131 LA UR 03 5862 - National Nuclear Security Administration ...
131 LA UR 03 5862 - National Nuclear Security Administration ...
131 LA UR 03 5862 - National Nuclear Security Administration ...
- No tags were found...

Create successful ePaper yourself
Turn your PDF publications into a flip-book with our unique Google optimized e-Paper software.
SWEIS Yearbook – 2002<strong>LA</strong>-<strong>UR</strong>-<strong>03</strong>-<strong>5862</strong>
<strong>LA</strong>-<strong>UR</strong>-<strong>03</strong>-<strong>5862</strong>Issued: September 20<strong>03</strong>Approved for public release;distribution is unlimitedSWEIS Yearbook—2002Comparison of 1998 to 2002 Data to Projections of theSite-Wide Environmental Impact Statement forContinued Operation of the Los Alamos <strong>National</strong> LaboratoryEcology GroupRisk Reduction and Environmental Stewardship Division
CONTENTSList of Tables . . . . . . . . . . . . . . . . . . . . . . . . . . . . . . . . . . . . . . . . . . . . . . . . . . . . . . . . . . . . . . . . . . . . . . . . . . viiList of Figures . . . . . . . . . . . . . . . . . . . . . . . . . . . . . . . . . . . . . . . . . . . . . . . . . . . . . . . . . . . . . . . . . . . . . . . . . xiAcronyms . . . . . . . . . . . . . . . . . . . . . . . . . . . . . . . . . . . . . . . . . . . . . . . . . . . . . . . . . . . . . . . . . . . . . . . . . . . . xiiiPreface . . . . . . . . . . . . . . . . . . . . . . . . . . . . . . . . . . . . . . . . . . . . . . . . . . . . . . . . . . . . . . . . . . . . . . . . . . . . . . . xvReferences. . . . . . . . . . . . . . . . . . . . . . . . . . . . . . . . . . . . . . . . . . . . . . . . . . . . . . . . . . . . . . . . . . . . . . . xviExecutive Summary . . . . . . . . . . . . . . . . . . . . . . . . . . . . . . . . . . . . . . . . . . . . . . . . . . . . . . . . . . . . . . . . . . . xviiReferences. . . . . . . . . . . . . . . . . . . . . . . . . . . . . . . . . . . . . . . . . . . . . . . . . . . . . . . . . . . . . . . . . . . . . . . xxiAcknowledgments . . . . . . . . . . . . . . . . . . . . . . . . . . . . . . . . . . . . . . . . . . . . . . . . . . . . . . . . . . . . . . . . . . . . xxiii1.0 Introduction. . . . . . . . . . . . . . . . . . . . . . . . . . . . . . . . . . . . . . . . . . . . . . . . . . . . . . . . . . . . . . . . . . . . . 1-11.1 The SWEIS . . . . . . . . . . . . . . . . . . . . . . . . . . . . . . . . . . . . . . . . . . . . . . . . . . . . . . . . . . . . . . . . . 1-11.2 Annual Yearbook. . . . . . . . . . . . . . . . . . . . . . . . . . . . . . . . . . . . . . . . . . . . . . . . . . . . . . . . . . . . . 1-11.3 This Yearbook . . . . . . . . . . . . . . . . . . . . . . . . . . . . . . . . . . . . . . . . . . . . . . . . . . . . . . . . . . . . . . . 1-31.4 References . . . . . . . . . . . . . . . . . . . . . . . . . . . . . . . . . . . . . . . . . . . . . . . . . . . . . . . . . . . . . . . . . . 1-32.0 Facilities and Operations . . . . . . . . . . . . . . . . . . . . . . . . . . . . . . . . . . . . . . . . . . . . . . . . . . . . . . . . . . 2-12.1 Plutonium Complex (TA-55). . . . . . . . . . . . . . . . . . . . . . . . . . . . . . . . . . . . . . . . . . . . . . . . . . . 2-342.1.1 Construction and Modifications at the Plutonium Complex . . . . . . . . . . . . . . . . . . . . 2-342.1.2 Operations at the Plutonium Complex. . . . . . . . . . . . . . . . . . . . . . . . . . . . . . . . . . . . . 2-372.1.3 Operations Data for the Plutonium Complex . . . . . . . . . . . . . . . . . . . . . . . . . . . . . . . 2-372.1.4 Cerro Grande Fire Effects at the Plutonium Complex. . . . . . . . . . . . . . . . . . . . . . . . . 2-442.2 Tritium Facilities (TA-16 and TA-21) . . . . . . . . . . . . . . . . . . . . . . . . . . . . . . . . . . . . . . . . . . . . 2-452.2.1 Construction and Modifications at the Tritium Facilities . . . . . . . . . . . . . . . . . . . . . . 2-452.2.2 Operations at the Tritium Facilities . . . . . . . . . . . . . . . . . . . . . . . . . . . . . . . . . . . . . . . 2-462.2.3 Operations Data for the Tritium Facilities . . . . . . . . . . . . . . . . . . . . . . . . . . . . . . . . . . 2-502.2.4 Cerro Grande Fire Effects at the Tritium Facilities . . . . . . . . . . . . . . . . . . . . . . . . . . . 2-502.3 Chemistry and Metallurgy Research Building (TA-<strong>03</strong>) . . . . . . . . . . . . . . . . . . . . . . . . . . . . . . 2-522.3.1 Construction and Modifications at the CMR Building . . . . . . . . . . . . . . . . . . . . . . . . 2-532.3.2 Operations at the CMR Building . . . . . . . . . . . . . . . . . . . . . . . . . . . . . . . . . . . . . . . . . 2-542.3.3 Operations Data for the CMR Building. . . . . . . . . . . . . . . . . . . . . . . . . . . . . . . . . . . . 2-542.3.4 Cerro Grande Fire Effects at the CMR Building . . . . . . . . . . . . . . . . . . . . . . . . . . . . . 2-542.4 Pajarito Site (TA-18) . . . . . . . . . . . . . . . . . . . . . . . . . . . . . . . . . . . . . . . . . . . . . . . . . . . . . . . . . 2-652.4.1 Construction and Modifications at the Pajarito Site . . . . . . . . . . . . . . . . . . . . . . . . . . 2-662.4.2 Operations at the Pajarito Site . . . . . . . . . . . . . . . . . . . . . . . . . . . . . . . . . . . . . . . . . . . 2-672.4.3 Operations Data for the Pajarito Site . . . . . . . . . . . . . . . . . . . . . . . . . . . . . . . . . . . . . . 2-712.4.4 Cerro Grande Fire Effects at the Pajarito Site . . . . . . . . . . . . . . . . . . . . . . . . . . . . . . . 2-722.5 Sigma Complex (TA-<strong>03</strong>). . . . . . . . . . . . . . . . . . . . . . . . . . . . . . . . . . . . . . . . . . . . . . . . . . . . . . 2-732.5.1 Construction and Modifications at the Sigma Complex . . . . . . . . . . . . . . . . . . . . . . . 2-742.5.2 Operations at the Sigma Complex . . . . . . . . . . . . . . . . . . . . . . . . . . . . . . . . . . . . . . . . 2-752.5.3 Operations Data for the Sigma Complex. . . . . . . . . . . . . . . . . . . . . . . . . . . . . . . . . . . 2-752.5.4 Cerro Grande Fire Effects at the Sigma Complex . . . . . . . . . . . . . . . . . . . . . . . . . . . . 2-752.6 Materials Science Laboratory (TA-<strong>03</strong>) . . . . . . . . . . . . . . . . . . . . . . . . . . . . . . . . . . . . . . . . . . . 2-792.6.1 Construction and Modifications at the Materials Science Laboratory. . . . . . . . . . . . . 2-792.6.2 Operations at the Materials Science Laboratory . . . . . . . . . . . . . . . . . . . . . . . . . . . . . 2-792.6.3 Operations Data for the Materials Science Laboratory . . . . . . . . . . . . . . . . . . . . . . . . 2-832.6.4 Cerro Grande Fire Effects at the Materials Science Laboratory . . . . . . . . . . . . . . . . . 2-84SWEIS Yearbook—2002iii
5.4.4 Production Readiness/Plant Capacity . . . . . . . . . . . . . . . . . . . . . . . . . . . . . . . . . . . . . 5-215.4.5 Environment, Safety, and Health/Regulatory Issues . . . . . . . . . . . . . . . . . . . . . . . . . . 5-215.4.6 <strong>Security</strong> . . . . . . . . . . . . . . . . . . . . . . . . . . . . . . . . . . . . . . . . . . . . . . . . . . . . . . . . . . . . 5-225.4.7 Workforce Profile. . . . . . . . . . . . . . . . . . . . . . . . . . . . . . . . . . . . . . . . . . . . . . . . . . . . . 5-225.4.8 Transportation and Parking . . . . . . . . . . . . . . . . . . . . . . . . . . . . . . . . . . . . . . . . . . . . . 5-235.4.9 Current Planning Initiatives. . . . . . . . . . . . . . . . . . . . . . . . . . . . . . . . . . . . . . . . . . . . . 5-235.4.10 Facility Strategic Planning. . . . . . . . . . . . . . . . . . . . . . . . . . . . . . . . . . . . . . . . . . . . . . 5-235.5 Facilities and Infrastructure Projects. . . . . . . . . . . . . . . . . . . . . . . . . . . . . . . . . . . . . . . . . . . . . 5-235.5.1 Overview of Site Project Prioritization and Cost Profile. . . . . . . . . . . . . . . . . . . . . . . 5-235.5.2 Line Item Highlighted Projects . . . . . . . . . . . . . . . . . . . . . . . . . . . . . . . . . . . . . . . . . . 5-235.5.3 FIRP Highlighted Projects . . . . . . . . . . . . . . . . . . . . . . . . . . . . . . . . . . . . . . . . . . . . . . 5-245.5.4 RTBF/Operations of Facilities Highlighted Projects. . . . . . . . . . . . . . . . . . . . . . . . . . 5-245.5.5 Non-RTBF/FIRP Highlighted Projects . . . . . . . . . . . . . . . . . . . . . . . . . . . . . . . . . . . . . 5-255.5.6 Institutional General Plant Projects . . . . . . . . . . . . . . . . . . . . . . . . . . . . . . . . . . . . . . . 5-265.5.7 Facilities and Infrastructure Cost Projection Spreadsheets . . . . . . . . . . . . . . . . . . . . . 5-275.6 References . . . . . . . . . . . . . . . . . . . . . . . . . . . . . . . . . . . . . . . . . . . . . . . . . . . . . . . . . . . . . . . . . 5-286.0 Summary and Conclusion . . . . . . . . . . . . . . . . . . . . . . . . . . . . . . . . . . . . . . . . . . . . . . . . . . . . . . . . . . . 6-16.1 Summary . . . . . . . . . . . . . . . . . . . . . . . . . . . . . . . . . . . . . . . . . . . . . . . . . . . . . . . . . . . . . . . . . . . 6-16.2 Conclusions . . . . . . . . . . . . . . . . . . . . . . . . . . . . . . . . . . . . . . . . . . . . . . . . . . . . . . . . . . . . . . . . . 6-66.3 To the Future . . . . . . . . . . . . . . . . . . . . . . . . . . . . . . . . . . . . . . . . . . . . . . . . . . . . . . . . . . . . . . . . 6-6Appendix A. Chemical Usage and Emissions Data . . . . . . . . . . . . . . . . . . . . . . . . . . . . . . . . . . . . . . . . . . . A-1Appendix B. <strong>Nuclear</strong> Facilities Lists . . . . . . . . . . . . . . . . . . . . . . . . . . . . . . . . . . . . . . . . . . . . . . . . . . . . . . B-1Appendix C. Radiological Facility List . . . . . . . . . . . . . . . . . . . . . . . . . . . . . . . . . . . . . . . . . . . . . . . . . . . . C-1Appendix D. NPDES Outfall Status Summary . . . . . . . . . . . . . . . . . . . . . . . . . . . . . . . . . . . . . . . . . . . . . . D-1Appendix E. Preliminary Assessment of Potential Impact of <strong>LA</strong>NL Site Boundary Changes andLand Transfer on Accident Analyses in the SWEIS. . . . . . . . . . . . . . . . . . . . . . . . . . . . . . . . E-1Appendix F. Future Projects . . . . . . . . . . . . . . . . . . . . . . . . . . . . . . . . . . . . . . . . . . . . . . . . . . . . . . . . . . . . F-1LIST OF TABLES2.0-1. Maximum Offsite Dose Estimates . . . . . . . . . . . . . . . . . . . . . . . . . . . . . . . . . . . . . . . . . . . 2-12.0-2. Radiological Exposure to <strong>LA</strong>NL Workers . . . . . . . . . . . . . . . . . . . . . . . . . . . . . . . . . . . . . 2-22.0-3. Radioactive Liquid Waste Treated at <strong>LA</strong>NL . . . . . . . . . . . . . . . . . . . . . . . . . . . . . . . . . . . 2-32.0-4. Low-Level Waste Generation at <strong>LA</strong>NL by Facility . . . . . . . . . . . . . . . . . . . . . . . . . . . . . . 2-42.0-5. Mixed Low-Level Waste Generation at <strong>LA</strong>NL by Facility . . . . . . . . . . . . . . . . . . . . . . . . 2-52.0-6. TRU Waste Generation at <strong>LA</strong>NL by Facility. . . . . . . . . . . . . . . . . . . . . . . . . . . . . . . . . . . 2-62.0-7. Mixed TRU Waste Generation at <strong>LA</strong>NL by Facility . . . . . . . . . . . . . . . . . . . . . . . . . . . . . 2-72.0-8. Overall Solid Radioactive Waste Generation at <strong>LA</strong>NL . . . . . . . . . . . . . . . . . . . . . . . . . . . 2-82.0-9. Chemical Waste Generated at <strong>LA</strong>NL by Facility. . . . . . . . . . . . . . . . . . . . . . . . . . . . . . . . 2-92.0-10. <strong>LA</strong>NL <strong>Nuclear</strong> Facilities–SWEIS and 2002 . . . . . . . . . . . . . . . . . . . . . . . . . . . . . . . . . . 2-112.0-11. Projected Construction and Modifications in the SWEIS ROD. . . . . . . . . . . . . . . . . . . . 2-142.0-12. Projected Construction and Modifications Completed 1998–2002 . . . . . . . . . . . . . . . . . 2-182.0-13. Capabilities. . . . . . . . . . . . . . . . . . . . . . . . . . . . . . . . . . . . . . . . . . . . . . . . . . . . . . . . . . . . 2-192.0-14. Summary of Inactive Capabilities . . . . . . . . . . . . . . . . . . . . . . . . . . . . . . . . . . . . . . . . . . 2-242.0-15. Summary of Wastes Generated . . . . . . . . . . . . . . . . . . . . . . . . . . . . . . . . . . . . . . . . . . . . 2-252.0-16. Flow from Permitted Outfalls . . . . . . . . . . . . . . . . . . . . . . . . . . . . . . . . . . . . . . . . . . . . . 2-262.0-17. Acreage for Key and Non-Key Facilities. . . . . . . . . . . . . . . . . . . . . . . . . . . . . . . . . . . . . 2-30SWEIS Yearbook—2002vii
2.13-1. Radiochemistry Buildings with <strong>Nuclear</strong> Hazard Classification. . . . . . . . . . . . . . . . . . . 2-1362.13.1-1. Construction and Modifications at the Radiochemistry Facility . . . . . . . . . . . . . . . . . . 2-1372.13.2-1. Radiochemistry Facility (TA-48)/Comparison of Operations . . . . . . . . . . . . . . . . . . . . 2-1382.13.3-1. Radiochemistry Facility (TA-48)/Operations Data . . . . . . . . . . . . . . . . . . . . . . . . . . . . 2-1412.13.4-1. Fire-Damaged Structures at TA-48 . . . . . . . . . . . . . . . . . . . . . . . . . . . . . . . . . . . . . . . . 2-1432.14-1. Radioactive Liquid Waste Treatment Facility Buildings with <strong>Nuclear</strong> HazardClassification . . . . . . . . . . . . . . . . . . . . . . . . . . . . . . . . . . . . . . . . . . . . . . . . . . . . . . . . . 2-1442.14.1-1. Radioactive Liquid Waste Treatment Facility Construction and Modifications . . . . . . 2-1452.14.2-1. Radioactive Liquid Waste Treatment Facility (TA-50)/Comparisonof Operations . . . . . . . . . . . . . . . . . . . . . . . . . . . . . . . . . . . . . . . . . . . . . . . . . . . . . . . . . 2-1472.14.3-1. Radioactive Liquid Waste Treatment Facility (TA-50)/Operations Data. . . . . . . . . . . . 2-1502.15-1. Solid Radoactive and Chemical Waste Buildings with <strong>Nuclear</strong> HazardClassification . . . . . . . . . . . . . . . . . . . . . . . . . . . . . . . . . . . . . . . . . . . . . . . . . . . . . . . . . 2-1522.15.1-1. Solid Radioactive and Chemical Waste Facilities Constructionand Modifications. . . . . . . . . . . . . . . . . . . . . . . . . . . . . . . . . . . . . . . . . . . . . . . . . . . . . . 2-1552.15.2-1. Solid Radioactive and Chemical Waste Facilities (TA-54 and TA-50)/Comparison of Operations . . . . . . . . . . . . . . . . . . . . . . . . . . . . . . . . . . . . . . . . . . . . 2-1562.15.3-1. Solid Radioactive and Chemical Waste Facilities (TA-54 and TA-50)/Operations Data . . . . . . . . . . . . . . . . . . . . . . . . . . . . . . . . . . . . . . . . . . . . . . . . . . . . . . . 2-1612.16-1. Non-Key Facilities with <strong>Nuclear</strong> Hazard Classification . . . . . . . . . . . . . . . . . . . . . . . . 2-1622.16-2. Non-Key Facilities with Radiological Hazard Classification . . . . . . . . . . . . . . . . . . . . 2-1622.16.1-1. Non-Key Facilities Construction and Modifications . . . . . . . . . . . . . . . . . . . . . . . . . . . 2-1642.16.2-1. Operations at the Non-Key Facilities. . . . . . . . . . . . . . . . . . . . . . . . . . . . . . . . . . . . . . . 2-1762.16.3-1. Non-Key Facilities/Operations Data . . . . . . . . . . . . . . . . . . . . . . . . . . . . . . . . . . . . . . . 2-1782.17.2-1. Environmental Restoration Project/Operations Data . . . . . . . . . . . . . . . . . . . . . . . . . . . 2-1832.17.3-1. Evaluated and Stabilized PRSs following the Cerro Grande Fire . . . . . . . . . . . . . . . . . 2-1843.1.1-1. Radioactive Air Emissions . . . . . . . . . . . . . . . . . . . . . . . . . . . . . . . . . . . . . . . . . . . . . . . . . 3-23.1.1-2. Maximum Offsite Dose Estimates . . . . . . . . . . . . . . . . . . . . . . . . . . . . . . . . . . . . . . . . . . . 3-23.1.2.1-1. Emissions of Criteria Pollutants. . . . . . . . . . . . . . . . . . . . . . . . . . . . . . . . . . . . . . . . . . . . . 3-33.1.2.2-1. Emissions of Volatile Organic Compounds and Hazardous Air Pollutants fromChemical Use . . . . . . . . . . . . . . . . . . . . . . . . . . . . . . . . . . . . . . . . . . . . . . . . . . . . . . . . . . . 3-43.2-1. NPDES Permitted Outfalls by Watershed . . . . . . . . . . . . . . . . . . . . . . . . . . . . . . . . . . . . . 3-53.2-2. Discharges to Watersheds from NPDES Permitted Outfalls . . . . . . . . . . . . . . . . . . . . . . . 3-63.2-3. NPDES Permitted Outfalls by Facility . . . . . . . . . . . . . . . . . . . . . . . . . . . . . . . . . . . . . . . 3-73.2-4. Discharges from NPDES Permitted Outfalls by Facility. . . . . . . . . . . . . . . . . . . . . . . . . . 3-83.3-1. <strong>LA</strong>NL Waste Types and Generation. . . . . . . . . . . . . . . . . . . . . . . . . . . . . . . . . . . . . . . . . 3-1<strong>03</strong>.3.2-1. Chemical Waste Generators and Quantities . . . . . . . . . . . . . . . . . . . . . . . . . . . . . . . . . . . 3-113.3.3-1. LLW Generators and Quantities. . . . . . . . . . . . . . . . . . . . . . . . . . . . . . . . . . . . . . . . . . . . 3-123.3.4-1. MLLW Generators and Quantities . . . . . . . . . . . . . . . . . . . . . . . . . . . . . . . . . . . . . . . . . . 3-123.3.5-1. Transuranic Waste Generators and Quantities . . . . . . . . . . . . . . . . . . . . . . . . . . . . . . . . . 3-143.3.6-1. Mixed Transuranic Waste Generators and Quantities . . . . . . . . . . . . . . . . . . . . . . . . . . . 3-143.4.1-1. Gas Consumption (decatherms) at <strong>LA</strong>NL/Fiscal Years 1991-2002. . . . . . . . . . . . . . . . . 3-153.4.1-2. Steam Production at <strong>LA</strong>NL/Fiscal Years 1996-2002. . . . . . . . . . . . . . . . . . . . . . . . . . . . 3-153.4.2-1. Electric Peak Coincident Demand/Fiscal Years 1991-2002. . . . . . . . . . . . . . . . . . . . . . . 3-163.4.2-2. Electric Consumption/Fiscal Years 1991-2002 . . . . . . . . . . . . . . . . . . . . . . . . . . . . . . . . 3-173.4.3-1. Water Consumption for Calendar Years 1992-2002. . . . . . . . . . . . . . . . . . . . . . . . . . . . . 3-183.5.1-1. Total Recordable and Lost Workday Case Rates at <strong>LA</strong>NL . . . . . . . . . . . . . . . . . . . . . . . 3-193.5.2-1. Radiological Exposure to <strong>LA</strong>NL Workers . . . . . . . . . . . . . . . . . . . . . . . . . . . . . . . . . . . . 3-20SWEIS Yearbook—2002ix
3.5.2-2. Highest Individual Doses from External Radiation to <strong>LA</strong>NL Workers . . . . . . . . . . . . . . 3-2<strong>03</strong>.6-1. <strong>LA</strong>NL-Affiliated Workforce. . . . . . . . . . . . . . . . . . . . . . . . . . . . . . . . . . . . . . . . . . . . . . . 3-213.6-2. County of Residence for UC Employees . . . . . . . . . . . . . . . . . . . . . . . . . . . . . . . . . . . . . 3-223.6-3. UC Employee Index for Key Facilities . . . . . . . . . . . . . . . . . . . . . . . . . . . . . . . . . . . . . . 3-233.7.5-1. Site-wide Land Use . . . . . . . . . . . . . . . . . . . . . . . . . . . . . . . . . . . . . . . . . . . . . . . . . . . . . 3-263.7.5-2. Land Transfers during CY 2002. . . . . . . . . . . . . . . . . . . . . . . . . . . . . . . . . . . . . . . . . . . . 3-263.8-1. Groundwater Characterization Wells . . . . . . . . . . . . . . . . . . . . . . . . . . . . . . . . . . . . . . . . 3-283.9-1. Acreage Surveyed, Prehistoric Cultural Resource Sites Recorded, and CulturalResource Sites Eligible for the <strong>National</strong> Register of Historic Places at<strong>LA</strong>NL FY 2002 . . . . . . . . . . . . . . . . . . . . . . . . . . . . . . . . . . . . . . . . . . . . . . . . . . . . . . . . 3-333.9-2. Historic Period Cultural Resource Properties at <strong>LA</strong>NL. . . . . . . . . . . . . . . . . . . . . . . . . . 3-343.9.3-1. Historic Building Documentation and Demolition Numbers. . . . . . . . . . . . . . . . . . . . . . 3-373.10.2-1. Biological Resources Reviews. . . . . . . . . . . . . . . . . . . . . . . . . . . . . . . . . . . . . . . . . . . . . 3-394.3-1. <strong>LA</strong>NL Sanitary Waste Generation in FY 2002 . . . . . . . . . . . . . . . . . . . . . . . . . . . . . . . . . 4-85.2.3.1-1. Site-Wide Land Use . . . . . . . . . . . . . . . . . . . . . . . . . . . . . . . . . . . . . . . . . . . . . . . . . . . . . . 5-65.2.3.2-1. Land Subparcels Transferred during CY 2002. . . . . . . . . . . . . . . . . . . . . . . . . . . . . . . . . . 5-85.2.4-1. Primary Construction Projects Funded through FY 2002 . . . . . . . . . . . . . . . . . . . . . . . . . 5-95.2.4-2. Selected Proposed Construction Projects through FY 2012 . . . . . . . . . . . . . . . . . . . . . . 5-105.3.6-1. Specialized Facilities and Supported Mission Needs. . . . . . . . . . . . . . . . . . . . . . . . . . . . 5-135.3.7-1. Specialized Non-NNSA Facilities . . . . . . . . . . . . . . . . . . . . . . . . . . . . . . . . . . . . . . . . . . 5-155.4.2-1. Summary of Proposed Future Condition by Gross Square Feet—FY 2002and FY 20<strong>03</strong> . . . . . . . . . . . . . . . . . . . . . . . . . . . . . . . . . . . . . . . . . . . . . . . . . . . . . . . . . . . 5-175.4.3-1. Electrical Power Concerns and Related Projects . . . . . . . . . . . . . . . . . . . . . . . . . . . . . . . 5-185.4.3-2. Sanitary Waste Disposal System Concerns and Related Projects . . . . . . . . . . . . . . . . . . 5-185.4.3-3. Radioactive Liquid Waste Concerns and Related Projects . . . . . . . . . . . . . . . . . . . . . . . 5-195.4.3-4. Central Steam System Concerns and Related Projects . . . . . . . . . . . . . . . . . . . . . . . . . . 5-195.4.3-5. Water Supply System Concerns and Related Projects . . . . . . . . . . . . . . . . . . . . . . . . . . . 5-205.4.3-6. Natural Gas Concerns and Related Projects. . . . . . . . . . . . . . . . . . . . . . . . . . . . . . . . . . . 5-205.4.7-1. Current and Projected Workforce Levels by Directorate . . . . . . . . . . . . . . . . . . . . . . . . . 5-225.5.1-1. Funding Sources. . . . . . . . . . . . . . . . . . . . . . . . . . . . . . . . . . . . . . . . . . . . . . . . . . . . . . . . 5-24A-1. Chemistry and Metallurgy Research Building Air Emissions . . . . . . . . . . . . . . . . . . . . . . A-1A-2. Bioscience Air Emissions. . . . . . . . . . . . . . . . . . . . . . . . . . . . . . . . . . . . . . . . . . . . . . . . . . A-3A-3. High Explosives Processing Air Emissions . . . . . . . . . . . . . . . . . . . . . . . . . . . . . . . . . . . . A-5A-4. High Explosives Testing Air Emissions . . . . . . . . . . . . . . . . . . . . . . . . . . . . . . . . . . . . . . . A-7A-5 <strong>LA</strong>NSCE Air Emissions. . . . . . . . . . . . . . . . . . . . . . . . . . . . . . . . . . . . . . . . . . . . . . . . . . . A-8A-6. Machine Shops Air Emissions . . . . . . . . . . . . . . . . . . . . . . . . . . . . . . . . . . . . . . . . . . . . . A-10A-7. Materials Science Laboratory Air Emissions. . . . . . . . . . . . . . . . . . . . . . . . . . . . . . . . . . A-11A-8. Pajarito Site Air Emissions. . . . . . . . . . . . . . . . . . . . . . . . . . . . . . . . . . . . . . . . . . . . . . . . A-13A-9. Plutonium Facility Complex Air Emissions. . . . . . . . . . . . . . . . . . . . . . . . . . . . . . . . . . . A-14A-10. Radiochemistry Site Air Emissions . . . . . . . . . . . . . . . . . . . . . . . . . . . . . . . . . . . . . . . . . A-16A-11. Sigma Complex Air Emissions . . . . . . . . . . . . . . . . . . . . . . . . . . . . . . . . . . . . . . . . . . . . A-21A-12. Target Fabrication Facility Air Emissions . . . . . . . . . . . . . . . . . . . . . . . . . . . . . . . . . . . . A-23A-13. Tritium Operations Air Emissions . . . . . . . . . . . . . . . . . . . . . . . . . . . . . . . . . . . . . . . . . . A-26A-14. Waste Management Operations Air Emissions . . . . . . . . . . . . . . . . . . . . . . . . . . . . . . . . A-27B-1. Comparison of <strong>Nuclear</strong> Facilities Lists . . . . . . . . . . . . . . . . . . . . . . . . . . . . . . . . . . . . . . . B-1C-1. Radiological Facility List. . . . . . . . . . . . . . . . . . . . . . . . . . . . . . . . . . . . . . . . . . . . . . . . . . C-1E-1. Land Parcels Transferred and to be Transferred . . . . . . . . . . . . . . . . . . . . . . . . . . . . . . . . E-6E-2 Sixteen Radiological Accidents Evaluated in <strong>LA</strong>NL SWEIS and Affected Areas . . . . . . E-7xSWEIS Yearbook—2002
F-1. RTBF Line Item Projects . . . . . . . . . . . . . . . . . . . . . . . . . . . . . . . . . . . . . . . . . . . . . . . . . . F-2F-2. RTBF Operations of Facilities . . . . . . . . . . . . . . . . . . . . . . . . . . . . . . . . . . . . . . . . . . . . . . F-4F-3. Facilities and Infrastructure Recapitalization Program (FIRP) . . . . . . . . . . . . . . . . . . . . . F-7F-4. Non-RTBF and Non-FIRP Facilities and Infrastructure—Line Item and ProposedCapital Projects . . . . . . . . . . . . . . . . . . . . . . . . . . . . . . . . . . . . . . . . . . . . . . . . . . . . . . . . F-13F-5. Non-RTBF and Non-FIRP Facilities and Infrastructure—Expense, General Plant,Institutional General Plant, and Institutional Projects . . . . . . . . . . . . . . . . . . . . . . . . . . . F-16F-6. Non-RTBF and Non-FIRP Facilities and Infrastructure—Maintenance, Standby Facility,Decommissioning and Demolition, and Facilities Management andSite Planning Projects . . . . . . . . . . . . . . . . . . . . . . . . . . . . . . . . . . . . . . . . . . . . . . . . . . . F-21F-7. Other General Plant Projects in 2001 TYCSP . . . . . . . . . . . . . . . . . . . . . . . . . . . . . . . . . F-23F-8. Summary of Decommissioning and Demolition Projects . . . . . . . . . . . . . . . . . . . . . . . . F-24LIST OF FIG<strong>UR</strong>ES2-1. Location of <strong>LA</strong>NL . . . . . . . . . . . . . . . . . . . . . . . . . . . . . . . . . . . . . . . . . . . . . . . . . . . . . . 2-312-2. Location of technical areas. . . . . . . . . . . . . . . . . . . . . . . . . . . . . . . . . . . . . . . . . . . . . . . . 2-322-3. Location of Key Facilities.. . . . . . . . . . . . . . . . . . . . . . . . . . . . . . . . . . . . . . . . . . . . . . . . 2-333-1. Location of the groundwater characterization wells. . . . . . . . . . . . . . . . . . . . . . . . . . . . . 3-274-1. Total radioactive emissions from point sources. . . . . . . . . . . . . . . . . . . . . . . . . . . . . . . . . 4-24-2. Total tritium emissions from Tritium Key Facilities’ stacks. . . . . . . . . . . . . . . . . . . . . . . . 4-34-3. Maximum offsite dose.. . . . . . . . . . . . . . . . . . . . . . . . . . . . . . . . . . . . . . . . . . . . . . . . . . . . 4-34-4. Carbon monoxide emissions. . . . . . . . . . . . . . . . . . . . . . . . . . . . . . . . . . . . . . . . . . . . . . . . 4-44-5. Emissions of nitrogen oxides. . . . . . . . . . . . . . . . . . . . . . . . . . . . . . . . . . . . . . . . . . . . . . . 4-44-6. Particulate matter emissions. . . . . . . . . . . . . . . . . . . . . . . . . . . . . . . . . . . . . . . . . . . . . . . . 4-44-7. Emissions of sulfur oxides. . . . . . . . . . . . . . . . . . . . . . . . . . . . . . . . . . . . . . . . . . . . . . . . . 4-54-8. Emissions of volatile organic compounds and hazardous air pollutants.. . . . . . . . . . . . . . 4-54-9. NPDES discharges by facility. . . . . . . . . . . . . . . . . . . . . . . . . . . . . . . . . . . . . . . . . . . . . . . 4-64-10. <strong>LA</strong>NL chemical waste generation.. . . . . . . . . . . . . . . . . . . . . . . . . . . . . . . . . . . . . . . . . . . 4-74-11. <strong>LA</strong>NL low-level waste generation. . . . . . . . . . . . . . . . . . . . . . . . . . . . . . . . . . . . . . . . . . 4-104-12. <strong>LA</strong>NL mixed low-level waste generation. . . . . . . . . . . . . . . . . . . . . . . . . . . . . . . . . . . . . 4-104-13. <strong>LA</strong>NL transuranic waste generation. . . . . . . . . . . . . . . . . . . . . . . . . . . . . . . . . . . . . . . . . 4-114-14. <strong>LA</strong>NL mixed transuranic waste generation.. . . . . . . . . . . . . . . . . . . . . . . . . . . . . . . . . . . 4-114-15. <strong>LA</strong>NL natural gas consumption. . . . . . . . . . . . . . . . . . . . . . . . . . . . . . . . . . . . . . . . . . . . 4-124-16. <strong>LA</strong>NL electric consumption. . . . . . . . . . . . . . . . . . . . . . . . . . . . . . . . . . . . . . . . . . . . . . . 4-124-17. <strong>LA</strong>NL electric peak coincident demand. . . . . . . . . . . . . . . . . . . . . . . . . . . . . . . . . . . . . . 4-134-18. <strong>LA</strong>NL water consumption.. . . . . . . . . . . . . . . . . . . . . . . . . . . . . . . . . . . . . . . . . . . . . . . . 4-134-19. Total recordable injuries at <strong>LA</strong>NL. . . . . . . . . . . . . . . . . . . . . . . . . . . . . . . . . . . . . . . . . . 4-144-20. Lost workday case rates at <strong>LA</strong>NL.. . . . . . . . . . . . . . . . . . . . . . . . . . . . . . . . . . . . . . . . . . 4-144-21. Radiological exposure to <strong>LA</strong>NL workers. . . . . . . . . . . . . . . . . . . . . . . . . . . . . . . . . . . . . 4-145-1. Existing land use at <strong>LA</strong>NL. . . . . . . . . . . . . . . . . . . . . . . . . . . . . . . . . . . . . . . . . . . . . . . . . 5-45-2. Future land use at <strong>LA</strong>NL.. . . . . . . . . . . . . . . . . . . . . . . . . . . . . . . . . . . . . . . . . . . . . . . . . . 5-55-3. <strong>LA</strong>NL parcels for conveyance and transfer.. . . . . . . . . . . . . . . . . . . . . . . . . . . . . . . . . . . . 5-7E-1. Site boundaries for conducting accident analyses at <strong>LA</strong>NL . . . . . . . . . . . . . . . . . . . . . . . E-3E-2a. TA-55 old evaluation boundary . . . . . . . . . . . . . . . . . . . . . . . . . . . . . . . . . . . . . . . . . . . . . E-4E-2b. TA-55 new evaluation boundary . . . . . . . . . . . . . . . . . . . . . . . . . . . . . . . . . . . . . . . . . . . . E-4E-3. Location of transfer parcels and key accident facilities . . . . . . . . . . . . . . . . . . . . . . . . . . . E-8SWEIS Yearbook—2002xi
xiiSWEIS Yearbook—2002
AcronymsAFCIA<strong>LA</strong>RAAOCBABSLCASACDCCDISCINTCiCMRCRMTSWEIS Yearbook—2002Advanced Fuel Cycle Initiativeas low as reasonably achievablearea of concernbiological assessmentBiosafety LevelCritical Assembly and Storage AreaCenters for Disease ControlChange During Interim StatusCenter for IntegratedNanotechnologiescurieChemical and Metallurgy ResearchCultural Resources ManagementTeamCSP2000 Comprehensive Site Plan for 2000CXCX-TBDCYDARHTD&DDOEDVRSDXEAEA-CXcategorical exclusionthe planned activity is anticipated tobe within categorical exclusioncalendar yearDual-Axis RadiographicHydrodynamic Test (facility)Decommissioning and demolitionUS Department of EnergyDecontamination and VolumeReduction SystemDynamic Experimentation (Division)environmental assessmentan environmental assessment foundthe proposed activity to be withincategorical exclusionEA-FONSI an environmental assessment wasconducted with a finding of nosignificant impactEA-TBDEISEIS DraftEIS-Prepan environmental assessment has notbeen conducted but is anticipatedenvironmental impact statementan EIS was drafted and issued forpublic commentan EIS has been determined tobe needed and is currently beingpreparedEIS-RODEIS-TBDEPAERESAFIRPFITSFTEFYGPPHCHEPAHEWTFHRLHSWAHVACIAEAICEJCNNMkV<strong>LA</strong><strong>LA</strong>NL<strong>LA</strong>NSCELEDAlinacLIRLLWLPSSan EIS was written and record ofdecision issueda determination of need for EIS is notyet complete, but an EIS isanticipatedUS Environmental ProtectionAgencyEnvironmental Restoration (Project)Engineering Sciences andApplications (Division)Facilities and InfrastructureRecapitalization ProgramFacility Improvement TechnicalSupport (building)full-time equivalent (employee)fiscal yearGeneral Plant ProjectHazard Categoryhigh-efficiency particulate air (filter)High Explosives Waste TreatmentFacilityHealth Research LaboratoryHazardous and Solid WasteAmendmentheating, ventilation, and airconditioningInternational Atomic Energy AgencyIrradiation of Chips and ElectronicsJohnson Controls Northern NewMexicokilovoltLaboratory of AnthropologyLos Alamos <strong>National</strong> LaboratoryLos Alamos Neutron Science CenterLow-Energy DemonstrationAcceleratorlinear acceleratorLaboratory ImplementingRequirementlow-level wasteLong-Pulse Spallation Sourcexiii
LWCmMDAMeVMGYMLLWMSLNEPANFANISCNMEDNMSFNMSHPDNNSANO xNPDESNRCNRHPOPCOSRPCBPE & Dxivlost workday cases (rate)meterMaterial Disposal Areamillion electron voltsmillion gallons per yearmixed low-level wasteMaterials Science Laboratory<strong>National</strong> Environmental Policy Actno further actionNonproliferation and International<strong>Security</strong> CenterNew Mexico EnvironmentDepartment<strong>Nuclear</strong> Materials Storage FacilityNew Mexico State HistoricPreservation Department<strong>National</strong> <strong>Nuclear</strong> <strong>Security</strong><strong>Administration</strong>nitrogen oxides<strong>National</strong> Pollutant DischargeElimination SystemUS <strong>Nuclear</strong> Regulatory Commission<strong>National</strong> Register of Historic PlacesOther Project CostsOffsite Source Recovery (Program)polychlorinated biphenylPreliminary Engineering and DesignPHERMEX Pulsed High-Energy RadiographicMachine Emitting X-rays (facility)PNMPRSpsiPT<strong>LA</strong>Public Service Company of NewMexicopotential release sitepounds per square inchProtection Technology Los AlamosRAMROD Radioactive Materials ResearchOperations and Demonstration(facility)RANTRCRAremRadioactive Assay andNondestructive Test (facility)Resource Conservation and RecoveryActroentgen equivalent manRLWTFRODRTBFRadioactive Liquid Waste TreatmentFacilityrecord of decisionReadiness in Technical Base andFacilitiesS-3 <strong>Security</strong> Systems GroupSCCSHEBASNMSO xSWEISSWMUTATBDTECTEDETFFTRITRUTSCATSFFTSTATWISPTYCSPU 3O 8UCUF/ROUNHVCAWCRRWETFWIPPWNRWTAStrategic Computing ComplexSolution High-Energy BurstAssemblyspecial nuclear materialsulfur oxidesSite-Wide Environmental ImpactStatementsolid waste management unitTechnical Areato be determinedTotal Estimated Costtotal effective dose equivalentTarget Fabrication Facilitytotal recordable incident (rate)transuranicToxic Substances Control ActTritium Science and FabricationFacilityTritium System Test Assembly(facility)Transuranic Waste InspectableStorage ProjectTen-Year Comprehensive Site Planuranium oxideUniversity of Californiaultrafiltration/reverse osmosisuranium nitrate hexahydratevoluntary corrective actionWaste Characterization, Reduction,and Repackaging (facility)Weapons Engineering TritiumFacilityWaste Isolation Pilot PlantWeapons Neutron Research (facility)Western Technical AreaSWEIS Yearbook—2002
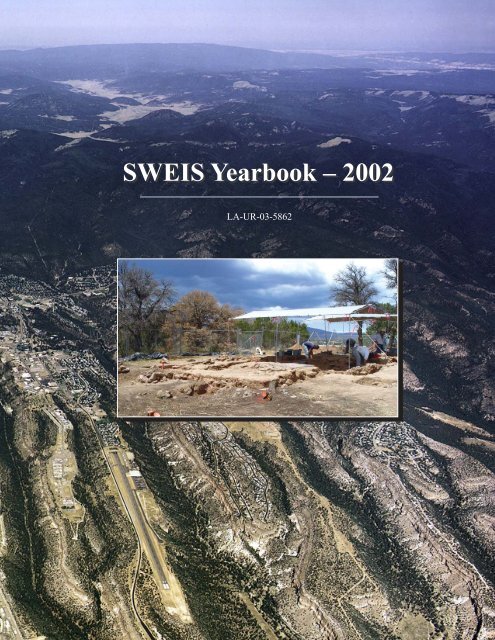
PrefaceIn the Record of Decision for StockpileStewardship and Management, the US Departmentof Energy (DOE) 1 charged <strong>LA</strong>NL with several newtasks, including war reserve pit production. DOEevaluated potential environmental impacts of theseassignments in the Site-Wide Environmental ImpactStatement for Continued Operation of the LosAlamos <strong>National</strong> Laboratory (DOE 1999a). ThisSite-Wide Environmental Impact Statement (SWEIS)provided the basis for DOE decisions to implementthese new assignments at <strong>LA</strong>NL through the SWEISRecord of Decision (ROD) issued in September 1999(DOE 1999b).Every five years, DOE performs a formal analysisof the adequacy of the SWEIS to characterizethe environmental envelope for continuingoperations at <strong>LA</strong>NL. The Annual SWEIS Yearbookwas designed to assist DOE in this analysis bycomparing operational data with projections of theSWEIS for the level of operations selected by theROD. As originally planned, the Yearbook wasto be published one year following the activities;however, publication was moved approximately sixmonths earlier to achieve timely presentation of theinformation. Yearbook publications to date includethe following:• “SWEIS 1998 Yearbook,” <strong>LA</strong>-<strong>UR</strong>-99-6391,December 1999 (<strong>LA</strong>NL 1999, http://libwww.lanl.gov/cgi-bin/getfile?00460172.pdf).• “SWEIS Yearbook – 1999,” <strong>LA</strong>-<strong>UR</strong>-00-5520, December 2000 (<strong>LA</strong>NL 2000a, http://lib-www.lanl.gov/cgi-bin/getfile?<strong>LA</strong>-<strong>UR</strong>-00-5520.htm).• “SWEIS Yearbook – 2000,” <strong>LA</strong>-<strong>UR</strong>-01-2965,July 2001. (<strong>LA</strong>NL 2001, http://lib-www.lanl.gov/la-pubs/00818189.pdf).• “SWEIS Yearbook – 2001,” <strong>LA</strong>-<strong>UR</strong>-02-3143,September 2002 (<strong>LA</strong>NL 2002, http://libwww.lanl.gov/cgi-bin/getfile?00818857.pdf).• “SWEIS Yearbook – 2002” <strong>LA</strong>-<strong>UR</strong>-<strong>03</strong>-<strong>5862</strong>, September 20<strong>03</strong> (<strong>LA</strong>NL 20<strong>03</strong>, http://lib-www.lanl.gov/cgi-bin/getfile?<strong>LA</strong>-<strong>UR</strong>-<strong>03</strong>-<strong>5862</strong>.htm).The collective set of Yearbooks contains dataneeded for trend analyses, identifies potentialproblem areas, and enables decision-makers todetermine when and if an updated SWEIS orother <strong>National</strong> Environmental Policy Act (NEPA)analysis is necessary. This edition of the Yearbooksummarizes the data from 1998 to 2002, and providestrend analysis of these data to assist DOE in itsdecision-making process. A similar summarizationwill be prepared every five years, as appropriate.As with previous editions, the covers includeinset photographs depicting important events thathappened during the calendar year under review. Thephotograph on the front cover this year representspast human occupation of the Pajarito Plateau withan archaeological excavation on property destinedfor transfer from the Department of Energy to LosAlamos County. The photograph on the back coverdepicts a current capability at the Laboratory—‘theWall’ in the Strategic Computing Complex whichhouses the world’s fastest computers.• “A Special Edition of the SWEIS Yearbook,Wildfire 2000,” <strong>LA</strong>-<strong>UR</strong>-00-3471, August 2000(<strong>LA</strong>NL 2000b, http://lib-www.lanl.gov/cgi-bin/getfile?0<strong>03</strong>93627.pdf).1 Congress established the <strong>National</strong> <strong>Nuclear</strong> <strong>Security</strong> <strong>Administration</strong> (NNSA) within the DOE to manage the nuclear weapons program for theUnited States. Los Alamos <strong>National</strong> Laboratory (<strong>LA</strong>NL or Laboratory) is one of the facilities now managed by the NNSA. The NNSA officiallybegan operations on March 1, 2000. Its mission is to carry out the national security responsibilities of the DOE, including maintenance of a safe,secure, and reliable stockpile of nuclear weapons and associated materials capabilities and technologies; promotion of international nuclear safety andnonproliferation; and administration and management of the naval nuclear propulsion program.SWEIS Yearbook—2002xv
ReferencesDepartment of Energy, 1999a. “Site-WideEnvironmental Impact Statement for ContinuedOperation of the Los Alamos <strong>National</strong>Laboratory,” US Department of Energy documentDOE/EIS-0238, Albuquerque, NM.Department of Energy, 1999b. “Record of Decision:SWEIS in the State of New Mexico,” 64 FR50797, Washington, D.C.Los Alamos <strong>National</strong> Laboratory, 1999. “SWEIS1998 Yearbook,” Los Alamos <strong>National</strong> Laboratoryreport <strong>LA</strong>-<strong>UR</strong>-99-6391, Los Alamos, NM. (http://lib-www.lanl.gov/cgi-bin/getfile?00460172.pdf).Los Alamos <strong>National</strong> Laboratory, 2002. “SWEISYearbook – 2001,” Los Alamos <strong>National</strong>Laboratory report <strong>LA</strong>-<strong>UR</strong>-02-3143, LosAlamos, NM. (http://lib-www.lanl.gov/cgi-bin/getfile?00818857.pdf).Los Alamos <strong>National</strong> Laboratory, 20<strong>03</strong>. “SWEISYearbook – 2002” Los Alamos <strong>National</strong>Laboratory report <strong>LA</strong>-<strong>UR</strong>-<strong>03</strong>-<strong>5862</strong>, Los Alamos,NM. (http://lib-www.lanl.gov/cgi-bin/getfile?<strong>LA</strong>-<strong>UR</strong>-<strong>03</strong>-<strong>5862</strong>.htm).Los Alamos <strong>National</strong> Laboratory, 2000a. “SWEISYearbook – 1999,” Los Alamos <strong>National</strong>Laboratory report <strong>LA</strong>-<strong>UR</strong>-00-5520, Los Alamos,NM. (http://lib-www.lanl.gov/cgi-bin/getfile?<strong>LA</strong>-<strong>UR</strong>-00-5520.htm).Los Alamos <strong>National</strong> Laboratory, 2000b. “A SpecialEdition of the SWEIS Yearbook, Wildfire2000,” Los Alamos <strong>National</strong> Laboratory report<strong>LA</strong>-<strong>UR</strong>-00-3471, Los Alamos, NM. (http://libwww.lanl.gov/cgi-bin/getfile?0<strong>03</strong>93627.pdf).Los Alamos <strong>National</strong> Laboratory, 2001. “SWEISYearbook – 2000,” Los Alamos <strong>National</strong>Laboratory report <strong>LA</strong>-<strong>UR</strong>-01-2965, LosAlamos, NM. (http://lib-www.lanl.gov/la-pubs/00818189.pdf).xviSWEIS Yearbook—2002
Executive SummaryIn 1999, the US Department of Energy (DOE)published a Site-Wide Environmental ImpactStatement (SWEIS) for Continued Operationof Los Alamos <strong>National</strong> Laboratory (<strong>LA</strong>NL orLaboratory)(DOE 1999a). DOE issued a Record ofDecision (ROD) for this document in September1999 (DOE 1999b).DOE and <strong>LA</strong>NL implemented a program, theAnnual Yearbook, making comparisons betweenSWEIS ROD projections and actual operations datafor two reasons: first, to preserve and enhance theusefulness of the SWEIS as a “living” document,and second, to provide DOE with a tool to assist indetermining the continued adequacy of the SWEISin characterizing existing operations. The Yearbooksfrom calendar year (CY) 1998 through CY 2001focus on operations during one calendar year andspecifically address the following:• facility and/or process modifications or additions,• types and levels of operations during the calendaryear,• operations data for the Key Facilities, and• site-wide effects of operations for the calendaryear.The 2002 Yearbook is a special edition to assistDOE/<strong>National</strong> <strong>Nuclear</strong> <strong>Security</strong> <strong>Administration</strong> inevaluating the need for preparing a new SWEIS for<strong>LA</strong>NL. This edition of the Yearbook summarizesthe data routinely collected from CY 1998 throughCY 2002 as described above. It also containsadditional text and tabular summaries as well as atrend analysis. The 2002 Yearbook also indicatesthe Laboratory’s programmatic progress in movingtowards the SWEIS projections.The SWEIS analyzed the potential environmentalimpacts of scenarios for future operations at<strong>LA</strong>NL. DOE announced in its ROD that it wouldoperate <strong>LA</strong>NL at an expanded level and thatthe environmental consequences of that level ofoperations were acceptable. The ROD is not apredictor of specific operations, but establishesboundary conditions for operations. The RODSWEIS Yearbook—2002provides an environmental operating envelope forspecific facilities and for the Laboratory as a whole.If operations at <strong>LA</strong>NL were to routinely exceed theoperating envelope, DOE would evaluate the needfor a new SWEIS. As long as <strong>LA</strong>NL operationsremain below the level analyzed in the ROD, theenvironmental operating envelope is valid. Thus, thelevels of operation projected by the SWEIS RODshould not be viewed as goals to be achieved, butrather as acceptable operational levels.The Yearbooks address capabilities and operationsusing the concept of “Key Facility” as presentedin the SWEIS. The definition of each Key Facilityhinges upon operations (research, production, orservices) and capabilities and is not necessarilyconfined to a single structure, building, or technicalarea. Chapter 2 discusses each of the 15 KeyFacilities from three aspects—significant facilityconstruction and modifications that have occurredfrom 1998 through 2002, the types and levels ofoperations that occurred from 1998 through 2002,and the 1998 through 2002 operations data. Chapter2 also discusses the “Non-Key Facilities,” whichinclude all buildings and structures not part of a KeyFacility, or the balance of <strong>LA</strong>NL.During 2002, planned construction and/ormodifications continued at six of the 15 KeyFacilities. These activities were both modificationswithin existing structures and new or replacementfacilities. New structures completed and occupiedduring 2002 included the Technical Area (TA) 18Relocation Project Office Building between TA-48 and TA-55, the Vessel Preparation Facility atTA-15, a Camera Room at TA-36-12, a CarpenterShop at TA-15, the X-Ray Calibration Facility atTA-15, a Warehouse at TA-15, and the transportableoffice building TA-48-210. Additionally, 13 majorconstruction projects were either completed orcontinued for the Non-Key Facilities. These projectswere as follows:• Construction continued on the Nonproliferationand International <strong>Security</strong> Center that was begunin March 2001.• Atlas was disassembled and relocated to theNevada Test Site in December 2002.xvii
• Construction of the Emergency OperationsCenter started in January 2002.• Construction of the S-3 <strong>Security</strong> SystemsSupport Facility started in July 2002.• Construction of the Decision ApplicationsDivision Office Building started in September2002.• Construction of the new Medical Facility startedin October 2002.• The Chemistry Division Office Building wasconstructed, completed, and occupied.• Construction of the Materials Science andTechnology Office Building started in November2002.• Construction of the TA-72 Live Fire Shoot Housestarted in November 2002.• The <strong>Security</strong> Truck Inspection Station wasconstructed and became operational.• The High Pressure Tritium Facility (TA-33-86) underwent decontamination anddecommissioning and is now demolished.• Demolition activities began in July 2002 on theOmega West Reactor Facility.• TA-41-30 and the front of TA-41-4 weredemolished August to October 2002.The ROD projected a total of 38 facilityconstruction and modification projects for <strong>LA</strong>NL.Twenty projects have now been completed: six in1998, eight in 1999, two in 2000, and four in 2002.The number of projects started or continued eachyear were 13 in 1998, 10 in 1999, seven in 2000, andsix in both 2001 and 2002.A major modification project, elimination and/orrerouting of <strong>National</strong> Pollutant Discharge EliminationSystem (NPDES) outfalls, was completed in 1999,bringing the total number of permitted outfalls downfrom the 55 identified by the SWEIS ROD to 20.During 2000, Outfall <strong>03</strong>A-199, which will serve theTA-<strong>03</strong>-1837 cooling towers, was included in thenew NPDES permit issued by the US EnvironmentalProtection Agency (EPA) on December 29, 2000.This brings the total number of permitted outfalls upto 21. During 2002, only 17 of the 21 outfalls flowed.As in the Yearbooks since 1999, this issue reportschemical usage and calculated emissions (expressedas kilograms per year) for the Key Facilities, basedon an improved chemical reporting system. The2002 chemical usage amounts were extracted fromthe Laboratory’s EX3 chemical inventory systemrather than the Automated Chemical InventorySystem used in the past. The quantities used forthis report represent chemicals procured or broughton site by calendar year from 1999 through 2002.Information is presented in Appendix A for actualchemical use and estimated emissions for each KeyFacility. Additional information for chemical useand emissions reporting can be found in the annualEmissions Inventory Report as required by NewMexico Administrative Code, Title 20, Chapter 2,Part 73 (20 NMAC 2.73). The most recent report is“Emissions Inventory Report Summary, ReportingRequirements for the New Mexico AdministrativeCode, Title 20, Chapter 2, Part 73 (20 NMAC 2.73)for Calendar Year 2000” (<strong>LA</strong>NL 2001).With a few exceptions, the capabilities identifiedin the SWEIS ROD for <strong>LA</strong>NL have remainedconstant since 1998. The exceptions are the• movement of the Nonproliferation Training/<strong>Nuclear</strong> Measurement School between PajaritoSite and the Chemistry and Metallurgy Research(CMR) Building during 2000 and 2002,• relocation of the Decontamination OperationsCapability from the Radioactive Liquid WasteTreatment Facility (RLWTF) to the SolidRadioactive and Chemical Waste Facilities in2001,• transfer of part of the Characterization ofMaterials Capability from Sigma to the TargetFabrication Facility (TFF) in 2001, and• loss of Cryogenic Separation Capability at theTritium Key Facilities in 2001.xviiiSWEIS Yearbook—2002
Also, following the events of September 11, 2001,the Laboratory was requested to provide support forhomeland security.Since CY 1998, fewer than the 96 capabilitiesidentified for <strong>LA</strong>NL have been active. During 1998,only 87 capabilities were active. The nine capabilitieswith no activity were Manufacturing PlutoniumComponents at the Plutonium Complex; bothUranium Processing and Nonproliferation Trainingat the CMR Building; Accelerator Transmutation ofWastes at the Los Alamos Neutron Science Center(<strong>LA</strong>NSCE); Biologically Inspired Materials andChemistry, Computational Biology, and Molecularand Cell Biology at the Bioscience Facilities; andboth Size Reduction and Other Waste Processing atthe Solid Radioactive and Chemical Waste Facilities.During CY 1999, 91 capabilities were active.The five inactive capabilities were Fabricationand Metallography at CMR; both AcceleratorTransmutation of Wastes and Medical IsotopeProduction at <strong>LA</strong>NSCE; and both Size Reduction andOther Waste Processing at the Solid Radioactive andChemical Waste Facilities.During CY 2000, 89 capabilities were active.The seven inactive capabilities were Fabricationof Ceramic-Based Reactor Fuels at the PlutoniumComplex; Diffusion and Membrane Purificationat the Tritium Facilities; both Destructive andNondestructive Assay and Fabrication andMetallography at CMR; Accelerator Transmutationof Wastes and Medical Isotope Production at<strong>LA</strong>NSCE; and both Size Reduction and Other WasteProcessing at the Solid Radioactive and ChemicalWaste Facilities.During CY 2001, 87 capabilities were active. Thenine inactive capabilities were both ManufacturingPlutonium Components and Fabrication of Ceramic-Based Reactor Fuels at the Plutonium Complex; bothCryogenic Separation and Diffusion and MembranePurification at the Tritium Facilities; both Destructiveand Nondestructive Assay and Fabrication andMetallography at CMR; Accelerator Transmutation ofWastes and Medical Isotope Production at <strong>LA</strong>NSCE;and Other Waste Processing at the Solid Radioactiveand Chemical Waste Facilities.During CY 2002, 88 capabilities were active.The eight inactive capabilities were ManufacturingPlutonium Components at the Plutonium Complex;both the Cryogenic Separation and the Diffusion andMembrane Purification capabilities at the TritiumFacilities; both the Destructive and NondestructiveAssay and the Fabrication and Metallographycapabilities at CMR; both the AcceleratorTransmutation of Wastes and the Medical IsotopeProduction capabilities at <strong>LA</strong>NSCE; and Other WasteProcessing at the Solid Radioactive and ChemicalWaste Facilities.As in the preceding calendar years from 1998through 2001, only three of <strong>LA</strong>NL’s facilitiesoperated during 2002 at levels approximating thoseprojected by the ROD—the Materials ScienceLaboratory (MSL), the Bioscience Facilities(formerly Health Research Laboratory), and the Non-Key Facilities. The two Key Facilities (MSL andBioscience) are more akin to the Non-Key Facilitiesand represent the dynamic nature of researchand development at <strong>LA</strong>NL. More importantly,none of these facilities are major contributors tothe parameters that lead to significant potentialenvironmental impacts. The remaining 13 KeyFacilities all conducted operations at or belowprojected activity levels.From 1998 through 2002, radioactive airborneemissions from point sources (i.e., stacks) havevaried from a low of 1,900 curies during 1999 to ahigh of approximately 15,400 curies during 2001,70 percent of the ten-year average of 21,700 curiesprojected by the SWEIS ROD. The final dose overthis same five-year period has varied from a lowof 0.32 millirem in 1999 to a high of 1.84 milliremduring 2001 (compared to 5.44 projected), with thefinal dose for 2002 being reported to the EPA byJune 30, 2002. Calculated NPDES discharges haveranged from a low of 124 million gallons per yearin 2001 to a high of 317 million gallons per year in1999 compared to a projected volume of 278 milliongallons per year. However, the apparent decreasein flows is primarily due to the methodology bywhich flow was measured and reported in the past.Historically, instantaneous flow was measured duringfield visits as required in the NPDES permit. Thesemeasurements were then extrapolated over a 24-hourday/seven-day week. With implementation of theSWEIS Yearbook—2002xix
new NPDES permit on February 1, 2001, data arecollected and reported using actual flows recordedby flow meters at most outfalls. At those outfallsthat do not have meters, the flow is calculated asbefore, based on instantaneous flow. Quantities ofsolid radioactive and chemical wastes generated haveranged from approximately 3.2 percent of the mixedlow-level radioactive waste projections during both1999 and 2002 to 1,291 percent and 1,309 percentof the chemical waste projections during 2001 and2000, respectively. The extremely large quantities ofchemical waste (23.0 million kilograms during 2001and 27.2 million kilograms during 2000) are a resultof Environmental Restoration (ER) Project activities.(For example, the remediation of Material DisposalArea [MDA] P resulted in 21.5 million kilograms, or88 percent, of the 24.4 million kilograms of chemicalwaste generated during 2001.) Most chemicalwastes are shipped offsite for disposal at commercialfacilities; therefore, these large quantities of chemicalwaste will not impact <strong>LA</strong>NL environs. The chemicalwaste quantities are the only solid waste type tohave met or exceeded the SWEIS ROD projectionsbetween 1998 and 2002.The workforce has been above ROD projectionssince 1997. The 13,524 employees at the end of CY2002 represent 2,173 more employees than projectedand the highest number of employees over theperiod. Since 1998, the peak electricity consumptionwas 394 gigawatt-hours during 2002 and the peakdemand was 72 megawatts during 2001 comparedto projections of 782 gigawatt-hours with a peakdemand of 113 megawatts. The peak water usagewas 461 million gallons during 1998 (compared to759 million gallons projected), and the peak naturalgas consumption was 1.49 million decathermsduring 2001 (compared to 1.84 million decathermsprojected). Between 1998 and 2002, the highestcollective Total Effective Dose Equivalent (TEDE)for the <strong>LA</strong>NL workforce was 196 person-rem during2000, which is considerably lower than the workforcedose of 704 person-rem projected by the ROD.Measured parameters for ecological resourcesand groundwater were similar to ROD projections,and measured parameters for cultural resources andland resources were below ROD projections. Forland use, the ROD projected the disturbance of 48acres of new land at TA-54 because of the need foradditional disposal cells for low-level radioactivewaste. As of 2002, this expansion had not becomenecessary. However, construction continued on 44acres of land that are being developed along WestJemez Road for the Los Alamos Research Park. Thisproject has its own <strong>National</strong> Environmental PolicyAct documentation (an environmental assessment),and the land is being leased to Los Alamos Countyfor this privately owned development.Cultural resources remained protected, and noexcavation of sites at TA-54 of <strong>LA</strong>NL has occurred.(The ROD projected that 15 prehistoric sites wouldbe affected by the expansion of Area G into Zones 4and 6 at TA-54.) However, excavations did occur atthe Airport East and White Rock tracts beginning inJune 2002 and ending in March 20<strong>03</strong>. These two landtracts are now available to the County of Los Alamosfor development.As projected by the ROD, water levels in wellspenetrating into the regional aquifer continue todecline in response to pumping, typically by severalfeet each year. In areas where pumping has beenreduced, water levels show some recovery. Nounexplained changes in patterns have occurred in the1995–2002 period, and water levels in the regionalaquifer have continued a gradual decline that startedin about 1977. In addition, ecological resources arebeing sustained as a result of protection afforded byDOE ownership of <strong>LA</strong>NL. These resources includebiological resources such as protected sensitivespecies, ecological processes, and biodiversity. Therecovery and response to the Cerro Grande Fireof May 2000 included a wildfire fuels reductionprogram, burned area rehabilitation and monitoringefforts, and enhanced vegetation and wildlifemonitoring.In conclusion, <strong>LA</strong>NL operations data mostly fellwithin projections. Operations data that exceededprojections, such as number of employees orchemical waste from cleanup, either produced apositive impact on the economy of northern NewMexico or resulted in no local impact because thesewastes were shipped offsite for disposal. Overall,the 1998 through 2002 operations data indicate thatthe Laboratory was operating within the SWEISenvelope and still ramping up operations towards thepreferred Expanded Alternative in the ROD.xxSWEIS Yearbook—2002
ReferencesDepartment of Energy, 1999a. “Site-WideEnvironmental Impact Statement for ContinuedOperation of the Los Alamos <strong>National</strong>Laboratory,” US Department of Energy documentDOE/EIS-0238, Albuquerque, NM.Department of Energy, 1999b. “Record of Decision:SWEIS in the State of New Mexico,” 64 FR50797, Washington, D.C.Los Alamos <strong>National</strong> Laboratory, 2001. “EmissionsInventory Report Summary, ReportingRequirements for the New Mexico AdministrativeCode, Title 20, Chapter 2, Part 73 (20 NMAC2.73) for Calendar Year 2000,” Los Alamos<strong>National</strong> Laboratory report, Los Alamos, NM.SWEIS Yearbook—2002xxi
xxiiSWEIS Yearbook—2002
AREA OF CONTRIBUTION (continued)Los Alamos Neutron Science CenterLos Alamos Neutron Science CenterLos Alamos Neutron Science CenterMachine ShopsMaterials Science Laboratory<strong>National</strong> Pollutant Discharge Elimination System DataNon-Key Facilities–AtlasNon-Key Facilities–Industrial Research ParkNon-Key Facilities–Nonproliferation and International <strong>Security</strong> CenterNon-Key Facilities–Nonproliferation and International <strong>Security</strong> CenterNon-Key Facilities–Strategic Computing ComplexNon-Key Facilities–<strong>LA</strong>NL Medical FacilityNon-Key Facilities–Multichannel CommunicationsNon-Key Facilities–D Division Office BuildingNon-Key Facilities–Emergency Operations CenterNon-Key Facilities–Biosafety Level 3 FacilityNon-Key Facilities–Truck Inspection StationNon-Key Facilities–Live-Fire Shoot HouseNon-Key Facilities–Live-Fire Shoot HouseNon-Key Facilities–Safeguards and <strong>Security</strong>Non-Key Facilities–Omega WestNon-Key Facilities–C Division Office BuildingPajarito SitePlutonium ComplexRadioactive Liquid Waste Treatment FacilityRadioactive Liquid Waste Treatment FacilityRadiochemistry FacilitySigmaSigmaSocioeconomicsSolid Radioactive and Chemical Waste FacilitiesSolid Radioactive and Chemical Waste FacilitiesSolid Radioactive and Chemical WasteSolid Radioactive and Chemical WasteSolid Radioactive and Chemical WasteTarget Fabrication FacilityTarget Fabrication FacilityTrend AnalysisTrend AnalysisTrend AnalysisTrend AnalysisTritium FacilitiesUtilitiesUtilitiesUtilitiesWorker Safety/DosesWorker Safety/DosesCONTRIBUTOR (continued)Frank MerrillAlexander (Andy) SaundersGabriela Lopez EscobedoJerry LeechesJennifer RezmerMarc BaileyDave ScudderTony BeugelsdijkWilliam (Bill) HamiltonMark GambleNick NagyAleene JenkinsLyle KerstiensKathleen FillmoreKeith OrrLinda BakerRuth LarkinSkip AndersonSteve RiveraBill SoleKeith RendellGeorge MartinezDebbie BacaHarvey DeckerRick AlexanderRobert McClenahanSara HelmickGreg LowerStephen CosseyJohn PantanoSean FrenchGarry AllenDeborah DaymonTim SloanJulie Minton-HughesJerry GrindstaffStephen CosseyTrisha SanchezRichard RomeroKen BostickJohn KellyRichard CarlsonJerome GonzalesMark HinrichsGilbert MontoyaRobin DeVoreTom BuhlxxivSWEIS Yearbook—2002
1.0 Introduction1.1 The SWEISIn 1999, the US Department of Energy (DOE) 1 published a Site-Wide Environmental Impact Statementfor Continued Operation of the Los Alamos <strong>National</strong> Laboratory (DOE 1999a). DOE issued its Record ofDecision (ROD) on this Site-Wide Environmental Impact Statement (SWEIS) in September 1999 (DOE1999b). The ROD identified the decisions DOE made on levels of operation for <strong>LA</strong>NL for the foreseeablefuture.1.2 Annual YearbookTo enhance the usefulness of this SWEIS, a <strong>National</strong> Environmental Policy Act (NEPA) document, DOEand <strong>LA</strong>NL implemented a program making annual comparisons between SWEIS ROD projections and actualoperations via an Annual Yearbook. The Yearbook’s purpose is not to present environmental impacts orenvironmental consequences, but rather to provide data that could be used to develop an impact analysis. TheYearbook focuses on the following:• Facility and process modifications or additions (Chapter 2). These include projected activities, forwhich NEPA coverage was provided by the SWEIS, and some post-SWEIS activities for whichenvironmental coverage was not provided. In the latter case, the Yearbook identifies the additionalNEPA analyses (i.e., categorical exclusions and environmental assessments) that were performed.• The types and levels of operations during the calendar year (Chapter 2). Types of operations aredescribed using capabilities defined in the SWEIS. Levels of operations are expressed in unitsof production, numbers of researchers, numbers of experiments, hours of operation, and otherdescriptive units.• Operations data for the Key Facilities, comparable to data projected by the SWEIS ROD (Chapter2). Data for each facility include waste generated, air emissions, liquid effluents, and number ofworkers.• Site-wide effects of operations for the calendar year (Chapter 3). These include measures such asnumber of workers, radiation doses, workplace incidents, utility requirements, air emissions, liquideffluents, and solid wastes. These effects also include changes in the regional aquifer, ecologicalresources, and other resources for which the DOE has long-term stewardship responsibilities as anowner of federal lands.• Trend analysis (Chapter 4). This includes analysis on land use, quantities of waste generated, utilityconsumption, long-term effects from Laboratory operations, and the Cerro Grande RehabilitationProject.• Ten-Year Comprehensive Site Plan (TYSCP; Chapter 5). This is a summary of what the Laboratoryis proposing for potential future projects relative to land usage; structure maintenance, construction,and decontamination and demolition; and infrastructure maintenance and improvements.1Congress established the <strong>National</strong> <strong>Nuclear</strong> <strong>Security</strong> <strong>Administration</strong> (NNSA) within the DOE to manage the nuclear weapons program for theUnited States. Los Alamos <strong>National</strong> Laboratory (<strong>LA</strong>NL or Laboratory) is one of the facilities now managed by the NNSA. The NNSA officiallybegan operations on March 1, 2000. Its mission is to carry out the national security responsibilities of the DOE, including maintenance of a safe,secure, and reliable stockpile of nuclear weapons and associated materials capabilities and technologies; promotion of international nuclear safety andnonproliferation; and administration and management of the naval nuclear propulsion program.SWEIS Yearbook—2002 1-1
• Summary and conclusion (Chapter 6). This chapter summarizes CY 1998 through CY 2002 forthe Laboratory in terms of overall facility construction and modifications, facility operations, andoperations data and environmental parameters. These data form the basis of the conclusion forwhether or not the Laboratory is operating within the envelope of the SWEIS ROD.• Chemical usage and emissions data (Appendix A). These data summarize the chemical usage andair emissions by Key Facility.• <strong>Nuclear</strong> facilities list (Appendix B). This appendix provides a summary of the facilities identifiedas nuclear at the time the SWEIS was developed through CY 2002.• Radiological facilities list (Appendix C). These data identify the facilities considered asradiological in CY 2001 and CY 2002 and indicate their categorization at the time the SWEIS wasdeveloped.• Outfall status table (Appendix D). This table delineates outfalls at <strong>LA</strong>NL and chronicles usagehistory.• Preliminary Assessment of Potential Impact of <strong>LA</strong>NL Site Boundary Changes and Land Transferon Accident Analyses in the SWEIS (Appendix E). This appendix provides an assessment of thepotential impact of land transfers on the accident analyses in the SWEIS.• Future projects (Appendix F). This appendix summarizes the projects identified in the TYCSP.Data for comparison come from a variety of sources, including facility records, operations reports,facility personnel, and the annual Environmental Surveillance Report. The focus on operations rather than onprograms, missions, or funding sources is consistent with the approach of the SWEIS.The Annual Yearbooks provide DOE with information needed to evaluate adequacy of the SWEIS andenables DOE to make decisions on when and if a new SWEIS is needed. Once every five years, DOE willmake a formal evaluation of the SWEIS as to its adequacy, and therefore, every fifth year, the Yearbook willnot only report the previous years, data on operations, but will also include summaries and trends of the datapresented in the previous four editions.The Yearbooks also provide facilities and managers at the Laboratory a guide in determining whetheractivities are within the SWEIS operating envelope. The report does not reiterate the detailed informationfound in other <strong>LA</strong>NL documents, but rather points the interested reader to those documents for the additionaldetail. The Yearbook serves as a guide to environmental information collected and reported by the variousgroups at <strong>LA</strong>NL.The SWEIS analyzed the potential environmental impacts of scenarios for future operations at <strong>LA</strong>NL.DOE announced in its ROD that it would operate <strong>LA</strong>NL at an expanded level and that the environmentalconsequences of that level of operations were acceptable. The ROD is not a predictor of specific operations,but establishes boundary conditions for operations. The ROD provides an environmental operating envelopefor specific facilities and for the Laboratory as a whole. If operations at <strong>LA</strong>NL were to routinely exceedthe operating envelope, DOE would evaluate the need for a new SWEIS. As long as <strong>LA</strong>NL operationsremain below the level analyzed in the ROD, the environmental operating envelope is valid. Thus, the levelsof operation projected by the SWEIS ROD should not be viewed as goals to be achieved, but rather asacceptable operational limits.1-2SWEIS Yearbook—2002
1.3 This YearbookThe ROD selected levels of operations, and the SWEIS provided projections for these operations.This Yearbook compares data from 1998 through 2002 to the appropriate SWEIS projections. Hence, thisreport uses the phrases “SWEIS ROD projections,” “SWEIS ROD,” or “ROD” to convey this concept, asappropriate.The collection of data on facility operations is a unique effort. The type of information developed for theSWEIS is not routinely collected at <strong>LA</strong>NL. Nevertheless, this information is the heart of the SWEIS and theYearbook. Although this requires a special effort, the description of current operations and indications offuture changes in operations are believed to be sufficiently important to warrant an incremental effort.This Yearbook represents the fifth year of data collection and comparison. Therefore, this Yearbookincludes summaries of the previous four years, trends in the data across these years, and additionalinformation as deemed necessary to enable DOE to use this document as the primary source of informationfor determination of the adequacy of the existing SWEIS.1.4 ReferencesDepartment of Energy, 1999a. “Site-Wide Environmental Impact Statement for Continued Operation of theLos Alamos <strong>National</strong> Laboratory,” US Department of Energy document DOE/EIS-0238, Albuquerque,NM.Department of Energy, 1999b. “Record of Decision: SWEIS in the State of New Mexico,” 64 FR 50797,Washington, D.C.Entrance to <strong>LA</strong>NLSWEIS Yearbook—2002 1-3
Aerial view–North from Pajarito Road1-4SWEIS Yearbook—2002
2.0 Facilities and Operations<strong>LA</strong>NL has more than 2,000 structures with approximately eight million square feet under roof, spreadover an area of approximately 40 square miles. In order to present a logical and comprehensive evaluation of<strong>LA</strong>NL’s potential environmental impacts, the SWEIS developed the Key Facility concept. Fifteen facilitieswere identified that were both critical to meeting mission assignments and• housed operations that have potential to cause significant environmental impacts, or• were of most interest or concern to the public (based on comments in the SWEIS public hearings), or• would be more subject to change because of DOE programmatic decisions.The remainder of <strong>LA</strong>NL was called “Non-Key,” not to imply that these facilities were any less importantto accomplishment of critical research and development, but because they did not fit the above criteria (DOE1999a).Taken together, the 15 Key Facilities represent the great majority of environmental risks associated with<strong>LA</strong>NL operations. Specifically, the SWEIS projected that the Key Facilities would contribute• more than 99 percent of all radiation doses to the public,• more than 90 percent of all radioactive liquid waste generated at <strong>LA</strong>NL,• more than 90 percent of all radioactive solid waste generated at <strong>LA</strong>NL,• more than 99 percent of all radiation doses to the <strong>LA</strong>NL workforce, and• approximately 30 percent of all chemical waste generated by <strong>LA</strong>NL.Offsite and Onsite DosesTable 2.0-1 compares the actual maximum offsite doses to the SWEIS projections. As expected, the dosesvary from the projection because the pit production mission has not reached maturity. Table 2.0-1 presentsthe readily available calendar year radiation doses, estimated and actual, to the public from <strong>LA</strong>NL operations.These data have not been captured by facility for the SWEIS Yearbooks.Table 2.0-1. Maximum Offsite Dose Estimates (mrem)MAXIMUMOFFSITEDOSE SWEIS ROD 1998 1999 2000 2001 2002Estimate 5.44 1.72 0.32 0.65 1.9 1.6Actual --- 1.72 0.32 0.65 1.84 1.69Occupational radiation exposures for workers at <strong>LA</strong>NL from CY 1998 through CY 2002 are summarizedin Table 2.0-2. The collective Total Effective Dose Equivalent, or collective TEDE, for the <strong>LA</strong>NL workforceduring 2002 was 164 person-rem, considerably lower than the workforce dose of 704 person-rem projectedfor the ROD.SWEIS Yearbook—2002 2-1
Table 2.0-2. Radiological Exposure to <strong>LA</strong>NL WorkersPARAMETERCollective TEDE (external +internal)Number of workers with nonzerodoseAverage non-zero dose:• external + internalradiation exposure• external radiation exposure onlySWEIS VALUE VALUE VALUE VALUE VALUEUNITS ROD FOR 1998 FOR 1999 FOR 2000 FOR 2001 FOR 2002person-rem 704 161 <strong>131</strong> 196 113 164number 3,548 1,839 1,427 1,316 1,332 1696milliremmilliremNotprojectedNotprojected87.4Notprojected92901496585839695Comparison with the Projected TEDE in the ROD. In addition to being less than the collectiveTEDE levels in 1993–1995, the collective TEDE for 2002 is less than the TEDE projected in the ROD. Theimplementation of war reserve pit manufacture, which was approved in the ROD, has not become fullyoperational at <strong>LA</strong>NL. This contributed to lower doses than projected. The collective dose may increase oncethe pit manufacture program is fully implemented.Collective TEDEs for Key Facilities. In general, collective TEDEs by Key Facility or technical area aredifficult to determine because these data are collected at the group level, and members of many groups and/ororganizations receive doses at several locations. The fraction of a group’s collective TEDE coming from aspecific Key Facility or technical area can only be estimated. For example, personnel from the Health PhysicsOperations group and Johnson Controls Northern New Mexico (JCNNM) are distributed over the entireLaboratory, and these two organizations account for a significant fraction of the total <strong>LA</strong>NL collective TEDE.Radioactive Waste GenerationTables 2.0-3 through 2.0-8 compare the actual waste generation volumes to the SWEIS projections. Asexpected, the volumes vary from the projections because the pit production mission has not reached maturity.Please note that the Facility and Waste Operations (FWO) database has been improved and adjusted for wastegenerator variances.Table 2.0-3 shows the total amount of radioactive liquid waste treated at <strong>LA</strong>NL. The facilities contributingliquid waste to the Radioactive Liquid Waste Treatment Facility (RLWTF), located at TA-50, can be found inthe Annual Reports generated by the RLWTF operating group. Inspection of these reports substantiates theprojection of greater than 90 percent of all radioactive liquid waste being generated by the 15 Key Facilities.(The most recent report is <strong>LA</strong>NL 20<strong>03</strong>.)Tables 2.0-4 through 2.0-8 show the solid radioactive waste data by Key Facility. The solid radioactivewaste data are presented by individual types (LLW, mixed LLW [MLLW], TRU, and Mixed TRU) andsummarized overall. Percentage comparisons have been given with and without environmental restorationbecause the environmental restoration contribution was an unknown at the time of the SWEIS publication.Chemical Waste GenerationThe chemical waste generated by Key Facility is summarized in Table 2.0-9. As with the solid radioactivewaste, percentage comparisons have been given with and without environmental restoration because theenvironmental restoration contribution was an unknown at the time of the SWEIS publication.2-2SWEIS Yearbook—2002
SWEIS Yearbook—2002 2-3Table 2.0-3. Radioactive Liquid Waste Treated at <strong>LA</strong>NLWASTE TREATMENT ACTIVITY SWEIS ROD 1998 1999 2000 2001 2002TOTAL(1998–2002)Pretreatment of radioactive liquid 900,000 liters/yr 370,000 liters 45,000 liters 45,000 liters 457,000 liters 30,300 liters 947,300 literswaste at TA-21Percentage of SWEIS projection of- 41% 5% 5% 51% 3% 21%pretreatment at TA-21Pretreatment of radioactive liquidwaste from TA-5580,000 liters/yr 39,000 liters Less than80,000 liters9,000 liters 22,000 liters 35,400 liters Less than185,400 litersPercentage of SWEIS projection of- 49% Less than 100% 11% 28% 44% 46%pretreatment from TA-55Solidification of transuranic (TRU) 3 m 3 /yr None 5 m 3 5 m 3 None None 10 m 3sludge at TA-50Percentage of SWEIS projection of- 0% 167% 167% 0% 0% 67%solidification of TRU sludgeRadioactive liquid waste treated atTA-5<strong>03</strong>5,000,000 liters/yr 23,000,000liters20,000,000liters19,000,000liters14,000,000liters11,500,000liters87,500,000litersPercentage of SWEIS projection of- 66% 57% 54% 40% 33% 50%radioactive liquid waste treated atTA-50De-water low-level radioactive waste 10 m 3 /yr 28 m 3 37 m 3 48 m 3 60 m 3 10 m 3 183 m 3(LLW) sludge at TA-50Percentage of SWEIS projection of- 280% 370% 480% 600% 100% 366%LLW sludge de-watered at TA-50Radioactive liquid waste treated at Not Projecteda a b b243,000 liters NATA-53Percentage of SWEIS projection ofradioactive liquid waste treated atTA-53NA NA NA NA NA NA NAabRecords of flows into the TA-53 lagoons started in CY 2000.The first records of flows into the TA-53 RLWTF were reported in the 2002 annual report (<strong>LA</strong>NL 20<strong>03</strong>).
2-4Table 2.0-4. Low-Level Waste Generation at <strong>LA</strong>NL by Facility (in m 3 /yr)FACILITY SWEIS ROD 1998 1999 2000 2001 2002TOTAL(1998–2002)2.1 Plutonium Complex 754 238 345 199 300 296.3 1,378.302.2 Tritium Facility 480 46 47 49 0 90 232.002.3 Chemistry and Metallurgy Research (CMR)1,820 124 184 264 448 389 1,409.00Building2.4 Pajarito Site 145 4 31.3 14 13 0 62.302.5 Sigma Complex 960 3 61 52 0.5 202 318.502.6 Materials Science Laboratory (MSL) 0 0 0 0 0 0 0.002.7 Target Fabrication Facility (TFF) 10 0 0 0 0.2 0.4 0.602.8 Machine Shops 606 27 40.4 409 22 44 542.402.9 High Explosives Processing 16 6 8.3 3 1 8.69 26.992.10 High Explosives Testing 940 0 0.01 0.6 0 0 0.612.11 Los Alamos Neutron Science Center (<strong>LA</strong>NSCE) 1,085 16 70 28 0.1 0 114.102.12 Bioscience Facilities 34 7 14 0 0 0 21.002.13 Radiochemistry Facility 270 89 44 57 55 34 279.002.14 RLWTF 160 132 175 132 517 193 1,149.002.15 Solid Radioactive and Chemical Waste Facilities 174 15 21 13 14 35 98.00Total of LLW for Key Facilities 7,454 707 1,042.01 1,221.60 1,406.80 1,292.39 5,669.802.16 Non-Key Facilities 520 386 350 2,781 569 534 4,620Total of LLW for Key and Non-Key Facilities 7,974 1,092 1,392.01 4,002.60 1,975.80 1,826.39 10,288.80Percentage of Total from Key Facilities 93.5% 65.7% 74.8% 43.9% 71.2% 70.8% 55.1%2.17 Environmental Restoration (ER) Project 4,260 744 286 226 621 5,484 7,361Total of LLW for Non-Key Facilities and ER Project 4,780 1,130 636 3,007 1,190 6,018 11,981Total LLW = Key + Non-Key and ER Project 12,234 1,837 1,678.01 4,228.60 2,596.80 7,310 17,650.41Percentage of Total from Key Facilities 60.9% 38.5% 62.1% 28.9% 54.2% 17.7% 32.1%SWEIS Yearbook—2002
SWEIS Yearbook—2002 2-5Table 2.0-5. Mixed Low-Level Waste Generation at <strong>LA</strong>NL by Facility (in m 3 /yr)FACILITY SWEIS ROD 1998 1999 2000 2001 2002TOTAL(1998–2002)2.1 Plutonium Complex 13 1.3 3.9 1.75 12.6 3.34 22.892.2 Tritium Facility 3 0.1 0 0 0.01 0.8 0.912.3 CMR Building 19 3.2 0.4 0.3 0.4 0.9 5.22.4 Pajarito Site 1.5 0 7.9 0 0 0 7.92.5 Sigma Complex 4 0 0.3 0 1.3 0 1.62.6 MSL 0 0 0 0 0 0 02.7 TFF 0.4 0 0 0 0 0 02.8 Machine Shops 0 0.1 0.<strong>03</strong> 0.12 0.05 0 0.32.9 High Explosives Processing 0.2 0 0 0 0 0 02.10 High Explosives Testing 0.9 0 0 0 0 0 02.11 <strong>LA</strong>NSCE 1 0.4 0.5 4.9 0.2 0.9 6.92.12 Bioscience Facilities 3.4 0 0.01 0 0 0 0.012.13 Radiochemistry Facility 3.8 0.3 0.6 1.6 2.8 2.2 7.52.14 RLWTF 0 1.3 3.2 2.5 2.6 3.7 13.32.15 Solid Radioactive and Chemical Waste Facilities 4 0 0 0 0 0 0Total of MLLW for Key Facilities 54.2 6.8 16.9 11.13 19.97 11.84 66.642.16 Non-Key Facilities 30 55.4 2.5 10.1 9.4 8.7 86.1Total of MLLW for Key and Non-Key Facilities 84.2 62.2 19.4 21.23 29.37 20.54 152.74Percentage of Total from Key Facilities 64.4% 10.9% 87.1% 52.4% 68.0% 57.6% 43.6%2.17 ER Project 548 9.2 1.25 577 28.86 0 616.31Total of MLLW for Non-Key and ER Project Facilities 578 64.6 3.75 587.1 38.26 8.7 702.41Total MLLW = Key + Non-Key and ER Project Facilities 632.2 71.4 20.65 598.23 58.23 20.54 769.05Percentage of Total from Key Facilities 8.6% 9.5% 81.8% 1.9% 34.3% 57.6% 8.7%
2-6Table 2.0-6. TRU Waste Generation at <strong>LA</strong>NL by Facility (in m 3 /yr)FACILITY SWEIS ROD 1998 1999 2000 2001 2002TOTAL(1998–2002)2.1 Plutonium Complex 237 73.3 94 54.1 35.6 40.6 297.92.2 Tritium Facility 0 0 0 0 0 0 02.3 CMR Building 28 12.7 8.9 24.8 46.5 10.2 1<strong>03</strong>.12.4 Pajarito Site 0 0 0 0 0 0 02.5 Sigma Complex 0 0 0 0 0 0 02.6 MSL 0 0 0 0 0 0 02.7 TFF 0 0 0 0 0 0 02.8 Machine Shops 0 0 0 0 0 0 02.9 High Explosives Processing 0 0 0 0 0 0 02.10 High Explosives Testing (Listed as TRU/Mixed TRU) 0.2 0 0 0 0 0 02.11 <strong>LA</strong>NSCE 0 0 0 0 0 0 02.12 Bioscience Facilities 0 0 0 0 0 0 02.13 Radiochemistry Facility 0 0.2 0 0 0 0 0.22.14 RLWTF 30 1 0 16.1 0.4 1.9 19.42.15 Solid Radioactive and Chemical Waste Facilities 27 20.9 39.9 27.1 9.7 29.5 127.1Total of TRU Waste for Key Facilities 322.2 108.1 143.2 122.1 92.2 82.2 547.82.16 Non-Key Facilities 0 0 0 2.7 24.8 36.8 64.3Total of TRU Waste for Key and Non-Key Facilities 322.2 108.1 143.2 124.8 117.0 119.1 612.2Percentage of Total from Key Facilities 100.0% 100.0% 100.0% 97.8% 78.8% 68.9% 89.5%2.17 ER Project 11 0 0 0 0 0 0Total of TRU Waste for Non-Key and ER Project Facilities 11 0 0 2.7 24.8 36.8 64.3Total TRU = Key + Non-Key and ER Project Facilities 333.2 108.1 143.2 124.8 117.0 119.1 612.2Percentage of Total from Key Facilities 96.7% 100% 100% 97.8% 78.8% 69.0% 89.5%SWEIS Yearbook—2002
SWEIS Yearbook—2002 2-7Table 2.0-7. Mixed TRU Waste Generation at <strong>LA</strong>NL by Facility (in m 3 /yr)FACILITY SWEIS ROD 1998 1999 2000 2001 2002TOTAL(1998–2002)2.1 Plutonium Complex 102 16.8 66 16.8 29.6 54.9 184.12.2 Tritium Facility 0 0 0 0 0 0 02.3 CMR Building 13 15.8 1.9 1 0.8 16.7 36.22.4 Pajarito Site 0 0 0 0 0 0 02.5 Sigma Complex 0 0 0 0 0 0 02.6 MSL 0 0 0 0 0 0 02.7 TFF 0 0 0 0 0 0 02.8 Machine Shops 0 0 0 0 0 0 02.9 High Explosives Processing 0 0 0 0 0 0 02.10 High Explosives Testing (Listed as TRU/Mixed TRU) 0.2 0 0 0 0 0 02.11 <strong>LA</strong>NSCE 0 0 0 0 0 0 02.12 Bioscience Facilities 0 0 0 0 0 0 02.13 Radiochemistry Facility 0 0 0 0 0 0 02.14 RLWTF 0 1.4 4.8 0 4.4 0.2 10.82.15 Solid Radioactive and Chemical Waste Facilities 0 0 0 7.8 13.1 15.1 36Total of Mixed TRU Waste for Key Facilities 115.2 34.0 72.2 25.6 47.9 86.8 266.52.16 Non-Key Facilities 0 0 15 63 00.21 78.21Total of Mixed TRU Waste for Key and Non-Key Facilities 115.2 34.0 87.2 88.6 47.9 87.01 344.71Percentage of Total from Key Facilities 100.0% 100.0% 83.8% 28.9% 100.0% 99.8% 77.3%2.17 ER Project 0 0 0 0 0.2 00.2Total of Mixed TRU Waste for Non-Key and ER Project Facilities 0 0 15 63 0.2 0.21 78.41Total Mixed TRU = Key + Non-Key and ER Project 115.2 34.0 87.2 88.6 48.1 87.01 344.91Percentage of Total from Key Facilities 100% 100% 82.8% 28.9% 99.6% 99.8% 77.3%
2-8Table 2.0-8. Overall Solid Radioactive Waste Generation at <strong>LA</strong>NL (in m 3 /yr)FACILITYSWEISROD 1998 1999 2000 2001 2002TOTAL(1998–2002)Total of LLW for Key Facilities 7,454.0 707 1,042.01 1,221.6 1,406.80 1,292.39 5,669.80Total of MLLW for Key Facilities 54.2 6.8 16.9 11.3 19.97 11.84 66.64Total of TRU for Key Facilities 322.2 108.1 143.2 122.1 92.2 82.2 547.8Total of Mixed TRU for Key Facilities 115.2 34 72.2 25.6 47.9 86.8 266.5Total Radioactive Solid Waste for Key Facilities 7,945.6 855.9 1,274.31 1,380.60 1,566.87 1,473.23 6,550.74Total LLW from Non-Key Facilities 520 386 350 2,781 569 534 4,620Total MLLW from Non-Key Facilities 30 55.4 2.5 10.1 9.4 8.7 86.1Total TRU from Non-Key Facilities 0 0 0 2.7 24.8 36.8 64.3Total Mixed TRU from Non-Key Facilities 0 0 15 63 00.21 78.21Total Radioactive Solid Waste from Non-Key Facilities 550 441.4 367.5 2,857 6<strong>03</strong>.2 579.71 4,849Total Radioactive Solid Waste for Key and Non-Key Facilities 8,495.6 1,297.3 1,641.81 4,237.6 2,170.07 2,052.94 11,399.74Percentage of Total Radioactive Solid Waste from Key Facilities 93.5% 66.0% 77.6% 32.6% 72.2% 71.8% 57.5%Total LLW from ER Project 4,260 744 286 226 621 5.484 7,361Total MLLW from ER Project 548 9.2 1.25 577 28.86 0 616.31Total TRU Waste from ER Project 11 0 0 0 0 0 0Total Mixed TRU Waste from ER Project 0 0 0 0 0.2 00.2Total Radioactive Solid Waste from ER Project 4,819 753.2 287.25 8<strong>03</strong> 650.06 5,484 7,978Total Radioactive Solid Waste from All Facilities 13,315 2,050.5 1,929.06 5,040.6 2.820.13 7,536.94 19,377.74Percentage From Key Facilities 59.7% 41.7% 66.1% 27.4% 55.6% 19.5% 33.8%SWEIS Yearbook—2002
SWEIS Yearbook—2002 2-9Table 2.0-9. Chemical Waste Generated at <strong>LA</strong>NL by Facility (in kg/yr)FACILITY SWEIS ROD 1998 1999 2000 2001 2002TOTAL(1998–2002)2.1 Plutonium Complex 8,400 10,861 2,538 1,563 11,709 14,243 40,9142.2 Tritium Facility 1,700 195 30 10 2,615 5,164 8,0142.3 CMR Building 10,800 3,313 4,824 1,837 676 707 11,3572.4 Pajarito Site 4,000 3,127 1,707 127 91 82 5,1342.5 Sigma Complex 10,000 22,489 3,208 3,672 1,265 32,397 63,<strong>03</strong>12.6 MSL 600 244 154 881 255 149 1,6832.7 TFF 3,800 2,827 594 1,062 668 904 6,0552.8 Machine Shops 474,000 4,399 3,955 887 26,474 2,023 37,7382.9 High Explosives Processing 13,000 12,237 13,329 1,<strong>03</strong>2,985 375,283 15,109 1,448,9432.10 High Explosives Testing 35,300 444 1,015 60,437 1,337 1,285 64,5182.11 <strong>LA</strong>NSCE 16,600 55,258 11,060 1,205 4,057 1,999 73,5792.12 Bioscience Facilities 13,000 2,368 1,691 2,370 1,359 4,504 12,2922.13 Radiochemistry Facility 3,300 1,990 1,513 12,461 17,725 186,135 219,8242.14 RLWTF 2,200 384 201 384 68,792 1,143 70,9042.15 Solid Radioactive and Chemical Waste Facilities 920 327 30 806 449 863 2,475Total of Chemical Waste for Key Facilities 597,620 120,462 45,848 1,120,688 512,756 266,707 2,066,4612.16 Non-Key Facilities 651,000 1,506,392 765,395 367,768 1,254,680 334,348 4,228,583Total of Chemical Waste for Key and Non-Key Facilities 1,248,620 1,626,854 811,243 1,488,456 1,767,436 601,055 6,295,044Percentage of Total from Key Facilities 47.9% 7.4% 5.7% 75.3% 21.2% 44.4% 32.8%2.17 ER Project 2,000,000 143,913 14,629,792 26,185,341 28,815,571 1,132,780 67,907,397Total of Chemical Waste for Non-Key and ER Project Facilities 2,651,000 1,650,305 15,395,187 26,553,109 27,070,251 1,467,128 72,135,980Total Waste = Key + Non-Key Facilities and ER Project 3,248,620 1,770,767 15,441,086 27,673,797 27,583,007 1,733,835 74,202,492Percentage of Total from Key Facilities 18.4% 9.3% 0.3% 4.0% 1.9% 15.4% 2.8%
In addition, the Key Facilities (as presented in the SWEIS) comprised 42 of the 48 Category 2 andCategory 3 <strong>Nuclear</strong> Structures at <strong>LA</strong>NL. 1 Subsequently, DOE and <strong>LA</strong>NL have published five lists identifyingnuclear facilities at <strong>LA</strong>NL [one in 1998 (DOE 1998a), another in 2000 (DOE 2000a), two in 2001 (<strong>LA</strong>NL2001a, b), and one in 2002 (<strong>LA</strong>NL 2002a)] that significantly changed the classification of some buildings.<strong>Nuclear</strong> and Radiological Facility DesignationsTable 2.0-10 shows the nuclear facilities identified in the SWEIS and those identified in 2002 (<strong>LA</strong>NL2002a). Appendix B provides a summary of the nuclear facilities and a table has been added to each sectionof this chapter to explain the differences and identify the 23 structures currently listed by DOE as nuclearfacilities. Of these 23 structures, all reside within a Key Facility. The only Non-Key Facility listed in2001 was the former tritium research facility (TA-33-86), but the facility underwent decontamination anddecommissioning in 2002, was demolished, and was removed from the nuclear facility list. Appendix Cprovides a comparison of the facilities identified as radiological when the SWEIS was prepared and thoseidentified as radiological in 2001 and 2002 (<strong>LA</strong>NL 2001c, 2002b). The 2001 and 2002 lists are shorter due tobetter guidance on the radiological designation. 2Definition of Key FacilitiesThe definition of each Key Facility hinges upon operations 3 , capabilities, and location and is notnecessarily confined to a single structure, building, or technical area. In fact, the number of structurescomprising a Key Facility ranges from one, the MSL, to more than 400 for <strong>LA</strong>NSCE. Key Facilities can alsoexist in more than a single technical area, as is the case with the High Explosives Testing and High ExplosivesProcessing Key Facilities, which exist in all or parts of five and seven technical areas, respectively.This chapter discusses each of the 15 Key Facilities from three aspects—significant facility constructionand modifications, types and levels of operations, and operations data by calendar year from the publication ofthe SWEIS through 2002. Each of these three aspects is given perspective by comparing them to projectionsmade by the SWEIS ROD. This comparison provides an evaluation of whether or not data resulting from<strong>LA</strong>NL operations continue to fall within the environmental envelope established by the SWEIS ROD.It should be noted that construction activities projected by the SWEIS ROD were for the 10-year period1996–2005. All construction activities will not be complete and projected operations may not reach maximumlevels until the end of the 10-year period. Table 2.0-11 identifies the construction and modifications projectedby the SWEIS ROD and what activity has occurred from 1998-2002. Table 2.0-12 summarizes the projectedconstruction and modifications that have been completed. Table 2.0-13 summarizes the usage of capabilitiesby facility while Table 2.0-14 concentrates on those capabilities that have been inactive or lost. Table 2.0-15provides an overview of emissions and solid waste while Table 2.0-16 summarizes flow from the permittedoutfalls.1 DOE Order 5480.23 (DOE 1992a) categorizes nuclear hazards as Category 1, Category 2, or Category 3. Because <strong>LA</strong>NL has no Category 1 nuclearfacilities (usually applied to nuclear reactors), definitions are presented for only Categories 2 and 3:• Category 2 <strong>Nuclear</strong> Hazard–has the potential for significant onsite consequences. DOE-STD-1027-92 (DOE 1992b) provides the resulting thresholdquantities for radioactive materials that define Category 2 facilities.• Category 3 <strong>Nuclear</strong> Hazard–has the potential for only significant localized consequences. Category 3 is designed to capture those facilities such aslaboratory operations, LLW handling operations, and research operations that possess less than Category 2 quantities of material. DOE-STD-1027-92(DOE 1992b) provides the Category 3 thresholds for radionuclides.The identification of nuclear facilities is based upon the official list maintained by DOE Los Alamos Site Office as of December 2002 (<strong>LA</strong>NL 2002a).2 Since the publication of the SWEIS, only two radiological facility lists have been published. The first (<strong>LA</strong>NL 2001c) was published in 2001 and thesecond (<strong>LA</strong>NL 2002b) in 2002.3 As used in the SWEIS and this Yearbook, facility operations include three categories of activities—research, production, and services to other <strong>LA</strong>NLorganizations. Research is both theoretical and applied. Examples include modeling (e.g., atmospheric weather patterns) to subatomic investigations(e.g., using the <strong>LA</strong>NSCE linear accelerator [linac]) to collaborative efforts with industry (e.g., fuel cells for automobiles). Production involves deliveryof a product to a customer, such as radioisotopes to hospitals and the medical industry. Examples of services provided to other <strong>LA</strong>NL facilities includeutilities and infrastructure support, analysis of samples, environmental surveys, and waste management.2-10SWEIS Yearbook—2002
SWEIS Yearbook—2002 2-11Table 2.0-10. <strong>LA</strong>NL <strong>Nuclear</strong> Facilities – SWEIS and 2002SWEIS 2002KEY FACILITY BUILDING FACILITY HC FACILITY HC2.1 Plutonium Complex TA-55-4 Pu-238 Processing 2 TA-55 Plutonium Facility 2TA-55-41 <strong>Nuclear</strong> Material Storage 22.2 Tritium Facilities TA-16-205 Weapons Engineering Tritium Facility (WETF) 2 TA-16 WETF 2TA-16-205A WETF 2TA-16-450 WETF 2TA-21-155 Tritium System Test Assembly (TSTA) 2 TSTA 2TA-21-209Tritium Science and Fabrication Facility(TSFF)2 TA-21 TSFF 22.3 CMR Building TA-<strong>03</strong>-19 (actually TA-3- Chemistry and Metallurgy Research Facility 2 TA-<strong>03</strong> CMR229)(CMR)2.4 Pajarito Site TA-18-23 KIVA 1 2 TA-18 Los Alamos Critical Experiment 2TA-18-26 Hillside Vault 2TA-18-32 KIVA 2 2TA-18-116 KIVA 3 22.5 Sigma Complex TA-<strong>03</strong>-66 44 metric tons of depleted uranium storage 3TA-<strong>03</strong>-159 Thorium storage 32.6 MSL2.7 TFF2.8 Machine Shops2.9 High ExplosivesProcessingTA-08-22 Radiography Facility 2FacilityTA-08-23 Radiography Facility 2 Betaron Building 2TA-08-24 Isotope Building 2TA-08-70 Experimental Science 2TA-16-411 Intermediate Device Assembly 22.10 High Explosives Testing2.11 <strong>LA</strong>NSCE TA-53-3M Experimental Science 3TA-53 1L Target 3TA-53 Lujan Center ER-1/2 3TA-53 Area A-6 32.12 Bioscience2.13 Radiochemistry Facility TA-48-1 Radiochemistry and Hot Cell Facility 3 TA-48 Radiochemistry and Hot CellFacility3
2-12SWEIS Yearbook—2002Table 2.0-10. <strong>LA</strong>NL <strong>Nuclear</strong> Facilities – SWEIS and 2002 (continued)SWEIS 2002KEY FACILITY BUILDING FACILITY HC FACILITY HC2.14 RLWTF TA-50-1 Main Treatment Plant 2 Main Treatment Plant, pretreatment plant,3decontamination operationTA-50-2 LLW Tank Farm Low level liquid influence tanks, treatment effluent 3tanks, low level sludge tanksTA-50-66 Acid and Caustic Tank Farm Acid and caustic waste holding tanks 3TA-50-90 Holding Tank Holding Tank 32.15 Solid Radioactive andChemical Waste FacilitiesTA-50-37 Radioactive Materials, Research,Operations, and DemonstrationTA-50 RAMROD 2TA-50-69(RAMROD)Waste Characterization, Reduction, andRepackaging (WCRR) Facility BuildingNondestructive Analysis MobileActivities2 TA-50 WCRR Facility 3TA-50-69OutsideTA-50 External nondestructive analysis mobileactivities outside TA-50-692TA-50-69TA-50 External Drum staging/storage pad and waste 2Outsidecontainer temperature equilibration activities outsideTA-50-69TA-54 Area G LLW Waste Storage/Disposal 2 TA-54 Storage and Disposal Facility (Area G) 2TA-54-33 TRU Drum Preparation 2 Transuranic waste storage fabric dome with TRU waste 2drum (TRU Waste Inspectable Storage Project[TWISP])TA-54-38 Radioactive Assay Nondestructive2 TA-54 RANT Facility 3Testing (RANT) FacilityTA-54-48 TRU Storage Dome 2TA-54-49 TRU Storage Dome 2TA-54-144 Shed 2TA-54-145 Shed 2TA-54-146 Shed 2TA-54-153 Dome 2TA-54-177 Shed 2TA-54-226 Temporary Retrieval Dome 2TA-54-229 Tension Support Dome 2TA-54-230 Tension Support Dome 2TA-54-231 Tension Support Dome 2TA-54-232 Tension Support Dome 2TA-54-283 Tension Support Dome 2TA-54-Pad2 Storage Pad 2 Recovery of buried TRU waste (TWISP) 2TA-54-Pad3 Storage Pad 2TA-54-Pad4 TRU Storage 2
SWEIS Yearbook—2002 2-13Table 2.0-10. <strong>LA</strong>NL <strong>Nuclear</strong> Facilities – SWEIS and 2002 (continued)SWEIS 2002KEY FACILITY BUILDING FACILITY HC FACILITY HC2.16 Non-Key Facilities TA-<strong>03</strong>-40 Physics Building 3TA-<strong>03</strong>-65 Source Storage 2TA-<strong>03</strong>-130 Calibration Building 3TA-33-86 Former Tritium Research 3TA-35-2 <strong>Nuclear</strong> Safeguards Research Facility 3
2-14SWEIS Yearbook—2002Table 2.0-11. Projected Construction and Modifications in the SWEIS RODFACILITY ROD PROJECTION 1998 1999 2000 2001 20022.1 Plutonium Renovation of the <strong>Nuclear</strong> Material StorageDesign effortsComplex Facility (NMSF)halted.2.2 TritiumFacilitiesConstruction of a new administrative officebuildingUpgrades within Building 55-4 to supportcontinued manufacturing at the existing capacityof 14 pits/yearFurther upgrades for long-term viability of thefacility and to boost production to a nominalcapacity of 20 pits/yearExtend the WETF tritium operations into TA-16-4502.3 CMR Building Phase I Upgrades to maintain safe operatingconditions for 5 to 10 yearsPhase II Upgrades (except seismic) to enableoperations for an additional 20 to 30 yearsUpgradescontinued.Significantremodeling ofTA-16-450 began.Five of the 11 PhaseI Upgradescompleted.FacilitiesImprovementTechnical Support(FITS) buildingconstructed.Upgradescontinued.Remodelingcontinued.Six of the 11 PhaseI Upgradescompleted beforere-baselining.Progress made on 3of the original 13.before re-baselining.Upgradescontinued.Remodelingcompleted.Upgradescontinued.CMRReplacementpreconceptualdesign.CMRReplacementdesign ongoing.Modifications for production of targets for themolybdenum-99 medical isotopeIncomplete;inactive project.Modifications for the recovery of sealed neutronsourcesIncomplete;inactive project.Modifications for safety testing of pits in theWing 9 hot cellsIncomplete;inactive project.2.4 Pajarito Site Replacement of the portable linac machine Has not beenreplaced.2.5 SigmaComplexReplacement of graphite collection systems Completed in 1998.Modification of the industrial drain pipe Completed in 1999.Replacement of electrical componentsEssentiallycompleted.Add-onassignmentscontinue.Add-onassignmentscontinue
SWEIS Yearbook—2002 2-15Table 2.0-11. Projected Construction and Modifications in the SWEIS ROD (continued)FACILITY ROD PROJECTION 1998 1999 2000 2001 2002Roof replacementWork done in 1998. Most of roofreplacement done.Additional workneeded.Additional workneeded.Additional workneeded.Seismic upgrades Not started. Not started. Not started. Not started. Not started.2.6 MSL Complete the top floor of the MSL Unscheduled andnot funded.Unscheduled andnot funded.Unscheduled andnot funded.Unscheduled andnot funded.Unscheduledand not funded.2.7 TFF None projected2.8 Machine Shops None projected2.9 HighExplosivesProcessingConstruction of the High Explosive WastewaterTreatment Facility (HEWTF)HEWTF, TA-16-508, became fullyoperational in 1997.2.10 HighExplosives TestingModification of 17 outfalls and their eliminationfrom the <strong>National</strong> Pollutant DischargeElimination System (NPDES) permitRelocation of the Weapons Component TestingFacilityTA-16 steam plant conversionDual-Axis Radiographic Hydrodynamic Test(DARHT) facility construction and modification2.11 <strong>LA</strong>NSCE Eliminate NPDES Outfall <strong>03</strong>A-145 from theOrange Box BuildingClosure of two former sanitary lagoonsLow-Energy Demonstration Accelerator (LEDA)to become operational in late 199819 outfallseliminated during1997 and 1998.Satellite steamboilers placed inservice in 1997 andcentral plantshutdown.Construction ofTA-15-312continued.Eliminated in 1998.Sampling conductedin 1998.Started high-powerconditioning.Completed before1999.Construction ofTA-15-312continued.Remediationstarted in 1999.Maximum powerachieved.Short-Pulse Spallation Source enhancements Upgrades started. Installation of newinstruments began.One-megawatt target/blanketConstruction ofTA-15-312completed.Characterizationcontinued; southlagoon sludge andliner removed.Operated.First phase ofProton StorageRing Upgradecompleted.Data analysis andsamplingcontinued.Shutdown inDecember untilfunded.Proton StorageRing completed;instrumentscommissioned.DARHTconstructioncompleted.Cleanup ofnorth lagoon asInterim Action.Inactive untilfunded.Upgrades to ionsource and 1Lline in progress.Not completedand not funded.
2-16SWEIS Yearbook—2002Table 2.0-11. Projected Construction and Modifications in the SWEIS ROD (continued)FACILITY ROD PROJECTION 1998 1999 2000 2001 2002New 100-MeV Isotope Production FacilityConstruction Constructionpreparation began. began.Facilitycompleted;upgrades to beamline in progress.ReadinessReview plannedfor July 20<strong>03</strong> andcommissioningfor October20<strong>03</strong>.Long-Pulse Spallation Source (LPSS), includingdecontamination and renovation of Area ANot completed andnot funded.Not completed andnot funded.Not completedand not funded.Not completedand not funded.Not completedand not funded.Dynamic Experiment Lab Not started. Not started. Concept revised.Los Alamos International Facility forTransmutationNot completed andnot funded.Not completed andnot funded.Not completedand not funded.Not completedand not funded.Not completedand not funded.Exotic Isotope Production FacilityNot completed andnot funded.Not completed andnot funded.Not completedand not funded.Not completedand not funded.Not completedand not funded.Decontamination and renovation of Area A-East Not completed. Not completed. Not completed. Not completed. Not completed.None projected2.12 BioscienceFacilities2.13None projectedRadiochemistryFacility2.14 RLWTF Replace influent underground storage tanks Tank farm upgradedby replacing two ofthree undergroundstorage tanks withfour abovegroundsteel tanks in 1997.Install an ultrafiltration/reverse osmosis (UF/RO)processInstall nitrate reduction equipmentProcess installed in1998.Equipment installedin 1998.Process becameoperational in1999.Equipment becameoperational.Equipmentremoved fromservice.
SWEIS Yearbook—2002 2-17Table 2.0-11. Projected Construction and Modifications in the SWEIS ROD (continued)FACILITY ROD PROJECTION 1998 1999 2000 2001 20022.15 SolidRadioactive andChemical WasteFacilityFour additional fabric domes for storage ofretrieved TRU wasteThree domesconstructed andusage of an existingdome changed.Dome 54-375completed.2.16 Non-KeyFacilitiesAtlasAtlas Facilitydesigned andconstruction beganin 1996.Constructioncontinued in 1999.Constructioncompleted andmajor capacitorbanks tested.Readiness foroperations in July2001 and firstexperiments inSeptember 2001;environmentalassessment forrelocation toNevada Test SiteAtlasphysicallymoved toNevada TestSite before endof December2002.
Table 2.0-12. Projected Construction and Modifications Completed 1998–20021998 OR EARLIER 1999 2000 2001 2002High ExplosivesProcessing: Constructionof HEWTF at TA-16-1508Plutonium Complex:Constructed FITSBuildingTritium Facilities:Remodel of TA-16-450 and connectionCMR: re-baselineupgrades (originallylisted as Phase 1 andHigh ExplosivesProcessing: Modificationof flows to 19 outfalls andelimination from NPDESpermitHigh ExplosivesProcessing: TA-16 Centralsteam plant replacement<strong>LA</strong>NSCE: Modification ofthree outfalls at TA-53 andelimination from NPDESpermitRLWTF: Installation offour above-grade tanks forinfluent liquid wasteSolid Radioactive andChemical Waste Facilities:Construction of fouradditional fabric domes atArea G for TRU wastestorageSigma: Replacement ofthe graphite collectionsystemsSigma: Modification ofthe industrial drainsystemSigma: Replacement ofelectrical componentsHigh ExplosivesProcessing: Relocation ofthe WeaponsComponents TestingFacility<strong>LA</strong>NSCE: making theLEDA operationalRLWTF: bringing thenew UF/RO process onlineRLWTF: bringing thenitrate reductionequipment on-lineto WETFNon-Key Facilities:Atlas facility in partsof five buildingsPhase 2 Upgrades)High ExplosivesTesting: DARHTcompleted<strong>LA</strong>NSCE: New100-MeV IsotopeProduction FacilityProjects Completed:6 8 2 0 4Total Completed for1998–2002: 202-18SWEIS Yearbook—2002
SWEIS Yearbook—2002 2-19Table 2.0-13. CapabilitiesFACILITY CAPABILITY 1998 1999 2000 2001 20022.1 Plutonium Plutonium Stabilization Active Active Active Active ActiveComplexManufacturing Plutonium Components Inactive Active below Active below SWEIS InactiveInactiveSWEIS ROD level ROD levelSurveillance and Disassembly of Weapons Components Active belowSWEIS ROD levelActive belowSWEIS ROD levelActive below SWEISROD levelActive below SWEISROD levelActive belowSWEIS ROD levelActinide Materials and Science Processing, Research,and DevelopmentActive belowSWEIS ROD levelActive belowSWEIS ROD levelActive below SWEISROD levelActive below SWEISROD levelActive belowSWEIS ROD levelFabrication of Ceramic-Based Reactor Fuels Active Active Inactive Inactive ActivePlutonium-238 Research, Development, andApplicationsActive belowSWEIS ROD levelActive belowSWEIS ROD levelActive below SWEISROD levelActive below SWEISROD levelActive belowSWEIS ROD level<strong>Nuclear</strong> Materials Storage, Shipping, and Receiving Active Active Active Active Active2.2 TritiumFacilitiesHigh-Pressure Gas Fills and Processing: WETF Active belowSWEIS ROD levelActive belowSWEIS ROD levelActive below SWEISROD levelActive below SWEISROD levelActive belowSWEIS ROD levelGas Boost System Testing and Development: WETF Active belowSWEIS ROD levelActive belowSWEIS ROD levelActive below SWEISROD levelActive below SWEISROD levelActive belowSWEIS ROD levelCryogenic Separation: TSTAActive below Active below Active below SWEIS Active below SWEIS LostSWEIS ROD level SWEIS ROD level ROD levelROD levelDiffusion and Membrane Purification: TSTA, TSFF, Active below Active below Inactive Inactive InactiveWETFSWEIS ROD level SWEIS ROD levelMetallurgical and Material Research: TSTA, TSFF,WETFActive belowSWEIS ROD levelActive belowSWEIS ROD levelActive below SWEISROD levelActive below SWEISROD levelActive belowSWEIS ROD levelThin Film Loading: TSFF (WETF by 2001)Active belowSWEIS ROD levelActive belowSWEIS ROD levelActive below SWEISROD levelActive below SWEISROD levelActive belowSWEIS ROD levelGas Analysis: TSTA, TSFF, WETF Active Active Active Active ActiveCalorimetry: TSTA, TSFF, WETF Active Active Active Active ActiveSolid Material and Container Storage: TSTA, TSFF, Active Active Active Active ActiveWETF2.3 CMRBuildingAnalytical ChemistryActive belowSWEIS ROD levelActive belowSWEIS ROD levelActive below SWEISROD levelActive below SWEISROD levelActive belowSWEIS ROD levelUranium Processing Inactive Active Active Active ActiveDestructive and Nondestructive AssayActive below Active below Inactive Inactive InactiveSWEIS ROD level SWEIS ROD levelNonproliferation Training Inactive Active Active and moved to Inactive at CMR ActivePajarito SiteActinide Research and ProcessingActive belowSWEIS ROD levelActive belowSWEIS ROD levelActive below SWEISROD levelActive below SWEISROD levelActive belowSWEIS ROD levelFabrication and MetallographyActive below Inactive Inactive Inactive InactiveSWEIS ROD level2.4 PajaritoSiteDosimeter Assessment and CalibrationActive belowSWEIS ROD levelActive belowSWEIS ROD levelActive below SWEISROD levelActive below SWEISROD levelActive belowSWEIS ROD levelDetector DevelopmentActive belowSWEIS ROD levelActive belowSWEIS ROD levelActive below SWEISROD levelActive below SWEISROD levelActive belowSWEIS ROD level
2-20SWEIS Yearbook—2002Table 2.0-13. Capabilities (continued)FACILITY CAPABILITY 1998 1999 2000 2001 2002Materials TestingActive belowSWEIS ROD levelActive belowSWEIS ROD levelActive below SWEISROD levelActive below SWEISROD levelActive belowSWEIS ROD levelSubcritical MeasurementsActive belowSWEIS ROD levelActive belowSWEIS ROD levelActive below SWEISROD levelActive below SWEISROD levelActive belowSWEIS ROD levelFast-Neutron SpectrumActive belowSWEIS ROD levelActive belowSWEIS ROD levelActive below SWEISROD levelActive below SWEISROD levelActive belowSWEIS ROD levelDynamic MeasurementsActive belowSWEIS ROD levelActive belowSWEIS ROD levelActive below SWEISROD levelActive below SWEISROD levelActive belowSWEIS ROD levelSkyshine MeasurementsActive belowSWEIS ROD levelActive belowSWEIS ROD levelActive below SWEISROD levelActive below SWEISROD levelActive belowSWEIS ROD levelVaporizationActive belowSWEIS ROD levelActive belowSWEIS ROD levelActive below SWEISROD levelActive below SWEISROD levelActive belowSWEIS ROD levelIrradiationActive belowSWEIS ROD levelActive belowSWEIS ROD levelActive below SWEISROD levelActive below SWEISROD levelActive belowSWEIS ROD level<strong>Nuclear</strong> Measurement SchoolInactive at PajaritoSiteInactive at PajaritoSiteInactive at PajaritoSiteActiveInactive at PajaritoSite2.5 Sigma Research and Development on Materials Fabrication, Active Active Active Active ActiveComplex Coating, Joining, and ProcessingCharacterization of MaterialsActive belowSWEIS ROD levelActive belowSWEIS ROD levelActive below SWEISROD levelFabrication of Metallic and Ceramic itemsActive belowSWEIS ROD level2.6 MSL Materials Processing Active belowSWEIS ROD levelMechanical Behavior in Extreme Environment Active belowSWEIS ROD levelAdvanced Materials DevelopmentActive belowSWEIS ROD levelMaterials CharacterizationActive belowSWEIS ROD level2.7 TFF Precision Machining and Target Fabrication Active belowSWEIS ROD levelPolymer SynthesisActive belowSWEIS ROD levelChemical and Physical Vapor DepositionActive belowSWEIS ROD levelCharacterization of MaterialsLocated at Sigma;not active at TFF2.8 Machine Fabrication of Specialty ComponentsActive belowShopsSWEIS ROD levelFabrication Utilizing Unique MaterialsActive belowSWEIS ROD levelActive at Sigma exceptfor “analyze up to 36tritium reservoirs/yr”Active at Sigmaexcept for “analyzeup to 36 tritiumreservoirs/yr”Active below Active below SWEIS Active below SWEIS Active belowSWEIS ROD level ROD levelROD levelSWEIS ROD levelActive Active Active ActiveActive Active Active ActiveActive Active Active ActiveActive Active Active ActiveActive belowSWEIS ROD levelActive belowSWEIS ROD levelActive belowSWEIS ROD levelLocated at Sigma;not active at TFFActive belowSWEIS ROD levelActive belowSWEIS ROD levelActive below SWEISROD levelActive below SWEISROD levelActive below SWEISROD levelLocated at Sigma; notactive at TFFActive below SWEISROD levelActive below SWEISROD levelActive below SWEISROD levelActive below SWEISROD levelActive below SWEISROD levelActive below SWEISROD levelActive below SWEISROD levelActive below SWEISROD levelActive belowSWEIS ROD levelActive belowSWEIS ROD levelActive belowSWEIS ROD levelActive belowSWEIS ROD levelActive belowSWEIS ROD levelActive belowSWEIS ROD level
SWEIS Yearbook—2002 2-21Table 2.0-13. Capabilities (continued)FACILITY CAPABILITY 1998 1999 2000 2001 2002Dimensional Inspection of Fabricated Components Active belowSWEIS ROD levelActive belowSWEIS ROD levelActive below SWEISROD levelActive below SWEISROD levelActive belowSWEIS ROD level2.9 HighExplosivesHigh Explosives Synthesis and ProductionActive belowSWEIS ROD levelActive belowSWEIS ROD levelActive below SWEISROD levelActive below SWEISROD levelActive belowSWEIS ROD levelProcessingHigh Explosives and Plastics Development andCharacterizationActive belowSWEIS ROD levelActive belowSWEIS ROD levelActive below SWEISROD levelActive below SWEISROD levelActive belowSWEIS ROD levelHigh Explosives and Plastics Fabrication Active Active Active Active ActiveTest Device AssemblyActive belowSWEIS ROD levelActive belowSWEIS ROD levelActive below SWEISROD levelActive below SWEISROD levelActive belowSWEIS ROD levelSafety and Mechanical Testing Active Active belowSWEIS ROD levelActive below SWEISROD levelActive below SWEISROD levelActive belowSWEIS ROD levelResearch, Development, and Fabrication of High-Power Active below Active below Active below SWEIS Active below SWEIS Active below2.10 HighExplosivesTestingDetonatorsHydrodynamic TestsSWEIS ROD levelActive belowSWEIS ROD levelSWEIS ROD levelActive belowSWEIS ROD levelROD levelActive below SWEISROD levelROD levelActive below SWEISROD levelSWEIS ROD levelActive belowSWEIS ROD levelDynamic ExperimentsActive belowSWEIS ROD levelActive belowSWEIS ROD levelActive below SWEISROD levelActive below SWEISROD levelActive belowSWEIS ROD levelExplosives Research and TestingActive belowSWEIS ROD levelActive belowSWEIS ROD levelActive below SWEISROD levelActive below SWEISROD levelActive belowSWEIS ROD levelMunitions ExperimentsActive belowSWEIS ROD levelActive belowSWEIS ROD levelActive below SWEISROD levelActive below SWEISROD levelActive belowSWEIS ROD levelHigh-Explosives Pulsed-Power ExperimentsActive belowSWEIS ROD levelActive belowSWEIS ROD levelActive below SWEISROD levelActive below SWEISROD levelActive belowSWEIS ROD levelCalibration, Development, and Maintenance Testing Active belowSWEIS ROD levelActive belowSWEIS ROD levelActive below SWEISROD levelActive below SWEISROD levelActive belowSWEIS ROD levelOther Explosives TestingActive belowSWEIS ROD levelActive belowSWEIS ROD levelActive below SWEISROD levelActive below SWEISROD levelActive belowSWEIS ROD level2.11 <strong>LA</strong>NSCE Accelerator Beam Delivery, Maintenance, andDevelopmentActive belowSWEIS ROD levelActive belowSWEIS ROD levelActive below SWEISROD levelActive below SWEISROD levelActive belowSWEIS ROD levelExperimental Area SupportActive belowSWEIS ROD levelActive belowSWEIS ROD levelActive below SWEISROD levelActive below SWEISROD levelActive belowSWEIS ROD levelNeutron Research and TechnologyActive belowSWEIS ROD levelActive belowSWEIS ROD levelActive below SWEISROD levelActive below SWEISROD levelActive belowSWEIS ROD levelAccelerator Transmutation of Wastes Inactive Inactive Inactive Inactive InactiveSubatomic Physics Research Active Active Active Active ActiveMedical Isotope ProductionActive below Inactive Inactive Inactive InactiveSWEIS ROD levelHigh-Power Microwaves and Advanced Accelerators Active Active Active Active Active
2-22SWEIS Yearbook—2002Table 2.0-13. Capabilities (continued)FACILITY CAPABILITY 1998 1999 2000 2001 20022.12 Biologically Inspired Materials and Chemistry Not in SWEIS ROD Active Active Active ActiveBioscienceFacilitiesComputational Biology Not in SWEIS ROD Active Active Active ActiveEnvironmental Biology (formerly Environmental Active Active Active Active ActiveEffects)Genomics (formerly Genomic Studies) Active Active Active Active ActiveMeasurement Science and Diagnostics (formerly Active Active Active Active ActiveCytometry)Molecular and Cell Biology (formerly Cell Biology and Active Active Active Active ActiveDNA Damage and Repair)Molecular Synthesis Not in SWEIS ROD Active Active Active ActiveStructural Biology (formerly Structural Cell Biology) Active Active Active Active ActiveIn-Vivo Monitoring Active Active belowSWEIS ROD levelActive below SWEISROD levelActive below SWEISROD levelActive belowSWEIS ROD level2.13 Radionuclide Transport Studies Active Active Active Active ActiveRadiochemistryFacilityEnvironmental Remediation SupportActive belowSWEIS ROD levelActive belowSWEIS ROD levelActive below SWEISROD levelActive below SWEISROD levelActive belowSWEIS ROD levelUltra-Low-Level Measurements Active Active Active Active Active<strong>Nuclear</strong>/Radiochemistry Active Active Active Active ActiveIsotope Production Active Active Active Active ActiveActinide/TRU Chemistry Active Active Active Active ActiveData AnalysisActive belowSWEIS ROD levelActive belowSWEIS ROD levelActive below SWEISROD levelActive below SWEISROD levelActive belowSWEIS ROD levelInorganic ChemistryActive belowSWEIS ROD levelActive belowSWEIS ROD levelActive below SWEISROD levelActive below SWEISROD levelActive belowSWEIS ROD levelStructural AnalysisActive belowSWEIS ROD levelActive belowSWEIS ROD levelActive below SWEISROD levelActive below SWEISROD levelActive belowSWEIS ROD levelSample Counting Active Active Active Active Active2.14 RLWTF Waste Characterization, Packaging, Labeling Active Active Active Active ActiveWaste Transport, Receipt, and Acceptance Active Active Active Active ActiveRadioactive Liquid Waste PretreatmentActive belowSWEIS ROD levelActive belowSWEIS ROD levelActive below SWEISROD levelActive below SWEISROD levelActive belowSWEIS ROD levelRadioactive Liquid Waste Treatment Active Active Active Active ActiveDecontamination OperationsActive belowSWEIS ROD levelActive belowSWEIS ROD levelActive below SWEISROD levelInactive at RLWTF;relocated to Solid WasteFacilitiesInactive at RLWTF;relocated to SolidWaste Facilities
SWEIS Yearbook—2002 2-23Table 2.0-13. Capabilities (continued)FACILITY CAPABILITY 1998 1999 2000 2001 20022.15 SolidRadioactiveWaste Characterization, Packaging, LabelingActive belowSWEIS ROD levelActive belowSWEIS ROD levelActive below SWEISROD levelActive below SWEISROD levelActive belowSWEIS ROD leveland ChemicalWasteFacilitiesCompactionActive belowSWEIS ROD levelActive belowSWEIS ROD levelActive below SWEISROD levelActive below SWEISROD levelActive belowSWEIS ROD levelSize Reduction Inactive Inactive Active below SWEISROD levelActive below SWEISROD levelActive belowSWEIS ROD levelWaste Transport, Receipt, and AcceptanceActive belowSWEIS ROD levelActive belowSWEIS ROD levelActive below SWEISROD levelActive below SWEISROD levelActive belowSWEIS ROD levelWaste StorageActive belowSWEIS ROD levelActive belowSWEIS ROD levelActive below SWEISROD levelActive below SWEISROD levelActive belowSWEIS ROD levelWaste RetrievalActive belowSWEIS ROD levelActive belowSWEIS ROD levelActive below SWEISROD levelActive below SWEISROD levelActive belowSWEIS ROD levelOther Waste Processing Inactive Inactive Inactive Inactive InactiveDisposalActive belowSWEIS ROD levelActive belowSWEIS ROD levelActive below SWEISROD levelActive below SWEISROD levelActive belowSWEIS ROD levelDecontamination OperationsInactive at SolidWaste; located atInactive at SolidWaste; located atInactive at SolidWaste; located atActive at Solid Waste Active at SolidWasteRLWTFRLWTFRLWTF2.16 Non-Key Theory, Modeling, and High-performance Computing Active Active Active Active ActiveFacilitiesExperimental Science and Engineering Active Active Active Active ActiveAdvanced and <strong>Nuclear</strong> Materials Research and Active Active Active Active ActiveDevelopment and ApplicationsWaste Management Active Active Active Active ActiveInfrastructure and Central Services Active Active Active Active ActiveMaintenance and Refurbishment Active Active Active Active ActiveManagement of Environmental, Ecological, and CulturalResourcesActive Active Active Active Active
2-24SWEIS Yearbook—2002Table 2.0-14. Summary of Inactive CapabilitiesabFACILITY 1998 1999 2000 2001 20022.1 Plutonium Complex Manufacturing PlutoniumComponentsManufacturing PlutoniumComponentsManufacturing PlutoniumComponentsFabrication of Ceramic-Based Reactor FuelsFabrication of Ceramic-Based Reactor Fuels2.2 Tritium Facilities Cryogenic Separation:TSTA aCryogenic Separation:TSTA a2.3 CMR Building Uranium ProcessingNonproliferation Training2.11 <strong>LA</strong>NSCE Accelerator Transmutationof Wastes2.12 BioscienceFacilities2.15 Solid Radioactiveand Chemical WasteFacilitiesBiologically InspiredMaterials and Chemistry(not in ROD) bComputational Biology(not in ROD) bMolecular Synthesis (not inROD) bSize ReductionFabrication andMetallographyAcceleratorTransmutation of WastesMedical IsotopeProductionSize ReductionDiffusion and MembranePurification: TSTA, TSFF,WETFDestructive andNondestructive AssayFabrication andMetallographyAccelerator Transmutationof WastesMedical IsotopeProductionDiffusion and MembranePurification: TSTA, TSFF,WETFDestructive andNondestructive AssayFabrication andMetallographyAccelerator Transmutationof WastesMedical IsotopeProductionDiffusion and MembranePurification: TSTA, TSFF,WETFDestructive andNondestructive AssayFabrication andMetallographyAccelerator Transmutationof WastesMedical Isotope ProductionOther Waste Processing Other Waste Processing Other Waste Processing Other Waste Processing Other Waste ProcessingCapability lost at TSTA in CY 2001 and not available elsewhere at <strong>LA</strong>NL.Capability not identified for Health Research Laboratory (now Bioscience Facilities) in the SWEIS ROD. Capability developed in CY 1999.
Table 2.0-15. Summary of Wastes GeneratedSWEIS ROD 1998 1999 2000 2001 2002Radioactive airborneemissions from pointsources• in Ci 21,700 8,690 1,900 3,100 15,400 6,150• Percent of 10-year ---
2-26SWEIS Yearbook—2002Table 2.0-16. Flow from Permitted Outfalls aMGYFACILITY OUTFALL SWEIS ROD 1998 1999 2000 2001 20022.1 Plutonium <strong>03</strong>A-181 14 8.5 8.54 6.4 0.4 2.8Complex2.2 Tritium 05S 0.0 Eliminated 1998 Eliminated 1998 Eliminated 1998 Eliminated 1998 Eliminated 1998Facilities02A-129 0.1 13.0 8.83 7.9 0.3902 10.8400<strong>03</strong>A-<strong>03</strong>6 0.0 Eliminated 1997 Eliminated 1997 Eliminated 1997 Eliminated 1997 Eliminated 1997<strong>03</strong>A-158 0.2 0.7 0.14 0.7 0.0<strong>03</strong>00 2.560004A-091 Eliminated 1997 Eliminated 1997 Eliminated 1997 Eliminated 1997 Eliminated 1997 Eliminated 19972.3 CMR Building <strong>03</strong>A-021 0.53 3.2 4.45 2.28 0.02090 0.762.4 Pajarito Site None2.5 Sigma Complex <strong>03</strong>A-022 4.4 12.7 5.77 3.9 0.05 2.0040<strong>03</strong>A-024 2.9 No discharge No discharge 0 0 02.6 MSL None2.7 TFF 04A-127 0 Eliminated 1997 Eliminated 1997 Eliminated 1997 Eliminated 1997 Eliminated 19972.8 Machine Shops None2.9 High Explosives 02A-007 7.4 Eliminated 1998 Eliminated 1998 Eliminated 1998 Eliminated 1998 Eliminated 1998Processing<strong>03</strong>A-130 0.04 0.1 0.022 0.001 0.002 0.002004A-070 0.0 Eliminated 1997 Eliminated 1997 Eliminated 1997 Eliminated 1997 Eliminated 199704A-083 0.0 Eliminated 1997 Eliminated 1997 Eliminated 1997 Eliminated 1997 Eliminated 199704A-092 0.0 Eliminated 1998 Eliminated 1998 Eliminated 1998 Eliminated 1998 Eliminated 199804A-115 0.0 Eliminated 1997 Eliminated 1997 Eliminated 1997 Eliminated 1997 Eliminated 199704A-157 0.0 Eliminated 1997 Eliminated 1997 Eliminated 1997 Eliminated 1997 Eliminated 199705A-053 0.0 Eliminated 1998 Eliminated 1998 Eliminated 1998 Eliminated 1998 Eliminated 199805A-054 3.6 6.3 Eliminated 1998 Eliminated 1998 Eliminated 1998 Eliminated 199805A-055 0.13 8.9 0.096 0.085 0.<strong>03</strong>4 0.027505A-056 0.0 Eliminated 1998 Eliminated 1998 Eliminated 1998 Eliminated 1998 Eliminated 199805A-066 0.74 Eliminated 1998 Eliminated 1998 Eliminated 1998 Eliminated 1998 Eliminated 199805A-067 0.33 Eliminated 1998 Eliminated 1998 Eliminated 1998 Eliminated 1998 Eliminated 199805A-068 0.06 Eliminated 1998 Eliminated 1998 Eliminated 1998 Eliminated 1998 Eliminated 199805A-069 0.01 Eliminated 1998 Eliminated 1998 Eliminated 1998 Eliminated 1998 Eliminated 199805A-071 0.04 Eliminated 1998 Eliminated 1998 Eliminated 1998 Eliminated 1998 Eliminated 199805A-072 0.0 Eliminated 1997 Eliminated 1997 Eliminated 1997 Eliminated 1997 Eliminated 199705A-096 0.01 Eliminated 1998 Eliminated 1998 Eliminated 1998 Eliminated 1998 Eliminated 199805A-097 0.01 1.8 No discharge No discharge No discharge 0.0006A-073 0.0 Eliminated 1998 Eliminated 1998 Eliminated 1998 Eliminated 1998 Eliminated 1998
SWEIS Yearbook—2002 2-27Table 2.0-16. Flow from Permitted Outfalls a (continued)MGYFACILITY OUTFALL SWEIS ROD 1998 1999 2000 2001 200206A-074 0.0 Eliminated 1997 Eliminated 1997 Eliminated 1997 Eliminated 1997 Eliminated 19972.10 HighExplosives Testing06A-075 0.0 Eliminated 1998 Eliminated 1998 Eliminated 1998 Eliminated 1998 Eliminated 1998<strong>03</strong>A-028 2.2 0.5 2.81 5 4 0.5027<strong>03</strong>A-185 0.73 1.2 11.42 11 5 0.877304A-101 0.0 Eliminated 1997 Eliminated 1997 Eliminated 1997 Eliminated 1997 Eliminated 199704A-139 None Eliminated 1997 Eliminated 1997 Eliminated 1997 Eliminated 1997 Eliminated 199704A-141 0.0 Eliminated 1997 Eliminated 1997 Eliminated 1997 Eliminated 1997 Eliminated 199704A-143 0.018 Eliminated 1998 Eliminated 1998 Eliminated 1998 Eliminated 1998 Eliminated 199804A-156 0.0 Eliminated 1997 Eliminated 1997 Eliminated 1997 Eliminated 1997 Eliminated 199706A-079 0.54 0.1 Eliminated 1998 Eliminated 1998 Eliminated 1998 Eliminated 199806A-080 0.<strong>03</strong> Eliminated 1998 Eliminated 1998 Eliminated 1998 Eliminated 1998 Eliminated 199806A-081 0.<strong>03</strong> Eliminated 1998 Eliminated 1998 Eliminated 1998 Eliminated 1998 Eliminated 199806A-082 0.0 Eliminated 1998 Eliminated 1998 Eliminated 1998 Eliminated 1998 Eliminated 199806A-099 0.0 Eliminated 1997 Eliminated 1997 Eliminated 1997 Eliminated 1997 Eliminated 199706A-100 0.04 0.1 Eliminated 1998 Eliminated 1998 Eliminated 1998 Eliminated 199806A-106 b 0.58 No discharge Eliminated 1999 Eliminated 1999 Eliminated 1999 Eliminated 199906A-123 0.0 Eliminated 1998 Eliminated 1998 Eliminated 1998 Eliminated 1998 Eliminated 19982.11 <strong>LA</strong>NSCE <strong>03</strong>A-047 7.1 13.5 3.4 3.5 0 0<strong>03</strong>A-048 23.4 19.1 19.7 15.6 13.05 23.25<strong>03</strong>A-049 11.3 20.1 10.8 9.6 5.9 0.14<strong>03</strong>A-113 39.8 0.7 3.3 1.8 1.5 0.65<strong>03</strong>A-125 0.18 Eliminated 1998 Eliminated 1998 Eliminated 1998 Eliminated 1998 Eliminated 1998<strong>03</strong>A-145 0.0 Eliminated 1998 Eliminated 1998 Eliminated 1998 Eliminated 1998 Eliminated 1998<strong>03</strong>A-146 Not listed in SWEIS Eliminated 1997 Eliminated 1997 Eliminated 1997 Eliminated 1997 Eliminated 19972.12 BioscienceFacilities2.13 RadiochemistryFacility<strong>03</strong>A-040 2.5 No discharge Eliminated 1999 Eliminated 1999 Eliminated 1999 Eliminated 1999<strong>03</strong>A-045 0.87 No discharge Eliminated 1999 Eliminated 1999 Eliminated 1999 Eliminated 199904A-016 None Eliminated 1997 Eliminated 1997 Eliminated 1997 Eliminated 1997 Eliminated 199704A-<strong>131</strong> None Eliminated 1998 Eliminated 1998 Eliminated 1998 Eliminated 1998 Eliminated 199804A-152 None Eliminated 1997 Eliminated 1997 Eliminated 1997 Eliminated 1997 Eliminated 199704A-153 3.2 Eliminated 1998 Eliminated 1998 Eliminated 1998 Eliminated 1998 Eliminated 19982.14 RLWTF 051 9.3 6.1 5.3 4.9 3.6 2.92.15 Solid Radioactiveand ChemicalWaste FacilitiesNone
2-28SWEIS Yearbook—2002Table 2.0-16. Flow from Permitted Outfalls a (continued)MGYFACILITY OUTFALL SWEIS ROD 1998 1999 2000 2001 2002001 114 Active Active 170 98.75 101.32002.16 Non-KeyFacilities013 No direct discharge;goes through 001No direct discharge;goes through 001No direct discharge;goes through 001No directdischarge; goesthrough 001No direct discharge;goes through 001No directdischarge; goesthrough 001<strong>03</strong>A-027 5.8 Active Active 8.7 0.13 6.6070<strong>03</strong>A-160 5.1 Active Active 14 0.13 22.9000<strong>03</strong>A-199 Added to permit on Not on permit Not on permit Not on permit No discharge No discharge2/1/01<strong>03</strong>A-042 5.30 No discharge Eliminated 1998 Eliminated 1998 Eliminated 1998 Eliminated 199804A-118 1.10 No discharge Active Eliminated 1999 Eliminated 1999 Eliminated 199904A-166 0.01 No discharge No observation Eliminated 1999 Eliminated 1999 Eliminated 1999<strong>03</strong>A-<strong>03</strong>8 5.80 Eliminated 1997 Eliminated 1997 Eliminated 1997 Eliminated 1997 Eliminated 199704A-171 0.00 No discharge No discharge Eliminated 1999 Eliminated 1999 Eliminated 199904A-172 0.00 No discharge No discharge Eliminated 1999 Eliminated 1999 Eliminated 199904A-173 0.00 No discharge Active Eliminated 1999 Eliminated 1999 Eliminated 199904A-174 0.00 No discharge Eliminated 1998 Eliminated 1998 Eliminated 1998 Eliminated 199804A-175 0.00 No discharge No observation Eliminated 1999 Eliminated 1999 Eliminated 199904A-176 0.66 Active Active Eliminated 1999 Eliminated 1999 Eliminated 199904A-177 0.06 No discharge No observation Eliminated 1999 Eliminated 1999 Eliminated 1999<strong>03</strong>A-<strong>03</strong>4 0.26 Eliminated 1997 Eliminated 1997 Eliminated 1997 Eliminated 1997 Eliminated 1997<strong>03</strong>A-<strong>03</strong>5 0.04 Eliminated 1997 Eliminated 1997 Eliminated 1997 Eliminated 1997 Eliminated 199704A-182 0.00 Active Eliminated 1998 Eliminated 1998 Eliminated 1998 Eliminated 199804A-186 0.18 Active Active Eliminated 1999 Eliminated 1999 Eliminated 199906A-132 5.80 No discharge Eliminated 1998 Eliminated 1998 Eliminated 1998 Eliminated 1998<strong>03</strong>A-025 0.18 Active Eliminated 1998 Eliminated 1998 Eliminated 1998 Eliminated 199804A-164 0.01 No discharge No observation Eliminated 1999 Eliminated 1999 Eliminated 199904A-161 1.00 Active Active Eliminated 1999 Eliminated 1999 Eliminated 1999<strong>03</strong>A-148 6.30 Eliminated 1997 Eliminated 1997 Eliminated 1997 Eliminated 1997 Eliminated 199704A-094 5.30 Eliminated 1997 Eliminated 1997 Eliminated 1997 Eliminated 1997 Eliminated 199704A-163 6.20 Active Active Eliminated 1999 Eliminated 1999 Eliminated 199904A-165 2.00 Active Active Eliminated 1999 Eliminated 1999 Eliminated 1999Total Outfalls:• With flow 18 13 18 18 19• Active 10 10 0 0 0• Active andeliminated frompermit0 7 0 0 0
SWEIS Yearbook—2002 2-29Table 2.0-16. Flow from Permitted Outfalls a (continued)MGYFACILITY OUTFALL SWEIS ROD 1998 1999 2000 2001 2002• No discharge,12 4 1 2 1but on permit• No dischargeand eliminatedfrom permit0 2 0 0 0• No directdischarge• With flow, butlater eliminatedfrom permit• Eliminated frompermit duringyear22 during 199730 during 19981 1 1 1 12 7 0 0 016 during 1999 0 during 2000 0 during 2001 0 during 2002• No observation 0 4 0 0 0• Added to permit0 during 1997 0 during 1999 0 during 2000 1 during 2001 0 during 2002during year0 during 1998Total Outfalls atend of year66 at end of 1998 36 at end of 1999 20 at end of 2000 21 at end of 2001 21 at end of 2002abEliminated means that the outfall was eliminated from the NPDES permit during the specified year. No discharge means that there was no flow from the outfall. A “0.0” means that therewas a very small flow from the outfall. Active means that the outfall was listed on the NPDES permit and did discharge at least once during the year. Active and eliminated from permitmeans that the outfall was listed on the NPDES permit at the beginning of the year, discharged at least once during the year, and was eliminated from the NPDES permit by the end ofthe year. No observation means that this outfall was part of a supply well and was not checked during the year because the well was being transferred to Los Alamos County.This outfall was listed in the SWEIS under the Non-Key Facilities.
This chapter also discusses Non-Key Facilities, which include all buildings and structures not part of a KeyFacility, or the balance of <strong>LA</strong>NL. Although operations at Non-Key Facilities do not contribute significantlyto radiation doses or generation of radioactive wastes, the Non-Key Facilities represent a significant fractionof <strong>LA</strong>NL. The Non-Key Facilities comprise all or the majority of 30 of <strong>LA</strong>NL’s 49 technical areas, andapproximately 14,224 of <strong>LA</strong>NL’s estimated 26,480 acres. The Non-Key Facilities also employ about half the<strong>LA</strong>NL workforce. The Non-Key Facilities include such important buildings and operations as the CentralComputing Facility, the TA-46 sewage treatment facility, and the Main <strong>Administration</strong> Building. Table 2.0-17identifies and compares the acreage of the 15 Key Facilities and the Non-Key Facilities. Figure 2-1 shows thelocation of <strong>LA</strong>NL within northern New Mexico, while Figure 2-2 illustrates the technical areas. Figure 2-3shows the locations of the Key Facilities.With the issuance of <strong>Nuclear</strong> Safety Management (10 CFR 830) on January 10, 2001, on-site transportationalso needs to be addressed relative to nuclear hazard categorization (FR 2001). This is a change from theSWEIS. At the time the SWEIS was published, on-site transportation was considered part of the affectedenvironment in Section 4.10.3.1. The on-site transportation of nuclear materials greater than or equal toHazard Category 3 quantities is addressed in a DOE approved safety analysis (<strong>LA</strong>NL 2002c, DOE 2002a,Steele 2002). The implementation of the analysis and associated controls is under development.Table 2.0-17. Acreage for Key and Non-Key FacilitiesFACILITY TECHNICAL AREAS ~SIZE (ACRES)Plutonium Complex TA-55 93Tritium Facilities TA-16 & TA-21 312CMR Building TA-<strong>03</strong> 14Pajarito Site TA-18 <strong>131</strong>Sigma Complex TA-<strong>03</strong> 11MSL TA-<strong>03</strong> 2TFF TA-35 3Machine Shops TA-<strong>03</strong> 8High Explosives Processing TAs 08, 09, 11, 16, 22, 28, 37 1,115High Explosives Testing TAs 15, 36, 39, 40 8,691<strong>LA</strong>NSCE TA-53 751Bioscience Facilities (Formerly Health Research Laboratory) TA-43, <strong>03</strong>, 16, 35, 46 4Radiochemistry Facility TA-48 116RLWTF TA-50 62Solid Radioactive and Chemical Waste Facilities TA-50 & TA-54 943Subtotal, Key Facilities 12,256Non-Key Facilities 30 of 49 TAs 14,244<strong>LA</strong>NL 26,4802-30SWEIS Yearbook—2002
Los Alamos <strong>National</strong> LaboratoryTechnical Area boundariesSANDOVAL COUNTYLOS A<strong>LA</strong>MOS COUNTY0 0.5 1 2 mi0 0.5 1 2 kmS AN T AF EN A TI O NA LF O RLOS A<strong>LA</strong>MOSLOS A<strong>LA</strong>MOSCOUNTYE S TSANTA FE COUNTYRIO ARRIBA COUNTYSANTA FE COUNTYSANTA FENATIONALFORESTSAN ILDEFONSOPUEBLO<strong>LA</strong>NDSCounty boundariesOther political boundariesMajor paved roadsNToEspañola30502501Pajarito RoadEast Jemez Road502 5024BANDELIERNAT. MON.ToSanta FeSANDO-VAL CO.SAN ILDEFONSOPUEBLO<strong>LA</strong>NDS4LOS A<strong>LA</strong>MOS COUNTY44WHITEROCKAZUTCONMBANDELIERNATIONAL MONUMENTU. S. A.OKTXSANDOVAL COUNTYTaosLos AlamosGrants Santa FeAlbuquerqueNEW MEXICOSocorroTierra AmarillaRio GrandeRIO ARRIBA COUNTYLos AlamosSANDOVALCOUNTYBernalilloAlbuquerquecARTography by A. Kron 3/28/<strong>03</strong>LOSA<strong>LA</strong>MOSCOUNTYSanta FeSANTAFECOUNTYTAOSCOUNTYTaosLas CrucesBERNALILLOCOUNTYFigure 2-1. Location of <strong>LA</strong>NL.SWEIS Yearbook—2002 2-31
SANTA FENATIONALSANTA FENATIONAL FORESTFORESTLos AlamosWESTJEMEZ69895011628ROAD6258224341 23 616059486 64 553550 52634066 4614 67151137737321535511836735027472544PAJARITO ROADEAST JE MEZ RDSAN ILDEFONSOPUEBLO <strong>LA</strong>NDS502BANDELIERNATIONAL MON.SAN ILDEFONSO PUEBLO<strong>LA</strong>NDSBANDELIER449 684WhiteRockNATIONAL39710 2500 5000 7500 10000MONUMENT70FEETcARTography by A. Kron 3/27/<strong>03</strong>33<strong>LA</strong>NL boundaryTechnical Area boundaryMajor paved roadSecondary paved roadNRio GrandeSANTA FENATIONAL FORESTFigure 2-2. Location of technical areas.2-32SWEIS Yearbook—2002
SANTA FENATIONALSANTA FENATIONAL FORESTFORESTTA-21 TritiumLos AlamosOperationsTA-43 HRL(TSTA, TSFF)4373TA-3 CMR62 TA-3 MSL 41 2 21TA-3 Machine Shops 3 6173TA-55 Plutonium Facility58TA-3 Sigma 69Complex60535948TA-48 Radiochemistry FacilityTA-35 Target Fabrication64655 35TA-8 HE* 2252 TA-50 Waste Management950406358TA-40 ET*501TA-9 HE* 1466 4667TA-14 ET*51TA-16TritiumOperations(WETF)TA-16 HE*1628TA-28 HE*11TA-11 HE*BANDELIER37TA-37 HE*415TA-15 ET*TA-18Pajarito Site1836TA-36 ET*49 6854PAJARITO ROAD74502TA-53 <strong>LA</strong>NSCEEAST JE MEZ RDSAN ILDEFONSOPUEBLO <strong>LA</strong>NDSSAN ILDEFONSO PUEBLOTA-54 WasteManagement<strong>LA</strong>NDS472BANDELIERNATIONAL MON.4WhiteRock502NATIONAL39TA-39 ET*710 2500 5000 7500 10000FEETcARTography by A. Kron 3/31/<strong>03</strong>MONUMENT70<strong>LA</strong>NL boundaryTechnical Area boundaryMajor paved roadSecondary paved roadKey facilities:HE* = High explosivesprocessingET* = Explosive testingN33Rio GrandeSANTA FENATIONAL FORESTFigure 2-3. Location of Key Facilities.SWEIS Yearbook—2002 2-33
2.1 Plutonium Complex (TA-55)The Plutonium Complex Key Facility consists of six primary buildings and a number of lesser buildingsand structures. As presented in the SWEIS, this Key Facility contained one operational Category 2 nuclearhazard facility (TA-55-4), two Low Hazard chemical facilities (TA-55-3 and TA-55-5), and one Low Hazardenergy source facility (TA-55-7).The DOE listing of <strong>LA</strong>NL nuclear facilities for both 1998 and 2002 (DOE 1998a, <strong>LA</strong>NL 2002a) retainedBuilding TA-55-4 as a Category 2 nuclear hazard facility as shown in Table 2.1-1.Table 2.1-1. Plutonium Complex Buildings with <strong>Nuclear</strong> Hazard ClassificationabcdeBUILDING DESCRIPTIONSWEISRODDOE1998 a DOE2000 b <strong>LA</strong>NL2001 c <strong>LA</strong>NL2001 d <strong>LA</strong>NL2002 eTA-55-0004 PU-238 Processing 2 2 2 2 2 2TA-55-0041 <strong>Nuclear</strong> Material Storage 2DOE/<strong>LA</strong>NL list of Los Alamos <strong>National</strong> Laboratory <strong>Nuclear</strong> Facilities (DOE 1998a)DOE/<strong>LA</strong>NL list of Los Alamos <strong>National</strong> Laboratory <strong>Nuclear</strong> Facilities (DOE 2000a)DOE/<strong>LA</strong>NL list of Los Alamos <strong>National</strong> Laboratory <strong>Nuclear</strong> Facilities (<strong>LA</strong>NL 2001a)DOE/<strong>LA</strong>NL list of Los Alamos <strong>National</strong> Laboratory <strong>Nuclear</strong> Facilities (<strong>LA</strong>NL 2001b)DOE/<strong>LA</strong>NL list of Los Alamos <strong>National</strong> Laboratory <strong>Nuclear</strong> Facilities (<strong>LA</strong>NL 2002a)The SWEIS also identified one potential Category 2 nuclear hazard facility (TA-55-41, the <strong>Nuclear</strong>Material Storage Facility [NMSF]), which was slated for potential modification to bring it into operationalstatus. This was not done, and the DOE removed this facility from its list of nuclear facilities in its April 2000listing (DOE 2000a). There are currently no plans to use this building for storage of nuclear materials.2.1.1 Construction and Modifications at the Plutonium ComplexProjected: The SWEIS projected four facility modifications:• renovation of the NMSF;• construction of a newadministrative office building;• upgrades within Building55-4 to support continuedmanufacturing at the existingcapacity of 14 pits per year;and• further upgrades for long-termviability of the facility and toboost production to a nominalcapacity of 20 pits per year.Actual: During the period 1996–2002,the new administrative office building Aerial view of the Plutonium Complex (TA-55)was completed and upgrades to maintainexisting capacity were undertaken.In 1999, design efforts for renovation of the NMSF were halted and there are no current plans to continuethe renovations. The upgrades included the 1996 installation of a new TA-55 Facility Control System withcomputers and controls located in the Operations Center and the continuing replacement of the main fireprotection water line and pump houses. Explorations for placing parts of CMR and TA-18 at TA-55 beganin 2001 and are continuing. Table 2.1.1-1 shows a more detailed comparison of the projected and actualconstruction and modifications at the Plutonium Complex.2-34SWEIS Yearbook—2002
SWEIS Yearbook—2002 2-35Table 2.1.1-1. Plutonium Complex Construction and ModificationsACTUAL CONSTRUCTION AND MODIFICATIONSWEIS RODPROJECTION 1998 YEARBOOK 1999 YEARBOOK 2000 YEARBOOK 2001 YEARBOOK 2002 YEARBOOKRenovation of the NMSFConstruction of a newadministrative officebuildingUpgrades within Building55-4 to support continuedmanufacturing at theexisting capacity of 14 pitsper yearDesign commenced on anew office building.Upgrades to maintainexisting capacity werecontinued—1996installation of a new TA-55 Facility ControlSystem.Design efforts forrenovation of NMSF werehalted.A new office building, theFITS building wasconstructed(<strong>LA</strong>NL 1998a).Upgrades to maintainexisting capacity werecontinued.aUpgrades to maintainexisting capacity werecontinued.Design of main fireprotection water line andpump houses replacement.<strong>Nuclear</strong> MaterialsTechnology FY 2001Office Building,Manufacturing TechnicalSupport Facility (<strong>LA</strong>NL2001d, DOE 1996a).Upgrades to maintainexisting capacity werecontinued.<strong>Nuclear</strong> MaterialsTechnology ProtectCombustible Materials(<strong>LA</strong>NL 2001e, DOE1996b).TA-55 Fire Protect YardMain Replacement (<strong>LA</strong>NL2001f, DOE 1996c).FRIT Transfer System(<strong>LA</strong>NL 2001g, DOE1996d).<strong>Nuclear</strong> MaterialsTechnology Fire SafeStorage Building (<strong>LA</strong>NL2001h, DOE 1996e).FITS Parking Lot (notphysically started in 2002;<strong>LA</strong>NL 2002d).Construction began in2002Continuing in 2002.Completed in 2002 exceptfor repaving scheduled forsummer 20<strong>03</strong>.On-going in 2002.Construction not started.TA-55 Radiography/Interim (<strong>LA</strong>NL 2001i).
2-36SWEIS Yearbook—2002Table 2.1.1-1. Plutonium Complex Construction and Modifications (continued)SWEIS RODACTUAL CONSTRUCTION AND MODIFICATIONPROJECTION 1998 YEARBOOK 1999 YEARBOOK 2000 YEARBOOK 2001 YEARBOOK 2002 YEARBOOKTA-55 Radiography(complements interim;<strong>LA</strong>NL 2001j, <strong>LA</strong>NL2002e).Temporary Parking (Falseperimeter intrusiondetection and assessmentsystem; not completed inFurther upgrades for longtermviability of thefacility and to boostproduction to a nominalcapacity of 20 pits peryearCMR Replacement ProjectPreconceptual Design(<strong>LA</strong>NL 2001k).TA-18 Relocation ProjectOffice Building (<strong>LA</strong>NL2001l, DOE 2001a).TA-18 Relocation ProjectCAT III/IV at TA-55(<strong>LA</strong>NL 2001m, DOE2001a).TA-18 Relocation ProjectCAT-I Piece (<strong>LA</strong>NL2001n, DOE 2001a).2002; <strong>LA</strong>NL 2002f ).Ongoing in 2002draft environmentalimpact statement reviewin 20<strong>03</strong>.Temporary buildingbetween TA-55 and TA-48 on north side ofPajarito Road.Under consideration atend of 2002.No longer planned forTA-55 at end of 2002.CMR ReplacementGeotechnicalInvestigation (<strong>LA</strong>NL2002g).
2.1.2 Operations at the Plutonium ComplexThe SWEIS identified seven capabilities 4 for this Key Facility. No new capabilities have been added;however, one capability, Special <strong>Nuclear</strong> Materials (SNM) Storage, Shipping, and Receiving, had planned onusing the NMSF. Because of changes in plans, the NMSF will not be used for this activity, and SNM storage,shipping, and receiving will continue to be performed at the Plutonium Facility (Building 55-4). For all sevencapabilities, activity levels were below those projected by the SWEIS ROD. Table 2.1.2-1 presents details.2.1.3 Operations Data for the Plutonium ComplexDetails of operational data are presented in Table 2.1.3-1. From 1998 through 2002, radioactive airemissions were much less than the SWEIS ROD projections (less than 61 curies in 2002 and less than 5curies in 2001 compared to 1,000 curies projected). The only wastes to exceed the SWEIS ROD projectionshave been the chemical wastes in 1998, 2001, and 2002 due to unique events. During 1998, a <strong>LA</strong>NL-widecampaign to identify and dispose of chemicals no longer needed or used resulted in 10,861 kilograms ofchemical waste at TA-55 rather than the 8,400 kilograms projected. This campaign was called the LegacyWaste Cleanup Project. It was completed in September 1998 and required facilities to locate and inventoryall materials. More than 22,000 items Lab-wide were characterized, collected, and managed. Many itemswere sent to commercial facilities for treatment and disposal. In 2000, cleanup from the Cerro Grande Firegenerated 763 kilograms of construction and demolition debris (previously identified in the Yearbooks asindustrial waste) sent to local landfills for disposal. In 2001, the 11,709 kilograms of chemical waste included10,433 kilograms of solid waste material from the replacement of the hydraulic cylinders at the front gate.This waste consisted of dirt, rocks, concrete chips, and asphalt chips. During 2002, a large transformeradjacent to the Facilities Improvement Technical Support (FITS) building needed to be relocated for theconstruction of the Manufacturing Technical Support Facility. While the transformer was being moved, it wasdropped and non-polychlorinated biphenyl oil spilled from the transformer creating chemical waste (NewMexico Special Waste) that had to be cleaned up.Radiological Control Technician counts waste container4 As defined in the SWEIS, a capability refers to the combination of buildings, equipment, infrastructure, and expertise necessary to undertake typesor groups of activities and to implement mission assignments. Capabilities at <strong>LA</strong>NL have been established over time, principally through missionassignments and activities directed by DOE Program Offices.SWEIS Yearbook—2002 2-37
2-38SWEIS Yearbook—2002Table 2.1.2-1. Plutonium Complex/Comparison of OperationsCAPABILITIES SWEIS ROD a 1998 OPERATIONS 1999 OPERATIONS 2000 OPERATIONS 2001 OPERATIONS 2002 OPERATIONSPlutoniumStabilizationManufacturingPlutoniumComponentsSurveillance andDisassembly ofWeaponsComponentsActinide Materialsand ScienceProcessing,Research, andDevelopmentRecover, process, andstore the existingplutonium inventory ineight years.Produce nominally 20war reserve pits peryear. (Requires minorfacility modifications.)Pit disassembly: Up to65 pits per yeardisassembled. Pitsurveillance: Up to 40pits per year destructivelyexamined and 20pits per year nondestructivelyexamined.Develop productiondisassembly capacity.Process up to 200 pitsper year, including atotal of 250 pits (overfour years) as part ofdisposition demonstrationactivities.On schedule with focuson highest priorityinventory items.There were no warreserve pits produced oraccepted by DOE fortransfer to the nuclearstockpile.Consistent with the NoAction Alternative, nomore than 20 pits weredisassembled and nomore than 20 pits wereexamined during 1998.Fewer than 200 pitswere disassembled orconverted in 1998.Highest priority itemshave been stabilized.The implementationplan is being modifiedbetween DOE and theDefense <strong>Nuclear</strong>Facilities Safety Boardwith a longercompletion schedule.There were no warreserve pits producedor accepted by DOEfor transfer to thenuclear stockpile. Fourdevelopment pits werefabricated inpreparation foreventual war reservefabrication.Less than 65 pits weredisassembled during1999.Less than 40 pits weredestructively examinedas part of the stockpileevaluation program (pitsurveillance) in 1999.Fewer than 200 pitswere disassembled orconverted in 1999.Highest priority itemshave been stabilized.The implementationplan is being modifiedbetween DOE and theDefense <strong>Nuclear</strong>Facilities Safety Boardwith a longercompletion schedule.There were no warreserve pits producedor accepted by DOEfor transfer to thenuclear stockpile. Twodevelopment pits werefabricated inpreparation foreventual war reservefabrication.Less than 65 pits weredisassembled during2000.Less than 40 pits weredestructively examinedas part of the stockpileevaluation program (pitsurveillance) in 2000.Fewer than 200 pitswere disassembled orconverted in 2000.Highest priority itemshave been stabilized.The implementationplan is being modifiedbetween DOE and theDefense <strong>Nuclear</strong>Facilities Safety Boardto be completed by2010.There were no warreserve pits produced oraccepted by DOE fortransfer to the nuclearstockpile.Less than 65 pits weredisassembled during2001.Less than 40 pits weredestructively examinedas part of the stockpileevaluation program (pitsurveillance) in 2001.Fewer than 200 pitswere disassembled orconverted in 2001.Highest priority itemshave been stabilized.The implementationplan has been modifiedbetween DOE and theDefense <strong>Nuclear</strong>Facilities Safety Boardto be completed by2010.There were no warreserve pits producedor accepted by DOE fortransfer to the nuclearstockpile.Less than 65 pits weredisassembled during2002.Less than 40 pits weredestructively examinedas part of the stockpileevaluation program (pitsurveillance) in 2002.Fewer than 200 pitswere disassembled orconverted in 2002.
SWEIS Yearbook—2002 2-39Table 2.1.2-1. Plutonium Complex/Comparison of Operations (continued)CAPABILITIES SWEIS ROD a 1998 OPERATIONS 1999 OPERATIONS 2000 OPERATIONS 2001 OPERATIONS 2002 OPERATIONSActinide Materialsand ScienceProcessing,Research, andDevelopment (cont.)Process neutronsources up to 5,000Ci/yr. Process neutronsources other thansealed sources.Process up to 400 kg/yrof actinides. bProvide support fordynamic experiments.Performdecontamination of 28to 48 uraniumcomponents per month.Processed sourcescontaining ~120 Ci in1998.Processed ~140 kg ofactinide material in1998. Supporteddynamic experiments.Processed 10 pitsthrough tritiumseparation at TA-55.Decontaminated/converted 24 uraniumcomponents in 1998.Neutron sources arenot currently beingdisassembled andchemically processed.Less than 400 kg/yr ofactinides wereprocessed.Support was providedfor dynamicexperiments.In 1999, less than 48uranium componentswere decontaminated.Neutron sources arenot currently beingdisassembled andchemically processed.Less than 400 kg/yr ofactinides wereprocessed.Support was providedfor dynamicexperiments. Less than12 pits per year wereprocessed throughtritium separation in2000.In 2000, less than 48uranium componentswere decontaminated.Neutron sources are notcurrently beingdisassembled andchemically processed.Less than 400 kg/yr ofactinides wereprocessed.Support was providedfor dynamicexperiments.In 2001, less than 48uranium componentswere decontaminated.Neutron sources are notcurrently beingdisassembled andchemically processed.Off-site sources arebeing recovered fromgovernment, industrial,and academic activities,repackaged, and sent toTA-54 for final disposition.No new sourcesare being processed.Less than 400 kg/yr ofactinides wereprocessed.Support was providedfor dynamicexperiments.In 2002, less than 48uranium componentswere decontaminatedper month.
2-40SWEIS Yearbook—2002Table 2.1.2-1. Plutonium Complex/Comparison of Operations (continued)CAPABILITIES SWEIS ROD a 1998 OPERATIONS 1999 OPERATIONS 2000 OPERATIONS 2001 OPERATIONS 2002 OPERATIONSActinide Materialsand ScienceProcessing,Research, andDevelopment (cont.)Research in support ofDOE actinide cleanupactivities. Stabilizeminor quantities ofspecialty items.Research anddevelopment onactinide processing andwaste activities at DOEsites, includingprocessing up to 140 kgof plutonium aschloride salts from theRocky FlatsEnvironmentalTechnology Site.Conduct plutoniumresearch anddevelopment andsupport. Prepare,measure, andcharacterize samplesfor fundamentalresearch anddevelopment in areassuch as aging, weldingand bonding, coatings,and fire resistance.Fabricate and studynuclear fuels used interrestrial and spacereactors. Fabricate andstudy prototype fuel forlead test assemblies.Research supportingDOE actinide cleanupactivities continued atlow level. Smallquantities of plutoniumresidues from RockyFlats were processed.Sample preparation andcharacterizationcontinued.Minimal terrestrial andspace reactor fueldevelopment occurredin 1998.Research supportingDOE actinide cleanupactivities continued atlow levels. Noplutonium residuesfrom Rocky Flats wereprocessed.Sample preparationand characterizationcontinued.Minimal terrestrial andspace reactor fueldevelopment occurredin 1999.Research supportingDOE actinide cleanupactivities continued atlow levels. Noplutonium residuesfrom Rocky Flats wereprocessed.Sample preparationand characterizationcontinued.Minimal terrestrial andspace reactor fueldevelopment occurredin 2000.Research supportingDOE actinide cleanupactivities continued atlow levels. Noplutonium residuesfrom Rocky Flats wereprocessed.Sample preparation andcharacterizationcontinued.Minimal terrestrial andspace reactor fueldevelopment occurredin 2001.Research supportingDOE actinide cleanupactivities continued atlow levels. Noplutonium residuesfrom Rocky Flats wereprocessed.Sample preparation andcharacterizationcontinued.The DOE/Office of<strong>Nuclear</strong> EnergyAdvanced Fuel CycleInitiative (AFCI) isfabricating actinidenitride fuels forirradiation in a reactorenvironment. Lead testassemblies are beingconsidered for thefuture.
SWEIS Yearbook—2002 2-41Table 2.1.2-1. Plutonium Complex/Comparison of Operations (continued)CAPABILITIES SWEIS ROD a 1998 OPERATIONS 1999 OPERATIONS 2000 OPERATIONS 2001 OPERATIONS 2002 OPERATIONSActinide Materialsand ScienceProcessing,Research, andDevelopment (cont.)Fabrication ofCeramic-BasedReactor FuelsPlutonium-238Research,Development, andApplications<strong>Nuclear</strong> MaterialsStorage, Shipping,and ReceivingDevelop safeguardsinstrumentation forplutonium assay.Analyze samples insupport of actinidereprocessing andresearch anddevelopment activities.Build mixed oxide testreactor fuel assembliesand continue researchand development onfuels.Process, evaluate, andtest up to 25 kg/yrplutonium-238.Recycle residues andblend up to 18 kg/yrplutonium-238.Store up to 6,600 kgSNM in the NMSF;continue to storeworking inventory inthe vault in Building55-4; ship and receiveSNM as needed tosupport <strong>LA</strong>NLactivities.Continued support ofsafeguardsinstrumentationdevelopment.Analysis of actinidesamples at TA-55continued in support ofactinide reprocessingand research anddevelopment activities.Manufactured ~11 kg ofmixed oxide fuel in1998.Recovered ~0.5 kg andprocessed ~1.5 kg ofplutonium-238 in 1998.NMSF not operationalas a storage vault.Building 55-4 vaultlevels remainedapproximately constantwith 1996 levels.Continued support ofsafeguardsinstrumentationdevelopment.Analysis of actinidesamples at TA-55continued in support ofactinide reprocessingand research anddevelopment activities.Manufactured ~10 kgof mixed oxide fuel in1999.Recovered ~0.5 kg ofplutonium-238 andprocessed ~1.0 kg ofplutonium-238 for heatsource fuel in 1999.NMSF is notoperational as a storagevault and there are nocurrent plans tocomplete themodifications requiredto use the facility as astorage vault. Building55-4 vault levelsremainedapproximately constantwith 1996 levels.Continued support ofsafeguardsinstrumentationdevelopment.Analysis of actinidesamples at TA-55continued in support ofactinide reprocessingand research anddevelopment activities.No mixed oxide fuelwas manufactured in2000.Recovered ~0.65 kg ofplutonium-238 andprocessed ~0.75 kg ofplutonium-238 for heatsource fuel in 2000.Because of changes inplans, the NMSF willnot be used for thisactivity, and SNMstorage, shipping, andreceiving will continueto be performed at thePlutonium Facility(Building 55-4).Building 55-4 vaultlevels remainedconstant at levelsidentified duringpreparation of theSWEIS.Continued support ofsafeguardsinstrumentationdevelopment.Analysis of actinidesamples at TA-55continued in support ofactinide reprocessingand research anddevelopment activities.No mixed oxide fuelwas manufactured in2001.Recovered ~1.1 kg ofplutonium-238 andprocessed ~0.70 kg ofplutonium-238 for heatsource fuel in 2001.Because of changes inplans, the NMSF willnot be used for thisactivity, and SNMstorage, shipping, andreceiving will continueto be performed at thePlutonium Facility(Building 55-4).Building 55-4 vaultlevels remainedapproximately constantat levels identifiedduring preparation ofthe SWEIS.Continued support ofsafeguardsinstrumentationdevelopment.Analysis of actinidesamples at TA-55continued in support ofactinide reprocessingand research anddevelopment activities.AFCI mixed oxidefuels are beingfabricated forirradiation testing.Recovered ~1.5 kg ofplutonium-238 andprocessed ~2.2 kg ofplutonium-238 for heatsource fuel.Because of changes inplans, the NMSF willnot be used for thisactivity, and SNMstorage, shipping, andreceiving will continueto be performed at thePlutonium Facility(Building 55-4).Building 55-4 vaultlevels remainedapproximately constantat levels identifiedduring preparation ofthe SWEIS.
2-42Table 2.1.2-1. Plutonium Complex/Comparison of Operations (continued)abCAPABILITIES SWEIS ROD a 1998 OPERATIONS 1999 OPERATIONS 2000 OPERATIONS 2001 OPERATIONS 2002 OPERATIONSConduct nondestructiveassay onSNM at the NMSF toidentify and verify thecontent of storedcontainers.NMSF not operationalas a storage vault andwas not used fornondestructive assay.NMSF not operationalas a storage vault andwas not used for nondestructiveassay.The NMSF is notoperational as a storagevault and was not usedfor non- destructiveassay.The NMSF is notoperational as a storagevault and was not usedfor non-destructiveassay.The NMSF is notoperational as a storagevault and was not usedfor non-destructiveassay.Includes renovation of the NMSF (which is no longer planned for use), construction of new technical support office building, and upgrades to enable the production ofnominally 20 war reserve pits per year.The actinide activities at the CMR Building and at TA-55 are expected to total 400 kilograms per year. The future split between these two facilities was not known, sothe facility-specific impacts at each facility were conservatively analyzed at this maximum amount. Waste projections that are not specific to the facility (but arerelated directly to the activities themselves) are only projected for the total of 400 kilograms per year.SWEIS Yearbook—2002
Table 2.1.3-1. Plutonium Complex/Operations DataPARAMETER UNITS aSWEISROD1998 1999OPERATIONS OPERATIONS2000OPERATIONS2001OPERATIONS2002OPERATIONSRadioactive AirEmissions:Plutonium-239 b Ci/yr 2.70E-05 6.20E-08 1.2E-07 2.4E-06 3.2E-08 8.1E-08Plutonium-238 Ci/yr Not Not detected Not detected 1.1E-07 1.0E-08 1.4E-08projected cAmericium-241 Ci/yr Not Not detected 5.4E-08 3.3E-07 6.2E-09 1.6E-08projected cOther actinides d Ci/yr Not Not detected Not detected Not detected 3.2E-07 1.2E-07projected cTritium in Ci/yr 7.50E+2 4.80E-01 3.1E-01 3.1E-01 7.4E-01 1.6E+0Water VaporTritium as a Gas Ci/yr 2.50E+2 1.40E+0 1.45E+0 6.1E+0 2.5E+0 5.9E+01Uranium-234 Ci/yr Not Not detected 2.0E-08 Not detected Not detected 6.8E-08projected cUranium-238 Ci/yr Not Not detected 5.1E-08 Not detected Not detected 1.6E-07projected cNPDESDischarge eNumber of --- 1 1 1 1 1 1outfallsTotal Discharge MGY 14 8.5 8.54 6.4 0.4 2.8<strong>03</strong>A–181 f MGY 14 8.5 8.54 6.4 0.4 2.8Wastes:Chemical kg/yr 8,400 10,861 2,538 1,563 11,709 14,243LLW g m 3 /yr 754 h 238 345 199 300 296.3MLLW m 3 /yr 13 h 1.3 3.9 1.75 12.6 3.34TRU m 3 /yr 237 i 73.3 94.3 54.1 35.6 40.6Mixed TRU m 3 /yr 102 i 16.8 66 16.8 29.6 54.9Number of FTEs 1,111 j 526 j 589 jWorkers 589 j 572 j 635 j 689 jaCi/yr = curies per year; MGY = million gallons per year; FTEs = full-time equivalent workers.bProjections for the SWEIS were reported as plutonium or plutonium-239, the primary material at TA-55.cThe radionuclide was not projected in the SWEIS ROD because it was either dosimetrically insignificant or not isotopicallyidentified.dThese radionuclides include isotopes of thorium.eNPDES is <strong>National</strong> Pollutant Discharge Elimination System.fThis outfall flowed all four quarters during CY 1999, 2000, and 2001.gLLW = low-level radioactive waste; MLLW = mixed low-level radioactive waste; TRU = transuranic.hIncludes estimates of waste generated by the facility upgrades associated with pit fabrication.iThe SWEIS provided data for TRU and mixed TRU wastes in Chapter 3 and Chapter 5. However, projections made had tobe modified to reflect the decision to produce nominally 20 pits per year.jThe first number shown in the “SWEIS ROD” column is the actual employee count representing CY 1999 (the year theSWEIS ROD was published). The second number shown in the “SWEIS ROD” column is the index number representingCY 1999 (the year the SWEIS ROD was published). The number of employees for CY 1998 through CY 2002 operationscannot be directly compared to numbers projected by the SWEIS ROD. The employee numbers projected by the SWEISROD represent total workforce size and include PT<strong>LA</strong>, JCNNM, and other subcontractor personnel. The number ofemployees for 1998 through 2002 operations is routinely collected information and represents only University ofCalifornia (UC) employees (regular full-time and part- time). Because the two sets of numbers (SWEIS ROD versus thenew index) do not represent the same entity, a direct comparison to numbers projected by the SWEIS ROD(see Section 3.6, Socioeconomics) is not appropriate. However, because this index is going to be used in each subsequentYearbook, selecting CY 1999 as the base year establishes an index that can be compared over the ten-year windowrepresented by the SWEIS ROD.SWEIS Yearbook—2002 2-43
Glovebox linesWaste transfer2.1.4 Cerro Grande Fire Effects at the Plutonium ComplexOn Monday, May 8, 2000, <strong>LA</strong>NL officially closed because of the Cerro Grande Fire. At 1328 hourson May 10, because of worsening fire conditions, Building TA-55-4 was put into off-normal operationsstatus (e.g., normal operations were terminated, some of the facility systems were shut down, and programoperations that relied upon those systems required alternative services). In addition, zones 2 and 3 ventilationsystems were shut down to reduce intake ventilation airflow. Ventilation systems in all other support buildingsat TA-55 were also shutdown in an effort to mitigate facility damage from heavy smoke and blowing embers.At 2130 hours, because of fire encroaching on the fenced perimeter intrusion detection and assessmentsystems area surrounding TA-55, Building TA-55-4 was completely shut down and entombed (e.g., allmassive vault-type doors were shut and locked). Shortly thereafter at 0010 hours on May 11, OperationsCenter personnel were ordered to evacuate. Protection Technology Los Alamos (PT<strong>LA</strong>) continued to performrounds to ensure that the security envelope at TA-55 remained intact. On May 12, a limited number of facilityoperations personnel returned to TA-55 for an initial condition assessment. Power was partially restored torecover security and fire suppression systems. Building TA-55-4 was found to be stable with no indicationof contamination. The uninterruptible power supply system, Operations Center ventilation, and vault coolingsystem were re-energized. A Facility Recovery Plan was written, approved, and implemented in the days thatfollowed. On May 15, the facility again resumed around-the-clock manning of the Operations Center. On May22, all Building TA-55-4 systems were operable and Building TA-55-4 was again placed in full operationsstatus.Although fire encroached on the fenced perimeter intrusion detection and assessment systems areasurrounding TA-55, none of the buildings suffered serious fire damage.2-44SWEIS Yearbook—2002
2.2 Tritium Facilities (TA-16 and TA-21)This Key Facility consists of tritium operations at TA-16 and TA-21. Tritium operations are conductedprimarily in three buildings: The WETF (Building TA-16-205), the TSTA (Building TA-21-155), and theTSFF (Building TA-21-209). Limited operations involving the removal of tritium from actinide materialare conducted at <strong>LA</strong>NL’s TA-55 Plutonium Facility; however, these operations are small in scale and thisoperation was not included as part of the Tritium Facilities in the SWEIS. The tritium emissions from TA-55,however, are included in the TA-55 Key Facility.The three facilities, (WETF, TSTA, and TSFF) had tritium inventories greater than 30 grams during the1996–2002 timeframe and thus are Category 2 nuclear facilities. However, the scope of the tritium activitiesat TSTA and TSFF is now being reduced. Programmatic activities at TSTA have been discontinued. Onlywork supporting tritium inventory removal and facility deactivation is now conducted at TSTA. Thetritium inventory at the end of 2002 was estimated to be less than 20 grams. During 20<strong>03</strong>, the inventorywill be reduced to less than 1.6 grams and it is expected that <strong>LA</strong>NL and DOE will reclassify the facilityto a radiological facility (less than 1.6 grams tritium). TSTA will be placed in a stable surveillance andmaintenance mode until decommissioning and demolition funding become available.Programmatic activities at the TSFF are also being reduced and are expected to be moved to WETF andTA-16-202 in 20<strong>03</strong>. The TSFF transition to radiological facility is estimated to occur in 2006. When fundingbecomes available the TSFF will be deactivated.As shown in Table 2.2-1, the <strong>Nuclear</strong> Hazard Classification of these three facilities has remained constant.Although WETF was separated into its three component buildings in the SWEIS, it is now considered a singlebuilding.Table 2.2-1. Tritium Buildings with <strong>Nuclear</strong> Hazard ClassificationaBUILDING DESCRIPTIONSWEISRODDOE1998 a DOE2000 b <strong>LA</strong>NL2001 c <strong>LA</strong>NL2001 d <strong>LA</strong>NL2002 eTA-16-0205 f WETF 2 2 2 2 2 2TA-16-0205A f WETF 2TA-16-0450 f WETF 2TA-21-0155 TSTA 2 2 2 2 2 2TA-21-0209 TSFF 2 2 2 2 2 2DOE/<strong>LA</strong>NL list of Los Alamos <strong>National</strong> Laboratory <strong>Nuclear</strong> Facilities (DOE 1998a)DOE/<strong>LA</strong>NL list of Los Alamos <strong>National</strong> Laboratory <strong>Nuclear</strong> Facilities (DOE 2000a)DOE/<strong>LA</strong>NL list of Los Alamos <strong>National</strong> Laboratory <strong>Nuclear</strong> Facilities (<strong>LA</strong>NL 2001a)DOE/<strong>LA</strong>NL list of Los Alamos <strong>National</strong> Laboratory <strong>Nuclear</strong> Facilities (<strong>LA</strong>NL 2001b)DOE/<strong>LA</strong>NL list of Los Alamos <strong>National</strong> Laboratory <strong>Nuclear</strong> Facilities (<strong>LA</strong>NL 2002a)In 2002, TA-16-205 and TA-16-205A are nuclear facilities while TA-16-450 is not operational with tritium. Whenthe WETF Safety Analysis Report is approved and an operational readiness review is completed, TA-16-205, -205A,and -450 will be considered one facility.bcdef2.2.1 Construction and Modifications at the Tritium FacilitiesProjected for the Tritium Facilities: The ROD projected extending the WETF tritium operations intoTA-16-450.Actual for WETF: No major upgrades were made to the WETF at TA-16 during the period 1996-1998.However, significant remodeling to the adjacent building, TA-16-450, was begun with the goal of extendingthe WETF tritium processing area into Building 450 (as was projected by the ROD). The remodeling of TA-16-450 continued in 1999 and was completed in 2000. No major upgrades were made to the WETF atSWEIS Yearbook—2002 2-45
TA-16 during 1999, 2000, and 2001. Upgrade of a part of the WETF roof to meet current seismicrequirements was begun in November 2000 and was completed in March 2001. This modification involvedadditional structural attachment of the existing roof to the facility walls. NEPA review for the re-roofing wasprovided by Categorical Exclusion (DOE 1998b). A new WETF office building (Building 824) was completedin November 2001. This work was also done under a Categorical Exclusion (DOE 1998c).During 2002, there were no new major construction activities or building modifications at WETF at TA-16. The operational readiness review to extend the tritium processing area of WETF into Building 450 wasstarted in 2002. At the completion of the operational readiness review, Building 450 will be integrated intoWETF tritium operations. The modification of Building 450 is to accommodate neutron tube target loadingoperations and related research. This modification was addressed by the SWEIS ROD and has its own NEPAcoverage via an environmental assessment and Finding of No Significant Impact (DOE 1995a).Actual for TSTA and TSFF: A new cooling tower was installed to replace the original TSTA coolingtower at TA-21 (DOE 2000b). This reduced the amount of tritium released into the <strong>LA</strong>NL liquid radioactivewaste system. No other modifications to either TSTA or TSFF were made during the period 1996–1998. InNovember 1999, DOE determined that the TSTA facility has completed its mission and the tritium will beremoved from TSTA in the next several years. During 2001, only a limited experimental program was carriedout in TSTA, and this program was completed by June 2001. There were no facility modifications made tothe TA-21 facilities from 1999 through 2002.A summary of construction and modification activities is presented in Table 2.2.1-1.2.2.2 Operations at the Tritium FacilitiesThe SWEIS identified nine capabilities for this Key Facility. No new capabilities have been added, andone, Cryogenic Separation at TSTA, has been deleted. Table 2.2.2-1 lists the nine capabilities identified in theSWEIS and presents CY 1998 through CY 2002 operational data for each of these capabilities. Operationsin 1998 through 2002 were below the SWEIS ROD projections and remained within the establishedenvironmental envelope. For example, in 2002, 25 High-Pressure Gas Fill operations were conducted(compared to 65 fills projected by the SWEIS ROD), and approximately 20 gas boost system tests and gasprocessing operations were performed (compared to 35 projected).Tritium water collection drums2-46SWEIS Yearbook—2002
Table 2.2.1-1. Tritium Facilities Construction and ModificationsSWEIS RODPROJECTIONWETF atTA-16Extend the WETFtritium operationsinto TA-16-450TSTA and TSFF atTA-211998YEARBOOKSignificantremodeling ofTA-16-450begun (DOE1995a).Outfall 05S,<strong>03</strong>A-<strong>03</strong>6, and04A-091eliminated fromNPDES permit.ACTUAL CONSTRUCTION AND MODIFICATION1999YEARBOOKRemodeling ofTA-16-450continued.New coolingtower for TSTA(DOE 2000b).DOE determinedthat TSTAmissioncompleted.2000YEARBOOKRemodeling ofTA-16-450completed.Upgrade of WETFroof began (DOE1998b).2001YEARBOOKWETF roofupgradecompleted.Several existingsystemsupgraded.WETF officebuildingcompleted (DOE1998c).TSTA completedlimitedexperimentalprogram.2002YEARBOOKCross countrytransfer line toTA-50 removed(See Section2.14).SWEIS Yearbook—2002 2-47
2-48SWEIS Yearbook—2002Table 2.2.2-1. Tritium Facilities/Comparison of OperationsCAPABILITY SWEIS ROD a 1998YEARBOOKHigh-Pressure Gas Fillsand Processing: WETFGas Boost SystemTesting andDevelopment: WETFCryogenic Separation:TSTADiffusion andMembrane Purification:TSTA, TSFF, WETFMetallurgical andMaterial Research:TSTA, TSFF, WETFHandling and processing oftritium gas in quantities of upto 100 g with no limit onnumber of operations peryear. Capability used ~65times per year.System testing and gasprocessing operationsinvolving quantities of up to100 grams. Capability used~35 times per year.Tritium gas purification andprocessing in quantities up to200 grams. Capability usedfive to six times per year.Research on tritiummovement and penetrationthrough materials. Expect sixto eight experiments permonth. Capability also usedcontinuously for effluenttreatment.Capability involves materialsresearch including metalgetter research andapplication studies. Smallquantities of tritium supporttritium effects and propertiesresearch and development.Contributes
Table 2.2.2-1. Tritium Facilities/Comparison of Operations (continued)SWEIS Yearbook—2002 2-49CAPABILITY SWEIS ROD a YEARBOOK1998Thin Film Loading:TSFF (WETF by 2001)Gas Analysis: TSTA,TSFF, WETFCalorimetry: TSTA,TSFF, WETFSolid Material andContainer Storage:TSTA, TSFF, WETFaChemical bonding of tritiumto metal surfaces. Currentapplication is for tritiumloading of neutron tubetargets; perform loadingoperations up to 3,000 unitsper year.Analytical support to currentcapabilities. Operationsestimated to contribute
2.2.3 Operations Data for the Tritium FacilitiesNeither TRU nor mixed TRU waste was generated in 2000 and 2001. From 1998 through 2002, mostdata for operations at the Tritium Facilities were slightly below levels projected by the SWEIS ROD.An exception to this was the airborne releases of elemental tritium from WETF. During January 2001,approximately 7,600 curies of elemental tritium were released from the facility during a single event. Theother exceptions are the generation of 2,615 kilograms and 5,164 kilograms of chemical waste in 2001 and2002 from WETF. In 2001, 2,353 kilograms of chemical waste were generated from refrigerant replacementat TA-16-450. The 2002 waste volume is 3,464 kilograms over the amount projected in the SWEIS ROD.Over 4,000 kilograms of the 2002 chemical waste were generated from refrigerant replacement at TA-16-450.The outfall flows at the Tritium Facilities were below levels projected in the ROD for 1998 and 1999.(Appendix D provides information on outfall usage at <strong>LA</strong>NL.) In 2000, the NPDES outfall discharges fromTA-21 were significantly higher than those projected by the SWEIS ROD. This increase was a result of themethods used for estimating the flow. These outfalls discharge on a batch flow basis and one is seasonallyout of service. However, the Discharge Monitoring Reports from the Water Quality and Hydrology group arebased on infrequent sampling and assume round-the-clock flow, thus substantially overestimating the actualdischarge flow. With the 2001 implementation of the newly issued NPDES permit, the Water Quality andHydrology group has been able to acquire direct flow measurements for all outfalls enabling the use of realdata instead of estimates.During 2001, the cross-country transfer line, dedicated to the transfer of radioactive liquid wastes fromthe TA-21 Tritium Facilities to the TA-50 RLWTF, was taken out of service, flushed, drained, and capped.Environmental protection was the primary reason for removing this pipeline from service; it was a singlewalledpipe for its entire length (~two miles). Reduction of radioactive liquid waste volumes generated atthe TA-21 facilities enabled the line to be taken out of service; the smaller volumes can now be transportedfrom TA-21 to TA-50 or TA-53 by truck. The TSTA cooling tower blowdown was changed from the liquidradioactive waste system to the outfall on the southwest end of TA-21, Building 209.During 2002, the cross-country transfer line was mostly removed as part of land transfer. Operational datafrom 1998 through 2002 are summarized in Table 2.2.3-1. The 2002 TSTA releases for tritium in water vaporwere greater than estimated in the ROD because of the deactivation activities.2.2.4 Cerro Grande Fire Effects at the Tritium FacilitiesThreat of wildfire caused the Laboratory to close on Monday, May 8, 2000, and enter emergencyoperations. Because the closure was on a Monday, the Tritium Facilities were already in a safe condition frombeing in safe weekend configuration. During the fire, no damage was incurred at the Tritium Facilities. WhileTA-21 facilities were only remotely threatened by fire, the fire burned up to and around WETF at least threetimes. Because of previous fuel thinning at TA-16 around the WETF and onsite fire support during the fire, nofacility or office structures were damaged.During the Laboratory closure, the safety systems at the Tritium Facilities remained operational and thefacilities remained in safe weekend configuration. The Tritium Facilities were never placed into shutdownmode. Facility operations personnel responded several times to facility alarms and maintenance needs. Noincrease in tritium emission occurred as a result of the fire. Restoration of full operating capabilities (returningto operations) of the Tritium Facilities proceeded without problems or delays.A lessons-learned exercise was conducted after the fire with Tritium Facilities personnel. This resulted inseveral suggestions for personnel and system improvements that will improve safety should a similar incidentoccur in the future.2-50SWEIS Yearbook—2002
Table 2.2.3-1. Tritium Facilities (TA-16 and TA-21)/Operations DataPARAMETERRadioactive AirEmissions:• TA-16, WETF,Elemental tritium• TA-16, WETF,Tritium in watervapor• TA-21, TSTA,Elemental tritium• TA-21, TSTA,Tritium in watervapor• TA-21, TSFF,Elemental tritium• TA-21, TSFF,Tritium in watervaporUNITSSWEISROD1998 1999 2000 2001 2002OPERATIONS OPERATIONS OPERATIONS OPERATIONS OPERATIONSCi/yr 3.0E+2 2.3E+1 2.4E+1 3.9E+1 7.7E+3 3.0E+2Ci/yr 5.0E+2 2.2E+2 1.4E+2 2.2E+2 2.0E+2 1.0E+2Ci/yr 1.0E+2 1.3E+1 1.7E+1 2.5E+1 7.1E+0 4.1E+1Ci/yr 1.0E+2 6.9E+1 4.9E+1 1.5E+2 5.8E+1 4.8E+2Ci/yr 6.4E+2 7.3E+1 9.2E+1 2.5E+2 3.1E+1 2.6E+1Ci/yr 8.6E+2 3.1E+2 3.3E+2 5.1E+2 3.9E+2 5.8E+2NPDES Discharge:Total Discharges MGY 0.3 13.7 8.97 8.6 0.3932 b 13.4000• 05S (SewageTreatment Plant,MGY 0.0 Eliminated1998Eliminated1998Eliminated1998Eliminated1998Eliminated1998aTA-21)• 02A-129 MGY 0.1 13.0 8.83 7.9 0.3902 b 10.8400(TA-21)• <strong>03</strong>A-<strong>03</strong>6 MGY 0.0 Eliminated Eliminated Eliminated Eliminated Eliminateda(TA-21)1997 19971997 1997 1997• <strong>03</strong>A-158 MGY 0.2 0.7 0.14 c 0.7 0.0<strong>03</strong>00 2.5600(TA-21)• 04A-091a(TA-16)MGY 0.0 Eliminated1997Eliminated1997Eliminated1997Eliminated1997Eliminated1997Wastes:Chemical kg/yr 1,700 195 30 10d2,615e5,164LLW m 3 /yr 480 46 47 49 090MLLW m 3 /yr 3 0.10 0 0.01 0.8TRU m 3 /yr 0 00 00 0Mixed TRU m 3 /yr 0 0 00 0 0Number of FTEs 123 f 31 f 28 fWorkers 28 f 24 f 25 f f20abcdefOutfalls eliminated before 1999: 05S (TA-21), <strong>03</strong>A-<strong>03</strong>6 (TA-21), and 04A-091 (TA-16). Consolidation and removal of outfallshas resulted in projected NPDES volumes underestimating actual discharges from the exiting outfalls.Discharge quantity is not considered significantly different from the SWEIS ROD.This outfall only discharged two quarters during CY 1999.During CY 2001, 2,350 kilograms of the chemical waste are from refrigerant replacement at TA-16-450.Over 4,000 kilograms of the chemical waste in CY 2002 are from refrigerant replacement at TA-16-450.The first number shown in the “SWEIS ROD” column is the actual employee count representing CY 1999 (the year theSWEIS ROD was published). The second number shown in the “SWEIS ROD” column is the index number representingCY 1999 (the year the SWEIS ROD was published). The number of employees for 1998 through 2002 operations cannotbe directly compared to numbers projected by the SWEIS ROD. The employee numbers projected by the SWEIS RODrepresent total workforce size and include PT<strong>LA</strong>, JCNNM, and other subcontractor personnel. The number of employeesfor CY 1998 through CY 2002 operations is routinely collected information and represents only UC employees (regularfull-time and part-time). Because the two sets of numbers (SWEIS ROD versus the new index) do not represent the same entity,a direct comparison to numbers projected by the SWEIS ROD (see Section 3.6, Socioeconomics) is not appropriate.However, because this index is going to be used in each subsequent Yearbook, selecting CY 1999 as the base yearestablishes an index that can be compared over the 10-year window represented by the SWEIS ROD.SWEIS Yearbook—2002 2-51
Tree-thinning operations on Two-Mile Mesa2.3 Chemistry and Metallurgy Research Building (TA-<strong>03</strong>)The CMR Building Key Facility was designed and constructed in 1952 to house analytical chemistry,plutonium metallurgy, uranium chemistry, engineering design, and drafting. However, at the time the SWEISROD was issued, CMR was described as “a production, research, and support center for actinide chemistryand metallurgy research and analysis, uranium processing, and fabrication of weapon components.” It consistsof a main building (TA-<strong>03</strong>-29) and a radioactive liquid waste pump house, TA-<strong>03</strong>-154. The CMR consistsof three floors: a basement, first floor, and an attic. It has seven independent wings connected by a commoncorridor. Throughout its history, the CMR has operated as a category 2 nuclear facility.As shown in Table 2.3-1, DOE has identified the CMR facility, in various levels of detail, as a Category 2nuclear facility since the publication of the SWEIS ROD.2-52SWEIS Yearbook—2002
Table 2.3-1 CMR Building with <strong>Nuclear</strong> Hazard ClassificationBUILDINGDESCRIPTIONSWEISRODDOE1998 a DOE2000 b <strong>LA</strong>NL2001 c <strong>LA</strong>NL2001 d <strong>LA</strong>NL2002 aTA-<strong>03</strong>-0029 CMR 2 2 2 2TA-<strong>03</strong>-0029 Radiochemistry Hot Cell 2 2 2Actinide chemistry and metallurgy2research and analysisTA-<strong>03</strong>-0029 SNM Vault 2 2 2TA-<strong>03</strong>-0029 Nondestructive analysis/nondestructive2 2 2examination Waste AssayTA-<strong>03</strong>-0029 IAEA Classroom f 2 2TA-<strong>03</strong>-0029 Wing 9 (Enriched Uranium) 2 2 2aDOE/<strong>LA</strong>NL list of Los Alamos <strong>National</strong> Laboratory <strong>Nuclear</strong> Facilities (DOE 1998a)bDOE/<strong>LA</strong>NL list of Los Alamos <strong>National</strong> Laboratory <strong>Nuclear</strong> Facilities (DOE 2000a)cDOE/<strong>LA</strong>NL list of Los Alamos <strong>National</strong> Laboratory <strong>Nuclear</strong> Facilities (<strong>LA</strong>NL 2001a)dDOE/<strong>LA</strong>NL list of Los Alamos <strong>National</strong> Laboratory <strong>Nuclear</strong> Facilities (<strong>LA</strong>NL 2001b)eDOE/<strong>LA</strong>NL list of Los Alamos <strong>National</strong> Laboratory <strong>Nuclear</strong> Facilities (<strong>LA</strong>NL 2002a)fThe IAEA (International Atomic Energy Agency) Classroom was used to conduct Nonproliferation Training. InCY 2001, this capability was moved to Pajarito Site (TA-18) and renamed the “<strong>Nuclear</strong> Measurement School.”However, the capability was returned to and operated in CMR in CY 2002.2.3.1 Construction and Modifications at the CMR BuildingThe ROD projected five facility modifications by December 2005:• Phase I Upgrades to maintain safe operatingconditions for 5–10 years;• Phase II Upgrades (except seismic) to enableoperations for an additional 20–30 years;• modifications for production of targets for themolybdenum-99 medical isotope;• modifications for the recovery of sealed neutronsources; and• modifications for safety testing of pits in theWing 9 hot cells.During the 1996–1998 time period, only the Phase IUpgrades were in progress. By the end of 1998, all 11of these upgrades had been started, but only five of the11 Phase I Upgrades were completed. Concurrently, inAugust 1998, DOE approved the CMR Basis for InterimOperations, and in the fall of 1998, DOE determined thatextensive upgrades to CMR would not be cost effective.In 1999, DOE directed the CMR Upgrades Projectto re-baseline including only those upgrades needed toensure compliance with the Basis for Interim Operations.These upgrades were required for the facility to bereliable through 2010. During 1999, some work was doneon the remaining Phase I Upgrades and three of the 13Phase II Upgrades. Under the Phase I Upgrades, workon the continuous air monitors in the building wings wasAlpha box insert for a hot cellSWEIS Yearbook—2002 2-53
completed; work on the wing electrical systems and the interim improvements to the duct washdown systemcontinued; and work on the power distribution system, the stack monitoring system, and the improvements toacid vents and drains stopped. Under the Phase II Upgrades, the standby power for the operations center wasnot completed. This project was removed during re-baselining and the upgrades to both the operations centerand the fire protection system were in progress.The new baseline was approved in October 1999 and included 16 upgrades necessary to ensure workersafety, public safety, environmental compliance, and reliability of services to safety systems. Table 2.3.1-1identifies these 16 upgrades and their status during 2002. The table also indicates additional modifications atCMR.All 16 upgrades under the re-baselining were completed by March 2002; the Project submitted allTurnover/Closeout documentation to DOE in July 2002; and the DOE approved Turnover/Closeout inNovember 2002.2.3.2 Operations at the CMR BuildingThe eight capabilities identified in the SWEIS for the CMR Facility are presented in Table 2.3.2-1. No newcapabilities have been added, but one capability (Nonproliferation Training) was removed from CMR in 2000and relocated back to CMR from TA-18 in 2002.2.3.3 Operations Data for the CMR BuildingOperations data from research, services, and production activities at the CMR Building were well belowthose projected by the SWEIS ROD. Radioactive air emissions were less than one curie per year from 1998through 2002 (compared to 1,645 projected)—principally because processing of irradiated molybdenum-99 targets in the hot cells did not occur. Of the wastes generated, only TRU waste in 2001 and mixed TRUin 1998 and 2002 have exceeded SWEIS ROD projections; the others remained low, ranging from about 2percent to about 25 percent of these projections. The TRU and mixed TRU wastes were above projections dueto remodeling activities. Table 2.3.3-1 provides details of these and other operational data.2.3.4 Cerro Grande Fire Effects at the CMR BuildingCerro Grande Fire effects on the CMR Building and its associated operations were minimal. Programs didsuffer downtime and loss of productivity during the evacuation. No direct fire damage occurred and recoverywas limited to cleaning or replacement of air system filters.CMR Building2-54SWEIS Yearbook—2002
SWEIS Yearbook—2002 2-55Table 2.3.1-1. CMR Building Construction and ModificationsSWEIS RODPROJECTIONPhase I Upgradesto maintain safeoperatingconditions for 5to10 yearsDESCRIPTION OFUPGRADES/MODIFICATIONSPhase I Upgrades:Continuous Air MonitorsHeating, ventilation, and airconditioning (HVAC) blowersand motors (Wing 7 only,balance moved to Phase II)ElectricalStack monitorsUninterruptible power supplyDuct Work ModificationAcid Vents and Drains(Immediate repairs, remainingscope moved to Phase II)1998 YEARBOOKFive of the 11 PhaseI Upgradescompleted by end of1998.95% complete1. Continuous airmonitors in buildingwings.100% complete2. HVAC blowers.80% complete3. Wing electricalsystems.70% complete4. Power distributionsystem.90% complete5. Stack monitoringsystem.100% complete6. Uninterruptiblepower supply forstack monitors inwings.90% complete7. Interimimprovements to theduct washdownsystem.40% complete8. Improvements toacid vents anddrains.ACTUAL CONSTRUCTION AND MODIFICATION1999YEARBOOK a 2000YEARBOOK b 2001YEARBOOKSix of the 11Phase I Upgradescompleted by endof 1999.2002YEARBOOK2002 COMPLETIONSTATUS OFUPGRADESPhase I Upgradeswere re-baselinedin 1999.95% complete. Installed, but neverbecame operational.80% complete,work continuing.70% complete,work stopped.90% complete,work stopped.90% complete,continuing.40% complete,work stopped.Cancelled; becameout of scope.Modified andcompleted.Cancelled.Completed; modified.Incomplete; out ofscope withre-baselining.Never turned over.Out of scopewith re-baselining.Out of scopewith re-baselining.
2-56Table 2.3.1-1. CMR Building Construction and Modifications (continued)SWEIS RODPROJECTIONPhase II Upgrades(except seismic) toenable operationsfor an additional20 to 30 yearsDESCRIPTION OFUPGRADES/MODIFICATIONSSanitary SewerFire Protection (Title 1/FireHazard Analysis, remainingscope moved to Phase 2)Engineering Assessment/CDR& EASafety Analysis ReportPhase II Upgrades:Seismic/Tertiary Confinement1998 YEARBOOK100% complete9. Modify thesanitary sewersystem.100% complete10. Fire hazardanalysis.100% complete.11. Engineeringassessment andconceptual design.Basis for InterimOperation completedAugust 1998.ACTUAL CONSTRUCTION AND MODIFICATION199920002001YEARBOOK a YEARBOOK b YEARBOOKProgress wasmade on 3 of theoriginal 13 PhaseII Upgradesduring 1999.<strong>Security</strong> Related to TertiaryConfinementVentilation/Confinement ZoneSeparationOperation Center 25% complete. 0% complete, indesign.80% complete,construction.2002YEARBOOK100%completed.2002 COMPLETIONSTATUS OFUPGRADESCompleted–pluggeddrains.Fire Hazard Analysiscompleted.Completed.Basis for InterimOperation completedAugust 1998.Out of scopewith re-baselining.Out of scopewith re-baselining.Out of scopewith re-baselining.Modified; completed.SWEIS Yearbook—2002StandbyPower/CommunicationsWing 1 HVAC Upgrades(includes Decontamination)Wing 2 and 4 Safe StandbyModified; completed.Out of scopewith re-baselining.Out of scopewith re-baselining.
SWEIS Yearbook—2002 2-57Table 2.3.1-1. CMR Building Construction and Modifications (continued)SWEIS RODPROJECTIONDESCRIPTION OFUPGRADES/MODIFICATIONSChilled Water UpgradesMain Vault Upgrades1998 YEARBOOKACTUAL CONSTRUCTION AND MODIFICATION199920002001YEARBOOK a YEARBOOK b YEARBOOKAcid Vent and Drains (beyondPhase I)Fire Protection Upgrades 25% complete. 40% complete,in design.2002YEARBOOK100% complete. 100%completed.2002 COMPLETIONSTATUS OFUPGRADESIncomplete; out ofscope withre-baselining.Out of scopewith re-baselining.Out of scopewith re-baselining.Modified; completed.Exhaust Wash Down RecycleOut of scopewith re-baselining.Standby Power for Operation100% complete. Completed.CenterModifications underRebaseliningMotor Control Centers Completed.Fire Alarm Control PanelsCompleted.Transient CombustibleCompleted.LoadingAir Compressors Replacement80% complete,in construction.100%completed.HVAC Delta P Indicators 100%completed.Duct Wash Down System Completed.AssessmentDuct Wash Down SystemDesign and Construction75% complete,in construction.100%completed.Stack Monitors FE 14, 19, 20,23, 24, 28, and 32 (Phase A)100%completed.Emergency PersonnelAccountability System60% complete,in construction.95% complete,turnover.100%completed.Wing 9 VentilationCompleted.AssessmentVentilation System FilterCompleted.Replacement Assessment
2-58SWEIS Yearbook—2002Table 2.3.1-1. CMR Building Construction and Modifications (continued)SWEIS RODPROJECTIONModifications forproduction oftargets for themolybdenum-99medical isotopeModifications forthe recovery ofsealed neutronsourcesModifications forsafety testing ofpits in the Wing 9hot cellsDESCRIPTION OFUPGRADES/MODIFICATIONSHood Wash DownStack Monitors FE 15, 29, and33 (Phase B)Emergency Lighting1952 Sprinkler HeadReplacementVentilation System FilterReplacement Design andConstruction (Wing 9)West Bank Hot CellControls/Radiation MonitorsWest Bank Hot Cell Delta PIndicatorsFire Protection SystemEmergency NotificationOperations CenterInternal Power Distribution1998 YEARBOOKACTUAL CONSTRUCTION AND MODIFICATION1999YEARBOOK a 2000YEARBOOK b 2001YEARBOOK65% complete, 100%in construction. completed.90% completed. 100%55% complete,in construction.100%completed.45% complete,in design.40% complete,in design.55% complete,in design.40% complete,in design.35% complete,in design.0% complete, indesign.40% complete,in design.completed.100%completed.100%completed.2002YEARBOOK95% complete,turnover.100%completed.95% complete, 100%turnover. completed.100% complete. 100%completed.90% complete, 100%turnover. completed.80% complete, 100%construction. completed.90% complete, 100%turnover. completed.2002 COMPLETIONSTATUS OFUPGRADESIncomplete–inactiveproject.Incomplete–inactiveproject.Incomplete–inactiveproject
SWEIS Yearbook—2002 2-59Table 2.3.1-1. CMR Building Construction and Modifications (continued)abSWEIS RODPROJECTIONDESCRIPTION OFUPGRADES/MODIFICATIONSOther/additionalmodifications:East Bank Hot CellControls/Radiation MonitorsEast Bank Hot Cell Delta PIndicatorsWing 9 Modifications forBolas GrandeWing 3 Modifications forBolas GrandeMaterial Recovery in Wing 9Clean-out of Waste StorageTanks1998 YEARBOOKACTUAL CONSTRUCTION AND MODIFICATION199920002001YEARBOOK A YEARBOOK B YEARBOOK2002YEARBOOKDuring 1999, Phase I and II Upgrades were re-baselined to include only those needed to ensure compliance with the Basis of Interim Operations.Construction disrupted by Cerro Grande Fire.2002 COMPLETIONSTATUS OFUPGRADESCompleted.Completed.Started.Started.Started.Started.
2-60SWEIS Yearbook—2002Table 2.3.2-1. CMR Building (TA-<strong>03</strong>)/Comparison of OperationsCAPABILITY SWEIS ROD a 1998OPERATIONSAnalyticalChemistryUraniumProcessingDestructive andNondestructiveAnalysisNonproliferationTrainingSample analysis in support of awide range of actinide researchand processing activities.Approximately 7,000 samplesper year.Activities to recover, process,and store <strong>LA</strong>NL highly enricheduranium inventory by 2005.Includes possible recovery ofmaterials resulting frommanufacturing operations.Evaluate 6 to 10 secondaries peryear through destructive/nondestructive analyses anddisassembly.Nonproliferation traininginvolving SNM. No additionalquantities of SNM, but maywork with more types of SNMthan present during preparationof the SWEIS.Approximately 4,000samples wereanalyzed.No activity.Performednondestructiveanalysis on twosecondaries.No activity. Projectinactive.1999OPERATIONSApproximately 2,926samples wereanalyzed.Activities to recoverand process highlyenriched uraniumwere performed.Three shipments to Y-12 involvedpackaging andrepackaging.Performednondestructiveanalysis on less than10 secondaries.Five weeks of SNMnonproliferationtraining conducted.Two weeks involvedCategory 2 quantitiesof SNM.2000OPERATIONSApproximately 2,150samples wereanalyzed.Activities to recoverand process highlyenriched uraniumwere performed. Fourto five shipmentswere made to Y-12.No activity. Project isno longer active, andcapability was notused in 2000.Training wasconducted in August2000. This capabilitywas moved back toTA-18, and no moretraining is planned atCMR Buildingbecause of a changein status.2001OPERATIONSApproximately 2,500samples wereanalyzed.Highly enricheduranium wasrepackaged. Fiveshipments were madeto Y-12 at Oak Ridge<strong>National</strong> Laboratory.Other material wasmoved to TA-18.No activity. Project isno longer active, andcapability was notused in 2001.This capability wasmoved back to TA-18, and no moretraining is planned atCMR Buildingbecause of a changein status.2002OPERATIONSApproximately 2,800samples wereanalyzed.Highly enricheduranium wasrepackaged. Twobatches of soliduranium nitratehexahydrate (UNH)were converted totriuranium octocide(U 3 O 8 ). Also threebatches of UNHliquids wereconverted to U 3 O 8 .All items are fromTA-18.No activity. Project isno longer active, andcapability was notused in 2002.This capabilityreturned to CMR andoperated at CMRduring 2002.
SWEIS Yearbook—2002 2-61Table 2.3.2-1. CMR Building (TA-<strong>03</strong>)/Comparison of Operations (continued)CAPABILITYActinide Researchand Processing baSWEIS RODProcess up to 5,000 Ci/yrplutonium-238/beryllium andamericium-241/berylliumneutron sources.Process neutron sources otherthan sealed sources.Stage up to 1,000 Ci/yrplutonium-238/beryllium andamericium-241/berylliumsources in Wing 9 floor holes.Introduce research anddevelopment effort on spentnuclear fuel related to long-termstorage and analyze componentsin spent and partially spentfuels.Metallurgical microstructural/chemical analysis andcompatibility testing ofactinides and other metals.Primary mission to study longtermaging and other materialeffects. Characterize about 100samples per year. Conductresearch and development in hotcells on pits exposed to hightemperatures.1998OPERATIONSReceived a few smallquantitysources.Level well below thatprojected by theSWEIS ROD.1999OPERATIONSNo source processingactivity.200020012002OPERATIONS OPERATIONS OPERATIONSNo activity. No activity. No activity.No activity. No activity. No activity. Analyzed ~50samples in 2001.Metallurgicalmicrostructural/chemical analysis andcompatibility testingof actinides and othermetals. Primarymission to study longtermaging and othermaterial effects.Characterize about100 samples per year.Conduct research anddevelopment in hotcells on pits exposedto high temperatures.Performedmicrostructuralcharacterization testson ~50 samples. Noresearch anddevelopment on pitsexposed to hightemperatures.Performedmicrostructuralcharacterization testson ~50 samplescontaining less than20 grams ofplutonium per sample.No research anddevelopment on pitsexposed to hightemperatures.Performedmicrostructuralcharacterization testson ~200 samplescontaining less than20 grams ofplutonium per sample.Performedmicrostructuralcharacterization testson ~200 samplescontaining less than20 grams ofplutonium per sample.
Table 2.3.2-1. CMR Building (TA-<strong>03</strong>)/Comparison of Operations (continued)2-62SWEIS Yearbook—2002CAPABILITY SWEIS ROD a 1998OPERATIONSAnalysis of TRU waste disposal No decontaminationrelated to validation of the technology activity.Waste Isolation Pilot Plant Studies on TRU waste(WIPP) performance assessment and WIPPmodels.performanceTRU waste characterization. assessment modelsAnalysis of gas generation such ongoing.as could occur in TRU wasteduring transportation to WIPP.Performance DemonstrationProgram to test nondestructiveanalysis/nondestructiveexamination equipment.Demonstrate actinidedecontamination technology forsoils and materials.Develop actinide precipitationmethod to reduce mixed wastesin <strong>LA</strong>NL effluents.Fabrication andMetallographyProduce 1,080 targets per year,each containing ~20 gramsuranium-235, for the productionof molybdenum-99, plus anadditional 20 targets/wk for 12weeks.Separate fission products fromirradiated targets to providemolybdenum-99. Ability toproduce 3,000 six-day curies ofmolybdenum-99/wk. cCoated ~300 targetsfor molybdenum-99.1999OPERATIONSFinal analysisconducted onexperiments.No work performed.2000OPERATIONSDecontaminationperformed on 15drum scales, anddecontamination wasstarted on 34 literdrum scales. Thisoperation is expectedto terminate in 2001.No activity. Projectwas terminated.2001OPERATIONSThis is no longer anongoing program.No activity. Projectwas terminated.2002OPERATIONSNo activity. Projectwas terminated.No activity. Projectwas terminated.
SWEIS Yearbook—2002 2-63Table 2.3.2-1. CMR Building (TA-<strong>03</strong>)/Comparison of Operations (continued)abcCAPABILITY SWEIS ROD a 19981999200020012002OPERATIONS OPERATIONS OPERATIONS OPERATIONS OPERATIONSSupport complete highlyenriched uranium processing,research and development, pilotoperations, and casting.Fabricate metal shapes,including up to 50 sets of highlyenriched uranium components,using 1 to 10 kg highly enricheduranium per operation.Material recovered and retainedin inventory.Up to 1,000 kg annualthroughput.No activity. No activity. No activity. No activity. No activity.Includes completion of Phase I and Phase II Upgrades, except for seismic upgrades, modifications for the fabrication of molybdenum-99 targets, modifications for theRadioactive Source Recovery Program, and modification for safety testing of pits.The actinide activities at the CMR Building and at TA-55 are expected to total 400 kg/yr. The future split between these two facilities is not known, so the facilityspecificimpacts at each facility are conservatively analyzed at this maximum amount. Waste projections, which are not specificto the facility (but are related directlyto the activities themselves), are only projected for the total of 400 kg/yr.Molybdenum-99 is a radioactive isotope that decays to form metastable technetium-99, a radioactive isotope that has broad applications in medical diagnosticprocedures. Both isotopes are short-lived, with half-lives (the time in which the quantity of the isotope is reduced by 50 percent) of 66 hours and 6 hours, respectively.These short half-lives make these isotopes both attractive for medical use (minimizes the radiation dose received by the patient) and highly perishable. Production ofthese isotopes is therefore measured in “six-day curies,” the amount of radioactivity remaining after six days of decay, which is the time required to produce anddeliver the isotope to hospitals and other medical institutions.
Table 2.3.3-1. CMR Building (TA-<strong>03</strong>)/Operations DataPARAMETER UNITSSWEISROD1998OPERATIONS1999OPERATIONS2000OPERATIONS2001OPERATIONS2002OPERATIONSRadioactive AirEmissions:Total Actinides a Ci/yr 7.60E-4 2.62E-5 3.0E-5 1.0E-5 5.9E-8 2.7E-5Selenium-75 Ci/yr Not 6.66E-6 Not detected Not detected Not detected Not detectedprojectedKrypton-85 Ci/yr 1.00E+2 Not measured Not measured b Not measured b Not measured b Not measuredXenon-<strong>131</strong>m Ci/yr 4.50E+1 Not measured Not measured b Not measured b Not measured b Not measuredXenon-133 Ci/yr 1.50E+3 Not measured Not measured b Not measured b Not measured b Not measuredTritium Water Ci/yr Negligible Not measured Not measured b Not measured b Not measured b Not measuredTritium Gas Ci/yr Negligible Not measured Not measured b Not measured b Not measured b Not measuredTechnetium-99 Ci/yr Notprojected cNPDESDischarge:Number ofoutfalls --- 1 1 1 1 1 1Total Discharge MGY 0.53 3.2 4.45 2.28 0.02090 0.76<strong>03</strong>A–021 d MGY 0.53 3.2 4.45 2.28 0.02090 0.76Wastes:Chemical kg/yr 10,800 3,313 4,824 1,837 676 707LLW e m 3 /yr 1,820 124 184 264 448 389MLLW m 3 /yr 19 3.2 0.4 0.3 0.4 0.9TRU m 3 /yr 28 f 12.7 8.9 24.8 46.5 10.2Mixed TRU m 3 /yr 13 f 15.8 1.9 1 0.8 16.7Number of FTEs 367 g 218 g 204 gWorkers 204 g 190 g 192 g 201 gaIncludes uranium, plutonium, americium, and thorium.bPotential emissions during the period were sufficiently small that measurement of these radionuclides was notnecessary to meet facility or regulatory requirements.cThe radionuclide was not projected in the ROD because it was either dosimetrically insignificant or not isotopicallyidentified.dThis outfall discharged all four quarters during CY 1999.eWastes (e.g., 4,000 cubic meters LLW) from the Phase II CMR Upgrades are included.fThe SWEIS provided the data for TRU and mixed TRU wastes in Chapter 3 and Chapter 5. However, the projectionsmade had to be modified to reflect the decision to produce nominally 20 pits per year.gThe first number shown in the “SWEIS ROD” column is the actual employee count representing CY 1999 (the yearthe SWEIS ROD was published). The second number shown in the “SWEIS ROD” column is the index numberrepresenting CY 1999 (the year the SWEIS ROD was published). The number of employees for CY 1998 throughCY 2002 operations cannot be directly compared to numbers projected by the SWEIS ROD. The employee numbersprojected by the SWEIS ROD represent total workforce size and include PT<strong>LA</strong>, JCNNM, and other subcontractorpersonnel. The number of employees for 1998 through 2002 operations is routinely collected information and representsonly UC employees (regular full-time and part-time). Because the two sets of numbers (SWEIS ROD versus the newindex) do not represent the same entity, a direct comparison to numbers projected by the SWEIS ROD (see Section3.6, Socioeconomics) is not appropriate. However, because this index is going to be used in each subsequentYearbook, selecting CY 1999 as the base year establishes an index that can be compared over the 10-year windowrepresented by the SWEIS ROD.2-64SWEIS Yearbook—2002
2.4 Pajarito Site (TA-18)The Pajarito Site Key Facility is located entirely at TA-18. Principal activities are design andperformance of nuclear criticality experiments and detector development in support of emergency response,nonproliferation, and arms control.The SWEIS defined the facility as having a main building (18-30), three outlying, remote-controlledcritical assembly buildings then known as “kivas” (18-23, -32, -116), and a number of additional supportbuildings, including the hillside vault (18-26). During 2000, in response to concerns expressed by two NativeAmerican Indian Pueblos (Santa Ana and Picuris), the term “kiva” (which has religious significance to theseNative Americans), was replaced with the acronym CASA (Critical Assembly and Storage Area).As shown in Table 2.4-1, DOE lists this whole Key Facility as a Category 2 facility and identifies sevenbuildings with nuclear hazard classification. The four buildings identified in the SWEIS (TA-18-23, -26, -32,and -116) have remained Category 2 nuclear facilities. The additions represent buildings with inventoriesmeeting the current nuclear facility classification guidelines. It is interesting to note that the IAEA classroom(Building TA-18-258) represents a capability that was originally at TA-18, transferred to the CMR Building,and then brought back to TA-18 in 2000. The IAEA schools have been returned to CMR in 2002. All otherschools remain at TA-18.The new Authorization Basis, comprised of a Basis of Interim Operation document and Technical SafetyRequirements, was submitted to NNSA on March 14, 2002, and approved by NNSA on July 31, 2002.Implementation of the new Authorization Basis, including the Technical Safety Requirements, is in progressand scheduled to be completed by June 2004. The new Authorization Basis adds safety measures to TA-18operations in the form of both engineered and administrative controls.Table 2.4-1. Pajarito Site Buildings with <strong>Nuclear</strong> Hazard ClassificationBUILDINGDESCRIPTIONSWEISRODDOE1998 a DOE2000 b <strong>LA</strong>NL2001 c <strong>LA</strong>NL2001 d <strong>LA</strong>NL2002 eTA-18 Site Itself 2 2 2 2 2TA-18-0023 SNM Vault (CASA 1) 2 2 2 2 2TA-18-0026 Hillside Vault 2 2 2 2 2TA-18-0<strong>03</strong>2 SNM Vault (CASA 2) 2 2 2 2 2TA-18-0116 Assembly Building (CASA 3) 2 2 2 2 2TA-18-0127 Accelerator used for weapons x-ray 2 2 2 2TA-18-0129 Calibration Laboratory 2 2 2 2TA-18-0247 Sealed Sources 3 3TA-18-0258 IAEA Classroom (Trailer) f 2aDOE/<strong>LA</strong>NL list of Los Alamos <strong>National</strong> Laboratory <strong>Nuclear</strong> Facilities (DOE 1998a)bDOE/<strong>LA</strong>NL list of Los Alamos <strong>National</strong> Laboratory <strong>Nuclear</strong> Facilities (DOE 2000a)cDOE/<strong>LA</strong>NL list of Los Alamos <strong>National</strong> Laboratory <strong>Nuclear</strong> Facilities (<strong>LA</strong>NL 2001a)dDOE/<strong>LA</strong>NL list of Los Alamos <strong>National</strong> Laboratory <strong>Nuclear</strong> Facilities (<strong>LA</strong>NL 2001b)eDOE/<strong>LA</strong>NL list of Los Alamos <strong>National</strong> Laboratory <strong>Nuclear</strong> Facilities (<strong>LA</strong>NL 2002a)fThe IAEA Classroom was used to conduct Nonproliferation Training. In CY 2001, this capability was moved toPajarito Site (TA-18) and renamed the “<strong>Nuclear</strong> Measurement School.” However, the capability was returned to andoperated in CMR in CY 2002.SWEIS Yearbook—2002 2-65
2.4.1 Construction and Modifications at the Pajarito SiteProjected: The SWEIS ROD projected replacement of the portable linac machine.Actual: The portable linac has not been replaced. Construction projects for 2001 consist of the installationof two office trailers (Buildings 300 and 301) and security enhancements. In 2002, a cable tray relocationoccurred (DOE 2001a).Proposed: The environmental impact statement ROD for TA-18 relocation was issued for public commenton August 30, 2002, listing the Device Assembly Facility at the Nevada Test Site as the preferred alternative.The ROD was approved on December 5, 2002 (DOE 2002b).Table 2.4.1-1 indicates the construction and modifications that have occurred at TA-18.Table 2.4.1-1. Pajarito Site Construction and ModificationsACTUAL CONSTRUCTION AND MODIFICATIONSWEIS RODPROJECTIONReplacement ofthe portable linac1998YEARBOOK1999YEARBOOK2000YEARBOOK2001YEARBOOK2002YEARBOOKNot done. Not done. Not done. Not done. Not done.Installation of twooffice trailers(Buildings 300 and301)<strong>Security</strong>enhancementsCable trayrelocation (DOE2001a).An accelerator2-66SWEIS Yearbook—2002
2.4.2. Operations at the Pajarito SiteThe SWEIS identified nine capabilities for this Key Facility. No research capabilities have been deleted.However, the <strong>Nuclear</strong> Measurement School (IAEA classroom returned to CMR) that was originally movedfrom TA-18 to CMR (before the SWEIS), was moved back to TA-18 in 2000 and then returned to CMR in2002.The TA-18 facility experienced a safety stand down on August 12, 1998, that lasted into April 1999. As aresult, only a limited number (54) of criticality experiments were performed during 1998, along with morethan 100 subcritical tests. This total of 154 experiments is approximately a factor of seven below the RODprojection of a maximum of 1,050 experiments in any given year.Since 1999, the facility has experienced normal operations. TA-18 conducted 188 criticality experimentsin 1999 and a total of 140 in both 2000 and 2001. The TA-18 facility experienced normal operationsduring 2002, except for the Solution High-Energy Burst Assembly (SHEBA) critical assembly that was onoperational downtime starting August 2000. SHEBA was restarted in February 20<strong>03</strong>. The TA-18 facilityconducted 160 criticality experiments in 2002. This total of 160 experiments represents only about 15 percentof the SWEIS ROD projection of a maximum of 1,050 experiments in any given year.In addition, the nuclear material inventory level has remained below the SWEIS ROD projection. For 2002the material inventory was reduced by 10 percent, and there was not a significant increase in nuclear weaponscomponents and materials at the facility. Table 2.4.2-1 provides details.Examining hemispheresSWEIS Yearbook—2002 2-67
2-68SWEIS Yearbook—2002Table 2.4.2-1. Pajarito Site (TA-18)/Comparison of OperationsCAPABILITIES SWEIS ROD a 1998 OPERATIONS 1999 OPERATIONS 2000 OPERATIONS 2001 OPERATIONS 2002 OPERATIONSDosimeterAssessment andCalibrationDetectorDevelopmentPerform up to 1,050 criticalityexperiments per year.Develop safeguardsinstrumentation and performresearch and development fornuclear materials, lightdetection and rangingexperiments, and materialsprocessing.Increase nuclear materialsinventory by 20%, and replaceportable linac.Materials Testing Perform up to 1,050 criticalityexperiments per year. Developsafeguards instrumentation andperform research anddevelopment for nuclearmaterials, light detection andranging experiments, andmaterials processing.SubcriticalMeasurementsPerform up to 1,050 criticalityexperiments per year. Developsafeguards instrumentation andperform research anddevelopment for nuclearmaterials, light detection andranging experiments, andmaterials processing. Increasenuclear materials inventory by20%.Performed 54experiments.Same activities as in1995. Increasednuclear materialsinventory by 5%. Didnot replace theportable accelerator.Performed 54experiments.Performed 54experiments.Increased nuclearmaterials inventory by5%.Performed 188experiments.Increased nuclearmaterials inventory by5% in 1998, noadditional increase in1999. Did not replacethe portable linac.Performed 188experiments.Performed 140experiments.Increased nuclearmaterials inventory by5% in 1998, noadditional increase in1999, and a 15%increase in 2000. Didnot replace the portablelinac.Performed 140experiments.Performed 188 Performed 140experiments. Increasednuclear materialsinventory by 5% in1998, no additionalincrease in 1999.experiments. Increasednuclear materialsinventory by 5% in1998, no additionalincrease in 1999, and a15% increase in 2000.The SKUA criticalassembly was de-fueledat DOE’s request and isno longer available forcriticality experiments.Performed 140experiments.The nuclear materialsinventory for 2001 wasapproximately thesame as the 2000inventory. Did notreplace the portablelinac.Performed 140experiments.Performed 140experiments. Thenuclear materialsinventory for 2001 wasapproximately thesame as the 2000inventory.The SKUA criticalassembly was defueledat DOE’srequest and is nolonger available forcriticality experiments.Performed 140experiments.The nuclear materialsinventory for 2002was approximately thesame as the 2001inventory. Did notreplace the portablelinac.Performed 160experiments.Performed 160experiments. Thenuclear materialsinventory for 2001was approximately thesame as the 2000inventory.The SKUA criticalassembly was defueledat DOE’srequest and is nolonger available forcriticalityexperiments. Allexpected SKUAmaterial shipmentswill be completed byMay 20<strong>03</strong>.
SWEIS Yearbook—2002 2-69Table 2.4.2-1. Pajarito Site (TA-18)/Comparison of Operations (continued)CAPABILITIES SWEIS ROD a 1998 OPERATIONS 1999 OPERATIONS 2000 OPERATIONS 2001 OPERATIONS 2002 OPERATIONSFast-NeutronSpectrumDynamicMeasurementsSkyshineMeasurementsVaporizationIrradiationPerform up to 1,050 criticalityexperiments per year. Developsafeguards instrumentation andperform research anddevelopment for nuclearmaterials, light detection andranging experiments, andmaterials processing.Increase nuclear materialsinventory by 20%, andincrease nuclear weaponscomponents and materials.Perform up to 1,050 criticalityexperiments per year. Developsafeguards instrumentation andperform research anddevelopment for nuclearmaterials, light detection andranging experiments, andmaterials processing. Increasenuclear materials inventory by20%.Perform up to 1,050 criticalityexperiments per year.Perform up to 1,050 criticalityexperiments per year.Perform up to 1,050 criticalityexperiments per year. Developsafeguards instrumentation andperform research anddevelopment for nuclearmaterials, interrogationtechniques, and field systems.Increase nuclear materialsinventory by 20%.Performed 54experiments.Increased nuclearmaterials inventory by5%. Slight increase innuclear weaponscomponents andmaterials.Performed 54experiments.Increased nuclearmaterials inventory by5%.Performed 54experiments.Performed 54experiments.Performed 54experiments.Increased nuclearmaterials inventory by5%.Performed 188 Performed 140experiments. Increasednuclear materialsinventory by 5% in1998, no additionalincrease in 1999.Slight increase innuclear weaponscomponents andmaterials in 1998, noadditional increase in1999.1999.Performed 188experiments. Increasednuclear materialsinventory by 5% in1998, no additionalincrease in 1999.Performed 188experiments.Performed 188experiments.Performed 188experiments. Increasednuclear materialsinventory by 5% in1998, no additionalincrease in 1999.experiments. Increasednuclear materialsinventory by 5% in1998, no additionalincrease in 1999, and a15% increase in 2000.Slight increase innuclear weaponscomponents andmaterials in 1998, noadditional increase inPerformed 140experiments. Increasednuclear materialsinventory by 5% in1998, no additionalincrease in 1999, and a15% increase in 2000.Performed 140experiments.Performed 140experiments.Performed 140experiments. Increasednuclear materialsinventory by 5% in1998, no additionalincrease in 1999, and a15% increase in 2000.Performed 140experiments. Thenuclear materialsinventory for 2001 wasapproximately thesame as the 2000inventory. Slightincrease in nuclearweapons componentsand materials in 1998,no additional increasein 1999 through 2001.Performed 140experiments. Thenuclear materialsinventory for 2001 wasapproximately thesame as the 2000inventory.Performed 160experiments. Thenuclear materialsinventory for 2001was approximately thesame as the 2000inventory. Significantdecrease in nuclearweapons componentsand materials in 1999and 2002, noadditional increase in1999 through 2002.Performed 160experiments. Thenuclear materialsinventory for 2002was decreased by10%.Performed 140 Performed 160experiments. experiments.Performed 140 Performed 160experiments. experiments.Performed 140experiments. Thenuclear materialsinventory for 2001 wasapproximately thesame as the 2000inventory.Performed 160experiments. Thenuclear materialsinventory for 2002was approximately thesame as the 2001inventory.
2-70Table 2.4.2-1. Pajarito Site (TA-18)/Comparison of Operations (continued)CAPABILITIES SWEIS ROD a 1998 OPERATIONS 1999 OPERATIONS 2000 OPERATIONS 2001 OPERATIONS 2002 OPERATIONS<strong>Nuclear</strong>MeasurementSchool (relocatedfrom CMR andrenamed. AtCMR it wascalled“NonproliferationTraining”).aNot in SWEIS ROD (waslocated in CMR).IAEA schools are at CMR.Includes replacement of the portable linac.This capability waslocated at TA-18 inyears past, but hadbeen moved to CMR.In the effort to reducethe CMR Building to aCategory 3 nuclearfacility, theseoperations were movedback to TA-18,necessitating thetransfer of additionalnuclear material to thefacility for use in theclasses.This capabilityreturned to CMR andoperated at CMRduring 2002.SWEIS Yearbook—2002
2.4.3 Operations Data for the Pajarito SiteResearch activities have remained well below those projected by the SWEIS ROD; consequently,operations data were also well below projections. The chief environmental measure of activities at the PajaritoSite is the estimated radiation dose to a hypothetical member of the public, referred to as the maximallyexposed individual. The dose has remained below the SWEIS ROD projection. The dose estimated to resultfrom 2002 activities was 1.0 millirem, compared to 28.5 millirem per year projected by the SWEIS ROD.Chemical waste generation at Pajarito Site has been below the ROD projection from 1998 through 2002.Operational data are detailed in Table 2.4.3-1.The chemical and low-level wastes generated in 2002 were shipped in 20<strong>03</strong>.Table 2.4.3-1. Pajarito Site (TA-18)/Operations DataSWEISROD1998OPERATIONS19992000OPERATIONS OPERATIONS2001OPERATIONS2002OPERATIONSPARAMETER UNITSRadioactive AirEmissionsArgon-41 a Ci/yr 1.02E+2 1.8E-1 a 4.9E-1 a 8.0E-1 a 2.9E-1 1.6E-1ExternalPenetratingRadiationmrem/yr 28.5 b 3 2.6 2.5 4.2 1.0NPDESDischargeMGY No outfalls No outfalls No outfalls No outfalls No outfalls No outfallsWastes:Chemical kg/yr 4,000 3,127 1,707 127 91 82LLW m 3 /yr 145 4 31.3 14 13 0Number of FTEs 95 d 65 dMLLW m 3 /yr 1.5 0c7.9 0 0 0TRU m 3 /yr 0 0 0 0 0 0Mixed TRU m 3 /yr 0 0 0 0 0 0Workers 70 d 70 d73 d 73 d 78 daThese values are not stack emissions. The SWEIS ROD projections are from Monte Carlo modeling. Values are fromthe first 394-foot (120-meter) radius. Other isotopes (nitrogen-13 and oxygen-15) are not shown because of very shorthalf-lives.bPage 5-116, Section 5.3.6.1, “Public Health,” of the SWEIS.cdThe 7.9 cubic meters of MLLW in CY 2000 were generated as a result of maintenance activities.The first number shown in the “SWEIS ROD” column is the actual employee count representing CY 1999 (the yearthe SWEIS ROD was published). The second number shown in the “SWEIS ROD” column is the index numberrepresenting CY 1999 (the year the SWEIS ROD was published). The number of employees for CY 1998 throughCY 2002 operations cannot be directly compared to numbers projected by the SWEIS ROD. The employee numbersprojected by the SWEIS ROD represent total workforce size and include PT<strong>LA</strong>, JCNNM, and other subcontractorpersonnel. The number of employees for 1998 through 2002 operations is routinely collected information and representsonly UC employees (regular full-time and part-time). Because the two sets of numbers (SWEIS ROD versus the newindex) do not represent the same entity, a direct comparison to numbers projected by the SWEIS ROD (see Section3.6, Socioeconomics) is not appropriate. However, because this index is going to be used in each subsequentYearbook, selecting CY 1999 as the base year establishes an index that can be compared over the ten-year windowrepresented by the SWEIS ROD.SWEIS Yearbook—2002 2-71
“Hummer”2.4.4 Cerro Grande Fire Effects at the Pajarito SiteThe Cerro Grande Fire damaged no facilities at TA-18. A Facility Recovery Plan was issued on May 22,2000. The Facility Manager implemented this plan by establishing the Facility Recovery Team to performsafety reconnaissance and condition assessment of the facility. The assessment identified no deficiencies orsignificant environmental, safety, and health issues. Specifically, there was no need for additional oversight bymanagers or subject matter experts, no need for compensatory measures for facility systems, and no need forinterim or unusual operations.The fire destroyed much of the vegetation in and around TA-18. Because TA-18 is located in a canyonbottom, post-fire flooding became a major concern and a flood contingency plan was designed for protectingpersonnel, infrastructure, and nuclear material at risk. A plan for personnel safety was issued that includedfive flood condition warnings with varying responses, including facility evacuation (Condition 5). Theinfrastructure was protected by construction of earthern berms up-canyon northwest of CASA 1 and theSHEBA building and at the bridge crossing the stream channel to CASA 2 and CASA 3. Additional measuresincluded clearing and deepening the stream channel running through the facility and installation of barriers,sandbags, and sheet piling at several locations to channel the flow of potential floods away from keystructures. Some portable structures, such as metal sheds used to store radioactive sources, were moved tohigher ground. <strong>Nuclear</strong> material at risk was protected by moving uranium solutions used for critical assemblyfuel to storage locations on higher ground. Finally, a flood retention structure was built by the Army Corps ofEngineers up Pajarito Canyon from the facility outside of Facility Management Unit 74 boundaries to protectthe facility from floods. NEPA analysis for actions taken in response to the Cerro Grande Fire, includingthe installation of certain flood and sediment retention structures, was provided by a Special EnvironmentalAnalysis (DOE 2000c).2-72SWEIS Yearbook—2002
Flood retention structure during construction2.5 Sigma Complex (TA-<strong>03</strong>)The Sigma Complex Key Facility consists of four principal buildings: the Sigma Building (<strong>03</strong>-66), theBeryllium Technology Facility (<strong>03</strong>-141), the Press Building (<strong>03</strong>-35), and the Thorium Storage Building(<strong>03</strong>-159). Primary activities are the fabrication of metallic and ceramic items, characterization of materials,and process research and development. As shown in Table 2.5-1, this Key Facility had two Category 3nuclear facilities, <strong>03</strong>-66 and <strong>03</strong>-159 identified in the SWEIS; however, in April 2000, Building <strong>03</strong>-159 wasdowngraded from a hazard category 3 nuclear facility to a radiological facility and removed from the nuclearfacilities list. In March 2001, Building <strong>03</strong>-66 was downgraded from a hazard category 3 nuclear facility andremoved from the nuclear facilities list (<strong>LA</strong>NL 2002a). In September 2001, Buildings <strong>03</strong>-35, <strong>03</strong>-66, and <strong>03</strong>-159 were placed on the radiological facility list (<strong>LA</strong>NL 2002b). Building <strong>03</strong>-141 is a Non-nuclear ModerateHazard Facility.Table 2.5-1. Sigma Buildings with <strong>Nuclear</strong> Hazard ClassificationabcdeBUILDINGDESCRIPTIONSWEISRODDOE1998 a DOE2000 b <strong>LA</strong>NL2001 c <strong>LA</strong>NL2001 d <strong>LA</strong>NL2002 eTA-<strong>03</strong>-0066 44 metric tons of depleted uranium storage 3 3 3TA-<strong>03</strong>-0159 thorium storage 3 3DOE/<strong>LA</strong>NL list of Los Alamos <strong>National</strong> Laboratory <strong>Nuclear</strong> Facilities (DOE 1998a)DOE/<strong>LA</strong>NL list of Los Alamos <strong>National</strong> Laboratory <strong>Nuclear</strong> Facilities (DOE 2000a)DOE/<strong>LA</strong>NL list of Los Alamos <strong>National</strong> Laboratory <strong>Nuclear</strong> Facilities (<strong>LA</strong>NL 2001a)DOE/<strong>LA</strong>NL list of Los Alamos <strong>National</strong> Laboratory <strong>Nuclear</strong> Facilities (<strong>LA</strong>NL 2001b)DOE/<strong>LA</strong>NL list of Los Alamos <strong>National</strong> Laboratory <strong>Nuclear</strong> Facilities (<strong>LA</strong>NL 2002a)SWEIS Yearbook—2002 2-73
2.5.1 Construction and Modifications at the Sigma ComplexProjected: The SWEIS projected significant facility changes for the Sigma Building itself and completionof the conversion of the Rolling Mill Building (TA-<strong>03</strong>-141) into the Beryllium Technology Facility. The fiveupgrades planned for the Sigma Building were• replacement of graphite collection systems,• modification of the industrial drain system,• replacement of electrical components,• roof replacement, and• seismic upgrades.In addition, the ROD projected completion of the development of the Beryllium Technology Facility (DOE1993a).Actual: Three of five planned upgrades of the Sigma Building are done, one is essentially done, and oneremains undone. They are• replacement of graphite collection systems–completed in 1998,• modification of the industrial drain system–completed in 1999,• replacement of electrical components–essentially completed in 2000; however, add-on assignmentswill continue,• roof replacement–most of the roof was replaced in 1998 and 1999; however, additional work needsto be done, and• seismic upgrades–not started.Construction of the Beryllium Technology Facility, formerly known as the Rolling Mill Building, wascompleted during 1999. The Beryllium Technology Facility, a state-of-the-art beryllium processing facility,has 16,000 square feet of floor space, of which 13,000 are used for beryllium operations. The remaining3,000 square feet will be used for general metallurgical activities. The mission of the new facility is tomaintain and enhance the beryllium technology base that exists at <strong>LA</strong>NL and to establish the capability forfabrication of beryllium powder components. Research will also be conducted at the Beryllium TechnologyFacility and will include energy- and weapons-related uses of beryllium metal and beryllium oxide. Asdiscussed in Section 2.8, Machine Shops, beryllium equipment was moved from the shops into the BerylliumTechnology Facility in stages during 2000 and 2001. The authorization to begin operations in the BerylliumTechnology Facility was granted by DOE in January 2001.Table 2.5.1-1 indicates the construction and modifications that have occurred at the Sigma Complex.Sigma Building2-74SWEIS Yearbook—2002
Table 2.5.1-1. Sigma Complex Construction and ModificationsSWEIS RODPROJECTIONSigma Building Upgrades• Replacement of graphitecollection systems• Modification of theindustrial drain system• Replacement of electricalcomponents1998YEARBOOKCompleted in 1998.Completed in 1998.ACTUAL CONSTRUCTION AND MODIFICATION1999YEARBOOK2000YEARBOOK2001YEARBOOKWorked on. Worked on. Completed. Additional workbeing done.2002YEARBOOKAdditionalwork beingdone.Additionalwork needed.• Roof replacement Worked on; largelycompleted.• Seismic upgrades Not started. Not started. Not started. Not started. Not started.Beryllium TechnologyReconfigurationFacilitycompleted.Decontamination,decommissioning,and reconfigurationof Rolling MillBuilding (DOE1993a).Berylliumequipmentmoved in stagesfrom Building<strong>03</strong>-39.DOEauthorization tobeginoperations.2.5.2 Operations at the Sigma ComplexThe SWEIS identified three capabilities for the Sigma Complex. No new capabilities have been added,and none has been deleted. As indicated in Table 2.5.2-1, activity levels for all capabilities during the 1998 to2002 timeframe were less than levels projected by the SWEIS ROD.2.5.3 Operations Data for the Sigma ComplexLevels of research and operations were less than those projected by the SWEIS ROD; consequently,operations data were also below projections. Waste volumes and NPDES discharge volumes were all lowerthan projected by the SWEIS ROD except for chemical waste generated in 2002. Table 2.5.3-1 providesdetails.2.5.4 Cerro Grande Fire Effects at the Sigma ComplexCerro Grande Fire effects on the Sigma Key Facility and its associated operations were minimal. Programsat Sigma did suffer downtime and loss of productivity during the evacuation, initial damage assessment,and recovery and reentry phases. No direct fire damage occurred and recovery was limited to cleaning orreplacement of air system filters.SWEIS Yearbook—2002 2-75
2-76SWEIS Yearbook—2002Table 2.5.2-1. Sigma Complex (TA-<strong>03</strong>)/Comparison of OperationsCAPABILITY SWEIS ROD a 1998 YEARBOOK 1999 YEARBOOK 2000 YEARBOOK 2001 YEARBOOK 2002 YEARBOOKResearch andDevelopment onMaterialsFabrication,Coating, Joining,and ProcessingCharacterizationof MaterialsFabrication ofMetallic andCeramic ItemsMaintain and enhance capability to Capabilityfabricate items from metals, ceramics, maintained andsalts, beryllium, enriched uranium, enhanced, asdepleted uranium, and other uranium projected.isotope mixtures including casting,forming, machining, polishing, coating,and joining.Maintain and enhance research anddevelopment activities on properties ofceramics, oxides, silicides, composites,and high-temperature materials.Characterize components foraccelerator production of tritium.Analyze up to 36 tritium reservoirs peryear.Develop library of aged non-SNMmaterials from stockpiled weapons anddevelop techniques to test and predictchanges. Store and characterize up to2,500 non-SNM component samples,including uranium.Fabricate stainless steel and berylliumcomponents for about 80 pits per year.Fabricate up to 200 tritium reservoirsper year.Fabricate components for up to 50secondaries per year.Fabricate nonnuclear components forresearch and development: about 100major hydrotests and 50 joint testassemblies per year.Modest increase inresearch anddevelopment. Totalsof 255 assignmentsand 1,200 specimenswere characterized.Total of 36 tritiumreservoirs analyzed.Less than 2,500 non-SNM componentsamples, includinguranium, stored inlibrary.Fabricated twodevelopment pitsfrom existingcomponents.Total of 36reservoirsfabricated.Evaluated less than50 components.Fabricated 10secondaries.Fabricatedcomponents for lessthan 100 majorhydrotests and forless than 50 jointtest assemblies.Capabilitymaintained andenhanced, asprojected.Modest increase inresearch anddevelopment. Totalsof 248 assignmentsand 1,300 specimenswere characterized.Less than 36 tritiumreservoirs analyzed.Approximately 500non-SNM materialssamples and 500 non-SNM componentsamples stored inlibrary.No development pitsfabricated.Less than 200reservoirs fabricated.Fabricatedcomponents for lessthan 50 secondaries.Fabricatedcomponents for lessthan 100 majorhydrotests and forless than 50 joint testassemblies.Capabilitymaintained andenhanced, asprojected.Totals of 227assignments and1,070 specimenswere characterized.Total of 3 tritiumreservoirs analyzed.Approximately 1,000non-SNM materialssamples and 1,000non-SNM componentsamples stored inlibrary.No development pitsfabricated.Less than 25reservoirs fabricated.Fabricatedcomponents for lessthan 50 secondaries.Fabricatedcomponents for lessthan 100 majorhydrotests and forless than 50 joint testassemblies.Capability maintainedand enhanced, asprojected.Totals of 184assignments and 961specimens werecharacterized.Capabilitymaintained andenhanced, asprojected.Totals of 153assignments and759 specimens werecharacterized.Activity transferredActivity transferred to2.7.2-1.) b 2.7.2-1.) bTFF (See Table to TFF (See TableApproximately 500non-SNM materialssamples and 500 non-SNM componentsamples stored inlibrary.No development pitsfabricated.Less than 25reservoirs fabricated.Fabricatedcomponents for lessthan 50 secondaries.Fabricatedcomponents for lessthan 100 majorhydrotests and for lessthan 50 joint testassemblies.Approximately 500non-SNM materialssamples and 500non-SNMcomponent samplesstored in library.No developmentpits fabricated.Less than 25reservoirsfabricated.Fabricatedcomponents for lessthan 50 secondaries.Fabricatedcomponents for lessthan 100 majorhydrotests and forless than 50 jointtest assemblies.
SWEIS Yearbook—2002 2-77Table 2.5.2-1. Sigma Complex (TA-<strong>03</strong>)/Comparison of Operations (continued)abCAPABILITY SWEIS ROD a 1998 YEARBOOK 1999 YEARBOOK 2000 YEARBOOK 2001 YEARBOOK 2002 YEARBOOKFabricate beryllium targets. None produced. None produced. None produced. Provided material forthe production ofInertial ConfinementFusion targets but didnot fabricate anytargets.Fabricate targets and other componentsfor accelerator production of tritiumresearch.One radio-frequencycavity produced.Three radiofrequencycavitieswere produced.Seven radiofrequencycavitieswere polished. Nonewere produced.Two radio-frequencycavities were polished.None were produced.Fabricate test storage containers fornuclear materials stabilization.None produced. None produced. None produced. Produced 50containers.Fabricate nonnuclear (stainless steel None produced. Fabricated Less than 10 stainlessand beryllium) components for up to 20nonnuclear (stainless steel and nopit rebuilds per year.steel and beryllium) berylliumcomponents for up to components20 pit rebuilds per produced.year.Includes Sigma Building renovation and modifications for Beryllium Technology Facility.The SWEIS indicated that this activity would also be accomplished at TFF.Less than 10 stainlesssteel and no berylliumcomponents produced.Provided materialfor the productionof InertialConfinement Fusiontargets but did notfabricate anytargets.Six radio-frequencycavities werepolished. Nonewere produced.Produced 50containers.Less than 10stainless steel andno berylliumcomponentsproduced.
Table 2.5.3-1. Sigma Complex (TA-<strong>03</strong>)/Operations DataPARAMETER UNITSSWEISRODRadioactive AirEmissions: aAmericium-241 Ci/yr Notprojected1998YEARBOOK1999YEARBOOK2000YEARBOOK2001YEARBOOK2002OPERATIONS9.30E-09 Not Detected Not Measured b Not Measured Not MeasuredUranium-234 Ci/yr 6.60E-5 1.30E-09 1.2E-06 Not Measured b Not Measured Not MeasuredUranium-235 Ci/yr Not Not Detected 4.5E-08 Not Measured b Not Measured Not MeasuredprojectedUranium-238 Ci/yr 1.80E-3 6.20E-09 1.3E-08 Not Measured b Not Measured Not MeasuredThorium-230 Ci/yr Not Not Measured 6.4E-09 Not Measured b Not Measured Not MeasuredprojectedNPDESDischarge:Total Discharges MGY 7.3 12.7 5.77 3.9 0.05 2.0040<strong>03</strong>A–022 MGY 4.4 12.7 5.77 3.9 c 0.05 2.0040<strong>03</strong>A–024 MGY 2.9 No discharge No discharge 0 0 0Wastes:Chemical kg/yr 10,000 22,489 3,208 3,672 1,265 32,397 dLLW m 3 /yr 960 3 61 52 0.5 202MLLW m 3 /yr 4 0 0.3 0 1.3 0TRU m 3 /yr 0 0 0 0 0 0Mixed TRU m 3 /yr 0 0 0 0 0 0Number of FTEs 284 e 110 e 101 eWorkers 101 e 99 e 94 e 105 eaDuring 1999, only emissions from TA-<strong>03</strong>-35 were measured using stack sampling. Potential emissions from otherSigma facilities were sufficiently small that measurement systems were not necessary to meet regulatory or facilityrequirements.bStack monitoring at Sigma was discontinued early in 2000. This decision was made because the potential emissionsfrom the monitored stack were sufficiently low that stack monitoring was no longer warranted for compliance withU.S. Environmental Protection Agency (EPA) or DOE regulations. Therefore, no emissions from monitoring data areavailable.cThis outfall flowed all four quarters during CY 2000.dA significant difference in the amount of chemical waste generated from that projected in the SWEIS is due tostructure rehabilitation and disposal of equipment and other material debris resulting from bringing the Press Buildingback on-line.eThe first number shown in the “SWEIS ROD” column is the actual employee count representing CY 1999 (the yearthe SWEIS ROD was published). The second number shown in the “SWEIS ROD” column is the index numberrepresenting CY 1999 (the year the SWEIS ROD was published). The number of employees for CY 1998 throughCY 2002 operations cannot be directly compared to numbers projected by the SWEIS ROD. The employee numbersprojected by the SWEIS ROD represent total workforce size and include PT<strong>LA</strong>, JCNNM, and other subcontractorpersonnel. The number of employees for 1998 through 2002 operations is routinely collected information and representsonly UC employees (regular full-time and part-time). Because the two sets of numbers (SWEIS ROD versus the newindex) do not represent the same entity, a direct comparison to numbers projected by the SWEIS ROD (see Section3.6, Socioeconomics) is not appropriate. However, because this index is going to be used in each subsequentYearbook, selecting CY 1999 as the base year establishes an index that can be compared over the ten-year windowrepresented by the SWEIS ROD.2-78SWEIS Yearbook—2002
2.6 Materials Science Laboratory (TA-<strong>03</strong>)The MSL Key Facility is a single laboratory building (3-1698) containing 27 labs, 60 offices, 21 materialsresearch areas, and support rooms. The building, a two-story structure with approximately 55,000 square feetof floor space, was first opened in November 1993. Activities are all related to research and development ofmaterials science. In 1998, 1999, and 2000, this Key Facility was categorized as a Low Hazard nonnuclearfacility. In September 2001, MSL was placed on the Radiological Facility List (<strong>LA</strong>NL 2001c) and remainedon the list in 2002 (<strong>LA</strong>NL 2002b).2.6.1 Construction and Modifications at the Materials Science LaboratoryProjected: The SWEIS identified that completion of the top floor of the MSL was planned and wasincluded in an environmental assessment (DOE 1991), but was not funded.Actual: To date, the completion of the top floor of the MSL remains unscheduled and unfunded.Table 2.6.1-1 indicates the construction and modifications that were planned and have not occurred at theMSL.Table 2.6.1-1. MSL Construction and ModificationsACTUAL CONSTRUCTION AND MODIFICATIONSWEIS RODPROJECTIONCompletion of topfloor of MSL1998YEARBOOKUnscheduled andnot funded1999YEARBOOKUnscheduled andnot funded2000YEARBOOKUnscheduledand not funded2001YEARBOOKUnscheduledand not funded2002YEARBOOKUnscheduled andnot funded2.6.2 Operations at the Materials Science LaboratoryThe SWEIS identified four major types of experimentation at MSL: materials processing, mechanicalbehavior in extreme environments, advanced materials development, and materials characterization. Nonew capabilities have been added, and none has been deleted. In 2001, MSL conducted operations at levelsapproximating those projected by the SWEIS ROD.During the 1998–2002 timeframe, the approximate total number of researchers and support staff atMSL has been fairly consistent with 105 in 1998 and 1999, 109 in 2000 and 2001, and 102 in 2002. Thesenumbers are approximately 30 percent more than the 82 personnel projected by the SWEIS ROD. 5 (Theprimary measurement of activity for this facility is the number of scientists doing research.) This increase wasaccomplished by having researchers share offices and laboratories and reflects the high value placed on theMSL because of its quality lab space. Table 2.6.2-1 compares 1998 through 2002 operations to projectionsmade by the SWEIS ROD.5 This number should not be confused with the FTE index shown in Table 2.6.3-1 (59 FTEs) as the two numbers represent different populations ofindividuals. The 109 total researchers represent students, temporary employees, and visiting staff from other institutions. The 59 FTEs represents onlyregular full-time and part-time <strong>LA</strong>NL staff.SWEIS Yearbook—2002 2-79
2-80Table 2.6.2-1. MSL (TA-<strong>03</strong>)/Comparison of OperationsCAPABILITY SWEIS ROD a 1998 YEARBOOK 1999 YEARBOOK 2000 YEARBOOK 2001 YEARBOOK 2002 YEARBOOKMaterials Processing Maintain seven research capabilitiesat levels identified duringpreparation of the SWEIS:Wet chemistry• Thermomechanical processing• Microwave processing• Heavy equipment materials• Single crystal growth• Amorphous alloys• Powder processingExpand materialssynthesis/processing to develop coldmock-up of weapons assembly andprocessing.Expand materialssynthesis/processing to developenvironmental and wastetechnologies.Unlike projections,microwaveprocessing was notperformed, andmaterialssynthesis/processingwas not expanded.The other fivecapabilities weremaintained asprojected by theSWEIS ROD.These capabilitieswere maintained asprojected by theSWEIS ROD.These capabilitieswere maintained asprojected by theSWEIS ROD.These capabilitieswere maintained asprojected by theSWEIS ROD.These capabilitieswere maintained asprojected by theSWEIS ROD.Synthesis/processingof cold mock-up ofweapons assemblyand processing wasexpanded in 2002.Synthesis/processingof environmental andwaste technologieswas expanded in2002.SWEIS Yearbook—2002
SWEIS Yearbook—2002 2-81Table 2.6.2-1. MSL (TA-<strong>03</strong>)/Comparison of Operations (continued)CAPABILITY SWEIS ROD a 1998 YEARBOOK 1999 YEARBOOK 2000 YEARBOOK 2001 YEARBOOK 2002 YEARBOOKMechanicalBehavior in ExtremeEnvironmentMaintain two research capabilities atlevelsidentified during preparationof the SWEIS:• Mechanical testing• Fabrication and assemblyExpand dynamic testing to includeresearch and development for theaging of weapons materials.Develop a new research capability(machining technology).Mechanical testing Mechanical testingwas maintained as was maintained asprojected, and dynamictesting was into materials failureprojected. Researchexpanded as projected. and fractureFabrication and continued.assembly was notperformed, however.A new researchcapability was developedfor research intomaterials failure andfracture.Mechanical testingwas maintained asprojected. Researchinto materials failureand fracturecontinued.Items weremaintained andprocesses improved.New capabilitiesdevelopment andprocess improvementis an ongoing effort.These two capabilitieswere maintained asprojected by theSWEIS ROD andadditional capabilitieswere expanded asprojected by theSWEIS ROD. Fabrication,assembly andprototype experimentswere expanded in2002.Dynamic testing forthe aging of weaponsmaterials wasexpanded in 2002.A new machiningresearch capabilitywas developed in2002. It includes:• machining andmechanicalfabrication;• physical energymeasurements atcryogenic, lowtemperatures, highmagnetic fields andhigh pressure; and• lab-scale fluid dynamicsmeasurements.
2-82SWEIS Yearbook—2002Table 2.6.2-1. MSL (TA-<strong>03</strong>)/Comparison of Operations (continued)CAPABILITY SWEIS ROD a 1998 YEARBOOK 1999 YEARBOOK 2000 YEARBOOK 2001 YEARBOOK 2002 YEARBOOKAdvanced MaterialsDevelopmentMaterialsCharacterizationaMaintain four research capabilitiesat levels identified duringpreparation of the SWEIS:• New materials• Synthesis and characterization• Ceramics• SuperconductorsMaintain four research capabilitiesat levels identified duringpreparation of the SWEIS:• Surface science chemistry• X-ray• Optical metallography• SpectroscopyExpand corrosion characterizationto develop surface modificationtechnology.Expand electron microscopy todevelop plasma source ionimplantation.Includes completion of the second floor of MSL.Three capabilitieswere maintained asprojected by theSWEIS ROD.Synthesis andcharacterization wasnot performed,however.This capability wasmaintained asprojected by theSWEIS ROD.As projected in the MaterialsSWEIS ROD, four characterizationcapabilities were continued to bemaintained at 1995 maintained.levels, and corrosioncharacterization wasexpanded to developsurface modificationtechnology. Electronmicroscopy was alsoexpanded, but plasmasource ionimplantation was notdeveloped.This capability wasmaintained asprojected by theSWEIS ROD.Materialscharacterizationcontinued to bemaintained.This capability wasmaintained asprojected by theSWEIS ROD.These processes areexpanded andimproved upon on acontinual basis.This capability wasmaintained asprojected by theSWEIS ROD. TheSuperconductorscapability has beenexpanded to include:• Thin Film Depositionand• Electropolishing.These processes areexpanded andimproved upon on acontinual basis.Optical metalographyhas been expanded toinclude ion analysis.Spectroscopy capabilitieshave beenexpanded to includethe Ion Beam MaterialsScienceLaboratory.Corrosion characterizationhas beenexpanded to developsurface modificationtechnology.Electron microscopyhas been expanded todevelop plasmasource ionimplantation.
2.6.3 Operations Data for the Materials Science LaboratoryThe overall size of the MSL workforce has increased from about 57 workers in 1998 to about 61 in 2002(regular part-time and full-time <strong>LA</strong>NL employees listed in Table 2.6.3-1). Operational effects have beennormal relative to SWEIS ROD projections. Generally, waste quantities have been lower than projectedby the SWEIS ROD. An exception on chemical waste quantities occurred during 2000 when a lab in C-Wing was remodeled and construction and demolition debris (previously identified as industrial waste) wasgenerated. Industrial solid waste (251 kilograms in 2001 not identified further) is nonhazardous, may bedisposed in county landfills, and does not represent a threat to local environs. Radioactive air emissionscontinue to be negligible and therefore were not measured. Table 2.6.3-1 provides details.Table 2.6.3-1. MSL (TA-<strong>03</strong>)/Operations DataPARAMETER UNITSSWEISROD1998YEARBOOK1999YEARBOOK2000YEARBOOK2001YEARBOOK2002YEARBOOKRadioactive Air Ci/yr Negligible Not measured Not measured Not measured Not measured Not measuredEmissionsNPDES MGY No outfalls No outfalls No outfalls No outfalls No outfalls No outfallsDischargeVolumeWastes:Chemical kg/yr 600 244 154 881 255 149LLW m 3 /yr 0 0 0 0 0 0MLLW m 3 /yr 0 0 0 0 0 0TRU m 3 /yr 0 0 0 0 0 0Mixed TRU m 3 /yr 0 0 0 0 0 0Number of FTEs 82 a 57 a 57 aWorkers 57 a 59 a 60 a 61 aaThe number shown in the “SWEIS ROD” column is the index number representing CY 1999 (the year the SWEISROD was published). The number of employees for CYs 2000, 2001, and 2002 operations cannot be directly comparedto numbers projected by the SWEIS ROD. The employee numbers projected by the SWEIS ROD represent totalworkforce size and include PT<strong>LA</strong>, JCNNM, and other subcontractor personnel. The number of employees for CYs 2000,2001, and 2002 operations is routinely collected information and represents only UC employees (regular full-timeand part-time). Because the two sets of numbers (SWEIS ROD versus the new index) do not represent the sameentity, a direct comparison to numbers projected by the SWEIS ROD (see Section 3.6, Socioeconomics) is notappropriate. However, because this index is going to be used in each subsequent Yearbook, selecting CY 1999 as thebase year establishes an index that can be compared over the ten-year window represented by the SWEIS ROD.Materials Science LaboratorySWEIS Yearbook—2002 2-83
2.6.4 Cerro Grande Fire Effects at the Materials Science LaboratoryCerro Grande Fire effects on MSL and its associated operations were minimal. Programs at MSL suffereddowntime and loss of productivity during the evacuation, initial damage assessment, and recovery and reentryphases. No direct damage occurred and recovery was limited to cleaning or replacement of air system filters.2.7 Target Fabrication Facility (TA-35)The TFF is a two-story building (35-213) housing activities related to weapons production and laser fusionresearch. This Key Facility is categorized as a Low Hazard nonnuclear facility. Exhaust air from processequipment is filtered prior to exhaust to the atmosphere. Sanitary wastes are piped to the <strong>LA</strong>NL sewagefacility at TA-46, and radioactive liquid wastes are piped to the treatment facility at TA-50.2.7.1 Construction and Modifications at the Target Fabrication FacilityProjected: The ROD did not project any facility changes through 2005.Actual: In 1998, process discharges from Outfall 04A-127 were rerouted to the sewage facility at TA-46,and the outfall was eliminated from the NPDES permit (DOE 1996f). There were no other significant facilityadditions or modifications from 1996 through 2002.Table 2.7.1-1 indicates the construction and modifications at the TFF.Table 2.7.1-1. TFF Construction and ModificationsSWEIS RODPROJECTIONNo changesthrough 20051998YEARBOOKOutfall 04A-127eliminated withsewage reroutedto TA-46 (DOE1996f).ACTUAL CONSTRUCTION AND MODIFICATION1999YEARBOOK2000YEARBOOK2001YEARBOOK2002YEARBOOK2.7.2 Operations at the Target Fabrication FacilityThe SWEIS identified three capabilities for the TFF Key Facility. The primary measurement of activityfor this facility is production of targets for research and testing (laser and physics testing). In the 1998–2002 timeframe, the number of targets and specialized components fabricated for testing purposes wasconsistently less than the 6,100 targets per year projected by the SWEIS ROD. As seen in the Table 2.7.2-1,other operations at the TFF were also below levels projected by the SWEIS ROD. The Characterization ofMaterials capability has been added to Table 2.7.2-1. This was a capability identified in the SWEIS for theTFF and Sigma Key Facilities but, before the 2001 Yearbook, was only listed for the Sigma Key Facility.2.7.3 Operations Data for the Target Fabrication FacilityTFF activity levels are primarily determined by funding from fusion, energy, and other research-orientedprograms, as well as funding from some defense-related programs. These programs, and hence operationsat TFF, were at levels similar to those levels identified during preparation of the SWEIS and below levelsprojected by the SWEIS ROD. This summary is supported by the current workforce and by the 1998–2002waste volumes, which were less than projected. Table 2.7.3-1 details operations data for 1998–2002.2-84SWEIS Yearbook—2002
SWEIS Yearbook—2002 2-85Table 2.7.2-1. TFF (TA-35)/Comparison of OperationsCAPABILITY SWEIS ROD 1998 YEARBOOK 1999 YEARBOOK 2000 YEARBOOK 2001 YEARBOOK 2002 YEARBOOKPrecisionMachining andTargetFabricationPolymerSynthesisProvide targets andspecialized components for~6,100 laser and physicstests per year, including a20% increase over levelsidentified during preparationof the SWEIS for highexplosivepulsed-powertarget operations, andincluding ~100 high-energydensityphysics tests.Produce polymers fortargets and specializedcomponents for ~6,100 laserand physics tests per year,including a 20% increaseover levels identified duringpreparation of the SWEISfor high-explosive pulsedpowertarget operations, andincluding ~100 high-energydensityphysics tests.Provided targets andspecializedcomponents for ~1,200tests. Supported highexplosivepulsedpowertests at 1995levels. Supported ~25high-energy-densityphysics tests.Produced polymers fortargets and specializedcomponents for ~600tests. Supported highexplosivepulsedpowertests at 1995levels. Supported ~15high-energy-densityphysics tests.Provided targets andspecialized componentsfor ~1,200 tests.Supported highexplosivepulsed-powertests at 1995 levels.Supported ~25 highenergy-densityphysicstests.Produced polymers fortargets and specializedcomponents for ~600tests. Supported highexplosivepulsed-powertests at 1995 levels.Supported ~20 highenergy-densityphysicstests.Provided targets andspecialized componentsfor ~1,300 tests.Supported highexplosivepulsed-powertests at levels identifiedduring preparation ofthe SWEIS; supported~seven high-energydensityphysics tests.Produced polymers fortargets and specializedcomponents for ~600tests. Supported highexplosivepulsed-powertests at levels identifiedduring preparation ofthe SWEIS; supported~seven high-energydensityphysics tests.Provided targets andspecialized componentsfor ~1,600 tests. Didnot support highexplosivepulsed-powertests at levels identifiedduring preparation ofthe SWEIS; however,did support electricalhigh-energy-densityhydrodynamics.Supported ~seven highenergy-densityphysicstests.Produced polymers fortargets and specializedcomponents for ~800tests. Did not supporthigh-explosive pulsedpowertests at levelsidentified duringpreparation of theSWEIS; however, didsupport electrical highenergy-densityhydrodynamics.Supported ~seven highenergy-densityphysicstests.Provided targets andspecialized componentsfor ~1,600 tests. Did notsupport high-explosivepulsed-power tests atlevels identified duringpreparation of theSWEIS; however, didsupport electrical highenergy-densityhydrodynamics.Supported ~18 highenergy-densityphysicstests.Produced polymers fortargets and specializedcomponents for ~800tests. Did not supporthigh-explosive pulsedpowertests at levelsidentified duringpreparation of theSWEIS; however, didsupport electrical highenergy-densityhydrodynamics.Supported ~18 highenergy-densityphysicstests.
2-86Table 2.7.2-1. TFF (TA-35)/Comparison of Operations (continued)CAPABILITY SWEIS ROD 1998 YEARBOOK 1999 YEARBOOK 2000 YEARBOOK 2001 YEARBOOK 2002 YEARBOOKChemical andPhysical VaporDepositionCoat targets andspecialized components for~6,100 laser and physicstests per year, including a20% increase over levelsidentified during preparationof the SWEIS for highexplosivepulsed-powertarget operations, including~100 high-energy-densityphysics tests, and includingsupport for pit rebuildoperations at twice thelevels identified duringpreparation of the SWEIS.Characterization Analyze up to 36 tritiumof Materials a reservoirs per year. aaCoated targets andspecializedcomponents for ~600tests. Supported highexplosivepulsedpowertests at 1995levels. Supported ~25high-energy-densityphysics tests. Providedno support for pitrebuild operations.Coated targets andspecialized componentsfor ~600 tests. Supportedhigh-explosive pulsedpowertests at 1995levels. Supported ~25high-energy-densityphysics tests. Providedcoatings for pit rebuildoperations.Coated targets andspecialized componentsfor ~600 tests.Supported highexplosivepulsed-powertests at levels identifiedduring preparation ofthe SWEIS; supported~seven high-energydensityphysics tests.Provided coatings forpit rebuild operations.The SWEIS indicated that this activity would be accomplished at TFF as well as the Sigma Complex. See Table 2.5.2-1.Coated targets andspecialized componentsfor ~800 tests. Did notsupport high-explosivepulsed-power tests atlevels identified duringpreparation of theSWEIS; however, didsupport electrical highenergy-densityhydrodynamics.Supported ~seven highenergy-densityphysicstests. Provided coatingsfor pit rebuildoperations.Less than 36 tritiumreservoirs analyzed.Coated targets andspecialized componentsfor ~800 tests. Did notsupport high-explosivepulsed-power tests atlevels identified duringpreparation of theSWEIS; however, didsupport electrical highenergy-densityhydrodynamics.Supported ~18 highenergy-densityphysicstests. Provided coatingsfor pit rebuildoperations.Less than 36 tritiumreservoirs analyzed.SWEIS Yearbook—2002
Table 2.7.3-1. TFF (TA-35)/Operations DataPARAMETER UNITSSWEISROD1998YEARBOOK1999YEARBOOK2000YEARBOOK2001YEARBOOK2002YEARBOOKRadiological Air Ci/yr Negligible Not measured Not measured a Not measured b Not measured b Not measured bEmissionsNPDESDischarge:4A-127 MGY 0 Eliminated c Eliminated Eliminated Eliminated EliminatedWastes:Chemical kg/yr 3,800 2,827 594 1,062 668 904LLW m 3 /yr 10 0 0 0 0.2 0.4MLLW m 3 /yr 0.4 0 0 0 0 0TRU m 3 /yr 0 0 0 0 0 0Mixed TRU m 3 /yr 0 0 0 0 0 0Number of FTEs 98 d 57 d 54 dWorkers 54 d 52 d 54 d 53 dabcdPotential emissions during 1999 were sufficiently small that measurement systems were not necessary to meetregulatory or facility requirements.The emissions continue to be sufficiently low that monitoring is not required.Outfall eliminated before 1999: 04A-127 (TA-35).The first number shown in the “SWEIS ROD” column is the actual employee count representing CY 1999 (the yearthe SWEIS ROD was published). The second number shown in the “SWEIS ROD” column is the index numberrepresenting CY 1999 (the year the SWEIS ROD was published). The number of employees for CY 1998 throughCY 2002 operations cannot be directly compared to numbers projected by the SWEIS ROD. The employee numbersprojected by the SWEIS ROD represent total workforce size and include PT<strong>LA</strong>, JCNNM, and other subcontractorpersonnel. The number of employees for 1998 through 2002 operations is routinely collected information and representsonly UC employees (regular full-time and part-time). Because the two sets of numbers (SWEIS ROD versus the newindex) do not represent the same entity, a direct comparison to numbers projected by the SWEIS ROD (see Section3.6, Socioeconomics) is not appropriate. However, because this index is going to be used in each subsequentYearbook, selecting CY 1999 as the base year establishes an index that can be compared over the ten-year windowrepresented by the SWEIS ROD.2.7.4 Cerro Grande Fire Effects at the Target Fabrication FacilityPrograms at TFF suffered substantial downtime and loss of productivity during the evacuation and initialdamage assessment, recovery, and reentry phases. Lost time because of the fire resulted in the TFF beingavailable only about 93 percent of the planned operational days in 2000 while the target assembly area wasonly available about 88 percent. No direct fire damage occurred; however, some equipment was damagedbecause of fluctuating power and loss of liquid nitrogen cooling. Additionally, smoke damage to work areasand air handling systems was sufficient to prevent use of the Target Assembly area. The Target AssemblyTeam relocated to Sandia <strong>National</strong> Laboratories for a two-week period while their work areas and air handlingsystems were cleaned and repaired.SWEIS Yearbook—2002 2-87
Inspection of target component2.8 Machine Shops (TA-<strong>03</strong>)The Machine Shops Key Facility consists of two buildings, the Nonhazardous Materials Machine Shop(Building <strong>03</strong>-39) and the Radiological Hazardous Materials Machine Shop (Building <strong>03</strong>-102). Both buildingsare located within the same exclusion area. Activities consist of machining, welding, and assembly ofvarious materials in support of major <strong>LA</strong>NL programs and projects, principally those related to weaponsmanufacturing. In September 2001, Building <strong>03</strong>-102 was placed on the Radiological Facility List (<strong>LA</strong>NL2001c) and remained on the radiological facility list in 2002 (<strong>LA</strong>NL 2002b).2.8.1 Construction and Modifications at the Machine ShopsProjected: The SWEIS ROD projected no new construction or major modifications to the shopsActual: There were two facility modifications over the three-year period 1996–1998 at Building <strong>03</strong>-39. Inthe center wing of Building <strong>03</strong>-39, Room 26 was put to use as the central weapons information center for theInformation and Records Management Group of the Computing, Information, and Communications Division.Room 26 had been empty (DOE 1996g). Additionally, the waste machine coolant generated by the Building<strong>03</strong>-39 shops was reduced in 1998 (<strong>LA</strong>NL 1998d). In 1999, Building <strong>03</strong>-39 was re-roofed by installing asingle-ply membrane over the existing roof. In 2001, both Buildings <strong>03</strong>-39 and -102 upgraded securitycontainers to meet life safety code standards. Building <strong>03</strong>-102 upgraded both the ventilation and electricalsystems in 1998. In 2002, the Building <strong>03</strong>-66 thermal treatment of depleted uranium parts was duplicated atBuilding <strong>03</strong>-102.2-88SWEIS Yearbook—2002
Consistent with SWEIS ROD projections, there were no new construction or major modifications tothe shops in 1999, 2000, 2001, or 2002. Beryllium operations conducted in Room 16 in the north wing ofBuilding <strong>03</strong>-39 were completely moved to Building <strong>03</strong>-141, the Beryllium Technology Facility (part ofthe Sigma Key Facility). This move was started in 2000 and was, for the most part, completed in 2001.Remaining equipment and materials will be relocated prior to decontamination and decommissioning. Table2.8.1-1 indicates the construction and modifications at the Machine Shops.Table 2.8.1-1. Machine Shops Construction and ModificationsSWEIS RODPROJECTIONNo new constructionor modificationsprojected1998YEARBOOKBuilding <strong>03</strong>-39,Room 26 becamecentral weaponsinformation center(DOE 1996g).Upgraded andreplaced ventilationsystem in Building<strong>03</strong>-102 (<strong>LA</strong>NL1996a).Waste machinecoolant volumereduction at Building<strong>03</strong>-39 (<strong>LA</strong>NL1998d).ACTUAL CONSTRUCTION AND MODIFICATION1999YEARBOOKRe-roofed Building<strong>03</strong>-39 (<strong>LA</strong>NL1998b).Electrical upgradesat Building <strong>03</strong>-102(<strong>LA</strong>NL 1998c).2000YEARBOOKBerylliumequipmentmoved toBeryllium Tech.Facilityfrom Building<strong>03</strong>-39.2001YEARBOOKBerylliumequipmentmoved toBeryllium Tech.Facilityfrom Building<strong>03</strong>-39.<strong>Security</strong> containerfire and lightingupgrades atBuildings <strong>03</strong>-39and <strong>03</strong>-102(<strong>LA</strong>NL 2001o).2002YEARBOOKDuplicateTA-<strong>03</strong>-66 heattreating capabilityat Building <strong>03</strong>-102(<strong>LA</strong>NL 2002h).SWEIS Yearbook—2002 2-89
2.8.2 Operations at the Machine ShopsAs shown in Table 2.8.2-1, the SWEIS identified three capabilities at the shops. These same threecapabilities continue to be maintained. No new capabilities have been added to this Key Facility. Allactivities during the 1998–2002 timeframe occurred at levels well below those projected by the SWEIS ROD.The workload at the Shops is directly linked to research and development and production requirements.2.8.3 Operations Data for the Machine ShopsSince activities were well below projections by the SWEIS ROD, so too were operations data. The highestchemical waste generation was 26,474 kilograms generated in 2001, compared to a ROD projection of474,000 kilograms per year. Table 2.8.3-1 provides details.2.8.4 Cerro Grande Fire Effects at the Machine ShopsCerro Grande Fire effects on the Machine Shops and associated operations were minimal. Programs at theMachine Shops suffered downtime and loss of productivity during the evacuation, initial damage assessment,and recovery and reentry phases.Machine Shop operations2-90SWEIS Yearbook—2002
SWEIS Yearbook—2002 2-91Table 2.8.2-1. Machine Shops (TA-<strong>03</strong>)/Comparison of OperationsCAPABILITY SWEIS ROD 1998 YEARBOOK 1999 YEARBOOK 2000 YEARBOOK 2001 YEARBOOK 2002 YEARBOOKFabrication ofSpecialty ComponentsFabrication UtilizingUnique MaterialsDimensionalInspection ofFabricatedComponentsProvide fabricationsupport for the dynamicexperiments programand explosives researchstudies.Support up to 100hydrodynamic tests/yr.Manufacture up to 50joint test assemblysets/yr.Provide generallaboratory fabricationsupport as requested.Continue fabricationutilizing unique andunusual materials.Provide appropriatedimensional inspectionof above fabricationactivities.Undertake additionaltypes of measurementsand inspections.Specialty componentswere fabricated at levelsbelow those projected bythe SWEIS ROD.Fabrication with uniquematerials was conductedat levels below thoseprojected by the SWEISROD.Dimensional inspectionwas provided for theabove fabricationactivities.Additional types ofmeasurements andinspections were notundertaken.Specialtycomponents werefabricated at levelsbelow thoseprojected by theSWEIS ROD.Fabrication withunique materials wasconducted at levelsbelow thoseprojected by theSWEIS ROD.Dimensionalinspection wasprovided for theabove fabricationactivities.Additional types ofmeasurements andinspections were notundertaken.Specialty componentswere fabricated atlevels below thoseprojected by theSWEIS ROD.Fabrication withunique materials wasconducted at levelsbelow those projectedby the SWEIS ROD.Dimensionalinspection wasprovided for the abovefabrication activities.Additional types ofmeasurements andinspections were notundertaken.Specialty componentswere fabricated at levelsbelow those projected bythe SWEIS ROD.Fabrication with uniquematerials was conductedat levels below thoseprojected by the SWEISROD.Dimensional inspectionwas provided for theabove fabricationactivities.Additional types ofmeasurements andinspections were notundertaken.Specialty componentswere fabricated atlevels below thoseprojected by theSWEIS ROD.Fabrication withunique materials wasconducted at levelsbelow those projectedby the SWEIS ROD.Dimensionalinspection wasprovided for the abovefabrication activities.Additional types ofmeasurements andinspections were notundertaken.
Table 2.8.3-1. Machine Shops (TA-<strong>03</strong>)/Operations DataPARAMETER UNITSRadioactiveAir Emissions:SWEISROD1998 1999 2000 2001OPERATIONS OPERATIONS OPERATIONS OPERATIONS2002OPERATIONSNotPlutonium-238 Ci/yr projected a 2.0E-10 a Not detected Not detected Not detected Not detectedNot aPlutonium-239 Ci/yr projected Not detected Not detected Not detected Not detected 3.9E-10 bNotThorium-228 Ci/yr projected a 2.3E-9 a 2.5E-9 b Not detected Not detected 8.0E-10 bThorium-230Thorium-232Uranium-234Ci/yrCi/yrCi/yrNotprojected a 6.8E-9 a 7.8E-10 b 1.2E-9 b Not detected Not detectedNotprojected a 1.4E-9 a 5.4E-10 b Not detected Not detected Not detectedNotprojected a 1.7E-5 a 3.0E-7 b 5.3E-8 b 2.1E-8 b 8.7E-8 bUranium-235 Ci/yrNotprojected a 5.8E-9 a 1.2E-8 b 1.9E-9 b 9.9E-10 b 3.8E-9 bUranium-238 Ci/yr 1.50E-4 3.6E-8 1.3E-8 1.3E-9 4.5E-10 5.0E-9NPDESNoMGYDischargeoutfallsNo outfalls No outfalls No outfalls No outfalls No outfallsWastes:Chemical kg/yr 474,000 4,399 3,955 887 26,474 2,023LLW m 3 /yr 606 27 40.4 409 22 44MLLW m 3 /yr 0 0.1 0.<strong>03</strong> 0.12 0.05 0TRU m 3 /yr 0 0 0 0 0 0Mixed TRU m 3 /yr 0 0 0 0 0 0Number of FTEs 289 c 83 c 81 cWorkers 81 c 80 c 91 c 92 caThe SWEIS ROD did not contain projections for these radioisotopes.bThis radionuclide was not projected by the SWEIS ROD because it was either dosimetrically insignificant or notisotopically identified.cThe first number shown in the “SWEIS ROD” column is the actual employee count representing CY 1999 (the yearthe SWEIS ROD was published). The second number shown in the “SWEIS ROD” column is the index numberrepresenting CY 1999 (the year the SWEIS ROD was published). The number of employees for CY 1998 throughCY 2002 operations cannot be directly compared to numbers projected by the SWEIS ROD. The employee numbersprojected by the SWEIS ROD represent total workforce size and include PT<strong>LA</strong>, JCNNM, and other subcontractorpersonnel. The number of employees for 1998 through 2002 operations is routinely collected information and represents onlyUC employees (regular full-time and part-time). Because the two sets of numbers (SWEIS ROD versus the new index) donot represent the same entity, a direct comparison to numbers projected by the SWEIS ROD (see Section 3.6,Socioeconomics) is not appropriate. However, because this index is going to be used in each subsequent Yearbook,selecting CY 1999 as the base year establishes an index that can be compared over the ten-year window represented bythe SWEIS ROD.2-92SWEIS Yearbook—2002
2.9 High Explosives Processing (TA-08, TA-09, TA-11, TA-16, TA-22, TA-28, TA-37)The High Explosives Processing Key Facility is located in all or parts of seven technical areas. Buildingtypes consist of production and assembly facilities, analytical laboratories, explosives storage magazines,and a facility for treatment of high explosive contaminated wastewaters. Activities consist primarily ofmanufacture and assembly of high explosives components for nuclear weapons and for Science-BasedStockpile Stewardship Program tests and experiments. Environmental and safety tests are performed at TA-11and TA-09 while TA-08 houses radiography activities.As identified in the SWEIS, this Key Facility has one Category 2 nuclear building in TA-08 (8-23) (Table2.9-1). The High Explosives Processing facilities identified as radiological are shown in Table 2.9-2.Table 2.9-1. High Explosives Processing Buildings with <strong>Nuclear</strong> Hazard ClassificationBUILDINGDESCRIPTIONSWEISRODDOE1998 a DOE2000 b <strong>LA</strong>NL2001 c <strong>LA</strong>NL2001 d <strong>LA</strong>NL2002 eTA-08-0022 Radiography facility 2 2 2TA-08-0023 Radiography facility 2 2 2 2 2 2TA-08-0024 Isotope Building 2TA-08-0070 Experimental Science 2TA-16-0411 Intermediate Device Assembly 2 2aDOE/<strong>LA</strong>NL list of Los Alamos <strong>National</strong> Laboratory <strong>Nuclear</strong> Facilities (DOE 1998a)bDOE/<strong>LA</strong>NL list of Los Alamos <strong>National</strong> Laboratory <strong>Nuclear</strong> Facilities (DOE 2000a)cDOE/<strong>LA</strong>NL list of Los Alamos <strong>National</strong> Laboratory <strong>Nuclear</strong> Facilities (<strong>LA</strong>NL 2001a)dDOE/<strong>LA</strong>NL list of Los Alamos <strong>National</strong> Laboratory <strong>Nuclear</strong> Facilities (<strong>LA</strong>NL 2001b)eDOE/<strong>LA</strong>NL list of Los Alamos <strong>National</strong> Laboratory <strong>Nuclear</strong> Facilities (<strong>LA</strong>NL 2002a)Table 2.9-2. High Explosives Processing Buildings Identified as Radiological FacilitiesabBUILDINGDESCRIPTION<strong>LA</strong>NL2001 a <strong>LA</strong>NL2002 bTA-08-0022 Radiography Rad RadTA-08-0070 Nondestructive Testing and Evaluation Rad RadTA-08-0120 Radiography RadTA-11-0<strong>03</strong>0 Vibration Testing Rad RadTA-16-0088 Component Storage Rad RadTA-16-0202 Laboratory RadTA-16-0207 Component Testing RadTA-16-<strong>03</strong>00 Component Storage Rad RadTA-16-<strong>03</strong>01 Component Storage Rad RadTA-16-<strong>03</strong>02 Component Storage/Training Rad RadTA-16-<strong>03</strong>32 Component Storage Rad RadTA-16-0410 Assembly Building Rad RadTA-16-0411 Assembly Building Rad RadTA-16-0413 Component Storage RadTA-16-0415 Component Storage RadTA-37-0010 Storage Magazine Rad RadTA-37-0014 Storage Magazine Rad RadTA-37-0016 Storage Magazine RadTA-37-0022 Magazine RadTA-37-0024 Storage Magazine Rad RadTA-37-0025 Storage Magazine Rad Rad<strong>LA</strong>NL Radiological Facility List (<strong>LA</strong>NL 2001c).<strong>LA</strong>NL Radiological Facility List (<strong>LA</strong>NL 2002b).SWEIS Yearbook—2002 2-93
Operations at this Key Facility are performed by two separate Divisions: the Dynamic Experimentation(DX) Division and the Engineering Sciences and Applications (ESA) Division. ESA performs the majority ofthe high explosives manufacturing and assembly work while DX assesses the parts produced by ESA.The ESA Weapon Materials and Manufacturing group brings 99 percent of the explosives into <strong>LA</strong>NLand stores it as raw material. ESA presses the raw explosives into solid shapes and machines these shapes tospecifications. The completed shapes are shipped to DX for testing (detonation). The DX High ExplosivesScience and Technology group also creates a small quantity of high explosives during the year from basicchemistry. The DX Detonation Science and Technology group uses a small amount of the raw explosives formaking detonators.There are two major pathways for expending the explosives brought into <strong>LA</strong>NL: wastes from the pressingand machining operations, which are burned, and completed shapes that are detonated as part of the testingprogram.As a result, information from both Divisions must be combined to completely capture operationalparameters for production of high explosives. To assist the reader, this information is presented both inseparate and combined forms.2.9.1 Construction and Modifications at High Explosives ProcessingProjected: The ROD projected four facility modifications for this Key Facility. These four modificationswere• construction of the High Explosive Waste Treatment Facility (HEWTF),• modification of 17 outfalls and their elimination from the NPDES permit,• relocation of the Weapons Components Testing Facility, and• the TA-16 steam plant conversion.Actual: All four projects identified in the ROD were completed before 1999. The real-time, smallcomponentradiography capability installed in Building TA-16-260 was completed and made fully operationalin 2001. When this capability became fully operational in 2001, Buildings TA-16-220, -222, -223, -224, -225,and -226 were vacated and are presentlybeing demolished (DOE 1997a).Planning and modification work at TA-09started in 1998 and has continued to allowconsolidation of high explosives formulationoperations previously conducted at TA-16-340 with other TA-09 high explosivesoperations (DOE 1999b).Table 2.9.1-1 summarizes the constructionand modification activities at the HighExplosive Processing Key Facility. Theadditional construction and modificationsdescribed in the table address other aspectsof consolidating the ongoing work andimproving environmental stewardship.High Explosives Burning Facility2-94SWEIS Yearbook—2002
SWEIS Yearbook—2002 2-95Table 2.9.1-1. High Explosive Processing Construction and ModificationsSWEIS RODACTUAL CONSTRUCTION AND MODIFICATIONPROJECTION 1998 YEARBOOK 1999 YEARBOOK 2000 YEARBOOK a 2001 YEARBOOK 2002 YEARBOOKConstruction of the HEWTF HEWTF, TA-16-1508, for Completed before 1999.treating process waters via sandfiltration became fullyoperational in 1997.Modification of 17 outfalls Nineteen outfalls wereCompleted before 1999.the NPDES permit permit during 1997 and 1998. band their elimination from eliminated from the NPDESRelocation of the Weapons Completed before 1999. Completed before 1999.Components Testing FacilityTA-16 steam plantconversionEnergy-efficient satellite steamboilers placed into service foreach major TA-16 building orcluster of buildings in 1997.Gas-fired, central steam plant forCompleted before 1999.TA-16 shut down.Real-time, small-componentradiography capability installedin TA-16-260 in 1998 (DOE1997a).High explosives casting and inert(mock high explosives)processing operations movedfrom Buildings TA-16-300 and -302 to Building TA-16-260.TA-16-300 and -302 becameJoint Weapons Training Facility(DOE 1996h).Old casting and storage buildingsTA-16-164 and -27 and sixnearby WWII-vintage machiningand inspection buildings plusassociated support structuresremoved under decontaminationand decommissioning (DOE1997b).TA-16-260 not fullyoperational in 1999 (DOE1997a).TA-16-260 not fullyoperational in 2000(DOE 1997a).TA-16-260 completedand made fullyoperational in 2001.Buildings 16-220,-222, -223, -224,-225, and -226vacated.Decontamination anddecommissioning ofBuildings 16-220,-222, -223, -224, -225,and -226.
2-96SWEIS Yearbook—2002Table 2.9.1-1. High Explosive Processing Construction and Modifications (continued)SWEIS RODACTUAL CONSTRUCTION AND MODIFICATIONPROJECTION 1998 YEARBOOK 1999 YEARBOOK 2000 YEARBOOK a 2001 YEARBOOK 2002 YEARBOOKPlanning and modification workat TA-09 to consolidate highexplosive formulation operationspreviously conducted at TA-16-340 with other TA-09 HEoperations (DOE 1999b).Explosive material storagemagazines at TA-28 used forPT<strong>LA</strong> support rather than highexplosive processing operations.Burn operations at highexplosive-contaminatedcombustible trash incinerator,TA-16-1409 ceased.Draft closure plan submitted toNew Mexico State.Planning and modificationwork at TA-09 to consolidatehigh explosive formulationoperations continued (DOE1999b).Explosives stored at TA-28were moved to TA-37 forstorage. TA-28 remains partof High Explosive ProcessingKey Facility.Aboveground wastewaterstorage tank system placedinto service at TA-09 (<strong>LA</strong>NL1998e).Planning andmodification work atTA-09 to consolidatehigh explosiveformulation operationscontinued (DOE1999b).Building TA-16-340closed during secondquarter of FY 2000.Incinerator underwentResource Conservationand Recovery Act(RCRA) clean-closureand was dismantledand scrapped.RCRA closureactivities continued forTA-16-387 flash pad c(ESA; <strong>LA</strong>NL 1996b).RCRA closureactivities continued forTA-16-394 burn tray d(ESA; <strong>LA</strong>NL 2000b).ESA upgraded a burnunit improvingcapacity and efficiencyand minimizingenvironmental impacts.Planning andmodification work atTA-09 to consolidatehigh explosiveformulation operationscontinued (DOE1999b).
SWEIS Yearbook—2002 2-97Table 2.9.1-1. High Explosive Processing Construction and Modifications (continued)abcdSWEIS RODACTUAL CONSTRUCTION AND MODIFICATIONPROJECTION 1998 YEARBOOK 1999 YEARBOOK 2000 YEARBOOK a 2001 YEARBOOK 2002 YEARBOOKCerro Grande Fireimpacts: All V Sitebuildings except onedestroyed, fire andsmoke damage,underground fire inMaterial Disposal Area(MDA) R.Consolidation of all highexplosive burningoperations at TA-16-388 and -399.Additional information on the impacts from the Cerro Grande Fire can be found in Section 2.9.4.Refer to Table 2.9.3-1 for information on the outfalls that were eliminated.Approximately 545 cubic meters of hazardous wastes were removed during closure of the flash pad.Approximately 114 cubic meters of hazardous wastes were removed during closure of the burn tray.
2.9.2 Operations at High Explosives ProcessingThe SWEIS ROD identified six capabilities for this Key Facility. No new capabilities have been added,and none has been deleted. Activity levels during 2002 continued below those projected by the SWEIS ROD.These projections were based on the possibility that <strong>LA</strong>NL would take over high explosives production workbeing performed at Pantex Plant. DOE decided, however, to keep high explosives production at the PantexPlant. However, the projections for high explosive processing were retained because DOE intends to keep<strong>LA</strong>NL available as a back-up capability for the Pantex Plant.As seen in Table 2.9.2-1, high explosives and plastics development and characterization operationsremained below levels projected in the SWEIS. Efforts continued in 2002 to develop protocols for obtainingreturned stockpile materials, develop new test methods, and procure new equipment to support requirementsfor science-based studies on stockpile materials.In 2002, 9,402 pounds of high explosives and 1,531 pounds of high explosives simulant material fromDX and ESA Divisions were used in the fabrication of test components. The level of high explosives usagewas significantly below the ROD projection of 82,700 pounds of high explosives, while the usage of highexplosives simulant was about the same as the projection of 2,910 pounds. However, the high explosivesimulant results in chemical waste that is shipped offsite for disposal and does not result in environmentalimpacts at <strong>LA</strong>NL.In 2002, 3,170 pounds of explosive scrap were burned at the TA-16 Burn Ground. In addition, 636 poundsof explosive-contaminated combustible solid wastes were burned, 149 gallons of explosive-contaminatedsolvent-water solutions were burned, 4,305 pounds of explosive-contaminated metal were treated andsalvaged, and 27,500 gallons of explosive-contaminated water were treated and released.These levels were well below those projected by the SWEIS ROD. Three outfalls from High ExplosivesProcessing remain on the NPDES permit: <strong>03</strong>A-130, 05A-055 (the HEWTF), and 05A-097.2.9.3 Operations Data for High Explosives ProcessingThe details of operations data from 1998 through 2002 are provided in Table 2.9.3-1. The NPDESdischarge volume for 2002 was about 30,000 gallons, compared to a projection of more than 12 milliongallons. Except for chemical wastes, waste quantities have consistently been well below projections made bythe SWEIS ROD. The chemical waste projection of 13,000 kilograms was exceeded in 2000 through 2002.2.9.4 Cerro Grande Fire Effects at High Explosives ProcessingOn May 7, 2000, the High Explosives Processing Key Facility Emergency Control Center was activated,TA-16 (S-Site) was evacuated, and all buildings were placed into a safe closed condition. Personnel beganbulldozing a fire line around WETF. By May 12, 2000, TA-16 was on fire. On May 14, several emergencyentries were made to assure that WETF was adequately maintained to keep its authorization basis active.By May 15, management started planning for reentry, and procedures were established. On May 17, TA-16 was reentered according to procedures, and personnel started to assess buildings and perform cleanupfollowing the fire. Care had to be taken to avoid hotspots (small fires burning in tree roots, stumps, etc.) thatwere a real danger to personnel walking across the land. By May 19, over 298 structures had been assessedfor damage, and office buildings were reopened so people could return to work. On May 21, Managementauthorized employees to return to work at TA-16.2-98SWEIS Yearbook—2002
SWEIS Yearbook—2002 2-99Table 2.9.2-1. High Explosives Processing (TA-08, TA-09, TA-11, TA-16, TA-22, TA-28, and TA-37)/Comparison of OperationsCAPABILITY SWEIS ROD a, b 1998 OPERATIONS 1999 OPERATIONS 2000 OPERATIONS 2001 OPERATIONS 2002 OPERATIONSHigh ExplosivesSynthesis andProductionHigh Explosivesand PlasticsDevelopmentandCharacterizationHigh Explosivesand PlasticsFabricationContinue synthesis research anddevelopment, produce newmaterials, and formulateexplosives as needed.Increase production of materialsfor evaluation and processdevelopment.Produce material andcomponents for directedstockpile production.Evaluate stockpile returns.Increase (40%) efforts indevelopment andcharacterization of new plasticsand high explosives forstockpile improvement.Improve predictive capabilities.Research high explosives wastetreatment methods.Continue traditional stockpilesurveillance and processdevelopment.Supply parts to Pantex forsurveillance, stockpile rebuilds,and joint test assemblies.Increase fabrication forhydrodynamic andenvironmental testing.The high explosivessynthesis andproduction operationswere less than thoseprojected by theSWEIS ROD.High explosivesformulation, synthesis,production, andcharacterizationoperations wereperformed at levels thatwere less than thoseprojected by theSWEIS ROD.Fabricated ~950 highexplosives parts insupport of the weaponsprogram, includinghigh explosivescharacterizationstudies, subcriticalexperiments, hydrotests, surveillanceactivities,environmental weaponstests, and safety tests.The high explosivessynthesis andproduction operationswere less than thoseprojected by theSWEIS ROD.High explosivesformulation, synthesis,production, andcharacterizationoperations wereperformed at levelsthat were less thanthose projected by theSWEIS ROD.DX Divisionfabricated ~3,000 highexplosive parts, andESA Divisionfabricated ~870 highexplosives parts in1999. Therefore,~3,870 parts werefabricated in supportof the weaponsprogram, includinghigh explosivescharacterizationstudies, subcriticalexperiments,hydrotests,surveillance activities,environmentalweapons tests, andsafety tests.The high explosivessynthesis andproduction operationswere less than thoseprojected by theSWEIS ROD.High explosivesformulation, synthesis,production, andcharacterizationoperations wereperformed at levelsthat were less thanthose projected by theSWEIS ROD.DX Divisionfabricated ~2,000 highexplosive parts, andESA Divisionfabricated ~578 highexplosives parts in2000. Therefore,~2,578 parts werefabricated in supportof the weaponsprogram, includinghigh explosivescharacterizationstudies, subcriticalexperiments,hydrotests,surveillance activities,environmentalweapons tests, andsafety tests.The high explosivessynthesis andproduction operationswere less than thoseprojected by theSWEIS ROD.High explosivesformulation, synthesis,production, andcharacterizationoperations wereperformed at levels thatwere less than thoseprojected by theSWEIS ROD.DX Division fabricated~2,000 high explosiveparts, and ESADivision fabricated~578 high explosivesparts in 2001.Therefore, ~2,578 partswere fabricated insupport of the weaponsprogram, includinghigh explosivescharacterizationstudies, subcriticalexperiments,hydrotests, surveillanceactivities,environmentalweapons tests, andsafety tests.The high explosivessynthesis and productionoperations were lessthan those projected bythe SWEIS ROD.High explosivesformulation, synthesis,production, andcharacterizationoperations wereperformed at levels thatwere less than thoseprojected by the SWEISROD.DX Division fabricated~2,000 high explosiveparts, and ESA Divisionfabricated ~778 highexplosives parts in 2002.Therefore, ~2,778 partswere fabricated insupport of the weaponsprogram, including highexplosivescharacterization studies,subcritical experiments,hydrotests, surveillanceactivities, environmentalweapons tests, andsafety tests.
2-100SWEIS Yearbook—2002Table 2.9.2-1. High Explosives Processing (TA-08, TA-09, TA-11, TA-16, TA-22, TA-28, and TA-37)/Comparison of Operations(continued)CAPABILITY SWEIS ROD a, b 1998 OPERATIONS 1999 OPERATIONS 2000 OPERATIONS 2001 OPERATIONS 2002 OPERATIONSTest DeviceAssemblySafety andMechanicalTestingResearch,Development,and Fabricationof High-PowerDetonatorsabIncrease test device assembly tosupport stockpile relatedhydrodynamic tests, joint testassemblies, environmental andsafety tests, and increasedresearch and development.Approximately 100 majorassemblies per year.Increase (50%) safety andenvironmental tests related tostockpile assurance. Improvepredictive models.Approximately 15 safety andmechanical tests per year.Increase operations to supportassigned stockpile stewardshipmanagement activities;manufacture up to 40 majorproduct lines per year. SupportDOE complex for packagingand transportation of electroexplosivedevices.Eleven majorassemblies wereprovided forhydrodynamic, NevadaTest Site subcritical,and joint environmentaltest programs.Fifteen stockpilerelated safety andmechanical tests during1998.High-power detonatoractivities resulted in themanufacture of lessthan 10 product lines in1998.ESA Divisionprovided 10 majorassemblies forhydrodynamic,Nevada Test Sitesubcritical, and jointenvironmental testprograms.DX Divisionperformed 13 stockpilerelated safety andmechanical testsduring 1999. ESADivision providedthree revalidation andtwo certificationassemblies during1999.High-power detonatoractivities by DXDivision resulted inthe manufacture ofless than 20 productlines in 1999. Inaddition, ESADivision providedfourteen flux generatorassemblies in 1999.ESA Divisionprovided 10 majorassemblies forhydrodynamic,Nevada Test Sitesubcritical, and jointenvironmental testprograms.DX Divisionperformed 13stockpile related safetyand mechanical testsduring 2000. ESADivision providedthree revalidation andtwo certificationassemblies during2000.High-power detonatoractivities by DXDivision resulted inthe manufacture ofless than 20 productlines in 2000.In addition, ESADivision provided 14flux generatorassemblies in 2000.ESA Divisionprovided less than 100major assemblies forNevada Test Sitesubcritical and jointenvironmental testprograms.DX Divisionperformed less than 15stockpile related safetyand mechanical testsduring 2001.High-power detonatoractivities by DXDivision resulted inthe manufacture of lessthan 40 product linesin 2001.ESA Division providedless than 100 majorassemblies for NevadaTest Site subcritical andjoint environmental testprograms.DX Division performedless than 15 stockpilerelated safety andmechanical tests during2002.High-power detonatoractivities by DXDivision resulted in themanufacture of lessthan 40 product lines in2002.The total amount of explosives and mock explosives used across all activities is an indicator of overall activity levels for this Key Facility. Amounts projected by theSWEIS ROD are 82,700 pounds of explosives and 2,910 pounds of mock explosives. Actual amounts used in 2002 were 9,402 pounds of high explosiveand 1,531 pounds of mock high explosive.Includes construction of the HEWTF, the steam plant conversion, relocation of the Weapons Testing Facility, and outfall modifications.
SWEIS Yearbook—2002 2-101Table 2.9.3-1. High Explosives Processing (TA-08, TA-09, TA-11, TA-16, TA-22, TA-28, and TA-37)/Operations DataPARAMETER UNITSSWEISROD1998OPERATIONS1999OPERATIONS2000OPERATIONS2001OPERATIONS2002OPERATIONSRadioactive Air Emissions:Uranium-238 Ci/yr 9.96E-7a a a a aUranium-235 Ci/yr 1.89E-8a a a a aUranium-234 Ci/yr 3.71E-7a a a a aNPDES Discharge: bNumber of outfalls --- 22 4 3 3 3 3Total Discharges MGY 12.4 17.1 0.118 0.086 0.<strong>03</strong>6 0.<strong>03</strong>02A-007 (TA-16) MGY 7.4 Eliminated 1998 Eliminated 1998 Eliminated 1998 Eliminated 1998 Eliminated 1998<strong>03</strong>A-130 (TA-11) c MGY 0.04 0.1 0.022 0.001 0.002 0.00204A-070 (TA-16) MGY 0.0 Eliminated 1997 Eliminated 1997 Eliminated 1997 Eliminated 1997 Eliminated 199704A-083 (TA-16) MGY 0.0 Eliminated 1997 Eliminated 1997 Eliminated 1997 Eliminated 1997 Eliminated 199704A-092 (TA-16) MGY 0.0 Eliminated 1998 Eliminated 1998 Eliminated 1998 Eliminated 1998 Eliminated 199804A-115 (TA-08) MGY 0.0 Eliminated 1997 Eliminated 1997 Eliminated 1997 Eliminated 1997 Eliminated 199704A-157 (TA-16) MGY 0.0 Eliminated 1997 Eliminated 1997 Eliminated 1997 Eliminated 1997 Eliminated 199705A-053 (TA-16) MGY 0.0 Eliminated 1998 Eliminated 1998 Eliminated 1998 Eliminated 1998 Eliminated 199805A-054 (TA-16) d MGY 3.6 6.3 Eliminated 1998 Eliminated 1998 Eliminated 1998 Eliminated 199805A-055 (TA-16) MGY 0.13 8.9 0.096 0.085 0.<strong>03</strong>4 0.027505A-056 (TA-16) MGY 0.0 Eliminated 1998 Eliminated 1998 Eliminated 1998 Eliminated 1998 Eliminated 199805A-066 (TA-09) MGY 0.74 Eliminated 1998 Eliminated 1998 Eliminated 1998 Eliminated 1998 Eliminated 199805A-067 (TA-09) MGY 0.33 Eliminated 1998 Eliminated 1998 Eliminated 1998 Eliminated 1998 Eliminated 199805A-068 (TA-09) MGY 0.06 Eliminated 1998 Eliminated 1998 Eliminated 1998 Eliminated 1998 Eliminated 199805A-069 (TA-11) MGY 0.01 Eliminated 1998 Eliminated 1998 Eliminated 1998 Eliminated 1998 Eliminated 199805A-071 (TA-16) MGY 0.04 Eliminated 1998 Eliminated 1998 Eliminated 1998 Eliminated 1998 Eliminated 199805A-072 (TA-16) MGY 0.0 Eliminated 1997 Eliminated 1997 Eliminated 1997 Eliminated 1997 Eliminated 199705A-096 (TA-11) MGY 0.01 Eliminated 1998 Eliminated 1998 Eliminated 1998 Eliminated 1998 Eliminated 199805A-097 (TA-11) MGY 0.01 1.8 No discharge No discharge No discharge 0.0006A-073 (TA-16) MGY 0.0 Eliminated 1998 Eliminated 1998 Eliminated 1998 Eliminated 1998 Eliminated 199806A-074 (TA-08) MGY 0.0 Eliminated 1997 Eliminated 1997 Eliminated 1997 Eliminated 1997 Eliminated 199706A-075 (TA-08) MGY 0.0 Eliminated 1998 Eliminated 1998 Eliminated 1998 Eliminated 1998 Eliminated 1998Wastes:Chemical e f ghkg/yr 13,000 12,237 13,329 1,<strong>03</strong>2,985 375,283 15,109LLW m 3 /yr 16 6 8.3 3 1 8.69MLLW m 3 /yr 0.2 0 0 0 0 0TRU m 3 /yr 0 0 0 0 0 0Mixed TRU m 3 /yr 0 0 0 0 0 0Number of FTEs 335 i 201 i 96 iWorkers 96 i 92 i 107 i 114 iaNo stacks require monitoring; all non-point sources are measured using ambient monitoring.
Table 2.9.3-1. High Explosives Processing (TA-08, TA-09, TA-11, TA-16, TA-22, TA-28, and TA-37)/Operations Data (continued)2-102bcdefghiOutfalls eliminated before 1999: 02A-007 (TA-16), 04A-070 (TA-16), 04A-083 (TA-16), 04A-092 (TA-16), 04A-115 (TA-08), 04A-157 (TA-16), 05A-053 (TA-16),05A-056 (TA-16), 05A-066 (TA-09), 05A-067 (TA-09), 05A-068 (TA-09), 05A-069 (TA-11), 05A-071 (TA-16), 05A-072 (TA-16), 05A-096 (TA-11),06A-073 (TA-16), 06A-074 (TA-08), and 06A-075 (TA-08).This outfall discharged only one quarter during calendar year 1999.Outfall 05A-054 had discharges only part of the year. Process flows were routed to the HEWTF, and this outfall was then eliminated from the NPDES permit.Explanations for the chemical waste numbers that exceed the ROD projections were not given in the 1998 and 1999 Yearbooks. Research indicates that the CY 1998volume consists of 12,236 kilograms of non-ER chemical waste and 36,364 kilograms of ER waste. The CY 2002 volume includes 2,721.55 kilograms of roll-off scrapmetal for recycle that was caught up in the DOE radiological area release moratorium.During CY 2000, cleanup of MDA R generated 1,023,284 kilograms of chemical waste.During CY 2001, cleanup of MDA R generated 370,124 kilograms of chemical waste.The CY 2002 chemical waste volume is due to chemical cleanup activities.The first number shown in the “SWEIS ROD” column is the actual employee count representing CY 1999 (the year the SWEIS ROD was published). The secondnumber shown in the “SWEIS ROD” column is the index number representing CY 1999 (the year the SWEIS ROD was published). The number of employees forCYs 1998 through 2002 operations cannot be directly compared to numbers projected by the SWEIS ROD. The employee numbers projected by the SWEIS RODrepresent total workforce size and include PT<strong>LA</strong>, JCNNM, and other subcontractor personnel. The number of employees for CY 1998 through CY 2002information and represents only UC employees (regular full-time and part-time). Because the two sets of numbers (SWEIS ROD versus the new index) do notrepresent the same entity, a direct comparison to numbers projected by the SWEIS ROD (see Section 3.6, Socioeconomics) is not appropriate. However, because thisindex is going to be used in each subsequent Yearbook, selecting CY 1999 as the base year establishes an index that can be compared over the ten-year windowrepresented by the SWEIS ROD.SWEIS Yearbook—2002
ImpactsThere were relatively few facilities burned at High Explosives Processing. Some of the exceptions includedV-Site (an historic Manhattan Project Era site) where all buildings except one were destroyed. Smoke damagewas extensive and resulted in replacement of equipment, filter systems, and furnishings of buildings. Firedamaged roofs, and Material Disposal Area (MDA) R suffered an underground fire that required extensiveeffort to extinguish. In addition, many utility poles burned and wiring melted requiring extensive efforts torestore electrical utilities. Other damage included flooding in a high bay at TA-46, dead rodents in manybuildings, destroyed HVAC systems, and miscellaneous damage to drop towers and substations.2.10 High Explosives Testing (TA-14, TA-15, TA-36, TA-39, TA-40)The High Explosives Testing Key Facility is located in all or parts of five technical areas, comprises aboutone-half (22 of 43 square miles) of the land area occupied by <strong>LA</strong>NL, and has 17 associated firing sites. Allfiring sites are in remote locations and/or within canyons. Major buildings are located at TA-15, and includethe Dual Axis Radiographic Hydrodynamic Test (DARHT) facility (Building TA-15-312), Pulsed High-Energy Radiographic Machine Emitting X-rays (PHERMEX) facility (TA-15-184), and the TA-15-306 firingsite. Building types consist of preparation and assembly facilities, bunkers, analytical laboratories, explosivesstorage magazines, and offices. Activities consist primarily of testing high explosives components for nuclearweapons and for Science-Based Stockpile Stewardship Program tests and experiments.In September 2001, Building TA-15-R183 was placed on the <strong>LA</strong>NL Radiological Facility List (<strong>LA</strong>NL2001c) and remained on the list in 2002 (<strong>LA</strong>NL 2002b).2.10.1 Construction and Modifications at High Explosives TestingProjected: DARHT, Building TA-15-312, was the only facility construction and modification projected bythe SWEIS ROD. This facility was evaluated in a separate environmental impact statement (DOE 1995b).Actual: Construction of DARHT began in 1994, but was interrupted for two years pending resolution ofa lawsuit. The facility construction resumed in 1996 and DARHT Axis I was completed in 1999. Installationand component testing of the accelerator and its associated control and diagnostics systems began in late1999. Construction of DARHT Axis II continued through CY 2002.Other construction that occurred through 2001 includes the Access Control Building (TA-15-446) thatbecame operational in 1998; the Hydrodynamic Test Operations Control Building (TA-15-484) that becameoperational in the spring of 1999; and the Applied Research Optics Electronics Laboratory (TA-15-494) wasoccupied in 2000. The Ector Multi-diagnostic Hydrotest accelerator was taken out of service, but the firingsite (TA-15-306) remains active. Also, 12 outfalls were eliminated before 1999 and Outfall 06A-106 waseliminated from the NPDES permit in 1999.During 2002, construction began on the Vessel Preparation Facility (DOE 1995b), a carpenter shop (DOE2001b), an X-Ray calibration facility (DOE 2001b), and a warehouse (DOE 2001b) located within TA-15. The carpenter shop, x-ray calibration facility, and warehouse were replacement structures for similaroperations destroyed in the Cerro Grande Fire. Additionally, a camera room (DOE 2001c) was built to supportexperiments at TA-36-12. The strategic planning effort also began.Table 2.10.1-1 summarizes the construction and modifications at the High Explosives Testing Key Facility.SWEIS Yearbook—2002 2-1<strong>03</strong>
2-104SWEIS Yearbook—2002Table 2.10.1-1. High Explosive Testing Construction and ModificationsSWEIS RODACTUAL CONSTRUCTION AND MODIFICATIONPROJECTION 1998 YEARBOOK 1999 YEARBOOK 2000 YEARBOOK a 2001 YEARBOOK 2002 YEARBOOKDARHT facilityconstruction andmodificationConstruction of theDARHT building(TA-15-312) continued.DARHT cooling towerbecame operational in1998.Hydrodynamic TestOperations Controlbuilding (TA-15-484)constructed and becameoperational in spring1999 (<strong>LA</strong>NL 1996c).Access Control Building(TA-15-446) becameoperational in 1998 (DOE1993b).Ector Multi-diagnosticHydrotest acceleratortaken out of service.(Firing site remainsactive).Construction of theDARHT building(TA-15-312) continued(DOE 1995b).DARHT Axis I operational.Installation andcomponent testing of theaccelerator and itsassociated control anddiagnostics systems beganin 1999.Construction of the DARHTbuilding (TA-15-312)completed in 1999 (DOE1995b).Installation and componenttesting of the acceleratorand its associated controland diagnostics systemsbegan in 1999 andcontinued in 2000.Construction of theDARHT building(TA-15-312) completed in1999 (DOE 1995b).Installation andcomponent testing of theaccelerator and itsassociated control anddiagnostics systems beganin late 1999 and continuedin 2001.Vessel PreparationFacility constructed atTA-15 (DOE 1995b).
SWEIS Yearbook—2002 2-105Table 2.10.1-1. High Explosive Testing Construction and Modifications (continued)abSWEIS RODACTUAL CONSTRUCTION AND MODIFICATIONPROJECTION 1998 YEARBOOK 1999 YEARBOOK 2000 YEARBOOK a 2001 YEARBOOK 2002 YEARBOOKApplied Research OpticsElectronics Laboratory(TA-15-494, new officeand laboratory building)and adjacent parkingunder construction in1999 (<strong>LA</strong>NL 1998f).Construction of AppliedResearch Optics ElectronicsLaboratory (TA-15-494,new office building)completed in 2000 (<strong>LA</strong>NL1998f).Twelve of 14 outfallseliminated. bOutfall 06A106 at TA-36eliminated from NPDESpermit in 1999.Cerro Grande Fire destroyedDARHT equipment,materials, and storagestructures.Additional information on the impacts from the Cerro Grande Fire can be found in Section 2.10.4.Refer to Table 2.10.3-1 for information on the outfalls that were eliminated.Cerro Grande Fire: ~14facilities destroyed and~28 damaged; destroyedfacilities transferred todecontaminate anddecommission in 2001;tree thinning (<strong>LA</strong>NL2001p).Categorical Exclusion forhigh explosive storageand preparation facilitiesat TA-36 (DOE 2001d).Camera room built atTA-36-12 (DOE 2001c).Carpenter shopconstructed at TA-15(DOE 2001b).X-ray calibration facilityconstructed at TA-15(DOE 2001b).Warehouse constructedat TA-15 (DOE 2001b).
2.10.2 Operations at High Explosives TestingThe ROD identified seven capabilities for this Key Facility. None of these has been deleted, and no newcapabilities have been introduced. Levels of research were below those predicted by the SWEIS ROD.Table 2.10.2-1 identifies the operational capabilities discussed in the SWEIS and presents the 1998–2002operational data for comparative purposes. The total amount of depleted uranium expended during testing (allcapabilities) is an indicator of overall activity levels at this Key Facility. On an annual basis, the quantity ofdepleted uranium expended has remained well below the SWEIS projections. For example, a total of 216.67kilograms were expended in 2002, compared to approximately 3,900 kilograms projected by the SWEISROD.2.10.3 Operations Data for High Explosives TestingThe operational data presented in Table 2.10.3-1 indicate that the materials used and effects of researchfrom 1998 through 2002 were considerably less than projections made by the SWEIS ROD. The onlyoperational data exceptions are the chemical waste quantity in 2000 and the LLW quantity in 2001 thatexceeded the SWEIS ROD projections. The chemical waste in 2000 was due to cleanup from the CerroGrande Fire.DARHT2-106SWEIS Yearbook—2002
SWEIS Yearbook—2002 2-107Table 2.10.2-1. High Explosives Testing (TA-14, TA-15, TA-36, TA-39, and TA-40)/Comparison of OperationsCAPABILITY SWEIS ROD a 1998OPERATIONSHydrodynamic Tests Conduct up to 100 hydrodynamic Hydrodynamic teststests/yr. Develop containment were conducted intechnology. Conduct baseline and 1998 at a level farcode development tests of weapons below thoseconfiguration. Depleted uranium use projected in theof 6,900 lb/yr (over all activities). SWEIS (See TableDynamic ExperimentsExplosives Researchand TestingMunitions ExperimentsHigh-ExplosivesPulsed-PowerExperimentsConduct dynamic experiments tostudy properties and enhanceunderstanding of the basic physics ofstate and motion for materials usedin nuclear weapons including someexperiments with SNM.Conduct high explosives tests tocharacterize explosive materials.Continued support of Department ofDefense in conventional munitions.Conduct experiments withprojectiles and study other effects onmunitions.Conduct experiments anddevelopment tests.2.10.3-1).Dynamicexperiments wereconducted at a levelfar below thoseprojected in theSWEIS (See Table2.10.3-1).Explosives researchand testing wereconducted at a levelfar below thoseprojected in theSWEIS (See Table2.10.3-1).Munitionsexperiments wereconducted at a levelfar below thoseprojected in theSWEIS (See Table2.10.3-1).Experiments wereconducted at a levelfar below thoseprojected in theSWEIS (See Table2.10.3-1).1999OPERATIONSHydrodynamic testswere conducted in1999 at a level belowthose projected in theSWEIS.Dynamicexperiments wereconducted at a levelfar below thoseprojected in theSWEIS.Explosives researchand testing wereconducted at a levelfar below thoseprojected in theSWEIS.Munitionsexperiments wereconducted at a levelfar below thoseprojected in theSWEIS.Experiments wereconducted at a levelfar below thoseprojected.2000OPERATIONSHydrodynamic testswere conducted in2000 at a levelbelow thoseprojected by theSWEIS ROD.Dynamicexperiments wereconducted at a levelbelow thoseprojected by theSWEIS ROD.Explosives researchand testing wereconducted at a levelbelow thoseprojected by theSWEIS ROD.Munitionsexperiments wereconducted at a levelbelow thoseprojected by theSWEIS ROD.Experiments wereconducted at a levelbelow thoseprojected by theSWEIS ROD.2001OPERATIONSHydrodynamic testswere conducted in2001 at a levelbelow thoseprojected by theSWEIS ROD.Dynamicexperiments wereconducted at a levelbelow thoseprojected by theSWEIS ROD.Explosives researchand testing wereconducted at a levelbelow thoseprojected by theSWEIS ROD.Munitionsexperiments wereconducted at a levelbelow thoseprojected by theSWEIS ROD.Experiments wereconducted at a levelbelow thoseprojected by theSWEIS ROD.2002OPERATIONSHydrodynamic testswere conducted in2002 at a levelbelow thoseprojected by theSWEIS ROD.Dynamicexperiments wereconducted at a levelbelow thoseprojected by theSWEIS ROD.Explosives researchand testing wereconducted at a levelbelow thoseprojected by theSWEIS ROD.Munitionsexperiments wereconducted at a levelbelow thoseprojected by theSWEIS ROD.Experiments wereconducted at a levelbelow thoseprojected by theSWEIS ROD.
2-108Table 2.10.2-1. High Explosives Testing (TA-14, TA-15, TA-36, TA-39, and TA-40)/Comparison of Operations (continued)CAPABILITY SWEIS ROD a 1998OPERATIONSCalibration,Development, andMaintenance TestingOther ExplosivesTestingaConduct tests to provide calibrationdata, instrumentation development,and maintenance of imageprocessing capability.Develop advanced high explosivesor weapons evaluation techniques.Calibration,development, andmaintenance testingwere conducted at alevel far belowthose projected inthe SWEIS (SeeTable 2.10.3-1).Other explosivestesting wasconducted at a levelfar belowexplosives testingprojected in theSWEIS (See Table2.10.3-1).Includes completion of construction for the DARHT facility and its operation.1999OPERATIONSCalibration,development, andmaintenance testingwere conducted at alevel far below thoseprojected in theSWEIS.Other explosivestesting wasconducted at a levelfar below explosivestesting projected inthe SWEIS.2000OPERATIONSCalibration,development, andmaintenance testingwere conducted at alevel below thoseprojected by theSWEIS ROD.Other explosivestesting wasconducted at a levelbelow explosivestesting projected bythe SWEIS ROD.2001OPERATIONSCalibration,development, andmaintenance testingwere conducted at alevel below thoseprojected by theSWEIS ROD.Other explosivestesting wasconducted at a levelbelow explosivestesting projected bythe SWEIS ROD.2002OPERATIONSCalibration,development, andmaintenance testingwere conducted at alevel below thoseprojected by theSWEIS ROD.Other explosivestesting wasconducted at a levelbelow explosivestesting projected bythe SWEIS ROD.SWEIS Yearbook—2002
SWEIS Yearbook—2002 2-109Table 2.10.3-1. High Explosives Testing (TA-14, TA-15, TA-36, TA-39, and TA-40)/Operations DataPARAMETER UNITS SWEIS ROD 1998 OPERATIONS 1999 OPERATIONS 2000 OPERATIONS 2001 OPERATIONS 2002 OPERATIONSRadioactive AirEmissions:Depleted Uranium Ci/yr 1.5E-1 a b b b b bChemical Usage: cAluminum d kg/yr 45,450 624 688 394 78 860Beryllium kg/yr 90 1 0.5 2 52 0Copper d kg/yr 45,630 14 41 88 24 33Depleted Uranium kg/yr 3,930 121 67 419 536 216Lead kg/yr 240 2 0.5 5 0 0Tantalum kg/yr 300 5 0.2 1 12 2Tungsten kg/yr 300 0 0 19 0 0NPDES Discharge:Number of outfalls e --- 14 4 2 2 2 2Total discharges MGY 3.6 1.9 14.23 16 9 1.38<strong>03</strong>A-028 (TA-15) f MGY 2.2 0.5 2.81 g 5 4 0.5027<strong>03</strong>A-185 (TA-15) f MGY 0.73 1.2 11.42 h 11 5 0.877304A-101 (TA-40) MGY 0.0 Eliminated 1997 Eliminated 1997 Eliminated 1997 Eliminated 1997 Eliminated 199704A-139 (TA-15) MGY None Eliminated 1997 Eliminated 1997 Eliminated 1997 Eliminated 1997 Eliminated 199704A-141 (TA-39) MGY 0.0 Eliminated 1997 Eliminated 1997 Eliminated 1997 Eliminated 1997 Eliminated 199704A-143 (TA-15) MGY 0.018 Eliminated 1997 Eliminated 1997 Eliminated 1997 Eliminated 1997 Eliminated 199704A-156 (TA-39) MGY 0.0 Eliminated 1997 Eliminated 1997 Eliminated 1997 Eliminated 1997 Eliminated 199706A-079 (TA-40) i MGY 0.54 0.1 Eliminated 1998 Eliminated 1998 Eliminated 1998 Eliminated 199806A-080 (TA-40) MGY 0.<strong>03</strong> Eliminated 1998 Eliminated 1998 Eliminated 1998 Eliminated 1998 Eliminated 199806A-081 (TA-40) MGY 0.<strong>03</strong> Eliminated 1998 Eliminated 1998 Eliminated 1998 Eliminated 1998 Eliminated 199806A-082 (TA-40) MGY 0.0 Eliminated 1998 Eliminated 1998 Eliminated 1998 Eliminated 1998 Eliminated 199806A-099 (TA-40) MGY 0.0 Eliminated 1997 Eliminated 1997 Eliminated 1997 Eliminated 1997 Eliminated 199706A-100 (TA-40) g MGY 0.04 0.1 Eliminated 1998 Eliminated 1998 Eliminated 1998 Eliminated 1998j06A-106 (TA-36) MGY 0.0 Eliminated 1999 Eliminated 1999 Eliminated 1999 Eliminated 1999 Eliminated 199906A-123 (TA-15) MGY 0.0 Eliminated 1998 Eliminated 1998 Eliminated 1998 Eliminated 1998 Eliminated 1998Wastes:Chemical kg/yr 35,300 444 1,015 60,437 k 1,337 1,285LLW m 3 /yr 940 0 0.01 0.6 0 0MLLW m 3 /yr 0.9 0 0 0 0 0TRU/Mixed TRU l m 3 /yr 0.2 0 0 0 0 0Number of FTEs 619 m 93 m 227 mWorkers 227 m 212 m 245 m 264 maThe isotopic composition of depleted uranium is approximately 99.7 percent uranium-238, approximately 0.3 percent uranium-235, and approximately 0.002 percenturanium-234. Because there are no historic measurements of emissions from these sites, projections are based on estimated release fractions of the materials used intests.
Table 2.10.3-1. High Explosives Testing (TA-14, TA-15, TA-36, TA-39, and TA-40)/Operations Data (continued)2-110SWEIS Yearbook—2002bcdefghijklmNo stacks require monitoring; all non-point sources are measured using ambient monitoring. During 1999, a total of 67 kilograms of depleted uranium was expendedduring these activities.Usage listed for the SWEIS ROD includes projections for expanded operations at DARHT as well as the other TA-15 firing sites (the highest foreseeable level of suchactivities that could be supported by the <strong>LA</strong>NL infrastructure). No proposals are currently before DOE to exceed the material expenditures at DARHT that areevaluated in the DARHT Environmental Impact Statement (DOE 1995b).The quantities of copper and aluminum involved in these tests are used primarily in the construction of support structures. These structures are not expended in theexplosive tests, and thus, do not contribute to air emissions.Outfalls eliminated before 1999: 04A-101 (TA-40), 04A-139 (TA-15), 04A-141 (TA-39), 04A-143 (TA-15), 04A-156 (TA-39), 06A-080 (TA-40), 06A-081 (TA-40),06A-082 (TA-40), 06A-099 (TA-40), and 06A-123 (TA-15). Consolidation and removal of outfalls has resulted in projected NPDES volumes underestimating actualdischarges from the existing outfalls.The annual quantity of discharge was calculated by using the average daily flow and multiplying by 365 days in the year; this results in an overestimate of volume. Atotalizing water meter has been installed on <strong>03</strong>A-185 (TA-15), which will allow for much more accurate water usage calculations for 2002 reporting. <strong>03</strong>A-28 (TA-15)does not yet have a totalizing water meter and the water use will continue to be averaged.This outfall discharged during three quarters of CY 1999.This outfall discharged during all four quarters of CY 1999.Outfalls 06A-079 and 06A-100 had discharges only part of 1998. Process flows were routed to the HEWTF, and these outfalls were eliminated from the NPDESpermit.This outfall was originally identified with the Non-Key Facilities.The 2000 chemical waste, as indicated in the 2000 SWEIS Yearbook exceeded the ROD due to cleanup following the Cerro Grande Fire. Construction and demolitiondebris (previously cited as ‘industrial waste’ in the Yearbooks) accounted for 9,362 kilograms of the chemical waste, was nonhazardous, and was disposed of inregular landfills. The remainder of the chemical waste was shipped offsite to approved hazardous waste facilities.TRU waste (steel) will be generated as a result of DARHT’s Phased Containment Option (see DARHT Environmental Impact Statement [DOE 1995b]).The first number shown in the “SWEIS ROD” column is the actual employee count representing CY 1999 (the year the SWEIS ROD was published). The secondnumber shown in the “SWEIS ROD” column is the index number representing CY 1999 (the year the SWEIS ROD was published). The number of employees for1998 through 2002 operations cannot be directly compared to numbers projected by the SWEIS ROD. The employee numbers projected by the SWEIS ROD representtotal workforce size and include PT<strong>LA</strong>, JCNNM, and other subcontractor personnel. The number of employees for CY 1998 through CY 2002 operations is routinelycollected information and represents only UC employees (regular full-time and part-time). Because the two sets of numbers (SWEIS ROD versus the new index) donot represent the same entity, a direct comparison to numbers projected by the SWEIS ROD (see Section 3.6, Socioeconomics) is not appropriate. However, becausethis index is going to be used in each subsequent Yearbook, selecting CY 1999 as the base year establishes an index that can be compared over the ten-year windowrepresented by the SWEIS ROD.
2.10.4 Cerro Grande Fire Effects at High Explosives TestingImmediate EffectsAbout 3,040 acres of land within the High Explosives Testing Key Facility burned during the Cerro GrandeFire. Areas most affected were TAs 14, 15, and 40 and, to a lesser extent, TAs 06, 09, 22, and 36. Fire damagewas in excess of $16 million.Fire Effects on High Explosives Testing: Firing site operations were abruptly halted, and High ExplosivesTesting operations were shut down for approximately four months. Restart proceeded cautiously to ensuresafety and security of personnel, the public, the environment, and facilities. Safety and security requirementsnecessitated that operations be restarted using a graded and methodical approach. Because high explosivesfiring operations may only be conducted when the airspace is closed, restart of high explosives firingoperations was delayed because remediation efforts included aerial reseeding of burned areas.From the end of May 2000 through August 2001, facility operations personnel were involved in facilityrecovery activities (reopening more than 400 buildings and restarting operations within them). These effortsincluded reestablishing security and safety control of firing site perimeters and other outside work areas, walkdownsof all operations, reauthorization of hazardous operations, and daily escorting of many environmentalspecialists into the area. No worker injuries were reported during the fire recovery period.The Cerro Grande Fire directly affected DARHT by costing $6.1 million for delays and additional workassociated with work stoppage and then recovery. A fraction of the total amount, about $177,000, wasattributed to burned and destroyed DARHT equipment, materials, and storage structures.Fire Effects on High Explosives Processing: The Cerro Grande Fire halted high explosives processing bythe High Explosives Testing Key Facility for approximately two months; one month while the Laboratorywas closed and one additional month to reopen facilities and restart operations. Before the fire, detonatorproduction was ahead of schedule and production commitments were being met. Because of the fire, work onone production line was transferred to Lawrence Livermore <strong>National</strong> Laboratory to meet testing schedules.Continuing EffectsThe Cerro Grande Fire has had a long-term effect on the high explosives testing operations. Managementhas limited high explosives testing at TA-40 to tests that are contained because of adjacent steep canyon wallsand excess forest fuels. This self-imposed restriction has created a hardship because these firing sites are nolonger available for smaller experiments requiring open-air tests. The restriction remained in place throughout2002 and still remains in place.Replacement structures for burned buildings were designed and construction began on two warehouses,a carpenter shop, an X-ray calibration facility, a camera room addition to a firing site, and a high explosivepreparation building. Buildings that were transferred to decommissioning and decontamination went throughbid document preparation, site visits, and contractor bidding process. Contracts will be awarded and workperformed in 20<strong>03</strong>. Burned trees were removed and remaining forest thinned to reduce the wildland firepotential and make the forest viable and self-sustaining. Trees that were not eligible for firewood use or saleto a sawmill were burned in an air curtain destructor.SWEIS Yearbook—2002 2-111
DX Division Strategic Plan for the FutureNNSA determined that an environmental assessment was required for this plan and its new structuresto be constructed at TA-22, and the subsequent decommissioning and decontamination of old buildings tobe replaced. The process began in 2002 with <strong>LA</strong>NL internal organizations and consultants preparing thedocuments. The environmental assessment, DOE/EA-1447 (DOE 2002c), was started in 2002.2.11 The Los Alamos Neutron Science Center (TA-53)The <strong>LA</strong>NSCE Key Facility lies entirely within TA-53. The facility has more than 400 buildings, includingone of the largest at <strong>LA</strong>NL. Building 53-3, which houses the linac, has 315,000 square feet under roof.Activities consist of neutron science and nuclear physics research, proton radiography, the development ofaccelerators and diagnostic instruments, and production of medical radioisotopes. [Note: Isotope productionhas not occurred since 1998; it will resume after commissioning of the new isotope production facility in20<strong>03</strong>.] The majority of the <strong>LA</strong>NSCE Key Facility (the User Facility) is composed of the 800-million-electronvoltlinac, a Proton Storage Ring, and three major experimental areas: the Manuel Lujan Neutron ScatteringCenter, the Weapons Neutron Research (WNR) facility, and Experimental Area C.Experimental Area C is the location of proton radiography experiments for the Stockpile StewardshipProgram. A new experimental facility for the production of ultracold neutrons is under construction inArea B. Experimental Area A, formerly used for materials irradiation experiments and isotope production,is currently inactive; construction of a new isotope production facility was completed in 2002 andcommissioning will occur in 20<strong>03</strong>. A second accelerator facility located at TA-53, Low-Energy DemonstrationAccelerator (LEDA), is also inactive.This Key Facility has three Category 3 nuclear activities (Table 2.11-1): experiments using neutronscattering by actinides in Experimental Area ER-1/ER-2, the 1L neutron production target in Building 53-7,and Area A East in Building 53-3M (<strong>LA</strong>NL 2001b), which is used for passive storage of activated materials.There are no Category 2 nuclear facilities at TA-53. In September 2001, TA-53-945 and 53-954 wereplaced on the <strong>LA</strong>NL Radiological Facility List (<strong>LA</strong>NL 2001c). TA-53-945 and TA-53-954 remained on theRadiological Facility List in 2002 (<strong>LA</strong>NL 2002b). Experimental Area ER-1/ER-2 is categorized as a ModerateHazard facility. The remainder of the <strong>LA</strong>NSCE User Facility is categorized as Low Hazard. DOE approvedan Interim Safety Assessment Document for the <strong>LA</strong>NSCE accelerator and experimental areas in May 2002.<strong>LA</strong>NSCE began work on a two-year project to update and consolidate existing authorization basis documentsfor the User Facility.2.11.1 Construction and Modifications at the Los Alamos Neutron Science CenterProjected: The ROD projected significant facility changes and expansion to occur at <strong>LA</strong>NSCE byDecember 2005. These changes were the closure of two former sanitary lagoons; make LEDA operationalby late 1998; enhance the Short-Pulse Spallation Source; have a one-megawatt target/blanket; construct anew 100-million-electron-volt Isotope Production Facility; have a Long-Pulse Spallation Source (LPSS),including decontamination and renovation of Area A; construct a Dynamic Experiment Lab; construct the LosAlamos International Facility for Transmutation; construct the Exotic Isotope Facility; and decontaminate andrenovate Area A-East.Actual: Table 2.11.1-1 indicates that two of the projected changes have been completed and that four havebeen started. In addition to these projected construction activities, a new warehouse was constructed in 1998to store equipment and other materials formerly stored outside, a new waste treatment facility for radioactiveliquids generated at <strong>LA</strong>NSCE was constructed during 1999, and construction of a new cooling tower wascompleted in 2000. These projects received NEPA review through Categorical Exclusions <strong>LA</strong>N-98-1102-112SWEIS Yearbook—2002
(DOE 1998d), <strong>LA</strong>N-98-109 (DOE 1998e), and <strong>LA</strong>N-96-022 (DOE 1999c). The two new cooling towers(structure #53-963, 53-952) replace cooling towers 53-60, 53-62, and 53-64, which have been taken off line.The new towers discharge through Outfall <strong>03</strong>A-048, as had their predecessors. Construction of two newinstruments on Flight Paths 12 and 13 at the Lujan Center started in 2002.Table 2.11-1. <strong>LA</strong>NSCE Buildings with <strong>Nuclear</strong> Hazard ClassificationBUILDINGDESCRIPTIONSWEISRODDOE1998 a DOE2000 b <strong>LA</strong>NL2001 c <strong>LA</strong>NL2001 d <strong>LA</strong>NL2002 eTA-53-1L 1L Target 3 3 3 3 3TA-53-3M Experimental Science 3TA-53-A-6 Area A East 3 3 3 3 3TA-53-ER1 Actinide scattering experiments 3 3TA-53-ER1/ER-2 Actinide scattering experiments 3 3 3TA-53-P3E Pion Scattering Experiment 3 3TA-53 Target 4 WNR Neutron Production target 3aDOE/<strong>LA</strong>NL list of Los Alamos <strong>National</strong> Laboratory <strong>Nuclear</strong> Facilities (DOE 1998a)bDOE/<strong>LA</strong>NL list of Los Alamos <strong>National</strong> Laboratory <strong>Nuclear</strong> Facilities (DOE 2000a)cDOE/<strong>LA</strong>NL list of Los Alamos <strong>National</strong> Laboratory <strong>Nuclear</strong> Facilities (<strong>LA</strong>NL 2001a)dDOE/<strong>LA</strong>NL list of Los Alamos <strong>National</strong> Laboratory <strong>Nuclear</strong> Facilities (<strong>LA</strong>NL 2001b)eDOE/<strong>LA</strong>NL list of Los Alamos <strong>National</strong> Laboratory <strong>Nuclear</strong> Facilities (<strong>LA</strong>NL 2002a)The <strong>LA</strong>NSCE Key FacilitySWEIS Yearbook—2002 2-113
2-114SWEIS Yearbook—2002Table 2.11.1-1. Los Alamos Neutron Science Center Construction and ModificationsSWEIS RODPROJECTIONEliminate NPDES Outfall<strong>03</strong>A-145 from the OrangeBox BuildingClosure of two formersanitary lagoonsLEDA to becomeoperational in late 1998Short-Pulse SpallationSource enhancementsSWEISACTUAL CONSTRUCTION AND MODIFICATIONREF. 1998 YEARBOOK 1999 YEARBOOK 2000 YEARBOOK a 2001 YEARBOOK 2002 YEARBOOK2-88 Eliminated in 1998. b2-88 Sampling conducted in Remediation started1998. c in 1999.2-89 Started high-powerconditioning.Maximum powerachieved.2-90 Upgrades started. Upgrades started;installation of newinstruments began.Characterizationcontinued; south lagoonsludge and linerremoved.First phase of the ProtonStorage Ring Upgradecompleted.Data analysis andsampling continued.Shutdown inDecember untilfunded.Proton Storage Ringcompleted;instrumentscommissioned.Cleanup of north lagoonas Interim Action. dInactive until funded. eUpgrades to ion sourceand 1L line in progress. fOne-megawatt target/blanket 2-91 Not completed Not completed Not completed Not completed Not completed and notfunded.New 100-MeV IsotopeProduction Facility2-92 Constructionpreparations began.Construction began.LPSS, includingdecontamination andrenovation of Area AFacility completed;upgrades to beam linein progress.Readiness Reviewplanned for July 20<strong>03</strong>and commissioning forOctober 20<strong>03</strong>.3-25 Not completed Not completed Not completed Not completed Not completed and notfunded.Dynamic Experiment Lab 3-25 Not started Not started Concept revised g Concept revised g Concept revised gLos Alamos InternationalFacility for Transmutation3-25 Not completed Not completed Not completed Not completed Not completed and notfunded.Exotic Isotope ProductionFacility3-27 Not completed Not completed Not completed Not completed Not completed and notfunded.Decontamination andrenovation of Area A-East h 3-27 Not completed Not completed Not completed Not completed Not completedOutfalls <strong>03</strong>A-146 and<strong>03</strong>A-125 eliminated fromNPDES permit. iNew warehouse erected ateast end of mesa (DOE1998d).TA-53 radioactiveliquid waste treatmentfacility constructed(DOE 1998e).
SWEIS Yearbook—2002 2-115Table 2.11.1-1. Los Alamos Neutron Science Center Construction and Modifications (continued)abcdefghSWEIS RODPROJECTIONSWEISACTUAL CONSTRUCTION AND MODIFICATIONREF. 1998 YEARBOOK 1999 YEARBOOK 2000 YEARBOOK a 2001 YEARBOOK 2002 YEARBOOKCooling tower 53-963completed and replacestower 53-62 (DOE1999c).Cooling tower 53-952replaces coolingtowers 53-60 and 53-64.ICE Houseconstructed. jStarted construction oftwo new instruments onFlight Paths 12 and 13at the Lujan Center.Additional information on the impacts of the Cerro Grande Fire can be found in Section 2.11.4.Outfall <strong>03</strong>A-145 was associated with a small swamp cooler for the Orange Box Conference and Office Building (53-06). There was no flow from the outfall. Althoughthere had been no flow, discharge piping from the outfall was tied to the sewage plant at TA-46.The lagoons were removed from the RCRA closure. Cleanup will be performed as a corrective action. The Environmental Restoration (ER) Project started the cleanupwith some sampling in 1998.Characterization started in 1999 and continued into 2000. Cleanup at the south lagoon began in 2000 with the removal of the sludge and liner. Data analysis andsampling continued through 2001 for both lagoons and an Interim Action Plan was written for remediation of the north lagoon. Cleanup of the north lagoon was done in2002, but only as an interim action. It is not known at this time if the cleanup will be "final" or if more cleanup is needed. A report will be prepared and submitted to theNew Mexico Environment Department (NMED) in the summer of 20<strong>03</strong>. The site has not been "closed" by NMED.LEDA started high-power conditioning of the radio-frequency quadrupole power supply in November 1998. The first trickle of proton beam was produced in March1999, and maximum power was achieved in September 1999. It has been designed for a maximum energy of 12 million electron volts, not the 40 million electron voltsprojected by the SWEIS ROD. LEDA was shut down in December 2001 and will remain inactive until funding is resolved. (True for 2002; note that the 20<strong>03</strong> omnibusbill passed by Congress included funding for LEDA decontamination and decommissioning. The plan is to remove all support equipment and leave the building and theaccelerator itself in place.)Part of the Short-Pulse Spallation Source upgrades have been performed. Upon completion, the project will upgrade the Proton Storage Ring and 1L line to operate at200 microamperes at 30 hertz (vs. 70 microamperes at 20 hertz present during preparation of the SWEIS); will install a brighter ion source; and will add three neutronscatteringinstruments to the Lujan Center. Through the end of 2002, the upgrades to the Proton Storage Ring had been completed, and the three instruments have beeninstalled and commissioned in the Lujan Center. Upgrades to the ion source and 1L line are still in progress. (Note the latter upgrades have been delayed to 2004.)The Stockpile Stewardship Program is currently using Experimental Area C, Building 53-3P, for proton radiography, and the Blue Room in Building 53-07 for neutronresonance spectroscopy. The concept of combining these experiments in a new Dynamic Experiment Laboratory has been replaced by the concept to construct a $1.6billion Advanced Hydrotest Facility, which is currently in the conceptual phase. Conceptual planning for the Advanced Hydrotest Facility is being done consistent withthe Stockpile Stewardship and Management Programmatic Environmental Impact Statement (DOE 1996b) and ROD. Before DOE decides to build and operate theAdvanced Hydrotest Facility at <strong>LA</strong>NL or some other site, an environmental impact statement and ROD would be prepared.Area A East is used to store the old 1L target. Both the target and residually activated materials such as the 800-million-electron-volt beam stop are why Area A East isdesignated as a Category 3 nuclear facility.
2-116Table 2.11.1-1. Los Alamos Neutron Science Center Construction and Modifications (continued)iOutfalls <strong>03</strong>A-146 and <strong>03</strong>A-125 were eliminated from the NPDES permit in 1997 and 1998, respectively. Although no flows are expected because the cooling units havejbeen or are scheduled to be removed, discharge piping for both outfalls was tied in to the sanitary sewer instead and rerouted to the sewage treatment plant at TA-46.The “ICE House” is a new building completed in 2002. The building houses an experimental station on an existing WNR flight path and provides a new capability atWNR for single-event upset measurements.SWEIS Yearbook—2002
2.11.2 Operations at the Los Alamos Neutron Science CenterThe SWEIS identified seven capabilities for the <strong>LA</strong>NSCE Key Facility. No new capabilities have beenadded, and none has been deleted. During CY 2002, <strong>LA</strong>NSCE operated both accelerators and three of the fiveexperimental areas. (Area A has been idle for more than two years; Area B has been idle for several years buta new Ultracold Neutron Facility is under construction.)The primary indicator of activity for this facility is production of the 800-million-electron-volt <strong>LA</strong>NSCEproton beam as shown in Table 2.11.2-1. These production figures are all less than the 6,400 hours at1,250 microamps projected by the SWEIS ROD. In addition, there were no experiments conducted fortransmutation of wastes. There was also no production of medical isotopes from 1999 through 2002, althoughconstruction of a new isotope production facility has been completed. Table 2.11.2-1 provides details.The most significant accomplishment in CY 2002 for <strong>LA</strong>NSCE is the successful completion of a full runcycle for the three primary experimental facilities: the WNR, the Proton Radiography area, and the ManuelLujan Jr. Neutron Scattering Center (Lujan Center). <strong>LA</strong>NSCE hosted over 780 user visits this run cycle (June3–January 26). The facility operated at an average 86 percent availability for the Lujan Center and 88 percentfor WNR, allowing the completion of just under 225 experiments for internal and external neutron scatteringand neutron nuclear physics users. Construction of two new instruments at the Lujan Center began in 2002.One, IN500, will be used for inelastic neutron scattering studies. The other is NPD-gamma, which will lookfor violations of the weak nuclear interaction.A hot cell in the new Isotope Production Facility at <strong>LA</strong>NSCESWEIS Yearbook—2002 2-117
Table 2.11.2-1. Los Alamos Neutron Science Center (TA-53)/Comparison of Operations2-118SWEIS Yearbook—2002CAPABILITY SWEIS ROD a 1998 YEARBOOK 1999 YEARBOOK 2000 YEARBOOK 2001 YEARBOOK 2002 YEARBOOKAccelerator BeamDelivery,Maintenance, andDevelopmentDeliver <strong>LA</strong>NSCE linac beamto Areas A, B, C, WNRfacility, Manuel LujanCenter, Dynamic ExperimentFacility, and new isotopeproduction facility for 10months/yr (6,400 hrs).Positive ion current 1,250microampere and negativeion current of 200microampere.(a) In 1998, positiveion beam wasproduced for 1,335hours at an averagecurrent of 740microamps. Negativeion beam wasdelivered, at varyingcurrents, to Areas A,B, C, WNR facility,and Lujan Center forup to 1,127 hours.In 1999, H+ beam wasnot produced. H- beamwas delivered, atmaximum current of 93microamps, to lines Band C (505 hours),WNR facility (1,993hours), and LujanCenter (239 hours).Area A did not receivebeam.In 2000, H+ beam wasnot produced. H- beamwas delivered asfollows:(a) to the Lujan Centerfor 1,749 hours at anaverage current of 100microamperes.(b) to WNR Target 2for 307 hours in a“pulse on demand”mode of operation,with an average currentbelow 1 femtoampere,(c) to WNR Target 4for 2,024 hours at anaverage current of 5microamperes,(d) through Line X toLines B and C for 806hours in a “pulse ondemand” mode ofoperation, with anaverage current below1 femtoampere.In 2001, H+ beam wasnot produced. H-beam was delivered asfollows:(a) to the Lujan Centerfor 2,741 hours at anaverage current of 55microamperes,(b) to WNR Target 2for 350 hours in a“pulse on demand”mode of operation,with an averagecurrent below 1femtoampere,(c) to WNR Target 4for 1,989 hours at anaverage current of 5microamperes,(d) through Line X toLines B and C for 465hours in a “pulse ondemand” mode ofoperation, with anaverage current below1 femtoampere.In 2002, H+ beamwas not produced. H-beam was deliveredas follows:(a) to the LujanCenter for 2,3<strong>03</strong>hours at an averagecurrent of 105microamperes with87% total availability(b) to WNR Target 2for 252 hours in a“pulse on demand”mode of operation,with an averagecurrent below 1femtoampere with90% total availability(c) to WNR Target 4for 2,507 hours at anaverage current of 3.5microamperes with88% total availability(d) through Line X toLines B and C for384 hours in a “pulseon demand” mode ofoperation, with anaverage currentbelow 1 femtoamperewith 85% totalavailability.
SWEIS Yearbook—2002 2-119Table 2.11.2-1. Los Alamos Neutron Science Center (TA-53)/Comparison of Operations (continued)CAPABILITY SWEIS ROD a 1998 YEARBOOK 1999 YEARBOOK 2000 YEARBOOK 2001 YEARBOOK 2002 YEARBOOKAccelerator BeamDelivery,Maintenance, andDevelopment (cont.)Experimental AreaSupportReconfigure beam deliveryand support equipment tosupport new facilities,upgrades, and experiments. aCommission, operate,maintain LEDA for 10 to 15years; operate up toapproximately 6,600 hrs/yr.Full-time remote handlingand radioactive wastedisposal capability requiredduring Area A interiormodifications and Area A-East renovation.Support of experiments,facility upgrades, andmodifications.Increased power demand for<strong>LA</strong>NSCE linac and LEDAradio frequency operation.In the fall of 1998, theupgrade to H-injectors to the ProtonStorage Ring wascompleted.In November 1998,started conditioningthe radio frequencyquadrupole powersupply. No beam wasgenerated in 1998.Full-time capabilitymaintained. (Note:Modifications andrenovations were notundertaken, however.)Support activitieswere conducted perthe projections of theSWEIS ROD.Started conditioningthe radio frequencyquadrupole powersupply for LEDA inNovember 1998.No major upgrades tothe beam deliverycomplex.Full power (100milliamps and 6.7MeV) achieved inSeptember 1999.Full-time capabilitymaintained. (Note:Modifications andrenovations were notundertaken, however.)Support activities wereconducted per theprojections of theSWEIS ROD.A 700-MHz klystronwas developed for usewith LEDA.No major upgrades tothe beam deliverycomplex.Continued to operate atfull power (100milliamps and 6.7million electron volts).Full-time capabilitymaintained. (Note:Modifications andrenovations were notundertaken, however.)Support activities wereconducted per theprojections of theSWEIS ROD.No developments in2000.No major upgrades tothe beam deliverycomplex.LEDA was shutdownin December 2001.Full-time capabilitymaintained. (Note:Modifications andrenovations were notundertaken, however.)Support activitieswere conducted perthe projections of theSWEIS ROD.No developments in2001.No major upgrades tothe beam deliverycomplex. Materialwas received forinstallation of a newswitchyard kickermagnet during 20<strong>03</strong>;this will allowsimultaneousoperations of Line D(Lujan and WNR)and Line X (Area Band C).LEDA was shutdownin December 2001.Full-time capabilitymaintained. (Note:Modifications andrenovations were notundertaken,however.)Support activitieswere conducted perthe projections of theSWEIS ROD.Average beamcurrent to the LujanCenter was increasedto over 100microamps.
2-120SWEIS Yearbook—2002Table 2.11.2-1. Los Alamos Neutron Science Center (TA-53)/Comparison of Operations (continued)CAPABILITY SWEIS ROD a 1998 YEARBOOK 1999 YEARBOOK 2000 YEARBOOK 2001 YEARBOOK 2002 YEARBOOKNeutron Research Conduct 1,000 to 2,000and Technology b experiments/yr using ManuelLujan Center, WNR facility,and LPSS. Establish LPSS inArea A (requiresmodification).Conduct acceleratorproduction of tritium targetneutronics experiment for sixmonths.Construct DynamicExperiment Laboratoryadjacent to WNR Facility.Support contained weaponsrelatedexperiments:With small quantities ofactinides, high explosives,and sources (up toapproximately 80/yr).With nonhazardous materialsand small quantities of highexplosives (up toapproximately 200/yr)With up to 4.5 kg highexplosives and/or depleteduranium (up toapproximately 60/yr)Shock wave experimentsinvolving small amounts, upto (nominally) 50 gramsplutonium.Provide support for staticstockpile surveillancetechnology research anddevelopment.Far fewer number ofexperiments since thelinac operated only1,135 hours. LPSSwas not constructed.Acceleratorproduction of tritiumtarget neutronicsexperiments werebegun inExperimental Area Cin 1997 and werecompleted in 1998.The DynamicExperimentLaboratory was notconstructed, butweapons-relatedexperiments wereconducted:None with actinidesSome withnonhazardousmaterials and highexplosivesSome with highexplosives, but nonewith depleted uraniumNo shock waveexperiments.Support was notprovided forsurveillance researchand development.Far fewer number ofexperiments, since theLujan Center was idlefrom February intoJuly. LPSS was notconstructed.The DynamicExperiment Laboratorywas not constructed,but weapons-relatedexperiments wereconducted:None with actinidesSome withnonhazardous materialsand high explosivesSome with highexplosives, but nonewith depleted uraniumNo shock waveexperiments.Support was notprovided forsurveillance researchand development.Fewer than 200experiments wereconducted at the LujanCenter. LPSS was notconstructed.The DynamicExperiment Laboratorywas not constructed,but weapons-relatedexperiments wereconducted:None with actinidesSome withnonhazardous materialsand high explosivesSome with highexplosives, but nonewith depleted uraniumSome shock waveexperiments.Support was providedfor surveillanceresearch anddevelopment.113 experiments wereconducted at the LujanCenter and 36experiments at WNR.LPSS was notconstructed.The DynamicExperimentLaboratory was notconstructed, butweapons-relatedexperiments wereconducted:None with actinidesSome withnonhazardousmaterials and highexplosivesSome with highexplosives, but nonewith depleted uraniumSome shock waveexperiments.Support was providedfor surveillanceresearch anddevelopment.165 experiments wereconducted at theLujan Center and 59experiments at WNR.LPSS was notconstructed.The DynamicExperimentLaboratory was notconstructed, butweapons-relatedexperiments wereconducted:None with actinidesSome withnonhazardousmaterials and highexplosivesSome with highexplosives, but nonewith depleteduraniumSome shock waveexperiments.Support was providedfor surveillanceresearch anddevelopment.
SWEIS Yearbook—2002 2-121Table 2.11.2-1. Los Alamos Neutron Science Center (TA-53)/Comparison of Operations (continued)CAPABILITY SWEIS ROD a 1998 YEARBOOK 1999 YEARBOOK 2000 YEARBOOK 2001 YEARBOOK 2002 YEARBOOKAcceleratorTransmutation ofWastes cConduct lead target tests fortwo years at Area A beamstop.No tests. No tests. No tests. No tests. No tests.Subatomic PhysicsResearchMedical IsotopeProductionImplement the Los AlamosInternational Facility forTransmutation. (Establishone-megawatt, then fivemegawattAcceleratorTransmutation of Wastestarget/blanket experimentareas adjacent to Area A.)Conduct 5-megawattexperiments for 10months/yr for four yearsusing about 3 kg of actinides.Conduct 5 to 10 physicsexperiments/yr at ManuelLujan Center, WNR facility,and LPSS.Continue neutrinoexperiment through FY97.Conduct proton radiographyexperiments, includingcontained experiments withhigh explosives.Irradiate up to approximately50 targets/yr for medicalisotope production.Added production of exotic,neutron-rich, and neutrondeficientisotopes (requiresmodification of an existingtarget area).Neither thetarget/blanketexperiment nor theLos AlamosInternational Facilityfor Transmutation wasconstructed.Neither thetarget/blanketexperiment nor the LosAlamos InternationalFacility forTransmutation wasconstructed.Neither thetarget/blanketexperiment nor the LosAlamos InternationalFacility forTransmutation wasconstructed.Neither thetarget/blanketexperiment nor theLos AlamosInternational Facilityfor Transmutation wasconstructed.Neither thetarget/blanketexperiment nor theLos AlamosInternational Facilityfor Transmutationwas constructed.No experiments. No experiments. No experiments. No experiments. No experiments.Between 5 and 10physics experimentswere conducted in1998.The neutrinoexperiment, extendedone year, concluded inSeptember 1998.Experimentsinvolving containedhigh explosives wereconducted in 1998.Production began inNovember 1998.Twelve targets wereirradiated.No production in1998.Ultra-cold neutronexperiments ran on 5occasions in the BlueRoom.Experiments involvingcontained highexplosives wereconducted on 10 daysin 1999.No production in 1999.No production in 1999.Ultra-cold neutronexperiments ran on 13days in the “B” linebeam tunnel room.Experiments involvingcontained highexplosives wereconducted on 28 daysin 2000.Ultra-cold neutronexperiments ran 10days in the “BlueRoom” (target 2).Fewer than 40experiments involvingcontained highexplosives wereconducted in 2001.No production in 2000. No production in2001.No production in 2000. No production in2001.No ultra-cold neutronexperiments were runduring 2002<strong>LA</strong>NSCE beamoperations.42 experimentsinvolving containedhigh explosives wereconducted in 2002.No production in2002.No production in2002.
2-122Table 2.11.2-1. Los Alamos Neutron Science Center (TA-53)/Comparison of Operations (continued)CAPABILITY SWEIS ROD a 1998 YEARBOOK 1999 YEARBOOK 2000 YEARBOOK 2001 YEARBOOK 2002 YEARBOOKHigh-PowerMicrowaves andAdvancedAcceleratorsabcConduct research anddevelopment in these areas,including microwavechemistry research forindustrial and environmentalapplications.Research anddevelopment wereconducted.Research anddevelopment wereconducted.Research anddevelopment wereconducted.Research anddevelopment wereconducted.Research anddevelopment wereconducted.Includes the completion of proton and neutron radiography facilities, the LEDA, the isotope production facility relocation, the Short-Pulsed Spallation Source, andthe LPSS.Numbers of neutron experiments represent plausible levels of activity. Bounding conditions for the consequences of operations are primarily determined by 1) lengthand power of beam operation and 2) maintenance and construction activities.Formerly Accelerator-Driven Transmutation Technology.SWEIS Yearbook—2002
2.11.3 Operations Data for the Los Alamos Neutron Science CenterArea A remains inactive. Two outfalls at TA-53 were eliminated with completion of the cooling towers.Since both construction activities, which contribute to waste quantities, and levels of operations were less thanthose projected by the SWEIS ROD, operations data were also less than projected. Radioactive air emissionsare a key parameter since <strong>LA</strong>NSCE emissions have historically accounted for more than 95 percent of thetotal <strong>LA</strong>NL offsite dose. However, emissions over the past three years have been smaller percentages of thetotal <strong>LA</strong>NL offsite dose. In 2002, emissions totaled about 4,400 curies or about 70 percent of the total <strong>LA</strong>NLradioactive air emissions of 6,300 curies (all values include diffuse emissions). Emissions in 2001 totaled onlyabout 6,000 curies (including diffuse emissions), about 40 percent of total <strong>LA</strong>NL radioactive air emissions.The 2000 total was also less than projections of the ROD of 8,496 curies (Garvey and Miller 1996). Thesesmall emissions can be attributed to non-use of the Area A beam stop. Waste generation and NPDESdischarge volumes were well below projected quantities. Table 2.11.3-1 provides details.2.11.4 Cerro Grande Fire Effects at the Los Alamos Neutron Science Center<strong>LA</strong>NSCE was nearly untouched by the fire; a small portion of the roof of one building was damaged.Return to operations was in accordance with the <strong>LA</strong>NL-wide recovery procedure (<strong>LA</strong>NL 2000a). Building53-882 was established as a recovery command post. The TA-53 Facility Recovery Team was established andperformed safety reconnaissance and condition assessment during the second week of the evacuation. (<strong>LA</strong>NLwas evacuated from Monday, May 8, through Sunday, May 21, 2000.) All <strong>LA</strong>NSCE workers were approvedto return to their workstations on Tuesday, May 23, 2000. The only impact to operations was evaluating andrestoring the status of accelerator systems since site power was lost during the fire. Systems and equipmentwere returned to power sequentially instead of simultaneously, and this process required about a month tocomplete.Removal of dried radioactive sludge and the plastic liner from a lagoon at <strong>LA</strong>NSCESWEIS Yearbook—2002 2-123
2-124SWEIS Yearbook—2002Table 2.11.3-1. Los Alamos Neutron Science Center (TA-53)/Operations DataPARAMETER UNITS SWEIS ROD 1998 OPERATIONS 1999 OPERATIONS 2000 OPERATIONS 2001 OPERATIONS 2002 OPERATIONSRadioactive AirEmissions:Argon-41 Ci/yr 7.44E+1 1.52E+02 1.4E+01 2.9E+01 1.6E+1 2.5E+1Arsenic-73 Ci/yr Not projected a 1.26E-04 Not detected 2.2E-05 7.6E-4 b Not detectedBeryllium-7 Ci/yr Not projected a 1.16E-04 Not detected Not detected Not detected Not detectedBromine-76 Ci/yr Not projected a 3.65E-02 2.3E-04 b 2.6E-04 b 1.4E-3 b Not detectedBromine-77 Ci/yr Not projected a 3.55E-02 Not detected Not detected Not detected Not detectedBromine-82 Ci/yr Not projected a 7.71E-<strong>03</strong> 6.3E-04 b 4.2E-<strong>03</strong> b 3.4E-3 b 6.0E-3 bCarbon-10 Ci/yr 2.65E+0 1.87E+02 4.2E-02 1.4E-01 2.5E+0 7.3E-1Carbon-11 Ci/yr 2.96E+3 3.38E+<strong>03</strong> 2.8E+02 6.9E+02 3.4E+3 2.8E+3Chlorine-39 Ci/yr Not projected a 3.25E+0 Not detected Not detected Not detected Not detectedCobalt-60 Ci/yr Not projected a Not detected 4.0E-06 b Not detected Not detected Not detectedMercury-193 Ci/yr Not projected a Not detected Not detected 8.0E-01 b 6.9E-1 b 4.4E-1 bMercury-193m Ci/yr Not projected a Not detected Not detected Not detected Not detected 4.7E-4 bMercury-195m Ci/yr Not projected a Not detected Not detected 2.0E-02 b 2.4E-2 b 8.0E-3 bMercury-197 Ci/yr Not projected a 6.12E-<strong>03</strong> 1.6E-<strong>03</strong> b 1.0E-01 b 3.7E-1 b 1.6E-1 bMercury-2<strong>03</strong> Ci/yr Not projected a Not detected Not detected Not detected 8.6E-3 b 6.2E-4 bNitrogen-13 Ci/yr 5.35E+2 1.28E+<strong>03</strong> 1.6E 2.8E+01 1.3E+2 1.2E+2Nitrogen-16 Ci/yr 2.85E-2 1.50E+02 1.5E-02 1.7E-02 2.8E-2 4.7E-1Oxygen-14 Ci/yr 6.61E+0 5.87E+01 1.0E-01 4.1E-01 3.4E+1 1.5E+1Oxygen-15 Ci/yr 6.06E+2 2.66E+<strong>03</strong> 1.9E+01 9.1E+01 2.4E+3 1.5E+3Potassium-40 Ci/yr Not projected a 7.62E-05 Not detected Not detected Not detected Not detectedScandium-44M Ci/yr Not projected a 5.81E-07 Not detected Not detected Not detected Not detectedSodium-24 Ci/yr Not projected a 1.82E-04 Not detected Not detected Not detected Not detectedTritium as Water Ci/yr Not projected a 3.79 2.3 b 2.9 b 6.4E+0 b Not measuredVanadium-48 Ci/yr Not projected a 5.29E-06 Not detected Not detected Not detected Not detectedLEDA Projections(8-yr average):Oxygen-19 Ci/yr 2.16E-3 Not measured c Not measured c Not measured c Not measured c Not measured cSulfur-37 Ci/yr 1.81E-3 Not measured c Not measured c Not measured c Not measured c Not measured cChlorine-39 Ci/yr 4.70E-4 Not measured c Not measured c Not measured c Not measured c Not measured cChlorine-40 Ci/yr 2.19E-3 Not measured c Not measured c Not measured c Not measured c Not measured cKrypton-83m Ci/yr 2.21E-3 Not measured c Not measured c Not measured c Not measured c Not measured cOthers Ci/yr 1.11E-3 Not measured c Not measured c Not measured c Not measured c Not measured cNPDES Discharge: dTotal Discharges MGY 81.8 53.4 37.2 30.5 20.45 24.04<strong>03</strong>A-047 MGY 7.1 13.5 3.4 3.5 0 0<strong>03</strong>A-048 MGY 23.4 19.1 19.7 15.6 13.05 23.25
SWEIS Yearbook—2002 2-125Table 2.11.3-1. Los Alamos Neutron Science Center (TA-53)/Operations Data (continued)PARAMETER UNITS SWEIS ROD 1998 OPERATIONS 1999 OPERATIONS 2000 OPERATIONS 2001 OPERATIONS 2002 OPERATIONS<strong>03</strong>A-049 MGY 11.3 20.1 10.8 9.6 5.9 0.14<strong>03</strong>A-113 MGY 39.8 0.7 3.3 1.8 1.5 0.65<strong>03</strong>A-125 MGY 0.18 Eliminated 1998 Eliminated 1998 Eliminated 1998 Eliminated 1998 Eliminated 1998<strong>03</strong>A-145 MGY 0.0 Eliminated 1998 Eliminated 1998 Eliminated 1998 Eliminated 1998 Eliminated 1998<strong>03</strong>A-146 MGY Not projected e Eliminated 1997 Eliminated 1997 Eliminated 1997 Eliminated 1997 Eliminated 1997Wastes:Chemical kg/yr 16,600f55,258 11,060 1,205 g 4,057 1,999LLW m 3 /yr 1,085 h 16 70 28 0.1 0MLLW m 3 /yr 1 0.4 0.5 4.9 0.2 0.9TRU m 3 /yr 0 0 0 0 0 0Mixed TRU m 3 /yr 0 0 0 0 0 0Number of FTEs 846 i 547 i 560 iWorkers 560 i 550 i 505 i 496 iaThe SWEIS ROD did not contain projections for these radioisotopes.bThe radionuclide was not projected by the SWEIS ROD because it was either dosimetrically insignificant or not isotopically identified.cPotential emissions from LEDA were sufficiently small that measurement systems were not necessary to meet regulatory or facility requirements.dOutfalls eliminated before 1999: <strong>03</strong>A-125 (TA-53), <strong>03</strong>A-145 (TA-53), and <strong>03</strong>A-146 (TA-53).eThis outfall was not listed in the SWEIS.fChemical waste in CY 1998 was generated as a result the legacy material action project.gAbout one-half of this waste (590 kilograms) was construction and demolition debris (previously identified as industrial solid waste in the Yearbook; nonhazardous)and may be disposed of in regular landfills.hLLW volumes include decommissioning and renovation of Experimental Area A (Building 53-<strong>03</strong>M) due to the LPSS project.iThe first number shown in the “SWEIS ROD” column is the actual employee count representing CY 1999 (the year the SWEIS ROD was published). The secondnumber shown in the “SWEIS ROD” column is the index number representing CY1999 (the year the SWEIS ROD was published). The number of employees for 1998through 2002 operations cannot be directly compared to numbers projected by the SWEIS ROD. The employee numbers projected by the SWEIS ROD represent totalworkforce size and include PT<strong>LA</strong>, JCNNM, and other subcontractor personnel. The number of employees for CY 1998 through CY 2002 operations is routinely collectedinformation and represents only UC employees (regular full-time and part-time). Because the two sets of numbers (SWEIS ROD versus the new index) do notrepresent the same entity, a direct comparison to numbers projected by the SWEIS ROD (see Section 3.6, Socioeconomics) is not appropriate. However, because thisindex is going to be used in each subsequent Yearbook, selecting CY 1999 as the base year establishes an index that can be compared over the ten-year windowrepresented by the SWEIS ROD.
2.12 Bioscience Facilities (TA-43, TA-3, TA-16, TA-35, and TA-46) (Previously HealthResearch Laboratory [TA-43])The Bioscience Key Facility definition includes the main HRL facility (Buildings 43-1, -37, -45, and -20)plus support located at TA-35-85, -2 and -254, TA-<strong>03</strong>-562 and -1698, and TA-46-158/161, -217, -218, -80,-24, and -31. Additionally, Bioscience has small operations located at TA-16. Operations at TA-43, TA-35-85and -02, and TA-46-158/161 have chemical, laser, and limited radiological activities that maintain hazardousmaterials inventory and generate hazardous chemical wastes and very small amounts of LLW. Activitiesat TA-<strong>03</strong>-562, -<strong>03</strong>-1698, and TA-16 have relatively minor impacts because of low numbers of personneland limited quantities of materials. Bioscience activities at TA-<strong>03</strong>-1698, the MSL, are accounted for withpotential impacts of that Key Facility and are not double-counted here. The new Biosafety Level (BSL) 3facility, TA-<strong>03</strong>-1076, located near the MSL, is a Bioscience Division facility and will not be included in thepotential impacts analysis of the MSL Key Facility. Bioscience research capabilities focus on the study ofintact cells (BSL-1 and -2), cellular components (RNA, DNA, and proteins), instrument analysis (laser andmass spectroscopy), and cellular systems (repair, growth, and response to stressors). All Bioscience activitiesare classed as Low Hazard nonnuclear in all buildings within this Key Facility; there are no Moderate Hazardnonnuclear facilities or nuclear facilities (<strong>LA</strong>NL 2002a). TA-43-1 is now on the Radiological Facilities list(<strong>LA</strong>NL 2002b).The Bioscience Key Facility is a consolidation of bioscience functions and capabilities that represent thedynamic nature of the Yearbook, responding to the growth and decline of research and development across<strong>LA</strong>NL.2.12.1 Construction and Modifications at the Bioscience FacilitiesProjected: Outfall <strong>03</strong>A-040 exists, but is used only for the discharge of storm waters from the roofs andparking lots. It is likely to be eliminated from the NPDES permit.Actual: A two-story, 4,500-square-foot wing was dedicated and opened at Building 43-01 in June 1997.The wing has laboratories and offices on both the first and second floors and is primarily used for cytometryresearch. Although this facility modification was not forecast by the ROD, a NEPA review was conducted,resulting in a Categorical Exclusion for the expansion project (<strong>LA</strong>NL 1995).Construction of the BSL-3 facility2-126SWEIS Yearbook—2002
In addition to the new wing, process waters from cooling of a laser were routed in 1998 to the Countysewage treatment facility in Bayo Canyon. As a result, there were no discharges from Outfall <strong>03</strong>A-040in 1998. This outfall was eliminated from the NPDES permit on January 11, 1999. The animal colonywas downsized substantially in 1996 and 1997 and eliminated entirely in 1999. Research activitiesinvolving radioactive materials were moved into the space previously occupied by the animal colony. In1999, the volume of radioactive work at HRL had significantly diminished from previous years. This wasattributed to technological advances and new methods, such as the use of laser-based instrumentation andchemiluminescense, which do not require the use of radioactive materials. For instance, DNA sequencingpredominantly uses laser analysis of fluorescent dyes hooked onto DNA bases instead of radioactivetechniques. During 2000, 2001, and 2002, the volume of work with radioactive materials continued todiminish.In 2000, 2001, and 2002, buildings within TA-43 continued to have interior remodeling and rearranging toaccommodate new and existing work. In 2000, the principal change in TA-43-1 resulted from relocation ofradionuclide materials handling activities from the first floor north wing to the basement. In 2002, only minorinterior changes to accommodate operational changes have occurred.Growth in the Structural Genomics capability in 2000 resulted in the remodeling of over 1,000 square feetof laboratory and office space at <strong>LA</strong>NL. Bioscience relocated two aspects of Genomics work from TA-43-1to TA-35-85 to alleviate crowding and allow work to expand. Sequencing instruments were relocated to anundeveloped area of about 800 square feet within Building TA-35-85 that was modified to accept this work.In addition to instruments from TA-43-1, sequencing instruments from the University of New Mexico werealso added to TA-35-85. This project is an international collaboration that provides bioscience resourcesat <strong>LA</strong>NL to scientists all over the world. In 2002, Bioscience has continued the development of TA-35-85.This is a key effort for Bioscience Division. In 2002, the southwest corner of TA-35-85 was remodeledto accommodate Division needs. Phase 1 is now complete. Bioscience Division is planning to continueexpansions at TA-35 as Nonproliferation and International <strong>Security</strong> work is relocated to new buildings.The addition of Computational Biology to Bioscience in 1999 required remodeling of TA-43-45 toaccommodate the growth. This capability requires computing workstations and has affected available officespace at TA-43-1. This is a growth capability and will continue to require additional office space. Thiscapability does not generate wastes nor use hazardous materials.The HRL facility has BSL-1 and BSL-2 work, which includes limited work with infectious microbes andlow-toxicity biotoxins, as defined by the Centers for Disease Control and Prevention (CDC). All biosafetyactivities are regulated by the CDC <strong>National</strong> Institutes of Health, <strong>LA</strong>NL’s Institutional Biosafety Committee,and the Institutional Biosafety Officer. BSL-2 work is expanding as part of <strong>LA</strong>NL’s growing Chemical andBiological Nonproliferation Program.Biosafety Level 3 Facility: During 2002, Bioscience began construction of a BSL-3 facility (<strong>LA</strong>NL2000c); this activity has progressed substantially. The new BSL-3 facility is specifically designed to safelyhandle and store infectious organisms. It will enable Los Alamos scientists to fully commit to the nationalsecurity mission of <strong>LA</strong>NL and to contribute new technological solutions to the global threat of emerginginfectious diseases. It will be the first BSL-3 facility in the DOE complex.Description: The BSL-3 building will be a 3,202-square-foot, stand-alone containment facility that will belocated remotely from the Los Alamos townsite, on the canyon west of Diamond Drive and south of SigmaRoad. The building near the MSL at the intersection of Diamond Drive and Pajarito Road will contain twolaboratory spaces at the BSL-3 level, a larger BSL-2 laboratory area, offices, and related storage and changingrooms. The mechanical system will accommodate directional airflow and negative pressure from the areas oflesser to greater risk, plus door interlocks and high-efficiency particulate air (HEPA) filtration.SWEIS Yearbook—2002 2-127
Because of the building’s small size and the small quantities of samples studied, there is no expectedincrease in quantities of sewage, solid wastes, or chemical wastes, nor should there be increased demand forutilities. NEPA coverage for this project was provided by the Environmental Assessment for the ProposedConstruction and Operation of a BSL-3 Facility at <strong>LA</strong>NL (DOE 2002d) dated February 26, 2002, and aFinding of No Significant Impact (FONSI).Status: Title II Design of the building occurred from February through September 2002. Constructionbegan October 2002 and is more than 40 percent finished. The building is scheduled for completion inOctober 20<strong>03</strong>. Overlapping construction are rigorous readiness assessment activities with a projectedcompletion date of February 2004 after which operations are expected to commence.The construction and modification activities for the Bioscience Facilities are summarized in Table 2.12.1-1.Table 2.12.1-1. Construction and Modifications at the Bioscience FacilitiesSWEIS RODPROJECTIONOutfall <strong>03</strong>A-040exists1998YEARBOOKDischargeredirected to LosAlamos Countysewage treatmentplant in 1998.Two-story, 4,500-square-foot wingadded to Building43-01 in 1997.Animal colonydownsized in 1996and 1997.ACTUAL CONSTRUCTION AND MODIFICATION1999YEARBOOKOutfall eliminatedfrom NPDES permitin 1999.Animal colonyeliminated andresearch activitieswith radioactivematerials movedinto space.Radioactivematerial workdecreased.Remodeling of TA-43-45 to accommodateComputationalBiology.2000YEARBOOKRadioactivematerial workdecreased.Interior remodelingwithin TA-43buildings.Genomics workmoved from TA-43-1 to TA-35-85and expanded.2001YEARBOOKRadioactivematerial workdecreased.Interiorremodeling withinTA-43 buildings.2002YEARBOOKRadioactivematerial workdecreased.Interior remodelingwithin TA-43buildings.Southwest cornerof TA-35-85remodeled.BSL-3 facilityconstruction began(<strong>LA</strong>NL 2000c).2-128SWEIS Yearbook—2002
2.12.2 Operations at the Bioscience FacilitiesThe SWEIS identified eight capabilities for the HRL (now called the Bioscience Facilities). In 1998,Neurobiology research was moved out of the Bioscience Facility and into space controlled by the PhysicsDivision, the Physics Building at TA-<strong>03</strong> (Building TA-<strong>03</strong>-40). Potential impacts of this capability areaccounted for with the Non-Key Facilities.In 1998, levels of research were greater than they were in 1995 for all capabilities, and two areas ofresearch exceeded ROD projections. The primary reasons for this growth include the human genome project,the study of environmental effects, and research into structural cell biology.In 1999, creation of Bioscience Division led to definitional changes in the existing capabilities. As part ofthe establishment of the Bioscience Division, three of the capabilities were renamed, two were combined at ahigher level, and one was further defined into two operations as shown below:• Genomic Studies was renamed Genomics• Environmental Effects was renamed Environmental Biology• Structural Cell Biology was renamed Structural Biology• Cell Biology and DNA Damage and Repair were combined to form Molecular Cell Biology• Cytometry was further defined as operations in Measurement Science and operations in Diagnosticsand Medical Applications.The Bioscience Division developed three other operations in 1999 (Biologically Inspired Materials andChemistry, Computational Biology, and Molecular Synthesis). Impacts from these three functions werepreviously captured in the Non-Key Facilities portion of <strong>LA</strong>NL. The In-Vivo Monitoring facility andcapability continues to be located in TA-43, HRL-1 and continues at the previously reported level.Following these changes, Bioscience Division still has eight broad research capabilities:1) Biologically Inspired Materials and Chemistry2) Computational Biology3) Environmental Biology4) Genomics5) Measurement Science and Diagnostics6) Molecular and Cell Biology7) Molecular Synthesis8) Structural BiologyThe same set of capabilities still exist, but some have become more visible as research and developmentin a particular area grows, and some have become less visible as research and development in another areadeclines. This simply reflects the dynamic nature of a research laboratory.Growth in Bioscience has resulted in addition of new personnel and expanded operations. While therehave been increases in volumes of chemicals used and generation of chemical wastes, Bioscience continuesto decommission unfunded work. BSL-2 work is expanding to include use of a non-pathogenic strain ofanthrasis–delta Ames, low-toxicity biotoxins (defined by CDC), and DNA from other infectious microbes.The Institutional Biosafety Committee reviews all of this work. In addition, work with DNA from a subset oforganisms (select agents) requiring registration with the CDC continues. BSL-2 work does not generate anyinfectious wastes. Expansion of sequencing efforts was most noticeable but does not generate new wastes orincreased volumes of regulated wastes. Upgrades and remodeling have generated minimal construction debrisas laboratory areas were cleaned out and equipment was replaced or upgraded. This trend in modernizationSWEIS Yearbook—2002 2-129
is expected to continue through 20<strong>03</strong>. TA-43-1 is at capacity for both office and laboratory activities, andfuture Bioscience expansion is expected to occur at TA-35-85 and TA-46-158. Bioscience is pursuing a newbuilding at <strong>LA</strong>NL that will consolidate its work and remove activities from TA-43.Table 2.12.2-1 compares 1998–2002 operations to those predicted by the SWEIS ROD. The table includesthe number of FTEs per capability to measure activity levels compared to the SWEIS ROD. These FTEs arenot measured the same as the index shown in Table 2.12.3-1 and these numbers cannot be directly compared.All but two of the existing capabilities have activity levels greater than those projected by the SWEIS ROD.2.12.3 Operations Data for the Bioscience FacilitiesTable 2.12.3-1 presents the operations data as measured by radioactive air emissions, NPDES discharges,generated waste volumes, and number of workers. The generation of most waste (chemical, administrative,and MLLW) has decreased from historical levels and was smaller than projections.2.12.4 Cerro Grande Fire Effects at the Bioscience FacilitiesCerro Grande Fire effects on Bioscience facilities and operations included the loss of office transportablescontaining computers, intellectual property, and data at TA-46. Some computers and data were lost in homesburned by the fire. Overall, Bioscience, along with other programs at <strong>LA</strong>NL, suffered downtime and lossof productivity during the evacuation and initial damage assessment, recovery, and reentry phases. Smokedamage occurred in several buildings at TA-43 and TA-46-158/161 requiring cleaning or replacement ofan air handling system and many replacement air filters. The smoke damaged laser optics requiring theirreplacement at TA-46-158, -161, and TA-<strong>03</strong>-1698.A training exercise, using ROB (Reagentless Optical Biosensor) to test environmental samples2-130SWEIS Yearbook—2002
SWEIS Yearbook—2002 2-<strong>131</strong>Table 2.12.2-1. Bioscience Facilities/Comparison of OperationsCAPABILITIES SWEIS ROD a 1998 YEARBOOK 1999 YEARBOOK 2000 YEARBOOK 2001 YEARBOOK 2002 YEARBOOKBiologicallyInspired Materialsand ChemistryNot in SWEIS ROD. Not in SWEIS ROD.This operation wasdeveloped in 1999.Not in SWEIS ROD.This operation wasdeveloped in 1999.Not in SWEIS ROD.This operation wasdeveloped in 1999.Not in SWEIS ROD.This operation wasdeveloped in 1999.In 2002, 17 FTEs wereassociated withBiologically InspiredComputationalBiologyEnvironmentalBiology (formerlynamedEnvironmentalEffects)Genomics(formerly namedGenomic Studies)Not in SWEIS ROD.Research tocharacterize the extentof diversity inenvironmentalmicrobes and tounderstand theirfunctions andoccurrences in theenvironment.(25 FTEs)Conduct research atcurrent levels utilizingmolecular andbiochemicaltechniques todetermine and analyzethe sequences ofgenomes (human,microbes and animal).Develop strategies toanalyze the nucleotidesequence ofindividual genes,especially thoseassociated withgenetic disorders,infectious diseaseorganisms.Not in SWEIS ROD.This operation wasdeveloped in 1999.In 1998, activitiesincreased about 50%above 1995 levels to 30FTEs, and exceededSWEIS RODprojections.In 1998, activitiesincreased about 10%above 1995 levels to 43FTEs, but were stillbelow SWEIS RODprojections.Not in SWEIS ROD.This operation wasdeveloped in 1999.In 1999, 25 FTEswere associated withEnvironmentalBiology. This equalsthe SWEIS RODprojection and is anincrease of 25% over1995 levels.In 1999, 61 FTEs wereassociated withGenomics. Thisexceeded the SWEISROD projection of 50FTEs and is anincrease of 56% over1995 levels.In 2000, there were 25FTEs, expected to growto 35 FTEs by 2002.In 2000, 20 FTEs wereassociated withEnvironmentalBiology.In 2000, 50 FTEs wereassociated withGenomics.In 2001, 16 FTEs wereassociated withComputational Biology.In 2001, 27 FTEs wereassociated withEnvironmental Biology.In 2001, 47 FTEs wereassociated withGenomics.Materials and Chemistry.In 2002, 16 FTEs wereassociated withComputational Biology.In 2002, 24 FTEs wereassociated withEnvironmental Biology.In 2002, 47 FTEs wereassociated withGenomics.
2-132SWEIS Yearbook—2002Table 2.12.2-1. Bioscience Facilities/Comparison of Operations (continued)CAPABILITIES SWEIS ROD a 1998 YEARBOOK 1999 YEARBOOK 2000 YEARBOOK 2001 YEARBOOK 2002 YEARBOOKMeasurementScience andDiagnostics(formerly namedCytometry)Molecular andCell Biology(formerly CellBiology and DNADamage andRepair)Conduct researchutilizing imaging andspectroscopy systemsto analyze thestructures andfunctions ofsubcellular systemsand components. (40FTEs)Conduct research atcurrent levels utilizingwhole cells andcellular systems, bothin-vivo and in-vitro,to investigate theeffects of natural andcatastrophic cellularevents like responseto aging, harmfulchemical and physicalagents, and cancer.In 1998, activitiesincreased 10% above1995 levels to 33 FTEs,but were belowprojections made by theSWEIS ROD.In 1998, Cell Biologyactivities increased~15% above 1995 levelsto 29 FTEs, but werestill below projections of35 FTEs made by theSWEIS ROD.In 1999, 25 FTEs wereassociated withMeasurement Scienceand Diagnostics, aspecialized applicationof cytometry,microscopy,spectroscopy, andother techniques formolecular detectionand diagnosis. In 1999,10 FTEs wereassociated withMedical Applicationsutilizing laser-basedmolecular analysistechniques to developtools for clinicaldiagnosis of disease.The 35 total FTEs inCytometry is belowthe 40 FTEs projectedin the ROD.In 1999, 30 FTEs wereassociated withMolecular CellBiology. This is lessthan half of the 70FTEs projected in theROD. In 1995, a totalof 50 FTEs wereassociated with CellBiology and DNADamage and Repair.In 2000, 30 FTEswere associated withMeasurement Scienceand Diagnostics.In 2000, 30 FTEswere associated withMolecular CellBiology.In 2001, 37 FTEs wereassociated withMeasurement Scienceand Diagnostics.In 2001, 42 FTEs wereassociated withMolecular Cell Biology.In 2002, 37 FTEs wereassociated withMeasurement Science andDiagnostics.In 2002, 42 FTEs wereassociated with MolecularCell Biology.
SWEIS Yearbook—2002 2-133Table 2.12.2-1. Bioscience Facilities/Comparison of Operations (continued)CAPABILITIES SWEIS ROD a 1998 YEARBOOK 1999 YEARBOOK 2000 YEARBOOK 2001 YEARBOOK 2002 YEARBOOKMolecular andCell Biology(formerly CellBiology and DNADamage andRepair) (cont.)MolecularSynthesisStructuralBiology (formerlynamed StructuralCell Biology)In-VivoMonitoring. Thisis not aBioscienceDivisioncapability;however, it islocated at TA-43-HRL-1.Therefore, it is acapability withinthis Key Facilityand is includedhere.aThe work includesusing isolated cells toinvestigate DNArepair mechanisms.(35 FTEs)Generate biometricorganic materials andconstruct syntheticbiomolecules.Conduct researchutilizing chemical andcrystallographictechniques to isolateand characterize theproperties and threedimensionalshapes ofDNA and proteinmolecules.(15 FTEs)Perform 3,000 wholebodyscans per year asa service to the <strong>LA</strong>NLpersonnel monitor-ingprogram, whichsupports operationswith radioactivematerials conductedelsewhere at <strong>LA</strong>NL.(5 FTEs)DNA Damage andRepair activitiesincreased ~30% above1995 levels to 32 FTEs,but were still belowprojections of 35 FTEsmade by the SWEISROD.This operation wasdeveloped in 1999.In 1998, activitiesincreased 130% above1995 levels to 23 FTEsand exceeded SWEISROD projections.Conducted 1,068 wholebodyscans and 1,737other counts (detectorstudies, qualityassurancemeasurements, etc.). In1998, 5 FTEs wereassociated with thiscapability.This operation wasdeveloped in 1999.In 1999, 60 FTEs wereassociated withStructural Biology.This exceeded theSWEIS RODprojection of 15 FTEsand is an increase of500% over 1995levels.Conducted 1,250whole-body scans and1,733 other counts(detector studies,quality assurancemeasurements, etc.). In1999, 3 FTEs wereassociated with thiscapability.In 2000, 10 FTEs wereassociated with thiscapability.In 2000, 35 FTEs wereassociated withStructural Biology.Conducted 1,261whole-body scans and718 other counts(detector studies,quality assurancemeasurements, etc.). In2000, 3 FTEs wereassociated with thiscapability.FTEs: full-time equivalent scientists, researchers, and other staff supporting a particular research capability.In 2001, 16 FTEs wereassociated withMolecular Synthesis.In 2001, 18 FTEs wereassociated withStructural Biology.Conducted 1,083whole-body scans and766 other counts(detector studies,quality assurancemeasurements, etc.). In2001, 2.5 FTEs wereassociated with thiscapability.In 2002, 16 FTEs wereassociated with MolecularSynthesis.In 2002, 18 FTEs wereassociated with StructuralBiology.Conducted 1,639 wholebodyscans and 641 othercounts (detector studies,quality assurancemeasurements, etc.). In2002, 3 FTEs wereassociated with thiscapability.
2-134Table 2.12.3-1. Bioscience Facilities/Operations DataPARAMETER UNITS SWEIS ROD1998OPERATIONS1999OPERATIONS2000OPERATIONS2001OPERATIONS2002OPERATIONSRadioactive Air Emissions Ci/yr Not estimated Not measured Not measured Not measured Not measured Not measuredNPDES Discharge: a<strong>03</strong>A-040 MGY 2.5 b No discharge c Eliminated 1999 Eliminated 1999 Eliminated 1999 Eliminated 1999Wastes:Chemical kg/yr 13,000 2,368 1,691 2,370 d 1,359 d 4,504 dBiomedical Waste kg/yr 280 e
2.13 Radiochemistry Facility (TA-48)The Radiochemistry Key Facility includes all of TA-48 (116 acres). It is a research facility that fills threeroles—research, production of medical radioisotopes, and support services to other <strong>LA</strong>NL organizations,primarily through radiological and chemical analyses of samples. TA-48 contains five major researchbuildings: the Radiochemistry Laboratory (Building 48-1), the Isotope Separator Facility (48-8), theDiagnostic Instrumentation and Development Building (48-28), the Advanced Radiochemical DiagnosticsBuilding (48-45), and the Analytical Facility (48-107). As shown in Table 2.13-1, the RadiochemistryLaboratory has remained a Category 3 nuclear facility (<strong>LA</strong>NL 2002a). During 20<strong>03</strong>, the RadiochemistryLaboratory (TA-48-01) is expected to transition from a Hazard Category 3 nuclear facility to a radiologicalfacility.Machine shop at TA-48-82.13.1 Construction and Modifications at the Radiochemistry FacilityProjected: The SWEIS projected no facility changes through 2005.Actual: Although no facility changes were projected in the SWEIS ROD, a few have occurred. In1996, Building 48-01, Room 346 was converted from a storage area into a chemistry lab with fume hoods,laboratory instrumentation, and hardware such as small furnaces. The lab accommodated personnel movedfrom TA-21 to TA-48. The modification underwent NEPA review and received a categorical exclusion (DOE1997c).Another modification was the upgrade to the ventilation system and the remodeling of the chemistry labin Building 48-01, Room 430. This modification also underwent NEPA review and received a categoricalexclusion (DOE 1998f). In addition, four of the five existing outfalls were eliminated from the NPDES permitduring 1997 and 1998. The elimination of the outfalls was evaluated in an environmental assessment (DOE1996f), and subsequent Finding of No Significant Impact.SWEIS Yearbook—2002 2-135
Table 2.13-1. Radiochemistry Buildings with <strong>Nuclear</strong> Hazard ClassificationabcdeBUILDING DESCRIPTIONSWEISRODDOE1998 a DOE2000 b <strong>LA</strong>NL2001 c <strong>LA</strong>NL2001 d <strong>LA</strong>NL2002 eTA-48-0001 Radiochemistry and Hot Cell 3 3 3 3 3 3DOE/<strong>LA</strong>NL list of Los Alamos <strong>National</strong> Laboratory <strong>Nuclear</strong> Facilities (DOE 1998a)DOE/<strong>LA</strong>NL list of Los Alamos <strong>National</strong> Laboratory <strong>Nuclear</strong> Facilities (DOE 2000a)DOE/<strong>LA</strong>NL list of Los Alamos <strong>National</strong> Laboratory <strong>Nuclear</strong> Facilities (<strong>LA</strong>NL 2001a)DOE/<strong>LA</strong>NL list of Los Alamos <strong>National</strong> Laboratory <strong>Nuclear</strong> Facilities (<strong>LA</strong>NL 2001b)DOE/<strong>LA</strong>NL list of Los Alamos <strong>National</strong> Laboratory <strong>Nuclear</strong> Facilities (<strong>LA</strong>NL 2002a)During 1999, only minor maintenance activities occurred and the facility’s remaining outfall, <strong>03</strong>A-045,was eliminated from the Laboratory’s NPDES permit on December 6, 1999 (DOE 1996f). Only minormaintenance activities occurred during 2000 and 2001 with the exception of the refurbishment of theDiagnostic Instrumentation and Development Building (48-45; <strong>LA</strong>NL 2001q, DOE 1996g) because of theCerro Grande Fire and upgrading some of the basement ductwork in the Radiochemistry laboratory (Building48-01).During 2002, funds were available to do more than minor maintenance activities at the RadiochemistryFacility. In the summer of 2002, pollution prevention funds were used to replace the refrigerants in twochillers with environmentally friendly refrigerants. Additionally, Building 48-01 underwent severalimprovements and repairs: the HVAC was improved in part of the building; the roof was repaired; thelightning protection was upgraded; and life safety was improved. The machine shop in the basement ofBuilding 48-01 was moved to Building 48-08. Additionally, an acid neutralization system was installedin Building 48-45. The 50-year-old Building 48-31 was removed and replaced with Building 48-210, atransportable with office space. The machine shop in the basement of Building 48-01 was moved to Building48-08. Table 2.13.1-1 provides details.2.13.2 Operations at the Radiochemistry FacilityThe SWEIS identified ten capabilities for the Radiochemistry Key Facility. No new capabilities have beenadded, and none has been deleted. The primary measure of activity for this Key Facility is the number ofpersonnel conducting research. In 2002, approximately 170 chemists and scientists were employed, far belowthe 250 projected by the SWEIS ROD. 6 As seen in Table 2.13.2-1, only two capabilities were active at levelsprojected by the SWEIS ROD: Radionuclide Transport Studies, Actinide and TRU Chemistry, and SampleCounting.2.13.3 Operations Data for the Radiochemistry FacilityThe overall level of activity at the Radiochemistry Facility has been below that projected by the SWEISROD. Two of the ten capabilities at this Key Facility were conducted at levels projected by the SWEIS ROD;the others were at or below activity levels identified during preparation of the SWEIS. As a result, for themost part, operations data were also below those projected by the SWEIS ROD, as shown in Table 2.13.3-1.An exception occurred during 2000 through 2002 when a large quantity of chemical wastes categorized asindustrial solid wastes was generated. 7 These industrial solid wastes are nonhazardous, may be disposed incounty landfills, and do not present a threat to the local environs. The quantities of TRU and MLLW generatedduring 2002 result from the plans to transition TA-48-1 from a nuclear facility to a radiological facility. Thewastes generated were shipped to TA-54.6 The 170 chemists and scientists listed cannot be directly compared to the FTEs shown in Table 2.13.3-1, because the two numbers represent twodifferent populations of individuals. The 170 chemists and scientists listed include temporary staff, students, and visiting scientists, whereas, the 124FTEs only includes full-time and part-time regular <strong>LA</strong>NL staff.7 In the SWEIS, the term “industrial solid waste” was used for construction debris, chemical waste, and sensitive paper records.2-136SWEIS Yearbook—2002
SWEIS Yearbook—2002 2-137Table 2.13.1-1. Construction and Modifications at the Radiochemistry FacilitySWEIS RODACTUAL CONSTRUCTION AND MODIFICATIONPROJECTION 1998 YEARBOOK 1999 YEARBOOK 2000 YEARBOOK 2001 YEARBOOK 2002 YEARBOOKProjected no facilitychanges through 2005Building 48-01, Room346 converted 3,500square feet of storagespace to chemistrylaboratory space (DOE1997c).Building 48-01, Room430. Upgraded theventilation systems andremodeled chemistrylab (DOE 1998f).Four outfallseliminated during 1997and 1998:04A-016, 04A-152,04A-<strong>131</strong>, and 04A-153(DOE 1996f).Minor maintenance:office modifications,chiller replaced, and somebasement ventilationremoved.Remaining outfalleliminated: <strong>03</strong>A-045(DOE 1996a).Minor maintenanceactivities.Minor maintenanceactivities.Building 48-01Upgraded some of thebasement ductwork.Building 48-45 refurbisheddue to Cerro Grande Fire(<strong>LA</strong>NL 2001q, DOE1996g).Minor maintenanceactivities.Building 48-01 replacedrefrigerants in two chillerswith pollution preventionfunds. Improved someHVAC. Repaired roofUpgraded lightningprotection. Improved lifesafety.Building 48-01Removed machine shopfrom basement.Building 48-08Installed machine shopfrom Building 48-01.Building 48-31 removed.Building 48-45Installed acidneutralization system.Building 48-210transportable officebuilding installed toreplace TA-48-31.
2-138SWEIS Yearbook—2002Table 2.13.2-1. Radiochemistry Facility (TA-48)/Comparison of OperationsCAPABILITYRadionuclide TransportStudiesEnvironmentalRemediation SupportUltra-Low-LevelMeasurementsSWEIS RODActinide transport,sorption, and bacterialinteraction studies.Development of modelsfor evolution ofgroundwater. Assessmentof performance or risk ofrelease for radionuclidesources at proposed wastedisposal sites. (28 to 34FTEs a )Background contaminationcharacterization pilotstudies. Performanceassessments, soilremediation research anddevelopment, and fieldsupport. (34 FTEs a )Isotope separation andmass spectrometry.(30 FTEs a )<strong>Nuclear</strong>/Radiochemistry Radiochemical operationsinvolving quantities ofalpha-, beta-, and gammaemittingradionuclides fornon-weapons and weaponswork. (44 FTEs a )Isotope ProductionTarget preparation. Highlevelbeta/gammachemistry and targetprocessing to recoverisotopes for medical andindustrial application.(15 FTEs a )1998OPERATIONS a 1999OPERATIONS b 2000OPERATIONS c 2001OPERATIONS c 2002OPERATIONS cIncreased level of Increased level of Increased level of During 2001, During 2002,operations,operations,operations,operations continued operations continuedapproximately twice approximately twice approximately twice at approximately at approximately1995 levels. (32 1995 levels. (35 levels identified twice the levels twice the levelsFTEs)FTEs)during preparation of identified during identified duringthe SWEIS. (36 FTEs) preparation of the preparation of theSWEIS. (36 FTEs) SWEIS. (36 FTEs)Decreased level ofoperations,approximately half1995 levels. (9 FTEs)Slightly increasedlevel of operations,approximately thesame as in 1995. (15FTEs)Slightly increasedlevel of operations,approximately thesame as 1995 levels.(40 FTEs)Slightly increasedlevel of operations,approximately thesame as in 1995. (12FTEs)Decreased level ofoperations,approximately half1995 levels. (10FTEs)Level of operations,approximately thesame as in 1995. (14FTEs)Slightly decreasedlevel of operations,but approximately thesame as 1995 levels.(35 FTEs)Slightly increasedlevel of operations,approximately thesame as in 1995. (11FTEs)Decreased level ofoperations,approximately halflevels identifiedduring preparation ofthe SWEIS. (10 FTEs)Level of operations,approximately thesame as levelsidentified duringpreparation of theSWEIS. (14 FTEs)Slightly decreasedlevel of operations,but approximately thesame as levelsidentified duringpreparation of theSWEIS. (35 FTEs)Slightly increasedlevel of operations,but approximately thesame as levelsidentified duringpreparation of theSWEIS. (11 FTEs)During 2001,operations continuedat approximately halfthe levels identifiedduring preparation ofthe SWEIS. (10 FTEs)Level of operationswas approximately thesame as levelsidentified duringpreparation of theSWEIS. (14 FTEs)Slightly decreasedlevel of operations,but approximately thesame as levelsidentified duringpreparation of theSWEIS. (35 FTEs)Slightly increasedlevel of operations,but approximately thesame as levelsidentified duringpreparation of theSWEIS. (11 FTEs)During 2002,operations continuedat approximately halfthe levels identifiedduring preparation ofthe SWEIS. (10 FTEs)Level of operationswas approximately thesame as levelsidentified duringpreparation of theSWEIS. (14 FTEs)Slightly decreasedlevel of operations,but approximately thesame as levelsidentified duringpreparation of theSWEIS. (35 FTEs)Slightly increasedlevel of operations,but approximately thesame as levelsidentified duringpreparation of theSWEIS. (11 FTEs)
SWEIS Yearbook—2002 2-139Table 2.13.2-1. Radiochemistry Facility (TA-48)/Comparison of Operations (continued)CAPABILITYActinide/TRUChemistryData AnalysisInorganic ChemistrySWEIS RODRadiochemical operationsinvolving significantquantities of alphaemittingradionuclides.(12 FTEs a )Re-examination of archivedata and measurement ofnuclear process parametersof interest to weaponsradiochemists. (10 FTEs a )Synthesis, catalysis,actinide chemistry:Chemical synthesis ofnew organo-metalliccomplexesStructural and reactivityanalysis, organic productanalysis, and reactivityand mechanistic studiesSynthesis of new ligandsfor radiopharmaceuticalsEnvironmental technologydevelopment:Ligand design andsynthesis for selectiveextraction of metalsSoil washingMembrane separatordevelopmentUltrafiltration(49 FTEs a —total for bothactivities)1998OPERATIONS a 1999OPERATIONS b 2000OPERATIONS c 2001OPERATIONS c 2002OPERATIONS cIncreased operations, Increased operations, Increased operations, Increased operations, Significant decreaseapproximately twice approximately twice approximately twice approximately twice in quantities of alphaemitting1995 levels. (14 1995 levels. (13 levels identified levels identifiedradionuclidesFTEs)FTEs)during preparation of during preparation of used in operations.Slight increase from1995 to six FTEs, butless than projected bythe SWEIS ROD.Slight decrease fromlevels in 1995 to 32FTEs, belowprojections of theSWEIS ROD.Slight increase from1995 to six FTEs, butless than projected bythe SWEIS ROD.Same level of activityas in 1995 (35 FTEs),but below projectionsof the SWEIS ROD.the SWEIS. (14 FTEs)Slight increase fromlevels identifiedduring preparation ofthe SWEIS to sixFTEs, but less thanprojected by theSWEIS ROD.Same level of activity(35 FTEs) as levelsidentified duringpreparation of theSWEIS, but belowprojections of theSWEIS ROD.the SWEIS. (14 FTEs)Slight increase fromlevels identifiedduring preparation ofthe SWEIS to sixFTEs, but less thanprojected by theSWEIS ROD.Same level of activity(35 FTEs) as levelsidentified duringpreparation of theSWEIS, but belowprojections of theSWEIS ROD.(14 FTEs)Slight increase fromlevels identifiedduring preparation ofthe SWEIS to sixFTEs, but less thanprojected by theSWEIS ROD.Same level of activity(35 FTEs) as levelsidentified duringpreparation of theSWEIS, but belowprojections of theSWEIS ROD.
Table 2.13.2-1. Radiochemistry Facility (TA-48)/Comparison of Operations (continued)2-140CAPABILITYStructural AnalysisSample CountingabcSWEIS RODSynthesis and structuralanalysis of actinidecomplexes at currentlevels.X-ray diffraction analysisof powders and singlecrystals at current levels.(22 FTEs a )Measurement of thequantity of radioactivity insamples using alpha-,beta-, and gamma-raycounting systems.(5 FTEs a )19981999200020012002OPERATIONS a OPERATIONS b OPERATIONS c OPERATIONS c OPERATIONS cDecreased level ofoperations from 1995,and about 1/3 of thoseprojected by theSWEIS ROD. (6FTEs)Approximately thesame as SWEIS ROD.(6 FTEs)Decreased level ofoperations from 1995,and about 1/3 of thoseprojected by theSWEIS ROD. (8FTEs)Approximately thesame as SWEIS ROD.(6 FTEs)Decreased level ofoperations from levelsidentified duringpreparation of theSWEIS, and aboutone-third of thoseprojected by theSWEIS ROD.(7 FTEs)Approximately thesame as projected bythe SWEIS ROD.(6 FTEs)Decreased level ofoperations from levelsidentified duringpreparation of theSWEIS, and aboutone-third of thoseprojected by theSWEIS ROD.(7 FTEs)During 2001, slightincrease in the numberof samples projectedby the SWEIS ROD.(6 FTEs)Decreased level ofoperations from levelsidentified duringpreparation of theSWEIS, and aboutone-third of thoseprojected by theSWEIS ROD.(7 FTEs)During 2002, slightincrease in thenumber of samplesprojected by theSWEIS ROD.(6 FTEs)FTEs: full-time-equivalent scientists, researchers, and other staff supporting a particular research capability.Projections in the ROD were made as increments to the current level of operations as expressed by the “No Action” alternative for the current (1995) year. Thus, 1999operations must use increments from 1995 operational levels for comparison.FTEs: full-time-equivalent. It is imperative that these FTE numbers are not confused with the FTEs identified in Table 2.13.3-1. Two different populations ofindividuals are represented. The FTEs in this table include students, visitors, and temporary staff. The FTEs in Table 2.13.3-1 only include full-time and part-timeregular <strong>LA</strong>NL staff.SWEIS Yearbook—2002
SWEIS Yearbook—2002 2-141Table 2.13.3-1. Radiochemistry Facility (TA-48)/Operations DataPARAMETER UNITS SWEIS ROD1998OPERATIONS1999OPERATIONS2000OPERATIONS2001OPERATIONS2002OPERATIONSRadioactive Air Emissions:Mixed Fission Products Ci/yr 1.4E-4 None detected Not reported a Not reported a Not reported a Not reportedPlutonium-238 Ci/yr Not Projected b None detected None detected c None detected c None detected c 2.3E-10Plutonium-239 Ci/yr 1.1E-5 None detected None detected c None detected c None detected c 1.5E-9Uranium-234 Ci/yr Not Projected b 1.35E-7 None detected c None detected c None detected c Not detectedUranium-235 Ci/yr 4.4E-7 5.00E-9 None detected c None detected c None detected c Not detectedMixed ActivationCi/yr 3.1E-6 None detected Not reported a Not reported a Not reported a Not reportedProductsUranium-238 Ci/yr Not Projected d None detected 6.0E-10 None detected c None detected c Not detectedArsenic-72 Ci/yr 1.1E-4 None detected None detected c None detected c None detected c Not detectedArsenic-73 Ci/yr 1.9E-4 None detected 1.8E-5 4.4E-5 4.2E-5 2.3E-3Arsenic-74 Ci/yr 4.0E-5 9.46E-7 4.5E-5 2.8E-5 1.1E-5 1.2E-3Beryllium-7 Ci/yr 1.5E-5 None detected None detected c None detected c None detected c Not detectedBromine-77 Ci/yr 8.5E-4 8.68E-5 1.2E-5 2.8E-5 None detected c Not detectedGermanium-68 Ci/yr 1.7E-5 None detected 1.7E-3 8.1E-3 1.1E-3 3.4E-3Gallium-68 Ci/yr 1.7E-5 None detected 1.7E-3 8.1E-3 1.1E-3 3.4E-3Rubidium-86 Ci/yr 2.8E-7 None detected None detected c None detected c None detected c Not detectedSelenium-75 Ci/yr 3.4E-4 2.41E-5 3.5E-4 1.4E-4 None detected c 3.8E-7Silicon-32 Ci/yr Not Projected e Not measured 5.1E-6 Not measured Not measured Not measuredNPDES Discharge: fTotal Discharges MGY 4.1 No Discharge No Discharge No Discharge No discharge No discharge<strong>03</strong>A-045 MGY 0.87 No Discharge Eliminated 1999 g Eliminated - 1999 Eliminated 1999 Eliminated 199904A-016 MGY None Eliminated 1997 Eliminated 1997 Eliminated 1997 Eliminated 1997 Eliminated 199704A-<strong>131</strong> MGY None Eliminated 1998 Eliminated 1998 Eliminated 1998 Eliminated 1998 Eliminated 199804A-152 MGY None Eliminated 1997 Eliminated 1997 Eliminated 1997 Eliminated 1997 Eliminated 199704A-153 MGY 3.2 Eliminated 1998 Eliminated 1998 Eliminated 1998 Eliminated 1998 Eliminated 1998Wastes:Chemical kg/yr 3,300 1,990 1,513 12,461 h 17,725 i 186,135 jLLW m 3 /yr 270 89 44 57 55 34MLLW m 3 /yr 3.8 0.3 0.6 1.6 2.8 2.2TRU k m 3 /yr 0 0.2 0 0 0 0Mixed TRU k m 3 /yr 0 0 0 0 0 0Number of FTEs 248 l 129 l 128 lWorkers 128 l 124 l 122 l 110 laAlthough stack sampling systems were in place to measure these emissions, any emissions were sufficiently small to be below the detection capabilities of thesampling systems.bEmission categories of 'mixed fission products' and 'mixed activation products' are no longer used. Instead, where fission or activation products are measured, they arereported as specific radionuclides, e.g., Cesium-137 or Cobalt-60.
Table 2.13.3-1. Radiochemistry Facility (TA-48)/Operations Data (continued)2-142cdefghijklThe SWEIS ROD did not contain projections for this radioisotope.The radionuclide was not projected in the ROD because it was either dosimetrically insignificant or not isotopically identified.The Silicon-32 emissions were not expected. There was a slight process problem that resulted in these emissions. The dose from these emissions was not significant.Outfalls eliminated before 1999: 04A-016 (TA-48), 04A-<strong>131</strong> (TA-48), 04A-152 (TA-48), and 04A-153 (TA-48).This outfall was eliminated from the NPDES permit on December 6, 1999.Approximately 10,959 kilograms of this chemical waste represents construction and demolition debris (previously identified in the Yearbook as industrial solid waste)resulting from cleanup following the Cerro Grande Fire. The construction and demolition debris is nonhazardous and is disposed in regular county landfills.Approximately 8,861 kilograms of this waste was generated during chemical cleanouts of TA-48-01 during 2001.The CY 2002 chemical waste volume includes 182,891.52 kilograms of contaminated soil from a construction project outside TA-48-1. The contamination was from aleaky pipe uncovered during excavation of trenches for new utilities.TRU waste was projected to be returned to the generating facility.The first number shown in the “SWEIS ROD” column is the actual employee count representing CY 1999 (the year the SWEIS ROD was published). The secondnumber shown in the “SWEIS ROD” column is the index number representing CY 1999 (the year the SWEIS ROD was published). The number of employees forCY 1998 through CY 2002 operations cannot be directly compared to numbers projected by the SWEIS ROD. The employee numbers projected by the SWEIS RODrepresent total workforce size and include PT<strong>LA</strong>, JCNNM, and other subcontractor personnel. The number of employees for CY 1998 through CY 2002 operationsis routinely collected information and represents only UC employees (regular full-time and part-time). Because the two sets of numbers (SWEIS ROD versus thenew index) do not represent the same entity, a direct comparison to numbers projected by the SWEIS ROD (see Section 3.6, Socioeconomics) is not a ppropriate.However, because this index is going to be used in each subsequent Yearbook, selecting CY 1999 as the base year establishes an index that can be compared overthe ten-year window represented by the SWEIS ROD.SWEIS Yearbook—2002
2.13.4 Cerro Grande Fire Effects at the Radiochemistry FacilitySix structures were affected by the Cerro Grande Fire. As summarized in Table 2.13.4-1, five suffered onlyminor effects; activities in these buildings were not affected. Building 48-45, the Advanced RadiochemicalDiagnostics Building, however, suffered severe ash, dirt, and soot contamination.Table 2.13.4-1. Fire-Damaged Structures at TA-48NO. STRUCT<strong>UR</strong>E DAMAGE48-26 Office building Replace filters; cleaned48-33 Office trailer Replace filters; cleaned48-45 Advanced Radiological Diagnostics Damaged48-56 Office trailer Roof damage48-57 Office trailer Roof damage48-2<strong>03</strong> Office trailer North skirt melted; insulation damagedThe only way to return Building 48-45 to service was to gut its interior. Nearly everything was removed(ceiling tiles, piping, instrumentation, etc.) and disposed as waste. Since this is a laboratory used for sensitiveenvironmental analyses (and hence maintained apart from other TA-48 lab buildings, which host radiologicalactivities), wastes from this cleanup activity were construction and demolition debris (previously indicated inthe yearbooks as industrial solid wastes). They were shipped direct from TA-48 to a municipal landfill. Thecleanup began in 2000 and continued into 2001.2.14 Radioactive Liquid Waste Treatment Facility (TA-50)The RLWTF is located at TA-50 and consists of the treatment facility (Building 50-1), support buildings,and liquid and chemical storage tanks. The primary activity is treatment of radioactive liquid wastesgenerated at other <strong>LA</strong>NL facilities. The facility also houses analytical laboratories to support waste treatmentoperations.As shown in Table 2.14-1, this Key Facility consists of the following structures: the RLWTF itself(Building 50-01), the tank farm and pumping station (50-2), the acid and caustic solution tank farm (50-66),and a 100,000-gallon influent holding tank (50-90). The RWTF is presently considered a single HazaradCategory 3 facility. It is anticipated that it will become a Hazard Category 2 facility upon approval of thesubmitted Documented Safety Analysis. The Documented Safety Analysis was submitted for review by DOEin the second quarter of FY 20<strong>03</strong>. The SWEIS identified only the RLWTF main building as a nuclear facilityand gave it a ranking of Category 2. There are no other nuclear facilities and no Moderate Hazard nonnuclearbuildings within this Key Facility (<strong>LA</strong>NL 2002a).Initial treatment of radioactive liquid waste by chemical precipitationSWEIS Yearbook—2002 2-143
Table 2.14-1. Radioactive Liquid Waste Treatment Facility Buildings with <strong>Nuclear</strong> HazardClassificationBUILDINGDESCRIPTIONSWEISRODDOE DOE <strong>LA</strong>NL <strong>LA</strong>NL <strong>LA</strong>NL1998 a 2000 b 2001 c 2001 d 2002 eTA-50-0001 Main Treatment Plant 2 3 3 3 3 3TA-50-0002 LLW Tank Farm 3 3 3 3 3TA-50-0066 Acid and Caustic Tank Farm 3 3 3 3 3TA-50-0090 Holding Tank 3 3 3 3 3aDOE/<strong>LA</strong>NL list of Los Alamos <strong>National</strong> Laboratory <strong>Nuclear</strong> Facilities (DOE 1998a)bDOE/<strong>LA</strong>NL list of Los Alamos <strong>National</strong> Laboratory <strong>Nuclear</strong> Facilities (DOE 2000a)cDOE/<strong>LA</strong>NL list of Los Alamos <strong>National</strong> Laboratory <strong>Nuclear</strong> Facilities (<strong>LA</strong>NL 2001a)dDOE/<strong>LA</strong>NL list of Los Alamos <strong>National</strong> Laboratory <strong>Nuclear</strong> Facilities (<strong>LA</strong>NL 2001b)eDOE/<strong>LA</strong>NL list of Los Alamos <strong>National</strong> Laboratory <strong>Nuclear</strong> Facilities (<strong>LA</strong>NL 2002a)2.14.1 Construction and Modifications at the Radioactive Liquid Waste Treatment FacilityProjected: The SWEIS ROD projected three modifications to the RLWTF Key Facility: upgrade the tankfarm, install a new UF/RO process, and install nitrate reduction equipment.Actual: The three modifications to the RLWTF Key Facility projected by the SWEIS ROD werecompleted. The tank farm was upgraded in 1998. Four aboveground storage tanks were installed in 1997.Upon installation of the aboveground tanks, use of the influent underground storage tanks was to havestopped. However, both the aboveground and all but two of the underground storage tanks are in use. Oneunderground tank was removed from service and is being used as a secondary containment vessel instead. Thesecond underground tank was used to hold sludge generated by the treatment process. This sludge is now heldin a metal tank with secondary containment. Sludge has been removed from the underground tanks. This tankis being decommissioned. The new UF/RO process was installed in 1998 and became operational March 22,1999. Nitrate reduction equipment was installed in 1998 and became operational on March 15, 1999. Unlikethe SWEIS description, however, the treatment was by chemical reduction, not biological process. Theprocess treated only small batches of high-nitrate radioactive liquid waste. There have been zero violationsof the State of New Mexico discharge agreement for nitrate-nitrogen (10 milligrams per liter) from Marchthrough August 20<strong>03</strong>. And despite a longer break-in for the UF/RO equipment, the RLWTF effluent has beenbelow DOE’s guidelines for radioactivity beginning December 10, 1999 and continuing through August 20<strong>03</strong>.Facility personnel also installed an electrodialysis reversal unit in 1999 and an evaporator in 2000. Bothunits process the waste stream from the reverse osmosis unit. They received NEPA coverage throughCategorical Exclusions #7428, approved 02/23/99 (DOE 1999d), and #7737, approved 10/29/99 (DOE1999e). The SWEIS ROD projected neither of these modifications. Additionally, the RLWTF installed ionexchange resins in March 2002 for the removal of perchlorate from the facility effluent water.Decontamination operations were relocated during 2000 from Building 50-01 to TA-54. Except for thelead decontamination trailer, decontamination operations were moved to the west end of TA-54. Radioactiveliquid wastes generated during decontamination operations are collected in two holding tanks at TA-54, whichare trucked to the RLWTF at TA-50. The lead decontamination trailer, formerly located between Buildings50-83 and 50-02, was sent to Area G and decommissioned. The quantity of lead that needed decontaminationhad become so small that maintaining this operation was no longer cost effective. Building 50-83, thefabrication shop at the RLWTF, has been moved to TA-54 in anticipation of the funding to construct aninfluent tank farm facility and new pump house.During 2001, the cross-country transfer line, dedicated to the transfer of radioactive liquid wastes fromthe TA-21 tritium facilities to the TA-50 RLWTF, was taken out of service, flushed, drained, and capped. Forenvironmental protection, the pipeline was removed from service; it was a single-walled pipe for its entirelength (~two miles). Reduction of radioactive liquid waste volumes generated at the TA-21 facilities enabled2-144SWEIS Yearbook—2002
the line to be taken out of service; the smaller volumes can now be transported from TA-21 to TA-50 or TA-53by truck. In 2002, the cross-country transfer line was mostly removed as part of land transfer.Also during 2001, nitrate reduction equipment was removed from service. Source evaluation had shown thatmore than 70 percent of the nitrates in the <strong>LA</strong>NL radioactive liquid waste were found in less than 1 percent ofthe waste volume. These low-volume, high-nitrate liquid wastes are now segregated by waste generators andshipped to commercial hazardous waste treatment facilities. Table 2.14.1-1 provides details.Table 2.14.1-1. Radioactive Liquid Waste Treatment Facility Construction and ModificationsSWEIS RODPROJECTIONReplace influentundergroundstorage tanksaInstall a UF/ROprocessInstall nitratereductionequipment1998YEARBOOKTank farmupgraded byreplacing two ofthree undergroundstorage tanks withfour abovegroundsteel tanks in 1997.Process installed in1998.Equipmentinstalled in 1998.ACTUAL CONSTRUCTION AND MODIFICATION1999YEARBOOKProcess becameoperational in 1999.Installed anelectrodialysisreversal unit andbegan constructionof an evaporator tosupport UF/ROprocess (DOE1999d, DOE 1999e).Equipment becameoperational in 1999.2000YEARBOOK a 2001YEARBOOKDecontaminationoperations relocatedfrom BuildingTA-50-01 to TA-54.Lead decontaminationtrailer sent toArea G fordecommissioning.Nitrate reductionequipment wasremoved fromservice.Cross-countrytransfer linebetween TA-21and TA-50RLWTF taken outof service.Additional information on the impacts of the Cerro Grande Fire can be found in Section 2.14.4.2002YEARBOOKInstallation of ionexchange processto remove perchloratefrom theRLWTF effluent.Begin use ofmetal tank withsecondary containmentfor holdingprocess sludge.SWEIS Yearbook—2002 2-145
2.14.2 Operations at the Radioactive Liquid Waste Treatment FacilityThe SWEIS identified five capabilities for the RLWTF Key Facility. The primary measurement of activityfor this facility is the volume of radioactive liquid processed through the main treatment equipment. From1998 through 2002, all discharge volumes have been less than the projected discharge volume of 35 millionliters per year in the SWEIS ROD. In 1998, this volume was 23 million liters of treated radioactive wastedischarged to Mortandad Canyon. This is 12 million liters less than the discharge volume of 35 million litersprojected by the ROD. In 1999, the discharged volume of treated radioactive waste was 20 million liters, 15million liters less than projected by the ROD. In 2000, the discharged volume of treated radioactive wastewas 19 million liters, 16 million liters less than projected by the ROD. In 2001, the discharged volume oftreated radioactive waste was 14 million liters, 21 million liters less than projected by the ROD. In 2002, theRLWTF treated 11.5 million liters of radioactive liquid waste prior to discharging into Mortandad Canyon.Two factors have contributed to reduced waste volumes. Source reduction efforts re-routed two significantwaste streams, nonradioactive discharge waters from a cooling tower at TA-21 and a boiler at TA-48, tothe <strong>LA</strong>NL sewage plant during the summer of 2001. Internal recycling also reduced radioactive liquidwaste volumes. During 2001 and 2002, process waters were used instead of tap water for the dissolution ofchemicals needed in the treatment process. This recycle eliminated approximately two million liters per yearof fresh water use. Process waters, instead of tap water, were also used for filter backwash operations. Thismodification reduced waste volumes by 200,000 liters in 2001 and by 500,000 liters in 2002.In 2002, a perchlorate removal system was added to the main treatment plant at TA-50. Ion exchangeresin columns were installed and placed in service on March 26, 2002, to remove perchlorates from all theRLWTF effluent. To date, the resins have effectively removed perchlorates to less than the 4 parts per billiondetection limit in all waters discharged since installation. These actions were taken despite the fact that thereare no EPA or New Mexico discharge standards for perchlorate. This project received NEPA review throughCategorical Exclusion #8632 (DOE 2002e).As seen in Table 2.14.2-1, operations at the RLWTF during the 1998–2002 timeframe were below levelsprojected by the SWEIS ROD.One of the radioactive liquid waste operators prepares to start the reverse osmosis unit2-146SWEIS Yearbook—2002
Table 2.14.2-1. Radioactive Liquid Waste Treatment Facility (TA-50)/Comparison of OperationsSWEIS Yearbook—2002 2-147CAPABILITY SWEIS ROD a 1998 YEARBOOK 1999 YEARBOOK 2000 YEARBOOK 2001 YEARBOOK 2002 YEARBOOKWasteSupport, certify, and audit As projected. As projected. As projected. As projected. As projected.Characterization generator characterizationPackaging,LabelingWaste Transport,Receipt, andAcceptanceRadioactiveLiquid WastePretreatmentRadioactiveLiquid WasteTreatmentprograms.Maintain waste acceptancecriteria for radioactive liquidwaste treatment facilities.Collect radioactive liquidwaste from generators andtransport to TA-50.Pretreat 900,000 liters peryear of radioactive liquidwaste at TA-21.Pretreat 80,000 liters per yearof radioactive liquid wastefrom TA-55 in Room 60.Solidify, characterize, andpackage 3 m 3 per year of TRUwaste sludge in Room 60.Install UF/RO equipment in1997.Install equipment for nitratereduction in 1999.Treat 35 million liters peryear of radioactive liquidwaste.De-water, characterize, andpackage 10 m 3 per year ofLLW sludge.Solidify, characterize, andpackage 32 m 3 per year ofTRU waste sludge.As projected. As projected. As projected. As projected. As projected.As projected. As projected. As projected. As projected. As projected.Pretreated 370,000liters at TA-21.Pretreated 39,000liters in Room 60.No TRU waste sludgewas treated; solidificationwas conductedin Room 60 (5 m 3 in1997; 5 m 3 in 1999).UF/RO equipmentinstalled in 1998.Nitrate reductionequipment installed in1998.Treated 23 millionliters of radioactiveliquid waste.De-watered 28 m 3 ofLLW sludge.No TRU waste sludgewas solidified.Pretreated 45,000liters at TA-21.Pretreated less than80,000 liters in Room60.Solidified 5 m 3 ofTRU waste in Room60.UF/RO equipmentoperational in March1999.Nitrate reductionequipment operationalin March 1999.Treated 20 millionliters of radioactiveliquid waste.De-watered 37 m 3 ofLLW sludge.No TRU waste sludgewas solidified.Pretreated 45,000liters at TA-21.Pretreated 9,000 litersin Room 60.Solidified 5 m 3 ofTRU waste sludge inRoom 60.UF/RO equipmentoperational in March1999.Nitrate reductionequipment operationalin March 1999.Treated 19 millionliters of radioactiveliquid waste.De-watered 48 m 3 ofLLW sludge.No TRU waste sludgewas solidified.Pretreated 457,000liters at TA-21.Pretreated 22,000liters in Room 60.No TRU waste sludgewas solidified inRoom 60.UF/RO equipmentinstalled in 1998 andsubsequently removedin 2001.Nitrate reductionequipment installed in1998 andsubsequently removedin 2001.Treated 14 millionliters of radioactiveliquid waste.De-watered 60 m 3 ofLLW sludge.Solidified 5 m 3 ofTRU waste sludge.Pretreated 36,700liters at TA-21.Pretreated 35,400liters in Room 60.No TRU wastesludge was solidifiedin Room 60.UF/RO equipmentinstalled in 1998.Nitrate reductionequipment installedin 1998 andsubsequentlyremoved in 2001.Treated 11.5 millionliters of radioactiveliquid waste.Produced 52 m3 ofde-watered LLWsludge.No TRU waste sludgewas solidified.
Table 2.14.2-1. Radioactive Liquid Waste Treatment Facility (TA-50)/Comparison of Operations (continued)2-148SWEIS Yearbook—2002abCAPABILITY SWEIS ROD a 1998 YEARBOOK 1999 YEARBOOK 2000 YEARBOOK 2001 YEARBOOK 2002 YEARBOOKInstallation of ionexchange resincolumns to removeperchlorates from allthe RLWTF effluent.DecontaminationOperationsDecontaminate <strong>LA</strong>NLpersonnel respirators for reuse(~700 per month).Decontaminate airproportionalprobes for reuse(~300 per month).Decontaminate vehicles andportable instruments for reuse(as required).Decontaminate preciousmetals for resale (acid bath).Decontaminate scrap metalsfor resale (sandblast).Decontaminate 200 m 3 of leadfor reuse (grit blast).Decontaminated 500personnel respiratorsper month.Decontaminated 250faces and 200 bodiesper month.Decontaminated twovehicles in 1998 andeight portableinstruments per month.Decontamination ofprecious metals startedin 1998 via decon ofplatinum from TRUwaste to LLW.Decontaminated 11 m 3of scrap metals.Decontaminated onem 3 of lead.Decontaminated 425personnel respiratorsper month.Decontaminated 93faces and 94 bodiesper month.Decontaminated 26drill bits, 12 augers,four collars, and sixportable instrumentsper month.Decontaminatedplatinum from TRUwaste to LLW.Decontaminated noscrap metalsDecontaminated 2.3m 3 of lead.Decontaminated 450personnel respiratorsper month.Decontaminated about125 air-proportionalprobes per month.Decontaminated sixportable instrumentsper month. No largeitemdecontaminationwas performed.No activity.Decontaminated 386ft 3 of metal and 58 ft 3of circuit boards forrecycle.Decontaminated 0.15m 3 of lead.No activity. b Decontaminationoperationswere relocated during2000 from Building50-01 to TA-54.No activity. b Decontaminationoperationswere relocated during2000 from Building50-01 to TA-54.No activity. b Decontaminationoperationswere relocated during2000 from Building50-01 to TA-54.No activity. b Decontaminationoperationswere relocated during2000 from Building50-01 to TA-54.No activity. b Decontaminationoperationswere relocated during2000 from Building50-01 to TA-54.No activity. b Decontaminationoperationswere relocated during2000 from Building50-01 to TA-54.No activity. b Decontaminationoperationswere relocated during2000 from Building50-01 to TA-54.No activity. b Decontaminationoperationswere relocated during2000 from Building50-01 to TA-54.No activity. b Decontaminationoperationswere relocated during2000 from Building50-01 to TA-54.No activity. b Decontaminationoperationswere relocated during2000 from Building50-01 to TA-54.No activity. b Decontaminationoperationswere relocated during2000 from Building50-01 to TA-54.No activity. b Decontaminationoperationswere relocated during2000 from Building50-01 to TA-54.Includes installation of UF/RO and nitrate reduction processes in Building 50-01 and installation of aboveground tanks for the collection of influent radioactive liquidwaste.Decontamination operations are reported as part of the Solid Radioactive and Chemical Waste Key Facility.
2.14.3 Operations Data for the Radioactive Liquid Waste Treatment FacilityIn 1998, liquid effluent from the RLWTF did not meet DOE’s discharge criteria for water quality. In orderto improve effluent quality, the treatment process was upgraded in 1999 to include UF/RO equipment. Theseprocess modifications have contributed to improved effluent quality. Calendar year 2002 marked the thirdconsecutive year that there were zero violations of the State of New Mexico discharge agreement for nitrates,zero violations of NPDES permit limits, and zero exceedances of the DOE discharge standards for radioactiveliquid wastes. Annual average nitrate-nitrogen discharges were reduced from 360 milligrams per liter in 1993to less than 10 milligrams per liter in 2000 and remained at the less-than-10-milligram-level through 2002.Similarly, annual average radioactive discharges were reduced from greater than 250 picocuries alpha activityper liter during the period 1993–1999 to 13 picocuries per liter in 2000, 18 picocuries per liter in 2001, and 15picocuries per liter in 2002.The SWEIS ROD did not project the quality of effluent, only quantity. This and other consequences ofoperation were less than projected in the SWEIS ROD. Radioactive air emissions continued to be negligible(less than one microcurie); NPDES discharge volume was 2.9 million gallons, compared to a projected 9.3million gallons; the quantity of LLW sludge was higher than projected in part due to the removal of sludgefrom the concrete sludge storage tank in WM-2. Table 2.14.3-1 provides details.2.14.4 Cerro Grande Fire Effects at the Radioactive Liquid Waste Treatment FacilityThe RLWTF was one of the very few facilities that operated during the Cerro Grande Fire. Operationswere mandatory because readioactive liquid wastes continued to be generated at a rate of approximately 6,000to 7,000 gallons per day during the two weeks that <strong>LA</strong>NL was closed because of the fire (McClenahan 2000).These flows would be expected from cooling systems and experiments that required cooling during the standdown.Subsequent to the wildfire, radioactive liquid waste generation continued below typical rates becauseother <strong>LA</strong>NL facilities required time to resume normal levels of operations.An analytical laboratory at the RLWTFSWEIS Yearbook—2002 2-149
Table 2.14.3-1. Radioactive Liquid Waste Treatment Facility (TA-50)/Operations Data1998 1999 2000 20012002PARAMETER UNITS SWEIS ROD OPERATIONS OPERATIONS OPERATIONS OPERATIONS OPERATIONSRadioactive AirEmissions:Americium-241 Ci/yr Negligible 6.5E-09 1.3E-07 Not detected Not detected 1.3E-08Plutonium-238 Ci/yr Negligible 1.4E-08 3.4E-08 9.8E-09 3.8E-08 1.6E-08Plutonium-239 Ci/yr Negligible Not detected 1.8E-08 Not detected 4.5E-09 3.1E-08Thorium-230 Ci/yr Negligible 7.7E-08 3.7E-08 5.3E-08 Not detected Not detectedUranium-234 Ci/yr Negligible 1.8E-07 Not detected a Not detected Not detected Not detectedUranium-238 Ci/yr Not Not detected Not detected Not detected Not detected 2.5E-08projectedNPDESDischarge:051 MGY 9.3 6.1 5.3 4.9 3.6 2.9Wastes: bChemical kg/yr 2,200 384 201 384 c 68,792 d 1,143LLW m 3 /yr 160 132 175 132 517 e 193MLLW f m 3 /yr 0 1.3 3.2 2.5 2.6 3.7TRU m 3 /yr 30 1 016.1 0.4 1.9Mixed TRU m 3 /yr 0 1.4 4.8 04.4 0.2Number of FTEs 110 g 55 g 62 gWorkers 62 g 58 g 47 g 54 gaAlthough stack sampling systems were in place to measure these emissions, any emissions were sufficiently small tobe below the detection capabilities of the sampling system.bSecondary wastes are generated during the treatment of radioactive liquid waste and as a result of decontaminationoperations performed at this Key Facility until CY 2000. Examples include decontamination acid bath solutions andrinse waters, high-efficiency particulate air filters, personnel protective clothing and equipment, and sludges from thepretreatment and main radioactive liquid waste treatment processes.cApproximately 127 kilograms of the chemical wastes are construction and demolition debris (previously identified inthe yearbook as industrial solid wastes) resulting from cleanup following the Cerro Grande Fire. Construction anddemolition debris is nonhazardous, may be disposed of in county landfills, and does not represent a threat to localenvirons.dApproximately 68,584 kilograms of the chemical waste were generated as a result of replacement of storage tanks andsome associated plumbing at TA-50. The waste consisted of soil piles and asphalt associated with the pad the oldtanks were sitting on.eTo comply with the water quality standard of 20 picocuries, wastewater from tritium experimentsis occasionally sent to the Evaporation Basins at TA-53. During CY 2001, approximately 380 cubic meters of waterwere transferred to TA-53.fRCRA-listed hazardous chemicals were not projected to be used in RLWTF, and secondary mixed wastes weretherefore not projected to be generated.gThe first number shown in the “SWEIS ROD” column is the actual employee count representing CY 1999 (the yearthe SWEIS ROD was published). The second number shown in the “SWEIS ROD” column is the index numberrepresenting CY1999 (the year the SWEIS ROD was published). The number of employees for CY 1998 throughCY 2002 operations cannot be directly compared to numbers projected by the SWEIS ROD. The employee numbersprojected by the SWEIS ROD represent total workforce size and include PT<strong>LA</strong>, JCNNM, and other subcontractorpersonnel. The number of employees for 1998 through 2002 operations is routinely collected information and representsonly UC employees (regular full-time and part-time). Because the two sets of numbers (SWEIS ROD versus the newindex) do not represent the same entity, a direct comparison to numbers projected by the SWEIS ROD (see Section 3.6,Socioeconomics) is not appropriate. However, because this index is going to be used in each subsequent Yearbook,selecting CY 1999 as the base year establishes an index that can be compared over the ten-year window represented bythe SWEIS ROD.2-150SWEIS Yearbook—2002
2.15 Solid Radioactive and Chemical Waste Facilities (TA-50 and TA-54)The Solid Radioactive and Chemical Waste Key Facilities are located at TA-50 and TA-54. Activitiesare all related to the management (packaging, characterization, receipt, transport, storage, and disposal) ofradioactive and chemical wastes generated at other <strong>LA</strong>NL facilities.It is important to note that <strong>LA</strong>NL’s waste management operation captures and tracks data for wastestreams (whether or not they go through the Solid Radioactive and Chemical Waste Facilities), regardless oftheir points of generation or disposal. This includes information on the waste generating process; quantity;chemical and physical characteristics of the waste; regulatory status of the waste; applicable treatment anddisposal standards; and the final disposition of the waste. The data are ultimately used to assess operationalefficiency, help ensure environmental protection, and demonstrate regulatory compliance.There are three Category 3 nuclear buildings within this Key Facility: the Radioactive Materials ResearchOperations and Demonstration (RAMROD) Facility (Building 50-37); the Waste Characterization, Reduction,and Repackaging (WCRR) facility (Building 50-69), and the Radioactive Assay and Nondestructive TestFacility (RANT; Building 54-38). In addition, there are also several Category 2 nuclear facilities/operations;the LLW disposal cells, shafts, and trenches and fabric domes and buildings within Area G; the TransuranicWaste Inspection Project (TWISP) for the retrieval of TRU wastes, including storage domes 226 and 229–232; and outdoor operations at the WCRR facility. In addition to the nuclear facilities, has a radiologicalfacility. The Decontamination and Volume Reduction System (DVRS), TA-54-412, was added to theradiological facility list in 2002 (<strong>LA</strong>NL 2002b).As shown in Table 2.15-1, the SWEIS recognized 19 structures as having Category 2 nuclear classification(Area G was recognized as a whole and then individual buildings and structures were also recognized).RAMROD was only a potential nuclear facility in the SWEIS, but subsequently was characterized by DOE.The WCRR facility was identified as a Category 2 in the SWEIS, but because of inventories and the newerguidelines, it was downgraded to a Category 3. Area G has remained a Category 2 facility when taken as awhole.2.15.1 Construction and Modifications at the Solid Radioactive and Chemical Waste FacilitiesProjected: The SWEIS ROD projected two construction activities for this Key Facility: the constructionof four additional fabric domes for the storage of TRU wastes retrieved from earth-covered pads and theexpansion of Area G.Actual: Only one of the two construction activities projected by the SWEIS ROD has been completed. Theconstruction of four additional fabric domes for the storage of TRU wastes retrieved from earth-covered padswas completed in 1998. Although expansion of Area G has not yet begun, the possibility exists for initiationof radioactive and mixed waste storage and disposal operations in Zone 4 within the next one to two years.Planning for the new facility previously intended for construction over Pad 4 to house high-activity drumswas stopped after Title I design.Construction of the DVRS began in 1999 and was completed in 2002. This is a high-bay metal buildingwith 13,000 square feet under roof. The DVRS is designed to segregate, decontaminate, and volume-reducefiberglass-reinforced plywood crates of TRU waste retrieved from the TWISP storage pads. A major fractionof the resulting segregated wastes is anticipated to be decontaminated to LLW, which will both (a) allow thesewastes to be disposed of at Area G and (b) decrease the volume of wastes that must be shipped to WIPP fordisposal. DVRS (TA-54-412) is now on the Radiological Facilities list (DOE 2002b). Although constructionof the DVRS was not projected by the SWEIS ROD, NEPA coverage was provided through an environmentalassessment (DOE 1999f) and subsequent Finding of No Significant Impact in June 1999.SWEIS Yearbook—2002 2-151
Table 2.15-1. Solid Radioactive and Chemical Waste Buildings with <strong>Nuclear</strong> Hazard ClassificationBUILDING DESCRIPTIONSWEISRODDOE1998 a DOE2000 b <strong>LA</strong>NL2001 c <strong>LA</strong>NL2001 d <strong>LA</strong>NL2002 eTA-50-0<strong>03</strong>7 RAMROD 2 2 2 2 3TA-50-0069 WCRR Facility Building 2 3 3 3 3 3TA-50-0069 Nondestructive Analysis Mobile2 2 2 2Outside ActivitiesTA-50-0069 Drum Storage 2 2 2Outside fTA-54-Area LLW Storage/Disposal 2 2 2 2 2 2GTA-54 TWISP 2 2 2 2 2TA-54-0002 g TRU Storage Building 3 3 3 2TA-54-0<strong>03</strong>3 TRU Drum Preparation 2 2 2 2TA-54-0<strong>03</strong>8 Radioassay and Nondestructive 2 3 3 3 3 3Testing FacilityTA-54-0048 TRU Storage Dome 2 3 3 32TA-54-0049 TRU Storage Dome 2 3 3 32TA-54-0144 ShedTA-54-0145 Shed 2 2TA-54-0146 Shed 2 2TA-54-0153 TRU Storage Dome 2 3 3 3 2TA-54-0177 Shed 2 2TA-54-0224 Mixed Waste Storage Dome 2TA-54-0226 TRU Storage Dome 2 2TA-54-0229 Tension Support Dome 2 2TA-54-0230 Tension Support Dome 2 2TA-54-0231 Tension Support Dome 2 2TA-54-0232 Tension Support Dome 2 2 2TA-54-0283 Tension Support Dome 2 2 2TA-54-<strong>03</strong>75 TRU Storage Dome 2 2TA-54-Pad2 Storage Pad 2 2 2 2TA-54-Pad3 Storage Pad 2 2 2TA-54-Pad4 TRU Storage 2 2 2TA-54 Pit 2 TRU Waste Storage Dome 2aDOE/<strong>LA</strong>NL list of Los Alamos <strong>National</strong> Laboratory <strong>Nuclear</strong> Facilities (DOE 1998a)bDOE/<strong>LA</strong>NL list of Los Alamos <strong>National</strong> Laboratory <strong>Nuclear</strong> Facilities (DOE 2000a)cDOE/<strong>LA</strong>NL list of Los Alamos <strong>National</strong> Laboratory <strong>Nuclear</strong> Facilities (<strong>LA</strong>NL 2001a)dDOE/<strong>LA</strong>NL list of Los Alamos <strong>National</strong> Laboratory <strong>Nuclear</strong> Facilities (<strong>LA</strong>NL 2001b)eDOE/<strong>LA</strong>NL list of Los Alamos <strong>National</strong> Laboratory <strong>Nuclear</strong> Facilities (<strong>LA</strong>NL 2002a)fIn the most recent nuclear facility lists (<strong>LA</strong>NL 2001b) and (<strong>LA</strong>NL 2002a), “Drum Storage” includes drumstaging/storage pad and waste container temperature equilibration activities outside TA-50-69.gThis includes LLW (including mixed waste) storage and disposal in domes, pits, shafts, and trenches. TRU wastestorage in domes and shafts (does not include TWISP). TRU legacy waste in pits and shafts. Low-level disposal ofasbestos in pits and shafts. Operations building: TRU waste storage.In addition, decontamination operations were relocated during 2000 from the RLWTF, Building 50-01, toTA-54. Except for the lead decontamination trailer, activities were moved to Building 54-1009 at the westend of TA-54. Building 54-1014, an office trailer, has also become part of the operations.Radioactive liquid wastes will be collected in two holding tanks (1,000 gallons each) adjacent to 54-1009;they will be trucked to the RLWTF at TA-50. In addition, two transportainers have been installed. One willbecome a 90-day storage area for management of hazardous and mixed radioactive waste; the other willbe used for storage of supplies. The lead decontamination trailer was removed from service. The trailer iscurrently stored inside Area G and will be decommissioned.2-152SWEIS Yearbook—2002
To control storm water runoff from TA-54, check dams were installed during 2000 at Area G and asediment basin constructed in the canyon below Area G. NEPA review of this action was provided through aCategorical Exclusion, #7489 (DOE 1999g).The Off-Site Source Recovery (OSR) Project recovers and manages unwanted radioactive sealed sourcesand other radioactive material that• present a risk to public health and safety,• present a potential loss of control by a U.S. <strong>Nuclear</strong> Regulatory Commission (NRC) or agreementstate licensee, or• are excess and unwanted and are a DOE responsibility under Public Law 99-240 or are DOEowned.The project is sponsored by DOE’s Office of Technical Program Integration and the AlbuquerqueOperations Office Waste Management Division that operates from <strong>LA</strong>NL. It focuses on the problem ofsources and devices held under NRC or agreement state licenses for which there is no disposal option. Theproject was reorganized in 1999 to more aggressively recover and manage the estimated 18,000 sealedsourcedevices that will become excess and unwanted over the next decade. This reorganization combinedthree activities, the Radioactive Source Recovery Program, the Off-Site Waste Program, and the Pu-239/BeNeutron Source Project. Approximately 2,020 sources were collected for storage at TA-54 during CY 2002.Eventually, these sources will be shipped to WIPP for final disposition. The OSR Project received NEPAcoverage under an environmental assessment and subsequent Finding of No Significant Impact (DOE 1995c),#6279 (DOE 1996i), #7405 (DOE 1999h), and #7570 (DOE 1999i), the 1999 SWEIS (DOE 1999a), and aSupplement Analysis to the 1999 SWEIS (DOE 2000d).In 2002 <strong>LA</strong>NL submitted a request for Change During Interim Status (CDIS) to the NMED. The CDISasked for permission to combine two previously RCRA-regulated units (Pad 2 and Pad 4) into a single RCRAregulatedstorage unit (Pad 10). The CDIS was approved by NMED, but no construction has begun to date.Also, in 2002, <strong>LA</strong>NL submitted a closure plan for three RCRA-regulated storage units at TA-50. Theseunits were TA-50, Building 1, room 59, TA-50-114, and TA-50-37. The first two units are located at theRLWTF and the third is at RAMROD. Although the closure plan has not yet been approved, closure activitieshave been completed at the two units at RLWTF. To date there has been no work conducted towards closureof the final unit at RAMROD (TA-50-37). Table 2.15.1-1 provides details.2.15.2 Operations at the Solid Radioactive and Chemical Waste FacilitiesThe SWEIS identified eight capabilities for this Key Facility. One capability, Decontamination Operations,was transferred in 2000 from the RLWTF Key Facility. Therefore, there are now nine capabilities at the SolidRadioactive and Chemical Waste Facilities because one has been added, and none has been deleted. Theprimary measurements of activity for this facility are volumes of newly generated chemical, low-level, andTRU wastes to be managed and volumes of legacy TRU waste and MLLW in storage. A comparison of CY2002 to projections made by the SWEIS ROD can be summarized as follows:Chemical wastes: Approximately 2,250 metric tons of chemical waste were generated at <strong>LA</strong>NL during CY2002. Of this, approximately 2,057 metric tons were shipped directly offsite for treatment and/or disposal andapproximately 194 metric tons were shipped for offsite treatment and/or disposal from the Solid Radioactiveand Chemical Waste Facility. These compare to an average quantity of 3,250 metric tons per year projectedby the SWEIS ROD.LLW: In 2002, approximately 7,000 cubic meters were placed into disposal cells and shafts at Area G,compared to an average volume of 12,230 cubic meters per year projected by the SWEIS ROD. This LLWSWEIS Yearbook—2002 2-153
volume is an increase from the last year of operationsbut is consistent with the three years prior. Nonew disposal cells were constructed, and disposaloperations did not expand into either Zone 4 or Zone6 at TA-54. Operations could expand into Zone 4within the next one to two years.MLLW: In 2002, 20 cubic meters of MLLWwere generated and delivered to TA-54, comparedto an average volume of 632 cubic meters per yearprojected by the SWEIS ROD. This is well under theprojections in the SWEIS ROD.TRU wastes: There were two shipments of legacyTRU waste to WIPP during 2002, and the entirequantity of newly generated TRU wastes (206 cubicmeters) was added to storage.In summary, chemical and radioactive wastemanagement activities were at levels below thoseprojected by the SWEIS ROD and also below levelsof 1998 and 1999 operations at this Key Facility.These and other operational details appear in Table2.15.2-1.2.15.3 Operations Data for the SolidRadioactive and Chemical Waste FacilitiesLevels of activity in 2002 were less than projectedby the SWEIS ROD and so were air emissions andmost secondary wastes. Table 2.15.3-1 providesdetails.Loading shipping casks2.15.4 Cerro Grande Fire Effects at the SolidRadioactive and Chemical Waste FacilityThe Solid Radioactive and Chemical Waste KeyFacility was inaccessible for routine operations fortwo weeks during the wildfire. The impact continuedupon re-opening of the Laboratory since the facilitywas returned to normal operations in phases onlyupon completion of a series of condition assessmentsteps. Construction was delayed about five weeks,and routine operations took about four weeks toreturn to normal levels. A significant fraction of thefacility’s heavy earthmoving equipment was used forthe wildfire and was not available for some time. Thewildfire also impacted operations later in the yearbecause fire-related debris was shipped to Area G forstorage and/or disposal.Truck shipment to WIPP2-154SWEIS Yearbook—2002
SWEIS Yearbook—2002 2-155Table 2.15.1-1. Solid Radioactive and Chemical Waste Facilities Construction and ModificationsSWEIS RODACTUAL CONSTRUCTION AND MODIFICATIONPROJECTION 1998 YEARBOOK 1999 YEARBOOK 2000 YEARBOOK 2001 YEARBOOK 2002 YEARBOOKFour additionalfabric domes forstorage of retrievedTRU wasteDomes 54-231, 54-232, and54-375 constructed. Dome 54-226 usage changed fromretrieval to storage for TWISP.Dome 54-375 completed.Area G expansionfor waste storageNot yet needed. Not yet needed. Not yet needed. Not yet needed. Not yet needed.Automated and enclosed drumwashers installed in DrumPreparation Facility, Building54-33.Modular containment for sizereduction removed fromBuilding 54-33.Small compactor removedfrom Compactor Facility,Building 54-281.Maintenance Shop, Building54-02, converted into acounting laboratory for “Greenis Clean.”Construction of DVRSbegan (DOE 1999f ).Decontamination operationsrelocated from TA-50-01 toTA-54.Lead decontaminationtrailer from TA-50 removedfrom service and awaitingdecommissioning at Area G.Check dams installed at AreaG for storm water runoffcontrol (DOE 1999g).Storage of sourcesrecovered from OSRProject.Plan submitted to closethree RCRA regulatedstorage units at TA-50.
2-156SWEIS Yearbook—2002Table 2.15.2-1. Solid Radioactive and Chemical Waste Facilities (TA-50 and TA-54)/Comparison of OperationsCAPABILITY SWEIS ROD a YEARBOOK YEARBOOK YEARBOOK YEARBOOK YEARBOOK19981999200020012002WasteSupport, certify, and audit As projected. As projected. As projected. As projected. As projected.Characterization,Packaging, andLabelinggenerator characterizationprograms.Maintain waste acceptance criteriafor <strong>LA</strong>NL waste managementAs projected. As projected. As projected. As projected. As projected.facilities.Characterize 760 m 3 of legacyMLLW.Characterize 9,010 m 3 of legacyTRU waste.Verify characterization data at theRANT Facility for unopenedcontainers of LLW and TRUwaste.Maintain waste acceptance criteriafor offsite treatment, storage, anddisposal facilities.Over-pack and bulk waste asrequired.Perform coring and visualinspection of a percentage of TRUwaste packages.Ventilate 16,700 drums of TRUwaste retrieved during TWISP.Maintain current version of WIPPwaste acceptance criteria andliaison with WIPP operations.Characterized 136m 3 of legacy MLLWin 1998.Characterized 21 m 3of TRU waste during1996-1998.Verifiedcharacterization dataat RANT Facility forTRU wastes, but notfor LLW.Characterized 83 m 3of legacy MLLW.Characterized 6.25m 3 of legacy TRUwaste in 1999.Verifiedcharacterization dataat RANT Facility forTRU wastes, but notfor LLW.Characterized 11 m 3of legacy MLLW.No TRU waste wasfully characterized in2000.Verifiedcharacterization dataat RANT Facility forTRU wastes, but notfor LLW.Characterized 59 m 3of legacy MLLW.Characterized 83 m 3of TRU waste in2001.Verifiedcharacterization dataat RANT Facility forTRU wastes, but notfor LLW.Characterized 42 m 3of legacy MLLW.Characterized 14.4 m 3of TRU waste in2001.Verifiedcharacterization dataat RANT Facility forTRU wastes, but notfor LLW.As projected. As projected. As projected. As projected. As projected.As projected. As projected. As projected. As projected. As projected.Two drums werecored and inspected.Ventilated 4,816drums during 1996-1998.Six drums werecored and inspectedin 1999.Ventilated 8,426drums as ofDecember 1999.Coring operationswere suspended untilhomogenousanalyticalcapabilities areadded to theRAMROD Facility.Ventilated 622drums during 2000reaching a total of9,048 as ofDecember 2000.Coring operationswere suspended untilhomogenousanalyticalcapabilities areadded to theRAMROD Facility.Ventilated 7,085drums during 2001reaching a total of16,133 as ofDecember 2001.Performed visualinspection of 13 m 3 ofTRU waste packages.No coring wasperformed in 2002.Ventilated 766 drumsduring 2002.As projected. As projected. As projected. As projected. As projected.
SWEIS Yearbook—2002 2-157Table 2.15.2-1. Solid Radioactive and Chemical Waste Facilities (TA-50 and TA-54)/Comparison of Operations (continued)CAPABILITY SWEIS ROD a 1998YEARBOOKCompaction Compact up to 25,400 m 3 of 94 m 3 of LLW wasLLW.compacted intoSize ReductionWaste Transport,Receipt, andAcceptanceSize reduce 2,900 m 3 of TRUwaste at WCRRF and the DrumPreparation Facility.Collect chemical and mixedwastes from <strong>LA</strong>NL generators andtransport to TA-54.35 m 3 .Size reduction wasnot performed in1998.Collected andtransported chemicaland mixed wastes.Begin shipments to WIPP in 1999. No shipments toWIPP.Over the next 10 years, ship 1,767 metric tons of32,000 metric tons of chemical chemical waste andwastes and 3,640 m 3 of MLLW 136 m 3 of MLLWfor offsite land disposalwere shipped forrestrictions, treatment, and offsite treatment anddisposal.disposal.Over the next 10 years, ship noLLW for offsite disposal.Over the next 10 years, ship9,010 m 3 of legacy TRU waste toWIPP.Over the next 10 years, ship 5,460m 3 of operational andenvironmental restoration TRUwaste to WIPP.No LLW wasshipped for offsitedisposal.No legacy TRUwaste was shipped toWIPP.No operational orenvironmentalrestoration TRUwastes were shippedto WIPP.1999YEARBOOK280 m 3 of LLW wascompacted into77 m 3 .Size reduction wasnot performed in1999.Collected andtransported chemicaland mixed wastes.Shipments to WIPPbegan 3/26/1999.882 metric tons ofchemical waste and96 m 3 of MLLWwere shipped foroffsite treatment anddisposal.No LLW wasshipped for offsitedisposal.6.25 m 3 of legacyTRU waste wereshipped in 1999.No operational orenvironmentalrestoration TRUwastes were shippedto WIPP.2000YEARBOOK353 m 3 of LLW wascompacted into84 m 3 .As proof-of-principletesting for theDecontamination andVolume ReductionSystem Facility, 100m 3 of TRU wastewere processed andreduced to 60 m 3 .Collected andtransported chemicaland mixed wastes.Shipments to WIPPbegan 3/26/1999.450 metric tons ofchemical waste and11 m 3 of MLLWwere shipped foroffsite treatment anddisposal.No LLW wasshipped for offsitedisposal.No legacy TRUwaste was shipped in2000.No operational orenvironmentalrestoration TRUwastes were shippedto WIPP.2001YEARBOOK483 m 3 of LLW wascompacted into108 m 3 .As proof-of-principletesting for theDecontamination andVolume ReductionSystem Facility, 40m 3 of waste wererecharacterized anddisposed of as LLWat TA-54, Area G.Collected andtransported chemicaland mixed wastes.Shipments to WIPPbegan 3/26/1999.504 metric tons ofchemical waste and46 m 3 of MLLWwere shipped foroffsite treatment anddisposal.No LLW wasshipped for offsitedisposal.8 shipments oflegacy TRU wastewere shipped in2001.No operational orenvironmentalrestoration TRUwastes were shippedto WIPP.2002YEARBOOKApproximately 271m 3 of LLW wascompacted into 63 m 3 .Approximately 32 m 3of TRU waste wereprocessed through theDVRS. Over 85% wascharacterized as LLWand disposed of atTA-54, Area G.Collected andtransported chemicaland mixed wastes.Shipments to WIPPbegan 3/26/1999.Approximately 194metric tons ofchemical waste and~42 m 3 of MLLWwere shipped foroffsite treatment anddisposal.No LLW was shippedfor offsite disposal.2 shipments of legacyTRU waste wereshipped in 2002.No operational orenvironmentalrestoration TRUwastes were shippedto WIPP.
2-158SWEIS Yearbook—2002Table 2.15.2-1. Solid Radioactive and Chemical Waste Facilities (TA-50 and TA-54)/Comparison of Operations (continued)CAPABILITY SWEIS ROD a 1998YEARBOOKOver the next 10 years, ship noenvironmental restoration soils foroffsite solidification and disposal.Waste Transport,Receipt, andAcceptance(cont.)Waste StorageWaste RetrievalOther WasteProcessingAnnually receive, on average, 5m 3 of LLW and TRU waste fromoffsite locations in 5 to 10shipments.Stage chemical and mixed wastesbefore shipment for offsitetreatment, storage, and disposal.Store legacy TRU waste andMLLW.Store LLW uranium chips untilsufficient quantities haveaccumulated for stabilization.No environmentalrestoration soils wereshipped for offsitesolidification anddisposal.There were no LLWor TRU wastereceipts from offsitelocations.Chemical and mixedwastes were stagedbefore shipment.Legacy TRU wasteand MLLW stored.LLW uranium chipsare no longergenerated.1999YEARBOOKNo environmentalrestoration soils wereshipped for offsitesolidification anddisposal in 1999.There were no LLWor TRU wastereceipts from offsitelocations.Chemical and mixedwastes were stagedbefore shipment.Legacy TRU wasteand MLLW stored.<strong>LA</strong>NL still generatesthis waste; however,TA-54 no longeraccepts it for storage.The generator isrequired to processthis waste to make itacceptable fordisposal at TA-54.2000YEARBOOKNo environmentalrestoration soils wereshipped for offsitesolidification anddisposal in 2000. bThere were no LLWor TRU wastereceipts from offsitelocations.Chemical and mixedwastes were stagedbefore shipment.Legacy TRU wasteand MLLW stored.Two drums ofuranium chips instorage at Area G.2001YEARBOOKNo environmentalrestoration soils wereshipped for offsitesolidification anddisposal in 2001. bThere were no LLWor TRU wastereceipts from offsitelocations.Chemical and mixedwastes were stagedbefore shipment.Legacy TRU wasteand MLLW stored.There are no drumsof uranium chips instorage awaitingstabilization.2002YEARBOOKNo environmentalrestoration soils wereshipped for offsitesolidification anddisposal in 2002. bThere were no LLWor TRU waste receiptsfrom offsite locations.Chemical and mixedwastes were stagedbefore shipment.Legacy TRU wasteand MLLW stored.There are no drums ofuranium chips instorage awaitingstabilization.Begin retrieval operations in 1997. Retrieval begun in1997.Retrieval begun in1997.Retrieval begun in1997.Retrieval begun in1997.Retrieval begun in1997.Retrieve 4,700 m 3 of TRU wastefrom Pads 1, 2, 4 by 2004.Retrieved 1,951 m 3through 1998 (Pad1).Retrieved 2,195 m 3in 1999. Retrieved4,146 m 3 totalthrough Dec. 1999.Retrieved 169 m 3 in2000. Retrieved4,315 m 3 totalthrough Dec. 2000.Retrieved 1,463 m 3in 2001. Retrieved4,700 m 3 totalthrough Dec. 2001.Retrieval activitieswere completed in2001. No retrievaloccurred in 2002.Demonstrate treatment (e.g., No activity. No activity. No activity. No activity. No activity.electrochemical) of MLLWliquids.Land farm oil-contaminated soilsat Area J.No oil-contaminatedsoils were landfarmed.No oil-contaminatedsoils were landfarmed.No oil-contaminatedsoils were landfarmed.Area J is undergoingclosure.Closure of Area J isnow complete.
SWEIS Yearbook—2002 2-159Table 2.15.2-1. Solid Radioactive and Chemical Waste Facilities (TA-50 and TA-54)/Comparison of Operations (continued)CAPABILITY SWEIS ROD a 1998YEARBOOKOther Waste Stabilize 870 m 3 of uranium chips. No uranium chipsProcessing (cont.)were stabilized.Waste stream wastreated by generatorprior to transfer toArea G.Provide special-case treatment for1,<strong>03</strong>0 m 3 of TRU waste.Solidify 2,850 m 3 of MLLW(environmental restoration soils)for disposal at Area G.Disposal Over next 10 years, dispose of 420m 3 of LLW in shafts at Area G.DecontaminationOperations eOver next 10 years, dispose of115,000 m 3 of LLW in disposalcells at Area G. (Requiresexpansion of onsite LLW disposaloperations beyond existing Area Gfootprint.)Over next 10 years, dispose 100m 3 per year administrativelycontrolled industrial solid wastes,but refers to personnel informationor contracts in pits at Area J.Over next 10 years, dispose nonradioactiveclassified wastes inshafts at Area J.Decontaminate <strong>LA</strong>NL personnelrespirators for reuse(~700/month).Decontaminate air-proportionalprobes for reuse (~300/month).c1999YEARBOOKNo uranium chipswere stabilized in1999.2000YEARBOOKNo uranium chipswere stabilized.2001YEARBOOK8.3 m 3 of uraniumchips and turningswere stabilized atTA-3, Building 39.None. None. None. None. None.No environmentalrestoration soils weresolidified5 m 3 of LLW weredisposed of in shaftsat Area G.1,807 m 3 of LLWwas disposed of incells. Area G was notexpanded.55 m 3 solid wastesdisposed of in pits atArea J.One cubic meter ofclassified solidwastes disposed of inshafts at Area J.No environmentalrestoration soils weresolidified23 m 3 of LLW weredisposed of in shaftsat Area G.1,320 m 3 of LLWwas disposed of incells. Area G was notexpanded.4,0<strong>03</strong> m 3 solidwastes disposed of inpits at Area J d .0.28 m 3 of classifiedsolid wastesdisposed of in shaftsat Area J.No environmentalrestoration soils weresolidified.13 m 3 of LLW weredisposed of in shaftsat Area G.4,441 m 3 of LLWwas disposed of incells. Area G was notexpanded.5,839 m 3 solidwastes disposed of inpits at Area J.0.79 m 3 of classifiedsolid wastesdisposed of in shaftsat Area J.No environmentalrestoration soils weresolidified.9 m 3 of LLW weredisposed of in shaftsat Area G.1,808 m 3 of LLWwas disposed of incells. Area G was notexpanded.Area J is undergoingclosure.Area J is undergoingclosure.See Table 2.14.2-1. See Table 2.14.2-1. See Table 2.14.2-1. Decontaminated 450personnel respiratorsper month at TA-54-1009.See Table 2.14.2-1. See Table 2.14.2-1. See Table 2.14.2-1. Decontaminated 125faces and 120 bodiesper month at TA-54-1009.2002YEARBOOK7.2 m3 of uraniumchips and turningswere staged forprocessing.No environmentalrestoration soils weresolidified.Approximately 8.5 m 3of LLW weredisposed of in shaftsat Area G.Approximately 7,000m 3 of LLW wasdisposed of in cells.Area G was notexpanded.Closure of Area J isnow complete.Closure of Area J isnow complete.Decontaminated 500personnel respiratorsper month at TA-54-1009.Decontaminated 70faces and 70 bodiesper month at TA-54-1009.
2-160Table 2.15.2-1. Solid Radioactive and Chemical Waste Facilities (TA-50 and TA-54)/Comparison of Operations (continued)abcdefCAPABILITY SWEIS ROD a YEARBOOK YEARBOOK YEARBOOK YEARBOOK YEARBOOK19981999200020012002Decontaminate vehicles andportable instruments for reuse (asrequired).See Table 2.14.2-1. See Table 2.14.2-1. See Table 2.14.2-1. Decontaminated fiveportable instrumentsper month at TA-54-1009. No large-itemdecontamination wasperformed.Decontaminated sixportable instrumentsper month at TA-54-1009. No large-itemdecontamination wasperformedDecontaminate precious metals for See Table 2.14.2-1. See Table 2.14.2-1. See Table 2.14.2-1. No activity. f No activity. fresale (acid bath).Decontaminate scrap metals for See Table 2.14.2-1. See Table 2.14.2-1. See Table 2.14.2-1. No activity. f No activity. fresale (sandblast).Decontaminate 200 m 3 of lead forreuse (grit blast).See Table 2.14.2-1. See Table 2.14.2-1. See Table 2.14.2-1. No activity. f No activity. fIncludes the construction of four new storage domes for the TWISP.The ER Project usually ships soils removed in remediation of a potential release site (PRS) directly to an offsite disposal facility. These wastes do not typicallyrequire processing at TA-54 and do not go through the TA-54 operations for shipment.In the SWEIS, the term "industrial solid waste" was used for construction debris, chemical waste, and sensitive paper records.This volume exceeds projections because of excavation of MDA-P by the ER Project.The Decontamination Operations capability was identified with the RLWTF Key Facility in the SWEIS. Activities prior to 2000 are reported in Section 2.14.2 of theYearbook. In 2000, this capability was relocated to TA-54 and the Solid Radioactive and Chemical Waste Facility.Although there has been no activity in 2001 and 2002, this decontamination operation is now part of the Solid Radioactive and Chemical Waste Facility CapabilitiesSWEIS Yearbook—2002
Table 2.15.3-1. Solid Radioactive and Chemical Waste Facilities (TA-54 and TA-50)/OperationsDataPARAMETER UNITSSWEISROD1998YEARBOOK1999YEARBOOK2000YEARBOOK2001YEARBOOK2002YEARBOOKRadioactive AirEmissions: aTritium Ci/yr 6.09E+1a a a a aAmericium-241 Ci/yr 6.60E-7a a a5.8E-11 7.5E-10Plutonium-238 Ci/yr 4.80E-6 1.3E-09 9.9E-11a3.6E-11 5.0E-10Plutonium-239 Ci/yr 6.80E-7a a a2.7E-10 1.3E-09Uranium-234 Ci/yr 8.00E-6 1.14E-08 1.7E-08aa2.4E-10Uranium-235 Ci/yr 4.10E-7a a a aNot detectedUranium-238 Ci/yr 4.00E-6a2.3E-09aaNot detectedThorium-230 Ci/yrNotprojected3.10E-10 Not detected Not detected Not detected Not detectedNPDESMGYNo No outfalls No outfalls No outfalls No outfalls No outfallsDischargeoutfallsWastes: bChemical kg/yr 920 327 30 806 449 863LLW m 3 /yr 174 15 21 13 14 35MLLW m 3 /yr 4 0 0 0 0 0TRU m 3 /yr 27 20.9 39.9 27.1 9.7 29.5Mixed TRU m 3 /yr 0 0 0 7.8 13.1 15.1Number of FTEs 225 c 60 c 65 cWorkers 65 c 64 c 60 c 63 caData indicate no measured emissions at WCRR facility and the RAMROD facility at TA-50. No stacks requiremonitoring at TA-54. All non-point sources at TA-50 and TA-54 are measured using ambient monitoring.bSecondary wastes are generated during the treatment, storage, and disposal of chemical and radioactive wastes.Examples include repackaging wastes from the visual inspection of TRU waste, HEPA filters, personnel protectiveclothing and equipment, and process wastes from size reduction and compaction.cThe number shown in the “SWEIS ROD” column is the index number representing CY 1999 (the year the SWEISROD was published). The number of employees for CYs 2000, 2001, and 2002 operations cannot be directly comparedto numbers projected by the SWEIS ROD. The employee numbers projected by the SWEIS ROD represent totalworkforce size and include PT<strong>LA</strong>, JCNNM, and other subcontractor personnel. The number of employees for CYs 2000,2001, and 2002 operations is routinely collected information and represents only UC employees (regular full-time andpart-time). Because the two sets of numbers (SWEIS ROD versus the new index) do not represent the same entity, adirect comparison to numbers projected by the SWEIS ROD (see Section 3.6, Socioeconomics) is not appropriate.However, because this index is going to be used in each subsequent Yearbook, selecting CY 1999 as the base yearestablishes an index that can be compared over the ten-year window represented by the SWEIS ROD.SWEIS Yearbook—2002 2-161
2.16 Non-Key FacilitiesThe balance, and majority, of <strong>LA</strong>NL buildings are referred to in the SWEIS as Non-Key Facilities. Non-Key Facilities house operations that do not have potential to cause significant environmental impacts. Thesebuildings and structures are located in 30 of <strong>LA</strong>NL’s 49 technical areas and comprise approximately 14,224of <strong>LA</strong>NL’s estimated 26,480 acres. As expressed in Section 2.16.2 below, activities in the Non-Key Facilitiesencompass seven of the eight <strong>LA</strong>NL direct-funded activities (DOE 1999a, page 2-2).As shown in Table 2.16-1, the SWEIS identified six buildings within the Non-Key Facilities with nuclearhazard classifications. The High-Pressure Tritium Facility (Building TA-33-86), classified in 2001 as aCategory 2 nuclear facility, was removed from the <strong>Nuclear</strong> Facility List in March 2002 and downgraded toa radiological facility. The decontamination and decommissioning of the formerly used tritium facility, TA-33-86, the High-Pressure Tritium Laboratory, was completed in 2002 and is now demolished. At the presenttime, there are no Category 2 or Category 3 nuclear facilities among the Non-Key Facilities (<strong>LA</strong>NL 2002a).Table 2.16-1. Non-Key Facilities with <strong>Nuclear</strong> Hazard ClassificationBUILDINGDESCRIPTIONSWEISRODDOE1998 a DOE2000 b <strong>LA</strong>NL2001 c <strong>LA</strong>NL2001 d <strong>LA</strong>NL2002 eTA-<strong>03</strong>-0040 Physics Building 3TA-<strong>03</strong>-0065 Source Storage 2TA-<strong>03</strong>-0130 Calibration Building 3TA-33-0086 Former Tritium Research 3 2 2 2 2TA-35-0002 Non-American <strong>National</strong> Standards3 3Institute Uranium SourcesTA-35-0027 Safeguard Assay and Research 3 3aDOE/<strong>LA</strong>NL list of Los Alamos <strong>National</strong> Laboratory <strong>Nuclear</strong> Facilities (DOE 1998a)bDOE/<strong>LA</strong>NL list of Los Alamos <strong>National</strong> Laboratory <strong>Nuclear</strong> Facilities (DOE 2000a)cDOE/<strong>LA</strong>NL list of Los Alamos <strong>National</strong> Laboratory <strong>Nuclear</strong> Facilities (<strong>LA</strong>NL 2001a)dDOE/<strong>LA</strong>NL list of Los Alamos <strong>National</strong> Laboratory <strong>Nuclear</strong> Facilities (<strong>LA</strong>NL 2001b)eDOE/<strong>LA</strong>NL list of Los Alamos <strong>National</strong> Laboratory <strong>Nuclear</strong> Facilities (<strong>LA</strong>NL 2002a)Additionally, several Non-Key Facilities were identified as radiological facilities in 2001 (<strong>LA</strong>NL 2001c)and 2002 (<strong>LA</strong>NL 2002b). These include the Omega West Reactor, Building 2-1; the Cryogenics Building B,3-34; the Physics Building (HP), 3-40; the Lab Building, 21-5; <strong>Nuclear</strong> Safeguards Research, 35-2; <strong>Nuclear</strong>Safeguards Lab, 35-27; and the Underground Vault, 41-1. Table 2.16-2 lists all of the Non-Key Facilitiesidentified as radiological in CY 2001 and CY 2002.Table 2.16-2. Non-Key Facilities with Radiological Hazard ClassificationBUILDING DESCRIPTION <strong>LA</strong>NL 2001 a <strong>LA</strong>NL 2002 bTA-02-1 Omega Reactor RAD RADTA-<strong>03</strong>-16 Ion Exchange --- RADTA-<strong>03</strong>-34 Cryogenics Bldg. B RAD RADTA-<strong>03</strong>-40 Physics Bldg. (HP) RAD RADTA-<strong>03</strong>-169 Warehouse --- RADTA-<strong>03</strong>-1819 Experiment Mat’l Lab --- RADTA-21-5 Lab Bldg RAD RADTA-21-150 Molecular Chemical RAD ---TA-33-86 High Pressure Tritium --- RADTA-35-2 <strong>Nuclear</strong> Safeguards Research RAD RADTA-35-27 <strong>Nuclear</strong> Safeguards Lab RAD RADTA-36-1 Laboratory and offices --- RADTA-36-214 Central HP Calibration Facility --- RADTA-41-1 Underground Vault RAD RADTA-41-4 Laboratory RAD ---a<strong>LA</strong>NL Radiological Facility List (<strong>LA</strong>NL 2001c)b<strong>LA</strong>NL Radiological Facility List (<strong>LA</strong>NL 2002b)2-162SWEIS Yearbook—2002
2.16.1 Construction and Modifications at the Non-Key FacilitiesProjected: The SWEIS addressed the impacts of the proposed transfer of the DP Road Tract to the Countyof Los Alamos (DOE 1997d) and the proposed Lease of Land for the Development of a Research Park (DOE1997e) that were being finalized in 1999. Although the SWEIS did not identify any other “firm” projectedconstruction and modification projects for the Non-Key Facilities, there was a section, Section 1.6.3.1 ofVolume I, recognizing “Emerging Actions at <strong>LA</strong>NL.” This section identified studies addressing the renovationof the infrastructure at TA-<strong>03</strong>, the Nonproliferation and International <strong>Security</strong> Center (NISC), and electricalpower supply and reliability. The section also indicated that NEPA analysis would occur as these and otherstudies developed into projects. Also, at the time of SWEIS publication, the impacts of the electric powerdemand and water usage for the proposed Strategic Computing Complex (SCC) were factored into thealternatives analyzed and DOE was preparing an Environmental Impact Statement for the Conveyance andTransfer of Certain Land Tracts at <strong>LA</strong>NL.Actual: Some activity has occurred on each of the projected activities identified in the SWEIS. Table2.16.1-1 summarizes the actual construction and modifications at the Non-Key Facilities and the text thatfollows presents additional detail.In 2002, NEPA coverage for disposition of the Omega West Facility was provided by the EnvironmentalAssessment of the Proposed Disposition of the Omega West Facility (DOE 2002f) and a Finding of NoSignificant Impact. Demolition activities began in July 2002. At TA-61, Buildings 24, 25, and 26 have beencompletely demolished. TA-02-1, the Omega West Reactor, is 60 percent demolished. TA-41-30 and thefront of TA-41-4 were demolished from August through October 2002. Approximately 60 percent of thedemolition project is complete with an estimated completion date of September 20<strong>03</strong>.The SWEIS ROD had projected just one major construction project (Atlas) for the Non-Key Facilities.In contrast, however, <strong>LA</strong>NL plans for the next 10 years call for the construction or modification of manybuildings due to programmatic requirements and replacement of damaged or destroyed facilities following theCerro Grande Fire (<strong>LA</strong>NL 2001r). Major projects are discussed in the following paragraphs.Blue structure—Omega West Reactor housingSWEIS Yearbook—2002 2-163
2-164SWEIS Yearbook—2002Table 2.16.1-1. Non-Key Facilities Construction and ModificationsSWEIS RODPROJECTIONLand Transfer–DP Road TractResearch ParkRenovate TA-<strong>03</strong>infrastructureNISCElectrical powersupply andreliabilitySCCAtlas Facility1998YEARBOOKUnder study environmentalassessment prepared.Environmental assessmentprepared (DOE 1997d).Environmental assessmentprepared (DOE 1999j).Environmental assessmentprepared for SCC at TA-<strong>03</strong>(DOE 1998g).Atlas Facility designed andbegan construction in 1996-1998 at TA-35 (DOE 1996j).Ten of 28 outfalls eliminatedfrom NPDES permit during1997-1998.ACTUAL CONSTRUCTION AND MODIFICATION1999200020012002YEARBOOKYEARBOOK a YEARBOOKYEARBOOKUnder study. Under study. Under study. Under study, see Chapter 5.Construction started in1999.Building design began in1999.Began construction of SCCin 1999.Construction continued in1999.Thirteen outfallseliminated from NPDESpermit; 9 of 13 transferredto Los Alamos County(Sandoval 2000).Funding approved forCentral Health PhysicsCalibration Laboratory atTA-36.Began construction of firstbuilding at Los AlamosResearch Park.Design continued.Construction continued.Construction completed andmajor capacitor bankstested.Outfall <strong>03</strong>A-199 added topermit for future LaboratoryData CommunicationsCenter.High-Pressure TritiumFacility (TA-33-86) in safeshutdown mode.Construction of first buildingcompleted in March 2001;occupancy began in June2001.Construction began at TA-<strong>03</strong>in March 2001.Construction completed;occupancy began inDecember 2001.Readiness for operations inJuly 2001 and firstexperiments in September2001; environmentalassessment for relocating toNevada Test Site (DOE2001e).High-Pressure TritiumFacility (TA-33-86) in safeshutdown mode.Most of first building leased.Construction continued.Occupancy completed.Atlas physically moved toNevada Test Site by end ofDecember 2002.High-Pressure TritiumFacility (TA-33-86)underwent decontamination,decommissioning, anddemolition (DOE 1998h).
SWEIS Yearbook—2002 2-165Table 2.16.1-1. Non-Key Facilities Construction and Modifications (continued)SWEIS RODPROJECTION1998YEARBOOKACTUAL CONSTRUCTION AND MODIFICATION20002001YEARBOOK a YEARBOOKCerro Grande Fire impacted86 structures or buildings,damaged 31 structures orbuildings, and destroyed 10structures or buildings.1999YEARBOOKEnvironmental assessmentand design prepared forEmergency OperationsCenter (DOE 2001f).Environmental assessmentprepared for MultichannelCommunications Project(DOE 2001f).<strong>Security</strong> Systems Group (S-3)<strong>Security</strong> Systems SupportFacility at TA-<strong>03</strong>: NEPAcategorical exclusion issued(DOE 2001g).<strong>LA</strong>NL Medical Facility atTA-<strong>03</strong>: NEPA categoricalexclusion issued (DOE2001h).Chemistry Division OfficeBuilding at TA-46: NEPAcategorical exclusion issued(DOE 2001i).2002YEARBOOKConstruction started.Design and acquisition inprocess.Environmental assessmentfor Omega West ReactorFacility; demolition activitiesbegan in July 2002 (DOE2002f).Design and constructionbegan.Decision ApplicationsDivision Office Building atTA-<strong>03</strong>. NEPA categoricalexclusion issued andconstruction began (DOE2002g).Design and constructionbegan.Construction began and wascompleted; occupancygranted in November 2002.
2-166Table 2.16.1-1. Non-Key Facilities Construction and Modifications (continued)SWEIS RODPROJECTIONa1998YEARBOOK1999YEARBOOKACTUAL CONSTRUCTION AND MODIFICATION20002001YEARBOOK aAdditional information on the impacts of the Cerro Grande Fire can be found in Section 2.16.4.YEARBOOKMST Office Building atTA-<strong>03</strong>: NEPA categoricalexclusion issued (DOE2001j).TA-72 Live Fire ShootHouse: NEPA categoricalexclusion issued (DOE2001d).2002YEARBOOKConstruction began.Construction began.<strong>Security</strong> Truck InspectionStation: NEPA categoricalexclusion issued,constructed, and operational(DOE 2002h).TA-41-30 and front of TA-41-4 demolished.SWEIS Yearbook—2002
a) AtlasDescription: Atlas wasconstructed in parts of fivebuildings at TA-35 (35-124,125, 126, 294, and 301). Atlasis being used for research anddevelopment in the fields ofphysics, chemistry, fusion,and materials science that willcontribute to predictive capabilityfor the aging and performance ofprimary and secondary componentsof nuclear weapons. The heart ofthe Atlas facility is a pulsed-powercapacitor bank that will delivera large amount of electrical andmagnetic energy to a centimeterscaletarget in less than tenmicroseconds. Each experimentwill require extensive preparationof the experimental assembly anddiagnostic instrumentation.The completed Atlas facilityThe facility will require up to 5 megawatt hours of electrical energy annually (less than one percent of total<strong>LA</strong>NL consumption); will have a peak electrical demand of 4 megawatts for about one minute per week; andwill employ about 15 people. This facility has its own NEPA coverage provided by Appendix K of the FinalProgrammatic Environmental Impact Statement for Stockpile Stewardship and Management (DOE 1996j).Status: Construction was completed in September 2000. Major testing of the capacitor banks (level ofcurrent) was successfully completed in December 2000. Critical Decision 4 (authorization to commenceoperation) was received from DOE in March 2001. An Independent Verification Panel process was completedto assure readiness for operations in July 2001, and the first experiments were performed in September 2001.Status: During 2002, a new building was constructed at the Nevada Test Site to accommodate therelocation of Atlas. The relocation of Atlas to Nevada Test Site had its own NEPA coverage in the form of anenvironmental assessment and Finding of No Significant Impact issued 06/05/2001 (DOE 2001e). Atlas wasphysically moved out of <strong>LA</strong>NL at the end of December 2002. All of the equipment is currently located at theNevada Test Site. The formal property transfer of Atlas from <strong>LA</strong>NL to Bechtel/Nevada is in progress andis expected to be completed in March or April 20<strong>03</strong>. The schedule for reassembly and recommissioning ofAtlas estimates that this capability should be operational in Nevada by October 20<strong>03</strong>. <strong>LA</strong>NL personnel willcontinue to be involved in experimentation activities at the Nevada Test Site.b) Los Alamos Research ParkDescription: As described in the environmental assessment (DOE 1997e), the Los Alamos Commerceand Development Corporation will develop a maximum of 44 acres into a Research Park located along WestJemez Road, across from Otowi Building and the Wellness Center, and along West Road, in the vicinity of theice rink. According to the Research Park Master Plan, up to five buildings and two parking structures may beconstructed, with a total floor space of 300,000 square feet and parking for 1,400 cars. If five buildings wereto be constructed, the Research Park would consume an estimated 1.3 megawatts peak electric demand, 4,250megawatt-hours of electricity, 39 billion BTU of natural gas, and 17 million gallons of water annually. ThisSWEIS Yearbook—2002 2-167
consumption would represent approximate increases of 1 percent, 5 percent, 4 percent, and 18 percent in theseutilities, respectively. The Park could also provide up to 1,500 new jobs and would increase traffic by up to3,000 vehicle trips per day. Development would convert 30 undeveloped acres to office and light industrialuse. This area, less than 0.25 percent of the vegetated landscape at <strong>LA</strong>NL, currently provides a buffer forresidential areas. This project has its own NEPA coverage provided by the Environmental Assessment forthe Lease of Land for the Development of a Research Park at Los Alamos <strong>National</strong> Laboratory (DOE 1997e)along with a Finding of No Significant Impact.Status: Construction of the first building in the Research Park began in February of 2000 and wascompleted in March of 2001. Occupancy of the building began in June 2001. In March of 20<strong>03</strong>, with theexception of a few single office suites, the entire first building is leased. <strong>LA</strong>NL’s operations at the ResearchPark are based on partnerships between industry collaborators and various Laboratory groups. These groupsstand to benefit from industry-related research and, by their joint activities, help foster economic developmentin Los Alamos County.c) Strategic Computing Complex (renamed Nicholas C. Metropolis Center for Modeling and Simulation)Description: The SCC houses one of the world’s fastest supercomputers. It is a three-story structure with267,000 square feet under roof. About 300 designers, computer scientists, code developers, and universityand industrial scientists occupy the building. The building was connected to existing sewer, water, andnatural gas lines, but required a new 115/13.8-kilovolt substation transformer at the TA-<strong>03</strong> power plant. Threecooling towers were constructed, expandable to six if needed.The SCC will require an estimated 63 million gallons of cooling water per year. This water is proposed tocome from treated waters from the sewage facility, which total more than 100 million gallons annually. TheSCC is projected to have a maximum electricity load requirement of seven megawatts, or about 10 percentof total <strong>LA</strong>NL demand. This amount of cooling water and electricity is what is anticipated when the facilityhas all of the computers installed that it was designed to accommodate. That will probably take several years.When the “Q” machine is completely installed, it will fill about half of the computer room. Another computerwill probably be installed a few years later.The Nonproliferation and International <strong>Security</strong> Center (left) and the Strategic Computing Complex2-168SWEIS Yearbook—2002
This project had its NEPA coverage provided by the Environmental Assessment for the Proposed StrategicComputing Complex, Los Alamos <strong>National</strong> Laboratory, Los Alamos, New Mexico (DOE 1998g). Thisproposal was an allowable interim action, and the NEPA review proceeded separately from the SWEIS.Based on the environmental assessment, DOE issued a Finding of No Significant Impact in December 1998.Status: Construction of this new building got underway in 1999 and continued on schedule through2000 and 2001. At the end of 2001, construction was complete and items on the final punch list were beingaddressed. Occupancy began in December 2001 and was completed in 2002.d) Nonproliferation and International <strong>Security</strong> CenterDescription: The NISC is a four-story building plus basement of 164,000 square feet with a capacity tohouse 465 people. It is being constructed adjacent to the new SCC within TA-<strong>03</strong>. The building will havelaboratories, a machine shop for fabrication of satellite parts, a high-bay fabrication area, an area for the safehandling of sealed radioactive sources, and offices. Building heating and cooling will be by closed-loop watersystems.Because all occupants are to be relocated from other <strong>LA</strong>NL buildings, there is no expected increase inquantities of sewage, solid wastes, or chemical wastes, nor should there be increased demand for utilities. Toaccommodate both the SCC and NISC, nearby parking lots are to be expanded to accommodate an additional800 to 900 vehicles.Status: NEPA review for the NISC project was provided by the Environmental Assessment for theNonproliferation and International <strong>Security</strong> Center (DOE 1999j) and a Finding of No Significant Impact.Design of the building began in 1999 and continued through 2000. Construction started in March 2001, andthe building was enclosed in May of 2002. Interior work is progressing. Occupancy began in March 20<strong>03</strong>.e) Emergency Operations CenterDescription: The Cerro Grande Fire demonstrated several inadequacies within the current EmergencyOperations Center and Multi-Channel Communications capabilities. The fire showed that the EmergencyOperations Center has outlived its useful life. Further research showed that upgrading it would be neithereconomical nor practical, and the decision was made to have a new Emergency Operations Center designedand built.Status: During CY 2001, the conceptual design was completed and the final design was initiated. Alsoduring 2001, an environmental assessment (DOE 2001f) was prepared to address both the EmergencyOperations Center and the Multi-Channel Communications. With the current schedule, the EmergencyOperations Center is expected to be operational by September 30, 20<strong>03</strong>.f) Multi-Channel Communications ProjectDescription: The Multi-Channel Communications Project addresses communication vulnerabilities madeevident in the Cerro Grande Fire. The new communications and information systems will provide flexibilityto communicate between the <strong>LA</strong>NL Emergency Operations Center and external entities to respond tofuture emergencies with the most up to date information. The conceptual design was received in 2001 andprocurement of long lead items was initiated. Also during 2001, an environmental assessment (DOE 2001f)was prepared to address both the Emergency Operations Center and the Multi-Channel Communications.Equipment for the Radio Upgrade to increase the number of channels to 15 has been received and will beinstalled during CY 20<strong>03</strong> at the Communications, Computing, and Networking site on Pajarito Mountain.The Multi-band Radio System, which allows the Emergency Operations Center to communicate with outsideagencies, was received, programmed, is functional and will be installed in the Emergency Operations Center.SWEIS Yearbook—2002 2-169
Exterior and interior views of the Mobile Communications VanThe Mobile Communications Van was received;its radios have been programmed and it hasbeen formally placed into service by EmergencyManagement and Response.The Media Interface System and EmergencyAlert System equipment were procured and setup by the Public Affairs Office. This equipmentwill be moved into the new Emergency Operations Center building for use by Emergency Operations Centerand Public Affairs personnel. <strong>LA</strong>NL now has the capability to produce press releases directly and transmit tolocal television stations as well as generate emergency banners.The Portable Monitoring System, which will provide emergency response personnel remote monitoringcapability, was ordered as well as the associated chemical and radiological sensors. Chemical sensorswere received and tested. The robot will be delivered mid FY 20<strong>03</strong> and will be transferred to EmergencyManagement and Response personnel after acceptance testing.The contract was awarded for procurement and installation of Electronic Message Signs, VideoSurveillance, and Video Database Interface equipment. This system will give the Emergency OperationsCenter the capability to view and remotely record video of <strong>LA</strong>NL property and emergency response and toinform and direct traffic through the use of electronic message signs. Excavation permits were reviewedand approved for electronic sign installation. Approval was obtained from the Meteorology and Air Quality2-170SWEIS Yearbook—2002
Group to use existing meteorological towers to mount CCTV equipment and approval was given by DOE-Albuquerque to utilize wireless communications to transmit real-time video to the Emergency OperationsCenter. All CCTV equipment and electronic signs will be field-installed mid FY 20<strong>03</strong> and monitoring andprogramming equipment will be installed in the Emergency Operations Center.The Data Mirror task demonstrated the feasibility of MaxResponder emergency response software ona Predator ruggedized laptop. Laptops were ordered for installation in <strong>LA</strong>NL and Los Alamos Countyemergency vehicles. Databases were identified for inclusion in the Data Mirror system at the EmergencyOperations Center. The clustered, high-availability server system was procured and installed in the CentralComputing Facility (CCF) for database population. Full database population and user interfaces will occur inFY <strong>03</strong> and computing equipment will be moved to the Emergency Operations Center.Status: The Multi-Channel Communications Project received CD-3 in May of 2002 and was 48 percentcomplete as of the end of January 20<strong>03</strong>. The project is progressing on the anticipated schedule and is 14.percent under budget. It is estimated that final equipment installations will be complete by October 1, 20<strong>03</strong>.g) S-3 <strong>Security</strong> Systems Support Facility (S-3 Facility)Description: The mission of the <strong>Security</strong> Systems group (S-3) is to design, install, and maintain physicalsecurity systems in order to provide detection and deterrence of security violations. S-3 also designs,implements and maintains the software systems that protect nuclear material and control intrusion detection.S-3 provides access control systems, access area training, fire protection integration, and interior andperimeter intrusion detection systems.The S-3 Facility project (TA-<strong>03</strong>-1409) is located on the south side of TA-<strong>03</strong>, along Pajarito Road,immediately west of the existing <strong>Security</strong> Division Complex. The new S-3 Facility will be a two-storybuilding with parking for approximately 95 vehicles. This project consolidates the S-3 organization into asingle facility designed to meet the long-term needs of the group’s activities. S-3 is currently occupying spacein six transportable buildings, and buildings SM-30 and SM-142. The primary mission of this project is toimprove efficiency by consolidating personnel and activities to meet increasing <strong>LA</strong>NL demands for physicalsecurity systems, as well as the increase in facility revitalization and reinvestment.This project utilizes the design/build approach and has two distinct phases: 1) project development andprocurement and 2) execution of the design/build contract. The building is to be designed to <strong>LA</strong>NL technicalstandards and all other applicable codes and standards. The design-build contract will include complete andoperational building systems (i.e., electrical, HVAC, potable water, sanitary sewer, fire protection, telephone,computer/communication systems, and furniture). The project accommodates physical security systemsdesign; fabrication; maintenance; operations; data control; testing of security components; logistical support,to include receiving/warehousing; light electrical laboratory and machine shop operations; and supportingadministration. The size of the completed facility will be 20,400 square feet, accommodating over 63employees.Status: NEPA categorical exclusion #8612 was issued by NNSA/DOE on December 04, 2001 (DOE2001g). Design of the building began in 2002. The contract was awarded in June 2002 and constructionstarted in July 2002. The building is currently enclosed and interior work is progressing. Construction for thisfacility is scheduled to be complete in May 20<strong>03</strong> with occupancy scheduled for June 20<strong>03</strong>.h) Decision Applications Division Office BuildingDescription: The Decision Applications Division Office Building project will provide replacementoffice space for this division. The Design/Build contractor will provide a two-story, 24,813-square-footbuilding that will house 100 Decision Applications Division personnel. This project will allow the divisionSWEIS Yearbook—2002 2-171
Decision Applications Division Offi ce Building under constructionto consolidate functions and employees within close physical proximity and allow for two “temporary”structures to be excessed and decommissioned and demolished the following fiscal year.The project milestones are as follows: NEPA Categorical Exclusion #8595 was issued by NNSA/DOEon February 22, 2002 (DOE 2002g); the contract was awarded in May 2002; the design was completed inSeptember 2002; construction started in September 2002 and is projected to be substantially complete in June20<strong>03</strong>; occupancy is expected to begin in November 20<strong>03</strong>.Status: Construction is underway and progressing rapidly. The building footings and concrete placementfor the elevator are complete, and fire protection and water lines have been installed. The project is poised tocomplete the foundation and begin structural steel erection in April 20<strong>03</strong>. The project is approximately fourweeks ahead of schedule with a small positive cost variance of $54,000. It is expected that the project willhold on to the positive variances and finish ahead of schedule.i) <strong>LA</strong>NL Medical FacilityDescription: Employee health is monitored to assure the effectiveness of site health and safety programsand hazard control plans in protecting employees. The Occupational Medicine Program provides the DOEwith operational assurance that regulatory requirements are being met, that employees are fit (both physicallyand psychologically) to perform work at <strong>LA</strong>NL, and that mission activities are not harming our workers.The new facility will consolidate functions from three sites (TA-53, TA-63, and TA-<strong>03</strong>) and will supportOccupational Medicine functions to include human reliability, medical survey and certification evaluations,illness/injury management, and epidemiology.2-172SWEIS Yearbook—2002
This project will construct an approximately 20,000-square-foot structure employing a pre-engineeredbuilding with interior design to specifically support DOE/NNSA and <strong>LA</strong>NL requirements for occupationalmedicine certification, monitoring, intervention, and quality control. The building will house 60 medical staffpersonnel and support approximately 2,500 patients per month. The project replaces existing non-permanentfacilities that have exceeded their life expectancy and are rapidly deteriorating to the point that theircondition is currently impacting delivery of medical programs.Status: The project received NEPA coverage through Categorical Exclusion #8398, approved May 30,2001 (DOE 2001h). The design/build subcontract was awarded in September 2002. Construction start was inOctober 2002. Work in 2002 was limited to preparation of the temporary parking lot that involved excavationfor site preparation and leveling, removal of asphalt from the building site, and placement of the millingsin the temporary lot. Most of the effort in CY 2002 was focused on developing the design. Constructionactivities for site demolition and preparation, foundation, and underground utilities are continuing. Thebaseline schedule projects that construction will be complete in September 20<strong>03</strong> with operational status byJanuary 2004.j) Chemistry Division Office Building (Chemistry Technical Support Building)Description: As a result of the Cerro Grande Fire, over 200 employees were displaced due to the fact thattheir office trailers were destroyed or severely damaged by fire. As such, the housing of <strong>LA</strong>NL employeesin fire-susceptible trailers is a demonstrated vulnerability. Damage to permanent structures in the same areasduring the Cerro Grande Fire was much less severe and limited mostly to smoke damage and damage due toelectrical fluctuations. The new Chemistry Technical Support Building was built to house displaced scientistsand technicians from burned buildings within TA-46. To provide permanent office space for displacedemployees and to further decrease the present number of office trailers at <strong>LA</strong>NL, this permanent officebuilding has been constructed at TA-46, one of the sites to suffer the greatest loss of building space. The newtwo-story, 18,000-square-foot office building is located outside the fence at TA-46. This General Plant Projectwill provide vital support for surrounding <strong>LA</strong>NL Buildings 30, 31, and 154. The new building is office spaceonly. No hazardous or radiological materials will be involved in the project.Status: The project received its own NEPA coverage by Categorical Exclusion # 8044 issued February 28,2001 (DOE 2001i). Construction began in August 2002 and was completed in November 2002. Occupancywas granted in November 2002.Chemistry Technical Support BuildingSWEIS Yearbook—2002 2-173
k) Materials Science and Technology Office BuildingDescription: This project is consistent with <strong>LA</strong>NL’s long-range vision to group materials science activitiestogether in the southeast quadrant of TA-<strong>03</strong>. The new Materials Science and Technology Office Buildingproject location is west of the Sigma Complex security fence. The MSL and the other permanent buildingscomprising the materials science complex are all located adjacent to the site proposed for this new officebuilding and a common circulation pattern for that area will be implemented.This General Plant Project will replace 17 trailers located to the east of <strong>03</strong>-1819 and <strong>03</strong>-2002 with amultistory office building. This modern, sustainable facility will dramatically reduce operational costscompared to those associated with the “temporary” structures. The project will provide the Materials Scienceand Technology Division with a new office building to house approximately 80 staff currently working in acluster of “temporary” trailers and transportable structures in the materials science complex in TA-<strong>03</strong>. Theinstallation of numerous “temporary” structures has proven inefficient over the years because of the highoperational costs in addition to the fact that these facilities do not provide an effective work environment.Consequently, these facilities are detrimental to recruitment and retention of personnel.Status: The project received its own NEPA coverage by Categorical Exclusion # 8618 issued December07, 2001 (DOE 2001j). Construction of the new office building began in November 2002. The estimatedcompletion date is September 20<strong>03</strong>. Occupancy is scheduled to begin in October 20<strong>03</strong>.l) TA-72 Live Fire Shoot HouseDescription: PT<strong>LA</strong> currently provides security support for <strong>LA</strong>NL and its environs. Their mission requiresPT<strong>LA</strong> support to be trained to a high state of security readiness and to be able to respond to any emergencysituation relative to the security of <strong>LA</strong>NL. The purpose of the newly constructed Live Fire Shoot Houseis to provide an environment of the safe and realistic conduct of advanced tactical training for the PT<strong>LA</strong>.In addition, this General Plant Project enables <strong>LA</strong>NL security officers to satisfy all DOE requirements fortraining and Live Fire Shoot House qualifications. Prior to construction of the Live Fire Shoot House in2002, all training activities were conducted at the firing ranges at TA-72 with the exception of the Live FireShoot House training and qualifications that were conducted at offsite facilities. This consolidation of PT<strong>LA</strong>training activities into one location will result in a substantial cost savings for the PT<strong>LA</strong> training program,a more efficient use of personnel, and a more effective means of complying with DOE and <strong>LA</strong>NL trainingrequirements.Live Fire Shoot House2-174SWEIS Yearbook—2002
The Live Fire Shoot House facility is an entirely lead-free structure installed on a reinforced concretepad at TA-72. The facility consists of ballistic-resistant, steel-walled 60-foot by 76-foot modular structure.The entire house and concrete pad are covered with a steel-framed roof structure, similar to a metal buildingbut open on four sides, to protect the facility from the weather and to permit training in inclement weather.Exterior and interior walls consist of 4-foot-wide by 12-foot-high modular panels. These walls are designedto contain the bullets and fragmentation from multiple impacts. Bullet traps are placed in the Live Fire ShootHouse as the primary impact target for rounds fired. These traps are constructed of armor steel that cannot bepenetrated by handgun rounds and can withstand 5.56-mm, full-metal jacket rounds.The Live Fire Shoot House has an elevated observation control platform which is essentially a catwalkconstructed over a portion of the house to allow instructor monitoring and evaluation of the training.This catwalk is accessed by a set of stairs adjacent to the exterior of the house. The stairway was built toOccupational Safety and Health <strong>Administration</strong> safety specification; the stairs and the elevated observationcontrol platform have appropriate guardrails.NEPA review for this project was provided under ESH-ID 97-0130 Shooting House/Concrete Pad andESH-ID 98-0168 Live Fire Shoot House. NEPA coverage for the project was finally provided by CategoricalExclusion # 7245 issued on <strong>03</strong>/16/2000 (DOE 2000e).Status: Construction of the new Live Fire Shoot House began in November 2002 and was completed inJanuary 20<strong>03</strong>. The facility became operational in March 20<strong>03</strong>.m) <strong>Security</strong> Truck Inspection PostDescription: In an emergency response to the events that occurred on 9-11, security at <strong>LA</strong>NL has beenenhanced to protect our valuable assets—our personnel, property, and projects. One such security upgradewas the installation of the Truck Inspection Post (Post 10) on East Jemez Road just west of State Road 4. Thepurpose of this post is to screen all large vehicles coming into <strong>LA</strong>NL to ensure they have the proper authorityto be on DOE property. This post was initially established on the upper end of East Jemez Road near theTransit Mix Plant as an immediate response to 9-11. The permanent location of the post is now on the lowerend of East Jemez Road.When a truck stops at this post, the drivers are checked for identification and transportation invoices toensure their destination is, and should be, <strong>LA</strong>NL. At this post, if the paperwork is in order, the truck is issueda one-time pass that will permit access through other <strong>LA</strong>NL SECON Posts between the Truck Inspection Postand the truck’s destination.Trucks that show up at SECON Posts at <strong>LA</strong>NL without this pass or a valid DOE Standard or <strong>LA</strong>NL-issuedbadge are turned around and sent back to the Truck Inspection Post. If the drivers can provide the necessarycredentials, the truck is then issued a pass that authorizes its passage through SECON Posts to the destination<strong>LA</strong>NL facilities.Status: The project received its own NEPA coverage by Categorical Exclusion # 8726 issued March11, 2002 (DOE 2002h). The permanent Truck Inspection Post was installed in March 2002 and becameoperational in April 2002.SWEIS Yearbook—2002 2-175
n) NPDES Outfall ProjectDuring 1997 and 1998, 10 of 28 outfalls from the Non-KeyFacilities were eliminated from the NPDES permit. Watersfrom eight of these have been routed to the sewage plant atTA-46; discharges from the other two were eliminated. During1999, 13 outfalls from Non-Key Facilities were eliminatedfrom the NPDES permit. Responsibility for nine of the 13was transferred to Los Alamos County when the Countyassumed ownership of water supply wells, pumping stations,storage tanks, and piping. Discharges from the remainingfour outfalls were eliminated when the source activities wereeliminated and were associated with water supply wells thatwere removed from service. Coupled with the 10 outfallsdeleted during 1997 and 1998, a total of 24 of 27 outfallsfrom the Non-Key Facilities have been eliminated. AlthoughOutfall 13S is still listed as an outfall, 13S serves the sanitarywastewater treatment plant at TA-46. Instead of discharging toMortandad Canyon, however, treated waters are pumped to TA-<strong>03</strong> for re-use and ultimate discharge through Outfall 001 intoSandia Canyon. This transfer has resulted in projected NPDESvolumes underestimating actual discharges from the existing Outfall samplingoutfall. In 2000, a new outfall, Outfall <strong>03</strong>A-199, was added tothe NPDES permit. Although there was no discharge in 2000,2001, or 2002, Outfall <strong>03</strong>A-199 is to accommodate the future Laboratory Data Communications Center.Currently, there are a total of 21 permitted outfalls at <strong>LA</strong>NL; five of these are in Non-Key Facilities. TheSWEIS ROD projected a total of 55 <strong>LA</strong>NL outfalls, 22 at Non-Key Facilities.2.16.2 Operations at the Non-Key FacilitiesNon-Key Facilities are host to seven of the eight categories of activities at <strong>LA</strong>NL (DOE 1999a, pp. 2-2 through 2-9) as shown in Table 2.16.2-1. The eighth category, environmental restoration, is discussed inSection 2.17. During the 1998–2002 timeframe, no new capabilities were added to the Non-Key Facilities andnone of the eight was deleted.Table 2.16.2-1. Operations at the Non-Key FacilitiesCAPABILITYEXAMPLES1. Theory, modeling, and highperformancecomputing. plasma and beam physics, fluid dynamics, and superconducting materials.Modeling of atmospheric and oceanic currents. Theoretical research in areas such as2. Experimental science and Experiments in nuclear and particle physics, astrophysics, chemistry, and acceleratorengineering.technology. Also includes laser and pulsed-power experiments (e.g., Atlas).3. Advanced and nuclear Research and development into physical and chemical behavior in a variety ofmaterials research and environments; development of measurement and evaluation technologies.development and applications4. Waste management Management of municipal solid wastes. Sewage treatment. Recycle programs.5. Infrastructure and central Human resources activities. Management of utilities (natural gas, water, electricity).servicesPublic interface.6. Maintenance andPainting and repair of buildings. Maintenance of roads and parking lots. Erecting andrefurbishmentdemolishing support structures.7. Management of environmental, Research into, assessment of, and management of plants, animals, cultural artifacts,ecological, and cultural and environmental media (groundwater, air, surface waters).resources2-176SWEIS Yearbook—2002
In 1998, workforce size increased appreciably for the Non-Key Facilities and accounted for almost all ofthe 1,415 new workers at <strong>LA</strong>NL since 1995. This increase is due to the fact that activities at the Non-KeyFacilities consist largely of research and development, services, and administration. The increase in researchand development reflected the ebb and flow that is typical of funds and interest in research. Increased researchrequired more scientists, more support services, and a higher level of administration.The <strong>LA</strong>NL workforce increased by 404 employees during 1999. This brought the total workforce upto 12,412 employees, or 1,061 more employees than were anticipated under the ROD. Approximately 27percent of these new employees were either JCNNM (17 percent) or PT<strong>LA</strong> (10 percent). This reflects thenew construction going on at <strong>LA</strong>NL and the increased efforts in security upgrades as <strong>LA</strong>NL moves forwardwith its assignments for Stockpile Stewardship and Management. Approximately 40 percent of these newemployees were regular (full-time and part-time) UC employees, of which about 40 percent were assigned tothe Non-Key Facilities.The 12,015 employees at the end of CY 2000 are 664 more employees than SWEIS ROD projectionsof 11,351. The 12,380 employees at the end of CY 2001 are 1,029 more employees than SWEIS RODprojections of 11,351. The 13,524 employees that comprise the total <strong>LA</strong>NL-affiliated workforce at the end ofCY 2002 are 2,173 more employees than the SWEIS ROD projection of 11,351. SWEIS ROD projectionswere based on 10,593 employees identified for the index year (employment as of March 1996). About 60percent of this increase is in the Non-Key Facilities as a result of increases in research and development,services, and administration.The 5,243 employees in the Non-Key Facilities at the end of CY 2002 reflect an increase of 427 employeesover the 4,816 employees reported in the 2001 SWEIS Yearbook (<strong>LA</strong>NL 2002i).2.16.3 Operations Data for the Non-Key FacilitiesEven though the Non-Key Facilities occupy more than half of <strong>LA</strong>NL and employ more than half theworkforce, activities in these facilities generally contribute less than 20 percent of most operational effects.For example, the 534 cubic meters of LLW constituted only 7 percent of the <strong>LA</strong>NL total LLW volume in2002. Also in 2002, the Non-Key Facilities generated approximately 56 percent of the total <strong>LA</strong>NL chemicalwaste. Table 2.16.3-1 presents details of the operations data from 1998–2002.Radioactive air emissions from stacks at the Non-Key Facilities (290 curies in 2002) were less than a thirdof the SWEIS ROD projections. The radioactive air emissions of 1,000 curies in 2001 were slightly aboveSWEIS ROD projections. This represents off gassing from inactive facilities and their cleanup activities andrepresents less than 5 percent of the 21,700 curies projected by the SWEIS ROD.The combined flows of the sanitary waste treatment plant and the TA-<strong>03</strong> steam plant account for about 77percent of the total discharge from Non-Key Facilities and about 73 percent of all water discharged by <strong>LA</strong>NL.Section 3.2 has more detail. Operations data are summarized in Table 2.16.3-1.2.16.4 Cerro Grande Fire Effects at the Non-Key FacilitiesThe Non-Key Facilities received significant fire damage. The Cerro Grande Fire impacted 86 structuresor buildings, damaged 31 structures or buildings, and destroyed 10 structures or buildings. Like the rest of<strong>LA</strong>NL, operations were shut down during the emergency, and these programs suffered lost work time. Accesswas restricted in several of the more severely burned areas at <strong>LA</strong>NL, and employees who occupied thedamaged or destroyed structures had to be housed in new locations. In addition, the fire destroyed data, workin-progress,and work production at many locations, delaying some of the programs.SWEIS Yearbook—2002 2-177
2-178SWEIS Yearbook—2002Table 2.16.3-1. Non-Key Facilities/Operations DataPARAMETER UNITS SWEIS ROD 1998 YEARBOOK 1999 YEARBOOK 2000 YEARBOOK 2001 YEARBOOK 2002 YEARBOOKRadioactive Air Emissions: aTritium Ci/yr 9.1E+2 5.66E+2 9.5E+2 1.15E+3 1.0E+3 2.9E+2Plutonium Ci/yr 3.3E-6 None measured None measured b None measured b None measured b None measured bUranium Ci/yr 1.8E-4 None measured None measured b None measured b None measured b None measured bNPDES Discharge:Total Discharges MGY 142 95 232 192 99.01 130.827001 (TA-<strong>03</strong>) MGY 114 170 98.75 101.3200013S (TA-<strong>03</strong>) MGY c c c c c c<strong>03</strong>A-027 (TA-<strong>03</strong>) MGY 5.8 8.7 0.13 6.6070<strong>03</strong>A-160 (TA-35) MGY 5.1 14 0.13 22.9000<strong>03</strong>A-199 (TA-<strong>03</strong>) MGY --- 0 d 0 d 0 d 0 d 0 d<strong>03</strong>A-042 (TA-46) MGY 5.30 No discharge Eliminated 1998 Eliminated 1998 Eliminated 1998 Eliminated 199804A-118 (TA-54) MGY 1.10 No discharge ActiveEliminated 1999 Eliminated 1999 Eliminated 199904A-166 (TA-05) MGY 0.01 No discharge No observation Eliminated 1999 Eliminated 1999 Eliminated 1999<strong>03</strong>A-<strong>03</strong>8 (TA-33) MGY 5.80 Eliminated 1997 Eliminated 1997 Eliminated 1997 Eliminated 1997 Eliminated 199704A-171 (<strong>National</strong> Forest) MGY 0.00 No discharge No discharge Eliminated 1999 Eliminated 1999 Eliminated 199904A-172 (<strong>National</strong> Forest) MGY 0.00 No discharge No discharge Eliminated 1999 Eliminated 1999 Eliminated 199904A-173 (<strong>National</strong> Forest) MGY 0.00 No discharge ActiveEliminated 1999 Eliminated 1999 Eliminated 199904A-174 (<strong>National</strong> Forest) MGY 0.00 No discharge Eliminated 1998 Eliminated 1998 Eliminated 1998 Eliminated 199804A-175 (<strong>National</strong> Forest) MGY 0.00 No discharge No observation Eliminated 1999 Eliminated 1999 Eliminated 199904A-176 (<strong>National</strong> Forest) MGY 0.66 ActiveActiveEliminated 1999 Eliminated 1999 Eliminated 199904A-177 (<strong>National</strong> Forest) MGY 0.06 No discharge No observation Eliminated 1999 Eliminated 1999 Eliminated 1999<strong>03</strong>A-<strong>03</strong>4 (TA-21) MGY 0.26 Eliminated 1997 Eliminated 1997 Eliminated 1997 Eliminated 1997 Eliminated 1997<strong>03</strong>A-<strong>03</strong>5 (TA-21) MGY 0.04 Eliminated 1997 Eliminated 1997 Eliminated 1997 Eliminated 1997 Eliminated 199704A-182 (TA-21) MGY 0.00 ActiveEliminated 1998 Eliminated 1998 Eliminated 1998 Eliminated 199804A-186 (TA-21) MGY 0.18 ActiveActiveEliminated 1999 Eliminated 1999 Eliminated 199906A-132 (TA-35) MGY 5.80 No discharge Eliminated 1998 Eliminated 1998 Eliminated 1998 Eliminated 1998<strong>03</strong>A-025 (TA-<strong>03</strong>) MGY 0.18 ActiveEliminated 1998 Eliminated 1998 Eliminated 1998 Eliminated 199804A-164 (TA-18) MGY 0.01 No discharge No observation Eliminated 1999 Eliminated 1999 Eliminated 199906A-106 (TA-36) e MGY 0.58 No discharge Eliminated 1999 Eliminated 1999 Eliminated 1999 Eliminated 199904A-161 (TA-72) MGY 1.00 ActiveActiveEliminated 1999 Eliminated 1999 Eliminated 1999<strong>03</strong>A-148 (TA-<strong>03</strong>) MGY 6.30 Eliminated 1997 Eliminated 1997 Eliminated 1997 Eliminated 1997 Eliminated 199704A-094 (TA-<strong>03</strong>) MGY 5.30 Eliminated 1997 Eliminated 1997 Eliminated 1997 Eliminated 1997 Eliminated 199704A-163 (TA-72) MGY 6.20 ActiveActiveEliminated 1999 Eliminated 1999 Eliminated 199904A-165 (TA-72) MGY 2.00 ActiveActiveEliminated 1999 Eliminated 1999 Eliminated 1999
SWEIS Yearbook—2002 2-179Table 2.16.3-1. Non-Key Facilities/Operations Data (continued)i iPARAMETER UNITS SWEIS ROD 1998 YEARBOOK 1999 YEARBOOK 2000 YEARBOOK 2001 YEARBOOK 2002 YEARBOOKWastes:Chemicalkg/yr 651,000 1,506,392 765,395 367,768f1,254,680 334,348Number of 6,579 4,547 4,601LLW m 3 g/yr 520 386 350 2,781 569 534MLLW m 3 h/yr 30 55.4 2.5 10.1 9.4 8.7TRU m 3 /yr 0 0 0 2.7 24.8 36.8Mixed TRU m 3 /yr 0 0 15 63 0 0.21Workers FTEs 4,601 i 4,501 i 4,816 i 5,243 iabcdefghiStack emissions from previously active facilities (TA-33 and TA-41); these were not projected as continuing emissions in the future. Does not include non-pointsources.Most of the stacks in the Non-Key Facilities are not sampled for radioactive airborne emissions because the potential emissions from these stacks are sufficiently smallthat measurement systems are not necessary to meet regulatory or facility requirements.Outfall 013 is from the TA-46 sewage plant. Instead of discharging to Mortandad Canyon, however, treated waters are pumped to TA-3 for re-use and ultimatedischarge through Outfall 001 into Sandia Canyon. This transfer of water has resulted in projected NPDES volumes underestimating actual discharges from the exitingoutfall.New Outfall <strong>03</strong>A-199 was permitted by the EPA on 2/1/2001 for the future Laboratory Data Communications Center. It had no discharge during 2000, 2001, or 2002.Outfall <strong>03</strong>A-106 was incorrectly associated with the Non-Key Facilities in the SWEIS. Starting with the 2002 Yearbook, Outfall <strong>03</strong>A-106 is accounted for with HighExplosives Testing.Approximately 73,449 kilograms of the chemical wastes are construction and demolition debris (previously indicated in the Yearbooks as industrial solid wastes)resulting from cleanup following the Cerro Grande Fire. The construction and demolition debris is nonhazardous, may be disposed of in county landfills, and does notrepresent a threat to local environs.The CY 2000 LLW was generated from D & D activities and from soil and sediment removal from Mortandad and Los Alamos Canyons.The CY 1998 MLLW was generated as a result of soil and asphalt removal from MDA-L construction activities.The first number shown in the “SWEIS ROD” column is the actual employee count representing CY 1999 (the year the SWEIS ROD was published). The secondnumber shown in the “SWEIS ROD” column is the index number representing CY 1999 (the year the SWEIS ROD was published). The number of employees for1998 through 2002 operations cannot be directly compared to numbers projected by the SWEIS ROD. The employee numbers projected by the SWEIS ROD representtotal workforce size and include PT<strong>LA</strong>, JCNNM, and other subcontractor personnel. The number of employees for CY 1998 through CY 2002 operations is routinelycollected information and represents only UC employees (regular full-time and part-time). Because the two sets of numbers (SWEIS ROD versus the new index) do notrepresent the same entity, a direct comparison to numbers projected by the SWEIS ROD (see Section 3.6, Socioeconomics) is not appropriate. However, because thisindex is going to be used in each subsequent Yearbook, selecting CY 1999 as the base year establishes an index that can be compared over the ten-year windowrepresented by the SWEIS ROD.
2.17 Environmental Restoration ProjectThe ER Project may generate a significant amount of waste during cleanup activities; therefore, the projectis included as a section of Chapter 2. The SWEIS ROD forecast that the ER Project would contribute 60percent of the chemical wastes, 35 percent of the LLW, and 75 percent of the MLLW generated at <strong>LA</strong>NL overthe 10 years from 1996–2005. The ER Project will also affect land resources in and around <strong>LA</strong>NL.The DOE established the ER Project in 1989 to characterize and remediate over 2,100 PRSs known,or suspected, to be contaminated from historical operations. Many of the sites remain under DOE control;however, some have been transferred to Los Alamos County or to private ownership (at various locationswithin the Los Alamos town site). Remediation and cleanup efforts are regulated by and coordinated with theNMED and/or DOE.In 2002, ER Project activities included drafting and finalizing several characterization and remediationreports for NMED, conducting characterization and remediation field work on numerous sites, and formallytracking all work performed.Some cleanups included• Interim Action at the TA-53 north impoundment, which included the removal of 5,000 cubic yardsof contaminated material;• removal of 1,500 cubic feet of contaminated soil at the TA-16-260 outfall; and• source removals at TA-21 and TA-54.Continued field investigations included• drilling and installation of five groundwater monitoring wells (R-14, R-16, R-20, R-23, and R-32);• sampling at PRS <strong>03</strong>-052(a)-00;• four rounds of well sampling and two rounds of biota sampling to monitor natural attenuation andto support the ER Project’s collaboration with San Ildefonso Pueblo; and• completion of sediment, alluvial groundwater, and surface water sampling in Los Alamos/PuebloCanyon.2.17.1 Operations of the Environmental Restoration ProjectThe ER Project originally identified 2,124 PRSs, consisting of 1,099 PRSs administered by NMED and1,025 PRSs administered by DOE. By the end of 2002, only 833 discrete PRSs remain. Approximately 694units have been approved for no further action (NFA) 8 , 139 units have been removed from the Laboratory’sHazardous Waste Facility Permit, and 48 units proposed for NFA in previous permit modification requests arepending approval by NMED.Of the 139 total PRSs removed from the permit, no sites were removed in 2002. Additionally, in 2002, onenew PRS was identified and nine additional PRSs were proposed to the NMED for NFA.Completion of MDA-PThe completion of remediation activities at MDA-P was a major accomplishment for the ER Project.MDA-P is located at TA-16 on the south rim of Cañon de Valle on the western edge of <strong>LA</strong>NL. The MDA-P Landfill began receiving waste from the S-Site Burning Grounds in 1950. Debris from World War II–erabuildings was also disposed of at MDA-P. Operation of the landfill was suspended in 1984. ER Projectpersonnel began the closure process at the landfill in 1997. The presence of detonable high explosives in thelandfill required the use of a robotic excavator. Remote excavation of the landfill began in February 19998NFA means that the site is considered “clean” for its intended purpose. An industrial site would not be cleaned up to the same level as aresidential site.2-180SWEIS Yearbook—2002
MDA-P after ER Project remediation activities (top), Remote-controlledequipment in use to remove detonable high explosives from MDA-P(right)and was completed on May 3, 2000, just before the CerroGrande Fire. Excavation of contaminated soil beneath thelandfill using non-remote excavation methods resumedafter the fire and was completed in March 2001. PhaseII confirmatory sampling and geophysics measurements began in June 2001. During Phase II sampling,additional contamination was found, which was excavated and shipped off-site for disposal. All wastedisposal was completed at MDA-P in February 2002. Phase II confirmation sampling was also completedin the spring of 2002. More than 52,500 cubic yards of soil and debris were excavated from MDA-P. Wastematerial included hazardous and industrial waste and recycled material. Waste types and amounts generatedincluded• 387 pounds of detonable high explosive,• 820 cubic yards of hazardous waste with residual levels of radioactive contamination,• 6,600 pounds of barium nitrate,• 2,605 pounds of asbestos,• 200 pounds of mixed waste,• 235 cubic feet of LLW, and• 888 containers that underwent hazardous categorization characterization.TA-53 North ImpoundmentThree lagoons at TA-53 were constructed in 1969 to collect excess sanitary, radioactive, and industrialwastewater. The wastewater came from various <strong>LA</strong>NSCE activities as well as septic tank sludge from other<strong>LA</strong>NL activities. The lagoons operated until 1998, when the southern lagoon was replaced by a new liquidwastewater treatment facility at TA-53. The southern lagoon was remediated by the ER Project in 2000, andthe two northern lagoons were remediated in 2002.The two northern lagoons were 210 feet long, 210 feet wide, and 6 feet deep, and each could store 1.6million gallons. The lagoons worked via evaporation. The radioactive wastewater was first pumped intostorage tanks to allow short-lived radioisotopes to decay away and then was pumped into the lagoons toevaporate.SWEIS Yearbook—2002 2-181
The sludge and water in the lagoons and surrounding area were sampled and analyzed in four separatesampling events. The DOE conducted the first in 1988, then <strong>LA</strong>NL conducted several in 1991/1992,1994/1995, and 1999/2000. The contaminants of potential concern found included cobalt-60, cesium-134,strontium-90, sodium-22, and tritium. Other inorganic and organic chemicals identified were lead, mercury,and polychlorinated biphenyls.Approximately 5,000 cubic yards of contaminated material (sludge and clay liner) from the two northernlagoons were removed in 2002. The sludge and clay liners contained radioisotopes (e.g., cobalt-60 andcesium-134) and carcinogens (Aroclor-1260) at levels exceeding the target levels of 15 millirem per year fordose and 10 -5 risk. One hundred and fifty-nine waste bins were filled with northeast lagoon waste and 230waste bins from the northwest lagoon. Approximately 90 cubic yards of soil were removed from the lagoonsoutfall area located on the eastern side. Miscellaneous debris, from a previous interim action, filled anotherthree waste bins.Lagoon remediation efforts almost completed at <strong>LA</strong>NSCESource RemovalsA voluntary corrective action (VCA) was performed at the Burn Ground North as part of the MDA-Pclosure activities during FY 2002. VCAs were also completed at areas of concern (AOCs) 21-<strong>03</strong>0 and C-21-015, and at solid waste management unit (SWMU) 54-007(a). Additionally, approximately 1,500 cubicfeet of contaminated soil was removed and site restoration was completed at the TA-16-260 outfall. Allcontaminated soils were removed and disposed of in accordance with applicable EPA, NMED, DOE, and<strong>LA</strong>NL requirements. VCA completion reports were prepared for AOCs 51-001 and 54-007(d), SWMU54-007(c)-99, and the Los Alamos Area Office Land Transfer Tract (which included PRSs 0-0<strong>03</strong>, 0-012,and 0-<strong>03</strong>0(i)) and submitted to the appropriate administrative authority (NMED for Hazardous and SolidWaste Amendment [HSWA] PRSs, and DOE for non-HSWA PRSs) with a recommendation for NFA.NMED concurred with the recommendation for NFA at the Los Alamos Area Office Land Transfer Tractfor the two HSWA PRSs, based on a review of the VCA completion report. DOE also concurred with therecommendation for NFA for the one non-HSWA PRS.Continued Field InvestigationsThe ER Project continued investigations in several areas during FY 2002, including the following:• completed four rounds of well sampling and two rounds of biota sampling to monitor naturalattenuation and to support the ER Project’s collaboration with San Ildefonso Pueblo,• completed the drilling and installation of one monitoring well, R-13. Additionally, the ER Projectcompleted the report on hydrologic tests at characterization wells R-9i, R-13, R-19, R-22 and R-31;2-182SWEIS Yearbook—2002
completed geochemistry reports on R-15, R-9/9i, R-19, and R-12; and produced well completionreports for R-22 and R-7,• completed well installation and hydrological testing at well CdV-R-37-2,• completed sediment, alluvial, and surface water field investigations in Los Alamos/Pueblo Canyon,• completed accelerated sampling at PRS <strong>03</strong>-052(a)-00, and• completed geophysical investigations at PRS <strong>03</strong>-010(a).2.17.2 Operations Data for the Environmental Restoration ProjectWaste quantities generated from FY 1998 through FY 2002 are shown in Table 2.17.2-1. The ER Projectgenerated 1,047 kilograms of chemical waste (including the categories RCRA, Toxic Substances Control Act[TSCA], and New Mexico Special Waste) in FY 2002—all below the projections made by the SWEIS ROD.Table 2.17.2-1. Environmental Restoration Project/Operations DataWASTESWEISYEARBOOKTYPE UNITS ROD 1998 1999 2000 2001 2002Chemical a kg/yr 2,000,000 143,913 14,629,792 b 26,185,341 c 25,815,571 c 1,132,780LLW m 3 /yr 4,260 744 286 226 621 5,484MLLW m 3 /yr 548 9.2 1.25d577 28.86 0TRU m 3 /yr 11 0 0 0 0 0Mixed TRU m 3 /yr 0 0 0 0 0.20aThe chemical waste volume includes the categories of RCRA, TSCA, and New Mexico Special Waste.bThe chemical waste volume is higher than that projected in the SWEIS ROD because of extensive amounts of soildisposed of by the cleanup of MDA P.cThe chemical waste volume includes industrial solid waste and other chemical waste generated during the recovery effortsfrom the Cerro Grande Fire.dThe MLLW volume includes 574.5 cubic meters of MLLW generated as a result of emergency cleanups following theCerro Grande Fire.2.17.3 Cerro Grande Fire Effects on the ER ProjectFrom 2000The major concern following the Cerro Grande Fire was the threat of erosion at burned over PRSs and themovement of contaminants downstream. The ER Project began an assessment of the 600 PRSs within theburn area to accomplish the following:• Evaluate and stabilize sites touched by fire. The PRS Assessment Team determined that over 300PRSs were touched by fire. Assessments for these PRSs were completed by May 23, 2000, and, asshown in Table 2.17.3-1, erosion control measures (called best management practices) were neededfor 91 of the 300 PRSs. These best management practice installations were completed on July 15,2000, and included contour raking, placement of water barriers (straw wattles), diversion of streamchannels, and other measures to divert surface water from the PRS.SWEIS Yearbook—2002 2-183
Table 2.17.3-1. Evaluated and Stabilized PRSs following the Cerro Grande Fire• Conduct baseline sampling to characterize post-fire, pre-flood conditions (i.e., beforemonsoon season rains) in fire-impacted watersheds. The Contaminant Transport Teamcompleted a Baseline Characterization Sampling Plan on June 24, 2000. Pre-flood fieldwork,including collection of sediment, surface water, and alluvial groundwater samples, was completedon July 14, 2000. Post-flood fieldwork was carried out in August and September of 2000, asnecessary.• Evaluate, stabilize, or remove sites subject to flooding. The Accelerated Actions Team identified77 PRSs in fire-impacted canyons that were potentially vulnerable to post-fire flooding. Themajority of these sites were in Los Alamos Canyon (TA-2 and TA-41) and Pajarito Canyon (TA-18 and TA-27) and included outfalls, storm drains, septic systems, and other structures (includingthose associated with the Omega West Reactor at TA-2). Few of the sites assessed actually requiredcorrective actions except for several in TA-2 where excavation, soil removal, and site restorationactivities were completed during July and August 2000.In addition, one flood-impacted sediment deposition area and five fire-impacted sites were identifiedthat required corrective actions to remove debris or contaminated soils. ER Project personnel completedaccelerated actions at the following sites:MDA-RNO. OF PRSs PRS LOCATIONS START DATE COMPLETION DATE10 TA-11 5/21/00 5/24/0029 TA-06, 09, 14, 15, 22, 36, 40, 49 6/14/00 7/15/0<strong>03</strong>4 TA-16, 46, 15, (R-44) 5/29/00 7/15/0018 TA-04, 05, 42, 48 6/27/00 7/15/00• Los Alamos Canyon, “Garden Plot”: excavation of 765 cubic meters of low-level radioactivelycontaminated soil, waste removal, and site restoration,• TA-16, MDA-R: excavation and waste removal,• TA-15, R-44 firing site surface disposal area: debris removal,• TA-36 surface disposal area: debris removal,• TA-40 surface disposal area: debris removal, and• TA-16 “silver” outfall: removal of contaminated soil and stabilization of drainage channel.MDA-R (a 2.25-acre site) is located in TA-16, north of TA-16-260 (high explosives machining building)and south of Cañon de Valle. It lies on level terrain with a moderate-to-steep slope to the north, dropping off80 feet into the canyon. MDA-R ignited during the Cerro Grande Fire and continued to burn for over twoweeks.Historically, MDA-R was a burn ground and waste disposal site for S-Site’s weapons experiments fromthe mid-1940s until the early 1950s, probably 1951. Initially, waste materials were burned in an open field atMDA-R; later, three U-shaped bermed pits (75 feet by 75 feet) were constructed for burning. High explosivesscrap was collected, broken up, and burned in these pits. When the 260 Line was constructed, the bermsand the surface soil at MDA-R were graded northward into Cañon de Valle. A 1992 inspection of MDA-Rrevealed the presence of oil cans, glass vials, metal structures, and coaxial cables below MDA-R on the southside of the canyon.During the week of May 15, 2000, <strong>LA</strong>NL personnel observed that MDA-R was smoldering, noting thattree roots, tree trunks, railroad ties, and cabling were burning. Over the next two weeks, emergency personnel2-184SWEIS Yearbook—2002
attempted to extinguish the fire; first with fire-suppression foam, and later with water. However, the sitecontinued to burn beneath the surface. Ultimately, it was decided that the fire could only be extinguishedby excavation of the burning material. Using a remote excavator (a remotely controlled, fully functioningback hoe with mounted television survey cameras), burning material was uncovered and extinguished usinga low-pressure water stream from a fire hose. The remote excavator was required because of the possibilitythat unexploded high explosives were present in MDA-R. The last embers in MDA-R were extinguished onAugust 31, 2000.MDA-R was prioritized for accelerated corrective action because of concerns that erosion might leadto contaminant migration. Wastes removed from the site included approximately 1,960 cubic yards of soil,175 pounds of barium nitrate pieces, and 300 pounds of friable asbestos. Erosion control activities includedstabilization of spoils piles, stabilization of canyon slopes, and redirection of a small drainage arroyo thatpreviously conducted surface water runoff through the landfill. For more information regarding this activitysee the ER Project’s Project Completion Report for the Accelerated Action at TA-16, MDA-R (<strong>LA</strong>NL 2001s).Los Alamos Canyon CleanupIn late June 2000, a cleanup of contaminated sediment was conducted in Los Alamos Canyon following theCerro Grande Fire to address the potential for these sediments to be eroded and transported during possiblelarge floods resulting from high-intensity summer precipitation. The sediments removed were situatedwithin three discrete areas immediately below the confluence with DP Canyon. The contamination withinthese sediments consisted primarily of cesium-137 with lesser amounts of strontium-90, amercium-241,and plutonium. The contamination, at the remediation site and elsewhere in Los Alamos Canyon, is relatedpredominantly to releases of effluent from Building 21-35 and 21-257 at TA-21 during the years 1952 to1985. The location of the discharges is currently known as PRS 21-011(k). The contaminated sediments atthe remediation site were deposited by floods that occurred during the early period of releases from PRS 21-011(k) (Katzman 2000).The cleanup activity was triggered by several factors:• the area of contaminated sediments was relatively susceptible to flooding and erosion under thehydrologic conditions caused by the fire,• the contaminant concentrations in the remediation were significantly higher than surroundingsediments, and• the area was easily accessible by heavy equipment necessary to remove the sediment.A total of 720 cubic yards of material was removed from three discrete sub-areas within the remediationsite. The waste was transported to TA-54, Area G, for disposal as LLW. Following remediation, this sitewas restored by back filling the excavation with clean fill material brought in from the Los Alamos Countylandfill. The area was then covered with jute matting and reseeded (Katzman 2000).From 2001One year has passed since the Cerro Grande Fire impacted the Los Alamos townsite and the Laboratory.Massive fire rehabilitation and flood mitigation efforts have been ongoing and will continue for severalyears until areas prone to erosion are stabilized. The Cerro Grande Fire put nearly 100 of the ER Project’sPRSs at increased risk of contaminant release and/or transport, by virtue of either being directly burned, orvulnerable to increased surface water runoff or erosion. Since the fire, these sites have had controls installedand continue to be inspected and maintained as part of the Laboratory’s overall storm water program.For an update on the current status of the PRSs impacted by the Cerro Grande Fire go tohttp://lib-www.lanl.gov/pubs/laur01-4122.htm.SWEIS Yearbook—2002 2-185
2.18 ReferencesDepartment of Energy, 1991. “Environmental Assessment for the Materials Science Laboratory,”DOE/EA-0493, and Finding of No Significant Impact. Los Alamos, NM.Department of Energy, 1992a. “<strong>Nuclear</strong> Safety Analysis Report,” DOE Order 5480.23, Washington, D.C.Department of Energy, 1992b. “Hazard Categorization and Accident Analysis Techniques for Compliancewith DOE Order 5480.23, <strong>Nuclear</strong> Safety Analysis Report,” DOE Standard DOE-STD-1027-92,Washington, D.C.Department of Energy, 1993a. “Nonnuclear Consolidation Environmental Assessment, <strong>Nuclear</strong> WeaponsComplex Reconfiguration Program,” DOE/EA-0792, Washington, D.C.Department of Energy, 1993b. “DOE Categorical Exclusion,” <strong>LA</strong>N-94-001, Albuquerque, NM (11/19/93).Department of Energy, 1995a. “Environmental Assessment for Relocation of Neutron Tube Target LoadingOperations,” DOE/EA-1<strong>131</strong>, and Finding of No Significant Impact. Los Alamos, NM.Department of Energy, 1995b. “Dual-Axis Radiographic Hydrodynamic Test Facility Final EnvironmentalImpact Statement,” DOE/EIS-0228, Albuquerque, NM.Department of Energy, 1995c. “Environmental Assessment for Radioactive Source Recovery Program,”DOE/EA-1059, and Finding of No Significant Impact, 12/21/1995, Los Alamos, NM.Department of Energy, 1996a. “Categorical Exclusion for Manufacturing Technical Support Facility(MTSF),” <strong>LA</strong>N-96-022, Accession Number 8248, Los Alamos, NM.Department of Energy, 1996b. “Categorical Exclusion for NMT Protect Combustible Materials,”<strong>LA</strong>N-96-012, Accession Number 8608, Los Alamos, NM.Department of Energy, 1996c. “Categorical Exclusion for TA-55 Fire Protection Yard Main Replacement,”<strong>LA</strong>N-96-012, Accession Number 8532, Los Alamos, NM.Department of Energy, 1996d. “Categorical Exclusion for FRIT (crushed glass) Transfer System,”<strong>LA</strong>N-96-022, Accession Number 8521, Los Alamos, NM.Department of Energy, 1996e. “Categorical Exclusion for NMT Fire Safe Storage Building,”<strong>LA</strong>N-96-012, Accession Number 8304, Los Alamos, NM.Department of Energy, 1996f. “Environmental Assessment for Effluent Reduction,” DOE/EA-1156, andFinding of No Significant Impact. Los Alamos, NM (09/11/96).Department of Energy, 1996g. “Support Structures at <strong>LA</strong>NL, FY96-98,” <strong>LA</strong>N-96-022, (01/18/96),Los Alamos, NM.Department of Energy, 1996h. “Mock Explosive Production Move to Building TA-16-260,” <strong>LA</strong>N-98-<strong>03</strong>8,Los Alamos, NM (05/20/96).Department of Energy, 1996i. “Categorical Exclusion for Destruction of Pu-239 Be Neutron Sources,”<strong>LA</strong>N-96-1<strong>03</strong>, Accession Number 6279, Los Alamos, NM, 06/10/1996.2-186SWEIS Yearbook—2002
Department of Energy, 1996j. “Final Programmatic Environmental Impact Statement for StockpileStewardship and Management,” Appendix K, “Atlas Facility Project-Specific Analysis,” DOE/EIS-0236,Washington, D.C.Department of Energy, 1997a. “Relocation of Radiography at TA-16,” <strong>LA</strong>N-97-<strong>03</strong>6, Los Alamos, NM.Department of Energy, 1997b. “Decontamination and Decommissioning of 28 ‘S Site’ Properties at TA-16,”<strong>LA</strong>N-95-099A, Los Alamos, NM.Department of Energy, 1997c. “Refurbishment of TA-48, Building 1,” <strong>LA</strong>N-97-041, Los Alamos, NM(10/07/97).Department of Energy, 1997d. “Environmental Assessment for the Transfer of the DP Road Tract to theCounty of Los Alamos,” DOE/EA-1184, Los Alamos, NM.Department of Energy, 1997e. “Environmental Assessment for the Lease of Land for the Development of aResearch Park at Los Alamos <strong>National</strong> Laboratory,” DOE/EA-1212, Los Alamos, NM.Department of Energy, 1998a. “DOE List of Los Alamos <strong>National</strong> Laboratory <strong>Nuclear</strong> Facilities,”DOE Albuquerque Operations Office Memorandum, Albuquerque, NM.Department of Energy, 1998b. “Categorical Exclusion for Re-Roof TA-16-205 (WETF),” Accession Number7364 (12/15/1998), Los Alamos, NM.Department of Energy, 1998c. “Categorical Exclusion for WETF Modular Office Building,” <strong>LA</strong>N-96-022,Accession Number 7027 (<strong>03</strong>/11/1998), Los Alamos, NM.Department of Energy, 1998d. “Categorical Exclusion for TA-53 Storage Building,” <strong>LA</strong>N-98-110, AccessionNo. 7199, Los Alamos, NM.Department of Energy, 1998e. “Categorical Exclusion for TA-53 Radioactive Waste Treatment System,”<strong>LA</strong>N-98-109, Accession No. 7175, Los Alamos, NM.Department of Energy, 1998f. “Installation of Hoods and Gloveboxes at TA-48-1, Room 430,” <strong>LA</strong>N-98-111,Los Alamos, NM (09/30/98).Department of Energy, 1998g. “Environmental Assessment for the Proposed Strategic Computing Complex,Los Alamos <strong>National</strong> Laboratory, Los Alamos, New Mexico,” DOE/EA-1250, Los Alamos, NM.Department of Energy, 1998h. “Categorical Exclusion for D&D of TA-33-86,” <strong>LA</strong>N-96-008, AccessionNumbers 6111 (11/13/1995) and 7165 (11/20/1998), Los Alamos, NM.Department of Energy, 1999a. “Site-Wide Environmental Impact Statement for Continued Operation of theLos Alamos <strong>National</strong> Laboratory,” DOE/EIS-0238, Albuquerque, NM.Department of Energy, 1999b. “HE Formulation Relocation from TA-16-340 to TA-9-39 & Bldg. 45,”<strong>LA</strong>N-99-042a, Los Alamos, NM.Department of Energy, 1999c. “Categorical Exclusion for TA-53 Cooling Tower,” <strong>LA</strong>N-96-022, AccessionNo. 7583, Los Alamos, NM.SWEIS Yearbook—2002 2-187
Department of Energy, 1999d. “Categorical Exclusion for Electrodialysis Reversal,” <strong>LA</strong>N-99-025, AccessionNumber 7428 (02/23/1999), Los Alamos, NM.Department of Energy, 1999e. “Categorical Exclusion Volume Reducing Evaporator (TA-50/248),”<strong>LA</strong>N-99-025, Accession Number 7737 (10/29/1999), Los Alamos, NM.Department of Energy, 1999f. “Decontamination and Volume Reduction System for Transuranic Waste atLos Alamos <strong>National</strong> Laboratory,” DOE/EA-1269, Accession Number 6946, Los Alamos, NM.Department of Energy,1999g. “Categorical Exclusion for Installation of Sediment Basin and Check Dams,”<strong>LA</strong>N-99-<strong>03</strong>5, Accession Number 7489, Los Alamos, NM, <strong>03</strong>/25/1999.Department of Energy, 1999h. “Categorical Exclusion for Changes to Radioactive Source RecoveryProgram,” <strong>LA</strong>N-99-049, Accession Number 7405, Los Alamos, NM, 02/04/1999.Department of Energy, 1999i. “Categorical Exclusion for Radioactive Source Storage at <strong>LA</strong>NL,”<strong>LA</strong>N-99-049 Rev. 1, Accession Number 7570, Los Alamos, NM, 05/24/1999.Department of Energy, 1999j. “Environmental Assessment for Nonproliferation and International <strong>Security</strong>Center,” DOE/EA-1247, Los Alamos, NM.Department of Energy, 2000a. “DOE List of Los Alamos <strong>National</strong> Laboratory <strong>Nuclear</strong> Facilities,”DOE Los Alamos Area Office and Los Alamos <strong>National</strong> Laboratory, Los Alamos, NM.Department of Energy, 2000b. “Categorical Exclusion for TSTA Cooling Tower Demolition,”<strong>LA</strong>N-98-052, Accession Number 7952 (04/24/2000), Los Alamos, NM.Department of Energy, 2000c. “Special Environmental Analysis for Actions Taken in Response to the CerroGrande Fire at Los Alamos <strong>National</strong> Laboratory, Los Alamos, NM,” DOE/SEA-<strong>03</strong>, Los Alamos, NM.Department of Energy, 2000d. Supplement Analysis to the Site-Wide Environmental Impact Statement forContinued Operation of Los Alamos <strong>National</strong> Laboratory, Modification of Management Methods forCertain Unwanted Radioactive Sealed Sources at Operation of Los Alamos <strong>National</strong> Laboratory,August 2000, Los Alamos, NM.Department of Energy, 2000e. “Categorical Exclusion for the Live-Fire Shoot House,” <strong>LA</strong>N-97-112,Accession Number 7245, Los Alamos, NM.Department of Energy, 2001a. “Categorical Exclusion for Control and Instrumentation Cables at TA-18,”<strong>LA</strong>N-96-010, Accession Number 8433, (09/25/2001), Los Alamos, NM.Department of Energy, 2001b. “Categorical Exclusion for Task #41, Replacement Work,” <strong>LA</strong>N-96-022,Accession Number 8437, Los Alamos, NM.Department of Energy, 2001c. “Categorical Exclusion for CGRP, Task #41, Addition to TA-36-12, KAPPA,”<strong>LA</strong>N-96-012, Accession Number 8439, Los Alamos, NM.Department of Energy, 2001d. “Categorical Exclusion for TA-36 HE Storage and Prep Facilities,”<strong>LA</strong>N-96-010, Accession Number 8435, Los Alamos, NM.Department of Energy, 2001e. “Environmental Assessment for Atlas Relocation and Operation at theNevada Test Site, Los Alamos, New Mexico,” DOE/EA-1381, Los Alamos, NM.2-188SWEIS Yearbook—2002
Department of Energy, 2001f. “Environmental Assessment for the Emergency Operations Center andMulti-Channel Communications Project,” DOE/EA-1376, Los Alamos, NM.Department of Energy, 2001g. “Categorical Exclusion for the S-3 <strong>Security</strong> Systems Facility,”<strong>LA</strong>N-96-022, Accession Number 8612, Los Alamos, NM.Department of Energy, 2001h. “Categorical Exclusion for the ESH-2 Medical Clinic,” <strong>LA</strong>N-96-022,Accession Number 8398, Los Alamos, NM.Department of Energy, 2001i. “Categorical Exclusion for the Chemistry Technical Support Building,”<strong>LA</strong>N-96-011, CXAmend., Accession Numbers 8044 and 8227, Los Alamos, NM.Department of Energy, 2001j. “Categorical Exclusion for the MST Office Building,” <strong>LA</strong>N-96-022, AccessionNumbers 8618, Los Alamos, NM.Department of Energy, 2002a. “Safety Evaluation Report, Los Alamos <strong>National</strong> Laboratory TransportationSafety Document (TSD) Technical Safety Requirements (TSRs), <strong>LA</strong>NL BUS-SA-002,R0,” DOE <strong>National</strong><strong>Nuclear</strong> <strong>Security</strong> <strong>Administration</strong>, Albuquerque Operations Office, Los Alamos Site Operations, LosAlamos, NM.Department of Energy, 2002b. “Final Environmental Impact Statement for the Proposed Relocation ofTechnical Area 18 Capabilities and Materials at the Los Alamos <strong>National</strong> Laboratory,” DOE/EIS-319,Los Alamos, NM.Department of Energy, 2002c. “Environmental Assessment for the Proposed Consolidation of CertainExperimental Dynamic Activities at the Two-Mile Mesa Complex,” DOE/EA-1447 draft, Los Alamos,NM.Department of Energy, 2002d. “Environmental Assessment for the Proposed Construction and Operationof a Biosafety Level 3 Facility at Los Alamos <strong>National</strong> Laboratory, Los Alamos, NM,” DOE/EA-1364,Accession Number 8250, Los Alamos, NM.Department of Energy, 2002e. “Categorical Exclusion for Ion Exchange Removal of Perchlorates,”<strong>LA</strong>N 96-012, Accession Number 8632, Los Alamos, New Mexico.Department of Energy, 2002f. “Environmental Assessment of the Proposed Disposition of the Omega WestFacility at Los Alamos <strong>National</strong> Laboratory, Los Alamos, New Mexico,” DOE/EA-1410, Los Alamos,NM.Department of Energy, 2002g. “Categorical Exclusion for the D Division Office Building (DDOB),”<strong>LA</strong>N-96-011, CXAmend., Accession Number 8595, Los Alamos, NM.Department of Energy, 2002h. “Categorical Exclusion for the Truck <strong>Security</strong> Inspection Station,”<strong>LA</strong>N-96-022, Accession Number 8726, Los Alamos, NM.Federal Register, 2001. “<strong>Nuclear</strong> Safety Management,” U.S. Department of Energy, 10 CFR 830, Vol. 66,No. 7, Washington, D.C.Garvey, D., and S. Miller, 1996. “<strong>LA</strong>NSCE Radiological Air Emissions Data Development for theSWEIS–REVISED,” ESH-17:96-517, Los Alamos, NM.SWEIS Yearbook—2002 2-189
Katzman, 2000. Personal communication from Danny Katzman to Kenneth Rea, Los Alamos, NM.Los Alamos <strong>National</strong> Laboratory, 1995. “NEPA Review of Biophysics Lab Addition,” Accession No. 6101,Los Alamos, NM (12/07/95).Los Alamos <strong>National</strong> Laboratory, 1996a. “Ventilation System SM-102,” ESH-ID-96-0207, Los Alamos, NM.Los Alamos <strong>National</strong> Laboratory, 1996b. “NEPA Categorical Exclusion for Flash Pad Propane Burners,”Accession No. 6265, Los Alamos, NM (8/9/96).Los Alamos <strong>National</strong> Laboratory, 1996c. “NEPA Categorical Exclusion for Hydrodynamic Testing OperationsCenter,” Accession No. 6128, Los Alamos, NM (<strong>03</strong>/26/96).Los Alamos <strong>National</strong> Laboratory, 1998a. “NEPA Categorical Exclusion for Facilities Improvement TechnicalSupport (FITS) Building,” <strong>LA</strong>N-97-013A, Los Alamos, NM.Los Alamos <strong>National</strong> Laboratory, 1998b. “Re-roof at TA-<strong>03</strong>-39,” ESH-ID-98-0188, Los Alamos, NM.Los Alamos <strong>National</strong> Laboratory, 1998c. “Electrical Upgrades at TA-<strong>03</strong>-102,” ESH-ID-98-0199,Los Alamos, NM.Los Alamos <strong>National</strong> Laboratory, 1998d. “Waste Machine Coolant Volume Reduction,” ESH-ID-98-0064,Los Alamos, NM.Los Alamos <strong>National</strong> Laboratory, 1998e. “NEPA Categorical Exclusion for HE Wastewater Collection SystemRepairs, TA-9-21,” <strong>LA</strong>N-96-012, Los Alamos, NM (10/6/98).Los Alamos <strong>National</strong> Laboratory, 1998f. “NEPA Categorical Exclusion for the Applied Research, Optics, andElectronics (AROE) Laboratory,” <strong>LA</strong>N-98-101, Los Alamos, NM (10/3/98).Los Alamos <strong>National</strong> Laboratory, 2000a. “Facility Recovery Process,” FRC-001, R.3, Los Alamos, NM.Los Alamos <strong>National</strong> Laboratory, 2000b. “NEPA Categorical Exclusion for TA-16-394 Oil/Solvent Burn TrayExclosure,” Accession No. 7922, Los Alamos, NM (6/28/00).Los Alamos <strong>National</strong> Laboratory, 2000c. “Biosafety Level 3 Facility,” ESH-ID-00-<strong>03</strong>62, Los Alamos, NM.Los Alamos <strong>National</strong> Laboratory, 2001a. “DOE/<strong>LA</strong>NL List of Los Alamos <strong>National</strong> Laboratory <strong>Nuclear</strong>Facilities,” Facility and Waste Operations Division, Office of Authorization Basis, FWO-OAB 401, Rev. 1,Los Alamos, NM.Los Alamos <strong>National</strong> Laboratory, 2001b. “DOE/<strong>LA</strong>NL List of Los Alamos <strong>National</strong> Laboratory <strong>Nuclear</strong>Facilities,” Facility and Waste Operations Division, Office of Authorization Basis, FWO-OAB 401, Rev. 2,Los Alamos, NM.Los Alamos <strong>National</strong> Laboratory, 2001c. “Los Alamos <strong>National</strong> Laboratory Radiological Facility List,”Facility and Waste Operations Division, Office of Authorization Basis, FWO-OAB 4<strong>03</strong>, Rev. 0,Los Alamos, NM.Los Alamos <strong>National</strong> Laboratory, 2001d. “NMT FY01 Office Buildings,” ESH-ID 01-0005, Los Alamos, NM.2-190SWEIS Yearbook—2002
Los Alamos <strong>National</strong> Laboratory, 2001e. “NMT Protect Combustible Materials,” ESH-ID 01-0238,Los Alamos, NM.Los Alamos <strong>National</strong> Laboratory, 2001f. “TA-55 Fire Protect Yard Main Replacement,” ESH-ID 01-0202,Los Alamos, NM.Los Alamos <strong>National</strong> Laboratory, 2001g. “FRIT Transfer System,” ESH-ID 01-0193, Los Alamos, NM.Los Alamos <strong>National</strong> Laboratory, 2001h. “NMT Fire Safe Storage Building,” ESH-ID 01-0053,Los Alamos, NM.Los Alamos <strong>National</strong> Laboratory, 2001i. “TA-55 Radiography/Interim,” ESH-ID 01-0258, Los Alamos, NM.Los Alamos <strong>National</strong> Laboratory, 2001j. “TA-55 Radiography (complements ESH-ID 01-0258,” ESH-ID 01-0259, Los Alamos, NM.Los Alamos <strong>National</strong> Laboratory, 2001k. “CMR Replacement Project Preconceptual Design,” ESH-ID 01-0194, Los Alamos, NM.Los Alamos <strong>National</strong> Laboratory, 2001l. “TA-18 Relocation Project Office Building,” ESH-ID 01-0058,Los Alamos, NM.Los Alamos <strong>National</strong> Laboratory, 2001m. “TA-18 Relocation Project CATIII/IV at TA-55,” ESH-ID 01-0055,Los Alamos, NM.Los Alamos <strong>National</strong> Laboratory, 2001n. “TA-18 Relocation Project CAT-1 Piece,” ESH-ID 01-0<strong>03</strong>0,Los Alamos, NM.Los Alamos <strong>National</strong> Laboratory, 2001o. “TA-<strong>03</strong>-39 and -102 <strong>Security</strong> Container Fire and LightingUpgrades,” ESH-ID-01-0044, Los Alamos, NM.Los Alamos <strong>National</strong> Laboratory, 2001p. “Wildfire Hazard Reduction Project Plan,” <strong>LA</strong>-<strong>UR</strong>-01-2017,Los Alamos, NM.Los Alamos <strong>National</strong> Laboratory, 2001q. “Refurbishment of Building 48-45 from Cerro Grande Fire,”ESH-ID-01-0141, Los Alamos, NM.Los Alamos <strong>National</strong> Laboratory, 2001r. “Comprehensive Site Plan 2001,” Chapter VIII, “Projects,”<strong>LA</strong>-<strong>UR</strong>-01-01838, Los Alamos, NMLos Alamos <strong>National</strong> Laboratory, 2001s. “Project Completion Report for the Accelerated Action at TA-16,MDA-R,” <strong>LA</strong>-<strong>UR</strong>-01-522, Los Alamos, NM.Los Alamos <strong>National</strong> Laboratory, 2002a. “DOE/<strong>LA</strong>NL List of Los Alamos <strong>National</strong> Laboratory <strong>Nuclear</strong>Facilities,” Performance Surety Division, Office of Authorization Basis, FWO-OAB 401, Rev. 3,Los Alamos, NM.Los Alamos <strong>National</strong> Laboratory, 2002b. “Los Alamos <strong>National</strong> Laboratory Radiological Facility List,”Performance Surety Division, Office of Authorization Basis, PS-OAB-4<strong>03</strong>, Rev. 1, Los Alamos, NM.Los Alamos <strong>National</strong> Laboratory, 2002c. “Los Alamos <strong>National</strong> Laboratory Transportation Safety Document,”Business Operations Division, Materials Management Group, BUS4-SA-002, R0, Los Alamos, NM.SWEIS Yearbook—2002 2-191
Los Alamos <strong>National</strong> Laboratory, 2002d. “FITS Parking Lot,” ESH-ID 02-0125, Los Alamos, NM.Los Alamos <strong>National</strong> Laboratory, 2002e. “TA-55 New Parking Lot,” ESH-ID 02-0075, Los Alamos, NM.Los Alamos <strong>National</strong> Laboratory, 2002f. “Temporary Parking,” ESH-ID 02-0170, Los Alamos, NM.Los Alamos <strong>National</strong> Laboratory, 2002g. “CMR Replacement Geotechnical Investigation,” ESH-ID 02-0185,Los Alamos, NM.Los Alamos <strong>National</strong> Laboratory, 2002h. “TA-<strong>03</strong>-102 Heat Treating,” ESH-ID-02-0010, Los Alamos, NM.McClenahan, R.L., 2000. “RLWTF Influent Flows,” memo to R.A. Alexander of FWO-WFM,Los Alamos, NM.Sandoval,T., 2000. Email from Tina M. Sandoval to Chris Del Signore, Los Alamos, NM (04/07/00).Steele, C. M., 2002. “Transmittal of Approval of the Safety Evaluation Report (SER) for the Los Alamos<strong>National</strong> Laboratory (<strong>LA</strong>NL) Transportation Safety Document (TSD) and Technical Safety Requirements(TSRs),” DOE <strong>National</strong> <strong>Nuclear</strong> <strong>Security</strong> <strong>Administration</strong>, Albuquerque Operations Office, Los AlamosSite Operations, SABT/RCJ.02.013: SABM Steele, Los Alamos, NM.Squirrel2-192SWEIS Yearbook—2002
3.0 Site-Wide 2002 Operations DataThe Yearbook’s role is to provide data that could be used to develop an impact analysis. However, in twocases, worker dose and dose from radioactive air emissions, the Yearbook specifically addresses impactsas well. In this chapter, the Yearbook summarizes operational data at the site-wide level. These impactassessments are routinely undertaken by <strong>LA</strong>NL, using standard methodologies that duplicate those used in theSWEIS; hence, they have been included to provide the base for future trend analysis.Chapter 3 compares actual operating data to projected effects for about half of the parameters discussedin the SWEIS, including effluent, workforce, regional, and long-term environmental effects. Some ofthe parameters used for comparison were derived from information contained in both the main text andappendices of the SWEIS. Many parameters cannot be compared because data are not routinely collected.In these cases, projections made by the SWEIS ROD (DOE 1999) resulted only from expenditure ofconsiderable special effort, and such extra costs were avoided when preparing the Yearbook.3.1 Air Emissions3.1.1 Radioactive Air EmissionsRadioactive airborne emissions from point sources (i.e., stacks) during 2002 totaled approximately 6,150curies, 30 percent of the 10-year average of 21,700 curies projected by the ROD. These low emissions resultfrom operations at the Key Facilities not being performed at projected levels and from the conservative natureof the emissions calculations performed for the SWEIS.As in 1999, 2000, and 2001, the two largest contributors to radioactive air emissions were tritium fromthe Tritium Facilities (both Key and Non-Key) and activation products from <strong>LA</strong>NSCE. Stack emissions fromthe Tritium Key Facilities were about 1,500 curies and from other facilities were about 360 curies. Tritiumemissions from the Non-Key Facilities weredominated, as in 1999–2001, by cleanup activitiesat TA-33 and TA-41.Emissions of activation products from <strong>LA</strong>NSCEwere increased over 2000 levels. The total pointsource emissions were approximately 4,300 curies.The Area A beam stop did not operate after 1998and operations in Line D resulted in the majority ofemissions.Non-point sources of radioactive air emissionsare present at <strong>LA</strong>NSCE, Area G, TA-18, andother locations around the Laboratory. Non-pointemissions, however, are generally small comparedto stack emissions. For example, non-point airemissions from <strong>LA</strong>NSCE were less than 150 curies.Additional detail about radioactive air emissionsis provided in the Laboratory’s annual compliancereport to the EPA on June 30, 20<strong>03</strong>, and in the 2002Environmental Surveillance Report (<strong>LA</strong>NL, inpreparation).HEPA fi lterSWEIS Yearbook—2002 3-1
Table 3.1.1-1 summarizes the radioactive air emissions data reported in the 1998–2002 Yearbooks.Maximum offsite dose will continue to be relatively small for 2002. The final 2002 dose is estimated to beapproximately 1.6 millirem, with the final dose being reported to the EPA by June 30, 20<strong>03</strong>.Table 3.1.1-2 presents the dose estimates and the actual doses.Table 3.1.1-1. Radioactive Air EmissionsEMISSION CATEGORY SWEIS ROD 1998 1999 2000 2001 2002Point Sources 21,700 Ci/year 8,690 Ci 1,900 Ci 3,100 Ci 15,400 Ci 6,150 Ci% of 10-year average 21,700 Ci/year
3.1.2 Non-Radioactive Air Emissions3.1.2.1 Emissions of Criteria PollutantsCriteria pollutants include nitrogen oxides, sulfur oxides, carbon monoxide, and particulate matter. <strong>LA</strong>NL,in comparison to industrial sources and power plants, is a relatively small source of these non-radioactiveair pollutants. As such, the Laboratory is required to estimate emissions, rather than perform actual stacksampling. As Table 3.1.2.1-1 illustrates, all 2002 emissions of criteria pollutants are within the estimatedemissions presented in the SWEIS ROD, with the exception of particulate matter. These increased emissionsare attributable primarily to the operation of three air curtain destructors. These air curtain destructors areused to burn wood and slash from fire mitigation activities around the Laboratory. These operations emitted atotal of 12.2 tons of particulate matter during 2002.Table 3.1.2.1-1. Emissions of Criteria PollutantsSWEIS 19981999200020012002POLLUTANTS UNITS ROD OPERATIONS OPERATIONS OPERATIONS OPERATIONS OPERATIONSCarbon Tons/ 58 17.9 32 26 29.08 28.1monoxide yearNitrogen Tons/ 201 68 88 80 93.8 64.7oxidesyearParticulate Tons/ 11 3.0 4.5 3.8 5.5 15.5 amatteryearSulfur oxides Tons/year0.98 0.29 0.55 4.0 b 0.82 1.3 cThe increased emissions of particulate matter are primarily due to the operation of three air curtain destructors to burnwood and slash from fire mitigation activities around the Laboratory.The higher emissions of sulfur oxides (SO x ) are due to the main steam plant burning fuel oil during the Cerro Grande Fire.The increased emissions of SO x are due to operation of the three air curtain destructors to burn wood and slash fromfire mitigation activities around the Laboratory.abcApproximately two-thirds of the most significant criteria pollutant, nitrogen oxides (NO x), results fromthe TA-3 steam plant. In late 2000, <strong>LA</strong>NL received a permit from the NMED to install flue gas recirculationequipment on the steam plant boilers to reduce emissions of NO x. This equipment became operational in2002, and initial source tests indicated a reduction in NO xof approximately 70 percent.SO xemissions for 2002 result from the operation of three air curtain destructors to burn wood and slashfrom fire mitigation activities. Total emissions for 2002 from these units were one ton of SO x.Criteria pollutant emissions from <strong>LA</strong>NL’s fuel burning equipment are reported in the annual EmissionsInventory Report as required by the New Mexico Administrative Code, Title 20, Chapter 2, Part 73 (20.2.73NMAC). The report provides emission estimates for the steam plants, nonexempt boilers, the asphalt plant,and the water pump. The water pump which was a large source NO x emissions, was transferred to LosAlamos County in November 2001. In addition, emissions from the paper shredder, rock crusher, degreasers,and permitted beryllium machining operations are reported. For more information, refer to <strong>LA</strong>NL’s 1999 and2000 Emissions Inventory Report (<strong>LA</strong>NL 2000a, 2001a).3.1.2.2 Chemical Usage and EmissionsThe 1999 edition of the Yearbook proposed to report chemical usage and calculated emissions for KeyFacilities obtained from the Laboratory’s Automated Chemical Inventory System. (Note: In 2002 theLaboratory transitioned to the new EX3 chemical inventory system and no longer uses the AutomatedChemical Inventory System.) The quantities presented in this approach represent all chemicals procured orbrought on site in the respective calendar year. This methodology is identical to that used by the LaboratorySWEIS Yearbook—2002 3-3
for reporting under Section 313 of the Emergency Planning Community Right-To-Know Act (42 USC) andfor reporting regulated air pollutants estimated from research and development operations in the annualEmissions Inventory Report (<strong>LA</strong>NL 2000a, 2001a).Air emissions shown in Tables A-1 through A-14 of Appendix A are divided into emissions by KeyFacility. Emission estimates (expressed as kilograms per year) were performed in the same manner as thosereported in the 1999, 2000, and 2001 Yearbooks (<strong>LA</strong>NL 2000b, 2001b, 2002a, respectively). First, usageof listed chemicals was summed by facility. It was then estimated that 35 percent of the chemical usedwas released to the atmosphere. Emission estimates for some metals, however, were based on an emissionfactor of less than one percent. This is appropriate because these metal emissions are assumed to result fromcutting or melting activities. Fuels such as propane and acetylene were assumed to be completely combusted;therefore, no emissions are reported.Information on total volatile organic compounds and hazardous air pollutants estimated from researchand development operations is shown in Table 3.1.2.2-1. Projections by the SWEIS ROD for volatileorganic compounds and hazardous air pollutants were expressed as concentrations rather than emissions;direct comparisons cannot be made, and, therefore, projections from the SWEIS ROD are not presented.The volatile organic compound emissions reported from research and development activities reflectquantities procured in each calendar year. The hazardous air pollutant emissions reported from research anddevelopment activities generally reflect quantities procured in each calendar year. In a few cases, however,procurement values and operational processes were further evaluated so that actual air emissions could bereported instead of procurement quantities. As for particulate matter emissions, operation of the air curtaindestructors resulted in increases of volatile organic compounds and hazardous air pollutants emissionsduring 2002. The air curtain destructors accounted for 22.9 and 2.1 tons of volatile organic compounds andhazardous air pollutants, respectively.Table 3.1.2.2-1. Emissions of Volatile Organic Compounds and Hazardous Air Pollutants fromChemical UsePOLLUTANTEMISSIONS (TONS/YEAR)1999 2000 2001 2002Hazardous Air Pollutants 13.6 6.5 7.4 7.74Volatile Organic Compounds 20 10.7 18.6 14.93.2 Liquid Effluents<strong>LA</strong>NL discharges wastewater via 21 outfalls operating under its NPDES permit. Based on dischargemonitoring reports, as reported by <strong>LA</strong>NL’s Water Quality and Hydrology Group and on operational recordswhen available, effluent flow through NPDES outfalls totaled an estimated 178.18 million gallons in CY2002. This is an approximate increase of 54.15 million gallons over CY 2001 (124.04 million gallons). Thisvolume of discharge is below the SWEIS ROD projection of 278.0 million gallons.With implementation of the new NPDES permit on February 1, 2001, Water Quality and Hydrology iscollecting and reporting actual flows that are being recorded by flow totalizers at most outfalls. At outfallswithout totalizers, the flow is calculated based on instantaneous flow. Historically, instantaneous flow wasmeasured during field visits as required in the NPDES permit. These measurements were then extrapolatedover a 24-hour day/seven-day week. Details on all NPDES noncompliance results are provided in the 2002Environmental Surveillance Report (<strong>LA</strong>NL, in preparation).Key Facilities accounted for approximately 47 million gallons of the CY 2002 total. Comparison betweenthe projected and actual number of outfalls by watershed can be found in Table 3.2-1. (Relevant details on the3-4SWEIS Yearbook—2002
SWEIS Yearbook—2002 3-5Table 3.2-1. NPDES Permitted Outfalls by WatershedNUMBER OFOUTFALLSPROJECTEDTO HAVE ADISCHARGE(SWEIS ROD)NUMBER OFPERMITTEDOUTFALLSAS OFJANUARY 1,NUMBER OFPERMITTEDOUTFALLSAS OFJANUARY 1,NUMBER OFPERMITTEDOUTFALLSAS OFJANUARY 1,NUMBER OFPERMITTEDOUTFALLSAS OFJANUARY 1,NUMBER OFPERMITTEDOUTFALLSAS OFJANUARY 1,NUMBER OFPERMITTEDOUTFALLSAS OFDECEMBERWATERSHEDNUMBER OFOUTFALLSIDENTIFIEDIN SWEIS19981999200020012002 31, 2002Ancho 2 0 0 0 0 00 0Cañada del Buey a 4 4 4 3 1 1 1 1Chaquehui 1 0 0 0 0 0 0 0abcdeGuaje b 7 7 7 6 0 0 0 0Los Alamos 12 8 9 7 5 5 5 5Mortandad 12 7 9 6 5 5 5 5Pajarito c 17 11 13 2 0 0 0 0Pueblo 1 1 1 1 0 0 0 0Sandia d 10 7 8 6 4 4 5 5Water e 21 10 15 5 5 5 5 5Totals 87 55 66 36 20 20 21 21Includes Outfall 13S from the Sanitary Wastewater Systems Consolidation, which is registered as a discharge to Cañada del Buey or Sandia. The discharge is actuallypiped to TA-<strong>03</strong> and ultimately discharged to Sandia Canyon via Outfall 001.Includes 04A-176 discharge to Rendija Canyon, a tributary to Guaje Canyon.Includes 06A-106 discharge to Three-Mile Canyon, a tributary to Pajarito Canyon.The number of outfalls increased during CY 2001 with the addition of the new Outfall <strong>03</strong>A-199 (permit issued 2/1/2001).Includes 05A-055 discharge to Cañon de Valle, a tributary to Water Canyon.
NPDES permitted outfalls, including which watershed each outfall discharges to, are provided in AppendixD.) In Table 3.2-2, the number of gallons of discharge per watershed projected by the SWEIS is comparedto the actual discharge per calendar year. Tables 3.2-3 and 3.2-4 compare the projected and actual number ofoutfalls by facility and the volume of discharge per facility projected by the SWEIS is compared to the actualdischarge per calendar year.Table 3.2-2. Discharges to Watersheds from NPDES Permitted Outfalls (Millions of Gallons)PROJECTEDDISCHARGE(SWEIS ROD)DISCHARGE DISCHARGE DISCHARGE DISCHARGEWATERSHED1998 19992000 2001Cañada del Buey 6.4 0 2.6 0 0 0Guaje 0.7 1.2 1.7 0 0 0Los Alamos 44.8 69.7 45.2 37.4 19.34 36.79Mortandad 37.4 51.4 39.3 31.6 4.21 31.40Pajarito 2.6 2.8 0 0 0 0Pueblo 1.0 0.7 0.9 0 0 0Sandia 170.8 67.1 213.2 180.2 100.38 108.58Water 14.2 18.7 14.3 16.2 0.102 1.41Totals 278.0 212.0 317.2 265.4 124.04 178.18DISCHARGE2002Of the 21 outfalls listed in the NPDES permit only 17 discharged during 2002, as was the case in 2001.Table 3.2-4 compares NPDES discharges by facility. The Non-Key Facilities showed a difference of about11.3 million gallons between CY 2002 discharges and SWEIS ROD projections (130.83 million gallonsversus 142.1 million gallons, respectively). For the Non-Key Facilities, discharge from Outfall 001 at theTA-<strong>03</strong> power plant of 8.29 million gallons was higher than the 2001 discharge of 3.97 million gallons.Approximately 93 million gallons of the discharge from Outfall 001 at the power plant was attributableto treated sanitary effluent piped from Outfall 13S at TA-46 to TA-<strong>03</strong> to be available as “makeup water”in the cooling towers. The combined flow of the sanitary waste treatment plant and the TA-3 steam plantaccount for about 77 percent of the total discharge from Non-Key Facilities and about 57 percent of all waterdischarged by the Laboratory.For Key Facilities, <strong>LA</strong>NSCE discharged approximately 24 million gallons for 2002, about 4 milliongallons more than in 2001, accounting for about 51 percent of the total discharge from all Key Facilities (seeTable 3.2-4). This percentage has decreased from the almost 82 percent in 2001 because other Key Facilitiesexperienced an increase in discharge in 2002. The only Key Facilities to have decreased discharge in 2002were the High Explosives Processing Facility and the RLWTF.<strong>LA</strong>NL has three principal wastewater treatment facilities—the sewage plant (Sanitary Wastewater System)at TA-46, the RLWTF at TA-50, and the HEWTF at TA-16. As discussed above, the sewage treatment plantat TA-46 processed about 93 million gallons of treated wastewater and sewage during 2002, all of whichwas pumped to the TA-3 power plant after treatment to provide makeup water for the cooling towers or to bedischarged directly into Sandia Canyon via Outfall 001.3-6SWEIS Yearbook—2002
SWEIS Yearbook—2002 3-7abTable 3.2-3. NPDES Permitted Outfalls by FacilityNUMBER OFOUTFALLSIDENTIFIEDIN SWEISNUMBER OFOUTFALLSPROJECTEDTO HAVE ADISCHARGE(SWEIS ROD)NUMBER OFPERMITTEDOUTFALLSAS OFJANUARY 1,1998NUMBER OFPERMITTEDOUTFALLSAS OFJANUARY 1,1999NUMBER OFPERMITTEDOUTFALLSAS OFJANUARY 1,2000NUMBER OFPERMITTEDOUTFALLSAS OFJANUARY 1,2001NUMBER OFPERMITTEDOUTFALLSAS OFJANUARY 1,2002NUMBER OFPERMITTEDOUTFALLSAS OFDECEMBER31, 2002FACILITYPlutonium1 1 1 1 1 1 1 1ComplexTritium Facility 5 2 3 2 2 2 2 2CMR Building 1 1 1 1 1 1 1 1Sigma Complex 2 2 2 2 2 2 2 2High Explosives 22 11 16 3 3 3 3 3ProcessingHigh Explosives 15 7 10 3 2 2 2 2Testing a<strong>LA</strong>NSCE 6 5 6 4 4 4 4 4HRL 1 1 1 1 0 0 0 0Radiochemistry 5 2 3 1 0 0 0 0FacilityRLWTF 1 1 1 1 1 1 1 1Pajarito Site 0 0 0 0 0 0 0 0MSL 0 0 0 0 0 0 0 0TFF 1 0 0 0 0 0 0 0Machine Shops 0 0 0 0 0 0 0 0Waste0 0 0 0 0 0 0 0ManagementOperationsNon-Key27 22 22 17 4 4 5 5Facilities a, bTotals 87 55 66 36 20 20 21 21Outfall <strong>03</strong>A-106 was incorrectly associated with a Non-Key Facility in the SWEIS. Starting with the 2002 Yearbook, Outfall <strong>03</strong>A-106 is accounted for with HighExplosives Testing.The number of outfalls increased during CY 2001 with the addition of the new Outfall <strong>03</strong>A-199 (permit issued 2/1/2001). Please note that earlier Yearbooksincorrectly indicated that this outfall was added to the NPDES Permit in 2000.
Table 3.2-4. Discharges from NPDES Permitted Outfalls by Facility (Millions of Gallons)PROJECTEDDISCHARGE DISCHARGE DISCHARGE DISCHARGE DISCHARGE DISCHARGEFACILITY (SWEIS ROD) (1998) (1999) (2000) (2001) (2002)Plutonium Complex 14.0 8.5 8.6 6.5 0.4053 2.82Tritium Facility 0.3 13.7 9 8.6 0.3932 13.4CMR Building 0.5 3.1 4.5 2.3 0.0209 0.76Sigma Complex 7.3 12.7 5.9 3.9 0.0555 2.00High Explosives Processing 12.4 17.1 0.2 0.1 0.<strong>03</strong>6 0.<strong>03</strong>High Explosives Testing 3.6 1.8 14.3 16.1 0.006638 1.38<strong>LA</strong>NSCE 81.8 53.4 37.2 30.5 20.45 24.04HRL 2.5 0.0 0 0 0 0Radiochemistry Facility 4.1 0.0 0 0 0 0RLWTF 9.3 6.1 5.3 4.9 3.6 2.92Pajarito Site 0 0 0 0 0 0MSL 0 0 0 0 0 0TFF 0 0 0 0 0 0Machine Shops 0 0 0 0 0 0Waste Management0 0 0 0 0 0OperationsNon-Key Facilities 142.1 95.2 232 192.5 99.01 130.83Totals 278.0 212.0 317.2 265.4 124.04 178.18The RLWTF, Building 50-01, Outfall 051, discharges into Mortandad Canyon. During 2002, about 2.9million gallons of treated radioactive liquid effluent, about 0.7 million gallons less than 2001, were releasedto Mortandad Canyon from the RLWTF, compared to 9.3 million gallons projected by the SWEIS ROD. TheTA-16 HEWTF discharged about 0.0275 million gallons compared to 12.4 projected by the SWEIS ROD.Treated wastewater released from <strong>LA</strong>NL’s NPDES outfalls rarely leaves the site. However, the NPDESpermit program also regulates storm water discharges from certain activities. During CY 2002, <strong>LA</strong>NLoperated about 75 stream-monitoring and partial-record storm water-monitoring stations located in 17watersheds. Data gathered from these stations show that surface water, including storm water, occasionallyflows off of DOE property. Flow measurements and water quality data for surface water are detailed in<strong>LA</strong>NL’s annual reports, Environmental Surveillance at Los Alamos (an example is <strong>LA</strong>NL 2001c) and SurfaceWater Data at Los Alamos <strong>National</strong> Laboratory (an example is <strong>LA</strong>NL 2000c).Overview of the NPDES Outfalls HistoryThe number of outfalls listed in the NPDES permit had decreased from 88 at the end of 1996 to 66 at theend of 1997. Even more substantial reductions occurred during 1998, and the number of permitted outfallshad decreased to just 36 by the end of December 1998. Most of the reductions during both 1997 and 1998were from the High Explosives Processing Key Facility (six eliminated in 1997, and 13 eliminated in 1998)and High Explosives Testing Key Facility (five eliminated in 1997, and seven eliminated in 1998). Outfallreductions for both High Explosives Key Facilities largely resulted from redirecting some flows, such ascooling tower discharge waters, to the sewage plant at TA-46, and from the routing of high explosivescontaminated flows through the HEWTF, which has but a single outfall. The HEWTF began treatmentoperations in 1997.At the end of 1999, the number of outfalls listed in the NPDES permit had decreased by 16. Three ofthe 16 outfalls eliminated during 1999, Outfalls <strong>03</strong>A-040, <strong>03</strong>A-045, and 06A-106, were associated with theHRL, Radiochemistry Laboratory, and High Explosives Testing Key Facilities, respectively; and, each was3-8SWEIS Yearbook—2002
Stabilization measures below the deleted TA-16 Building 260 Outfalleliminated after cessation of source activities and processes or redirecting flows to other outfalls, primarily tothe sanitary system. Most of the reductions (9 of the 16) during 1999 were the result of transferring the watersupply system from the DOE to Los Alamos County. Those outfalls were removed from <strong>LA</strong>NL’s NPDESpermit and added to the Los Alamos County NPDES permit application. Four other water supply wells weretaken out of production, their pumping equipment removed, and their outfalls eliminated.This major modification project, elimination and/or rerouting of NPDES outfalls, was completed in 1999,bringing the total number of permitted outfalls down from the 55 identified by the SWEIS ROD to 20. During2000, Outfall <strong>03</strong>A-199, which will serve the TA-3-1837 cooling towers, was included in the new NPDESpermit issued by EPA on December 29, 2000; however, the effective date of the permit was February 1,2001. This brings the total number of permitted outfalls up to 21. This new outfall (<strong>03</strong>A-199) will dischargeto an unnamed tributary of Sandia Canyon and will be included in future totals for the Non-Key Facilities.It has yet to discharge. While the volume of water discharged by the Laboratory in CY 2000 was reducedoverall, the largest apparent reductions were primarily attributed to fewer outfalls being reported under theLaboratory’s NPDES permit coupled with more accurate record keeping.3.3 Solid Radioactive and Chemical WastesBecause of the complex array of facilities and operations, <strong>LA</strong>NL generates a wide variety of waste typesincluding solids, liquids, semi-solids, and contained gases. These waste streams are variously regulated assolid, hazardous, low-level radioactive, TRU, or wastewater by a host of State and Federal regulations. Theinstitutional requirements relating to waste management at <strong>LA</strong>NL are located in a series of documents thatare part of the Laboratory Implementation Requirements. These requirements specify how all process wastesand contaminated environmental media generated at <strong>LA</strong>NL are managed. Wastes are managed from planningfor waste generation for each new project through final disposal or permanent storage of those wastes. ThisSWEIS Yearbook—2002 3-9
ensures that <strong>LA</strong>NL meets all requirements including DOE Orders, Federal and State regulations, and <strong>LA</strong>NLpermits.<strong>LA</strong>NL’s waste management operation captures and tracks data for waste streams, regardless of their pointsof generation or disposal. This includes information on the waste generating process; quantity; chemicaland physical characteristics of the waste; regulatory status of the waste; applicable treatment and disposalstandards; and the final disposition of the waste. The data are ultimately used to assess operational efficiency,help ensure environmental protection, and demonstrate regulatory compliance.<strong>LA</strong>NL generates radioactive and chemical wastes as a result of research, production, maintenance,construction, and environmental restoration activities as shown in Table 3.3-1. Waste generators are assignedto one of three categories—Key Facilities, Non-Key Facilities, and the ER Project. Waste types are definedby differing regulatory requirements. No distinction has been made between routine wastes, those generatedfrom ongoing operations, and non-routine wastes such as those generated from the decontamination anddecommissioning of buildings.Table 3.3-1 presents a summary of the wastes quantities generated from 1998 through 2002. As shown inTable 3.3-1, quantities of wastes in 2002 were appreciably below projections.In general, waste quantities from operations at the Key Facilities were below ROD projections for nearlyall waste types, reflecting normal levels of operations at the Key Facilities. Waste minimization efforts putforth by the Environmental Stewardship Office are beginning to show a <strong>LA</strong>NL-wide trend in overall wastereduction across most categories. There have been improvements made in various facility processes to tryand minimize waste generation. Additionally, other processes are substituting non-hazardous chemicals forcommonly used hazardous chemicals in an effort to improve effluent quality.Table 3.3-1. <strong>LA</strong>NL Waste Types and GenerationWASTE TYPE UNITSSWEIS RODPROJECTION 1998 1999 2000 2001 2002Chemical 10 3 kg/yr 3,250 1,771 15,441 a 27,674 b 27,583 c 602LLW m 3 /yr 12,200 1,837 1,678 4,229 2,597 7,310MLLW m 3 /yr 632 71.4 20.65 598.23 58.23 20.54TRU m 3 /yr 333 108.1 143.2 124.8 117.0 119.1Mixed TRU m 3 /yr 115 34 87.2 88.6 48.1 87.01aClean-up efforts of the ER Project accounted for the large waste volumes, almost 95% of the total. Most of the 14.5million kilograms of chemical waste generated by the ER Project resulted from remediation of PRSs at TA-16,particularly MDA-P. MDA-P was exhumed as part of a clean-closure under the RCRA.bClean-up efforts of the ER Project accounted for the large waste volumes. The continuing clean-up of MDA-P,remediation of PRS 3-0569(c) at the upper end of Sandia Canyon in TA-<strong>03</strong>, and the accelerated clean-up of MDA-Rdue to the Cerro Grande Fire, were responsible for most of the chemical waste generation.cThe continuing clean-up efforts at MDA-P and PRS 3-056(c) accounted for most of the ER Project generated wastein 2001.3.3.1 Construction and Demolition Debris (Previously Identified in Yearbooks as IndustrialSolid Wastes)As projected by the SWEIS ROD, chemical waste includes not only construction and demolition debris,but also all other nonradioactive wastes passing through the Solid Radioactive and Chemical Waste Facility.In addition, construction and demolition debris is a component of those chemical wastes that in most casesare sent directly to offsite disposal facilities. For CY 2002, construction and demolition debris was 17 percentof the total chemical waste generated and consisted primarily of asbestos and construction debris fromdecontamination and decommissioning projects. Construction and demolition debris is disposed of in solidwaste landfills under regulations promulgated pursuant to Subtitle D of RCRA. (Note: Hazardous wastes areregulated pursuant to Subtitle C of RCRA.)3-10SWEIS Yearbook—2002
3.3.2 Chemical WastesChemical waste generation in 2002 was slightly more than one-half of the waste volumes projected by theSWEIS ROD. Table 3.3.2-1 summarizes chemical waste generation from 1998 through 2002.ER Project wastes accounted for 66 percent of the total chemical wastes generated. The ER projects thatcontributed to the waste generated were the removal of contaminated soil at the TA-16-260 outfall and thecompletion of the cleanup of MDA-P.Table 3.3.2-1. Chemical Waste Generators and QuantitiesWASTEGENERATOR UNITSSWEIS RODPROJECTION 1998 1999 2000 2001 2002Key Facilities 10 3 kg/yr 600 120 49 1,121 513 267Non-Key Facilities 10 3 kg/yr 650 1,506 a 765 368 1,255 b 334ER Project 10 3 kg/yr 2,000 144 14,630 c 26,185 d 25,816 e 1,133<strong>LA</strong>NL 10 3 kg/yr 3,250 1,771 15,441 27,674 27,583 1,734aAt the Non-Key Facilities in 1998, chemical waste quantities exceeded projections because of a <strong>LA</strong>NL-widecampaign to identify and dispose of chemicals no longer used or needed.bAt the Non-Key Facilities in 2001, the increased activity from new construction generated a higher quantity ofchemical waste.cClean-up efforts of the ER Project accounted for the large waste volumes, almost 95% of the total. Most of the 14.5million kilograms of chemical waste generated by the ER Project resulted from remediation of PRSs at TA-16,particularly MDA-P. MDA-P was exhumed as part of a clean-closure under the RCRA.dClean-up efforts of the ER Project accounted for the large waste volumes. The continuing clean-up of MDA-P,remediation of PRS 3-056(c) at the upper end of Sandia Canyon in TA-<strong>03</strong>, and the accelerated clean-up of MDA-Rdue to the Cerro Grande Fire, were responsible for most of the chemical waste generation.eThe continuing clean-up efforts at MDA-P and PRS 3-056(c) accounted for most of the ER Project generated wastein 2001.Radiological worker in respirator and personal protective equipmentSWEIS Yearbook—2002 3-11
3.3.3 Low-Level Radioactive WastesTable 3.3.3-1 summarizes LLW generation from 1998 through 2002. LLW generation in 2002 was less than60 percent of waste volumes projected by the SWEIS ROD. During 2002, Key Facilities produced less thanone-sixth the volume of LLW projected in the SWEIS ROD.Significant differences occurred at the CMR Building (389 cubic meters versus 1,820 cubic meters peryear projected by the SWEIS ROD), the Sigma Complex (960 cubic meters projected versus 202 actual),and High Explosives Testing (940 cubic meters projected versus 0 actual). In addition, <strong>LA</strong>NSCE generatedlower volumes than projected (1,085 cubic meters projected versus 0 actual) because decommissioning andrenovation of Experimental Area A did not occur. Normal to low workloads accounted for lower wastevolumes at the other Key Facilities. LLW generation at Non-Key Facilities slightly exceeded the SWEISROD. This is explained by heightened activities and new construction at Non-Key Facilities.Table 3.3.3-1. LLW Generators and QuantitiesWASTEGENERATOR UNITSSWEIS RODPROJECTION 1998 1999 2000 2001 2002Key Facilities m 3 /yr 7,450 707 1,042 1,222 1,407 1,292Non-Key Facilities m 3 /yr 520 386 350 2,781 a 569 a 534 aER Project m 3 /yr 4,260 744 286 226 621 5,484<strong>LA</strong>NL m 3 /yr 12,230 1,837 1,678 4,229 2,597 7,310aLLW generation at the Non-Key Facilities slightly exceeds the SWEIS ROD due to heightened activities and newconstruction.3.3.4 Mixed Low-Level Radioactive WastesGeneration in 2002 approximated one-thirtieth of the MLLW volumes projected by the SWEIS ROD.Table 3.3.4-1 examines these wastes by generator categories from 1998 through 2002. With the exception of2000, the ER Project has generated much less MLLW than had been projected.Table 3.3.4-1. MLLW Generators and QuantitiesaWASTEGENERATOR UNITSSWEIS RODPROJECTION 1998 1999 2000 2001 2002Key Facilities m 3 /yr 54 7 17 11 20 12Non-Key Facilities m 3 /yr 30 55 3 10 9 9ER Project m 3 /yr 548 9 1 577 a 29 0<strong>LA</strong>NL m 3 /yr 632 71 21 598 58 21Almost all of the MLLW generated in 2000 resulted from the remediation of MDA-P.3.3.5 Transuranic WastesGeneration in 2002 approximated one-third of the TRU waste volumes projected by the SWEIS ROD.As projected in the ROD, TRU wastes are expected to be generated almost exclusively in four facilities (thePlutonium Facility Complex, the CMR Building, the RLWTF, and the Solid Radioactive and Chemical WasteFacility). TRU waste generated at the Non-Key Facilities during 2000, 2001, and 2002 all resulted from theOSR Project. Because this waste comes from shipping and receiving, it is attributed to that location as thepoint of generation. Table 3.3.5-1 examines TRU wastes by generator categories from 1998 through 2002.The ER Project did not produce any TRU wastes in 2002.3-12SWEIS Yearbook—2002
High bay in the RANT facility with a waste shipment for WIPPWaste shipment desitined for WIPPSWEIS Yearbook—2002 3-13
Table 3.3.5-1. Transuranic Waste Generators and QuantitiesWASTEGENERATOR UNITSSWEIS RODPROJECTION 1998 1999 2000 2001 2002Key Facilities m 3 /yr 322 108 143 122 92 82Non-Key Facilities m 3 /yr 0 0 0 3 25 37ER Project m 3 /yr 11 0 0 0 0 0<strong>LA</strong>NL m 3 /yr 333 108 143 125 117 1193.3.6 Mixed Transuranic WastesGeneration in 2002 was less than one-third the mixed TRU waste volumes projected by the SWEIS ROD.As projected, mixed TRU wastes are expected to be generated at only two facilities–the Plutonium FacilityComplex and the CMR Building. Table 3.3.6-1 examines these wastes by generator categories from 1998through 2002.Both the Plutonium Facility Complex (30 cubic meters actual versus 102 cubic meters per year projectedby the SWEIS ROD) and the CMR Building (13 cubic meters projected versus one actual) produced lessmixed TRU waste than projected because full-scale production of war reserve pits had not begun.Table 3.3.6-1. Mixed Transuranic Waste Generators and QuantitiesWASTEGENERATOR UNITSSWEIS RODPROJECTION 1998 1999 2000 2001 2002Key Facilities m 3 /yr 115 34 72 26 48 87Non-Key Facilities m 3 /yr 0 0 15 63 0 0ER Project m 3 /yr 0 0 0 0 0 0<strong>LA</strong>NL m 3 /yr 115 34 87 89 48 873.4 UtilitiesOwnership and distribution of utility services continue to be split between NNSA and Los Alamos County.NNSA owns and distributes most utility services to <strong>LA</strong>NL facilities, and the County provides these services tothe communities of White Rock and Los Alamos. Routine data collection for both gas and electricity are doneon a fiscal year basis, and keeping with the Yearbook goal of using routinely collected data, this information ispresented by fiscal year. Water data, however, are routinely collected and summarized by calendar year.3.4.1 GasThere was a change in ownership to the DOE Natural Gas Transmission Line in August 1999. DOE sold130 miles of gas pipeline and metering stations to the Public Service Company of New Mexico (PNM). Thisgas pipeline traverses the area from Kutz Canyon Processing Plant south of Bloomfield, New Mexico, toLos Alamos. Approximately 4 miles of the gas pipeline are within <strong>LA</strong>NL. Table 3.4.1-1 presents gas usageby <strong>LA</strong>NL for FY 1991 through FY 2002. Approximately 84 percent of the gas used by <strong>LA</strong>NL was usedfor heating (both steam and hot air). The remainder was used for electrical production. <strong>LA</strong>NL electricalgeneration is used to fill the difference between peak loads and the electric import capability.As shown in Table 3.4.1-1, total gas consumption for FY 2002 was less than projected by the SWEISROD. During FY 2002, less natural gas was used for heating because of the drought and warmer than normalweather pattern, and there was less electric generation at the TA-<strong>03</strong> power plant as compared to FY 2001.Table 3.4.1-2 illustrates steam production from FY 1996 through FY 2002.3-14SWEIS Yearbook—2002
Table 3.4.1-1. Gas Consumption (decatherms a ) at <strong>LA</strong>NL/Fiscal Years 1991-2002a3.4.2 ElectricityTOTAL USEDFOR ELECTRICPRODUCTIONTOTAL USEDFOR HEATPRODUCTIONFISCALYEAR SWEIS RODTOTAL <strong>LA</strong>NLCONSUMPTIONTOTAL STEAMPRODUCTION1991 1,840,000 1,480,789 64,891 1,415,898 8<strong>03</strong>,1681992 1,840,000 1,833,318 447,427 1,385,891 744,3001993 1,840,000 1,843,936 411,822 1,432,113 1,192,8<strong>03</strong>1994 1,840,000 1,682,180 242,792 1,439,388 1,094,8121995 1,840,000 1,520,358 111,908 1,408,450 967,5871996 1,840,000 1,358,505 11,405 1,347,100 Table 3.4.1-21997 1,840,000 1,444,385 96,091 1,348,294 Table 3.4.1-21998 1,840,000 1,362,070 128,480 1,233,590 Table 3.4.1-21999 1,840,000 1,428,568 241,490 1,187,078 Table 3.4.1-22000 1,840,000 1,427,914 352,126 1,075,788 Table 3.4.1-22001 1,840,000 1,492,635 273,312 1,219,323 Table 3.4.1-22002 1,840,000 1,325,639 212,976 1,112,663 Table 3.4.1-2A decatherm is equivalent to 1,000 to 1,100 cubic feet of natural gas.Table 3.4.1-2. Steam Production at <strong>LA</strong>NL/Fiscal Years 1996-2002abFISCAL YEARTA-3 STEAMPRODUCTION (klb a )TA-21 STEAMPRODUCTION (klb)TOTAL STEAMPRODUCTION (klb)1996 451,363 54,<strong>03</strong>3 701,7921997 413,684 50,382 464,0661998 377,883 37,359 415,2421999 576,548 b 29,468 606,0162000 634,758 b 27,840 662,5982001 531,763 b 29,195 560,9582002 478,007 b 26,206 504,213klb: Thousands of poundsTA-<strong>03</strong> steam production has two components: that used for electric production (167,767 klb in 2002) and that usedfor heat (310,240 klb in 2002).<strong>LA</strong>NL is supplied with electrical power through a partnership arrangement with Los Alamos County,known as the Los Alamos Power Pool, which was established in 1985. The NNSA and Los Alamos Countyhave entered into a 10-year contract known as the Electric Coordination Agreement whereby each entity’selectric resources are consolidated or pooled. Recent changes (as of August 1, 2002) in transmissionagreements with PNM have resulted in the removal of contractual restraints on Power Pool resources importcapability. Import capacity is now limited only by the physical capability (thermal rating) of the transmissionlines that is approximately 110 to 120 megawatts from a number of hydroelectric, coal, and natural gaspower generators throughout the western United States. Onsite electric generating capability for the PowerPool is limited by the existing TA-<strong>03</strong> steam and electric power plant, which is capable of producing up to 20megawatts of electric power that is shared by the Pool under contractual arrangement.The ability to accept additional power into the Los Alamos Power Pool grid is limited by the regionalelectric import capability of the existing northern New Mexico power transmission system. In recent years,the population growth in northern New Mexico, together with expanded industrial and commercial usage,has greatly increased power demands on the northern New Mexico regional power system. Several proposalsfor bringing additional power into the region have been considered. Power line corridor locations remainunder consideration, but it is uncertain when any new regional power lines would be constructed and becomeserviceable.SWEIS Yearbook—2002 3-15
Power Plant ComplexIn CY 2002, an environmental assessment (DOE 2002a), “Environmental Assessment for Installationand Operation of Combustion Turbine Generators at Los Alamos <strong>National</strong> Laboratory, Los Alamos, NewMexico,” (DOE/EA-1430) was written to analyze the effects of increasing the TA-<strong>03</strong> steam and electricpower plant generating capability by an additional 40 megawatts of power in the near future. Based on thisenvironmental assessment, DOE issued a Finding of No Significant Impact in December 2002. Installation ofthe first combustion turbine generator at the TA-<strong>03</strong> power plant is scheduled to occur during the FY 20<strong>03</strong> toFY 2004 time frame.Table 3.4.2-1 shows peak demand and Table 3.4.2-2 shows annual use of electricity from FY 1991through FY 2002. <strong>LA</strong>NL’s electrical energy use remains below projections in the SWEIS ROD. The RODprojected peak demand to be 113,000 kilowatts (with 63,000 kilowatts being used by <strong>LA</strong>NSCE and about50,000 kilowatts being used by the rest of the Laboratory). In addition, the ROD projected annual use to be782,000 megawatt hours with 437,000 megawatt hours being used by <strong>LA</strong>NSCE and about 345,000 megawattTable 3.4.2-1. Electric Peak Coincident Demand/Fiscal Years 1991-2002aCATEGORY <strong>LA</strong>NL BASE <strong>LA</strong>NSCE <strong>LA</strong>NL TOTALCOUNTYTOTAL POOL TOTALSWEIS ROD 50,000 a 63,000 113,000 Not projected Not projectedFY 1991 43,452 32,325 75,777 11,471 84,248FY 1992 39,637 33,707 73,344 12,426 85,770FY1993 40,845 26,689 67,534 12,836 80,370FY 1994 38,354 27,617 65,971 11,381 77,352FY 1995 41,736 24,066 65,802 14,122 79,924FY 1996 41,799 20,799 62,598 13,160 75,758FY 1997 37,807 24,846 62,653 13,661 76,314FY 1998 39,064 24,773 63,837 13,268 77,105FY 1999 49,509 24,510 74,019 14,399 82,885FY 2000 48,225 24,594 72,819 15,176 80,623FY 2001 50,146 21,517 71,663 14,583 85,461FY 2002 45,809 20,938 66,747 16,653 83,400All figures in kilowatts.3-16SWEIS Yearbook—2002
Table 3.4.2-2. Electric Consumption/Fiscal Years 1991-2002CATEGORY <strong>LA</strong>NL BASE <strong>LA</strong>NSCE <strong>LA</strong>NL TOTAL COUNTY POOL TOTALSWEIS ROD 345,000 a 437,000 782,000 Not projected Not projectedFY 1991 282,994 89,219 372,213 86,873 459,086FY 1992 279,208 102,579 381,787 87,709 469,496FY 1993 277,005 89,889 366,894 89,826 456,720FY 1994 272,518 79,950 352,468 92,065 444,533FY 1995 276,292 95,853 372,145 93,546 465,691FY 1996 277,829 90,956 368,785 93,985 462,770FY 1997 258,841 138,844 397,715 96,271 493,986FY 1998 262,570 64,735 327,305 97,600 424,905FY 1999 255,562 113,759 369,321 106,547 475,868FY 2000 263,970 117,183 381,153 112,216 493,369FY 2001 294,169 80,974 375,143 116,043 491,186FY 2002 299,422 94,966 394,398 121,013 515,401aAll figures in megawatt-hours.hours being used by the rest of <strong>LA</strong>NL. Actual use has fallen below these values, and the projected periodsof brownouts have not occurred. However, on a regional basis, failures in the PNM system have causedblackouts in northern New Mexico and elsewhere.In the third quarter of CY 2002, <strong>LA</strong>NL completed construction of the new Western Technical Area(WTA) 115/13.8-kV substation at TA-06. The main power transformer for WTA, rated at up to 50 mega voltamperes, was delivered in 2001. WTA will provide <strong>LA</strong>NL and the Los Alamos town site with redundancy inbulk power transformation facilities to guard against losses of either the Eastern Technical Area Substation orthe TA-<strong>03</strong> Substation (DOE 2000).Operations at several of the large <strong>LA</strong>NL loads changed during 2002. Notably the SCC operationsincreased to about 3 megawatts of load in 2002. Additional computing facilities are to be added to SCC in20<strong>03</strong>, resulting in the addition of another 1 to 2 megawatts of load.<strong>LA</strong>NSCE operations were extended in operating time in 2002 due to extended programmatic operationsand an increase of direct operating funds. This represented no significant increase in the total peak demandof loading on the <strong>LA</strong>NL power system in 2002, but did result in an increase of 13,992 megawatt hours (a17 percent increase) in <strong>LA</strong>NSCE energy consumption over 2001. It is expected that operating funds willbe restored in future years such that the <strong>LA</strong>NSCE operations will be restored to the level of prior yearsoperations at high power levels.LEDA funding was curtailed in 2001 resulting in the loss of 2 to 4 megawatts of load. This situationcontinued through 2002. LEDA will continue in mothballed maintenance mode until a new sponsor issecured, hopefully as early as 2004.The <strong>National</strong> High Magnetic Field Laboratory remained out of operation during 2002. The 60-Tesla superconducting magnet that failed in 2000 is in redesign and reconstruction and should be operational again by20<strong>03</strong>. This represents a temporary reduction of approximately 2 megawatts load in 2002.The DARHT facility began commissioning operations of its first axis in 2001. The load level is about2 megawatts for the first axis. The second axis became operational in 2002, representing an additional 2megawatts of new load to <strong>LA</strong>NL.Mitigation of the damage to <strong>LA</strong>NL utilities from the Cerro Grande Fire was for the most part completed in2002. Tree trimming clearance for the power line corridors will take many more years to bring areas up to thedesired <strong>LA</strong>NL standard.SWEIS Yearbook—2002 3-17
3.4.3 WaterBefore September 8, 1998, DOE supplied all potable water for <strong>LA</strong>NL, Bandelier <strong>National</strong> Monument,and Los Alamos County, including the towns of Los Alamos and White Rock. This water was obtained fromDOE’s groundwater right to withdraw 5,541.3 acre-feet per year or about 1,806 million gallons of water peryear from the main aquifer. On September 8, 1998, DOE leased these water rights to Los Alamos County.This lease also included DOE’s contractual annual right obtained in 1976 to 1,200 acre-feet per year of SanJuan-Chama Transmountain Diversion Project water. The lease agreement was effective for three yearsuntil September 8, 2001, although the County could exercise an option to buy sooner than three years. InSeptember 2001, DOE officially turned over the water production system to Los Alamos County. <strong>LA</strong>NL isnow considered a customer to Los Alamos County. Los Alamos County is continuing to pursue the use of SanJuan-Chama water as a means of maintaining those water rights. Los Alamos County is also proceeding withan engineering study and will have more information after that is complete.<strong>LA</strong>NL is in the process of installing additional water meters and a Supervisory Control and DataAcquisition/Equipment Surveillance System on the distribution system to keep track of water usage and todetermine the specific water use for various applications. Data are being accumulated to establish a basis forconserving water. <strong>LA</strong>NL continues to maintain the distribution system by replacing portions of the over-50-year-old system as problems arise. In remote areas, <strong>LA</strong>NL is trying to automate the monitoring of the systemto be more responsive during emergencies such as the Cerro Grande Fire.Table 3.4.3-1 shows water consumption in thousands of gallons from CY 1992 through CY 2002. <strong>LA</strong>NLconsumed about 325 million gallons during CY 2002. Under the expanded alternative, water use for <strong>LA</strong>NLwas projected to be 759 million gallons per year. Actual use by <strong>LA</strong>NL in 2002 was about 434 million gallonsless than the projected consumption and about 217 million gallons less than the 542 million gallons per yearunder the agreement with the County. The calculated NPDES discharge of 178 million gallons (Table 3.2-2)was about 55 percent of the total <strong>LA</strong>NL usage of 324 million gallons.Table 3.4.3-1. Water Consumption (thousands of gallons) for Calendar Years 1992-2002aCATEGORY <strong>LA</strong>NL LOS A<strong>LA</strong>MOS COUNTY TOTALSWEIS ROD 759,000 Not Projected Not ApplicableCY 1992 547,535 982,132 1,529,667CY 1993 467,880 999,863 1,467,743CY 1994 524,791 913,430 1,438,221CY 1995 337,188 1,022,126 1,359,314CY 1996 340,481 1,<strong>03</strong>5,244 1,375,725CY 1997 488,252 800,019 1,288,271CY 1998 461,350 Not Available a Not Available aCY 1999 453,094 Not Available a Not ApplicableCY 2000 441,000 Not Available a Not Available aCY 2001 393,123 Not Available a Not ApplicableCY 2002 324,514 Not Available a Not Available aOn September 8, 1998, Los Alamos County acquired the water supply system and <strong>LA</strong>NL no longer collects thisinformation.The County now bills <strong>LA</strong>NL for water, and all future water use records maintained by <strong>LA</strong>NL will be basedon those billings. The distribution system used to supply water to <strong>LA</strong>NL facilities now consists of a series ofreservoir storage tanks, pipelines, and fire pumps. The <strong>LA</strong>NL distribution system is gravity fed with pumpsfor high-demand fire situations at limited locations.3-18SWEIS Yearbook—2002
3.5 Worker SafetyWorking conditions at <strong>LA</strong>NL have remained essentially the same as those identified in the SWEIS.DARHT and Atlas—major construction activities—were reflected in the SWEIS analysis, and several othermajor facilities are also under construction for which separate NEPA documentation was prepared. More thanhalf the workforce remains routinely engaged in activities that are typical of office and computing industries.Much of the remainder of the workforce is engaged in light industrial and bench-scale research activities.Approximately one-tenth of the general workforce at <strong>LA</strong>NL continues to be engaged in production, services,maintenance, and research and development within <strong>Nuclear</strong> and Moderate Hazard facilities.3.5.1 Accidents and InjuriesTable 3.5.1-1 summarizes occupational injury and illness rates from CY 1996 through CY 2002.Occupational injury and illness rates for workers at <strong>LA</strong>NL during CY 2002 continue to be small as shownin Table 3.5.1-1. These rates correlate to 260 reportable injuries and illnesses during the year, or less than 51percent of the 507 cases projected by the SWEIS ROD.Table 3.5.1-1. Total Recordable and Lost Workday Case Rates at <strong>LA</strong>NLUC WORKERS ONLY<strong>LA</strong>NL (ALL WORKERS)CALENDAR YEAR TRI a LWC b TRI LWC1996 4.53 2.88 5.88 3.861997 4.41 2.66 5.55 3.451998 2.90 1.30 3.35 1.771999 2.37 1.24 2.52 1.372000 1.53 0.62 1.97 0.942001 1.62 0.55 1.96 0.912002 2.16 1.24 2.39 1.46abTRI: Total recordable incident rate, number per 200,000 hours worked.LWC: Lost workday cases, number of cases per 200,000 hours worked.3.5.2 Ionizing Radiation and Worker ExposuresOccupational radiation exposures for workers at <strong>LA</strong>NL fromCY 1998 through CY 2002 are summarized in Table 3.5.2-1. Thecollective Total Effective Dose Equivalent, or collective TEDE,for the <strong>LA</strong>NL workforce during 2002 was 164 person-rem,considerably lower than the workforce dose of 704 person-remprojected for the ROD.Thermoluminiscent dosimeterSWEIS Yearbook—2002 3-19
Table 3.5.2-1. Radiological Exposure to <strong>LA</strong>NL WorkersPARAMETERUNITSSWEISRODVALUEFOR1998VALUEFOR1999VALUEFOR2000VALUEFOR2001VALUEFOR2002Collective TEDE (external + internal) personrem704 161 <strong>131</strong> 196 113 164Number of workers with non-zero dose number 3,548 1,839 1,427 1,316 1,332 1,696These reported doses in Table 3.5.2-1 for 2002 could change with time. Estimates of committed effectivedose equivalent in many cases are based on several years of bioassay results, and as new results are obtainedthe dose estimates may be modified accordingly.Of the 164 person-rem collective TEDE reported for 2002, external radiation and tritium exposureaccounted for 160 person-rem. The remaining 4 person-rem are from internal exposure.The five highest individual doses in CY 2002 were 2.214, 1.897, 1.813, 1.644, and 1.619 rem. Thesedoses are well below the 5 rem/year legal limit. The 2.214 rem dose was approved in advance to be abovethe 2 rem/year performance goal by the A<strong>LA</strong>RA [as low as reasonably achievable] Steering Committee inaccordance with <strong>LA</strong>NL procedures. Table 3.5.2-2 summarizes the highest individual dose data for CY 1998through CY 2002. This is the first time that the information for CY 1998 and CY 1999 has appeared in ayearbook. Also, the data for CY 2000 and CY 2001 have been expanded.Table 3.5.2-2. Highest Individual Doses from External Radiation to <strong>LA</strong>NL Workers (rem)abcAverage non-zero dose:• external + internal radiation exposure• external radiation exposure onlymilliremmilliremNotprojectedNotprojected87.4NotprojectedCY 1998 CY 1999 CY 2000CY 2001 cCY 20021.8461.9101.048 1.2842.2141.8041.5811.5361.5231.8661.7831.7551.7491.0130.9050.8280.8151.2251.1231.0020.9341.8971.8<strong>131</strong>.6441.619Data for CY 1998 and CY 1999 have been added this year.The CY 2000 data for only the two highest doses appeared in previous yearbooks. The TEDEs for these individualsare elevated due to a single unplanned incident at TA-55 in March 2000, as discussed in the SWEIS Yearbook-2000.This was an accidental exposure and so outside the SWEIS ROD projection.During CY 2001, four individual doses were greater than 1 rem, but less than 2 rem.Comparison with the SWEIS Baseline. The collective TEDE for CY 2002 is 79 percent of the 208 personremof 1993–1995 used as the baseline in the ROD. Several factors were responsible for this, the moreimportant of which include the following:Work and Workload. Changes in workload and types of work from 1993–1995 have resulted in adecreased collective TEDE. The SWEIS used the 1993–1995 time frame as its base. Of special importanceis that the radionuclide power source for the Cassini spacecraft was being constructed at TA-55 during thebaseline time period. This project incurred higher neutron exposure for the workers. After the project wascompleted in the 1995–1996 time frame, the <strong>LA</strong>NL collective TEDE was reduced.A<strong>LA</strong>RA Program. Improvements from the A<strong>LA</strong>RA program, such as the continuing addition of shieldingat <strong>LA</strong>NL workplaces, have also resulted in lower worker exposures and consequently a reduced collectiveTEDE for the Laboratory.929014965858396953-20SWEIS Yearbook—2002
Improved Personnel Dosimeter. An improved personnel dosimeter was introduced on a Laboratory-widebasis in April 1998. The dosimeter’s increased accuracy in measuring the external neutron dose removedsome conservatism that had been previously used in estimating the dose, which resulted in lower reporteddoses. (The actual dose did not change, but the ability to measure it accurately improved.)Comparison with the Projected TEDE in the ROD. In addition to being less than the collective TEDElevels in 1993–1995, the collective TEDE for 2002 is less than the TEDE projected in the ROD. Theimplementation of war reserve pit manufacture, which was approved in the ROD, has not become fullyoperational at <strong>LA</strong>NL. This contributed to lower doses than projected. The collective dose may increase oncethe pit manufacture program is fully implemented.Collective TEDEs for Key Facilities. In general, collective TEDEs by Key Facility or technical area aredifficult to determine because these data are collected at the group level, and members of many groups and/ororganizations receive doses at several locations. The fraction of a group’s collective TEDE coming from aspecific Key Facility or technical area can only be estimated. For example, personnel from the Health PhysicsOperations group and JCNNM are distributed over the entire Laboratory, and these two organizations accountfor a significant fraction of the total <strong>LA</strong>NL collective TEDE. Nevertheless, the group working at TA-18 iswell defined, and the 2002 collective TEDE for the Pajarito Site Key Facility is 1.4 person-rem.Many of the groups working at TA-55 have been reorganized to include workers at other facilities.However, approximately 95 percent of the collective TEDE that these groups incur is estimated to come fromoperations at TA-55. The total collective TEDE for these groups in CY 2002, plus the estimated collectiveTEDE for the health physics personnel and JCNNM personnel working at TA-55, is 108 person-rem, which is66 percent of the total Laboratory TEDE of 164 person-rem.3.6 SocioeconomicsThe <strong>LA</strong>NL-affiliated workforce continues to include UC employees and subcontractors. Table 3.6-1summarizes the workforce data from CY 1996 through CY 2002. As shown in Table 3.6-1, the number ofemployees has exceeded SWEIS ROD projections. The 13,524 employees at the end of CY 2002 are 2,173more employees than SWEIS ROD projections of 11,351. SWEIS ROD projections were based on 10,593employees identified for the index year (employment as of March 1996). The 13,524 total employees atthe end of CY 2002 reflect an increase of 1,144 employees over the 12,380 employees reported in the 2001Yearbook (<strong>LA</strong>NL 2002a).Table 3.6-1. <strong>LA</strong>NL-Affiliated WorkforceabCATEGORYUCEMPLOYEESTECHNICALCONTRACTORNON-TECHNICALCONTRACTOR JCNNM PT<strong>LA</strong> TOTALSWEIS ROD a 8,740 795 Not projected b 1,362 454 11,351CY 1996 8,256 877 269 1,358 395 11,155CY 1997 8,5<strong>03</strong> 911 328 1,330 424 11,496CY 1998 8,945 950 271 1,393 449 12,008CY 1999 9,185 1,064 214 1,461 488 12,412CY 2000 8,861 1,010 200 1,430 514 12,015CY 2001 9,179 1,024 197 1,487 493 12,380CY 2002 9,923 1,149 204 1,658 590 13,524Total number of employees was presented in the SWEIS, the breakdown had to be calculated based on the percentagedistribution shown in the SWEIS for the base year.Data were not presented for non-technical contractors or consultants.SWEIS Yearbook—2002 3-21
These employees have had a positive economic impact on northern New Mexico. Through 1998, DOEpublished a report each fiscal year regarding the economic impact of <strong>LA</strong>NL on north-central New Mexico aswell as the State of New Mexico (Lansford et al. 1997, 1998, 1999). The findings of these reports indicatethat <strong>LA</strong>NL’s activities resulted in a total increase in economic activity in New Mexico of about $3.2 billion in1996, $3.9 billion in 1997, and $3.8 billion in 1998. The publication of this report was discontinued after FY1998 due to funding deficiencies. However, based on number of employees and payroll, it is expected that<strong>LA</strong>NL’s 2002 economic contribution was similar to the three years analyzed for DOE.The residential distribution of UC employees reflects the housing market dynamics of three counties. Asseen in Table 3.6-2, 88 percent of the UC employees continued to reside in the three counties of Los Alamos,Rio Arriba, and Santa Fe.Table 3.6-2. County of Residence for UC Employees aCALENDAR YEARLOSA<strong>LA</strong>MOSRIOARRIBASANTAFEOTHERNMTOTALNMOUTSIDENM TOTALSWEIS ROD b 4,279 1,762 1,678 671 8,390 350 8,740CY 1996 4,539 1,274 1,524 422 7,759 497 8,256CY 1997 4,666 1,323 1,599 436 8,024 479 8,5<strong>03</strong>CY 1998 4,831 1,454 1,688 469 8,442 5<strong>03</strong> 8,945CY 1999 4,833 1,523 1,805 529 8,690 495 9,185CY 2000 4,663 1,509 1,778 510 8,460 401 8,861CY 2001 4,669 1,615 1,828 571 8,683 496 9,179CY 2002 4,909 1,733 2,065 659 9,366 557 9,923aIncludes both Regular and Temporary employees, including students who may not be at <strong>LA</strong>NL for much of the year.bTotal number of employees was presented in the SWEIS, the breakdown had to be calculated based on the percentagedistribution shown in the SWEIS for the base year.Science outreach3-22SWEIS Yearbook—2002
Table 3.6-3. UC Employee a Index for Key FacilitiesKEY FACILITYSWEISRODCY1996CY1997CY1998REFERENCEYEAR 1999 bCY1999CY2000CY2001CY2001Plutonium Complex 1,111 463 478 526 589 589 572 635 689Tritium Facilities 123 37 33 31 28 28 24 25 20CMR 367 206 207 218 204 204 190 192 201Pajarito Site 95 57 60 65 70 70 73 73 78Sigma Complex 284 96 104 110 101 101 99 94 105MSL 82 50 55 57 57 57 59 60 61Target Fabrication 98 55 55 57 54 54 52 54 53Machine Shops 289 73 77 83 81 81 80 91 92High Explosives Testing 619 85 90 93 227 227 212 245 264High Explosives Processing 335 184 197 201 96 96 92 107 114<strong>LA</strong>NSCE 846 494 523 547 560 560 550 505 496Biosciences 250 78 77 82 98 98 110 116 108Radiochemistry Laboratory 248 113 125 129 128 128 124 122 110Waste Management – Radioactive 110 47 48 55 62 62 58 47 54Liquid WasteWaste Management – Radioactive 225 40 46 60 65 65 64 60 63Solid and Chemical WasteRest of <strong>LA</strong>NL 6,579 4,144 4,325 4,547 4,601 4,601 4,501 4,816 5,243Total Employees 11,661 6,222 6,500 6,861 7,021 7,021 6,860 7,242 7,751abIncludes full-time and part-time regular employees; it does not include students who may be at the Laboratory formuch of the year nor does it include special programs personnel. A similar index does not exist in the SWEIS, whichused a very time-intensive method to calculate this index.CY 1999 was selected as the reference year for this index because it represents the year the SWEIS ROD waspublished.<strong>LA</strong>NL records contain the technical area and building number of each employee’s office. This informationdoes not necessarily indicate where the employee actually performs his or her work; but rather, indicateswhere this employee gets mail and officially reports to duty. However, for purposes of tracking the dynamicsof changes in employment across Key Facilities, this information provides a useful index. Table 3.6-3identifies UC employees by Key Facility based on the facility definitions contained in the SWEIS. Theemployee numbers contained in the category “Rest of <strong>LA</strong>NL,” were calculated by subtracting the Key Facilitynumbers from the calendar year total.The numbers in Table 3.6-3 cannot be directly compared to numbers in the SWEIS. The employeenumbers for Key Facilities in the SWEIS represent total workforce, and include PT<strong>LA</strong>, JCNNM, and othersubcontractor personnel. The new index (shown in Table 3.6-3) is based on routinely collected informationand only represents full-time and part-time regular UC employees. It does not include employees on leave ofabsence, students (high school, cooperative, undergraduate, or graduate), or employees from special programs(i.e., limited-term or long-term visiting staff, post-doctorate, etc.). Because the two sets of numbers do notrepresent the same entity, a comparison to numbers in the SWEIS is not appropriate. This new index will beused throughout the lifetime of the Yearbook; hence, future comparisons and trending will be possible. CY1999 was selected as the reference year for this index because it represents the year the SWEIS ROD waspublished.3.7 Land ResourcesLand resources were examined in 1996–1998 during the development of the SWEIS. From then untilCY 2002, the land resources (i.e., undeveloped and developed lands) available for use at <strong>LA</strong>NL remainedconstant. In CY 2002, approximately 2,209 acres of land were transferred to private ownership under PublicLaw 105-119.SWEIS Yearbook—2002 3-23
3.7.1 Land Resources—CY 1998From 1996 through 1998, land resources at <strong>LA</strong>NL and the surrounding areas remained essentiallyunchanged. The ROD had not been signed, and major land breaking construction projects were notundertaken. All of the construction projects that were undertaken were done within existing facilities. TheSWEIS projected a habitat reduction of 41 acres under the Expanded Alternative due to the expansion of AreaG. However, in 1998, <strong>LA</strong>NL was still operating under the No Action Alternative, and this expansion wasnot undertaken. During 1998, the only major construction project outside of existing facilities at <strong>LA</strong>NL wasDARHT. The actual habitat loss and ground breaking activities associated with DARHT happened duringconstruction start-up in 1992 and 1993 when the land was cleared of vegetation and the “footprint” of thisfacility was established.3.7.2 Land Resources—CY 1999In 1999, the SCC, NISC, and Los Alamos Research Park (known in 1999 as the Industrial Research Park)major construction projects started. Each of these projects had their own NEPA documentation. The SCC andNISC construction occurred on previously disturbed land containing parking lots or other structures. Only theResearch Park was greenfield construction and expected to result in a loss of 30 acres. All other constructionwas done within existing facilities. The projected Area G expansion did not occur.3.7.3 Land Resources—CY 2000During 2000, land resources were impacted by the Cerro Grande Fire, which burnt across approximately7,500 acres or 27 percent of the Laboratory’s land. Of the 332 structures affected by the fire, 236 wereimpacted, 68 damaged, and 28 destroyed (ruined beyond economic repair). Fire mitigation work such as floodretention facilities modified less than 50 acres of undeveloped land.A number of projects continued to move forward, such as the SCC, the NISC, several General PlantProjects, and the related but non-Laboratory Los Alamos Research Park. Most of these projects are onpreviously developed or disturbed land (<strong>LA</strong>NL 2000b). However, the Research Park occupies about 44 acresof previously undeveloped land along West Jemez Road.TA-<strong>03</strong> (left) and future site of Los Alamos Research Park (tree-covered area to the right)3-24SWEIS Yearbook—2002
The Los Alamos Research ParkAlso during 2000, <strong>LA</strong>NL’s new Comprehensive Site Plan (CSP2000, <strong>LA</strong>NL 2000d) was completed.CSP2000 is <strong>LA</strong>NL’s guide for land development. The CSP2000 geographic information system identifiedapproximately 18,500 acres or two-thirds of <strong>LA</strong>NL’s land resources as undesirable for development dueto physical and operational constraints. Of the remaining 9,300 acres (about one-third of the Laboratory’sland) over 5,500 acres have been developed, leaving about 4,000 acres as undeveloped. The majority of thisundeveloped land is located in TAs 58, 70, 71, and 74. Because of the remote locations and adjacent land usesof TAs 70, 71, and 74, they are not considered prime developable lands for Laboratory activities.The ER Project is unique from a land use standpoint. Rather than using land for development, the projectcleans up legacy wastes and makes land available for future use. Through these efforts, several large tractsof land will be made available for use by the Laboratory, Los Alamos County, or other adjacent landowners.For example, under Public Law 105-119, the DOE was directed to convey to Los Alamos County and transferto the Department of Interior, in trust for the Pueblo of San Ildefonso, lands not required to meet the nationalsecurity mission of DOE. Several tracts of land were identified for conveyance or transfer, and pendingcleanup by the ER Project, will be made available for future use.3.7.4 Land Resources—CY 2001CY 2001 was similar to the previous calendar years: the land acreage remained constant; the ongoingconstruction projects from CY 2000 continued; and the mitigation efforts and repairs from the Cerro GrandeFire of 2000 continued.3.7.5 Land Resources—CY 2002CY 2002 marks the first land transfers under Public Law 105-119. <strong>LA</strong>NL began CY 2002 with 27,863acres 1 of land and ended the calendar year with approximately 25,654 acres. Table 3.7.5-1 shows that,although the land resources at <strong>LA</strong>NL are distributed over 10 usage categories, all of the transferred land camefrom the reserve land category. Table 3.7.5-2 provides a summary of the land parcels transferred and to whomthey were transferred.Because of the land transfers, the distance to some site boundaries has decreased and a preliminaryassessment of the impact of the boundary changes on the accident analyses in the SWEIS has been performed.The full assessment is in Appendix E and the conclusions of the assessment are stated below.1 Previously, the SWEIS Yearbooks have listed Laboratory acreage at 27,816 acres. The acreage numbers being used here are from the TYCSP (<strong>LA</strong>NL2001d). The boundary survey will determine the correct number.SWEIS Yearbook—2002 3-25
Table 3.7.5-1. Site-wide Land UseACREAGE IN CY 2002<strong>LA</strong>ND USE CATEGORY BEGINNING OF CY END OF CYService/Support 140 140Experimental Science 514 514High Explosives Research and Development 1,310 1,310High Explosives Testing 7,096 7,096<strong>Nuclear</strong> Materials Research and Development 374 374Physical/Technical Support 336 336Public/Corporate Interface 31 31Theoretical/Computational 2 2Waste Management 186 186Reserve 17,874 ~15,665Total 27,863 ~25,654Table 3.7.5-2. Land Transfers during CY 2002DESIGNATOR DESCRIPTION RECIPIENT TRANSFER DATE ACREAGEA-1 Manhattan Monument Los Alamos County October 31, 2002 0.07A-12 <strong>LA</strong>AO-1 (East) Los Alamos County October 31, 2002 4.51A-17 TA-74-1 (West) Los Alamos County October 31, 2002 5.52A-19 White Rock-1 Los Alamos County October 31, 2002 76.33A-2 Site 22 Los Alamos County October 31, 2002 0.17A-3 Airport-1 (East) Los Alamos County October 31, 2002 9.44A-6 Airport-4 (West) Los Alamos County October 31, 2002 4.18A-9 DP Road-2 (North) (Tank Farm) Los Alamos County October 31, 2002 14.94B-1 White Rock-2 Pueblo of San Ildefonso October 31, 2002 14.94B-2 TA-74-3 (North) (Includes B-4) Pueblo of San Ildefonso October 31, 2002 2,089.88Total 2,209.29The basic conclusion of the assessment is that the decrease in distances between assumed accidentlocations and previously analyzed receptor locations will have little or no impact on estimated doses in theSWEIS. On this basis there appears to be no need to revise accident analyses in the SWEIS because of landtransfers from the DOE to public entities.The conclusion is based on a review of several facilities and postulated accidents, especially risk-dominantaccidents in the SWEIS. Very few or minimal changes in predicted effects are expected to occur. Oneexception, a hydrogen cyanide accident at the Sigma Facility, has been noted. The SWEIS still serves thepurpose of characterizing <strong>LA</strong>NL operations, differentiating among alternatives, and presenting a baseline thatis suitable for tiering and bounding of potential accidents at <strong>LA</strong>NL.A recommendation in the conclusion is that site boundary changes be considered in future NEPA reviewsas appropriate.Tract of land identifi ed for conveyance and transfer in Pueblo Canyon3-26SWEIS Yearbook—2002
3.8 GroundwaterGroundwater occurs in three settings beneath the Pajarito Plateau: alluvium, intermediate saturated zones,and the regional aquifer. The major source of recharge to the regional aquifer is precipitation within the Sierrade los Valles. However, alluvial groundwater on the Pajarito Plateau is a source of recharge to underlyingintermediate saturated zones and to the regional aquifer.Water levels have been measured in wells tapping the regional aquifer since the late 1940s when the firstexploratory wells were drilled by the US Geological Survey (McLin et al. 1998). The annual production anduse of water increased from 231 million gallons in 1947 to a peak of 1,732 million gallons in 1976. Wateruse has declined since 1976 to 1,286 million gallons in 1997 (McLin et al. 1997, 1998). Trends in waterlevels in the wells reflect a plateau-wide decline in regional aquifer water levels in response to municipalwater production. The decline is gradual and does not exceed 1 to 2 feet per year for most production wells(McLin et al. 1998). When pumping stops in the production wells, the static water level returns in about 6 to12 months. Hence, these long-term declines are not currently viewed as a threat to the water supply system(McLin et al. 1998).Sampling and analysis of water from water supply wells indicate that water in the regional aquifer beneaththe Pajarito Plateau is generally of high quality and meets or exceeds all applicable water supply standards.There have been 19 characterization wells ( Figure 3-1 and Table 3.8-1) installed in the regional aquiferover the past four years and each of the wells has been sampled on a quarterly basis. Data such as these areFigure 3-1. Location of the groundwater characterization wells.SWEIS Yearbook—2002 3-27
Table 3.8-1. Groundwater Characterization WellsTOTALWELL LOCATIONDATEDRILLEDDEPTH(FEET)P<strong>UR</strong>POSE/FINDINGSR-5 Pueblo Canyon May 2001 902 Investigate regional aquifer, intermediate perchedgroundwater zones, and intercalated unsaturated zonesin the northeast part of <strong>LA</strong>NL.No contaminants in regional aquifer.R-7 Los AlamosCanyonR-8 Los AlamosCanyonR-9, R-9iLos AlamosCanyonJanuary 2001 1,097 Investigate regional aquifer, intermediate perchedgroundwater zones, and intercalated unsaturated zonesin the north-central part of <strong>LA</strong>NL.No contaminants in regional aquifer.January 2002 860 Determine regional aquifer quality down gradient ofreleases in Los Alamos and DP Canyons.Tritium in regional aquifer indicating a component ofwater less than 60 years old.September 1999 771 Determine regional aquifer quality at the Laboratoryboundary down gradient of releases in Los Alamos andDP Canyons.Tritium in perched zones and regional aquifersindicating a component of water less than 60 years old.R-12 Sandia Canyon January 2000 886 Determine regional aquifer quality at the Laboratoryboundary down gradient of releases in Sandia Canyon.Tritium in perched zones and regional aquifersindicating a component of water less than 60 years old.R-13 Mortandad Canyon October 2001 1,133 Examine water quality at the Laboratory boundarydown gradient of releases within the MortandadCanyon.No contaminants detected in the regional aquifer.R-14 Ten Site Canyon July 2002 1,325 Examine water quality near the discharge point for theRLWTF (TA-50).No contaminants detected in the regional aquifer.R-15 Mortandad Canyon September 1999 1,107 Examine water quality down-gradient from thedischarge point for the RLWTF (TA-50).Contaminants detected in the regional aquifer aretritium, nitrate, and perchlorate. None are abovedrinking water standards.R-16 Cañada del Buey August 2002 1,287 Measure water levels and vertical gradients in regionalaquifer in the discharge area.No contaminants detected in regional aquifer.R-19 Mesa south ofThree-MileCanyonMarch 2000 1,9<strong>03</strong> Determine regional aquifer quality at the Laboratoryboundary down gradient of potential releases in upperPajarito Canyon.No contaminants detected in perched or regionalaquifer.R-20 Pajarito Canyon August 2002 1,365 Sentry well for water supply well PM-2.Regional aquifer water quality upgradient of TA-54.No contaminants detected in the regional aquifer.R-21 Cañada del Buey November 2002 995 Evaluate and monitor hydrologic and geochemicalconditions near MDA-L.No contaminants detected in the regional aquifer.R-22 Mesita del Bueyabove PajaritoCanyonOctober 2000 1,489 Regional water quality and water level down gradientof TA-54.Tritium in regional aquifer indicating a component ofwater less than 60 years old.3-28SWEIS Yearbook—2002
Table 3.8-1. Groundwater Characterization Wells (continued)TOTALWELL LOCATIONDATEDRILLEDDEPTH(FEET)P<strong>UR</strong>POSE/FINDINGSR-23 Pajarito Canyon September 2002 930 Regional water quality and water level near TA-54.No contaminants detected in the regional aquifer.R-25 Mesa south ofCañon de ValleFebruary 1999 1,942 Regional water quality and water level near MDA-Pand other potential release sites in TA-16.High explosives and solvents in upper saturated zoneand regional aquifer. Tritium in upper saturated zoneand regional aquifer indicating a component of waterless than 60 years old.R-31 Ancho Canyon February 2000 1,1<strong>03</strong> Regional water quality and water level nearburning/open detonation sites.No contaminants detected in the regional aquifer.R-32 Pajarito Canyon August 2002 1,008 Regional water quality and water level near TA-54.No contaminants detected in the regional aquifer.CdV-R-15-3 Cañon de Valle April 2000 1,722 Determine extent of high explosives in perched zonesdown gradient of TA-16.No contaminants detected in the perched or regionalaquifers.CdV-R-37-2Mesa north ofWater CanyonAugust 2001 1,664 Determine extent of high explosives in perched zonesdown gradient of TA-16.No contaminants detected in the regional aquifer.SWEIS Yearbook—2002 3-29
captured in the Laboratory’s annual groundwater status report. The most recent status report covers FY 2002(Nylander et al. 20<strong>03</strong>).Highlights of the regional aquifer water chemistry from these characterization wells are as follows:• Natural groundwater ranges from calcium-sodium bicarbonate composition (Sierra de los Valles) tosodium-calcium bicarbonate composition (White Rock Canyon springs) (Longmire 2002a, b; Blake et al.1995; <strong>LA</strong>NL 2001). Silica is the second most abundant solute found in surface water and groundwaterbecause of reactions between soluble silica glass in the rock and water. Trace metals, including barium,strontium, and uranium, vary within the different saturated zones (alluvial, intermediate, and regional aquifer)depending on how long the water has been in contact with the host rock (Nylander et al., 20<strong>03</strong>). Oldergroundwater within the regional aquifer tends to have higher concentrations of trace elements.• Dissolved organic carbon, in the form of humic and fulvic acids, is present in groundwater inconcentrations typically less than 3 milligrams carbon per liter. These acids occur as anions and cancomplex with calcium and magnesium. Higher concentrations of dissolved organic carbon occur in alluvialgroundwater where runoff through grasslands and forests takes place. Shortly after the Cerro Grande Fire,increased concentrations of total organic carbon were observed in surface water and alluvial groundwaterwithin Pueblo Canyon, Los Alamos Canyon, Pajarito Canyon, and other watersheds. Since 2002,concentrations of total organic carbon have decreased in surface water, but remain elevated in alluvial andperched-intermediate groundwater. Total organic carbon provides an excellent tracer for tracking movementof recent water (post Cerro Grande Fire) in the subsurface.• Groundwater impacted by <strong>LA</strong>NL-derived effluent is characterized by elevated concentrations of majorions (calcium, magnesium, potassium, sodium, chloride, bicarbonate, nitrate, and sulfate); trace solutes (forexample, molybdenum, perchlorate, barium, boron, and uranium); high explosive compounds and othervolatile organic compounds; and radionuclides (tritium, americium-241, cesium-137, plutonium isotopes,strontium-90, and uranium isotopes) (Longmire 2002a, b, c, d; <strong>LA</strong>NL 2001c).• With regard to interconnection between alluvial groundwater, intermediate saturated zones, andthe regional aquifer, contaminant source terms correlate reasonably well with chemical data for mobilesolutes collected at down gradient characterization wells (Longmire 2002a, <strong>LA</strong>NL 2001c). Non-adsorbingcontaminants (perchlorate, nitrate, RDX, and TNT) are the most mobile and travel the greatest distancesalong groundwater-flow paths.Concentrations of some of thesechemicals in groundwater havebeen observed above establishedmaximum contaminant levels andrecommended health and actionlevels in wells (<strong>LA</strong>NL 2001c,Broxton et al. 2002):• MCOBT-4.4:intermediate saturatedzone, nitrate, perchlorate• R-25: intermediatesaturated zone, highexplosives (RDX)• Alluvial wells: alluvialaquifer, actinides,metals, and fissionproducts (Los AlamosCanyon, Pueblo Canyon,and Mortandad Canyon)Drilling auger and crew3-30SWEIS Yearbook—2002
Cleaning the drilling residues from a regional aquifer wellPerchlorate and RDX are persistent chemicals, which are resistant to reductive breakdown to non-toxicforms in the environment.Work underway as part of the Hydrogeologic Characterization Program, and described in theHydrogeologic Workplan (Barr 2001), provided new information on the regional aquifer and details ofthe hydrogeologic conditions. By the end of 2002, six additional characterization wells were complete.The characterization wells were drilled using air rotary in the vadose zone and rotary with stiff foam orbentonite mud in the saturated zone. Casing advance with fluid assist methods, used in drilling previouscharacterization wells, was employed only when swelling clays were encountered in the boreholes. Geologiccore was collected in the upper vadose zone in each well, and geologic cuttings were collected at definedintervals during the drilling operations and described to record the stratigraphy encountered. Geophysicallogging was conducted in each well to enhance the understanding of the stratigraphy and rock characteristics.The six completed characterization wells include R-8 (Los Alamos Canyon); R-20, R-23, and R-32 (PajaritoCanyon); R-16 near the Rio Grande in White Rock; and R-13 (Mortandad Canyon). R-21 in Cañada del Bueynear TA-54 was started early in FY 20<strong>03</strong>. Table 3.8-1 summarizes details on the 19 characterization wellscompleted by the Laboratory.R-8 is located in Los Alamos Canyon near the confluence of Los Alamos Canyon and DP Canyon. Theprimary purpose of the well is to determine regional aquifer water quality down-gradient of releases in LosAlamos and DP Canyons. It also serves as a sentry well for PM-2. Significant difficulties were encounteredin drilling the R-8 bore hole, so the well was constructed in a second bore hole drilled 62 ft due east of theoriginal location. Drilling of the R-8 bore hole took place between January 9 and January 27, 2002. Wellconstruction and development were completed on February 14, 2002. Westbay sampling equipment wasinstalled between February 21 and February 24, 2002. The R-8 well is completed with two screened intervalsin the regional aquifer: one straddling the water table at a depth of 705 to 755 feet and one at a depth of 821 toSWEIS Yearbook—2002 3-31
828 ft. One sample of water from the bore hole was collected from a depth of 822 ft. Tritium with activity of15 picocuries per liter was detected in the bore hole water sample.Well R-14 is located within the Mortandad Canyon watershed in Ten Site Canyon, east of the formerradioactive liquid waste and septic treatment facilities at TA-35. Drilling started on June 2, 2002, andwas completed on July 2, 2002. The regional aquifer water level is at 1,180 feet in the high-gamma PuyeFormation. Well construction and development were conducted and Westbay sampling equipment wasinstalled to complete the well with two screened intervals in the regional aquifer: one near the water table at adepth of 1,200 feet and one in a productive zone at a depth of 1,286 feet.R-16 is located above the Rio Grande in Overlook Park in the town of White Rock. Drilling started onAugust 16, 2002, and was completed on September 13, 2002. Based on the 3-D geologic model, the staticwater level for the regional aquifer was anticipated to be at 783 feet. There was indication of water influxat 867 feet, drilling was stopped and the water level was measured. The water level rose to 621 feet, muchhigher than expected. There were clay-rich zones in the Santa Fe Group, so one possible explanation forthe rise in water level is that the clay zones act as confining zones. Similar artesian conditions were alsoencountered in Los Alamos Canyon (R-9). Well construction, development, and installation of Westbaysampling equipment completed the well with three screened intervals in the regional aquifer:• Screen 1: 863–871 feet• Screen 2: 1,015–1,022 feet• Screen 3: 1,237–1,244 feetR-20 is located in Pajarito Canyon, east of TA-18 on the south side of Pajarito Road. Drilling started onAugust 4, 2002, and was completed on September 19, 2002. No perched water was encountered in R-20. Thestatic water level in the regional aquifer is at 872 feet. The well was constructed with three screened intervals,the deeper screens were put in to coincide with screened interval in PM-2:• Screen 1: 904–912 feet• Screen 2: 1,147–1,154 feet• Screen 3: 1,328–1,336 feetWell R-23 was drilled in Pajarito Canyon, just west of the NM 4/Pajarito Road intersection, on the southside of Pajarito Road. Drilling started on August 17, 2002, and was completed on October 3, 2002. Theregional water table in R-23 was encountered at 817 feet, higher than predicted by the 3-D geologic model(892 feet). Based on geophysical logging, perched water may be present. The well was constructed with onescreened interval, from 816 to 873 feet, at the top of the regional aquifer water table.Well R-32 is located in Pajarito Canyon, south of TA-54, on the north side of Pajarito Road. Drillingstarted on July 13, 2002, and was completed on August 7, 2002. The regional water table in R-32 wasoriginally encountered at 865 feet, the depth predicted by the 3-D Geologic Model. However, the water levelrose to 715 feet. The well was constructed with three screened intervals, one at the top of water table and twodeeper to measure pressure gradients:• Screen 1: 867–874 feet• Screen 2: 930–933 feet• Screen 3: 970–977 feet3-32SWEIS Yearbook—2002
3.9 Cultural Resources<strong>LA</strong>NL has a large and diverse number of historic properties. Approximately 85 percent of DOE land in LosAlamos County has been surveyed for prehistoric and historic cultural resources. Over 1,800 prehistoric siteshave been recorded (Table 3.9-1). More than 85 percent of these archeological sites date from the 14th and15th centuries. Most of the sites are found in the piñon-juniper vegetation zone, with 80 percent lying between5,800 and 7,100 feet in elevation. Almost three-quarters of all sites are found on mesa tops.Table 3.9-1. Acreage Surveyed, Prehistoric Cultural Resource Sites Recorded, and CulturalResource Sites Eligible for the <strong>National</strong> Register of Historic Places at <strong>LA</strong>NL FY 2002 aFISCALYEAR<strong>LA</strong>NLSWEIS RODabcdTOTA<strong>LA</strong>CREAGES<strong>UR</strong>VEYEDTOTAL ACREAGESYSTEMATICALLYS<strong>UR</strong>VEYED TO DATETOTALPREHISTORICCULT<strong>UR</strong>ALRESO<strong>UR</strong>CE SITESRECORDED TODATE b(CUMU<strong>LA</strong>TIVE)TOTALNUMBER OFELIGIBLE ANDPOTENTIALLYELIGIBLENRHP SITESNUMBER OFNOTIFICATIONSTO INDIANTRIBES cNot reported Not Reported 1,295 d 1,092 231998 1,920 17,937 1,369 1,304 101999 1,074 19,011 1,392 1,321 132000 119 19,428 1,459 1,386 62001 4,112 19,790 1,424 d 1,297 d 22002 2,686 22,476 1,835 1,699 6Source: The Secretary of Interior's Report to Congress on Federal Archaeological Activities. Information on <strong>LA</strong>NLprovided by DOE/Los Alamos Site Office and <strong>LA</strong>NL Cultural Resources Management Team (CRMT).In the 1999 and 2000 Yearbooks, this column, then titled ‘Total Archaeological Sites Recorded to Date,’ includedHistoric Period cultural resources (A.D. 1600 to present), including buildings. In order to conform to the way culturalproperties were discussed in the SWEIS, historic period properties were removed beginning with the 2001 SWEISYearbook. Historic sites are now documented in a separate table (3.9-2).As part of the SWEIS preparation, 23 tribes were consulted in a single notification. Subsequent years, however, showthe number of separate projects for which tribal notifications were issued; the number of tribes notified is notindicated.As part of ongoing work to field verify sites recorded 20 to 25 years ago, <strong>LA</strong>NL’s CRMT has identified sites thathave been recorded more than once and have multiple Laboratory of Anthropology (<strong>LA</strong>) site numbers. Therefore, thetotal number of recorded archaeological sites is less than indicated in FY 2000. This effort will continue overthe next several years and more sites with duplicate records will probably be identified.<strong>LA</strong>NL continues to evaluate buildings and structures from the Manhattan Project and the early Cold Warperiod (1943–1963) for eligibility to the Natural Register of Historic Places (NRHP). Within <strong>LA</strong>NL’s limitedaccess boundaries, there are ancestral villages, shrines, petroglyphs, sacred springs, trails, and traditional useareas that could be identified by Pueblo and Athabascan communities as traditional cultural properties.The SWEIS ROD lists 2,319 historic (A.D. 1600 to the present) cultural resource sites, including sitesdating from the Historic Pueblo, US Territorial, Statehood, Homestead, Manhattan Project, and Cold WarPeriods (Table 3.9-2). To date <strong>LA</strong>NL has identified no sites associated with the Spanish Colonial or MexicanPeriods. Many of the 2,319 potential historic cultural resources are temporary and modular properties, sheds,and utility features associated with the Manhattan Project and Cold War Periods. Since the SWEIS ROD wasissued, these types of properties have been removed from the count of historic properties because they areexempt from review under the terms of the Programmatic Agreement (MOU DE-GM32-00AL77152) betweenthe DOE Los Alamos Area Office, the New Mexico State Historic Preservation Office, and the AdvisoryCouncil on Historic Preservation. Additionally, the CRMT has evaluated many Manhattan Project and EarlyCold War properties (A.D. 1942–1963) and those properties built after 1963 that potentially have historicalSWEIS Yearbook—2002 3-33
Table3.9-2. HistoricPeriodCulturalResourcePropertiesat<strong>LA</strong>NL aabcFISCALYEAR<strong>LA</strong>NLSWEISRODsignificance, reducing the total number of potential historic cultural resource sites to 753. Most buildings builtafter 1963 are being evaluated on a case-by-case basis as projects arise that have the potential to impact theproperties. Therefore, additional buildings may be added to the list of historic properties in the future.<strong>LA</strong>NL has recorded 139 historic sites. All have been given unique New Mexico <strong>LA</strong> site numbers. Someof the 139 are experimental areas and artifact scatters dating from the Manhattan Project and early ColdWar Periods. The majority, 126 sites, are structures or artifact scatters associated with the Historic Pueblo,US Territorial, Statehood, or Homestead Periods. Of these 139 sites 96 have been declared eligible for theNRHP. <strong>LA</strong>NL’s Manhattan Project and early Cold War Period buildings account for the remaining 614 of the753 historic period properties. At this time the New Mexico State Historic Preservation Division (NMSHPD)does not assign <strong>LA</strong> numbers to <strong>LA</strong>NL buildings. Of these historic buildings, 162 have been evaluated foreligibility and inclusion on the NRHP. Forty of these evaluated buildings have been declared not eligible forthe NRHP; the remaining 122 are NRHP-eligible.The CRMT has documented 30 of the NRHP-eligible buildings in accordance with the terms ofofficial Memorandums of Agreement between the DOE and the NMSHPD. They have subsequently beendecontaminated, decommissioned, and demolished through the Decontamination and DecommissioningProgram. Twelve of the 40 non-eligible buildings have also been demolished through this program.3.9.1 Compliance OverviewELIGIBLEANDPOTENTIALLYELIGIBLEEVALUATEDBUILDINGSPOTENTIAL PROPERTIES NON-ELIGIBLEPROPERTIES b RECORDED c PROPERTIES PROPERTIES DEMOLISHED2,319 164 98 NotReported NotReported1998 NotReported 181 136 45 NotReported1999 NotReported 240 170 70 NotReported2000 NotReported 246 173 73 NotReported2001 733 259 186 73 332002 753 301 218 83 42Source:TheSecretaryofInterior’sReporttoCongressonFederalArchaeologicalActivities.Informationon<strong>LA</strong>NLprovidedbyDOE/LosAlamosSiteOfficeand<strong>LA</strong>NLCRMT.Numbersgivenrepresentcumulativetotalpropertiesidentified,evaluated,ordemolishedbytheendofthegivenfiscalyear.Thisnumberincludeshistoricsitesthathavenotbeenevaluated,andtherefore,maybepotentiallyNRHP-eligible.Inaddition,beginningwiththe2002Yearbook,historicpropertiesthatareexemptfromreviewunderthetermsoftheProgrammaticAgreementwereremovedfromthesetotals,substantiallyreducingthenumberofpotentialhistoricperiodculturalresources.Thisrepresentsbotheligibleandnon-eligiblesites.Section 106 of the <strong>National</strong> Historic Preservation Act, Public Law 89-665, implemented by 36 Code ofFederal Regulations Part 800 (36 CFR 800), requires Federal agencies to evaluate the impact of proposedactions on historic properties. Federal agencies must also consult with the State Historic Preservation Officerand/or the Advisory Council on Historic Preservation about possible adverse effects to NRHP-eligibleresources.During FY 2002 (October 2001 through September 2002), the CRMT evaluated 1,124 Laboratoryproposed actions and conducted two new field surveys to identify cultural resources. DOE sent 11 surveyresults to the SHPO for concurrence in findings of effects and determinations of eligibility for the NRHP ofcultural resources located during the survey.3-34SWEIS Yearbook—2002
The American Indian Religious Freedom Act of 1978 (Public Law 95-341) stipulates that it is Federalpolicy to protect and preserve the right of American Indians to practice their traditional religions. Tribalgroups must receive notification of possible alteration of traditional and sacred places. The Governors of SanIldefonso, Santa Clara, Cochiti, and Jemez Pueblos and the President of the Mescalero Apache Tribe receivedcopies of six reports to identify any traditional cultural properties that a proposed action could affect. CRMTidentified adverse effects to three historic buildings that were decommissioned and decontaminated in 2002.Historic building documentation and interpretation were conducted to resolve the adverse effects.The Native American Graves Protection and Repatriation Act of 1990 (Public Law 101-601) states that ifburials or cultural objects are inadvertently disturbed by Federal activities, work must stop in that location for30 days, and the closest lineal descendant must be consulted for disposition of the remains. No discoveries ofburials or cultural objects occurred in FY 2002. The Archaeological Resources Protection Act of 1979 (PublicLaw 96-95) provides protection of cultural resources and sets penalties for their damage or removal fromFederal land without a permit. No violations of this Act were recorded on DOE land in FY 2002.3.9.2 Compliance ActivitiesNake’muu. During FY 2002, as part of the DARHT MAP (<strong>LA</strong>NL 1995), the CRMT continued a longtermmonitoring program at the ancestral pueblo of Nake’muu to assess the impact of <strong>LA</strong>NL missionactivities on cultural resources. Nake’muu is the only pueblo at the Laboratory that still contains its originalstanding walls. It dates from circa A.D. 1200 to 1325 and contains 55 rooms with walls standing up to six feethigh. FY 2002 witnessed the lowest loss rate for chinking stones (0.5%) and masonry blocks (0.2%) duringthe five-year monitoring period. The fact thatthis was an extreme drought year would supportthe contention that natural processes have agreat effect on the deterioration rate of thesite. During the five-year monitoring programNake’muu has experienced a 5.8 percent loss ofchinking stones and 2.7 percent loss of masonryblocks. During FY 2002 the post-Cerro GrandeFire Pueblo Site Condition Assessment Teamalso visited Nake’muu. Trees that couldpotentially fall and damage the standing wallarchitecture were marked for future removalduring 20<strong>03</strong>.Members of the San Ildefonso Pueblo visiting the Nake’ muu ruinsSWEIS Yearbook—2002 3-35
Traditional Cultural Properties Comprehensive Plan. During FY 2002, the CRMT continued toassist DOE in implementing the Traditional Cultural Properties Comprehensive Plan (<strong>LA</strong>NL 2000e). Thisincluded a formal meeting with the four Accord Pueblos (Cochiti, Jemez, San Ildefonso, Santa Clara) and aseparate formal meeting with the Hopi Tribe. In addition, two individual working meetings were held withrepresentatives from San Ildefonso Pueblo. A plan has been developed with San Ildefonso Pueblo to prioritizetheir issues, beginning with consideration of TA-<strong>03</strong> and previously identified traditional cultural properties inRendija Canyon.Shards found on the Pajarito PlateauLand Conveyance and Transfer. The Programmatic Agreement Among the United States Department ofEnergy, the Advisory Council on Historic Preservation, the New Mexico State Historic Preservation Offi cer,and the Incorporated County of Los Alamos, New Mexico, Concerning the Conveyance of Certain Parcelsof Land to Los Alamos County, New Mexico was signed in May 2002 (DOE 2002b). In September 2002,the TA-74 North tract was transferred to the Pueblo of San Ildefonso. Excavations at the Airport East andWhite Rock tracts began in June 2002 and were completed in March 20<strong>03</strong>. Those tracts are now available tothe County of Los Alamos for development. In the 20<strong>03</strong> archeological field season, the Airport Central tractis scheduled for excavation and historic building documentation will be completed at the DOE/NNSA LosAlamos Site Office building, the Laboratory Archives, and the classified incinerator.Cerro Grande Fire Recovery. During 2002, the CRMT finished its archaeological assessment of morethan 500 sites and historic buildings and structures that were potentially impacted by the May 2000 CerroGrande Fire. The report of this assessment will be made available to the general public through the EcologyGroup and <strong>LA</strong>NL’s Library Without Walls web sites. The CRMT also continued to assist the Cerro GrandeRehabilitation Project in support of a contract with the Pueblos of San Ildefonso and Santa Clara to providespecific recommendations for rehabilitative treatments at approximately 118 archaeological sites most heavilyimpacted by the fire. The Cerro Grande Rehabilitation Project and the Pueblo of San Ildefonso will implementthese treatments during 20<strong>03</strong>.3-36SWEIS Yearbook—2002
3.9.3 Integrated Cultural Resources Management PlanThe Integrated Cultural Resources Management Plan will provide a set of guidelines for managingand protecting cultural resources, in accordance with requirements of the <strong>National</strong> Historic Preservation Act,the Archaeological Resources Protection Act, and the American Indian Religious Freedom Act and in thecontext of UC/<strong>LA</strong>NL’s mission.The Comprehensive Plan for Consideration of Traditional Cultural Properties and Sacred Sites at LosAlamos <strong>National</strong> Laboratory, New Mexico (<strong>LA</strong>NL 2000e), issued August 2000, presents a framework forcollaborating with Native American Tribal organizations and other ethnic groups in identifying traditionalcultural properties and sacred sites. The ICRMP will provide high-level guidance for implementation of thisComprehensive Plan.Status:The Integrated Cultural Resources Management Plan is due to be complete in 2004 and it will be updatedevery five years after issuance.Relationship to Other Plans:The Biological Resources Management Plan (particularly the Threatened and Endangered Species HabitatManagement Plan [<strong>LA</strong>NL 1998]) may limit access to certain cultural resource sites. Erosion control under thewater plans will have a potential impact on cultural resource sites.Demolished BuildingsTable 3.9.3-1 indicates the extent of historic building documentation and demolition to date.Table 3.9.3-1. Historic Building Documentation and Demolition NumbersFISCAL YEARNUMBER OF BUILDINGS FOR WHICH REQUIREDDOCUMENTATION WAS COMPLETEDNUMBER OF BUILDINGS ACTUALLYDEMOLISHED IN FISCAL YEAR aPre 1995 1 Unknown1995 21 Unknown1996 0 Unknown1997 0 Unknown1998 5 Unknown1999 5 Unknown2000 0 Unknown2001 7 Unknown2002 31 0TOTAL 42 42aAlthough buildings were demolished in the years before 2002, the CRMT did not monitor the dates when thebuilding demolitions actually occurred, but the total is 42.SWEIS Yearbook—2002 3-37
2002 Land TransferredNine cultural resources sites were excavated in whole or in part in the White Rock and Airport tracts. Sitestransferred to San Ildefonso Pueblo did not require data recovery since the cultural properties are protected bythe same Federal laws that apply to DOE.White Rock Tract. A total of 11 sites were transferred to San Ildefonso Pueblo and Los Alamos County.Eight of these sites had data recovery including all seven County sites and the County portion of a sitestraddling the boundary between the County and San Ildefonso Pueblo.Airport Tract. One site was excavated and transferred to Los Alamos County.TA-74 Tract. Forty-nine sites were transferred to San Ildefonso Pueblo.3.10 Ecological Resources<strong>LA</strong>NL is located in a region of diverse landform, elevation, and climate—features that contribute toproducing diversified plant and animal communities. Plant communities range from urban and suburbanareas to grasslands, wetlands, shrub lands, woodlands, and mountain forest. These plant communities providehabitat for a variety of animal life.The SWEIS ROD projected no significant adverse impacts to biological resources, ecological processes, orbiodiversity (including threatened and endangered species). Data collected for 2001 support this projection.These data will be reported in the 2001 Environmental Surveillance Report (<strong>LA</strong>NL 2002b).Probably the greatest natural resources management issue for <strong>LA</strong>NL in 2002 was the continuing recoveryand response to the Cerro Grande Fire of May 2000. The wildfire fuels reduction program has treated severalthousand acres of forest and woodland and will continue to operate through 20<strong>03</strong>. Burned area rehabilitationand monitoring efforts are ongoing. Vegetation and wildlife monitoring efforts are evaluating the effects of thefire and the thinning activities. <strong>LA</strong>NL personnel are developing a biological resources management plan thatwill define management objectives and actions for sustainable stewardship of our natural resources.3.10.1 Threatened and Endangered Species Habitat Management Plan<strong>LA</strong>NL’s Threatened and Endangered Species Habitat Management Plan (<strong>LA</strong>NL 1998) received US Fishand Wildlife Service concurrence on February 12, 1999. The plan is used in project reviews and to provideguidelines to project managers for assessing and reducing potential impacts to federally listed threatenedand endangered species, including the Mexican spotted owl, southwestern willow flycatcher, and baldeagle. The Threatened and Endangered Species Habitat Management Plan was incorporated into the NEPA,Cultural, and Biological Laboratory Implementation Requirement (LIR) document developed during 1999.The LIR program provides training to <strong>LA</strong>NL personnel on the proper implementation of the Threatened andEndangered Species Habitat Management Plan as part of a LIR training program.In 2002, <strong>LA</strong>NL continued to assess the effects of the Cerro Grande Fire on threatened or endangeredspecies. As reported in the 2001 Yearbook (<strong>LA</strong>NL 2002a), there is no evidence that the fire caused a longtermchange to the overall number of federally listed threatened or endangered species inhabiting the region.<strong>LA</strong>NL’s species of greatest concern, the Mexican spotted owl, resumed normal breeding activities in 2001and 2002. Some State-listed species, including the Jemez Mountains salamander, have undoubtedly been lessfortunate.3-38SWEIS Yearbook—2002
<strong>LA</strong>NL continues to operate under the original Threatened and Endangered Species Habitat ManagementPlan guidelines. Work is continuing on a habitat model of Mexican spotted owls in the Jemez Mountains.A recently completed post-fire land cover map will provide more current information on habitat types. Theresults of these projects will refine the model of Mexican spotted owl habitat requirements and will be usedto modify the Threatened and Endangered Species Habitat Management Plan and to reflect post-fire habitatchanges.<strong>LA</strong>NL expanded the migratory bird monitoring program in 2002. The expanded monitoring program willprovide better data on the distribution and abundance of migratory species on <strong>LA</strong>NL property. It will alsoallow <strong>LA</strong>NL staff to better manage these habitats and to meet obligations under the Migratory Bird Treaty Act(16 USC 7<strong>03</strong>-711).In late 2002, bark beetle infestations killed large numbers of ponderosa pine and piñon pine throughout theSouthwest, including <strong>LA</strong>NL property. In some stands, over 90 percent of the pines have died. At this timethe ecological consequences of this event can only be postulated, but with the enhanced monitoring capability,<strong>LA</strong>NL staff will be better able to evaluate effects on sensitive species in subsequent years.In 2002, the <strong>LA</strong>NL staff continued several contaminant studies and risk assessment studies of threatenedand endangered species inhabiting Laboratory lands. These studies include potential impacts from the CerroGrande Fire and involve assessing organic chemical contamination in the food chain for selected endangeredspecies and monitoring polychlorinated biphenyls and organochlorine pesticides in fish of the Rio Grande.3.10.2 Biological AssessmentsThe Laboratory reviews proposed activities and projects for potential impact on biological resourcesincluding Federal- or State-listed threatened or endangered species. These reviews evaluate and record theamount of development or disturbance at proposed construction sites, the amount of disturbance withindesignated core and buffer habitat, the potential impact to wetlands or floodplains in the project area, andwhether habitat evaluations or species-specific surveys are needed (Table 3.10.2-1).Table 3.10.2-1. Biological Resources ReviewsTOTALPROJECTREVIEWSNUMBER OFHABITATS<strong>UR</strong>VEYSREQUIREDNUMBER OFPROJECTSMODIFIED TOMEET HMP aGUIDELINESUNDEVELOPEDBUFFER AREASAFFECTED(ACRES)UNDEVELOPEDCORE HABITATAFFECTED(ACRES)TIME FRAME10/01/1999 – 12/31/2000 ~505 60 45 12 3.601/01/2001 – 12/31/2002 ~2,000 475 260 63 5.7aHMP = <strong>LA</strong>NL’s Threatened and Endangered Species Habitat Management Plan (<strong>LA</strong>NL 1998).SWEIS Yearbook—2002 3-39
During 2002, <strong>LA</strong>NL completed three biological compliance packages for projects requiring an EndangeredSpecies Act biological assessment (BA). The compliance package includes the BA, a wetlands andfloodplains assessment, a migratory birds assessment, and an assessment of state-listed species of interest.Compliance packages were written in support of the original <strong>Security</strong> Bypass Road Project (<strong>LA</strong>NL 2002c;subsequently replaced by the Access Control and Traffic Improvement Project), the Los Alamos Canyon GasLine Project (<strong>LA</strong>NL 2002d), and the Pajarito Gas Line Project (<strong>LA</strong>NL 2001e). The US Fish and WildlifeService concurred in determinations that all four projects may affect, but are not likely to adversely affect, theMexican spotted owl and the bald eagle and will have no effect on other threatened or endangered species.In addition to the compliance packages, <strong>LA</strong>NL produced four independent floodplains/wetlands assessments:for the TA 18-22 Bypass Road Project, the Disposition of the Cerro Grande Fire Flood and SedimentRetention Structure Project, the installation of a multiple permeable reactive barrier in Mortandad Canyon,and the Access Control and Traffic Improvement Project.Fleabane Daisy3-40SWEIS Yearbook—2002
3.11 References20.2.73 NMAC. New Mexico Administrative Code, Title 20 “Environmental Protection,” Chapter 2“Air Quality (Statewide),” Part 73 “Notice of Intent and Emissions Inventory Requirements.”36 CFR 800. Protection of Historic and Cultural Properties.American Indian Religious Freedom Act of 1978. 42 USC 1996 and 1996a.Archaeological Resources Protection Act of 1979. 16 USC 470aa–mm.Barr, A., 2001. “Hydrogeologic Workplan,” Los Alamos <strong>National</strong> Laboratory report <strong>LA</strong>-<strong>UR</strong>-01-6511,Los Alamos, NM.Blake, W.D., F. Goff, A.I. Adams, and D. Counce, May 1995. “Environmental Geochemistry for Surfaceand Subsurface Waters in the Pajarito Plateau and Outlying Areas, New Mexico,” Los Alamos <strong>National</strong>Laboratory report <strong>LA</strong>-12912-MS, Los Alamos, NM.Broxton, D., R. Warren, P. Longmire, R. Gilkeson, S. Johnson, D. Rogers, W. Stone, B. Newman, M. Everett,D. Vaniman, S. McLin, J. Skalski, and D. Larssen, March 2002. “Characterization Well R-25 CompletionReport,” Los Alamos <strong>National</strong> Laboratory report <strong>LA</strong>-13909-MS, Los Alamos, NM.Department of Energy, 1999. “Record of Decision: SWEIS in the State of New Mexico,” 64 FR 50797,Washington, D.C.Department of Energy, 2000. “Environmental Assessment for Electrical Power System Upgrades atLos Alamos <strong>National</strong> Laboratory, Los Alamos, New Mexico,” DOE/EA-1247, and Finding of NoSignificant Impact. Los Alamos, NM.Department of Energy, 2002a. “Environmental Assessment for Installation and Operation of CombustionTurbine Generators at Los Alamos <strong>National</strong> Laboratory, Los Alamos, New Mexico,” DOE/EA-1430,and Finding of No Significant Impact. Los Alamos, NM.Department of Energy, 2002b. “Programmatic Agreement Among the United States Department of Energy,the Advisory Council on Historic Preservation, the New Mexico State Historic Preservation Officer, andthe Incorporated County of Los Alamos, New Mexico, Concerning the Conveyance of Certain Parcels ofLand to Los Alamos County, New Mexico,” signed 5/22/02.Emergency Planning Community Right-to-Know Act. 42 USC 116 et seq.Endangered Species Act. 16 USC et seq.Lansford, R., L. Adcock, S. Ben-David, and J. Temple, 1997. “The Economic Impact of Los Alamos <strong>National</strong>Laboratory on North-Central New Mexico and the State of New Mexico Fiscal Year 1996,” New MexicoState University; prepared for the US Department of Energy.Lansford, R., L. Adcock, S. Ben-David, and J. Temple, 1998. “The Economic Impact of Los Alamos <strong>National</strong>Laboratory on North-Central New Mexico and the State of New Mexico Fiscal Year 1997,” New MexicoState University; prepared for the US Department of Energy.SWEIS Yearbook—2002 3-41
Lansford, R., L. Adcock, S. Ben-David, and J. Temple, 1999. “The Economic Impact of Los Alamos <strong>National</strong>Laboratory on North-Central New Mexico and the State of New Mexico Fiscal Year 1998,” New MexicoState University; prepared for the US Department of Energy.Longmire, P., September 2002a. “Characterization Well R-22 Geochemistry Report,” Los Alamos <strong>National</strong>Laboratory report <strong>LA</strong>-13986-MS, Los Alamos, New Mexico.Longmire, P., March 2002b. “Characterization Well R-15 Geochemistry Report,” Los Alamos <strong>National</strong>Laboratory report <strong>LA</strong>-13896-MS, Los Alamos, New Mexico.Longmire, P., June 2002c. “Characterization Well R-12 Geochemistry Report,” Los Alamos <strong>National</strong>Laboratory Report <strong>LA</strong>-13952-MS, Los Alamos, New Mexico.Longmire, P., April 2002d. “Characterization Wells R-9 and R-9i Geochemistry Report,” Los Alamos<strong>National</strong> Laboratory report <strong>LA</strong>-13927-MS, Los Alamos, NM.Los Alamos <strong>National</strong> Laboratory, 1995. “Biological and Floodplain/Wetland Assessment for the Dual-AxisRadiographic Hydrodynamics Test Facility (DARHT),” Los Alamos <strong>National</strong> Laboratory report <strong>LA</strong>-<strong>UR</strong>-95-647, Los Alamos, NM.Los Alamos <strong>National</strong> Laboratory, 1998. “Threatened and Endangered Species Habitat Management Plan,”Los Alamos <strong>National</strong> Laboratory report <strong>LA</strong>-CP-98-96, Los Alamos, NM.Los Alamos <strong>National</strong> Laboratory, 2000a. “Emissions Inventory Report Summary, Reporting Requirements forthe New Mexico Administrative Code, Title 20, Chapter 2, Part 73 for Calendar Year 1999,” Los Alamos<strong>National</strong> Laboratory report <strong>LA</strong>-13728-PR, Los Alamos, NM.Los Alamos <strong>National</strong> Laboratory, 2000b. “SWEIS Yearbook–1999,” Los Alamos <strong>National</strong> Laboratory report<strong>LA</strong>-<strong>UR</strong>-00-5520, Los Alamos, NM. (http://lib-www.lanl.gov/cgi-bin/getfile?<strong>LA</strong>-<strong>UR</strong>-00-5520.htm).Los Alamos <strong>National</strong> Laboratory, 2000c. “Surface Water Data at Los Alamos <strong>National</strong> Laboratory: 2000Water Year,” Los Alamos <strong>National</strong> Laboratory report <strong>LA</strong>-13814-PR, Los Alamos, NM.Los Alamos <strong>National</strong> Laboratory 2000d. “Comprehensive Site Plan 2000, Technical Site InformationDocument,” Los Alamos <strong>National</strong> Laboratory report <strong>LA</strong>-<strong>UR</strong>-99-6704, Los Alamos, NM.Los Alamos <strong>National</strong> Laboratory, 2000e. “A Comprehensive Plan for the Consideration of TraditionalCultural Properties and Sacred Sites at Los Alamos <strong>National</strong> Laboratory, New Mexico,” Los Alamos<strong>National</strong> Laboratory document <strong>LA</strong>-<strong>UR</strong>-00-2400, Los Alamos, NM.Los Alamos <strong>National</strong> Laboratory, 2001a. “Emissions Inventory Report Summary, Reporting Requirements forthe New Mexico Administrative Code, Title 20, Chapter 2, Part 73 for Calendar Year 2000,” Los Alamos<strong>National</strong> Laboratory report <strong>LA</strong>-13850-PR, Los Alamos, NM.Los Alamos <strong>National</strong> Laboratory, 2001b. “SWEIS Yearbook—2000,” Los Alamos <strong>National</strong> Laboratory report<strong>LA</strong>-<strong>UR</strong>-01-2965, Los Alamos, NM. (http://lib-www.lanl.gov/la-pubs/00818189.pdf)Los Alamos <strong>National</strong> Laboratory, 2001c. “Environmental Surveillance at Los Alamos During 2000,” LosAlamos <strong>National</strong> Laboratory report <strong>LA</strong>-13979-ENV, Los Alamos, NM.Los Alamos <strong>National</strong> Laboratory, 2001d. “FY01 Ten Year Comprehensive Site Plan,” Los Alamos <strong>National</strong>Laboratory document <strong>LA</strong>-CP-01-374, Los Alamos, NM.3-42SWEIS Yearbook—2002
Los Alamos <strong>National</strong> Laboratory, 2001e. “Biological Assessment: The Potential Effects of the PajaritoGas Line Construction on Federally Listed Threatened and Endangered Species,” Los Alamos <strong>National</strong>Laboratory report <strong>LA</strong>-<strong>UR</strong>-00-4739, Los Alamos, NM.Los Alamos <strong>National</strong> Laboratory 2002a. “SWEIS Yearbook—2001,” Los Alamos <strong>National</strong> Laboratory report<strong>LA</strong>-<strong>UR</strong>-02-3143, Los Alamos, NM. (http://lib-www.lanl.gov/cgi-bin/getfile?00818857.pdf).Los Alamos <strong>National</strong> Laboratory, 2002b. “Environmental Surveillance at Los Alamos during 2001,”Los Alamos <strong>National</strong> Laboratory report <strong>LA</strong>-13979-ENV, Los Alamos, NM.Los Alamos <strong>National</strong> Laboratory, 2002c. “Biological Assessment: The Potential Effects of the Bypass RoadConstruction on Federally Listed Threatened, Endangered, and Sensitive Species,” Los Alamos <strong>National</strong>Laboratory report <strong>LA</strong>-CP-02-324, Los Alamos, NM.Los Alamos <strong>National</strong> Laboratory, 2002d. “Biological Assessment: The Potential Effects of the Los AlamosCanyon Gas Line Construction on Federally Listed Threatened, Endangered, and Sensitive Species,”Los Alamos <strong>National</strong> Laboratory report <strong>LA</strong>-<strong>UR</strong>-02-914. Los Alamos, NM.Los Alamos <strong>National</strong> Laboratory, in preparation. “Environmental Surveillance at Los Alamos during 2002,”Los Alamos <strong>National</strong> Laboratory report in preparation, Los Alamos, NM.Migratory Bird Treaty Act. 16 USC 7<strong>03</strong>–711.McLin, S.G., W.D. Purtymun, M.N. Maes, and P.A. Longmire, 1997. “Water Supply at Los Alamos during1996,” Los Alamos <strong>National</strong> Laboratory report <strong>LA</strong>-13371-PR, Los Alamos, NM.McLin, S.G., W.D. Purtymun, and M.N. Maes, 1998. “Water Supply at Los Alamos during 1997,”Los Alamos <strong>National</strong> Laboratory report <strong>LA</strong>-13548-PR, Los Alamos, NM.<strong>National</strong> Historic Preservation Act. 16 USC 470 et seq.Native American Graves Protection and Repatriation Act of 1990. 25 USC 3001 et seq.Nylander, C.L., K.A. Bitner, G. Cole, E.H. Keating, S. Kinkead, P. Longmire, B. Robinson, D.B. Rogers,and D. Vaniman, 20<strong>03</strong>. “Groundwater Annual Status Report for Fiscal Year 2002,” Los Alamos <strong>National</strong>Laboratory report <strong>LA</strong>-<strong>UR</strong>-<strong>03</strong>-0244, Los Alamos, NM.<strong>National</strong> Environmental Policy Act of 1969. 42 USC 4321 et seq.Resource Conservation and Recovery Act of 1976. 42 USC 6901 et seq.SWEIS Yearbook—2002 3-43
Wetland in Mortandad Canyon3-44SWEIS Yearbook—2002
4.0 Trend AnalysisBeginning in 1999 the Yearbook included a new chapter that examined trends by comparing actual <strong>LA</strong>NLoperating conditions to SWEIS ROD projections. Where the 1999 Yearbook was restricted to waste data,subsequent Yearbooks also included land use and utilities information. Additional information has been addedin this edition of the Yearbook so that SWEIS ROD projections can be applied to a wider range of data. Manyof these comparisons are qualitative due to the nature of the data collected. The purpose of these additionalcomparisons is to allow a more comprehensive review of the SWEIS projections compared to actual <strong>LA</strong>NLoperating parameters over the years in which data were available, usually about five years.In preparing this chapter, it became obvious that not all data collected lend themselves to this type ofanalysis. First, some data consist mostly of estimates (i.e., historical NPDES outfall flows) where variationsbetween years may be nothing more than an artifact of the methodology used to make estimates. These datadid not depict environmental risk, and any evaluation between years would be meaningless. Second, somedata were so far below SWEIS ROD projections (i.e., air quality and high explosive production), that evensignificant increases in measured quantities would not cause <strong>LA</strong>NL to exceed the risks evaluated in theSWEIS, and such a comparison would have served no practical purpose for the development of a SWEIS inthe future. Finally, some data did not represent site impacts, were inherently variable, and did not representutilization of onsite natural resources (i.e., ER Project exhumed material shipped offsite).The data conducive to numerical analysis represent real numbers of two distinct types. First, data thatdemonstrate cumulative effects across years where summed quantities could approach or exceed SWEIS RODprojections or regulatory limits or create negative environmental impacts (e.g., waste disposed at <strong>LA</strong>NL).Or, second, data that represent, on an annual basis, measured quantities that approach limits established byagreement and/or regulation (i.e., gas, electric, and water consumption). Specific factors that influenced thenumerical values are found in previous Yearbooks and in Chapter 3 of this Yearbook. Where quantitativecomparisons are not appropriate, this chapter attempts to summarize the relationship of <strong>LA</strong>NL’s operations tothe SWEIS projections qualitatively.4.1 Air EmissionsAir emissions continue to be within regulatory limits. <strong>LA</strong>NL continues to be in compliance with air qualitystandards and the region continues to be an attainment area for air quality under the Clean Air Act.4.1.1 Radioactive Air EmissionsThe SWEIS projected annual radioactive stack emissions for <strong>LA</strong>NL at 21,700 curies per year. Since 1998<strong>LA</strong>NL’s radioactive stack emissions have not exceeded 15,400 curies in a single year (see Table 3.1.1-1).<strong>LA</strong>NSCE, the largest contributor to <strong>LA</strong>NL radioactive stack emissions, has consistently emitted fewer curiesof radioactive material than was projected by the SWEIS. Consequently <strong>LA</strong>NL is still operating within theparameters that the SWEIS analyzed (Figure 4-1). This is likely due to the conservative nature of the SWEISprojections and to a lower level of operations than was considered in the SWEIS.Tritium emissions are the largest contributor to <strong>LA</strong>NL’s overall radioactive emissions (see Table 3.1.1-1).Tritium emissions from Key Facilities have, with one exception (2001), also been within the projections ofthe SWEIS. The single exception was a one-time release of 7,600 curies. The effect of this single release hasbeen to raise the average annual emissions of tritium to about 25 percent above the SWEIS projections. If thissingle event is deducted from the tritium emissions for 2001, tritium emissions from Key Facilities are lessthan half what the SWEIS projected (Figure 4-2). The SWEIS parameter for tritium emissions from the Non-Key Facilities is 910 curies per year based on the index year of 1994 (SWEIS Table 3.6.1-31). The averageannual emissions of tritium from Non-Key Facilities has exceeded that value slightly in three of the fourSWEIS Yearbook—2002 4-1
years for which data were reported; however, the average annual tritium emissions from Non-Key Facilities isbelow the SWEIS parameter.The SWEIS projected the maximum offsite dose to a member of the public at 5.44 millirem per year. Inthe period from 1998 to 2002, the actual dose has been lower than projected (see Table 3.1.1-2) and has notapproached the EPA dose standard of 10 millirem per year (Figure 4-3).4.1.2 Nonradioactive Air EmissionsThe Los Alamos area continues to be an attainment area for criteria air pollutants under the Clean Air Act.With few exceptions, annual emissions of criteria air pollutants from <strong>LA</strong>NL operations from 1998 to 2002remained within SWEIS projections for all four categories (carbon monoxide [Figure 4-4], NO x[Figure 4-5],particulate matter [Figure 4-6], and SO x[Figure 4-7]) (see Table 3.1.2.1-1). During the Cerro Grande Fire in2000, the steam plant burned fuel oil, significantly increasing the emissions of SO x. This event is not typicalof <strong>LA</strong>NL operations. In 2002, the use of air curtain destructors to dispose of trees thinned as part of the CerroGrande Rehabilitation Project resulted in higher than projected quantities of particulates and SO x. Emissionsof these two pollutants will remain higher than SWEIS projections while extensive tree thinning continuesin 20<strong>03</strong>. At the conclusion of the large-scale tree thinning, the emissions levels should drop to levels morein line with SWEIS projections. Nitrogen oxide emissions have decreased during CY 2002 due to theinstallation of flue gas recirculation equipment and to the transfer of the water pump to Los Alamos County.However, it is expected that there will an increase in NO xemissions in 2004 or 2005 when the TA-<strong>03</strong> PowerPlant begins operation of the new combustion turbine generator.Since the SWEIS reported chemical emissions (volatile organic compounds and hazardous air pollutants)as concentrations, the data cannot be directly compared to data reported in the Yearbook. Total emissions ofvolatile organic compounds and hazardous air pollutants (see Table 3.1.2.2-1) show considerable variationover the last four years (Figure 4-8). Use of the air curtain destructors accounted for substantial increases inboth volatile organic compounds and hazardous air pollutants in 2002. As the Cerro Grande RehabilitationProject completes tree thinning and removal, emissions of volatile organic compounds and hazardous airpollutants should return to lower levels more typical of pre-fire conditions.25,00020,00015,00010,0005,000RadioactiveEmissions0Figure 4-1. Total radioactive emissions from point sources.4-2SWEIS Yearbook—2002
14,00012,00010,0008,0006,0004,0002,000Tritium Emissions from TritiumKey Facilities' Stacks0Figure 4-2. Tritium Emissions from Tritium Key Facilities’ Stacks.SWEISMaxiumOffsite DoseFigure 4-3. Maximun offsite dose.SWEIS Yearbook—2002 4-3
Figure 4-4. Carbon monoxide emissions.Figure 4-5. Emissions of nitrogen oxides.Figure 4-6. Particulate matter emissions.4-4SWEIS Yearbook—2002
Figure 4-7. Emissions of sulfur oxides.Hazardous AirPollutantsVolatile OrganicCompoundsFigure 4-8. Emissions of volatile organic compounds and hazardous air pollutants.4.2 Surface Water QualityThe number of permitted outfalls at <strong>LA</strong>NL has decreased from 88 at the end of 1996 to 21 in 2002(Appendix D). As a result of these closures, there has been an overall 44 percent decrease in flow over 1999levels. Currently flow is about 64 percent of the level projected by the SWEIS. There was considerableuncertainty in both the SWEIS estimates and in the pre-2001 annual outfall volume estimates, when <strong>LA</strong>NLbegan to measure rather than estimate flows. All of the watersheds at <strong>LA</strong>NL, however, have had a decline inoutfall volume to some degree since 1999, in part due to outfall closures. Discharges into Mortandad Canyonhave decreased about 20 percent (7.9 million gallons per year) since 1999; outfall discharges into WaterCanyon have decreased about 99 percent (about 12.9 million gallons per year) since 1999; Sandia Canyonoutfall discharges have decreased by about half (105 million gallons per year) since 1999; and Los AlamosCanyon discharges have declined about 19 percent (about 8.4 million gallons per year) since 1999. In somewatersheds, increased runoff resulting from the Cerro Grande Fire has produced greater than normal flowsdespite the closure of outfalls.SWEIS Yearbook—2002 4-5
The SWEIS assumed that reducing outfall volumeswould result in improved surface water qualitysince fewer contaminants would be discharged. Italso assumed that water treatment improvementsat the RLWTF and at the TA-16 HEWTF wouldcontribute to higher surface water quality. TheRLWTF, the HEWTF, and <strong>LA</strong>NSCE outfalls areprimary contributors to the local watersheds; all havesubstantially reduced effluent volumes (Figure 4-9). In addition, flows from the Sanitary WastewaterTreatment Facility at TA-46 and from the power plantat TA-<strong>03</strong> discharge substantial volumes of water thatfeed Sandia Canyon and the Sandia Canyon wetland.<strong>LA</strong>NL effluent discharges by facility are listed inTable 3.2-4. The RLWTF discharges into MortandadCanyon. The RLWTF outfall discharge has decreasedabout 52 percent—from 6.1 million gallons in 1998 to2.92 million gallons in 2002. The HEWTF dischargesinto Water Canyon; the high explosive processingExamining sediment in a streambedfacilities have reduced liquid effluent from 17.1million gallons in 1998 to 0.<strong>03</strong> million gallons in2002—a decrease of about 99.8 percent. <strong>LA</strong>NSCE discharges have decreased from 53.4 million gallons in1998 to 24.04 in 2002. <strong>LA</strong>NSCE discharges primarily into Sandia Canyon and Los Alamos Canyon. <strong>LA</strong>NLis currently developing a treatment facility to remove dissolved and suspended solids from effluent from theTA-<strong>03</strong> power plant and from the Sanitary Wastewater Treatment Facility. The water will then be reused incooling towers before discharge. This treatment process and water reuse is expected to result in about a 20percent decrease in effluent flow into Sandia Canyon.The SWEIS identified several areas where the level of contaminants, such as nitrates (which are regulatedby the NPDES) in RLWTF effluent, would be reduced. The SWEIS also projected that outfall effluent qualitywould be similar to the baseline conditions or would improve. <strong>LA</strong>NL’s Environmental Surveillance ReportsHigh ExplosivesProcessing<strong>LA</strong>NSCERLWTFFigure 4-9. NPDES discharges by facility.4-6SWEIS Yearbook—2002
for 1998 to 2001 (<strong>LA</strong>NL 1999a, 2000, 2001, and 2002a) show that outfall quality is within the parametersidentified. In particular, nitrate concentrations in the RLWTF outfalls have been within NPDES limits since1998.4.3 Solid Radioactive and Chemical WastesWastes have been generated at levels below quantities projected by the SWEIS ROD with the exception ofER Project chemical wastes. For three of the last five years, ER Project wastes (see Table 3.3.2-1) have beengenerated at levels at least seven times the SWEIS projection. ER Project wastes are typically shipped offsitefor disposal at EPA-certified waste treatment, storage, and disposal facilities and do not impact local environs.These wastes result from exhumation of materials placed into the environment during the early history of<strong>LA</strong>NL and thus differ from the newly created wastes from routine operations. Figure 4-10 compares theannual <strong>LA</strong>NL chemical waste generation to the SWEIS ROD projections.Thousands of Kilograms30,00025,00020,00015,00010,0005,0000Figure 4-10. <strong>LA</strong>NL chemical waste generation.As a result of the uncertainty in ER Project waste estimates, the Yearbook presents totals for <strong>LA</strong>NL wastegeneration both with and without the ER Project. As shown in tables in Section 3.3, except for chemicalwastes, total generated amounts fall within projections made by the SWEIS ROD. This Yearbook alsopresents total volumes of solid sanitary waste for the first time.Technical Area 54SWEIS Yearbook—2002 4-7
Sanitary Waste<strong>LA</strong>NL sanitary waste generation and transfer of waste to the Los Alamos County Landfill has variedconsiderably over the last decade, with a peak (more than 14,000 tons) transferred to the landfill in 2000that is probably due to removal of Cerro Grande Fire debris. The SWEIS estimated that <strong>LA</strong>NL disposedof approximately 4,843 tons of waste at the Los Alamos County Landfill between July 1995 and June 1996(DOE 1999). This estimate may have not been representative of <strong>LA</strong>NL’s sanitary waste disposal over thelong term.<strong>LA</strong>NL has instituted an aggressive waste minimization and recycling program that has reduced theamount of waste disposed in sanitary landfills. <strong>LA</strong>NL’s Material Recovery Facility, which is used toseparate recyclable items from other waste in trash dumpsters, now recovers about 40 percent of this wastefor recycling. Other recycling initiatives include cardboard and paper recycling, a pilot concrete crushingoperation, construction debris sorting, uncontaminated soil fill reuse, brush mulching, and metal and plasticrecycling (<strong>LA</strong>NL 2002b).<strong>LA</strong>NL performance goals for sanitary waste reduction are based on waste generation in 1993. <strong>LA</strong>NL’stotal waste generation can be classified as routine and nonroutine. The waste can also be categorized asrecyclable and nonrecyclable. Table 4.3-1 shows <strong>LA</strong>NL sanitary waste generation for FY 2002. Compared to1993, <strong>LA</strong>NL has increased the recycled portion of sanitary waste from about 10 percent in 1993 to about 34percent in FY 1999 and to approximately 70 percent in FY 2002.Table 4.3-1. <strong>LA</strong>NL Sanitary Waste Generation in FY 2002 (metric tons)ROUTINENONROUTINETOTALRecycled 1,425 5,938 7,363Landfill disposal 1,822 1,388 3,210Total 3,247 7,326 10,573Routine sanitary waste consists mostly of food and food-contaminated waste, paper, plastic, wood, glass,styrofoam packing material, old equipment, and similar items. <strong>LA</strong>NL’s per capita generation of routinesanitary waste fell from 265 kilograms per person per year in 1993 to 163 kilograms per person per year in2001, equivalent to a 39 percent decrease in routine waste generation (<strong>LA</strong>NL 2002b).Nonroutine sanitary waste is typically derived from construction and demolition projects. The CerroGrande Rehabilitation Project also generated large quantities of nonroutine waste as a result of variouscleanup activities. In general, construction and demolition waste is the largest single component of thesanitary waste stream and constitutes virtually all of the current nonroutine sanitary waste generation. UntilMay 1998, construction debris was used as fill to construct a land bridge between two areas of <strong>LA</strong>NL;however, environmental and regulatory issues resulted in this activity being halted. Construction of newfacilities and demolition of old facilities are expected to continue to produce substantial quantities of this typeof waste. In FY 2002, approximately 82 percent of the uncontaminated construction and demolition wastewas recycled (<strong>LA</strong>NL 2002b). The portion of construction debris that is recycled is expected to remain thesame or to increase in the future.The SWEIS projected that the Los Alamos County Landfill would not reach capacity until about 2014. In2002, NMED issued a 35-year permit for operation of the current landfill—five years of additional disposalof waste and 30 years of post-closure operation. Therefore, the existing landfill will no longer accept wasteafter 2007. Currently NNSA is preparing an environmental assessment of the effects of locating a new landfillwithin <strong>LA</strong>NL boundaries. Other waste disposal alternatives may also be evaluated.4-8SWEIS Yearbook—2002
Chemical WasteWaste projections for the ER Project by the SWEIS ROD are uncertain at best. These projections weredeveloped in the 1996–1997 time period. Estimates were based on the then current Installation Work Planmethodology. The ER Project office kept a continuously updated database of waste projections by waste typefor each PRS. Estimates were made for the amount of waste expected to be generated by that PRS for thelife of the ER Project. In 1996–1997, it was assumed that the life of the ER Project would be 10 years, butthe schedule now projects cleanup will extend to 2020. This demonstrates the legitimate uncertainty in wasteestimates and schedules developed for the ER Project caused by changing requirements and refined wastecalculations as additional data were gathered.One task of the ER Project is to characterize sites about which little is known and to make adjustments inwaste quantity estimates based on new information. In addition, even the most rigorous field investigationscannot truly determine waste quantities with a high degree of certainty until remediation has progressedconsiderably. Remediation can often create more or less waste, or waste that was not anticipated, based onfield sampling. Moreover, the administrative authority may not approve a no further action recommendationor may require additional sampling or an alternative corrective action than the one planned. All of thesefactors lead to waste projections that are highly uncertain.An example of the latter is MDA-P. The first closure plan for MDA-P was submitted to EPA, and laterNMED, in the early 1980s. This plan proposed closure in place, but was never approved. During the mid- tolate-1980s, all parties (<strong>LA</strong>NL, DOE, EPA, and NMED) decided that clean-closure was a more appropriatestandard and the plan was rewritten to reflect risk-based clean-closure. All information in the closure plan,including waste estimates, was based on best available information (a combination of operating group recordsand data from field investigations). However, when remediation started, it quickly became apparent that earlyinformation was not reliable, and that there would be more waste generated than originally anticipated. TheER Project clean closure of MDA-P began on November 17, 1997, and Phase I (i.e., waste management,handling, and disposal) and Phase II (i.e., confirmatory sampling) activities completed by April 2002. A totalof 20,812 cubic yards of hazardous waste and 21,354 cubic yards of other waste were excavated and shippedto a disposal facility. A total of 6,600 cubic yards were shipped and used as clean fill at MDA-J.Chemical waste quantities are higher than projections for two reasons: ER Project cleanup activitiesduring 1999, 2000, and 2001 and the Legacy Materials Cleanup Project during 1998. The variability in ERProject waste projections is discussed above. The Legacy Materials Cleanup Project, completed in September1998, required facilities to locate and inventory all materials for which a use could no longer be identified.All such materials (more than 22,000 items) were characterized, collected, and managed. In 1999, the Non-Key Facilities also exceeded projections, and this was attributed to ER Project cleanups of PRSs within theNon-Key Facilities. When comparing the subtotal of Key and Non-Key Facilities, only the Legacy Programin 1998 pushes the quantities over SWEIS ROD projections. Regardless, these wastes (both ER and LegacyProgram) were and are shipped offsite, do not impact the local environs, and do not hasten the need to expandthe size of Area G. High amounts of chemical waste at Non-Key Facilities are mostly due to new constructionand some expanded operations.SWEIS Yearbook—2002 4-9
Low-Level Waste<strong>LA</strong>NL generation of LLW (see Table 3.3.3-1) is generally below that projected in the SWEIS ROD (Figure4-11). Although data from 2002 show that SWEIS projections were exceeded by both the Non-Key Facilitiesand the ER Project, total waste volumes remain within SWEIS projections.Figure 4-11. <strong>LA</strong>NL low-level waste generation.Mixed Low-Level WasteTable 3.3.4-1 shows a significant increase in MLLW in 2000. The total <strong>LA</strong>NL MLLW volume for 2000was 598 cubic meters; 575 cubic meters of that came from the MDA-P cleanup. Waste generation returnedto more typical levels in 2001 and 2002. Even with the noticeable increase in 2000, the generation of MLLWremains within SWEIS projections (Figure 4-12).Figure 4-12. <strong>LA</strong>NL mixed low-level waste generation.4-10SWEIS Yearbook—2002
TRU and Mixed TRUDespite the expected slow, but increasing, levels of activity on pit production and related programs,generation of TRU (see Table 3.3.5-1) and mixed TRU waste (see Table 3.3.6-1) remained within theprojections of the SWEIS ROD (Figures 4-13 and -14). Increasing levels of effort in the pit productionprogram and related programs are expected to result in increasing quantities of these waste types in the nearfuture but are not expected to exceed SWEIS projections. <strong>LA</strong>NL’s Offsite Source Recovery (OSR) Programhas generated TRU waste that is considered to be a waste from Non-Key Facilities. The SWEIS did notanticipate TRU waste generation from Non-Key Facilities. A separate NEPA review was conducted for theOSR Program and the effects of implementing the program were determined to be bounded by the SWEISimpact analysis (DOE 2000).Figure 4-13. <strong>LA</strong>NL transuranic waste generation.Figure 4-14. <strong>LA</strong>NL mixed transuranic waste generation.SWEIS Yearbook—2002 4-11
4.4 Utility ConsumptionConsumption of these commodities is restricted by contract. Utility usage is compared to the SWEIS RODprojections of annual use. Section 3.4 presents these three sets of data (gas [see Table 3.4.1-1], electricity[see Tables 3.4.2-1 and 3.4.2-2], and water [see Table 3.4.3-1]) and demonstrates that none of these measuredutilities exceeded SWEIS ROD projections, except for natural gas in 1993, which is before the 10-yearwindow evaluated by the SWEIS ROD. Based on these data, it appears that utility usage remains within theSWEIS ROD environmental envelope for operations (Figures 4-15, -16, -17, and -18).1991 1992 1993 1994 1995 1996 1997 1998 1999 2000 2001 2002Figure 4-15. <strong>LA</strong>NL natural gas consumption.Megawatts/hourMegawatts1991 1992 1993 1994 1995 1996 1997 1998 1999 2000 2001 2002Figure 4-16. <strong>LA</strong>NL electric consumption.4-12SWEIS Yearbook—2002
1991 1992 1993 1994 1995 1996 1997 1998 1999 2000 2001 2002Figure 4-17. <strong>LA</strong>NL electric peak coincident demand.Thousands ofGallons1992 1993 1994 1995 1996 1997 1998 1999 2000 2001 2002Figure 4-18. <strong>LA</strong>NL water consumption.4.5 Worker SafetyThe SWEIS ROD projected 507 reportable occupational injuries (TRI) per year. Despite a small increasein 2002 in TRI and lost workday cases (LWC), the 2002 data represent about half of the projected reportableinjuries in the SWEIS ROD (see Table 3.5.1-1). The overall trend has been downward since 1996 (Figures4-19 and -20).Radiological exposures to <strong>LA</strong>NL workers (see Table 3.5.2-1) are well within the levels projected by theSWEIS ROD (Figure 4-21). There is considerable variation from year to year but in no case are the dosesmore than one-third the SWEIS projected level. Likewise the number of workers with nonzero doses remainsbelow the SWEIS projection, typically half or less the number projected.SWEIS Yearbook—2002 4-13
TRI(UC Workers Only)TRI(All Workers)Figure 4-19. Total recordable injuries at <strong>LA</strong>NL.LWC(UC Workers Only)LWC(All Workers)Figure 4-20. Lost workday case rates at <strong>LA</strong>NL.Figure 4-21. Radiological exposure to <strong>LA</strong>NL workers.4-14SWEIS Yearbook—2002
4.6 SocioeconomicsThe SWEIS ROD projected a workforce (UC and contractors) of 8,740 persons (see Table 3.6-1). Since1996 the size of the workforce has increased steadily. Currently, it exceeds the SWEIS projection by nearly1,200 persons (an increase of about 14 percent). The expected result of this increase is a somewhat greaterpositive impact on the economy of northern New Mexico.4.7 Land ResourcesLand use at <strong>LA</strong>NL is a high-priority issue. Most of the undeveloped land is either required as buffer zonesfor operations or is unsuitable for development. Therefore, loss of available lands through developmentor Congressionally mandated land transfer has a significant impact on strategic planning for operations.Conversely, increases in available lands through cleanups performed by the ER Project and demolition ofvacated buildings also affect strategic planning. To date, however, the ER Project has not significantly addedto available land.In 2002, the first of the Congressionally mandated conveyance of land to the County of Los Alamos andtransfer to the Pueblo of San Ildefonso were accomplished. These disbursals effectively removed 2,209 acresfrom <strong>LA</strong>NL and made them unavailable for <strong>LA</strong>NL operational uses.The SWEIS ROD did not anticipate any significant effects on land use. Land uses within <strong>LA</strong>NLboundaries have not changed substantially since the SWEIS was issued (see Table 3.7.5-1) and are notexpected to change in the next few years. Future development will be consistent with <strong>LA</strong>NL’s CSP2000(<strong>LA</strong>NL 1999b), which guides <strong>LA</strong>NL land development.Results of tree-thinning effort along Pajarito RoadSWEIS Yearbook—2002 4-15
Though construction and modification often result in substantial loss of greenfields (previouslyundeveloped areas), this has not been the case for the period 1998–2002. For this Yearbook, the amountof greenfield and brownfield (previously developed areas) development was estimated using geographicinformation system data relating to <strong>LA</strong>NL’s larger ground-disturbing projects. The estimates do notinclude small facility projects, such as installing short utility lines. Nor do they include emergencyactivities performed during the Cerro Grande Fire, such as cutting firebreaks. Although the Cerro GrandeRehabilitation Project thinned trees over a large portion of <strong>LA</strong>NL, both greenfield and brownfield areas, thebasic character (greenfield or brownfield) was not altered by these actions.<strong>LA</strong>NL’s major projects between 1998 and 2002 have affected or will affect (in some cases, actualconstruction has not begun) about 247 acres. About 117 acres of greenfield (about 30 acres attributable tothe Research Park) have been developed or proposed for development; the remaining 120 acres consist ofbrownfield areas. Most of the greenfield development consists of installation of monitoring wells and newutilities and creation of short access roads. Cerro Grande Rehabilitation Projects, such as the Flood RetentionStructure in Pajarito Canyon, also contributed significantly to the total.Future construction at <strong>LA</strong>NL is incorporated in various facility strategic plans. A common componentof these plans is consolidation of dispersed activities into central areas. As a result, future constructionwill frequently be concentrated in areas that are already developed or are adjacent to developed areas, thusreducing future greenfield loss.Conceptual design of the proposed DX Complex4-16SWEIS Yearbook—2002
4.8 GroundwaterThe SWEIS ROD projected that <strong>LA</strong>NL operations would have a negligible effect on groundwateravailability and quality but acknowledged that more information about the regional aquifer system wasneeded. The SWEIS projected an onsite drawdown in the level of the main aquifer of about 15.6 feet.Drawdown of aquifers remains a regional concern. However, the decline is gradual, typically about one totwo feet per year with most production wells exhibiting recovery within 6 to 12 months after pumping stops.The SWEIS projected that trace levels of tritium would continue to be found in groundwater. Trace levelsof tritium continue to be found in monitoring wells, as well as some perchlorates, nitrates, high explosivesconstituents, uranium, and other contaminants in the perched or regional aquifers (see Table 3.8-1). Althougha number of regional water monitoring wells have been drilled over the last few years, there are stilluncertainties about the quality and quantity of groundwater. It is expected that these uncertainties will beresolved as additional data are gathered from the network of monitoring wells.Sampling and analysis of water from production wells indicate that the water in the regional aquifer belowthe Pajarito Plateau is of high quality and meets or exceeds all applicable water quality standards. Therefore,the SWEIS projections of groundwater quality and quantity still bound existing groundwater conditions asthey are currently understood.4.9 Cultural ResourcesCultural resources surveys, particularly those conducted after the Cerro Grande Fire, have increasedthe number of cultural properties identified at <strong>LA</strong>NL (see Table 3.9-1). The area of <strong>LA</strong>NL that has beensystematically surveyed has increased from 17,937 acres in 1998 (about 64 percent) to 22,476 acres (88percent of <strong>LA</strong>NL’s remaining area after 2002 land transfers) in 2002. Post-fire conditions also enhanced theidentification of low-visibility sites. Thus the number of known cultural properties has increased from 1,369in 1998 to 1,835 in 2002. The increase in acreage surveyed and properties identified does not affect anySWEIS projection.TA-8 Gun Site, a Manhattan Project Era buildingSWEIS Yearbook—2002 4-17
<strong>LA</strong>NL has also increased the inventory of historic buildings dating to the Manhattan Project and Cold Warperiod. At the same time, <strong>LA</strong>NL has begun to replace these older buildings with modern facilities. Sinceabout 1995, 42 historic buildings have been documented and a number of them have been demolished. Asplans for consolidated operations, infrastructure upgrades, and facility modernization proceed in accordancewith <strong>LA</strong>NL’s CSP2000 and various facility strategic plans, more of the historic buildings will be demolished.The SWEIS ROD, which projected limited new construction, did not address the effects of historic buildingdemolition.4.10 Ecological ResourcesThe SWEIS stated that <strong>LA</strong>NL’s planned activities would enhance biological resources. Under the HabitatManagement Plan (<strong>LA</strong>NL 1998), <strong>LA</strong>NL operations are evaluated against specified criteria to protect sensitivespecies. Since 1999 <strong>LA</strong>NL has evaluated approximately 2,500 projects for compliance with the HabitatManagement Plan. About 305 projects were modified to meet Plan criteria. A few projects could not bemodified to meet these criteria and were independently reviewed by the US Fish and Wildlife Service. Someof these projects are still in the planning stages; others have been completed. Approximately 24.6 acres ofundeveloped core habitat and 37.8 acres of undeveloped buffer zone would be affected by these projects.The Habitat Management Plan restricts new development within the buffer zone to 25 percent of each Areaof Environmental Interest buffer. <strong>LA</strong>NL projects typically would affect, or have affected, less than 2 percentof a given Area of Environmental Interest.The SWEIS identified approximately 50 acres of wetlands within <strong>LA</strong>NL. Thirteen acres of these wetlandsare supported in whole or in part by effluent from <strong>LA</strong>NL outfalls. With the reductions in effluent flow notedin Section 4.2, the total area of wetlands is less than what it was when the SWEIS was prepared. The effect ofclosing or reducing effluent flow on these 13 acres of wetlands was assessed in the Environmental Assessmentfor the Outfall Reduction Program (DOE 1996). The environmental assessment determined that the potentialloss of the affected wetlands was not significant. The actual reduction in wetland area has not been verifiedby field study.Cerro Grande Fire survivorWetland in Pajarito Canyon4-18SWEIS Yearbook—2002
4.11 Visual ResourcesThe SWEIS identified some existing adverse visual resources conditions, specifically the austere andindustrial character of many <strong>LA</strong>NL buildings, incompatible building styles at TA-<strong>03</strong>, and highly visible tallstructures that disrupted panoramic views. The SWEIS projected that, in addition to these continuing visualconditions, certain new construction and associated lighting (a possible waste disposal facility at TA-67 and anew road from TA-<strong>03</strong> to TA-55) would have minor effects on visual resources. However, these projects werenot selected in the SWEIS ROD.Several new construction projects, not anticipated by the SWEIS, have been completed or are underdevelopment. Construction at TA-<strong>03</strong> has reduced the number of incompatible building styles and will provideadditional landscaping to create a more unified visual environment. Construction in other areas, such as TA-16, is enabling the removal of some of the austere industrial buildings that the SWEIS identified as adversevisual resources conditions. Other buildings will be refurbished and surface treatments applied so that there isgreater architectural consistency. Landscaping will also reduce the industrial character of these areas.None of the tallest buildings in the <strong>LA</strong>NL viewscape have been removed but several are slated fordemolition. The new <strong>National</strong> <strong>Security</strong> Sciences Building, the replacement for Building TA-<strong>03</strong>-46 that maybe several stories high, is likely to be visible in the viewshed but it will be compatible with recent constructionin the TA-<strong>03</strong> area. Radio towers have been erected and are visible from some distance but due to their color,they blend to some extent with the background. Because lighting associated with new construction willcomply with the New Mexico Night Sky Protection Act, there should not be any substantial degradationof night sky conditions. As a consequence, <strong>LA</strong>NL operations have remained and should remain within theSWEIS projections.4.12 Long-Term EffectsTo date, <strong>LA</strong>NL has continued to operate within the projections made by the SWEIS ROD. None of themeasured parameters exceed SWEIS ROD projections or regulatory limits. Thus, long-term effects shouldremain within the projections made by the SWEIS ROD.SWEIS Yearbook—2002 4-19
4.13 ReferencesClean Air Act. 42 USC 7401 et seq.Department of Energy, 1996. “Environmental Assessment for the Outfall Reduction Program,”DOE/EA-1156, Albuquerque, NM.Department of Energy, 1999. “Site-Wide Environmental Impact Statement for Continued Operation of theLos Alamos <strong>National</strong> Laboratory,” DOE/EIS-0238, Albuquerque, NM.Department of Energy, 2000. “Modification of Management Methods for Certain Unwanted RadioactiveSealed Sources at Los Alamos <strong>National</strong> Laboratory.” Supplement Analysis, Final Site-WideEnvironmental Impact Statement for the Continued Operation of Los Alamos <strong>National</strong> Laboratory.Los Alamos Area Office, October 17, 2000.Los Alamos <strong>National</strong> Laboratory, 1998. “Threatened and Endangered Species Habitat Management Plan,”Los Alamos <strong>National</strong> Laboratory report <strong>LA</strong>-CP-98-96, Los Alamos, NM.Los Alamos <strong>National</strong> Laboratory, 1999a. “Environmental Surveillance at Los Alamos during 1998,”<strong>LA</strong>-13633-ENV, Los Alamos, NM.Los Alamos <strong>National</strong> Laboratory, 1999b. “Comprehensive Site Plan 2000 (Draft),” Los Alamos, NM.Los Alamos <strong>National</strong> Laboratory, 2000. “Environmental Surveillance at Los Alamos during 1999,”Los Alamos <strong>National</strong> Laboratory report <strong>LA</strong>-13775-ENV, Los Alamos, NM.Los Alamos <strong>National</strong> Laboratory, 2001. “Environmental Surveillance at Los Alamos during 2000,”Los Alamos <strong>National</strong> Laboratory report <strong>LA</strong>-13979-ENV, Los Alamos, NM.Los Alamos <strong>National</strong> Laboratory, 2002a. “Environmental Surveillance at Los Alamos during 2001,”Los Alamos <strong>National</strong> Laboratory report <strong>LA</strong>-13979-ENV, Los Alamos, NM.Los Alamos <strong>National</strong> Laboratory, 2002b. “Los Alamos <strong>National</strong> Laboratory 2002 Pollution PreventionRoadmap,” Los Alamos <strong>National</strong> Laboratory document <strong>LA</strong>-<strong>UR</strong>-02-7430, Los Alamos, NM.New Mexico Night Sky Protection Act, 44 th Legislature, House Bill 39, First Session, April 1999.4-20SWEIS Yearbook—2002
Bald eaglesSWEIS Yearbook—2002 4-21
The PastV-Site building related to the Trinity device testassembly areaBefore the Cerro Grande FireAfter the Cerro Grande FireThe Present—200250th Anniversary—CMRNonproliferation and International <strong>Security</strong> CenterThe FutureConceptual design of the Materials Science and TechnologyBuildingConceptual design of the EmergencyOperations Center4-22SWEIS Yearbook—2002
5.0 Ten-Year Comprehensive Site PlanThis chapter presents a brief overview of DOE/NNSA’s long-range planning process at <strong>LA</strong>NL (<strong>LA</strong>NL2001a, 2002a). Because this planning process is used to address what happens to facilities and infrastructureat <strong>LA</strong>NL, it ties into the SWEIS. The plan is updated annually and identifies what will be retained,maintained, modified, demolished, or replaced at <strong>LA</strong>NL. Even though portions of this chapter may appear tobe redundant with previous chapters of this report, the material presented here looks forward to the next 10years, whereas the preceding chapters look backwards at the past five years (1998 through 2002).The proposed projects identified in the plan are designed to• consolidate facility operations into fewer/smaller facilities providing for more efficient facilityoperations in support of missions;• consolidate nuclear materials facilities;• replace vulnerable “temporary” structures with long-term office and light laboratory space;• upgrade or replace infrastructure—electricity, water, waste water, natural gas, roads—andprotection and communications systems; and• construct or modify existing facilities to meet specific program needs.The average age of the Laboratory’s eight million square feet of facilities is over 40 years. Each projectis designed to improve safety, security, employee morale and retention, and to reduce maintenance andoperations costs. The Laboratory plans to eliminate two million of its existing eight million square feet overthe next 10 to 12 years.The following five sections parallel sections of the <strong>LA</strong>NL TYCSP for FY 20<strong>03</strong> (<strong>LA</strong>NL 2002a). Eachsection provides a brief overview of information pertinent to the SWEIS envelope.5.1 Introduction5.1.1 OverviewThe TYCSP is a long-range site-planning document initially delivered to DOE in September 2001 (<strong>LA</strong>NL2001a) with an updated plan delivered in October 2002 (<strong>LA</strong>NL 2002a). This document serves as the linkbetween long-range planning, proposed projects, and the budget. In doing so, the document connects theinstitutional plan, program plans, comprehensive site plans, and the SWEIS. The TYCSP was restructured inFY 20<strong>03</strong> and provides information on the following topics:• general site information,• facility and infrastructure cost summary,• production readiness and plant capacity,• summary of missions and alternatives/requirements tables, and• project lists.The plan integrates institutional planning efforts for mission and programs, workforce, facilities, security,utilities, environment, safety, health, and operations.SWEIS Yearbook—2002 5-1
5.1.2 AssumptionsThe Laboratory used the following assumptions in developing the FY 20<strong>03</strong> TYSCP.• The Laboratory’s core mission and programs will remain largely unchanged over the next 10 years.• The primary funding sources in support of the physical plant are Readiness in Technical Baseand Facilities (RTBF), Facilities and Infrastructure Recapitalization Program (FIRP), IntegratedConstruction Program Plan, Institutional General Plant Project, and program-specific funding.• Funding targets for the RTBF Operations of Facilities and FIRP projects/activities cost projectionsare based on the Future Years <strong>Nuclear</strong> <strong>Security</strong> Program.• Consolidation will have to achieve cost savings.• The facility management realignment to a more centralized management structure will reduceoperating costs.• Significant increases in physical site security will be considered.5.1.3 Current SituationLos Alamos has the oldest and the greatest number of facilities among the three weapons laboratoriesand DOE-Nevada operations. The cost of equipment maintenance, integrated safeguards and securitymanagement, environmental compliance, urgent maintenance, and operations for the Laboratory’s oldfacilities is expensive and growing. As a result, the Laboratory is exploring prioritization of maintenance andreplacement as well as consolidation of operations. Maintenance backlogs are a designated baseline and arebeing defined to maximize benefit from the resources expended on these older facilities.5.1.4 NEPAThe Laboratory remains committed to complying with NEPA requirements. The Laboratory performsNEPA reviews on several hundred projects each year. A recommendation on the level of NEPA review(categorical exclusion, environmental assessment, or environmental impact statement) is submitted toNNSA where a decision regarding the need for and the level of NEPA documentation is made. Once NEPAis completed, a project can proceed after NNSA notifies the Laboratory that a categorical exclusion iscompleted, a Finding of No Significant Impact is signed for an environmental assessment, or a ROD ispublished for an environmental impact statement.5.1.5 Changes and Accomplishments from the 2002 TYCSPIn addition to specific project-related changes, changes occurred in the TYCSP document and processes.The changes include• modifying the TYCSP to respond to and align with guidance changes such as document format andcontent, budget realities, and determination of historical significance and future excess facilities;• reflecting October 2001 restructuring;• addressing the DOE Gap analysis;• enhancing facility strategic planning;• expanding the information base on utilities, transportation, parking, and plant capacities;• planning for physical security; and• developing a sustainable design guide.5-2SWEIS Yearbook—2002
5.2 Site DescriptionThe site, i.e., <strong>LA</strong>NL, has been described in the SWEIS (DOE 1999a). This description includes thephysical location of <strong>LA</strong>NL as well as the environment affected by <strong>LA</strong>NL. The environment covers factorssuch as population, economy, land use, adjacent landowners, water availability, air quality, threatened andendangered species, and archeology and cultural resources.5.2.1 Geographic SettingThe geographic setting of the Laboratory is similar to what was described in the SWEIS. The differencesare the impact of the Cerro Grande Fire on the plant communities and a change in public access due toheightened security. The public is currently allowed limited access to certain areas along State Routes 4, 501,and 502. Access to most of Pajarito Road is now restricted by the DOE.Aerial view of Los Alamos mesas5.2.2 Laboratory ResourcesBasic information on the regional ecosystem encompassing the Laboratory and resources specifically atthe Laboratory are drawn from the SWEIS and supporting documentation. Regional ecosystem data includebrief summary descriptions of the canyons, watersheds, wetlands, and major vegetation zones. Brief summarydescriptions of the resources for integration include the topics of air, water, surface water, ground water, soils,biological, wildlife, forest, and cultural and historic.5.2.3 LandThe Laboratory is divided into 49 separate technical areas with location and spacing that reflect the site’shistorical development patterns, regional topography, and functional relationships. There are asphalt roadsand parking areas. In addition, the Laboratory has many unpaved roads and remote high explosives testing orfiring sites.5.2.3.1 Land UseTable 5.2.3.1-1 summarizes the current land use and the land use projected for the future. The major landusechanges involve consolidation of <strong>Nuclear</strong> Materials Research and Development and the expansion ofExperimental Science.Figure 5-1 shows the existing land use at <strong>LA</strong>NL, and Figure 5-2 shows the future land use.SWEIS Yearbook—2002 5-3
Figure 5-1. Existing land use at <strong>LA</strong>NL.5-4SWEIS Yearbook—2002
Figure 5-2. Future land use at <strong>LA</strong>NL.SWEIS Yearbook—2002 5-5
Table 5.2.3.1-1. Site-Wide Land UseEXISTING <strong>LA</strong>ND USE FUT<strong>UR</strong>E <strong>LA</strong>ND USE<strong>LA</strong>ND USE CATEGORY ACREAGE ACREAGEService/Support 140 161Experimental Science 514 544High Explosives Research and Development 1,310 1,436High Explosives Testing 7,096 7,096<strong>Nuclear</strong> Materials Research and Development 374 42Physical/Technical Support 336 340Public/Corporate Interface 31 24Theoretical/Computational 2 22Waste Management 186 231Reserve 17,874 17,856 aTotal 27,863 27,482aLand conveyance and transfer may include up to 4,046 acres by November 2007. The first transfer occurred in 2002.All of this acreage is included in the reserve land use category.5.2.3.2 Land TransferOn November 26, 1997, Congress passed Public Law 105-119. Section 632 of that law directed theSecretary of Energy to convey to the Incorporated County of Los Alamos, New Mexico, or to the designee ofthe County and transfer to the Secretary of the Interior, in trust for the Pueblo of San Ildefonso, parcels of landunder the jurisdictional administrative control of the Secretary at or in the vicinity of <strong>LA</strong>NL. Such parcels, ortracts, of land had to meet the suitability criteria established by the law, that is, they were not required for thenational security mission before the end of 11/26/2007; could be restored or remediated by 11/26/2007; andwere suitable for historic, cultural, or environmental preservation, economic diversification, or communityself-sufficiency. The DOE 1 identified 10 tracts of land for potential conveyance to the County of Los Alamosor transfer to San Ildefonso Pueblo. These 10 tracts of land have been further divided into subparcels fordisbursal purposes.The 10 tracts, which total approximately 4,600 acres, are shown in Figure 5-3 and include the following:• TA-21 tract, 244 acres - located on the eastern end of the same mesa on which the central businessdistrict of Los Alamos is located.• DP Road tract, 50 acres - located between the western boundary of TA-21 and the majorcommercial districts of the Los Alamos townsite.• DOE Los Alamos Area Office tract, 13 acres - located within the Los Alamos townsite between LosAlamos Canyon and Trinity Drive.• Airport tract, 198 acres - located east of the Los Alamos townsite, close to the East Gate BusinessPark.• White Rock tract, 99 acres - located north of Pajarito Acres residential development and west of theWhite Rock townsite.• Rendija Canyon tract, 909 acres - located north of and below Los Alamos townsite’s BarrancaMesa residential subdivision.• White Rock Y tract, 435 acres - a complex area that incorporates the alignments and intersectionsof State Routes 502 and 4 and the easternmost part of Jemez Road.• Site 22 tract, 0.3 acres - located at the edge of the Los Alamos townsite mesa, south of TrinityDrive and above Los Alamos Canyon.1Congress established the NNSA within the DOE to manage the nuclear weapons program for the United States. <strong>LA</strong>NL is one of the facilities nowmanaged by the NNSA. The NNSA officially began operations on March 1, 2000. Its mission is to carry out the national security responsibilities ofthe DOE, including maintenance of a safe, secure, and reliable stockpile of nuclear weapons and associated materials capabilities and technologies;promotion of international nuclear safety and nonproliferation; and administration and management of the naval nuclear propulsion program.5-6SWEIS Yearbook—2002
Figure 5-3. <strong>LA</strong>NL parcels for conveyance and transfer.SWEIS Yearbook—2002 5-7
• Manhattan Monument tract, a fraction of an acre in size; located adjacent to Ashley Pond andconsists of a plaque covered by a small pavilion.• TA-74 tract, 2,698 acres - located east of the Los Alamos townsite and includes much of PuebloCanyon.DOE’s Cross-Cut Guidance on Environmental Requirements for DOE Real Property Transfers (DOE1999b) provides guidance on the types of information needed to support real property transfers. Informationsuch as the presence of floodplains and wetlands; critical habitats; historic properties; and hazardoussubstances must be gathered and provided to the potential recipients of the property.An Environmental Baseline Survey is prepared in accordance with the Cross-Cut Guidance onEnvironmental Requirements for DOE Real Property Transfers in preparation of conveying or transferringownership of a subparcel at <strong>LA</strong>NL from the DOE/NNSA to either Los Alamos County or the Department ofInterior pursuant to Public Law 105-119, Section 632. It discusses NNSA compliance with the environmentalrequirements associated with real property transfers. It also demonstrates that, although potentiallycontaminated, a subparcel is in such condition that NNSA may issue deeds on the basis that “all remedialaction necessary to protect human health and the environment has been taken.” The methodology used toprepare the Environmental Basline Surveys is to• conduct an environmental site assessment of the subparcel consistent with the American Societyof Testing and Materials (ASTM) Standard Practice for Environmental Site Assessments: Phase IEnvironmental Site Assessment Process (ASTM 2000),• review historical and current information and documents pertinent to the subparcel,• perform a physical examination of the subparcel, and• consult with both UC and NNSA staff to confirm existing information or develop additionalinformation as necessary.Table 5.2.3.2-1 identifies those subparcels transferred during CY 2002. This resulted in a boundary changeof <strong>LA</strong>NL and a loss of about 2,209 acres of land changing the size of <strong>LA</strong>NL from about 43 square miles toabout 40 square miles.Table 5.2.3.2-1. Land Subparcels Transferred during CY 2002DESIGNATOR DESCRIPTION RECIPIENTTRANSFERDATE ACREAGEA-1 Manhattan Monument Los Alamos County October 31, 2002 0.07A-12 Los Alamos Area Office-1 (East) Los Alamos County October 31, 2002 4.51A-17 TA-74-1 (West) Los Alamos County October 31, 2002 5.52A-19 White Rock-1 Los Alamos County October 31, 2002 76.33A-2 Site 22 Los Alamos County October 31, 2002 0.17A-3 Airport-1 (East) Los Alamos County October 31, 2002 9.44A-6 Airport-4 (West) Los Alamos County October 31, 2002 4.18A-9 DP Road-2 (North) (Tank Farm) Los Alamos County October 31, 2002 4.25B-1 White Rock-2 Pueblo of San Ildefonso October 31, 2002 14.94B-2 TA-74-3 (North) (Includes B-4) Pueblo of San Ildefonso October 31, 2002 2,089.88Total 2,209.295-8SWEIS Yearbook—2002
5.2.4 BuildingsAs of July 2001, the Laboratory had over eightmillion gross square feet of space and leasedapproximately 250,000 square feet within Los AlamosCounty. In early 2002, SCC was completed and madeanother 300,000 square feet of space available. WhenNISC is completed in 20<strong>03</strong>, there will be an additional163,000 square feet of space.There is currently a Congressional requirement toremove one square foot of old structure for each newsquare foot of construction. Over 500,000 square feetof space has either been identified as excess or beenproposed to be excessed over the next 10 years. (SeeAppendix F.)The primary construction projects funded throughFY 2002 are identified in Table 5.2.4-1. The majorproposed construction projects through FY 2012 areshown in Table 5.2.4-2. Each of these constructionprojects undergoes individual NEPA review and Aerial view of TA-3 before the Cerro Grande Fireis closed out with a formal determination of beingcovered by a categorical exclusion, an environmental assessment with a finding of no significant impact, or anenvironmental impact statement with a record of decision from DOE. (The NEPA status for these projects issummarized in Appendix F.)Table 5.2.4-1. Primary Construction Projects Funded through FY 2002TA PROJECT INITIATED FUNDEDBENEFICIALOCCUPANCYFUNDINGTYPE a GSF b15 DARHT Phase 2 FY 1999 FY 2002 LI 8,300<strong>03</strong> Metropolis Center (SCC) FY 1999 FY 2002 LI 300,000<strong>03</strong> NISC FY 2000 FY 20<strong>03</strong> LI 163,400<strong>03</strong> Nonproliferation and International <strong>Security</strong> Division Office FY 2000 FY 20<strong>03</strong> LI 20,000Building69 Emergency Operations Center FY 2001 FY 20<strong>03</strong> LI 38,00016 Tritium Science and Engineering Office Building FY 2001 FY 20<strong>03</strong> GPP 24,10016 Weapons Engineering Office Building FY 2001 FY 20<strong>03</strong> LI 22,00046 Chemistry Division Office Building FY 2001 FY 20<strong>03</strong> LI 22,000<strong>03</strong> Health, Safety, and Radiation Protection Clinic FY 2002 FY 20<strong>03</strong> GPP 19,000<strong>03</strong> Materials Science and Technology Division Office Building FY 2002 FY 20<strong>03</strong> GPP 20,000<strong>03</strong> S-3 Facility FY 2002 FY 20<strong>03</strong> GPP 20,000<strong>03</strong> Decision Applications Division Office Building FY 2002 FY 20<strong>03</strong> GPP 18,000<strong>03</strong> BSL-3 Facility FY 2002 FY 20<strong>03</strong> GPP 3,300<strong>03</strong> Los Alamos Center for Integrated Nanotechnologies FY 2002 FY 2005 LI 31,000Gateway55 Manufacturing and Technical Support Facility FY 2002 FY 20<strong>03</strong> GPP 18,00016 Weapons Plant Support Facility FY 2002 FY 20<strong>03</strong> GPP 23,00022 High Power Detonator Facility FY 2002 FY 20<strong>03</strong> GPP TBDabThe funding types are line item (LI) and general plant project (GPP).GSF = gross square feet.SWEIS Yearbook—2002 5-9
Table 5.2.4-2. Selected Proposed Construction Projects through FY 2012TA PROJECT INITIATED FUNDEDBENEFICIALOCCUPANCYFUNDINGTYPE a GSF b55 CMR Replacement FY 20<strong>03</strong> FY 2012 LI 100,00022 Hydrotest Facility FY 20<strong>03</strong> FY 2004 GPP 18,00063 Facility Waste Operations Office Building FY 20<strong>03</strong> FY 2004 GPP 18,000<strong>03</strong> Fuel Cell Facility FY 20<strong>03</strong> FY 2005 LI 20,00016 Stockpile Support Facility FY 20<strong>03</strong> FY 2004 GPP 18,00016 Shock and Vibration Lab FY 20<strong>03</strong> FY 2004 GPP 3,70016 High Explosives Pressing Consolidation FY 20<strong>03</strong> FY 2004 GPP 3,70066 Homeland <strong>Security</strong> Building FY 20<strong>03</strong> FY 2004 GPP 18,000<strong>03</strong> <strong>National</strong> <strong>Security</strong> Sciences Building FY 2004 FY 2006 LI 275,00016 General Tritium Support Stockpile Life Extension FY 2004 FY 2005 GPP 2,000Program Support Building16 Fabrication Facility FY 2004 FY 2005 GPP 30,00016 Advanced Manufacturing Office FY 2004 FY 2005 GPP 18,00016 ESA DivisionFY 2004 FY 2005 GPP 18,000Facility Management Office Building<strong>03</strong> Communications Shop Building FY 2005 FY 2005 GPP 6,20016 Calibration Lab FY 2005 FY 2006 GPP 12,00022 Electronics Data Systems Building FY 2005 FY 2007 GPP 10,10053 Advanced Hydrotest Facility FY 2005 FY 2010 LI TBD22 Vessel Facility 1 of 4 FY 2006 FY 2007 GPP 4,20060 Support Services Consolidation FY 2007 FY 2008 LI TBD22 Vessel Facility 2 of 4 FY 2007 FY 2008 GPP 4,20050 RLWTF Upgrades FY 2007 FY 2009 LI N/A22 Vessel Facility 3 of 4 FY 2008 FY 2009 GPP 4,20022 Medium Heavy Lab FY 2008 FY 2009 GPP 5,00022 Vessel Facility 4 of 4 FY 2009 FY 2010 GPP 4,20022 Replace Machine Shop FY 2009 FY 2010 GPP 10,00022 Classified High Explosives Storage FY 2011 FY 2011 GPP 2,000TBD Joint DX/ESA Conference Facility FY 2011 FY 2011 GPP 5,000aThe funding types are line item (LI) and general plant project (GPP).bGSF = gross square feet.5.2.5 WorkforceThe Laboratory’s affiliated workforce includes employees of the prime contractor, the UC, andsubcontractors. The major subcontractors in 2002 were JCNNM and PT<strong>LA</strong>. As at the time the SWEIS waspublished, the Laboratory employs both technical and nontechnical subcontractors, as well as consultantsfrom around the world on a temporary basis.5.2.6 Cerro Grande FireThe Cerro Grande Fire damaged and destroyed important facilities, equipment, and infrastructure at theLaboratory and had a significant impact on mission-critical facilities. Emergency funding received by theLaboratory addressed the damage to Laboratory property from the fire and ongoing risk.The Cerro Grande Rehabilitation Project has implemented a three-phased approach to recover from thefire.• Phase 1: An emergency recovery or short-term phase addressed immediate dangers. These includedconstructing a flood retention structure in Pajarito Canyon, building weirs, hydro-seeding over 700acres, and installing other erosion control measures. This phase was completed in the first quarterof FY 2001.• Phase 2: Demonstrated vulnerabilities are being addressed by thinning forests to create fire-5-10SWEIS Yearbook—2002
A track mounted Harvester removing a ponderosa pinedefensible space around all Laboratory buildingsand structures. The work also includes repairing andreplacing equipment, roofs, sewer lines, and gas andLow-head weir near the White Rock Yelectrical lines. This phase was 70 percent complete atthe end of FY 2002.• Phase 3: This consists of fire-mitigation activities such as thinning approximately 10,000 acresof trees on Laboratory property, continuing erosion control, and the execution of five line-itemconstruction projects. The line-item construction projects include the new Emergency OperationsCenter, two office buildings, a multichannel communications system, replacement of majorportions of the Laboratory fire alarm system, and addressing demonstrated vulnerabilities at wastemanagement facilities located at TA-50 and TA-54.5.3 Mission Needs and Program Descriptions5.3.1 Current Missions, Programs, and WorkloadsThe Laboratory’s primary missions are• to ensure the safety and reliability of the U.S. nuclear weapons stockpile;• to develop technical means for reducing the global threat of weapons of mass destruction orterrorism (including biological, chemical, nuclear, and cyber); and• to solve national problems in energy, environment, infrastructure, and health security, using theinvestment in people and facilities implied by the first two missions.The Weapons Engineering and Manufacturing, Weapons Physics, Threat Reduction, and Strategic Researchdirectorates are devoted to achieving the Laboratory’s missions.5.3.2 Readiness in Technical Base and FacilitiesThe RTBF mission (<strong>LA</strong>NL 2002b, 2002c) is to ensure that the right facilities and infrastructure are in placeto manufacture and certify the 21 st century nuclear weapons stockpile and that the Laboratory is implementingthe technologies and methods necessary to make construction, operation, and maintenance of NNSA/DefensePrograms facilities safe, secure, and cost effective. The RTBF program provides the physical and operationsSWEIS Yearbook—2002 5-11
infrastructure required to conduct the scientific, technical, and manufacturing activities of the stockpilestewardship program. The RTBF program will maintain facilities and technologies in an appropriate conditionso that they are not limiting factors in the accomplishment of the NNSA/Defense Programs mission.In order to attain the RTBF program goals, the Laboratory must• make cost-effective investments in the infrastructure, workforce, facilities, and technologies toenable effective program management of activities;• continue to deliver and maintain safe and secure facilities that provide the means to perform anddeliver the requisite levels of science and technology associated with maintaining the safety andreliability of the nuclear weapons stockpile; and• continue to provide the balance of the physical and intellectual infrastructure underpinningsnecessary to support the goals and mission of NNSA/Defense Programs.The majority of the RTBF direct funds support facility “warm standby” operations for the major NNSA/Defense Programs experimental and manufacturing facilities. The “warm standby” condition is defined as thestate of readiness for programmatic operations.RTBF has been in place since FY 2000 and allows the Laboratory to embark on a set of improvementsfocusing on facilities and management techniques. The RTBF funds also support urgent maintenance, majorupgrades, and other NNSA/Defense Programs facility maintenance not funded within the warm standbydefinition as well as• material recycle and recovery that is targeted at reducing the SNM holdings at the Laboratory,• surveillance and maintenance of excess facilities awaiting decommissioning and demolition, and• waste management.In FY 2002, <strong>LA</strong>NSCE proposed a multiyear modernization initiative and DARHT clarified its plans totransition from construction to operations using RTBF funding.5.3.3 Linkages Between Facilities and Infrastructure and Mission NeedsThe Laboratory has developed a tabular summary relating program missions to facility alternatives andrequirements. The summary also links the facility requirements to the programs and activities that are integralparts of the Laboratory’s current and future missions. The table is referred to as the Summary Missions/Alternatives/Requirements Table and it attempts to capture the forecasted 10-year program mission campaignactivities and link the activities to technologies and facilities required to accomplish the missions.5.3.4 Future Missions, Programs, Workloads, and ImpactsFuture missions, programs, workloads, and potential impacts are identified in the Summary Missions/Alternatives/Requirements Table.5.3.5 Technology EffectsThe table also identifies future technologies and the facilities and infrastructure impacts and needs for thesetechnologies and links these technologies with directed stockpile work, RTBF, and campaigns.5.3.6 Special Needs of Current Missions, Programs, and WorkloadsIn order to meet the needs of current missions and programs, the Laboratory must maintain, upgrade, andconduct work in all facilities to ensure reliability and effectiveness. Table 5.3.6-1 highlights many of theLaboratory’s unique facilities and the particular mission needs they support.5-12SWEIS Yearbook—2002
SWEIS Yearbook—2002 5-13Table 5.3.6-1. Specialized Facilities and Supported Mission NeedsSWEIS RODREFERENCE2.1 PlutoniumComplex (TA-55)2.2 Tritium Facilities(TA-16 and TA-21)2.3 Chemistry andMetallurgy ResearchBuilding (TA-<strong>03</strong>)2.4 Pajarito Site(TA-18)2.5 Sigma Complex(TA-<strong>03</strong>)2.6 Materials ScienceLaboratory (TA-<strong>03</strong>) a2.7 Target FabricationFacility (TA-35) a2.8 Machine Shops(TA-<strong>03</strong>)TYCSPREFERENCE LOCATION DOE SPONSOR SUPPORTED MISSION NEEDSPlutonium TA-55 NNSA/Office of Manufacturing of plutonium componentsFacilities<strong>Nuclear</strong> Weapons Surveillance and disassembly of weapons componentsActinide materials science and processing research and developmentPlutonium recovery from pit production and surveillanceWar reserve plutonium metal recovery and productionVault storage of nuclear materialsTritium FacilitiesTA-16-205(WETF);TA-21-209(TSFF)NNSA/Office of<strong>Nuclear</strong> Weaponsand Office ofScienceCMR TA-<strong>03</strong>-29 NNSA/Office of<strong>Nuclear</strong> WeaponsWaste processingHigh-pressure gas fills and processingGas-boost system testing and developmentTritium research and developmentAnalytical chemistryMicrostructural analysisSupport for detonation surveillanceShielded hot-cell facility for plutonium weapons evaluationLimited fabrication, including casting, forming, welding, and joining, heat treating, andmetallographyDesign, construction, research, development, and applications of critical experimentsPajarito Site TA-18 all NNSA/Office of<strong>Nuclear</strong> WeaponsSigma Complex TA-<strong>03</strong>-66 General Fabrication of metallic and ceramic items, including boost system components and jointtest assembliesMock pit fabricationMechanical property evaluationsMetallography, microscopy, and extensive materials characterizationCasting, metallic deformation processing, powder metallurgy, welding and joining, andcomplete characterization of metals from Z number 4 (beryllium) to 92 (uranium)Capability exists to manufacture ceramic components from oxide, nitride, sulfide, andcarbide materialsBerylliumTechnologyFacility (BTF)EngineeringMachine ShopsTA-<strong>03</strong>-141TA-<strong>03</strong>-39;TA-<strong>03</strong>-102NNSA/Office of<strong>Nuclear</strong> WeaponsNNSA/Office ofResearch,Development, andSimulationBeryllium component fabrication for stockpile systemsSupport pit and mock pit productionDepleted uranium machining and inspectionBeryllium product inspection
5-14SWEIS Yearbook—2002Table 5.3.6-1. Specialized Facilities and Supported Mission Needs (continued)SWEIS RODREFERENCE2.9 High ExplosivesProcessing (TA-08,TA-09, TA-11, TA-16,TA-22, TA-28, TA-37)2.10 High ExplosivesTesting (TA-14,TA-15, TA-36, TA-39,TA-40)2.11 Los AlamosNeutron ScienceCenter (TA-53)2.12 Health ResearchLaboratory (TA-43) a, b2.13 RadiochemistryFacility (TA-48) a2.14 RadioactiveLiquid WasteTreatment Facility(TA-50)2.15 Solid Radioactiveand Chemical WasteFacilities (TA-50 andTA-54)2.16 Non-KeyFacilitiesTYCSPREFERENCE LOCATION DOE SPONSOR SUPPORTED MISSION NEEDSRadiography TA-08-22Nondestructive testing of pit parts, pit assemblies, and other productsBuildingNNSA/Office ofResearch,Development, andSimulationDARHT TA-15-312 NNSA/Office ofResearch,Development, andSimulation<strong>LA</strong>NSCE TA-53 NNSA/Office ofResearch,Development, andSimulationRadioactiveLiquid WasteTreatmentFacilitySolid RadioactiveWasteManagementFacilityNicholas C.MetropolisCenter forModeling andSimulation(formerly SCC)NISC (completein FY 20<strong>03</strong>)TA-50-01TA-54TA-<strong>03</strong>2.17 EnvironmentalRestoration Project aaNot included in this specialized facilities listing.bRenamed Bioscience Facilities.NNSA/Office ofResearch,Development, andSimulationNNSA/Office ofResearch,Development, andSimulationNNSA/Office ofResearch,Development, andSimulationHydrodynamic testingProton radiography and neutron resonance spectroscopyStudies of materials properties of direct relevance to stewardship, including special nuclearmaterials and high explosives over a neutron energy range relevant to weapons systemsResearch on mission-critical requirements of the stockpile stewardship program byexperimental validation of predictive tools and modelsFinal treatment of liquid radioactive and industrial wasteManagement of solid radioactive wasteTA-<strong>03</strong> Nonproliferation Arms controlTreaty verification<strong>Nuclear</strong> safeguardsNonproliferationWeapons assessmentNumerical simulation models of nuclear weapons
5.3.7 Facilities and Infrastructure Impacts from Non-NNSA ProgramsAt this time, there are no identified activities from non-NNSA programs that could impact the site’s currentand/or future NNSA facilities and infrastructure activities. The specialized non-NNSA facilities are identifiedin Table 5.3.7-1. These facilities include three new buildings.Table 5.3.7-1. Specialized Non-NNSA Facilities aSWEIS RODREFERENCE2.12 HealthResearchLaboratory b2.16 Non-KeyFacilitiesabTYCSPREFERENCEHealth ResearchLaboratory (HRL)Center for IntegratedNanotechnologies(CINT) (complete inFY 2005)Fuel Cell Facility(complete in FY 2005)Emergency OperationsCenter(complete in FY 20<strong>03</strong>)LOCATIONDOESPONSOR SUPPORTED MISSION NEEDSTA-43 Varies Biologically inspired materials and chemistryComputational biologyEnvironmental biologyGenomic studiesMeasurement science and diagnosticsMolecular and cell biologyCytometryStructure biologyTA-<strong>03</strong> Office of Nano/Bio/Micro interfacesScience Nanophotonics and nanoelectronicsNanomechanicsTA-<strong>03</strong>TA-69Office ofEnergyEfficiencyandRenewableEnergyCerroGrandeRehabilitationProjectComplex functional materialsLow-Temperature Fuel Cell research anddevelopment: membrane/electrode/research anddevelopment, theory and modelingEnabling technologies: fuel processing, catalystdevelopment, hydrogen storage and purification,sensorsAdvanced components: simplified systems,direct methanol systems, electrolyzers andreversible cells, alkaline fuel cellsIndustrial partnerships: portable electronicsmanufactures, automotive original equipmentmanufacturers fuel cell developersEmergency managementFacility operationsEmergency assessmentProtection action formulationJoint dispatch operationsAll other Key Facilities identified in the SWEIS ROD (DOE 1999c) are not included in this specialized facilitieslisting.Renamed Bioscience Facilities.During the early 1990s, several facilities were transferred from NNSA/Defense Programs to EnvironmentalManagement for surveillance and maintenance followed by decommissioning. In recent years, candidatefacilities for transfer have been discussed, but none have been transferred from NNSA/Defense Programs toNNSA/Environmental Management.SWEIS Yearbook—2002 5-15
5.4 The Plan5.4.1 Planning ProcessThe FY 20<strong>03</strong> TYCSP focuses on the physical assets that support the Laboratory’s missions and operations.The plan was developed from the four levels of the Laboratory’s strategic planning process: missionobjectives, permit to operate, operational plans, and supporting plans. The planning process translates into thefollowing:• The mission objectives incorporate the institutional plan with the Laboratory’s annual goals andobjectives.• The permit to operate includes the authorization basis (facility permit to operate) and the SWEIS(operating envelope).• The operational plans include the Site Safeguards and <strong>Security</strong> Plan; Environment, Safety, andHealth Management Plan; Integrated Natural and Cultural Resources Management Plan for LosAlamos <strong>National</strong> Laboratory (DOE 2002), program planning, and budget, and workforce planning.• The supporting plans that include the Comprehensive Site Plan 2000/2001 (<strong>LA</strong>NL 1999a, 2001),area development plans, facility strategic plans, and master plans.The accumulation of data from these four levels forms the TYCSP.5.4.2 FacilitiesMore than half of the Laboratory’s facilities are currently over 30 years old, including nuclear andnonnuclear facilities. Over the next 10 years, facilities aged 30 or more years old will increase to sevenmillion gross square feet. Without implementing the proposed demolition and replacement of aging facilities,the Laboratory’s ability to carry out the stockpile stewardship mission is seriously threatened. Nineteenpercent of the Laboratory’s structures are planned for excess within the next 10 years because of theirinadequacy to meet long-term missions.The facilities have been evaluated relative to their role in serving the Laboratory’s mission and whatmaintenance each requires. Some facilities have been identified as excess. These will be converted for otheruse, decontaminated and demolished, or preserved for their historical value.Table 5.4.2-1 provides a summary relative to structures for FY 2002 and FY 20<strong>03</strong>.5.4.3 UtilitiesThe ownership and distribution of utility services are split between DOE and Los Alamos County.Utility systems at the Laboratory include electrical services, natural gas, steam, water, sanitary wastewater,telecommunications and data networks, and refuse.Electrical Power. There are approximately 140 miles of transmission and primary electrical distributionlines at the Laboratory. Although the Laboratory’s electrical power system is in generally good operatingcondition, there are specific concerns that will require attention are summarized in Table 5.4.3-1.Sanitary Waste Disposal System. Sanitary liquids are delivered by dedicated pipelines to the sanitarywastewater systems consolidation plant at TA-46. The plant has a capacity of 600,000 gallons per day. Thesanitary sewer system has approximately 744,500 feet of pipeline. In general, the collection system is insatisfactory operating condition and the plant is in excellent condition and will adequately accommodatefuture demand. The specific concerns and related projects for this system are identified in Table 5.4.3-2.5-16SWEIS Yearbook—2002
Table 5.4.2-1. Summary of Proposed Future Condition by Gross Square Feet–FY 2002 andFY 20<strong>03</strong>EXISTINGWITHBUILDINGTO BEBUILDINGTO BELONG- EXCESSED EXCESSEDTEMPORARY/P<strong>LA</strong>NNED/BUDGETEDNEW (0 TO 3 YEARS) FYTERMMISSION5 TO 10YEARS0 TO 5YEARSUTILITARIANSTRUCT<strong>UR</strong>ES SPARE LEASED20,000 02 405,069 188,151 251,983 17,564 0 0EngineeringFacilities43,000 <strong>03</strong> 400,455 188,122 168,545 17,596 0 0Tritium Facilities 20,000 02 19,568 0 74,497 0 0 00 <strong>03</strong> 42,629 0 69,145 0 0 0<strong>LA</strong>NSCE 5,062 02 842,825 7,149 1,158 50,940 5,166 05,062 <strong>03</strong> 843,205 7,149 0 48,410 5,166 0DynamicExperimentsMaterialsScience/Laser0 02 278,331 159,332 22,931 11,687 17,349 05,600 <strong>03</strong> 277,548 158,564 21,151 8,432 4,338 00 02 508,659 11,245 164 25,711 0 018,000 <strong>03</strong> 526,820 0 164 2,133 0 0Waste Management 13,200 02 209,255 47,251 2,587 37,153 0 013,200 <strong>03</strong> 201,905 47,251 2,227 40,795 0 0Computer Facilities 300,000 02 468,257 9,006 6,159 30,107 0 00 <strong>03</strong> 819,179 35,707 0 25,899 0 0<strong>Nuclear</strong> (SNM) 7,500 02 397,205 667,727 840 18,340 0 025,500 <strong>03</strong> 397,205 664,672 840 20,620 0 0Nonproliferation 165,000 02 215,841 83,658 53,865 29,606 40 0Reduction) aand International<strong>Security</strong>/DecisionApplications (ThreatNonproliferation 206,000 <strong>03</strong> 210,980 182,735 8,744 31,143 0 0Reduction) band International<strong>Security</strong>/DecisionApplications/Biosciences(ThreatStrategic Research a 21,000 02 913,335 113,638 13,754 165,847 1,055 12,082Institutional 35,600 02 475,723 386,844 405,208 96,547 0 310,485Operations) a(Facility WasteInstitutional Science 92,600 <strong>03</strong> 1,309,970 344,620 537,109 205,052 0 345,539Divisions bBase SupportLaboratory Total 587,362 02 4,734,068 1,674,001 833,146 483,502 23,610 322,567408,962 <strong>03</strong> 5,029,896 1,628,820 807,925 400,080 9,544 345,539Excess Facilities 0 02 0 0 391,808 0 0 00 <strong>03</strong> 0 0 652,050 0 0 0abNot listed in FY 20<strong>03</strong>.Not listed in FY 2002.SWEIS Yearbook—2002 5-17
Table 5.4.3-1. Electrical Power Concerns and Related ProjectsCONCERNSSwitchgear and circuit breakers in several locationsare old and obsolete for the current system and need tobe replaced.Step-down transformers, which supply all the electricpower to the Laboratory’s main technical area (TA-<strong>03</strong>)and the Los Alamos town site, are old and do notprovide adequate redundancy. At TA-<strong>03</strong>, the 50-yearoldtransformers (30 megawatt capability each) serve a50 megawatt-plus load. Because a single transformercannot address the entire load, there is no redundancy.The two existing 115-kilovolt transmission lines thatcarry all the bulk electric power for the Laboratory andLos Alamos County terminate on a common bus andtherefore lack true redundancy.The program to monitor usage, power quality, and logevents does not cover all applicable buildings andneeds to be expanded.TA-<strong>03</strong> transformers are 50 years old and undersized.There is no redundancy to service the load.Portions of the 13.8-kilovolt aerial distribution linesare not adequate to carry the anticipated loads in 2011.Replacing existing conductors with heavier conductorsand adding new circuits to support them are requiredto accommodate these future loads.RE<strong>LA</strong>TED PROJECTS–CY 2002 AND BEYONDSwitchgear in several locations at the Laboratory is currentlybeing replaced. The design, delivery, and installation ofswitchgear and equipment was completed for Sigma duringCY 2002.The WTA 115 to 13.8 MVA (56 MVAcapacity) transformer was put into service during 2002 and,when operational, will allow the replacement of the TA-<strong>03</strong>transformers. Several other transformers are on the InstitutionalProjects List.To address electrical power redundancy and availability, theproject list includes projects to uncross the 115-kilovolt linesand to add a backpressure turbine at the power plant.The Laboratory’s metering network program, which monitorsusage, power quality, and log events from a central computer,has been expanded to include over 70 buildings. Fifty buildingswill be added to the program each year.The WTA 115 to 13.8 million voltamperes (56 million volt amperes capacity) transformer was putinto service during 2002 and, when operational, will allow thereplacement of the TA-<strong>03</strong> transformers.Replacement work has been done at DARHT, WETF, the SCC,and NISC and will continue with other projects.Table 5.4.3-2. Sanitary Waste Disposal System Concerns and Related ProjectsCONCERNSIndividual pipe segments throughout the Laboratory haveinadequate slopes and require a high degree of maintenanceto remove built-up solids. A minimum flow velocity of twofeet per second is required.RE<strong>LA</strong>TED PROJECTS–CY 2002 AND BEYONDTA-<strong>03</strong>/58 gravity line.Replace broken sewer lines.The Cooling Tower Water Conservation project, plannedfor late FY 20<strong>03</strong> completion, will use solid wastewatersystems consolidation water instead of potable water for aset of cooling towers.5-18SWEIS Yearbook—2002
Radioactive Liquid Waste. There are three treatment facilities for handling the Laboratory’s radioactiveliquid waste at TA-21, TA-53, and TA-50, and a collection system that consists of 22,000 feet of piping. Thepiping in the collection system is in good condition. The specific concerns and related projects for this systemare identified in Table 5.4.3-3.Table 5.4.3-3. Radioactive Liquid Waste Concerns and Related ProjectsCONCERNSTA-21 treatment facility is over 35 years old and in poorcondition. Inactivity has contributed to the generaldeteriorating quality and a number of storage vessels donot meet current practices for environmental protection.TA-50 treatment facility is over 35 years old and in poorcondition. The facility is undersized for handling itscurrent load of waste generated by approximately 1,800points at the Laboratory.Separated treatment operationsInadequate storage capacity could be overwhelmed by asurge of radioactive liquid waste.Flow meters at generator facilities do not function well andit is difficult to sample the radioactive liquid waste forcompliance with acceptance criteria.RE<strong>LA</strong>TED PROJECTS–CY 2002 AND BEYONDDecontamination and demolition of the TA-21 treatmentfacility.Repairs and upgrades to the ventilation system at the TA-50facility are needed to continue operations for the next 10years.Reliability improvements to the membrane system are neededto provide additional capacity.Upgrade the facility to enhance treatment efficiencies, relievesafety concerns, and address environmental concerns.Relocate/upgrade the high activity pretreatment operation tomeet space and safety needs.Add influent storage and instrumentation for continuedoperations.Add influent storage and instrumentation for continuedoperations.Central Steam System. The Laboratory has two primary sources of steam with the power plant in TA-<strong>03</strong>and the TA-21 distributed steam plant, with capabilities of 360,000 pounds per hour and 36,000 poundsper hour, respectively. The power and generator plants have the capacity to deliver three times the currentdemand, and this will accommodate future development in the TA-<strong>03</strong> area. The steam distribution is primarilyunderground in over 20 miles of steel piping, which is well maintained and in good condition. The specificconcerns and related projects for this system are identified in Table 5.4.3-4.Table 5.4.3-4. Central Steam System Concerns and Related ProjectsCONCERNSSteam system condensate return lines are made of variousmaterials, only some of which have cathodic protection,and deterioration is rapid in some instances.A condensate return rate of 60% to 75% is being currentlyachieved and should be increased to improve central plantperformance.There are sections of the steam system that have had a highleak rate and therefore high repair requirements that needreplacement.RE<strong>LA</strong>TED PROJECTS–CY 2002 AND BEYONDTA-<strong>03</strong> condensate lines.Power plant steam piping replacement, cooling towerpiping replacement, feed water piping, and condensatereturn piping.Flue gas recirculation ductwork.Water Supply System. The Laboratory has a target water consumption of 1,662 acre-feet per year. Waterdemand based on projected growth may require water beyond recent usage levels. In accordance with the<strong>LA</strong>NL Site-Wide Water Conservation Plan (Beers 2001) key recommendation, an Interim Water ConservationCommittee has been established and an Acting Water Conservation Officer appointed.Potable water is obtained from deep wells located in three well fields. This water is pumped into productionlines, and booster pump stations lift the water to reservoir storage tanks for distribution. The well fields canSWEIS Yearbook—2002 5-19
easily provide forecasted water demands for the next 10 years. The Laboratory water system is in generallygood condition. The specific concerns and related projects for this system are identified in Table 5.4.3-5.Table 5.4.3-5. Water Supply System Concerns and Related ProjectsCONCERNSFuture water availabilityWater pressure in lower-elevationareas often exceeds the pressurerating for the distribution piping.Some fire hydrants are connectedto undersized lines that need to bereplaced.RE<strong>LA</strong>TED PROJECTS – CY2002 AND BEYONDThe Laboratory has initiated a project to increase the TA-<strong>03</strong> and TA-53 coolingtowers’ cycles of concentration from two to six and is investigating water savingopportunities:• Greater use of recycled water.• Use of Los Alamos County wastewater for current and future Laboratory needs.• Sustainable design of new facilities to include water-saving fixtures, reuse ofgray water, low-water-use vegetation in landscaping, and use of natural spacecooling versus water cooling.• Complete reuse/recycle for potential irrigation, cooling, retention, firesuppression, and recharge.The water distribution system has been enhanced by the installation of equipment tocontrol the pressure.A preventive maintenance program is in place.Laboratory is working on a project to connect the system to the SCADA (monitoringand alarm) system.Natural Gas. Approximately 90 percent of the gas used is for heating (both steam and hot air), and theremainder is used for electrical production. In general, the natural gas system is old, with approximately 80percent having been installed in the 1950s and 1960s. An aggressive cathodic protection installation andmaintenance system was deployed in 1998, which has improved the integrity and condition of the system. Thespecific concerns and related projects for this system are identified in Table 5.4.3-6.Table 5.4.3-6. Natural Gas Concerns and Related ProjectsCONCERNSNo redundant border metering station capable of supplyingfull capacity gas demand exists.The gas pipe serving TA-55 is too small to carry peak loadcapacity.A portion of the East Jemez Road 6-inch line is restricted.RE<strong>LA</strong>TED PROJECTS – CY2002 AND BEYOND100 psi natural gas lines at TA-<strong>03</strong> and TA-16Pajarito Road gas lineUtility Planning. The Laboratory has a Mitigation Action Plan for its utility systems that addresses, inpart, specific measures for electrical power. The Laboratory is planning a comprehensive utility planningstudy that will evaluate the ability of the existing systems and will recommend necessary changes to thesystems to meet Laboratory projected utility loads for the next 10 years. Future utility loads are to be modeledfrom the projects listed in the TYCSP. Factors to be considered are the future utility system capabilities,potential threats to existing services such as the end-of-operating life issues, maintenance history, andalternative solutions to ensure adequate utility delivery systems.5-20SWEIS Yearbook—2002
5.4.4 Production Readiness/Plant CapacityIn addition to the research and development contributions to the Stockpile Stewardship Program, theLaboratory has also established a program for limited-manufacturing assignments within the productioncomplex for continued replacement of limited-life components and for replacement of componentsdestructively tested as part of the surveillance program. The goal of the Laboratory’s manufacturing programis to meet present and future component manufacturing requirements for the stockpile and simultaneouslymeet all safety and security requirements. The Laboratory is generally prepared and capable of meeting itsdirective-schedule production and surveillance missions. However, the aging facilities are an issue relative toreadiness for future directed stockpile work.5.4.5 Environment, Safety, and Health/Regulatory IssuesThe Laboratory’s Environment, Safety, and Health management processes are designed to enhanceEnvironment, Safety, and Health performance, preparation of tactical and strategic plans, achievementof Operational Excellence Goals, business efficiency, Appendix F and O of the UC/DOE Prime Contractperformance expectations, and the Laboratory’s commitment to the DOE policy of attaining “daily excellencein the protection of the worker, the public, and the environment.”Compliance Issues. There are four compliance activities that may have an impact on existing and newfacilities:• Quality Assurance: The final Code of Federal Regulation Rule for nuclear facility safetymanagement (10 CFR 830) established new requirements for the Laboratory’s nuclear facilities.• Beryllium Rule Implementation: The Laboratory developed and received approval for a ChronicBeryllium Disease Prevention Program.• Appendix O Safety Analyses: Appendix F and Appendix O of the UC/DOE Prime Contract providespecific expectations for the development and implementation of Safety Authorization Basisdocumentation for both nuclear and nonnuclear facilities.• Hydrogeologic Workplan (Barr 2001): The plan describes activities to characterize thehydrogeologic setting beneath the site and to enhance the groundwater monitoring program.The plan is driven by regulatory requirements of the NMED, DOE Orders, and the Laboratory’scommitment to groundwater protection.Commitments. The Laboratory has made commitments to non-NNSA regulators:• Elimination of Ozone Depleting Equipment: The Laboratory is required to eliminate pre-1984chillers larger than 150 tons that use Class 1 ozone depleting substances. Only two majorreplacement projects remain–TA-48 (Building RC-1) and <strong>LA</strong>NSCE.• Defense <strong>Nuclear</strong> Facilities Safety Board Recommendation 2000-2 (DNFSB 2000): Therecommendation calls for improvement in configuration management of vital safety systems.The Laboratory has major initiatives to revitalize institutional support services, standardize andintegrate facility management programs, and optimize facility management units.Improvements. There are two activities that have an impact on site operations:• Environmental Restoration: A Performance Management Plan for Accelerating Cleanup (<strong>LA</strong>NL2000a) was forwarded to DOE Headquarters in July 2002. The plan calls for completing work by2015 and describes three primary initiatives–legacy TRU and MLLW, groundwater protection, andenvironmental restoration.SWEIS Yearbook—2002 5-21
• Fire Hazard Mitigation: Facility Fire Hazard Assessments are being completed for all nuclearfacilities, high and moderate hazard nonnuclear facilities, new facilities as they are constructed andturned over for operations, and existing facilities with unique fire hazards or risks.• NMED Corrective Action Order: On May 2, 2002, the NMED issued a Determination to <strong>LA</strong>NLalleging that radioactive, hazardous, and solid wastes have been released and “may presentimminent and substantial endangerment to human health or the environment.” NMED publiclystated that it issued the ISE and Draft Order to obtain additional funding from DOE for cleanupat the Laboratory. DOE and UC have requested that NMED withdraw the ISE Determination andtake no further action on the Draft Order. The Laboratory is already implementing, under NMED,a comprehensive, multimedia environmental restoration program that includes addressing, on avoluntary basis, materials beyond NMED’s authority.5.4.6 <strong>Security</strong>A <strong>Security</strong> Strategy Working Group was chartered to identify security issues, prioritize preferred solutions,and provide a multiyear project plan. In response to September 11, 2001, security posts have been added,access restrictions have been implemented, and a permanent screening station for all commercial deliverieshas been added.5.4.7 Workforce ProfileOver the next five years, the Laboratory will experience a significant increase (approximately 13 percent)in the number of personnel. Primarily increasing mission and program requirements drive the impact. Table5.4.7-1 provides workforce data by directorate for January 2002 and projections through FY 2006. The dataTable 5.4.7-1. Current and Projected Workforce Levels by DirectorateC<strong>UR</strong>RENTPROJECTIONSDIRECTORATE (JAN 2002) FY 2002 a FY 20<strong>03</strong> b FY 2004 b FY 2005 c FY 2006 cInstitutional Science Baseand Support DivisionsWorkforce 3,132 3,250 3,318 3,388 3,439 3,473Critical Skills 49 65 69 70 72 73Strategic ResearchWorkforce 1,976 2,048 2,091 2,135 2,167 2,189Critical Skills 220 271 3<strong>03</strong> 304 310 312Threat ReductionWorkforce 1,367 1,453 1,484 1,515 1,537 1,553Critical Skills 64 87 89 90 92 92Weapons Engineering andManufacturingWorkforce 1,716 1,901 1,941 1,982 2,011 2,<strong>03</strong>2Critical Skills 446 534 596 618 628 636Weapons PhysicsWorkforce 2,231 2,371 2,421 2,472 2,509 2,534Critical Skills 423 475 495 511 513 514TotalWorkforce 10,422 d 11,023 11,254 11,491 11,663 11,780Critical Skills 1,202 1,432 1,552 1,593 1,615 1,627Net IncreaseWorkforce 601 231 236 172 117Critical Skills 230 120 41 22 12aFY 2002 projections are approved hires.bProjections represent standard escalations (2.1%).cProjections assume reduced growth rate (FY 2005–1.5%; FY 2006–1.0%).dExcludes JCNNM, PT<strong>LA</strong>, affiliates, and guests.5-22SWEIS Yearbook—2002
in the table are not readily comparable to the numbers of employees that have been routinely compiled forthe Yearbooks (<strong>LA</strong>NL 1999b, 2000b, 2000c, 2001b, 2002d). The data in Table 5.4.7-1 exclude PT<strong>LA</strong> andJCNNM and the critical skills are both a subset of the total workforce and are mission essential for stockpilestewardship. PT<strong>LA</strong>, in response to increased security requirements, is expected to increase by 200. Thesupport services contractor will likely remain constant. These projected increases call for facilities to supporta total workforce of approximately 14,000 people.5.4.8 Transportation and ParkingDevelopment of roads and parking has been incremental and neglected pedestrian, bicycle, and transitimprovements. Maintenance of the transportation infrastructure has generally been inadequate to keep upwith the needs. The new construction at TA-<strong>03</strong> and the population increases at TA-55 have caused parkingshortages. Additional parking lots have been added and are planned for both technical areas. The Laboratoryis working on the development of a transportation infrastructure that provides for security, emergency, andsafety needs.5.4.9 Current Planning InitiativesThe current planning initiatives are directed at consolidation plans to ensure that the Laboratory can meetthe RTBF mission. These efforts include addressing• integrated nuclear planning,• nuclear facilities consolidation,• nuclear materials storage,• Advanced Hydrotest Facility, and• a sanitary landfill.The Los Alamos County landfill that serves both the townsite and the Laboratory is nearing capacity.DOE, the Laboratory, and Los Alamos County are examining potential sites for a new sanitary landfill for thecounty. Laboratory sites are under consideration for the new landfill and discussions have included what canbe done with the current landfill after closure.5.4.10 Facility Strategic PlanningExtensive facility strategic planning efforts for consolidation are ongoing in alignment with and supportof the TYCSP. Along with these efforts, coordinating activities include NEPA, space management, securityplanning, project launch and development, and maintenance prioritization. Projects defined through facilitystrategic planning are based on organizational vision and needs. The projects are prioritized by the directorateand institution through the TYCSP project call process. The projects approved for institutional prioritizationare presented in the TYCSP project lists.5.5 Facilities and Infrastructure Projects5.5.1 Overview of Site Project Prioritization and Cost ProfileThe TYCSP includes projects from the six funding sources described in Table 5.5.1-1.5.5.2 Line Item Highlighted ProjectsThe highlighted projects are DARHT, the CMR Replacement Project, and the <strong>National</strong> <strong>Nuclear</strong> <strong>Security</strong>Building. Both DARHT and the CMR Replacement projects are discussed in Chapter 2, Sections 2.10 and2.1 respectively. The <strong>National</strong> <strong>Security</strong> Science Building is a replacement for the Laboratory’s 45-year-oldSM-43 Building at TA-<strong>03</strong>. The project will provide office and research space to house theoretical and appliedSWEIS Yearbook—2002 5-23
Table 5.5.1-1. Funding SourcesFUNDING SO<strong>UR</strong>CEINCLUDESDefense Program Line Items Consistent with the Integrated Construction Program Plan direction from NNSA onAugust 7, 2002RTBF (no line items)Projects for RTBF facilities achieving warm standby benefits but excluding anyproject needed to increase program capability or capacityFIRPProjects that improve long-term physical conditions and mission availability aswell as address the landlord infrastructure responsibilities of NNSA’s nuclearweapons complexCampaign/Directed Stockpile Work Projects supporting Defense Programs facilities not funded by RTBF and as neededfunded (no line items)to increase program capacity and capabilities in any DP facilitiesNon-NNSA/Defense Programs Non-NNSA/Defense Programs projects supported by specific programsInstitutional General Plant Projects Institutionally funded for institutional benefitsArtist’s rendering of the proposed <strong>National</strong> <strong>Security</strong> Sciences Building at TA-<strong>03</strong>physics, computational sciences, and the Laboratory’s program and senior management functions in supportof the DOE’s Stockpile Stewardship Program. The new building is currently planned to be located near thenew SCC and NISC facilities, to have approximately 275,000 square feet of office space, and to house a staffof approximately 700. Construction of a parking structure and decommissioning and demolition of the SM-43Building would also occur.5.5.3 FIRP Highlighted ProjectsThe highlighted FIRP projects are the <strong>Security</strong> Systems Support Facility, the Decision ApplicationsDivision Office Building, the MST Office Building, and the Health Clinic. All of these projects are discussedin Chapter 2, Section 2.16.5.5.4 RTBF/Operations of Facilities Highlighted ProjectsThe highlighted projects are from ESA Division consolidation. They include• the upgrade of TA-16 West Jemez Road–to improve traffic flow into and out of TA-16, designcompleted in FY 2002, construction will be completed in FY 20<strong>03</strong>;5-24SWEIS Yearbook—2002
Conceptual design of the proposed Technical Area 16 engineering complex• Weapons Plant Support Facility–to provide office and shop space for facility crafts and a changeroom for high explosives workers, fully funded in FY 2002, contract awarded in September 2002,completion expected in FY 2004;• security upgrades and fencing–infrastructure improvements; and• roads and utilities–improvements for utility upgrades and road relocations.5.5.5 Non-RTBF/FIRP Highlighted ProjectsThe highlighted projects are the NISC, the Emergency Operation Center, the Cerro Grande Fire Officereplacements, the Manufacturing Technical Support Facility, and the Center for Integrated Nanotechnologies.Only the Center for Integrated Nanotechnologies is not discussed in Chapter 2.SWEIS Yearbook—2002 5-25
Emergency Operations Center (above center), ManufacturingTechnical Support Facility (above left), Conceptual Design ofthe Center for Integrated Nanotechnologies (above right)The Center for Integrated Nanotechnologies will be a distributed center to be operated jointly by Sandia<strong>National</strong> Laboratories and Los Alamos. The Los Alamos element of the project will provide a 31,000-squarefootgateway to connect scientists to the extensive biosciences and nanomaterials capabilities of <strong>LA</strong>NL.5.5.6 Institutional General Plant ProjectsInstitutional General Plant Projects is a newly approved funding source for new construction projects atmultiprogram NNSA sites. Projects of a general institutional nature that are required for general purpose sitewideneeds are considered appropriate candidates. Examples of projects that could be proposed in future yearsinclude the following:• multiprogrammatic/interdisciplinary scientific laboratory,• institutional training facility,• new roads/parking,• multiprogrammatic office space, and• multiprogrammatic facilities required for “Quality of Life” improvements.The Laboratory has proposed two projects for consideration.5-26SWEIS Yearbook—2002
5.5.7 Facilities and Infrastructure Cost Projection SpreadsheetsThe Laboratory accomplishes critical infrastructure development, renovations, and upgrades through lineitem, general plant, capital equipment, and expense-funded projects. The primary categories of projects andcosts are• existing and proposed line item construction,• other project costs for existing and proposed line item construction,• preliminary engineering and design for proposed line item construction,• capital equipment,• expense,• General Plant Project,• institutional,• maintenance,• standby,• decommissioning and demolition, and• facility management and site planning costs.SWEIS Yearbook—2002 5-27
5.6 ReferencesAmerican Standard of Testing Materials International, 2000. “Standard Practice for Environmental SiteAssessments: Phase 1 Environmental Site Assessment Process,” ASTM E 1527-00, West Conshohoken,PA.Barr, A. R., 2001. “Hydrogeologic Workplan,” <strong>LA</strong>-<strong>UR</strong>-01-6511, Los Alamos <strong>National</strong> Laboratory,Los Alamos, NM.Beers, R. S., 2001. “Los Alamos <strong>National</strong> Laboratory Site-Wide Water Conservation Program Plan,”<strong>LA</strong>-<strong>UR</strong>-01-6377, Los Alamos <strong>National</strong> Laboratory, Los Alamos, NM.Defense <strong>Nuclear</strong> Facilities Safety Board, 2000. “Configuration Management, Vital Safety Systems,”DNFSB Recommendation 2002-2, Washington, D.C.Department of Energy, 1999a. “Site-Wide Environmental Impact Statement for Continued Operation of theLos Alamos <strong>National</strong> Laboratory,” DOE/EIS-0238, Albuquerque, NM.Department of Energy, 1999b. “Cross-Cut Guidance on Environmental Requirements for DOE Real PropertyTransfers,” DOE/EH-413/9712, Washington, D.C.Department of Energy, 1999c. “Record of Decision: SWEIS in the State of New Mexico,” 64 FR 50797,Washington, D.C.Department of Energy, 2002. “Integrated Natural and Cultural Resources Management Plan for Los Alamos<strong>National</strong> Laboratory,” Department of Energy/<strong>National</strong> <strong>Nuclear</strong> <strong>Security</strong> <strong>Administration</strong>, Office ofLos Alamos Site Operations, Los Alamos, NM.Federal Register, 2001. “<strong>Nuclear</strong> Safety Management,” US Department of Energy, 10 CFR 830, Vol. 66,No. 7, Washington, D.C.Los Alamos <strong>National</strong> Laboratory, 1999a. “Comprehensive Site Plan 2000, Technical Site InformationDocument,” <strong>LA</strong>-<strong>UR</strong>-99-6704, Los Alamos, NM.Los Alamos <strong>National</strong> Laboratory, 1999b. “SWEIS 1998 Yearbook,” <strong>LA</strong>-<strong>UR</strong>-99-6391, Los Alamos, NM.(http://lib-www.lanl.gov/cgi-bin/getfile?00460172.pdf).Los Alamos <strong>National</strong> Laboratory, 2000a. “Environmental Restoration: A Performance Management Plan forAccelerating Cleanup,” Los Alamos, NM.Los Alamos <strong>National</strong> Laboratory, 2000b. “SWEIS Yearbook – 1999,” <strong>LA</strong>-<strong>UR</strong>-00-5520, Los Alamos, NM.(http://lib-www.lanl.gov/cgi-bin/getfile?<strong>LA</strong>-<strong>UR</strong>-00-5520.htm).Los Alamos <strong>National</strong> Laboratory, 2000c. “A Special Edition of the SWEIS Yearbook, Wildfire 2000,”<strong>LA</strong>-<strong>UR</strong>-00-3471, Los Alamos, NM. (<strong>LA</strong>NL 2000b, http://lib-www.lanl.gov/cgi-bin/getfile?/0<strong>03</strong>93627.pdf).Los Alamos <strong>National</strong> Laboratory, 2001a. “Ten Year Comprehensive Site Plan,” <strong>LA</strong>-CP-01-374, Los Alamos,NM.5-28SWEIS Yearbook—2002
Los Alamos <strong>National</strong> Laboratory, 2001b. “SWEIS Yearbook – 2000,” <strong>LA</strong>-<strong>UR</strong>-01-2965, Los Alamos, NM.(<strong>LA</strong>NL 2001a, http://lib-www.lanl.gov/la-pubs/00818189.pdf).Los Alamos <strong>National</strong> Laboratory, 2002a. “Ten Year Comprehensive Site Plan FY<strong>03</strong>,” <strong>LA</strong>-CP-02-421,Los Alamos, NM.Los Alamos <strong>National</strong> Laboratory, 2002b. “Readiness in Technical Base and Facilities FY2002 ImplementationPlan,” <strong>LA</strong>-CP-01-313, Rev. 1.1, Los Alamos, NM.Los Alamos <strong>National</strong> Laboratory, 2002c. “Readiness in Technical Base and Facilities FY2002 ImplementationPlan,” <strong>LA</strong>-CP-02-413, Los Alamos, NM.Los Alamos <strong>National</strong> Laboratory, 2002d. “SWEIS Yearbook – 2001,” <strong>LA</strong>-<strong>UR</strong>-02-3143, Los Alamos, NM.(http://lib-www.lanl.gov/cgi-bin/getfile?00818857.pdf).Tate, R. A., 2001. “Comprehensive Site Plan 2001,” <strong>LA</strong>-<strong>UR</strong>-01-1838, Los Alamos <strong>National</strong> Laboratory,Los Alamos, NM.Public Law 105-119, Departments of Commerce, Justice, and State, the Judiciary, and Related AgenciesAppropriations Act, 1998.University of California/Department of Energy-<strong>National</strong> <strong>Nuclear</strong> <strong>Security</strong> <strong>Administration</strong> Prime ContractW-7405-ENG-36.SWEIS Yearbook—2002 5-29
5-30SWEIS Yearbook—2002
6.0 Summary and ConclusionThe 2002 Yearbook is a special edition to assist DOE/NNSA in evaluating the need for preparing a newSWEIS for <strong>LA</strong>NL. Instead of limiting this edition of the Yearbook to CY 2002 data, the 2002 Yearbooksummarizes the data routinely collected from CY 1998 through CY 2002:• facility and/or process modifications or additions,• types and levels of operations during the calendar year,• operations data for the Key Facilities, and• site-wide effects of operations for the calendar year.This Yearbook also contains additional text and tabular summaries as well as a trend analysis and indicatesthe Laboratory’s programmatic progress in moving towards the SWEIS projections.6.1 SummaryThe 2002 SWEIS Yearbook reviews CY 1998 through CY 2002 operations for the 15 Key Facilities(as defined by the SWEIS) at <strong>LA</strong>NL and compares those operations to levels projected by the ROD. TheYearbook also reviews the environmental parameters associated with operations at the same 15 Key Facilitiesand compares these data with ROD projections. In addition, the Yearbook presents a number of site-wideeffects of those operations and environmental parameters. The more significant results presented in theYearbook are as follows:Facility Construction and Modifi cations. The ROD projected a total of 38 facility construction andmodification projects for <strong>LA</strong>NL facilities. Ten of these projects were listed only in the Expanded OperationsAlternative, such as modifications at CMR for safety testing of pits in the Wing 9 hot cells, expansion ofthe LLW disposal area at TA-54, Area G, and the LPSS at TA-53. These ten projects could not proceed untilDOE issued the ROD in September 1999. However, the remaining 28 construction projects were projected inthe No Action Alternative. These included facility upgrades (e.g., safety upgrades at the CMR Building andprocess upgrades at the RLWTF), facility renovation (e.g., conversion of the former Rolling Mill, Building<strong>03</strong>-141, to the Beryllium Technology Facility), and the erection of new storage domes at TA-54 for TRUwastes. Since these projects had independent NEPA documentation, they could proceed while the SWEIS wasstill in process.Of the 38 facility construction and modification projects for <strong>LA</strong>NL projected in the ROD, 20 projects havenow been completed: Six of these projects were completed in 1998, eight in 1999, two in 2000, none in 2001,and four in 2002. The number of projects started or continued each year were 13 in 1998, 10 in 1999, seven in2000, and six in both 2001 and 2002.During 2002, planned construction and/or modifications continued at six of the 15 Key Facilities. Theseactivities were both modifications within existing structures and new or replacement facilities. New structurescompleted and occupied during 2002 included the TA-18 Relocation Project Office Building between TA-48 and TA-55, the Vessel Preparation Facility at TA-15, a Camera Room at TA-36-12, a Carpenter Shop atTA-15, the X-Ray Calibration Facility at TA-15, a warehouse at TA-15, and the transportable office buildingTA-48-210. Additionally, 13 major construction projects were either completed or continued for the Non-KeyFacilities. These projects were as follows:• Construction continued on the NISC begun in March 2001.• Atlas was disassembled and relocated to the Nevada Test Site in December 2002.• Construction of the Emergency Operations Center started in January 2002.• Construction of the S-3 Facility started in July 2002.SWEIS Yearbook—2002 6-1
• Construction of the DecisionApplications Division Office Buildingstarted in September 2002.• Construction of the new MedicalFacility started in October 2002.• The Chemistry Division OfficeBuilding was constructed, completed,and occupied.• Construction of the MST OfficeBuilding started in November 2002.• Construction of the TA-72 Live-FireShoot House started in November2002.• The <strong>Security</strong> Truck InspectionStation was constructed and becameoperational.• The High Pressure Tritium Facility(TA-33-86) underwent decontaminationand decommissioning and is now demolished.The suspended catwalk observation platform in the Live Fire ShootHouse• Demolition activities began in July 2002 on the Omega West Facility.• TA-41-30 and the front of TA-41-4 were demolished August to October 2002.A major modification project, elimination and/or rerouting of NPDES outfalls, was completed in 1999,bringing the total number of permitted outfalls down from the 55 identified by the SWEIS ROD to 20. During2000, Outfall <strong>03</strong>A-199, which will serve the TA-<strong>03</strong>-1837 cooling towers, was included in the new NPDESpermit issued by the EPA on December 29, 2000. This brought the total number of permitted outfalls up to 21.Demolition of the Omega West Facility6-2SWEIS Yearbook—2002
Facility Operations. The SWEIS grouped <strong>LA</strong>NL into 15 Key Facilities, identified the operations at each,and then projected the level of activity for each operation. These operations were grouped in the SWEIS under96 different capabilities for the Key Facilities. With a few exceptions, the capabilities identified in the SWEISROD for <strong>LA</strong>NL have remained constant since 1998. The exceptions are the• movement of the Nonproliferation Training/<strong>Nuclear</strong> Measurement School between Pajarito Siteand the CMR Building during 2000 and 2002,• relocation of the Decontamination Operations Capability from the RLWTF to the Solid Radioactiveand Chemical Waste Facilities in 2001,• transfer of part of the Characterization of Materials Capability from Sigma to the TFF in 2001, and• loss of Cryogenic Separation Capability at the Tritium Key Facilities in 2001.Also, following the events of September 11, 2001, the Laboratory was requested to provide support forhomeland security.Since 1998, fewer than the 96 capabilities identified for <strong>LA</strong>NL have been active. During 1998, only 87capabilities were active. The nine capabilities with no activity were Manufacturing Plutonium Componentsat the Plutonium Complex; both Uranium Processing and Nonproliferation Training at the CMR Building;Accelerator Transmutation of Wastes at <strong>LA</strong>NSCE; Biologically Inspired Materials and Chemistry,Computational Biology, and Molecular and Cell Biology at the Bioscience Facilities; and both Size Reductionand Other Waste Processing at the Solid Radioactive and Chemical Waste Facilities.During CY 1999, 91 capabilities were active. The five inactive capabilities were Fabrication andMetallography at CMR; both Accelerator Transmutation of Wastes and Medical Isotope Production at<strong>LA</strong>NSCE; and both Size Reduction and Other Waste Processing at the Solid Radioactive and Chemical WasteFacilities.During CY 2000, 89 capabilities were active. The seven inactive capabilities were Fabrication ofCeramic-Based Reactor Fuels at the Plutonium Complex; Diffusion and Membrane Purification at theTritium Facilities; both Destructive and Nondestructive Assay and Fabrication and Metallography at CMR;Accelerator Transmutation of Wastes and Medical Isotope Production at <strong>LA</strong>NSCE; and both Size Reductionand Other Waste Processing at the Solid Radioactive and Chemical Waste Facilities.During CY 2001, 87 capabilities were active. The nine inactive capabilities were both ManufacturingPlutonium Components and Fabrication of Ceramic-Based Reactor Fuels at the Plutonium Complex; bothCryogenic Separation and Diffusion and Membrane Purification at the Tritium Facilities; both Destructive andNondestructive Assay and Fabrication and Metallography at CMR; Accelerator Transmutation of Wastes andMedical Isotope Production at <strong>LA</strong>NSCE; and Other Waste Processing at the Solid Radioactive and ChemicalWaste Facilities.During CY 2002, 88 capabilities were active. The eight inactive capabilities were: ManufacturingPlutonium Components at the Plutonium Complex; both the Cryogenic Separation and the Diffusion andMembrane Purification capabilities at the Tritium Facilities; both the Destructive and Nondestructive Assayand the Fabrication and Metallography capabilities at CMR; both the Accelerator Transmutation of Wastesand the Medical Isotope Production capabilities at <strong>LA</strong>NSCE; and Other Waste Processing at the SolidRadioactive and Chemical Waste Facilities.While there was activity under nearly all capabilities, the levels of these activities were mostly belowlevels projected by the ROD. For example, the <strong>LA</strong>NSCE linac generated an H - beam to the Lujan Center for2,3<strong>03</strong> hours in 2002, at an average current of 105 microamps, compared to 6,400 hours at 200 microampsSWEIS Yearbook—2002 6-3
projected by the ROD. Similarly, a total of 160 criticality experiments were conducted at Pajarito Site,compared to the 1,050 projected experiments.As in 1998 through 2001, only three of <strong>LA</strong>NL’s facilities operated during 2001 at levels approximatingthose projected by the ROD—the MSL, the Bioscience Facilities (formerly HRL), and the Non-Key Facilities.The two Key Facilities (MSL and Bioscience) are more akin to the Non-Key Facilities and represent thedynamic nature of research and development at <strong>LA</strong>NL. More importantly, none of these facilities are majorcontributors to the parameters that lead to significant potential environmental impacts. The remaining 13 KeyFacilities all conducted operations at or below projected activity levels.Operations Data and Environmental Parameters. This 2002 Yearbook evaluates the effects of <strong>LA</strong>NLoperations in three general areas—effluents to the environment, workforce and regional consequences, andchanges to environmental areas for which the DOE has stewardship responsibility as the owner of a large tractof land.Effluents include air emissions, liquid effluents regulated through the NPDES program, and solid wastes.From 1998 through 2002, radioactive airborne emissions from point sources (i.e., stacks) have varied froma low of 1,900 curies during 1999 to a high of approximately 15,400 curies during 2001, 70 percent of the10-year average of 21,700 curies projected by the SWEIS ROD. The final dose over this same five-yearperiod has varied from a low of 0.32 millirem in 1999 to a high of 1.84 millirem during 2001 (compared to5.44 projected), with the final dose of 1.69 millirem for 2002 being reported to the EPA by June 30, 2002.Calculated NPDES discharges have ranged from a low of 124 million gallons per year in 2001 to a highof 317 million gallons per year in 1999 compared to a projected volume of 278 million gallons per year.However, the apparent decrease in flows is primarily due to the methodology by which flow was measuredand reported in the past.Historically, instantaneous flow was measured during field visits as required in the NPDES permit. Thesemeasurements were then extrapolated over a 24-hour day/seven-day week. With implementation of the newNPDES permit on February 1, 2001, data are collected and reported using actual flows recorded by flowmeters at most outfalls. At those outfalls that do not have meters, the flow is calculated as before, basedon instantaneous flow. Quantities of solid radioactive and chemical wastes generated have ranged fromapproximately 3.2 percent of the MLLW projections during both 1999 and 2002 to 1,291 percent and 1,309percent of the chemical waste projections during 2001 and 2000, respectively. The extremely large quantitiesof chemical waste (23.0 million kilograms during 2001 and 27.2 million kilograms during 2000) are a resultof ER Project activities. (For example, the remediation of MDA-P resulted in 21.5 million kilograms, or88 percent, of the 24.4 million kilograms of chemical waste generated during 2001.) Most chemical wastesare shipped offsite for disposal at commercial facilities; therefore, these large quantities of chemical wastewill not impact <strong>LA</strong>NL environs. The chemical waste quantities are the only solid waste type to have met orexceeded the SWEIS ROD projections between 1998 and 2002.The workforce has been above ROD projections since 1997. The 13,524 employees at the end of CY2002 represent 2,173 more employees than projected and the highest number of employees over the period.Thus, regional socioeconomic consequences, such as salaries and procurements, also should have exceededprojections.Since 1998, the peak electricity consumption was 394 gigawatt-hours during 2002 and the peak demandwas 72 megawatts during 2001 compared to projections of 782 gigawatt-hours with a peak demand of 113megawatts. The peak water usage was 461 million gallons during 1998 (compared to 759 million gallonsprojected), and the peak natural gas consumption was 1.49 million decatherms during 2001 (compared to 1.84projected).6-4SWEIS Yearbook—2002
Between 1998 and 2002, the highest collectiveTEDE for the <strong>LA</strong>NL workforce was 196 personremduring 2000, which is considerably lowerthan the workforce dose of 704 person-remprojected by the ROD.Measured parameters for ecologicalresources and groundwater were similar to RODprojections, and measured parameters for culturalresources and land resources were below RODprojections. For land use, the ROD projectedthe disturbance of 41 acres of new land at TA-54 because of the need for additional disposalcells for LLW. As of 2002, this expansion hadnot become necessary. However, constructioncontinued on 44 acres of land that are beingdeveloped along West Jemez Road for the LosAlamos Research Park. This project has itsown NEPA documentation (an environmental Anthropomorphic petroglyphassessment), and the land is being leased to LosAlamos County for this privately owned development.Cultural resources remained protected, and no excavation of sites at TA-54 or any other part of <strong>LA</strong>NLhas occurred. (The ROD projected that 15 prehistoric sites would be affected by the expansion of Area Ginto Zones 4 and 6 at TA-54.) However, there have beenexcavations related to the land transfer project under theauspices of a programmatic agreement between the DOE,the State Historic Preservation Office, and the AdvisoryCouncil on Historic Preservation. These excavationsare required before releasing these lands to Los AlamosCounty under Public Law 105-119.As projected by the ROD, water levels in wellspenetrating into the regional aquifer continue to declinein response to pumping, typically by several feet eachyear. In areas where pumping has been reduced, waterlevels show some recovery. No unexplained changesin patterns have occurred in the 1995–2002 period, andwater levels in the regional aquifer have continued agradual decline that started in about 1977.Day fl owerIn addition, ecological resources are being sustainedas a result of protection afforded by DOE ownership of<strong>LA</strong>NL. These resources include biological resourcessuch as protected sensitive species, ecological processes,and biodiversity. The recovery and response to theCerro Grande Fire of May 2000 has included a wildfirefuels reduction program, burned area rehabilitation andmonitoring efforts, and enhanced vegetation and wildlifemonitoring.SWEIS Yearbook—2002 6-5
6.2 ConclusionsIn conclusion, <strong>LA</strong>NL operations data mostly fell within projections. Operations data that exceededprojections, such as number of employees or chemical waste from cleanup, either produced a positive impacton the economy of northern New Mexico or resulted in no local impact because these wastes were shippedoffsite for disposal. Overall, the 1998 through 2002 operations data indicate that the Laboratory was operatingwithin the SWEIS envelope.The 1998 through 2002 data indicate that <strong>LA</strong>NL operations typically remained below levels projected bythe SWEIS ROD. There are two main reasons for this fact. The ROD was not issued until September 1999;consequently, operations were more likely to be at levels consistent with pre-ROD conditions. Moreover, datain the SWEIS were presented for the highest level projected over the 10-year period 1996–2005. Thus, thedata from early years in the projection period (1996–2002) would be expected to fall below the maximum.One purpose of the 2002 Yearbook is to compare <strong>LA</strong>NL operations and resultant 1998 through 2002data to the SWEIS ROD to determine if <strong>LA</strong>NL was still operating within the environmental envelopeestablished by the SWEIS and the ROD. Data for 1998 through 2002 indicate that positive impacts (such associoeconomics) were greater than SWEIS ROD projections, while negative impacts, such as radioactive airemissions and land disturbance, were within the SWEIS envelope.6.3 To the FutureThe Yearbook will continue to be prepared on an annual basis, with operations and relevant parameters in agiven year compared to SWEIS projections for activity levels chosen by the ROD. The presentation proposedfor the 20<strong>03</strong> Yearbook will follow that developed for the previous Yearbooks—comparison to the SWEISROD. As requested by DOE/NNSA, the Laboratory will include the results of an updated wildfire analysis inthe 20<strong>03</strong> Yearbook.The 2002 Yearbook is an important step forward in fulfilling a commitment to make the SWEIS for <strong>LA</strong>NLa living document. Future Yearbooks are planned to continue that role.Wetland in Pajarito Canyon6-6SWEIS Yearbook—2002
Pajarito CanyonSWEIS Yearbook—2002 6-7
6-8SWEIS Yearbook—2002
SWEIS Yearbook—2002 A-1Table A-1. Chemistry and Metallurgy Research Building Air EmissionsKEYFACILITYCHEMICAL NAMECASNUMBERUNITS1999ESTIMATEDAIREMISSIONS1999USAGE2000ESTIMATEDAIREMISSIONS2000USAGE2001ESTIMATEDAIREMISSIONS2001USAGE2002ESTIMATEDAIREMISSIONS2002USAGECMR Acetic Acid 64-19-7 kg/yr 0.2 0.5Acetone 67-64-1 kg/yr 2.5 7.1 6.10 17.41 1.94 5.53Acetonitrile 75-05-8 kg/yr 0.27 0.79Acetylene 74-86-2 kg/yr 0.00 5.26Ammonium Chloride (Fume) 12125-02-9 kg/yr 0.3 0.8Arsenic, el.&inorg.,exc. Arsine,as As 7440-38-2 kg/yr 0.20 0.56 0.39 1.12Diethylene Triamine 111-40-0 kg/yr 0.3 1.0 0.17 0.48Ethanol 64-17-5 kg/yr 3.1 9.0 4.01 11.47 2.95 8.43 2.62 7.50Ethyl Acetate 141-78-6 kg/yr 0.16 0.45Formic Acid 64-18-6 kg/yr 10.0 28.7 0.43 1.22Hydrogen Bromide 10<strong>03</strong>5-10-6 kg/yr 1.6 4.5 1.05 3.01 0.74 2.10 1.05 3.00Hydrogen Chloride 7647-01-0 kg/yr 43.2 123.4 5.00 14.27 11.43 32.64 21.81 62.32Hydrogen Fluoride, as F 7664-39-3 kg/yr 0.3 0.7 0.69 1.98 0.60 1.73 0.09 0.25Hydrogen Peroxide 7722-84-1 kg/yr 24.1 68.9 0.30 0.85 1.72 4.92Lead, el.& inorg.compounds, asPb 7439-92-1 kg/yr 0.<strong>03</strong> 3.00Magnesium Oxide Fume 1309-48-4 kg/yr 0.4 1.0Mercury numerous forms 7439-97-6 kg/yr 0.01 1.36 0.01 1.36Methyl Alcohol 67-56-1 kg/yr 0.1 0.4 2.22 6.34 8.86 25.33 0.72 2.06Methylene Chloride 75-09-2 kg/yr 0.47 1.33 0.46 1.33Molybdenum 7439-98-7 kg/yr 0.36 1.02n-Amyl Acetate 628-63-7 kg/yr 0.2 0.4Nitric Acid 7697-37-2 kg/yr 7.49 21.41 54.48 155.65 51.81 148.02Nitric Oxide 10102-43-9 kg/yr 2.93 8.36Pentane (all isomers) 109-66-0 kg/yr 0.22 0.63Phosphoric Acid 7664-38-2 kg/yr 9.6 27.5 8.02 22.93 9.63 27.51Potassium Hydroxide <strong>131</strong>0-58-3 kg/yr 16.9 48.3Propane 74-98-6 kg/yr 0.0 219.3 0.00 392.98 0.00 551.69 0.00 155.10Rhodium Metal 7440-16-6 kg/yr 3.26 9.31
A-2Table A-1. Chemistry and Metallurgy Research Building Air Emissions (continued)KEYFACILITYCHEMICAL NAMECASNUMBERUNITS1999ESTIMATEDAIREMISSIONS1999USAGE2000ESTIMATEDAIREMISSIONS2000USAGE2001ESTIMATEDAIREMISSIONS2001USAGE2002ESTIMATEDAIREMISSIONS2002USAGESulfur Hexafluoride 2551-62-4 kg/yr 5.17 14.76Sulfuric Acid 7664-93-9 kg/yr 70.8 202.4 6.61 18.90 7.89 22.54 25.44 72.68Tetrahydrofuran 109-99-9 kg/yr 0.31 0.89Tin numerous forms 7440-31-5 kg/yr 0.01 0.50 0.01 0.50Toluene 108-88-3 kg/yr 0.30 0.87Uranium (natural) Sol. & Unsol.Comp. as U 7440-61-1 kg/yr 0.67 1.90Yttrium 7440-65-5 kg/yr 0.16 0.45Zinc Oxide Fume <strong>131</strong>4-13-2 kg/yr 0.01 0.50SWEIS Yearbook—2002
SWEIS Yearbook—2002 A-3Table A-2. Bioscience Air EmissionsKEYFACILITYCASNUMBER1999ESTIMATEDAIREMISSIONS1999USAGE2000ESTIMATEDAIREMISSIONS2000USAGE2001ESTIMATEDAIREMISSIONS2001USAGE2002ESTIMATEDAIREMISSIONSCHEMICAL NAMEUNITSHRL 1,4-Dioxane 123-91-1 kg/yr 0.4 1.0 0.18 0.522-Methoxyethanol (EGME) 109-86-4 kg/yr 0.2 0.5Acetic Acid 64-19-7 kg/yr 4.0 11.5 12.36 35.31 10.65 30.43 11.20 32.00Acetic Anhydride 108-24-7 kg/yr 8.4 24.1Acetone 67-64-1 kg/yr 10.6 30.4 0.55 1.58 0.41 1.18 0.28 0.79Acetonitrile 75-05-8 kg/yr 231.6 661.6 147.16 420.44 39.32 112.36 18.45 52.72Acrylamide 79-06-1 kg/yr 0.6 1.6 0.39 1.12Ammonium Chloride (Fume) 12125-02-9 kg/yr 0.6 1.6 0.35 1.00 0.18 0.50Catechol 120-80-9 kg/yr 0.7 2.0Chlorodifluoromethane 74-45-6 kg/yr 0.10 0.28Chloroform 67-66-3 kg/yr 2.6 7.6 2.86 8.17 3.93 11.24 8.85 25.29Chromic Acid 1333-82-0 kg/yr 1.3 3.8Cyclohexane 110-82-7 kg/yr 0.1 0.4Diethanolamine 111-42-2 kg/yr 0.18 0.50Ethanol 64-17-5 kg/yr 94.2 269.1 26.07 74.48 54.56 155.88 0.55 1.56Ethanolamine 141-43-5 kg/yr 0.7 2.0Ethyl Acetate 141-78-6 kg/yr 0.14 0.41Ethyl Ether 60-29-7 kg/yr 2.9 8.4 1.96 5.60 1.23 3.50Ethylene Diamine 107-15-3 kg/yr 4.2 12.0Ethylene Dichloride 107-06-2 kg/yr 0.22 0.62Formamide 75-12-7 kg/yr 5.2 14.9 0.20 0.57 0.20 0.57 0.87 2.47Formic Acid 64-18-6 kg/yr 0.64 1.83 0.21 0.60Glutaraldehyde 111-30-8 kg/yr 0.39 1.10Hexane (other isomers)* orn-Hexane 110-54-3 kg/yr 0.3 1.0Hexylene Glycol 107-41-5 kg/yr 0.1 0.4Hydrogen Chloride 7647-01-0 kg/yr 2.1 5.9 3.96 11.30 5.23 14.96 10.18 29.08Hydrogen Fluoride, as F 7664-39-3 kg/yr 0.2 0.5Hydrogen Peroxide 7722-84-1 kg/yr 0.5 1.4 1.27 3.62 0.25 0.70 4.23 12.10Hydrogen Sulfide 7783-06-4 kg/yr 0.08 0.232002USAGE
A-4Table A-2. Bioscience Air Emissions (continued)KEYFACILITYCASNUMBER1999ESTIMATEDAIREMISSIONS1999USAGE2000ESTIMATEDAIREMISSIONS2000USAGE2001ESTIMATEDAIREMISSIONS2001USAGE2002ESTIMATEDAIREMISSIONS2002USAGECHEMICAL NAMEUNITSIso-Amyl Alcohol 123-51-3 kg/yr 0.7 2.0 0.11 0.32Isopropyl Alcohol 67-63-0 kg/yr 21.9 62.4 25.07 71.63 16.91 48.31 18.83 53.81Mercury, numerous forms 7439-97-6 kg/yr 0.0 0.5Methyl Alcohol 67-56-1 kg/yr 28.5 81.3 18.30 52.30 25.73 73.52 26.31 75.18Methylamine 74-89-5 kg/yr 0.32 0.90Methylene Chloride 75-09-2 kg/yr 16.9 48.4 0.98 2.79n,n-Dimethylformamide 68-12-2 kg/yr 0.6 1.6 0.33 0.95 0.17 0.47 0.25 0.71n-Butyl Alcohol 71-36-3 kg/yr 0.6 1.6Nitric Acid 7697-37-2 kg/yr 0.27 0.76 2.67 7.63 0.27 0.76Paraffin Wax Fume 8002-74-2 kg/yr 0.2 0.5Phenol 108-95-2 kg/yr 1.9 5.6 0.63 1.80 0.68 1.95 0.30 0.85Phosphoric Acid 7664-38-2 kg/yr 1.0 3.0 0.32 0.92 0.32 0.92 0.32 0.92Potassium Hydroxide <strong>131</strong>0-58-3 kg/yr 0.2 0.5 0.18 0.50 0.18 0.53 0.70 2.00Sec-Butyl Alcohol 105-46-4 kg/yr 0.1 0.4Sulfuric Acid 7664-93-9 kg/yr 1.7 4.8 0.65 1.84 0.64 1.84tert-Butyl Alcohol 75-65-0 kg/yr 0.28 0.79 0.14 0.39Tetrahydrofuran 109-99-9 kg/yr 17.2 49.2Tetrasodium Pyrophosphate 7722-88-5 kg/yr 0.2 0.5 0.18 0.50Thioglycolic Acid 68-11-1 kg/yr 0.23 0.66 0.47 1.35Trichloroacetic Acid 76-<strong>03</strong>-9 kg/yr 4.9 14.0 0.53 1.50 0.21 0.60Xylene (o-,m-,p-Isomers) 1330-20-7 kg/yr 0.2 0.4Zinc Chloride Fume 7646-85-7 kg/yr 0.4 1.2SWEIS Yearbook—2002
SWEIS Yearbook—2002 A-5Table A-3. High Explosive Processing Air Emissions1999ESTIMATEDAIREMISSIONS2000ESTIMATEDAIREMISSIONS2001ESTIMATEDAIREMISSIONS2002ESTIMATEDAIREMISSIONSKEYFACILITY CHEMICAL NAMECASNUMBER UNITS1999USAGE2000USAGE2001USAGE2002USAGEHighExplosiveProcessing Acetic Acid 64-19-7 kg/yr 14.7 42.0Acetone 67-64-1 kg/yr 66.4 189.8 3.32 9.50 113.08 323.07 66.63 190.37Acetonitrile 75-05-8 kg/yr 16.2 46.3Acetylene 74-86-2 kg/yr 7.7 22.0Carbon Black 1333-86-4 kg/yr 0.4 1.0Chlorodifluoromethane 74-45-6 kg/yr 168.3 480.8Chloroform 67-66-3 kg/yr 1.0 3.0 0.52 1.48Chromic acids and chromates 1333-82-0 kg/yr 0.2 0.5Copper 7440-50-8 kg/yr 0.0 0.5Cyclohexane 110-82-7 kg/yr 0.1 0.4Cyclohexanone 108-94-1 kg/yr 0.3 0.9Dichlorodifluoromethane 75-71-8 kg/yr 0.1 0.2Ethanol 64-17-5 kg/yr 174.6 498.7 0.83 2.37 60.22 172.06 0.60 1.72Ethyl Acetate 141-78-6 kg/yr 65.92 188.34Ethyl Ether 60-29-7 kg/yr 1.5 4.2Ethylene Dichloride 107-06-2 kg/yr 8.6 24.7 0.43 1.24Fluorine 7782-41-4 kg/yr 2.52 7.20Hexane (other isomers)* or n-Hexane 110-54-3 kg/yr 0.12 0.33Hydrogen Chloride 7647-01-0 kg/yr 11.9 34.1 9.58 27.36 6.23 17.81Hydrogen Fluoride, as F 7664-39-3 kg/yr 0.2 0.4Hydrogen Peroxide 7722-84-1 kg/yr 15.8 45.0Isobutyl Alcohol 78-83-1 kg/yr 0.53 1.52Isopropyl Alcohol 67-63-0 kg/yr 5.5 15.6 5.51 15.74 2.20 6.28 4.40 12.57Lead, el. and compounds, asPb 7439-92-1 kg/yr 0.05 4.54Mercury, numerous forms 7439-97-6 kg/yr 0.3 29.0Methyl Alcohol 67-56-1 kg/yr 37.3 106.4Methyl Cyclohexane 108-87-2 kg/yr 0.3 0.8
A-6SWEIS Yearbook—2002Table A-3. High Explosive Processing Air Emissions (continued)KEYFACILITYCASNUMBER1999ESTIMATEDAIREMISSIONS1999USAGE2000ESTIMATEDAIREMISSIONS2000USAGE2001ESTIMATEDAIREMISSIONS2001USAGE2002ESTIMATEDAIREMISSIONS2002USAGECHEMICAL NAMEUNITSMethyl Ethyl Ketone (MEK) 78-93-3 kg/yr 169.7 484.9 33.83 96.65Methylene Chloride 75-09-2 kg/yr 7.4 21.2n,n-Dimethylformamide 68-12-2 kg/yr 4.0 11.4Nitric Oxide 10102-43-9 kg/yr 2.7 7.6 5.84 16.68Nitrous Oxide 10024-97-2 kg/yr 3.9 11.1Pentane (all isomers) 109-66-0 kg/yr 0.18 0.50Phenol 108-95-2 kg/yr 0.4 1.0Phosphoric Acid 7664-38-3 kg/yr 9.65 27.57Potassium Hydroxide <strong>131</strong>0-58-3 kg/yr 0.18 0.50Propane 74-98-6 kg/yr 0.0 4396.2 0.00 86.41 0.00 170.60Propyl Alcohol 71-23-8 kg/yr 1.4 4.0Silver (metal dust and solublecomp., as Ag) 7440-22-4 kg/yr 0.1 6.2Stoddard Solvent 8052-41-3 kg/yr 1.08 3.08Sulfur Hexafluoride 2551-62-4 kg/yr 1.6 4.6Sulfuric Acid 7664-93-9 kg/yr 2.6 7.4Tetrahydrofuran 109-99-9 kg/yr 21.5 61.4 0.16 0.44 14.32 40.90Thionyl Chloride 7719-09-7 kg/yr 0.2 0.5Toluene 108-88-3 kg/yr 5.3 15.1 0.61 1.74 9.71 27.74Tungsten as W insolubleCompounds 7440-33-7 kg/yr 0.96 96.07 0.01 0.50Turpentine 8006-64-2 kg/yr 1.1 3.2VM and P Naptha 8<strong>03</strong>2-32-4 kg/yr 0.50 1.42Xylene (o-,m-,p-Isomers) 1330-20-7 kg/yr 0.3 0.8Zinc Oxide Fume <strong>131</strong>4-13-2 kg/yr 0.8 2.3
SWEIS Yearbook—2002 A-7Table A-4. High Explosive Testing Air Emissions1999ESTIMATEDAIREMISSIONS2000ESTIMATEDAIREMISSIONS2001ESTIMATED2002ESTIMATEDAIREMISSIONSKEYCAS19992000 AIR 20012002FACILITY CHEMICAL NAME NUMBER UNITSUSAGEUSAGE EMISSIONS USAGEUSAGEHighExplosiveTesting 2-Ethoxyethanol (EGEE) 110-80-5 kg/yr 0.33 0.93Acetone 67-64-1 kg/yr 0.8 2.4 5.26 15.04 7.19 20.54 2.76 7.90Acetylene 74-86-2 kg/yr 2.8 7.9Diethylene Triamine 111-40-0 kg/yr 0.34 0.96Ethanol 64-17-5 kg/yr 2.2 6.3 11.74 33.55Ethyl Acetate 141-78-6 kg/yr 1.26 3.61Hydrogen Peroxide 7722-84-1 kg/yr 23.02 65.77Iron Oxide Fume, as Fe 1309-37-1 kg/yr 1.05 3.00Kerosene 8008-20-6 kg/yr 0.84 2.40Methyl Alcohol 67-56-1 kg/yr 1.1 3.2 2.22 6.34 3.88 11.08Methyl n-Amyl Ketone 110-43-0 kg/yr 0.57 1.64Methyl Ethyl Ketone (MEK) 78-93-3 kg/yr 0.3 0.8Methylene Chloride 75-09-2 kg/yr 0.5 1.3Nitromethane 75-52-5 kg/yr 0.1 0.2Paraffin Wax Fume 8002-74-2 kg/yr 0.35 1.00Propane 74-98-6 kg/yr 0.0 296.9 0.00 53.18Stoddard Solvent 8052-41-3 kg/yr 0.3 0.7Sulfur Hexafluoride 2551-62-4 kg/yr 146.36 418.18
A-8SWEIS Yearbook—2002Table A-5. <strong>LA</strong>NSCE Air EmissionsKEYFACILITYCASNUMBER1999ESTIMATEDAIREMISSIONS1999USAGE2000ESTIMATEDAIREMISSIONS2000USAGE2001ESTIMATEDAIREMISSIONS2001USAGE2002ESTIMATEDAIREMISSIONS2002USAGECHEMICAL NAMEUNITS<strong>LA</strong>NSCE 1,1,1-Trichloroethane 71-55-6 kg/yr 97.8 279.41,1,2-Trichloroethane 79-00-5 kg/yr 8.09 23.111,4-Dioxane 123-91-1 kg/yr 0.36 1.<strong>03</strong>2-Butoxyethanol 111-76-2 kg/yr 0.2 0.5Acetic Acid 64-19-7 kg/yr 0.18 0.52Acetic Anhydride 108-24-7 kg/yr 0.95 2.71Acetone 67-64-1 kg/yr 177.0 505.6 3.74 10.69 64.42 184.05 8.85 25.28Acetonitrile 75-05-8 kg/yr 0.27 0.79Acetylene 74-86-2 kg/yr 736.5 2104.4 0.00 1.32 0.12 0.33 0.00 2.63Ammonium Chloride (Fume) 12125-02-9 kg/yr 0.18 0.50Benzene 71-43-2 kg/yr 0.3 0.9Carbon Disulfide 75-15-0 kg/yr 0.4 1.3Carbon Tetrachloride 56-23-5 kg/yr 3.3 9.6Chlorodifluoromethane 74-45-6 kg/yr 8440.3 24115.2 41.28 117.94Chloroform 67-66-3 kg/yr 3.64 10.40 2.60 7.42 2.65 7.56Cyclohexane 110-82-7 kg/yr 0.3 0.8Dichlorodifluoromethane 75-71-8 kg/yr 1.5 4.4Diethanolamine 111-42-2 kg/yr 0.2 0.5Ethanol 64-17-5 kg/yr 197.9 565.4 61.47 175.62 12.96 37.04 2.49 7.10Ethyl Bromide 74-96-4 kg/yr 0.26 0.73 0.26 0.73Ethylene Dichloride 107-06-2 kg/yr 0.4 1.1Ethyl Ether 60-29-7 kg/yr 0.25 0.70 0.98 2.80Hydrogen Chloride 7647-01-0 kg/yr 2.44 6.98 1.87 5.34Hydrogen Fluoride, as F 7664-39-3 kg/yr 0.16 0.45 1.21 3.45Hydrogen Peroxide 7722-84-1 kg/yr 0.25 0.70Hydroquinone 67-63-0 kg/yr 0.18 0.50Iron Oxide Fume, as FE 1309-37-1 kg/yr 0.2 0.5Isobutane 75-28-5 kg/yr 19.2 55.0Isopropyl Alcohol 67-63-0 kg/yr 7.3 20.8 2.48 7.08 4.40 12.57 3.54 10.13Kerosene 8008-20-6 kg/yr 2.24 6.40
SWEIS Yearbook—2002 A-9Table A-5. <strong>LA</strong>NSCE Air Emissions (continued)KEYFACILITYCASNUMBER1999ESTIMATEDAIREMISSIONS1999USAGE2000ESTIMATEDAIREMISSIONS2000USAGE2001ESTIMATEDAIREMISSIONS2001USAGE2002ESTIMATEDAIREMISSIONS2002USAGECHEMICAL NAMEUNITSLead, el.& inorg.compounds,as Pb 7439-92-1 kg/yr 0.01 0.50 0.00 0.45Mercury, numerous forms 7439-97-6 kg/yr 26.1 2612.7 1.60 159.55 1.36 136.08Methyl Alcohol 67-56-1 kg/yr 3.6 10.3 2.50 7.14 5.40 15.43 4.32 12.35Methyl Formate 107-31-3 kg/yr 0.35 1.00Methylene Chloride 75-09-2 kg/yr 0.5 1.3n-Butyl Acetate 123-86-4 kg/yr 0.2 0.4n,n-Dimethylformamide 68-12-2 kg/yr 0.33 0.95Naphtalene 91-20-3 kg/yr 0.09 0.25Nitric Acid 7697-37-2 kg/yr 16.47 47.04Nitrobenzene 98-95-3 kg/yr 0.21 0.60Phosphoric Acid 7664-38-2 kg/yr 0.3 0.9 0.64 1.83Potassium Hydroxide <strong>131</strong>0-58-3 kg/yr 0.2 0.5 2.12 6.05 0.88 2.50Propane 74-98-6 kg/yr 0.0 3797.7 0.00 497.34 0.00 810.92 0.00 560.55Pyridine 110-86-1 kg/yr 0.33 0.93Silver (metal dust and solublecomp., as Ag) 7440-22-4 kg/yr 0.0 0.5Sulfur Hexafluoride 2551-62-4 kg/yr 0.2 0.7Sulfuric Acid 7664-93-9 kg/yr 1.9 5.5 0.32 0.92 0.18 0.50Tetrachlorethylene 127-18-4 kg/yr 4.54 12.98Tetrahydrofuran 109-99-9 kg/yr 0.31 0.89 0.31 0.89Toluene 108-88-3 kg/yr 0.2 0.4 0.43 1.24 6.99 19.98Trichloroacetic Acid 76-<strong>03</strong>-9 kg/yr 0.09 0.25Trichloroethylene 79-01-6 kg/yr 0.24 0.69Tungsten as W insolubleCompounds 7440-33-7 kg/yr 7.3 732.5Zinc Chloride Fume 7646-85-7 kg/yr 0.18 0.50Zinc Chromate, as Cr kg/yr 0.4 1.1
A-10Table A-6. Machine Shops Air Emission1999ESTIMATEDAIREMISSIONS2000ESTIMATEDAIREMISSIONS2001ESTIMATEDAIREMISSIONS2002ESTIMATEDAIREMISSIONSKEYFACILITY CHEMICAL NAMECASNUMBER UNITS1999USAGE2000USAGE2001USAGE2002USAGEMachineShops Chlorodifluoromethane 75-45-6 kg/yr 52.39 149.69Ethanol 64-17-5 kg/yr 1.57 4.48 0.13 0.37Isopropyl Alcohol 67-63-0 kg/yr 1.1 3.1Nitric Acid 7697-37-2 kg/yr 1.34 3.82Propane 74-98-6 kg/yr 0.0 593.8 0.00 244.23 0.00 341.21SWEIS Yearbook—2002
SWEIS Yearbook—2002 A-11Table A-7. Materials Science Laboratory Air EmissionsKEYFACILITYCASNUMBER UNITS1999ESTIMATEDAIREMISSIONS1999USAGE2000ESTIMATEDAIREMISSIONS2000USAGE2001ESTIMATEDAIREMISSIONS2001USAGE2002ESTIMATEDAIREMISSIONS2002USAGECHEMICAL NAMEMSL 1,1,2,2-Tetrachloroethane 630-20-6 kg/yr 1.1 3.21,1,2-Trichloro-1,2,2-Trifluoroethane 76-13-1 kg/yr 0.5 1.61,1,2-Trichloroethane 79-00-5 kg/yr 0.50 1.442-Methoxyethanol (EGME) 109-86-4 kg/yr 0.7 1.9Acetic Acid 64-19-7 kg/yr 0.2 0.5 0.18 0.53Acetone 67-64-1 kg/yr 3.6 10.3 9.14 26.12 8.43 24.09 12.72 36.34Acetonitrile 75-05-8 kg/yr 1.10 3.14Aluminum numerous forms 7429-90-5 kg/yr 0.0 2.2 0.01 0.60Ammonia 7664-41-7 kg/yr 0.1 0.3Benzene 71-43-2 kg/yr 0.3 0.9Biphenyl 92-52-4 kg/yr 0.4 1.0Chlorobenzene 108-90-7 kg/yr 1.5 4.4Chloroform 67-66-3 kg/yr 1.0 3.0 0.52 1.49 0.52 1.48Copper 7440-50-8 kg/yr 0.1 6.8Cyclohexane 110-82-7 kg/yr 0.27 0.78Diethylene Triamine 111-40-0 kg/yr 0.2 0.5Ethanol 64-17-5 kg/yr 4.0 11.3 2.21 6.33Ethyl Acetate 141-78-6 kg/yr 1.3 3.6Ethylene Chlorohydrin 107-07-3 kg/yr 0.1 0.3Ethyl Ether 60-29-7 kg/yr 0.25 0.70 0.25 0.70Ethylene Diamine 107-15-3 kg/yr 2.52 7.20Hydrogen Bromide 10<strong>03</strong>5-10-6 kg/yr 0.2 0.5Hydrogen Chloride 7647-01-0 kg/yr 0.6 1.8 2.08 5.94 4.99 14.24Hydrogen Fluoride, as F 7664-39-3 kg/yr 0.2 0.7 0.18 0.50Hydrogen Peroxide 7722-84-1 kg/yr 0.5 1.4 0.25 0.70 0.98 2.81Isobutyl Alcohol 78-83-1 kg/yr 0.28 0.80Isophorone Diisocyanate 4098-71-9 kg/yr 0.09 0.26Isopropyl Alcohol 67-63-0 kg/yr 4.4 12.6 1.38 3.94 3.30 9.43 4.40 12.57Kerosene 8008-20-6 kg/yr 1.06 3.<strong>03</strong>
A-12SWEIS Yearbook—2002Table A-7. Materials Science Laboratory Air Emissions (continued)KEYFACILITYCASNUMBER UNITS1999ESTIMATEDAIREMISSIONS1999USAGE2000ESTIMATEDAIREMISSIONS2000USAGE2001ESTIMATEDAIREMISSIONS2001USAGE2002ESTIMATEDAIREMISSIONS2002USAGECHEMICAL NAMEMethyl Alcohol 67-56-1 kg/yr 3.3 9.5 6.94 19.83 7.76 22.16 6.65 18.99Methyl Methacrylate 80-62-6 kg/yr 0.17 0.47Methylene Chloride 75-09-2 kg/yr 0.5 1.3 1.86 5.32 0.46 1.33Molybdenum 7439-98-7 kg/yr 0.0 0.5 0.42 1.20n,n-Dimethylformamide 68-12-2 kg/yr 0.2 0.5 0.25 0.71 0.38 1.09n-Butyl Acetate 123-86-4 kg/yr 0.2 0.4n-Butyl Alcohol 71-36-3 kg/yr 0.3 0.8Nickel, metal (dust) orSoluble & Inorganic Comp. 7440-02-0 kg/yr 1.56 4.47Nitric Acid 7697-37-2 kg/yr 7.74 22.13Phenol 108-95-2 kg/yr 0.2 0.5Phosphoric Acid 7664-38-2 kg/yr 0.64 1.84Phosphorus Oxychloride 10025-87-3 kg/yr 0.1 0.3Potassium Hydroxide <strong>131</strong>0-58-3 kg/yr 3.5 10.0Propane 74-98-6 kg/yr 0.00 24.37Pyridine 110-86-1 kg/yr 0.7 1.9Silica, Quartz 14808-60-7 kg/yr 1.3 3.6Silver (metal dust & solublecomp., as Ag) 7440-22-4 kg/yr 0.0 0.8 0.88 2.50 0.18 0.51Styrene 100-42-5 kg/yr 0.3 0.9Sulfuric Acid 7664-93-9 kg/yr 2.6 7.4 3.23 9.22 1.61 4.60Tert-Butyl Alcohol 75-65-0 kg/yr 0.3 0.8Tetrahydrofuran 109-99-9 kg/yr 1.87 5.35Toulene-2,4-diisocyanate(TDI) 584-84-9 kg/yr 0.6 1.6Trichloroethylene 79-01-6 kg/yr 0.26 0.73Vanadium, Respirable Dustand Fume <strong>131</strong>4-62-1 kg/yr 0.0 0.5Zinc Chloride Fume 7646-85-7 kg/yr 0.4 1.0Zirconium Compounds, asZr 7440-67-7 kg/yr 0.0 0.3
SWEIS Yearbook—2002 A-13Table A-8. Pajarito Site Air EmissionsKEYFACILITYCASNUMBER1999ESTIMATEDAIREMISSIONS1999USAGE2000ESTIMATEDAIREMISSIONS2000USAGE2001ESTIMATEDAIREMISSIONS2001USAGE2002ESTIMATEDAIREMISSIONS2002USAGECHEMICAL NAMEUNITSPajarito Site Ethanol 64-17-5 kg/yr 0.1 0.4Isopropyl Alcohol 67-63-0 kg/yr 1.6 4.7 1.65 4.72 1.65 4.71Magnesium Oxide Fume 1309-48-4 kg/yr 15.9 45.4Phenylphosphine 638-21-1 kg/yr 6.6 18.9Propane 74-98-6 kg/yr 0.0 1050.2 0.00 293.07 0.00 250.37 0.00 292.46Xylene (o-,m-,p-Isomers) 1330-20-7 kg/yr 0.3 0.8
A-14SWEIS Yearbook—2002Table A-9. Plutonium Facility Complex Air EmissionsKEYFACILITYPlutoniumFacilityComplexCHEMICAL NAMECASNUMBERUNITS1999ESTIMATEDAIREMISSIONS1999USAGE2000ESTIMATEDAIREMISSIONS2000USAGE2001ESTIMATEDAIREMISSIONS2001USAGE2002ESTIMATEDAIREMISSIONS2002USAGE1,1,2-Trichloro-1,2,2-Trichloroethane 76-13-1 kg/yr 8.76 25.022-Ethoxyethanol (EGEE) 110-80-5 kg/yr 0.33 0.93 0.33 0.93Acetone 67-64-1 kg/yr 0.55 1.58Acetic Acid 64-19-7 kg/yr 14.7 42.0 0.92 2.63 0.18 0.52Acetylene 74-86-2 kg/yr 2.8 7.9 0.00 1.32 0.00 7.89Chlorine 7782-50-5 kg/yr 23.86 68.18 12.70 36.29Chloroform 67-66-3 kg/yr 2.60 7.42Diacetone Alcohol 123-42-2 kg/yr 3.73 10.66Diethylene Triamine 111-40-0 kg/yr 0.67 1.92Ethanol 64-17-5 kg/yr 59.0 168.6 64.74 184.98 6.27 17.93Hexane (other isomers)* orn-Hexane 110-54-3 kg/yr 0.92 2.64Hydrogen Chloride 7647-01-0 kg/yr 311.6 890.3 225.23 643.52 282.72 807.77 287.91 822.60Hydrogen Fluoride, as F 7664-39-3 kg/yr 2.08 5.95 0.43 1.23 0.95 2.72Hydrogen Peroxide 7722-84-1 kg/yr 45.5 130.1 13.07 37.36 23.93 68.37Iron Oxide, as Fe 1309-37-1 kg/yr 0.1 0.3Isopropyl Alcohol 67-63-0 kg/yr 1.10 3.15Magnesium Oxide Fume 1309-48-4 kg/yr 0.18 0.50Manganese Dust andCompounds or Fume 7439-96-5 kg/yr 0.25 0.72Methyl 2-Cyanoacrylate 137-05-3 kg/yr 0.5 1.5 0.54 1.53Methyl Alcohol 67-56-1 kg/yr 4.44 12.69 2.49 7.12 0.28 0.79Methyl Ethyl Ketone(MEK) 78-93-3 kg/yr 5.3 15.2n,n-Dimethylformamide 68-12-2 kg/yr 1.3 3.8 3.32 9.49 2.<strong>03</strong> 5.79n-Heptane 142-82-5 kg/yr 1.20 3.42Nitric Acid 7697-37-2 kg/yr 13.38 38.23 15.76 45.02 284.20 812.00Oxalic Acid 144-62-7 kg/yr 1.40 4.00Phosphoric Acid 7664-38-2 kg/yr 0.32 0.92 1.60 4.59
SWEIS Yearbook—2002 A-15Table A-9. Plutonium Facility Complex Air Emissions (continued)KEYFACILITYCHEMICAL NAMECASNUMBERUNITS1999ESTIMATEDAIREMISSIONS1999USAGE2000ESTIMATEDAIREMISSIONS2000USAGE2001ESTIMATEDAIREMISSIONS2001USAGE2002ESTIMATEDAIREMISSIONS2002USAGEPotassium Hydroxide <strong>131</strong>0-58-3 kg/yr 245.5 701.5 125.05 357.29 262.64 750.39Propane 74-98-6 kg/yr 0.00 48.85 0.00 77.55Silica, Quartz 14808-60-7 kg/yr 0.35 1.00Sulfuric Acid 7664-93-9 kg/yr 36.7 104.9 0.32 0.92 2.25 6.44 0.64 1.84Tetrahydrofuran 109-99-9 kg/yr 0.31 0.89Tetrasodium Pyrophosphate 7722-88-5 kg/yr 0.18 0.50Tributyl Phosphate 126-73-8 kg/yr 1.36 3.90 1.36 3.89Trichloroethylene 79-01-6 kg/yr 114.9 328.3 106.92 305.48 106.70 304.85Vanadium, Respirable Dust& Fume <strong>131</strong>4-62-1 kg/yr 0.09 0.25Zinc Chloride Fume 7646-85-7 kg/yr 0.70 2.00 0.53 1.50
A-16SWEIS Yearbook—2002Table A-10. Radiochemistry Site Air Emissions1999ESTIMATEDAIREMISSIONS2000ESTIMATEDAIREMISSIONS2001ESTIMATED2002ESTIMATEDAIREMISSIONSKEYCAS19992000 AIR 20012002FACILITY CHEMICAL NAME NUMBER UNITSUSAGEUSAGE EMISSIONS USAGEUSAGERadiochemistrySite 1,1,1-Trichloroethane 71-55-6 kg/yr 2.3 6.7 1.87 5.361,1,2-Trichloro-1,2,2-Trifluoroethane 76-13-1 kg/yr 2.2 6.3 4.94 14.101,3,5-Trimethylbenzene 108-67-8 kg/yr 0.2 0.51,3-Butadiene 106-99-0 kg/yr 5.3 15.01,4-Dioxane 123-91-1 kg/yr 0.4 1.0 0.36 1.04 0.98 2.792-Methoxyethanol (EGME) 109-86-4 kg/yr 0.2 0.5 0.34 0.97 0.51 1.45 0.17 0.48Acetic Acid 64-19-7 kg/yr 1.9 5.5 0.91 2.60 0.18 0.52 0.73 2.10Acetic Anhydride 108-24-7 kg/yr 0.8 2.2 0.54 1.54 0.19 0.54Acetone 67-64-1 kg/yr 90.9 259.8 62.47 178.50 55.85 159.56 94.40 269.70Acetonitrile 75-05-8 kg/yr 6.07 17.35 4.78 13.67 10.19 29.11Acrylic Acid 79-10-7 kg/yr 0.10 0.28Aluminum numerous forms 7429-90-5 kg/yr 0.00 0.27 0.08 7.57Ammonia 7664-41-7 kg/yr 11.90 34.00Ammonium Chloride (Fume) 12125-02-9 kg/yr 0.8 2.3 0.18 0.50 1.07 3.05Arsenic, el. and inorg., exc. Arsine,as As 7440-38-2 kg/yr 0.4 1.1 0.20 0.56Benzene 71-43-2 kg/yr 0.8 2.2 0.38 1.08 1.33 3.79 0.34 0.96Benzyl Chloride 100-44-7 kg/yr 0.2 0.5Beryllium 7440-41-7 kg/yr 0.33 0.94 0.13 0.38Bromine 7726-95-6 kg/yr 0.3 0.8 0.08 0.23 0.50 1.44Cadmium, el. and compounds, as Cd 7440-43-9 kg/yr 0.31 0.87Carbon Tetrachloride 56-23-5 kg/yr 64.5 184.2 1.12 3.19 1.67 4.78Chlorine 7782-50-5 kg/yr 0.3 0.9 0.16 0.45Chlorobenzene 108-90-7 kg/yr 0.19 0.55Chlorodifluoromethane 75-45-6 kg/yr 63.50 181.44Chloroform 67-66-3 kg/yr 5.5 15.6 4.16 11.89 0.13 0.37 8.59 24.55Chromium, Metal and Cr IIICompounds, as Cr 7440-47-3 kg/yr 0.3 0.7
SWEIS Yearbook—2002 A-17Table A-10. Radiochemistry Site Air Emissions (continued)KEYFACILITYCASNUMBER UNITS1999ESTIMATEDAIREMISSIONS1999USAGE2000ESTIMATEDAIREMISSIONS2000USAGE2001ESTIMATEDAIREMISSIONS2001USAGE2002ESTIMATEDAIREMISSIONS2002USAGECHEMICAL NAMECobalt, elemental and inorg. Comp.,as Co 7440-48-4 kg/yr 0.3 0.9 0.02 1.79Copper 7440-50-8 kg/yr 0.02 2.28 0.01 0.90Cyclohexanol 108-93-0 kg/yr 0.34 0.96 0.34 0.96Cyclohexanone 108-94-1 kg/yr 0.83 2.37Cyclohexylamine 108-91-8 kg/yr 0.3 0.8Dichlorodifluoromethane 75-71-8 kg/yr 0.34 0.96Dicyclopentadiene 77-73-6 kg/yr 0.86 2.45Diethanolamine 111-42-2 kg/yr 2.3 6.7Diethylamine 109-89-7 kg/yr 0.5 1.5 0.25 0.70 0.25 0.70Dimethyl Amine 124-40-3 kg/yr 0.48 1.38Dimethyl Sulfate 77-78-1 kg/yr 0.23 0.67Ethanol 64-17-5 kg/yr 10.0 28.6 4.71 13.45 0.55 1.58 7.15 20.42Ethyl Acetate 141-78-6 kg/yr 8.8 25.2 0.32 0.90 2.52 7.20 5.36 15.31Ethyl Bromide 74-96-4 kg/yr 0.26 0.73 0.42 1.20Ethyl Chloride 75-00-3 kg/yr 0.4 1.0Ethyl Ether 60-29-7 kg/yr 4.4 12.6 14.12 40.33 27.93 79.80 19.67 56.21Ethylamine 75-04-7 kg/yr 0.12 0.35Ethylene Diamine 107-15-3 kg/yr 0.2 0.5Ethylene Dichloride 107-06-2 kg/yr 0.9 2.5Furfural 98-01-1 kg/yr 0.2 0.6Hexafluoroacetone 684-16-2 kg/yr 0.3 0.7Hexane (other isomers)* or n-Hexane 110-54-3 kg/yr 11.2 32.0 7.90 22.56 2.31 6.60 3.93 11.23Hydrogen Bromide 10<strong>03</strong>5-10-6 kg/yr 4.3 12.3 12.10 34.57 11.42 32.63 4.54 12.98Hydrogen Chloride 7647-01-0 kg/yr 211.8 605.0 88.30 252.29 176.67 504.78 92.58 264.52Hydrogen Fluoride, as F 7664-39-3 kg/yr 3.2 9.0 1.59 4.55 0.90 2.57 2.49 7.12Hydrogen Peroxide 7722-84-1 kg/yr 11.6 33.1 5.94 16.98 7.04 20.12 15.02 42.91Hydrogen Sulfide 7783-06-4 kg/yr 0.16 0.45 3.67 10.48Indene 95-13-6 kg/yr 0.1 0.3
A-18SWEIS Yearbook—2002Table A-10. Radiochemistry Site Air Emissions (continued)KEYFACILITYCASNUMBER UNITS1999ESTIMATEDAIREMISSIONS1999USAGE2000ESTIMATEDAIREMISSIONS2000USAGE2001ESTIMATEDAIREMISSIONS2001USAGE2002ESTIMATEDAIREMISSIONS2002USAGECHEMICAL NAMEIndium & compounds, as In 7440-74-6 kg/yr 0.18 0.50Iron Oxide Fume, as Fe 1309-37-1 kg/yr 0.4 1.0Isobutyl Alcohol 78-83-1 kg/yr 0.14 0.40Isopropyl Alcohol 67-63-0 kg/yr 8.0 22.8 14.70 42.00 7.97 22.78 10.12 28.92Isopropyl Ether 108-20-3 kg/yr 0.1 0.3 1.02 2.90Kerosene 8008-20-6 kg/yr 0.0 3.0Lead, el. and inorg. Compounds, asPb 7439-92-1 kg/yr 0.01 1.13Magnesium Oxide Fume 1309-48-4 kg/yr 0.4 1.1 0.21 0.60Manganese Dust & Compounds orFume 7439-96-5 kg/yr 0.09 0.25Mercury numerous forms 7439-97-6 kg/yr 0.0 0.5 0.01 0.50Methyl Alcohol 67-56-1 kg/yr 11.1 31.7 7.91 22.60 11.63 33.24 8.86 25.33Methyl Cyclohexane 108-87-2 kg/yr 0.28 0.80Methylene Chloride 75-09-2 kg/yr 13.82 39.48 35.11 100.33Methyl Ethyl Ketone (MEK) 78-93-3 kg/yr 0.3 0.8Methyl Formate 107-31-3 kg/yr 0.4 1.0Methyl Iodide 74-88-4 kg/yr 0.4 1.0 0.14 0.40Methylene Chloride 75-09-2 kg/yr 13.9 39.8 8.85 25.30Molybdenum 7439-98-7 kg/yr 0.0 1.0 11.83 33.81Morpholine 110-91-8 kg/yr 0.35 1.00n,n-Dimethyl Acetamide or DimethylAcetamide 127-19-5 kg/yr 0.66 1.89 0.33 0.94n,n-Dimethylformamide 68-12-2 kg/yr 1.0 2.8 1.00 2.85 0.70 1.99 0.33 0.95n-Butyl Alcohol 71-36-3 kg/yr 0.14 0.41 0.28 0.81n-Heptane 142-82-5 kg/yr 1.92 5.48 0.48 1.37 1.37 3.92Nitric Acid 7697-37-2 kg/yr 450.78 1287.93 623.41 1781.17 528.82 1510.92Nitric Oxide 10102-43-9 kg/yr 1.5 4.2Nitromethane 75-52-5 kg/yr 0.2 0.6 0.20 0.57Nitrous Oxide 10024-97-0 kg/yr 0.1 0.2 0.08 0.23o-Dichlorobenzene 95-50-1 kg/yr 0.23 0.65 0.91 2.61
SWEIS Yearbook—2002 A-19Table A-10. Radiochemistry Site Air Emissions (continued)KEYFACILITYCASNUMBER UNITS1999ESTIMATEDAIREMISSIONS1999USAGE2000ESTIMATEDAIREMISSIONS2000USAGE2001ESTIMATEDAIREMISSIONS2001USAGE2002ESTIMATEDAIREMISSIONS2002USAGECHEMICAL NAMEp-Phenylene diamine 106-50-3 kg/yr 0.2 0.5p-Toluidine 106-49-0 kg/yr 0.18 0.50Pentane (all isomers) 109-66-0 kg/yr 0.9 2.5 0.22 0.63 1.53 4.38 0.66 1.88Phenylhydrazine 100-63-0 kg/yr 0.18 0.50Phosphoric Acid 7664-38-2 kg/yr 2.6 7.3 3.22 9.19 609.71 1742.<strong>03</strong> 3.85 11.00Phosphorus Oxychloride 10025-87-3 kg/yr 0.09 0.25Phosphorus Trichloride 7719-12-2 kg/yr 0.1 0.3 0.09 0.25 0.53 1.50Potassium Hydroxide <strong>131</strong>0-58-3 kg/yr 1.7 4.7 4.38 12.50Propane 74-98-6 kg/yr 0.0 1769.7 0.00 2663.99 0.00 1521.40Propionic Acid 79-09-4 kg/yr 0.49 1.39Propyl Alcohol 71-23-8 kg/yr 0.28 0.81Pyridine 110-86-1 kg/yr 0.8 2.4 0.20 0.56 1.14 3.26Silica, Quartz 14808-60-7 kg/yr 1.09 3.10Silver (metal dust and soluble comp.,as Ag) 7440-22-4 kg/yr 0.0 0.4 0.74 2.11Sulfur Hexafluoride 2551-62-4 kg/yr 2.06 5.90Sulfuric Acid 7664-93-9 kg/yr 12.2 35.0 3.38 9.66 5.80 16.56tert-Butyl Alcohol 75-65-0 kg/yr 0.1 0.4 0.28 0.79Tetrahydrofuran 109-99-9 kg/yr 5.6 16.0 19.98 57.09 12.20 34.87Thionyl Chloride 7719-09-7 kg/yr 0.7 1.9 0.80 2.28Tin numerous forms 7440-31-5 kg/yr 0.01 0.50Toluene 108-88-3 kg/yr 17.7 50.7 10.07 28.77 26.70 76.29Trichloroethylene 79-01-6 kg/yr 0.3 0.7Triethylamine 121-44-8 kg/yr 0.8 2.3 0.41 1.16 0.42 1.20Trimethylamine 75-50-3 kg/yr 0.11 0.32Tungsten as W insoluble Compounds 7440-33-7 kg/yr 0.23 22.68 0.02 1.94Uranium (natural)Sol.&Unsol.Comp. as U 7440-61-1 kg/yr 0.7 1.9 1.33 3.80VM & P Naphtha 8<strong>03</strong>2-32-4 kg/yr 5.78 16.50 6.83 19.50Vinyl Acatate 108-05-4 kg/yr 0.3 0.9
A-20Table A-10. Radiochemistry Site Air Emissions (continued)KEYFACILITYCASNUMBER UNITS1999ESTIMATEDAIREMISSIONS1999USAGE2000ESTIMATEDAIREMISSIONS2000USAGE2001ESTIMATEDAIREMISSIONS2001USAGECHEMICAL NAMEYttrium 7440-65-5 kg/yr 0.31 0.89Zinc Chloride Fume 7646-85-7 kg/yr 0.09 0.25Zirconium Compounds, as Zr 7440-67-7 kg/yr 0.01 1.302002ESTIMATEDAIREMISSIONS2002USAGESWEIS Yearbook—2002
SWEIS Yearbook—2002 A-21Table A-11. Sigma Complex Air Emissions1999ESTIMATEDAIREMISSIONS2000ESTIMATEDAIREMISSIONS2001ESTIMATEDAIREMISSIONS2002ESTIMATEDAIREMISSIONSKEYFACILITY CHEMICAL NAMECASNUMBER UNITS1999USAGE2000USAGE2001USAGE2002USAGESigmaComplex 2-Butoxyethanol 111-76-2 kg/yr 1.3 3.6Acetone 67-64-1 kg/yr 8.0 22.9 4.43 12.66 6.64 18.96 7.19 20.54Acetylene 74-86-2 kg/yr 11.0 31.6 0.00 1.31Aluminum numerous forms 7429-90-5 kg/yr 0.1 11.8 0.00 0.27Ammonia 7664-41-7 kg/yr 0.2 0.5Cadmium, el., and compounds,as Cd 7440-43-9 kg/yr 0.0 0.5Chloroform 67-66-3 kg/yr 0.3 0.7Chromium, Metal and Cr IIICompounds, as Cr 7440-47-3 kg/yr 0.0 4.0Copper 7440-50-8 kg/yr 0.6 56.6 0.01 1.11Diethylene Triamine 111-40-0 kg/yr 0.7 1.9 0.67 1.92 0.67 1.92 0.67 1.92Ethanol 64-17-5 kg/yr 15.2 43.5 1.11 3.16Ethyl Ether 60-29-7 kg/yr 0.25 0.70Hydrazine 302-01-2 kg/yr 0.1 0.3Hydrogen Chloride 7647-01-0 kg/yr 5.4 15.4 196.98 562.79 6.86 19.59 6.44 18.40Hydrogen Fluoride, as F 7664-39-3 kg/yr 64.9 185.4 25.56 73.<strong>03</strong> 85.09 243.11Hydrogen Peroxide 7722-84-1 kg/yr 1.3 3.7 3.21 9.16 2.26 6.47 4.92 14.07Isopropyl Alcohol 67-63-0 kg/yr 9.9 28.3 6.61 18.89 3.30 9.43 6.60 18.85Kerosene 8008-20-6 kg/yr 0.0 21.4 58.30 166.56Lead, el. and inorg. Compounds,as Pb 7439-92-1 kg/yr 0.05 5.01Mercury numerous forms 7439-97-6 kg/yr 0.02 2.27 0.07 6.80Methyl Alcohol 67-56-1 kg/yr 4.6 13.1 3.33 9.52 3.60 10.29 1.11 3.17Methyl Ethyl Ketone (MEK) 78-93-3 kg/yr 0.3 0.8 0.14 0.40Methylene Chloride 75-09-2 kg/yr 0.2 0.7Molybdenum 7439-98-7 kg/yr 3.9 387.1n,n-Dimethylformamide 68-12-2 kg/yr 0.17 0.48Nickel, metal (dust) or Solubleand Inorganic Comp. 7440-02-0 kg/yr 0.0 4.0
A-22Table A-11. Sigma Complex Air Emissions (continued)KEYFACILITYCASNUMBER UNITS1999ESTIMATEDAIREMISSIONS1999USAGE2000ESTIMATEDAIREMISSIONS2000USAGE2001ESTIMATEDAIREMISSIONS2001USAGE2002ESTIMATEDAIREMISSIONS2002USAGECHEMICAL NAMENitric Acid 7697-37-2 kg/yr 272.75 779.29 63.46 181.31 35.25 100.72Phosphoric Acid 7664-38-2 kg/yr 234.3 669.3 82.16 234.76Potassium Hydroxide <strong>131</strong>0-58-3 kg/yr 0.8 2.3Propane 74-98-6 kg/yr 0.00 73.27 0.00 387.74 0.00 194.98Silica, Quartz 14808-60-7 kg/yr 0.7 2.0Sulfuric Acid 7664-93-9 kg/yr 25.5 72.8 9.68 27.66 8.05 23.00Tantalum Metal 7440-25-7 kg/yr 0.3 27.2 0.73 2.08Tellurium & Compounds, as Te 13494-80-9 kg/yr 0.18 0.50Tin numerous forms 7440-31-5 kg/yr 0.0 1.1Tungsten as W insolubleCompounds 7440-33-7 kg/yr 0.01 1.00Xylene (o-,m-,p-Isomers) 1330-20-7 kg/yr 1.7 4.9Zinc Oxide Fume <strong>131</strong>4-13-2 kg/yr 0.2 0.5Zirconium Compounds, as Zr 7440-67-7 kg/yr 0.0 1.0 0.01 0.50 0.00 0.30SWEIS Yearbook—2002
SWEIS Yearbook—2002 A-23Table A-12. Target Fabrication Facility Air Emissions1999ESTIMATEDAIREMISSIONS2000ESTIMATEDAIREMISSIONS2001ESTIMATEDAIREMISSIONS2002ESTIMATEDAIREMISSIONSKEYFACILITY CHEMICAL NAMECASNUMBER UNITS1999USAGE2000USAGE2001USAGE2002USAGETargetFabricationFacility 1,1,1-Trichloroethane 71-55-6 kg/yr 4.9 14.1 0.23 0.671,1,2-Trichloroethane 79-00-5 kg/yr 0.5 1.42-Methoxyethanol (EGME) 109-86-4 kg/yr 0.3 1.0 0.34 0.96Acetic Acid 64-19-7 kg/yr 0.92 2.62Acetone 67-64-1 kg/yr 20.0 57.2 5.54 15.83 17.83 50.95 10.51 30.02Acetonitrile 75-05-8 kg/yr 0.55 1.57Acrylic Acid 79-10-7 kg/yr 0.2 0.6Acrylonitrile 107-13-1 kg/yr 0.3 0.8Aluminum numerous forms 7429-90-5 kg/yr 0.01 1.00Ammonia 7664-41-7 kg/yr 1483.5 4238.6Ammonium Chloride (Fume) 12125-02-9 kg/yr 0.4 1.0Aniline and Homologues 62-53-3 kg/yr 0.2 0.5Benzene 71-43-2 kg/yr 1.08 3.07 0.31 0.88Boron Oxide 13<strong>03</strong>-86-2 kg/yr 0.35 1.00Bromine 7726-95-6 kg/yr 0.32 0.90Chlorine 7782-50-5 kg/yr 6.9 19.7Chloroform 67-66-3 kg/yr 6.28 17.95Cyclohexane 110-82-7 kg/yr 0.5 1.6 0.55 1.56Dibutyl Phthalate 84-74-2 kg/yr 0.7 2.1Diethanolamine 111-42-2 kg/yr 0.2 0.5Diethyl Phthalate 84-66-2 kg/yr 0.1 0.4Diethylene Triamine 111-40-0 kg/yr 0.3 1.0Divinyl Benzene 1321-74-0 kg/yr 0.16 0.46 0.53 1.50 0.64 1.84Ethanol 64-17-5 kg/yr 9.1 25.9 1.73 4.95 3.14 8.96Ethyl Acetate 141-78-6 kg/yr 1.3 3.6 1.26 3.60Ethyl Ether 60-29-7 kg/yr 14.73 42.09 1.47 4.20Ethylene Diamine 107-15-3 kg/yr 0.2 0.4Ethylene Dichloride 107-06-2 kg/yr 2.4 6.8 0.43 1.24 0.22 0.62
A-24SWEIS Yearbook—2002Table A-12. Target Fabrication Facility Air Emissions (continued)KEYFACILITYCASNUMBER UNITS1999ESTIMATEDAIREMISSIONS1999USAGE2000ESTIMATEDAIREMISSIONS2000USAGE2001ESTIMATEDAIREMISSIONS2001USAGE2002ESTIMATEDAIREMISSIONS2002USAGECHEMICAL NAMEFormic Acid 64-18-6 kg/yr 0.32 0.92Hexane (other isomers)* orn-Hexane 110-54-3 kg/yr 0.46 1.32 0.49 1.39 1.85 5.28Hydrogen Chloride 7647-01-0 kg/yr 3.9 11.0 0.10 0.30Hydrogen Fluoride, as F 7664-39-3 kg/yr 0.3 1.0 0.32 0.91Hydrogen Peroxide 7722-84-1 kg/yr 0.2 0.7 1.72 4.92Isopropyl Alcohol 67-63-0 kg/yr 6.9 19.6 9.92 28.34 11.00 31.42 14.30 40.85Mercury numerous forms 7439-97-6 kg/yr 0.09 8.54Methyl Alcohol 67-56-1 kg/yr 12.1 34.7 14.43 41.24 18.84 53.82 6.65 18.99Methyl Cyclohexane 108-87-2 kg/yr 0.3 0.8Methyl Ethyl Ketone (MEK) 78-93-3 kg/yr 2.26 6.46 2.26 6.44 1.13 3.22Methyl Isobutyl Ketone 108-10-1 kg/yr 0.1 0.4Methyl Methacrylate 80-62-6 kg/yr 0.33 0.94Methylene BisphenylIsocyanate (MDI) 101-68-8 kg/yr 0.18 0.50Methylene Chloride 75-09-2 kg/yr 1.9 5.3 0.98 2.79Morpholine 110-91-8 kg/yr 0.35 1.00n,n-Dimethyl Acetamide orDimethyl Acetamide 127-19-5 kg/yr 0.3 0.9 0.99 2.83n,n-Dimethylformamide 68-12-2 kg/yr 12.3 35.1 6.65 19.01 10.63 30.36 6.64 18.97n-Amyl Acetate 628-63-7 kg/yr 0.3 0.9n-Butyl Acetate 123-86-4 kg/yr 0.2 0.4 0.61 1.75n-Heptane 142-82-5 kg/yr 1.0 2.7Nickel, metal (dust) orSoluble & Inorganic Comp. 7440-02-0 kg/yr 1.56 4.45Nitric Acid 7697-37-2 kg/yr 4.55 13.00 25.10 71.72 2.94 8.39Nitrous Oxide 10024-97-2 kg/yr 19.3 55.0o-Dichlorobenzene 95-50-1 kg/yr 1.00 2.87Osmium Tetroxide, as Os 20816-12-0 kg/yr 0.1 0.2Pentane (all isomers) 109-66-0 kg/yr 0.44 1.26Phosphoric Acid 7664-38-2 kg/yr 0.4 1.0
SWEIS Yearbook—2002 A-25Table A-12. Target Fabrication Facility Air Emissions (continued)KEYFACILITYCASNUMBER UNITS1999ESTIMATEDAIREMISSIONS1999USAGE2000ESTIMATEDAIREMISSIONS2000USAGE2001ESTIMATEDAIREMISSIONS2001USAGE2002ESTIMATEDAIREMISSIONS2002USAGECHEMICAL NAMEPhosphorus Pentachloride 10026-13-8 kg/yr 0.42 1.20Potassium Hydroxide <strong>131</strong>0-58-3 kg/yr 0.4 1.0 2.29 6.54 5.45 15.58Propane 74-98-6 kg/yr 0.0 45.4Propyl Alcohol 71-23-8 kg/yr 0.3 0.8 0.14 0.40Pyridine 110-86-1 kg/yr0.33 0.93Silica, Quartz 14808-60-7 kg/yr 0.35 1.00Silicon Tetrahydride 78<strong>03</strong>-62-5 kg/yr 3.1 8.9Styrene 100-42-5 kg/yr 1.7 4.9 1.90 5.44Sulfur Hexafluoride 2551-62-4 kg/yr 9.7 27.7Sulfuric Acid 7664-93-9 kg/yr 4.8 13.8 69.38 198.22 1.42 4.05Tert-Butyl Alcohol 75-65-0 kg/yr 0.28 0.79Tetrahydrofuran 109-99-9 kg/yr 0.3 0.9 1.25 3.56 1.56 4.45Toluene 108-88-3 kg/yr 1.2 3.5 1.22 3.49Triethylamine 121-44-8 kg/yr 0.25 0.73Tungsten as W insolubleCompounds 7440-33-7 kg/yr 0.01 0.50VM & P Naphtha 8<strong>03</strong>2-32-4 kg/yr 0.53 1.50 0.53 1.50Xylene (o-,m-,p-Isomers) 1330-20-7 kg/yr 0.91 2.59
A-26Table A-13. Tritium Operations Air Emissions1999ESTIMATEDAIREMISSIONS2000ESTIMATEDAIREMISSIONS2001ESTIMATEDAIREMISSIONS2002ESTIMATEDAIREMISSIONSKEYFACILITYCHEMICALNAMECASNUMBER UNITS1999USAGE2000USAGE2001USAGE2002USAGETritiumOperations Ammonia 7664-41-7 kg/yr 0.8 2.4Copper 7440-50-8 kg/yr 0.0 0.5Ethanol 64-17-5 kg/yr 0.3 0.7 0.28 0.79 0.52 1.49Hydrogen Chloride 7647-01-0 kg/yr 0.4 1.2Methyl Alcohol 67-56-1 kg/yr 0.3 0.8Phenylphosphine 638-21-1 kg/yr 0.3 0.9Propane 74-98-6 kg/yr 0.0 73.4 0.00 97.69 0.00 73.12 0.00 48.74Sulfur Hexafluoride 2551-62-4 kg/yr 14.2 40.6SWEIS Yearbook—2002
SWEIS Yearbook—2002 A-27Table A-14. Waste Management Operations Air EmissionsKEYFACILITYWasteManagementOperationsCHEMICAL NAMECASNUMBER UNITS1999ESTIMATEDAIREMISSIONS1999USAGE2000ESTIMATEDAIREMISSIONS2000USAGE2001ESTIMATEDAIREMISSIONS2001USAGE2002ESTIMATEDAIREMISSIONS2002USAGE1,1,2-Trichloro-1,1,2-Trifluoroethane 76-13-1 kg/yr 1.4 4.0Acetic Acid 64-19-7 kg/yr 17.7 50.5Acetone 67-64-1 kg/yr 0.8 2.4 1.11 3.16Acetonitrile 75-05-8 kg/yr 0.3 0.8Acetylene 74-86-2 kg/yr 6.9 19.7 0.00 2.64Aluminum numerous forms 7429-90-5 kg/yr 0.00 0.27Ammonium Chloride (Fume) 12125-02-9 kg/yr 0.2 0.7 0.25 0.71 0.25 0.71Antimony and Compounds, as Sb 7440-36-0 kg/yr 0.23 0.67Benzene 71-43-2 kg/yr 0.31 0.88Cadmium, el. And compounds, asCd 7440-43-9 kg/yr 0.2 22.7Carbon Black 1333-86-4 kg/yr 0.6 1.6Cyclohexanone 108-94-1 kg/yr 0.10 0.28Diethanolamine 111-42-2 kg/yr 0.2 0.5Ethanol 64-17-5 kg/yr 14.9 42.6 10.77 30.78 4.97 14.21Ethyl Acetate 141-78-6 kg/yr 0.95 2.70Hexane (other isomers)* or n-Hexane 110-54-3 kg/yr 1.8 5.3 0.69 1.98Hydrogen Chloride 7647-01-0 kg/yr 94.9 271.0 3477.22 9934.93 285.24 814.97 714.89 2042.53Hydrogen Fluoride, as F 7664-39-3 kg/yr 0.7 2.0 1.73 4.95Hydrogen Peroxide 7722-84-1 kg/yr 11.8 33.8Isopropyl Alcohol 67-63-0 kg/yr 1.10 3.14Lead, el. and inorg. Compounds, asPb 7439-92-1 kg/yr 0.01 1.13Magnesium Oxide Fume 1309-48-4 kg/yr 0.2 0.5Mercury numerous forms 7439-97-6 kg/yr 0.01 1.36 0.01 1.36Methyl 2-Cyanoacrylate 137-05-3 kg/yr 0.1 0.3Methyl Alcohol 67-56-1 kg/yr 3.3 9.5 1.11 3.17 2.22 6.33Methylene Chloride 75-09-2 kg/yr 0.46 1.33
A-28SWEIS Yearbook—2002Table A-14. Waste Management Operations Air Emissions (continued)KEYFACILITYCASNUMBER UNITS1999ESTIMATEDAIREMISSIONS1999USAGE2000ESTIMATEDAIREMISSIONS2000USAGE2001ESTIMATEDAIREMISSIONS2001USAGE2002ESTIMATEDAIREMISSIONS2002USAGECHEMICAL NAMEMolybdenum 7439-98-7 kg/yr 0.36 1.02Napthalene 91-20-3 kg/yr 0.18 0.50Nickel, metal (dust) or Soluble andInorganic Comp. 7440-02-0 kg/yr 0.31 0.89Nitric Acid 7697-37-2 kg/yr 28.90 82.58 12.07 34.49 4.06 11.60Oxalic Acid 144-05-3 kg/yr 0.2 0.5Phenol 108-95-2 kg/yr 0.7 2.0 0.18 0.50 0.18 0.50Phosphorus 7723-14-0 kg/yr 0.2 0.6Potassium Hydroxide <strong>131</strong>0-58-3 kg/yr 3.3 9.5Propane 74-98-6 kg/yr 0.0 14015.9 0.00 35.52 0.00 121.86 0.00 121.86Propyl Alcohol 71-23-8 kg/yr 0.1 0.4Pyridine 110-86-1 kg/yr 0.33 0.93 0.33 0.93Selenium Compounds, as Se 7782-49-2 kg/yr 0.17 0.48Silica, Quartz 14808-60-7 kg/yr 1.1 3.0Silver (metal dust and solublecomp., as Ag) 7440-22-4 kg/yr 0.0 1.1Stoddard Solvent 8052-41-3 kg/yr 1.02 2.92Sulfuric Acid 7664-93-9 kg/yr 153.2 437.7 2.58 7.38 3.86 11.04 7.73 22.08Tin numerous forms 7440-31-5 kg/yr 0.0 0.7Trichloroacetic Acid 76-<strong>03</strong>-9 kg/yr 0.2 0.5Uranium (natural) Sol.& Unsol.Comp. as U 7440-61-1 kg/yr 0.67 1.90 0.67 1.90Yttrium 7440-65-5 kg/yr 0.16 0.45Zinc Chloride Fume 7646-85-7 kg/yr 0.2 0.5
SWEIS Yearbook—2002 B-1Table B-1. Comparison of <strong>Nuclear</strong> Facilities ListsSWEISRODSECTION/TABLE BLDG. DESCRIPTION2.1 PlutoniumComplex2.1-1 TA-55-0004 Pu-238Processing2.1-1 TA-55-0041 <strong>Nuclear</strong>MaterialStorageHCDOE1998DESCRIPTION2 PlutoniumFacility2Pu gloveboxline; Pu-238processing2.2 TritiumFacilities2.2-1 TA-16-0205 WETF 2 WeaponsEngineeringTritium Facility(WETF)Weapons relatedtritium research2.2-1 TA-16-0205A WETF 22.2-1 TA-16-0450 WETF 22.2-1 TA-21-0155 TSTA 2 Tritium SystemTest Assembly(TSTA)Tritium research;>HC-2 threshold2.2-1 TA-21-0209 TSFF 2 TA-21 TritiumScience andFabricationFacility (TSFF)HCDOE2000DESCRIPTION2 TA-55PlutoniumFacility2 Pu gloveboxline; Pu-238processing2 TA-16 WeaponsEngineeringTritium Facility(WETF)2 Weapons relatedtritium research2 Tritium SystemTest Assembly(TSTA)2 Tritium research;>HC-2 threshold2 TA-21 TritiumScience andFabricationFacility (TSFF)HCFWO-OAB 401REV. 1REV. 2(JUNE 2001) (DECEMBER 2001)HHDESCRIPTION C DESCRIPTION C2 TA-55PlutoniumFacility2 Pu gloveboxline; Pu-238processing2 TA-16 WeaponsEngineeringTritium Facility(WETF)2 Weapons relatedtritium research2 Tritium SystemTest Assembly(TSTA)2 TA-55PlutoniumFacility2 Pu gloveboxline; processingof isotopes of Pu2 TA-16 WeaponsEngineeringTritium Facility(WETF)PS-OAB-401REV. 3(JULY 2002)DESCRIPTION2 TA-55PlutoniumFacility2 Pu glovebox line;processing ofisotopes of Pu2 TA-16 WeaponsEngineeringTritium Facility(WETF)2 Tritium research 2 Tritium research 22 Tritium SystemTest Assembly(TSTA)2 Tritium research 2 Stabilization andDeactivationActivities2 TA-21 TritiumScience andFabricationFacility (TSFF)2 TA-21 TritiumScience andFabricationFacility (TSFF)2 Tritium SystemTest Assembly(TSTA)2 Stabilization andDeactivationActivities2 TA-21 TritiumScience andFabricationFacility (TSFF)HC222222
Table B-1. Comparison of <strong>Nuclear</strong> Facilities Lists (continued)B-2SWEISRODSECTION/TABLE BLDG. DESCRIPTIONHCDOE1998DESCRIPTIONSupport forundergroundtesting program>HC-2 threshold;tritiumDOE2000HC DESCRIPTION2 Support forundergroundtesting program>HC-2 threshold;tritiumFWO-OAB 401REV. 1REV. 2(JUNE 2001) (DECEMBER 2001)HHHC DESCRIPTION C DESCRIPTION C2 Support for 2 Stabilizationunderground activities andtesting program NTTL support(tritium)PS-OAB-401REV. 3(JULY 2002)DESCRIPTIONStabilizationactivities andNTTL supportHC2SWEIS Yearbook—20022.3 Chemistry andMetallurgyResearchBuilding2.3-1 TA-<strong>03</strong>-0019(Buildingnumber shouldbe –0029)2.3-1 TA-<strong>03</strong>-0029 RadiochemistryHot CellCMR 2 TA-3 Chemistryand MetallurgyResearch (CMR)Bldg.RadiochemistryHot Cell facility2 TA-3 Chemistryand MetallurgyResearch (CMR)Bldg.2 RadiochemistryHot Cell facility2 TA-3 Chemistryand MetallurgyResearch (CMR)Bldg.2 RadiochemistryHot Cell facility2.3-1 TA-<strong>03</strong>-0029 SNM Vault CMR SNM Vault 2 CMR SNM Vault 2 CMR SNMVault2.3-1 TA-<strong>03</strong>-0029 Nondestructive CMR NDA/NDE 2 CMR NDA/NDEanalysis/waste assay; waste assay;nondestructive inspection of inspection ofexamination waste drums waste drumsWaste Assay2.3-1 TA-<strong>03</strong>-0029 IAEAClassroomClassroom forIAEA inspectors;a.k.a. “SchoolHouse”2 CMR NDA/NDEwaste assay;inspection ofwaste drums2 Classroom forIAEA inspectors;a.k.a. “SchoolHouse”2 TA-3 Chemistryand MetallurgyResearch (CMR)Bldg.2222Actinidechemistry andmetallurgyresearch andanalysis2 TA-3 Chemistryand MetallurgyResearch Facility(CMR)2 Actinidechemistry andmetallurgyresearch andanalysis22
SWEIS Yearbook—2002 B-3Table B-1. Comparison of <strong>Nuclear</strong> Facilities Lists (continued)SWEISRODSECTION/TABLE BLDG. DESCRIPTION2.3-1 TA-<strong>03</strong>-0029 Wing 9(EnrichedUranium)HCDOE1998DESCRIPTIONEnriched Uraniumfoundry &machining;operation shutdown;(Wing 9)2.4 Pajarito Site2.4-1 TA-18 Site Itself <strong>LA</strong>NL CriticalExperimentFacility (<strong>LA</strong>CEF)and Hillside VaultCriticalExperiment Site2.4-1 TA-18-0023 SNM Vault 2 Category 1 SNM(CASA 1) Vault (CASA 1)2.4-1 TA-18-0026 Hillside Vault 2 Hillside Vault(Pajarito Site);containsSNM>HC-2threshold2.4-1 TA-18-0<strong>03</strong>2 SNM Vault 2 Category 1 SNM(CASA 2) Vault (CASA 2)2.4-1 TA-18-0116 Assembly 2 AssemblyBuildingBuilding (CASA(CASA 3) 3)2.4-1 TA-18-0127 Acceleratorused forweapons x-rayAccelerator usedfor weapons x-ray2.4-1 TA-18-0129 CalibrationLaboratoryCalibrationlaboratory2.4-1 TA-18-0247 Sealed Sources Sealed sources>HC-3 thresholdvalues; not ANSIcertifiedDOE2000HC DESCRIPTION2 EnrichedUranium foundry& machining;operation shutdown;(Wing 9)2 TA-18 <strong>LA</strong>NLCritical ExperimentFacility(<strong>LA</strong>CEF) andHillside Vault2 CriticalExperiment Site2 Category 1 SNMVault (CASA 1)2 Hillside Vault(Pajarito Site);containsSNM>HC-2threshold2 Category 1 SNMVault (CASA 2)2 AssemblyBuilding (CASA3)2 Accelerator usedfor weapons x-ray2 Calibrationlaboratory3 Sealed sources>HC-3 thresholdvalues; notANSI certifiedFWO-OAB 401REV. 1REV. 2(JUNE 2001) (DECEMBER 2001)HHHC DESCRIPTION C DESCRIPTION C2 Enriched 2Uranium foundry& machining;operation shutdown;(Wing 9)2 TA-18 <strong>LA</strong>NLCritical ExperimentFacility(<strong>LA</strong>CEF) andHillside2 CriticalExperiment Site2 Category 1 SNMVault (CASA 1)2 Hillside Vault(Pajarito Site);containsSNM>HC-2threshold2 Category 1 SNMVault (CASA 2)2 AssemblyBuilding (CASA3)2 Accelerator usedfor weapons x-ray2 Calibrationlaboratory32 TA-18 <strong>LA</strong>NLCritical ExperimentFacility andHillside2 CriticalExperiment Site2 Category 1 SNMVault (CASA 1)2 Hillside Vault(Pajarito Site);containsSNM>HC-2threshold2 Category 1 SNMVault (CASA 2)2 AssemblyBuilding (CASA3)2 Accelerator usedfor weapons x-ray2 CalibrationlaboratoryPS-OAB-401REV. 3(JULY 2002)DESCRIPTION2 TA-18 <strong>LA</strong>NLCritical ExperimentFacility(<strong>LA</strong>CEF)2 CriticalExperiment Site222222HC22
B-4Table B-1. Comparison of <strong>Nuclear</strong> Facilities Lists (continued)SWEISRODSECTION/TABLE BLDG. DESCRIPTION2.4-1 TA-18-0258 IAEAClassroom(Trailer)HCDOE1998HDESCRIPTION CTrailer classroom 2for IAEA inspectors;a.k.a. “SchoolHouse”DOE2000DESCRIPTIONHCFWO-OAB 401REV. 1REV. 2(JUNE 2001) (DECEMBER 2001)HHDESCRIPTION C DESCRIPTION CPS-OAB-401REV. 3(JULY 2002)DESCRIPTIONHC2.5 Sigma Complex2.5-1 TA-<strong>03</strong>-0066 44 metric tonsof depleted uraniumstorage2.5-1 TA-<strong>03</strong>-0159 Thoriumstorage3 Storage of 44MT DU3 Storage of 239 kgthorium ingots andoxides3 Storage of 44MT DU33 * *2.6(NA)2.7(NA)2.8(NA)MaterialsScienceLaboratoryTargetFabricationFacilityMachineShopsSWEIS Yearbook—20022.9 High ExplosivesProcessing2.9-1 TA-8 RadiographyFacility2 TA-8 RadiographyFacility2 TA-8 RadiographyFacility2
SWEIS Yearbook—2002 B-5Table B-1. Comparison of <strong>Nuclear</strong> Facilities Lists (continued)SWEISRODSECTION/TABLE BLDG. DESCRIPTIONTA-08-0022 RadiographyFacility2.10(NA)TA-08-0023TA-08-0024TA-08-0070TA-16-0411RadiographyFacilityIsotopeBuildingExperimentalScienceIntermediateDeviceAssemblyHighExplosivesTesting2.11 Los AlamosNeutronScience CenterDOE1998DOE2000HC DESCRIPTIONHC DESCRIPTION2 2 Radiographyfacility; radiographsof nuclearexplosives assembliesandother sourcesexceed HC-2threshold values2 2 Radiographyfacility; radiographsof nuclearexplosivesassemblies andother sourcesexceed HC-2threshold values22TA-53 <strong>Nuclear</strong>Activities at<strong>LA</strong>NSCE2 IntermediateDevice AssemblyBuilding3 TA-53 <strong>Nuclear</strong>Activities at LosAlamos NeutronScience Center(<strong>LA</strong>NSCE)HC2FWO-OAB 401REV. 1REV. 2(JUNE 2001) (DECEMBER 2001)HHDESCRIPTION C DESCRIPTION C2 BetatronBuilding23 TA-53 <strong>Nuclear</strong>Activities at LosAlamos NeutronScience Center(<strong>LA</strong>NSCE)PS-OAB-401REV. 3(JULY 2002)DESCRIPTION2 Betatron Building 2 Betatron Building 23 TA-53 <strong>Nuclear</strong>Activities at LosAlamos NeutronScience Center(<strong>LA</strong>NSCE)3 TA-53 <strong>Nuclear</strong>Activities at LosAlamos NeutronScience Center(<strong>LA</strong>NSCE)HC3
Table B-1. Comparison of <strong>Nuclear</strong> Facilities Lists (continued)B-6SWEISRODSECTION/TABLE BLDG. DESCRIPTION2.11-1 TA-53-1L Manual LujanNeutron ScatteringCenterTA-53-3M ExperimentalTA-53-A-6TA-53-ER1TA-53-P3EScienceAcceleratorProduction ofTritium targetbeam stopActinidescatteringexperimentPionScatteringExperimentHC3DOE1998DOE2000DESCRIPTIONHC DESCRIPTIONManual Lujan 3 Manual LujanNeutron Scattering NeutronCenterScattering CenterAPT target,isotope production,beamstopActinide scatteringexperimentPion ScatteringExperiment3 APT target,isotope production,beamstop3 Actinidescatteringexperiment3FWO-OAB 401REV. 1REV. 2(JUNE 2001) (DECEMBER 2001)HHHC DESCRIPTION C DESCRIPTION C3 Manual Lujan 3 Lujan CenterNeutronNeutron ProductionScattering CenterTarget3 APT target,isotope production,beamstop3 TA-53 ERIActinidescatteringexperiment3 In-place storageDU and A-6beam stop3 TA-53 ERIActinidescatteringexperimentTA-53 Target 4 3WNR NeutronProductiontarget bPS-OAB-401REV. 3(JULY 2002)DESCRIPTION3 Lujan CenterNeutron ProductionTarget3 In-place storageDU and A-6beam stop3 Lujan Center ER-1/2 ActinidescatteringexperimentHC3332.12(NA)HealthResearchLaboratoryBioscienceFacilitiesBioscienceFacilitiesBioscienceFacilitiesBioscienceFacilitiesSWEIS Yearbook—20022.13 RadiochemistryFacility2.13-1 TA-48-0001 RadiochemistryandHot Cell3 TA-48 Radiochemistryand HotCell Facility3 TA-48 RadiochemistryandHot Cell Facility3 TA-48 RadiochemistryandHot Cell Facility3 TA-48 RadiochemistryandHot Cell Facility3 TA-48 RadiochemistryandHot Cell Facility3
SWEIS Yearbook—2002 B-7Table B-1. Comparison of <strong>Nuclear</strong> Facilities Lists (continued)SWEISRODSECTION/TABLE BLDG. DESCRIPTION2.14 RadioactiveLiquidWasteTtreatmentFacility2.14-1 TA-50-0001 MainTreatmentPlantTA-50-0002TA-50-0066LLW TankFarmAcid andCaustic TankFarmHCDOE1998DESCRIPTIONRadiochemistryand hot cellfacility; multiplesmall sources>HC-3 thresholdvaluesRadioactive LiquidWasteTtreatmentFacility2 Main treatmentplant, pretreatmentplant, decontaminationoperationLow level liquidinfluence tanks,treatment effluenttanks, low levelsludge tanksAcid and Causticwaste holdingtanksDOE2000HC DESCRIPTION3 Radiochemistryand hot cellfacility; multiplesmall sources>HC-3 thresholdvalues3 TA-50RadioactiveWaste TreatmentFacility (RLWTF)3 Main treatmentplant, pretreatmentplant,decontaminationoperation3 Low level liquidinfluence tanks,treatment effluenttanks, low levelsludge tanks3 Acid and Causticwaste holdingtanksFWO-OAB 401REV. 1REV. 2(JUNE 2001) (DECEMBER 2001)HHHC DESCRIPTION C DESCRIPTION C3 Radiochemistry 3 Radiochemistryand hot cell and hot cellfacility; multiple facility; multiplesmall sources small sources3 TA-50RadioactiveWaste TreatmentFacility (RLWTF)3 Main treatmentplant, pretreatmentplant,decontaminationoperation3 Low level liquidinfluence tanks,treatment effluenttanks, low levelsludge tanks3 Acid and Causticwaste holdingtanks3 TA-50 RadioactiveLiquidWaste TreatmentFacility(RLWTF)3 Main treatmentplant, pretreatmentplant,decontaminationoperation3 Low level liquidinfluence tanks,treatment effluenttanks, low levelsludge tanks3 Acid and Causticwaste holdingtanksPS-OAB-401REV. 3(JULY 2002)DESCRIPTION3 Radiochemistryand hot cellfacility; multiplesmall sources3 TA-50 RadioactiveLiquidWaste TreatmentFacility (RLWTF)3 Main treatmentplant, pretreatmentplant,decontaminationoperation3 Low level liquidinfluence tanks,treatment effluenttanks, low levelsludge tanks3 Acid and Causticwaste holdingtanksTA-50-0090 Holding Tank Holding tank 3 Holding tank 3 Holding tank 3 Holding tank 3 Holding tank 32.15 SolidRadioactive andChemical WasteFacilitiesHC33333
B-8SWEIS Yearbook—2002Table B-1. Comparison of <strong>Nuclear</strong> Facilities Lists (continued)SWEISRODSECTION/TABLE BLDG. DESCRIPTIONDOE1998HC DESCRIPTION2.15-1 TA-50-0<strong>03</strong>7 RAMROD Radioactive Materials,Research,Operations, andDemonstration(RAMROD)TA-50-0069WCRRFBuildingRadioactive materials,research,operations, anddemonstrationfacility2 TA-50 WasteCharacterization,Reduction, andRepackagingFacility (WCRRF)Waste characterization,reduction,and repackagingfacilityTA-50-190 Liquid waste tank 2TA-50-0069OutsideTA-50-0069OutsideNondestructiveAnalysis MobileActivitiesDrum StorageDOE2000HC DESCRIPTION2 TA-50 RadioactiveMaterials,Research,Operations, andDemonstration(RAMROD)2 Radioactive materials,research,operations, anddemonstrationfacility3 TA-50 WasteCharacterization,Reduction, andRepackagingFacility (WCRRF)3 Waste characterization,reduction ,and repackagingfacilityNDA mobileactivities outsideTA-50-69Drum staging/storage pad andwaste containertemperatureequilibrationactivities outsideTA-50-69FWO-OAB 401REV. 1REV. 2(JUNE 2001) (DECEMBER 2001)HHHC DESCRIPTION C DESCRIPTION C2 TA-50 Radioactive2 TA-50 Radio-Materials, active Materials,Research,Research,Operations, and Operations, andDemonstration Demonstration(RAMROD) (RAMROD)2 Radioactive materials,research,operations, anddemonstrationfacility2 TA-50 WasteCharacterization,reduction, andRepackagingFacility(WCRRF)3 Waste characterization,reduction,and repackagingfacility2 TA-50 ExternalNDA mobileactivities outsideTA-50-692 TA-50 ExternalDrum staging/storage pad andwaste containertemperatureequilibrationactivities outsideTA-50-692 Radioactive materials,research,operations, anddemonstrationfacility2 TA-50 WasteCharacterization,Reduction, andRepackagingFacility(WCRRF)3 Waste characterization,reduction,and repackagingfacility2 TA-50 ExternalNDA mobileactivities outsideTA-50-692 TA-50 ExternalDrum staging/storage pad andwaste containertemperatureequilibrationactivities outsideTA-50-69PS-OAB-401REV. 3(JULY 2002)DESCRIPTION2 TA-50 RadioactiveMaterials,Research,Operations, andDemonstration(RAMROD)2 Radioactive materials,research,operations, anddemonstrationfacility2 TA-50 WasteCharacterization,Reduction, andRepackagingFacility(WCRRF)3 Waste characterization,reduction,and repackagingfacility2 TA-50 ExternalNDA mobileactivities outsideTA-50-692 TA-50 ExternalDrum staging/storage pad andwaste containertemperatureequilibrationactivities outsideTA-50-69HC222322
SWEIS Yearbook—2002 B-9Table B-1. Comparison of <strong>Nuclear</strong> Facilities Lists (continued)SWEISRODSECTION/TABLE BLDG. DESCRIPTIONTA-54-Area G LLW WasteStorage/DisposalDOE1998HC DESCRIPTION2 TA-54 WasteStorage andDisposal FacilityLow level waste(LLW) (includingmixed waste)storage anddisposal in Domes,pits, shafts, andtrenches. TRUwaste storage indomes and shafts(does not includeTWISP). TRUlegacy waste inpits and shafts.Low level disposalof asbestos in pitsand shafts.Operationsbuilding; TRUwaste storageTA-54 TWISP TransuranicWaste InspectableStorageProject (TWISP)DOE2000HC DESCRIPTION2 TA-54 WasteStorage andDisposal Facility(Area G)2 Low level waste(LLW) (includingmixed waste)storage anddisposal in Domes,pits, shafts, andtrenches. TRUwaste storage indomes and shafts(does not includeTWISP). TRUlegacy waste inpits and shafts.Low level disposalof asbestos in pitsand shafts.Operationsbuilding; TRUwaste storage2 TA-54TransuranicWaste InspectableStorageProject (TWISP)FWO-OAB 401REV. 1REV. 2(JUNE 2001) (DECEMBER 2001)HHHC DESCRIPTION C DESCRIPTION C2 TA-54 Waste 2 TA-54 WasteStorage and Storage andDisposal Facility Disposal Facility(Area G)(Area G)2 Low level waste(LLW) (includingmixed waste)storage anddisposal inDomes, pits,shafts, andtrenches. TRUwaste storage indomes and shafts(does not includeTWISP). TRUlegacy waste inpits and shafts.Low leveldisposal ofasbestos in pitsand shafts.Operationsbuilding; TRUwaste storage2 TA-54TransuranicWaste InspectableStorageProject (TWISP)2 Low level waste(LLW) (includingmixed waste)storage anddisposal inDomes, pits,shafts, andtrenches. TRUwaste storage indomes and shafts(does not includeTWISP). TRUlegacy waste inpits and shafts.Low leveldisposal ofasbestos in pitsand shafts.Operationsbuilding; TRUwaste storage2 TA-54TransuranicWaste InspectableStorageProject (TWISP)PS-OAB-401REV. 3(JULY 2002)DESCRIPTION2 TA-54 WasteStorage andDisposal Facility(Area G)2 Low level waste(LLW) (includingmixed waste)storage anddisposal inDomes, pits,shafts, andtrenches. TRUwaste storage indomes and shafts(does not includeTWISP). TRUlegacy waste inpits and shafts.Operationsbuilding; TRUwaste storage2 TA-54TransuranicWaste InspectableStorageProject (TWISP)HC222
B-10SWEIS Yearbook—2002Table B-1. Comparison of <strong>Nuclear</strong> Facilities Lists (continued)SWEISRODSECTION/TABLE BLDG. DESCRIPTIONTA-54-0002TA-54-0<strong>03</strong>3TRU StorageDomeTRU DrumPreparationHCDOE1998DESCRIPTIONOperationsbuilding; TRUwaste storageTA-54-0<strong>03</strong>8 RANT 2 Radioactive AssayNondestructiveTesting (RANT)FacilityHCDOE2000DESCRIPTIONHC3 Radioactive andchemical wastestorage; fabricdome with TRUwaste drumstorage2 TRU wastestorage, fabricdome with TRUwaste drum(Note: TWISP)Nondestructiveassay andexamination ofwaste drums,WIPP certificationof TRU wastedrums, TRUPACTloading of drums3 TA-54 RadioactiveAssayNondestructiveTesting (RANT)Facility3 Nondestructiveassay andexamination ofwaste drums,WIPP certificationof TRUwaste drums,TRUPACTloading of drumsFWO-OAB 401REV. 1REV. 2(JUNE 2001) (DECEMBER 2001)HHDESCRIPTION C DESCRIPTION CPit 22 Pit 22Recovery of Recovery ofburied TRU buried TRUwastewaste(Note: TWISP) (Note: TWISP)3 TA-54 RadioactiveAssayNondestructiveTesting (RANT)Facility3 Nondestructiveassay andexamination ofwaste drums,WIPP certificationof TRUwaste drums,TRUPACTloading of drums32 TRU wastestorage, fabricdome with TRUwaste drum(Note: TWISP)3 TA-54 RadioactiveAssayNondestructiveTesting (RANT)Facility3 Nondestructiveassay andexamination ofwaste drums,WIPP certificationof TRUwaste drums,TRUPACTloading of drumsPS-OAB-401REV. 3(JULY 2002)DESCRIPTION2 TRU wastestorage, fabricdome with TRUwaste drum(Note: TWISP)3 TA-54 RadioactiveAssayNondestructiveTesting (RANT)Facility3 Nondestructiveassay andexamination ofwaste drums,WIPP certificationof TRUwaste drums,TRUPACTloading of drumsHC233
Table B-1. Comparison of <strong>Nuclear</strong> Facilities Lists (continued)SWEIS Yearbook—2002 B-11SWEISRODSECTION/TABLE BLDG. DESCRIPTIONTA-54-0048 TRU StorageDomeTA-54-0049TRU StorageDomeTA-54-0144 Shed 2TA-54-0145 Shed 2TA-54-0146 Shed 2TA-54-0153TRU StorageDomeTA-54-0177 Shed 2TA-54-0226 TemporaryRetrievalDomeTA-54-0229TA-54-0230TensionSupport DomeTensionSupport DomeDOE1998HC DESCRIPTION2 Radioactive andchemical wastestorage; fabricdome with TRUwaste drumstorage2 Radioactive andchemical wastestorage; fabricdome with TRUwaste drumstorage2 Radioactive andchemical wastestorage; fabricdome with TRUwaste drumstorage2 TRU wasteplacement(incidental toremediation)2 TRU wasteplacement(incidental toremediation)2 TRU wasteplacement(incidental toremediation)DOE2000HC DESCRIPTIONHC3 Radioactive andchemical wastestorage; fabricdome with TRUwaste drumstorage3 Radioactive andchemical wastestorage; fabricdome with TRUwaste drumstorage3 Radioactive andchemical wastestorage; fabricdome with TRUwaste drumstorage2 TRU wasteplacement(incidental toremediation)2 TRU wasteplacement(incidental toremediation)2 TRU wasteplacement(incidental toremediation)222FWO-OAB 401REV. 1REV. 2(JUNE 2001) (DECEMBER 2001)HHDESCRIPTION C DESCRIPTION C333PS-OAB-401REV. 3(JULY 2002)DESCRIPTIONHC
Table B-1. Comparison of <strong>Nuclear</strong> Facilities Lists (continued)B-12SWEISRODSECTION/TABLE BLDG. DESCRIPTIONTA-54-0231 TensionSupport DomeTA-54-0232TensionSupport DomeDOE1998HC DESCRIPTION2 TRU wasteplacement(incidental toremediation)2 TRU wasteplacement(incidental toremediation)2TA-54-0283 TensionSupport DomeTA-54-Pad1 Storage Pad TRU wasteremediationprojectTA-54-Pad2 Storage Pad 2 TRU wasteremediationprojectTA-54-Pad3 Storage Pad 2TA-54-Pad4 TRU Storage 2 TRU wasteremediationprojectDOE2000HC DESCRIPTION2 TRU wasteplacement(incidental toremediation)2 TRU wasteplacement(incidental toremediation)2 TRU wasteremediationproject2 TRU wasteremediationproject2 TRU wasteremediationprojectHC222FWO-OAB 401REV. 1REV. 2(JUNE 2001) (DECEMBER 2001)HHDESCRIPTION C DESCRIPTION C2 Recovery ofburied TRUwaste(Note: TWISP)2PS-OAB-401REV. 3(JULY 2002)DESCRIPTION2 Recovery ofburied TRUwaste(Note: TWISP)HC2SWEIS Yearbook—20022.16 Non-KeyFacilities2.16-1 TA-<strong>03</strong>-0040 Physics 3BuildingTA-<strong>03</strong>-0065 Source Storage 2TA-<strong>03</strong>-0130CalibrationBuilding3
Table B-1. Comparison of <strong>Nuclear</strong> Facilities Lists (continued)SWEIS Yearbook—2002 B-13SWEISRODSECTION/TABLE BLDG. DESCRIPTIONTA-33-0086 FormerTritiumResearch2.17(NA)TA-35-0002TA-35-0027<strong>Nuclear</strong>SafeguardsResearchFacility<strong>Nuclear</strong>SafeguardsResearchFacilityEnvironmentalRestorationProject(Note: on-sitetransportationwas evaluatedunder 4.10.3.1as part of theAffectedEnvironment)DOE1998DOE2000HC DESCRIPTIONHC DESCRIPTION3 2 TA-33 HighPressureTritium FacilityFormer tritiumresearch facility3 Multi-tenant officeand laboratoryfacility withnumerous non-ANSI certifiedUranium Sources>HC-2 thresholdvalues3 Safeguard assayinstruction andrelated research;Am-241 exceedingHC-2 thresholdquantities33FWO-OAB 401REV. 1REV. 2(JUNE 2001) (DECEMBER 2001)HHHC DESCRIPTION C DESCRIPTION C2 TA-33 High 2 TA-33 High 2Tritium Facility Facility cPressurePressure Tritium22 Former tritiumresearch facilitySite WideTransportation2 Former tritiumresearch facilityTBDSite WideTransportationTBDPS-OAB-401REV. 3(JULY 2002)DESCRIPTIONSite WideTransportationHCTBD
Table B-1. Comparison of <strong>Nuclear</strong> Facilities Lists (continued)B-14SWEISRODSECTION/TABLE BLDG. DESCRIPTIONHCDOE1998DESCRIPTIONHCDOE2000DESCRIPTIONaTA-<strong>03</strong>-0159 removed from list in April 2000.bWNR Facility Target 4 downgraded to below Category 3 and removed from <strong>Nuclear</strong> Facilities List in July 2002.HCFWO-OAB 401REV. 1REV. 2(JUNE 2001) (DECEMBER 2001)HHDESCRIPTION C DESCRIPTION CPS-OAB-401REV. 3(JULY 2002)DESCRIPTIONLaboratorynuclear materialstransportationthat is not DOTcertified is nowincluded in thescope of10 CFR 830HCTBDcTA-33-86, High Pressure Tritium Facility, removed from <strong>Nuclear</strong> Facilities List in March 2002.SWEIS Yearbook—2002
Table C-1. Radiological Facility ListSWEIS Yearbook—2002 C-1SWEIS ROD FWO-OAB-4<strong>03</strong>, Rev. 0 PS-OAB-4<strong>03</strong>, Rev. 1SWEISYEARBOOK BUILDING DESCRIPTION HAZ CAT DESCRIPTION HAZ CAT DESCRIPTION HAZ CAT2.1 Plutonium Complex a,b2.2 Tritium Facilities a,b2.3 Chemistry and Metallurgy ResearchBuilding a,b2.4 Pajarito Site a,b2.5 Sigma Complex b2.5 TA-3-35 Press Building L/RAD Sigma Press Building RAD Sigma Press Building RAD2.5 TA-3-66 Sigma Building NHC 3 Sigma Building RAD Sigma Building RAD2.5 TA-3-159 Thorium Storage NHC 3 Sigma Thorium Storage RAD Sigma Thorium Storage RAD2.6 Materials Science Laboratory2.6 TA-3-1698 Materials Science Lab L/CHEM Material Science Lab RAD Material Science Lab RAD2.7 Target Fabrication Facility a2.8 Machine Shops2.8 TA-3-102 Tech Shops Addition L/RAD Tech Shop Add RAD Tech Shop Add RAD2.9 High Explosives Processing b2.9 TA-8-22 X-Ray Facility NHC 2 X ray Facility c RAD X ray Facility c RAD2.9 TA-8-70 Nondestructive Testing NHC 2 Nondestructive Testing RAD Nondestructive Testing RAD2.9 TA-8-120 NA Radiography c RAD Radiography c RAD2.9 TA-11-30 Vibration Test Building L/ENS Vibration Test c RAD Vibration Test c RAD2.9 TA-16-88 Casting Rest House L/CHEM RAM Machine Shop RAD RAM Machine Shop RAD2.9 TA-16-202 Laboratory RAD2.9 TA-16-207 NA Component Testing c RAD Component Testing c RAD2.9 TA-16-300 NA Component Storage c RAD Component Storage c RAD2.9 TA-16-301 Rest House L/ENS Component Storage c RAD Component Storage c RAD2.9 TA-16-302 Process Building L/ENS Component Storage Training b RAD Component Storage Training b RAD2.9 TA-16-332 NA Component Storage RAD Component Storage RAD2.9 TA-16-410 Assembly Building L/ENS Assembly Building RAD Assembly Building RAD2.9 TA-16-411 Rest House NHC 2 Assembly Building c RAD Assembly Building c RAD2.9 TA-16-413 Rest House L/ENS Component Storage c RAD2.9 TA-16-415 Rest House L/ENS Component Storage c RAD2.9 TA-37-10 Magazine L/ENS Storage Magazine c RAD Storage Magazine c RAD2.9 TA-37-14 Magazine L/ENS Storage Magazine c RAD Storage Magazine c RAD2.9 TA-37-16 Storage Magazine RAD2.9 TA-37-22 Magazine L/ENS Storage Magazine c RAD2.9 TA-37-24 Magazine L/ENS Storage Magazine c RAD Storage Magazine c RAD2.9 TA-37-25 Magazine L/ENS Storage Magazine c RAD Storage Magazine c RAD
Table C-1. Radiological Facility List (continued)C-2SWEIS Yearbook—2002SWEIS ROD FWO-OAB-4<strong>03</strong>, REV. 0 PS-OAB-4<strong>03</strong>, REV. 1SWEISYEARBOOK BUILDING DESCRIPTION HAZ CAT DESCRIPTION HAZ CAT DESCRIPTION HAZ CAT2.10 High Explosives Testing2.10 TA-15-R183 NA Vault RAD Vault RAD2.11 Los Alamos Neutron Science Center b2.11 TA-53-945 NA RLW Treatment Facility RAD RLW Treatment Facility RAD2.11 TA-53-954 NA RLW Basins RAD RLW Basins RAD2.12 Bioscience Facilities a2.12 TA-43-1 Health Research Laboratory L/RAD andBio LabRADCHEM2.13 Radiochemistry Facility a,b2.14 Radioactive Liquid Waste TreatmentFacility a,b2.15 Solid Radioactive and ChemicalWaste Facilities a,b2.15 TA-54-412 NA DVRS RAD2.16 Non-Key Facilities b2.16 TA-2-1 Omega West Reactor L/RAD Omega Reactor d RAD Omega Reactor d RAD2.16 TA-3-16 Ion Exchange RAD2.16 TA-3-34 Cryogenics Bldg B L/CHEM Cryogenics Bldg B RAD Cryogenics Bldg B RAD2.16 TA-3-40 Physics Bldg NHC 3 Physics Bldg (HP) RAD Physics Bldg (HP) RAD2.16 TA-3-169 NA Warehouse RAD2.16 TA-3-1819 NA Experiment Mat’l Lab RAD2.16 TA-33-86 High Pressure Tritium NHC 3 High Pressure Tritium RAD2.16 TA-21-5 Laboratory Building L/RAD Lab Bldg d RAD Lab Bldg d RAD2.16 TA-21-150 Molecular Chemistry Building L/RAD Molecular Chemical d RAD2.16 TA-35-2 <strong>Nuclear</strong> Safeguards Research NHC 3 <strong>Nuclear</strong> Safeguards Research RAD <strong>Nuclear</strong> Safeguards Research RAD2.16 TA-35-27 <strong>Nuclear</strong> Safeguards Lab NHC 3 <strong>Nuclear</strong> Safeguards Lab RAD <strong>Nuclear</strong> Safeguards Lab RAD2.16 TA-35-125 Laser Building L/RAD2.16 TA-36-1 NA Laboratory and offices RAD2.16 TA-36-214 NA Central HP Calibration Facility RAD2.16 TA-41-1 Underground Vault L/RAD Undergound Vault c RAD Underground Vault c RAD2.16 TA-41-4 Laboratory Building M/RAD Laboratory c RAD2.17 Environmental Restoration Project aabcdNo radiological facilities identified in September 2001.Refer to Appendix B <strong>Nuclear</strong> Facilities List.Could contain radiological material on an interim basis.Scheduled for decontamination and decommissioning.
Appendix D. NPDES Outfall Status SummaryNPDESCATEGORY/OUTFALL NO. TA BLDGFMUNO.DRAINAGEBASINEPADELETE DATE1 01S 3 8 0 Sandia2 01A 001 3 22 80 Sandia Remaining3 02S 9 N/A Pajarito Prior to 944 01A 002 3 22 Combined with 0015 <strong>03</strong>S 16 N/A Water Prior to 946 01A 0<strong>03</strong> 3- 22 Combined with 0017 04S 18 N/A Pajarito Prior to 948 01A 004 3 22 Combined with 0019 05S 21 STP 80 Los Alamos 3/10/9810 01A 005 3 22 Combined with 00111 06S 41 STP12 02A 006 21 357 Eliminated13 07S 46 N/A Canada del Buey Prior to 9414 02A 007 16 540 80 Valle 5/15/9815 08S 48 5 Combined with 10S16 02A 008 22 6 Eliminated 6/8417 09S 53 N/A Los Alamos Prior to 9418 <strong>03</strong>A 009 3 102 70 Two Mile 7/31/9619 10S 35 N/A Mortandad Prior to 9420 04A 010 3 105 Eliminated 4/8721 11S 8 9 Combined with 02S22 04A 011 22 5 Eliminated 4/8723 12S 46 N/A Canada del Buey Prior to 9424 04A 012 35 67 Eliminated 4/8725 13S 46 SWS 80 Canada del Buey Remaining26 04A 013 46 30 66 Canada del Buey 12/6/9527 04A 014 46 88 66 Canada del Buey 7/11/9528 04A 015 48 1 Combined with 04529 04A 016 48 1 66 Mortandad 9/19/9730 04A 017 53 2 Combined with 11431 04A 018 46 24, 59, 76 66 Canada del Buey 12/6/9532 <strong>03</strong>A 019 2 44 Eliminated 5/16/9<strong>03</strong>3 <strong>03</strong>A 020 2 49 66 Los Alamos 7/11/9534 <strong>03</strong>A 021 3 29 65 Mortandad Remaining35 <strong>03</strong>A 022 3 2274 73 Mortandad Remaining36 <strong>03</strong>A 023 3 163, 287 77 Sandia 7/11/9537 <strong>03</strong>A 024 3 187 73 Sandia Remaining38 <strong>03</strong>A 025 3 208 77 Two Mile 7/20/9839 <strong>03</strong>A 026 3 208 Combined with 02540 <strong>03</strong>A 027 3-285 285, SCC 63 Sandia Remaining41 <strong>03</strong>A 028 15 185, 202 67 Water Remaining42 <strong>03</strong>A 029 16 340 Combined with 05443 <strong>03</strong>A <strong>03</strong>0 21 2 Eliminated 4/8744 <strong>03</strong>A <strong>03</strong>1 21 143 80 Los Alamos 7/11/9545 <strong>03</strong>A <strong>03</strong>2 21 150 66 Los Alamos 7/31/9646 <strong>03</strong>A <strong>03</strong>3 21 152 70 Los Alamos 3/1/8647 <strong>03</strong>A <strong>03</strong>4 21 166, 167 70 Los Alamos 9/19/9748 <strong>03</strong>A <strong>03</strong>5 21 210 71 Los Alamos 9/19/9749 <strong>03</strong>A <strong>03</strong>6 21 152, 155, 220 70 Los Alamos 9/19/97SWEIS Yearbook—2002 D-1
Appendix D. NPDES Outfall Status Summary (continued)NPDESCATEGORY/OUTFALL NO. TA BLDGFMUNO.DRAINAGEBASINEPADELETE DATE50 <strong>03</strong>A <strong>03</strong>7 21 314 66 Los Alamos 7/31/9651 <strong>03</strong>A <strong>03</strong>8 33 114 75 Chaquehi 9/19/9752 <strong>03</strong>A <strong>03</strong>9 35 33 Eliminated53 <strong>03</strong>A 040 43 1 72 Los Alamos 1/11/9954 <strong>03</strong>A 041 43 1 Combined with 04055 <strong>03</strong>A 042 46 1 70 Canada del Buey 3/10/9856 <strong>03</strong>A 043 46 31 66 Canada del Buey 7/31/9657 <strong>03</strong>A 044 46 86 Eliminated 4/8758 <strong>03</strong>A 045 48 1 66 Mortandad 12/6/9959 <strong>03</strong>A 046 48 1 Combined with 04560 <strong>03</strong>A 047 53 60 61 Los Alamos Remaining61 <strong>03</strong>A 048 53 62 61 Los Alamos Remaining62 <strong>03</strong>A 049 53 64 61 Los Alamos Remaining63 050 21 257 N/A Los Alamos Last DMR 6/85 a65 051 50 1 RLWTF 84 Mortandad Remaining66 05A 052 16 380 70 Water Prior to 9467 05A 053 16 410 70 Water 1/14/9868 05A 054 16 340 70 Valle 7/20/9869 05A 055 16 150770 Valle Remaining(HEWTF)70 05A 056 16 260 70 Valle 1/14/9871 05A 057 16 265, 267 70 Valle Prior to 9472 05A 058 16 300-306 70 Water 7/31/9673 04A 059 16 460 Combined with 07274 <strong>03</strong>A 060 16 430 70 Water 7/31/9675 05A 061 16 280 70 Valle 7/31/9676 05A 062 16 342 70 Valle 7/31/9677 05A 063 16 400 70 Water 12/5/9578 05A 064 22 34 Pajarito79 05A 065 22 1 Pajarito80 05A 066 9A 21, 28, 29, 32, 67 Valle 3/10/9833,34, 35, 37,38, 4081 05A 067 9B -41, 42, 43, 67 Valle 3/10/9845, & 4682 05A 068 9 48 67 Valle 3/10/9883 05A 069 11 50 70 Water 5/15/9884 04A 070 16 220 70 Valle 9/19/9785 05A 071 16 430 70 Water 3/10/9886 05A 072 16 460 70 Water 9/19/9787 06A 073 16 222 70 Valle 1/14/9888 06A 074 8 22 70 Valle 9/19/9789 06A 075 8 21 67 Valle 1/14/9890 04A 076 8 70 Valle Combined with 11591 06A 077 22 52 67 Pajarito92 06A 078 22 34 67 Pajarito 7/31/9693 06A 079 40 4 67 Pajarito 5/15/9894 06A 080 40 5 67 Pajarito 5/15/9895 06A 081 40 8 67 Pajarito 3/10/98D-2SWEIS Yearbook—2002
Appendix D. NPDES Outfall Status Summary (continued)NPDESCATEGORY/OUTFALL NO. TA BLDGFMUNO.DRAINAGEBASINEPADELETE DATE96 06A 082 40 12 67 Pajarito 1/14/9897 04A 083 16 202 70 Water 9/19/9798 04A 084 22 5 Eliminated 4/8799 04A 085 22 6 Eliminated100 04A 086 3 216 Eliminated 4/87101 04A 087 35 46 Eliminated 4/87102 04A 088 35 67 Eliminated 4/871<strong>03</strong> 04A 089 35 34 Eliminated104 04A 090 35 85 Eliminated 4/87105 04A 091 16 450 70 Water 9/19/97106 04A 092 16 370 70 Water 1/14/98107 04A 093 15 2<strong>03</strong> 67 Valle Prior to 94108 04A 094 3 170 62 Sandia 9/19/97109 095 3 170 Eliminated 4/87110 05A 096 11 51 70 Valle 5/15/98111 05A 097 11 52 70 Water Remaining112 <strong>03</strong>A 098 59 1 71 Two Mile 12/6/95113 06A 099 40 23 67 Pajarito 9/19/97114 06A 100 40 15 67 Pajarito 5/15/98115 04A 101 40 9 67 Pajarito 9/19/97116 04A 102 1 40 Eliminated 6/25/91117 04A 1<strong>03</strong> 15 40 Eliminated 6/25/91118 06A 104 18 30, 31 Eliminated 4/87119 04A 105 15 138 Eliminated120 06A 106 36 1 74 Three Mile 1/11/99121 02A 108 0 Inoperative122 07A 109 3-73 73 80 Sandia 8/4/95123 04A 110 3-73 73 Eliminated 2/89124 04A 111 52-1 1 Eliminated 4/87125 04A 112 52-11 11 Eliminated 4/87126 <strong>03</strong>A 113 53-293,1<strong>03</strong>2 293, 1<strong>03</strong>2, 61 Sandia Remaining(LEDA) 972127 <strong>03</strong>A 114 53-2 61 Sandia 7/11/95128 04A 115 8-70 70 Valle 9/19/97129 04A 116 35-29 Eliminated 4/87130 04A 117 46-41 66 Canada del Buey 7/11/95<strong>131</strong> 04A 118 Paj #4 80 Canada del Buey 10/13/99132 04A 119 Paj #5 Eliminated 4/87133 120 b 3 Geotherm discharge Eliminated134 04A 121 15-263 Eliminated 4/87135 04A 122 15-45 Eliminated 4/87136 06A 123 15-R183 67 Valle 1/14/98137 <strong>03</strong>A 124 46-169 66 Canada del Buey 12/6/95138 <strong>03</strong>A 125 53-28 61 Sandia 7/20/98139 04A 126 48-8 66 Mortandad 12/6/95140 04A 127 35-213 73 Mortandad 9/19/97141 128 22-91 67 Two Mile 12/5/95142 02A 129 21-357 80 Los Alamos Remaining143 <strong>03</strong>A 130 11-30 70 Water RemainingSWEIS Yearbook—2002 D-3
Appendix D. NPDES Outfall Status Summary (continued)NPDESCATEGORY/OUTFALL NO. TA BLDGFMUNO.DRAINAGEBASINEPADELETE DATE144 04A <strong>131</strong> 48-1 66 Mortandad 1/14/98145 06A 132 35-87 75 Mortandad 3/10/98146 04A 133 53-19 61 Sandia147 04A 134 16-478 Eliminated 5/16/90148 04A 135 53-18 61 Sandia 8/16/95149 <strong>03</strong>A 136 46-200 66 Canada del Buey 12/6/95150 04A 137 48-46 66 Mortandad 12/6/95151 <strong>03</strong>A 138 3-127 Eliminated 12/90152 04A 139 15-184 67 Water 9/19/97153 04A 140 3-141 73 Mortandad 8/16/95154 04A 141 39-69 67 Ancho 9/19/97155 04A 142 21-5, 149 66 Los Alamos 7/11/95156 04A 143 15-306 67 Three Mile 5/15/98157 <strong>03</strong>A 145 53-6 61 Sandia 1/14/98158 <strong>03</strong>A 146 53-14 61 Sandia 9/19/97159 04A 147 33-86 70 Chaquehui 7/11/95160 <strong>03</strong>A 148 3-1498, 1807 63 Sandia 9/19/97161 05A 149 16-267 70 Valle Prior to 94162 <strong>03</strong>A 150 41-30 Los Alamos163 04A 151 3-22 80 Sandia 8/16/95164 04A 152 48-28 66 Mortandad 9/19/97165 04A 153 48-1 66 Mortandad 7/20/98166 05A 154 40-41 67 Two Mile 12/5/95167 04A 155 9-50 67 Water 12/6/95168 04A 156 39-89 67 Ancho 9/19/97169 04A 157 16-460 70 Water 9/19/97170 <strong>03</strong>A 158 21-209 70 Los Alamos Remaining171 05A 159 16-360 70 Water 8/16/95172 <strong>03</strong>A 160 35-124 73 Mortandad Remaining173 04A 161 Otowi #1 80 Pueblo 10/13/99174 04A 163 Paj #1 80 Sandia 10/13/99175 04A 164 Paj #2 80 Pajarito 10/13/99176 04A 165 Paj #3 80 Sandia 10/13/99177 04A 166 Paj #5 80 Canada del Buey 10/13/99178 04A 167 <strong>LA</strong> Well #1B 80 Los Alamos Prior to 94179 04A 168 <strong>LA</strong> Well #2 80 Los Alamos Prior to 94180 04A 169 <strong>LA</strong> Well #3 80 Los Alamos Prior to 94181 04A 170 <strong>LA</strong> Well #5 80 Los Alamos Prior to 94182 04A 171 Guaje #1 80 Guaje 8/23/99183 04A 172 Guaje #1A 80 Guaje 10/13/99184 04A 173 Guaje #2 80 Guaje 9/21/99185 04A 174 Guaje #4 80 Guaje 7/20/98186 04A 175 Guaje #5 80 Guaje 8/23/99187 04A 176 Guaje #6 80 Rendija 8/23/99188 04A 177 Guaje Booster 1 80 Guaje 10/13/99189 04A 178 <strong>LA</strong> Booster 1 80 Los Alamos Prior to 94190 04A 179 Pajarito Potable Water blowdown191 <strong>03</strong>A 180 43-44 72 Los Alamos 7/11/95192 <strong>03</strong>A 181 55-6 76 Mortandad RemainingD-4SWEIS Yearbook—2002
Appendix D. NPDES Outfall Status Summary (continued)NPDESCATEGORY/OUTFALL NO. TA BLDGFMUNO.DRAINAGEBASINEPADELETE DATE193 04A 182 21-10<strong>03</strong> 80 Los Alamos 5/15/98194 06A 183 3-510 63 Sandia 8/16/95195 <strong>03</strong>A 184 53-17 N/A Sandia 8/16/95196 <strong>03</strong>A 185 15-312 (DARHT) 67 Water Remaining197 04A 186 Otowi #4 80 Los Alamos 10/13/99198 <strong>03</strong>A 199 3-1837 63 Sandia In permit 2-1-01aDMR = Discharge Monitoring Report. The last DMR submitted for this outfall was in June 1985.bResearch of the NPDES records indicates that Outfall 120 has not been on any NPDES permit since 1978. The “geotherm” under the Drainage BasinColumn would indicate that a geothermal discharge was anticipated.SWEIS Yearbook—2002 D-5
D-6SWEIS Yearbook—2002
Appendix E.Preliminary Assessment of Potential Impact of <strong>LA</strong>NL Site Boundary Changes and Land Transferon Accident Analyses in the SWEISIntroductionThis report summarizes the results of evaluating the potential for DOE site boundary changes and landtransfers to have effects on the analyses of risk-dominant accidents in the Site-Wide Environmental ImpactStatement (SWEIS) for Continued Operation of the Los Alamos <strong>National</strong> Laboratory (DOE 1999). A recentDOE policy on the use of site boundaries and commercial ventures and municipal operations within <strong>LA</strong>NL aswell as transfers of land to public entities resulted in changes in distances to public receptors at which effectsare predicted. These changes potentially create the need to alter the accident analyses in the SWEIS thatpredict, among other things, radiological dose consequences and health effects to public receptors. As such,we conducted a preliminary assessment of the potential for these changes to cause impacts to radiologicaldose consequences and effects for risk-dominant accidents reported in the SWEIS.Risk-dominant accidents analyzed in the SWEIS assess radiological consequences to maximally-exposedindividual (MEI) members of the public. Each accident has a location identified, usually the nearest pointof public access or location, at which a maximum dose could occur. Highways over which the DOE canexercise control during emergency conditions are not necessarily public MEI locations. Commercial venturesand municipal operations within <strong>LA</strong>NL are not necessarily MEI locations. But analyses for EISs such as theSWEIS often evaluate several public receptor locations for each accident. Pajarito Road, Royal Crest TrailerPark, State Road 502, State Road 4, Diamond Drive, White Rock, or the Los Alamos town site served as MEIor alternate public receptor locations for the 16 risk-dominant radiological accidents. Alternatively, parcels ofDOE/<strong>LA</strong>NL property given or transferred to public entities do introduce new locations of unrestricted publicaccess, potentially changing the MEI location for a given <strong>LA</strong>NL facility. This, in turn, can potentially changethe results of a radiation dose consequence/human health effects analysis. Given that the SWEIS serves asthe baseline to which all subsequent (post-1999) changes in operations and potential accidents are comparedunder NEPA, it is important to determine whether any major changes in the distance analysis parametermight have occurred because incremental risk from the introduction of new operations are evaluated againstthe SWEIS. Thus, we contrasted the MEI location for risk-dominant accidents in the SWEIS against thelocations of already transferred parcels, new site boundaries, or proposed new commercial ventures andmunicipal operations. We then used subjective judgment on whether these new locations had the potential tosubstantially change estimated MEI radiation doses given new distances to public receptors.MethodsThe general procedure for making this assessment was to contrast the role of a site boundary or transferredparcel of land in analyzing accidents under NEPA against the magnitude of the changes in distances to siteboundaries or transferred parcels. More specifically, we developed an understanding of the nature of the siteboundary and land ownership changes, identified resultant changes in distances to public MEI locations, andconsidered potential changes to MEI dose consequences and human health effects. We discuss the magnitudeof change to accident analyses in the SWEIS.We consulted key scientists and managers at <strong>LA</strong>NL (as cited throughout this document) that conductaccident analyses or manage related programs or activities as well as reviewing the SWEIS (DOE 1999)for potential impacts. While accident analyses for NEPA can, and often do, have different objectives thanaccident analyses for facility safety authorization, we note that the DOE has agreed that impacts of the siteboundary changes to <strong>LA</strong>NL facility safety authorizations can be assessed at the time of a facility’s normallyscheduled update to facility safety documents (Satterwhite 20<strong>03</strong>).SWEIS Yearbook—2002 E-1
Site Boundary ChangesOn December 11, 2002, DOE/NNSA/<strong>LA</strong>SO established a policy on the determination and use of theDOE/<strong>LA</strong>NL site boundary for use in evaluating dose to the Maximally Exposed Offsite Individual (MEOI)in facility safety authorization basis (AB) documents (DOE 2002a). The new boundaries are shown inFigure E-1. The policy also included instruction on how to treat potential receptors at commercial venturesand municipal operations within <strong>LA</strong>NL; e.g., the Research Park or the proposed new county landfill. Theseentities would include parcels of DOE/<strong>LA</strong>NL property that were given to public entities through the LandTransfer process.The first objective of the accident analysis in NEPA reviews is to characterize the overall risk posed byoperations, creating a context for the decision maker and putting the operations in perspective for the public(DOE 2002b). The concern is with presenting accidents that illustrate dominant consequences and theirlikelihood. Dominant consequences are often judged on the basis of maximum dose to the public froma spectrum of accidents, which is often highlighted by a consideration of the MEI member of the public.This MEI is defined as the outdoor, offsite location having the highest exposure and is almost always atthe site boundary closest to the release point. Other types of receptors, such as workers and populations insurrounding communities are generally unaffected by the site boundary changes. To obtain a general senseof the magnitude of change to the nearest site boundary for various facilities at <strong>LA</strong>NL we consulted <strong>LA</strong>NL’sProbabilistic Risk and Hazards Analysis Group (D-11) (Letellier 2002, 20<strong>03</strong>). For various facilities, D-11 made preliminary estimates of distances to the new nearest site boundaries for 16 equally spaced pointsradiating outwardly from each facility. For some of these facilities, distances to long-standing receptorlocations were contrasted with new receptor locations. While there are sometimes changes in the distance tothe nearest site boundary for several sectors from a given facility, in general there has been very little changeto the single nearest receptor. Using TA-55 for example (Figures E-2a and E-2b), although the receptorlocation in sectors 2, 3, 4, 5, 13, 14, 15, and 16 are now closer because of the addition of East Jemez Road(Truck Route) as a new receptor location, the distance to the nearest receptor–Royal Crest Trailer Park–hasnot changed. There are few examples where the distance to the nearest receptor from a facility has changedsubstantially.The SWEIS is the most recent substantial NEPA baseline documenting the effect of accidents to humanhealth and the environment. For many of the risk-dominant facility-specific accidents, Pajarito Road isan MEI location in the SWEIS. The most substantial changes to site boundaries with potential impact onNEPA assessments may be the allowance of continual public access to East Jemez Road and to the portionof State Road 4 from White Rock to Bandelier (Figure E-1). With no change to Pajarito Road as a receptorlocation, the changes for the most part do not affect maximum doses to receptors for the majority of facilityspecificaccidents in the SWEIS. For example, for the bounding accident in the SWEIS (“RAD-09”), a TRUwaste drum puncture or failure at TA-54, the MEI location does not change from Pajarito Road. For RAD-12, an earthquake-induced release of Pu from the DARHT generating relatively high potential MEI dosesand potential effects, MEI doses were computed for State Road 4, Pajarito Road, and Bandelier <strong>National</strong>Monument; these locations remain in effect for the DARHT. Thus, because EISs often do estimate doses atseveral offsite receptor locations, the impact of a site boundary change is lower than otherwise if only onereceptor location was used.A few facilities will be affected by the change in site boundaries. The <strong>LA</strong>NSCE at TA-53, BerylliumTechnology Facility (BTF) at TA-<strong>03</strong>, and Sigma Facility at TA-<strong>03</strong> are examples of facilities that will havea closer MEI. While the change in distance to nearest MEI for the <strong>LA</strong>NSCE could increase dispersioncoefficients by a factor of approximately four, it was screened out of final consideration in the SWEIS dueto a lack of credible accidents. The BTF was also screened due to a lack of credible accidents. Thus, forsome facilities, even though the distance to MEI is shortened, the lack of consequences of concern makes theissue of closer MEIs less impacting. In the SWEIS, the Sigma Facility was retained for detailed analysis ofconsequences of an accident involving hydrogen cyanide. The magnitude and type of effects are measuredE-2SWEIS Yearbook—2002
Figure E-1. Site boundaries for conducting accident analyses at <strong>LA</strong>NL (Source: RRES/ECO).SWEIS Yearbook—2002 E-3
Figure E-2a. TA-55 old evaluationboundary (Source: Letellier 2002).Figure E-2b. TA-55 new evaluationboundary (Source: Letellier 2002).E-4SWEIS Yearbook—2002
y estimating distances within which Emergency Response Planning Guideline (ERPG) conditions couldoccur. ERPG-2 or -3 effects are irreversible health effects (ERPG-2) or life threatening health effects (ERPG-3). The SWEIS showed that even under adverse dispersion conditions, the ERPG distances did not extendto the Los Alamos town site, which was the nearest public receptor location at approximately 0.7 mi away.East Jemez Road is relatively close (~0.4 mi) to the Sigma Facility. This is one example where the changein policy could result in ERPG-2 and -3 conditions applying to members of the public, at least for the moreconservative scenarios analyzed in the SWEIS for this facility.The second objective of accident analyses under NEPA is to realistically quantify the increment in riskamong alternatives, as input to a reasoned choice among the alternatives. To achieve this, there is a needto identify significant changes in the frequency or consequence/effect of postulated accidents among thealternatives. Changes in site boundaries would most affect the consequence portion of risk estimates. In ourreview of the SWEIS for changes in consequences among the different alternatives that could be affectedby the site boundary changes we almost always found no change for the No Action Alternative. Since thesite boundary changes have minimal impact on consequences, little or no change is expected among thealternatives disclosed in the SWEIS.Land TransferTable E-1 lists the parcels of land that were transferred in 2002 as well as those remaining to be transferred.The parcels are also shown in Figure E-3. All of the transfer parcels appear to be located at or very neara DOE/<strong>LA</strong>NL boundary, the majority of them on the north boundary and some on the southeast boundaryadjacent to the city of White Rock. The 16 radiological risk-dominant accidents evaluated in the SWEIS andaffected facility are listed in Table E-2 and the approximate location of some of the key facilities are shown inFigure E-3. Only two of the 16 radiological accidents appear to concern facility locations that have a shorterdistance to a transfer parcel than to the MEI location analyzed in the SWEIS.Facilities for which Pajarito Road was used as an MEI location (e.g., RANT Facility, <strong>LA</strong>CEF at TA-18,WCRRF and TWISP at TA-54, or Plutonium Facility at TA-55) are unaffected by the land transfer becausePajarito Road remains much closer to those facilities than the nearest transferred parcel or group of parcelssuch as the DOE/<strong>LA</strong>SO property off of Trinity Drive or property in the TA-21 area. Facilities for whichDiamond Drive was used as an MEI location such as the CMR are unaffected by the land transfer becauseDiamond Drive remains closer to those facilities than the nearest transferred parcel or group of parcels suchas the DOE/<strong>LA</strong>SO property. Facilities for which State Road 4 south of <strong>LA</strong>NL were used as an MEI locationsuch as the DARHT at TA-15 are unaffected by the land transfer because State Road 4 remains much closerto those facilities than the nearest transferred parcel or group of parcels such as the group of parcels (DOE/<strong>LA</strong>SO, TA-21, Manhattan Monument, Airport, etc.) that are far to the north of the DARHT. Facilities forwhich the Royal Crest Trailer Park off of E. Jemez Road was used as an MEI location such as the PlutoniumFacility at TA-55 are unaffected by the land transfer because the Trailer Park is still closer to those facilitiesto the south than the nearest transferred parcel or group of parcels such as the group of parcels (DOE/<strong>LA</strong>SO,TA-21, Manhattan Monument, Airport, etc.) to the north of the Plutonium Facility.SWEIS Yearbook—2002 E-5
Table E-1. Land Parcels Transferred and to be TransferredDESIGNATOR DESCRIPTION RECIPIENTTRANSFERREDTRANSFERDATEACREAGEA-1 Manhattan Monument (0 ac) County 11/1/06 0.07A-12 <strong>LA</strong>AO-1 (East) County 11/1/06 4.51A-17 TA-74-1 (West) (3 ac) County 11/1/06 5.52A-19 White Rock-1 County 11/1/06 76.33A-2 Site 22 (0 ac) County 11/1/06 0.17A-3 Airport-1 (East) (8 ac) County 11/1/06 9.44A-6 Airport-4 (West) County 11/1/06 4.18A-9 DP Road-2 (North) (Tank Farm) (4 ac) County 11/1/06 4.25B-1 White Rock-2 Pueblo 11/1/06 14.94B-2 TA-74-3 (North)(Includes B-4) Pueblo 11/1/06 2089.88TO BE TRANSFERREDB-3 TA-74-4 (Middle) (Little Otowi) Pueblo 10/1/07 3.40C-1 White Rock Highway TBD 15.41C-2 White Rock "Y"-1 Highway TBD 104.10C-3 White Rock "Y"-3 (deferred) Highway TBD 53.60A-18 TA-74-2 (South) County 10/1/07 676.52A-7 Airport-5 (Central) (7 ac) County 10/1/07 5.83A-8 DP Road-1 (South) (25 ac) County 10/1/07 24.92A-15 TA-21-1 (West) County 10/1/07 7.55A-13 <strong>LA</strong>AO-2 (West) (<strong>LA</strong>AO Bldg) County 10/1/09 8.82A-4 Airport-2 (North) (90 ac) County 10/1/09 92.60A-10 DP Road-3 (East) County 10/1/09 13.80A-11 (3) DP Road-4 (West) (Archives) County 10/1/10 3.09A-14 Rendija County 10/1/11 918.30A-5 Airport-3 (South) (deferred) County None 34.67A-16 TA-21-2 (East) (deferred) County None 252.10A-20 White Rock "Y"-2 (deferred) County None 323.40C-4 White Rock "Y"-4 (deferred) Highway TBD 20.10E-6SWEIS Yearbook—2002
Table E-2. Sixteen Radiological Accidents Evaluated in <strong>LA</strong>NL SWEIS and Affected FacilitiesACCIDENTSCENARIODESIGNATOR LOCATION FACILITYRAD-01 TA-54-38 Radioassay and Nondestructive Testing (RANT) FacilityRAD-02 TA-3-29 Chemistry and Metallurgy Research (CMR) FacilityRAD-<strong>03</strong> TA-18-116 Los Alamos Critical Experiments Facility (<strong>LA</strong>CEF)RAD-04 TA-15-312 Dual-Axis Radiographic Hydrodynamic Test (DARHT) FacilityRAD-05 TA-21-209 Tritium Science and Fabrication Facility (TSFF)RAD-06 TA-50-37 Radioactive Materials Research Operations and Demonstration (RAMROD) FacilityRAD-07 TA-50-69 Waste Characterization, Reduction, and Repackaging Facility (WCRRF)RAD-08 TA-54-G Tranuranic Waste Inspectable Storage Project (TWISP)RAD-09 TA-54-G Tranuranic Waste Inspectable Storage Project (TWISP)RAD-10 TA-55-4 Plutonium FacilityRAD-11 TA-15-312 Dual-Axis Radiographic Hydrodynamic Test (DARHT) FacilityRAD-12 TA-16-411 Device Assembly BuildingRAD-13 TA-18-116 Los Alamos Critical Experiments Facility (<strong>LA</strong>CEF)RAD-14 TA-55-4 Plutonium FacilityRAD-15 TA-3-29 Chemistry and Metallurgy Research (CMR) BuildingRAD-16 TA-3-29 Chemistry and Metallurgy Research (CMR) BuildingSWEIS Yearbook—2002 E-7
Figure E-3. Location of transfer parcels and key SWEIS accident facilities.E-8SWEIS Yearbook—2002
Analyses for which the city of White Rock was used as a receptor location for releases from TA-54facilities have the potential to be impacted because the White Rock transfer parcels are relatively close toTA-54 facilities. Doses to the city of White Rock MEI were estimated in “RAD-08,” “RAD-09,” and “SITE-01.” The White Rock transfer parcels (“White Rock-1,” “White Rock-2” and “White Rock (C-1)”) are asmuch as 0.34 mi closer to key facilities than a city of White Rock resident. This represents up to a 38%decrease in distance to the MEI receptor at White Rock. A decrease in distance to receptor doesn’t alwaysresult in a dose increase because, depending on the type of release or accident conditions, there may be anarea adjacent to the release point that receives none or little of the plume because an elevated plume travelsabove human receptors due to an elevated release point and/or a buoyant release. Additionally, dose estimatesfor any given accident in the SWEIS are usually made for several different receptors at a breadth of distances,therefore a change to one dose estimate does not invalidate the comprehensive set of analyses. The TA-54-related accidents had dose estimates made for a closer receptor (~0.13 mi to Pajarito Road) than even thenew distance created by the White Rock parcels (~0.59 mi), so the dose to a receptor at the parcels is likelyto still be within the range of doses for any give accident. For RAD-08, for example, dose estimates includedreceptors at Pajarito Road (~0.13 mi) and the dose at Pajarito Road likely bounds any estimates that would bemade for the White Rock parcels.ConclusionsThe multiple distances used for analyses of potential accident radiological doses in the SWEIS and thegeneral location of Land Transfer parcels in comparison to previously analyzed receptor locations, resultin our judgement that parcels of land transferred to various public entities will have little or no impact onestimated doses in the SWEIS. On this basis there appears to be no need to revise accident analyses in theSWEIS because of land transfers from the DOE to public entities. Although we have not reviewed everyfacility at <strong>LA</strong>NL for potential impacts to NEPA coverage as a result of the site boundary changes, a reviewof several facilities and postulated accidents, especially risk-dominant accidents in the SWEIS, resulted inour finding that very few or minimal changes in predicted effects are expected to occur. One exception, ahydrogen cyanide accident at the Sigma Facility, has been noted. The SWEIS still serves the purpose ofcharacterizing <strong>LA</strong>NL operations, differentiating among alternatives, and presenting a baseline that is suitablefor tiering and bounding of potential accidents at <strong>LA</strong>NL. We therefore recommend that site boundary changesbe considered in future NEPA reviews as appropriate.SWEIS Yearbook—2002 E-9
References and Key Information Sources:DOE 2002a: U.S. Department of Energy, “NNSA/O<strong>LA</strong>SO Policy on Site Boundary for Dose Evaluation ofthe Directionally Dependant Maximally Exposed Offsite Individual,” Memorandum, Dec. 11, 2002, R.Erickson (DOE/O<strong>LA</strong>SO).DOE 2002b: U.S. Department of Energy, “Analyzing Accidents Under NEPA,” Offi ce of NEPA Complianceand Policy.DOE 1999: U.S. Department of Energy, “Site-Wide Environmental Impact Statement for Continued Operationof the Los Alamos <strong>National</strong> Laboratory,” DOE/EIS-0238, Albuquerque Operations Offi ce, Albuquerque,New Mexico, 4 Volumes (January 1999).Letellier 2002: Personal communication from Bruce Letellier (<strong>LA</strong>NL/D-11) to Gil Gonzales (<strong>LA</strong>NL/RRES-ECO), e-mail December 19, 2002.Letellier 20<strong>03</strong>: Personal communications from Bruce Letellier (<strong>LA</strong>NL/D-11) to Gil Gonzales (<strong>LA</strong>NL/RRES-ECO), e-mails February 13, 20<strong>03</strong> and February 20, 20<strong>03</strong>.Satterwhite 20<strong>03</strong>: Telephone communication from David Satterwhite (<strong>LA</strong>NL/PS-OAB) to Gil Gonzales(<strong>LA</strong>NL/RRES-ECO), Feb. 12, 20<strong>03</strong>.E-10SWEIS Yearbook—2002
Appendix F. Future ProjectsThe Appendix F tables present a summary of the TYCSP reports prepared in CY 2001 and CY 2002 for FY2001 and FY 20<strong>03</strong>, respectively. To the maximum extent possible, the tables are arranged to compare a projectlisted in the FY 20<strong>03</strong> report to what is identified for the same project in the FY 2001 report. However, becausethe two TYCSP reports were prepared against different guidelines, the tables in the 2002 Yearbook cannot beeasily compared to the tables in Appendix D of the 2001 Yearbook.The tables in this appendix have several items in common. The Project Name and Number are as they arelisted in the TYCSP. In some cases, there have been changes in the name and/or number between the tworeports. The “Data from TYCSP” column indicates that the information in a given row is from the CY 2001(or FY 2001) or from the CY 2002 (or FY 20<strong>03</strong>) report. The NEPA column identifies the coverage that eitherhas occurred or was/is planned for the project. Other than the data from the TYCSP reports, the only datathat have been added are in the Construction Status column on each table. The information in this column isnot complete; the information is limited to that which is easily collected. The Funding Category typically hasseveral subheadings. These include several that are not spelled out:• LI for line item,• C for proposed capital funded line item,• TEC for total estimated cost,• OPC for other project costs,• PE&D for preliminary engineering and design,• GPE for general plant equipment,• GPP for general plant project, and• D&D for decommissioning and demolition.Table F-1 presents the data for RTBF line item projects. These appear directly in the budget approved byCongress.Table F-2 shows the projects associated with RTBF operations of facilities.Table F-3 identifies the projects under the Facilities and Infrastructure Recapitalization Program.Table F-4 provides the data for projects that are under neither the RTBF nor the Facilities and InfrastructureRecapitalization Programs. Each project is either a budget line item or a proposed capital project. The lineitem projects fall into two separate categories – an existing line item or a Cerro Grande Rehabilitation lineitem.Table F-5 captures the data for a second set of projects that are under neither the RTBF nor the Facilitiesand Infrastructure Recapitalization Programs. These projects are expense, general plant, institutional generalplant, and institutional projects.Table F-6 presents the data for a third set of projects that are under neither the RTBF nor the Facilities andInfrastructure Recapitalization Programs. These projects fall under the funding categories of maintenance,standby facility, decommissioning and demolition, and facilities management. The “standby facility” categorydoes not apply at <strong>LA</strong>NL.Table F-7 lists general plant projects identified in the FY 2001 TYCSP that do not appear in the FY 20<strong>03</strong>TYCSP.Table F-8 summarizes decommissioning and demolition projects that have been identified.SWEIS Yearbook—2002 F-1
F-2SWEIS Yearbook—2002Table F-1. RTBF Line Item ProjectsNAMECMR UpgradesPROJECTAPT/Triple A ProjectNUMBER<strong>LA</strong>NL-92-001<strong>LA</strong>NL-98-002FUNDING CATEGORYDATAFROMCONSTRUCTIONTYCSP NEPA STATUS LI C TEC OPC PE&D2001 EA-FONSI Started Into IntoFY 2001 FY 20022002Completed in IntoIntoCY 2002FY 2001FY 20022001 EIS-TBD Started Into IntoFY 2002 FY 20022002IntoIntoFY 2002FY 2002EIS-RODIntoFY 2001 FY 20022002Continued in IntoIntoCY 2002FY 2001FY 20022001 EA-FONSI Started Into IntoDARHT (Phase 2) <strong>LA</strong>NL-98-0<strong>03</strong> 2001 Started IntoDARHT (Phase 1 &2)Nicholas C.Metropolis Center(formerly StrategicComputing Complex)CMR ReplacementProject<strong>National</strong> <strong>Security</strong>Sciences Building(formerly SM-43Replacement)SM-43 D&D<strong>LA</strong>NL-99-007<strong>LA</strong>NL-<strong>03</strong>-0122002Occupancycompleted inCY 20022001 EIS-TBD Startedpreconceptual designin 20012002Design continued inCY 2002EA-FONSIIntoFY 2002FY 2002FY 2002IntoFY 2002IntoFY 2011IntoFY 2009IntoFY 2011<strong>LA</strong>NL-<strong>03</strong>-011 2001 IntoFY 2006<strong>LA</strong>NL-04-011 2002IntoIntoFY 2005FY 2007<strong>LA</strong>NL-06-DD- 2001 CX-TBD13 2002aTA-55 Infrastructure <strong>LA</strong>NL-04-015 2001 EIS-TBDIntoReinvestmentFY 2007<strong>LA</strong>NL-05-015 2002IntoIntoFY 2012FY 2012DX Consolidation <strong>LA</strong>NL-04-016 2001 CX IntoFY 2005IntoFY 20<strong>03</strong>PROPOSEDCAPITALPROJECTS - TECInto FY 2010IntoFY 2004- Into FY 2005IntoFY 2001Into FY 2012IntoFY 2006Into Into FY 2008FY 2005
SWEIS Yearbook—2002 F-3Table F-1. RTBF Line Item Projects (continued)PROJECTFUNDING CATEGORYDATANAME NUMBERFROMTYCSP NEPACONSTRUCTIONSTATUS LI C TEC OPC PE&DDX High Explosives <strong>LA</strong>NL-05-016 2002 EA IntoInto IntoCharacterizationFY 2007FY 2005 FY 2005Support Services <strong>LA</strong>NL-05-019 2001 CXInto IntoConsolidationFY 2005 FY 2005<strong>LA</strong>NL-07-019 2002IntoIntoFY 2007FY 2005Radiography Facility <strong>LA</strong>NL-08-026 2001 EA-TBD Into IntoFY 2010 FY 2008Radiography Facility, <strong>LA</strong>NL-08-241 2002 IntoInto IntoTA-55FY 2010FY 2010 FY 2008TA-18 Relocation <strong>LA</strong>NL-02-009 2001 EIS Draft Started Into IntoProjectFY 2010 FY 20022002 EIS-TBD Continued IntoInto IntoFY 2007FY 2010 FY 2005Central Campus <strong>LA</strong>NL-04-017 2001 EA-TBD - I Into IntoBypass RoadFY 2005 FY 2004Rad Liquid Waste <strong>LA</strong>NL-06-021 2001 EA-TBD- I Into IntoUpgradeFY 2004 FY 2006Replacement of <strong>LA</strong>NL-07-021 2002IntoInto IntoRadioactive LiquidFY 2007FY 2005 FY 2006Waste TreatmentPlant<strong>LA</strong>NSCE Support <strong>LA</strong>NL-06-022 2001 EA-TBD- I IntoComplexReplacement of HighVoltage DistributionSystem for <strong>LA</strong>NSCEAccelerator ComplexInfrastructure RoofUpgradesVulnerable FacilityReplacement Program<strong>LA</strong>NL InfrastructureRevitalizationOn-Site Generation#1 20MWa<strong>LA</strong>NL-06-022 2002IntoFY 2009IntoFY 2006<strong>LA</strong>NL-07-023 2001 CX-TBD - I IntoFY 2005<strong>LA</strong>NL-07-024 2001 CX-TBD - I IntoFY 2007<strong>LA</strong>NL-07-025 2001 CX-TBD - I IntoFY 2012<strong>LA</strong>NL-07-027 2001 EA-TBD - I IntoFY 2009D&D of the existing SM-43 structure is being funded as an OPC cost of the <strong>National</strong> <strong>Security</strong> Sciences Building project.FY 2006IntoFY 2006PROPOSEDCAPITALPROJECTS - TECInto FY 2005Into FY 2010Into FY 2010Into FY 2007Into FY 2004Into FY 2006- Into FY 2005IntoFY 2007IntoFY 2007IntoFY 2008Into FY 2007Into FY 2012Into FY 2009
F-4SWEIS Yearbook—2002Table F-2. RTBF Operations of FacilitiesPROJECTNAMEShort Pulse SpallationSource (SPSS)EnhancementFire Suppression YardMain Replacement (TA-55)NUMBER<strong>LA</strong>NL-97-045<strong>LA</strong>NL-97-047FUNDING CATEGORYDATACAPITALFROMCONSTRUCTIONEQUIPMENT EXPENSETYCSP NEPA STATUS GPE PROJECTS PROJECTS2001 CX Continued Into FY 20<strong>03</strong>2002Into FY 2002Continued2001 CX Started Into FY 20022002Completed in CYInto FY 20<strong>03</strong>2002 except forrepaving2001 CXInto FY 2004Started2002 CX Into FY 2012GENERAL P<strong>LA</strong>NTPROJECTSMonitoring Well Project <strong>LA</strong>NL-98-048(DP)Monitoring Well Project(NA)TA-15 Electrical<strong>LA</strong>NL-00-050 2001 CXInto FY 2002Distribution UpgradeStartedTA-15 Electrical2002Into FY 20<strong>03</strong>Infrastructure UpgradesTA-53-62 Cooling Tower <strong>LA</strong>NL-00-051 2001 CXInto FY 2002Replacement2002Completed Into FY 2002TA-53-64 Cooling Tower <strong>LA</strong>NL-00-052 2001 CXInto FY 20022002Completed Into FY 2002Electrical Infrastructure <strong>LA</strong>NL-00-053 2001 Into FY 2002Safety Upgrade (TA-<strong>03</strong>-40)Electrical Infrastructure <strong>LA</strong>NL-02-071 2001 CX- Into FY 2002Upgrade (TA-<strong>03</strong>-30)Electrical Infrastructure <strong>LA</strong>NL-02-071 2002Into FY 2004Upgrade (TA-<strong>03</strong>-40)Electrical Infrastructure <strong>LA</strong>NL-00-054 2001 CX- Into FY 20<strong>03</strong>Safety Upgrade (TA-48-01)2002Into FY 2004Electrical Infrastructure <strong>LA</strong>NL-00-055 2001 CX - Into FY 20<strong>03</strong>Safety Upgrade (TA-46-31)2002 Into FY 2004TA-53 Cooling Tower a <strong>LA</strong>NL-00-DD-<strong>03</strong> 2002WETF Public<strong>LA</strong>NL-01-059 2001 CX- Into FY 2001Address/Intercom System2002Into FY 2002Water Treatment (TA-<strong>03</strong>) <strong>LA</strong>NL-01-060 2001 CX - Into FY 2002Cooling Tower Water2002 CX Into FY 2002Conservation
SWEIS Yearbook—2002 F-5Table F-2. RTBF Operations of Facilities (continued)NAMESwitch Yard KickerPROJECTElectrical InfrastructureSafety Upgrade (TA-16-200)TA-8 to TA-22 ConnectorRoadESA-TA-16-200 HVACNUMBER<strong>LA</strong>NL-01-046<strong>LA</strong>NL-01-064FUNDING CATEGORYDATACAPITALFROMCONSTRUCTIONEQUIPMENT EXPENSE GENERAL P<strong>LA</strong>NTTYCSP NEPA STATUS GPE PROJECTS PROJECTS PROJECTS2001 CX- Into FY 20<strong>03</strong>2002Into FY 20022001 CX - Into FY 20022002 CX-TBD Into FY 2002<strong>LA</strong>NL-02-089 2002 CX-TBD Into FY 20022001 CX-TBD - Into FY 2002and Electrical Upgrades <strong>LA</strong>NL-02-072 2002 Into FY 2002TA-21 HIC Move to TA- <strong>LA</strong>NL-02-090 2001 CX-TBD- Into FY 20<strong>03</strong>16-2022002Into FY20<strong>03</strong>TA-16 Site Utilities and <strong>LA</strong>NL-<strong>03</strong>-090 2001 EA-TBD - Into FY 20<strong>03</strong>RoadsRoads and Utilities <strong>LA</strong>-<strong>03</strong>-116 2002 CX-TBD Into FY 20<strong>03</strong>WETF 1.6 MVA Generator <strong>LA</strong>NL-<strong>03</strong>-092 2001 CX-TBD- Into FY 20<strong>03</strong>Installation <strong>LA</strong>NL-02-092 2002Into FY 20<strong>03</strong>ESA-FM Weapons Support <strong>LA</strong>NL-<strong>03</strong>-093 2001 EA-TBD - Into FY 20<strong>03</strong>BuildingWeapons Plant Support <strong>LA</strong>NL-02-093 2002 EA-TBD Into FY 2002BuildingFY02 RTBF Funded D&D b <strong>LA</strong>NL-02-DD-05 2002 CX-TBD Into FY 2002TSR Implementation <strong>LA</strong>NL-<strong>03</strong>-110 2002 CX-TBD Into FY 2007 Into FY 2007<strong>Security</strong> Upgrades/Fencing <strong>LA</strong>NL-<strong>03</strong>-109 2002 EA-Prep Into FY 20<strong>03</strong>Fabrication Facility <strong>LA</strong>NL-04-074 2002 EA-Prep Into FY 2004Central Auditorium <strong>LA</strong>NL-04-108 2001 CX-TBD- Into FY 2004Building 2002002Into FY 2004Lujan Center Neutron <strong>LA</strong>NL-04-120 2001 SWEIS- Into FY 2004Production Target System2002Into FY 2004Communication Shop <strong>LA</strong>NL-04-121 2001 CX- Into FY 2004Building <strong>LA</strong>NL-05-121 2002Into FY 2005Vessel Facility 1 of 4 <strong>LA</strong>NL-04-128 2001 CX-TBD- Into FY 2004<strong>LA</strong>NL-06-128 2002Into FY 2006Vessel Facility 2 of 4 <strong>LA</strong>NL-05-143 2001 CX-TBD- Into FY 2005<strong>LA</strong>NL-07-143 2002Into FY 2007Calibration Laboratory <strong>LA</strong>NL-05-145 2001 EA-Prep- Into FY 20052002Into FY 2005
F-6SWEIS Yearbook—2002Table F-2. RTBF Operations of Facilities (continued)PROJECTFUNDING CATEGORYNAMENUMBERDATAFROMTYCSP NEPACONSTRUCTIONSTATUS GPECAPITALEQUIPMENTPROJECTSEXPENSEPROJECTSGENERAL P<strong>LA</strong>NTPROJECTSVessel Facility 3 of 4 <strong>LA</strong>NL-06-152 2001 CX-TBD- Into FY 2006<strong>LA</strong>NL-08-152 2002Into FY 2008Medium/Heavy Lab at TA- <strong>LA</strong>NL-06-153 2001 EA-TBD- Into FY 200622 <strong>LA</strong>NL-08-153 2002Into FY 2008Vessel Facility 4 of 4 <strong>LA</strong>NL-07-160 2001 CX-TBD- Into FY 2007<strong>LA</strong>NL-09-160 2002Into FY 2009Pajarito Road TA-59 to <strong>LA</strong>NL-07-162 2001 CX-TBD - Into FY 2007TA-64 Access and ParkingPajarito Road Access <strong>LA</strong>NL-<strong>03</strong>-068 2002 CX-TBD Into FY 20<strong>03</strong>Control StationsReplace Machine Shop at <strong>LA</strong>NL-08-166 2001 CX-TBD- Into FY 2008TA-22 <strong>LA</strong>NL-09-166 2002Into FY 2009Move Existing Vessel to <strong>LA</strong>NL-08-167 2001 CX-TBD- Into FY 2008TA-22 <strong>LA</strong>NL-09-167 2002Into FY 2009West Jemez/TA-16 <strong>LA</strong>NL-08-169 2001 CX-TBD - Into FY 2008IntersectionsTA-16 Intersection <strong>LA</strong>NL-02-107 2002 CX Into FY 20<strong>03</strong>Bomb Proof at TA-22 <strong>LA</strong>NL-09-175 2001 CX-TBD- Into FY 2009<strong>LA</strong>NL-10-175 2002Into FY 2010Gas Gun Relocation TA-40 <strong>LA</strong>NL-09-176 2001 CX-TBD- Into FY 2009to TA-22 <strong>LA</strong>NL-10-176 2002Into FY 2010Classified HE Storage <strong>LA</strong>NL-10-180 2001 CX-TBD- Into FY 2010<strong>LA</strong>NL-11-180 2002Into FY 2011Joint DX/ESA Conference <strong>LA</strong>NL-10-181 2001 CX-TBD- Into FY 2010Facility <strong>LA</strong>NL-11-181 2002Into FY 2011abD&D of the existing TA-53 cooling towers and support buildings is funded within the funded GPPs replacing the towers (900 square feet).FY02 RTBF funding includes surveillance and maintenance of excess facilities; D&D of facilities in TA-<strong>03</strong> and TA-16 with a total of 6,700 square feet.
SWEIS Yearbook—2002 F-7Table F-3. Facilities and Infrastructure Recapitalization Program (FIRP)PROJECTNAMEVulnerable Office BuildingReplacement #02-1Vulnerable Office BuildingReplacement – HSR ClinicNUMBER<strong>LA</strong>NL-02-075FUNDING CATEGORYDATAGENERALFROMCONSTRUCTIONEXPENSE P<strong>LA</strong>NTTYCSP NEPA STATUS C OPC PE&D PROJECTS PROJECTS2001 CX-TBD - Into FY 20022002Design andInto FY 2002construction beganin CY 20022001 CX-TBD - Into FY 2002MAINTENANCEVulnerable Office Building <strong>LA</strong>NL-02-076Replacement #02-2Vulnerable Office Building2002ConstructionInto FY 2002Replacement – MST Officebegan in CY 2002BuildingVulnerable Office Building <strong>LA</strong>NL-02-077 2001 CX-TBD - Into FY 2002Replacement #02-3Vulnerable Office Building2002Design andInto FY 2002Replacement – S3 Officeconstruction beganBuildingin CY 2002Vulnerable Office Building <strong>LA</strong>NL-02-078 2001 CX-TBD - Into FY 2002Replacement #02-4Vulnerable Office Building2002ConstructionInto FY 2002Replacement – D Officebegan in CY 2002BuildingNMT Maintenance <strong>LA</strong>NL-02-215 2002 CX-TBD Into FY 2002FY02 FIRP Funded D&D <strong>LA</strong>NL-02-DD-06 2002 CX-TBD Into FY 2002 aFY<strong>03</strong> Planning <strong>LA</strong>NL-02-216 2002 CX-TBD Into FY 2002Beryllium TechnologyFacility – Cartridge FilterHouse Install<strong>LA</strong>NL-01-063 2001 CX-TBD - Into FY 2002<strong>LA</strong>NL-<strong>03</strong>-063 2002Into FY 20<strong>03</strong>Electrical Infrastructure <strong>LA</strong>NL-02-070 2001 CX- Into FY 20<strong>03</strong>Safety Upgrade (TA-3-261) <strong>LA</strong>NL-<strong>03</strong>-070 2002Into FY 20<strong>03</strong>TA-08 Division Entrance <strong>LA</strong>NL-02-073 2001 CX- Into FY 20<strong>03</strong>Project <strong>LA</strong>NL-04-073 2002Into FY 2005<strong>LA</strong>NSCE Chiller<strong>LA</strong>NL-02-080 2001 CX- Into FY 2002Replacement <strong>LA</strong>NL-<strong>03</strong>-080 2002Into FY 2004Electrical Infrastructure <strong>LA</strong>NL-<strong>03</strong>-082 2001 CX-TBD - Into FY 2004Safety Upgrade (TA-8-21)2002Into FY 20<strong>03</strong>Not used <strong>LA</strong>NL-01-<strong>03</strong>4 2001
F-8SWEIS Yearbook—2002Table F-3. Facilities and Infrastructure Recapitalization Program (FIRP) (continued)PROJECTFUNDING CATEGORYNAMENUMBERDATAFROMTYCSP NEPACONSTRUCTIONSTATUS C OPC PE&DEXPENSEPROJECTSGENERALP<strong>LA</strong>NTPROJECTSElectrical Infrastructure <strong>LA</strong>NL-<strong>03</strong>-<strong>03</strong>4 2002 CX-TBD Into FY 2004Safety Upgrade (TA-43-1)HE Pressing Consolidation <strong>LA</strong>NL-<strong>03</strong>-081 2002 EA-FONSI Into FY 2004(TA-16-260)Hydrotest Design Facility <strong>LA</strong>NL-<strong>03</strong>-104 2002 CX-TBD Into FY 20<strong>03</strong>Electrical Infrastructure <strong>LA</strong>NL-<strong>03</strong>-083 2001 CX-TBD - Into FY 2004Safety Upgrade (TA-46-1) <strong>LA</strong>NL-04-083 2002Into FY 2004Electrical Infrastructure <strong>LA</strong>NL-<strong>03</strong>-084 2001 CX-TBD - Into FY 2004Safety Upgrade (TA-53-2) <strong>LA</strong>NL-04-084 2002Into FY 2004Electrical Infrastructure <strong>LA</strong>NL-<strong>03</strong>-085 2001 CX-TBD - Into FY 2004Safety Upgrade (TA-59-1) <strong>LA</strong>NL-04-085 2002Into FY 2004Electrical Infrastructure <strong>LA</strong>NL-<strong>03</strong>-086 2001 CX-TBD - Into FY 2004Safety Upgrade (TA-15-40) <strong>LA</strong>NL-04-086 2002Into FY 2004Electrical Infrastructure <strong>LA</strong>NL-<strong>03</strong>-087 2001 CX-TBD - Into FY 2004Safety Upgrade (TA-15-183) <strong>LA</strong>NL-04-087 2002Into FY 2004TA-9-38, 40, 42, 46 Steam to <strong>LA</strong>NL-<strong>03</strong>-088 2001 CX-TBD - Into FY 20<strong>03</strong>Hot Water Heating<strong>LA</strong>NL-04-088 2002Into FY 2004ConversionAdvanced Manufacturing <strong>LA</strong>NL-04-098 2002 CX-TBD Into FY 2004OfficesESA-FM Office Building <strong>LA</strong>NL-04-099 2002 CX-TBD Into FY 2004TA-48 Rad Liquid Waste <strong>LA</strong>NL-<strong>03</strong>-094 2001 CX-TBD - Into FY 20<strong>03</strong>Line Replacement <strong>LA</strong>NL-05-094 2002Into FY 2005Electrical Infrastructure <strong>LA</strong>NL-04-100 2001 CX-TBD - Into FY 2005Safety Upgrade (TA-3-32) <strong>LA</strong>NL-05-100 2002Into FY 2005Electrical Infrastructure <strong>LA</strong>NL-04-101 2001 CX-TBD - Into FY 2005Safety Upgrade (TA-35-2) <strong>LA</strong>NL-05-101 2002Into FY 2005Electrical Infrastructure <strong>LA</strong>NL-04-102 2001 CX-TBD - Into FY 2005Safety Upgrade (TA-35-27) <strong>LA</strong>NL-05-102 2002Into FY 2005Electrical Infrastructure <strong>LA</strong>NL-04-1<strong>03</strong> 2001 CX-TBD - Into FY 2005Safety Upgrade (TA-33-114) <strong>LA</strong>NL-05-1<strong>03</strong> 2002Into FY 2005Electrical Infrastructure <strong>LA</strong>NL-05-135 2002 CX-TBD Into FY 2005Safety Upgrade (TA-39-2)Electrical Infrastructure <strong>LA</strong>NL-05-136 2001 CX-TBD - Into FY 2005Safety Upgrade (TA-46-30)2002Into FY 2005MAINTENANCE
SWEIS Yearbook—2002 F-9Table F-3. Facilities and Infrastructure Recapitalization Program (FIRP) (continued)PROJECTFUNDING CATEGORYNAMENUMBERDATAFROMTYCSP NEPACONSTRUCTIONSTATUS C OPC PE&DEXPENSEPROJECTSGENERALP<strong>LA</strong>NTPROJECTSVulnerable Office Building <strong>LA</strong>NL-04-104 2001 CX-TBD - Into FY 2004Replacement #04-1 <strong>LA</strong>NL-04-105 2002Into FY 2004Vulnerable Office Building <strong>LA</strong>NL-04-105 2001 CX-TBD - Into FY 2004Replacement #04-2 <strong>LA</strong>NL-04-106 2002Into FY 2004Vulnerable Office Building <strong>LA</strong>NL-04-106 2001 CX-TBD - Into FY 2004Replacement #04-3Shock and Vibration <strong>LA</strong>NL-04-111 2001 EA-Prep - Into FY 2004Laboratory <strong>LA</strong>NL-<strong>03</strong>-111 2002 EA-FONSI Into FY 20<strong>03</strong>FWO Office Building <strong>LA</strong>NL-<strong>03</strong>-079 2002 CX-TBD Into FY 20<strong>03</strong>CCF Electrical Upgrades <strong>LA</strong>NL-<strong>03</strong>-057 2002 CX-TBD Into FY 20<strong>03</strong>HVAC Upgrades to North <strong>LA</strong>NL-<strong>03</strong>-058 2002 CX-TBD Into FY 20<strong>03</strong>Wing of TA-43-1TA-46-24 Roof Replacement <strong>LA</strong>NL-<strong>03</strong>-061 2002 CX-TBD Into FY 20<strong>03</strong>Roofing Assessment <strong>LA</strong>NL-<strong>03</strong>-053 2002 CX-TBD Into FY 20<strong>03</strong>Safety/Infrastructure GPPs <strong>LA</strong>NL-<strong>03</strong>-217 2002 CX-TBD Into FY 20<strong>03</strong>FY<strong>03</strong> FIRP Funded D&D <strong>LA</strong>NL-<strong>03</strong>-DD-08 2001 CX-TBD - Into FY 20<strong>03</strong> b2002Into FY 20<strong>03</strong> cFY04 Planning <strong>LA</strong>NL-<strong>03</strong>-063 2002 N/A Into FY 20<strong>03</strong>TA-16-450 Gas Transfer <strong>LA</strong>NL-04-112 2001 CX-TBD - Into FY 2005System2002Into FY 2005Reconfigure TA-39-98, Close <strong>LA</strong>NL-04-113 2001 CX-TBD - Into FY 2004TA-39-2, 39-1<strong>03</strong>, 39-072002Into FY 2004TA-53 Replace Roofs <strong>LA</strong>NL-04-118 2001 CX- Into FY 20042002Into FY 2004TA-35 TSL-189 Trident2001 CX- Into FY 2004Laser HVAC Upgrades <strong>LA</strong>NL-05-1192002Into FY 2005Convert Heating System and <strong>LA</strong>NL-04-124 2001 CX-TBD - Into FY 2004Upgrade Controls at TA-48- <strong>LA</strong>NL-05-124 2002Into FY 2005RC1HVAC/Electrical Upgrade, <strong>LA</strong>NL-04-125 2001 CX-TBD - Into FY 2004MPF-6 <strong>LA</strong>NL-05-125 2002Into FY 2005Otowi Floor<strong>LA</strong>NL-04-126 2001 CX-TBD - Into FY 2005Replacement/Upgrades2002Into FY 2005Electronics/Data Systems <strong>LA</strong>NL-04-127 2001 CX-TBD - Into FY 2004Building <strong>LA</strong>NL-05-127 2002Into FY 2005MAINTENANCE
F-10SWEIS Yearbook—2002Table F-3. Facilities and Infrastructure Recapitalization Program (FIRP) (continued)PROJECTFUNDING CATEGORYNAMENUMBERDATAFROMTYCSP NEPACONSTRUCTIONSTATUS C OPC PE&DEXPENSEPROJECTSGENERALP<strong>LA</strong>NTPROJECTSFiring Site Consolidation <strong>LA</strong>NL-04-129 2001 CX-TBD - Into FY 2004<strong>LA</strong>NL-05-129 2002Into FY 2005Building 193 Reconfiguration <strong>LA</strong>NL-04-130 2001 EA-Prep - Into FY 20052002 EA-FONSI Into FY 2005Electrical Infrastructure <strong>LA</strong>NL-05-095 2002 CX-TBD Into FY 2005Safety Upgrades (TA-9-45)GTS SLEP Support Building <strong>LA</strong>NL-04-132 2001 EA-Prep - Into FY 20052002Into FY 2005FY04 FIRP Funded D&D <strong>LA</strong>NL-04-DD-10 2002 CX-TBD Into FY 2004 dFY05 Planning <strong>LA</strong>NL-04-218 2002 N/A Into FY 2004Electrical Infrastructure <strong>LA</strong>NL-05-137 2001 CX-TBD - Into FY 2005Safety Upgrade (TA-9-35)2002Into FY 2005Electrical Infrastructure <strong>LA</strong>NL-05-138 2001 CX-TBD - Into FY 2006Safety Upgrade (TA-3-39)2002Into FY 2006Electrical Infrastructure <strong>LA</strong>NL-05-139 2001 CX-TBD - Into FY 2005Safety Upgrade (TA-3-102)2002Into FY2005Vulnerable Office Building <strong>LA</strong>NL-05-140 2001 CX-TBD - Into FY 2005Replacement #05-12002Into FY 2005Vulnerable Office Building <strong>LA</strong>NL-05-141 2001 CX-TBD - Into FY 2005Replacement #05-22002Into FY 2005Vulnerable Office Building <strong>LA</strong>NL-05-142 2001 CX-TBD - Into FY 2005Replacement #05-32002Into FY 2005Safety/Infrastructure GPPs <strong>LA</strong>NL-05-219 2002 CX-TBD Into FY 2005FY05 FIRP Funded D&D <strong>LA</strong>NL-05-DD-12 2002 CX-TBD Into FY 2005 eFY06 Planning <strong>LA</strong>NL-05-220 2002 CX-TBD Into FY 2005Power Grid Infrastructure <strong>LA</strong>NL-06-020 2001 EA-FONSIIntoUpgrade fFY 2005-2002Into IntoFY 2007 FY 2005Electrical Infrastructure <strong>LA</strong>NL-06-148 2001 CX-TBD - Into FY 2006Safety Upgrade (TA-9-21)2002Into FY 2006Vulnerable Office Building <strong>LA</strong>NL-06-149 2001 CX-TBD - Into FY 2006Replacement #06-12002Into FY 2006Vulnerable Office Building <strong>LA</strong>NL-06-150 2001 CX-TBD - Into FY 2006Replacement #06-22002Into FY 2006MAINTENANCE
SWEIS Yearbook—2002 F-11Table F-3. Facilities and Infrastructure Recapitalization Program (FIRP) (continued)PROJECTFUNDING CATEGORYNAMENUMBERDATAFROMTYCSP NEPACONSTRUCTIONSTATUS C OPC PE&DEXPENSEPROJECTSGENERALP<strong>LA</strong>NTPROJECTSVulnerable Office Building <strong>LA</strong>NL-06-151 2001 CX-TBD - Into FY 2006Replacement #06-32002Into FY 2006Safety/Infrastructure GPPs <strong>LA</strong>NL-06-221 2002 CX-TBD Into FY 2006FY06 FIRP Funded D&D <strong>LA</strong>NL-06-DD-15 2002 CX-TBD Into FY 2006 gFY07 Planning <strong>LA</strong>NL-06-222 2002 CX-TBD Into FY 2006Infrastructure Roof Upgrades <strong>LA</strong>NL-07-023 2002 CX-TBD Into Into IntoFY 2012 FY 2005 FY 2007<strong>LA</strong>NL Infrastructure <strong>LA</strong>NL-07-025 2002 CX-TBD Into Into IntoRevitalizationFY 2010 FY 2012 FY 2007Vulnerable Office Building <strong>LA</strong>NL-07-157 2001 CX-TBD - Into FY 2007Replacement #07-12002Into FY 2007Vulnerable Office Building <strong>LA</strong>NL-07-158 2001 CX-TBD - Into FY 2007Replacement #07-22002Into FY 2007Vulnerable Office Building <strong>LA</strong>NL-07-159 2001 CX-TBD - Into FY 2007Replacement #07-32002Into FY 2007Safety/Infrastructure GPPs <strong>LA</strong>NL-07-223 2002 CX-TBD Into FY 2007FY07 FIRP Funded D&D <strong>LA</strong>NL-07-224 2002 CX-TBD Into FY 2007 hFY08 Planning <strong>LA</strong>NL-07-225 2002 CX-TBD Into FY 2007Vulnerable Facility<strong>LA</strong>NL-08-024 2002 CX-TBD Into Into IntoReplacement ProgramFY 2010 FY 2010 FY 2008Vulnerable Office Building <strong>LA</strong>NL-08-163 2001 CX-TBD - Into FY 2008Replacement #08-12002Into FY 2008Vulnerable Office Building <strong>LA</strong>NL-08-164 2001 CX-TBD - Into FY 2008Replacement #08-22002Into FY 2008Vulnerable Office Building <strong>LA</strong>NL-08-165 2001 CX-TBD - Into FY 2008Replacement #08-32002Into FY 2008Safety/Infrastructure GPPs <strong>LA</strong>NL-08-226 2002 CX-TBD Into FY 2008FY08 FIRP Funded D&D <strong>LA</strong>NL-08-227 2002 CX-TBD Into FY 2008 iFY09 Planning <strong>LA</strong>NL-08-228 2002 CX-TBD Into FY 2008Vulnerable Office Building <strong>LA</strong>NL-09-172 2001 CX-TBD - Into FY 2009Replacement #09-12002Into FY 2009Vulnerable Office Building <strong>LA</strong>NL-09-173 2001 CX-TBD - Into FY 2009Replacement #09-22002Into FY 2009MAINTENANCE
F-12SWEIS Yearbook—2002Table F-3. Facilities and Infrastructure Recapitalization Program (FIRP) (continued)PROJECTFUNDING CATEGORYNAMENUMBERDATAFROMTYCSP NEPACONSTRUCTIONSTATUS C OPC PE&DEXPENSEPROJECTSGENERALP<strong>LA</strong>NTPROJECTSVulnerable Office Building <strong>LA</strong>NL-09-174 2001 CX-TBD - Into FY 2009Replacement #09-32002Into FY 2009Safety/Infrastructure GPPs <strong>LA</strong>NL-09-229 2002 CX-TBD Into FY 2009FY09 FIRP Funded D&D <strong>LA</strong>NL-09-230 2002 CX-TBD Into FY 2009 jFY10 Planning <strong>LA</strong>NL-08-231 2002 CX-TBD Into FY 2009Vulnerable Office Building <strong>LA</strong>NL-10-178 2001 CX-TBD - Into FY 2010Replacement #10-12002Into FY 2010Vulnerable Office Building <strong>LA</strong>NL-10-179 2001 CX-TBD - Into FY 2010Replacement #10-22002Into FY 2010Safety/Infrastructure GPPs <strong>LA</strong>NL-10-232 2002 CX-TBD Into FY 2010FY10 FIRP Funded D&D <strong>LA</strong>NL-10-233 2002 CX-TBD Into FY 2010 kFY11 Planning <strong>LA</strong>NL-10-234 2002 CX-TBD Into FY 2010Safety/Infrastructure GPPs <strong>LA</strong>NL-11-235 2002 CX-TBD Into FY 2011FY11 FIRP Funded D&D <strong>LA</strong>NL-11-236 2002 CX-TBD Into FY 2011 lFY12 Planning <strong>LA</strong>NL-11-237 2002 CX-TBD Into FY 2011Safety/Infrastructure GPPs <strong>LA</strong>NL-12-238 2002 CX-TBD Into FY 2012FY12 FIRP Funded D&D <strong>LA</strong>NL-12-239 2002 CX-TBD Into FY 2012 mFY13 Planning <strong>LA</strong>NL-12-240 2002 CX-TBD Into FY 2012abcdefghijklmFY02 F&I funding is planned for D&D of TA-3 and TA-16 facilities with a total of 76,800 square feet.Identified as D&D in FY 2002 TYCSP.FY<strong>03</strong> F&I funding is planned for the D&D of facilities at TA-16 and TA-3 with a total of 119,500 square feet.FY04 F&I funding is planned for the D&D of facilities at TA-3, TA-6, TA-16, TA-21 and TA-69 with a total of 81,100 square feet.FY05 F&I funding for the D&D of structures to be prioritized in FY<strong>03</strong>.Identified as proposed in 2001 TYCSP with proposal including TEC funding.FY06 F&I funding for the D&D of structures to be prioritized in FY04.FY07 F&I funding for the D&D of structures to be prioritized in FY05.FY08 F&I funding for the D&D of structures to be prioritized in FY06.FY09 F&I funding for the D&D of structures to be prioritized in FY07.FY10 F&I funding for the D&D of structures to be prioritized in FY08.FY11 F&I funding for the D&D of structures to be prioritized in FY09.FY12 F&I funding for the D&D of structures to be prioritized in FY10.MAINTENANCE
SWEIS Yearbook—2002 F-13Table F-4. Non-RTBF and Non-Facilities and Infrastructure Recapitalization Program (FIRP) Facilities and Infrastructure – LineItem and Proposed Capital ProjectsPROJECTNAMESpallationNeutron SourceLine AcceleratorNMSSUP, PhaseITA-53 IsotopeProductionFacilityNISCLos AlamosCINT GatewayFuel Cell FacilityNUMBER<strong>LA</strong>NL-99-004<strong>LA</strong>NL-99-005<strong>LA</strong>NL-99-006<strong>LA</strong>NL-00-008<strong>LA</strong>NL-02-010<strong>LA</strong>NL-<strong>03</strong>-013DATAFROMTYCSPEXISTING LINEITEMSNEPA2001 EA-TBD - - -2002 N/A - -FUNDING CATEGORYPROPOSED CAPITALPROJECTSCERRO GRANDEREHABILITATION LINE ITEMSCONSTRUCTIONSTATUS TEC OPC PE&D TEC OPC TEC OPC GPP2001 CX Started Into IntoFY 2005 FY 20062002 Into IntoFY 20<strong>03</strong> FY 20062001 EA-CX Started Into IntoFY 2002 FY 20<strong>03</strong>2002 CX Into IntoFY 2002 FY 20<strong>03</strong>2001 EA-FONSI Started Into IntoFY 20<strong>03</strong> FY 20042002Construction Into Intocontinued in CY FY 2002 FY 200420022001 EA-TBD - Into IntoFY 2002 FY 20042002 CX Into FY Into20<strong>03</strong> FY 20052001 EA-TBD- - IntoFY 20042002- IntoFY 2004Bypass Roads <strong>LA</strong>NL-04-017 2002 EA-TBD - IntoFY 2006NMSSUP Phase <strong>LA</strong>NL-04-014 2001 CX- - Into2aFY 2006<strong>LA</strong>NL-05-014 2002- IntoFY 2007IntoFY 2005IntoFY 2006IntoFY 2002IntoFY 2002IntoFY 2006IntoFY 2007IntoFY 2004
F-14SWEIS Yearbook—2002Table F-4. Non-RTBF and Non-Facilities and Infrastructure Recapitalization Program (FIRP) Facilities and Infrastructure – LineItem and Proposed Capital Projects (continued)NAMEAdvancedHydrotestFacilityDARHT (BCP)PROJECTNUMBER<strong>LA</strong>NL-05-018<strong>LA</strong>NL-01-028DATAFROMTYCSPEmergencyOperationsCenter <strong>LA</strong>NL-01-029 2002Office BuildingReplacementProject forVulnerableFacilities (TA-46/TA-16)Site-wide FireAlarmReplacementMulti-ChannelCommunicationSystemTA-50/54 WasteManagementRisk MitigationTA-41 GTSRelocation to S-SiteWater SCADA<strong>LA</strong>NL-01-<strong>03</strong>0<strong>LA</strong>NL-01-<strong>03</strong>1<strong>LA</strong>NL-01-<strong>03</strong>2<strong>LA</strong>NL-01-<strong>03</strong>3<strong>LA</strong>NL-01-<strong>03</strong>5<strong>LA</strong>NL-01-<strong>03</strong>6EXISTING LINEITEMSFUNDING CATEGORYPROPOSED CAPITALPROJECTSCERRO GRANDEREHABILITATION LINE ITEMSNEPACONSTRUCTIONSTATUS TEC OPC PE&D TEC OPC TEC OPC GPP2001 EIS-TBD- Into FY2007IntoFY 20102002Into FY Into Into2007 FY 2010 FY 20102001 EIS-ROD Started Into FY -20012002- -2001 EA-FONSIInto IntoFY 2001 FY 2001Construction- -started in CY 20022001 CX Started Into IntoFY 2001 FY 20012002- -2001 CX Started IntoFY 2001IntoFY 20012002- -2001 EA-FONSI Started Into IntoFY 2001 FY 20012002- IntoFY 20022001 CX Started Into IntoFY 2001 FY 20012002Into IntoFY 2002 FY 20022001 CX Started Into FY 20012002-2001 CX Started Into FY 20022002Into FY 2002
SWEIS Yearbook—2002 F-15Table F-4. Non-RTBF and Non-Facilities and Infrastructure Recapitalization Program (FIRP) Facilities and Infrastructure – LineItem and Proposed Capital Projects (continued)PROJECTNAMEEmergencyGenerator andMotor ControlCenterPajarito RoadGas LineWTA SubstationBuilding 202UpgradeWell-HeadProtectionInternalConnectivityReplacement ofDestroyed/Damaged ProgramEquipmentHigh ActivityWaste StorageFacilityNUMBER<strong>LA</strong>NL-01-<strong>03</strong>7<strong>LA</strong>NL-01-<strong>03</strong>8<strong>LA</strong>NL-01-<strong>03</strong>9<strong>LA</strong>NL-01-040<strong>LA</strong>NL-01-041<strong>LA</strong>NL-01-042<strong>LA</strong>NL-01-043<strong>LA</strong>NL-01-044DATAFROMTYCSPEXISTING LINEITEMSFUNDING CATEGORYPROPOSED CAPITALPROJECTSCERRO GRANDEREHABILITATION LINE ITEMSNEPACONSTRUCTIONSTATUS TEC OPC PE&D TEC OPC TEC OPC GPP2001 EA-FONSI Started Into FY 20022002Into FY 2002Design andacquisition inprocess in CY 20022001 CX Started Into FY 20022002Into FY 20022001 EA-FONSI Started Into FY 20012002-2001 EA-Draft- Into FY 20012002-2001 CX- Into FY 20012002-2001 CX - Into 20012002 EA-FONSI -2001 CX Started Into FY 20012002-2001 CX- Into FY 20012002-
F-16SWEIS Yearbook—2002Table F-5. Non-RTBF Non-Facilities and Infrastructure Recapitalization Program (FIRP) Facilities and Infrastructure – Expense,General Plant, Institutional General Plant, and Institutional ProjectsPROJECTNAMEMonitoring Well Project(ER)PT<strong>LA</strong> Live Fire HouseNUMBER<strong>LA</strong>NL-98-049<strong>LA</strong>NL-01-062DATAFROMTYCSP NEPACONSTRUCTIONSTATUSEXPENSEPROJECTS2001 CX Started Into FY 20042002Into FY 2004CX2002Construction started Into FY 2002in CY 2002SWEIS20022001 - Into FY 2001High Power DetonatorFacility<strong>LA</strong>NL-01-056 2001 - Into FY 2002Into FY 2002Bioscience Level 3 <strong>LA</strong>NL-02-065 2001 EA-Prep - Into FY 2002Laboratory2002 EA- Construction startedInto FY 2002FONSI in CY 2002TA-55 Unclassified <strong>LA</strong>NL-02-066 2001 CXInto FY 2002Office BuildingManufacturing Technical2002Construction startedInto FY 2002Support Facilityin CY 2002O<strong>LA</strong>SO Office Building <strong>LA</strong>NL-02-067 2001 CX- Into FY 20022002-TA-16 Site Utilities and <strong>LA</strong>NL-<strong>03</strong>-091 2001 EA-TBD- Into FY 20<strong>03</strong>Roads <strong>LA</strong>NL-02-091 2002Into FY 20<strong>03</strong>TA-15 Firing Sites <strong>LA</strong>NL-<strong>03</strong>-096 2001 CX-TBD - Into FY 20<strong>03</strong>Support FacilityFiring Point Beryllium2002 CX-TBD Into FY 20<strong>03</strong>Mitigation, TA-15-312Stockpile Support <strong>LA</strong>NL-<strong>03</strong>-114 2002 CX-TBD Into FY 20<strong>03</strong>BuildingHomeland <strong>Security</strong> <strong>LA</strong>NL-<strong>03</strong>-<strong>131</strong> 2002 CX-TBD Into FY 20<strong>03</strong>BuildingDX Transition Office <strong>LA</strong>NL-<strong>03</strong>-242 2002 CX-TBD Into FY 20<strong>03</strong>BuildingTA-50-37 RAMROD <strong>LA</strong>NL-04-115 2001 CX-TBD- Into FY 2004Upgrade for Act. Chem.2002Into FY 2004TA-<strong>03</strong>-1698 Offices <strong>LA</strong>-04-117 2001 CX- Into FY 2004above Microscope Labs2002Into FY 2004Royal Crest Intersection <strong>LA</strong>NL-04-122 2001 CX- Into FY 2004Improvements2002Into FY 2004FUNDING CATEGORYGENERAL INSTITUTIONALP<strong>LA</strong>NT GENERAL P<strong>LA</strong>NTPROJECTS PROJECTSINSTITUTIONAL
SWEIS Yearbook—2002 F-17Table F-5. Non-RTBF Non-Facilities and Infrastructure Recapitalization Program (FIRP) Facilities and Infrastructure – Expense,General Plant, Institutional General Plant, and Institutional Projects (continued)PROJECTFUNDING CATEGORYNAME NUMBERDATAFROMTYCSP NEPACONSTRUCTIONSTATUSEXPENSEPROJECTSGENERALP<strong>LA</strong>NTPROJECTSINSTITUTIONALGENERAL P<strong>LA</strong>NTPROJECTSTA-64 HAZMAT <strong>LA</strong>NL-04-123 2001 CX-TBD- Into FY 2004Vehicle Entrance2002Into FY 2004East Jemez Upgrade <strong>LA</strong>NL-04-133 2001 CX-TBD- Into FY 2004(Landfill to Royal Crest)2002Into FY 2004Parking Structure <strong>LA</strong>NL-04-134 2001 CX-TBD- Into FY 20042002Into FY 2004New TA-51/54 <strong>LA</strong>NL-05-146 2001 CX-TBDInto FY 2005Intersection2002Into FY 2005Anchor Ranch Road <strong>LA</strong>NL-05-147 2001 CX-TBDInto FY 2005South2002Into FY 2005Anchor Road North <strong>LA</strong>NL-06-154 2001 CX-TBDInto FY 20062002Into FY 2006West Jemez from Casa <strong>LA</strong>NL-06-155 2001 CX-TBDInto FY 2006Grande to West Road2002Into FY 2006Widen Pajarito Road TA- <strong>LA</strong>NL-06-156 2001 EA-TBDInto FY 200618 to TA-542002Into FY 2006Pistol Range Intersection <strong>LA</strong>NL-07-161 2001 CX-TBDInto FY 20072002Into FY 2007Pajarito Road TA-59 to <strong>LA</strong>NL-07-162 2002 CX-TBD Into FY 2007TA-64 Access andParkingUpgrade Eniwetok to <strong>LA</strong>NL-08-168 2001 CX-TBDInto FY 2008Sigma Mesa2002Into FY 2008West Jemez/TA-16 <strong>LA</strong>NL-08-169 2002 CX-TBD Into FY 2008IntersectionTA-53 Sidewalks <strong>LA</strong>NL-08-170 2001 CX-TBD- Into FY 20082002Into FY 2008Upgrade Guardrails <strong>LA</strong>NL-08-171 2001 CX-TBD- Into FY 20082002Into FY 2008TA-18 Intersection <strong>LA</strong>NL-09-177 2001 CX-TBD- Into FY 2009West Jemez Overpass atTA-3<strong>LA</strong>NL-10-1822002Into FY 20092001 CX-TBD- Into FY 20102002Into FY 2010INSTITUTIONAL
F-18SWEIS Yearbook—2002Table F-5. Non-RTBF Non-Facilities and Infrastructure Recapitalization Program (FIRP) Facilities and Infrastructure – Expense,General Plant, Institutional General Plant, and Institutional Projects (continued)PROJECTNUMBERDATAFROMTYCSP NEPACONSTRUCTIONSTATUSEXPENSEPROJECTSGENERALP<strong>LA</strong>NTPROJECTS<strong>LA</strong>NL-02-069 2001 CX Into FY 2002FUNDING CATEGORYINSTITUTIONALGENERAL P<strong>LA</strong>NTPROJECTSNAMEBadge OfficeTBD 2002 CX-TBD -BUS-4 Office Building TBD 2002 CX-TBD -Distribution Center <strong>LA</strong>NL-<strong>03</strong>-144 2002 CX-TBD Into FY 20<strong>03</strong>Parking Structure <strong>LA</strong>NL-<strong>03</strong>-243 2002 CX-TBD Into FY 20<strong>03</strong>TA-3 Steam Condensate <strong>LA</strong>NL-00-183LinesFlue Gas Recirculation <strong>LA</strong>NL-00-184DuctworkReplace Broken Sewer <strong>LA</strong>NL-01-185LinesCorrect Cross Connectors <strong>LA</strong>NL-01-186PP-Plant CondensateReturn PipingReplace Old 13.8 kVSwitchgearsReplace 115kv OilCircuit BreakerPP – Steam PipingReplacementPP – Feed Water PipingWhite Rock 115 kV RingBus115 kV TransmissionSystem ProtectionAdd third 115 kVTransformer TA-53Replace 13.8 kV CableTA-53 Substation 115kV Ring Bus Upgrade<strong>LA</strong>NL-01-187<strong>LA</strong>NL-02-188<strong>LA</strong>NL-02-189<strong>LA</strong>NL-02-190<strong>LA</strong>NL-<strong>03</strong>-191<strong>LA</strong>NL-04-192<strong>LA</strong>NL-04-193<strong>LA</strong>NL-05-194<strong>LA</strong>NL-05-195<strong>LA</strong>NL-06-196INSTITUTIONAL2001 CXStarted Into FY 20122002Into FY 20122001 CX- Into FY 20<strong>03</strong>2002Into FY 20<strong>03</strong>2001 CX- Into FY 20052002Into FY 20052001 CX- Into FY 20122002Into FY 20122001 CX- Into FY 20<strong>03</strong>2002Into FY 20<strong>03</strong>2001 CX-TBD- Into FY 20092002Into FY 20092001 CX-TBD- Into FY 20092002Into FY 20092001 CX-TBD- Into FY 20022002Into FY 20022001 CX-TBD- Into FY 20042002Into FY 20<strong>03</strong>2001 CX-TBD- Into FY 20042002Into FY 20042001 CX-TBD- Into FY 20042002Into FY 20042001 CX-TBD- Into FY 20052002Into FY 20052001 CX-TBD- Into FY 20092002Into FY 20092001 CX-TBD- Into FY 20062002Into FY 2006
SWEIS Yearbook—2002 F-19Table F-5. Non-RTBF Non-Facilities and Infrastructure Recapitalization Program (FIRP) Facilities and Infrastructure – Expense,General Plant, Institutional General Plant, and Institutional Projects (continued)PROJECTFUNDING CATEGORYNAME NUMBERDATAFROMTYCSP NEPACONSTRUCTIONSTATUSEXPENSEPROJECTSGENERALP<strong>LA</strong>NTPROJECTSINSTITUTIONALGENERAL P<strong>LA</strong>NTPROJECTS INSTITUTIONALReplace TA-53 (2) 115 <strong>LA</strong>NL-07-197 2001 CX-TBD- Into FY 2008kV Transformers2002Into FY 2008Uncross NL and RL 115 <strong>LA</strong>NL-07-198 2001 CX-TBD- Into FY 2010kV Lines2002Into FY 2007PP – Cooling Tower <strong>LA</strong>NL-10-199 2001 CX-TBD- Into FY 2010Piping Replacement2002Into FY 2010Reconductor Norton Line <strong>LA</strong>NL-11-200 2001 CX-TBD- Into FY 20112002Into FY 2011TA-3 South Sewer Relief <strong>LA</strong>NL-02-201 2001 CX-TBD- Into FY 2002Project2002Into FY 2002Express Feeder <strong>LA</strong>NL-02-202 2001 CX-TBD- Into FY 20022002Into FY 2002New Border Station-East <strong>LA</strong>NL-02-2<strong>03</strong> 2001 CX-TBD- Into FY 2002Jemez Road2002Into FY 200290 MVAR SVC <strong>LA</strong>NL-<strong>03</strong>-204 2001 CX-TBD- Into FY 2004Capacitor2002Into FY 2004<strong>LA</strong>C Sewer Project <strong>LA</strong>NL-<strong>03</strong>-205 2001 EA-TBD - Into FY 20<strong>03</strong>2002 CX-TBD Into FY 20<strong>03</strong>Add Third 115 kV <strong>LA</strong>NL-05-206 2001 CX-TBD- Into FY 2005Transformer TA-32002Into FY 2005TA-3/58 Gravity Line <strong>LA</strong>NL-05-207 2001 CX-TBD- Into FY 20052002Into FY 2005345 kV Ring Bus Norton <strong>LA</strong>NL-06-208 2001 CX-TBD- Into FY 20072002Into FY 2007100 psi Natural Gas <strong>LA</strong>NL-07-209 2001 CX-TBD- Into FY 2008Lines, TA-32002Into FY 2008Add Second 115 kV <strong>LA</strong>NL-07-210 2002 CX-TBD Into FY 2007Transformer TA-5 (ETA)TA-70 115/13.8 kV <strong>LA</strong>NL-08-211 2001 CX-TBD- Into FY 2008Substation2002Into FY 2008TA-70 345/115 kV <strong>LA</strong>NL-09-212 2001 CX-TBD- Into FY 2009Substation2002Into FY 2009
F-20Table F-5. Non-RTBF Non-Facilities and Infrastructure Recapitalization Program (FIRP) Facilities and Infrastructure – Expense,General Plant, Institutional General Plant, and Institutional Projects (continued)PROJECTNAMETA-3 Power PlantBackpressure Turbine100 psi Natural GasLines, TA-16NUMBER<strong>LA</strong>NL-09-213<strong>LA</strong>NL-11-214FUNDING CATEGORYDATAGENERAL INSTITUTIONALFROMCONSTRUCTION EXPENSE P<strong>LA</strong>NT GENERAL P<strong>LA</strong>NTTYCSP NEPA STATUS PROJECTS PROJECTS PROJECTS INSTITUTIONAL2001 CX-TBD- Into FY 20092002Into FY 20092001 CX-TBD- Into FY 20122002Into FY 2012SWEIS Yearbook—2002
SWEIS Yearbook—2002 F-21Table F-6. Non-RTBF Non-Facilities and Infrastructure Recapitalization Program (FIRP) Facilities and Infrastructure –Maintenance, Standby Facility, Decommissioning and Demolition, and Facilities Management and Site Planning ProjectsPROJECTFUNDING CATEGORYDATAFROMCONSTRUCTIONSTANDBY DECOMMISSIONINGNAME NUMBER TYCSP NEPA STATUS MAINTENANCE FACILITY aAND DEMOLITIONF&I Initiatives2001 - - Into FY 2004Maintenance 2002 Into FY 2004Preventive2001Maintenance –2002included inGeneralMaintenancePredictive2001Maintenance –2002included inGeneralMaintenanceCorrective2001Maintenance –2002included inGeneralMaintenanceMaintenance2001Management -2002included inGeneralMaintenanceGeneral2001 - - Into FY 2012Maintenance 2002 Into FY 2012NISC Funded <strong>LA</strong>NL-00-DD-04 2002 EA-FONSI bDecommissioningand DemolitionTSTA<strong>LA</strong>NL-TBD-DD-16 2001 CX-TBD- Into FY 20<strong>03</strong>2002cDP-West and Ion <strong>LA</strong>NL-TBD-DD-17 2001 CX-TBD- Into FY 20<strong>03</strong>Beam Facility2002dTSFF2001 CX-TBD- -<strong>LA</strong>NL-TBD-DD-18 2002eFACILITIESMANAGEMENTAND SITEP<strong>LA</strong>NNING
F-22Table F-6. Non-RTBF Non-Facilities and Infrastructure Recapitalization Program (FIRP) Facilities and Infrastructure –Maintenance, Standby Facility, Decommissioning and Demolition, and Facilities Management and Site Planning Projects (continued)NAMEEngineeringRental ofBuildings andLandFacility Startupand ProjectSupportOtherUtilitiesTen Year SitePlans (All ofSite Planning)abcdePROJECTNUMBERFUNDING CATEGORYFACILITIESDATAMANAGEMENTFROMCONSTRUCTIONSTANDBY DECOMMISSIONING AND SITETYCSP NEPA STATUS MAINTENANCE FACILITY aAND DEMOLITION P<strong>LA</strong>NNING2001 - Into FY 20122002 Into FY 20122001 - Into FY 20122002 Into FY 20122001 - -20022001 - -2002 Into FY 20122001 - Into FY 20122002 Into FY 20122001 - Into FY 20122002 Into FY 2012Not applicable for <strong>LA</strong>NL.The NISC Line Item Project includes funding to remove 21 trailers/transportables with a total of 18,585 square feet.Transfer of the 16,350 square foot TSTA Facility from the Offices of Science to EM is currently being negotiated. The schedule for decommissioning and demolition is unknown.Transfer of the Ion Beam Facility (TA-3-16) and DP West at TA-21 from DP to EM is currently being negotiated. The schedule for decommissioning and demolition is unknown.Transfer of the 48,452 square foot TSFF Facility at TA-21 from DP to EM is anticipated to be proposed for FY 2004. The schedule for decommissioning and demolition is unknown.SWEIS Yearbook—2002
SWEIS Yearbook—2002 F-23Table F-7. Other General Plant Projects in 2001 TYCSPPROJECTDATAFROMTYCSP NEPA CONSTRUCTION STATUSFUNDINGCATEGORYGENERAL P<strong>LA</strong>NTPROJECTSNAMENUMBERTSE Office Building <strong>LA</strong>NL-01-058 2001 CX Completed Into FY 2001Site Prep for ASCI30T Initial and Phase I Installs <strong>LA</strong>NL-01-057 2001 EA-FONSI - Into FY 2001TA-16-202 Room 107 Modifications <strong>LA</strong>NL-01-061 2001 CX - Into FY 2001TA-<strong>03</strong> Gateway Infrastructure <strong>LA</strong>NL-02-068 2001 CX-TBD - Into FY 2002MX Cold Shop <strong>LA</strong>NL-02-074 2001 EA-Prep - Into FY 2002Vulnerable Office Building Replacement #02-5 <strong>LA</strong>NL-02-079 2001 CX-TBD - Into FY 2002Building 260 Reconfiguration <strong>LA</strong>NL-02-081 2001 CX-TBD - Into FY 2002Upgrade R Site Road (Access Safety Improvement) <strong>LA</strong>NL-<strong>03</strong>-089 2001 CX-TBD - Into FY 20<strong>03</strong>TA-46 Air Exhaust System <strong>LA</strong>NL-<strong>03</strong>-095 2001 CX-TBD - Into FY 20<strong>03</strong>DP-20 Safety/Infrastructure GPPs <strong>LA</strong>NL-<strong>03</strong>-097 2001 CX-TBD - Into FY 20<strong>03</strong>DP-10 Safety/Infrastructure GPPs <strong>LA</strong>NL-<strong>03</strong>-098 2001 CX-TBD - Into FY 20<strong>03</strong>Sigma GPP <strong>LA</strong>NL-<strong>03</strong>-099 2001 CX-TBD - Into FY 20<strong>03</strong>WETF Systems Refurbishment <strong>LA</strong>NL-04-107 2001 CX-TBD - Into FY 2005ESA Landscaping <strong>LA</strong>NL-04-109 2001 EA-Prep - Into FY 2004Relocate JNETF and R&R NDE <strong>LA</strong>NL-04-110 2001 EA-Prep - Into FY 2005SM-66 Electroplating Labs Renovation <strong>LA</strong>NL-04-114 2001 CX - Into FY 2004TA-16 <strong>Security</strong> Upgrade <strong>LA</strong>NL-04-116 2001 CX-TBD - Into FY 2004Hot Shop <strong>LA</strong>NL-04-<strong>131</strong> 2001 EA-Prep - Into FY 2004Water Processing PMR/TCAP <strong>LA</strong>NL-05-144 2001 CX-TBD - Into FY 2006
F-24SWEIS Yearbook—2002Table F-8. Summary of Decommissioning and Demolition ProjectsPROJECTFUNDING CATEGORYNAMENUMBERDATAFROMTYCSP NEPACONSTRUCTIONSTATUSDECOMMISSIONINGAND DEMOLITIONCHARGESPARTIAL D&DTRANSFER OFRESPONSIBILITYTO EMCerro Grande Rehabilitation <strong>LA</strong>NL-01-DD-01 2001 CX Started Into FY 2001ProjectSherwood Building and <strong>LA</strong>NL-01-DD-02 2001 CX Started Into FY 2001Adjacent StructuresTA-53 Cooling Towers <strong>LA</strong>NL-00-DD-<strong>03</strong> 2001 CX - -NISC Funded D&D <strong>LA</strong>NL-00-DD-04 2001 EA-- -2002 FONSIFY 02 RTBF Funded D&D <strong>LA</strong>NL-02-DD-05 2001 CX-TBD - Into FY 20022002Into FY 2002FY 02 F&I Funded D&D <strong>LA</strong>NL-02-DD-06 2001 CX-TBD - Into FY 2002FY 02 FIRP Funded D&D2002Into FY 2002FY <strong>03</strong> RTBF Funded D&D <strong>LA</strong>NL-02-DD-07 2001 CX-TBD - Into FY 20<strong>03</strong>FY <strong>03</strong> F&I Funded D&D <strong>LA</strong>NL-<strong>03</strong>-DD-08 2001 CX-TBD - Into FY 20<strong>03</strong>FY <strong>03</strong> FIRP Funded D&D2002Into FY 20<strong>03</strong>FY 04 RTBF Funded D&D <strong>LA</strong>NL-04-DD-09 2001 CX-TBD - Into FY 2004FY 04 F&I Funded D&D <strong>LA</strong>NL-04-DD-10 2001 CX-TBD - Into FY 2004FY 04 FIRP Funded D&D2002Into FY 2004FY 05 RTBF Funded D&D <strong>LA</strong>NL-05-DD-11 2001 CX-TBD - Into FY 2005FY 05 F&I Funded D&D <strong>LA</strong>NL-05-DD-12 2001 CX-TBD - Into FY 2005FY 05 FIRP Funded D&D2002Into FY 2005SM-43 D&D <strong>LA</strong>NL-06-DD-13 2001 CX-TBD - -FY 06 RTBF Funded D&D <strong>LA</strong>NL-06-DD-14 2001 CX-TBD - Into FY 2006FY 06 F&I Funded D&D <strong>LA</strong>NL-06-DD-15 2001 CX-TBD - Into FY 2006FY 06 FIRP Funded D&D2002Into FY 2006TSTA<strong>LA</strong>NL-TBD-DD-16 2001 CX-TBDInto FY 20<strong>03</strong>2002-DP-West and Ion Beam <strong>LA</strong>NL-TBD-DD-17 2001 CX-TBDInto FY 20<strong>03</strong>Facility2002-TSFF <strong>LA</strong>NL-TBD-DD-18 2001 CX-TBD - -FY 07 FIRP Funded D&D <strong>LA</strong>NL-07-224 2002 CX-TBD Into FY 2007FY 08 FIRP Funded D&D <strong>LA</strong>NL-08-227 2002 CX-TBD Into FY 2008FY 09 FIRP Funded D&D <strong>LA</strong>NL-09-230 2002 CX-TBD Into FY 2009FY 10 FIRP Funded D&D <strong>LA</strong>NL-10-233 2002 CX-TBD Into FY 2010FY 11 FIRP Funded D&D <strong>LA</strong>NL-11-236 2002 CX-TBD Into FY 2011FY 12 FIRP Funded D&D <strong>LA</strong>NL-12-239 2002 CX-TBD Into FY 2012FACILITIESMANAGEMENT& SITEP<strong>LA</strong>NNING
SWEIS Yearbook—2002 F-25
To obtain a copy of the SWEIS Yearbook – 2002, contact Ken Rea,Project Leader, RRES-ECO, P.O. Box 1663, MS M887,Los Alamos, New Mexico 87545. This 2002 Yearbook is availableon the web at:http://lib-www.lanl.gov/cgi-bin/getfile?<strong>LA</strong>-<strong>UR</strong>-<strong>03</strong>-<strong>5862</strong>.htmLead Writers: Theresa Rudell, Susan Radzinski, and Ken ReaEditor: Hector Hinojosa, IM-1Designer: Kelly Parker, IM-1Compositor: Deidré Plumlee, IM-1Printing coordinator: Lupe Archuleta, IM-4Photos courtesy of IM-4, PA, RRES-ECO, and others.Los Alamos <strong>National</strong> Laboratory, an affi rmative action/equal opportunity employer, is operated by the University of Californiafor the US Department of Energy under contract W-7405-ENG-36. By acceptance of this article, the publisher recognizes thatthe US Government retains a nonexclusive, royalty-free license to publish or reproduce the published form of this contribution,or to allow others to do so, for US Government purposes. Los Alamos <strong>National</strong> Laboratory requests that the publisher identifythis article as work performed under the auspices of the US Department of Energy. Los Alamos <strong>National</strong> Laboratory stronglysupports academic freedom and a researcher’s right to publish; as an institution, however, the Laboratory does not endorsethe viewpoint of a publication or guarantee its technical correctness.