Aquatic Environment and Biodiversity Annual Review 2012
Aquatic Environment and Biodiversity Annual Review 2012
Aquatic Environment and Biodiversity Annual Review 2012

Create successful ePaper yourself
Turn your PDF publications into a flip-book with our unique Google optimized e-Paper software.
<strong>Aquatic</strong> <strong>Environment</strong> <strong>and</strong> <strong>Biodiversity</strong><br />
<strong>Annual</strong> <strong>Review</strong> <strong>2012</strong><br />
A summary of environmental interactions between<br />
fisheries <strong>and</strong> the aquatic environment
AEBAR <strong>2012</strong>: Preface<br />
MINISTRY FOR PRIMARY<br />
INDUSTRIES<br />
AQUATIC ENVIRONMENT AND<br />
BIODIVERSITY ANNUAL REVIEW<br />
(<strong>2012</strong>)<br />
Fisheries Management Science Team
AEBAR <strong>2012</strong><br />
Acknowledgements<br />
In addition to the thanks due to members of AEWG <strong>and</strong> BRAG working groups, special<br />
acknowledgement is due to Owen Anderson (NIWA) for his contribution to the new chapter on Nonprotected<br />
Bycatch; Igor Debski (DOC) on the new seabirds chapter, <strong>and</strong> Ian Tuck (NIWA) on the<br />
benthic chapter. Notwithst<strong>and</strong>ing these contributions, any errors or omissions are the Ministry’s.<br />
Image on cover<br />
Chatham-Challenger Ocean Survey 20/20<br />
Disclaimer<br />
This document is published by the Ministry Primary Industries which was formed from the merger of<br />
the Ministry of Fisheries, the Ministry of Agriculture <strong>and</strong> Forestry <strong>and</strong> the New Zeal<strong>and</strong> Food Safety<br />
Authority in 2010 <strong>and</strong> 2011. All references to the Ministry of Fisheries in this document should,<br />
therefore, be taken to refer also to the legal entity, the Ministry for Primary Industries. The<br />
information in this publication is not government policy. While every effort has been made to ensure<br />
the information is accurate, the Ministry for Primary Industries does not accept any responsibility or<br />
liability for error of fact, omission, interpretation or opinion that may be present, nor for the<br />
consequences of any decisions based on this information. Any view or opinion expressed does not<br />
necessarily represent the view of the Ministry for Primary Industries.<br />
Publisher<br />
Fisheries Management Science Team<br />
Ministry for Primary Industries<br />
Pastoral House, 25 The Terrace<br />
PO Box 2526, Wellington 6140<br />
New Zeal<strong>and</strong><br />
www.mpi.govt.nz<br />
Telephone: 0800 00 83 33<br />
Facsimile: +64 4 894 0300<br />
ISBN 978-0-478-40503-3 (print)<br />
ISBN 978-0-478-40504-0 (online)<br />
© Crown Copyright March 2013 – Ministry for Primary Industries<br />
Preferred citation<br />
Ministry for Primary Industries (<strong>2012</strong>). <strong>Aquatic</strong> <strong>Environment</strong> <strong>and</strong> <strong>Biodiversity</strong> <strong>Annual</strong> <strong>Review</strong> <strong>2012</strong>.<br />
Compiled by the Fisheries Management Science Team, Ministry for Primary Industries, Wellington,<br />
New Zeal<strong>and</strong>. 387 p.<br />
2
AEBAR <strong>2012</strong><br />
PREFACE<br />
This, the <strong>2012</strong> edition of the <strong>Aquatic</strong> <strong>Environment</strong> <strong>and</strong> <strong>Biodiversity</strong> <strong>Review</strong>, exp<strong>and</strong>s <strong>and</strong> updates the first<br />
edition published in 2011. It summarises information on a range of issues related to the environmental effects of<br />
fishing <strong>and</strong> aspects of marine biodiversity <strong>and</strong> productivity relevant to fish <strong>and</strong> fisheries. This review is a<br />
conceptual analogue of the Ministry’s annual Reports from the Fisheries Assessment Plenary. It summarises the<br />
most recent data <strong>and</strong> analyses on particular aquatic environment issues <strong>and</strong>, where appropriate, assesses current<br />
status against any specified targets or limits. Whereas the Reports from the Fisheries Assessment Plenary are<br />
organised by fishstock, however, the <strong>Aquatic</strong> <strong>Environment</strong> <strong>and</strong> <strong>Biodiversity</strong> <strong>Review</strong> is organised by issue (for<br />
example, protected species bycatch, benthic impacts), <strong>and</strong> almost all issues involve more than one fishstock or<br />
fishery.<br />
Several Fisheries Assessment Working Groups (FAWGs) contribute to the Fisheries Assessment Plenary, but<br />
only two generally contribute to the <strong>Aquatic</strong> <strong>Environment</strong> <strong>and</strong> <strong>Biodiversity</strong> <strong>Review</strong>. These are the <strong>Aquatic</strong><br />
<strong>Environment</strong> Working Group (AEWG) <strong>and</strong> the <strong>Biodiversity</strong> Research Advisory Group (BRAG). However, a<br />
wider variety of research is summarised in the <strong>Aquatic</strong> <strong>Environment</strong> <strong>and</strong> <strong>Biodiversity</strong> <strong>Review</strong> than in the<br />
Reports from the Fisheries Assessment Plenary, <strong>and</strong> some of this is peer-reviewed through processes other than<br />
the Ministry’s science working groups. In particular, the Department of Conservation funds <strong>and</strong> reviews research<br />
on protected species, <strong>and</strong> the Ministry of Business Innovation <strong>and</strong> Employment funds a wide variety of research,<br />
some of which is relevant to fisheries. Where such research is relevant to fisheries it will be considered for<br />
inclusion in the review.<br />
As has happened with the Reports from the Fisheries Assessment Plenary, continual future expansion <strong>and</strong><br />
improvement of the <strong>Aquatic</strong> <strong>Environment</strong> <strong>and</strong> <strong>Biodiversity</strong> <strong>Review</strong> is anticipated <strong>and</strong> additional chapters will be<br />
developed to provide increasingly comprehensive coverage of the issues. New chapters are included this year for<br />
seabirds (Chapter 5) <strong>and</strong> the bycatch <strong>and</strong> discards of fish <strong>and</strong> invertebrates (Chapter 6), <strong>and</strong> a new appendix<br />
summarising aquatic environment <strong>and</strong> marine biodiversity research since 1998 has now been developed<br />
(Appendix 12.9). A chapter on Hector’s/Maui’s dolphins has been identified as a priority for development in<br />
2013. Data acquisition, modelling, <strong>and</strong> assessment techniques will also progressively improve, <strong>and</strong> it is expected<br />
that reference points to guide fisheries management decisions will be developed. Both will lead to changes to the<br />
current chapters. We hope the condensation in this review of the information from previously scattered reports<br />
will assist fisheries managers, stakeholders <strong>and</strong> other interested parties to underst<strong>and</strong> the issues, locate relevant<br />
documents, track research progress <strong>and</strong> make informed decisions.<br />
This revision has been led by the Science Team within the Directorate of Fisheries Management of the Ministry<br />
for Primary Industries (primarily Martin Cryer, Rohan Currey, Rich Ford, <strong>and</strong> Mary Livingston) but has relied<br />
critically on the input of members of the Ministry’s <strong>Aquatic</strong> <strong>Environment</strong> Working Group (AEWG) <strong>and</strong><br />
<strong>Biodiversity</strong> Research Advisory Group (BRAG) <strong>and</strong> the Department of Conservation’s Conservation Services<br />
Technical Working Group (DOC-CSTWG). I would especially like to recognise <strong>and</strong> thank the large number of<br />
research providers <strong>and</strong> scientists from research organisations, academia, the seafood industry, environmental<br />
NGOs, Māori customary, DOC, <strong>and</strong> MPI, along with all other technical <strong>and</strong> non-technical participants in present<br />
<strong>and</strong> past AEWG <strong>and</strong> BRAG meetings for their substantial contributions to this review. My sincere thanks to each<br />
<strong>and</strong> all who have contributed.<br />
I am pleased to endorse this document as representing the best available scientific information relevant to the<br />
aspects of the environmental effects of fishing <strong>and</strong> marine biodiversity covered as at December <strong>2012</strong>.<br />
Pamela Mace<br />
Principal Adviser Fisheries Science<br />
Ministry for Primary Industries<br />
3
AEBAR <strong>2012</strong><br />
Contents<br />
PREFACE ............................................................................................................................................... 3<br />
1. INTRODUCTION .......................................................................................................................... 6<br />
1.1. Context <strong>and</strong> purpose ................................................................................................................ 6<br />
1.2. Legislation ............................................................................................................................... 6<br />
1.3. Policy Setting .......................................................................................................................... 9<br />
1.4. Science processes .................................................................................................................. 11<br />
1.5. References ............................................................................................................................. 12<br />
2. Research themes covered in this document .................................................................................. 13<br />
THEME 1: PROTECTED SPECIES .................................................................................................... 16<br />
3. New Zeal<strong>and</strong> sea lions (Phocarctos hookeri) ............................................................................... 17<br />
3.1. Context .................................................................................................................................. 17<br />
3.2. Biology .................................................................................................................................. 19<br />
3.3. Global underst<strong>and</strong>ing of fisheries interactions ...................................................................... 25<br />
3.4. State of knowledge in New Zeal<strong>and</strong> ...................................................................................... 25<br />
3.5. Indicators <strong>and</strong> trends ............................................................................................................. 39<br />
3.6. References ............................................................................................................................. 41<br />
4. New Zeal<strong>and</strong> fur seal (Arctocephalus forsteri)............................................................................. 44<br />
4.1. Context .................................................................................................................................. 44<br />
4.2. Biology .................................................................................................................................. 45<br />
4.3. Global underst<strong>and</strong>ing of fisheries interactions ...................................................................... 50<br />
4.4. State of knowledge in New Zeal<strong>and</strong> ...................................................................................... 50<br />
4.5. Indicators <strong>and</strong> trends ............................................................................................................. 59<br />
4.6. References ............................................................................................................................. 60<br />
5. New Zeal<strong>and</strong> seabirds ................................................................................................................... 63<br />
5.1. Context .................................................................................................................................. 64<br />
5.2. Biology .................................................................................................................................. 68<br />
5.3. Global underst<strong>and</strong>ing of fisheries interactions ...................................................................... 68<br />
5.4. State of knowledge in New Zeal<strong>and</strong> ...................................................................................... 70<br />
5.5. Indicators <strong>and</strong> trends ........................................................................................................... 113<br />
5.6. References ........................................................................................................................... 115<br />
THEME 2: NON-PROTECTED BYCATCH ..................................................................................... 120<br />
6. Non-protected species (fish <strong>and</strong> invertebrates) bycatch ............................................................. 121<br />
6.1. Context ................................................................................................................................ 122<br />
6.2. Global underst<strong>and</strong>ing .......................................................................................................... 123<br />
6.3. State of knowledge in New Zeal<strong>and</strong> .................................................................................... 124<br />
6.4. Indicators <strong>and</strong> trends ........................................................................................................... 156<br />
6.5. References ........................................................................................................................... 157<br />
THEME 3: BENTHIC IMPACTS ...................................................................................................... 159<br />
7. Benthic (seabed) impacts ............................................................................................................ 160<br />
7.1. Context ................................................................................................................................ 161<br />
7.2. Global underst<strong>and</strong>ing .......................................................................................................... 164<br />
7.3. State of knowledge in New Zeal<strong>and</strong> .................................................................................... 168<br />
7.4. Indicators <strong>and</strong> trends ........................................................................................................... 183<br />
7.5. References ........................................................................................................................... 184<br />
THEME 4: ECOSYSTEM EFFECTS ................................................................................................. 187<br />
8. New Zeal<strong>and</strong> Climate <strong>and</strong> Oceanic Setting ................................................................................ 188<br />
8.1. Context ................................................................................................................................ 189<br />
8.2. Indicators <strong>and</strong> trends ........................................................................................................... 193<br />
8.3. Ocean climate trends <strong>and</strong> New Zeal<strong>and</strong> fisheries ................................................................ 201<br />
8.4. References ........................................................................................................................... 203<br />
9. Habitats of particular significance for fisheries management..................................................... 205<br />
4
AEBAR <strong>2012</strong><br />
9.1. Context ................................................................................................................................ 205<br />
9.2. Global underst<strong>and</strong>ing .......................................................................................................... 207<br />
9.3. State of knowledge in New Zeal<strong>and</strong> .................................................................................... 210<br />
9.4. Indicators <strong>and</strong> trends ........................................................................................................... 213<br />
9.5. References ........................................................................................................................... 213<br />
10. L<strong>and</strong>-based effects on fisheries, aquaculture <strong>and</strong> supporting biodiversity .............................. 216<br />
10.1. Context ............................................................................................................................ 216<br />
10.2. Global underst<strong>and</strong>ing ...................................................................................................... 218<br />
10.3. State of knowledge in New Zeal<strong>and</strong> ................................................................................ 220<br />
10.4. Indicators <strong>and</strong> trends ....................................................................................................... 224<br />
10.5. References ....................................................................................................................... 225<br />
THEME 5: MARINE BIODIVERSITY ............................................................................................. 228<br />
11. <strong>Biodiversity</strong> ............................................................................................................................. 229<br />
11.1. Introduction ..................................................................................................................... 231<br />
11.2. Global underst<strong>and</strong>ing <strong>and</strong> developments ......................................................................... 235<br />
11.3. State of knowledge in New Zeal<strong>and</strong> ................................................................................ 243<br />
11.4. Progress <strong>and</strong> re-alignment ............................................................................................... 281<br />
11.5. References ....................................................................................................................... 286<br />
11.6. Appendix ......................................................................................................................... 295<br />
12. Appendices .............................................................................................................................. 298<br />
12.1. Terms of Reference for the <strong>Aquatic</strong> <strong>Environment</strong> Working Group in <strong>2012</strong> ................... 298<br />
12.2. AEWG Membership <strong>2012</strong> ............................................................................................... 303<br />
12.3. Terms of Reference for the <strong>Biodiversity</strong> Research Advisory Group (BRAG) <strong>2012</strong> ....... 304<br />
12.4. BRAG attendance 2011-<strong>2012</strong>.......................................................................................... 310<br />
12.5. Generic Terms of Reference for Research Advisory Groups (Sept 2010) .................... 310<br />
12.6. Fisheries 2030 .................................................................................................................. 314<br />
12.7. OUR STRATEGY 2030: Growing <strong>and</strong> protecting New Zeal<strong>and</strong> ................................... 316<br />
12.8. Other strategic policy documents .................................................................................... 317<br />
12.9. Appendix of <strong>Aquatic</strong> <strong>Environment</strong> <strong>and</strong> <strong>Biodiversity</strong> funded <strong>and</strong> related projects .......... 323<br />
5
1. INTRODUCTION<br />
1.1. Context <strong>and</strong> purpose<br />
AEBAR <strong>2012</strong>: Introduction<br />
This document contains a summary of information <strong>and</strong> research on aquatic environment issues<br />
relevant to the management of New Zeal<strong>and</strong> fisheries <strong>and</strong> exp<strong>and</strong>s <strong>and</strong> updates the first version<br />
published in 2011 (MAF 2011). It is designed to complement the Ministry’s annual Reports from<br />
Fisheries Assessment Plenaries (e.g., MPI <strong>2012</strong>a & b) <strong>and</strong> emulate those documents’ dual role in<br />
providing an authoritative summary of current underst<strong>and</strong>ing <strong>and</strong> an assessment of status relative to<br />
any overall targets <strong>and</strong> limits. However, whereas the Reports from Fisheries Assessment Plenaries<br />
have a focus on individual fishstocks, this report has a focus on aquatic environment fisheries<br />
management issues <strong>and</strong> biodiversity responsibilities that often cut across many fishstocks, fisheries, or<br />
activities, <strong>and</strong> sometimes across the responsibilities of multiple agencies.<br />
This update has been developed by the Science Team within the Fisheries Management Directorate of<br />
the Resource Management <strong>and</strong> Programmes branch, Ministry for Primary Industries (MPI). It does not<br />
cover all issues but, as anticipated, includes more chapters than the first edition in 2011. As with the<br />
Reports from Fisheries Assessment Plenaries, it is expected to change <strong>and</strong> grow as new information<br />
becomes available, more issues are considered, <strong>and</strong> as feedback <strong>and</strong> ideas are received. This synopsis<br />
has a broad, national focus on each issue <strong>and</strong> the general approach has been to avoid too much detail at<br />
a fishery or fishstock level. For instance, the benthic (seabed) effects of mobile bottom-fishing<br />
methods are dealt with at the level of all bottom trawl <strong>and</strong> dredge fisheries combined rather than at the<br />
level of a target fishery that might contribute only a small proportion of the total impact. The details of<br />
benthic impacts by individual fisheries will be documented in the respective chapters in the May or<br />
November Report from the Fisheries Assessment Plenary, <strong>and</strong> linked there to the fine detail <strong>and</strong><br />
analysis in <strong>Aquatic</strong> <strong>Environment</strong> <strong>and</strong> <strong>Biodiversity</strong> Reports (AEBRs), Fisheries Assessment Reports<br />
(FARs), <strong>and</strong> Final Research Reports (FRRs). Such sections have already been developed for several<br />
species in both <strong>2012</strong> Fishery Assessment Plenary Reports, <strong>and</strong> others will follow.<br />
The first part of this document describes the legislative <strong>and</strong> broad policy context for aquatic<br />
environment <strong>and</strong> biodiversity research commissioned by MPI, <strong>and</strong> the science processes used to<br />
generate <strong>and</strong> review that research. The second, <strong>and</strong> main, part of the document contains chapters<br />
focused on various aquatic environment issues for fisheries management. Those chapters are divided<br />
into five broad themes: protected species; non-QMS fish bycatch; benthic effects; ecosystem issues<br />
(including New Zeal<strong>and</strong>’s oceanic setting); <strong>and</strong> marine biodiversity. A third part of the review<br />
includes a number of appendices for reference. This review is not comprehensive in its coverage of all<br />
issues or of all research within each issue, but attempts to summarise the best available information on<br />
the issues covered. Each chapter has been considered by the appropriate working group at least once.<br />
1.2. Legislation<br />
The primary legislation for the management of fisheries, including effects on the aquatic environment,<br />
is the Fisheries Act 1996. The main sections setting out the obligation to avoid, remedy, or mitigate<br />
any adverse effect of fishing on the aquatic environment are sections 8, 9, <strong>and</strong> 15, although sections<br />
10, 11, <strong>and</strong> 13 are also relevant to decision-making under this Act (Table 1.1). The Ministry also<br />
administers the residual parts of the Fisheries Act 1983, the Treaty of Waitangi (Fisheries Claims)<br />
Settlement Act 1992, the Fisheries (Quota Operations Validation) Act 1997, the Maori Fisheries Act<br />
2004, the Maori Commercial Aquaculture Claims Settlement Act 2004, the Aquaculture Reform<br />
(Repeals <strong>and</strong> Transitional Provisions) Act 2004, the Driftnet Prohibition Act 1991, <strong>and</strong> the Antarctic<br />
Marine Living Resources Act 1981. Other Acts are relevant in specific circumstances: the Wildlife<br />
Act 1953 <strong>and</strong> the Marine Mammals Protection Act 1978 for protected species; the Marine Reserves<br />
Act 1971 for “no take” marine reserves; the Conservation Act 1987; the Hauraki Gulf Marine Park Act<br />
6
AEBAR <strong>2012</strong>: Introduction<br />
2000; the Resource Management Act 1991 for issues in coastal marine areas that could affect fisheries<br />
interests or be the subject of sustainability measures under section 11 of the Fisheries Act; <strong>and</strong> the<br />
Exclusive Economic Zone <strong>and</strong> Continental Shelf (<strong>Environment</strong>al Effects) Act <strong>2012</strong> for issues outside<br />
the Territorial Sea. These Acts are administered by other agencies <strong>and</strong> this leads to a requirement for<br />
the Ministry for Primary Industries to work with other government departments (especially the<br />
Department of Conservation <strong>and</strong> through the Natural Resource Sector 1 ) <strong>and</strong> with various territorial<br />
authorities (especially Regional Councils) to a greater extent than is required for most fisheries stock<br />
assessment issues.<br />
Table 1.1: Sections of the Fisheries Act 1996 relevant to the management of the effects of fishing on the aquatic<br />
environment.<br />
Fisheries Act 1996<br />
s8 Purpose –<br />
(1) The purpose of this Act is to provide for the utilisation of fisheries resources while ensuring sustainability, where<br />
(2) “Ensuring sustainability” means –<br />
(a) Maintaining the potential of fisheries resources to meet the reasonably foreseeable needs of future generations: <strong>and</strong><br />
(b) Avoiding, remedying, or mitigating any adverse effects of fishing on the aquatic environment:<br />
“Utilisation” means conserving, using, enhancing, <strong>and</strong> developing fisheries resources to enable people to provide for their<br />
social, economic, <strong>and</strong> cultural well-being.<br />
s9 <strong>Environment</strong>al Principles.<br />
associated or dependent species should be maintained above a level that ensures their long-term viability;<br />
biological diversity of the aquatic environment should be maintained:<br />
habitat of particular significance for fisheries management should be protected.<br />
s11 Sustainability Measures. The Minister may take into account, in setting any sustainability measure, (a) any effects of<br />
fishing on any stock <strong>and</strong> the aquatic environment;<br />
s15 Fishing-related mortality of marine mammals or other wildlife. A range of management considerations are set out in<br />
the Fisheries Act 1996, which empower the Minister to take measures to avoid, remedy or mitigate any adverse<br />
effects of fishing on associated or dependent species <strong>and</strong> any effect of fishing-related mortality on any protected<br />
species. These measures include the setting of catch limits or the prohibition of fishing methods or all fishing in an<br />
area, to ensure that such catch limits are not exceeded.<br />
Under the primary legislation lie various layers of Regulations <strong>and</strong> Orders in Council (see<br />
http://www.legislation.govt.nz/). It is beyond the scope of this document to summarise these.<br />
In addition to its domestic legislation, the New Zeal<strong>and</strong> government is a signatory to a wide variety of<br />
International Instruments <strong>and</strong> Agreements that bring with them various International Obligations<br />
(Table 1.2). Section 5 of the Fisheries Act requires that the Act be interpreted in a manner that is<br />
consistent with international obligations <strong>and</strong> with the Treaty of Waitangi (Fisheries Claims) Settlement<br />
Act 1992.<br />
1 The Natural Resources Sector is a network of government agencies established to enhance collaboration. Its<br />
main purpose is to ensure a strategic, integrated <strong>and</strong> aligned approach is taken to natural resources development<br />
<strong>and</strong> management across government agencies. The network is chaired by MfE’s Chief Executive. The Sector<br />
aims to provide high-quality advice to government <strong>and</strong> provide effective implementation <strong>and</strong> execution of major<br />
government policies through coordination <strong>and</strong> integration across agencies, management of relationships, <strong>and</strong><br />
alignment of the policies <strong>and</strong> practices of individual agencies.<br />
7
AEBAR <strong>2012</strong>: Introduction<br />
Table 1.2: International agreements <strong>and</strong> regional agreements to which New Zeal<strong>and</strong> is a signatory, that are relevant<br />
to the management of the effects of fishing on the aquatic environment.<br />
International Instruments Regional Fisheries Agreements<br />
• Convention on the Conservation of Migratory Species of Wild<br />
Animals (CMS). Aims to conserve terrestrial, marine <strong>and</strong> avian<br />
migratory species throughout their range.<br />
• Agreement on the Conservation of Albatrosses <strong>and</strong> Petrels<br />
(ACAP). Aims to introduce a number of conservation measures to<br />
reduce the threat of extinction to the Albatross <strong>and</strong> Petrel species.<br />
• Convention on Biological Diversity (CBD) Provides for<br />
conservation of biological diversity <strong>and</strong> sustainable use of<br />
components. States accorded the right to exploit resources<br />
pursuant to environmental policies.<br />
• United Nations Convention on the Law of the Sea (UNCLOS)<br />
Acknowledges the right to explore <strong>and</strong> exploit, conserve <strong>and</strong><br />
manage natural resources in the State’s EEZ…with regard to the<br />
protection <strong>and</strong> preservation of the marine environment including<br />
associated <strong>and</strong> dependent species, pursuant to the State’s<br />
environmental policies.<br />
• Convention on the International Trade in Endangered Species<br />
of Wild Fauna <strong>and</strong> Flora (CITES). Aims to ensure that<br />
international trade in wild animals <strong>and</strong> plants does not threaten<br />
their survival.<br />
• United Nations Fishstocks Agreements. Aims to lay down a<br />
comprehensive regime for the conservation <strong>and</strong> management of<br />
straddling <strong>and</strong> highly migratory fish stocks.<br />
• International Whaling Commission (IWC) Aims to provide for<br />
the proper conservation of whale stocks <strong>and</strong> thus make possible<br />
the orderly development of the whaling industry.<br />
• Wellington Convention Aims to prohibit drift net fishing activity<br />
in the convention area.<br />
• Food <strong>and</strong> Agriculture Organisation – International Plan of<br />
Action for Seabirds (FAO-IPOA Seabirds) Voluntary<br />
framework for reducing the incidental catch of seabirds in longline<br />
fisheries.<br />
• Food <strong>and</strong> Agriculture Organisation – International Plan of<br />
Action for Sharks (FAO –IPOA Sharks) Voluntary framework<br />
for the conservation <strong>and</strong> management of sharks.<br />
• Noumea Convention. Promotes protection <strong>and</strong> management of<br />
natural resources. Parties to regulate or prohibit activity likely to<br />
have adverse effects on species, ecosystems <strong>and</strong> biological<br />
processes.<br />
• Food <strong>and</strong> Agriculture Organisation - Code of Conduct for<br />
Responsible Fisheries Provides principles <strong>and</strong> st<strong>and</strong>ards<br />
applicable to the conservation, management <strong>and</strong> development of<br />
all fisheries, to be interpreted <strong>and</strong> applied to conform to the rights,<br />
jurisdiction <strong>and</strong> duties of Sates contained in UNCLOS.<br />
8<br />
• Convention for the Conservation of<br />
Southern Bluefin Tuna (CCSBT) Aims to<br />
ensure, through appropriate management, the<br />
conservation <strong>and</strong> optimum utilisation of the<br />
global Southern Bluefin Tuna fishery. The<br />
Convention specifically provides for the<br />
exchange of data on ecologically related<br />
species to aid in the conservation of these<br />
species when fishing for southern bluefin<br />
tuna.<br />
• Convention for the Conservation of<br />
Antarctic Marine Living Resources<br />
(CCAMLR). Aims to conserve, including<br />
rational use of Antarctic marine living<br />
resources. This includes supporting research<br />
to underst<strong>and</strong> the effects of CCAMLR<br />
fishing on associated <strong>and</strong> dependent species,<br />
<strong>and</strong> monitoring levels of incidental take of<br />
these species on New Zeal<strong>and</strong> vessels fishing<br />
in CCAMLR waters.<br />
• Convention on the Conservation <strong>and</strong><br />
Management of Highly Migratory Fish<br />
Stocks in the Western <strong>and</strong> Central Pacific<br />
Ocean (WCPFC). The objective is to<br />
ensure, through effective management, the<br />
long-term conservation <strong>and</strong> sustainable use<br />
of highly migratory fish stocks in accordance<br />
with UNCLOS.<br />
• South Tasman Rise Orange Roughy<br />
Arrangement. The arrangement puts in<br />
place the requirement for New Zeal<strong>and</strong> <strong>and</strong><br />
Australian fishers to have approval from the<br />
appropriate authorities to trawl or carry out<br />
other demersal fishing for any species in the<br />
STR area<br />
• Convention on the Conservation <strong>and</strong><br />
Management of High Seas Fishery<br />
Resources in the South Pacific Ocean (a<br />
Regional Fisheries Management<br />
Organisation, colloquially SPRFMO) has<br />
recently been negotiated to facilitate<br />
management of non-highly migratory species<br />
in the South Pacific.
1.3. Policy Setting<br />
AEBAR <strong>2012</strong>: Introduction<br />
1.3.1. Our Strategy 2030 <strong>and</strong> MPI’s Statement of Intent<br />
<strong>2012</strong>/15<br />
The Ministry for Primary Industries’ Statement of Intent, SOI, is an important guiding document for<br />
the short to medium term. That for <strong>2012</strong>–15 is available on the Ministry’s website at:<br />
http://www.mpi.govt.nz/Default.aspx?TabId=126&id=1341<br />
The SOI sets out the Ministry’s strategic direction for the coming three years, primarily through<br />
implementation of Our Strategy 2030 (Appendix 12.7). This strategy was agreed by Cabinet in August<br />
2011<strong>and</strong> sets out MPI’s vision of “growing <strong>and</strong> protecting New Zeal<strong>and</strong>” <strong>and</strong> defines the focus <strong>and</strong><br />
approach of the organisation. The strategy includes four focus areas <strong>and</strong> outcomes: maximising export<br />
opportunities; improving sector productivity; increasing sustainable resource use; <strong>and</strong> protecting from<br />
biological risk.<br />
MPI is the single key adviser to the Government across all aspects of the primary industries, food<br />
production <strong>and</strong> related trade issues. MPI is the principal adviser to the Government on agriculture,<br />
horticulture, aquaculture, fisheries, forestry, <strong>and</strong> food industries, animal welfare, <strong>and</strong> the protection of<br />
New Zeal<strong>and</strong>’s primary industries from biological risk. Aspects of the role specific to fisheries<br />
itemized in the SOI include supporting the development of sustainable limits to natural resource use.<br />
To that end, MPI contracts the following types of research (relevant to this document):<br />
• aquatic environment research to assess the effects of fishing on marine habitats, protected<br />
species, trophic linkages, <strong>and</strong> to underst<strong>and</strong> habitats of special significance for fisheries;<br />
• biodiversity research to increase our underst<strong>and</strong>ing of the systems that support resilient<br />
ecosystems <strong>and</strong> productive fisheries.<br />
1.3.2. Fisheries 2030<br />
New Zeal<strong>and</strong>’s Quota Management System (QMS) forms the overall framework for management of<br />
domestic fisheries (see http://www.fish.govt.nz/en-nz/Commercial/Quota+Management+System/default.htm). Within<br />
that framework, Fisheries 2030 provides a long-term goal for the New Zeal<strong>and</strong> fisheries sector. After<br />
endorsement by Cabinet, it was released by the Minister of Fisheries in September 2009. It can be<br />
found on the MPI website at:<br />
http://www.fish.govt.nz/en-nz/Fisheries+2030/default.htm?wbc_purpose=bas<br />
(noting that the Ministry of Fisheries merged with the Ministry of Agriculture <strong>and</strong> Forestry on 1 July 2011 <strong>and</strong><br />
became the Ministry for Primary Industries on 30 April <strong>2012</strong>. This URL <strong>and</strong> subsequent links in this document<br />
will eventually change as the new Ministry’s systems are progressively merged).<br />
Fisheries 2030 sets out a goal to have New Zeal<strong>and</strong>ers maximising benefits from the use of fisheries<br />
within environmental limits. To support this goal, major outcomes for Use (of fisheries) <strong>and</strong><br />
<strong>Environment</strong> are specified. The <strong>Environment</strong> outcome is the main driver for aquatic environment<br />
research: The capacity <strong>and</strong> integrity of the aquatic environment, habitats <strong>and</strong> species are sustained at<br />
levels that provide for current <strong>and</strong> future use. Fisheries 2030 states that this means:<br />
• <strong>Biodiversity</strong> <strong>and</strong> the function of ecological systems, including trophic linkages, are conserved<br />
• Habitats of special significance to fisheries are protected<br />
• Adverse effects on protected species are reduced or avoided<br />
9
AEBAR <strong>2012</strong>: Introduction<br />
• Impacts, including cumulative impacts, of activities on l<strong>and</strong>, air or water on aquatic<br />
ecosystems are addressed.<br />
1.3.3. Fisheries Plans<br />
Fisheries planning processes for deepwater, highly migratory species, inshore finfish, inshore shellfish<br />
<strong>and</strong> freshwater fisheries use objective-based management to drive the delivery of services, as<br />
described in Fisheries 2030 <strong>and</strong> affirmed in the <strong>2012</strong>/15 SOI <strong>and</strong> Our Strategy 2030. The planning<br />
processes are guided by five National Fisheries Plans, which recognise the distinctive characteristics<br />
of these fisheries. Plans for Deepwater <strong>and</strong> Highly Migratory species have been approved by the<br />
Minister <strong>and</strong> a suite of three plans for inshore species has been released in prototype form. These plans<br />
establish management objectives for each fishery, including those related to the environmental effects<br />
of fishing. All are available on the Ministry’s websites.<br />
Deepwater <strong>and</strong> middle depth fisheries:<br />
http://www.fish.govt.nz/ennz/Consultations/Archive/2010/National+Fisheries+Plan+for+Deepwater+<strong>and</strong>+Middle-<br />
Depth+Fisheries/default.htm<br />
Highly migratory species (HMS) fisheries:<br />
http://www.fish.govt.nz/ennz/Consultations/Archive/2010/National+Fisheries+Plan+for+Highly+Migratory+Species/default.htm<br />
Inshore fisheries (comprising finfish, shellfish, <strong>and</strong> freshwater fisheries):<br />
http://www.fish.govt.nz/en-nz/Fisheries+Planning/default.htm<br />
Certain research areas (aquatic environment, recreational <strong>and</strong> biodiversity) are not entirely covered by<br />
fish plans, as many of these issues span multiple fisheries <strong>and</strong> plans. Antarctic research is also<br />
excluded from fish plans as it is beyond their spatial scope. These areas are administered by the<br />
science team <strong>and</strong> subject to the drivers in Tables 1.1, 1.2 <strong>and</strong> Fisheries 2030.<br />
1.3.4. Other strategic documents<br />
A number of strategies or reviews have been published that potentially affect fisheries values <strong>and</strong><br />
research. These include: the New Zeal<strong>and</strong> <strong>Biodiversity</strong> Strategy (2000); the Biosecurity Strategy<br />
(2003, followed by its science strategy 2007); the MPA Policy <strong>and</strong> Implementation Plan (2005);<br />
MfE’s discussion paper on Management of Activities in the EEZ (2007); MRST’s Roadmap for<br />
<strong>Environment</strong> Research (2007); the Revised Coastal Policy Statement (2010); the National Plan of<br />
Action to Reduce the Incidental Catch of Seabirds in New Zeal<strong>and</strong> Fisheries (2004, soon to be<br />
revised); <strong>and</strong> the New Zeal<strong>and</strong> National Plan of Action for the Conservation <strong>and</strong> Management of<br />
Sharks (2008). Links to these documents are provided in Appendix 12.8 because they provide some of<br />
the broad policy setting for aquatic environment issues <strong>and</strong> research across multiple organisations <strong>and</strong><br />
agencies.<br />
In <strong>2012</strong>, the Natural Resource Sector cluster formed a Marine Director’s Group to improve data<br />
sharing <strong>and</strong> information exchange across key agencies with marine environmental responsibilities,<br />
particularly MPI, DOC, MfE, EPA, LINZ, MBIE. The Marine Director’s Group is chaired by MPI <strong>and</strong><br />
DOC <strong>and</strong> a substantial amount of cross-agency work has been initiated to: summarise relevant marine<br />
information held by different agencies <strong>and</strong> current marine research investment; identify knowledge<br />
<strong>and</strong> funding gaps; <strong>and</strong> to develop a long-term Marine Research Strategy for New Zeal<strong>and</strong>.<br />
10
1.4. Science processes<br />
AEBAR <strong>2012</strong>: Introduction<br />
1.4.1. Research Planning<br />
Until 2010 the Ministry of Fisheries ran an iterative planning process to determine, in conjunction with<br />
stakeholders <strong>and</strong> subject to government policy, the future directions <strong>and</strong> priorities for fisheries<br />
research. Subsequently, the Ministry has adopted an overall approach of specifying objectives for<br />
fisheries in Fisheries Plans <strong>and</strong> using these plans to develop associated implementation strategies <strong>and</strong><br />
required services, including research. These services are identified in <strong>Annual</strong> Operational Plans that<br />
are updated each year.<br />
For deepwater fisheries <strong>and</strong> highly migratory stocks (HMS), the transition to the new research<br />
planning approach is well advanced because fisheries plans for these areas have been approved by the<br />
Minister. Research for these fisheries are already being developed using Fisheries Plan <strong>and</strong> <strong>Annual</strong><br />
Operating Plan processes as primary drivers, <strong>and</strong>, as necessary, Research Advisory Groups (RAGs) to<br />
develop the technical detail of particular projects. The Ministry’s website contains more information<br />
on this approach, developed during the Research Services Strategy <strong>Review</strong>, at:<br />
http://www.fish.govt.nz/NR/rdonlyres/04D579E5-6DCC-42A6-BF68-<br />
9CAB800D6392/0/Research_Services_Strategy_<strong>Review</strong>_Report.pdf (see Section 5.2, pages 14 to 21) <strong>and</strong> in<br />
summary at: http://www.fish.govt.nz/NR/rdonlyres/432EA3A0-AEA7-41DD-8E5C-D0DCA9A3B96B/0/RSS_letter.pdf.<br />
Generic terms of reference for Research Advisory Groups are in Appendix 12.5. For inshore fisheries,<br />
the three Fisheries Plans (inshore finfish, shellfish, <strong>and</strong> freshwater) are still under development, so a<br />
transitional research planning process was established for 2010 <strong>and</strong> developed slightly in 2011. This<br />
included the following steps:<br />
• Identification of the main management information needs using:<br />
o Fisheries Plans or Fisheries Operational Plans where available<br />
o Any relevant Medium Term Research Plan<br />
o Fishery managers’ underst<strong>and</strong>ing of decisions likely to require research information in the<br />
next 1–3 years.<br />
• Technical discussions as required (i.e., tailored to the needs of the different research areas) to<br />
consider:<br />
o The feasibility <strong>and</strong> utility of each project<br />
o The likely cost of each project<br />
o Any synergies or overlaps with work being conducted by other providers (including<br />
industry, CRIs, MBIE, Universities, etc.)<br />
• Stakeholder meetings as required to discuss relative priorities for particular projects<br />
The process for aquatic environment research for 2011/12 <strong>and</strong> <strong>2012</strong>/13 (other than aspects driven by<br />
deepwater <strong>and</strong> HMS plans or the specific needs of inshore fishery managers) followed essentially<br />
these same steps.<br />
The Ministry runs a separate planning group to design <strong>and</strong> prioritise its research programme on marine<br />
biodiversity. Given its much broader <strong>and</strong> more strategic focus, the <strong>Biodiversity</strong> Research Advisory<br />
Group (BRAG) has both peer review <strong>and</strong> planning roles <strong>and</strong> therefore differs slightly in constitution<br />
from the Ministry’s other working <strong>and</strong> planning groups.<br />
1.4.2. Contributing Working Groups<br />
The main contributing working groups for this document are the Ministry’s <strong>Aquatic</strong> <strong>Environment</strong><br />
Working Group (AEWG) <strong>and</strong> <strong>Biodiversity</strong> Research Advisory Group (BRAG). The Department of<br />
Conservation’s Conservation Services Programme <strong>and</strong> National Plan of Action Seabirds Technical<br />
Working Group (CSP/NPOA-TWG, see http://www.doc.govt.nz/conservation/marine-<strong>and</strong>-<br />
11
AEBAR <strong>2012</strong>: Introduction<br />
coastal/commercial-fishing/marine-conservation-services/meetings-<strong>and</strong>-project-updates/) also considers a<br />
wide range of DOC-funded projects related to protected species, sometimes in joint meetings with the<br />
AEWG. The Ministry’s Fishery Assessment Working Groups occasionally consider research relevant<br />
to this synopsis. Terms of reference for AEWG <strong>and</strong> BRAG are periodically revised <strong>and</strong> updated (see<br />
Appendix 12.1 <strong>and</strong> 12.3 for the <strong>2012</strong> Terms of Reference for AEWG <strong>and</strong> BRAG, respectively).<br />
AEWG is convened for the Ministry’s peer review purposes with an overall purpose of assessing,<br />
based on scientific information, the effects of fishing, aquaculture, <strong>and</strong> enhancement on the aquatic<br />
environment for all New Zeal<strong>and</strong> fisheries. The purview of AEWG includes: bycatch <strong>and</strong> unobserved<br />
mortality of protected species, fish, <strong>and</strong> other marine life; effects of bottom fisheries on benthic<br />
biodiversity, species, <strong>and</strong> habitat; effects of fishing on biodiversity, including genetic diversity;<br />
changes to ecosystem structure <strong>and</strong> function as a result of fishing, including trophic effects; <strong>and</strong> effects<br />
of aquaculture <strong>and</strong> fishery enhancement on the environment <strong>and</strong> on fishing. Where possible, AEWG<br />
may explore the implications of any effects, including with respect to any st<strong>and</strong>ards, reference points,<br />
<strong>and</strong> relevant indicators. The AEWG is a technical forum to assess the effects of fishing or<br />
environmental status <strong>and</strong> make projections. It has no m<strong>and</strong>ate to make management recommendations<br />
or decisions. Membership of AEWG is open (attendees for <strong>2012</strong> are listed in Appendix 12.2).<br />
The two main responsibilities of BRAG are: to review, discuss, <strong>and</strong> convey views on the results of<br />
marine biodiversity research projects contracted by the Ministry; <strong>and</strong> to discuss, evaluate, make<br />
recommendations <strong>and</strong> convey views on Medium Term <strong>Biodiversity</strong> Research Plans <strong>and</strong> constituent<br />
individual projects. Both tasks have hitherto been undertaken in the context the strategic goals in the<br />
New Zeal<strong>and</strong> <strong>Biodiversity</strong> Strategy (2000) <strong>and</strong> the Strategy for New Zeal<strong>and</strong> Science in Antarctica<br />
<strong>and</strong> the Southern Ocean (2010), but the focus of the programme is currently being reviewed to align it<br />
with more recent strategic documents. BRAG also administers some large cross-government projects<br />
such as NORFANZ, BIOROSS, Fisheries <strong>and</strong> <strong>Biodiversity</strong> Ocean Survey 20/20; <strong>and</strong> International<br />
Polar Year (IPY) Census of Antarctic Marine Life (IPY-CAML). Membership of BRAG is also open<br />
(attendees for 2011 <strong>and</strong> <strong>2012</strong> are listed in Appendix 12.4).<br />
Following consideration at one or more meetings of appropriate working groups, reports from<br />
individual projects are also technically reviewed by the Ministry before they are finalised for use in<br />
management <strong>and</strong>/or for public release. Fisheries Assessment Reports, FARs, <strong>and</strong> <strong>Aquatic</strong> <strong>Environment</strong><br />
<strong>and</strong> <strong>Biodiversity</strong> reports, AEBRs, are also subject to editorial review whereas Final Research Reports,<br />
FRRs, <strong>and</strong> Research Progress Reports, RPRs, are not. Finalised FARs, AEBRs, historical FARDs<br />
(Fisheries Assessment Research Documents) <strong>and</strong> MMBRs (Marine <strong>Biodiversity</strong> <strong>and</strong> Biosecurity<br />
Reports), <strong>and</strong> some FRRs can be found at:<br />
http://fs.fish.govt.nz/Page.aspx?pk=61&tk=209.<br />
Increasingly, reports will be available from the MPI website at: http://www.mpi.govt.nz/newsresources/publications.<br />
1.5. References<br />
Ministry of Agriculture <strong>and</strong> Forestry (2011). <strong>Aquatic</strong> <strong>Environment</strong> <strong>and</strong> <strong>Biodiversity</strong> <strong>Annual</strong> <strong>Review</strong> 2011: a summary of<br />
environmental interactions between fisheries <strong>and</strong> the aquatic environment. Compiled by the Fisheries Science<br />
Group, Ministry of Agriculture <strong>and</strong> Forestry, Wellington, New Zeal<strong>and</strong>. 199 p.<br />
Ministry for Primary Industries (<strong>2012</strong>a). Report from the Fisheries Assessment Plenary, May <strong>2012</strong>: stock assessments <strong>and</strong><br />
yield estimates. Compiled by the Fisheries Science Group, Ministry for Primary Industries, Wellington, New<br />
Zeal<strong>and</strong>. 1194 p.<br />
Ministry for Primary Industries (<strong>2012</strong>b). Fisheries Assessment Plenary, November <strong>2012</strong>: stock assessments <strong>and</strong> yield<br />
estimates. Compiled by the Fisheries Science Group, Ministry for Primary Industries, Wellington, New Zeal<strong>and</strong>.<br />
531 p.<br />
12
AEBAR <strong>2012</strong>: Research themes<br />
2. Research themes covered in this document<br />
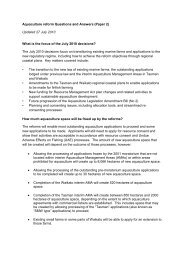
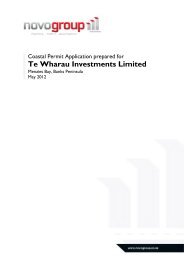
The Ministry has identified four broad categories of research on the environmental effects of fishing<br />
(Figure 2.1): bycatch <strong>and</strong> fishing-related mortality of protected species; bycatch of non-protected<br />
species, primarily non-QMS fish; modification of benthic habitats (including seamounts); <strong>and</strong> various<br />
ecosystem effects (including fishing <strong>and</strong> non-fishing effects on habitats of particular significance for<br />
fisheries management <strong>and</strong> trophic relationships). Other emerging issues (such as the genetic<br />
consequences of selective fishing <strong>and</strong> the impacts of aquaculture) are not dealt with in detail in this<br />
synopsis but it is anticipated that those that turn out to be important will be dealt with in future<br />
iterations. A fifth theme for this document is MPI research on marine biodiversity. The research has<br />
been driven largely by the <strong>Biodiversity</strong> Strategy but has strategic importance for fisheries in that it<br />
provides for better underst<strong>and</strong>ing of the ecosystems that support fisheries productivity.<br />
Our underst<strong>and</strong>ing is not uniform across these themes <strong>and</strong>, for example, our knowledge of the<br />
quantum <strong>and</strong> consequences of fishing-related mortality of protected species is much better developed<br />
than our knowledge of the consequences of mortalities of non-target fish, bottom trawl impacts, or<br />
l<strong>and</strong> management choices for ecosystem processes or fisheries productivity. Ultimately, the goal of<br />
research described in this synopsis is to complement information on fishstocks to ensure that the<br />
Ministry has the information required to underpin the ecosystem approach to fisheries management<br />
envisaged in Fisheries 2030. Stock assessment results have been published for many years in Fisheries<br />
Assessment Reports, <strong>and</strong> Final Research Reports, <strong>and</strong> the <strong>Annual</strong> Report from the Fishery Assessment<br />
Plenary. Collectively, these provide a rich <strong>and</strong> well-understood resource for fisheries managers <strong>and</strong><br />
stakeholders. In 2005, an environmental section was included in the hoki plenary report as part of the<br />
characterisation of that fishery <strong>and</strong> to highlight any particular environmental issues associated with the<br />
fishery. Similar, fishery-specific sections have since been developed for other working group reports<br />
<strong>and</strong> the plenary, including many fisheries for highly migratory species <strong>and</strong> the trawl fisheries for<br />
scampi <strong>and</strong> squid, but work on environmental issues has otherwise been more difficult to access for<br />
fisheries managers <strong>and</strong> stakeholders. The Ministry is, therefore, looking at improving ways to<br />
document, review, publicise, <strong>and</strong> integrate information from environmental assessments with<br />
traditional fishery assessments. This will rely heavily on studies that are published in <strong>Aquatic</strong><br />
<strong>Environment</strong> <strong>and</strong> <strong>Biodiversity</strong> Reports <strong>and</strong> Final Research Reports but, given the overlapping<br />
m<strong>and</strong>ates <strong>and</strong> broader scope of work in this area, also on results published by other organisations. The<br />
integration of all this work into a single source document analogous to the Report from the Fishery<br />
Assessment Plenary will take time <strong>and</strong> not all issues will be covered for some years.<br />
13
AEBAR <strong>2012</strong>: Research themes<br />
THEME RESEARCH QUESTIONS CURRENT WORK<br />
1.PROTECTED<br />
SPECIES<br />
• Marine mammals<br />
• Seabirds<br />
• Turtles<br />
• Protected fish<br />
• Corals<br />
• How many of each NZ-breeding protected<br />
species are caught <strong>and</strong> killed in our fisheries<br />
(<strong>and</strong> out of zone)?<br />
• How many unobserved deaths are caused?<br />
• What is the likely effect of fishing-related<br />
mortality on protected species populations?<br />
• Which species or populations are most at<br />
risk?<br />
• Which fisheries cause the most risk <strong>and</strong><br />
where are the most cost-effective gains to<br />
be made?<br />
• What mitigation approaches are most<br />
successful <strong>and</strong> in what circumstances?<br />
• What levels of bycatch would lead to<br />
14<br />
• Estimation of annual bycatch of<br />
protected species by fishery<br />
• Abundance <strong>and</strong> productivity of<br />
key seabird populations<br />
• Abundance <strong>and</strong> productivity of<br />
Hector’s & Maui’s dolphins<br />
• Semi-quantitative risk assessment<br />
for all seabirds<br />
• Semi-quantitative risk assessment<br />
for other protected species<br />
• Full quantitative risk assessment<br />
for selected seabird populations<br />
• Modelling to assess robust links<br />
between observed ycatch <strong>and</strong><br />
different population outcomes?<br />
population outcomes<br />
2. OTHER • How much non-target fish is caught <strong>and</strong> • Continued monitoring cycle for<br />
BYCATCH<br />
discarded in our fisheries?<br />
deepwater <strong>and</strong> highly migratory<br />
• Non-QMS fish & • What is the effect of that bycatch? • Risk assessment for tier 3<br />
invertebrates • What do trends in bycatch show?<br />
deepwater bycatch species<br />
3. BENTHIC • What seabed habitats occur where in our • Testing of habitat classifications<br />
EFFECTS<br />
TS/EEZ <strong>and</strong> how much of each is affected • Assessment of recovery rate of<br />
• Distribution of by trawling or shellfish dredging?<br />
some key inshore habitats<br />
habitats & trawling • How sensitive is each habitat to disturbance • Assessment of relative sensitivity<br />
• Effects of trawling <strong>and</strong> what do we lose when each is<br />
of habitats<br />
on each<br />
disturbed?<br />
• Mapping of sensitive biogenic<br />
• What are the consequences of different habitats, <strong>and</strong> deepwater <strong>and</strong><br />
management approaches?<br />
inshore trawl footprints<br />
4. ECOSYSTEM • How do the ecosystems that support our • Habitat of significance: Kaipara<br />
EFFECTS<br />
fisheries function?<br />
Harbour fish habitats (SNA)<br />
• Trophic studies • What are the key predator-prey or • Habitat of significance: review of<br />
• Habitats of<br />
synergistic relationships in these systems? information for inshore finfish<br />
significance • Are our fisheries affecting food webs or • Habitat of significance: coastal<br />
• Ecosystem<br />
ecosystem services?<br />
shark nursery areas (starting with<br />
indicators • What changes are occurring in the<br />
rig)<br />
• L<strong>and</strong>-use effects ecosystems that support our fisheries? • Multi-impact risk assessment<br />
• Climate variability • What is “habitat of particular significance • Monitoring <strong>and</strong> indicators of<br />
• Climate Change for fisheries management”?<br />
environmental change for<br />
• System productivity • How do fisheries <strong>and</strong>/or l<strong>and</strong> management deepwater fisheries<br />
affect fish habitat <strong>and</strong> fisheries production? • Ecotrophic factors affecting<br />
• What are the major risks <strong>and</strong> opportunities<br />
from ocean-climate variability <strong>and</strong> trends?<br />
highly migratory species<br />
5. MARINE • What are the key drivers of pattern in New • Mapping key biogenic habitats<br />
BIODIVERSITY Zeal<strong>and</strong>’s marine biodiversity?<br />
• SPRFMO benthic habitats<br />
• Characterising NZ • How does biodiversity contribute to the • Modelling seabed response <strong>and</strong><br />
biodiversity resilience of ecosystems to perturbation <strong>and</strong> recovery from disturbance<br />
• Functional ecology climate change?<br />
• Ocean acidification in fish habitat<br />
• Genetic diversity • What drives genetic connectivity within • Experimental response of shellfish<br />
• Ocean climate species?<br />
to warming <strong>and</strong> acidification<br />
• Metrics & indicators • What do we need to measure <strong>and</strong> monitor to • Monitoring surface plankton<br />
• Threats & impacts assess risks <strong>and</strong> change?<br />
• Implications of ocean acidification<br />
• Ross Sea & IPY • How are biota adapted to polar conditions for plankton productivity<br />
<strong>and</strong> what is their sensitivity to perturbation? • Marine environmental monitoirng<br />
Figure 2.1: Summary of themes in the <strong>Aquatic</strong> <strong>Environment</strong> <strong>and</strong> <strong>Biodiversity</strong> <strong>Annual</strong> <strong>Review</strong> 2011.
AEBAR <strong>2012</strong>: Research themes<br />
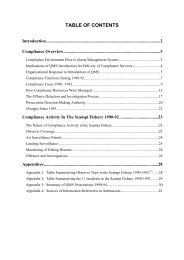
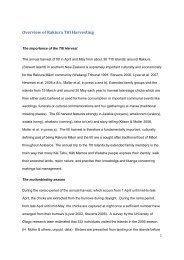
CURRENT STATE OF KNOWLEDGE<br />
• Aggregate “on deck” bycatch of seabirds (<strong>and</strong> approximate species composition), marine mammals, <strong>and</strong><br />
large sharks known reasonably well for offshore trawl <strong>and</strong> longline fisheries, but less well for inshore<br />
fisheries (where observer coverage has historically been low).<br />
• Incidental, cryptic, or unobserved mortality very poorly known (<strong>and</strong> difficult to assess).<br />
• Factors affecting fishing related mortality are well known for most seabirds <strong>and</strong> marine mammals.<br />
• Knowledge of population abundance is increasing for some key seabird species <strong>and</strong> well known for sea<br />
lions, but poorly known or dated for other seabirds, some species of dolphins, fur seals, <strong>and</strong> most sharks.<br />
• Qualitative or semi-quantitative risk assessments have been completed for almost all seabirds <strong>and</strong> marine<br />
mammals.<br />
• Fully quantitative risk assessments have been completed for two seabird populations, Hector’s / Maui’s<br />
dolphins, <strong>and</strong> sea lions.<br />
• Impact of fishing-related mortality on most protected species remains uncertain because of some key<br />
knowledge gaps.<br />
• Some methods of mitigating bycatch have been formally tested.<br />
• Bycatch <strong>and</strong> discards are monitored <strong>and</strong> reported using observer records for the main deepwater <strong>and</strong><br />
highly migratory fisheries.<br />
• Bycatch <strong>and</strong> discards for inshore vessels remain poorly known.<br />
• Some mitigation approaches have been assessed (e.g., for scampi trawl).<br />
• Modelled predictions (that have been tested in deepwater) are available of the distribution of seabed<br />
habitats at a broad scale using classifications (BOMEC) <strong>and</strong> at finer scale for seamounts <strong>and</strong> some<br />
biogenic habitats.<br />
• Excellent underst<strong>and</strong>ing of the distribution of bottom trawling in offshore waters (but not in coastal<br />
waters, especially for most shellfish dredge fisheries).<br />
• Good underst<strong>and</strong>ing of the effects of trawling on some nearshore habitats.<br />
• General underst<strong>and</strong>ing of the effects of trawling on biogeochemical processes.<br />
• General underst<strong>and</strong>ing of the relative sensitivity of different habitats.<br />
• Variability in the diets of key commercial species in the Chatham Rise ecosystem have been described as<br />
part of a wider biodiversity <strong>and</strong> MSI programme.<br />
• A preliminary trophic model of the Subantarctic ecosystem suggests a low productivity system<br />
supporting a simple food chain with high transfer efficiencies.<br />
• Atlases have been developed showing the distribution of spawning, pupping, egg-laying, <strong>and</strong> juveniles of<br />
key species (this needs finalising for inshore species).<br />
• A review of l<strong>and</strong>-based effects on fish habitat <strong>and</strong> coastal biodiversity has been completed.<br />
• A start has been made on assessing ecosystem change over time (through fish-based indicators calculated<br />
from trawl survey data <strong>and</strong> acoustic time series of mesopelagic biomass)<br />
• A summary of ocean climate variability <strong>and</strong> change has been produced.<br />
• Broad reviews have been completed of the impacts of climate variability on fisheries (especially<br />
recruitment), but the likely impacts of ocean climate change or acidification remain poorly known.<br />
• This theme has links <strong>and</strong> synergies with MBIE, DOC, universities <strong>and</strong> the MPI biodiversity programme.s<br />
• Taxonomy <strong>and</strong> ID Guides have been produced <strong>and</strong> specimens recorded in National Collections.<br />
• <strong>Biodiversity</strong> surveys completed on local scale (Fiordl<strong>and</strong>, Spirits Bay, seamounts) <strong>and</strong> larger fishery<br />
scale (Norfolk ridge, Chatham Rise, Challenger Plateau, BOI).<br />
• Measures <strong>and</strong> indicators for marine biodiversity measures <strong>and</strong> ecosystem have been developed.<br />
• Predictive modelling techniques have been applied <strong>and</strong> habitat classification methods improved<br />
• Productivity in benthic communities has been measured.<br />
• Specimens from New Zeal<strong>and</strong> have been genetically assessed <strong>and</strong> entered into the barcode of life.<br />
• Seamount connectivity, l<strong>and</strong>-sea connectivity, <strong>and</strong> endemism have been studied.<br />
• A plan for monitoring the marine environment for long-term change is under development.<br />
• Demersal fish trophic studies on the Chatham Rise have been completed.<br />
• A review of NZ data from deep-sea <strong>and</strong> abyssal habitats has been completed.<br />
• A multidisciplinary study of longterm (1000 years) changes to NZ marine ecosystem is ongoing.<br />
• Latitudinal gradient project, ICECUBE <strong>and</strong> 2 large scale surveys in the Ross Sea have been conducted.<br />
• This theme has links <strong>and</strong> synergies with MBIE, DOC, universities <strong>and</strong> the MPI AEWG programmes<br />
Figure 2.1 continued: Summary of Themes in the <strong>Aquatic</strong> <strong>Environment</strong> & <strong>Biodiversity</strong> <strong>Review</strong> 2011<br />
15
AEBAR <strong>2012</strong>: Protected species:<br />
THEME 1: PROTECTED SPECIES<br />
16
AE&B <strong>Review</strong>: Protected species: Sea lions<br />
3. New Zeal<strong>and</strong> sea lions (Phocarctos hookeri)<br />
Scope of chapter This chapter outlines the biology of New Zeal<strong>and</strong> (or Hooker’s) sea<br />
lions (Phocarctos hookeri), the nature of fishing interactions, the<br />
management approach, trends in key indicators of fishing effects <strong>and</strong><br />
major sources of uncertainty.<br />
Area Southern parts of the New Zeal<strong>and</strong> EEZ <strong>and</strong> Territorial Sea.<br />
Focal localities Areas with significant fisheries interactions include the Auckl<strong>and</strong><br />
Isl<strong>and</strong>s Shelf, the Stewart/Snares Shelf <strong>and</strong> Campbell Plateau.<br />
Key issues Improving estimates of incidental bycatch in some trawl fisheries (e.g.<br />
scampi), improving estimates of SLED post-exit survival, improving<br />
underst<strong>and</strong>ing of interaction rate <strong>and</strong> improving underst<strong>and</strong>ing of the<br />
demographic processes underlying recent population trends.<br />
Emerging issues Assessing potential impacts of resource competition <strong>and</strong>/or resource<br />
limitation through ecosystem effects on NZ sea lion population viability.<br />
The role of fisheries impacts in light of ongoing declines in population<br />
MPI Research<br />
(current)<br />
Other Govt<br />
Research (current)<br />
Links to 2030<br />
objectives<br />
Related<br />
issues/chapters<br />
3.1. Context<br />
size. Estimation of interactions given low numbers of observed captures.<br />
PRO2010-01 Estimating the nature & extent of incidental captures of<br />
seabirds, marine mammals & turtles in New Zeal<strong>and</strong> commercial<br />
fisheries; PRO<strong>2012</strong>-02 Assess the risk posed to marine mammal<br />
populations from New Zeal<strong>and</strong> fisheries; External review of the Breen-<br />
Fu-Gilbert model (SRP2011-04).<br />
DOC Marine Conservation Services Programme (CSP): INT<strong>2012</strong>-01 To<br />
underst<strong>and</strong> the nature <strong>and</strong> extent of protected species interactions with<br />
New Zeal<strong>and</strong> commercial fishing activities; POP<strong>2012</strong>-01 To provide<br />
information on the population level <strong>and</strong> dynamics of the New Zeal<strong>and</strong><br />
sea lion at the Auckl<strong>and</strong> Isl<strong>and</strong>s relevant to assessing the impacts of<br />
commercial fishing impacts on this population; POP<strong>2012</strong>-02 To<br />
determine the key demographic factors driving the observed population<br />
decline of New Zeal<strong>and</strong> sea lions at the Auckl<strong>and</strong> Isl<strong>and</strong>s.<br />
NIWA Research: SA123098 Multispecies modelling to evaluate the<br />
potential drivers of decline in New Zeal<strong>and</strong> sea lions; TMMA103<br />
Conservation of New Zeal<strong>and</strong>'s threatened iconic marine megafauna.<br />
Objective 6: Manage impacts of fishing <strong>and</strong> aquaculture.<br />
Strategic Action 6.2: Set <strong>and</strong> monitor environmental st<strong>and</strong>ards,<br />
including for threatened <strong>and</strong> protected species <strong>and</strong> seabed impacts.<br />
See the New Zeal<strong>and</strong> fur seal chapter.<br />
Management of fisheries impacts on New Zeal<strong>and</strong> (NZ) sea lions is legislated under the Marine<br />
Mammals Protection Act (MMPA) 1978 <strong>and</strong> the Fisheries Act (FA) 1996. Under s.3E of the MMPA,<br />
the Minister of Conservation, with the concurrence of the Minister for Primary Industries (formerly<br />
the Minister of Fisheries), may approve a population management plan (PMP). Although a NZ sea<br />
lion PMP was proposed by the Department of Conservation (DOC) in 2007 (DOC 2007), following<br />
consultation DOC decided not to proceed with the PMP.<br />
All marine mammal species are designated as protected species under s.2(1) of the FA. In 2005, the<br />
Minister of Conservation approved the Conservation General Policy, which specifies in Policy 4.4 (f)<br />
that “Protected marine species should be managed for their long-term viability <strong>and</strong> recovery<br />
17
AE&B <strong>Review</strong>: Protected species: Sea lions<br />
throughout their natural range.” DOC’s Regional Conservation Management Strategies outline<br />
specific policies <strong>and</strong> objectives for protected marine species at a regional level. New Zeal<strong>and</strong>’s sub-<br />
Antarctic isl<strong>and</strong>s, including Auckl<strong>and</strong> <strong>and</strong> Campbell isl<strong>and</strong>s, were inscribed as a World Heritage area<br />
in 1998.<br />
The Minister of Conservation gazetted the NZ sea lion as a threatened species in 1997. In 2009, DOC<br />
approved the New Zeal<strong>and</strong> sea lion species management plan 2 : 2009–2014 (DOC 2009). It aims: “To<br />
make significant progress in facilitating an increase in the New Zeal<strong>and</strong> sea lion population size <strong>and</strong><br />
distribution.” The plan specifies a number of goals, of which the following are most relevant for<br />
fisheries interactions:<br />
“To avoid or minimise adverse human interactions on the population <strong>and</strong> individuals.<br />
To ensure comprehensive protection provisions are in place <strong>and</strong> enforced.<br />
To ensure widespread stakeholder underst<strong>and</strong>ing, support <strong>and</strong> involvement in<br />
management measures.”<br />
In the absence of a PMP, the Ministry for Primary Industries (MPI, formerly the Ministry of Fisheries,<br />
MFish) manages fishing-related mortality of NZ sea lions under s.15(2) of the FA. Under that section,<br />
the Minister “may take such measures as he or she considers are necessary to avoid, remedy, or<br />
mitigate the effect of fishing-related mortality on any protected species, <strong>and</strong> such measures may<br />
include setting a limit on fishing-related mortality.”<br />
Management of NZ sea lion bycatch aligns with Fisheries 2030 Objective 6: Manage impacts of<br />
fishing <strong>and</strong> aquaculture. Further, the management actions follow Strategic Action 6.2: Set <strong>and</strong><br />
monitor environmental st<strong>and</strong>ards, including for threatened <strong>and</strong> protected species <strong>and</strong> seabed impacts.<br />
The relevant National Fisheries Plan for the management of NZ sea lion bycatch is the National<br />
Fisheries Plan for Deepwater <strong>and</strong> Middle-depth Fisheries (the National Deepwater Plan). Under the<br />
National Deepwater Plan, the objective most relevant for management of NZ sea lions is Management<br />
Objective 2.5: Manage deepwater <strong>and</strong> middle-depth fisheries to avoid or minimise adverse effects on<br />
the long-term viability of endangered, threatened <strong>and</strong> protected species.<br />
Specific objectives for the management of NZ sea lion bycatch will be outlined in the fishery-specific<br />
chapters of the National Deepwater Plan for the fisheries with which NZ sea lions are most likely to<br />
interact. These fisheries include trawl fisheries for arrow squid (SQU1T <strong>and</strong> SQU6T), southern blue<br />
whiting (SBW) <strong>and</strong> scampi (SCI). The SBW chapter of the National Deepwater Plan is complete <strong>and</strong><br />
includes Operational Objective 2.2: Ensure that incidental New Zeal<strong>and</strong> sea lion mortalities, in the<br />
southern blue whiting fishery at the Campbell Isl<strong>and</strong>s (SBW6I), do not impact the long term viability<br />
of the sea lion population <strong>and</strong> captures are minimised through good operational practices. Chapters<br />
in the National Deepwater Plan for arrow squid <strong>and</strong> scampi are under development.<br />
Currently, MPI limits the actual or estimated bycatch of sea lions in the SQU6T trawl fishery based<br />
on tests of the likely performance of c<strong>and</strong>idate bycatch control rules (<strong>and</strong>, hence, bycatch limits) using<br />
an integrated population <strong>and</strong> fishery model (Breen et al. 2010). C<strong>and</strong>idate rules are assessed against<br />
the following two criteria:<br />
a. A rule should provide for an increase in the sea lion population to more than 90% of carrying<br />
capacity 3 , or to within 10% of the population size that would have been attained in the<br />
2 The species management plan differs from the draft Population Management Plan in that it is quite broad in<br />
scope; providing a framework to guide the Department of Conservation in its management of the NZ sea lion<br />
over the next 5 years. The draft population management plan focused on options for managing the extent of<br />
incidental mortality of NZ sea lions from fishing through establishing a maximum allowable level of fishingrelated<br />
mortality (MALFiRM) for all New Zeal<strong>and</strong> fisheries waters.<br />
3 Carrying capacity in this instance applies to the current range. For managing the SQU6T fishery, carrying<br />
capacity refers to the maximum number of NZ sea lions that could be sustained on the Auckl<strong>and</strong> Isl<strong>and</strong>s.<br />
18
AE&B <strong>Review</strong>: Protected species: Sea lions<br />
absence of fishing, <strong>and</strong> that these levels must be attained with 90% certainty, over 20-year<br />
<strong>and</strong> 100-year projections.<br />
b. A rule should attain a mean number of mature mammals that exceeded 90% of carrying<br />
capacity in the second 50 years of 100-year projection runs.<br />
These management criteria were developed <strong>and</strong> approved in 2003 by a Technical Working Group<br />
comprised of MFish, DOC, squid industry representatives, <strong>and</strong> environmental groups.<br />
Likely performance is also assessed against two additional criteria proposed by DOC:<br />
a) A rule should maintain numbers above 90% of the carrying capacity in at least 18 of the first<br />
20 years.<br />
b) A rule should lead to at least a 50% chance of an increase in the number of mature animals<br />
over the first 20 years of the model projections.<br />
3.2. Biology<br />
3.2.1. Taxonomy<br />
The NZ sea lion (Phocarctos hookeri, Gray, 1844) is one of only two species of otariid (eared seals,<br />
including fur seals <strong>and</strong> sea lions) native to New Zeal<strong>and</strong>, the other being the NZ fur seal<br />
(Arctocephalus forsteri, Lesson, 1828). The NZ sea lion is also New Zeal<strong>and</strong>’s only endemic<br />
pinniped.<br />
3.2.2. Distribution<br />
Before human habitation, NZ sea lions ranged around the North <strong>and</strong> South Isl<strong>and</strong>s of New Zeal<strong>and</strong>.<br />
Pre-European remains of NZ sea lions have been identified from at least 47 archaeological sites,<br />
ranging from Stewart Isl<strong>and</strong> to North Cape, with most occurring in the southern half of the South<br />
Isl<strong>and</strong> (Smith 1989, 2011, Childerhouse <strong>and</strong> Gales 1998, Gill 1998). Subsistence hunting on the<br />
mainl<strong>and</strong> <strong>and</strong> subsequent commercial harvest from outlying isl<strong>and</strong>s of NZ sea lions for skins <strong>and</strong> oil<br />
resulted in population decline <strong>and</strong> contraction of the species’ range (Gales 1995, Childerhouse <strong>and</strong><br />
Gales 1998, Nagaoka 2001, 2006). Currently, most NZ sea lions are found in the New Zeal<strong>and</strong> Sub-<br />
Antarctic, with individuals ranging to the NZ mainl<strong>and</strong> <strong>and</strong> Macquarie Isl<strong>and</strong>.<br />
NZ sea lion breeding colonies 4 are highly localized, with most pups being born at two main breeding<br />
areas, the Auckl<strong>and</strong> Isl<strong>and</strong>s <strong>and</strong> Campbell Isl<strong>and</strong> (Wilkinson et al. 2003, Chilvers 2008). At the<br />
Auckl<strong>and</strong> Isl<strong>and</strong>s, there are three breeding colonies: Enderby Isl<strong>and</strong> (mainly at S<strong>and</strong>y Bay <strong>and</strong> South<br />
East Point); Dundas Isl<strong>and</strong>; <strong>and</strong> Figure of Eight Isl<strong>and</strong>. On Campbell Isl<strong>and</strong> there is one breeding<br />
colony at Davis Point, another colony at Paradise Point, plus a small number of non-colonial breeders<br />
(Wilkinson et al. 2003, Chilvers 2008, Maloney et al. 2009, Maloney et al. <strong>2012</strong>). Twenty-five sea<br />
lion pups were captured <strong>and</strong> tagged around Stewart Isl<strong>and</strong> during a DOC recreational hut <strong>and</strong> track<br />
maintance trip in March <strong>2012</strong>. Breeding on the Auckl<strong>and</strong> Isl<strong>and</strong>s represents 71–87% of the pup<br />
production for the species, with the remaining 13–29% occurring on Campbell Isl<strong>and</strong> (based on<br />
concurrent pup counts in 2003, 2008 <strong>and</strong> 2010; see section 3.2.5).<br />
4 DOC (2009) defines colonies as “haul-out sites where 35 pups or more are born each year for a period of 5<br />
years or more.” Haul-out sites are defined as “terrestrial sites where NZ sea lions occur but where pups are not<br />
born, or where less than 35 pups are born per year over 5 consecutive years.”<br />
19
AE&B <strong>Review</strong>: Protected species: Sea lions<br />
Although breeding is concentrated on the Auckl<strong>and</strong> Isl<strong>and</strong>s <strong>and</strong> Campbell Isl<strong>and</strong>, occasional births<br />
have been reported from the Snares <strong>and</strong> Stewart Isl<strong>and</strong>s (Wilkinson et al. 2003, Chilvers et al. 2007).<br />
Breeding is also taking place on the New Zeal<strong>and</strong> mainl<strong>and</strong> at the Otago peninsula, mainly the result<br />
of a single female arriving in 1992 <strong>and</strong> giving birth in 1993 (McConkey et al., 2002).<br />
On l<strong>and</strong>, NZ sea lions are able to travel long distances <strong>and</strong> climb high hills, <strong>and</strong> are found in a variety<br />
of habitats including s<strong>and</strong>y beaches, grass fields, bedrock, <strong>and</strong> dense bush <strong>and</strong> forest (Gales 1995,<br />
Augé et al. <strong>2012</strong>). Following the end of the females’ oestrus cycle in late January, adult <strong>and</strong> sub-adult<br />
males disperse throughout the species’ range, whereas dispersal of females (both breeding <strong>and</strong> nonbreeding)<br />
appears more restricted (Marlow 1975, Robertson et al. 2006, Chilvers <strong>and</strong> Wilkinson<br />
2008).<br />
3.2.3. Foraging ecology<br />
Most foraging studies have been conducted on lactating female NZ sea lions from Enderby Isl<strong>and</strong><br />
(Chilvers et al. 2005a, 2006, Chilvers <strong>and</strong> Wilkinson 2009, although work is underway at Campbell<br />
Isl<strong>and</strong> under NIWA project TMMA103, Conservation of New Zeal<strong>and</strong>'s threatened iconic marine<br />
megafauna). These show that females from this place forage primarily within the Auckl<strong>and</strong> Isl<strong>and</strong>s<br />
continental shelf <strong>and</strong> its northern edge, <strong>and</strong> that individuals show strong foraging site fidelity both<br />
within <strong>and</strong> across years. Satellite tagging data from lactating females showed that the mean return<br />
distance travelled per foraging trip is 423 ± 43 km (n = 26), which is greater than that recorded for any<br />
other sea lion species (Chilvers et al. 2005a). While foraging, about half of the time is spent<br />
submerged, with a mean dive depth of 130 ± 5 m (max. 597 m) <strong>and</strong> a mean dive duration of 4 ±<br />
1 minutes (max. 14.5 minutes; Chilvers et al. 2006). NZ sea lions, like most pinnipeds, may use their<br />
whiskers to help them capture prey at depths where light does not penetrate (Marshall 2008, Hanke et<br />
al. 2010).<br />
Studies conducted on female NZ sea lions suggest that the foraging behaviour of each individual falls<br />
into one of two distinct categories, benthic or meso-pelagic (Chilvers <strong>and</strong> Wilkinson 2009). Benthic<br />
divers have fairly consistent dive profiles, reaching similar depths (120 m on average) on consecutive<br />
dives in relatively shallow water to presumably feed on benthic prey. Meso-pelagic divers, by<br />
contrast, exhibit more varied dive profiles, undertaking both deep (> 200 m) <strong>and</strong> shallow (< 50 m)<br />
dives over deeper water. Benthic divers tend to forage further from their breeding colonies, making<br />
their way to the north-eastern limits of Auckl<strong>and</strong> Isl<strong>and</strong>s’ shelf, whereas meso-pelagic divers tend to<br />
forage along the north-western edge of the shelf over depths of approximately 3000 m (Chilvers <strong>and</strong><br />
Wilkinson 2009).<br />
The differences in dive profiles have further implications for the animals’ estimated aerobic dive<br />
limits (ADL; Chilvers et al. 2006), defined as the maximum amount of time that can be spent<br />
underwater without increasing blood lactate concentrations (a by-product of anaerobic metabolism). If<br />
animals exceed their ADL <strong>and</strong> accumulate lactate, they must surface <strong>and</strong> go through a recovery period<br />
in order to aerobically metabolize the lactate before they can undertake subsequent dives. Chilvers et<br />
al. (2006) estimated that lactating female NZ sea lions exceed their ADL on 69% of all dives, a much<br />
higher proportion than most other otariids (which exceed their ADL for only 4–10% of dives;<br />
Chilvers et al. 2006). NZ sea lions that exhibit benthic diving profiles are estimated to exceed their<br />
ADL on 82% of dives, compared with 51% for meso-pelagic divers (Chilvers 2008).<br />
Chilvers et al. (2006) <strong>and</strong> Chilvers <strong>and</strong> Wilkinson (2009) suggested that the long, deep diving<br />
behaviour, the propensity to exceed their estimated ADL, <strong>and</strong> differences in physical condition <strong>and</strong><br />
age at first reproduction from animals at Otago together indicate that females from the Auckl<strong>and</strong><br />
Isl<strong>and</strong>s may be foraging at or near their physiological limits. However, Bowen (<strong>2012</strong>) suggested a<br />
lack of relationship between surface time <strong>and</strong> anaerobic diving would seem to indicate that ADL has<br />
been underestimated. Further, given a number of studies of diving behaviour were conducted during<br />
20
AE&B <strong>Review</strong>: Protected species: Sea lions<br />
early lactation when the dem<strong>and</strong>s of offspring are less than they would be later in lactation, Bowen<br />
(<strong>2012</strong>) considered it unlikely that females are operating at or near a physiological limit.<br />
Adult females at Otago are generally heavier for a given age, breed earlier, undertake shorter foraging<br />
trips, <strong>and</strong> have shallower dive profiles compared with females from the Auckl<strong>and</strong> Isl<strong>and</strong>s (Table 3.1).<br />
Any observed differences may reflect differences in environment between the Auckl<strong>and</strong> Isl<strong>and</strong>s <strong>and</strong><br />
the Otago peninsula, a founder effect, or a combination of these or other factors.<br />
Table 3.1: Comparison of select characteristics between adult female NZ sea lions from the Auckl<strong>and</strong> Isl<strong>and</strong>s <strong>and</strong><br />
those from the Otago peninsula (Chilvers et al. 2006, Augé et al. 2011a, 2011b, 2011c). Data are means ± SE (where<br />
available).<br />
Characteristic Auckl<strong>and</strong> Isl<strong>and</strong>s Otago<br />
Reproduction at age 4 < 5% of females > 85% of females<br />
Average mass at 8-13 years of<br />
age<br />
112 kg 152 kg<br />
Foraging distance from shore 102.0 ± 7.7 km (max = 175 km) 4.7 ± 1.6 km (max = 25 km)<br />
Time spent foraging at sea 66.2 ± 4.2 hrs 11.8 ± 1.5 hrs<br />
Dive depth 129.4 ± 5.3 m (max = 597 m) 20.2 ± 24.5 m (max = 389 m)<br />
Dives estimated to exceed ADL 68.7 ± 4.4 percent 7.1 ± 8.1 percent<br />
NZ sea lions are generalist predators with a varied diet that includes fish (rattail, red cod, opalfish,<br />
hoki), cephalopods (octopus, squid), crustaceans (lobster krill, scampi), <strong>and</strong> salps (Cawthorn et al.<br />
1985; Childerhouse et al. 2001; Meynier et al. 2009). The three main methods used to assess NZ sea<br />
lion diets involve analyses of stomach contents, scats <strong>and</strong> regurgitate, <strong>and</strong> the fatty acid composition<br />
of blubber (Meynier et al. 2008). Stomach contents of by-caught animals tend to be biased towards<br />
the target species of the fishery concerned (e.g. squid in the SQU6T fishery), whereas scats <strong>and</strong><br />
regurgitates are biased towards less digestible prey (Meynier et al. 2008). Stomach, scat <strong>and</strong><br />
regurgitate approaches tend to reflect only recent prey (Meynier et al. 2008). By contrast, analysis of<br />
the fatty acid composition of blubber provides a longer-term perspective on diets ranging from weeks<br />
to months (although individual prey species are not identifiable). This approach suggests that the diet<br />
of female NZ sea lions tends to include proportionally more arrow squid (Nototodarus sloanii) <strong>and</strong><br />
proportionally less red cod (Pseudophycis bachus) <strong>and</strong> scampi (Metanephrops challengeri) than for<br />
male NZ sea lions, while lactating <strong>and</strong> non-lactating females do not differ in their diet (Meynier et al.<br />
2008; Meynier 2010).<br />
3.2.4. Reproductive biology<br />
NZ sea lions exhibit marked sexual dimorphism, with adult males being larger <strong>and</strong> darker in colour<br />
than adult females (Walker <strong>and</strong> Ling 1981, Cawthorn et al. 1985). Cawthorn et al. (1985) <strong>and</strong> Dickie<br />
(1999) estimated the maximum age of males <strong>and</strong> females to be 21 <strong>and</strong> 23 years, respectively, but<br />
Childerhouse et al. (2010a) recently reported a maximum estimated age for females of 28 years<br />
(although the AEWG had some concerns about the methods used <strong>and</strong> this estimate may not be<br />
reliable). Although females can become sexually mature as early as age 2 <strong>and</strong> give birth the following<br />
year, most do not breed until they are 6 years old (Childerhouse et al. 2010a). Males generally reach<br />
sexual maturity at 4 years of age, but because of their polygynous colonial breeding strategy (i.e.,<br />
males actively defend territories <strong>and</strong> mate with multiple females within a harem) they are only able to<br />
successfully breed at 7–9 years old, once they have attained sufficient physical size (Marlow 1975,<br />
Cawthorn et al. 1985). Reproductive rate in females increases rapidly between the ages of 3 <strong>and</strong> 7,<br />
reaching a plateau until the age of approximately 15 <strong>and</strong> declining rapidly thereafter, with the<br />
maximum recorded age at reproduction being 26 years (Breen et al. 2010, Childerhouse et al. 2010b,<br />
Chilvers et al. 2010). Chilvers et al. (2010) estimated from tagged sea lions that the median lifetime<br />
21
AE&B <strong>Review</strong>: Protected species: Sea lions<br />
reproductive output of a female NZ sea lion was 4.4 pups, <strong>and</strong> 27% of all females that survive to age<br />
3 never breed. Analysis of tag-resight data from female New Zeal<strong>and</strong> sea lions on Enderby Isl<strong>and</strong><br />
indicates average annual breeding probability is approximately 0.30-0.35 for prime-age females that<br />
did not breed in the previous year (ranges reflect variation relating to the definition of breeders) <strong>and</strong><br />
0.65-0.68 for prime-age females that did breed in the previous year (MacKenzie 2011).<br />
NZ sea lions are philopatric (i.e., they return to breed at the same location where they were born,<br />
although more so for females than males). Breeding is highly synchronised <strong>and</strong> starts in late<br />
November when adult males establish territories for their harems (Robertson et al. 2006, Chilvers <strong>and</strong><br />
Wilkinson 2008). Pregnant <strong>and</strong> non-pregnant females appear at the breeding colonies in December<br />
<strong>and</strong> early January, with pregnant females giving birth to a single pup in late December before entering<br />
oestrus 7–10 days later <strong>and</strong> mating again (Marlow 1975). Twin births <strong>and</strong> the fostering of pups in NZ<br />
sea lions are rare (Childerhouse <strong>and</strong> Gales 2001). Shortly after the breeding season ends in mid-<br />
January, the harems break up with the males dispersing offshore <strong>and</strong> females often moving away from<br />
the rookeries with their pups (Marlow 1975, Cawthorn et al. 1985).<br />
Pups at birth weigh 8–12 kg with parental care restricted to females (Walker <strong>and</strong> Ling 1981,<br />
Cawthorn et al. 1985, Chilvers et al. 2006). Females remain ashore for about 10 days after giving<br />
birth before alternating between foraging trips lasting approximately two days out at sea <strong>and</strong> returning<br />
for about one day to suckle their pups (Gales <strong>and</strong> Mattlin 1997, Chilvers et al. 2005). New Zeal<strong>and</strong><br />
pup growth rates are lower than those reported for other sea lion species, <strong>and</strong> may be linked to a<br />
relatively low concentration of lipids in the females’ milk during early lactation (Riet-Sapriza et al.<br />
<strong>2012</strong>, Chilvers 2008). Pups are weaned after about 10–12 months (Marlow 1975, Gales <strong>and</strong> Mattlin<br />
1997).<br />
3.2.5. Population biology<br />
For NZ sea lions, the overall size of the population is indexed using estimates of the number of pups<br />
that are born each year (Chilvers et al. 2007). Since 1995, the Department of Conservation (DOC) has<br />
conducted mark-recapture counts at each of the main breeding colonies at the Auckl<strong>and</strong> Isl<strong>and</strong>s to<br />
estimate annual pup production (i.e., the total number of pups born each year, including dead <strong>and</strong> live<br />
animals; Robertson <strong>and</strong> Chilvers 2011). The data show a decline in pup production from a peak of<br />
3021 in 1997/98 to a low of 1501 ± 16 pups in 2008/09 (Chilvers <strong>and</strong> Wilkinson 2011, Robertson <strong>and</strong><br />
Chilvers 2011; Table 3.2), with the largest single-year decline (31%) occurring between the 2007/08<br />
<strong>and</strong> 2008/09 counts. The most recent estimate of pup production for the Auckl<strong>and</strong> Isl<strong>and</strong>s population<br />
was 1683 ± 16 pups in 2011/12 (Chilvers <strong>2012</strong>a) <strong>and</strong> a project is underway to obtain a comparable<br />
estimate for <strong>2012</strong>/13 (POP<strong>2012</strong>-01).<br />
Total NZ sea lion abundance (including pups) at the Auckl<strong>and</strong> Isl<strong>and</strong>s has been estimated using<br />
Bayesian population models (Breen et al. 2003, Breen <strong>and</strong> Kim 2006a, Breen <strong>and</strong> Kim 2006b, Breen<br />
et al. 2010). Although other abundance estimates are available (e.g. Gales <strong>and</strong> Fletcher 1999), the<br />
integrated models are preferred because they take into account a variety of age-specific factors<br />
(breeding, survival, maturity, vulnerability to fishing, <strong>and</strong> the proportion incidentally captured by<br />
fishing), as well as data on the re-sighting of tagged animals <strong>and</strong> pup production estimates, to generate<br />
estimates of the overall size of the NZ sea lion population inhabiting the Auckl<strong>and</strong> Isl<strong>and</strong>s (Table<br />
3.2). The most recent estimate of NZ sea lion abundance for the Auckl<strong>and</strong> Isl<strong>and</strong>s population was<br />
12 065 animals (90% CI: 11 160–13 061) in 2009. The integrated model suggested a net decline at the<br />
Auckl<strong>and</strong> Isl<strong>and</strong>s of 23% between 1995 <strong>and</strong> 2009, or 29% between the maximum estimated<br />
population size in 1998 <strong>and</strong> 2009.<br />
22
AE&B <strong>Review</strong>: Protected species: Sea lions<br />
Table 3.2: Pup production <strong>and</strong> population estimates of NZ sea lions from the Auckl<strong>and</strong> Isl<strong>and</strong>s from 1995 to 2010.<br />
Pup production data are direct counts or mark-recapture estimates from Chilvers et al. (2007), Robertson <strong>and</strong><br />
Chilvers (2011) <strong>and</strong> Chilvers (<strong>2012</strong>a). St<strong>and</strong>ard errors only apply to the portion of pup production estimated using<br />
mark-recapture methods. Population estimates from P. Breen, estimated in the model by Breen et al. 2010. Year<br />
refers to the second year of a breeding season (e.g., 2010 refers to the 2009-10 season).<br />
Year Pup production estimate Population size estimate<br />
Mean St<strong>and</strong>ard error (for mark Median 90% confidence<br />
recapture estimates)<br />
interval<br />
1995 2 518 21 15 675 14 732–16 757<br />
1996 2 685 22 16 226 15 238–17 318<br />
1997 2 975 26 16 693 15 656–17 829<br />
1998 3 021 94 16 911 15 786–18 128<br />
1999 2 867 33 15 091 13 932–16 456<br />
2000 2 856 43 15 248 14 078–16 586<br />
2001 2 859 24 15 005 13 870–16 282<br />
2002 2 282 34 13 890 12 856–15 079<br />
2003 2 518 38 14 141 13 107–15 295<br />
2004 2 515 40 14 096 13 057–15 278<br />
2005 2 148 34 13 369 12 383–14 518<br />
2006 2 089 30 13 110 12 150–14 156<br />
2007 2 224 38 13 199 12 231–14 215<br />
2008 2 175 44 12 733 11 786–13 757<br />
2009 1 501 16 12 065 11 160–13 061<br />
2010 1 814 36<br />
2011 1 550 5 41<br />
<strong>2012</strong> 1 683 16<br />
For the Campbell Isl<strong>and</strong> population, pup production was estimated at 681–726 pups in 2010<br />
(Robertson <strong>and</strong> Chilvers 2011, Maloney et al. <strong>2012</strong>). Pup production estimates at Campbell Isl<strong>and</strong> are<br />
increasing over time, although there have been changes to the methodology (Maloney et al. 2009).<br />
Previous estimates of total pup production were: 150 in 1992/93; 385 in 2003; <strong>and</strong> 583 in 2007-08<br />
(Cawthorn 1993, Childerhouse et al. 2005, Maloney et al. 2009). There were also minimum pup<br />
counts of 51 in 1987/88, 122 in 1991/92 <strong>and</strong> 78 (from a partial count) in 1997/98 (Moore <strong>and</strong> Moffat<br />
1990, McNally et al. 2001, M. Fraser, unpubl. data cited in Maloney et al. 2009).<br />
For the Otago sub-population, annual pup production has ranged from 0 to 7 pups since the 1994/95<br />
breeding season, with five pups recorded in 2010/11 (McConkey et al. 2002, Augé 2011). A<br />
modelling exercise suggested that this population can exp<strong>and</strong> to 9–22 adult females by 2018 (Lalas<br />
<strong>and</strong> Bradshaw 2003). The sub-population at Otago is of special interest because it highlights the<br />
potential for establishing new breeding colonies, in this case from a single pregnant female<br />
(McConkey et al. 2002).<br />
Established anthropogenic sources of mortality in NZ sea lion include: historic subsistence hunting<br />
<strong>and</strong> commercial harvest (Gales 1995, Childerhouse <strong>and</strong> Gales 1998); pup entrapment in rabbit<br />
burrows prior to rabbit eradication from Enderby Isl<strong>and</strong> in 1993 (Gales <strong>and</strong> Fletcher 1999); human<br />
disturbance, including attacks by dogs, vehicle strikes <strong>and</strong> deliberate shooting on mainl<strong>and</strong> New<br />
Zeal<strong>and</strong> (Gales 1995); <strong>and</strong> fisheries bycatch (see below).<br />
In addition to the established effects, there are a number of other anthropogenic effects that may also<br />
influence NZ sea lion mortality. However their role, if any, is presently unclear. These include:<br />
possible competition for resources between NZ sea lions <strong>and</strong> the various fisheries (Robertson <strong>and</strong><br />
5 Due to extreme weather conditions there was some delay in making the 2010/11 pup count which may affect<br />
comparability with previous years. However DOC’s analysis suggests any such effect is unlikely to be large<br />
(Chilvers <strong>and</strong> Wilkinson 2011).<br />
23
AE&B <strong>Review</strong>: Protected species: Sea lions<br />
Chilvers 2011, Bowen <strong>2012</strong>); effects of organic <strong>and</strong> inorganic pollutants, including polychlorinated<br />
biphenyls (PCBs), dichlorodiphenyltrichloroethane (DDT) <strong>and</strong> heavy metals such as mercury <strong>and</strong><br />
cadmium (Baker 1999, Robertson <strong>and</strong> Chilvers 2011); <strong>and</strong> impacts of eco-tourism.<br />
Other sources of mortality include epizootics, particularly Campylobacter which killed 1600 pups<br />
(53% of pup production) <strong>and</strong> at least 74 adult females on the Auckl<strong>and</strong> Isl<strong>and</strong>s in 1997/98 (Wilkinson<br />
et al. 2003, Robertson <strong>and</strong> Chilvers 2011) <strong>and</strong> Klebsiella pneumoniae which killed 33% <strong>and</strong> 21% of<br />
pups on the Auckl<strong>and</strong> Isl<strong>and</strong>s in 2001/02 <strong>and</strong> 2002/03 respectively (Wilkinson et al. 2006). The 1998<br />
epizootic event may have affected the fecundity of the surviving pups; reducing their breeding rate<br />
relative to other cohorts (Gilbert <strong>and</strong> Chilvers 2008). There are also occurrences of predation by<br />
sharks (Cawthorn et al. 1985, Robertson <strong>and</strong> Chilvers 2011), starvation of pups if they become<br />
separated from their mothers (Walker <strong>and</strong> Ling 1981, Castinel et al. 2007), drowning in wallows <strong>and</strong><br />
male aggression towards females <strong>and</strong> pups (Wilkinson et al. 2000, Chilvers et al. 2005b).<br />
Analysis of tag-resight data on Enderby Isl<strong>and</strong> yielded estimates of average annual survival for primeage<br />
females of 0.90 for females that did not breed <strong>and</strong> 0.95 for females that did breed, with no<br />
indication of a systematic change in survival during the period 1997/98 to 2010/11 (MacKenzie<br />
2011). Further analysis of tag-resight data is planned under DOC project POP<strong>2012</strong>-02 to determine<br />
the key demographic factors driving the observed population decline of New Zeal<strong>and</strong> sea lions at the<br />
Auckl<strong>and</strong> Isl<strong>and</strong>s.<br />
Despite a historic reduction in population size as a result of subsistence hunting <strong>and</strong> commercial<br />
harvest, the NZ sea lion population does not display low genetic diversity at microsatellite loci <strong>and</strong><br />
thus does not appear to have suffered effects of genetic drift <strong>and</strong> inbreeding depression (Robertson<br />
<strong>and</strong> Chilvers 2011).<br />
3.2.6. Conservation biology <strong>and</strong> threat classification<br />
Threat classification is an established approach for identifying species at risk of extinction (IUCN<br />
2010). The risk of extinction for NZ sea lions has been assessed under two threat classification<br />
systems, the International Union for the Conservation of Nature (IUCN) Red List of Threatened<br />
Species (IUCN 2010) <strong>and</strong> the New Zeal<strong>and</strong> Threat Classification System (Townsend et al. 2008).<br />
In 2008, the IUCN updated the Red List status of NZ sea lions, listing them as Vulnerable, A3b 6 on<br />
the basis of a marked (30%) decline in pup production in the last 10 years, at some of the major<br />
rookeries (Gales 2008). The IUCN further recommended that the species should be reviewed within a<br />
decade in light of what they considered to be the current status of NZ sea lions (i.e., declining pup<br />
production, reducing population size, severe disease outbreaks).<br />
In 2010, DOC updated the New Zeal<strong>and</strong> Threat Classification status of all NZ marine mammals<br />
(Baker et al. 2010). In the revised list, NZ sea lions had their threat classification increased from At<br />
Risk, Range Restricted 7 to Nationally Critical under criterion C 8 with a Range Restricted qualifier<br />
based on the recent rate of decline (Baker et al. 2010).<br />
6 A taxon is listed as ‘Vulnerable’ if it is considered to be facing a high risk of extinction in the wild. A3b refers<br />
to a reduction in population size (A), based on a reduction of ≥ 30% over the last 10 years or three generations<br />
(whichever is longer up to a maximum of 100 years (3); <strong>and</strong> when considering an index of abundance that is<br />
appropriate to the taxon (b; IUCN 2010).<br />
7 A taxon is listed as ‘Range Restricted’ if it is confined to specific substrates, habitats or geographic areas of<br />
less than 1000 km 2 (100 000 ha); this is assessed by taking into account the area of occupied habitat of all subpopulations<br />
(Townsend et al. 2008).<br />
8 A taxon is listed as ‘Nationally Critical’ under criterion C if the population (irrespective of size or number of<br />
sub-populations) has a very high (rate of) ongoing or predicted decline; greater than 70% over 10 years or three<br />
generations, whichever is longer (Townsend et al. 2008).<br />
24
AE&B <strong>Review</strong>: Protected species: Sea lions<br />
3.3. Global underst<strong>and</strong>ing of fisheries interactions<br />
<strong>Review</strong>s of fisheries interactions among pinnipeds globally can be found in Read et al. 2006,<br />
Woodley <strong>and</strong> Lavigne (1991), Katsanevakis (2008) <strong>and</strong> Moore et al. (2009). Because NZ sea lions are<br />
endemic to New Zeal<strong>and</strong>, the global underst<strong>and</strong>ing of fisheries interactions for this species is outlined<br />
under state of knowledge in New Zeal<strong>and</strong>. For related information on fishing interactions for NZ fur<br />
seals, both within New Zeal<strong>and</strong> <strong>and</strong> overseas, see the NZ fur seal chapter.<br />
3.4. State of knowledge in New Zeal<strong>and</strong><br />
NZ sea lions interact with trawl fisheries resulting in incidental bycatch, specifically from animals<br />
being caught <strong>and</strong> drowned in the trawl nets. These interactions are largely confined to trawl fisheries<br />
in Sub-Antarctic waters (Figure 3.1); particularly the Auckl<strong>and</strong> Isl<strong>and</strong>s arrow squid fishery (SQU6T),<br />
but also the Auckl<strong>and</strong> Isl<strong>and</strong>s scampi fishery (SCI6A), other Auckl<strong>and</strong> Isl<strong>and</strong>s trawl fisheries, the<br />
Campbell Isl<strong>and</strong> southern blue whiting (Micromesistius australis) fishery (SBW6I) <strong>and</strong> the Stewart-<br />
Snares shelf fisheries targeting mainly arrow squid (SQU1T; Thompson <strong>and</strong> Abraham 2010,<br />
Thompson et al. 2011, Thompson et al. <strong>2012</strong>). 9<br />
NZ sea lions forage to depths of up to 600 m (Table 3.1), within the habitat where depth ranges for<br />
prey species range from 0–500 m for arrow squid, 250–600 m for spawning southern blue whiting <strong>and</strong><br />
350–550 m for scampi (Tuck 2009, Ministry of Fisheries 2011). There is seasonal variation in the<br />
distribution overlap between NZ sea lions <strong>and</strong> the target species fisheries (Table 3.3). Breeding male<br />
sea lions, breeding ashore between November <strong>and</strong> January with occasional trips to sea, then migrate<br />
away from the Auckl<strong>and</strong> isl<strong>and</strong> area (Robertson et al. 2006). Breeding females are in the Auckl<strong>and</strong><br />
isl<strong>and</strong> area year round, ashore to give birth for up to 10 days during December <strong>and</strong> January <strong>and</strong> then<br />
dividing their time between foraging at sea (~2days) <strong>and</strong> suckling their pup ashore (~1.5 days;<br />
Chilvers et al. 2005a).The SQU6T fishery currently operates between February <strong>and</strong> July, peaking<br />
between February <strong>and</strong> May, whereas the SQU1T fishery operates between December <strong>and</strong> May,<br />
peaking between January <strong>and</strong> April, before the squid spawn. The SBW6I fishery operates in August<br />
<strong>and</strong> September, peaking in the latter month, when the fish aggregate to spawn. The SCI6A fishery<br />
may operate at any time of the year but does not operate continuously.<br />
3.4.1. Quantifying fisheries interactions<br />
Since 1988, the level of NZ sea lion bycatch has been monitored by government observers aboard a<br />
proportion of the fishing fleet in the SQU6T fishery (Wilkinson et al. 2003), generally amounting to<br />
around 20–40% observer coverage between 1995 <strong>and</strong> 2010 but reaching almost 100% during the<br />
2001/02 season (see Table 3.4). Over the same period, there has also been 1–15% observer coverage<br />
for non-squid trawl fisheries operating around the Auckl<strong>and</strong> Isl<strong>and</strong>s (primarily targeting scampi, but<br />
also jack mackerel, orange roughy <strong>and</strong> hoki), 20–60% observer coverage in the Campbell Isl<strong>and</strong><br />
southern blue whiting fishery, <strong>and</strong> 8–43% observer coverage for the Stewart-Snares shelf trawl<br />
fisheries (primarily targeting squid, but also hoki, jack mackerel <strong>and</strong> barracouta; Table 3.4).<br />
Unobserved trips have tended to report NZ sea lion captures at a lower rate than observed trips across<br />
all observed fisheries. Fishers reported 177 NZ sea lion captures between 1998–99 <strong>and</strong> 2008–09,<br />
while observers reported 196 captures over the same period (Abraham <strong>and</strong> Thompson 2011).<br />
Observers observed an overall average of 4.7–11.2% of trawl tows each year over this time period,<br />
but fisheries where most sea lions are caught had higher observer coverage.<br />
9 See the Report from the Fisheries Assessment Plenary, May 2011 (Ministry of Fisheries 2011) for further<br />
information regarding the biology <strong>and</strong> stock assessments for these species.<br />
25
AE&B <strong>Review</strong>: Protected species: Sea lions<br />
Table 3.3: Monthly distribution of NZ sea lion activity <strong>and</strong> the main trawl fisheries with observed reports of NZ sea<br />
lion incidental captures (see text for details).<br />
NZ sea lions Sep Oct Nov Dec Jan Feb Mar Apr May Jun Jul Aug<br />
Breeding males<br />
Breeding<br />
females<br />
Dispersed at sea<br />
or at haulouts<br />
At sea<br />
At breeding colony Dispersed at sea or at haulouts<br />
At breeding<br />
colony<br />
26<br />
At breeding colony <strong>and</strong> at-sea foraging <strong>and</strong> suckling<br />
Pups At sea At breeding colony<br />
Non-breeders Dispersed at sea, at haulouts, or breeding colony periphery<br />
Major fisheries Sep Oct Nov Dec Jan Feb Mar Apr May Jun Jul Aug<br />
Squid Stewart-<br />
Snares Shelf<br />
Southern blue<br />
whiting<br />
Pukaki Rise <strong>and</strong><br />
Campbell Rise<br />
Auckl<strong>and</strong> Isl<strong>and</strong>s <strong>and</strong><br />
Stewart-Snares Shelf<br />
Scampi Auckl<strong>and</strong> Isl<strong>and</strong>s<br />
Auckl<strong>and</strong><br />
Isl<strong>and</strong>s<br />
Bounty<br />
Isl<strong>and</strong>s<br />
The number of NZ sea lion captures reported by observers has been incorporated in increasingly<br />
sophisticated models to estimate the total number of captures across the entire fishing fleet in each<br />
fishing year (Smith <strong>and</strong> Baird 2007b, Thompson <strong>and</strong> Abraham 2010, Abraham <strong>and</strong> Thompson 2011).<br />
This approach is currently applied using information collected under DOC project INT<strong>2012</strong>-01 <strong>and</strong><br />
analysed under MPI project PRO2010-01 (Thompson et al. 2011, Thompson et al. <strong>2012</strong>). Estimates in<br />
Table 3.4 for the SQU6T <strong>and</strong> Campbell Isl<strong>and</strong> fisheries were generated using Bayesian models,<br />
whereas those for the Stewart-Snares <strong>and</strong> the Auckl<strong>and</strong> Isl<strong>and</strong>s scampi <strong>and</strong> Auckl<strong>and</strong> Isl<strong>and</strong>s other<br />
fisheries were generated using ratio estimates (Thompson et al. <strong>2012</strong>). Captures comprise the number<br />
of NZ sea lions brought on deck (both dead <strong>and</strong> alive), <strong>and</strong> necessarily exclude the unknown fraction<br />
of animals that exit trawls through Sea Lion Exclusion Devices (SLEDs) as well as those that were<br />
decomposed upon capture or that climbed aboard vessels (Smith <strong>and</strong> Baird 2007b, Thompson <strong>and</strong><br />
Abraham 2010 Thompson et al. 2011). Only 8 of the 248 captures from 1995/96 to 2008/09 were<br />
released alive (Thompson <strong>and</strong> Abraham 2010). Interactions are defined as the number of sea lion that<br />
would have been caught if no SLEDs were used (Thompson et al. <strong>2012</strong>).<br />
In the years since SLEDs were introduced in the SQU6T fishery, both the observed <strong>and</strong> estimated<br />
numbers of NZ sea lion captures have declined overall, except for a slight increase in 2009/10 (Table<br />
3.4). Conversely, for those other fisheries where SLEDs are not deployed, observed <strong>and</strong> estimated<br />
numbers of NZ sea lion captures increased in the Campbell Isl<strong>and</strong> southern blue whiting fishery to a<br />
peak in 2010 (Table 3.4). For the Stewart-Snares <strong>and</strong> the Auckl<strong>and</strong> Isl<strong>and</strong>s non-squid fisheries, the<br />
observed <strong>and</strong> estimated numbers of NZ sea lion captures have fluctuated without trend (Table 3.4).<br />
Capture rate is defined as the number of NZ sea lions caught per 100 tows. Strike rate is defined as the<br />
number of NZ sea lions that would be caught per 100 tows if no SLEDs were fitted. Models indicate<br />
that the interaction rate of female NZ sea lions (equivalent to the capture rate were no SLEDs fitted) is<br />
influenced by a number of factors including year, distance from rookery, tow duration, <strong>and</strong> change of<br />
tow direction (Smith <strong>and</strong> Baird 2005). Conversely, the interaction rate of male NZ sea lions is
AE&B <strong>Review</strong>: Protected species: Sea lions<br />
influenced by year, the number of days into the fishery (males leave the rookeries soon after mating<br />
whereas females remain with the pups), <strong>and</strong> time of day (Smith <strong>and</strong> Baird 2005).<br />
Figure 3.1: Distribution of trawl fishing effort <strong>and</strong> observed NZ sea lion captures, 2002-03 to 2010-11<br />
(http://data.dragonfly.co.nz/psc/). Fishing effort is mapped into 0.2-degree cells, with the colour of each cell being<br />
related to the amount of effort. Observed fishing events are indicated by black dots, <strong>and</strong> observed captures are<br />
indicated by red dots. Fishing is only shown if the effort could be assigned a latitude <strong>and</strong> longitude, <strong>and</strong> if there were<br />
three or more vessels fishing within a cell. In this case, 96.0% of the effort is shown.<br />
27
AE&B <strong>Review</strong>: Protected species: Sea lions<br />
Table 3.4a: Effort, observed <strong>and</strong> estimated NZ sea lion captures in trawl fisheries by fishing year in the New Zeal<strong>and</strong> EEZ (http://data.dragonfly.co.nz/psc/). For each fishing year,<br />
the table gives the the total number of tows; the observer coverage (the percentage of tows that were observed); the number of observed captures (both dead <strong>and</strong> alive); the capture<br />
rate (captures per hundred tows); the estimation method used (model, ratio or both combined); the mean number of estimated total captures (with 95% confidence interval); the<br />
mean number of estimated total interactions (with 95% confidence interval), <strong>and</strong> the stike rate (interactions per hundred tows). For more information on the methods used to<br />
prepare the data, see Thompson et al. (<strong>2012</strong>).<br />
Fishing year Fishing effort<br />
Observed captures<br />
28<br />
Estimated captures<br />
Estimated interations<br />
Estimatedstrike rate<br />
All effort % obs Number Rate Method Mean 95% c.i. Mean 95% c.i. Mean 95% c.i.<br />
Trawl fisheries<br />
1995–96 10 081 10<br />
16 1.5<br />
Both 148 85–242<br />
148 85–243<br />
1.5 0.8–2.4<br />
1996–97 10 941 15<br />
28 1.7<br />
Both 155 104–221<br />
155 102–225<br />
1.4 0.9–2.1<br />
1997–98 9 964 14<br />
14 1.0<br />
Both 76 47–119<br />
76 45–121<br />
0.8 0.5–1.2<br />
1998–99 10 551 16<br />
6 0.4<br />
Both 33 20–49<br />
33 19–50<br />
0.3 0.2–0.5<br />
1999–00 9 043 22<br />
28 1.4<br />
Both 88 63–129<br />
89 59–130<br />
1.0 0.7–1.4<br />
2000–01 8 910 40<br />
46 1.3<br />
Both 61 52–72<br />
83 59–111<br />
0.9 0.7–1.2<br />
2001–02 9 945 19<br />
23 1.2<br />
Both 64 46–88<br />
94 61–139<br />
0.9 0.6–1.4<br />
2002–03 8 308 19<br />
11 0.7<br />
Both 34 22–48<br />
62 37–97<br />
0.7 0.4–1.2<br />
2003–04 10 033 23<br />
21 0.9<br />
Both 61 43–85<br />
214 120–376<br />
2.1 1.2–3.7<br />
2004–05 11 109 23<br />
14 0.5<br />
Both 53 36–77<br />
181 94–325<br />
1.6 0.8–2.9<br />
2005–06 9 316 21<br />
14 0.7<br />
Both 52 35–75<br />
174 86–334<br />
1.9 0.9–3.6<br />
2006–07 6 728 24<br />
15 0.9<br />
Both 47 32–66<br />
118 59–235<br />
1.8 0.9–3.5<br />
2007–08 6 545 33<br />
8 0.4<br />
Both 29 18–42<br />
118 35–418<br />
1.8 0.5–6.4<br />
2008–09 6 677 27<br />
3 0.2<br />
Both 22 12–36<br />
103 25–383<br />
1.5 0.4–5.7<br />
2009–10 5 541 34<br />
15 0.8<br />
Both 46 32–66<br />
141 51–439<br />
2.5 0.9–7.9<br />
2010–11 6 389 31 6 0.3 Both 29 17–43<br />
81 26–259<br />
1.3 0.4–4.1<br />
Auckl<strong>and</strong> Isl<strong>and</strong>s squid<br />
1995–96 4 467 12<br />
13 2.4<br />
Model 131 69–226<br />
131 67–224<br />
2.9 1.6–5.0<br />
1996–97 3 716 19<br />
28 3.9<br />
Model 142 91–208<br />
142 89–210<br />
3.8 2.6–5.5<br />
1997–98 1 441 22<br />
13 4.2<br />
Model 60 33–102<br />
60 31–104<br />
4.2 2.5–6.9<br />
1998–99 402 38<br />
5 3.2<br />
Model 14 5–27<br />
15 5–29<br />
3.6 2.1–5.9<br />
1999–00 1 206 36<br />
25 5.7<br />
Model 69 45–107<br />
69 42–108<br />
5.8 4.0–8.6<br />
2000–01 583 99<br />
39 6.7<br />
Model 39 39–40<br />
61 39–87<br />
10.4 8.6–13.1<br />
2001–02* 1 648 34<br />
21 3.7<br />
Model 43 30–64<br />
73 43–116<br />
4.4 3.0–6.6<br />
2002–03 1 470 29<br />
11 2.6<br />
Model 19 13–29<br />
48 24–81<br />
3.2 2.0–5.1<br />
2003–04 2 594 30<br />
16 2.0<br />
Model 41 26–62<br />
194 100–356<br />
7.5 4.0–13.5<br />
2004–05^ 2 706 30<br />
9 1.1<br />
Model 31 17–51<br />
159 73–303<br />
5.9 2.7–11.1<br />
2005–06 2 462 28<br />
9 1.3<br />
Model 28 15–45<br />
149 62–308<br />
6.0 2.7–12.5<br />
2006–07 1 320 41<br />
7 1.3<br />
Model 16 9–27<br />
87 29–201<br />
6.6 2.3–14.8<br />
2007–08 1 265 46<br />
5 0.9<br />
Model 12 6–21<br />
101 19–396<br />
8.0 1.6–30.9<br />
2008–09 1 925 40<br />
2 0.3<br />
Model 8 3–17<br />
89 12–365<br />
4.6 0.7–18.4<br />
2009–10 1 190 25<br />
3 1.0<br />
Model 13 5–27<br />
107 18–402<br />
9.0 1.7–33.6<br />
2010–11 1 586 34 0 – Model 4 0–11<br />
56 4–233<br />
3.5 0.4–14.9<br />
* SLEDs introduced. ^ SLEDs st<strong>and</strong>ardised <strong>and</strong> in widespread use.
AEBAR <strong>2012</strong>: Protected species: Sea lions<br />
Table 3.4b: Effort, observed <strong>and</strong> estimated NZ sea lion captures in trawl fisheries by fishing year in the New Zeal<strong>and</strong><br />
EEZ (http://data.dragonfly.co.nz/psc/). For each fishing year, the table gives the the total number of tows; the<br />
observer coverage (the percentage of tows that were observed); the number of observed captures (both dead <strong>and</strong><br />
alive); the capture rate (captures per hundred tows or per thous<strong>and</strong> hooks); the estimation method used (model, ratio<br />
or both combined); <strong>and</strong> the mean number of estimated total captures (with 95% confidence interval). For more<br />
information on the methods used to prepare the data, see Thompson et al. (<strong>2012</strong>).<br />
Fishing year Fishing effort Observed captures Estimated captures<br />
All effort % obs Number Rate Method Mean 95% c.i.<br />
Auckl<strong>and</strong> Isl<strong>and</strong>s scampi<br />
1995-96 1 303 5<br />
2 3.2<br />
Ratio 11 4–19<br />
1996-97 1 222 15<br />
0 -<br />
Ratio 7 2–15<br />
1997-98 1 107 11<br />
0 -<br />
Ratio 7 1–15<br />
1998-99 1 254 2<br />
0 -<br />
Ratio 9 2–18<br />
1999-00 1 383 5<br />
0 -<br />
Ratio 9 3–18<br />
2000-01 1 417 6<br />
4 4.8<br />
Ratio 14 7–23<br />
2001-02 1 604 9<br />
0 -<br />
Ratio 10 3–20<br />
2002-03 1 351 11<br />
0 -<br />
Ratio 9 2–17<br />
2003-04 1 363 12<br />
3 1.8<br />
Ratio 12 5–20<br />
2004-05 1 275 0<br />
NA NA<br />
Ratio 9 3–18<br />
2005-06 1 331 9<br />
1 0.9<br />
Ratio 10 3–18<br />
2006-07 1 328 7<br />
1 1.1<br />
Ratio 10 4–19<br />
2007-08 1 327 7<br />
0 -<br />
Ratio 9 2–18<br />
2008-09 1 457 4<br />
1 1.6<br />
Ratio 11 4–21<br />
2009-10 940 10<br />
0 -<br />
Ratio 6 1–13<br />
2010-11<br />
Auckl<strong>and</strong> Isl<strong>and</strong>s other<br />
1 401 15 0 - Ratio 9 2–17<br />
1995-96 405 6<br />
1 4.0<br />
Ratio 3 1–6<br />
1996-97 296 4<br />
0 -<br />
Ratio 1 0–4<br />
1997-98 684 17<br />
1 0.9<br />
Ratio 3 1–8<br />
1998-99 525 10<br />
1 1.8<br />
Ratio 3 1–7<br />
1999-00 750 13<br />
0 -<br />
Ratio 3 0–8<br />
2000-01 577 7<br />
0 -<br />
Ratio 2 0–7<br />
2001-02 589 4<br />
0 -<br />
Ratio 2 0–7<br />
2002-03 543 13<br />
0 -<br />
Ratio 2 0–7<br />
2003-04 289 17<br />
0 -<br />
Ratio 1 0–4<br />
2004-05 170 7<br />
0 -<br />
Ratio 1 0–3<br />
2005-06 39 15<br />
0 -<br />
Ratio 0 0–1<br />
2006-07 38 5<br />
0 -<br />
Ratio 0 0–1<br />
2007-08 147 45<br />
0 -<br />
Ratio 0 0–2<br />
2008-09 121 50<br />
0 -<br />
Ratio 0 0–2<br />
2009-10 77 66<br />
0 -<br />
Ratio 0 0–1<br />
2010-11 131 37 0 - Ratio 0 0–2<br />
29
AEBAR <strong>2012</strong>: Protected species: Sea lions<br />
Table 3.4c: Effort, observed <strong>and</strong> estimated NZ sea lion captures in trawl fisheries by fishing year (calendar year for<br />
SBW) in the New Zeal<strong>and</strong> EEZ (http://data.dragonfly.co.nz/psc/). For each fishing year, the table gives the the total<br />
number of tows; the observer coverage (the percentage of tows that were observed); the number of observed captures<br />
(both dead <strong>and</strong> alive); the capture rate (captures per hundred tows or per thous<strong>and</strong> hooks); the estimation method<br />
used (model, ratio or both combined); <strong>and</strong> the mean number of estimated total captures (with 95% confidence<br />
interval). For more information on the methods used to prepare the data, see Thompson et al. (<strong>2012</strong>).<br />
Fishing year Fishing effort Observed captures Estimated captures<br />
All effort % observed Number Rate Type Mean 95% c.i.<br />
Campbell Isl<strong>and</strong> SBW<br />
1996 474 27<br />
0 - Model 0 0–4<br />
1997 641 34<br />
0 - Model 1 0–3<br />
1998 963 28<br />
0 - Model 1 0–5<br />
1999 788 28<br />
0 - Model 1 0–5<br />
2000 447 52<br />
0 - Model 0 0–3<br />
2001 672 60<br />
0 - Model 0 0–2<br />
2002 980 28<br />
1 0.4 Model 4 1–11<br />
2003 599 43<br />
0 - Model 1 0–3<br />
2004 690 34<br />
1 0.4 Model 3 1–9<br />
2005 726 37<br />
2 0.7 Model 5 2–12<br />
2006 521 28<br />
3 2.1 Model 10 3–21<br />
2007 544 32<br />
6 3.5 Model 15 6–29<br />
2008 557 41<br />
2 0.9 Model 8 5–14<br />
2009 627 20<br />
0 - Model 1 0–7<br />
2010 550 43<br />
11 4.7 Model 24 15–36<br />
2011 815 40 6 1.8 Model 15 8–25<br />
Stewart-Snares (mainly squid)<br />
1995-96 3432 8<br />
0 -<br />
Ratio 3 0–7<br />
1996-97 5066 10<br />
0 -<br />
Ratio 4 0–9<br />
1997-98 5769 10<br />
0 -<br />
Ratio 5 1–10<br />
1998-99 7582 16<br />
0 -<br />
Ratio 6 1–13<br />
1999-00 5257 23<br />
3 0.3<br />
Ratio 7 3–12<br />
2000-01 5661 43<br />
3 0.1<br />
Ratio 6 3–10<br />
2001-02 5124 18<br />
1 0.1<br />
Ratio 5 1–10<br />
2002-03 4345 16<br />
0 -<br />
Ratio 3 0–8<br />
2003-04 5097 21<br />
1 0.1<br />
Ratio 5 1–10<br />
2004-05 6232 24<br />
3 0.2<br />
Ratio 7 4–13<br />
2005-06 4963 19<br />
1 0.1<br />
Ratio 5 1–10<br />
2006-07 3498 24<br />
1 0.1<br />
Ratio 4 1–7<br />
2007-08 3249 36<br />
1 0.1<br />
Ratio 3 1–7<br />
2008-09 2547 31<br />
0 -<br />
Ratio 2 0–5<br />
2009-10 2784 43<br />
1 0.1<br />
Ratio 3 1–6<br />
2010-11 2456 36 0 - Ratio 1 0–4<br />
3.4.2. Managing fisheries interactions<br />
For NZ sea lions, efforts to mitigate fisheries bycatch have focused on the SQU6T fishery. Spatial<br />
<strong>and</strong>/or temporal closures have been put in place, SLEDs were developed by industry, codes of<br />
practice were introduced, <strong>and</strong> mortality limits imposed. In 1982 the Minister of Fisheries established a<br />
12 nautical mile exclusion zone around the Auckl<strong>and</strong> Isl<strong>and</strong>s from which all fishing activities were<br />
excluded (Wilkinson et al. 2003). In 1995, the exclusion zone was replaced with a Marine Mammal<br />
Sanctuary with the same controls on fishing (Chilvers 2008). The area was subsequently also<br />
designated as a Marine Reserve in 2003. In addition to these area-based measures, mitigation devices<br />
in the form of SLEDs were introduced in the SQU6T fishing fleet in 2001/02 (Figure 3.2), with<br />
widespread <strong>and</strong> st<strong>and</strong>ardised use by all the fleet since 2004/05. The use of SLEDs is not m<strong>and</strong>atory,<br />
but is required by the current industry body (the Deepwater Group), fleet wide in application <strong>and</strong><br />
monitored by MPI observers. In 1992, the Ministry adopted a fisheries-related mortality limit (FRML;<br />
previously referred to as a maximum allowable level of fisheries-related mortality or MALFiRM) to<br />
set an upper limit on the number of NZ sea lions that could be incidentally drowned each year in the<br />
30
AEBAR <strong>2012</strong>: Protected species: Sea lions<br />
SQU6T trawl fishery (Chilvers 2008). If this limit is reached, the fishery may be m<strong>and</strong>atorily closed<br />
for the remainder of the season. This has happened seven times (1996 to1998, 2000, <strong>and</strong> 2002 to<br />
2004) since this plan was first adopted in 1993 (Table 3.5; Robertson <strong>and</strong> Chilvers 2011).<br />
Figure 3.2: Diagram of a NZ sea lion exclusion device (SLED) inside a trawl net. Image courtesy of the Deepwater<br />
Group.<br />
Before the widespread use of SLEDs, NZ sea lions incidentally caught during fishing were usually<br />
retained in trawl nets <strong>and</strong> hauled on board, allowing observers to gain an accurate assessment of the<br />
number of NZ sea lions being captured on observed tows in a given fishery. This enabled a relatively<br />
simple estimation of the total number of NZ sea lions killed. However, following the introduction of<br />
SLEDs, the number of NZ sea lions interacting with SLEDs <strong>and</strong> the proportion of those surviving are<br />
much more difficult to estimate. Since the introduction of SLEDs, therefore, it has become necessary<br />
to estimate the number of NZ sea lions interacting with trawls using a predetermined strike rate to<br />
monitor performance against any bycatch limits set. Using a predetermined strike rate enables the<br />
FRML to be converted into a number of tows for management purposes. The rate of 5.65% assumed<br />
by MPI for the SQU6T fishery is based on rates observed on vessels without SLEDs from 2003/04 to<br />
2005/06 <strong>and</strong> is also assumed as part of the fishery implementation within an integrated management<br />
procedure evaluation model (named the BFG model after its authors, see section 3.3.3). A strike rate<br />
of 5.89 will be assumed for the <strong>2012</strong>-13 season, reflecting a slight increase in the long-term average.<br />
The most recent strike rates are given in Table 3.4 (Thompson et al. <strong>2012</strong>).<br />
The current management regime for the SQU6T fishery provides for a “discounted” strike rate to<br />
apply to all tows when an approved SLED is used (because SLEDs allow some NZ sea lions to escape<br />
<strong>and</strong> survive their encounters with trawl nets; Thompson <strong>and</strong> Abraham 2010, see Table 3.5). The<br />
SLED discount rate is a fisheries management setting <strong>and</strong> should not be confused with the actual<br />
survival of NZ sea lions that encounter a trawl equipped with a SLED, but the discount mechanism is<br />
31
AEBAR <strong>2012</strong>: Protected species: Sea lions<br />
duplicated in the BFG simulations. The current discount rate of 82% means that the strike rate is<br />
reduced from 5.89% to 1.06% so that, for every 100 tows using an approved SLED, 1.06 NZ sea lions<br />
are presumed killed. Ideally, the discount rate would be equal to the survival rate of NZ sea lions that<br />
encounter a trawl in circumstances that would be fatal if no SLED were fitted. This survival rate is the<br />
product of the proportion of animals that exit a trawl with a SLED <strong>and</strong> their post-exit survival.<br />
Table 3.5: Maximum allowable level of fisheries-related mortality (MALFiRM) or fisheries-related mortality limit<br />
(FRML) from 1991 to 2013. Note, however, that direct comparisons among years of the limits in Table 3.5 are not<br />
possible because the assumptions underlying the MALFiRM or FRML changed over time.<br />
Year MALFiRM or Discount Management actions<br />
FRML rate<br />
1991/92 16 (female only)<br />
1992/93 63<br />
1993/94 63<br />
1994/95 69<br />
1995/96 73 Fishery closed by MFish (4 May)<br />
1996/97 79 Fishery closed by MFish (28 March)<br />
1997/98 63 Fishery closed by MFish (27 March)<br />
1998/99 64<br />
1999/00 65 Fishery closed by MFish (8 March)<br />
2000/01 75 Voluntary withdrawal by industry<br />
2001/02 79 Fishery closed by MFish (13April)<br />
2002/03 70 Fishery closed by MFish (29 March), overturned by High Court<br />
2003/04 62 (124) 20% Fishery closed by MFish (22 March), overturned by High Court FRML increased<br />
2004/05 115 20% Voluntary withdrawal by industry on reaching the FRML<br />
2005/06 97 (150) 20% FRML increased in mid-March due to abundance of squid<br />
2006/07 93 20%<br />
2007/08 81 35%<br />
2008/09 113 (95) 35% Lower interim limit agreed due to the decrease in pup numbers<br />
2009/10 76 35%<br />
2010/11 68 35%<br />
2011/12 68 35%<br />
<strong>2012</strong>/13 68 82%<br />
In 2004, the Minister of Fisheries requested that the squid fishery industry organisation (Squid Fishery<br />
Management Company), government agencies <strong>and</strong> other stakeholders with an interest in sea lion<br />
conservation work collaboratively to develop a plan of action to determine SLED efficacy. In<br />
response, an independently chaired working group (the SLED Working Group) was established to<br />
develop an action plan to determine the efficacy of SLEDs, with a particular focus on the survivability<br />
of NZ sea lions that exit the nets via the exit hole in the SLED. The group undertook a number of<br />
initiatives, most notably the st<strong>and</strong>ardisation of SLED specifications (including grid spacing) across<br />
the fleet (Clement <strong>and</strong> Associates Ltd. 2007) <strong>and</strong> the establishment of an underwater video monitoring<br />
programme to help underst<strong>and</strong> what happens when a NZ sea lion exits a SLED. White light <strong>and</strong> infrared<br />
illuminators were tested. Sea lions were observed outside the net on a number of occasions, but<br />
only one fur seal <strong>and</strong> one NZ sea lion were observed exiting the net via the SLED (on tows when<br />
white light illumination was used). The footage contributed to underst<strong>and</strong>ing of SLED performance,<br />
but established that video monitoring was only suitable for tows using mid water gear, as the camera<br />
view was often obscured on tows where bottom gear was used. The SLED Working Group was<br />
disb<strong>and</strong>ed in early 2010.<br />
The original “MALFiRM” was calculated using the potential biological removal approach (PBR;<br />
Wade 1998) <strong>and</strong> was used from 1992/93 to 2003/04 (Smith <strong>and</strong> Baird 2007a). Since 2003/04 the<br />
FRML has been translated into a maximum permitted number of tows after which the SQU6T fishing<br />
32
AEBAR <strong>2012</strong>: Protected species: Sea lions<br />
season may be halted by the Minister regardless of the observed NZ sea lion mortality. This approach<br />
has been taken because NZ sea lion mortality can no longer be monitored directly since the<br />
introduction of SLEDs.<br />
3.4.3. Modelling population-level impacts of fisheries interactions<br />
The population-level impact of fisheries interactions has been assessed for the Auckl<strong>and</strong> Isl<strong>and</strong>s via a<br />
management procedure evaluation model for the SQU6T fishery (see below). The impact of fisheries<br />
interactions for all NZ sea lion populations (<strong>and</strong> other marine mammal populations) will be assessed<br />
as part of the marine mammal risk assessment project (PRO<strong>2012</strong>-02). The goal of this project is to<br />
assess the risk posed to marine mammal populations from New Zeal<strong>and</strong> fisheries by applying a<br />
similar approach to the recent seabird risk assessment (Richard et al. 2011). In this approach, risk is<br />
defined as the ratio of total estimated annual fatalities due to bycatch in fisheries, to the level of PBR<br />
(Wade 1998). The results of this project should be available in 2014.<br />
Since 2000, an integrated Bayesian management procedure evaluation model having both population<br />
<strong>and</strong> fishery components has been used to assess the likely performance of a variety of management<br />
control rules, each of which can be used to determine the FRML for a given SQU6T season (Breen et<br />
al. 2003, Breen <strong>and</strong> Kim 2006a, Breen <strong>and</strong> Kim 2006b, <strong>and</strong> Breen, Fu <strong>and</strong> Gilbert 2010). The model<br />
underwent several iterations. An early version, developed in 2000/01, was a relatively simple<br />
deterministic, partially age-structured population model with density-dependence applied to pup<br />
production (Breen et al. 2003). An updated version called the Breen-Kim model was built in 2003 to<br />
render it fully age-structured <strong>and</strong> to incorporate various datasets supplied by DOC (Breen <strong>and</strong> Kim<br />
2006a, 2006b). This model was further revised in 2007/08 to incorporate the latest NZ sea lion<br />
population data <strong>and</strong> to address various model uncertainties <strong>and</strong> called the BFG model (after its<br />
authors, Breen, Fu <strong>and</strong> Gilbert 2010). In 2009, the model was again updated to incorporate the low<br />
NZ sea lion pup counts observed in 2008/09 (<strong>and</strong> thus better reflect the observed variability in pup<br />
survival <strong>and</strong> pupping rates), as well as NZ sea lion bycatch that occurs in fisheries other than SQU6T.<br />
The BFG model was re-run in 2011 using the same underlying data <strong>and</strong> structure as in 2009 to<br />
evaluate the effect of different model assumptions about the survival of NZ sea lions that exit trawl<br />
nets via SLEDs (see below). Additional details on the NZ sea lion population model can be found in<br />
Breen et al. (2010).<br />
The BFG model incorporates various population dynamics observations (tag re-sighting observations,<br />
pup births <strong>and</strong> mortality, age at maturity) as well as bycatch counts <strong>and</strong> catch-at-age data from the<br />
SQU6T trawl fishery. The model was projected into the future by applying the observed dynamics<br />
<strong>and</strong> a virtual fishery model that is managed in roughly the same way as the real SQU6T fishery. A<br />
large number of projections were run <strong>and</strong> used to assess the likely performance of a wide range of<br />
different management control rules against the four performance criteria described in Context (two<br />
MFish criteria <strong>and</strong> two DOC criteria). For each set of runs the population indicators were summarised<br />
<strong>and</strong> the rules compared in tables. The BFG model is sensitive to several key parameters (see Sources<br />
of uncertainty, below) <strong>and</strong> is scheduled to be reviewed in 2013.<br />
SLEDs are effective in allowing most NZ sea lions to exit a trawl but some are retained <strong>and</strong> drowned<br />
<strong>and</strong> others may not survive the encounter. An experimental approach to assessing non-retained fatality<br />
rate involved intentionally capturing animals as they exited the escape hole of a SLED between<br />
1999/2000 <strong>and</strong> 2002/03. Cover nets were added over the escape holes of some SLEDs <strong>and</strong> sea lions<br />
were restrained in these nets after they exited the SLED proper. An underwater video camera was<br />
deployed in 2001 to assess the behaviour <strong>and</strong> the likelihood of post-exit survival of those animals that<br />
were retained in the cover nets (Wilkinson et al. 2003, Mattlin 2004). The low number of captures<br />
filmed <strong>and</strong> the inability to assess longer term survival meant that this approach could not be used to<br />
determine likely survival rates (e.g., Roe 2010).<br />
33
AEBAR <strong>2012</strong>: Protected species: Sea lions<br />
Necropsies were conducted on animals recovered from the cover net trials <strong>and</strong> on those incidentally<br />
caught <strong>and</strong> recovered from vessels operating in the SQU6T, SQU1T <strong>and</strong> SBW6I fisheries. Although<br />
all of the NZ sea lions returned for necropsy died as a result of drowning rather than physical trauma<br />
(from interactions with the trawl gear including the SLED grid; Roe <strong>and</strong> Meynier 2010, Roe 2010),<br />
necropsies were designed to assess the nature <strong>and</strong> severity of trauma sustained during capture <strong>and</strong> to<br />
infer the survival prognosis had those animals been able to exit the net (Mattlin 2004). However,<br />
problems associated with this approach limited the usefulness of the results. For example, NZ sea<br />
lions were frozen on vessels <strong>and</strong> stored for periods of up to several months before being thawed for 3–<br />
5 days to allow necropsy. Roe <strong>and</strong> Meynier (2010) concluded that this freeze-thaw process created<br />
artefactual lesions that mimic trauma but, particularly in the case of brain trauma, could also obscure<br />
real lesions. Further, two reviews in 2011 concluded that the lesions in retained animals may not be<br />
representative of the injuries sustained by animals that exit a trawl via a SLED (Roe <strong>and</strong> Meynier<br />
2010, Roe 2010). As a result of these reviews, the use of necropsies to infer the survival of sea lions<br />
interacting with SLEDs was discontinued.<br />
Notwithst<strong>and</strong>ing the limitations of the necropsy data in assessing trauma for previously frozen<br />
animals, it was possible to determine that none of the necropsied animals sustained sufficient injuries<br />
to the body (excluding the head) to compromise survival (Roe <strong>and</strong> Meynier 2010, Roe 2010). Head<br />
trauma, most likely due to impacts with the SLED grid, could not be ruled out as a potential<br />
contributing factor (Roe <strong>and</strong> Meynier 2010, Roe 2010). In order to quantify the likelihood of a NZ sea<br />
lion experiencing physical trauma sufficient to render the animal insensible (<strong>and</strong> therefore likely to<br />
drown) after a colliosion with a SLED grid, a number of factors need to be assessed. These include<br />
the likelihood of a head-first impact, the speed of impact, the angle of impact relative to individual<br />
grid bars <strong>and</strong> relative to the grid plane, the location of impact on the grid, head mass, <strong>and</strong> the risk of<br />
brain injury for a given impact speed <strong>and</strong> head mass. The effect of multiple impacts also needs to be<br />
considered. Estimates for each of these factors were derived from a number of sources, including<br />
necropsies (for head mass), video footage of Australian fur seals interacting with Seal Exclusion<br />
Devices (SEDs) (for impact speed, location <strong>and</strong> body orientation) <strong>and</strong> biomechanical modelling of<br />
impacts on the SLED grid (for the risk of brain injury).<br />
In the absence of sufficient video footage of NZ sea lion interacting with SLEDs, footage of fur seals<br />
(thought to be Australian fur seals) interacting with SEDs in the Tasmanian small pelagic mid-water<br />
trawl fishery has been used (Lyle 2011). The SEDs are similar, but not identical, to the New Zeal<strong>and</strong><br />
SLEDs in that both have sloping steel grids to separate the catch from pinnipeds <strong>and</strong> guide the latter<br />
toward an escape hole in the trawl. The angle of slope <strong>and</strong> the number of sections in the steel grids are<br />
variable (either two or three sections, depending on the vessel). Lyle <strong>and</strong> Willcox (2008) conducted a<br />
camera trial between January 2006 <strong>and</strong> February 2007 to assess the efficacy of the SED <strong>and</strong><br />
documented 457 interactions for about 170 individual fur seals. Lyle (2011) reanalysed the footage to<br />
estimate impact speed, impact location across the SED grid <strong>and</strong> body orientation at the time of<br />
impact. The situation faced by NZ sea lions in a squid trawl is not identical to that faced by the fur<br />
seals studied by Lyle <strong>and</strong> co-workers, but these are closely related otariids of similar size <strong>and</strong>, in the<br />
absence of specific data, Australian fur seals are considered a reasonable proxy to estimate impact<br />
speed, impact location <strong>and</strong> body orientation.<br />
The risk of brain injury was assessed by biomechanical testing <strong>and</strong> modelling. Tests using an artificial<br />
“head form” (as used in vehicular “crash test” studies) were used to assess the likelihood of brain<br />
injury to NZ sea lions colliding with a SLED grid (Ponte et al. 2010, 2011). In an initial trial (Ponte et<br />
al. 2010), the head form (weighing 4.8 kg) was launched at three locations on the SLED grid at a<br />
speed of 10 m.s -1 (about 20 knots). This was considered a “worst feasible case” collision representing<br />
the combined velocities of a sea lion swimming with a burst speed of 8 m.s -1 (after Ray 1963, Fish<br />
2008) <strong>and</strong> a net being towed at 2 m.s -1 (about 4 knots). A head injury criterion (HIC, a predictor of the<br />
risk of brain injury) was calculated based on criteria validated against human-vehicle impact studies<br />
<strong>and</strong> translated into the probability of mild traumatic brain injury (MTBI) for a given collision, taking<br />
into account differences between human <strong>and</strong> sea lion head <strong>and</strong> brain masses. MTBI is assumed to<br />
have the potential to lead to insensibility or disorientation <strong>and</strong> subsequent death through drowning for<br />
34
AEBAR <strong>2012</strong>: Protected species: Sea lions<br />
a NZ sea lion experiencing such an injury at depth. Ponte et al. (2010) calculated that a collision at the<br />
stiffest part of the SLED grid at this highest feasible speed had a very high risk of MTBI, especially<br />
for smaller sea lions. This provides an upper bound for the assessment of risk but Ponte et al. (2010)<br />
also imputed risk at speeds below the maximum.<br />
In a follow-up study, after a research advisory group meeting with other experts, Ponte et al. (2011)<br />
tested a wider variety of impact locations on the grid <strong>and</strong> various angles of impact relative to the bars<br />
<strong>and</strong> to the plane of the grid <strong>and</strong> combined these to produce a HIC “map” for a SLED grid. This HIC<br />
map can be used to estimate the risk of MTBI for a collision by a sea lion at any given speed, location,<br />
<strong>and</strong> orientation.<br />
The data collected from the footage of Australian fur seal SED interactions (Lyle 2011) <strong>and</strong> the<br />
biomechanical modelling (Ponte et al. 2010, 2011) were combined in a simulation-based probabilistic<br />
model to estimate the risk of a sea lion suffering a mild traumatic brain injury when striking a SLED<br />
grid (Abraham 2011). The simulation involved selecting an impact location on the SLED grid (from<br />
the fur seal data), selecting a head mass (from NZ sea lion necropsy data) <strong>and</strong> an impact speed (from<br />
the fur seal data), calculating the head impact criterion (HIC) (from the HIC map), scaling the HIC to<br />
the head mass <strong>and</strong> impact speed <strong>and</strong> calculating the expected probability of mild traumatic brain<br />
injury, MTBI. Both 45° <strong>and</strong> 90° degree impacts were considered, with the former, reflecting the angle<br />
of a grid when deployed, adopted as the base case. The head masses used may be at the lower end of<br />
the range of head masses for NZ sea lions. Impact speeds were drawn from the distribution of speeds<br />
observed for fur seals colliding with SEDs (2–6 m.s -1 ) <strong>and</strong> these are broadly consistent with the<br />
combined tow speed <strong>and</strong> observed swimming speeds of NZ sea lions in the wild (Crocker et al. 2001).<br />
Different scaling of HIC values was assessed to gauge sensitivity.<br />
For the base case, the simulation results indicated there was a 3.3% chance of a single head-first<br />
collision resulting in MTBI with a 95 percentile of 15.7% risk of MTBI (Abraham 2011). Sensitivities<br />
modulating single parameters resulted in up to 6.2% probability of a single collision resulting in<br />
MTBI. One sensitivity trial involving changes in multiple parameters resulted in a 10.9% probability<br />
of MTBI. This scenario considered impact speeds 20% above those measured for fur seals, multiple<br />
collisions with the grid, <strong>and</strong> the least favourable values of scaling exponents used in scaling the test<br />
HIC values <strong>and</strong> calculating MTBI from the HIC (Abraham 2011). These results are probabilities of<br />
MTBI resulting from a single head first collision but, because each individual can have multiple<br />
interactions with the grid while in a trawl, <strong>and</strong> some of these will not be head-first, some additional<br />
assumptions were made based on the Australian observations. Using these data, Abraham (2011)<br />
estimated the number of head-first collisions per interaction as 0.74, leading to an estimated<br />
probability of MTBI for a NZ sea lion interacting with a trawl of 2.7%. Single parameter sensitivity<br />
runs increased this to up to 4.6% <strong>and</strong> the multiple parameter sensitivity using the scenario described<br />
above increased it to 8.2% (Abraham 2011). Assuming synergistic interaction between successive<br />
head-first strikes (each collision carrying 5 times more risk than previous ones) did not appreciably<br />
increase the overall risk because few fur seals had multiple head-first collisions. These results indicate<br />
that the risk of mortality for NZ sea lions interacting with the SLED grid is probably low, although<br />
some remaining areas of uncertainty were identified (see below).<br />
3.4.4. Sources of uncertainty<br />
There are several outst<strong>and</strong>ing sources of uncertainty in modelling the effects of fisheries interactions<br />
on NZ sea lions at the Auckl<strong>and</strong> Isl<strong>and</strong>s, including uncertainty relating to the Bayesian management<br />
procedure evaluation model (the BFG model, Breen et al. 2010), uncertainty in the modelling of stike<br />
rate (Thompson et al. 2011) <strong>and</strong> uncertainty relating to the biomechanical modelling (Ponte et al.<br />
2010, 2011, Abraham 2011, Lyle 2011).<br />
35
AEBAR <strong>2012</strong>: Protected species: Sea lions<br />
The BFG model is sensitive to several key parameters. Some relate mostly to uncertainty about the<br />
productivity of the NZ sea lion population (including maximum population growth rate, abundance<br />
relative to carrying capacity, maximum rate of pup production, <strong>and</strong> density dependence), whereas<br />
others relate to how the fishery works <strong>and</strong> is managed (including strike rates <strong>and</strong> the survival of NZ<br />
sea lions that interact with SLEDs but are not retained in the net). Conclusions drawn from the BFG<br />
model results are sensitive to prior assumptions about how fast this NZ sea lion population is able to<br />
grow. The maximum population growth rate (lambda, λ) for this population of NZ sea lions is not<br />
known. Fitting the model to the observed data with an uninformative prior led to an estimated<br />
maximum rate of less than 1% per year, potentially as a consequence of attempting to estimate λ for a<br />
declining population. This is a very low maximum growth rate for a pinniped (some suggest a default<br />
value of 12% per year, Wade 1998), so a prior of 8% was applied to the base model. In a sensitivity<br />
run, the model was fitted using a prior of 5% per year, <strong>and</strong> the results were more consistent with the<br />
observed data than when 8% was used.<br />
The estimated abundance of NZ sea lions relative to the carrying capacity of mature individuals at the<br />
Auckl<strong>and</strong> Isl<strong>and</strong>s (K) is another source of uncertainty. When the model is run in the absence of<br />
fishing, the median numbers of mature animals after 100 years was only 94.4% of K as estimated<br />
from the model. Although the population is not presently near K, over this timescale, the population<br />
would normally be expected to approach K. This is thought to be an artefact of the parameterisation of<br />
survival rates in the model, which renders the model conservative when assessing performance<br />
against K (Breen et al. 2010).<br />
The density dependent response for this population of NZ sea lions is largely unknown, although there<br />
is presently no evidence of a density dependent response in life-history traits such as pup mass, pup<br />
survival or female fecundity (Chilvers <strong>2012</strong>b). Ecological principles suggest that, as numbers in a<br />
population decline, individuals compete less with one another for resources. Less competition may<br />
result in NZ sea lions growing faster as well as having lower mortality rates <strong>and</strong> higher rates of pup<br />
production <strong>and</strong> survival. The effect of this type of response is that populations tend to recover from<br />
events that reduce their numbers, <strong>and</strong> populations with strong density dependence recover more<br />
strongly than those with weak density dependence. In the BFG model, the shape of the density<br />
dependent response was “hard wired” in the model <strong>and</strong> assumed to occur entirely in the mortality rate<br />
of pups. The strength of this response is unknown, <strong>and</strong> there was no information to support a strong<br />
preference for any of the assumed values used in sensitivity runs. This means the base model results<br />
may be either conservative or optimistic.<br />
The maximum rate of pup production for this population is not known but can be estimated in the<br />
population model. Other modelling conducted for DOC (albeit using different assumptions, Breen et<br />
al. 2010) suggests that the maximum rate of pup production is
AEBAR <strong>2012</strong>: Protected species: Sea lions<br />
Table 3.6: Tow duration in the SQU6T fishery (i.e. for trawl fishers targeting SQU in statistical areas 602, 603, 617<br />
<strong>and</strong> 618). Years are calendar years. Data from MPI databases.<br />
No. of Mean tow duration<br />
Percentage of tows<br />
Year<br />
tows<br />
(hours) Less than 4 hours Between 4 & 8 hours More than 8 hours<br />
1995 4 014 3.7 64.2 33.5 2.2<br />
1996 4 474 3.6 64.3 34.2 1.5<br />
1997 3 719 3.8 62.7 33.7 3.7<br />
1998 1 446 3.2 74.4 24.7 0.9<br />
1999 403 3.5 73.0 24.3 2.7<br />
2000 1 213 3.5 70.3 27.0 2.7<br />
2001 583 3.3 72.9 26.6 0.5<br />
2002 1 647 3.8 59.8 38.8 1.4<br />
2003 1 467 4.1 52.4 44.0 3.6<br />
2004 2 598 5.0 36.7 53.6 9.7<br />
2005 2 693 4.7 43.7 48.6 7.7<br />
2006 2 462 6.3 26.0 49.6 24.3<br />
2007 1 317 7.3 18.9 46.3 34.8<br />
2008 1 265 6.2 20.4 58.7 20.9<br />
2009 1 925 6.5 21.1 51.4 27.5<br />
2010 1 190 7.9 16.4 37.4 46.2<br />
2011 1 585 6.8 24.7 42.8 32.4<br />
<strong>2012</strong>* 1 283 6.6 23.5 49.3 27.3<br />
* Includes data up to November 30, <strong>2012</strong>.<br />
There are a number of possible sources of uncertainty relating to the biomechanical modelling (Ponte<br />
et al. 2010, 2011, Abraham 2011, Lyle 2011). The use of linear acceleration, as opposed to rotational<br />
(angular) acceleration, in the biomechanical modelling may underestimate the risk of MTBI, although<br />
this was thought to be accounted for at least in part by sensitivity analysis of the scaling of HIC<br />
values. The testing used an artificial “head form” based on human anatomy, so the effect of NZ sea<br />
lion scalp thickness <strong>and</strong> skull morphology is unknown, although differences in head <strong>and</strong> brain masses<br />
are accounted for. Potential effects of differences in the angle of the head on impact (relative to the<br />
neck) were not tested. Impact speeds, locations <strong>and</strong> orientations of NZ sea lions may differ from those<br />
of Australian fur seals, although the fur seal data were considered to be a reasonable proxy by a<br />
Research Advisory Group. The head mass values used may be lower than average for NZ sea lions;<br />
this would mean risk is likely to be overestimated. This approach assesses risk associated with<br />
collisions with the grid of a SLED <strong>and</strong> cannot be used to assess other sources of mortality resulting,<br />
for example, from an animal being retained in a net long enough for them to exceed their dive limit<br />
before reaching the surface after escaping from either the SLED or the front of the net. Such sources<br />
of cryptic mortality have always existed, are presently unquantified <strong>and</strong> are not reflected in the<br />
estimated overall survival rate of encounters with trawls.<br />
3.4.5. Potential indirect threats<br />
In addition to sources of uncertainty associated with direct fisheries interactions, there is the<br />
possibility that indirect fisheries effects may have population-level consequences for NZ sea lions.<br />
Such indirect effects may include competition for food resources between various fisheries <strong>and</strong> NZ<br />
sea lions (Robertson <strong>and</strong> Chilvers 2011). In order to determine whether resource competition is<br />
present <strong>and</strong> is having a population-level effect on NZ sea lions, research must identify if there are<br />
resources in common for NZ sea lions <strong>and</strong> the various fisheries within the range of NZ sea lions, <strong>and</strong><br />
if those resources are limiting. Diet studies have demonstrated overlap in the species consumed by NZ<br />
sea lions <strong>and</strong> those caught in fisheries within the range of NZ sea lions, particularly hoki <strong>and</strong> arrow<br />
squid (Cawthorn et al. 1985, Childerhouse et al. 2001, Meynier et al. 2009). A recent study focused<br />
on energy <strong>and</strong> amino acid content of prey determined that the selected prey species contained all<br />
37
AEBAR <strong>2012</strong>: Protected species: Sea lions<br />
essential amino acids <strong>and</strong> were of low to medium energy levels (Meynier 2010). This may indicate<br />
that the nutritional content of prey species is not limiting the metabolic activity of NZ sea lions,<br />
although vitamin <strong>and</strong> mineral content were not considered. Meynier (2010) also developed a bioenergetic<br />
model <strong>and</strong> used it to estimate the amount of prey consumed by NZ sea lions at 17 871<br />
tonnes (95% CI 17 738–18 000 t) per year. This is equivalent to ~30% of the tonnage of arrow squid,<br />
<strong>and</strong> ~15% of the hoki harvested annually by the fisheries in the Sub-Antarctic between 2000 <strong>and</strong> 2006<br />
(Meynier 2010). Comparison of the temporal <strong>and</strong> spatial distributions of sea lion prey, sea lion<br />
foraging <strong>and</strong> of historical fishing extractions may help to identify the mechanisms whereby resource<br />
competition might occur (Bowen <strong>2012</strong>). The effects of fishing on sea lion prey species are likely to be<br />
complicated by food web interactions <strong>and</strong> multispecies models may help to assess the extent to which<br />
resource competition can impact on sea lion populations, such as those currently being developed by<br />
NIWA (Project SA123098). In addition, multispecies models may provide a means for simultaneously<br />
assessing multiple drivers of sea lion population change (a review of potential causes is given in<br />
Robertson & Chilvers 2011) which may be a more effective approach than focussing on single factor<br />
explanations for the recent observed decline in NZ sea lions (Bowen <strong>2012</strong>).<br />
38
3.5. Indicators <strong>and</strong> trends<br />
AEBAR <strong>2012</strong>: Protected species: Sea lions<br />
Population size • 12 065 animals (including pups < 1 yr old) at the Auckl<strong>and</strong> Isl<strong>and</strong>s (90% CI:<br />
11 160–13 061) in 2009 (most recent model estimate) 10<br />
• 1 683 pups at the Auckl<strong>and</strong> Isl<strong>and</strong>s (SE = 16) in 2011/12 11<br />
• 681–726 pups at Campbell Isl<strong>and</strong> in 2010 12<br />
• 25 pups tagged at Stewart Isl<strong>and</strong> during a DOC recreational hut <strong>and</strong> track<br />
maintance trip in March <strong>2012</strong><br />
• 5 pups at the Otago Peninsula in 2011/12 13<br />
Population trend • Estimated abundance at the Auckl<strong>and</strong> Isl<strong>and</strong>s:<br />
• Pup production at the Auckl<strong>and</strong> Isl<strong>and</strong>s:<br />
• The population is probably increasing at Campbell Isl<strong>and</strong> based on substantial<br />
increases in pup counts (although methodology has changed over time).<br />
• The population is increasing at the Otago Peninsula through a combination of<br />
reproduction <strong>and</strong> immigration.<br />
10 Breen et al. (2010).<br />
11 Chilvers (<strong>2012</strong>).<br />
12 Robertson <strong>and</strong> Chilvers (2011), Maloney et al. (<strong>2012</strong>).<br />
13 For more information, see: http://www.sealiontrust.org.nz/otago-sea-lion-family-tree/.<br />
39
AEBAR <strong>2012</strong>: Protected species: Sea lions<br />
Threat status • NZ: Nationally Critical, Criterion C 14 , Range Restricted 15 , in 2010 16<br />
• IUCN: Vulnerable, A3b 17 , in 2008 18<br />
Number of<br />
interactions 19<br />
• 81 estimated interactions (95% CI: 26-259) in trawl fisheries in 2010-11<br />
• 29 estimated captures (95% CI: 17-43) in trawl fisheries in 2010-11<br />
• 6 observed captures in trawl fisheries in 2010-11<br />
Trend in interactions Trawl fisheries:<br />
14 A taxon is listed as ‘Nationally Critical’ under criterion C if the population (irrespective of size or number of<br />
sub-populations) has a very high (rate of) ongoing or predicted decline; greater than 70% over 10 years or three<br />
generations, whichever is longer (Townsend et al. 2008).<br />
15 A taxon is listed as ‘Range Restricted’ if it is confined to specific substrates, habitats or geographic areas of<br />
less than 1000 km 2 (100 000 ha); this is assessed by taking into account the area of occupied habitat of all subpopulations<br />
(Townsend et al. 2008).<br />
16 Baker et al. (2010).<br />
17 A taxon is listed as ‘Vulnerable’ if it is considered to be facing a high risk of extinction in the wild. A3b refers<br />
to a reduction in population size (A), based on a reduction of ≥ 30% over the last 10 years or three generations<br />
(whichever is longer up to a maximum of 100 years (3); <strong>and</strong> when considering an index of abundance that is<br />
appropriate to the taxon (b; IUCN 2010).<br />
18 Gales (2008).<br />
19 For more information, see: http://data.dragonfly.co.nz/psc/.<br />
40
3.6. References<br />
AEBAR <strong>2012</strong>: Protected species: Sea lions<br />
Abraham ER (2011). Probability of Mild Traumatic Brain Injury for sea lions interacting with SLEDs. Final Research Report for Ministry of<br />
Fisheries project SRP2011-03 (Unpublished report held by the Ministry of Fisheries, Wellington). 21 pages.<br />
Abraham ER; Thompson FN (2011). Summary of the capture of seabirds, marine mammals, <strong>and</strong> turtles in New Zeal<strong>and</strong> commercial<br />
fisheries, 1998–99 to 2008–09. Final Research Report prepared for Ministry of Fisheries project PRO2007/01. (Unpublished<br />
report held by the Ministry of Fisheries, Wellington.) 170 p.<br />
Anonymous (2009). DWG <strong>and</strong> MFish SLED Specification for SQU 6T 2010 Operation Plan (MK 3/13). Report presented to SLED WG<br />
September 2009, Wellington, NZ.<br />
Augé AA (2006). Terrestrial spatial ecology of female New Zeal<strong>and</strong> sea lions. Unpublished MSc thesis, University of Otago, Dunedin.<br />
Augé AA; Lalas C; Chilvers BL; Davis LS (2011a). Autumn diet of recolonising female New Zeal<strong>and</strong> sea lions based at Otago Peninsula,<br />
South Isl<strong>and</strong>, New Zeal<strong>and</strong>. New Zeal<strong>and</strong> Journal of Marine <strong>and</strong> Freshwater Research 46: 97 - 110.<br />
Augé AA; Chilvers BL; Moore AB; Davis LS (2011b). Foraging behaviour indicates marginal habitat for New Zeal<strong>and</strong> sea lions: remnant<br />
vs recolonising. Marine Ecology Progress Series 432:247-256.<br />
Augé AA; Chilvers BL; Davis LS; Moore AB (2011c). In the shallow end: diving behaviour of recolonising female New Zeal<strong>and</strong> sea lions<br />
(Phocarctos hookeri) around the Otago Peninsula. Canadian Journal of Zoology 89:1195–1205.<br />
Baker CS; Chilvers BL; Constantine R; DuFresne S; Mattlin RH; van Helden A; Hitchmough R (2010). Conservation status of New Zeal<strong>and</strong><br />
Marine Mammals (suborders Cetacea <strong>and</strong> Pinnipedia), 2009. New Zeal<strong>and</strong> Journal of Marine <strong>and</strong> Freshwater Research 44:<br />
101–115.<br />
Baker AJ (1999). Unusual mortality of the New Zeal<strong>and</strong> sea lion, Phocarctos hookeri, Auckl<strong>and</strong> Isl<strong>and</strong>s, January–February 1998: A report<br />
of a workshop held 8–9 June 1998, Wellington, <strong>and</strong> a contingency plan for future events. pp. 29–33, Department of<br />
Conservation, Te Papa Atawhai, Wellington, New Zeal<strong>and</strong>.<br />
Breen PA (2008). Sea lion data for use in the population model for Project IPA200609. Unpublished Final Research Report for Ministry of<br />
Fisheries, 30 March 2008. 18 pp. plus Confidential Appendix of 6p.<br />
Breen PA; Hilborn R; Maunder MN; Kim SW (2003). Effects of alternative control rules on the conflict between a fishery <strong>and</strong> a threatened<br />
sea lion (Phocarctos hookeri). Canadian Journal of Fisheries <strong>and</strong> <strong>Aquatic</strong> Sciences 60: 527–541.<br />
Breen PA; Kim SW (2006a). Exploring alternative management procedures for controlling bycatch of Hooker’s sea lions in the SQU 6T<br />
squid fishery. Unpublished Final Research Report for Ministry of Fisheries Project M0F2002/03L, Objective 3. Revision 5, 3<br />
February 2006. 88 pp.<br />
Breen PA; Kim SW (2006b). An integrated Bayesian evaluation of Hooker’s sea lion bycatch limits. pp. 471-493 In: A. Trites, S. Atkinson,<br />
D. DeMaster, L. Fritz, T. Gelatt, L. Rea, <strong>and</strong> K. Wynne. (eds.). Sea lions of the world. Alaska Sea Grant College Program,<br />
University of Alaska Fairbanks.<br />
Breen PA; Fu D; Gilbert DJ (2010). Sea lion population modelling <strong>and</strong> management procedure evaluations: Report for Project SAP2008/14,<br />
Objective 2. Presented to AEWG March 22 2010, Wellington, New Zeal<strong>and</strong>.<br />
Bowen WD (<strong>2012</strong>). A review of evidence for indirect effects of commercial fishing on New Zeal<strong>and</strong> sea lions (Phocarctos hookeri)<br />
breeding on the Auckl<strong>and</strong> Isl<strong>and</strong>s. Final Report May <strong>2012</strong>, Contract Number: POP 2010/01 (Objectives 4 <strong>and</strong> 5). Department<br />
of Conservation, Wellington. 41 p.<br />
Castinel A; Duignan PJ; Pomroy WE; López-Villalobos N; Gibbs NJ; Chilvers BL; Wilkinson IS (2007). Neonatal mortality in New<br />
Zeal<strong>and</strong> sea lions (Phocarctos hookeri) at S<strong>and</strong>y Bay, Enderby Isl<strong>and</strong>, Auckl<strong>and</strong> Isl<strong>and</strong>s from 1998 to 2005. Journal of<br />
Wildlife Diseases 43: 461-474.<br />
Cawthorn MW (1993). Census <strong>and</strong> population estimation of Hooker’s sea lion at the Auckl<strong>and</strong> Isl<strong>and</strong>s, December 1992–February 1993.<br />
DOC Technical Series 2. Wellington, Department of Conservation. 34 p<br />
Cawthorn MW; Crawley MC; Mattlin RH; Wilson GJ (1985). Research on pinnipeds in New Zeal<strong>and</strong>. Wildlife Research Liaison Group<br />
Report No. 7, Wellington, New Zeal<strong>and</strong>.<br />
Childerhouse, S., <strong>and</strong> N. Gales. (1998). The historic distribution <strong>and</strong> abundance of the New Zeal<strong>and</strong> sea lion Phocarctos hookeri. New<br />
Zeal<strong>and</strong> Journal of Zoology 25: 1-16.<br />
Childerhouse SJ; Gales NJ (2001). Fostering behavior in New Zeal<strong>and</strong> sea lions Phocarctos hookeri. New Zeal<strong>and</strong> Journal of Zoology<br />
28:189-195.<br />
Childerhouse SJ; Dix B; Gales NJ (2001). Diet of New Zeal<strong>and</strong> sea lions (Phocarctos hookeri) at the Auckl<strong>and</strong> Isl<strong>and</strong>s. Wildlife Research<br />
28:291–298.<br />
Childerhouse SJ; Gibbs N; McAlister G; McConkey S; McConnell H; McNally N; Sutherl<strong>and</strong> D (2005). Distribution, abundance <strong>and</strong><br />
growth of New Zeal<strong>and</strong> sea lion Phocarctos hookeri pups on Campbell Isl<strong>and</strong>. New Zeal<strong>and</strong> Journal of Marine <strong>and</strong><br />
Freshwater Research 39: 889–898.<br />
Childerhouse SJ; Dawson SM; Slooten E; Fletcher DJ; Wilkinson IS (2010a). Age distribution of lactating New Zeal<strong>and</strong> sea lions:<br />
interannual <strong>and</strong> intersite variation. Marine Mammal Science 26: 123-139.<br />
Childerhouse SJ; Dawson SM; Fletcher DJ; Slooten E; Chilvers BL (2010b). Growth <strong>and</strong> reproduction of female New Zeal<strong>and</strong> sea lions.<br />
Journal of Mammalogy 91:165-176.<br />
Chilvers BL (2008). New Zeal<strong>and</strong> sea lions Phocarctos hookeri <strong>and</strong> squid trawl fisheries: bycatch problems <strong>and</strong> management options.<br />
Endangered Species Research 5: 193–204.<br />
Chilvers BL (2009). Foraging locations of a decreasing colony of New Zeal<strong>and</strong> sea lions (Phocarctos hookeri). New Zeal<strong>and</strong> Journal of<br />
Ecology 33:106–113.<br />
Chilvers BL (<strong>2012</strong>a). Research to assess the demographic parameters of New Zeal<strong>and</strong> sea lions, Auckl<strong>and</strong> Isl<strong>and</strong>s: Final Research Report<br />
November <strong>2012</strong>, Contract Number: POP 2011/01. Department of Conservation, Wellington. 11 p.<br />
Chilvers BL (<strong>2012</strong>b). Using life-history traits of New Zeal<strong>and</strong> sea lions, Auckl<strong>and</strong> Isl<strong>and</strong>s to clarify potential causes of decline. Journal of<br />
Zoology 287: 240-249.<br />
Chilvers BL; Wilkinson IS (2008). Philopatry <strong>and</strong> site fidelity of New Zeal<strong>and</strong> sea lions (Phocarctos hookeri). Wildlife Research 35: 463–<br />
470.<br />
Chilvers BL; Wilkinson IS (2009). Diverse foraging strategies in lactating New Zeal<strong>and</strong> sea lions. Marine Ecology Progress Series 378:<br />
299–308.<br />
Chilvers BL; Wilkinson IS (2011). Research to assess the demographic parameters of New Zeal<strong>and</strong> sea lions, Auckl<strong>and</strong> Isl<strong>and</strong>s: Draft Final<br />
Report November 2011, Contract Number: POP 2010/01. Department of Conservation, Wellington. 20 p.<br />
Chilvers BL; Wilkinson IS; Duignan PJ; Gemmell NJ (2005a). Summer foraging areas for lactating New Zeal<strong>and</strong> sea lions Phocarctos<br />
hookeri. Marine Ecology Progress Series 304:235–247.<br />
41
AEBAR <strong>2012</strong>: Protected species: Sea lions<br />
Chilvers BL; Robertson BC; Wilkinson IS; Duignan PJ; Gemmell NJ (2005b). Male harassment of female New Zeal<strong>and</strong> sea lions: mortality,<br />
injury <strong>and</strong> harassment avoidance. Canadian Journal of Zoology 83:642-648.<br />
Chilvers BL; Wilkinson IS; Duignan PJ; Gemmell NJ (2006). Diving to extremes: are New Zeal<strong>and</strong> sea lions pushing their limits in a<br />
marginal habitat? Journal of Zoology 269:233–240.<br />
Chilvers BL; Wilkinson IS; Childerhouse SJ (2007). New Zeal<strong>and</strong> sea lion, Phocarctos hookeri, pup production–1995 to 2006. New<br />
Zeal<strong>and</strong> Journal of Marine <strong>and</strong> Freshwater Research 41: 205–213.<br />
Chilvers BL; Wilkinson IS; Mackenzie DI (2010). Predicting life-history traits for female New Zeal<strong>and</strong> sea lions, Phocarctos hookeri:<br />
integrating short-term mark–recapture data <strong>and</strong> population modelling. Journal of Agricultural, Biological, <strong>and</strong> <strong>Environment</strong>al<br />
Statistics 15): 259–278.<br />
Chilvers BL; Amey JM; Huckstadt LA; Costa DP (2011). Partitioning of breeding area foraging locations in New Zeal<strong>and</strong> sea lions. Polar<br />
Biology 34:565–574.<br />
Clement & Associates Ltd. (2007). Squid trawl fleet sea lion escape device audit. A report commissioned by the Department of<br />
Conservation for Project CSP MIT2004/05. Department of Conservation, Wellington. 19 p.<br />
Costa DP; Gales NJ (2000). Foraging energetic <strong>and</strong> diving behaviour of lactating New Zeal<strong>and</strong> sea lions, Phocarctos hookeri. Journal of<br />
Experimental Biology 203:3655–3665.<br />
Crocker DE; Gales NJ; Costa DP (2001). Swimming speed <strong>and</strong> foraging strategies of New Zeal<strong>and</strong> sea lions, Phocarctos hookeri. Journal of<br />
Zoology 254: 267-277.<br />
Department of Conservation. (2007). Draft Population Management Plan for New Zeal<strong>and</strong> Sea Lion. Draft Document for Public<br />
Consultation, August 2007. Department of Conservation, Wellington. http://www.doc.govt.nz/gettinginvolved/consultations/closed/nz-sea-lion-management/.<br />
Department of Conservation. (2009). New Zeal<strong>and</strong> sea lion species management plan: 2009–2014. Department of Conservation, Wellington.<br />
31 p.<br />
Dickie G (1999). Population dynamics of New Zeal<strong>and</strong> fur seals (Arctocephalus forsteri) <strong>and</strong> New Zeal<strong>and</strong> sea lions (Phocarctos hookeri).<br />
M.Sc. thesis. University of Otago, Dunedin, New Zeal<strong>and</strong>. 117p.<br />
Fish F (2008). Streamlining. pp. 1123-26. In W. F. Perrin, B. Wursig, <strong>and</strong> J. G. M. Thewissen (eds.). Encyclopedia of Marine Mammals.<br />
Academic Press.<br />
Gales NJ (1995). New Zeal<strong>and</strong> (Hooker’s) sea lion recovery plan. Threatened Species Recovery Plan Series 17. Department of<br />
Conservation, Wellington.<br />
Gales NJ (2008). Phocarctos hookeri. In: IUCN 2010. IUCN Red List of Threatened Species. Version 2010.4. www.iucnredlist.org.<br />
Downloaded on 1 June 2011.<br />
Gales NJ; Fletcher DJ (1999). Abundance, distribution <strong>and</strong> status of the New Zeal<strong>and</strong> sea lion, Phocarctos hookeri. Wildlife Research 26:<br />
35-52.<br />
Gales NJ; Mattlin RH (1997). Summer diving behaviour of lactating female New Zeal<strong>and</strong> sea lions. Canadian Journal of Zoology 75:1695-<br />
1706.<br />
Gilbert DJ; Chilvers BL (2008). Final report on New Zeal<strong>and</strong> sea lion pupping rate. POP2006-01 Objective 3. Analysis from sea lion<br />
database to estimate pupping rate <strong>and</strong> associated parameters. NIWA Report WLG2008-77. 26p.<br />
Gill BJ (1998). Prehistoric breeding sites of New Zeal<strong>and</strong> sea lions (Phocarctos hookeri, Carnivora: Otariidae) at North Cape. Records of<br />
the Auckl<strong>and</strong> Museum 35: 55-64.<br />
Hanke1 W; Witte M; Miersch L; Brede M; Oeffner J; Michael M; Hanke1 F; Leder A; Dehnhardt G (2010). Harbor seal vibrissa<br />
morphology suppresses vortex-induced vibrations. Journal of Experimental Biology 213: 2665-2672.<br />
IUCN, 2010. IUCN Red List of Threatened Species. Version 2010.4. http://www.iucnredlist.org. Downloaded on 1 June 2011.<br />
Katsanevakis S (2008). Marine debris, a growing problem: Sources, distribution, composition, <strong>and</strong> impacts. In: Hofer TN (ed) Marine<br />
Pollution: New Research. Nova Science Publishers, New York. pp. 53–100.<br />
Lalas C; Bradshaw CJA (2003). Expectations for population growth at new breeding locations for the vulnerable New Zeal<strong>and</strong> sea lion<br />
using a simulation model. Biological Conservation 114:67-78.<br />
Leung ES; Chilvers BL; Moore AB; Nakagawa S; Robertson BC (<strong>2012</strong>). Sexual segregation in juvenile New Zeal<strong>and</strong> sea lion foraging<br />
ranges: implications for intraspecific competition, population dynamics <strong>and</strong> conservation. PLoS ONE. 7(9): e45389.<br />
Lyle JM (2011). SRP2010-03: Fur seal interactions with SED excluder device. Unpublished Final Research Report for Ministry of Fisheries,<br />
26 July 2011. 20 pp.<br />
Lyle JM; Willcox ST (2008). Dolphin <strong>and</strong> seal interactions with mid-water trawling in the Commonwealth small pelagic fishery, including<br />
an assessment of bycatch mitigation. Final Report Project R05/0996. Australian Fisheries Management Authority, National<br />
Library of Australia. 39p.<br />
MacKenzie DI (2011). Estimation of demographic parameters for New Zeal<strong>and</strong> sea lions breeding on the Auckl<strong>and</strong> Isl<strong>and</strong>s. Final Report<br />
November <strong>2012</strong>, Contract Number: Objective 3: POP 2011/01. Department of Conservation, Wellington. 88 p.<br />
Maloney A; Chilvers BL; Haley M; Muller CG; Roe WD; Debski I (2009). Distribution, pup production <strong>and</strong> mortality of New Zeal<strong>and</strong> sea<br />
lion (Phocarctos hookeri) on Campbell Isl<strong>and</strong> / Motu Ihupuku, 2008. New Zeal<strong>and</strong> Journal of Ecology 33: 97-105.<br />
Maloney A; Chilvers BL; Muller CG; Haley M (<strong>2012</strong>). Increasing pup production of New Zeal<strong>and</strong> sea lions at Campbell Isl<strong>and</strong>/Motu<br />
Ihupuku: can it continue? New Zeal<strong>and</strong> Journal of Zoology 39:19-29.<br />
Marshall CD (2008). Feeding Morphology. pp. 406-413. In W. F. Perrin, B. Wursig, <strong>and</strong> J. G. M. Thewissen (eds.). Encyclopedia of Marine<br />
Mammals. Academic Press.<br />
Mattlin RH (2004). QMA SQU6T New Zeal<strong>and</strong> sea lion incidental catch <strong>and</strong> necropsy data for the fishing years 2000-01, 2001-02 <strong>and</strong><br />
2002-03. Report prepared for the NZ Ministry of Fisheries, Wellington, NZ. July 2004. 21p.<br />
Marlow BJ (1975). The comparative behaviour of the Australasian sea lions Neophoca cinerea <strong>and</strong> Phocarctos hookeri. Mammalia 39:159-<br />
230.<br />
McConkey S; McConnell H; Lalas C; Heinrich S; Ludmerer A; McNally N; Parker E; Borofsky C; Schimanski K; McIntosh M (2002). A<br />
northward spread in the breeding distribution of the New Zeal<strong>and</strong> sea lion. Australian Mammalogy 24:97-106.<br />
McNally N; Heinrich S; Childerhouse SJ (2001). Distribution <strong>and</strong> breeding of New Zeal<strong>and</strong> sea lions Phocarctos hookeri on Campbell<br />
Isl<strong>and</strong>. New Zeal<strong>and</strong> Journal of Zoology 28: 79–87.<br />
Meynier L (2010). New Zeal<strong>and</strong> sea lion bio-energetic modelling: Final Report for Project IPA2009-09. Presented to AEWG May 17 2011,<br />
Wellington, New Zeal<strong>and</strong>. 34p.<br />
Meynier L; Morel PCH; Chilvers BL; Mackenzie DDS; MacGibbon A; Duignan PJ (2008). Temporal <strong>and</strong> sex differences in the blubber<br />
fatty acid profiles of the New Zeal<strong>and</strong> sea lion Phocarctos hookeri. Marine Ecology Progress Series 366: 271–278.<br />
Meynier L; Mackenzie DDS; Duignan PJ; Chilvers BL; Morel PCH (2009). Variability in the diet of New Zeal<strong>and</strong> sea lion (Phocarctos<br />
hookeri) at the Auckl<strong>and</strong> Isl<strong>and</strong>s, New Zeal<strong>and</strong>. Marine Mammal Science 25: 302–326.<br />
42
AEBAR <strong>2012</strong>: Protected species: Sea lions<br />
Ministry of Fisheries. (2011). Report from the Fisheries Assessment Plenary, May 2011: stock assessments <strong>and</strong> yield estimates. Ministry of<br />
Fisheries, Wellington, New Zeal<strong>and</strong>. 1178p.<br />
Moore JM; Wallace B; Lewison RL; Zydelis R; Cox T; Crowder L (2009). A review of marine mammal, sea turtle <strong>and</strong> seabird bycatch in<br />
USA fisheries <strong>and</strong> the role of policy in shaping management. Marine Policy 33:435–451.<br />
Moore PJ; Moffatt RD (1990). Research <strong>and</strong> management projects on Campbell Isl<strong>and</strong> 1987–88. Science <strong>and</strong> Research Internal Report<br />
Series 57. Wellington, Department of Conservation. 101 p.<br />
Nagaoka L (2001). Using Diversity Indices to Measure Changes in Prey Choice at the Shag River Mouth Site, Southern New Zeal<strong>and</strong>.<br />
International Journal of Osteoarchaeology 11: 101–111.<br />
Nagaoka L (2006). Prehistoric seal carcass exploitation at the Shag Mouth site, New Zeal<strong>and</strong>. Journal of Archaeological Science 33: 1474–<br />
1481.<br />
Ponte G; van den Berg A; Anderson RWG (2010). Impact characteristics of the New Zeal<strong>and</strong> Fisheries sea lion exclusion device stainless<br />
steel grid. Final Research Report for Ministry of Fisheries project IPA2009-06, Oct. 2010. 24p.<br />
Ponte G; van den Berg A; Anderson RWG (2011). Further analysis of the impact characteristics of the New Zeal<strong>and</strong> Fisheries sea lion<br />
exclusion device stainless steel grid. Final Research Report for Ministry of Fisheries project SRP2010-05, Sept. 2011. 36 p.<br />
Ray GC (1963). Locomotion in pinnipeds. Natural History 72: 10 -21.<br />
Read AJ; Drinker P; Northridge S (2006). Bycatch of marine mammals in U.S. <strong>and</strong> global fisheries. Conservation Biology 20:163–169.<br />
Richard Y; Abraham ER; Filippi D (2011). Assessment of the risk to seabird populations from New Zeal<strong>and</strong> commercial fisheries. Final<br />
Research Report for research projects IPA2009-19 <strong>and</strong> IPA2009-20. (Unpublished report held by Ministry of Fisheries,<br />
Wellington.). 66 p.<br />
Riet-Sapriza FG (2007). Milk composition of the New Zeal<strong>and</strong> sea lion <strong>and</strong> factors that influence it. PhD thesis, Massey University,<br />
Palmerston North, New Zeal<strong>and</strong>.<br />
Riet-Sapriza FG; Lopez-Villalobos N; Mackenzie DDS; Duignan PJ; Macgibbon A; Chilvers BL (<strong>2012</strong>). Assimilation <strong>and</strong> deposition of<br />
fatty acid biomarkers in blood serum <strong>and</strong> milk of lactating New Zeal<strong>and</strong> sea lions, Phocarctos hookeri. Canadian Journal of<br />
Zoology<br />
Robertson BC; Chilvers BL (2011). The population decline of the New Zeal<strong>and</strong> sea lion Phocarctos hookeri: a review of possible causes.<br />
Mammal <strong>Review</strong> 41: 253–275.<br />
Robertson BC; Chilvers BL; Duignan PJ; Wilkinson IS; Gemmel NJ (2006). Dispersal of breeding adult male Phocarctos hookeri:<br />
implications for disease transmission, population management <strong>and</strong> species recovery. Biological Conservation 127:227-236.<br />
Roe WD (2010). External review of NZ sea lion bycatch necropsy data <strong>and</strong> methods. Report prepared for the NZ Ministry of Fisheries,<br />
Wellington. 8p.<br />
Roe WD; Meynier L (2010). <strong>Review</strong> of Necropsy Records for Bycaught NZ sea lions (Phocarctos hookeri), 2000-2008. Report for NZ<br />
Ministry of Fisheries project PRO2008-03, Wellington. 46p.<br />
Smith IWG (1989). Maori Impact on the Marine Magafauna: Pre-European Distributions of New Zeal<strong>and</strong> Sea Mammals. In Sutton, D. G.<br />
(ed.) Saying so doesn't make it so. Papers in Honour of B. Foss Leach. New Zeal<strong>and</strong> Archaeological Association Monograph.<br />
17:76-108.<br />
Smith IWG (2011). Estimating the magnitude of pre-European Maori marine harvest in two New Zeal<strong>and</strong> study areas. New Zeal<strong>and</strong> <strong>Aquatic</strong><br />
<strong>Environment</strong> <strong>and</strong> <strong>Biodiversity</strong> Report No. 82.<br />
Smith MH; Baird SJ (2005). Factors that may influence the level of incidental mortality of New Zeal<strong>and</strong> sea lions (Phocarctos hookeri) in<br />
the squid (Nototodarus spp.) trawl fishery in SQU 6T. New Zeal<strong>and</strong> Fisheries Assessment Report 2005/20. 35 p.<br />
Smith MH; Baird SJ (2007a). Estimation of incidental captures of New Zeal<strong>and</strong> sea lions (Phocarctos hookeri) in New Zeal<strong>and</strong> fisheries in<br />
2003-04, with particular reference to the SQU 6T squid trawl fishery. New Zeal<strong>and</strong> Fisheries Assessment Report 2007/7. 32 p.<br />
Smith MH; Baird SJ (2007b). Estimation of incidental captures of New Zeal<strong>and</strong> sea lions (Phocarctos hookeri) in New Zeal<strong>and</strong> fisheries in<br />
2004-05, with particular reference to the SQU 6T squid trawl fishery. New Zeal<strong>and</strong> <strong>Aquatic</strong> <strong>Environment</strong> <strong>and</strong> <strong>Biodiversity</strong><br />
Report No. 12. 31 p.<br />
Thompson FN; Abraham ER (2010). Estimation of the capture of New Zeal<strong>and</strong> sea lions (Phocarctos hookeri) in trawl fisheries, from 1995–<br />
96 to 2008–09. New Zeal<strong>and</strong> <strong>Aquatic</strong> <strong>Environment</strong> <strong>and</strong> <strong>Biodiversity</strong> Report No. 66, Wellington.<br />
Thompson FN; Abraham ER; Berkenbusch K (2011). Marine mammal bycatch in New Zeal<strong>and</strong> trawl fisheries, 1995–96 to 2009–10. Draft<br />
Final Research Report for Ministry for Primary Industries project PRO2010-01 (Unpublished report held by the Ministry for<br />
Primary Industries, Wellington). 80 pages.<br />
Thompson FN; Abraham ER; Berkenbusch K (<strong>2012</strong>). Marine mammal bycatch in New Zeal<strong>and</strong> trawl fisheries, 1995–96 to 2010–11. Draft<br />
Final Research Report for Ministry for Primary Industries project PRO2010-01 (Unpublished report held by the Ministry for<br />
Primary Industries, Wellington). 90 pages.<br />
Townsend AJ; de Lange PJ; Duffy CAJ; Miskelly CM; Molloy J; Norton D (2008). New Zeal<strong>and</strong> Threat Classification System Manual.<br />
Department of Conservation, Wellington, New Zeal<strong>and</strong>.<br />
Tuck ID (2009). Characterisation of scampi fisheries <strong>and</strong> the examination of catch at length <strong>and</strong> spatial distribution of scampi in SCI 1, 2, 3,<br />
4A <strong>and</strong> 6A. New Zeal<strong>and</strong> Fisheries Assessment Report 2009/27:102 pages.<br />
Wade PR (1998). Calculating limits to the allowable human caused mortality of cetaceans <strong>and</strong> pinnipeds. Marine Mammal Science 14:1–37.<br />
Wade PR; Angliss R (1997). Guidelines for assessing marine mammal stocks: Report of the GAMMS Workshop. NOAA Technical Memo<br />
NMFS-OPR-12.<br />
Walker GE; Ling JK (1981). New Zeal<strong>and</strong> sea lion. In Ridway S.H., Harrisson R.J. (eds.). H<strong>and</strong>book of Marine Mammal, Vol. 1. Academic<br />
Press Inc., London, United Kingdom.<br />
Wilkinson IS; Burgess J; Cawthorn MW (2003). New Zeal<strong>and</strong> sea lions <strong>and</strong> squid—managing fisheries impacts on a threatened marine<br />
mammal. pp 192–207 In: N. Gales, M. Hindell, <strong>and</strong> R. Kirkwood (eds.). Marine mammals: Fisheries, tourism <strong>and</strong><br />
management issues. CSIRO Publishing, Melbourne.<br />
Wilkinson IS; Childerhouse SJ; Duignan PJ; Gull<strong>and</strong> FMD (2000). Infanticide <strong>and</strong> cannibalism in the New Zeal<strong>and</strong> sea lion. Marine<br />
Mammal Science 16:495-500.<br />
Wilkinson IS; Duignan PJ; Grinberg A; Chilvers BL; Robertson BC (2006). Klebsiella pneumonia epidemics: Possible impact on New<br />
Zeal<strong>and</strong> sea lion recruitment. pp. 455–471. In: A. Trites, S. Atkinson, D. DeMaster, L. Fritz, T. Gelatt, L. Rea, <strong>and</strong> K. Wynne.<br />
(eds.). Sea lions of the world. Alaska Sea Grant College Program, University of Alaska Fairbanks.<br />
Woodley TH; Lavigne DM (1991). Incidental capture of pinnipeds in commercial fishing gear. International Marine Mammal Association<br />
Technical Report 91-01: 35 p.<br />
43
AEBAR <strong>2012</strong>: Protected species: Fur seals<br />
4. New Zeal<strong>and</strong> fur seal (Arctocephalus forsteri)<br />
Scope of chapter This chapter outlines the biology New Zeal<strong>and</strong> fur seals (Arctocephalus<br />
forsteri), the nature of any fishing interactions, the management<br />
approach, trends in key indicators of fishing effects <strong>and</strong> major sources of<br />
uncertainty.<br />
Area All of the New Zeal<strong>and</strong> EEZ <strong>and</strong> territorial sea.<br />
Focal localities Areas with significant fisheries interactions include waters over or close<br />
to the continental shelf surrounding the South Isl<strong>and</strong> <strong>and</strong> southern<br />
offshore isl<strong>and</strong>s, notably Cook Strait, West Coast South Isl<strong>and</strong>, Banks<br />
Peninsula <strong>and</strong> the Bounty Isl<strong>and</strong>s, plus offshore of Bay of Plenty-East<br />
Cape.<br />
Key issues Improving estimates of incidental bycatch in some fisheries, <strong>and</strong><br />
assessing the potential for populations to sustain the present levels of<br />
bycatch.<br />
Emerging issues Improving data <strong>and</strong> information sources for future ecological risk<br />
MPI Research<br />
(current)<br />
Other Govt<br />
Research (current)<br />
Links to 2030<br />
objectives<br />
Related<br />
issues/chapters<br />
assessments.<br />
4.1. Context<br />
PRO2010-01 Estimating the nature & extent of incidental captures of<br />
seabirds, marine mammals & turtles in New Zeal<strong>and</strong> commercial<br />
fisheries; PRO<strong>2012</strong>-02 Assess the risk posed to marine mammal<br />
populations from New Zeal<strong>and</strong> fisheries.<br />
DOC Marine Conservation Services Programme (CSP): INT<strong>2012</strong>-01 To<br />
underst<strong>and</strong> the nature <strong>and</strong> extent of protected species interactions with<br />
New Zeal<strong>and</strong> commercial fishing activities.<br />
Objective 6: Manage impacts of fishing <strong>and</strong> aquaculture.<br />
Strategic Action 6.2: Set <strong>and</strong> monitor environmental st<strong>and</strong>ards,<br />
including for threatened <strong>and</strong> protected species <strong>and</strong> seabed impacts<br />
See the New Zeal<strong>and</strong> sea lion chapter.<br />
Management of fisheries impacts on New Zeal<strong>and</strong> (NZ) fur seals is legislated under the Marine<br />
Mammals Protection Act (MMPA) 1978 <strong>and</strong> the Fisheries Act (FA) 1996. Under s.3E of the MMPA,<br />
the Minister of Conservation, with the concurrence of the Minister for Primary Industries (formerly<br />
the Minister of Fisheries), may approve a population management plan (PMP). There is no PMP in<br />
place for NZ fur seals.<br />
In the absence of a PMP, the Ministry for Primary Industries (MPI) manages fishing-related mortality<br />
of NZ fur seals under s.15(2) of the FA “to avoid, remedy, or mitigate the effect of fishing-related<br />
mortality on any protected species, <strong>and</strong> such measures may include setting a limit on fishing-related<br />
mortality.”<br />
All marine mammal species are designated as protected species under s.2(1) of the FA. In 2005, the<br />
Minister of Conservation approved the Conservation General Policy, which specifies in Policy 4.4 (f)<br />
that “Protected marine species should be managed for their long-term viability <strong>and</strong> recovery<br />
throughout their natural range.” DOC’s Regional Conservation Management Strategies outline<br />
specific policies <strong>and</strong> objectives for protected marine species at a regional level.<br />
44
AEBAR <strong>2012</strong>: Protected species: Fur seals<br />
In 2004, DOC approved the Department of Conservation Marine Mammal Action Plan for 2005–<br />
2010 20 (Suisted <strong>and</strong> Neale 2009). The plan specifies a number of species-specific key objectives for<br />
NZ fur seals, of which the following is most relevant for fisheries interactions: “To control/mitigate<br />
fishing-related mortality of NZ fur seals in trawl fisheries (including the WCSI hoki <strong>and</strong> Bounty Isl<strong>and</strong><br />
southern blue whiting fisheries).”<br />
Management of NZ fur seal incidental captures aligns with Fisheries 2030 Objective 6: Manage<br />
impacts of fishing <strong>and</strong> aquaculture. Further, the management actions follow Strategic Action 6.2: Set<br />
<strong>and</strong> monitor environmental st<strong>and</strong>ards, including for threatened <strong>and</strong> protected species <strong>and</strong> seabed<br />
impacts.<br />
All National Fisheries Plans except those for inshore shellfish <strong>and</strong> freshwater fisheries are relevant to<br />
the management of fishing-related mortality of NZ fur seals.<br />
Under the National Deepwater Plan, the objective most relevant for management of NZ fur seals is<br />
Management Objective 2.5: Manage deepwater <strong>and</strong> middle-depth fisheries to avoid or minimise<br />
adverse effects on the long-term viability of endangered, threatened <strong>and</strong> protected species.<br />
Specific objectives for the management of NZ fur seals bycatch are to be outlined in the fisheryspecific<br />
chapters of the National Deepwater Plan for the fisheries with which NZ fur seals are most<br />
likely to interact. These fisheries include hoki (HOK), southern blue whiting (SBW), hake (HAK) <strong>and</strong><br />
jack mackerel (JMA). The HOK chapter of the National Deepwater Plan is complete <strong>and</strong> includes<br />
Operational Objective 2.11: Ensure that incidental marine mammal captures in the hoki fishery are<br />
avoided <strong>and</strong> minimised to acceptable levels (which may include st<strong>and</strong>ards) by <strong>2012</strong>. The SBW<br />
chapter is nearing completion while the timeframes for the HAK <strong>and</strong> JMA chapters are yet to be<br />
confirmed.<br />
Management Objective 7 of the National Fisheries Plan for Highly Migratory Species (HMS) is to<br />
“Implement an ecosystem approach to fisheries management, taking into account associated <strong>and</strong><br />
dependent species.” This comprises four components: Avoid, remedy, or mitigate the adverse effects<br />
of fishing on associated <strong>and</strong> dependent species, including through maintaining foodchain<br />
relationships; Minimise unwanted bycatch <strong>and</strong> maximise survival of incidental catches of protected<br />
species in HMS fisheries, using a risk management approach; Increase the level <strong>and</strong> quality of<br />
information available on the capture of protected species; <strong>and</strong> Recognise the intrinsic values of HMS<br />
<strong>and</strong> their ecosystems, comprising predators, prey, <strong>and</strong> protected species.<br />
The <strong>Environment</strong> Objective is the same for all groups of fisheries in the draft National Fisheries Plan<br />
for Inshore Finfish, to “Minimise adverse effects of fishing on the aquatic environment, including on<br />
biological diversity”. The draft National Fisheries Plans for Inshore Shellfish <strong>and</strong> Freshwater have the<br />
same objective but are unlikely to be relevant to management of fishing-related mortality of NZ fur<br />
seals.<br />
4.2. Biology<br />
4.2.1. Taxonomy<br />
The NZ fur seal (Arctocephalus forsteri (Lesson, 1828)) is one of only two species of otariid (eared<br />
seals, includes fur seals <strong>and</strong> sea lions) native to New Zeal<strong>and</strong>, the other being the New Zeal<strong>and</strong> sea<br />
lion (Phocarctos hookeri (Gray, 1844)).<br />
20<br />
DOC has confirmed that the Marine Mammal Action Plan for 2005–2010 still reflects DOC’s priorities for<br />
marine mammal conservation.<br />
45
4.2.2. Distribution<br />
AEBAR <strong>2012</strong>: Protected species: Fur seals<br />
Pre-European archaeological evidence suggests that NZ fur seals were present along much of the east<br />
coasts of the North Isl<strong>and</strong> (except the less rocky coastline of Bay of Plenty <strong>and</strong> Hawke Bay) <strong>and</strong> the<br />
South Isl<strong>and</strong>, <strong>and</strong>, to a lesser extent, on the west coasts, where fewer areas of suitable habitat were<br />
available (Smith 1989, 2005, 2011). A combination of subsistence hunting <strong>and</strong> commercial harvest<br />
resulted contraction of the species’ range <strong>and</strong> in population decline almost to the point of extinction<br />
(Smith 1989, 2005, 2011, Ling 2002, Lalas 2008). NZ fur seals became fully protected in the 1890’s<br />
<strong>and</strong>, with the exception of one year of licenced harvest in the 1950’s, have remained protected since.<br />
Currently, NZ fur seals are dispersed throughout New Zeal<strong>and</strong> waters, especially in waters south of<br />
about 40º S to Macquarie Isl<strong>and</strong>. On l<strong>and</strong>, NZ fur seals are distributed around the New Zeal<strong>and</strong><br />
coastline, on offshore isl<strong>and</strong>s, <strong>and</strong> on sub-Antarctic isl<strong>and</strong>s (Crawley <strong>and</strong> Wilson 1976, Wilson 1981,<br />
Mattlin 1987). The recolonisation of the coastline by NZ fur seals has resulted in the northward<br />
expansion of the distribution of breeding colonies <strong>and</strong> haulouts (Lalas <strong>and</strong> Bradshaw 2001), <strong>and</strong><br />
breeding colonies present on many exposed rocky areas (Baird 2011). The extent of breeding colony<br />
distribution in New Zeal<strong>and</strong> waters is bounded to the north by a very small (space-limited) colony at<br />
Gannet Isl<strong>and</strong> off the North Isl<strong>and</strong> west coast (latitude 38° S), to the east by colonies of unknown<br />
sizes at the Chatham Isl<strong>and</strong>s group, to the west by colonies of unknown size on Fiordl<strong>and</strong> offshore<br />
isl<strong>and</strong>s, <strong>and</strong> to the south by unknown numbers on Campbell Isl<strong>and</strong>. Outside New Zeal<strong>and</strong> waters,<br />
breeding populations exist in South <strong>and</strong> Western Australia (Shaughnessy et al. 1994, Shaughnessy<br />
1999, Goldsworthy et al. 2003).<br />
The seasonal distribution of the NZ fur seals is determined by the sex <strong>and</strong> maturity of each animal.<br />
Males are generally at the breeding colonies from late October to late January then move to haulout<br />
areas around the New Zeal<strong>and</strong> coastline (see Bradshaw et al. 1999), with peak density of males <strong>and</strong><br />
sub-adult males at haulouts during July–August <strong>and</strong> lowest densities in September–October (Crawley<br />
<strong>and</strong> Wilson 1976). Females arrive at the breeding colony from November <strong>and</strong> lactating females<br />
remain at the colony (apart from short foraging trips) for about 10 months until the pups are weaned,<br />
usually during August–September (Crawley <strong>and</strong> Wilson 1976).<br />
4.2.3. Foraging ecology<br />
Most foraging research in New Zeal<strong>and</strong> has focused on lactating NZ fur seals at Open Bay Isl<strong>and</strong>s off<br />
the South Isl<strong>and</strong> west coast (Mattlin et al. 1998), Otago Peninsula (Harcourt et al. 2002), <strong>and</strong> Ohau<br />
Point, Kaikoura (Boren 2005), using time-depth-recorders, satellite-tracking, or very-high-frequency<br />
transmitters. Individual females show distinct dive pattern behaviour <strong>and</strong> may be relatively shallow or<br />
deep divers, but most forage at night <strong>and</strong> in depths shallower than 200 m. At Open Bay Isl<strong>and</strong>s, dives<br />
were generally deeper <strong>and</strong> longer in duration during autumn <strong>and</strong> winter. Females can dive to at least<br />
274 m (for a 5.67 min dive in autumn) <strong>and</strong> remain near the bottom at over 237 m for up to 11.17 min<br />
in winter (Mattlin et al. 1998). Females in some locations undertook longer dive trips, with some to<br />
deeper waters, in autumn (in over 1000 m beyond the continental shelf; Harcourt et al. 2002).<br />
The relatively shallow dives <strong>and</strong> nocturnal feeding during summer suggested that seals fed on pelagic<br />
<strong>and</strong> vertical migrating prey species (for example, arrow squid, Nototodarus sloanii). Conversely, the<br />
deeper dives <strong>and</strong> increased number of dives in daylight during autumn <strong>and</strong> winter suggested that the<br />
prey species may include benthic, demersal, <strong>and</strong> pelagic species (Mattlin et al. 1998, Harcourt et al.<br />
2002). The deeper dives enabled seals to forage along or off the continental shelf (within 10 km) of<br />
the colony studied (at Open Bay Isl<strong>and</strong>s). These deeper dives may be to the benthos or to depths in the<br />
water column where spawning hoki are concentrated.<br />
46
AEBAR <strong>2012</strong>: Protected species: Fur seals<br />
Methods to analyse NZ fur seal diets have included investigation of freshly killed animals (Sorensen<br />
1969), scats, <strong>and</strong> regurgitates (e.g. Allum <strong>and</strong> Maddigan <strong>2012</strong>). Fish prey items can be recognised by<br />
the presence of otoliths, bones, scales, <strong>and</strong> lenses, while cephalopods are indicated by beaks <strong>and</strong> pens.<br />
Foraging appears to be specific to individuals <strong>and</strong> different diets may be represented in the scats <strong>and</strong><br />
regurgitations of males <strong>and</strong> females as well as juveniles from one colony. These analyses can be<br />
biased, however, particularly if only one collection method is used, <strong>and</strong> this limits fully quantitative<br />
assessment of prey species composition.<br />
Dietary studies of NZ fur seals have been conducted at colonies in Nelson-Marlborough, west coast<br />
South Isl<strong>and</strong>, Otago Peninsula, Kaikoura, Banks Peninsula, Snares Isl<strong>and</strong>s, <strong>and</strong> off Stewart Isl<strong>and</strong>, <strong>and</strong><br />
summaries are provided by Carey (1992), Harcourt (2001), Boren (2010), <strong>and</strong> Baird (2011).<br />
NZ fur seals are opportunistic foragers <strong>and</strong>, depending on the time of year, method of analysis, <strong>and</strong><br />
location, their diet includes at least 61 taxa (Holborow 1999) of mainly fish (particularly lanternfish<br />
(myctophids) in all studied colonies except Tonga Isl<strong>and</strong> (in Golden Bay, Willis et al. 2008), as well<br />
as anchovy (Engraulis australis), aruhu (Auchenoceros punctatus), barracouta (Thrysites atun), hoki<br />
(Macruronus novaezel<strong>and</strong>iae), jack mackerel (Trachurus spp.), pilchard (Sardinops sagax), red cod<br />
(Pseudophycis bachus), red gurnard (Chelidonichthys kumu), silverside (Argentina elongate), sprat<br />
(Sprattus spp.) <strong>and</strong> cephalopods (octopus (Macroctopus maorum), squid (Nototodarus sloanii,<br />
Sepioteuthis bilineata)). For example, myctophids were present in Otago scats throughout the year<br />
(representing offshore foraging), but aruhu, sprat, <strong>and</strong> juvenile red cod were present only during<br />
winter-spring (Fea et al. 1999). Medium-large arrow squid predominated in summer <strong>and</strong> autumn. Jack<br />
mackerel species, barracouta, <strong>and</strong> octopus were dominant in winter <strong>and</strong> spring. Prey such as<br />
lanternfish <strong>and</strong> arrow squid rise in the water column at night, the time when NZ fur seals exhibit<br />
shallow foraging (Harcourt et al. 1995, Mattlin et al. 1998, Fea et al. 1999).<br />
4.2.4. Reproductive biology<br />
NZ fur seals are sexually dimorphic <strong>and</strong> polygynous (Crawley <strong>and</strong> Wilson 1976); males may weigh<br />
up to 160 kg, whereas females weigh up to about 50 kg (Miller 1975; Mattlin 1978a, 1987; Troy et al.<br />
1999). Adult males are much larger around the neck <strong>and</strong> shoulders than females <strong>and</strong> breeding males<br />
are on average 3.5 times the weight of breeding females (Crawley <strong>and</strong> Wilson 1976). Females are<br />
philopatric <strong>and</strong> are sexually mature at 4–6 years, whereas males mature at 5–9 years (Mattlin 1987,<br />
Dickie <strong>and</strong> Dawson 2003). The maximum age recorded for NZ fur seals in New Zeal<strong>and</strong> waters is 22<br />
years for females (Dickie <strong>and</strong> Dawson 2003) <strong>and</strong> 15 years for males (Mattlin 1978).<br />
NZ fur seals are annual breeders <strong>and</strong> generally produce one pup after a gestation period of about 10<br />
months (Crawley <strong>and</strong> Wilson 1976). Twinning can occur <strong>and</strong> females may foster a pup (Dowell et al.<br />
2008), although both are rare. Breeding animals come ashore to mate after a period of sustained<br />
feeding at sea. Breeding males arrive at the colonies to establish territories during October–<br />
November. Breeding females arrive at the colony from late November <strong>and</strong> give birth shortly after.<br />
Peak pupping occurs in mid December (Crawley <strong>and</strong> Wilson 1976).<br />
Females remain at the colony with their newborn pups for about 10 days, by which time they have<br />
usually mated. Females then leave the colony on short foraging trips of 3–5 days before returning to<br />
suckle pups for 2–4 days (Crawley <strong>and</strong> Wilson 1976). As the pups grow, these foraging trips are<br />
progressively longer in duration. Pups remain at the breeding colony from birth until weaning (at 8–<br />
12 months of age).<br />
Breeding males generally disperse after mating to feed <strong>and</strong> occupy haulout areas, often in more<br />
northern areas (Crawley <strong>and</strong> Wilson 1976). This movement of breeding adults away from the colony<br />
area during January allows for an influx of sub-adults from nearby areas. Little is described about the<br />
ratio of males to females on breeding colonies (Crawley <strong>and</strong> Wilson 1976), or the reproductive<br />
47
AEBAR <strong>2012</strong>: Protected species: Fur seals<br />
success. Boren (2005) reported a fecundity rate of 62% for a Kaikoura colony, based on two annual<br />
samples of between about 5 <strong>and</strong> 8% of the breeding female population. This rate is similar to the 67%<br />
estimated by Goldsworthy <strong>and</strong> Shaughnessy (1994) for a South Australian colony.<br />
Newborn pups are about 55 cm long <strong>and</strong> weigh about 3.5 kg (Crawley <strong>and</strong> Wilson 1976). Male pups<br />
are generally heavier than female pups at birth <strong>and</strong> throughout their growth (Crawley <strong>and</strong> Wilson<br />
1976, Mattlin 1981, Chilvers et al. 1995, Bradshaw et al. 2003b, Boren 2005). Pup growth rates may<br />
vary by colony (see Harcourt 2001). The proximity of a colony to easily accessible rich food sources<br />
will vary, <strong>and</strong> pup condition at a colony can vary markedly between years (Mattlin 1981, Bradshaw et<br />
al. 2000, Boren 2005). Food availability may be affected by climate variation, <strong>and</strong> pup growth rates<br />
probably represent variation in the ability of mothers to provision their pups from year to year. The<br />
sex ratio of pups at a colony may vary by season (Bradshaw et al. 2003a, 2003b, Boren 2005), <strong>and</strong> in<br />
years of high food resource availability, more mothers may produce males or more males may survive<br />
(Bradshaw et al. 2003a, 2003b).<br />
4.2.5. Population biology<br />
Historically, the population of NZ fur seals in New Zeal<strong>and</strong> was thought to number above 1.25<br />
million animals (possibly as high as 1.5 to 2 million) before the extensive sealing of the early 19 th<br />
century (Richards 1994). Present day population estimates for NZ fur seals in New Zeal<strong>and</strong> are few<br />
<strong>and</strong> highly localised. In the most comprehensive attempt to quantify the total NZ fur seal population,<br />
Wilson (1981) summarised population surveys of mainl<strong>and</strong> New Zeal<strong>and</strong> <strong>and</strong> offshore isl<strong>and</strong>s<br />
undertaken in the 1970s <strong>and</strong> estimated the population size within the New Zeal<strong>and</strong> region at between<br />
30,000 <strong>and</strong> 50,000 animals. Since then, several authors have suggested a population size of ~100,000<br />
animals (Taylor 1990, see Harcourt 2001), but this estimate is very much an approximation <strong>and</strong> its<br />
accuracy is difficult to assess in the absence of comprehensive surveys.<br />
Fur seal colonies provide the best data for consistent estimates of population numbers, generally based<br />
on pup production in a season (see Shaughnessy et al. 1994). Data used to provide colony population<br />
estimates of NZ fur seals have been, <strong>and</strong> generally continue to be, collected in an ad hoc fashion.<br />
Regular pup counts are made at some discrete populations. A 20-year time series of Otago Peninsula<br />
colony data is updated, maintained, <strong>and</strong> published primarily by Chris Lalas (assisted by Sanford<br />
(South Isl<strong>and</strong>) Limited), <strong>and</strong> the most recent estimate is 20,000–30,000 animals (Lalas 2008). A 20year<br />
plus time series of pup counts exists for three west coast South Isl<strong>and</strong> colonies (Cape Foulwind,<br />
Wekekura Point, <strong>and</strong> Open Bay Isl<strong>and</strong>s; Best 2011). Recent Kaikoura work by Boren (2005) covered<br />
four seasons <strong>and</strong> unpublished data are available for the subsequent seasons.<br />
Other studies of breeding colonies generally provide estimates for one or two seasons, but many of<br />
these are more than 10 years old. Published estimates suggest that populations have stabilised at the<br />
Snares Isl<strong>and</strong>s after a period of growth in the 1950s <strong>and</strong> 1960s (Carey 1998) <strong>and</strong> increased at the<br />
Bounty Isl<strong>and</strong>s (Taylor 1996), Nelson-Marlborough region (Taylor et al. 1995), Kaikoura (Boren<br />
2005), Otago (Lalas <strong>and</strong> Harcourt 1995, Lalas <strong>and</strong> Murphy 1998, Lalas 2008), <strong>and</strong> near Wellington<br />
(Dix 1993).<br />
For many areas where colonies or haulouts exist, count data have been collected opportunistically<br />
(generally by Department of Conservation staff during their field activities) <strong>and</strong> thus data are not often<br />
comparable because counts may represent different life stages, different assessment methods, <strong>and</strong><br />
different seasons (see Baird 2011).<br />
Baker et al. (2010a) conducted an aerial survey of the South Isl<strong>and</strong> west coast from Farewell Spit to<br />
Puysegur Point <strong>and</strong> Sol<strong>and</strong>er Isl<strong>and</strong> in 2009 but were their counts were quite different from ground<br />
counts collected at a similar time at the main colonies (Melina <strong>and</strong> Cawthorn 2009). This discrepancy<br />
was thought to be a result mainly of the survey design <strong>and</strong> the nature of the terrain. However, the<br />
48
AEBAR <strong>2012</strong>: Protected species: Fur seals<br />
aerial survey confirmed the localities shown by Wilson (1981) of potentially large numbers of pups at<br />
sites such as Cascade Point, Yates Point, Chalky Isl<strong>and</strong>, <strong>and</strong> Sol<strong>and</strong>er Isl<strong>and</strong>.<br />
Population numbers for some areas, especially more isolated ones, are not well known. The most<br />
recent counts for the Chatham Isl<strong>and</strong>s were collected in the 1970s (Wilson 1981), <strong>and</strong> the most recent<br />
for the Bounty Isl<strong>and</strong>s in 1993–94. Taylor (1996) reported an increase in pup production at the<br />
Bounty Isl<strong>and</strong>s since 1980, <strong>and</strong> estimated that the total population was at least 21 500, occupying over<br />
50% of the available area. Information is sparse for populations at Campbell Isl<strong>and</strong>, the Auckl<strong>and</strong><br />
Isl<strong>and</strong>s group <strong>and</strong> the Antipodes Isl<strong>and</strong>s<br />
Little is reported about the natural mortality of NZ fur seals, other than reports of sources <strong>and</strong><br />
estimates of pup mortality for some breeding colonies. Estimates of pup mortality or pup survival<br />
vary in the manner in which they were determined <strong>and</strong> in the number of seasons they represent, <strong>and</strong><br />
are not directly comparable. Each colony will be affected by different sources of mortality related to<br />
habitat, location, food availability, environment, <strong>and</strong> year, as well as the ability of observers to count<br />
all the dead pups (may be limited by terrain, weather, or time of day).<br />
Reported pup mortality rates vary: 8% for Otago Peninsula pups up to 30 days old <strong>and</strong> 23% for pups<br />
up to 66 days old (Lalas <strong>and</strong> Harcourt 1995); 20% from birth to 50 days <strong>and</strong> about 40% from birth to<br />
300 days for Taumaka Isl<strong>and</strong>, Open Bay Isl<strong>and</strong>s pups (Mattlin 1978b); <strong>and</strong> in one year, 3% of<br />
Kaikoura pups before the age of 50 days (Boren 2005). Starvation was the major cause of death,<br />
although stillbirth, suffocation, trampling, drowning, predation, <strong>and</strong> human disturbance also occur.<br />
Pup survival of at least 85% was estimated for a mean 47 day interval for three Otago colonies,<br />
incorporating data such as pup body mass (Bradshaw et al. 2003b), though pup mortality before the<br />
first capture effort was unknown. Other sources of natural mortality for NZ fur seals include predators<br />
such as sharks <strong>and</strong> NZ sea lions (Mattlin 1978b, Bradshaw et al. 1998).<br />
Human-induced sources of mortality include: fishing, for example, entanglement or capture in fishing<br />
gear; vehicle-related deaths (Lalas <strong>and</strong> Bradshaw 2001, Boren 2005, Boren et al. 2006, 2008); <strong>and</strong><br />
mortality through shooting, bludgeoning, <strong>and</strong> dog attacks. NZ fur seals are vulnerable to certain<br />
bacterial diseases <strong>and</strong> parasites <strong>and</strong> environmental contaminants, though it is not clear how lifethreatening<br />
these are. The more obvious problems include tuberculosis infections, Salmonella,<br />
hookworm enteritis, phocine distemper, <strong>and</strong> septicaemia (associated with abortion) (Duignan 2003,<br />
Duignan <strong>and</strong> Jones 2007). Low food availability <strong>and</strong> persistent organohalogen compounds (which can<br />
affect the immune <strong>and</strong> the reproductive systems) may also affect NZ fur seal health.<br />
Various authors have investigated fur seals genetic differentiation among colonies <strong>and</strong> regions in New<br />
Zeal<strong>and</strong> (Lento et al. 1994; Robertson <strong>and</strong> Gemmell (2005). Lento et al. (1994) described the<br />
geographic distribution of mitochondrial cytochrome b DNA haplotypes, whereas Robertson <strong>and</strong><br />
Gemmell (2005) described low levels of genetic differentiation (consistent with homogenising gene<br />
flow between colonies <strong>and</strong> an exp<strong>and</strong>ing population) based on genetic material from NZ fur seal pups<br />
from seven colonies. One aim of the work is to determine the provenance of animals captured during<br />
fishing activities, through the identification <strong>and</strong> isolation of any colony genetic differences.<br />
4.2.6. Conservation biology <strong>and</strong> threat classification<br />
Threat classification is an established approach for identifying species at risk of extinction (IUCN<br />
2010). The risk of extinction for NZ fur seals has been assessed under two threat classification<br />
systems: the New Zeal<strong>and</strong> Threat Classification System (Townsend et al. 2008) <strong>and</strong> the International<br />
Union for the Conservation of Nature (IUCN) Red List of Threatened Species (IUCN 2010).<br />
In 2008, the IUCN updated the Red List status of NZ fur seals, listing them as Least Concern on the<br />
basis of their large <strong>and</strong> apparently increasing population size (Goldsworthy <strong>and</strong> Gales 2008). In 2010,<br />
49
AEBAR <strong>2012</strong>: Protected species: Fur seals<br />
DOC updated the New Zeal<strong>and</strong> Threat Classification status of all NZ marine mammals (Baker et al.<br />
2010b). In the revised list, NZ fur seals were classified as Not Threatened with the qualifiers<br />
increasing (Inc) <strong>and</strong> secure overseas (SO) (Baker et al. 2010b).<br />
4.3. Global underst<strong>and</strong>ing of fisheries interactions<br />
NZ fur seals are found in both Australian <strong>and</strong> New Zeal<strong>and</strong> waters. Overall abundance has been<br />
suggested to be as high as 200 000, with about half of the population in Australian waters<br />
(Goldsworthy <strong>and</strong> Gales 2008). However, this figure is very much an approximation, <strong>and</strong> its accuracy<br />
is difficult to assess in the absence of comprehensive surveys.<br />
Pinnipeds are caught incidentally in a variety of fisheries worldwide (Read et al. 2006), including: NZ<br />
fur seals, Australian fur seals, <strong>and</strong> Australian sea lions in Australian trawl <strong>and</strong> inshore fisheries (e.g.,<br />
Shaughnessy 1999, Norman 2000); Cape fur seals in South African fisheries (Shaughessy <strong>and</strong> Payne<br />
1979); South Amercian sea lions in trawl fisheries off Patagonia (Dans et al. 2003); <strong>and</strong> seals <strong>and</strong> sea<br />
lions in United States waters (Moore et al. 2009).<br />
4.4. State of knowledge in New Zeal<strong>and</strong><br />
NZ fur seals are attracted to feeding opportunities in various fishing gears <strong>and</strong> anecdotal evidence<br />
suggests that the sound of winches as trawlers haul their gear acts as a ‘dinner gong’. The attraction of<br />
fish in a trawl net, on longline hooks, or caught in a setnet provide opportunities for NZ fur seals to<br />
interact with fishing gear, which can result in capture <strong>and</strong>, potentially, death via drowning or injury.<br />
Most captures occur in trawl fisheries <strong>and</strong> NZ fur seals are most at risk from capture during shooting<br />
<strong>and</strong> hauling (Shaughnessy <strong>and</strong> Payne 1979), when the net mouth is within diving depths. Once in the<br />
net some animals may have difficulty in finding their way out within their maximum breath-hold time<br />
(Shaughnessy <strong>and</strong> Davenport 1996). The operational aspects that are associated with NZ fur seal<br />
captures on trawlers include factors that attract the NZ fur seals, such as the presence of offal <strong>and</strong><br />
discards, the sound of the winches, vessel lights, <strong>and</strong> the presence of ‘stickers’ in the net (Baird 2005).<br />
NZ fur seals are at particular risk of capture when a vessel partially hauls the net during a tow <strong>and</strong><br />
executes a turn with the gear close to the surface. At the haul, NZ fur seals pften attempt to feed from<br />
the codend as it is hauled <strong>and</strong> dive after fish that come loose <strong>and</strong> escape from the net (Baird 2005).<br />
Factors identified as important influences on the potential capture of NZ fur seals in trawl gear<br />
include the year or season, the fishery area, gear type <strong>and</strong> fishing strategies (often specific to certain<br />
nationalities within the fleet), time of day, <strong>and</strong> distance to shore (Baird <strong>and</strong> Bradford 2000, Mormede<br />
et al. 2008, Smith <strong>and</strong> Baird 2009). These analyses did not include any information on NZ fur seal<br />
numbers or activity in the water at the stern of the vessel. Other influences on NZ fur seal capture rate<br />
(of Australian <strong>and</strong> NZ fur seals) may include inclement weather <strong>and</strong> sea state, vessel speed, increased<br />
numbers of vessels <strong>and</strong> trawl frequency, <strong>and</strong> potentially the weight of the fish catch <strong>and</strong> the presence<br />
of certain bycatch fish species (Hamer <strong>and</strong> Goldsworthy 2006). This Australian study found similar<br />
mortality rates for tows with <strong>and</strong> without Seal Exclusion Devices (see also Hooper et al. 2005).<br />
The spatial <strong>and</strong> temporal overlap of commercial fishing grounds <strong>and</strong> NZ fur seal foraging areas has<br />
resulted in NZ fur seal captures in fishing gear (Mattlin 1987, Rowe 2009). Most fisheries with<br />
observed captures occur in waters over or close to the continental shelf. Because the topography<br />
around much of the South Isl<strong>and</strong> <strong>and</strong> offshore isl<strong>and</strong>s slopes steeply to deeper waters, most captures<br />
occur close to colonies <strong>and</strong> haulouts (Figures 4.1 <strong>and</strong> 4.2).<br />
Observed NZ fur seal captures are mainly from trawls in defined seasons in areas where fishing<br />
occurs relatively close to NZ fur seal colonies or haulouts. Winter hoki fisheries attract NZ fur seals<br />
50
AEBAR <strong>2012</strong>: Protected species: Fur seals<br />
off the west coast South Isl<strong>and</strong> <strong>and</strong> in Cook Strait between late June <strong>and</strong> September (Table 4.1). In<br />
August–October, NZ fur seals are caught in southern blue whiting effort near the Bounty Isl<strong>and</strong>s <strong>and</strong><br />
Campbell Isl<strong>and</strong>. In September–October captures may occur in hoki <strong>and</strong> ling fisheries off Puysegur<br />
Point on the southwestern coast of the South Isl<strong>and</strong>. Captures are also reported from the Stewart-<br />
Snares shelf fisheries that operate during summer months, mainly for hoki <strong>and</strong> other middle depths<br />
species <strong>and</strong> squid, <strong>and</strong> from fisheries throughout the year on the Chatham Rise though captures have<br />
not been observed east of longitude 180° on the Chatham Rise.<br />
Captures were reported from trawl fisheries for species such as hoki, hake (Merluccius australis), ling<br />
(Genypterus blacodes), squid, southern blue whiting, Jack mackerel, <strong>and</strong> barracouta (Baird <strong>and</strong> Smith<br />
2007, Abraham et al. 2010a). Between 1 <strong>and</strong> 3% of observed tows targeting middle depths fish<br />
species catch NZ fur seals compared with about 1% for squid tows, <strong>and</strong> under 1% of observed tows<br />
targeting deepwater species such as orange roughy (Hoplostethus atlanticus) <strong>and</strong> oreo species (for<br />
example, Allocyttus niger, Pseudocyttus maculatus) (Baird <strong>and</strong> Smith 2007). The main fishery areas<br />
that contribute to the estimated annual catch of NZ fur seals (modelled from observed captures) in<br />
middle depths <strong>and</strong> deepwater trawl fisheries are Cook Strait hoki, west coast South Isl<strong>and</strong> middle<br />
depths fisheries (mainly hoki), western Chatham Rise hoki, <strong>and</strong> the Bounty Isl<strong>and</strong>s southern blue<br />
whiting fishery (Baird <strong>and</strong> Smith 2007, Thompson <strong>and</strong> Abraham 2010). Captures on longlines occur<br />
when the NZ fur seals attempt to feed on the fish catch during hauling. Most NZ fur seals are released<br />
alive from surface <strong>and</strong> bottom longlines, typically with a hook <strong>and</strong> short snood or trace still attached.<br />
Table 4.1: Monthly distribution of NZ fur seal activity <strong>and</strong> the main trawl <strong>and</strong> longline fisheries with observed<br />
reports of NZ fur seal incidental captures.<br />
NZ fur seals Oct Nov Dec Jan Feb Mar Apr May Jun Jul Aug Sep<br />
Breeding males At breeding colony Dispersed at sea or at haulouts<br />
Breeding<br />
females<br />
At sea<br />
At breeding<br />
colony<br />
At breeding colony <strong>and</strong> at-sea foraging <strong>and</strong> suckling At sea<br />
Pups At sea At breeding colony At sea<br />
Non-breeders Dispersed at sea, at haulouts, or breeding colony periphery<br />
Major fisheries Oct Nov Dec Jan Feb Mar Apr May Jun Jul Aug Sep<br />
Hoki trawl Puysegur Chatham Rise Cook Strait, west coast South<br />
Isl<strong>and</strong><br />
Squid trawl Stewart-Snares shelf, Auckl<strong>and</strong> Is. Shelf, East Coast South<br />
Isl<strong>and</strong><br />
Southern blue<br />
whiting trawl<br />
Southern bluefin<br />
tuna longline<br />
Campbell Rise Bounty Is.,<br />
Pukaki Rise<br />
51<br />
Fiordl<strong>and</strong>
AEBAR <strong>2012</strong>: Protected species: Fur seals<br />
Figure 4.1: Distribution of trawl fishing effort <strong>and</strong> observed NZ fur seal captures, 2002-03 to 2010-11 (for more<br />
information see http://data.dragonfly.co.nz/psc/). Fishing effort is mapped into 0.2-degree cells, with the colour of<br />
each cell being related to the amount of effort. Observed fishing events are indicated by black dots, <strong>and</strong> observed<br />
captures are indicated by red dots. Fishing is only shown if the effort could be assigned a latitude <strong>and</strong> longitude, <strong>and</strong><br />
if there were three or more vessels fishing within a cell. In this case, 96.0% of the effort is shown.<br />
52
AEBAR <strong>2012</strong>: Protected species: Fur seals<br />
Figure 4.2: Distribution of surface longline fishing effort <strong>and</strong> observed NZ fur seal captures, 2002-03 to 2010-11 (for<br />
more information see http://data.dragonfly.co.nz/psc/). Fishing effort is mapped into 0.2-degree cells, with the colour<br />
of each cell being related to the amount of effort. Observed fishing events are indicated by black dots, <strong>and</strong> observed<br />
captures are indicated by red dots. Fishing is only shown if the effort could be assigned a latitude <strong>and</strong> longitude, <strong>and</strong><br />
if there were three or more vessels fishing within a cell. In this case, 75.3% of the effort is shown.<br />
53
AEBAR <strong>2012</strong>: Protected species: Fur seals<br />
4.4.1. Quantifying fisheries interactions<br />
Observer data <strong>and</strong> commercial effort data have been used historically to characterise the incidental<br />
captures <strong>and</strong> estimate the total numbers caught (Baird <strong>and</strong> Smith 2007, Smith <strong>and</strong> Baird 2009,<br />
Thompson <strong>and</strong> Abraham 2010, Abraham <strong>and</strong> Thompson 2011). This approach is currently applied<br />
using information collected under DOC project INT<strong>2012</strong>-01 <strong>and</strong> analysed under MPI project<br />
PRO2010-01 (Thompson et al. 2011, Thompson et al. <strong>2012</strong>). The analytical methods used to estimate<br />
capture numbers across the commercial fisheries have depended on the quantity <strong>and</strong> quality of the<br />
data, in terms of the numbers observed captured <strong>and</strong> the representativeness of the observer coverage.<br />
Initially, stratified ratio estimates were provided for the main trawl fisheries, starting in the late 1980s,<br />
after scientific observers reported 198 NZ fur seal deaths during the July to September west coast<br />
South Isl<strong>and</strong> spawning hoki fishery (Mattlin 1994a, 1994b). In the following years, ratio estimation<br />
was used to estimate NZ fur seal captures in the Taranaki Bight jack mackerel fisheries <strong>and</strong> Bounty<br />
Platform, Pukaki Rise, <strong>and</strong> Campbell Rise southern blue whiting fisheries, based on observed catches<br />
<strong>and</strong> stratified by area, season, <strong>and</strong> gear type (Baird 1994).<br />
In the last 10 years, model-based estimates of captures have been developed for all trawl fisheries in<br />
waters south of 40° S (Baird <strong>and</strong> Smith 2007, Smith <strong>and</strong> Baird 2009, Thompson <strong>and</strong> Abraham 2010,<br />
Abraham <strong>and</strong> Thompson 2011, Thompson et al. 2011, Thompson et al. <strong>2012</strong>). These models use the<br />
observed <strong>and</strong> unobserved data in an hierarchical Bayesian approach that combines season <strong>and</strong> vesselseason<br />
r<strong>and</strong>om effects with covariates (for example, day of fishing year, time of day, tow duration,<br />
distance from shore, gear type, target) to model variation in capture rates among tows. This method<br />
compensates in part for the lack of representativeness of the observer coverage <strong>and</strong> includes the<br />
contribution from correlation in the capture rate among tows by the same vessel. The method is<br />
limited by the very large differences in the observed <strong>and</strong> non-observed proportions of data for the<br />
different vessel sizes; most observer coverage is on larger vessels that generally operate in waters<br />
deeper than 200 m. The operation of inshore vessels in terms of the location of effort, gear, <strong>and</strong> the<br />
fishing strategies used is also relatively unknown compared with the deeper water fisheries although<br />
changes to reporting requirements means that data is now improving <strong>and</strong> inshore trawl effort (not<br />
including flatfish trawl effort) is now able to be included in the modelling (Thompson et al. <strong>2012</strong>, see<br />
also description of the Trawl Catch Effort Return, TCER, in use since 2007/08, in Chapter 7 on<br />
benthic effects).<br />
Since 2005, there has been a small downward trend in estimated capture rates, <strong>and</strong> annual estimated<br />
NZ fur seal captures (Smith <strong>and</strong> Baird 2009, Thompson <strong>and</strong> Abraham 2010, Abraham <strong>and</strong> Thompson<br />
2011, Thompson et al. 2011, Thompson et al. <strong>2012</strong>, Figure 4.3). This probably reflects efforts to<br />
reduce bycatch combined with a reduction in fishing effort since the late 1990s. Similar modelling<br />
methods were used to produce the most recent set of estimated NZ fur seal captures in trawl fisheries<br />
(Thompson <strong>and</strong> Abraham 2010, Abraham <strong>and</strong> Thompson 2011, Thompson et al. 2011, Thompson et<br />
al. <strong>2012</strong>). The overall downward trend in estimated annual captures for trawl fisheries has continued<br />
(see Table 4.2), as a result of the continued decrease in total tows made each year <strong>and</strong> a concurrent<br />
decrease in capture rate. Note these capture rates include animals that are released alive (7% of<br />
observed trawl capture in 2008-09, Thompson <strong>and</strong> Abraham 2010).<br />
Ratio estimation was used to calculate total captures in longline fisheries by target fishery fleet <strong>and</strong><br />
area (Baird 2008) <strong>and</strong> by all fishing methods (Abraham et al. 2010a). NZ fur seal captures in surface<br />
longline fisheries have been generally observed in waters south <strong>and</strong> west of Fiordl<strong>and</strong>, but also in the<br />
Bay of Plenty <strong>and</strong> off East Cape. Estimated numbers range from 127 (95% c.i. 121–133) in 1998–99<br />
to 25 (14–39) in 2007–08 during southern bluefin tuna fishing by chartered <strong>and</strong> domestic vessels<br />
(Abraham et al. 2010a). These capture rates include animals that are released alive (100% of observed<br />
surface longline capture in 2008-09, Thompson <strong>and</strong> Abraham 2010). Captures of NZ fur seals have<br />
also been recorded in other fisheries; 8 in setnets <strong>and</strong> 2 in bottom longline fisheries since 2002-03<br />
54
AEBAR <strong>2012</strong>: Protected species: Fur seals<br />
(Thompson et al. <strong>2012</strong>). Captures associated with recreational fishing activities are poorly known<br />
(Abraham et al. 2010b).<br />
Table 4.2: Effort, observed <strong>and</strong> estimated NZ fur seal captures in trawl <strong>and</strong> surface longline fisheries by fishing year<br />
in the New Zeal<strong>and</strong> EEZ (Abraham <strong>and</strong> Thompson 2011 <strong>and</strong> http://data.dragonfly.co.nz/psc/). For each fishing year,<br />
the table gives the the total number of tows or hooks; the observer coverage (the percentage of tows or hooks that<br />
were observed); the number of observed captures (both dead <strong>and</strong> alive); the capture rate (captures per hundred tows<br />
or per thous<strong>and</strong> hooks); the estimation method used (model or ratio); <strong>and</strong> the mean number of estimated total<br />
captures (with 95% confidence interval). For more information on the methods used to prepare the data, see<br />
Abraham <strong>and</strong> Thompson (2011).<br />
Fishing year Fishing effort Observed captures Estimated captures<br />
All effort % observed Number Rate Type Mean 95% c.i.<br />
Trawl fisheries<br />
1998–1999 153 412 4.7<br />
190 2.62 Ratio 1 591 1454–1744<br />
1999–2000 139 057 5.5<br />
203 2.65 Ratio 1 539 1400–1693<br />
2000–2001 134 243 6.8<br />
170 1.87 Ratio 1 490 1348–1649<br />
2001–2002 127 883 6.0<br />
157 2.03 Ratio 1 273 1164–1394<br />
2002–2003 130 344 5.2<br />
68 1.00 Model 841 503 – 1380<br />
2003–2004 121 494 5.4<br />
84 1.28 Model 1 052 635 – 1728<br />
2004–2005 120 590 6.4<br />
200 2.59 Model 1 471 914 – 2392<br />
2005–2006 110 230 5.9<br />
143 2.18 Model 917 577 – 1479<br />
2006–2007 103 529 7.7<br />
73 0.92 Model 533 324 – 871<br />
2007–2008 89 537 10.1<br />
141 1.56 Model 765 476 – 1348<br />
2008–2009 87 587 11.2<br />
72 0.73 Model 546 308 – 961<br />
2009–2010 92 886 9.7<br />
72 0.80 Model 472 269 – 914<br />
2010–2011 86 073 8.6 69 0.93 Model 376 221 – 668<br />
Surface longline fisheries<br />
1998–1999 6 855 124 18.9<br />
102 0.08 Ratio 138 120–160<br />
1999–2000 8 258 537 10.4<br />
42 0.05 Ratio 67 54–83<br />
2000–2001 9 698 805 10.8<br />
43 0.04 Ratio 64 51–83<br />
2001–2002 10 833 533 9.1<br />
44 0.04 Ratio 75 61–93<br />
2002–2003 10 764 588 20.4<br />
56 0.03 Ratio 73 63–87<br />
2003–2004 7 380 779 21.8<br />
40 0.02 Ratio 107 61–189<br />
2004–2005 3 676 365 21.3<br />
20 0.03 Ratio 46 26–71<br />
2005–2006 3 687 339 19.1<br />
12 0.02 Ratio 59 28–100<br />
2006–2007 3 738 362 27.8<br />
10 0.01 Ratio 31 18–49<br />
2007–2008 2 244 339 19.0<br />
10 0.02 Ratio 29 17–46<br />
2008–2009 3 115 633 30.1<br />
22 0.02 Ratio 48 29–75<br />
2009–2010 2 992 285 22.3<br />
19 0.03 Ratio 65 35–103<br />
2010–2011 3 164 159 21.3 17 0.03 Ratio 57 26–99<br />
55
a<br />
b<br />
c<br />
d<br />
e<br />
f<br />
AEBAR <strong>2012</strong>: Protected species: Fur seals<br />
Figure 4.3: Observed captures of NZ fur seals in trawl fisheries (both dead <strong>and</strong> alive), the capture rate (captures per<br />
hundred tows) <strong>and</strong> the mean number of estimated total captures (with 95% confidence interval) by fishing year for<br />
regions with more than 50 observed captures since 2002-03: (a) the New Zeal<strong>and</strong> EEZ; (b) the Cook Strait area; (c)<br />
the East Coast South Isl<strong>and</strong> area; (d) the Stewart Snares Shelf area; (e) the Subantarctic area; <strong>and</strong> (f) the West Coast<br />
South Isl<strong>and</strong> area (Abraham <strong>and</strong> Thompson 2011 <strong>and</strong> http://data.dragonfly.co.nz/psc/). For more information on the<br />
methods used to prepare the data, see Abraham <strong>and</strong> Thompson (2011).<br />
56
AEBAR <strong>2012</strong>: Protected species: Fur seals<br />
4.4.2. Managing fisheries interactions<br />
The impact of fishing related captures on the NZ fur seal population is presently unknown. However,<br />
fishing interactions are considered unlikely to have adverse population-level consequences for NZ fur<br />
seals given: the scale of bycatch relative to overall NZ fur seal abundance; the apparently increasing<br />
population <strong>and</strong> range; <strong>and</strong> the NZ <strong>and</strong> IUCN threat status of the species. The consequences of fishing<br />
related mortality for some individual colonies may be more or less severe.<br />
Management has focused on encouraging vessel operators to alter fishing practices to reduce captures,<br />
<strong>and</strong> monitoring captures via the observer programme. A marine mammal operating procedure<br />
(MMOP) has been developed by the deepwater sector to reduce the risk of marine mammal captures<br />
<strong>and</strong> is currently applied to trawlers greater than 28 m LOA <strong>and</strong> is supported by annual training. It<br />
includes a number of mitigation measures, such as managing offal discharge <strong>and</strong> refraining from<br />
shooting <strong>and</strong> hauling the gear when NZ fur seals are congregating around the vessel. Its major focus is<br />
reducing the time gear is at or near the surface when it poses the greatest risk. MPI monitors <strong>and</strong><br />
audits vessel performance against this procedure (see the MPI National Deepwater Plan for further<br />
details).<br />
Research into methods to minimise or mitigate NZ fur seal captures in commercial fisheries has<br />
focused on fisheries in which NZ fur seals are more likely to be captured (trawl fisheries, see Clement<br />
<strong>and</strong> Associates 2009). Finding ways to mitigate captures has proven difficult because the animals are<br />
free swimming, can easily dive to the depths of the net when it is being deployed, hauled, or brought<br />
to the surface during a turn, <strong>and</strong> are known to deliberately enter nets to feed. Further, any measures<br />
also need to ensure that the catch is not greatly compromised, either in terms of the amount of fish or<br />
their condition. This is one potential drawback of using seal exclusion devices (see Rowe 2007).<br />
Adhering to current risk mitigation methods (e.g. MMOP) will help to minimise the level of impacts,<br />
however rates may fluctuate depending on fleet deployment, NZ fur seal abundance <strong>and</strong> local feeding<br />
conditions.<br />
4.4.3. Modelling population-level impacts of fisheries interactions<br />
The uncertainty about the size of the NZ fur seal population has restricted the potential to investigate<br />
any effects that NZ fur seal deaths through fishing may have on the population as a whole or on the<br />
viability of colonies or groups of colonies. The provenance of NZ fur seals caught during fishing is<br />
presently unknown, although proposed genetic research potentially could identify which animals<br />
belonged to a specific colony (Robertson <strong>and</strong> Gemmell 2005).<br />
In response to the requirements for the Marine Stewardship Council certification of the hoki fishery<br />
(one target fishery contributing to NZ fur seal mortality), expert knowledge about NZ fur seals <strong>and</strong><br />
their interactions with trawl gear (including some comparisons of annual capture estimates) have been<br />
used for an expert-based qualitative ecological risk assessment (ERAs). The results of this study have<br />
not been reviewed by the AEWG or DOC’s CSP-TWG.<br />
The impact of fisheries interactions on NZ fur seal populations (<strong>and</strong> other marine mammal<br />
populations) will be assessed in the marine mammal risk assessment project (PRO<strong>2012</strong>-02) due to be<br />
commissioned in 2013. The goal of this project is to assess the risk posed to marine mammal<br />
populations by New Zeal<strong>and</strong> fisheries by applying a similar approach to the recent seabird risk<br />
assessment (Richard et al. 2011). In this approach, risk is defined as the ratio of total estimated annual<br />
fatalities due to bycatch in fisheries, to the level of Potential Biological Removal (PBR, Wade 1998).<br />
The results should be available in 2014.<br />
57
4.4.4. Sources of uncertainty<br />
AEBAR <strong>2012</strong>: Protected species: Fur seals<br />
Any measure of the effect of NZ fur seal mortality from commercial fisheries on NZ fur seal<br />
populations requires adequate information on the size of the populations at different colonies.<br />
Although there is reasonable information about where the main NZ fur seal breeding colonies exist,<br />
the size <strong>and</strong> dynamics of the overall populations are poorly understood. At present, the main sources<br />
of uncertainty are the lack of consistent data on: abundance by colony <strong>and</strong> in total; population<br />
demographic parameters; <strong>and</strong> at-sea distribution (which would ideally be available at the level of a<br />
colony or wider geographic area where several colonies are close together) (Baird 2011). Collation<br />
<strong>and</strong> analysis of existing data, such as that for the west coast South Isl<strong>and</strong>, would fill some of these<br />
gaps; there is a 20-year time series of pup production from three west coast South Isl<strong>and</strong> colonies, a<br />
reasonably long data series from the Otago Peninsula, <strong>and</strong> another from Kaikoura. Maximum benefit<br />
could be gained through the use of all available data, as shown by the monitoring of certain colonies<br />
of NZ fur seals in Australia to provide a measure of overall population stability (see Shaughnessy et<br />
al. 1994, Goldsworthy et al. 2003).<br />
Fur seals may forage in waters near a colony or haulout, or may range widely, depending on the sex,<br />
age, <strong>and</strong> individual preferences of the animal (Baird 2011). It is not known whether the NZ fur seals<br />
around a fishing vessel are from colonies nearby. Some genetic work is proposed to test the potential<br />
to differentiate between colonies so that in the future NZ fur seals drowned by fishing gear may be<br />
identified as being from a certain colony (Robertson <strong>and</strong> Gemmell 2005).<br />
The low to moderate levels of observer coverage in some fishery-area strata adds uncertainty to the<br />
total estimated captures. However, the main source of uncertainty in the level of bycatch is the paucity<br />
of information from the inshore fishing fleets using a variety of methods. Recent increases in observer<br />
coverage enabled fur seal capture estimates to include inshore fishing effort. Further increases in<br />
coverage, particularly for inshore fisheries, would provide better data on the life stage, sex, <strong>and</strong> size of<br />
captured animals, as well as samples for fatty acid or stable isotope analysis to assess diet <strong>and</strong> to<br />
determine provenance. Information on the aspects of fishing operations that lead to capture in inshore<br />
fisheries would also be useful to design mitigation.<br />
58
4.5. Indicators <strong>and</strong> trends<br />
AEBAR <strong>2012</strong>: Protected species: Fur seals<br />
Population size Unknown, but potentially ~100 000 in the New Zeal<strong>and</strong> EEZ 21 .<br />
Population trend Increasing at some mainl<strong>and</strong> colonies but unknown for offshore isl<strong>and</strong> colonies. Range is<br />
thought to be increasing.<br />
Threat status NZ: Not Threatened, Increasing, Secure Overseas, in 2010 22 .<br />
Number of<br />
interactions 24<br />
Trends in<br />
interactions<br />
IUCN: Least Concern, in 2008 23 .<br />
376 estimated captures (95%CI: 221-668) in trawl fisheries in 2010-11<br />
57 estimated captures (95%CI: 26-99) in surface longline fisheries in 2010-11<br />
69 observed captures in trawl fisheries in 2010-11<br />
17 observed captures in surface longline fisheries in 2010-11<br />
Trawl fisheries:<br />
Surface longline fisheries:<br />
21 Taylor (1990), Harcourt (2001).<br />
22 Baker et al. (2010b).<br />
23 Goldsworthy <strong>and</strong> Gales (2008).<br />
24 For more information, see: http://data.dragonfly.co.nz/psc/.<br />
59
4.6. References<br />
AEBAR <strong>2012</strong>: Protected species: Fur seals<br />
Abraham, E.R.; Thompson, F.N. (2011). Summary of the capture of seabirds, marine mammals, <strong>and</strong> turtles in New Zeal<strong>and</strong> commercial<br />
fisheries, 1998–99 to 2008–09. Final Research Report prepared for Ministry of Fisheries project PRO2007/01. 170 pages.<br />
(Unpublished report held by the Ministry of Fisheries, Wellington.)<br />
Abraham, E.R.; Thompson, F.N.; Oliver, M.D. (2010a). Summary of the capture of seabirds, marine mammals, <strong>and</strong> turtles in New Zeal<strong>and</strong><br />
commercial fisheries, 1998–99 to 2007–08. New Zeal<strong>and</strong> <strong>Aquatic</strong> <strong>Environment</strong> <strong>and</strong> <strong>Biodiversity</strong> Report No. 45. 148 p.<br />
Abraham, E.R.; Berkenbusch, K.N.; Richard, Y. (2010b). The capture of seabirds <strong>and</strong> marine mammals in New Zeal<strong>and</strong> non-commercial<br />
fisheries. New Zeal<strong>and</strong> <strong>Aquatic</strong> <strong>Environment</strong> <strong>and</strong> <strong>Biodiversity</strong> Report No. 64. 52 p.<br />
Allum, L.L.; Maddigan, F.W. (<strong>2012</strong>). Unusual stability of diet of the New Zeal<strong>and</strong> fur seal (Arctocephalus forsteri) at Banks Peninsula,<br />
New Zeal<strong>and</strong>. New Zeal<strong>and</strong> Journal of Marine <strong>and</strong> Freshwater Research 46: 91–96.<br />
Baird, S.J. (Comp.) (1994). Nonfish species <strong>and</strong> fisheries interactions working group report. New Zeal<strong>and</strong> Fisheries Assessment Working<br />
Group Report 94/1. Ministry of Fisheries. [Unpublished report held in the NIWA library.] 54 p.<br />
Baird, S.J. (2005). <strong>Review</strong> of observer comments that relate to captures of New Zeal<strong>and</strong> fur seals (Arctocephalus forsteri) during hoki<br />
(Macruronus novaezel<strong>and</strong>iae) trawl fishery operations. NIWA Client Report WLG205-43. (Report prepared for the Hoki Fishery<br />
Management Company) 27 p.<br />
Baird, S.J. (2008). Incidental capture of New Zeal<strong>and</strong> fur seals (Arctocephalus forsteri) in longline fisheries in New Zeal<strong>and</strong> waters, 1994–<br />
95 to 2005–06. New Zeal<strong>and</strong> <strong>Aquatic</strong> <strong>Environment</strong> <strong>and</strong> <strong>Biodiversity</strong> Report No. 20. 21 p.<br />
Baird, S.J. (2011). New Zeal<strong>and</strong> fur seals — summary of current knowledge. New Zeal<strong>and</strong> <strong>Aquatic</strong> <strong>Environment</strong> <strong>and</strong> <strong>Biodiversity</strong> Report<br />
No. 72. 50 p.<br />
Baird, S.J.; Bradford, E. (2000). Factors that may have influenced the capture of New Zeal<strong>and</strong> fur seals (Arctocephalus forsteri) in the west<br />
coast South Isl<strong>and</strong> hoki fishery, 1991–98. NIWA Technical Report 92. 35 p.<br />
Baird, S.J.; Smith, M.H. (2007). Incidental capture of New Zeal<strong>and</strong> fur seals (Arctocephalus forsteri) in commercial fisheries in New<br />
Zeal<strong>and</strong> waters, 2003–04 to 2004–05. New Zeal<strong>and</strong> <strong>Aquatic</strong> <strong>Environment</strong> <strong>and</strong> <strong>Biodiversity</strong> Report No. 14. 98 p.<br />
Baker, B.; Jensz, K.; Cawthorn, M.; Cunningham, R. (2010a). Census of New Zeal<strong>and</strong> fur seals on the west coast of New Zeal<strong>and</strong>’s South<br />
Isl<strong>and</strong>. [Report to the Deepwater Group Ltd., available at www.latitude-42.com.au.] 22 p.<br />
Baker, C.S.;., B.L. Chilvers, B.L.;R. Constantine, R.;S. DuFresne, S.;R. Mattlin, R.;A. van Helden, A.; <strong>and</strong> R. Hitchmough, R. (2010b).<br />
Conservation status of New Zeal<strong>and</strong> marine mammals (suborders Cetacea <strong>and</strong> Pinnipedia), 2009. New Zeal<strong>and</strong> Journal of<br />
Marine <strong>and</strong> Freshwater Research 44: 101–115.<br />
Best,H. (2011). West Coast South Isl<strong>and</strong> monitoring of NZ fur seal pup numbers, 1991-2010 – a summary. Unpublished report for the<br />
Department of Conservation. 5 p.<br />
Boren, L.J. (2005). New Zeal<strong>and</strong> fur seals in the Kaikoura region: colony dynamics, maternal investment <strong>and</strong> health. A thesis submitted in<br />
partial fulfillment of the requirements for the degree of Doctor of Philosophy in Biological Sciences at the University of<br />
Canterbury, University of Canterbury. 261 p.<br />
Boren, L. (2010). Diet of New Zeal<strong>and</strong> fur seals (Arctocephalus forsteri): a summary. DOC Research & Development Series 319.<br />
Department of Conservation, Wellington. 19 p.<br />
Boren, L.; Morrissey, M.; Gemmell, N.J. (2008). Motor vehicle collisions <strong>and</strong> the New Zeal<strong>and</strong> fur seal in the Kaikoura region. Marine<br />
Mammal Science 24(1): 235–238.<br />
Boren, L.J.; Morrissey, M.; Muller, C.G.; Gemmell, N.J. (2006). Entanglement of New Zeal<strong>and</strong> fur seals in man-made debris at Kaikoura,<br />
New Zeal<strong>and</strong>. Marine Pollution Bulletin 52: 442–446.<br />
Bradshaw, C.J.A.; Barker, R.J.; Harcourt, R.G.; Davis, L.S. (2003a). Estimating survival <strong>and</strong> capture probability of fur seal pups using<br />
multistate mark-recapture models. Journal of Mammalogy 84(1): 65–80.<br />
Bradshaw, C.J.A.; Davis, L.S.; Lalas, C.; Harcourt, R.G. (2000). Geographic <strong>and</strong> temporal variation in the condition of pups of the New<br />
Zeal<strong>and</strong> fur seal (Arctocephalus forsteri): evidence for density dependence <strong>and</strong> differences in the marine environment. Journal of<br />
Zoology 252: 41–51.<br />
Bradshaw, C.J.A.; Harcourt, R.G.; Davis, L.S. (2003b). Male-biased sex ratios in New Zeal<strong>and</strong> fur seal pups relative to environmental<br />
variation. Behavioral Ecology <strong>and</strong> Sociobiology 53(5): 297–307.<br />
Bradshaw, C.J.A.; Lalas, C.; McConkey, S. (1998). New Zeal<strong>and</strong> sea lion predation on New Zeal<strong>and</strong> fur seals. New Zeal<strong>and</strong> Journal of<br />
Marine <strong>and</strong> Freshwater Research 32: 101–104.<br />
Bradshaw, C.J.A.; Thompson, C. M.; Davis, L.S.; Lalas, C. (1999). Pup density related to terrestrial habitat use by New Zeal<strong>and</strong> fur seals.<br />
Canadian Journal of Zoology 77(10): 1579–1586.<br />
Carey, P. W. (1992). Fish prey species of the New Zeal<strong>and</strong> fur seal (Arctocephalus forsteri Lesson). New Zeal<strong>and</strong> Journal of Ecology 16(1):<br />
41-46.<br />
Carey, P.W. (1998). New Zeal<strong>and</strong> fur seals (Arctocephalus forsteri) at the Snares Isl<strong>and</strong>s: a stabilised population? New Zeal<strong>and</strong> Journal of<br />
Marine <strong>and</strong> Freshwater Research 32(1): 113–118.<br />
Chilvers, B.L.; Wilson, K-J.; Hickling, G.J. (1995). Suckling behaviours <strong>and</strong> growth rates of New Zeal<strong>and</strong> fur seals, Arctocephalus forsteri,<br />
at Cape Foulwind, New Zeal<strong>and</strong>. New Zeal<strong>and</strong> Journal of Zoology 22: 263–270.<br />
Clement <strong>and</strong> Associates (2009). Mitigating incidental captures of fur seals in trawl fisheries. Final Report prepared for Department of<br />
Conservation project MIT2006/09. 45 p.<br />
Crawley, M.C.; Wilson, G.J. (1976). The natural history <strong>and</strong> behaviour of the New Zeal<strong>and</strong> fur seal (Arctocephalus forsteri). Tuatara 22(1):<br />
1–29.<br />
Dickie, G.S.; Dawson, S.M. (2003). Age, growth, <strong>and</strong> reproduction in New Zeal<strong>and</strong> fur seals. Marine Mammal Science 19(1): 173–185.<br />
Dans, S.L.; Alonso, M.K.; Crespo, E.A.; Pedraza, S.N.; Garcia, N.A. (2003). Interactions between marine mammals <strong>and</strong> high sea fisheries in<br />
Patagonia: an integrated approach.pp. 100–115, in Gales, N.; Hindell, M.; Kirkwood, R. (Eds.) Marine mammals fisheries<br />
tourism <strong>and</strong> management issues. CSIRO Publishing. 446p.<br />
Dix, B. (1993) A new record this century of a breeding colony in the North Isl<strong>and</strong> for the New Zeal<strong>and</strong> fur seal Arctocephalus forsteri.<br />
Journal of the Royal Society of New Zeal<strong>and</strong> 23: 1–4.<br />
Dowell, S.A.; Boren, L.J.; Negro, S.; Muller, C.G.; Caudron, A.K.; Gemmell, N.J. (2008). Rearing two New Zeal<strong>and</strong> fur seal<br />
(Arctocephalus forsteri) pups to weaning. Australian Journal of Zoology 56: 33–39.<br />
Duignan, P.J. (2003). Disease investigations in str<strong>and</strong>ed marine mammals, 1999–2002. DOC Science Internal Series 104. Department of<br />
Conservation, Wellington. 32 p.<br />
Duignan, P.J.; Jones, G.W. (2007): Autopsy of pinnipeds incidentally caught in commercial fisheries, 2002/03 <strong>and</strong> 2003/04. DOC Research<br />
& Development Series 280. Department of Conservation, Wellington. 41 p.<br />
60
AEBAR <strong>2012</strong>: Protected species: Fur seals<br />
Fea, N.I.; Harcourt, R.; Lalas, C. (1999). Seasonal variation in the diet of New Zeal<strong>and</strong> fur seals (Arctocephalus forsteri) at Otago Peninsula,<br />
New Zeal<strong>and</strong>. Wildlife Research 26: 147–160.<br />
D.; Bulman, C.; He, X.; Larcombe, J.; Littman, C. (2003). Trophic interactions between marine mammals <strong>and</strong> Australian fisheries: an<br />
ecosystem approach, pp. 62–99. In Gales, N.; Hindell, M.; Kirkwood, R. (Eds.), Marine mammals — fisheries, tourism <strong>and</strong><br />
management issues. CSIRO Publishing. 446 p.<br />
Goldsworthy, S.D.; Shaughnessy, P.D. (1994). Breeding biology <strong>and</strong> haul-out pattern of the New Zeal<strong>and</strong> fur seal, Arctocephalus forsteri, at<br />
Cape Gantheaume, South Australia. Wildlife Research 21: 365–376 .<br />
Goldsworthy, S.; Gales, N. (2008). Arctocephalus forsteri. In: IUCN 2010. IUCN Red List of Threatened Species. Version 2011.1.<br />
www.iucnredlist.org. Downloaded on 21 June 2011.<br />
Hamer, D.J.; Goldsworthy, S.D. (2006). Seal–fishery operational interactions: Identifying the environmental <strong>and</strong> operational aspects of a<br />
trawl fishery that contribute to bycatch <strong>and</strong> mortality of Australian fur seals (Arctocephalus pusillus doriferus). Biological<br />
Conservation 130: 517–529.<br />
Harcourt, R.G. (2001). Advances in New Zeal<strong>and</strong> mammalogy 1990–2000: Pinnipeds. Journal of the Royal Society of New Zeal<strong>and</strong> 31(1):<br />
135–160.<br />
Harcourt, R. G.; Bradshaw, C.J.A.; Dickson, K.; Davis, L.S. (2002). Foraging ecology of a generalist predator, the female New Zeal<strong>and</strong> fur<br />
seal. Marine Ecology Progress Series 227: 11–24.<br />
Harcourt, R.G.; Schulman, A.; Davis, L.S.; Trillmich, F (1995). Summer foraging by lactating female New Zeal<strong>and</strong> fur seals (Arctocepbalus<br />
forsteri) off Otago Peninsula, New Zeal<strong>and</strong>. Canadian Journal of Zoology 73: 678–690.<br />
Holborrow, J. (1999). The diet of New Zeal<strong>and</strong> fur seals (Arctocephalus forsteri) in Southern New Zeal<strong>and</strong>. [Unpublished MSc thesis,<br />
University of Otago, New Zeal<strong>and</strong>.]<br />
Hooper, J., J.M. Clark, C. Charman <strong>and</strong> D. Agnew. (2005). Sea mitigation measures on trawl vessels fishing for krill in CCAMLR Subarea<br />
48.3. CCAMLR Science 12: 195-205.<br />
IUCN, (2010). IUCN Red List of Threatened Species. Version 2011.1. www.iucnredlist.org. Downloaded on 21 June 2011.<br />
Lalas, C. (2008). Recolonisation of Otago, southern New Zeal<strong>and</strong>, by fur seals <strong>and</strong> sea lions: unexpected patterns <strong>and</strong> consequences, 15 p. In<br />
Clarkson, B.; Kurian, P.; Nachowitz, T.; Rennie, H. (Eds.), Proceedings of the Conser-Vision Conference, University of Waikato,<br />
available at www.waikato.ac.nz/wfass/conserv-vision.<br />
Lalas, C.; Bradshaw, C.J.A. (2001). Folklore <strong>and</strong> chimerical numbers: review of a millennium of interaction between fur seals <strong>and</strong> humans<br />
in the New Zeal<strong>and</strong> region. New Zeal<strong>and</strong> Journal of Marine <strong>and</strong> Freshwater Research 35(3): 477–497.<br />
Lalas, C.; Harcourt, R. (1995). Pup production of the New Zeal<strong>and</strong> fur seal on the Otago Peninsula, New Zeal<strong>and</strong>. Journal of the Royal<br />
Society of New Zeal<strong>and</strong> 25(1): 81–88.<br />
Lalas, C.; Murphy, B. (1998). Increase in the abundance of New Zeal<strong>and</strong> fur seals at the Catlins, South Isl<strong>and</strong>, New Zeal<strong>and</strong>. Journal of the<br />
Royal Society of New Zeal<strong>and</strong> 28(2): 287–294.<br />
Lento, G.M., R.H. Mattlin. G.K. Chambers <strong>and</strong> C. S. Baker. (1994). Geographic distribution of mitochondrial cytochrome b DNA<br />
haplotypes in New Zeal<strong>and</strong> fur seals (Arctocephalus forsteri). Canadian Journal of Zoology 72: 293 – 299.<br />
Ling JK, (2002). Impact of colonial sealing on seal stocks around Australia, New Zeal<strong>and</strong> <strong>and</strong> subantarctic isl<strong>and</strong>s between 150 <strong>and</strong> 170<br />
degrees East. Australian Mammalogy 24: 117-126.<br />
Mattlin, R.H. (1978a). Population biology, thermoregulation <strong>and</strong> site preference of the New Zeal<strong>and</strong> fur seal (Arctocephalus forsteri<br />
(Lesson, 1828) on the Open Bay Isl<strong>and</strong>s, New Zeal<strong>and</strong>. Unpubl. PhD Thesis, Christchurch, University of Canterbury.<br />
Mattlin, R.H. (1978b). Pup mortality of the New Zeal<strong>and</strong> fur seal (Arctocephalus forsteri Lesson). New Zeal<strong>and</strong> Journal of Ecology 1: 138–<br />
144.<br />
Mattlin, R.H. (1981). Pup growth of the New Zeal<strong>and</strong> fur seal, Arctocephalus forsteri, on the Open Bay Isl<strong>and</strong>s, New Zeal<strong>and</strong>. Journal of<br />
Zoology (London) 193: 305–314.<br />
Mattlin, R.H. (1987). New Zeal<strong>and</strong> fur seal, Arctocephalus forsteri, within the New Zeal<strong>and</strong> region. In Croxall, J.P.; Gentry, R.L. Status,<br />
biology, <strong>and</strong> ecology of fur seals: Proceedings of an international symposium <strong>and</strong> workshop, Cambridge, Engl<strong>and</strong>, 23–27 April<br />
1984. NOAA Technical Report NMFS-51.<br />
Mattlin, R.H. (1994a). Incidental catch of fur seals in the west coast South Isl<strong>and</strong> hoki trawl fishery, 1989–92. New Zeal<strong>and</strong> Fisheries<br />
Assessment Research Document 93/19. 18 p. (Unpublished report available at NIWA library, Wellington.)<br />
Mattlin, R.H. (Comp. & Ed.)(1994b). Seals <strong>and</strong> sea birds–fisheries interactions: report of a workshop, Wellington, 1992. New Zeal<strong>and</strong><br />
Fisheries Occasional Publication No. 8. 18 p. plus appendices.<br />
Mattlin, R.H.; Gales N.J.; Costa, D.P. (1998). Seasonal dive behaviour of lactating New Zeal<strong>and</strong> fur seals (Arctocephalus forsteri).<br />
Canadian Journal of Zoology 76(2): 350–360.<br />
Mellina, E.; Cawthorn, M. (2009). New Zeal<strong>and</strong> fur seal (Arctocephalus forsteri) population assessment in Fiordl<strong>and</strong> Sounds. Draft Report.<br />
Presented to AEWG July 7 2009, Wellington, New Zeal<strong>and</strong>. 31p.<br />
Miller, E.H. 1975. Body <strong>and</strong> organ measurements of fur seals, Arctocephalus forsteri (Lesson), from New Zeal<strong>and</strong>. Journal of Mammalogy<br />
56(2): 511-513.<br />
Moore, J.E.; Wallace, B.P.; Lewison, R.L.; Žydelis, R.; Cox, T.M.; Crowder, L.B. (2009). A review of marine mammal, sea turtle <strong>and</strong><br />
seabird bycatch in USA fisheries <strong>and</strong> the role of policy in shaping management. Marine Policy33: 435–451.<br />
Mormede, S.; Baird, S.J.; Smith, M.H. (2008). Factors that may influence the probability of fur seal capture in selected New Zeal<strong>and</strong><br />
fisheries. New Zeal<strong>and</strong> <strong>Aquatic</strong> <strong>Environment</strong> <strong>and</strong> <strong>Biodiversity</strong> Report No. 19. 42 p.<br />
Norman, F.I. (2000). Preliminary investigation of the bycatch of marine birds <strong>and</strong> mammals in inshore commercial Fisheries, Victoria,<br />
Australia. Biological Conservation 92:217–226.<br />
Richard, Y., Abraham, E. R., & Filippi, D. (2011). Assessment of the risk to seabird populations from New Zeal<strong>and</strong> commercial fisheries.<br />
Final Research Report for research projects IPA2009-19 <strong>and</strong> IPA2009-20. (Unpublished report held by Ministry of Fisheries,<br />
Wellington.). 66 pages.<br />
Richards, R. 1994: "The upl<strong>and</strong> seal" of the Antipodes <strong>and</strong> Macquarie Isl<strong>and</strong>s: a historian's perspective. Journal of The Royal Society of New<br />
Zeal<strong>and</strong> 24:289-295.<br />
Robertson, B.C.; Gemmell, N.J. (2005). Microsatellite DNA markers for the study of population structure in the New Zeal<strong>and</strong> fur seal<br />
Arctocephalus forsteri. DOC Science Internal Series 196. Department of Conservation, Wellington. 18 p.<br />
Rowe, S.J. (2007). A review of methodologies for mitigating incidental catch of protected marine mammals. DOC Research <strong>and</strong><br />
Development Series 283. 47p. Science <strong>and</strong> Technical Publishing . DOC Wellington.<br />
Rowe, S.J. (2009). Conservation Services Programme observer report: 1 July 2004 to 30 June 2007. DOC Marine Conservation Services<br />
Series 1. Department of Conservation, Wellington. 93 p.<br />
Shaughnessy, P.D. (1999). The action plan for Australian seals. <strong>Environment</strong> Australia. 62 p.<br />
Shaughnessy, P.D.; Davenport, S.R. (1996). Underwater videographic observations <strong>and</strong> incidental mortality of fur seals around fishing<br />
equipment in south-eastern Australia. Marine <strong>and</strong> Freshwater Research 47: 553–556.<br />
61
AEBAR <strong>2012</strong>: Protected species: Fur seals<br />
Shaughnessy, P.D.; Gales, N.J.; Dennis, T.E.; Goldsworthy, S.D. (1994). Distribution <strong>and</strong> abundance of New Zeal<strong>and</strong> fur seals,<br />
Arctocephalus forsteri, in South Australia <strong>and</strong> Western Australia. Wildlife Research 21(6): 667–695.<br />
Shaughnessy, P.D.; Payne, A.I.L (1979). Incidental mortality of Cape fur seals during trawl fishing activities in South African waters.<br />
Fisheries Bulletin, South Africa 12: 20–25.<br />
Smith, I.W.G. (1989). Maori impact on the marine megafauna: pre-European distributions of New Zeal<strong>and</strong> sea mammals, pp. 76–108. In<br />
Sutton, D.G. (Ed.) “Saying so doesn’t make it so”, papers in honour of B. Foss Leach. New Zeal<strong>and</strong> Archaeological Association,<br />
Dunedin.<br />
Smith, I.W.G. (2005). Retreat <strong>and</strong> resilience: fur seals <strong>and</strong> human settlement in New Zeal<strong>and</strong>, pp. 6–18. In Monks, G. (Ed.), “The<br />
Exploitation <strong>and</strong> Cultural Importance of Sea Mammals”. Oxbow Books, Oxford. 173 p.<br />
Smith, I.W.G. (2011). Estimating the magnitude of pre-European Maori marine harvest in two New Zeal<strong>and</strong> study areas. New Zeal<strong>and</strong><br />
<strong>Aquatic</strong> <strong>Environment</strong> <strong>and</strong> <strong>Biodiversity</strong> Report No. 82.<br />
Smith, M.H.; Baird, S.J. (2009). Model-based estimation of New Zeal<strong>and</strong> fur seal (Arctocephalus forsteri) incidental captures <strong>and</strong> strike<br />
rates for trawl fishing in New Zeal<strong>and</strong> waters for the years 1994–95 to 2005–06. New Zeal<strong>and</strong> <strong>Aquatic</strong> <strong>Environment</strong> <strong>and</strong><br />
<strong>Biodiversity</strong> Report No. 40. 90 p.<br />
Sorensen, J.H. (1969). New Zeal<strong>and</strong> seals with special reference to the fur seal. Fisheries Technical Report No. 39. N.Z. Marine<br />
Department. 35 p.<br />
Suisted, R.; Neale, D. M. (2004). Department of Conservation Marine Mammal Action Plan for 2005-2010. Department of Conservation:<br />
Wellington.<br />
Taylor, R.H. (1990). Records of subantarctic fur seals in New Zeal<strong>and</strong> (Note). New Zeal<strong>and</strong> Journal of Marine <strong>and</strong> Freshwater Research<br />
24: 499–502.<br />
Taylor, R.H. (1996). Distribution, abundance <strong>and</strong> pup production of the New Zeal<strong>and</strong> fur seal (Arctocephalus forsteri Lesson) at the Bounty<br />
Isl<strong>and</strong>s. Science for Conservation No. 32. 14 p.<br />
Taylor, R.H.; Barton, K.J.; Wilson, P.R.; Thomas, B.W.; Karl, B.J. (1995). Population status <strong>and</strong> breeding of New Zeal<strong>and</strong> fur seals<br />
(Arctocephalus forsteri) in the Nelson-northern Marlborough region. New Zeal<strong>and</strong> Journal of Marine <strong>and</strong> Freshwater Research<br />
29(2): 223–234.<br />
Thompson, F.N.; Abraham, E.R. (2010). Estimation of fur seal (Arctocephalus forsteri) bycatch in New Zeal<strong>and</strong> trawl fisheries, 2002–03 to<br />
2008–09. New Zeal<strong>and</strong> <strong>Aquatic</strong> <strong>Environment</strong> <strong>and</strong> <strong>Biodiversity</strong> Report No. 61. 37 p.<br />
Thompson, F.N., E.R. Abraham., <strong>and</strong> K. Berkenbusch. 2011. Marine mammal bycatch in New Zeal<strong>and</strong> trawl fisheries, 1995–96 to 2009–10.<br />
Draft Final Research Report for Ministry for Primary Industries project PRO2010-01 (Unpublished report held by the Ministry<br />
for Primary Industries, Wellington). 80 pages.<br />
Thompson, F.N., E.R. Abraham., <strong>and</strong> K. Berkenbusch. <strong>2012</strong>. Marine mammal bycatch in New Zeal<strong>and</strong> trawl fisheries, 1995–96 to 2010–11.<br />
Draft Final Research Report for Ministry for Primary Industries project PRO2010-01 (Unpublished report held by the Ministry<br />
for Primary Industries, Wellington). 90 pages.<br />
Troy, S.K., R. Mattlin, P.D. Shaughnessy <strong>and</strong> P.S. Davie. (1999). Morphology, age <strong>and</strong> survival of adult male New Zeal<strong>and</strong> fur seals,<br />
Arctocephalus forsteri, in South Australia, Wildlife Research 26: 21-34.<br />
Wade, P.R. 1998. Calculating limits to the allowable human caused mortality of cetaceans <strong>and</strong> pinnipeds. Marine Mammal Science 14: 1–<br />
37.<br />
Wilson, G. J. (1981). Distribution <strong>and</strong> abundance of the New Zeal<strong>and</strong> fur seal, Arctocephalus forsteri. Fisheries Research Division<br />
Occasional Publication No. 20. 39 p.<br />
Willis, T.J.; Triossi, F.; Meynier, L. (2008). Diet of fur seals Arctocephalus forsteri at Tonga Isl<strong>and</strong>, Abel Tasman National Park. NIWA<br />
Client Report: NEL2008-011 12 p. prepared for the Department of Conservation <strong>and</strong> available at<br />
http://www.doc.govt.nz/upload/documents/conservation/marine-<strong>and</strong>-coastal/marine-protected-areas/tonga-isl<strong>and</strong>-seal-diet.pdf.<br />
62
5. New Zeal<strong>and</strong> seabirds<br />
AEBAR <strong>2012</strong>: Protected species: Seabirds<br />
Scope of chapter This chapter focuses on estimates of captures <strong>and</strong> risk assessments<br />
conducted for seabirds that breed in New Zeal<strong>and</strong> waters. Also included<br />
are descriptions of the nature of fishing interactions, the management<br />
context <strong>and</strong> approach, trends in key indicators <strong>and</strong> major sources of<br />
uncertainty. It does not include detail on the biology or response of<br />
individual seabird species other than those four taxa for which<br />
quantitative population modelling has been conducted.<br />
Area New Zeal<strong>and</strong> EEZ <strong>and</strong> Territorial Sea (noting that many seabirds are<br />
highly migratory <strong>and</strong> spend prolonged periods outside the NZ EEZ; on<br />
the high seas these effects are considered by CCSBT, WCPFC,<br />
CCAMLR, SPRFMO, etc. <strong>and</strong> New Zeal<strong>and</strong> capture estimates are<br />
reported to those organisations).<br />
Focal localities Interactions with fisheries occur in many parts of the EEZ <strong>and</strong> TS.<br />
Key issues Quantitative <strong>and</strong> semi-quantitative risk assessments can be improved<br />
through better estimates of: incidental captures in fisheries that are<br />
poorly or un-observed; species identity, especially of birds released<br />
alive; cryptic mortality rates; survival of birds released alive; <strong>and</strong> the<br />
ability of seabird populations to sustain given levels of bycatch,<br />
especially given fisheries interactions <strong>and</strong> captures outside the New<br />
Zeal<strong>and</strong> EEZ <strong>and</strong> in non-commercial fisheries. Consolidating qualitative<br />
<strong>and</strong> (semi) quantitative risk assessments is a key challenge.<br />
Emerging issues Assessing fisheries impacts in the context of other factors influencing<br />
seabird survival <strong>and</strong> reproduction, including other anthropogenic effects.<br />
MFish Research<br />
(current)<br />
Other Govt<br />
Research (current)<br />
Links to 2030<br />
objectives<br />
Related<br />
chapters/issues<br />
Magnitude of “deck strike” mortality.<br />
PRO2006-01 Demographic, distributional <strong>and</strong> trophic information on<br />
selected seabird species; PRO2006-02 Modelling the effects of fishing<br />
on selected seabird species; PRO2010-01 Estimating incidental<br />
captures of protected species; PRO2010-02 Addressing key areas of<br />
uncertainty (including in risk assessments) for a revised NPOA-<br />
seabirds.<br />
DOC Conservation Services Programme (CSP) projects: INT<strong>2012</strong>-01,<br />
Observing commercial fisheries; INT2010-02, Identification of seabirds<br />
captured in New Zeal<strong>and</strong> fisheries; POP2011-02, Flesh-footed<br />
shearwater population study trial <strong>and</strong> at-sea distribution; POP<strong>2012</strong>-03,<br />
Black petrel at-sea distribution <strong>and</strong> population estimate; POP<strong>2012</strong>-04,<br />
Campbell Isl<strong>and</strong> <strong>and</strong> grey-headed albatrosses population estimates;<br />
POP<strong>2012</strong>-05, White-capped albatross population estimate; POP<strong>2012</strong>-<br />
06, Salvin’s albatross population estimate <strong>and</strong> at-sea distribution;<br />
POP<strong>2012</strong>-07, Gibson’s albatross population estimate; POP<strong>2012</strong>-08, Pitt<br />
Isl<strong>and</strong> shags foraging ecology; MIT<strong>2012</strong>-01, Inshore bottom longline<br />
seabird mitigation design <strong>and</strong> analysis; MIT<strong>2012</strong>-02, Inshore trawl<br />
warp-strike mitigation analysis of effectiveness; MIT<strong>2012</strong>-03, <strong>Review</strong> of<br />
mitigation techniques in setnet fisheries; MIT<strong>2012</strong>-04, Surface longline<br />
seabird mitigation; MIT<strong>2012</strong>-05, Protected species bycatch newsletter<br />
Objective 6: Manage impacts of fishing <strong>and</strong> aquaculture.<br />
Strategic Action 6.2: Set <strong>and</strong> monitor environmental st<strong>and</strong>ards,<br />
including for threatened <strong>and</strong> protected species <strong>and</strong> seabed impacts.<br />
National Plan of Action to reduce the incidental catch of seabirds in<br />
New Zeal<strong>and</strong> fisheries<br />
63
5.1. Context<br />
AEBAR <strong>2012</strong>: Protected species: Seabirds<br />
Seabird names <strong>and</strong> taxonomy in this document generally follow that adopted by the Ornithological<br />
Society of New Zeal<strong>and</strong> (OSNZ 2010) except where a different classification has been agreed by the<br />
parties to the Agreement for the Conservation of Albatrosses <strong>and</strong> Petrels, ACAP, or the New Zeal<strong>and</strong><br />
Threat Classification Scheme (NZTCS) classifies multiple taxa within a single OSNZ species (Table<br />
5.1). The key exceptions to the OSNZ (2010) classification are for: white-capped albatross (OSNZ<br />
cites a subspecies Thalassarche cauta steadi whereas full species status is used here following<br />
ACAP); blue penguins (OSNZ cites a single species, little penguin Eudyptula minor, whereas multiple<br />
sub-species are used here to reflect NZTCS); <strong>and</strong> OSNZ (2010) <strong>and</strong> white-fronted tern (OSNZ cite a<br />
single species Sterna striata, whereas multiple sub-species are use here to reflect NZTCS). Southern<br />
<strong>and</strong> northern Buller’s albatrosses are treated as separate taxa here, although ACAP lists a single<br />
species “Buller’s albatross”. The taxonomy <strong>and</strong> common names adopted here will, therefore, differ in<br />
some instances from those used in legislation or other documents.<br />
There are about 140 000 bird species worldwide, but fewer than 400 are classified as seabirds (being<br />
specialised marine foragers). All but seven seabird taxa in New Zeal<strong>and</strong> are absolutely protected<br />
under s.3 of the Wildlife Act 1953, meaning that it is an offence to hunt or kill them. Southern blackbacked<br />
gull, Larus dominicanus, is the only species that is not protected. Black shag, Phalacrocorax<br />
carbo, <strong>and</strong> sea hawk, Catharacta lonnbergi, are partially protected, <strong>and</strong> sooty shearwater, Puffinus<br />
griseus, grey-faced petrel, Pterodroma macroptera, little shag, Phalacrocorax melanoleucos<br />
brevirostris, <strong>and</strong> pied shag, Phalacrocorax varius, may be hunted or killed subject to Minister’s<br />
notification. Of the 85 seabird taxa that breed in New Zeal<strong>and</strong> waters, 47 are considered threatened<br />
(by far the largest number on the world). For albatrosses <strong>and</strong> petrels, a key threat is injury or death in<br />
fishing operations, although the Wildlife Act provides defences if the death or injury took place as<br />
part of a fishing operation or if all reasonable steps to avoid the death or injury were taken, as long as<br />
the interaction is reported. Commercial fishers are required to complete a Non-Fish <strong>and</strong> Protected<br />
Species Catch Return (NFPSR, s11E of the Fisheries (Reporting) Regulations 2001).<br />
Relevant, high level guidance from the 2005 statement of General Policy under the Conservation Act<br />
1987 <strong>and</strong> Wildlife Act 1953 includes the following stated policies:<br />
4.4 (f) Marine protected species should be managed for their long-term viability <strong>and</strong> recovery<br />
throughout their natural range.<br />
4.4 (g) Where unprotected marine species are identified as threatened, consideration will be<br />
given to amending the Wildlife Act 1953 schedules to declare such species absolutely<br />
protected.<br />
4.4 (j) Human interactions with marine mammals <strong>and</strong> other marine protected species should be<br />
managed to avoid or minimise adverse effects on populations <strong>and</strong> individuals.<br />
4.4 (l) The Department should work with other agencies <strong>and</strong> interests to protect marine species.<br />
The Minister of Conservation may approve a Population Management Plan (PMP) for one or more<br />
species under s.14F of the Wildlife Act <strong>and</strong> a PMP can include a maximum allowable level of fishingrelated<br />
mortality for a species (MALFiRM). Such a limit would apply to New Zeal<strong>and</strong> fisheries<br />
waters <strong>and</strong> would be for the purpose of enabling a threatened species to achieve a non-threatened<br />
status as soon as reasonably practicable or, in the case of non-threatened species, neither cause a net<br />
reduction in the size of the population nor seriously threaten the reproductive capacity of the species<br />
(s.14G). No PMPs are in place for seabirds but, in the absence of a PMP, the Minister of Fisheries<br />
(Primary Industries) may, after consultation with the Minister of Conservation, take such measures as<br />
they consider necessary to avoid, remedy, or mitigate the effect of fishing-related mortality on any<br />
protected species (s.15(2) of the Fisheries Act).<br />
64
AEBAR <strong>2012</strong>: Protected species: Seabirds<br />
New Zeal<strong>and</strong> is a signatory to a number of international conventions <strong>and</strong> agreements to<br />
provide for the management of threats to seabirds, including:<br />
• the United Nations Convention on the Law of the Sea (UNCLOS);<br />
• the United Nations Fish Stocks Agreement (insofar as it relates to the conservation of<br />
non-target, associated <strong>and</strong> dependent species);<br />
• the Convention on Biological Diversity (CBD);<br />
• the Convention on Migratory Species (CMS);<br />
• the Food <strong>and</strong> Agriculture Organisation’s (FAO) International Plan of Action for<br />
Reducing the Incidental Catch of Seabirds in Longline Fisheries (IPOA);<br />
• the FAO Code of Conduct for Responsible Fisheries <strong>and</strong> the interpretive Best Practice<br />
Technical Guidelines;<br />
• the Agreement on the Conservation of Albatrosses <strong>and</strong> Petrels (ACAP)<br />
The ACAP agreement requires that parties achieve <strong>and</strong> maintain a favourable conservation<br />
status for a number of albatross <strong>and</strong> petrel taxa. Under the IPOA-seabirds, New Zeal<strong>and</strong><br />
developed a National Plan of Action (NPOA) to reduce the incidental catch of seabirds in<br />
New Zeal<strong>and</strong> fisheries in 2004 (MFish <strong>and</strong> DOC 2004) <strong>and</strong> recently (<strong>2012</strong>) consulted on a<br />
revised NPOA-seabirds (http://www.fish.govt.nz/en-nz/Consultations/npoa+seabirds/default.htm). The<br />
scopes of the 2004 NPOA (<strong>and</strong> the <strong>2012</strong> draft) are broader than the original IPOA to facilitate<br />
a co-ordinated <strong>and</strong> long-term approach to reducing the impact of fishing activity on seabirds.<br />
Management of fishing-related mortality of seabirds is consistent with Fisheries 2030 Objective 6:<br />
Manage impacts of fishing <strong>and</strong> aquaculture. Further, the management actions follow Strategic Action<br />
6.2: Set <strong>and</strong> monitor environmental st<strong>and</strong>ards, including for threatened <strong>and</strong> protected species <strong>and</strong><br />
seabed impacts.<br />
All National Fisheries Plans except that for freshwater fisheries are relevant to the management of<br />
fishing-related mortality of seabirds.<br />
Under the National Deepwater Plan, the objective most relevant for management of seabirds is<br />
Management Objective 2.5: Manage deepwater <strong>and</strong> middle-depth fisheries to avoid or minimise<br />
adverse effects on the long-term viability of endangered, threatened <strong>and</strong> protected species.<br />
Management objective 7 of the National Fisheries Plan for Highly Migratory Species (HMS) is to<br />
“Implement an ecosystem approach to fisheries management, taking into account associated <strong>and</strong><br />
dependent species”. This comprises four components: Avoid, remedy, or mitigate the adverse effects<br />
of fishing on associated <strong>and</strong> dependent species, including through maintaining food-chain<br />
relationships; Minimise unwanted bycatch <strong>and</strong> maximise survival of incidental catches of protected<br />
species in HMS fisheries, using a risk management approach; Increase the level <strong>and</strong> quality of<br />
information available on the capture of protected species; <strong>and</strong> Recognise the intrinsic values of HMS<br />
<strong>and</strong> their ecosystems, comprising predators, prey, <strong>and</strong> protected species.<br />
The <strong>Environment</strong> Objective is the same for all groups of fisheries in the draft National Fisheries Plan<br />
for Inshore Finfish <strong>and</strong> the draft National Fisheries Plan for Inshore Shellfish, to “Minimise adverse<br />
effects of fishing on the aquatic environment, including on biological diversity”. The draft National<br />
Fisheries Plan for Freshwater has the same objective but is unlikely to be relevant to management of<br />
fishing-related mortality of seabirds.<br />
65
AEBAR <strong>2012</strong>: Protected species: Seabirds<br />
Table 5.1: List of New Zeal<strong>and</strong> seabird taxa, excluding occasional visitors <strong>and</strong> vagrants, according to the<br />
Ornithological Society of New Zeal<strong>and</strong> (OSNZ 2010) unless otherwise indicated (all taxa under the New<br />
Zeal<strong>and</strong> Threat Classification System are listed <strong>and</strong> ACAP taxonomy generally takes precedence). Broad<br />
categories of threat status are listed, but comprehensive threat classifications are given by IUCN<br />
(http://www.iucnredlist.org/) <strong>and</strong> DOC (http://www.doc.govt.nz/publications/conservation/nz-threatclassification-system/nz-threat-classification-system-lists-2008-2011/,<br />
see also Miskelly et al. 2008, to be<br />
updated shortly).<br />
Common name Scientific name DOC category<br />
W<strong>and</strong>ering albatross Diomedea exulans –<br />
Antipodean albatross Diomedea antipodensis antipodensis Threatened<br />
Gibson's albatross Diomedea antipodensis gibsonii Threatened<br />
Southern royal albatross Diomedea epomophora At Risk<br />
Northern royal albatross Diomedea sanfordi At Risk<br />
Black-browed albatross Thalassarche melanophrys –<br />
Campbell black-browed albatross Thalassarche impavida At Risk<br />
Southern Buller's albatross Thalassarche bulleri At Risk<br />
Northern Buller's albatross Thalassarche bulleri platei. At Risk<br />
White-capped albatross Thalassarche steadi* Threatened<br />
Salvin's albatross Thalassarche salvini Threatened<br />
Chatham Isl<strong>and</strong> albatross Thalassarche eremita At Risk<br />
Indian yellow-nosed albatross Thalassarche carteri –<br />
Grey-headed albatross Thalassarche chrysostoma Threatened<br />
Light mantled sooty albatross Phoebetria palpebrata At Risk<br />
Flesh-footed shearwater Puffinus carneipes Threatened<br />
Wedge-tailed shearwater Puffinus pacificus At Risk<br />
Buller's shearwater Puffinus bulleri At Risk<br />
Sooty shearwater Puffinus griseus At Risk<br />
Short-tailed shearwater Puffinus tenuirostris –<br />
Fluttering shearwater Puffinus gavia At Risk<br />
Hutton's shearwater Puffinus huttoni At Risk<br />
Kermadec little shearwater Puffinus assimilis kermadecensis At Risk<br />
North Isl<strong>and</strong> little shearwater Puffinus assimilis haurakiensis At Risk<br />
Subantarctic little shearwater Puffinus elegans At Risk<br />
Northern diving petrel Pelecanoides urinatrix urinatrix At Risk<br />
Southern diving petrel Pelecanoides urinatrix chathamensis At Risk<br />
Subantarctic diving petrel Pelecanoides urinatrix exsul –<br />
South Georgian diving petrel Pelecanoides georgicus Threatened<br />
Grey petrel Procellaria cinerea At Risk<br />
Black (Parkinson's) petrel Procellaria parkinsoni Threatened<br />
Westl<strong>and</strong> petrel Procellaria westl<strong>and</strong>ica At Risk<br />
White-chinned petrel Procellaria aequinoctialis At Risk<br />
Kerguelen petrel Lugensa brevirostris –<br />
Southern Cape petrel Daption capense capense –<br />
Snares Cape petrel Daption capense australe At Risk<br />
Antarctic fulmar Fulmarus glacialoides –<br />
Southern giant petrel Macronectes giganteus –<br />
Northern giant petrel Macronectes halli At Risk<br />
Fairy prion Pachyptila turtur At Risk<br />
Chatham fulmar prion Pachyptila crassirostris crassirostris At Risk<br />
Lesser fulmar prion Pachyptila crassirostris flemingi At Risk<br />
Thin-billed prion Pachyptila belcheri –<br />
Antarctic prion Pachyptila desolata At Risk<br />
Salvin's prion Pachyptila salvini –<br />
Broad-billed prion Pachyptila vittata At Risk<br />
Blue petrel Halobaena caerulea –<br />
Pycroft's petrel Pterodroma pycrofti At Risk<br />
Cook's petrel Pterodroma cookii At Risk<br />
Black-winged petrel Pterodroma nigripennis –<br />
Chatham petrel Pterodroma axillaris Threatened<br />
Mottled petrel Pterodroma inexpectata At Risk<br />
White-naped petrel Pterodroma cervicalis At Risk<br />
Kermadec petrel Pterodroma neglecta At Risk<br />
Grey-faced petrel Pterodroma macroptera gouldi –<br />
Chatham Isl<strong>and</strong> taiko Pterodroma magentae Threatened<br />
66
AEBAR <strong>2012</strong>: Protected species: Seabirds<br />
White-headed petrel Pterodroma lessonii –<br />
Soft-plumaged petrel Pterodroma mollis –<br />
Wilson's storm petrel Oceanites oceanicus –<br />
Kermadec storm petrel Pelagodroma albiclunis Threatened<br />
New Zeal<strong>and</strong> storm petrel Pealeornis maoriana Threatened<br />
Grey-backed storm petrel Garrodia nereis At Risk<br />
New Zeal<strong>and</strong> white-faced storm petrel Pelagodroma marina maoriana At Risk<br />
Black-bellied storm petrel Fregetta tropica –<br />
White-bellied storm petrel Fregetta grallaria grallaria Threatened<br />
Yellow-eyed penguin Megadyptes antipodes Threatened<br />
Northern blue penguin** Eudyptula minor iredalei** At Risk<br />
Southern blue penguin** Eudyptula minor minor** At Risk<br />
Chatham Isl<strong>and</strong> blue penguin** Eudyptula minor chathamensis** At Risk<br />
White-flippered blue penguin** Eudyptula minor albosignata** Threatened<br />
Eastern rockhopper penguin Eudyptes filholi Threatened<br />
Fiordl<strong>and</strong> crested penguin Eudyptes pachyrhynchus Threatened<br />
Snares crested penguin Eudyptes robustus At Risk<br />
Erect-crested penguin Eudyptes sclateri At Risk<br />
Red-tailed tropicbird Phaethon rubricauda Threatened<br />
Australasian gannet Morus serrator –<br />
Masked booby Sula dactylatra fullageri Threatened<br />
Black shag Phalacrocorax carbo novaeholl<strong>and</strong>iae At Risk<br />
Pied shag Phalacrocorax varius varius Threatened<br />
Little black shag Phalacrocorax sulcirostris At Risk<br />
Little shag Phalacrocorax melanoleucos brevirostris –<br />
Stewart Isl<strong>and</strong> shag Leucocarbo chalconotus Threatened<br />
King shag Leucocarbo carunculatus Threatened<br />
Chatham Isl<strong>and</strong> shag Leucocarbo onslowi Threatened<br />
Bounty Isl<strong>and</strong> shag Leucocarbo ranfurlyi Threatened<br />
Auckl<strong>and</strong> Isl<strong>and</strong> shag Leucocarbo colensoi Threatened<br />
Campbell Isl<strong>and</strong> shag Leucocarbo campbelli At Risk<br />
Spotted shag Stictocarbo punctatus punctatus –<br />
Blue shag Stictocarbo punctatus oliveri At Risk<br />
Pitt Isl<strong>and</strong> shag Stictocarbo featherstoni Threatened<br />
Subantarctic skua Catharacta antarctica lonnbergi At Risk<br />
South Polar skua Catharacta maccormicki –<br />
Pomarine skua Stercorarius pomarinus –<br />
Arctic skua Stercorarius parasiticus –<br />
Long-tailed skua Stercorarius longicaudus –<br />
Southern black-backed gull Larus dominicanus dominicanus –<br />
Red-billed gull Larus novaeholl<strong>and</strong>iae scopulinus Threatened<br />
Black-billed gull Larus bulleri Threatened<br />
Caspian tern Hydroprogne caspia Threatened<br />
White-fronted tern*** Sterna striata striata*** At Risk<br />
Southern white-fronted tern*** Sterna striata auckl<strong>and</strong>orna*** Threatened<br />
Arctic tern Sterna paradisaea –<br />
New Zeal<strong>and</strong> Antarctic tern Sterna vittata bethunei At Risk<br />
Eastern little tern Sternula albifrons sinensis –<br />
New Zeal<strong>and</strong> fairy tern Sternula nereis davisae Threatened<br />
Sooty tern Onychoprion fuscata serratus At Risk<br />
Black-fronted tern Chlidonias albostriatus Threatened<br />
White-winged black tern Chlidonias leucopterus –<br />
Brown noddy Anous stolidus pileatus –<br />
Black noddy Anous tenuirostris minutus At Risk<br />
Grey noddy Procelsterna cerulea albivittata At Risk<br />
White tern Gygis alba c<strong>and</strong>ida Threatened<br />
Notes:<br />
* OSNZ (2010) classify New Zeal<strong>and</strong> white-capped albatross as a subspecies Thalassarche cauta steadi. Full species status<br />
is used here following ACAP.<br />
** OSNZ (2010) classify a single species, little penguin Eudyptula minor. Multiple taxa are included here to reflect<br />
classification in the New Zeal<strong>and</strong> Threat Classification Scheme.<br />
*** OSNZ (2010) classify a single species, white-fronted tern Sterna striata. Multiple taxa are included here to reflect<br />
classification in the New Zeal<strong>and</strong> Threat Classification Scheme.<br />
67
5.2. Biology<br />
AEBAR <strong>2012</strong>: Protected species: Seabirds<br />
Taylor (2000) provided an excellent summary of the characteristics, ecology, <strong>and</strong> life history traits of<br />
seabirds (defined for the purpose of this document by the list in Table 5.1) which is further<br />
summarised here.<br />
All seabirds spend part of their life cycle feeding over the open sea. They have webbed feet, waterresistant<br />
feathering to enable them to fully immerse in salt water, <strong>and</strong> powerful wings or flippers. All<br />
have bills with sharp hooks, points, or filters which enable them to catch fish, cephalopods,<br />
crustaceans, <strong>and</strong> plankton. Seabirds can drink saltwater <strong>and</strong> have physiological adaptations to remove<br />
excess salt.<br />
Most seabird taxa are relatively long-lived; most live to 20 years <strong>and</strong> 30–40 years is typical for the<br />
oldest individuals. A few groups, notably albatrosses, can live for 50–60 years. Most taxa have<br />
relatively late sexual maturity. Red-billed gull <strong>and</strong> blue penguin have been recorded nesting as<br />
yearlings <strong>and</strong> diving petrels <strong>and</strong> yellow-eyed penguins can begin as 2-year-olds, but most seabirds<br />
start nesting only at age 3–6 years, <strong>and</strong> some albatross <strong>and</strong> petrel taxa delay nesting until 8–15 years<br />
old. In these late developers, individuals first return to colonies at 2–6 years old. Richard et al. (2011)<br />
list values for several demographic parameters that they used for a comprehensive seabird risk<br />
assessment. Most seabirds, <strong>and</strong> especially albatrosses <strong>and</strong> some petrels, usually return to the breeding<br />
colony where they were reared, or nest close-by. Seabirds also have a tendency to mate for long<br />
periods with the same partner, <strong>and</strong> albatross pairs almost always remain together unless one partner<br />
fails to return to the colony.<br />
The number of eggs laid varies among families. Albatrosses <strong>and</strong> petrels lay only one egg per year<br />
(sometimes nesting every other year) <strong>and</strong> do not replace it if it is damaged or lost. Other taxa such as<br />
gannets lay one egg but can replace it if the egg is lost. Most penguins lay two eggs but some raise<br />
only one chick <strong>and</strong> eject the second egg; replacement laying is uncommon. Blue penguins, gulls, <strong>and</strong><br />
terns lay 1–3 eggs <strong>and</strong> can lay up to three clutches in a year if eggs are damaged or lost. Shags lay 2–5<br />
eggs, can replace clutches, <strong>and</strong> have several breeding seasons in a year. Incubation in albatrosses <strong>and</strong><br />
petrels lasts 40–75 days <strong>and</strong> chick rearing 50–280 days. In gulls <strong>and</strong> terns, incubation is completed in<br />
20–25 days <strong>and</strong> chicks fledge in 20–40 days. In general, the lower the potential reproductive output of<br />
a taxon, the higher the adult survival rates <strong>and</strong> longevity.<br />
Some seabirds such as shags, blue penguins, <strong>and</strong> yellow-eyed penguins live their lives <strong>and</strong> forage<br />
relatively close to where they breed, but many, including most albatrosses <strong>and</strong> petrels, spend large<br />
parts of their lives in international waters or in the waters of other nations far away from their<br />
breeding locations. They can travel great distances across oceans during foraging flights <strong>and</strong><br />
migratory journeys.<br />
5.3. Global underst<strong>and</strong>ing of fisheries interactions<br />
Fishing related mortality of seabirds has been recognised as a serious, worldwide issue for only about<br />
20 years (Bartle 1991, Brothers 1991, Brothers et al. 1999, Croxall 2008) <strong>and</strong> the Food & Agriculture<br />
Organization of the United Nations (FAO) released its International Plan of Action for reducing<br />
incidental catch of seabirds in longline fisheries (IPOA-seabirds) in 1999 (FAO 1999). The IPOA-<br />
Seabirds called on countries with (longline) fisheries that interact with seabirds to assess their<br />
fisheries to determine if a problem exists <strong>and</strong>, if so, to develop national plans (NPOA–seabirds) to<br />
reduce the incidental seabird catch in their fisheries. Lewison et al. (2004) noted that, in spite of the<br />
recognition of the problem, few comprehensive assessments of the effects of fishing-related mortality<br />
had been conducted in the decade or so after the problem was recognised. They reasoned that: many<br />
vulnerable species live in pelagic habitats, making surveys logistically complex <strong>and</strong> expensive;<br />
capture data are sparse; <strong>and</strong> underst<strong>and</strong>ing of the potential for affected populations to sustain<br />
68
AEBAR <strong>2012</strong>: Protected species: Seabirds<br />
additional mortality is poor. Soykan et al. (2008) identified similar questions in a Theme Section<br />
published in Endangered Species Research, including: Where is bycatch most prevalent? Which<br />
species are taken as bycatch? Which fisheries <strong>and</strong> gear types result in the highest bycatch of marine<br />
megafauna? What are the population-level effects on bycatch species? How can bycatch be reduced?<br />
There has been substantial progress on these questions since 2004. Croxall et al (<strong>2012</strong>) reviewed the<br />
threats to 346 seabird taxa <strong>and</strong> concluded that: seabirds are more threatened than other comparable<br />
groups of birds; that their status has deteriorated faster over recent decades; <strong>and</strong> that fishing-related<br />
mortality is the most pervasive <strong>and</strong> immediate threat to many albatross <strong>and</strong> petrels. They listed the<br />
principal threats while at sea were posed by commercial fisheries (through competition <strong>and</strong> mortality<br />
on fishing gear) <strong>and</strong> pollution, <strong>and</strong> those on l<strong>and</strong> were alien predators, habitat degradation <strong>and</strong> human<br />
disturbance. Direct exploitation, impacts of aquaculture, energy generation operations, <strong>and</strong> climate<br />
change were listed as threats for some taxa or areas where underst<strong>and</strong>ing was particularly poor.<br />
Croxall et al (<strong>2012</strong>) categorise responses to the issue of fishing-related mortality as<br />
• using long-term demographic studies of relevant seabird species, linked to observational <strong>and</strong><br />
recovery data to identify the cause of population declines (e.g. Croxall et al. 1998, Tuck et al.<br />
2004, Poncet et al. 2006);<br />
• risk assessments, based on spatiotemporal overlap between seabird species susceptible to<br />
bycatch <strong>and</strong> effort data for fisheries likely to catch them (e.g. Waugh et al. 2008; Filippi et al.<br />
2010; Tuck et al. 2011);<br />
• working with multinational <strong>and</strong> international bodies (e.g. FAO <strong>and</strong> RFMOs) to develop <strong>and</strong><br />
implement appropriate regulations for the use of best-practice techniques to reduce or<br />
eliminate seabird bycatch <strong>and</strong>;<br />
• working with fishers (<strong>and</strong> national fishery organisations) to assist cost-effective<br />
implementation of these mitigation techniques.<br />
Seabirds are ranked by the International Union for the Conservation of Nature (IUCN) as the world’s<br />
most threatened bird grouping (Croxall et al. <strong>2012</strong>). Globally they face a number of threats to their<br />
long term viability, both at their breeding sites <strong>and</strong> while foraging at sea. Work at the global level on<br />
reducing threats at breeding sites is a major focus of the Agreement on the Conservation of<br />
Albatrosses <strong>and</strong> Petrels (ACAP) <strong>and</strong>, in New Zeal<strong>and</strong>, is a DOC responsibility, but the key threat to<br />
seabirds at sea, especially albatrosses <strong>and</strong> petrels, is incidental capture <strong>and</strong> death through fishing<br />
operations.<br />
Some seabirds do not range far from their breeding or roosting sites <strong>and</strong> incidental captures of these<br />
taxa can be managed by a single jurisdiction. Conversely, conservation of highly migratory taxa such<br />
as albatrosses <strong>and</strong> petrels cannot be achieved by one country acting independently of other nations<br />
which share the same populations (e.g., ACAP). Because of this, in recent years countries which share<br />
populations of threatened seabirds have sought to take actions on an international level to complement<br />
policy <strong>and</strong> actions taken within their own jurisdictions.<br />
The ICES Working Group on Seabird Ecology agreed (WGSE 2011) that the three most important<br />
indirect effects of fisheries on seabird populations were: the harvesting of seabird food; discards as<br />
food subsidies; <strong>and</strong> modification of marine habitats by dredges <strong>and</strong> trawls. Many seabird prey species<br />
are fished commercially (e.g., Furness 2003) or can be impacted indirectly by fishing of larger<br />
predators. These relationships are complex <strong>and</strong> poorly understood but WGSE (2011) agreed that<br />
impacts on populations of seabirds were inevitable. Fishery discards <strong>and</strong> offal have the potential to<br />
benefit seabird species, especially those that ordinarily scavenge (Furness et al. 1992, Wagner <strong>and</strong><br />
Boersma 2011). However, discarding can also modify the way in which birds forage for food (e.g.,<br />
Bartumeus et al. 2010; Louzao et al. 2011), sometimes with farther-reaching behavioural<br />
consequences with negative as well as positive effects. Louzao et al. (2011) stated that discards can<br />
affect movement patterns (Arcos <strong>and</strong> Oro 1996), improve reproductive performance (Oro et al., 1997;<br />
69
AEBAR <strong>2012</strong>: Protected species: Seabirds<br />
1999) <strong>and</strong> increase survival (Oro <strong>and</strong> Furness, 2002; Oro et al. 2004). Benefits for scavengers <strong>and</strong><br />
kleptoparasitic taxa (those that obtain food by stealing from other animals) feeding on discards can<br />
also have consequent negative impacts on other species, especially diving species, that share breeding<br />
sites or are subject to displacement (Wagner <strong>and</strong> Boersma 2011). Dredging <strong>and</strong> bottom trawling both<br />
affect benthic habitat <strong>and</strong> fauna (see Rice 2006 <strong>and</strong> the benthic effects chapter in this document) <strong>and</strong><br />
WGSE (2011) agreed that this probably affects some seabird populations, although little work has<br />
been done in this area.<br />
5.4. State of knowledge in New Zeal<strong>and</strong><br />
Before the arrival of humans, the absence of mammalian predators in New Zeal<strong>and</strong> made it a<br />
relatively safe breeding place for seabirds <strong>and</strong> large numbers of a wide variety of taxa bred here,<br />
including substantial numbers on the main North <strong>and</strong> South Isl<strong>and</strong>s. Today, New Zeal<strong>and</strong>’s extensive<br />
coastline, numerous inshore <strong>and</strong> offshore isl<strong>and</strong>s (many of them predator free) <strong>and</strong> surrounding seas<br />
<strong>and</strong> oceans continue to make it an important foraging <strong>and</strong> breeding ground for about 145 seabird taxa,<br />
second only to the USA (GA Taylor, Department of Conservation, personal communication). Roughly<br />
95 of these taxa breed in New Zeal<strong>and</strong> (Figures 5.1 <strong>and</strong> 5.2; Table 5.2), including the greatest number<br />
of albatrosses (14), petrels (32), shags (13) <strong>and</strong> penguins (9) of any area in the world (Miskelly et al.<br />
2008). More than a third are endemic (i.e. breed nowhere else in the world), giving New Zeal<strong>and</strong> by<br />
far the largest number of endemic seabird taxa in the world.<br />
Figure 5.1 (after Croxall et al <strong>2012</strong>). Number of endemic breeding seabird taxa by country.<br />
Some seabirds use New Zeal<strong>and</strong> waters but do not breed here. Some visit here occasionally to feed<br />
(e.g. Indian Ocean yellow-nosed albatross <strong>and</strong> snowy w<strong>and</strong>ering albatross), whereas others are<br />
frequent visitors (e.g. short-tailed shearwater <strong>and</strong> Wilson’s storm petrel), sometimes for extended<br />
durations (e.g. juvenile giant petrels).<br />
Taylor (2000) lists a wide range of threats to New Zeal<strong>and</strong> seabird taxa including introduced<br />
mammals, avian predators (weka), disease, fire, weeds, loss of nesting habitat, competition for nest<br />
sites, coastal development, human disturbance, commercial <strong>and</strong> cultural harvesting, volcanic<br />
eruptions, pollution, plastics <strong>and</strong> marine debris, oil spills <strong>and</strong> exploration, heavy metals or chemical<br />
contaminants, global sea temperature changes, marine biotoxins, <strong>and</strong> fisheries interactions. Seabirds<br />
are caught in trawl, longline, set-net, <strong>and</strong>, occasionally, other fisheries (e.g, annual assessments by SJ<br />
Baird from 1994 to 2005, Baird & Smith 2008, Waugh et al. 2008, Abraham et al. 2010) <strong>and</strong> New<br />
Zeal<strong>and</strong> released its National Plan of Action to reduce the incidental catch of seabirds (NPOAseabirds)<br />
in 2004. This stated there was, at that time, limited information about the level of incidental<br />
70
AEBAR <strong>2012</strong>: Protected species: Seabirds<br />
catch <strong>and</strong> population characteristics of different seabird taxa, <strong>and</strong> that this made quantifying the<br />
overall impact of fishing difficult. A key objective of New Zeal<strong>and</strong>’s NPOA-seabirds was to improve<br />
this information <strong>and</strong> gain a better underst<strong>and</strong>ing of the impact of incidental catch on seabird taxa.<br />
Seabird taxa caught in New Zeal<strong>and</strong> fisheries range in IUCN threat ranking from critically<br />
endangered (e.g. Chatham Isl<strong>and</strong> shag), to least concern (e.g. flesh-footed shearwater) (e.g., Vie et al.<br />
2009).<br />
Table 5.2 (after Taylor 2000): Number of species (spp.) <strong>and</strong> taxa of seabirds of different families in New<br />
Zeal<strong>and</strong> <strong>and</strong> worldwide in 2000. Additional taxa may have been recorded since.<br />
NZ visitors,<br />
World breeding NZ breeding vagrants<br />
Family Common name N spp. N taxa N spp. N taxa N spp. N taxa<br />
Spheniscidae Penguins 17 26 6 10 8 10<br />
Gaviidae Divers, loons 4 6 – – – –<br />
Podicipedidae Grebes 10 20 2 2 – –<br />
Diomedeidae Albatrosses 24 24 13 13 7 7<br />
Procellariidae Petrels, shearwaters 70 109 28 31 20 23<br />
Hydrobatidae Storm-petrels 20 36 4 5 2 3<br />
Pelecanoididae Diving petrels 4 9 2 4 – –<br />
Phaethontidae Tropicbirds 3 12 1 1 1 1<br />
Pelecanidae Pelicans 7 12 – – 1 1<br />
Sulidae Gannets 9 19 2 2 1 1<br />
Phalacrocoracidae Shags 39 57 12 13 – –<br />
Fregatidae Frigatebirds 5 11 – – 2 2<br />
Anatidae Marine ducks 18 27 – – – –<br />
Scolopacidae Phalaropes 2 2 – – 2 2<br />
Chionididae Sheathbills 2 5 – – – –<br />
Stercorariidae Skuas 7 10 1 1 4 4<br />
Laridae Gulls 51 78 3 3 – –<br />
Sternidae Terns, noddies 43 121 10 11 8 8<br />
Rynchopidae Skimmers 2 4 – – – –<br />
Alcidae Auks, puffins 22 45 – – – –<br />
Total 359 633 84 96 56 62<br />
Figure 5.2 (from Croxall et al. <strong>2012</strong>, supplementary material): The number of breeding <strong>and</strong> resident<br />
seabird species by country in each IUCN category (excluding Least Concern). FST, French Southern<br />
Territories; SGSSI, South Georgia & South S<strong>and</strong>wich Isl<strong>and</strong>s; FI(M), Falkl<strong>and</strong> Isl<strong>and</strong>s (Malvinas);<br />
H&M, Heard Isl<strong>and</strong> & McDonald Isl<strong>and</strong>s.<br />
71
AEBAR <strong>2012</strong>: Protected species: Seabirds<br />
Different taxa <strong>and</strong> populations face different threats from fishing operations depending on their<br />
biological characteristics <strong>and</strong> foraging behaviours. Biological traits such as diving ability, agility, size,<br />
sense of smell, eyesight <strong>and</strong> diet, foraging factors such as the season <strong>and</strong> areas they forage, their<br />
aggressiveness, the boldness (or shyness) they display in their attraction to fishing activity can all<br />
determine their susceptibility to capture, injury, or death from fishing operations. Some fishing<br />
methods pose particular threats to some guilds or types of seabirds. For example, penguins are<br />
particularly vulnerable to set net operations <strong>and</strong> large albatrosses appear to be vulnerable to all forms<br />
of longlining. The nature <strong>and</strong> extent of interactions differs spatially, temporally, seasonally <strong>and</strong><br />
diurnally between sectors, fisheries <strong>and</strong> between fleets <strong>and</strong> vessels within fisheries. In 2010/11 the<br />
taxa most frequently observed caught in New Zeal<strong>and</strong> commercial fisheries in descending order were<br />
white-chinned petrel, sooty shearwater, southern Buller’s albatross, white-capped albatross, Salvin’s<br />
albatross, <strong>and</strong> flesh footed shearwater, grey petrel, cape petrel, storm petrels, <strong>and</strong> black petrel.<br />
The management of fisheries to ensure the long-term viability of seabird populations requires an<br />
underst<strong>and</strong>ing of the risks posed by fishing <strong>and</strong> other anthropogenic drivers. Several studies have<br />
already estimated the number of seabirds caught annually within the New Zeal<strong>and</strong> Exclusive<br />
Economic Zone (EEZ) in a range of fisheries (e.g., Baird & Smith 2008, Waugh et al. 2008, Abraham<br />
et al. 2010). In order to evaluate whether the viability of seabird populations is jeopardised by<br />
incidental mortality from commercial fishing, the number of annual fatalities needs to be compared<br />
with the capacity of the populations to replace those losses; this depends on the size <strong>and</strong> productivity<br />
of each population. Seabirds that breed in New Zeal<strong>and</strong> die as a result of interactions with commercial<br />
or recreational fishing operations in waters under New Zeal<strong>and</strong> jurisdiction, through interactions with<br />
New Zeal<strong>and</strong> vessels or other nations’ vessels on the High Seas <strong>and</strong> through interactions with<br />
commercial, recreational or artisanal fishing operations in waters under the jurisdiction of other states.<br />
Unfortunately, sufficient data to build fully quantitative population models to assess risks <strong>and</strong> explore<br />
the likely results of different management approaches are available for only very few taxa (e.g.,<br />
Fletcher et al. 2008, Francis <strong>and</strong> Bell 2010, Francis et al. 2008, Dillingham <strong>and</strong> Fletcher 2011). For<br />
this reason, broad seabird risk assessments need to rely on expert knowledge (level-1) or to be semiquantitative<br />
(level-2) (Hobday et al. 2007). Rowe 2010b described a level-1 seabird risk assessment<br />
<strong>and</strong> Baird <strong>and</strong> Gilbert (2010) described a semi-quantitative assessment for seabird taxa for which<br />
reasonable numbers of observed captures were available. These assessments were based on expert<br />
knowledge or not comprehensive <strong>and</strong> could not be used directly to assess risk for all seabird taxa <strong>and</strong><br />
fisheries.<br />
5.4.1. Quantifying fisheries interactions<br />
Information with which to characterise seabird interactions with fisheries comes from a variety of<br />
sources. Some is opportunistically collected, whilst other information collection is targeted at<br />
specifically describing the nature <strong>and</strong> extent of seabird captures in fisheries. This section is focussed<br />
on the targeted information collection.<br />
Many New Zeal<strong>and</strong> commercial fisheries have MPI observer coverage, much of which is funded by<br />
DOC’s CSP programme (e.g., Rowe 2009, 2010, Ramm 2011, <strong>2012</strong>). Observers generate independent<br />
data on the number of captures of seabirds, the number of fishing events observed, <strong>and</strong> at-sea<br />
identification of the seabirds for these fisheries. Commercial fishers are required to provide effort data<br />
allowing estimation of the total number of fishing events in a fishery. In combination these data have<br />
been used for many years to assess the nature <strong>and</strong> extent of seabird captures in fisheries (e.g.,<br />
Abraham et al. 2010, Abraham <strong>and</strong> Thompson 2009a, 2010, 2011 a&b, Ayers et al. 2004, Baird 1994,<br />
1995, 1996, 1997, 1999, 2000 a&b, 2001 a&b, 2003, 2004 a–c, 2005, Baird et al. 1998, 1999, Baird<br />
& Griggs 2004, Thompson <strong>and</strong> Abraham 2009). Fisher-reported captures (on NFPSR forms available<br />
since 1 October 2008) have not been used to estimate total captures because the reported capture rates<br />
72
AEBAR <strong>2012</strong>: Protected species: Seabirds<br />
are much lower than those reported by independent observers (Abraham <strong>and</strong> Thompson 2011) <strong>and</strong> the<br />
species identification is less certain. Specimens <strong>and</strong> photographs (especially for birds released alive)<br />
are also collected allowing verification of at-sea identifications (from carcasses or photographs) <strong>and</strong><br />
description of biological characters (sex, age, condition, etc., available only from carcasses).<br />
In some fisheries observer data are temporally <strong>and</strong> spatially well stratified, whilst in others data are<br />
only available from a spatially select part of the fishery, or a limited part of the year. Where sufficient<br />
observer data are available, estimates of total seabird captures in the fishery are calculated. The<br />
methods currently used in estimating seabird captures in New Zeal<strong>and</strong> fisheries are described in<br />
Abraham <strong>and</strong> Thompson (2011a). In this context, captures include all seabirds recovered on a fishing<br />
vessel except birds that simply l<strong>and</strong> on the deck or collide with a vessel’s superstructure,<br />
decomposing animals, records of tissue fragments, <strong>and</strong> birds caught during trips carried out under<br />
special permit (e.g., for trials of mitigation methods). Observer coverage has been highly<br />
heterogeneous in that some fisheries <strong>and</strong> areas have had much higher coverage than others. This<br />
complicates estimation of the total number of seabirds captured, especially when estimates include<br />
more than one fishery, because the distribution of birds <strong>and</strong> captures is heterogeneous (Figure 5.3).<br />
Abraham <strong>and</strong> Thompson (2011, available at: http://fs.fish.govt.nz/Doc/22872/AEBR_79.pdf.ashx) made<br />
model-based estimates of captures in New Zeal<strong>and</strong> trawl <strong>and</strong> longline fisheries for the following taxa<br />
or groups: sooty shearwater (Puffinus griseus); white-chinned petrel (Procellaria aequinoctialis);<br />
white-capped albatross (Thalassarche steadi); other albatrosses; <strong>and</strong> all other birds. The three<br />
individual species were chosen because they are the most frequently caught in trawl <strong>and</strong> longline<br />
fisheries. Captures of other albatrosses are mostly Salvin’s, southern Buller’s, Gibson’s or Antipodean<br />
w<strong>and</strong>ering albatrosses, or Campbell albatrosses. The other birds category includes many taxa but<br />
grey, black, great-winged, <strong>and</strong> Cape petrels, flesh-footed shearwater, <strong>and</strong> spotted shag are relatively<br />
common observed captures (the latter based on few observations that included 31 captures in one<br />
event). Estimated captures up to <strong>and</strong> including the 2010/11 year are shown in Tables 5.3 <strong>and</strong> 5.4.<br />
Observed captures of seabirds in trawl fisheries were most common off both coasts of the South<br />
Isl<strong>and</strong>, along the Chatham Rise, on the fringes of the Stewart-Snares shelf, <strong>and</strong> around the Auckl<strong>and</strong><br />
Isl<strong>and</strong>s (Figure 5.4). This largely reflects the distribution of the major commercial fisheries for squid,<br />
hoki, <strong>and</strong> middle-depth species which have tended to have relatively high observer coverage. Whitecapped,<br />
Salvin's, <strong>and</strong> southern Buller's have been the most frequently observed captured albatrosses,<br />
<strong>and</strong> sooty shearwater <strong>and</strong> white chinned petrel have been the other species most frequently observed<br />
(Table 5.5). About 42% of observed captures were albatrosses.<br />
Observed captures of seabirds in surface longline fisheries were most common off the southwest coast<br />
of the South Isl<strong>and</strong> <strong>and</strong> the northeast coast of the North Isl<strong>and</strong> (Figure 5.5), again largely reflecting<br />
the distribution of the major commercial fisheries (for southern bluefin <strong>and</strong> other tunas). The charter<br />
fleet targeting tuna has historically had much higher observer coverage than the domestic fleet.<br />
Southern Buller's <strong>and</strong> white-capped have been the most frequently observed captured albatrosses, <strong>and</strong><br />
grey, white-chinned, <strong>and</strong> black petrels have been the other species most frequently observed (Table<br />
5.6). About 77% of observed captures were albatrosses.<br />
Observed captures of seabirds in bottom longline fisheries were most common off the south coast of<br />
the South Isl<strong>and</strong>, along the Chatham Rise, scattered throughout the SubAntarctic, <strong>and</strong> off the northeast<br />
coast of the North Isl<strong>and</strong>, especially around the Hauraki Gulf (Figure 5.6). This distribution largely<br />
reflects the distribution of the ling <strong>and</strong> snapper longline fisheries that have received most observer<br />
coverage; other bottom longline fisheries have had much less coverage. Salvin’s <strong>and</strong> Chatham have<br />
been the most frequently observed captured albatrosses, <strong>and</strong> white chinned petrel, grey petrel, sooty<br />
shearwater, <strong>and</strong> black petrels have been the other species most frequently observed (Table 5.7). Only<br />
about 14% of observed captures were albatrosses.<br />
73
AEBAR <strong>2012</strong>: Protected species: Seabirds<br />
Figure 5.3 (reproduced from Abraham <strong>and</strong> Thompson 2011): All observed seabird captures in trawl,<br />
surface longline, <strong>and</strong> bottom longline fishing within the New Zeal<strong>and</strong> region, between October 2008 <strong>and</strong><br />
September 2009. The colour within each 0.2 degree cell indicates the number of fishing events (tows <strong>and</strong><br />
sets, darker colours indicate more fishing) <strong>and</strong> the black dots indicate the number of observed events<br />
(larger dots indicate more observations). The coloured symbols indicate the location of observed seabird<br />
captures, r<strong>and</strong>omly jittered by 0.2 degrees. The 500 m <strong>and</strong> 1000 m depth contours are shown.<br />
74
AEBAR <strong>2012</strong>: Protected species: Seabirds<br />
Table 5.3: Summary of observed <strong>and</strong> model-estimated total captures of all seabirds (top half) <strong>and</strong> whitecapped<br />
albatross (bottom half) by October fishing year in trawl (BT, effort in tows)), surface longline<br />
(SLL, effort in hooks) <strong>and</strong> bottom longline (BLL, effort in hooks) fisheries between 2002–30 <strong>and</strong> 2010–11.<br />
Observed <strong>and</strong> modelled rates are per 100 trawl tows or 1000 longline hooks. Caps, observed captures;<br />
% obs, percentage of effort observed; % incl, percentage of total effort included in the model. Data<br />
version v<strong>2012</strong>1101.<br />
Models for all seabirds Fishing effort Seabirds Model estimates<br />
Year All effort Observed % obs Caps Rate Mean 95% c.i. % incl Rate<br />
BT 2002–03 130 344 6 834 5.2 269 3.94 3126 2451–4045 100.0 2.40<br />
BT 2003–04 121 498 6 546 5.4 262 4.00 2624 2034–3456 100.0 2.16<br />
BT 2004–05 120 585 7 709 6.4 483 6.27 4337 3358–5861 100.0 3.60<br />
BT 2005–06 110 234 6 553 5.9 356 5.43 3424 2696–4363 100.0 3.11<br />
BT 2006–07 103 529 7 928 7.7 211 2.66 2027 1559–2678 100.0 1.96<br />
BT 2007–08 89 537 9 046 10.1 234 2.59 1976 1515–2574 100.0 2.21<br />
BT 2008–09 87 589 9 804 11.2 469 4.78 2505 2059–3140 100.0 2.86<br />
BT 2009–10 92 886 9 006 9.7 256 2.85 2176 1672–2882 100.0 2.34<br />
BT 2010–11 86 074 7 445 8.6 370 4.97 2788 2172–3611 100.0 3.24<br />
SLL 2002–03 10764 588 2 195 152 20.4 115 0.05 2349 1735–3271 100.0 0.022<br />
SLL 2003–04 7 380 779 1 607 304 21.8 71 0.04 1582 1212–2064 100.0 0.021<br />
SLL 2004–05 3 676 365 783 812 21.3 41 0.05 660 499–885 100.0 0.018<br />
SLL 2005–06 3 687 339 705 945 19.1 37 0.05 785 589–1062 100.0 0.021<br />
SLL 2006–07 3 738 362 1 040 948 27.8 187 0.18 923 720–1239 100.0 0.025<br />
SLL 2007–08 2 244 339 426 310 19.0 41 0.10 509 397–650 100.0 0.023<br />
SLL 2008–09 3 115 633 937 233 30.1 57 0.06 642 502–814 100.0 0.021<br />
SLL 2009–10 2 992 285 665 883 22.3 135 0.20 903 702–1191 100.0 0.030<br />
SLL 2010–11 3 164 159 674 522 21.3 47 0.07 740 547–1019 100.0 0.023<br />
BLL 2002–03 37 671 038 10 772 020 28.6 296 0.03 1718 1250–2268 89.2 0.005<br />
BLL 2003–04 43 397 540 5 162 608 11.9 54 0.01 1151 761–1604 90.2 0.003<br />
BLL 2004–05 41 818 638 2 883 725 6.9 30 0.01 1191 802–1661 88.0 0.003<br />
BLL 2005–06 37 126 833 3 802 951 10.2 41 0.01 1037 701–1431 87.3 0.003<br />
BLL 2006–07 38 124 470 2 315 772 6.1 58 0.03 1236 833–1716 86.2 0.003<br />
BLL 2007–08 41 464 276 3 589 511 8.7 40 0.01 1193 824–1621 86.0 0.003<br />
BLL 2008–09 37 389 512 4 024 816 10.8 33 0.01 1037 699–1458 86.5 0.003<br />
BLL 2009–10 40 413 281 2 271 623 5.6 68 0.03 1062 716–1474 86.1 0.003<br />
BLL 2010–11 40 826 726 1 730 585 4.2 29 0.02 1403 955–1967 85.8 0.003<br />
White-capped albatross models<br />
Year All effort Observed % obs Caps Rate Mean 95% c.i. % incl Rate<br />
BT 2002–03 130 344 6 834 5.2 85 1.24 861 648–1119 100.0 0.66<br />
BT 2003–04 121 498 6 546 5.4 148 2.26 905 701–1144 100.0 0.74<br />
BT 2004–05 120 585 7 709 6.4 243 3.15 1200 976–1502 100.0 1.00<br />
BT 2005–06 110 234 6 553 5.9 69 1.05 609 439–826 100.0 0.55<br />
BT 2006–07 103 529 7 928 7.7 57 0.72 437 315–591 100.0 0.42<br />
BT 2007–08 89 537 9 046 10.1 42 0.46 312 205–443 100.0 0.35<br />
BT 2008–09 87 589 9 804 11.2 97 0.99 471 352–625 100.0 0.54<br />
BT 2009–10 92 886 9 006 9.7 48 0.53 381 266–527 100.0 0.41<br />
BT 2010–11 86 074 7 445 8.6 39 0.52 356 236–496 100.0 0.41<br />
SLL 2002–03 10764 588 2 195 152 20.4 2 0.00 101 63–149 100.0 0.001<br />
SLL 2003–04 7 380 779 1 607 304 21.8 17 0.01 228 148–325 100.0 0.003<br />
SLL 2004–05 3 676 365 783 812 21.3 3 0.00 58 35–86 100.0 0.002<br />
SLL 2005–06 3 687 339 705 945 19.1 2 0.00 54 32–81 100.0 0.001<br />
SLL 2006–07 3 738 362 1 040 948 27.8 28 0.03 42 32–55 100.0 0.001<br />
SLL 2007–08 2 244 339 426 310 19.0 4 0.01 55 33–81 100.0 0.002<br />
SLL 2008–09 3 115 633 937 233 30.1 3 0.00 78 48–114 100.0 0.003<br />
SLL 2009–10 2 992 285 665 883 22.3 31 0.05 135 94–185 100.0 0.005<br />
SLL 2010–11 3 164 159 674 522 21.3 3 0.00 84 52–123 100.0 0.003<br />
BLL 2002–03 37 671 038 10 772 020 28.6 0 0.00 1 0–4 44.8 0.000<br />
BLL 2003–04 43 397 540 5 162 608 11.9 1 0.00 3 0–7 50.3 0.000<br />
BLL 2004–05 41 818 638 2 883 725 6.9 0 0.00 2 0–6 39.6 0.000<br />
BLL 2005–06 37 126 833 3 802 951 10.2 1 0.00 3 1–6 36.4 0.000<br />
BLL 2006–07 38 124 470 2 315 772 6.1 0 0.00 2 0–5 30.6 0.000<br />
BLL 2007–08 41 464 276 3 589 511 8.7 0 0.00 2 0–6 29.9 0.000<br />
BLL 2008–09 37 389 512 4 024 816 10.8 0 0.00 2 0–5 32.1 0.000<br />
BLL 2009–10 40 413 281 2 271 623 5.6 0 0.00 2 0–6 30.1 0.000<br />
BLL 2010–11 40 826 726 1 730 585 4.2 0 0.00 2 0–5 28.6 0.000<br />
75
AEBAR <strong>2012</strong>: Protected species: Seabirds<br />
Table 5.4: Summary of observed <strong>and</strong> model-estimated total captures of sooty shearwater (top half) <strong>and</strong><br />
white-chinned petrel (bottom half) by October fishing year in trawl (BT, effort in tows), surface longline<br />
(SLL, effort in hooks) <strong>and</strong> bottom longline (BLL, effort in hooks) fisheries between 2002–30 <strong>and</strong> 2010–11.<br />
Observed <strong>and</strong> modelled rates are per 100 trawl tows or 1000 longline hooks. Caps, observed captures;<br />
% obs, percentage of effort observed; % incl, percentage of total effort included in the model. Data<br />
version v<strong>2012</strong>1101.<br />
Sooty shearwater models Fishing effort Seabirds Model estimates<br />
Year All effort Observed % obs Caps Rate Mean 95% c.i. % incl Rate<br />
BT 2002–03 130 344 6 834 5.2 120 1.76 999 642–1523 100.0 0.77<br />
BT 2003–04 121 498 6 546 5.4 54 0.82 370 224–590 100.0 0.30<br />
BT 2004–05 120 585 7 709 6.4 74 0.96 494 319–758 100.0 0.41<br />
BT 2005–06 110 234 6 553 5.9 169 2.58 976 657–1456 100.0 0.89<br />
BT 2006–07 103 529 7 928 7.7 84 1.06 497 328–748 100.0 0.48<br />
BT 2007–08 89 537 9 046 10.1 82 0.91 416 276–627 100.0 0.46<br />
BT 2008–09 87 589 9 804 11.2 152 1.55 521 371–744 100.0 0.59<br />
BT 2009–10 92 886 9 006 9.7 43 0.48 260 159–409 100.0 0.28<br />
BT 2010–11 86 074 7 445 8.6 110 1.48 488 331–722 100.0 0.57<br />
SLL 2002–03 10 771 388 2 195 152 20.4 8 0.00 14 8–31 100.0 0.000<br />
SLL 2003–04 7 386 864 1 607 304 21.8 3 0.00 7 3–19 100.0 0.000<br />
SLL 2004–05 3 679 865 783 812 21.3 0 0.00 2 0–9 100.0 0.000<br />
SLL 2005–06 3 689 879 705 945 19.1 0 0.00 2 0–9 100.0 0.000<br />
SLL 2006–07 3 739 962 1 040 948 27.8 2 0.00 4 2–10 100.0 0.000<br />
SLL 2007–08 2 245 939 426 310 19.0 0 0.00 2 0–6 100.0 0.000<br />
SLL 2008–09 3 115 633 937 233 30.1 0 0.00 2 0–8 100.0 0.000<br />
SLL 2009–10 2 992 285 665 883 22.3 0 0.00 2 0–7 100.0 0.000<br />
SLL 2010–11 3 166 559 674 522 21.3 0 0.00 2 0–9 100.0 0.000<br />
BLL 2002–03 37 789 058 10 772 020 28.6 32 0.00 97 45–216 100.0 0.000<br />
BLL 2003–04 43 493 500 5 162 608 11.9 17 0.00 82 30–202 100.0 0.000<br />
BLL 2004–05 41 868 788 2 883 725 6.9 3 0.00 81 20–213 100.0 0.000<br />
BLL 2005–06 37 138 783 3 802 951 10.2 3 0.00 46 6–151 100.0 0.000<br />
BLL 2006–07 38 150 820 2 315 772 6.1 1 0.00 53 7–169 100.0 0.000<br />
BLL 2007–08 41 502 096 3 589 511 8.7 6 0.00 61 17–157 100.0 0.000<br />
BLL 2008–09 37 424 356 4 023 916 10.8 0 0.00 54 6–169 100.0 0.000<br />
BLL 2009–10 40 445 221 2 279 233 5.6 7 0.00 53 10–165 100.0 0.000<br />
BLL 2010–11 40 878 991 1 728 765 4.2 0 0.00 69 6–235 100.0 0.000<br />
White-chinned petrel models<br />
Year All effort Observed % obs Caps Rate Mean 95% c.i. % incl Rate<br />
BT 2002–03 130 344 6 834 5.2 13 0.19 148 67–280 100.0 0.11<br />
BT 2003–04 121 498 6 546 5.4 18 0.27 117 61–207 100.0 0.10<br />
BT 2004–05 120 585 7 709 6.4 55 0.71 266 169–403 100.0 0.22<br />
BT 2005–06 110 234 6 553 5.9 70 1.07 436 270–688 100.0 0.40<br />
BT 2006–07 103 529 7 928 7.7 29 0.37 135 82–216 100.0 0.13<br />
BT 2007–08 89 537 9 046 10.1 59 0.65 271 168–430 100.0 0.30<br />
BT 2008–09 87 589 9 804 11.2 104 1.06 316 222–453 100.0 0.36<br />
BT 2009–10 92 886 9 006 9.7 74 0.82 295 189–461 100.0 0.32<br />
BT 2010–11 86 074 7 445 8.6 130 1.75 540 359–817 100.0 0.63<br />
SLL 2002–03 10764 588 2 195 152 20.4 4 0.00 79 43–128 100.0 0.001<br />
SLL 2003–04 7 380 779 1 607 304 21.8 2 0.00 53 27–87 100.0 0.001<br />
SLL 2004–05 3 676 365 783 812 21.3 3 0.00 30 14–49 100.0 0.001<br />
SLL 2005–06 3 687 339 705 945 19.1 1 0.00 30 14–50 100.0 0.001<br />
SLL 2006–07 3 738 362 1 040 948 27.8 5 0.00 30 16–48 100.0 0.001<br />
SLL 2007–08 2 244 339 426 310 19.0 4 0.01 22 11–35 100.0 0.001<br />
SLL 2008–09 3 115 633 937 233 30.1 3 0.00 26 13–43 100.0 0.001<br />
SLL 2009–10 2 992 285 665 883 22.3 3 0.00 25 12–41 100.0 0.001<br />
SLL 2010–11 3 164 159 674 522 21.3 8 0.01 34 19–52 100.0 0.001<br />
BLL 2002–03 37 671 038 10 772 020 28.6 132 0.01 350 246–540 100.0 0.001<br />
BLL 2003–04 43 397 540 5 162 608 11.9 15 0.00 139 81–215 100.0 0.000<br />
BLL 2004–05 41 818 638 2 883 725 6.9 11 0.00 188 105–290 100.0 0.000<br />
BLL 2005–06 37 126 833 3 802 951 10.2 13 0.00 189 108–303 100.0 0.001<br />
BLL 2006–07 38 124 470 2 315 772 6.1 12 0.01 225 123–364 100.0 0.001<br />
BLL 2007–08 41 464 276 3 589 511 8.7 10 0.00 261 143–423 100.0 0.001<br />
BLL 2008–09 37 389 512 4 024 816 10.8 1 0.00 204 97–380 100.0 0.001<br />
BLL 2009–10 40 413 281 2 271 623 5.6 1 0.00 172 86–282 100.0 0.000<br />
BLL 2010–11 40 826 726 1 730 585 4.2 24 0.01 422 225–769 100.0 0.001<br />
76
AEBAR <strong>2012</strong>: Protected species: Seabirds<br />
Figure 5.4: Map of trawl fishing effort <strong>and</strong> all observed seabird captures in trawls, October 2003 to<br />
September 2011. Fishing effort is mapped into 0.2-degree cells, with the colour of each cell being related<br />
to the amount of effort (events). Observed fishing events are indicated by black dots, <strong>and</strong> observed<br />
captures are indicated by red dots. Fishing is shown only if the effort could be assigned a latitude <strong>and</strong><br />
longitude, <strong>and</strong> if there were three or more vessels fishing within a cell (here, 96% of effort is displayed).<br />
77
AEBAR <strong>2012</strong>: Protected species: Seabirds<br />
Table 5.5: Summary of seabirds observed captured in trawl fisheries 2002–03 to 2010–11. Declared target<br />
species are: SQU, arrow squid; HOK+, hoki, hake, ling; Mid., other middle depth species silver, white,<br />
<strong>and</strong> common warehou, barracouta, alfonsinos, stargazer; SCI, scampi; ORH+, orange roughy <strong>and</strong> oreos;<br />
SBW, southern blue whiting; JMA, Jack mackerels; Ins., other inshore species for which one or more<br />
captures have been observed; tarakihi, red cod, spiny dogfish, John dory, snapper; FLA, flatfishes. Data<br />
version v<strong>2012</strong>1101.<br />
Declared target species<br />
Species or group SQU HOK+ Mid. SCI ORH+ SBW JMA Ins. FLA Total<br />
White capped albatross 679 54 52 15 6 0 1 22 0 829<br />
Salvin's albatross 18 87 25 29 16 2 0 20 0 197<br />
Southern Buller's 49 41 19 4 3 0 1 1 0 118<br />
Campbell albatross 2 5 0 1 0 1 0 0 0 9<br />
Chatham Isl<strong>and</strong> albatross 0 0 0 1 8 0 0 0 0 9<br />
Southern royal albatross 5 0 0 0 0 1 0 0 0 6<br />
Southern black-browed 1 2 0 0 0 0 0 2 0 5<br />
Gibson's albatross 0 0 0 0 1 0 0 0 0 1<br />
Northern royal albatross 0 0 0 0 1 0 0 0 0 1<br />
Albatross indet. 10 10 1 5 0 4 1 1 0 32<br />
All albatrosses 764 199 97 55 35 8 3 46 0 1207<br />
Sooty shearwater 540 181 119 37 5 0 5 1 0 888<br />
White chinned petrel 387 43 42 48 1 0 9 0 0 530<br />
Cape petrels 1 34 1 3 19 1 2 0 0 61<br />
Flesh footed shearwater 0 1 0 35 0 0 0 2 0 38<br />
Spotted shag 0 0 0 0 0 0 0 0 32 32<br />
Grey petrel 1 2 0 0 3 22 0 0 0 28<br />
Common diving petrel 5 5 0 1 2 0 1 0 0 14<br />
Westl<strong>and</strong> petrel 0 11 1 0 0 0 1 0 0 13<br />
Fairy prion 0 4 0 0 0 0 5 0 0 9<br />
Antarctic prion 7 0 0 0 0 0 0 0 0 7<br />
Northern giant petrel 0 3 1 1 1 0 0 0 0 6<br />
Giant petrel 3 1 0 0 0 0 0 0 0 4<br />
Grey-backed storm petrel 3 1 0 0 0 0 0 0 0 4<br />
Fulmar prion 0 0 0 0 0 0 3 0 0 3<br />
Black petrel 0 0 0 1 0 0 0 1 0 2<br />
Black-bellied storm petrel 1 1 0 0 0 0 0 0 0 2<br />
White-faced storm petrel 0 0 0 0 2 0 0 0 0 2<br />
Black backed gull 0 0 0 0 0 0 0 0 1 1<br />
Short tailed shearwater 0 0 1 0 0 0 0 0 0 1<br />
White headed petrel 1 0 0 0 0 0 0 0 0 1<br />
Other bird indet. 11 5 3 2 1 5 0 2 2 31<br />
All other birds 960 292 168 128 34 28 26 6 35 1677<br />
All observed birds 1724 491 265 183 69 36 29 52 35 2884<br />
Approx. proportion obs 0.23 0.14 0.06 0.09 0.26 0.35 0.25 0.01 0.01 0.08<br />
78
AEBAR <strong>2012</strong>: Protected species: Seabirds<br />
Figure 5.5: Map of surface longline fishing effort <strong>and</strong> all observed seabird captures by surface longlines,<br />
October 2003 to September 2011. Fishing effort is mapped into 0.2-degree cells, with the colour of each<br />
cell being related to the amount of effort (events). Observed fishing events are indicated by black dots,<br />
<strong>and</strong> observed captures are indicated by red dots. Fishing is shown only if the effort could be assigned a<br />
latitude <strong>and</strong> longitude, <strong>and</strong> if there were three or more vessels fishing within a cell (here, 75.3% of effort<br />
is displayed).<br />
79
AEBAR <strong>2012</strong>: Protected species: Seabirds<br />
Table 5.6: Summary of seabirds observed captured in surface longline fisheries 2002–03 to 2010–11.<br />
Declared target species are: SBT, southern bluefin tuna; BIG, bigeye tuna; SWO, broadbill swordfish;<br />
ALB, albacore tuna. Data version v<strong>2012</strong>1101.<br />
Declared target species<br />
Species or group SBT BIG SWO ALB Total<br />
Southern Buller's albatross 296 7 1 8 312<br />
White capped albatross 91 1 1 0 93<br />
Campbell albatross 18 3 2 17 40<br />
Antipodean albatross 4 8 15 3 30<br />
Gibson's albatross 8 6 9 7 30<br />
W<strong>and</strong>ering albatrosses 8 3 0 0 11<br />
Salvin's albatross 3 4 0 1 8<br />
Antipodean / Gibson's 0 2 5 0 7<br />
Black browed albatrosses 0 2 2 0 4<br />
Southern royal albatross 4 0 0 0 4<br />
Southern black-browed 2 0 0 0 2<br />
Light-mantled sooty 1 0 0 0 1<br />
Northern royal albatross 0 1 0 0 1<br />
Pacific albatross 1 0 0 0 1<br />
Albatrosses indet. 2 1 33 0 36<br />
Total albatrosses 438 38 68 36 580<br />
Grey petrel 38 0 3 5 46<br />
White chinned petrel 21 8 2 2 33<br />
Black petrel 0 23 2 1 26<br />
Great winged petrel 0 1 2 17 20<br />
Sooty shearwater 4 0 1 8 13<br />
Flesh footed shearwater 0 11 1 0 12<br />
Westl<strong>and</strong> petrel 6 0 0 2 8<br />
Cape petrels 2 0 0 0 2<br />
Southern giant petrel 2 0 0 0 2<br />
White headed petrel 0 0 0 2 2<br />
Petrels indet. 0 1 0 0 1<br />
Total other birds 73 44 11 37 165<br />
All observed birds 511 82 79 73 745<br />
Approx. proportion obs 0.42 0.03 0.10 0.38 0.22<br />
80
AEBAR <strong>2012</strong>: Protected species: Seabirds<br />
Figure 5.6: Map of bottom longline fishing effort <strong>and</strong> all observed seabird captures by bottom longlines,<br />
October 2003 to September 2011. Fishing effort is mapped into 0.2-degree cells, with the colour of each<br />
cell being related to the amount of effort (events). Observed fishing events are indicated by black dots,<br />
<strong>and</strong> observed captures are indicated by red dots. Fishing is shown only if the effort could be assigned a<br />
latitude <strong>and</strong> longitude, <strong>and</strong> if there were three or more vessels fishing within a cell (here, 79.3% of effort<br />
is displayed).<br />
81
AEBAR <strong>2012</strong>: Protected species: Seabirds<br />
Table 5.7: Summary of seabirds observed captured in bottom longline fisheries 2002–03 to 2010–11.<br />
Declared target species are: LIN, ling; SNA, snapper; BNS, bluenose; HPB, hapuku or bass. Data version<br />
v<strong>2012</strong>1101.<br />
Declared target species<br />
Species or group LIN SNA BNS HPB Total<br />
Salvin's albatross 51 0 0 0 51<br />
Chatham Isl<strong>and</strong> albatross 18 0 0 0 18<br />
Southern Buller's albatross 4 0 3 0 7<br />
Campbell albatross 0 0 2 1 3<br />
W<strong>and</strong>ering albatrosses 2 0 1 0 3<br />
White capped albatross 2 0 0 0 2<br />
Black browed albatrosses 1 0 0 0 1<br />
Indian yellow-nosed albatross 1 0 0 0 1<br />
Southern royal albatross 1 0 0 0 1<br />
Albatross indet. 2 0 0 0 2<br />
All albatrosses 82 0 6 1 89<br />
White chinned petrel 217 0 2 0 219<br />
Grey petrel 79 0 0 0 79<br />
Sooty shearwater 68 0 0 1 69<br />
Black petrel 0 28 14 7 51<br />
Flesh footed shearwater 0 36 0 3 39<br />
Cape petrels 24 0 0 0 24<br />
Common diving petrel 23 0 0 0 23<br />
Great winged petrel 0 0 0 6 6<br />
Fluttering shearwater 0 4 0 0 4<br />
Northern giant petrel 4 0 0 0 4<br />
Prions 4 0 0 0 4<br />
Storm petrels 3 0 0 0 3<br />
Gannets 0 2 0 0 2<br />
Pied shag 0 2 0 0 2<br />
Black backed gull 0 1 0 0 1<br />
Buller's shearwater 0 1 0 0 1<br />
Crested penguins 1 0 0 0 1<br />
Giant petrel 1 0 0 0 1<br />
Red billed gull 0 1 0 0 1<br />
Other birds indet 1 10 0 0 11<br />
All other birds 425 85 16 17 545<br />
All birds observed 507 85 22 18 634<br />
Approx. proportion obs 0.20 0.01 0.01 0.01 0.10<br />
Model-based estimates of captures can be combined across trawl <strong>and</strong> longline fisheries (Figure 5.7).<br />
Summed across all bird taxa, trawl, surface longline, <strong>and</strong> bottom longline fisheries account for 55%,<br />
21%, <strong>and</strong> 24% of captures, respectively, but there are substantial differences in these proportions<br />
among seabird taxa. A high proportion (87% between 2003 <strong>and</strong> 2011) of white-capped albatross<br />
captures are taken in trawl fisheries with almost all of the remainder taken in surface longline<br />
fisheries. The trawl fishery also accounts for 89% of sooty shearwaters captured, with most of the<br />
remainder taken by bottom longliners. The proportion captured by trawl fisheries reduces to 53% for<br />
all other albatrosses combined, with 30% <strong>and</strong> 17% taken in surface <strong>and</strong> bottom longline fisheries,<br />
respectively. Bottom longline <strong>and</strong> trawl take similar proportions of the white-chinned petrels captured<br />
(43% <strong>and</strong> 50%, respectively).<br />
82
AEBAR <strong>2012</strong>: Protected species: Seabirds<br />
Over the 2003 to 2011 period, there appear to have been downward trends (across all fisheries) in the<br />
estimated captures of all birds combined, white-capped albatross, <strong>and</strong> non-albatross taxa other than<br />
sooty shearwaters <strong>and</strong> white-chinned petrel (Figure 5.7). Estimated captures of other albatrosses,<br />
sooty shearwaters, <strong>and</strong> white-chinned petrel appear to have fluctuated without much trend, although<br />
there is some evidence for an increasing trend for white-chinned petrel, especially in trawl fisheries.<br />
Because fishing effort often changes with time, estimates of total captures may not be the only index<br />
required for comprehensive monitoring. The number of captures (with certain caveats, see later) is<br />
clearly more biologically relevant for the birds, but capture rates by fishery may be more useful<br />
measures to assess fishery performance <strong>and</strong> the effectiveness of mitigation approaches. Dividing<br />
modelled catch estimates by the number of tows or hooks set in a particular fishery in each year<br />
provides catch rate indices by fishery. These are typically reported as the number of birds captured per<br />
100 trawl tows or per 1000 longline hooks (Figures 5.8 to 5.10).<br />
Estimated captures<br />
1400<br />
1200<br />
1000<br />
800<br />
600<br />
400<br />
200<br />
0<br />
1200<br />
1000<br />
800<br />
600<br />
400<br />
200<br />
0<br />
3000<br />
2500<br />
2000<br />
1500<br />
1000<br />
500<br />
0<br />
White-capped albatross<br />
2003 2004 2005 2006 2007 2008 2009 2010 2011<br />
Sooty shearwater<br />
2003 2004 2005 2006 2007 2008 2009 2010 2011<br />
2003 2004 2005 2006 2007 2008 2009 2010 2011<br />
Other birds<br />
BLL<br />
SLL<br />
Trawl<br />
BLL<br />
SLL<br />
Trawl<br />
BLL<br />
SLL<br />
Trawl<br />
83<br />
2500<br />
2000<br />
1500<br />
1000<br />
500<br />
0<br />
1200<br />
1000<br />
800<br />
600<br />
400<br />
200<br />
0<br />
8000<br />
7000<br />
6000<br />
5000<br />
4000<br />
3000<br />
2000<br />
1000<br />
0<br />
2003 2004 2005 2006 2007 2008 2009 2010 2011<br />
2003 2004 2005 2006 2007 2008 2009 2010 2011<br />
Other albatrosses<br />
White-chinned petrel<br />
All birds combined<br />
2003 2004 2005 2006 2007 2008 2009 2010 2011<br />
Figure 5.7: Model-based estimates of captures of the most numerous seabird taxa observed captured in<br />
trawl, surface longline, <strong>and</strong> bottom longline fisheries between 2002/03 <strong>and</strong> 2010/11. For confidence limits<br />
see Tables 3 <strong>and</strong> 4. Note this level of aggregation conceals any different trends within a fishing method<br />
(e.g., deepwater vs. inshore <strong>and</strong> flatfish trawl or large vs. small longliners).<br />
BLL<br />
SLL<br />
Trawl<br />
BLL<br />
SLL<br />
Trawl<br />
BLL<br />
SLL<br />
Trawl
AEBAR <strong>2012</strong>: Protected species: Seabirds<br />
For white-capped albatross, captures rates declined between 2002/03 <strong>and</strong> 2010/11, <strong>and</strong> especially up<br />
to 2006/07, in the major offshore trawl fisheries for squid <strong>and</strong> hoki (Figure 5.8) but showed no trend<br />
for inshore trawlers <strong>and</strong> increased for surface longliners targeting southern bluefin tuna. Together,<br />
these fisheries account for 82% of all estimated captures of white-capped albatross in these years.<br />
1000<br />
800<br />
600<br />
400<br />
200<br />
500<br />
400<br />
300<br />
200<br />
100<br />
0<br />
300<br />
250<br />
200<br />
150<br />
100<br />
50<br />
0<br />
200<br />
150<br />
100<br />
50<br />
0<br />
0<br />
White-capped albatross captures <strong>and</strong> capture rates<br />
Captures<br />
Squid trawl: 39% of captures<br />
2003 2004 2005 2006 2007 2008 2009 2010 2011<br />
Inshore trawl: 26% of captures<br />
2003 2004 2005 2006 2007 2008 2009 2010 2011<br />
SBT longline: 11% of captures<br />
2003 2004 2005 2006 2007 2008 2009 2010 2011<br />
Hoki trawl: 6% of captures<br />
2003 2004 2005 2006 2007 2008 2009 2010 2011<br />
Fishing year<br />
84<br />
10.0<br />
8.0<br />
6.0<br />
4.0<br />
2.0<br />
0.0<br />
1.2<br />
1.0<br />
0.8<br />
0.6<br />
0.4<br />
0.2<br />
0.0<br />
0.12<br />
0.10<br />
0.08<br />
0.06<br />
0.04<br />
0.02<br />
0.00<br />
0.7<br />
0.6<br />
0.5<br />
0.4<br />
0.3<br />
0.2<br />
0.1<br />
0.0<br />
Capture rate<br />
2003 2004 2005 2006 2007 2008 2009 2010 2011<br />
2003 2004 2005 2006 2007 2008 2009 2010 2011<br />
2003 2004 2005 2006 2007 2008 2009 2010 2011<br />
2003 2004 2005 2006 2007 2008 2009 2010 2011<br />
Figure 5.8: Model-based estimates of captures (left panels) <strong>and</strong> capture rates (right panels, captures per<br />
100 trawl tows or 1000 longline hooks) of white capped albatross in the four fisheries estimated to have<br />
taken the most captures between 2002/03 <strong>and</strong> 2010/11 (cumulatively, 82% of all white-capped albatross<br />
captures). Data version v<strong>2012</strong>1101.
AEBAR <strong>2012</strong>: Protected species: Seabirds<br />
For white-chinned petrel, captures rates increased between 2002/03 <strong>and</strong> 2010/11 in squid <strong>and</strong> scampi<br />
trawlers (Figure 5.9) but showed no trend for bottom longliners targeting ling <strong>and</strong> bluenose. Together,<br />
these fisheries account for 81% of all estimated captures of white-chinned petrel in these years.<br />
800<br />
600<br />
400<br />
200<br />
0<br />
600<br />
400<br />
200<br />
0<br />
200<br />
150<br />
100<br />
50<br />
0<br />
300<br />
250<br />
200<br />
150<br />
100<br />
50<br />
0<br />
White-chinned petrel captures <strong>and</strong> capture rates<br />
Captures Capture rate<br />
Ling longline: 32% of captures<br />
2003 2004 2005 2006 2007 2008 2009 2010 2011<br />
Squid trawl: 30% of captures<br />
2003 2004 2005 2006 2007 2008 2009 2010 2011<br />
Bluenose longline: 11% of captures<br />
2003 2004 2005 2006 2007 2008 2009 2010 2011<br />
Scampi trawl: 8% of captures<br />
2003 2004 2005 2006 2007 2008 2009 2010 2011<br />
Fishing year<br />
85<br />
0.05<br />
0.04<br />
0.03<br />
0.02<br />
0.01<br />
0.00<br />
12.0<br />
10.0<br />
8.0<br />
6.0<br />
4.0<br />
2.0<br />
0.0<br />
0.03<br />
0.02<br />
0.01<br />
0.00<br />
6.0<br />
5.0<br />
4.0<br />
3.0<br />
2.0<br />
1.0<br />
0.0<br />
2003 2004 2005 2006 2007 2008 2009 2010 2011<br />
2003 2004 2005 2006 2007 2008 2009 2010 2011<br />
2003 2004 2005 2006 2007 2008 2009 2010 2011<br />
2003 2004 2005 2006 2007 2008 2009 2010 2011<br />
Figure 5.9: Model-based estimates of captures (left panels) <strong>and</strong> capture rates (right panels, captures per<br />
100 trawl tows or 1000 longline hooks) of white chinned petrels in the four fisheries estimated to have<br />
taken the most captures between 2002/03 <strong>and</strong> 2010/11 (cumulatively, 81% of all white-chinned petrel<br />
captures). Data version v<strong>2012</strong>1101.
AEBAR <strong>2012</strong>: Protected species: Seabirds<br />
For sooty shearwaters, captures rates decreased between 2002/03 <strong>and</strong> 2010/11 for bottom longliners<br />
targeting ling, but showed no trend in squid, middle-depth, <strong>and</strong> hoki trawlers (Figure 5.10). Together,<br />
these fisheries account for 80% of all estimated captures of sooty shearwaters in these years.<br />
1000<br />
800<br />
600<br />
400<br />
200<br />
400<br />
300<br />
200<br />
100<br />
0<br />
600<br />
400<br />
200<br />
0<br />
100<br />
80<br />
60<br />
40<br />
20<br />
0<br />
0<br />
Sooty shearwater captures <strong>and</strong> capture rates<br />
Captures Capture rate<br />
Squid trawl: 43% of captures<br />
2003 2004 2005 2006 2007 2008 2009 2010 2011<br />
mid-depth trawl: 18% of captures<br />
2003 2004 2005 2006 2007 2008 2009 2010 2011<br />
Hoki trawl: 17% of captures<br />
2003 2004 2005 2006 2007 2008 2009 2010 2011<br />
Ling longline: 3% of captures<br />
2003 2004 2005 2006 2007 2008 2009 2010 2011<br />
Fishing year<br />
86<br />
10.0<br />
8.0<br />
6.0<br />
4.0<br />
2.0<br />
0.0<br />
4.0<br />
3.0<br />
2.0<br />
1.0<br />
0.0<br />
3.0<br />
2.0<br />
1.0<br />
0.0<br />
0.005<br />
0.004<br />
0.003<br />
0.002<br />
0.001<br />
0.000<br />
2003 2004 2005 2006 2007 2008 2009 2010 2011<br />
2003 2004 2005 2006 2007 2008 2009 2010 2011<br />
2003 2004 2005 2006 2007 2008 2009 2010 2011<br />
2003 2004 2005 2006 2007 2008 2009 2010 2011<br />
Figure 5.10: Model-based estimates of captures (left panels) <strong>and</strong> capture rates (right panels, captures per<br />
100 trawl tows or 1000 longline hooks) of sooty shearwaters in the four fisheries estimated to have taken<br />
the most captures between 2002/03 <strong>and</strong> 2010/11 (cumulatively, 80% of all sooty shearwater captures).<br />
Data version v<strong>2012</strong>1101.
AEBAR <strong>2012</strong>: Protected species: Seabirds<br />
On-board captures recorded by observers represent the most reliable source of information for<br />
monitoring trends in total captures <strong>and</strong> capture rates, but these data have three main deficiencies with<br />
respect to estimating total fatalities, especially to species level. First, some captured seabirds are<br />
released alive (23% in trawl fisheries between 2002–03 <strong>and</strong> 2010–11, 29% in surface longline<br />
fisheries, <strong>and</strong> 25% in bottom longline fisheries), meaning that, all else being equal, estimates of<br />
captures may overestimate total fatalities, depending on the survival rate of those released. Second,<br />
identifications by observers are not completely reliable <strong>and</strong> sometimes use generic codes rather than<br />
species codes. A high proportion of dead captures are returned for necropsy <strong>and</strong> formal identification<br />
(87% in trawl fisheries between 2002–03 <strong>and</strong> 2010–11, 83% in surface longline fisheries, <strong>and</strong> 89% in<br />
bottom longline fisheries), but there remains uncertainty in the identity of 11–17% of dead captures<br />
<strong>and</strong> 100% of those released alive. Third, not all birds killed or mortally wounded by fishing gear are<br />
recovered on a fishing vessel. Some birds caught on longline hooks fall off before being recovered,<br />
<strong>and</strong> birds that collide with trawl warps may be dragged under the water <strong>and</strong> drowned or injured to the<br />
extent that they are unable to fly or feed. Excluding this “cryptic” mortality means that, all else being<br />
equal, estimates of captures will underestimate total fatalities. These deficiencies do not greatly affect<br />
the suitability of estimates of captures <strong>and</strong> capture rates for monitoring purposes, but they have<br />
necessitated the development of alternative measures for assessing risk <strong>and</strong> population consequences.<br />
5.4.2. Managing fisheries interactions<br />
New Zeal<strong>and</strong> had taken steps to reduce incidental captures of seabirds before the advent of the IPOA<br />
in 1999 <strong>and</strong> the NPOA in 2004. For example, regulations were put in place under the Fisheries Act to<br />
prohibit drift net fishing in 1991 <strong>and</strong> prohibit the use of netsonde monitoring cables (“third wires”) in<br />
trawl fisheries in 1992. The use of tori lines (streamer lines designed to scare seabirds away from<br />
baited hooks) was made m<strong>and</strong>atory in all tuna longline fisheries in 1992.<br />
The fishing industry also undertook several initiatives to reduce captures include funding research into<br />
new or improved mitigation measures, <strong>and</strong> adopting voluntary codes of practice <strong>and</strong> best practice<br />
fishing methods. Codes of practice have been in place in the joint venture tuna longline fishery since<br />
1997–98, requiring, inter alia, longlines to be set at night <strong>and</strong> voluntary upper limits on the incidental<br />
catch of seabirds. That limit was steadily reduced from 160 “at risk” seabirds in 1997–98, to 75 in<br />
2003–04. Most vessels in the domestic longline tuna fishery had also voluntarily adopted night<br />
setting, by 2004. A code of practice was in place for the ling auto-line fishery by 2002–03. Other early<br />
initiatives included reduced deck lighting, the use of thawed rather than frozen baits, sound deterrents,<br />
discharging of offal away from setting <strong>and</strong> hauling, weighted branch lines, different gear hauling<br />
techniques <strong>and</strong> line shooters. Current regulated <strong>and</strong> voluntary initiatives are summarised by fishery in<br />
Table 5.8.<br />
In 2002, MFish, DOC, <strong>and</strong> stakeholders began working with other countries to reduce the incidental<br />
catch of seabirds. As a result, a group called Southern Seabird Solutions was formed <strong>and</strong> formally<br />
established as a Trust in 2003 (http://www.southernseabirds.org/) <strong>and</strong> received royal patronage in <strong>2012</strong>.<br />
Southern Seabird Solutions exists to promote responsible fishing practices that avoid the incidental<br />
capture of seabirds in New Zeal<strong>and</strong> <strong>and</strong> the southern ocean. Membership includes representatives<br />
from the commercial fishing industry, environmental <strong>and</strong> conservation groups, <strong>and</strong> government<br />
departments. The Trust’s vision is that: All fishers in the Southern Hemisphere avoid the capture of<br />
seabirds, <strong>and</strong> this is underpinned by the strategic goals on: Culture Change; Supporting Collaboration;<br />
Mitigation Development <strong>and</strong> Knowledge Transfer; Recognising Success; <strong>and</strong> Strengthening the Trust.<br />
Building on these initiatives, New Zeal<strong>and</strong>’s 2004 NPOA established a more comprehensive<br />
framework to reducing incidental captures approach across all fisheries (because focussing on<br />
longline fisheries like the IPOA was considered neither equitable nor sufficient).<br />
87
It included two goals that set the overall direction:<br />
AEBAR <strong>2012</strong>: Protected species: Seabirds<br />
1. To ensure that the long-term viability of protected seabird species is not threatened by their<br />
incidental catch in New Zeal<strong>and</strong> fisheries waters or by New Zeal<strong>and</strong> flagged vessels in high<br />
seas fisheries; <strong>and</strong><br />
2. To further reduce incidental catch of protected seabird species as far as possible, taking into<br />
account advances in technology, knowledge <strong>and</strong> financial implications.<br />
Together the two goals established the NPOA as a long-term strategy. The second goal was designed<br />
to build on the first goal by promoting <strong>and</strong> encouraging the reduction of incidental catch beyond the<br />
level that is necessary to ensure long term viability. The goals recognised that, although seabird deaths<br />
may be accidentally caused by fishing, most seabirds are absolutely protected under the Wildlife Act.<br />
The second goal balances the need to continue reducing incidental catch against the factors that<br />
influence how this can be achieved in practice (e.g., advances in technology <strong>and</strong> the costs of<br />
mitigation). The scope of the NPOA included:<br />
• all seabird species absolutely or partially protected under the Wildlife Act;<br />
• commercial <strong>and</strong> non-commercial fisheries;<br />
• all New Zeal<strong>and</strong> fisheries waters; <strong>and</strong><br />
• high seas fisheries in which New Zeal<strong>and</strong> flagged vessels participate, or where foreign<br />
flagged vessels catch protected seabird species.<br />
Specific objectives were established in the NPOA as follows:<br />
1. Implement efficient <strong>and</strong> effective management measures to achieve the goals of the NPOA,<br />
using best practice measures where possible;<br />
2. Ensure that appropriate incentives <strong>and</strong> penalties are in place so that fishers comply with<br />
management measures;<br />
3. Establish m<strong>and</strong>atory bycatch limits for seabird species where they are assessed to be an<br />
efficient <strong>and</strong> effective management measure <strong>and</strong> there is sufficient information to enable an<br />
appropriate limit to be set;<br />
4. Ensure that there is sufficient, reliable information available for the effective implementation<br />
<strong>and</strong> monitoring of management measures;<br />
5. Establish a transparent process for monitoring progress against management measures;<br />
6. Ensure that management measures are regularly reviewed <strong>and</strong> updated to reflect new<br />
information <strong>and</strong> developments, <strong>and</strong> to ensure the achievement of the goals of the NPOA;<br />
7. Encourage <strong>and</strong> facilitate research into affected seabird species <strong>and</strong> their interactions with<br />
fisheries;<br />
8. Encourage <strong>and</strong> facilitate research into new <strong>and</strong> innovative ways to reduce incidental catch;<br />
9. Provide mechanisms to enable all interested parties to be involved in the reduction of<br />
incidental catch;<br />
10. Promote education <strong>and</strong> awareness programmes to ensure that all fishers are aware of the need<br />
to reduce incidental catch <strong>and</strong> the measures available to achieve a reduction.<br />
The NPOA-seabirds sets out the mix of voluntary <strong>and</strong> m<strong>and</strong>atory measures that would be used to help<br />
reduce incidental captures of seabirds, noted research into the extent of the problem <strong>and</strong> the<br />
techniques for mitigating it, <strong>and</strong> outlined mechanisms to oversee, monitor <strong>and</strong> review the<br />
effectiveness of these measures. It was not within the scope of the NPOA to address threats to<br />
seabirds other than fishing. Such threats are identified in DOC’s Action Plan for Seabird Conservation<br />
in New Zeal<strong>and</strong> (Taylor 2000) <strong>and</strong> their management is undertaken by DOC.<br />
88
AEBAR <strong>2012</strong>: Protected species: Seabirds<br />
Since publication of the NPOA in 2004, more progress has been made in the commercial fishing<br />
sector, including:<br />
• in the deepwater fishing sector;<br />
o industry has implemented vessel specific risk management plans (VMPs) comprising<br />
non-m<strong>and</strong>atory seabird scaring devices offal management <strong>and</strong> other measures to<br />
reduce risks to seabirds,<br />
o Government has implemented m<strong>and</strong>atory measures to reduce risk to seabirds (e.g.,<br />
use <strong>and</strong> deployment of seabird scaring devices), <strong>and</strong><br />
o industry has taken a proactive stance in resourcing a 24/7 liaison officer to undertake<br />
incident response actions, mentoring, VMP <strong>and</strong> regime development <strong>and</strong> reviewing,<br />
<strong>and</strong> fleet wide training;<br />
• in the bottom <strong>and</strong> surface long-line sectors, Government has implemented m<strong>and</strong>atory<br />
measures including tori lines, night setting, line weighting <strong>and</strong> offal management;<br />
• a number of research projects have been or are currently being undertaken by government <strong>and</strong><br />
industry into offal discharge, efficacy of seabird scaring devices, line weighting <strong>and</strong> longline<br />
setting devices; <strong>and</strong><br />
• workshops organised by both industry bodies <strong>and</strong> Southern Seabird Solutions are being held<br />
for the inshore trawl <strong>and</strong> longline sectors.<br />
Areas still requiring progress identified in MPI’s <strong>2012</strong> consultation documents for a revision to the<br />
NPOA-seabirds included:<br />
• development <strong>and</strong> implementation of mitigation measures, <strong>and</strong> education, training <strong>and</strong><br />
outreach in commercial set net fisheries <strong>and</strong> inshore trawl fisheries;<br />
• implementation of spatially <strong>and</strong> temporally representative at-sea data collection in inshore <strong>and</strong><br />
some HMS fisheries;<br />
• development <strong>and</strong> implementation of mitigation measures for net captures in trawl fisheries;<br />
• development <strong>and</strong> implementation of mitigation measures, education, training <strong>and</strong> outreach in,<br />
<strong>and</strong> risk assessment of non-commercial fisheries (especially setnet <strong>and</strong> line fisheries).<br />
Mitigation has developed substantially since FAO’s IPOA was published <strong>and</strong> a number of recent<br />
reviews consider the effectiveness of different methods (Bull 2007, 2009) <strong>and</strong> summarise currently<br />
accepted best practice (ACAP 2011). In December 2010, FAO held a Technical Consultation where<br />
International Guidelines on bycatch management <strong>and</strong> reduction of discards were adopted (FAO2010).<br />
The text included an agreement that the guidelines should complement appropriate bycatch measures<br />
addressed in the IPOA-Seabirds <strong>and</strong> its Best Practice Technical Guidelines (FAO 2009). The<br />
Guidelines were subsequently adopted by FAO in January 2011.<br />
The most important factor influencing contacts between seabirds <strong>and</strong> trawl warp cables is the<br />
discharge of offal (Wienecke <strong>and</strong> Robertson 2002; Sullivan et al. 2006, ACAP 2011). Offal<br />
management methods used to reduce the attraction of seabirds to vessels include mealing, mincing,<br />
<strong>and</strong> batching. ACAP recommends (ACAP 2011) full retention of all waste material where practicable<br />
because this significantly reduced the number of seabirds feeding behind vessels compared with the<br />
discharge of unprocessed fish waste (Abraham 2009; Wienecke <strong>and</strong> Robertson 2002; Favero et al.<br />
2010) or minced waste (Melvin et al. 2010). Offal management has been found to be a key driver of<br />
seabird bycatch in New Zeal<strong>and</strong> trawl fisheries (Abraham 2007; Abraham <strong>and</strong> Thompson 2009b;<br />
Abraham et al. 2009; Abraham 2010; Pierre et al 2010, <strong>2012</strong> a&b). Other best practice<br />
recommendations (ACAP 2011) are the use of bird-scaring lines to deter birds from foraging near the<br />
trawl warps, use of snatch blocks to reduce the aerial extent of trawl warps, cleaning fish <strong>and</strong> benthic<br />
material from nets before shooting, minimising the time the trawl net is on the surface during hauling,<br />
<strong>and</strong> binding of large meshes in pelagic trawl before shooting.<br />
89
AEBAR <strong>2012</strong>: Protected species: Seabirds<br />
Table 5.8 (after MPI <strong>2012</strong>, consultation documents for a revised NPOA-seabirds): summary of current mitigation measures applied to New Zeal<strong>and</strong> vessels fishing<br />
in New Zeal<strong>and</strong> waters to avoid incidental seabird captures. R, regulated; SM, required via a self-managed regime (non-regulatory, but required by industry<br />
organisation <strong>and</strong> audited independently by Government); V, voluntary with at least some use known; N/A, measure not relevant to the fishery; years in parentheses<br />
indicate year of implementation; *, part of a vessel management plan (VMP). Note, this table may not capture all voluntary measures adopted by fishers.<br />
Mitigation Measure Surface longline Bottom longline Trawl >=28 m Trawl
AEBAR <strong>2012</strong>: Non-protected bycatch<br />
In New Zeal<strong>and</strong>, the three legally permitted devices used for mitigation by trawlers are tori lines (e.g.,<br />
Sullivan et al. 2006), bird bafflers (Crysel 2002), <strong>and</strong> warp scarers (Carey 2005). Middleton <strong>and</strong><br />
Abraham (2007) reported experimental trials of mitigation devices designed to reduce the frequency<br />
of collisions between seabirds <strong>and</strong> trawl warps on 18 observed vessels in squid trawl fishery in 2006.<br />
The frequencies of birds striking either warps or one of three mitigation devices (tori lines, 4-boom<br />
bird bafflers, <strong>and</strong> warp scarers) were assessed using st<strong>and</strong>ardised protocols during commercial<br />
fishing. Different warp strike mitigation treatments were used on different tows according to a<br />
r<strong>and</strong>omised experimental design. Middleton <strong>and</strong> Abraham (2007) confirmed that the discharge of<br />
offal was the main factor influencing seabird strikes; almost no strikes were recorded when there was<br />
no discharge, <strong>and</strong> strike rates were low when only sump water was discharged (see also Abraham et<br />
al. 2009). In addition to this effect, tori lines were shown to be most effective mitigation approach <strong>and</strong><br />
reduced warp strikes by 80–95% of their frequency without mitigation. Other mitigation approaches<br />
were only 10–65% effective. Seabirds struck tori lines about as frequently as they did the trawl warps<br />
in the absence of mitigation but the consequences are unknown.<br />
Recommended best practice for surface (pelagic) longline fisheries <strong>and</strong> bottom (demersal) longlines<br />
(ACAP 2011) includes weighting of lines to ensure rapid sinking of baits (including integrated<br />
weighted line for bottom longlines), setting lines at night when most vulnerable birds are less active,<br />
<strong>and</strong> the proper deployment of bird scaring lines (tori lines) over baits being set, <strong>and</strong> offal management<br />
(especially for bottom longlines). A range of other measures are offered for consideration.<br />
5.4.3. Modelling fisheries interactions <strong>and</strong> estimating risk<br />
5.4.3.1. Hierarchical structure of risk assessments<br />
Hobday et al (2007) described a hierarchical framework for ecological risk assessment in fisheries<br />
(see Figure 5.11). The hierarchy included three levels: Level 1 qualitative, expert-based assessments<br />
(often based on a Scale, Intensity, Consequence Analysis, SICA); Level 2 semi-quantitative analysis<br />
(often using some variant of Productivity Susceptibility Analysis, PSA); <strong>and</strong> Level 3 fully quantitative<br />
modelling including uncertainty analysis. The hierarchical structure is designed to “screen out”<br />
potential effects that pose little or low risk for the least investment in data collection <strong>and</strong> analysis,<br />
escalating to risk treatment or higher levels in the hierarchy only for those potential effects that pose<br />
non-negligible risk. This structure relies for its effectiveness on a low potential for false negatives at<br />
each stage, thereby identifying <strong>and</strong> screening out activities that are ‘low risk’ with high certainty. This<br />
focuses effort on remaining higher risk activities. In statistical terms, risk assessment tolerates Type I<br />
errors (false positives, i.e. not screening out activities that may actually present a low risk) in order to<br />
avoid Type II errors (false negatives, i.e. incorrectly screening out activities that actually constitute<br />
high risk), <strong>and</strong> it is important to distinguish this approach from normal estimation methods. Whereas<br />
normal estimation strives for a lack of bias <strong>and</strong> a balance of Type I <strong>and</strong> Type II errors, risk assessment<br />
is designed to answer the question “how bad could it be?” The divergence between the risk<br />
assessment approach <strong>and</strong> normal, unbiased estimation approaches should diminish at higher levels in<br />
the risk assessment hierarchy, where the assessment process should be informed by good data that<br />
support robust estimation.<br />
91
AEBAR <strong>2012</strong>: Non-protected bycatch<br />
Figure 5.11 (from Hobday et al.): Diagrammatic representation of the hierarchical risk assessment<br />
process where activities that present low risk are progressively screened out by assessments of<br />
increasingly high data content, sophistication, <strong>and</strong> cost.<br />
5.4.3.2. Qualitative (Level 1) risk assessment<br />
Rowe (2010) summarised an expert-based, qualitative (Level 1) risk assessment, commissioned by<br />
DOC, for the incidental mortality of seabirds caused by New Zeal<strong>and</strong> fisheries. The main focus was<br />
on fisheries operating within the NZ EEZ <strong>and</strong> on all seabirds absolutely or partially protected under<br />
the Wildlife Act 1953. New Zeal<strong>and</strong> flagged vessels fishing outside the EEZ were included, but risk<br />
from non-NZ fisheries <strong>and</strong> other human causes were not included.<br />
The panel of experts who conducted the Level 1 risk assessment assessed the threat to each of 101<br />
taxa posed by 26 fishery groups, scoring exposure <strong>and</strong> consequence independently according to the<br />
schemas in Tables 5.9 <strong>and</strong> 5.10 (details in Rowe 2010b). The risk for a given taxon posed by a given<br />
fishery was calculated as the product of exposure <strong>and</strong> consequence scores. Potential risk was<br />
estimated as the risk posed by a fishery assuming no mitigation was in place, <strong>and</strong> residual risk (called<br />
“optimum risk” by Rowe 2010b) was estimated assuming that mitigation was in place throughout a<br />
given fishery <strong>and</strong> deployed correctly. The panel also agreed a confidence score for each taxon-fishery<br />
interaction using the schema in Table 5.11.<br />
Table 5.9: Exposure scores used by Rowe (2010) (modified from Fletcher 2005, Hobday et al 2007)<br />
Score Descriptor Description<br />
0 Remote The species will not interact directly with the fishery<br />
1 Rare Interactions may occur in exceptional circumstances<br />
2 Unlikely Evidence to suggest interactions possible<br />
3 Possible Evidence to suggest interactions occur, but are uncommon<br />
4 Occasional Interactions likely to occur on occasion<br />
5 Likely Interactions are expected to occur<br />
92
AEBAR <strong>2012</strong>: Non-protected bycatch<br />
Table 5.10: Consequence scores used by Rowe (2010) (modified from Fletcher 2005, Campbell &<br />
Gallagher 2007, Hobday et al. 2007)<br />
Score Descriptor Description<br />
1 Negligible Some or one individual/s impacted, no population impact.<br />
2 Minor Some individuals are impacted, but minimal impact on population structure or<br />
dynamics. In the absence of further impact, rapid recovery would occur<br />
3 Moderate The level of interaction / impact is at the maximum acceptable level that still meets<br />
an objective. In the absence of further impact, recovery is expected in years<br />
4 Major Wider <strong>and</strong> longer term impacts; loss of individuals; potential loss of genetic<br />
diversity. Level of impact is above the maximum acceptable level. In the absence<br />
of further impact, recovery is expected in multiple years<br />
5 Severe Very serious impacts occurring, loss of seabird populations causing local<br />
extinction; decline in species with single breeding population, measurable loss of<br />
genetic diversity. In the absence of further impact, recovery is expected in years to<br />
decades<br />
6 Intolerable Widespread <strong>and</strong> permanent / irreversible damage or loss occurring; local extinction<br />
of multiple seabird populations; serious decline of a species with a single breeding<br />
population, significant loss of genetic diversity. Even in the absence of further<br />
impact, long-term recovery period to acceptable levels will be greater than decades<br />
or may never occur<br />
Table 5.11: Confidence scores used by Rowe (2010) (after Hobday 2007)<br />
Score Descriptor Rationale for confidence score<br />
1a<br />
1b<br />
1c<br />
1d<br />
2a<br />
2b<br />
2c<br />
Low Data exists, but is considered poor or conflicting.<br />
No data exists.<br />
Agreement between experts, but with low confidence<br />
Disagreement between experts<br />
High Data exists <strong>and</strong> is considered sound.<br />
Consensus between experts<br />
High confidence exposure to impact can not occur (e.g. no spatial overlap of<br />
fishing activity <strong>and</strong> at-sea seabird distribution)<br />
Total potential <strong>and</strong> residual risk for a seabird taxon was estimated by summing the scores across all<br />
fisheries (Table 5.12 shows taxa with an aggregate score of 30 or higher), <strong>and</strong> total potential <strong>and</strong><br />
residual risk posed by a fishery group was estimated by summing the scores across all seabird taxa<br />
(Table 5.13 shows the results for all 26 fishery groups).<br />
White-chinned petrel, Sooty shearwater, Black (Parkinson's) petrel, Salvin's albatross, White-capped<br />
albatross, <strong>and</strong> Flesh-footed shearwater were all estimated by this procedure to have an aggregate risk<br />
score of 90 or higher (range 92 to 123) even if mitigation was in place <strong>and</strong> deployed properly across<br />
all fisheries. Of the 101 seabird taxa considered, the aggregate risk score was less than 30 for 70 taxa<br />
with respect to potential risk <strong>and</strong> for 72 taxa with respect to residual risk.<br />
93
AEBAR <strong>2012</strong>: Non-protected bycatch<br />
Table 5.12: Potential <strong>and</strong> residual risk scores for each seabird taxon with a potential risk score of >=30 in<br />
Rowe (2010). Residual risk (“optimal risk” in Rowe 2010b, not tabulated therein for grey-faced petrel or<br />
light-mantled albatross) is estimated assuming mitigation is deployed <strong>and</strong> correctly used throughout all<br />
interacting fisheries.<br />
Taxon Potential score Residual score Percent reduction<br />
White-chinned petrel 159 123 23<br />
Sooty shearwater 126 108 14<br />
Black (Parkinson's) petrel 139 106 24<br />
Salvin's albatross 161 106 34<br />
White-capped albatross 141 94 33<br />
Flesh-footed shearwater 117 92 21<br />
Southern Buller's albatross 123 85 31<br />
Grey petrel 123 84 32<br />
Black-browed albatross 114 80 30<br />
Northern Buller's albatross 107 72 33<br />
Chatham albatross 114 71 38<br />
Campbell albatross 97 66 32<br />
Westl<strong>and</strong> petrel 89 59 34<br />
Antipodean albatross 89 55 38<br />
Gibson's albatross 89 55 38<br />
W<strong>and</strong>ering albatross 89 55 38<br />
Southern royal albatross 79 49 38<br />
King shag 48 48 0<br />
Pitt Isl<strong>and</strong> shag 46 46 0<br />
Chatham Isl<strong>and</strong> shag 45 45 0<br />
Hutton's shearwater 37 35 5<br />
Northern giant petrel 62 35 44<br />
Pied shag 35 35 0<br />
Indian yellow-nosed albatross 58 34 41<br />
Southern giant petrel 61 34 44<br />
Fluttering shearwater 34 32 6<br />
Spotted shag 31 31 0<br />
Stewart Isl<strong>and</strong> shag 31 31 0<br />
Yellow-eyed penguin 30 30 0<br />
Grey-faced petrel 31 – –<br />
Light-mantled albatross 30 – –<br />
Setnet <strong>and</strong> inshore trawl fisheries groups posed the greatest residual risk to seabirds (summed across<br />
all taxa); both had aggregate scores of over 200 <strong>and</strong> had no substantive mitigation. Surface <strong>and</strong><br />
bottom longline fisheries <strong>and</strong> middle-depth trawl fisheries for finfish <strong>and</strong> squid also had aggregate<br />
risk scores of 100 or more. These risk scores were substantially reduced if mitigation was assumed to<br />
be deployed throughout these fisheries (reductions of 24 to 56%), but all remained above 100.<br />
Trawling for southern blue whiting <strong>and</strong> deep-water species, inshore drift net, various seine methods,<br />
ring net, diving, dredging, <strong>and</strong> h<strong>and</strong> gathering all had aggregate risk scores of 40 or less if mitigation<br />
was assumed to be deployed throughout these fisheries. Diving, dredging, <strong>and</strong> h<strong>and</strong> gathering were all<br />
judged by the panel to pose essentially no risk to seabirds.<br />
94
AEBAR <strong>2012</strong>: Non-protected bycatch<br />
Table 5.13: Cumulative potential risk <strong>and</strong> residual risk scores across all seabird taxa for each fishery<br />
from Rowe (2010). Residual risk (“optimal risk” in Rowe 2010b) is estimated assuming mitigation is<br />
deployed <strong>and</strong> correctly used throughout a given fishery.<br />
Fishery group No. taxa Potential risk Residual risk Percent<br />
reduction<br />
Setnet 42 374 374 0<br />
Inshore trawl 44 225 225 0<br />
Surface longline: charter 25 313 191 39<br />
Surface longline: domestic 25 302 184 39<br />
Bottom longline: small 33 354 154 56<br />
Bottom longline: large 32 311 139 55<br />
Mid-depth trawl: finfish 22 160 122 24<br />
Mid-depth trawl: squid 21 156 118 24<br />
Mid-depth trawl: scampi 23 94 94 0<br />
H<strong>and</strong> line 27 68 68 0<br />
Squid jig 44 62 62 0<br />
Dahn line 29 61 61 0<br />
Pots, traps 17 61 61 0<br />
Trot line 29 61 61 0<br />
Pelagic trawl 27 63 51 19<br />
Troll 23 50 50 0<br />
Mid-depth trawl: southern blue whiting 21 53 40 25<br />
Deep water trawl 21 46 35 24<br />
Inshore drift net 12 33 33 0<br />
Danish seine 15 32 32 0<br />
Beach seine 16 29 29 0<br />
Purse seine 11 22 22 0<br />
Ring net 12 13 13 0<br />
Diving 0 0 0 –<br />
Dredge 0 0 0 –<br />
H<strong>and</strong> gather 0 0 0 –<br />
5.4.3.3. Semi-quantitative (Level 2) risk assessment<br />
The level 2 method developed by MPI arose initially from an expert workshop hosted by the Ministry<br />
of Fisheries in 2008 <strong>and</strong> attended by experts with specialist knowledge of New Zeal<strong>and</strong> fisheries,<br />
seabird-fishery interactions, seabird biology, population modelling, <strong>and</strong> ecological risk assessment.<br />
The overall framework is described in Sharp et al. (2011) <strong>and</strong> has been variously applied <strong>and</strong><br />
improved in multiple iterations (Waugh et al. 2008, developed further by Sharp 2009, Waugh <strong>and</strong><br />
Filippi 2009, Filippi et al. 2010, Richard et al. 2011). The method applies the “exposure-effects”<br />
approach where exposure refers to the number of fatalities arising from an activity <strong>and</strong> effect refers to<br />
the consequence of that exposure for the population. The relative encounter rate of each seabird taxon<br />
with each fishery group is estimated as a function of the spatial overlap between seabird distributions<br />
(e.g., Figure 5.12) <strong>and</strong> fishing effort distributions (e.g., see Figures 5.4–5.6), <strong>and</strong> compares these<br />
estimates with observed captures from fisheries observer data to estimate vulnerability by taxon<br />
(capture rates per encounter) to each fishery group, yielding estimates of total observable captures <strong>and</strong><br />
population-level potential fatalities from all New Zeal<strong>and</strong> commercial fisheries. Impact estimates are<br />
subsequently compared with population estimates <strong>and</strong> biological characteristics to yield estimates of<br />
population-level risk.<br />
The current level 2 risk assessment (i.e., as described by Richard et al. 2011) estimated the risk posed<br />
to each of 64 seabird taxa by trawl <strong>and</strong> longline fisheries within New Zeal<strong>and</strong>’s TS <strong>and</strong> EEZ.<br />
Insufficient information was available to include some other fisheries thought to pose substantial risk<br />
95
AEBAR <strong>2012</strong>: Non-protected bycatch<br />
to seabirds, especially setnet. For each taxon, the risk was assessed by dividing the estimated number<br />
of potential fatalities by an estimate of Potential Biological Removals (PBR, after Wade 1998). This<br />
index represents the amount of human-induced mortality a population can sustain without<br />
compromising its ability to achieve <strong>and</strong> maintain a population size above its maximum net<br />
productivity (MNPL) or to achieve rapid recovery from a depleted state. In the risk assessment, PBR<br />
was estimated from the best available information on the demography of each taxon (Figure 5.13).<br />
Because estimates of seabirds’ demographic parameters <strong>and</strong> of fisheries related mortality are<br />
imprecise, the uncertainty around the demographic <strong>and</strong> mortality estimates was propagated through<br />
the analysis. This allowed uncertainty in the resulting risk to be calculated, <strong>and</strong> also allowed the<br />
identification of parameters where improved precision would reduce overly large uncertainties.<br />
However, not all sources of uncertainty could be included, <strong>and</strong> the results are best used as a guide in<br />
the setting of research <strong>and</strong> management priorities. In general, seabird demographics, the distribution<br />
of seabirds within New Zeal<strong>and</strong> waters, <strong>and</strong> sources of cryptic mortality were poorly known.<br />
Amongst the 64 studied taxa, black (Parkinson’s) petrel (Procellaria parkinsoni) clearly stood out as<br />
at most risk from commercial fishing activities within the New Zeal<strong>and</strong> Exclusive Economic Zone<br />
(estimated annual potential fishing-related fatalities almost 10 times higher than the PBR, Figures<br />
5.14 <strong>and</strong> 5.15). Seven other taxa had estimated annual potential fatalities with 95% confidence<br />
intervals of their risk ratios completely above one. These were grey-headed albatross, Chatham<br />
albatross, Westl<strong>and</strong> petrel, light-mantled albatross, Salvin’s albatross, fleshfooted shearwater, <strong>and</strong><br />
Stewart Isl<strong>and</strong> shag. For a further 12 taxa, the confidence interval of the risk ratio included one.<br />
Small inshore fisheries, especially trawl fisheries targeting flatfish, <strong>and</strong> small bottom <strong>and</strong> surface<br />
fisheries, were associated with the highest estimated risk to seabirds. This was due to a combination<br />
of low observer coverage, high effort, <strong>and</strong> overlap with the distributions of many seabirds. In fisheries<br />
where there were few observations, the number of potential fatalities was estimated in a precautionary<br />
way, with the estimates being biased toward the high end of the range of values that were consistent<br />
with the observer data. In these poorly observed fisheries, the risk estimates are often primarily<br />
associated with the lack of information. Of the taxa that had a risk ratio greater than one, the risk for<br />
four of them (grey-headed albatross, Westl<strong>and</strong> petrel, Chatham albatross, <strong>and</strong> light-mantled albatross)<br />
was associated with low observer coverage in inshore fisheries that overlap with the distribution of<br />
these birds. Increasing the number of observations in inshore trawl <strong>and</strong> small vessel longline fisheries,<br />
especially in FMAs 1, 2, 3, <strong>and</strong> 7, would increase the precision of the estimated fatalities. The risk<br />
was estimated independently for each fishery, <strong>and</strong> it was assumed that the vulnerabilities of seabirds<br />
to capture in different fisheries were independent. This has the consequence that birds (such as lightmantled<br />
sooty albatross) may be caught infrequently in well observed fisheries, but still have high risk<br />
associated with poorly observed fisheries.<br />
96
AEBAR <strong>2012</strong>: Non-protected bycatch<br />
Figure 5.12 (reproduced from Richard et al. 2011 supplementary material): Captures <strong>and</strong> relative density<br />
of White-capped albatross (top) <strong>and</strong> Chatham petrel (bottom) showing large differences in the extent of<br />
distributions <strong>and</strong> overlap with fishing effort (in grey), <strong>and</strong> in the number of observed captures. The<br />
97
AEBAR <strong>2012</strong>: Non-protected bycatch<br />
distribution base maps were obtained from NABIS (white-capped albatross) <strong>and</strong> the BirdLife single-layer<br />
range maps (Chatham petrel).<br />
Figure 5.13 (reproduced from Richard et al. 2011): Diagram of the modelling approach to calculate the<br />
risk index for each taxon. NBP, number of annual breeding pairs; N, total number of birds over one year<br />
old; NBPmin, lower 25% of the distribution of NBP; Nmin, lower 25% of the distribution of the total number<br />
of birds over one year old; rmax, maximum population growth rate; f, recovery factor; PBR, Potential<br />
Biological Removal; P, proportion of adults breeding in a given year; A, age at first reproduction; S,<br />
annual adult survival rate.<br />
98
AEBAR <strong>2012</strong>: Non-protected bycatch<br />
Figure 5.14 (reproduced from Richard et al. 2011): Mean annual potential seabird fatalities in the<br />
assessed fishery groups (colour bars) <strong>and</strong> the PBR (grey bars), for each of the 64 studied taxa. The bars<br />
indicate the 95% confidence intervals of the distributions. Taxa are sorted in decreasing order of the<br />
lower confidence level of the number of fatalities.<br />
99
AEBAR <strong>2012</strong>: Non-protected bycatch<br />
Figure 5.15 (reproduced from Richard et al. 2011): Risk ratio (total annual potential fatalities / PBR) for<br />
each of the studied taxa except black-browed albatross. The risk ratio is displayed on a logarithmic scale.<br />
The threshold where the number of potential bird fatalities equals the PBR is presented by the vertical<br />
black line. The bars indicate the 95% confidence intervals of the distributions. Taxa are sorted in<br />
decreasing order of the lower confidence level of the risk ratio.<br />
Many limitations were identified in the risk assessment. These may result in biased estimates (either<br />
too high or too low) of the risk of fishing to some seabirds. Moreover, some fisheries were not<br />
included in our analysis, <strong>and</strong> other sources of human-induced mortality were ignored. The conclusions<br />
of our results should therefore be interpreted with caution, as some taxa might be at risk, even if their<br />
risk ratio was estimated to be lower than one. Conversely, the fisheries-related fatalities may be<br />
overestimated in poorly observed fisheries because the method is designed to answer the question<br />
“how bad could it be?” (e.g., Figure 5.16 which shows the results of different estimation approaches<br />
<strong>and</strong> questions). The method assumed a high number of captures in the absence of data to the contrary,<br />
so the estimated potential fatalities in poorly-observed fisheries may be higher than the actual<br />
fatalities.<br />
100
AEBAR <strong>2012</strong>: Non-protected bycatch<br />
Figure 5.16 (reproduced from Richard et al. 2011): Comparison of the number of potential annual<br />
captures (without cryptic mortality) estimated using the risk assessment method used by Richard et al<br />
(2011), a simple ratio scalar, <strong>and</strong> statistical modelling, for white-chinned petrel, white-capped albatross,<br />
sooty shearwater, <strong>and</strong> all birds combined, in trawl, bottom longline, <strong>and</strong> surface longline fisheries. Each<br />
symbol represents the mean <strong>and</strong> the 95% confidence interval of an estimate.<br />
The method described by Richard et al. (2011) offers the following advantages that make it<br />
particularly suitable for assessing risk to multiple seabird populations from multiple fisheries:<br />
• risk is assessed separately for each seabird taxon; fisheries managers must assess risk to<br />
seabirds with reference to units that are biologically meaningful;<br />
• the method does not rely on the existence of universal or representative fisheries observer<br />
data to estimate seabird mortality (fisheries observer coverage is generally too low <strong>and</strong>/or too<br />
spatially unrepresentative to allow direct impact estimation at the species or subspecies level);<br />
the method can be applied to any fishery for which at least some observer data exists;<br />
• the method does not rely on detailed population models (the necessary data for which are<br />
unavailable for the great majority of taxa) because risk is estimated as a function of<br />
population-level potential fatalities <strong>and</strong> biological parameters that are generally available<br />
from published sources;<br />
• the method assigns risk to each taxon in an absolute sense, i.e. taxa are not merely ranked<br />
relative to one another; this allows the definition of biologically meaningful performance<br />
st<strong>and</strong>ards <strong>and</strong> ability to track changes in performance over time <strong>and</strong> in relation to risk<br />
management interventions;<br />
• risk scores are quantitative <strong>and</strong> objectively scalable between fisheries or areas, so that risk at a<br />
population level can be disaggregated <strong>and</strong> assigned to different fisheries or areas based on<br />
their proportional contribution to total impact to inform risk management prioritisation;<br />
101
AEBAR <strong>2012</strong>: Non-protected bycatch<br />
• the method allows explicit statistical treatment of uncertainty, <strong>and</strong> does not conflate<br />
uncertainty with risk; numerical inputs include error distributions <strong>and</strong> it is possible to track<br />
the propagation of uncertainty from inputs to estimates of risk; <strong>and</strong><br />
• the method readily incorporates new information; assumptions in the assessment are<br />
transparent <strong>and</strong> testable <strong>and</strong>, as new data becomes available, the consequences for the<br />
subsequent impact <strong>and</strong> risk calculations arise logically without the need to revisit other<br />
assumptions or repeat the entire risk assessment process.<br />
The key disadvantages of the method are that:<br />
• fisheries for which no observer information on seabird interactions is available cannot be<br />
included in the analysis<br />
• the assumption that the vulnerabilities of particular seabirds to capture in different fisheries<br />
are independent does not allow “sharing” of scarce observer information between fisheries<br />
within the risk assessment<br />
• the spatial overlap method relies on appropriate spatial <strong>and</strong> temporal scales for the<br />
distributions of birds <strong>and</strong> fishing effort being used; use of inappropriate scales can lead to<br />
misleading results<br />
• strong assumptions have to be made about the distribution <strong>and</strong> productivity of some taxa, the<br />
relative vulnerability of different taxa to capture by particular fisheries, cryptic mortality<br />
associated with different fishing methods, <strong>and</strong> the applicability of the allometric method of<br />
estimating Potential Biological Removals.<br />
Most of these limitations are a result of the scarcity of relevant data on seabird populations <strong>and</strong><br />
fisheries impacts <strong>and</strong> can be addressed only through the collection of more information or, in some<br />
cases, sensitivity testing. In particular, it was not possible to include some fishery groups identified by<br />
Rowe’s (2010b) level 1 analysis as posing substantial risk to seabirds. Notable among these fisheries<br />
was the commercial setnet fishery group. In the absence of quantitative information for these fishery<br />
groups, the Ministry of Fisheries combined the level 1 <strong>and</strong> level 2 results to generate a comprehensive<br />
assessment of seabird risk across all New Zeal<strong>and</strong> seabirds <strong>and</strong> fisheries (Table 5.14). Apart from<br />
filling some important information gaps in the assessment, the level 1 results were also useful as a<br />
cross-check on the level 2 outputs. A number of likely misleading results were identified in this way,<br />
including those from poor input data (e.g. spatial distribution layers) or faulty structural assumptions<br />
for particular seabird taxa, <strong>and</strong> these were noted so that inappropriate conclusions were not made <strong>and</strong><br />
to provide for better treatment in subsequent iterations of the level 2 analysis.<br />
At the time of going to press, a major update <strong>and</strong> revision of the level 2 risk assessment published by<br />
Richard et al. (2011) was undergoing final review. This revision includes several substantial<br />
improvements on the 2011 version including:<br />
• fisheries <strong>and</strong> observer data from 2006/07 onwards (i.e., post-mitigation only, allowing a better<br />
estimate of current risk)<br />
• inclusion of set net fisheries (obviating the need to combine level 1 <strong>and</strong> level 2 analyses)<br />
• revised bird distributions<br />
• inclusion of seasonal stratification of bird distribution <strong>and</strong> overlap with fisheries<br />
• an integrated approach to estimating species-specific vulnerability to particular fisheries<br />
• correction of a bias in the estimation of productivity from age at first reproduction <strong>and</strong> annual<br />
adult survival rate<br />
• inclusion of uncertainty in estimates of cryptic mortality<br />
This revised risk assessment is expected to be available early in 2013.<br />
102
AEBAR <strong>2012</strong>: Non-protected bycatch<br />
Table 5.14: Combined level 2 <strong>and</strong> level 1 risk assessments for seabird taxa with a risk ratio of 0.3 or<br />
greater (i.e., mean potential fatalities 30% of the estimated PBR or greater). INS, inshore trawl fisheries<br />
including for flatfish; SQU, squid trawl fisheries; SCI, scampi trawl fisheries; OFF, other offshore trawl<br />
fisheries; BLL, bottom longline fisheries; SLL, surface longline fisheries; SN, setnet (from level 1); Other,<br />
all other fisheries considered in the level 1 risk assessment. * indicates an unreliable assessment.<br />
Taxon INS SQU SCI OFF BLL SLL SN Other<br />
103<br />
Risk<br />
ratio<br />
Black (Parkinson's) petrel 4.37 0.12 0.17 0.37 5.56 0.41 0.00 0.45 11.45<br />
Black-browed albatross * 1.07 0.02 0.04 0.64 2.46 1.37 0.00 0.00 * 5.59<br />
New Zeal<strong>and</strong> king shag 1.84 0.00 0.00 0.05 0.15 0.00 1.51 0.91 4.46<br />
Grey-headed albatross * 2.38 0.03 0.09 0.37 0.52 0.07 0.00 0.00 * 3.46<br />
Westl<strong>and</strong> petrel 1.99 0.12 0.05 0.36 0.59 0.15 0.00 0.00 3.26<br />
Chatham albatross 1.81 0.04 0.08 0.19 0.55 0.03 0.00 0.00 2.70<br />
Stewart Isl<strong>and</strong> shag 1.59 0.00 0.00 0.00 0.01 0.00 1.01 0.00 2.62<br />
Northern giant-petrel 1.65 0.06 0.12 0.32 0.34 0.05 0.00 0.00 2.55<br />
Pitt Isl<strong>and</strong> shag 0.00 0.00 0.00 0.01 0.12 0.00 1.51 0.80 2.45<br />
Flesh-footed shearwater 0.72 0.01 0.31 0.08 1.12 0.19 0.00 0.00 2.42<br />
Chatham Isl<strong>and</strong> shag 0.00 0.00 0.00 0.02 0.17 0.00 1.51 0.60 2.31<br />
Salvin's albatross 1.43 0.05 0.22 0.22 0.34 0.03 0.00 0.00 2.29<br />
Light-mantled albatross * 1.46 0.02 0.05 0.22 0.34 0.04 0.00 0.00 * 2.14<br />
Northern royal albatross 0.96 0.05 0.03 0.21 0.31 0.54 0.00 0.00 2.09<br />
Campbell albatross 0.61 0.06 0.06 0.24 0.51 0.33 0.00 0.00 1.81<br />
New Zeal<strong>and</strong> storm-petrel 0.00 0.00 0.00 0.00 0.00 0.00 0.00 1.51 1.51<br />
Yellow-eyed penguin 0.08 0.00 0.00 0.01 0.02 0.00 1.26 0.00 1.38<br />
Spotted shag 0.47 0.00 0.00 0.00 0.03 0.01 0.75 0.00 1.27<br />
Fiordl<strong>and</strong> crested penguin 0.07 0.00 0.00 0.01 0.33 0.04 0.80 0.00 1.25<br />
W<strong>and</strong>ering albatross 0.00 0.00 0.00 0.00 0.00 1.21 0.00 0.00 1.21<br />
Southern Buller's albatross 0.36 0.17 0.03 0.38 0.05 0.20 0.00 0.00 1.19<br />
Gibson's albatross 0.23 0.02 0.01 0.07 0.15 0.67 0.00 0.00 1.16<br />
Antipodean albatross 0.22 0.02 0.01 0.06 0.14 0.64 0.00 0.00 1.10<br />
Hutton's shearwaters 0.05 0.00 0.00 0.01 0.04 0.00 1.01 0.00 1.10<br />
Pied shag 0.00 0.00 0.00 0.00 0.00 0.00 0.75 0.30 1.06<br />
South Georgia diving-petrel 0.00 0.00 0.00 0.00 0.00 0.00 0.60 0.30 0.91<br />
Indian yellow-nosed albatross 0.00 0.00 0.00 0.00 0.00 0.60 0.00 0.00 0.60<br />
White-capped albatross 0.32 0.34 0.02 0.09 0.02 0.01 0.00 0.00 0.79<br />
Sooty shearwater * 0.01 0.01 0.00 0.00 0.00 0.00 0.75 0.00 * 0.77<br />
White-chinned petrel 0.11 0.37 0.01 0.09 0.15 0.03 0.00 0.00 0.77<br />
Fluttering shearwater 0.00 0.00 0.00 0.00 0.00 0.00 0.75 0.00 0.75<br />
Little black shag 0.00 0.00 0.00 0.00 0.00 0.00 0.75 0.00 0.75<br />
Northern blue penguin 0.00 0.00 0.00 0.00 0.00 0.00 0.75 0.00 0.75<br />
White-flippered blue penguin 0.00 0.00 0.00 0.00 0.00 0.00 0.75 0.00 0.75<br />
Northern Buller's albatross 0.19 0.00 0.05 0.14 0.19 0.17 0.00 0.00 0.75<br />
Southern royal albatross 0.31 0.05 0.02 0.07 0.08 0.21 0.00 0.00 0.74<br />
Cape petrel * 0.27 0.00 0.03 0.14 0.21 0.03 0.00 0.00 * 0.69<br />
Southern giant petrel 0.00 0.00 0.00 0.00 0.15 0.00 0.00 0.00 0.15<br />
Chatham Isl<strong>and</strong> blue penguin 0.00 0.00 0.00 0.00 0.00 0.00 0.45 0.00 0.45<br />
Grey petrel 0.13 0.00 0.00 0.03 0.08 0.12 0.00 0.00 0.37<br />
Magenta petrel 0.00 0.00 0.00 0.00 0.02 0.00 0.00 0.30 0.33
AEBAR <strong>2012</strong>: Non-protected bycatch<br />
5.4.3.4. Fully quantitative modelling<br />
Fully quantitative population modelling has been conducted only for southern Buller’s albatross,<br />
black (Parkinson’s) petrel, white capped albatross (mollymawk), <strong>and</strong> Gibson’s (w<strong>and</strong>ering) albatross.<br />
Data of similar quality <strong>and</strong> quantity are available for Antipodean (w<strong>and</strong>ering) albatross, <strong>and</strong> this work<br />
should be commissioned soon, but data for other species or populations appear unlikely to be<br />
adequate for comprehensive population modelling. The poor estimates of observable <strong>and</strong> cryptic<br />
fishing-related mortality have restricted such work to comprehensive population modelling rather than<br />
formal assessment of risk.<br />
5.4.3.4.1. Quantitative models for southern Buller’s<br />
albatross<br />
Francis et al. (2008, see also Francis <strong>and</strong> Sagar <strong>2012</strong>) assessed the status of the Snares Isl<strong>and</strong>s<br />
population of southern Buller’s albatross (Thalassarche bulleri bulleri). They estimated (see also<br />
Sagar <strong>and</strong> Stahl 2005) that the adult population had increased about 5-fold since about 1950 (Figure<br />
5.17) at a rate of about 2% per year, <strong>and</strong> concluded from this that the risk to the viability of this<br />
population posed by fisheries had been small. This conclusion depends critically on the reliability of<br />
the first census of nesting birds conducted in 1969, but the authors give compelling reasons to trust<br />
that information. They noted, however, that population growth had slowed by about 2005 (<strong>and</strong><br />
perhaps reversed) <strong>and</strong> adult survival rates were falling, but could discern neither the cause nor<br />
significance of these changes because they had included survival data only up to 2007. An additional<br />
5 years of survival <strong>and</strong> other demographic data have since been recorded (Sagar et al. 2010) <strong>and</strong> all<br />
monitored sites at the Snares Isl<strong>and</strong>s show substantial declines in the number of breeding pairs since<br />
2006. The modelling has not yet been repeated.<br />
Figure 5.17 (reproduced from Francis et al. 2008): Estimates from model SBA21 of numbers of breeders<br />
(solid line) <strong>and</strong> adults (broken line) in each year. Also shown are the census observations (after (Sagar<br />
<strong>and</strong> Stahl 2005) of numbers of breeders (crosses), with assumed 95% confidence intervals (vertical lines).<br />
104
AEBAR <strong>2012</strong>: Non-protected bycatch<br />
Fishery discards are an important component of the diet of chicks, but Francis et al. (2008) were not<br />
able to assess whether the associated positive effect on population growth (e.g., from increased<br />
breeding success) is greater or less than the negative effect of fishing-related mortality.<br />
5.4.3.4.2. Quantitative models for black petrel<br />
Francis <strong>and</strong> Bell (2010) analysed data from the main population of black (Parkinson’s) petrel<br />
(Procellaria parkinsoni), which breeds on Great Barrier Isl<strong>and</strong>. Abundance data from transect surveys<br />
were used to infer that the population was probably increasing at a rate between 1.2% <strong>and</strong> 3.1% per<br />
year. Mark-recapture data were useful in estimating demographic parameters, like survival <strong>and</strong><br />
breeding success, but contained little information on population growth rates. Fishery bycatch data<br />
from observers were too sparse <strong>and</strong> imprecise to be useful in assessing the contribution of fishingrelated<br />
mortality. Francis <strong>and</strong> Bell (2010) suggested that, because the population was probably<br />
increasing, there was no evidence that fisheries posed a risk to the population at that time. They<br />
cautioned that this did not imply that there was clear evidence that fisheries do not pose a risk.<br />
Subsequent analysis (Bell et al. <strong>2012</strong>) included an additional line transect survey in 2009/10 in which<br />
the breeding population was estimated to be ~22% lower than in 2004/05 (the latest available to<br />
Francis <strong>and</strong> Bell, 2010). Updating the model of Francis <strong>and</strong> Bell (2010) made little difference to<br />
estimates of demographic parameters such as adult survival, age at first breeding, <strong>and</strong> juvenile<br />
survival (which had 95% confidence limits of 0.67 <strong>and</strong> 0.91). The uncertainty in juvenile survival<br />
gave rise to uncertainty in the estimated population trend, with a mean rate of population growth over<br />
the modelling period ranging from ‐2.5% per year (if juvenile survival = 0.67) to +1.6% per year (if<br />
juvenile survival = 0.91, close to the average annual survival rate for older birds) (Figure 5.18). Bell et<br />
al. (<strong>2012</strong>) concluded that the mean rate of change of the population over the study period had not<br />
exceeded 2% per year, though the direction of change was uncertain.<br />
Figure 5.18 (reproduced from Bell et al. <strong>2012</strong>): Likelihood profile for annual probability of juvenile<br />
survival showing: A, the loss of fit (the horizontal dotted line shows a 95% confidence interval for this<br />
parameter); <strong>and</strong> B, population trajectories corresponding to different values of juvenile survival, together<br />
with population estimates from transect counts (crosses with vertical lines indicating 95% confidence<br />
intervals. Note that the 1988 population estimate was not used in the model.<br />
105
AEBAR <strong>2012</strong>: Non-protected bycatch<br />
5.4.3.4.3. Quantitative models for white-capped albatross<br />
Francis (<strong>2012</strong>) described quantitative models for white-capped albatross (Thalassarche steadi), New<br />
Zeal<strong>and</strong>’s most numerous breeding albatross, <strong>and</strong> the most frequently captured, focussing on the<br />
population breeding at the Auckl<strong>and</strong> Isl<strong>and</strong>s. After a correction for a probable bias introduced by<br />
sampling at different times of day in one of the surveys, aerial photographic counts by Baker et al.<br />
(2007, 2008, 2009, <strong>and</strong> 2010, see also Table 5.15) suggest that the adult population declined at about<br />
9.8% per year between 2006 <strong>and</strong> 2009. However, this estimate is imprecise <strong>and</strong> is not easily<br />
reconciled with the high adult survival rate (0.96) estimated from mark-recapture data. Francis (<strong>2012</strong>)<br />
also compared the trend with his estimate of the global fishing-related fatalities of white-capped<br />
albatross (slightly over 17 000 birds per year, about 30% of which is taken in New Zeal<strong>and</strong> fisheries)<br />
<strong>and</strong> found that fishing-related fatalities were insufficient to account for the number of deaths implied<br />
by a decline of 9.8% per year (roughly 22 000 birds per year over the study period). The scarcity of<br />
information on cryptic mortality makes these estimates <strong>and</strong> conclusions uncertain, however.<br />
Table 5.15 (data from Baker et al. 2007, 2008, 2009, 2010): Aerial-photographic counts of breeding pairs<br />
of white-capped albatrosses on three isl<strong>and</strong>s in the Auckl<strong>and</strong> Isl<strong>and</strong>s group in December 2006–2009.<br />
Confidence limits for these counts published by Baker (op. cit.) were based on a Poisson model <strong>and</strong> were<br />
very narrow (although uncertainty introduced by the proportion of non-nesting birds at the colonies<br />
during photography was not included).<br />
Year Disappointment SW Cape Adams Total<br />
2006 110 649 6 548 – 117 197<br />
2007 86 080 4 786 79 90 945<br />
2008 91 694 5 264 131 97 089<br />
2009 70 569 4 161 132 74 862<br />
5.4.3.4.4. Quantitative models for Gibson’s albatross<br />
Francis et al. (in press) concluded there is cause for concern about status of the population of<br />
Gibson’s w<strong>and</strong>ering albatross (Diomedea gibsoni) on the Auckl<strong>and</strong> Isl<strong>and</strong>s. Since 2005, the adult<br />
population has been declining at 5.7%/yr (95% c.i. 4.5–6.9%) because of sudden <strong>and</strong> substantial<br />
reductions in adult survival, the proportion of adults breeding, <strong>and</strong> the proportion of breeding attempts<br />
that are successful (Figure 5.19). Forward projections showed that the most important of these to the<br />
future status of this population is adult survival (Figure 5.20).<br />
The population in 2011 was 64% (58–73%) of its estimated size in 1991. The breeding population<br />
dropped sharply in 2005, to 59% of its 1991 level, but has been increasing since 2005 at 4.2% per<br />
year (2.3–6.1%). The 2011 breeding population is estimated to be only 54% of the average of 5831<br />
pairs estimated by Walker & Elliott (1999) for 1991–97.<br />
106
AEBAR <strong>2012</strong>: Non-protected bycatch<br />
Figure 5.19: Estimated population trajectories for the whole Auckl<strong>and</strong> Isl<strong>and</strong>s population of Gibson’s<br />
w<strong>and</strong>ering albatross. These were calculated by scaling up Francis et al.’s (in press) GIB5 trajectories to<br />
match the Walker & Elliott (1999) estimate for the whole population.<br />
Figure 5.20: Estimated population trajectory for adults from Francis et al.’s (in press) model GIB5 with<br />
20-year projections under five alternative scenarios about three demographic parameters: adult survival<br />
(adsurv); breeding success (Psuccess); <strong>and</strong> proportion of adults breeding. These scenarios differ<br />
according to whether each parameter remains at its status quo (=2011) level or recovers immediately to<br />
its 1991 level.<br />
Francis et al. (in press) found it difficult to assess the effect of fisheries mortality on the viability of<br />
this population because, although some information exists about captures in New Zeal<strong>and</strong> <strong>and</strong><br />
Australian waters, the effect of fisheries in international waters is unknown. Three conclusions are<br />
possible from the available data: most fisheries mortality of Gibson’s is caused by surface longlines;<br />
mortality from fishing within the New Zeal<strong>and</strong> EEZ is now probably lower than it was; <strong>and</strong> there is<br />
no indication that the sudden <strong>and</strong> substantial drops in adult survival, the proportion breeding, <strong>and</strong><br />
breeding success were caused primarily by fishing.<br />
107
AEBAR <strong>2012</strong>: Non-protected bycatch<br />
5.4.3.4.5. Other quantitative models<br />
This section is not intended to cover all quantitative modelling of seabird populations, rather to focus<br />
on recent studies that sought to assess the impact of fishing-related mortality.<br />
Maunder et al. (2007) sought to assess the impact of commercial fisheries on the Otago Peninsula<br />
yellow-eyed penguins using mark-recapture data within a population dynamics model. They found the<br />
data available at that time inadequate to assess fisheries impacts, but evaluated the likely utility of<br />
additional information on annual survival or an estimate of bycatch for a single year. Including<br />
auxiliary information on average survival in the absence of fishing allowed estimation of the fishery<br />
impact, but with poor precision. Including an estimate of fishery-related mortality for a single year<br />
improved the precision in the estimated fishery impact. The authors concluded that there was<br />
insufficient information to determine the impact of fisheries on yellow-eyed penguins <strong>and</strong> that<br />
quantifying fishing-related mortality over several years was required to undertake such an assessment<br />
using population a modelling approach.<br />
Fletcher et al. (2008) sought to assess the potential impact of fisheries on Antipodean <strong>and</strong> Gibson’s<br />
w<strong>and</strong>ering albatrosses (Diomedea antipodensis antipodensis <strong>and</strong> D. a. gibsoni); black petrel<br />
(Procellaria parkinsoni) <strong>and</strong> southern royal albatross (Diomedea epomophora). Because of problems<br />
with the available fisheries <strong>and</strong> biological data, they were unable to use their models to predict the<br />
impact of a change in fishing effort on the population growth rate of a given species. Instead, they<br />
used the models to estimate the impact that changes in demographic parameters like annual survival<br />
are likely to have on population growth rate. They found that: reducing breeder survival rate by k<br />
percentage points will lead to a reduction in the population growth rate of about 0.3k percentage<br />
points (0.4 for black petrel); <strong>and</strong> a reduction of k percentage points in the survival rate for each stage<br />
in the life cycle (juvenile, pre-breeder, non-breeder <strong>and</strong> breeder) will lead to a reduction in the<br />
population growth rate of approximately k percentage points. Fletcher et al. (2008) also made<br />
estimates of PBR for 23 New Zeal<strong>and</strong> seabird taxa <strong>and</strong> summarise <strong>and</strong> tabulated non-fishing-related<br />
threats for 38 taxa.<br />
Newman et al. (2009) combined survey data with demographic population models to estimate the<br />
total population of sooty shearwaters within New Zeal<strong>and</strong>. They estimated the total New Zeal<strong>and</strong><br />
population between 1994 <strong>and</strong> 2005 to have been 21.3 (95% c.i. 19.0–23.6) million birds. The harvest<br />
of “muttonbirds” was estimated to be 360 000 (320 000–400 000) birds per year, equivalent to 18% of<br />
the chicks produced in the harvested areas <strong>and</strong> 13% of chicks in the New Zeal<strong>and</strong> region. This<br />
directed harvest is much larger than estimates of captures in key fisheries (Table 5.4) or potential<br />
fatalities in the level 2 risk assessment (Figure 5.16). Newman et al. (2009) did not assess the likely<br />
impact of fishing-related mortality but concluded that the much larger directed harvest was not an<br />
adequate explanation for the observed declines in the past three decades.<br />
5.4.3.4.6. General conclusions from quantitative modelling<br />
Fully quantitative modelling has now been conducted for four of the five seabird populations for<br />
which apparently suitable data are available. That modelling suggests very strongly that one<br />
population had been increasing steadily (southern Buller’s albatross, but note this trend may have<br />
reversed) <strong>and</strong> another is declining quite rapidly (Gibson’s albatross). White-capped albatross <strong>and</strong><br />
black petrel both more likely to be declining than not but, even for these relatively data rich<br />
populations, the conclusions are uncertain. General conclusions from the modelling conducted to date,<br />
therefore, can be summarised as:<br />
• Very few seabird populations have sufficient data for modelling<br />
• Except for the two most complete data sets (southern Buller’s <strong>and</strong> Gibson’s albatross) it has<br />
been difficult to draw firm conclusions about trends in population size.<br />
108
AEBAR <strong>2012</strong>: Non-protected bycatch<br />
• Information from surveys or census counts is much more powerful for detecting trends in<br />
population size than data from the tagging programmes <strong>and</strong> plot monitoring implemented for<br />
New Zeal<strong>and</strong> seabirds to date.<br />
• The available information on incidental captures in fisheries have not allowed rigorous tests<br />
of the role of fishing-related mortality in driving population trends<br />
• Although comprehensive modelling provides additional information to allow interpretation,<br />
we will have to rely on level 2 risk assessment approaches for much of our underst<strong>and</strong>ing of<br />
the relative risks faced by different seabird taxa <strong>and</strong> posed by different fisheries.<br />
5.4.3.5. Sources of uncertainty in risk assessments<br />
There are several outst<strong>and</strong>ing sources of uncertainty in modelling the effects of fisheries interactions<br />
on sea birds, especially for the complete assessment of risk to individual seabird populations.<br />
5.4.3.5.1. Scarcity of information on captures <strong>and</strong><br />
biological characteristics of affected<br />
populations<br />
These sources of uncertainty can be explored within the analytical framework of the level 2 risk<br />
assessment (Richard et al. 2011), noting that the results of that exploration are constrained by the<br />
structure of that analysis. Richard et al. (2011) provided plots of such an exploration for four example<br />
taxa (Figure 5.21). It can be concluded from this analysis that substantially more precise estimates of<br />
risk would be available for black petrel <strong>and</strong> Stewart Isl<strong>and</strong> shag if better estimates of potential<br />
captures were available. Conversely, substantially more precise estimates of risk would be available<br />
for Salvin’s albatross <strong>and</strong> flesh-footed shearwater if better estimates of average adult survival were<br />
available. This analysis is a powerful way of assessing the priorities for collection of new information,<br />
including research.<br />
Figure 5.21 (reproduced from Richard et al. 2011): Sensitivity of the risk ratio to the uncertainty in the<br />
mean number of annual potential fatalities (F, reflecting the uncertainty in vulnerability), the adult<br />
annual survival rate (S), the number of annual breeding pairs (N), the proportion of adults breeding in a<br />
given year (P), the age at first reproduction (A), <strong>and</strong> to the distribution map (D), for the taxa most at risk<br />
(lower bound of the 95% c.i. above 1). This sensitivity is expressed as the percentage reduction in the 95%<br />
confidence interval of the risk ratio when each parameter is fixed to its mean.<br />
5.4.3.5.2. Scarcity of information on cryptic mortality<br />
Cryptic mortality is particularly poorly understood but has substantial influence on the results of the<br />
risk assessment. Richard et al. (2011) provided a description of the method used to incorporate cryptic<br />
109
AEBAR <strong>2012</strong>: Non-protected bycatch<br />
mortality into their estimates of potential fatalities in the level-2 risk assessment (their Appendix B<br />
authored by B. Sharp, MPI). This method builds on the published information from Brothers et al.<br />
(2010) for longline fisheries <strong>and</strong> Watkins et al. (2008) <strong>and</strong> Abraham (2010) for trawl fisheries.<br />
Brothers et al. (2010) observed almost 6 000 seabirds attempting to take longline baits during line<br />
setting, of which 176 (3% of attempts) were seen to be caught. Of these, only 85 (48%) were retrieved<br />
during line hauling. They concluded that using only observed captures to estimate seabird fatalities<br />
grossly underestimates actual levels in pelagic longline fishing. Similarly, Watkins et al. (2008)<br />
observed 2454 interactions between seabirds <strong>and</strong> trawl warps in the South African hake fishery over<br />
189.8 hours of observation. About 11% of those interactions (263) involved birds, mostly albatrosses,<br />
being dragged under the water by the warps, <strong>and</strong> 30 of those submersions were observed to be fatal.<br />
Of the 30 birds observed killed on the warps, only two (both albatrosses) were hauled aboard <strong>and</strong><br />
would have been counted as captures by an observer in New Zeal<strong>and</strong>. Aerial collisions with the warps<br />
were about 8 times more common but appeared mostly to have little effect (although one whitechinned<br />
petrel suffered a broken wing which would almost certainly have fatal consequences).<br />
Given the relatively small sample sizes in both of these trials, there is substantial (estimatable)<br />
uncertainty in the estimates from the trials themselves <strong>and</strong> additional (non-estimatable) uncertainty<br />
related to the extent to which these trials are representative of all fishing of a given type, particularly<br />
as both trials were undertaken overseas. The binomial 95% confidence range (calculated using the<br />
Clopper-Pearson “exact” method) for the ratio of total fatalities to observed captures in Brothers et<br />
al.’s (2010) longline trial is 1.8–2.5 (mean 2.1), <strong>and</strong> that for Watkins et al.’s trawl warp trial is 5–122<br />
(mean 15.0 fatalities per observed capture). Abraham (2010) estimated that there were 244 (95% c.i.<br />
190–330) warp strikes by large birds for every one observed captured, <strong>and</strong> 6 440 (3400–20 000) warp<br />
strikes by small birds for every one observed captured (although small birds tend to be caught in the<br />
net rather than by warps). There is also uncertainty in the relative frequencies <strong>and</strong> consequences of<br />
different types of encounters with trawl warps in New Zeal<strong>and</strong> fisheries (Abraham 2010, Richard et<br />
al. 2011 Appendix B).<br />
5.4.3.5.3. Mortalities in non-commercial fisheries.<br />
Little is known about the nature <strong>and</strong> extent of incidental captures of seabirds in non-commercial<br />
fisheries, either in New Zeal<strong>and</strong> or globally (Abraham et al. 2010). In New Zeal<strong>and</strong>, participation in<br />
recreational fishing is high <strong>and</strong> 2.5% of the adult population are likely to be fishing in a given week<br />
(mostly using rod <strong>and</strong> line). Because of this high participation rate, even a low rate of interactions<br />
between individual fishers <strong>and</strong> seabirds could have population-level impacts. A boat ramp survey of<br />
765 interviews at two locations during the summer of 2007–08 revealed that 47% of fishers recalled<br />
witnessing a bird being caught some time in the past. Twenty-one birds were reported caught on the<br />
day of the interview at a capture rate of 0.22 (95% c.i.: 0.13–0.34) birds per 100 hours of fishing.<br />
Observers on 57 charter trips recorded seabird captures at rate of 0.36 (0.09–0.66) birds per 100 fisher<br />
hours. The most frequently reported type of bird caught in rod <strong>and</strong> line fisheries were petrels <strong>and</strong><br />
gulls. Captures of albatrosses, shags, gannets, penguins, <strong>and</strong> terns were also recalled.<br />
The ramp surveys reported by Abraham et al. (2010) were limited <strong>and</strong> covered only two widelyseparated<br />
parts of the New Zeal<strong>and</strong> coastline. However, they also report two other pieces of<br />
information that suggest non-commercial captures are likely to be very widespread. First, the<br />
Ornithological Society of New Zeal<strong>and</strong>’s beach patrol scheme records seabird hookings <strong>and</strong><br />
entanglements as a common occurrence throughout New Zeal<strong>and</strong>. Second, returns of b<strong>and</strong>ed birds<br />
caught in fisheries (separating commercial <strong>and</strong> non-commercial fisheries is very difficult) are very<br />
widely distributed around the coast (Figure 5.22).<br />
Noting that our underst<strong>and</strong>ing of seabird capture rates in amateur fisheries is very sketchy, it is<br />
possible to make first-order estimates of total captures using information on fishing effort. For<br />
example, in the north-eastern region where most of Abraham et al.’s (2010) interviews were<br />
conducted, there were an estimated 4.8 (4.4–5.2) million fisher hours rod <strong>and</strong> line fishing from trailer<br />
110
AEBAR <strong>2012</strong>: Non-protected bycatch<br />
boats in 2004–05 (Hartill et al. 2007). Applying Abraham et al.’s (2010) capture rate leads to an<br />
estimate of 11 500 (6600–17 200) captures per year in this area. Based on estimates of nationwide<br />
recreational fishing effort, this could increase to as many as 40 000 bird captures annually. Most birds<br />
captured by amateur fishers were reported to have been released unharmed (77% of the incidents<br />
recalled) <strong>and</strong> only three people reported incidents where the bird died. Because of likely recall biases<br />
<strong>and</strong> the qualitative nature of the survey, the fate of birds that are captured by amateur fishers remains<br />
unclear.<br />
Non-commercial fishers are allowed to use setnets in New Zeal<strong>and</strong> <strong>and</strong> two studies suggest that these<br />
have an appreciable bycatch of seabirds. A study of captures in non-commercial setnets in Portobello<br />
Bay, Otago Harbour, between 1977 <strong>and</strong> 1985 (Lalas 1991) suggested spotted shags were the most<br />
frequently caught taxa (82 recorded, compared with 14 Stewart Isl<strong>and</strong> shags <strong>and</strong> two little shags).<br />
Lalas (1991) suggested that up to 800 spotted shags (20% of the local population) may have been<br />
caught in the summer of 1981/82. A broader-scale study of yellow-eyed penguin mortality in setnets<br />
in southern New Zeal<strong>and</strong> (Darby <strong>and</strong> Dawson 2000) suggested non-negligible captures of this species<br />
by non-commercial fishers, also reporting other seabirds like spotted shags <strong>and</strong> little blue penguin.<br />
Figure 5.22 (reproduced from Abraham et al. 2010): Distribution of the reported capture locations for<br />
b<strong>and</strong>ed seabirds reported as being captured in fishing gear, 1952–2007. Note, b<strong>and</strong> recovery locations are<br />
reported with low spatial precision <strong>and</strong> some of the inl<strong>and</strong> locations may be correct.<br />
5.4.3.5.4. Out of zone mortality.<br />
Robertson et al. (2003) mapped the distribution of the 25 breeding (mainly endemic) New Zeal<strong>and</strong><br />
seabird taxa they considered most at risk outside New Zeal<strong>and</strong> waters. These ranged widely: 4 used<br />
the South Atlantic; 4 the Indian Ocean; 22 Australian waters <strong>and</strong> the Tasman Sea; 15 used the South<br />
Pacific Ocean as far afield as Chile <strong>and</strong> Peru; <strong>and</strong> 6 used the North Pacific Ocean as far north as the<br />
Bering Sea. These taxa therefore use the national waters of at least 18 countries. For example, the<br />
111
AEBAR <strong>2012</strong>: Non-protected bycatch<br />
level-2 risk assessment described by Richard et al. (2011) includes only that part of the range of each<br />
taxon contained within New Zeal<strong>and</strong> waters, but many including commonly-caught seabirds like<br />
white-capped albatross <strong>and</strong> white-chinned petrel range much further <strong>and</strong> are vulnerable to fisheries in<br />
other parts of the world. For instance, fatalities of white-capped albatross outside the New Zeal<strong>and</strong><br />
EEZ greatly exceed fatalities within the zone (Baker 2007, Francis <strong>2012</strong>, Table 5.16), <strong>and</strong> more than<br />
10 000 white-chinned petrel are killed off South America each year (Phillips et al. 2006), noting that<br />
reliable records are not available for most of the fisheries involved. Based on similar analyses, Moore<br />
<strong>and</strong> Zydelis (2008) concluded that a population-based, multi-gear <strong>and</strong> multi-national framework is<br />
required to identify the most significant threats to wide-ranging seabird populations <strong>and</strong> to prioritize<br />
mitigation efforts in the most problematic areas. To that end, the Agreement for the Conservation of<br />
Albatrosses <strong>and</strong> Petrels (ACAP) adopted a global prioritisation framework at the Fourth Session of<br />
the Meeting of the Parties (MoP4) in April <strong>2012</strong> (ACAP <strong>2012</strong>).<br />
Table 5.16 (after Francis <strong>2012</strong>): Estimates of the number of white-capped albatrosses killed annually, by<br />
fishery. The first two columns are from Baker et al. (2007) (mid-point where a range was presented),<br />
including their assessment of reliability (L = low, M-H = medium-high, H = high). Updated estimates are<br />
from Watkins et al. (2008, *) <strong>and</strong> Petersen et al. (2009, **). Estimates not already corrected for cryptic<br />
mortality are either doubled to allow for this (***) or replaced by estimates of potential fatalities from<br />
Richard et al. (2011, ***), noting that potential fatalities may considerably overestimate actual fatalities.<br />
Fishery From Baker et al. 2007 Updated Incl. Cryptic<br />
mortality<br />
South African demersal trawl 4 750 (L) * 6650 6 650<br />
Asian distant-water longline 1 255 (L) – *** 2 510<br />
Namibian demersal trawl 910 (L) * 1270 1 270<br />
Namibian pelagic longline 180 (L) ** 195 *** 390<br />
NZ hoki <strong>and</strong> squid trawl 513 (MH) – **** 4 920<br />
NZ longline 60 (MH) – **** 199<br />
Australian (line fisheries) 15 (MH) – *** 30<br />
South African pelagic longline 570 (H) ** 570 *** 1 140<br />
Total 8 210 – – 17 110<br />
5.4.3.5.5. Other sources of anthropogenic mortality.<br />
Taylor (2000) listed a wide range of threats to New Zeal<strong>and</strong> seabirds including introduced mammals,<br />
avian predators (weka), disease, fire, weeds, loss of nesting habitat, competition for nest sites, coastal<br />
development, human disturbance, commercial <strong>and</strong> cultural harvesting, volcanic eruptions, pollution,<br />
plastics <strong>and</strong> marine debris, oil spills <strong>and</strong> exploration, heavy metals or chemical contaminants, global<br />
sea temperature changes, marine biotoxins, <strong>and</strong> fisheries interactions. Relatively little is known about<br />
most of these factors, but the parties to ACAP have agreed a formal prioritisation process to address<br />
<strong>and</strong> prioritise major threats (ACAP <strong>2012</strong>). Croxall et al. (<strong>2012</strong>) identified the main priorities as:<br />
protection of Important Bird Area (IBA) breeding, feeding, <strong>and</strong> aggregation sites; removal of<br />
invasive, especially predatory, alien species as part of habitat <strong>and</strong> species recovery initiatives.<br />
Lewison et al. (<strong>2012</strong>) identified similar research priorities (in addition to direct fishing-related<br />
mortality), including: underst<strong>and</strong>ing spatial ecology; tropho-dynamics; response to global change; <strong>and</strong><br />
management of anthropogenic impacts such as invasive species, contaminants, <strong>and</strong> protected areas.<br />
Non fishing-related threats to seabirds in New Zeal<strong>and</strong> are largely the m<strong>and</strong>ate of the Department of<br />
Conservation <strong>and</strong> a detailed description is beyond the scope of this document (although causes of<br />
mortality other than fishing are clearly relevant to the interpretation of risk assessment restricted to the<br />
direct effects of fishing). These threats are identified in DOC’s Action Plan for Seabird Conservation<br />
in New Zeal<strong>and</strong> (Taylor 2000).<br />
112
5.5. Indicators <strong>and</strong> trends<br />
AEBAR <strong>2012</strong>: Non-protected bycatch<br />
Population size Multiple species <strong>and</strong> populations: see Taylor (2000)<br />
Population trend Multiple species <strong>and</strong> populations: see Taylor (2000)<br />
Threat status Multiple species <strong>and</strong> populations: see Miskelly et al. (2008) <strong>and</strong> updates<br />
Number of<br />
interactions<br />
Trend in interactions<br />
In the 2010/11 October fishing year, there were an estimated 4931 seabird captures<br />
(excluding cryptic mortalities) across all trawl <strong>and</strong> longline fisheries (excluding about<br />
14% of bottom longline effort that could not be included in the models) (Data version<br />
v<strong>2012</strong>1101). About 57% of the captures were in trawl fisheries, 15% in surface<br />
longline fisheries, <strong>and</strong> 28% in bottom longline fisheries:<br />
Bird group Trawl Surface<br />
longline<br />
113<br />
Bottom<br />
longline<br />
All these<br />
methods<br />
White-capped albatross 356 84 2 442<br />
Other albatrosses 808 287 257 1 352<br />
White-chinned petrel 540 34 422 996<br />
Sooty shearwater 488 2 69 559<br />
Other birds 596 333 652 1 581<br />
All birds combined 2 788 740 1 403 4 931<br />
Captures of all birds combined show a decreasing trend between 2002/03 <strong>and</strong> 2010/11<br />
(Data version v<strong>2012</strong>1101) but there are substantial differences in trends between<br />
species <strong>and</strong> fisheries. Captures of white-capped albatross have decreased, especially in<br />
offshore trawl fisheries, whereas captures of white-chinned petrel have increased:<br />
Estimated captures<br />
1400<br />
1200<br />
1000<br />
White-capped albatross<br />
800<br />
BLL<br />
600<br />
SLL<br />
400<br />
200<br />
0<br />
Trawl<br />
2003 2005 2007 2009 2011<br />
1200<br />
1000<br />
800<br />
600<br />
400<br />
200<br />
0<br />
3000<br />
2500<br />
2000<br />
1500<br />
1000<br />
500<br />
0<br />
Sooty shearwater<br />
2003 2005 2007 2009 2011<br />
2003 2005 2007 2009 2011<br />
BLL<br />
SLL<br />
Other birds<br />
Trawl<br />
BLL<br />
SLL<br />
Trawl<br />
2500<br />
2000<br />
1500<br />
1000<br />
500<br />
0<br />
1200<br />
1000<br />
800<br />
600<br />
400<br />
200<br />
0<br />
Other albatrosses<br />
2003 2005 2007 2009 2011<br />
2003 2005 2007 2009 2011<br />
BLL<br />
SLL<br />
White-chinned petrel<br />
Trawl<br />
BLL<br />
SLL<br />
Trawl<br />
8000<br />
7000<br />
6000<br />
All birds combined<br />
5000<br />
4000<br />
BLL<br />
3000<br />
SLL<br />
2000<br />
1000<br />
0<br />
Trawl<br />
2003 2005 2007 2009 2011<br />
Capture rate trends (excluding cryptic mortalities) are described for the four fisheries<br />
estimated to account for most of captures of a species (accounting for 80% or more of<br />
the total). Capture rates of white-capped albatross have fallen in trawl fisheries for
Trend in interactions<br />
contd.<br />
AEBAR <strong>2012</strong>: Non-protected bycatch<br />
hoki <strong>and</strong> squid but have remained steady in inshore trawl fisheries <strong>and</strong> increased in<br />
the southern bluefin tuna fishery. Capture rates for white-chinned petrel have<br />
increased in trawl fisheries for squid <strong>and</strong> scampi but have remained steady in longline<br />
fisheries. Capture rates of sooty shearwater have declined in the ling longline fishery<br />
but have fluctuated without trend in other key fisheries.<br />
114
5.6. References<br />
AEBAR <strong>2012</strong>: Non-protected bycatch<br />
Abraham ER (2007). Summary of data collected during the southern squid fishery mincing trial. Research report prepared by<br />
Dragonfly for the Department of Conservation, Wellington, New Zeal<strong>and</strong>. 39 p.<br />
Abraham ER (2009). Batching of waste to reduce seabird numbers behind trawl vessels. Unpublished report prepared for the<br />
Department of Conservation, Wellington, New Zeal<strong>and</strong>.<br />
Abraham ER (2010). Warp strike in New Zeal<strong>and</strong> trawl fisheries, 2004–05 to 2008–00. New Zeal<strong>and</strong> <strong>Aquatic</strong> <strong>Environment</strong><br />
<strong>and</strong> <strong>Biodiversity</strong> Report No. 60. 29 p.<br />
Abraham ER (2010). Mincing offal to reduce the attendance of seabirds at trawlers. Report prepared by Dragonfly for<br />
Department of Conservation, Wellington, New Zeal<strong>and</strong>. 28 p.<br />
Abraham ER; Berkenbusch KN; Richard Y (2010). The capture of seabirds <strong>and</strong> marine mammals in New Zeal<strong>and</strong> noncommercial<br />
fisheries New Zeal<strong>and</strong> <strong>Aquatic</strong> <strong>Environment</strong> <strong>and</strong> <strong>Biodiversity</strong> Report No. 64. 52 p.<br />
Abraham ER; Pierre JP; Middleton DAJ; Cleal J; Walker NA; Waugh SM (2009). Effectiveness of fish waste management<br />
strategies in reducing seabird attendance at a trawl vessel. Fisheries Research 95: 210–219<br />
Abraham ER; Thompson FN (2009a). Capture of protected species in New Zeal<strong>and</strong> trawl <strong>and</strong> longline fisheries, 1998–99 to<br />
2006–07. New Zeal<strong>and</strong> <strong>Aquatic</strong> <strong>Environment</strong> <strong>and</strong> <strong>Biodiversity</strong> Report No. 32.<br />
Abraham ER; Thompson FN (2009b): Warp strike in New Zeal<strong>and</strong> trawl fisheries, 2004-05 to 2006-07. New Zeal<strong>and</strong><br />
<strong>Aquatic</strong> <strong>Environment</strong> <strong>and</strong> <strong>Biodiversity</strong> Report No. 33. 21 p.<br />
Abraham ER; Thompson FN (2010). Estimated capture of seabirds in New Zeal<strong>and</strong> trawl <strong>and</strong> longline fisheries, 2002–03 to<br />
2006–07. Final Research Report for research project PRO2007-01 (Unpublished report held by Ministry of<br />
Fisheries, Wellington).<br />
Abraham ER; Thompson FN (2011a). Estimated capture of seabirds in New Zeal<strong>and</strong> trawl <strong>and</strong> longline fisheries, 2002–03 to<br />
2008–09. New Zeal<strong>and</strong> <strong>Aquatic</strong> <strong>Environment</strong> <strong>and</strong> <strong>Biodiversity</strong> Report No. 79. 74 p.<br />
Abraham ER; Thompson FN (2011b). Summary of the capture of seabirds, marine mammals, <strong>and</strong> turtles in New Zeal<strong>and</strong><br />
commercial fisheries, 1998–99 to 2008–09. New Zeal<strong>and</strong> <strong>Aquatic</strong> <strong>Environment</strong> <strong>and</strong> <strong>Biodiversity</strong> Report No. 80.<br />
170 p.<br />
Abraham ER; Thompson FN; Oliver MD (2010). Summary of the capture of seabirds, marine mammals <strong>and</strong> turtles in New<br />
Zeal<strong>and</strong> commercial fisheries, 1998–99 to 2007–08. New Zeal<strong>and</strong> <strong>Aquatic</strong> <strong>Environment</strong> <strong>and</strong> <strong>Biodiversity</strong> Report<br />
No. 45.<br />
ACAP (2011). Report of the Fourth Meeting of the Seabird Bycatch Working Group, Guayaquil, Ecuador, 22–24 August<br />
2011. 94 p. AC6 Doc 14 Rev4.<br />
ACAP (<strong>2012</strong>) ACAP Conservation Priorities. Fourth Meeting of the Parties, Lima, Peru, 23 – 27 April <strong>2012</strong>, available at<br />
http://www.acap.aq/docman/english/meeting-of-the-parties/mop4/mop4-final-report. 13 p.<br />
Arcos JM; Oro D (1996). Changes in foraging range of Audouin’s gulls Larus audouinii in relation to a trawler moratorium<br />
in the western Mediterranean. Waterbirds 19:128–131.<br />
Astles KL; Holloway MG; Steffe A; Green M; Ganassin C; Gibbs PJ (2006). An ecological method for qualitative risk<br />
assessment <strong>and</strong> its use in the management of fisheries in New South Wales, Australia. Fisheries Research 82: 290–<br />
303.<br />
Ayers, D.; Francis, M.P.; Griggs, L.H.; Baird, S.J. (2004). Fish bycatch in New Zeal<strong>and</strong> tuna longline fisheries, 2000/01 <strong>and</strong><br />
2001/02. New Zeal<strong>and</strong> Fisheries Assessment Report 2004/46. 47 p.<br />
Baird SJ 1994: Nonfish Species <strong>and</strong> Fisheries Interactions Working Group Report. N.Z. Fisheries Assessment Working<br />
Group Report 94/1. MAF Fisheries, N.Z. Ministry of Agriculture <strong>and</strong> Fisheries, Wellington. 54 p.<br />
Baird SJ 1995: Nonfish Species <strong>and</strong> Fisheries Interactions Working Group Report — April 1995. N.Z. Fisheries Assessment<br />
Working Group Report 95/1. MAF Fisheries, N.Z. Ministry of Agriculture <strong>and</strong> Fisheries, Wellington. 24 p.<br />
Baird SJ 1996: Nonfish Species <strong>and</strong> Fisheries Interactions Working Group Report — May 1996. N.Z. Fisheries Assessment<br />
Working Group Report 96/1. Ministry of Fisheries, Wellington. 34 p.<br />
Baird SJ 1997: Report on the incidental capture of nonfish species during fishing operations in New Zeal<strong>and</strong> waters.<br />
(Unpublished report completed as part of the Ministry of Fisheries SANF01 contract.) 15 p plus appendices on<br />
New Zeal<strong>and</strong> fur seal-trawl fishery interaction (54 p) <strong>and</strong> seabird-tuna longline fishery interaction (34 p).<br />
Baird SJ (1998). Estimation of nonfish bycatch in commercial fisheries in New Zeal<strong>and</strong> waters, 1990–91 to 1993–94. Final<br />
Research Report for Ministry of Fisheries Research Project ENV9701.<br />
Baird SJ 1999: Estimation of nonfish bycatch in commercial fisheries in New Zeal<strong>and</strong> waters, 1997–98. Unpublished report<br />
completed for Objective 1 of Ministry of Fisheries Project ENV9801. 57 p.<br />
Baird SJ (2000a). Estimation of the incidental capture of seabird <strong>and</strong> marine mammal species in commercial fisheries in<br />
New Zeal<strong>and</strong> waters, 1998–99. New Zeal<strong>and</strong> Fisheries Assessment Report 2001/14 43 p.<br />
Baird SJ (2000b). Incidental capture of seabirds in New Zeal<strong>and</strong> tuna longline fisheries. In Flint, E., & Swift, K. (Eds.), p.<br />
126, Second Albatross Conference on the Biology <strong>and</strong> Conservation of Albatrosses <strong>and</strong> other Petrels, Honolulu,<br />
Hawaii, USA, 8–12 May 2000. Abstracts <strong>and</strong> Oral Presentations. Marine Ornithology 28: 125–152.<br />
Baird SJ (2001a). Estimation of the incidental capture of seabird <strong>and</strong> marine mammal species in commercial fisheries in<br />
New Zeal<strong>and</strong> waters, 1998–99. New Zeal<strong>and</strong> Fisheries Assessment Report 2001/14. 43 p.<br />
Baird SJ (Comp. & Ed.) (2001b): Report on the International Fishers’ Forum on Solving the incidental Capture of Seabirds<br />
in Longline Fisheries, Auckl<strong>and</strong>, New Zeal<strong>and</strong>, 6–9 November 2000. Department of Conservation, Wellington,<br />
New Zeal<strong>and</strong>. 63 p.<br />
Baird SJ (2003). New Zeal<strong>and</strong> breeding seabirds: human-induced mortality ― a review. Draft report prepared for the<br />
Ministry of Fisheries Project ENV2000/09. 74 p.<br />
115
AEBAR <strong>2012</strong>: Non-protected bycatch<br />
Baird SJ (2004a). Estimation of the incidental capture of seabird <strong>and</strong> marine mammal species in commercial fisheries in<br />
New Zeal<strong>and</strong> waters, 1999–2000. New Zeal<strong>and</strong> Fisheries Assessment Report 2004/41. 56 p.<br />
Baird SJ (2004b). Incidental capture of seabird species in commercial fisheries in New Zeal<strong>and</strong> waters, 2000–01. New<br />
Zeal<strong>and</strong> Fisheries Assessment Report 2004/58. 63 p.<br />
Baird SJ (2004c). Incidental capture of seabird species in commercial fisheries in New Zeal<strong>and</strong> waters, 2001–02. New<br />
Zeal<strong>and</strong> Fisheries Assessment Report 2004/60. 51 p.<br />
Baird SJ (2005). Incidental capture of seabird species in commercial fisheries in New Zeal<strong>and</strong> waters, 2002–03. New<br />
Zeal<strong>and</strong> Fisheries Assessment Report 2005/2. 50 p.<br />
Baird SJ; Francis M; Griggs LH; Dean HA (1998). <strong>Annual</strong> review of bycatch in southern bluefin <strong>and</strong> related tuna longline<br />
fisheries in the New Zeal<strong>and</strong> 200 n. mile Exclusive Economic Zone. CCSBT-ERS/9806/31. (Third Meeting of the<br />
Ecologically Related Species Working Group, Tokyo, 9–13 June 1998.)<br />
Baird SJ; Gilbert DJ (2010). Initial assessment of risk posed by commercial fisheries to seabirds breeding in New Zeal<strong>and</strong><br />
waters. <strong>Aquatic</strong> <strong>Environment</strong> <strong>and</strong> <strong>Biodiversity</strong> Report No. 50. 99 p.<br />
Baird SJ; Gilbert DJ; Smith MH (2006) <strong>Review</strong> of environmental risk assessment methodologies with relevance to seabirds<br />
<strong>and</strong> fisheries within New Zeal<strong>and</strong> waters. Final Research Report for Ministry of Fisheries project ENV2005/01<br />
Objective 3.<br />
Baird SJ; Griggs LH (2004). Estimation of within-season chartered southern bluefin tuna (Thunnus maccoyii) longline<br />
seabird incidental captures, 2002. New Zeal<strong>and</strong> Fisheries Assessment Report 2004/42. 15 p.<br />
Baird SJ; S<strong>and</strong>ers BM; Dean HA; Griggs LH (1999). Estimation of nonfish bycatch in commercial fisheries in New Zeal<strong>and</strong><br />
waters, 1990/91 to 1993/94. Final Research Report for Ministry of Fisheries Project ENV9701 Objective 1. 63 p.<br />
Baird SJ; Smith MH (2008). Incidental capture of seabird species in commercial fisheries in New Zeal<strong>and</strong> waters, 2005–06.<br />
New Zeal<strong>and</strong> <strong>Aquatic</strong> <strong>Environment</strong> <strong>and</strong> <strong>Biodiversity</strong> Report No. 18. 124 p.<br />
Baker GB; Double MC; Gales R; Tuck GN; Abbott CL; Ryan PG; Petersen SL; Robertson CJR; Alderman R (2007). A<br />
global assessment of the impact of fisheries related mortality on shy <strong>and</strong> white-capped albatrosses: conservation<br />
implications. Biological Conservation 137: 319–333.<br />
Baker GB; Jensz K; Cunningham R (2009). Data collection of demographic, distributional <strong>and</strong> trophic information on the<br />
white-capped albatross to allow estimation of effects of fishing on population viability - 2008 field season. Final<br />
Research Report for Ministry of Fisheries project PRO2006-01H. 13 p.<br />
Baker GB; Jensz K; Cunningham R (2010). Data collection of demographic, distributional <strong>and</strong> trophic information on the<br />
white-capped albatross to allow estimation of effects of fishing on population viability - 2009 field season. Final<br />
Research Report for Ministry of Fisheries project PRO2006-01I. 13 p.<br />
Baker GB; Jensz K; Double M; Cunningham R (2007). Data collection of demographic, distributional <strong>and</strong> trophic<br />
information on selected seabird species to allow estimation of effects of fishing on population viability. Final<br />
Research Report for Ministry of Fisheries project PRO2006-01F. 12 p.<br />
Baker GB; Jensz K; Double M; Cunningham R (2008). Data collection of demographic, distributional <strong>and</strong> trophic<br />
information on selected seabird species to allow estimation of effects of fishing on population viability. Final<br />
Research Report for Ministry of Fisheries project PRO2006-01G. 11 p.<br />
Bartle JA (1991). Incidental capture of seabirds in the New Zeal<strong>and</strong> subantarctic squid trawl fishery, 1990. Bird<br />
Conservation International 1: 351–359.<br />
Bartumeus F; Giuggioli L; Louzao M; Bretagnolle V; Oro D; Levin SA (2010). Fishery discards impact on seabird<br />
movement patterns at regional scales. Current Biology 20: 215–222.<br />
Bell EA; Sim JL; Scofield P; Francis RICC (<strong>2012</strong>). Population parameters of the black petrels (Procellaria parkinsoni) on<br />
Great Barrier Isl<strong>and</strong> (Aotea Isl<strong>and</strong>), 2009/10. Report for Conservation Services Programme Project POP2009-01,<br />
near-final (post-review) draft. 82 p. Department of Conservation, Wellington.<br />
Brothers NP (1991). Albatross mortality <strong>and</strong> associated bait loss in the Japanese longline fishery in the Southern Ocean.<br />
Biological Conservation 55: 255–268.<br />
Brothers NP; Cooper J; Lokkeborg S (1999). The incidental catch of seabirds by longline fisheries: worldwide review <strong>and</strong><br />
technical guidelines for mitigation. FAO Fisheries Circular No. 937. 107 p.<br />
Brothers NP; Duckworth AR; Safina C; Gilman EL (2010). Seabird bycatch in pelagic longline fisheries is grossly<br />
underestimated when using only haul data. PLoS ONE 5: e12491.<br />
Bull LS (2007). A review of methodologies for mitigating incidental catch of seabirds in New Zeal<strong>and</strong> Fisheries. DOC<br />
Research & Development Series 263. Department of Conservation, Wellington. 57p.<br />
Bull LS (2009). New mitigation measures reducing seabird by-catch in trawl fisheries. Fish <strong>and</strong> Fisheries 8: 31–56.<br />
Campbell JL; Gallagher C (2007). Assessing the relative effects of fishing on the New Zeal<strong>and</strong> marine environment through<br />
risk analysis. ICES Journal of Marine Science, 64: 256–270.<br />
Carey, C. (2005). Carefree’s cunning contraption. Seafood New Zeal<strong>and</strong> 13(6): 44–45.<br />
Croxall JP (2008). The role of science <strong>and</strong> advocacy in the conservation of Southern Ocean albatrosses at sea. Bird<br />
Conservation International 18: S13–29.<br />
Croxall JP; Butchart SHM; Lascelles B; Stattersfield AJ; Sullivan B; Symes A; Taylor P (<strong>2012</strong>). Seabird conservation status,<br />
threats <strong>and</strong> priority actions: a global assessment. Bird Conservation International 22: 1−34<br />
Croxall JP; Prince PA; Rothery P; Wood AG (1998). Population changes in albatrosses at South Georgia. Pages 68–83 in G<br />
Robertson; R Gales, eds. Albatross biology <strong>and</strong> conservation: Chipping Norton, Australia: Surrey Beatty & Sons.<br />
Crysel, S. (2002). Baffling birds brings benefits. Seafood New Zeal<strong>and</strong> 10(10): 60–61.<br />
Darby JT; Dawson SM (2000). Bycatch of yellow-eyed penguin (Megadyptes antipodes) in gillnets in New Zeal<strong>and</strong> waters<br />
1979–1997. Biological Conservation 93: 327–332.<br />
Dillingham PW; Fletcher D (2011). Potential biological removal of albatrosses <strong>and</strong> petrels with minimal demographic<br />
information. Biological Conservation 144: 1885–1894<br />
116
AEBAR <strong>2012</strong>: Non-protected bycatch<br />
Favero M; Blanco G; Garcia G; Copello S; Seco Pon JP; Frere E; Quintana F; Yorio P; Rabuffetti F; Canete G; G<strong>and</strong>ini P<br />
(2010). Seabird mortality associated with ice trawlers in the Patagonian shelf: effect of discards on the occurrence<br />
of interactions with fishing gear. Animal Conservation 14:131–139.<br />
Filippi D; Waugh SM; Nicol S (2010). Revised spatial risk indicators for seabird interactions with longline fisheries in the<br />
western <strong>and</strong> central Pacific. Western <strong>and</strong> Central Pacific Fisheries Commission, Scientific Committee (2010) Paper<br />
EB-IP-01.<br />
Fletcher D; MacKenzie D; Dillingham P; (2008). Modelling of impacts of fishing-related mortality on New Zeal<strong>and</strong> seabird<br />
populations. Final Research Report for Ministry of Fisheries project, 17 December 2008.<br />
Fletcher WJ (2005). The application of qualitative risk assessment methodology to prioritize issues for fisheries<br />
management. ICES Journal of Marine Science 62:1576–1587.<br />
FAO (2009). Fishing operations. 2. Best practices to reduce incidental catch of seabirds in capture fisheries. FAO Technical<br />
Guidelines for Responsible Fisheries. No. 1, Suppl. 2. Rome, FAO. 2009. 49p.<br />
FAO (2010). Report of the Technical Consultation to Develop International Guidelines on Bycatch Management <strong>and</strong><br />
Reduction of Discards, Rome, 6–10 December 2010. FAO Fisheries <strong>and</strong> Aquaculture Report No. 957. 41 p.<br />
Francis RICC (<strong>2012</strong>). Fisheries risks to the population viability of white-capped albatross Thalassarche steadi. New Zeal<strong>and</strong><br />
<strong>Aquatic</strong> <strong>Environment</strong> <strong>and</strong> <strong>Biodiversity</strong> Report. No. 104. 24 p.<br />
Francis RICC; Bell EA (2010). Fisheries risks to population viability of black petrel (Procellaria parkinsoni). New Zeal<strong>and</strong><br />
<strong>Aquatic</strong> <strong>Environment</strong> <strong>and</strong> <strong>Biodiversity</strong> Report No. 51. Ministry of Fisheries, Wellington<br />
Francis RICC; Elliott G; Walker K (in press). Fisheries risks to the viability of Gibson’s w<strong>and</strong>ering albatross Diomedea<br />
gibsoni. New Zeal<strong>and</strong> <strong>Aquatic</strong> <strong>Environment</strong> <strong>and</strong> <strong>Biodiversity</strong> Report.<br />
Francis RICC; Sagar PM (<strong>2012</strong>): Modelling the effect of fishing on southern Buller's albatross using a 60-year dataset, New<br />
Zeal<strong>and</strong> Journal of Zoology 39:1, 3–17.<br />
Francis RICC; Sagar PM; Fu D (2008). Status of the Snares Isl<strong>and</strong>s population of southern Buller’s albatross. Final Research<br />
Report for Year 2 of Ministry of Fisheries Research Project PRO200602. 138 p.<br />
Furness RW (2003). Impacts of fisheries on seabird communities. Sci. Mar. 67:33–45.<br />
Furness RW; Ensor K; Hudson AV (1992). The use of fishery waste by gull populations around the British Isles. Ardea 80:<br />
105–113.<br />
Hartill B; Bian R; Armiger H; Vaughan M; Rush N (2007). Recreational marine harvest estimates of snapper, kahawai, <strong>and</strong><br />
kingfish in QMA 1 in 2004–05. New Zeal<strong>and</strong> Fisheries Assessment Report 2007/26. 44 p.<br />
Hobday AJ; Smith A; Webb H; Daley R; Wayte S; Bulman C; Dowdney J; Williams A; Sporcic M; Dambacher J; Fuller M;<br />
Walker T (2007). Ecological risk assessment for the effects of fishing: methodology. Report R04/1072 for the<br />
Australian Fisheries Management Authority, Canberra.<br />
Kirby J; Hobday A (2007) Ecological risk assessment for the effects of fishing the western <strong>and</strong> central Pacific Ocean:<br />
productivity-susceptibility analysis. Paper presented to the Scientific Committee of the Third Regular Session of<br />
the Western <strong>and</strong> Central Pacific Fisheries Commission, WCPFC-SC3-EB SWG/WP-1<br />
Lalas C (1991). Assessment of bird kills in set nets in Otago Harbour over a period of eight years (1977–1985). Unpublished<br />
report held by Department of Conservation, Dunedin.<br />
Lewison RL; Crowder LB; Read AJ; Freeman SA (2004). Underst<strong>and</strong>ing impacts of fisheries bycatch on marine megafauna.<br />
Trends in Ecology <strong>and</strong> Evolution 19: 598–604.<br />
Lewison RL; Oro D; Godley BJ; Underhill L; Bearhop S; Wilson RP; Ainley D; Arcos JM; Boersma PD; Borboroglu PG;<br />
Boulinier T; Frederiksen M; Genovart M; González-Solís J; Green JA; Grémillet D; Hamer KC; Hilton GM;<br />
Hyrenbach KD; Martínez-Abraín A; Montevecchi WA; Phillips RA; Ryan PG; Sagar PM, Sydeman WJ; Wanless<br />
S; Watanuki Y; Weimerskirch H; Yorio P (<strong>2012</strong>). <strong>Review</strong>: Research priorities for seabirds: improving<br />
conservation <strong>and</strong> management in the 21st century. Endangered Species Research 17: 93–121.<br />
Louzao M; Arcos JM; Guijarro B; Valls M; Oro D (2011). Seabird-trawling interactions: factors affecting species-specific to<br />
regional community utilisation of fisheries waste. Fisheries Oceanography 20: 263–277.<br />
Maunder MN; Houston DM; Dunn A; Seddon PJ; Kendrick TH (2007). Assessment to risk of yellow-eyed penguins<br />
Megadyptes antipodes from fisheries incidental mortality in New Zeal<strong>and</strong> fisheries <strong>and</strong> definition of information<br />
requirements for managing fisheries related risk. Final Research Report for Ministry of Fisheries project<br />
ENV2005-13. 28 p.<br />
Melvin EF; Dietrich KS; Fitzgerald S; Cordoza T (2010). Reducing seabird strikes with trawl cables in the pollock catcherprocessor<br />
fleet in the eastern Bering Sea. Agreement on the Conservation of Albatrosses <strong>and</strong> Petrels, SBWG-3 Doc<br />
14 Rev1, Hobart, Australia, 18 p<br />
MFish-DOC (2004). National plan of action to reduce the incidental catch of seabirds in New Zeal<strong>and</strong> fisheries. NZ Ministry<br />
of Fisheries <strong>and</strong> Department of Conservation, Wellington. 62 p.<br />
Middleton DAJ; Abraham ER (2007). The efficacy of warp strike mitigation devices: trials in the 2006 squid fishery. Final<br />
Research Report for Ministry of Fisheries research project IPA2006/02.<br />
Miskelly CM; Dowding JE; Elliott GP; Hitchmough RA; Powlesl<strong>and</strong> RG; Robertson HA; Sagar PM; Scofield RP; Taylor<br />
GA (2008). Conservation status of New Zeal<strong>and</strong> birds, 2008. Notornis 55: 117–135<br />
Moore JE; Zydelis R (2008). Quantifying seabird bycatch: where do we go from here? Animal Conservation 11: 257–259<br />
Newman J; Scott D; Bragg C; McKechnie S; Moller H; Fletcher D (2009). Estimating regional population size <strong>and</strong> annual<br />
harvest intensity of the sooty shearwater in New Zeal<strong>and</strong>. New Zeal<strong>and</strong> Journal of Zoology 36: 307–323.<br />
Oro D; Cam E; Pradel R; Martinez-Abrain A (2004). Influence of food availability on demography <strong>and</strong> local population<br />
dynamics in a long-live seabird. Proc. R. Soc. Lond. B Biol. Sci. 271:387–396.<br />
Oro D; Furness RW (2002). Influences of food availability <strong>and</strong> predation on survival of kittiwakes. Ecology 83:2516–2528.<br />
Oro D; Pradel R; Lebreton JD (1999). Food availability <strong>and</strong> nest predation influence life history traits in Audouin’s gull,<br />
Larus audouinii. Oecologia 118:438–445.<br />
117
AEBAR <strong>2012</strong>: Non-protected bycatch<br />
Oro D; Ruiz X; Jover L; Pedrocchi V; Gonzalez-Solis J (1997). Audouin’s gull diet <strong>and</strong> adult time budget responses on<br />
changes in food availability induced by commercial fisheries. Ibis 139:631–637.<br />
OSNZ (2010). Checklist of the birds of New Zeal<strong>and</strong> <strong>and</strong> the Ross Dependency, Antarctica. Fourth Edition. Te Papa Press in<br />
association with the Ornithological Society of New Zeal<strong>and</strong> Inc. Wellington.<br />
Petersen SL; Honig MB; Ryan PG; Underhill LG (2009). Seabird bycatch in the pelagic longline fishery off southern Africa.<br />
African Journal of Marine Science 31: 191–204.<br />
Phillips RA; Silk JRD; Croxall JP; Afanasyev V (2006). Year-round distribution of white-chinned petrels from South<br />
Georgia: relationships with oceanography <strong>and</strong> fisheries. Biological Conservation 129:336–347.<br />
Pierre JP; Abraham ER; Middleton DAJ; Cleal J; Bird R; Walker NA; Waugh SM (2010). Reducing interactions between<br />
seabirds <strong>and</strong> trawl fisheries: Responses to foraging patches provided by fish waste batches. Biological<br />
Conservation 143: 2779–2788.<br />
Pierre JP; Abraham, ER; Cleal J; Middleton DAJ (<strong>2012</strong>). Reducing effects of trawl fishing on seabirds by limiting foraging<br />
opportunities provided by fishery waste. Emu 112: 244–254. CSIRO.<br />
Pierre JP; Abraham ER; Middleton DAJ; Cleal J; Bird R; Walker NA; Waugh SM (2010). Reducing interactions between<br />
trawl fisheries <strong>and</strong> seabirds: responses to foraging patches provided by fish waste batches. Biological Conservation<br />
143: 2779-2788.<br />
Pierre JP; Abraham ER; Richard Y (<strong>2012</strong>). Concluding six years of research on seabird bycatch reduction through modified<br />
discharge management regimes: Is batch discharge better than ad‐hoc discharge from trawl vessels? SBWG-4 Doc<br />
14, Progress report on ACAP Project Application 2010-04.<br />
Poncet S; Robertson G; Phillips RA; Lawton K; Phalan B; Trathan PN; Croxall JP (2006). Status <strong>and</strong> distribution of<br />
w<strong>and</strong>ering, black-browed <strong>and</strong> grey-headed albatrosses breeding at South Georgia. Polar Biology 29: 772–781.<br />
Ramm KC (2011). Conservation Services Programme Observer Report for the period 1 July 2008 to 30 June 2009. Available<br />
at www.doc.govt.nz/documents/science-<strong>and</strong>-technical/2008-09-csp-observer-report.pdf<br />
Ramm KC (<strong>2012</strong>). Conservation Services Programme Observer Report for 1 July 2009 to 30 June 2010. Available:<br />
www.doc.govt.nz/documents/conservation/marine-<strong>and</strong>-coastal/marine-conservation-services/csp-observer-report-2009-10.pdf<br />
Rice J. 2006. Impacts of Mobile Bottom Gears on Seafloor Habitats, Species, <strong>and</strong> Communities: A <strong>Review</strong> <strong>and</strong> Synthesis of<br />
Selected International <strong>Review</strong>s. Canadian Science Advisory Secretariat Research Document 2006/057. 35 p.<br />
(available from:<br />
http://www.dfo-mpo.gc.ca/CSAS/Csas/DocREC/2006/RES2006_057_e.pdf).<br />
Richard Y; Abraham EA; Filippi D (2011). Assessment of the risk to seabird populations from New Zeal<strong>and</strong> commercial<br />
fisheries. Final Research Report for Ministry of Fisheries projects IPA2009-19 <strong>and</strong> IPA 2009-20.<br />
Robertson CJR; Bell EA; Sinclair N; Bell BD (2003). Distribution of seabirds from New Zeal<strong>and</strong> that overlap with fisheries<br />
worldwide. Science for Conservation 233. Department of Conservation, Wellington. 102 p.<br />
Rowe SJ (2009). Conservation Services Programme Observer Report for the period 1 July 2004 to 30 June 2007. DOC<br />
Marine Conservation Services Series 1. Department of Conservation, Wellington. 97p<br />
Rowe SJ (2010). Conservation Services Programme Observer Report for the period 1 July 2007 to 30 June 2008. DOC<br />
Marine Conservation Services Series 4. Department of Conservation, Wellington. 97p<br />
Rowe SJ (2010). Level 1 risk assessment for incidental seabird mortality associated with New Zeal<strong>and</strong> Fisheries in the NZ-<br />
EEZ. Department of Conservation. 75 pp.<br />
Sagar PM; Torres L; Thompson D (2010). Demography <strong>and</strong> distribution of Buller’s Albatrosses Thalassarche bulleri<br />
bulleri: Final research report of the 2010 field season. NIWA Client Report: CHC2010-156, December 2010,<br />
prepared for Department of Conservation project<br />
Sagar PM; Stahl JC (2005). Increases in the numbers of breeding pairs in two populations of Buller's albatross (Thalassarche<br />
bulleri bulleri). Emu 105: 49–55.<br />
Sharp B (2009). A risk assessment framework for incidental seabird mortality associated with New Zeal<strong>and</strong> fishing in the<br />
New Zeal<strong>and</strong> EEZ. Unpublished report to the Ministry of Fisheries May 2009.<br />
Sharp B; Parker S, Smith N (2009). An impact assessment framework for bottom fishing methods in the CCAMLR area.<br />
CAMMLR Science, 15 June 2009.<br />
Soykan CU; Moore JE; Zydelis R; Crowder LB; Safina C; Lewison RL (2008). Why study bycatch? An introduction to the<br />
Theme Section on fisheries bycatch. Endangered Species Research 5: 91–102.<br />
Sullivan BJ; Brickle P; Reid TA; Bone DG; Middleton DAJ (2006). Mitigation of seabird mortality on factory trawlers:<br />
Trials of three devices to reduce warp cable strikes. Polar Biology 29: 745–753.<br />
Sullivan, BJ; Reid TA; Bugoni L (2006). Seabird mortality on factory trawlers in the Falkl<strong>and</strong> Isl<strong>and</strong>s <strong>and</strong> beyond.<br />
Biological Conservation 131: 495–504.<br />
Taylor GA (2000). Action plan for seabird conservation in New Zeal<strong>and</strong>. Part A, threatened seabirds. Threatened Species<br />
Occasional Publication No. 16. 234 p. Dept. of Conservation, Wellington.<br />
Thompson FN; Abraham ER (2009). Six monthly summary of the capture of protected species in New Zeal<strong>and</strong> commercial<br />
fisheries, summer 2007–08. New Zeal<strong>and</strong> <strong>Aquatic</strong> <strong>Environment</strong> <strong>and</strong> <strong>Biodiversity</strong> Report No. 35.<br />
Tuck GN; Polacheck T; Croxall JP; Weimerskirch H; Ryan P; Nel D; Wayte S; Bulman CM (2004). Modelling the impact of<br />
fishery incidental mortality on three populations of w<strong>and</strong>ering albatross. Pages 149–241 in GN Tuck (ed.) A<br />
comprehensive study of the ecological impacts of the worldwide pelagic longline industry: Southern Hemisphere<br />
studies. Melbourne, Australia: CSIRO.<br />
Tuck GN; Phillips RA; Small C; Thomson RB; Klaer N; Taylor F; Wanless R; Arrizabalaga H (2011) An assessment of<br />
seabird–fishery interactions in the Atlantic Ocean. ICES Journal of Marine Science 68: 1628–1637.<br />
Vié J-C; Hilton-Taylor C; Stuart SN (eds.) (2009). Wildlife in a changing world – an analysis of the 2008 IUCN Red List of<br />
Threatened Species. Gl<strong>and</strong>, Switzerl<strong>and</strong>: IUCN. 180 pp.<br />
118
AEBAR <strong>2012</strong>: Non-protected bycatch<br />
Wagner EL; Boersma PD (2011). Effects of fisheries on seabird community ecology. <strong>Review</strong>s in Fisheries Science 19: 157–<br />
167.<br />
Walker K; Elliott G (2009). Gibson’s w<strong>and</strong>ering albatross research Adams Isl<strong>and</strong> 2009. 11 p. Unpublished report produced<br />
for the Department of Conservation.<br />
Watkins BP; Petersen SL; Ryan PG (2008). Interactions between seabirds <strong>and</strong> deep-water hake trawl gear: an assessment of<br />
impacts in South African waters. Animal Conservation 11: 247–254.<br />
Waugh SM; Baker GB; Gales R; Croxall JP (2008). CCAMLR process of risk assessment to minimise the effects of longline<br />
fishing mortality on seabirds. Marine Policy 32: 442–454.<br />
Waugh SM; Filippi D; Walker NA; Kirby DS (2008). Updated preliminary results of an ecological risk assessment for<br />
seabirds <strong>and</strong> marine mammals with risk of fisheries interactions. Western Central Pacific Fisheries Commission<br />
Scientific Committee 4th Regular Session, August 2008, Port Moresby, Papua New Guinea. WCPFC-SC4-<br />
2008/EB-WP-2.<br />
Waugh SM; Filippi D (2009). Ecological risk assessment for seabirds in New Zeal<strong>and</strong> fisheries: primary components of<br />
ecological risk assessment methodology <strong>and</strong> calculating vulnerability <strong>and</strong> productivity for species. Research<br />
Progress Report for Ministry of Fisheries Research Project IPA2009-19.<br />
WGSE (2011). Report of the International Council for the Exploration of the Sea (ICES) Working Group on Seabird<br />
Ecology (WGSE), 1–4 November 2011, Madeira, Portugal. ICES CM 2011/SSGEF:07. 73 p.<br />
Wienecke B; Robertson G (2002). Seabird <strong>and</strong> seal-fisheries interactions in the Australian Patagonian toothfish Dissostichus<br />
eleginoides trawl fishery. Fisheries Research 54:253–265.<br />
119
AEBAR <strong>2012</strong>: Non-protected bycatch<br />
THEME 2: NON-PROTECTED BYCATCH<br />
120
AEBAR <strong>2012</strong>: Non-protected bycatch<br />
6. Non-protected species (fish <strong>and</strong> invertebrates)<br />
bycatch<br />
Scope of chapter This chapter outlines the main non-protected bycatch species (fish <strong>and</strong><br />
invertebrates) <strong>and</strong> annual levels <strong>and</strong> trends in bycatch <strong>and</strong> discards in<br />
New Zeal<strong>and</strong>’s major offshore fisheries. Research in this field is<br />
conducted fishery by fishery <strong>and</strong> this first summary of current<br />
knowledge reflects that strategy. It is expected that future summaries<br />
will be aligned to the general format used in other sections of this<br />
report, <strong>and</strong> be based on fishing method, habitat type, region, or a<br />
combination of these.<br />
The fisheries summarised are as follows:<br />
Trawl fisheries: Longline fisheries: Other fisheries<br />
Arrow squid Ling<br />
Albacore troll<br />
Hoki/hake/ling<br />
Jack mackerel<br />
Tuna<br />
Skipjack purse seine<br />
Area<br />
Southern blue whiting<br />
Orange roughy<br />
Oreo<br />
Scampi<br />
All areas <strong>and</strong> fisheries<br />
Focal localities Arrow squid: Auckl<strong>and</strong> Isl<strong>and</strong>s <strong>and</strong> Stewart/Snares Shelf (80–300 m).<br />
Hoki/hake/ling: Chatham Rise, West Coast South Isl<strong>and</strong>, Campbell<br />
Plateau, Puysegur Bank, <strong>and</strong> Cook Strait (200–800 m).<br />
Jack mackerel: West Coast of the North <strong>and</strong> South Isl<strong>and</strong>s, Chatham<br />
Rise, <strong>and</strong> Stewart-Snares Shelf (0–300 m).<br />
Southern blue whiting: Campbell Plateau <strong>and</strong> Bounty Plateau (250–600<br />
m).<br />
Orange roughy: The entire New Zeal<strong>and</strong> region (700–1200 m).<br />
Oreos: South Chatham Rise, Pukaki Rise, Bounty Plateau, <strong>and</strong><br />
Southl<strong>and</strong> (700–1200 m).<br />
Scampi: East coasts of the North <strong>and</strong> South Isl<strong>and</strong>s, Chatham Rise, <strong>and</strong><br />
Auckl<strong>and</strong> Isl<strong>and</strong>s (300–450 m).<br />
Ling longline: Chatham Rise, Bounty Plateau, <strong>and</strong> Campbell Plateau<br />
(150–600 m).<br />
Tuna longline: Surface waters off the east coast of the North Isl<strong>and</strong> <strong>and</strong><br />
west coast of the South Isl<strong>and</strong>.<br />
Albacore troll fishery: Surface waters off the west coasts of the North<br />
<strong>and</strong> South Isl<strong>and</strong>s.<br />
121
AEBAR <strong>2012</strong>: Non-protected bycatch<br />
Skipjack purse seine fishery: Northern North Isl<strong>and</strong><br />
Key issues Under-utilisation (including shark finning) of high volume, low value<br />
bycatch species, especially rattails, spiny dogfish, deepsea sharks, blue<br />
sharks, porbeagle sharks, <strong>and</strong> swimming crabs.<br />
Potential for considerable reduction of discards by discretionary fishing<br />
practices such as the use of mid-water nets, where practicable, <strong>and</strong> meal<br />
plants.<br />
Unseen mortality in longline fisheries due to predation by large fish <strong>and</strong><br />
sharks, marine mammals, seabirds, <strong>and</strong> sea lice.<br />
Emerging issues Trends of increasing rates <strong>and</strong> levels of bycatch <strong>and</strong> discarding in<br />
several categories of catch, especially non-QMS fish species <strong>and</strong><br />
invertebrates.<br />
The effect on bycatch rates in the ling longline fishery of a change to<br />
heavier fishing gear (including integrated weights) as used in the<br />
Antarctic toothfish fishery.<br />
Increasing trawl lengths in the squid, scampi, <strong>and</strong> orange roughy<br />
fisheries due to changes in fishing gear or reduction of target species<br />
catch rates—leading to greater bycatch levels in some categories.<br />
MPI Research (current) DAE201002 (bycatch <strong>and</strong> discards in deepwater fisheries)<br />
DEE201004 (ecological risk assessment in deepwater fisheries)<br />
DEE201005A (environmental indicators in deepwater fisheries)<br />
HMS200901 (bycatch in tuna longline fisheries)<br />
Other Govt Research (current) None<br />
Links to 2030 objectives Objective 6: Manage impacts of fishing <strong>and</strong> aquaculture.<br />
Related chapters/issues NPOA sharks<br />
6.1. Context<br />
Management of non-protected species bycatch aligns with Fisheries 2030 Objective 6: Manage<br />
impacts of fishing <strong>and</strong> aquaculture.<br />
The management of non-protected species bycatch in the deepwater <strong>and</strong> middle-depth fisheries is<br />
described in the National Fisheries Plan for Deepwater <strong>and</strong> Middle-depth Fisheries (the National<br />
Deepwater Plan). Under the National Deepwater Plan, the objective most relevant for management of<br />
non-protected species bycatch is Management Objective 2.4: Identify <strong>and</strong> avoid or minimise adverse<br />
effects of deepwater <strong>and</strong> middle-depth fisheries on incidental bycatch species. Specific objectives for<br />
the management of non-protected species bycatch will be outlined in the fishery-specific chapters of<br />
the National Deepwater Plan. Estimation of non-protected species bycatch is carried out for each of<br />
the Tier-1 deepwater fisheries on an annual rotational basis, with each of the following fisheries<br />
updated about every 4–5 years:<br />
• Arrow squid<br />
• ling bottom longline<br />
• hoki/hake/ling trawl<br />
• Jack mackerel trawl<br />
• southern blue whiting trawl<br />
• orange roughy/oreo trawl<br />
• scampi trawl<br />
122
AEBAR <strong>2012</strong>: Non-protected bycatch<br />
Non-protected fish species bycatch in the Highly Migratory Species (HMS) is addressed in the HMS<br />
fish plan. Tuna fisheries incidental bycatch has been regularly examined, with updates every 2–3<br />
years. Some data on bycatch in the Albacore troll fishery <strong>and</strong> the skipjack tuna purse seine fishery are<br />
also available.<br />
The three National Fisheries Plans for Inshore species (finfish, shellfish <strong>and</strong> freshwater fisheries) also<br />
include objectives which address non-protected species bycatch, but research on these objectives has<br />
yet to be conducted. However, summaries of the main bycatch species are occasionally included in<br />
reports from fisheries characterisation projects, for example school shark, red gurnard, <strong>and</strong><br />
elephantfish (Starr In Prep; Starr et al. 2010a, b, c, Starr & Kendrick <strong>2012</strong>).<br />
6.2. Global underst<strong>and</strong>ing<br />
Bycatch of unwanted, low value species <strong>and</strong> discarding of these <strong>and</strong> of target species that are<br />
damaged or too small to process are significant issues in many fisheries worldwide. Few, if any,<br />
fisheries are completely without bycatch <strong>and</strong> this issue has been the subject of innumerable studies<br />
<strong>and</strong> international meetings. Saila (1983) made the first comprehensive global assessment <strong>and</strong><br />
estimated, albeit with very poor information, that at least 6.7 million tonnes was discarded each year.<br />
Alverson et al. (1994) extended that work <strong>and</strong> estimated the global bycatch at 27.0 (range 17.9–39.5)<br />
million tonnes each year. An update by Kelleher (2005) suggested global bycatch of about 8% of the<br />
global catch, or 7.3 million tonnes, in 1999–2001.<br />
Tropical shrimp trawl fisheries typically have the highest levels of unwanted bycatch, with an average<br />
discard rate of 62% (Kelleher 2005), accounting for about one-quarter to one-third of global bycatch.<br />
Discard rates in demersal trawl fisheries targeting finfish are typically much lower but, because they<br />
are so widespread, their contribution to global discards is considerable. Tuna longline fisheries have<br />
the next largest contribution <strong>and</strong> tend to have greater unwanted bycatch than other line fisheries<br />
(Kelleher 2005).<br />
The estimated global level of discards has reduced considerably since the first estimates were made,<br />
but differences in the methodology <strong>and</strong> definition of bycatch used (Kelleher 2005, Davies et al. 2009)<br />
make it difficult to quantify the decline. The main reasons for the decline in bycatch are thought to<br />
have been a combination of higher retention rates, better fisheries management, <strong>and</strong> improved fishing<br />
methods.<br />
Bycatch <strong>and</strong> discard estimation is frequently very coarse, <strong>and</strong> estimates of rates based on occasional<br />
surveys are often scaled up to represent entire fisheries <strong>and</strong> applied across years, or even to other<br />
fisheries (e.g., Bellido et al. 2011). Data from dedicated fisheries observers are also frequently used<br />
for individual fisheries, <strong>and</strong> these are considered to provide the most accurate results, providing that<br />
discarding is not illegal (leading to bias due to “observer effects”, Fern<strong>and</strong>es 2011). Ratio estimators<br />
similar to those applied in New Zeal<strong>and</strong> fisheries are frequently used to raise observed bycatch <strong>and</strong><br />
discard rates to the wider fishery, <strong>and</strong> the methods used in New Zeal<strong>and</strong> fisheries are broadly similar<br />
to those used elsewhere (e.g., Fern<strong>and</strong>es 2011, Borges et al. 2005).<br />
Discard data are increasingly incorporated into fisheries stock assessments <strong>and</strong> management decisionmaking,<br />
especially with the move towards an Ecosystem Approach to Fisheries (EAF) (Bellido et al.<br />
2011), <strong>and</strong> as third party fishery certification schemes examine more closely the effects of fishing on<br />
the ecosystem. They can also be used to assess impacts on non-target species (e.g., Pope et al. 2000,<br />
Casini et al. 2003, Piet et al. 2009).<br />
123
AEBAR <strong>2012</strong>: Non-protected bycatch<br />
6.3. State of knowledge in New Zeal<strong>and</strong><br />
Estimation of annual bycatch <strong>and</strong> discard levels of non-protected species in selected New Zeal<strong>and</strong><br />
fisheries have been undertaken at regular intervals since 1998 (Table 6.1).<br />
Table 6.1: Summary of research into bycatch in New Zeal<strong>and</strong> fisheries<br />
Fishery Report<br />
Arrow squid Anderson et al. (2000)<br />
Anderson (2004b)<br />
Ballara <strong>and</strong> Anderson (2009)<br />
Anderson (In Press)<br />
Ling bottom longline Anderson et al. (2000)<br />
Anderson (2008)<br />
Hoki trawl Clark et al. (2000)<br />
Anderson et al. (2001)<br />
Anderson <strong>and</strong> Smith (2005)<br />
Ballara et al. (2010)<br />
Hake trawl Ballara et al. (2010)<br />
Ling trawl Ballara et al. (2010)<br />
Jack mackerel trawl Anderson et al. (2000)<br />
Anderson (2004b)<br />
Anderson (2007)<br />
Southern blue whiting trawl Clark et al. (2000)<br />
Anderson (2004a)<br />
Anderson (2009b)<br />
Orange roughy Clark et al. (2000)<br />
Anderson et al. (2001)<br />
Anderson (2009a)<br />
Anderson (2011)<br />
Oreo trawl Clark et al. (2000)<br />
Anderson (2004a)<br />
Anderson (2011)<br />
Scampi trawl Anderson (2004b)<br />
Ballara <strong>and</strong> Anderson (2009)<br />
Tuna longline Francis et al. (1999a, 1999b)<br />
Ayers et al. (2004)<br />
Francis et al. (2004)<br />
Griggs et al. (2007)<br />
Griggs et al. (2008)<br />
Griggs & Baird (In Press)<br />
Albacore troll fishery Griggs et al. (In Press)<br />
Skipjack purse seine fishery Griggs (unpublished data)<br />
The estimation process uses rates of bycatch <strong>and</strong> discards in various categories (in most cases “all<br />
QMS species combined”, “all non-QMS species combined”, “all invertebrate species combined”) <strong>and</strong><br />
fishery strata in the observed fraction of the fishery, <strong>and</strong> effort statistics from the wider fishery, to<br />
calculate annual bycatch <strong>and</strong> discard levels. This ratio-based approach calculates precision by<br />
incorporating a multi-step bootstrap algorithm which takes into account the effect of correlation<br />
between trawls in the same observed trip <strong>and</strong> stratum. Estimates of the annual bycatch of a wide range<br />
of individual species were also made in the most recent analysis of the arrow squid fishery (Anderson<br />
In Press).<br />
124
AEBAR <strong>2012</strong>: Non-protected bycatch<br />
The approach used in these analyses relies heavily on an appropriate level <strong>and</strong> spread of observer effort<br />
being achieved, <strong>and</strong> this is examined in detail in each report. Although details of bycatch <strong>and</strong> discards<br />
are also recorded directly by vessel skippers for the entire fishery, through catch effort forms, these data<br />
are often incomplete as the forms list only the top 5 catch species, discards are not well recorded, <strong>and</strong><br />
they generally lack the accuracy <strong>and</strong> precision of observer data. Nevertheless, annual bycatch totals are<br />
also derived from these data, but only as secondary estimates.<br />
6.3.1. Arrow squid trawl fishery<br />
Since 1990–91 the level of observer coverage in this fishery has ranged from 6% to 53% of the total<br />
annual catch, <strong>and</strong> has been higher in more recent years due to the management measures imposed for the<br />
protection of New Zeal<strong>and</strong> sealions (Phocarctos hookeri). This coverage has been spread across the fleet<br />
<strong>and</strong> annually 10–68% of all vessels targeting arrow squid have been observed, with this fraction<br />
increasing over time. Observers have covered the full size range of vessels operating in the fishery,<br />
although the smallest vessels have been slightly undersampled <strong>and</strong> the largest oversampled.<br />
The observer effort was mostly focussed on the main arrow squid fisheries around the Auckl<strong>and</strong><br />
Isl<strong>and</strong>s <strong>and</strong> Stewart-Snares Shelf, but the smaller fisheries on the Puysegur Bank <strong>and</strong> off Banks<br />
Peninsula were also covered, although less consistently. Observer coverage was more focussed on the<br />
central period of the arrow squid season, February to April, than the fleet was in general – with<br />
fishing in January <strong>and</strong> May slightly undersampled.<br />
Appropriate stratification for the analyses was determined using linear mixed-effect models (LMEs)<br />
to identify key factors influencing variability in the observed rates of bycatch <strong>and</strong> discarding. This<br />
approach addresses the significant vessel-to-vessel <strong>and</strong> trip-to-trip differences in bycatch <strong>and</strong> discard<br />
rates in this fishery by treating the trip variable as a r<strong>and</strong>om effect (whereby the trip associated with<br />
each record is assumed to be r<strong>and</strong>omly selected from a population of trips) <strong>and</strong> treating other<br />
variables as fixed effects. This process consistently identified the separate fishery areas (Auckl<strong>and</strong><br />
Isl<strong>and</strong>s, Stewart-Snares Shelf, Puysegur Bank, Banks Peninsula) as having the greatest influence on<br />
bycatch <strong>and</strong> discard rates (with trawl duration of secondary importance) <strong>and</strong> so area was used in all<br />
cases to stratify the calculation of annual levels.<br />
Since 1990–91, over 470 bycatch species or species groups have been identified by observers in this<br />
fishery, most being non-commercial species (including invertebrate species) caught in low numbers.<br />
Arrow squid have accounted for about 80% of the total estimated catch recorded by observers. The<br />
main bycatch species or species groups were the QMS species barracouta (8.5%), silver warehou<br />
(2.5%), spiny dogfish (1.7%), <strong>and</strong> jack mackerel (1.1%); of these only spiny dogfish were mostly<br />
discarded (Figure 6.1).<br />
Of the other invertebrate groups crabs (0.8%), in particular smooth red swimming crabs (Nectocarcinus<br />
bennetti) (0.5%), were caught in the greatest amounts <strong>and</strong> these were mostly discarded. Smaller amounts<br />
of octopus <strong>and</strong> squid, sponges, cnidarians, <strong>and</strong> echinoderms were also often caught <strong>and</strong> discarded.<br />
When combined into broader taxonomic groups, bony fish (excluding rattails, tuna, flatfish, <strong>and</strong> eels)<br />
contributed the most bycatch (16.5% of the total catch), followed by sharks <strong>and</strong> dogfish (1.9%),<br />
crustaceans (0.8%), <strong>and</strong> rattails (0.2%). The combined bycatch of all other fish (tuna, rays & skates,<br />
chimaeras, flatfish, <strong>and</strong> eels) accounted for a further 0.5% of the total catch.<br />
More than 75% of the sharks & dogfish, rattails, <strong>and</strong> eels were discarded, whereas about half the flatfish<br />
were retained, as were most of the tuna, rays & skates, chimaeras, <strong>and</strong> other fish not in any of these<br />
groups. The fish species discarded in the greatest amounts were spiny dogfish, redbait, rattails, <strong>and</strong><br />
silver dory. Of the invertebrates, virtually all the echinoderms, other squid, sponges, cnidarians, <strong>and</strong><br />
polychaetes were discarded, but crustaceans, octopuses, <strong>and</strong> other molluscs were often retained.<br />
125
AEBAR <strong>2012</strong>: Non-protected bycatch<br />
Figure 6.1: Percentage of the total catch contributed by the main bycatch species (those representing<br />
0.05% or more of the total catch) in the observed portion of the arrow squid fishery, <strong>and</strong> the percentage<br />
discarded. The “Other” category is the sum of all bycatch species representing less than 0.05% of the<br />
total catch.<br />
Total annual bycatch in the arrow squid fishery ranged from about 4500 t to 25 000 t, with low levels<br />
in the early 1990s <strong>and</strong> after 2007–08, <strong>and</strong> a peak in the early 2000s (Figure 6.2). The large majority of<br />
the bycatch comprised QMS species, with less than 1000 t of non-QMS species <strong>and</strong> invertebrate<br />
species bycatch in most years.<br />
Estimated total annual discards ranged from just over 200 t in 1995–96 to about 5500 in 2001–02 <strong>and</strong>,<br />
like bycatch, peaked in the early 1990s <strong>and</strong> were at relatively low levels after 2006–07 (Figure 6.3).<br />
The majority of discards were QMS species (about 62% over all years), followed by non-QMS<br />
species (19%), invertebrate species (11%), <strong>and</strong> arrow squid (7%).<br />
126
AEBAR <strong>2012</strong>: Non-protected bycatch<br />
Figure 6.2: <strong>Annual</strong> estimates of bycatch in the arrow squid trawl fishery, for QMS species, non-QMS<br />
species, invertebrates (INV), <strong>and</strong> overall for 1990–91 to 2010–11. Also shown (in grey) are estimates of<br />
bycatch in each category (excluding INV) calculated for 1999–2000 to 2005–06 (Ballara & Anderson<br />
2009). Error bars indicate 95% confidence intervals. The red lines show the fit of a locally-weighted<br />
polynomial regression to annual bycatch. In the bottom panel the solid black line shows the total annual<br />
reported trawl-caught l<strong>and</strong>ings of arrow squid (Ministry of Fisheries 2011), with circles indicating years<br />
in which the fishery closed early after reaching the sea lion FRML; <strong>and</strong> the dashed line shows annual<br />
effort (scaled to have mean equal to that of total bycatch).<br />
127
AEBAR <strong>2012</strong>: Non-protected bycatch<br />
Figure 6.3: <strong>Annual</strong> estimates of discards in the arrow squid trawl fishery, for arrow squid (SQU), QMS<br />
species, non-QMS species, invertebrates (INV), <strong>and</strong> overall for 1990–91 to 2010–11. Also shown (in grey)<br />
are estimates of discards in each category (excluding INV) calculated for 1999–2000 to 2005–06 (Ballara<br />
& Anderson 2009). Error bars indicate 95% confidence intervals. The red lines show the fit of a locallyweighted<br />
polynomial regression to annual discards.<br />
128
AEBAR <strong>2012</strong>: Non-protected bycatch<br />
6.3.2. Ling longline fishery<br />
The first analysis of bycatch <strong>and</strong> discards in this fishery covered the period from 1990–91 to 1997–98,<br />
<strong>and</strong> the second (<strong>and</strong> latest) analysis covered the following years up to 2005–06. To enable a<br />
comparison of estimates between studies, which used slightly different methodologies, the 1994–95<br />
fishing year was re-assessed in the recent analysis. In addition to estimating the bycatch of all quota<br />
species combined, <strong>and</strong> all non-quota species combined, in the recent analysis annual bycatch was<br />
estimated separately for three commonly caught individual species, spiny dogfish, red cod, <strong>and</strong><br />
ribaldo. Comparative estimates of only total annual bycatch are available from the first analysis for<br />
1990–91 to 1997–98.<br />
The ratio estimator used in these analyses to calculate bycatch <strong>and</strong> discard rates was based on the<br />
number of hooks set. The ratios were applied to hook number totals calculated from commercial<br />
catch-effort data to make annual estimates for the target fishery as a whole.<br />
Regression tree methods were used to minimise the number of levels of season <strong>and</strong> area variables<br />
used to stratify data for the calculation of annual discard bycatch totals in all categories with minimal<br />
loss of explanatory power. This reduced the number of areas in each category from eight down to<br />
between two <strong>and</strong> four, <strong>and</strong> split the year into three or four periods. The area variables created in this<br />
way tended to have more explanatory power. .<br />
Between 1998–99 <strong>and</strong> 2005–06 only 9% of the vessels operating in this fishery were observed<br />
(14 vessels in all) but these tended to be the main operators (including most of the larger autoliners)<br />
<strong>and</strong> accounted for between 7.7% <strong>and</strong> 52.5% of the annual target ling catch <strong>and</strong> 7.8% to 61% of the<br />
annual number of longlines set during these years. The annual number of observed sets ranged from<br />
324 to 1605 compared with the total target fishery effort of about 2500 to 4150 sets. Observer<br />
coverage before 1998–99 was very low, exceeding 5% of the annual target ling catch only in 1994–95<br />
<strong>and</strong> 1996–97.<br />
Ling accounted for 68% of the total estimated catch from all observed sets targeting ling between<br />
1998–99 <strong>and</strong> 2005–06, <strong>and</strong> spiny dogfish accounted for about a further 14%. About half of the<br />
remaining 18% of the catch comprised other commercial species; especially red cod (Pseudophycis<br />
bachus), (2.3%), ribaldo (Mora moro) (2.2%), rough skates (Zearaja nasuta, 1.9%), smooth skates<br />
(Dipturus innominatus) (1.8%), <strong>and</strong> sea perch (Helicolenus spp.) (1.2%). Altogether, 93% of the<br />
observed catch was comprised of QMS species, representing 40 of the 96 species in the QMS prior to<br />
1 October 2007. Over 130 species or species groups were identified by observers, the majority being<br />
non-commercial species caught in low numbers, especially black cod (Paranotothenia magellanicus)<br />
<strong>and</strong> Chondrichthyans, often unspecified but including shovelnose spiny dogfish (Deania calcea),<br />
Etmopterus species, <strong>and</strong> seal sharks (Dalatias licha). A surprising number of echinoderms, especially<br />
starfish (of which almost 200 000 were observed caught during the period), anemones, crustaceans,<br />
<strong>and</strong> other invertebrates were also recorded by observers.<br />
Total annual bycatch estimates for 1998–99 to 2005–06 ranged from about 2200 t to 3700 t, compared<br />
with approximate target species catches in the same period of between about 3500 <strong>and</strong> 8700 t. A large<br />
part of this bycatch (40–50%) comprised a single species, spiny dogfish, <strong>and</strong> 80% of the bycatch were<br />
quota species (Figures 6.4 & 6.5). Bycatch levels decreased during the period, in line with decreasing<br />
effort in the fishery. Total bycatch estimates for the years before 1998–99 ranged from about 880 t to<br />
3900 t. Differences in methodology between the two studies, coupled with generally low observer<br />
coverage, resulted in significantly different estimates of total bycatch for 1994–95.<br />
129
AEBAR <strong>2012</strong>: Non-protected bycatch<br />
Figure 6.4: <strong>Annual</strong> estimates of fish bycatch in the target ling longline fishery, calculated for commercial<br />
(QMS) species (COM), non-commercial (non-QMS) species (OTH), <strong>and</strong> overall (TOT) for the years<br />
1994–95 <strong>and</strong> 1998–99 to 2005–06 (in black). Also shown (in grey) are estimates of total bycatch calculated<br />
for the period 1990–91 to 1997–98 by Anderson et al. (2000). Error bars show the 95% confidence<br />
intervals.<br />
130
AEBAR <strong>2012</strong>: Non-protected bycatch<br />
Figure 6.5: <strong>Annual</strong> estimates of the bycatch of spiny dogfish (SPD), red cod (RCO), <strong>and</strong> ribaldo (RIB) in<br />
the target ling longline fishery for the years 1994–95 <strong>and</strong> 1998–99 to 2005–06. Error bars show the 95%<br />
confidence intervals.<br />
Total annual discard estimates for 1998–99 to 2005–06 ranged from about 1400 t to 2400 t, <strong>and</strong><br />
generally decreased during the period (Figure 6.6). About 70–75% of these discarded fish were quota<br />
species, <strong>and</strong> 60–70% spiny dogfish, the remainder being non-quota, generally non-commercial,<br />
species. Ling were discarded in small amounts (40–90 t per year), these discards generally being<br />
attributable to fish being lost on retrieval or predated by marine mammals <strong>and</strong> birds. Estimated annual<br />
discards were generally lower for the earlier period (1990–91 to 1997–98) <strong>and</strong> between about 350 t<br />
<strong>and</strong> 1600 t. Total discard estimates for 1994–95 were similar for the two studies.<br />
131
AEBAR <strong>2012</strong>: Non-protected bycatch<br />
Figure 6.6: <strong>Annual</strong> estimates of fish discards in the target ling longline fishery, calculated for ling (LIN),<br />
commercial (QMS) species (COM), non-commercial (non-QMS) species (OTH), <strong>and</strong> overall (TOT) for the<br />
years 1994–95 <strong>and</strong> 1998–99 to 2005–06 (in black). Also shown (in grey) are estimates of the ling <strong>and</strong> total<br />
discards calculated for 1990–91 to 1997–98 by Anderson et al. (2000). Error bars show the 95%<br />
confidence intervals.<br />
6.3.3. Hoki/hake/ling trawl fishery<br />
Earlier reports were limited to the hoki target fishery <strong>and</strong> only the most recent report considers<br />
bycatch <strong>and</strong> discards for the fishery as defined by the three target species combined—but hoki is<br />
dominant in this fishery, accounting for over 90% of the catch.<br />
Observer coverage in the hoki, hake, <strong>and</strong> ling trawl fishery between 2000–01 <strong>and</strong> 2006–07 ranged<br />
from 11% to 21% of the annual target fishery catch, <strong>and</strong> 78 separate vessels were observed, covering<br />
132
AEBAR <strong>2012</strong>: Non-protected bycatch<br />
the full range of vessel sizes. The annual number of observed tows decreased from 3580 in 2000–01<br />
to 1999 in 2006–07. Coverage has been spread over the geographical range of this fishery, with high<br />
sampling throughout the west coast South Isl<strong>and</strong> (WCSI) <strong>and</strong> Chatham Rise fishing grounds <strong>and</strong>, less<br />
frequently, in the Sub-Antarctic. Lower levels of sampling have been achieved in the Cook Strait <strong>and</strong><br />
Puysegur fisheries, <strong>and</strong> coverage was lower still around the North Isl<strong>and</strong> although this area accounts<br />
for very little of the overall catch. Good observer coverage was achieved during the hoki spawning<br />
season (July to early September), but coverage outside of this period was variable <strong>and</strong> underrepresentative<br />
in some months in some years, especially in the Sub-Antarctic, Chatham Rise <strong>and</strong><br />
Puysegur fisheries.<br />
Hoki, hake, <strong>and</strong> ling accounted for 87% (77%, 6%, <strong>and</strong> 4% respectively) of the total observed catch<br />
from trawls targeting hoki, hake, <strong>and</strong> ling between 2000–01 <strong>and</strong> 2006–07. The remaining 13%<br />
comprised a large range of species, especially javelinfish (2.1%), silver warehou (1.7%), rattails<br />
(1.4%), <strong>and</strong> spiny dogfish (1.1%). In total, over 470 species or species groups have been identified by<br />
observers, the majority of which are non-commercial species caught in low numbers.<br />
Chondrichthyans in general, often unspecified but including spiny dogfish <strong>and</strong> basking shark, have<br />
accounted for much of the non-commercial catch. Echinoderms, squids, crustaceans, <strong>and</strong> other<br />
unidentified invertebrates were also well represented in the bycatch of this fishery.<br />
Total bycatch in the hoki, hake, <strong>and</strong> ling fishery between 2000–01 <strong>and</strong> 2006–07 ranged from about 36<br />
000 to 58 000 t per year (compared to the combined total l<strong>and</strong>ed catch of hoki, hake, <strong>and</strong> ling of 130<br />
000 to 238 000 t). Estimates of total bycatch for 1990–91 to 1998–99 from earlier projects (for the<br />
hoki target fishery alone), ranged from about 15 000 t to 60 000 t (Figure 6.7). Overall, total bycatch<br />
increased during the 1990s to a peak in the early 2000s, <strong>and</strong> has since declined slowly. <strong>Annual</strong><br />
bycatch for the 1990–01 to 2006–07 period was also estimated for commercial species (QMS species<br />
<strong>and</strong> species which were generally retained (>75%) <strong>and</strong> comprised 0.1% or more of the total observed<br />
catch) <strong>and</strong> non-commercial species, rather than QMS <strong>and</strong> non-QMS species. Roughly similar amounts<br />
of these two categories were caught overall, <strong>and</strong> each showed a similar pattern over time to total<br />
bycatch.<br />
133
AEBAR <strong>2012</strong>: Non-protected bycatch<br />
Figure 6.7: <strong>Annual</strong> estimates of fish bycatch in the target hoki, hake <strong>and</strong> ling trawl fishery, calculated for<br />
commercial species, non-commercial species, <strong>and</strong> overall for 2000–01 to 2006–07 (black). Also shown (in<br />
light grey) are the equivalent bycatch estimates calculated for 1990–91 to 1998–99 by Anderson et al.<br />
(2001), <strong>and</strong> for the years 1990–91, 1994–95, 1998–99 <strong>and</strong> 1999–2000 to 2002–03 by Anderson <strong>and</strong> Smith<br />
(2004), (in dark grey). Error bars show the 95% confidence intervals.<br />
Total annual discard estimates for 2000–01 to 2006–07 ranged from about 5500 to 29 000 t per year<br />
with the main species being discarded including spiny dogfish, rattails, javelinfish, hoki, <strong>and</strong><br />
shovelnose dogfish. Total annual discards for 1990–91 to 1998–99 were between 6600 t <strong>and</strong> 17 900 t,<br />
<strong>and</strong> overall there has been no obvious trend in total discards (Figure 6.8). The target species (hoki,<br />
hake, <strong>and</strong> ling) made up 9.7% of total observed discards. Discard rates were strongly influenced by<br />
the use of meal plants on fishing vessels; discards of non-commercial species on factory vessels<br />
without meal plants was up to twice the level of discards for vessels with meal plants. The use of meal<br />
plants, especially for species such as javelinfish <strong>and</strong> other rattails, has become more prevalent in<br />
recent years.<br />
134
AEBAR <strong>2012</strong>: Non-protected bycatch<br />
Figure 6.8: <strong>Annual</strong> estimates of fish discards in the target hoki, hake, <strong>and</strong> ling trawl fishery, calculated<br />
for commercial species, non-commercial species, hoki, <strong>and</strong> overall for the period 2000–01 to 2006–07<br />
(black). Also shown (in light grey) are the equivalent discard estimates calculated for the period 1990–91<br />
to 1998–99 by Anderson et al. (2001), <strong>and</strong> for 1990–91, 1994–95, 1998–99 <strong>and</strong> 1999–2000 to 2002–03 by<br />
Anderson <strong>and</strong> Smith (2004), (in dark grey). Error bars show the 95% confidence intervals.<br />
135
AEBAR <strong>2012</strong>: Non-protected bycatch<br />
6.3.4. Jack mackerel trawl fishery<br />
Estimates of annual bycatch in this fishery are available for 1990–91 to 2004–05, with this fishery due<br />
to for reassessment in 2013. The annual level of observer coverage in this fishery has varied between<br />
8% <strong>and</strong> 27% of the target fishery catch but was usually between 15% <strong>and</strong> 20%. For the most recent<br />
period examined, 2001–02 to 2004–05, the majority of the observer effort has focussed on the main<br />
fishery, off the west coasts of the North <strong>and</strong> South Isl<strong>and</strong>s, with some additional coverage on the<br />
Stewart/Snares Shelf <strong>and</strong> Chatham Rise fisheries. However, in 2003–04 <strong>and</strong> 2004–05, there was a<br />
total of only 12 trawls observed outside of the western fishery. During this time the fishery was<br />
dominated by seven large trawlers <strong>and</strong> observers were able to complete a trip on each vessel in most<br />
years. The fishery runs year round, <strong>and</strong> although there were significant periods in each year when<br />
commercial fishing effort was not observed, coverage encompassed all seasons for the four years<br />
combined.<br />
Jack mackerel species accounted for 70% of the total estimated catch from all trawls targeting jack<br />
mackerel between 2001–02 <strong>and</strong> 2004–05. The remaining 30% mostly comprised other commercial<br />
species; especially barracouta (15.6%), blue mackerel (4.8%), frostfish (3.1%), <strong>and</strong> redbait (2.7%).<br />
Overall about 130 species or species groups were identified by observers, <strong>and</strong> about half of these were<br />
non-commercial, non-QMS species caught in low numbers. The species most discarded was the spiny<br />
dogfish, which comprised about 0.5% of the total catch. The bycatch of non-QMS invertebrate species<br />
has yet to be closely studied in this fishery, but species of squid, salps, jellyfish were the most<br />
commonly recorded by observers during this period.<br />
Total bycatch in the jack mackerel trawl fishery between 2001–02 <strong>and</strong> 2004–05 ranged from about<br />
7700 t to 11 900 t. Estimates of total bycatch for 1990–91 to 2003–04 from earlier projects ranged<br />
from about 5400 t to 15 500 t (Figure 6.9). After an abrupt increase in the late 1990s, annual bycatch<br />
steadily decreased to a level comparable to that of the 1990–91 to 1996–97 period. This bycatch<br />
almost entirely comprised commercial (mainly QMS) species.<br />
136
AEBAR <strong>2012</strong>: Non-protected bycatch<br />
Figure 6.9: <strong>Annual</strong> estimates of fish bycatch in the target jack mackerel trawl fishery for the 2001-02 to<br />
2004-05 fishing years (in black), calculated for commercial species (COM), non-commercial species<br />
(OTH), <strong>and</strong> overall (TOT). Also shown (in grey) are estimates of overall bycatch calculated for 1990–91 to<br />
2000–01 by Anderson et al. (2000) <strong>and</strong> Anderson (2004a). Error bars show the 95% confidence<br />
intervals.<br />
Total annual discards decreased between 2001–02 <strong>and</strong> 2004–05, continuing a trend that began in<br />
1998–99, to a level of only 90–100 t per year. This is about 5% of the level of 1997–98 (1850 t), when<br />
annual discards were at their greatest, <strong>and</strong> is lower than in any year since 1990–91 (Figure 4.10).<br />
Discards of the target species were about 200–400 t per year prior to 1998–99 but thereafter decreased<br />
to only about 10 t per year, mainly due to the absence of recorded losses of large quantities of fish<br />
through rips in the net or intentional releases of fish during l<strong>and</strong>ing. Discards comprised a roughly<br />
equal amount of commercial <strong>and</strong> non-commercial species in the recent study, although commercial<br />
species discards were substantially greater in 2001–02.<br />
137
AEBAR <strong>2012</strong>: Non-protected bycatch<br />
Figure 6.10: <strong>Annual</strong> estimates of fish discards in the target jack mackerel trawl fishery for the 2001-02 to<br />
2004–05 fishing years (in black), calculated for jack mackerel (JMA), commercial species (COM), noncommercial<br />
species (OTH), <strong>and</strong> overall (TOT). Also shown (in grey) are estimates of jack mackerel <strong>and</strong><br />
overall discards calculated for 1990–91 to 2000–01 by Anderson et al. (2000) <strong>and</strong> Anderson (2004a). Error<br />
bars show the 95% confidence intervals.<br />
6.3.5. Southern blue whiting trawl fishery<br />
In the most recent study, covering the period 2002–03 to 2006–07, the ratio estimator used to<br />
calculate bycatch <strong>and</strong> discard rates in this fishery was based on trawl duration. Linear mixed-effect<br />
models (LMEs) identified fishing depth as the key variable influencing bycatch rates <strong>and</strong> discard rates<br />
in this fishery, <strong>and</strong> regression tree methods were used to optimise the number of levels of this variable<br />
in order to stratify the calculation of annual bycatch <strong>and</strong> discard totals in each catch category.<br />
The key categories of catch/discards examined were; southern blue whiting, other QMS species<br />
combined, commercial species combined (as defined above for hoki/hake/ling), non-commercial<br />
species combined, <strong>and</strong> three commonly caught individual species, hake, hoki, <strong>and</strong> ling.<br />
138
AEBAR <strong>2012</strong>: Non-protected bycatch<br />
The level of observer coverage represented between about 22% <strong>and</strong> 53% of the target fishery catch<br />
between 2002–03 <strong>and</strong> 2006–07 <strong>and</strong> similar levels were reported from earlier reports, for 1990–91 to<br />
2001–02. The spread of observer data, across a range of variables, has shown no significant<br />
shortcomings, due to a combination of the highly restricted distribution of the southern blue whiting<br />
fishery over space <strong>and</strong> time of year, a stable <strong>and</strong> uniform fleet composition, <strong>and</strong> a high level of<br />
observer effort.<br />
Southern blue whiting accounted for more than 99% of the total estimated catch from all observed<br />
trawls targeting southern blue whiting between 2002–03 <strong>and</strong> 2006–07. About half the remaining total<br />
catch was made up of ling (0.2%), hake (0.1%), <strong>and</strong> hoki (0.1%). These three species, along with<br />
other QMS species, comprised over 80% of the total bycatch. In all, over 120 species or species<br />
groups were identified by observers, most being non-commercial species caught in low numbers.<br />
Porbeagle sharks (introduced into the QMS in 2004), javelinfish <strong>and</strong> other rattails, <strong>and</strong> silverside,<br />
accounted for much of remaining bycatch. Invertebrate species (mainly sponges, crabs, <strong>and</strong><br />
echinoderms) were also recorded by observers, but no taxon accounted for more than 0.01% of the<br />
total observed catch.<br />
Total annual bycatch estimates for 2002–03 <strong>and</strong> 2006–07 ranged from about 40 t to 390 t, compared<br />
with approximate target species catches in the same period of about 22 000 to 42 000 t. This bycatch<br />
was fairly evenly split between commercial species (55%) <strong>and</strong> non-commercial species (45%),<br />
although QMS species accounted for about 80% of the total bycatch during this period. Total annual<br />
bycatch decreased during the period, to an all-time low of 40 t in 2006–07. Total annual bycatch<br />
estimates for 1990–91 to 2001–02, from earlier reports, were mostly between about 60 t <strong>and</strong> 500 t but<br />
reached nearly 1500 t in 1991–92 (Figure 6.11). This year immediately preceded the introduction of<br />
southern blue whiting into the QMS, <strong>and</strong> effort <strong>and</strong> catch were exceptionally high.<br />
139
AEBAR <strong>2012</strong>: Non-protected bycatch<br />
Figure 6.11: <strong>Annual</strong> estimates of fish bycatch in the southern blue whiting trawl fishery, calculated for<br />
QMS species, non-commercial species (OTH), <strong>and</strong> overall (TOT) for 2002–03 to 2006–07 (in black). Also<br />
shown (in grey) are estimates of bycatch in each category (excluding QMS) for 1990–91 to 2001–02<br />
(Anderson 2004a). Error bars show the 95% confidence intervals. Note: the 98–00 fishing year<br />
encompasses the 18 months between September 1998 <strong>and</strong> March 2000, the transitional period between a<br />
change from an Oct–Sep to Apr–Mar fishing year. The dark line in the bottom panel shows the total<br />
annual estimated l<strong>and</strong>ings of SBW (Ministry of Fisheries 2009).<br />
Total annual discard estimates between 2002–03 <strong>and</strong> 2006–07 ranged from about 90 t to 250 t per<br />
year. Discard amounts sometimes exceeded bycatch due to the large contribution of the target species<br />
(50–230 t per year) to total discards – the result usually of fish losses during recovery of the trawl.<br />
Discarding of commercial species was virtually non-existent in most years <strong>and</strong> discards of noncommercial<br />
species amounted to only 10–50 t per year. The main species discarded were southern<br />
blue whiting, rattails <strong>and</strong> porbeagle sharks. Total annual discard estimates for 1990–91 to 2001–02,<br />
from earlier reports, were mostly between about 140 t <strong>and</strong> 750 t but were about 1200 t in 1991–92<br />
(Figure 6.12). Discards of southern blue whiting (<strong>and</strong> therefore total discards) decreased substantially<br />
at the end of the 1990s <strong>and</strong> have remained at low levels, below 250 t per year, at least up until 2006–0<br />
140
AEBAR <strong>2012</strong>: Non-protected bycatch<br />
Figure 6.12: <strong>Annual</strong> estimates of fish discards in the southern blue whiting trawl fishery, calculated for<br />
the target species (SBW), QMS species, non-commercial species (OTH), <strong>and</strong> overall (TOT) for 2002–03 to<br />
2006–07 (in black). Also shown (in grey) are estimates of discards in each category (excluding QMS)<br />
calculated for 1990–91 to 2001–02 by Anderson (2004a). Error bars show the 95% confidence intervals.<br />
The dark line shows the total annual estimated l<strong>and</strong>ings of SBW (Ministry of Fisheries 2009).<br />
141
AEBAR <strong>2012</strong>: Non-protected bycatch<br />
6.3.6. Orange roughy trawl fishery<br />
In the most recent study, covering the period 1990–91 to 2008–09, the ratio estimator used to<br />
calculate bycatch <strong>and</strong> discard rates in the orange roughy fishery was based on the number of trawls.<br />
Linear mixed-effect models (LMEs) identified trawl duration as the key variable influencing bycatch<br />
rates <strong>and</strong> discard rates in this fishery, <strong>and</strong> regression tree methods were used to optimise the number<br />
of levels of this variable in order to stratify the calculation of annual bycatch <strong>and</strong> discard totals in each<br />
catch category.<br />
The key categories of catch/discards examined were; orange roughy, other QMS species (excluding<br />
oreos) combined, commercial species combined (as defined above for hoki/hake/ling), <strong>and</strong> noncommercial<br />
species combined.<br />
The level of observer coverage in this fishery has been relatively high over the entire period of the<br />
fishery—more than 10% (in terms of the total fishery catch) in all but one year, <strong>and</strong> over 50% in some<br />
years. Observer coverage was not evenly spread across all parameters of the orange roughy fishery,<br />
the most widespread of any New Zeal<strong>and</strong> fishery, with notable undersampling of smaller vessels, the<br />
east coast fisheries in QMAs ORH 2A, ORH 2B, <strong>and</strong> ORH 3A, <strong>and</strong> some of the earlier years of the<br />
period.<br />
For the recent orange roughy fishery (since 2005–06), orange roughy accounted for about 84% of the<br />
total observed catch. Much of the remainder of the total catch (about 10%) comprised oreo species:<br />
mainly smooth oreo (8%), <strong>and</strong> black oreo (2.1%). Rattails (various species, 0.8%) <strong>and</strong> shovelnose<br />
spiny dogfish (Deania calcea, 0.6%) were the species most adversely affected by this fishery, with<br />
over 90% discarded. Other fish species frequently caught <strong>and</strong> usually discarded included deepwater<br />
dogfishes (family Squalidae), especially Etmopterus species, the most common of which is likely to<br />
have been Baxter’s dogfish (E. baxteri), slickheads, <strong>and</strong> morid cods, especially Johnson’s cod<br />
(Halargyreus johnsonii) <strong>and</strong> ribaldo. In total, over 250 bycatch species or species groups were<br />
observed, most being non-commercial species, including invertebrate species, caught in low numbers.<br />
Squid (mostly warty squid, Onykia spp.) were the largest component of invertebrate catch, followed<br />
by various groups of coral, echinoderms (mainly starfish), <strong>and</strong> crustaceans (mainly king crabs, family<br />
Lithodidae).<br />
Total annual bycatch in the orange roughy fishery since 1990–91 ranged from about 2300 t to<br />
27 000 t, <strong>and</strong> declined over time alongside the decline in catch <strong>and</strong> effort in this fishery to be less than<br />
4000 t in each of the last four years estimated (Figure 6.13). Bycatch mostly comprised commercial<br />
species, with non-commercial species accounting for only 5–10% of the total bycatch in the recent<br />
period.<br />
Estimated total annual discards also decreased over time, from about 3400 t in 1990–91 to about 300 t<br />
in 2007–08 (Figure 6.14), <strong>and</strong> since about 2000 were almost entirely non-commercial, non-QMS<br />
species. Large discards of orange roughy <strong>and</strong> other commercial species, more prevalent early in the<br />
fishery, were often due to fish lost from torn nets during hauling.<br />
142
AEBAR <strong>2012</strong>: Non-protected bycatch<br />
Figure 6.13: <strong>Annual</strong> estimates of fish bycatch in the orange roughy trawl fishery, calculated for<br />
commercial species (COM), non-commercial species (OTH), QMS species, <strong>and</strong> overall for 1990–91 to<br />
2008–09 (black points). Also shown (grey points) are earlier estimates of bycatch in each category<br />
(excluding QMS) calculated for 1990–91 to 2004–05 (Anderson et al. 2001, Anderson 2009a). Error bars<br />
show the 95% confidence intervals. The black line in the bottom panel shows the total annual estimated<br />
l<strong>and</strong>ings of orange roughy (O. Anderson & M. Dunn (NIWA), unpublished data).<br />
143
AEBAR <strong>2012</strong>: Non-protected bycatch<br />
Figure 6.14: <strong>Annual</strong> estimates of fish discards in the orange roughy trawl fishery, calculated for the target<br />
species (ORH), commercial species (COM), non-commercial species (OTH), QMS species, <strong>and</strong> overall for<br />
1990–91 to 2008–09 (black points). Also shown (grey points) are estimates of discards in each category<br />
(excluding QMS) calculated for 1990–91 to 2004–05 (Anderson et al. 2001, Anderson 2009a). Error bars<br />
show the 95% confidence intervals. The black line in the bottom panel shows the total annual estimated<br />
l<strong>and</strong>ings of orange roughy (O. Anderson & M. Dunn (NIWA), unpublished data).<br />
144
AEBAR <strong>2012</strong>: Non-protected bycatch<br />
6.3.7. Oreo trawl fishery<br />
In the most recent study, covering the period 1990–91 to 2008–09, the ratio estimator used to<br />
calculate bycatch <strong>and</strong> discard rates in the oreo fishery was based on the number of trawls. Linear<br />
mixed-effect models (LMEs) identified trawl duration as the key variable influencing bycatch rates<br />
<strong>and</strong> discard rates in this fishery, <strong>and</strong> regression tree methods were used to optimise the number of<br />
levels of this variable in order to stratify the calculation of annual bycatch <strong>and</strong> discard totals in each<br />
catch category.<br />
The key categories of catch/discards examined were; oreos, other QMS species (excluding orange<br />
roughy) combined, commercial species combined (as defined above for hoki/hake/ling), <strong>and</strong> noncommercial<br />
species combined.<br />
The oreo fishery is strongly linked to the orange roughy fishery, <strong>and</strong> only about 15% of the observed<br />
trips examined in the study predominantly targeted oreos, <strong>and</strong> nearly 30% of the observed trawls<br />
targeting oreos were from trips which predominantly targeted orange roughy. The coverage of the<br />
oreo fishery is therefore partly determined by the operations of the orange roughy fishery.<br />
The annual number of observed trawls in the oreo fishery ranged from 30 in 1991–92 to 1006 in<br />
2006–07 <strong>and</strong> the number of vessels observed ranged from 2 to 12. The level of coverage remained at a<br />
relatively consistent level after the mid-1990s, despite a decrease in the total catch <strong>and</strong> effort.<br />
Observer coverage was mostly restricted to the main fisheries on the South Chatham Rise <strong>and</strong> further<br />
south. Within this region, few locations were not covered by observers during the 19 years examined,<br />
but in the smaller fisheries, on the North Chatham Rise, Louisville Ridge, <strong>and</strong> the east coast from<br />
Kaikoura to East Cape, coverage was minimal. The match of observer coverage to commercial effort<br />
was relatively good, especially compared with the orange roughy fishery. Some oversampling on the<br />
south Chatham Rise occurred in some periods, e.g., 2001–2005 <strong>and</strong> 2008–09, <strong>and</strong> undersampling in<br />
the Pukaki/Bounty fisheries in 2005–06 <strong>and</strong> 2008–09, but elsewhere, <strong>and</strong> at other times, the spread of<br />
coverage was nearly ideal. The full range of vessel sizes (mainly between 300 t <strong>and</strong> 3000 t) was<br />
covered by observers, although small vessels were somewhat underrepresented <strong>and</strong> large vessels<br />
overrepresented. The fleet has shrunk in recent years <strong>and</strong> the remaining vessels are observed more<br />
regularly, with 30–60% of the fleet hosting observers annually since 2002–03.<br />
Oreo species accounted for about 92% of the total estimated catch from all observed trawls targeting<br />
oreos after 1 October 2002. Orange roughy (3.5%) was the main bycatch species, with no other<br />
species or group of species accounting for more than 0.6% of the total catch. Hoki were the next most<br />
common bycatch species, followed by rattails, deepwater dogfish (especially Baxter’s dogfish <strong>and</strong><br />
seal shark (Dalatias licha)), slickheads, <strong>and</strong> basketwork eel (Diastobranchus capensis), all of which<br />
were usually discarded. Ling were also frequently caught, but only comprised about 0.25% of the total<br />
catch. In total, over 250 species or species groups were identified by observers in the target fishery,<br />
including numerous invertebrates. As in the orange roughy fishery, corals, squids <strong>and</strong> octopuses, king<br />
crabs, <strong>and</strong> echinoderms were the main groups caught. Coral, in particular, was a substantial part of the<br />
bycatch, accounting for almost 0.4% of the total catch.<br />
Total annual bycatch in the oreo fishery since 1990–91 has ranged from about 270 t to 2200 t <strong>and</strong>,<br />
apart from some higher levels in the late 1990s, not shown any obvious trends (Figure 6.15). Bycatch<br />
has been split almost evenly between commercial <strong>and</strong> non-commercial species overall, although after<br />
2002 about 60% of the bycatch comprised commercial species.<br />
Discards in the oreo fishery remained relatively stable over time, ranging from about 260 t to 750 t per<br />
year, with higher levels in the late 1990s than in the early 1990s or 2000s (Figure 6.16). Discards<br />
mainly comprised non-commercial, non-QMS species, but also included a significant component of<br />
the target species in most years.<br />
145
AEBAR <strong>2012</strong>: Non-protected bycatch<br />
Figure 6.15: <strong>Annual</strong> estimates of fish bycatch in the oreo trawl fishery, calculated for commercial species<br />
(COM), non-commercial species (OTH), QMS species, <strong>and</strong> overall for 1990–91 to 2008–09 (black points).<br />
Also shown (grey points) are estimates of bycatch in each category (excluding QMS) calculated for 1990–<br />
91 to 2001–02 (Anderson 2004a). Error bars show the 95% confidence intervals. The black line in the<br />
bottom panel shows the total annual estimated l<strong>and</strong>ings of oreos (Ministry of Fisheries 2010).<br />
146
AEBAR <strong>2012</strong>: Non-protected bycatch<br />
Figure 6.16: <strong>Annual</strong> estimates of fish discards in the oreo trawl fishery, calculated for the target species<br />
(OEO), commercial species (COM), non-commercial species (OTH), QMS species, <strong>and</strong> overall for 1990–<br />
91 to 2008–09 (black points). Also shown (grey points) are estimates of discards in each category<br />
(excluding QMS) calculated for 1990–91 to 2001–02 (Anderson 2004a). Error bars show the 95%<br />
confidence intervals. The black line in the bottom panel shows the total annual estimated l<strong>and</strong>ings of<br />
oreos (Ministry of Fisheries 2010).<br />
147
AEBAR <strong>2012</strong>: Non-protected bycatch<br />
6.3.8. Scampi trawl fishery<br />
In the most recent study, covering the period 1990–91 to 2009–10, the ratio estimator used to<br />
calculate bycatch <strong>and</strong> discard rates in the scampi fishery was based on the number of trawls. Linear<br />
mixed-effect models (LMEs) identified fishery area as the key variable influencing bycatch rates <strong>and</strong><br />
discard rates.<br />
The key categories of catch/discards examined were; all QMS species combined, all non-QMS<br />
species combined, all invertebrate species combined, javelinfish, <strong>and</strong> all other rattail species<br />
combined.<br />
Observer coverage in the scampi fishery has been relatively low compared with most of the other<br />
fisheries assessed. The long-term level of observer coverage in the orange roughy, oreo, arrow squid,<br />
southern blue whiting, <strong>and</strong> ling longline fisheries is greater than 18% of the target fishery catch (<strong>and</strong><br />
over 40% for southern blue whiting) whereas in the scampi fishery (<strong>and</strong> also in the jack mackerel<br />
fishery) long-term coverage has only been about 11–12%. However, annual coverage in the scampi<br />
fishery was greater than 10% in most years <strong>and</strong> fell below 5% only once (in 2000–01).<br />
The annual number of observed trawls in the fishery ranged from 142 to 797, but has been over 300<br />
trawls in most years. The number of vessels observed in each year ranged from 3 to 8 (equivalent to<br />
33–66% of the fleet) <strong>and</strong> was very constant—5 or 6 vessels in most years. Analysis of the spread of<br />
observer effort compared with that of the scampi fishery as a whole, across a range of variables,<br />
indicated that this coverage was reasonably well spread. Although some less important regions of the<br />
fishery received little or no coverage (e.g. the central Chatham Rise, where commercial scampi<br />
fishing has only recently developed, <strong>and</strong> west coast South Isl<strong>and</strong>), the main scampi fisheries were<br />
consistently sampled throughout the period examined. Vessels were mostly of a similar size, <strong>and</strong> the<br />
small amount of effort by larger vessels was adequately covered, as was the full depth range of the<br />
fishery <strong>and</strong> (despite highly intermittent sampling in several years) all periods of the year.<br />
Over 450 bycatch species or species groups were observed in the scampi target fishery catch, most<br />
being non-commercial species, including invertebrate species, caught in low numbers. Scampi<br />
accounted for only about 17% of the total estimated catch from all observed trawls targeting scampi<br />
since 1 October 1990. The main bycatch species or species groups were javelinfish (16%), other<br />
(unidentified) rattails (13%), sea perch (Helicolenus spp., 8.4%), ling (7.5%), <strong>and</strong> hoki (6.1%). The<br />
first three of these bycatch groups were mostly discarded (Figure 6.17). Of the other invertebrate<br />
groups, unidentified crabs (1.1%) <strong>and</strong> unidentified starfish (0.8%) were caught in the greatest<br />
amounts. When combined into broader taxonomic groups, bony fish (excluding rattails) contributed<br />
the most to total bycatch (40%), followed by rattails (29%), rays <strong>and</strong> skates (3.5%), sharks <strong>and</strong><br />
dogfish (2.3%), crustaceans (2.2%), chimaeras (2.0%), echinoderms (1.6%), <strong>and</strong> cnidarians (0.6%). A<br />
large percentage of the bycatch in these groups was discarded, <strong>and</strong> was less than 85% only for bony<br />
fish (excluding rattails) (33%), rays <strong>and</strong> skates (67%), <strong>and</strong> chimaeras (28%).<br />
148
AEBAR <strong>2012</strong>: Non-protected bycatch<br />
Figure 6.17: Percentage of the total catch contributed by the main bycatch species (those representing 1%<br />
or more of the total catch) in the observed portion of the scampi fishery, <strong>and</strong> the percentage discarded.<br />
The “Other” category is the sum of all other bycatch species (fish <strong>and</strong> invertebrates) representing less<br />
than 1% of the total catch.<br />
Total annual bycatch since 1990–91 ranged from about 2100 t to 9200 t <strong>and</strong>, although highly variable,<br />
showed a significant decline over the past 20 years – driven mainly by a decline in the bycatch of<br />
QMS species (Figure 6.18). <strong>Annual</strong> bycatch has generally been an even mixture of QMS <strong>and</strong> non-<br />
QMS species, with invertebrate species (although showing a significant increase over time)<br />
accounting for only about 7% of the total bycatch for the whole period. Rattails (split evenly between<br />
javelinfish <strong>and</strong> all other species combined) accounted for 30–80% of the annual non-QMS bycatch.<br />
Comparison of bycatch rates with relative biomass estimates from trawl surveys to test for similarity of<br />
trends over time was possible for the Chatham Rise <strong>and</strong> Auckl<strong>and</strong> Isl<strong>and</strong>s fishery areas, but these were<br />
inconclusive.<br />
Total annual discards ranged from 6790 t in 1995–96 to 1430 t in 2005–06 <strong>and</strong>, although showing a<br />
general decrease since 2001–02, there was no significant trend in overall discard levels since 1990–91<br />
(Figure 6.19). Discards were dominated by non-QMS species (overall about 75%) followed by QMS<br />
species (16%) <strong>and</strong> invertebrates (9%). Rattail species accounted for nearly 60% of the non-QMS<br />
discards <strong>and</strong> about 45% of all discards.<br />
149
AEBAR <strong>2012</strong>: Non-protected bycatch<br />
Figure 6.18: <strong>Annual</strong> estimates of bycatch in the scampi trawl fishery, for QMS species, non-QMS species,<br />
invertebrates (INV), <strong>and</strong> overall for 1990–91 to 2009–10. Also shown (in grey) are estimates of bycatch in<br />
each category (excluding INV) calculated for 1999–2000 to 2005–06 (Ballara & Anderson 2009). Error<br />
bars indicate 95% confidence intervals. The straight lines show the fit of a weighted regression to annual<br />
bycatch. In the bottom panel the solid black line shows the total annual reported l<strong>and</strong>ings of scampi<br />
(Ministry of Fisheries 2011) <strong>and</strong> the dashed line shows annual effort (scaled to have mean equal to that of<br />
total bycatch).<br />
150
AEBAR <strong>2012</strong>: Non-protected bycatch<br />
Figure 6.19: <strong>Annual</strong> estimates of discards in the scampi trawl fishery, for QMS species, non-QMS species,<br />
invertebrates (INV), <strong>and</strong> overall for 1990–91 to 2009–10. Also shown (in grey) are estimates of discards<br />
in each category (excluding INV) calculated for 1999–2000 to 2005–06 (Ballara & Anderson 2009). Error<br />
bars indicate 95% confidence intervals. The straight lines show the fit of the weighted regression to<br />
annual discards.<br />
151
AEBAR <strong>2012</strong>: Non-protected bycatch<br />
6.3.9. Tuna longline fishery<br />
The New Zeal<strong>and</strong> tuna longline fishery was dominated by the foreign licensed vessels during the<br />
1980s, but is now comprised of chartered Japanese vessels <strong>and</strong> New Zeal<strong>and</strong> domestic vessels. The<br />
domestic fishing fleet has been the dominant fleet in the fishery since 1993–94 (Figure 6.20).<br />
Number of hooks (millions)<br />
30.0<br />
25.0<br />
20.0<br />
15.0<br />
10.0<br />
5.0<br />
0.0<br />
1979-80<br />
1980-81<br />
1981-82<br />
1982-83<br />
1983-84<br />
1984-85<br />
1985-86<br />
1986-87<br />
1987-88<br />
1988-89<br />
1989-90<br />
1990-91<br />
1991-92<br />
1992-93<br />
1993-94<br />
1994-95<br />
1995-96<br />
1996-97<br />
Fishing year<br />
1997-98<br />
1998-99<br />
1999-00<br />
2000-01<br />
2001-02<br />
2002-03<br />
N.Z. Domestic<br />
Foreign + charter<br />
2003-04<br />
2004-05<br />
2005-06<br />
2006-07<br />
2007-08<br />
2008-09<br />
Figure 6.20: Effort (hooks set) in the tuna longline fishery. Black bars are Foreign <strong>and</strong> Charter vessels,<br />
white bars are NZ domestic vessels.<br />
The Japanese charter fleet mainly target southern bluefin tuna off the west coast South isl<strong>and</strong> (WCSI),<br />
<strong>and</strong> domestic vessels target mainly southern bluefin tuna <strong>and</strong> bigeye tuna <strong>and</strong> the fishery is<br />
concentrated on the east coast of the North Isl<strong>and</strong> (ECNI) with some fishing for southern Bluefin tuna<br />
on the WCSI.<br />
The most recent analysis of fish bycatch in tuna longline fisheries was the 2006−07 to 2009−10<br />
fishing years (Griggs & Baird 1012)<br />
Observer effort has mainly focused on the Japanese charter vessels (all vessels covered <strong>and</strong> usually<br />
about 80% of hooks observed), with lower coverage of the domestic fishery (approximately 7-8%<br />
during 2006−07 to 2009−10). Most of the fishing effort is carried out by the domestic fleet so this<br />
fleet is under-observed.<br />
During 2006−07 to 2009–10, 111 074 fish <strong>and</strong> invertebrates from at least 62 species or species groups<br />
were observed. Most species were rarely observed, with only 37 species (or species groups) exceeding<br />
100 observations between 1988–89 <strong>and</strong> 2009–10. The most commonly observed species over all years<br />
were blue shark, albacore tuna, <strong>and</strong> Ray’s bream, these three making up nearly 70% of the catch by<br />
numbers. Blue shark <strong>and</strong> Ray’s bream were the most abundant <strong>and</strong> second most abundant species in<br />
each of the four fishing years 2006–07 to 2009−10 (Table 6.2). Other important non-target species<br />
were albacore, lancetfish, bigscale pomfret, dealfish, porbeagle shark, swordfish, moonfish, mako<br />
shark, deepwater dogfish, sunfish, <strong>and</strong> oilfish. The catch composition varied with fleet <strong>and</strong> area<br />
fished.<br />
QMS bycatch species are blue sharks, mako sharks, porbeagle sharks, school shark, moonfish, Ray’s<br />
bream, <strong>and</strong> swordfish. Swordfish is also sometimes targeted.<br />
152<br />
2009-10
AEBAR <strong>2012</strong>: Non-protected bycatch<br />
Table 6.2: Species composition of observed tuna longline catches. Number of fish observed are shown for<br />
2006-07 to 2009-10 <strong>and</strong> all fish observed since 1988-89. Top 30 species.<br />
1<br />
2<br />
3<br />
4<br />
5<br />
6<br />
7<br />
8<br />
9<br />
10<br />
11<br />
12<br />
13<br />
14<br />
15<br />
16<br />
17<br />
18<br />
19<br />
20<br />
21<br />
22<br />
23<br />
24<br />
25<br />
26<br />
27<br />
28<br />
29<br />
30<br />
2006–07 to Total<br />
Species Scientific Name<br />
2009–10 number<br />
Blue shark Prionace glauca 38162 182628<br />
Albacore tuna Thunnus alalunga 9854 101316<br />
Rays bream Brama brama 25277 98205<br />
Southern bluefin tuna Thunnus maccoyii 10373 43291<br />
Porbeagle shark Lamna nasus 2235 19011<br />
Dealfish Trachipterus trachypterus 2304 17185<br />
Lancetfish Alepisaurus ferox & A. brevirostris 5661 14383<br />
Moonfish Lampris guttatus 1683 9134<br />
Deepwater dogfish Squaliformes 1600 9112<br />
Swordfish Xiphias gladius 2213 8286<br />
Big scale pomfret Taractichthys longipinnis 2954 7818<br />
Oilfish Ruvettus pretiosus 711 7542<br />
Mako shark Isurus oxyrinchus 1676 6162<br />
Rudderfish Centrolophus niger 373 4907<br />
Butterfly tuna Gasterochisma melampus 617 4469<br />
Escolar Lepidocybium flavobrunneum 643 4422<br />
Bigeye tuna Thunnus obesus 1240 4390<br />
School shark Galeorhinus galeus 419 3620<br />
Yellowfin tuna Thunnus albacares 97 3342<br />
Sunfish Mola mola 1000 2755<br />
Pelagic stingray Pteroplatytrygon violacea 585 2398<br />
Hoki Macruronus novaezel<strong>and</strong>iae 265 2021<br />
Thresher shark Alopias vulpinus 169 1400<br />
Skipjack tuna Katsuwonus pelamis 38 1151<br />
Dolphinfish Coryphaena hippurus 134 608<br />
Flathead pomfret Taractes asper 158 516<br />
Striped marlin Tetrapturus audax 59 468<br />
Black barracouta Nesiarchus nasutus 51 386<br />
Barracouta Thyrsites atun 10 357<br />
Pacific bluefin tuna Thunnus orientalis 34 222<br />
Most blue, porbeagle, mako, <strong>and</strong> school sharks were processed in some way, either being finned or<br />
retained for their flesh, but there were significant fleet differences. Blue sharks were mainly just<br />
finned. Most albacore, swordfish, yellowfin tuna, moonfish <strong>and</strong> Ray’s bream were retained. Most<br />
bigscale pomfret, escolar, oilfish <strong>and</strong> rudderfish were discarded, with some year <strong>and</strong> fleet differences.<br />
Almost all deepwater dogfish, dealfish, <strong>and</strong> lancetfish were discarded.<br />
153
AEBAR <strong>2012</strong>: Non-protected bycatch<br />
6.3.10. Albacore troll fishery<br />
This fishery is comprised entirely of small domestic vessels fishing over the summer months mainly<br />
on the west coast of the North <strong>and</strong> South Isl<strong>and</strong>, especially WCSI.<br />
Observers began to go to sea on troll vessels in 2007. The first 2 years were a trial period with one trip<br />
observed <strong>and</strong> targets were set in 2009. Coverage has ranged from 0.5-1.5% of days fished over the<br />
2009−10 to 2010−12 fishing years.<br />
Albacore has made up 93.5% of the observed catch over the past six years, followed by Ray’s bream<br />
(3.1%) <strong>and</strong> Skipjack tuna (2.1%) <strong>and</strong> small numbers (
AEBAR <strong>2012</strong>: Non-protected bycatch<br />
6.3.11. Skipjack purse seine fishery<br />
Skipjack tuna makes up 98.9% of the catch observed on purse seine vessels in NZ waters.<br />
Catch composition from eight observed purse seine trips operating within New Zeal<strong>and</strong> fisheries<br />
waters in 2010 <strong>and</strong> 2011 can be seen in Table 6.4.<br />
Table 6.4: Species composition of observed skipjack purse seine catches in 2010 <strong>and</strong> 2011.<br />
2010–2011<br />
Observed<br />
catch weight<br />
Common name Scientific name<br />
(kg) % Catch<br />
Skipjack tuna Katsuwonus pelamis 3 600 988 98.92<br />
Jack mackerel Trachurus spp. 22 090 0.61<br />
Jellyfish Scyphozoa 6 740 0.19<br />
Blue mackerel Scomber australasicus 4 040 0.11<br />
Manta ray Mobula japanica 2 122 0.06<br />
Sunfish Mola mola 1 456 0.04<br />
Striped marlin Tetrapturus audax 820 0.02<br />
Mako shark Isurus oxyrinchus 517 0.01<br />
Albacore tuna Thunnus alalunga 422 0.01<br />
Porcupine fish Tragulichthys jaculiferus 343 0.01<br />
Flying fish Exocoetidae 174
6.4. Indicators <strong>and</strong> trends<br />
AEBAR <strong>2012</strong>: Non-protected bycatch<br />
A st<strong>and</strong>ard measure that can be used to indicate the degree of wastefulness in a fishery is the level of<br />
annual discards as a fraction of the catch of the target species. The most recent estimates of this<br />
measure are provided in Table 6.5 for those fisheries where the necessary data were available.<br />
Table 6.5: Fishery efficiency. Kilograms of discards per kilogram of target species catch. The figures<br />
represent the most recent estimate, from published reports.<br />
Fishery Discards/target species catch (kg)<br />
Arrow squid trawl 0.02–0.07<br />
Ling longline 0.35<br />
Hoki/hake/ling trawl 0.03<br />
Jack mackerel trawl 0.011<br />
Southern blue whiting trawl 0.005<br />
Orange roughy trawl 0.03–0.06<br />
Oreo trawl 0.02–0.03<br />
Scampi trawl 3.5<br />
Some general trends have been identified in some fisheries, especially those examined within more<br />
recent MPI projects where the determination of trends in the rates <strong>and</strong> levels of bycatch over time has<br />
been an explicit objective (Table 6.6).<br />
Table 6.6: Trends in non-protected species bycatch from recent MPI projects where trend determination<br />
has been an objective.<br />
Fishery Trends<br />
Arrow squid trawl Linear regression modelling of observer catch data indicated increasing bycatch<br />
rates over time (positive slopes) in all species categories <strong>and</strong> areas except for<br />
QMS species in the Stewart-Snares Shelf <strong>and</strong> Banks Peninsula fisheries. These<br />
trends were statistically significant (p
6.5. References<br />
AEBAR <strong>2012</strong>: Non-protected bycatch<br />
Recent fleet-wide alterations to the nets providing escape gaps for larger<br />
unwanted fish species (e.g., skates) may be responsible for the above trends.<br />
These escape gaps allow for longer tows, as the nets fill up less rapidly, <strong>and</strong> may<br />
lead to greater catches of benthic invertebrates <strong>and</strong> smaller fish species.<br />
Alverson DL; Freeberg MH; Murawski SA; Pope JG (1994). A global assessment of fisheries bycatch <strong>and</strong> discards. FAO Technical Paper No.<br />
339. Rome. 233 p.<br />
Anderson, O.F. (2004a). Fish discards <strong>and</strong> non-target fish catch in the fisheries for southern blue whiting <strong>and</strong> oreos. New Zeal<strong>and</strong> Fisheries<br />
Assessment Report 2004/9. 40 p.<br />
Anderson, O.F. (2004b). Fish discards <strong>and</strong> non-target fish catch in the trawl fisheries for arrow squid, jack mackerel, <strong>and</strong> scampi in New Zeal<strong>and</strong><br />
waters. New Zeal<strong>and</strong> Fisheries Assessment Report 2004/10. 61 p.<br />
Anderson, O.F. (2007). Fish discards <strong>and</strong> non-target fish catch in the New Zeal<strong>and</strong> jack mackerel trawl fishery, 2001–02 to 2004–05. New<br />
Zeal<strong>and</strong> <strong>Aquatic</strong> <strong>Environment</strong> <strong>and</strong> <strong>Biodiversity</strong> Report 8. 36 p.<br />
Anderson, O.F. (2008). Fish <strong>and</strong> invertebrate bycatch <strong>and</strong> discards in ling longline fisheries, 1998–2006. New Zeal<strong>and</strong> <strong>Aquatic</strong> <strong>Environment</strong> <strong>and</strong><br />
<strong>Biodiversity</strong> Report 23. 43 p.<br />
Anderson, O.F. (2009a). Fish discards <strong>and</strong> non-target fish catch in the New Zeal<strong>and</strong> orange roughy trawl fishery, 1999–2000 to 2004–05. New<br />
Zeal<strong>and</strong> <strong>Aquatic</strong> <strong>Environment</strong> <strong>and</strong> <strong>Biodiversity</strong> Report 39. 40 p.<br />
Anderson, O.F. (2009b). Fish <strong>and</strong> invertebrate bycatch <strong>and</strong> discards in southern blue whiting fisheries, 2002–07. New Zeal<strong>and</strong> <strong>Aquatic</strong><br />
<strong>Environment</strong> <strong>and</strong> <strong>Biodiversity</strong> Report 43. 42 p.<br />
Anderson, O.F.; (2011). Fish <strong>and</strong> invertebrate bycatch <strong>and</strong> discards in orange roughy <strong>and</strong> oreo fisheries from 1990–91 until 2008–09. New<br />
Zeal<strong>and</strong> <strong>Aquatic</strong> <strong>Environment</strong> <strong>and</strong> <strong>Biodiversity</strong> Report 67.<br />
Anderson, O.F. (In Press). Fish <strong>and</strong> invertebrate bycatch <strong>and</strong> discards in New Zeal<strong>and</strong> arrow squid fisheries from 1990–91 until 2010–11. New<br />
Zeal<strong>and</strong> <strong>Aquatic</strong> <strong>Environment</strong> <strong>and</strong> <strong>Biodiversity</strong> Report.<br />
Anderson, O.F., Clark, M.R., & Gilbert, D.J. (2000). Bycatch <strong>and</strong> discards in trawl fisheries for jack mackerel <strong>and</strong> arrow squid, <strong>and</strong> in the<br />
longline fishery for ling, in New Zeal<strong>and</strong> waters. NIWA Technical Report 74. 44 p.<br />
Anderson, O.F., Gilbert, D.J., & Clark, M.R. (2001). Fish discards <strong>and</strong> non-target catch in the trawl fisheries for orange roughy <strong>and</strong> hoki in New<br />
Zeal<strong>and</strong> waters for the fishing years 1990–91 to 1998–99. New Zeal<strong>and</strong> Fisheries Assessment Report 2001/16. 57 p.<br />
Anderson, O.F.; Clark, M.R. (2003). Analysis of bycatch in the fishery for orange roughy, Hoplostethus atlanticus, on the South Tasman Rise.<br />
Marine <strong>and</strong> Freshwater Research 54: 643–652.<br />
Anderson, O.F.; Smith, M.H. (2005). Fish discards <strong>and</strong> non-target fish catch in the New Zeal<strong>and</strong> hoki trawl fishery, 1999–2000 to 2002–03. New<br />
Zeal<strong>and</strong> Fisheries Assessment Report 2005/3. 37 p<br />
Ayers, D.; Francis, M.P.; Griggs, L.H.; Baird, S.J. (2004). Fish bycatch in New Zeal<strong>and</strong> tuna longline fisheries, 2000–01 <strong>and</strong> 2001–02. New<br />
Zeal<strong>and</strong> Fisheries Assessment Report 2004/46. 47 p.<br />
Ballara, S.L.; Anderson, O.F. (2009). Fish discards <strong>and</strong> non-target fish catch in the trawl fisheries for arrow squid <strong>and</strong> scampi in New Zeal<strong>and</strong><br />
waters. New Zeal<strong>and</strong> <strong>Aquatic</strong> <strong>Environment</strong> <strong>and</strong> <strong>Biodiversity</strong> Report 38. 102 p.<br />
Ballara, S.L.; O’Driscoll, R.L.; Anderson, O.F. (2010). Fish discards <strong>and</strong> non-target fish catch in the trawl fishery for hoki, hake, <strong>and</strong> ling in New<br />
Zeal<strong>and</strong> waters. New Zeal<strong>and</strong> <strong>Aquatic</strong> <strong>Environment</strong> <strong>and</strong> <strong>Biodiversity</strong> Report 48.<br />
Bellido, J.M.; Santos, B. M.; Pennino, G. M.; Valeiras, X.; Pierce, G.J. (2011). Fishery discards <strong>and</strong> bycatch: solutions for an ecosystem<br />
approach to fisheries management? Hydrobiologia, 670. 317–333<br />
Borges, L.; Zuur, A. F.; Rogana, E.; Officer, R. 2005. Choosing the best sampling unit <strong>and</strong> auxiliary variable for discards estimations. Fisheries<br />
Research, 75: 29–39.<br />
Casini M; Vitale F; Cardinale M (2003). Trends in biomass <strong>and</strong> changes in spatial distribution of demersal fish species in Kattegatt <strong>and</strong><br />
Skagerrak between 1981 <strong>and</strong> 2003. ICES CM 2003/Q:14<br />
Clark, M.R., Anderson, O.F., & Gilbert, D.J. (2000). Discards in trawl fisheries for southern blue whiting, orange roughy, hoki, <strong>and</strong> oreos in<br />
New Zeal<strong>and</strong> waters. NIWA Technical Report 71. 73 p.<br />
Davies, R. W. D.; Cripps, S. J.; Nickson, A; Porter, G. (2009). Defining <strong>and</strong> estimating global marine fisheries bycatch. Marine Policy 33: 661–<br />
672.<br />
Fern<strong>and</strong>es, P. G.; Coull, K.; Davis, C.; Clark, P.; Catarino, R.; Bailey, N.; Fryer, R.; Pout, A. (2011). Observations of discards in the Scottish<br />
mixed demersal trawl fishery. ICES Journal of Marine Science, 68: 1734–1742.<br />
Francis, M. P.; Griggs, L. H.; Baird, S. J.; Murray, T. E.; Dean, H. A. (1999a). Fish bycatch in New Zeal<strong>and</strong> tuna longline fisheries. NIWA<br />
Technical Report 55. 70 p.<br />
Francis, M. P.; Griggs, L. H.; Baird, S. J.; Murray, T. E.; Dean, H. A. (1999b). Fish bycatch in New Zeal<strong>and</strong> tuna longline fisheries, 1988–89 to<br />
1997–98. NIWA Technical Report 76. 79 p.<br />
Francis, M.P.; Griggs, L.H.; Baird, S.J. (2004).Fish bycatch in New Zeal<strong>and</strong> tuna longline fisheries, 1998–99 to 1999–2000. New Zeal<strong>and</strong><br />
Fisheries Assessment Report 2004/22. 62 p.<br />
Griggs, L.; Doonan, I. McKenzie, A.; Fu, D. (In Press). Monitoring the length structure of commercial l<strong>and</strong>ings of albacore (Thunnus alalunga)<br />
during the 2009–10 to 2011−12 fishing years. New Zeal<strong>and</strong> Fisheries Assessment Report.<br />
Griggs, L.H.; Baird, S.J.; Francis, M.P. (2007). Fish bycatch in New Zeal<strong>and</strong> tuna longline fisheries, 2002–03 to 2004–05. New Zeal<strong>and</strong><br />
Fisheries Assessment Report 2007/18. 58 p.<br />
Griggs, L.H.; Baird, S.J.; Francis, M.P. (2008). Fish bycatch in New Zeal<strong>and</strong> tuna longline fisheries in 2005–06. New Zeal<strong>and</strong> Fisheries<br />
Assessment Report 2008/27. 47 p.<br />
Griggs, L.H.; Baird, S.J.; (In Press). Fish bycatch in New Zeal<strong>and</strong> tuna longline fisheries in 2006–07 to 2009−10. New Zeal<strong>and</strong> fisheries<br />
Assessment Report.<br />
Kelleher, K.: (2005). Discards in the world’s marine fisheries. An update. FAO Fisheries Technical Paper No. 470. FAO, Rome: 131 pp.<br />
Ministry of Fisheries (2009). Report from the Fisheries Assessment Plenary, May 2010: stock assessments <strong>and</strong> yield estimates. Wellington, New<br />
Zeal<strong>and</strong> Ministry of Fisheries. 1040p.<br />
157
AEBAR <strong>2012</strong>: Non-protected bycatch<br />
Ministry of Fisheries (2010). Report from the Fisheries Assessment Plenary, May 2010: stock assessments <strong>and</strong> yield estimates. Wellington, New<br />
Zeal<strong>and</strong> Ministry of Fisheries. 1158p.<br />
Ministry of Fisheries. (2011). Report from the Fisheries Assessment Plenary, May 2011: stock assessments <strong>and</strong> yield estimates. Ministry of<br />
Fisheries, Wellington, New Zeal<strong>and</strong>. 1178p.<br />
Pope JG; MacDonald DS; Daan N; Reynolds JD; Jennings S (2000). Gauging the impact of fishing mortality on non-target species. ICES<br />
Journal of Marine Science 57: 689–696.<br />
Saila S (1983). Importance <strong>and</strong> assessment of discards in commercial fisheries. FAO Circular No. 765. Rome. 62 p.<br />
Starr P.J. (In prep). Stock assessment of east coast South Isl<strong>and</strong> elephantfish (ELE 3). New Zeal<strong>and</strong> Fisheries Assessment Report xxxx/xx:<br />
32p.<br />
Starr P.J., Kendrick T.H. (<strong>2012</strong>). GUR 3 Fishery Characterisation <strong>and</strong> CPUE Report. SINS-WG-<strong>2012</strong>-14v2. 72 pp.<br />
Starr P.J., Kendrick T.H., Bentley, N. (2010a.) Report to the Adaptive Management Programme Fishery Assessment Working Group:<br />
Characterisation, CPUE analysis <strong>and</strong> logbook data for SCH 3. Document 2010/07-v2, 62 p. (Unpublished document held by the<br />
Ministry of Fisheries, Wellington, N.Z.) (http://cs.fish.govt.nz/forums/thread/3874.aspx)<br />
Starr P.J., Kendrick T.H., Bentley, N. (2010b). Report to the Adaptive Management Programme Fishery Assessment Working Group:<br />
Characterisation, CPUE analysis <strong>and</strong> logbook data for SCH 5. Document 2010/08-v2, 65 p. (Unpublished document held by the<br />
Ministry of Fisheries, Wellington, N.Z.) (http://cs.fish.govt.nz/forums/thread/3875.aspx)<br />
Starr P.J., Kendrick T.H., Bentley, N. (2010c). Report to the Adaptive Management Programme Fishery Assessment Working Group:<br />
Characterisation, CPUE analysis <strong>and</strong> logbook data for SCH 7 <strong>and</strong> SCH 8. Document 2010/09-v2, 149 p. (Unpublished document held<br />
by the Ministry of Fisheries, Wellington, N.Z.) (http://cs.fish.govt.nz/forums/thread/3876.aspx)<br />
158
AEBAR <strong>2012</strong>: Benthic impacts<br />
THEME 3: BENTHIC IMPACTS<br />
159
AEBAR <strong>2012</strong>: Benthic impacts<br />
7. Benthic (seabed) impacts<br />
Scope of chapter This chapter outlines the main effects of mobile bottom (or demersal) fishing<br />
gear on seabed habitats <strong>and</strong> communities All trawl gears contacting the<br />
seabed <strong>and</strong> shellfish dredges are included. Danish seines <strong>and</strong> more or less<br />
static methods like bottom longline <strong>and</strong> potting are excluded in this first<br />
version, as are fisheries outside the EEZ.<br />
Area All of the New Zeal<strong>and</strong> Territorial Sea (TS) <strong>and</strong> Exclusive Economic Zone<br />
(EEZ). There will be some relevance for out-of-zone bottom trawl fisheries.<br />
Focal localities Areas that are fished more frequently <strong>and</strong> habitats that are more sensitive to<br />
disturbance are likely to be most affected; areas that are closed to bottom<br />
impacting methods will not be directly affected. Bottom trawling in the EEZ<br />
is most intense on the western flanks <strong>and</strong> to the southwest of the Chatham<br />
Rise, the edge of the Stewart-Snares Shelf, south of the Auckl<strong>and</strong> Isl<strong>and</strong>s,<br />
<strong>and</strong> off the northwest coast of the South Isl<strong>and</strong>. Because of the low spatial<br />
resolution of reporting up to 2006/07, the spatial distribution of trawling<br />
within the TS is less well understood. Shellfish dredges probably have the<br />
greatest effect but their footprint is much smaller than that of bottom trawl<br />
fisheries <strong>and</strong> in generally shallow waters.<br />
Key issues Habitat modification, potential loss of biodiversity, potential loss of benthic<br />
productivity, potential modification of important breeding or juvenile fish<br />
habitat leading to reduced fish recruitment.<br />
Emerging issues Potential for effects on habitats of particular significance to fisheries<br />
management (HPSFM). The need for (<strong>and</strong> opportunities presented by) better<br />
spatial information on inshore fisheries from finer scale reporting of fishing<br />
locations (including logbooks). Cumulative effects <strong>and</strong> interactions with<br />
other stressors (including existing effects, especially in the coastal zone, <strong>and</strong><br />
MFish Research<br />
(current)<br />
NZ Government<br />
Research (current)<br />
Links to 2030<br />
objectives<br />
Related chapter/<br />
issues<br />
climate change.<br />
BEN2007/01, Assessing the effects of fishing on soft sediment habitat, fauna,<br />
<strong>and</strong> processes; DAE2010/04, Monitoring the trawl footprint for deepwater<br />
fisheries; DAE2010/01, Taxonomic identification of benthic samples;<br />
DEE2010/05, Development of a suite of environmental indicators for<br />
deepwater fisheries; DEE2010/06, Design a programme to monitor trends in<br />
deepwater benthic communities; BEN<strong>2012</strong>-01, Spatial overlap of mobile<br />
bottom fishing methods <strong>and</strong> coastal benthic habitats.<br />
MSI (ex-FRST) programmes: C01X0907, Coastal Conservation<br />
Management; C01X0906, Impacts of resource use on vulnerable deep-sea<br />
communities; C01X0808, Deepsea mining of the Kermadec Ridge. Previous<br />
OBI programmes Coasts & Oceans C01X0501 <strong>and</strong> Marine <strong>Biodiversity</strong> &<br />
Biosecurity C01X0502 are now part of NIWA core funding.<br />
Objective 6: Manage impacts of fishing <strong>and</strong> aquaculture<br />
Habitats of particular significance for fisheries management (HPSFM),<br />
marine environmental monitoring, marine mining/s<strong>and</strong> extraction, l<strong>and</strong>-based<br />
effects.<br />
160
7.1. Context<br />
AEBAR <strong>2012</strong>: Benthic impacts<br />
For the purpose of this document, mobile bottom fishing methods include all types of trawl gear that<br />
are used in contact with the seabed, Danish seines, <strong>and</strong> various designs of shellfish dredges. The<br />
information available on the distribution <strong>and</strong> effects of Danish seining is poor relative to that on<br />
trawls <strong>and</strong> dredges, so that method is not considered here in detail. The benthic effects of other<br />
methods of catching fish on or near the seabed that do not involve deliberately towing or dragging<br />
fishing gear across the seabed are thought to be considerably less than those of the mobile methods<br />
(although not always negligible) <strong>and</strong> these methods are not considered in this version.<br />
Trawls <strong>and</strong> dredges are used to catch a relatively high proportion of commercial l<strong>and</strong>ings in New<br />
Zeal<strong>and</strong> <strong>and</strong> such methods can represent the only effective <strong>and</strong> economic way of catching some<br />
species. However, the resulting disturbance to seabed habitats <strong>and</strong> communities may have<br />
consequences for biodiversity <strong>and</strong> ecosystem services, including fisheries <strong>and</strong> other secondary<br />
production. The guiding sections of the Fisheries Act 1996 for managing the effects fishing, including<br />
benthic effects, are s.8(2)(b) which specifies that “ensuring sustainability” (s.8(1)) includes “avoiding,<br />
remedying, or mitigating any adverse effects of fishing on the aquatic environment” <strong>and</strong> s.9 which<br />
specifies a principle that “biological diversity of the aquatic environment should be maintained”. Also<br />
potentially relevant is the principle in s.9 that “habitat of particular significance for fisheries<br />
management should be protected” (see the chapter on Habitats of Particular Significance for Fisheries<br />
Management for more details).<br />
One approach to managing the effects of mobile bottom fishing methods is through the use of spatial<br />
controls. A wide variety of such controls apply in New Zeal<strong>and</strong> waters (Figure 7.1). Some of these<br />
controls were introduced specifically to manage the effects of trawling, shellfish dredging, <strong>and</strong> Danish<br />
seining in areas or habitats considered sensitive to such disturbance (e.g., the bryozoans beds off<br />
Separation Point, between Golden <strong>and</strong> Tasman Bays, <strong>and</strong> the sponge-dominated fauna to the north of<br />
Spirits <strong>and</strong> Tom Bowling Bays in the far north). Other closures exist for other reasons but have the<br />
effect of protecting certain areas of seabed from disturbance by mobile bottom fishing methods. These<br />
include no-take marine reserves, pipeline <strong>and</strong> power cable exclusion zones, <strong>and</strong> areas set aside to<br />
protect marine mammals (e.g., see Figure 7.2 for trawl closures introduced in 2008 to protect Hector’s<br />
<strong>and</strong> Maui’s dolphins). Marine reserves provide marine protection in a range of habitats within the<br />
Territorial Sea. Although marine reserves provide a higher level of protection by prohibiting all<br />
extractive activities, most tend to be small. New Zeal<strong>and</strong>’s 34 marine reserves protect about 7.6% of<br />
New Zeal<strong>and</strong>’s Territorial Sea; however, 99% of this is in two marine reserves in the territorial seas<br />
around offshore isl<strong>and</strong> groups in the far north <strong>and</strong> far south of New Zeal<strong>and</strong>’s EEZ (Helson et al.<br />
2009). Until 2000, most closures that had the effect of protecting areas of seabed from disturbance by<br />
trawling <strong>and</strong> dredging were in the Territorial Sea.<br />
In the Exclusive Economic Zone, 18 seamount closures were established in 2000 to protect<br />
representative underwater topographic features from bottom trawling <strong>and</strong> dredging (Brodie <strong>and</strong> Clark<br />
2003, see Figure 7.1). These areas include 25 features, including 12 large seamounts >1000 m high,<br />
covering 2% (81, 000 km 2 ) of the EEZ. The seamount areas are closed to all types of trawling <strong>and</strong><br />
dredging. In 2006, members of the fishing industry proposed the closure of about 31% of the EEZ to<br />
bottom trawling <strong>and</strong> dredging in Benthic Protection Areas (BPAs), including the existing seamount<br />
closures. The design criteria for the BPAs were they should be large, relatively unfished, have simple<br />
boundaries, <strong>and</strong> be broadly representative of the marine environment. After a consultation process, a<br />
substantially revised package of BPAs (including three additional areas totalling 13,887 km 2 , 10<br />
additional active hydrothermal vents, <strong>and</strong> 35 topographic features) that complemented the existing<br />
seamount closures was implemented by regulation in 2007 (Helson et al. 2009, Figure 7.3). BPAs<br />
cover about 1.1 million km 2 (30%) of New Zeal<strong>and</strong>’s EEZ <strong>and</strong> are closed to trawling on or close to<br />
the bottom. Midwater trawling well off the bottom is permitted in the BPAs if two observers are on<br />
161
AEBAR <strong>2012</strong>: Benthic impacts<br />
board <strong>and</strong> an approved net monitoring system is used. Much of the seabed within BPAs is below<br />
trawlable depth (maximum trawlable depth is about 1600 m) <strong>and</strong> all are outside the Territorial Sea. In<br />
combination, the seamount closures <strong>and</strong> the BPAs include: 28% of topographic features (a term that<br />
includes underwater hills, knolls, <strong>and</strong> seamounts); 52% of seamounts over 1000 m high; <strong>and</strong> 88% of<br />
known active hydrothermal vents.<br />
Figure 7.1: Map, from Baird <strong>and</strong> Wood 2010, of the major spatial restrictions to trawling present at some stage<br />
during 1989–90 to 2004–05 <strong>and</strong> the Ministry for Primary Industries Fishery Management Areas (FMAs) within the<br />
outer boundary of the New Zeal<strong>and</strong> EEZ. Vessels longer than 28 m may not trawl within the TS <strong>and</strong> additional<br />
restrictions are specified in the Fisheries (Auckl<strong>and</strong> Kermadecs Commercial Fishing) Regulations 1986, the Fisheries<br />
(Central Area Commercial Fishing) Regulations 1986, the Fisheries (Challenger Area Commercial Fishing)<br />
Regulations 1986 the Fisheries (South East Area Commercial Fishing) Regulations 1986, <strong>and</strong> the Fisheries (Southl<strong>and</strong><br />
<strong>and</strong> Sub-Antarctic Areas Commercial Fishing) Regulations 1991.<br />
162
AEBAR <strong>2012</strong>: Benthic impacts<br />
Figure 7.2: Maps from Ministry of Fisheries website showing the general locations of areas closed to trawling to<br />
protect Hector’s <strong>and</strong> Maui’s dolphins. Note scales differ. (http://www.fish.govt.nz/ennz/Consultations/Archive/2008/Hectors+dolphins/Decisions.htm?wbc_purpose=Basic&WBCMODE=PresentationUnpublis<br />
hed%2525252525252cPresentationUnpublished)<br />
163
AEBAR <strong>2012</strong>: Benthic impacts<br />
Figure 7.3: Map from Ministry of Fisheries website showing the general locations of Benthic Protection Areas (BPAs)<br />
(http://www.fish.govt.nz/ennz/<strong>Environment</strong>al/Seabed+Protection+<strong>and</strong>+Research/Benthic+Protection+Areas.htm?wbc_purpose=basic&WBCMODE=pr<br />
esentationunpublished&MSHiC=65001&L=10&W=BPA%20&Pre=%3Cspan%20class%3d'SearchHighlight'%3E&Post=%<br />
3C/span%3E). See also Helson et al. 2009.<br />
7.2. Global underst<strong>and</strong>ing<br />
Concerns about the use of towed fishing gear on benthic habitats were first raised by fishermen in the<br />
fourteenth century in the UK (Lokkeborg 2005). They were worried about the capture of juvenile fish<br />
<strong>and</strong> the detrimental effects on food sources for harvestable fish. Despite this long history of concern,<br />
it is really only in the last 20 years that research efforts have focused strongly on the effects of mobile<br />
bottom fishing methods on benthic (seabed) communities, biodiversity, <strong>and</strong> production. This activity,<br />
combined with controversy around fishing effects, has spawned numerous reviews in the past 10 years<br />
that seek to summarise or synthesise the information (Jones 1992, Dayton et al. 1995; Jennings <strong>and</strong><br />
Kaiser 1998; Watling <strong>and</strong> Norse 1998; Lindeboom <strong>and</strong> deGroot 1998, Auster <strong>and</strong> Langton 1999; Hall<br />
1999; ICES 2000a <strong>and</strong> b, Kaiser <strong>and</strong> de Groot 2000; NMFS 2002, NRC 2002, Dayton et al. 2002;<br />
Thrush <strong>and</strong> Dayton 2002; Lokkeborg 2005, Barnes <strong>and</strong> Thomas 2005, Clark <strong>and</strong> Koslow 2007).<br />
Benthic habitats provide shelter <strong>and</strong> refuge for juvenile fish <strong>and</strong> the associated fauna can be the prey<br />
of demersal fish species. Towed fishing gears (particularly trawl doors), affect benthic habitats <strong>and</strong><br />
organisms <strong>and</strong> the level of effect will depend on the type of trawl doors <strong>and</strong> ground gear used, <strong>and</strong> the<br />
physical <strong>and</strong> biological characteristics of seabed habitats in the fishing grounds. The effects are<br />
164
AEBAR <strong>2012</strong>: Benthic impacts<br />
difficult to assess because of the complexity of benthic communities <strong>and</strong> their temporal <strong>and</strong> spatial<br />
variations, <strong>and</strong> interpretation can be complicated by environmental gradients or change. For reasons<br />
of accessibility, cost, <strong>and</strong> tractability, most research on seabed disturbance caused by human activities<br />
worldwide has been carried out in coastal systems, <strong>and</strong> our underst<strong>and</strong>ing of the effects of physical<br />
disturbance in the sparse but highly diverse communities of the deep sea has developed only recently.<br />
The reviews above broadly indicate that numerical abundance of many invertebrates declines<br />
(sometimes substantially) after mining, trawling, or other major disturbance. Trawling <strong>and</strong> dredging<br />
can re-suspend sediment <strong>and</strong> can, depending on sediment <strong>and</strong> local currents, alter sediment<br />
characteristics. Physical effects include furrows <strong>and</strong> berms from trawl doors, furrows from the<br />
bobbins <strong>and</strong> rock hoppers, <strong>and</strong> sediment resorting, but the magnitude of these depends on sediment<br />
type, currents, <strong>and</strong> wave action (if any). Bottom trawling can also alter natural sediment fluxes <strong>and</strong><br />
reduce the depth of the oxic layer in sediments (Churchill 1989, Warnken et al. 2003, Bradshaw et al.<br />
<strong>2012</strong>), <strong>and</strong> trawling can modify the shape of the upper continental slope (Puig et al <strong>2012</strong>), reducing<br />
morphological complexity <strong>and</strong> benthic habitat heterogeneity. The mixing of sediments <strong>and</strong> overlying<br />
water can alter the chemical makeup of the sediment <strong>and</strong> have considerable effects in deep, stable<br />
waters (Rumohr, 1998). Chemical release from the sediment can also be changed, as shown for<br />
phosphate in the North Sea (ICES 1992, noting lower fluxes were observed after trawling events).<br />
Trawling can alter benthic communities, reduce total biomass of benthic species, <strong>and</strong> increase<br />
predation by scavengers. Sites subject to greater natural disturbance are generally thought less<br />
susceptible to change from bottom contact fishing (but see Schratzberger et al. 2009 who concluded<br />
that common anthropogenic disturbances differ fundamentally from natural disturbance).<br />
There has been less work on the effects of other methods of catching demersal fish or crustaceans that<br />
do not involve deliberately towing or dragging fishing gear across the seabed, but some such methods<br />
can have non-negligible effects (e.g., Sharp et al. 2009, Williams et al. 2011). Studies of recovery<br />
dynamics are rarer still, but a return to pre-disturbance levels after such changes can take up to several<br />
years, even in some sites subject to considerable natural disturbance (see Kaiser et al. 2006 for a<br />
summary). In shallow regions with mobile sediments, the effects are generally difficult to detect <strong>and</strong><br />
recovery can be rapid (e.g., Jennings et al. 2005). Hard-bottom fauna is predicted to recover most<br />
slowly <strong>and</strong> Williams et al. (2010) concluded that hard-bottom fauna on seamounts did not show signs<br />
of recovery within 5–10 years on Australasian seamounts. Recovery rate is typically correlated with<br />
the spatial extent of a disturbance event (e.g., Hall 1994, Kaiser et al. 2003, see also Figure 7.4) <strong>and</strong><br />
the effects of some “catastrophic” natural disturbance events, such as large-scale marine mudslides,<br />
can be detected for hundreds of years, even for taxa thought to be robust to physical disturbance such<br />
as nematodes (Hinz et al. 2008).<br />
Recovery time<br />
10 y<br />
5y<br />
1y<br />
1 mo<br />
eider<br />
rays<br />
1 day macrofauna<br />
fishing<br />
hurricanes<br />
bait digging fishing anoxia<br />
Ice scour hurricanes<br />
Hydraulic dredging<br />
walrus grey whales<br />
10 mm² 1 m² 100 m² 108 10 mm² 1 m² 100 m² 10 m² 8 m²<br />
Patch size<br />
165<br />
tidal currents<br />
Figure 7.4: General relation between the spatial extent of disturbance events <strong>and</strong> the time taken to recover from such<br />
events in marine systems (after Kaiser et al. 2003). Blue dots signal human impacts, including fishing in habitats of<br />
different abilities to recover, <strong>and</strong> black dots signal natural disturbance.
AEBAR <strong>2012</strong>: Benthic impacts<br />
Rice (2006) summarised the findings of five major reviews of the effects of mobile bottom-contacting<br />
fishing gears on benthic species, communities, <strong>and</strong> habitats (available at: http://www.dfompo.gc.ca/CSAS/Csas/DocREC/2006/RES2006_057_e.pdf).<br />
In this “review of reviews” Rice (2006)<br />
summarised the findings of the multiple working groups that contributed to the reviews as follows:<br />
Rice’s (2006) conclusions about the effects on habitats of mobile bottom fishing gears were that<br />
they:<br />
• can damage or reduce structural biota (All reviews, strong evidence or support).<br />
• can damage or reduce habitat complexity (All reviews, variable evidence or support).<br />
• can reduce or remove major habitat features such as boulders (Some reviews, strong evidence<br />
or support).<br />
• can alter seafloor structure (Some reviews, conflicting evidence for benefits or harm).<br />
Other emergent conclusions on habitat effects included:<br />
• There is a gradient of effects, with greatest effects on hard, complex bottoms <strong>and</strong> least effect<br />
on s<strong>and</strong>y bottoms (All reviews, strong support, with qualifications).<br />
• There is a gradient of effects, with greatest effects on low energy environments <strong>and</strong> least<br />
(often negligible) effect on high-energy environments (All reviews, strong support).<br />
• Trawls <strong>and</strong> mobile dredges are the most damaging of the gears considered (Three of the<br />
reviews considered other gears; all drew this conclusion, often with qualifications).<br />
Mobile bottom gears affect benthic species <strong>and</strong> communities in that they:<br />
• can change the relative abundance of species (All reviews, strong evidence or support).<br />
• can decrease the abundance of long-lived species with low turnover rates (All reviews,<br />
moderate to strong evidence or support).<br />
• can increase the abundance of short-lived species with high turnover rates (All reviews,<br />
moderate to occasionally strong evidence or support).<br />
• affect populations of surface-living species more often <strong>and</strong> to greater extents than populations<br />
of burrowing species (All reviews, weak to occasionally strong evidence or support).<br />
• have lesser effects in high-energy or frequent natural disturbance environments than in low<br />
energy environments where natural disturbances are uncommon (Four reviews (the other did<br />
not address the factor), strong evidence or support).<br />
• affect populations of structurally fragile species more often <strong>and</strong> to greater extents than<br />
populations of “robust” species (All reviews, variable evidence <strong>and</strong> support).<br />
• Abundance of scavengers increases temporarily in areas where bottom trawls have been used<br />
(Three reviews, variable support or evidence, all argue for the effects being transient).<br />
• Rates of nutrient cycling or sedimentation are increased in areas where bottom trawls have<br />
been used (Two reviews, mixed views on magnitude of effects <strong>and</strong> conditions under which<br />
they occur).<br />
Considerations in the application or adoption of mitigation measures:<br />
• The effect of mobile fishing gears on benthic habitats <strong>and</strong> communities is not uniform. It<br />
depends on:<br />
o the features of the seafloor habitats, including the natural disturbance regime (All<br />
reviews, strong evidence or support);<br />
o the species present (All reviews, strong evidence or support, though not mentioned by<br />
NMFS panel);<br />
o the type of gear used <strong>and</strong> methods of deployment (All reviews, moderate to strong<br />
evidence support);<br />
o the history of human activities, particularly past fishing, in the area of concern (All<br />
reviews, strong evidence or support).<br />
166
AEBAR <strong>2012</strong>: Benthic impacts<br />
• Recovery time from trawl-induced disturbance can take from days to centuries, <strong>and</strong> depends<br />
on the same factors as listed above. (All reviews, strong evidence or support).<br />
• Given the above considerations, the effect of mobile bottom gears has a monotonic<br />
relationship with fishing effort, <strong>and</strong> the greatest effects are caused by the first few fishing<br />
events (All reviews, moderate to strong evidence or support).<br />
• Application of mitigation measures requires case specific analyses <strong>and</strong> planning; there are no<br />
universally appropriate fixes (Three reviews, moderate to strong evidence or support. The<br />
issue of implementing mitigation was not addressed in the FAO review. It was also stressed in<br />
the US National Academy of Sciences review <strong>and</strong> discussed in the ICES review that extensive<br />
local data are not necessary for such case-specific planning. The effects of mobile bottom<br />
gears on seafloor habitats <strong>and</strong> communities are consistent enough with well-established<br />
ecological theory, <strong>and</strong> across studies, that cautious extrapolation of information across sites<br />
is legitimate).<br />
Rice (2006) concluded “These overall conclusions on impacts <strong>and</strong> mitigation measures, <strong>and</strong><br />
recommendations for management action form a coherent <strong>and</strong> consistent whole. They are relevant to<br />
the general circumstances likely to be encountered in temperate, sub-boreal, <strong>and</strong> boreal seas on<br />
coastal shelves <strong>and</strong> slopes, <strong>and</strong> probably areas … beyond the continental shelves. They allow use of<br />
all relevant information that can be made available on a case by case basis, but also guide<br />
approaches to management in areas where there is little site-specific information.”<br />
Since Rice’s (2006) paper, Kaiser et al. (2006) published a meta-analysis of 101 separate<br />
manipulative experiments that confirms many of Rice’s findings. Shellfish dredges have the greatest<br />
effect of the various mobile bottom fishing gears, biogenic habitats are the most sensitive to such<br />
disturbance (especially for attached fauna on hard substrates) <strong>and</strong> unconsolidated, coarse sediments<br />
(e.g., s<strong>and</strong>s) are the least sensitive. Kaiser et al. (2006) concluded that recovery from disturbance<br />
events can take months to years, depending on the combination of fishing method <strong>and</strong> benthic habitat<br />
type. This meta-analysis of manipulative experiments was an important development, reinforcing the<br />
inferences drawn from multiple mensurative observations at much larger scale (“fisheries scale”) in<br />
New Zeal<strong>and</strong> (e.g., Thrush et al. 1998, Cryer et al. 2002) <strong>and</strong> overseas (e.g., Craeymeersch et al.<br />
2000, McConnaughey et al. 2000, Bradshaw et al. 2002, Blyth et al. 2004, Tillin et al. 2006, Hiddink<br />
et al. 2006). This is a powerful combination that implies substantial generality of the findings.<br />
The international literature is, therefore, clear that bottom (demersal) trawling <strong>and</strong> shellfish dredging<br />
are likely to have largely predictable <strong>and</strong> sometimes substantial effects on benthic community<br />
structure <strong>and</strong> function. However, the positive or negative consequences for ecosystem processes such<br />
as production had not been addressed until more recently (e.g., Jennings et al. 2001, Reiss et al. 2009,<br />
Hiddink et al. 2011). It has been mooted that frequent disturbance should lead to the dominance of<br />
smaller species with faster life histories <strong>and</strong> that, because smaller species are more productive than<br />
larger ones, system productivity <strong>and</strong> production should increase under trawling disturbance. However,<br />
when this proposition has been tested, it has not been supported by data in real fishing situations (e.g.,<br />
Jennings 2002, Hermsen et al. 2003, Reiss et al.2009) <strong>and</strong> where overall productivity has been<br />
assessed, it decreases with increasing trawling disturbance.<br />
For example, Veale et al. (2000) examined spatial patterns in the scallop fishing grounds in the Irish<br />
Sea <strong>and</strong> found that total abundance, biomass, <strong>and</strong> secondary production (including that of most<br />
individual taxa examined) decreased significantly with increasing fishing effort. Echinoids,<br />
cnidarians, prosobranch molluscs, <strong>and</strong> crustaceans contributed most to the differences. Jennings et al.<br />
(2001) showed that, in the North Sea, trawling led to significant decreases in infaunal biomass <strong>and</strong><br />
production in some areas even though production per unit biomass rose with increased trawling<br />
disturbance. The expected increase in relative production did not compensate for the loss of total<br />
production that resulted from the depletion of large-bodied species <strong>and</strong> individuals. Hermsen et al.<br />
(2003) found that mobile fishing gear disturbance had a conspicuous effect on benthic megafaunal<br />
production on Georges Bank, <strong>and</strong> cessation of such fishing led to a marked increase in benthic<br />
167
AEBAR <strong>2012</strong>: Benthic impacts<br />
megafaunal production, dominated by scallops <strong>and</strong> urchins. Hiddink et al. (2006) estimated that more<br />
than half of the southern North Sea was trawled sufficiently frequently to depress benthic biomass by<br />
10% or more, <strong>and</strong> that 27% was in a state where benthic production was depressed by 10% or more.<br />
They estimated that recovery from this situation would take 2.5–6 years or more once fishing effort<br />
had been eliminated. They further estimated that fishing reduced benthic biomass <strong>and</strong> production by<br />
56% <strong>and</strong> 21%, respectively, compared with an unfished situation. Reiss et al. (2009) found that,<br />
although sediment composition was the most important driver of benthic community structure in their<br />
North Sea study area, the intensity of fishing effort was also important <strong>and</strong> reductions in the<br />
secondary production of the infaunal community could be detected even within this heavily fished<br />
region.<br />
The types of models developed by Hiddink et al. (2006, 2011, but see also Ellis <strong>and</strong> Pantus 2001 <strong>and</strong><br />
Dichmont et al.(2008) can be used to assess the likely performance of different management<br />
approaches or levels of fishing intensity. Such management-strategy-evaluation (MSE) methods<br />
involve specifying management objectives, performance measures, a suite of alternative management<br />
strategies, <strong>and</strong> evaluating these alternatives using simulation (Sainsbury et al. 2000). For instance, the<br />
early study by Ellis <strong>and</strong> Pantus (2001) assessed the effect of trawling on marine benthic communities<br />
by combining an implementation of the spatial <strong>and</strong> temporal behaviour of the local fishing fleet with<br />
realistic ranges for the removal <strong>and</strong> recovery of benthic organisms. The model was used to compare<br />
the outcomes of two radically different management approaches, spatial closures <strong>and</strong> reductions in<br />
fishing effort. Lundquist et al. (2007, 2010) used a more sophisticated spatially explicit l<strong>and</strong>scape<br />
mosaic model with variable connectivity between patches to assess the implications of different<br />
spatial <strong>and</strong> temporal patterns of disturbance in the model l<strong>and</strong>scape. They found that the scale of the<br />
disturbance regime (which could be trawling or any other physical disturbance) <strong>and</strong> the dispersal<br />
processes interact, <strong>and</strong> that the scales of these processes greatly influenced changes in the structure<br />
<strong>and</strong> diversity of the model community, <strong>and</strong> that recovery across the mosaic depended strongly on<br />
dispersal. System stability also decreased as dispersal distance decreased.<br />
7.3. State of knowledge in New Zeal<strong>and</strong><br />
To underst<strong>and</strong> the effects of mobile bottom fishing methods on benthic habitats, it is necessary to<br />
have knowledge on<br />
• the distribution of such habitats,<br />
• the extent to which mobile bottom fishing methods are used in each habitat (the overlap),<br />
• the consequences of any such disturbance (potentially in conjunction with other disturbances<br />
or stressors), <strong>and</strong><br />
• the nature <strong>and</strong> speed of recovery from the disturbance.<br />
These components will be dealt with in turn.<br />
7.3.1. Distribution of Habitats<br />
Mapping of benthic habitats at the large scales inherent in fisheries management is expensive <strong>and</strong><br />
time-consuming so the New Zeal<strong>and</strong> government commissioned an environmental classification to<br />
provide a spatial framework that subdivided the TS <strong>and</strong> EEZ into areas having similar environmental<br />
<strong>and</strong> biological character. This Marine <strong>Environment</strong> Classification (MEC) was launched in 2005<br />
(Snelder et al. 2004, 2005, 2006) using available physical <strong>and</strong> chemical predictors, <strong>and</strong> because<br />
environmental pattern was thought a reasonable surrogate for biological pattern. The authors<br />
suggested that the MEC provided managers with a useful spatial framework for broad scale<br />
management, but cautioned that the full utility <strong>and</strong> limitations would become clear only as the MEC<br />
was applied to real issues. They described the MEC as a tool to organise data, analyses <strong>and</strong> ideas, <strong>and</strong><br />
as only one component of the information that would be employed in any analysis. The 20-class<br />
version (Figure 7.5, Table 7.1) has been the most widely cited, although additional classification<br />
168
AEBAR <strong>2012</strong>: Benthic impacts<br />
levels provide more detail that is significantly correlated with biological layers. The 2005 MEC was<br />
not optimised for any specific ecosystem component but was “tuned” against data for demersal fish,<br />
phytoplankton, <strong>and</strong> benthic invertebrates. It performed least well as a classification of benthic<br />
invertebrates <strong>and</strong>, at the 20-class level, grouped most of the Chatham Rise <strong>and</strong> Challenger Plateau into<br />
a single class. Although separation of these two areas was evident as the MEC was driven to larger<br />
numbers of classes, their inclusion in a single class in the 20-class classification was considered<br />
counter-intuitive because their productivity <strong>and</strong> fisheries are known to be very different.<br />
This disquiet with the predictions of the original MEC for benthic habitat classes led to the<br />
development of alternatives that might perform better for benthic systems. First of these was a<br />
classification optimised for demersal fish (Leathwick et al. 2006). Several variants of this<br />
classification all out-performed the original MEC for demersal fish, particularly at lower levels of<br />
classification detail <strong>and</strong> was adopted by the Ministry for the <strong>Environment</strong> for their indicators related<br />
to bottom trawling <strong>and</strong> their 2010 <strong>Environment</strong>al Snapshot where the trawl footprint is compared with<br />
putative habitats (Ministry for the <strong>Environment</strong> 2010, see also:<br />
http://www.mfe.govt.nz/environmental-reporting/report-cards/seabed-trawling/2010/index.html).<br />
Figure 7.5: The 20-class version of the 2005 general purpose Marine <strong>Environment</strong> Classification (MEC, from Snelder<br />
et al. 2005). The class numbers are nominal; for attributes of each class at this level, see Table 7.1.<br />
169
AEBAR <strong>2012</strong>: Benthic impacts<br />
Based partly on this experience, the Ministry of Fisheries commissioned a Benthic-Optimised Marine<br />
<strong>Environment</strong> Classification, BOMEC. Many more physical, chemical, <strong>and</strong> biological data layers were<br />
available for the development <strong>and</strong> tuning of this classification than for the 2005 MEC. Especially<br />
relevant for benthic invertebrates was the inclusion of a layer for sediment grain size (notably absent<br />
from the MEC). Generalised Dissimilarity Modelling (GDM, Ferrier et al. 2002, 2006, Leathwick et<br />
al. 2011) was used to define the classification because this approach is well suited to the sparse <strong>and</strong><br />
unevenly distributed biological data available. The BOMEC classes (Figure 7.6) were strongly driven<br />
by depth, temperature, <strong>and</strong> salinity into five major groups: inshore <strong>and</strong> shelf; upper slope; northern<br />
mid-depths; southern mid-depths; <strong>and</strong> deeper waters (generally beyond the fishing footprint, down to<br />
3000 m, the limit of the analysis). Waters deeper than 3000 m could be considered an additional class.<br />
Recent testing (Bowden et al. 2011) has indicated that the BOMEC out-performs the original MEC at<br />
predicting benthic habitat classes on <strong>and</strong> around the Chatham Rise, but that none of the available<br />
classifications is very good at predicting the abundance <strong>and</strong> composition of benthic invertebrates at<br />
the fine scale of the sampling undertaken (10s of metres to kilometres). This, in conjunction with the<br />
findings of Leathwick et al. (2006), reinforces the role of environmental classifications as broad-scale<br />
predictors of general patterns at broad scale (tens to hundres of kilometres) when more specific<br />
biological information is not available.<br />
Where broad scale classification methods are not applicable, other approaches have been taken. The<br />
trawl fisheries for orange roughy, oreos, <strong>and</strong> cardinalfish take place to a large extent on seamounts or<br />
other features (Clark <strong>and</strong> O’Driscoll 2003, O’Driscoll <strong>and</strong> Clark 2005). These features are often<br />
geographically small <strong>and</strong>, in common with other, localised habitats like vents, seeps, <strong>and</strong> sponge beds,<br />
do not appear on broad-scale habitat maps (e.g., at EEZ scale) <strong>and</strong> cannot realistically be predicted by<br />
broad-scale environmental classifications. Many features have been extensively mapped in recent<br />
years (e.g., Rowden et al. 2008), <strong>and</strong> seamount classifications based on biologically-referenced<br />
physical <strong>and</strong> environmental “proxies” have also been developed, in New Zeal<strong>and</strong> waters by Rowden<br />
et al. (2005), <strong>and</strong> globally by Clark et al. (2010a&b), <strong>and</strong> Davies <strong>and</strong> Guinotte (2011) developed a<br />
method of predicting the framework-forming (i.e, physically structuring) coldwater corals that are a<br />
focus for benthic biodiversity in deepwater systems. Work continues worldwide, including in New<br />
Zeal<strong>and</strong>, on the development of sampling, analytical, <strong>and</strong> modelling techniques to provide costeffective<br />
assessments of the distribution of marine habitats at a range of scales. MPI project<br />
DEE2010/06 has been commissioned to design a monitoring programme to assess trends in deepwater<br />
benthic communities using information from trawl surveys, observers, <strong>and</strong> directed sampling. MPI<br />
project DEE2010/05 has been commissioned to develop a suite of environmental indicators for<br />
deepwater fisheries using, to the extent possible, existing data collection processes. This is an area of<br />
rapid change in the science <strong>and</strong> better techniques <strong>and</strong> data sets for predicting <strong>and</strong> mapping marine<br />
benthic habitats are likely to become available in the short to medium term. MPI project<br />
BEN<strong>2012</strong>/01will use existing information <strong>and</strong> classifications to describe the distribution of benthic<br />
habitats in the coastal zone. NIWA has a MBIE-funded project “Predicting the occurrence of<br />
vulnerable marine ecosystems for planning spatial management in the South Pacific region” in<br />
collaboration with Victoria University of Wellington <strong>and</strong> the Marine Conservation Institute (USA).<br />
The research will develop a model to predict the locations of VMEs to inform New Zeal<strong>and</strong> <strong>and</strong> South<br />
Pacific Regional Fisheries Management Organisation (SPRFMO) initiatives on spatial management in<br />
the South Pacific region. There may be applications within the New Zeal<strong>and</strong> EEZ.<br />
170
AEBAR <strong>2012</strong>: Benthic impacts<br />
Table 7.1: Average values for each of the eight defining environmental variables in each class of the 20-class level of<br />
the MEC classification. After Snelder et al. 2005.<br />
Figure 7.6: Map of the distribution of Benthic Optimised Marine <strong>Environment</strong> Classification (BOMEC) classes<br />
defined by multivariate classification of environmental data transformed using results from GDM analyses of<br />
relationships between environment <strong>and</strong> species turnover averaged across eight taxonomic groups of benthic species.<br />
From Leathwick et al. 2010.<br />
171
7.3.2. Distribution of Fishing<br />
AEBAR <strong>2012</strong>: Benthic impacts<br />
Since 1989/90, mobile bottom fishing has been reported on one of three st<strong>and</strong>ardised reporting forms<br />
(Table 7.2). Trawl Catch Effort <strong>and</strong> Processing Returns (TCEPRs) contain detailed spatial <strong>and</strong> other<br />
information for each trawl tow, whereas Catch Effort <strong>and</strong> L<strong>and</strong>ing Returns (CELRs) include only<br />
summarised information for each day’s fishing, with very limited spatial resolution. Since 2007/08,<br />
Trawl Catch <strong>and</strong> Effort Returns (TCERs) have been available for smaller, predominantly inshore<br />
trawlers. These include spatial <strong>and</strong> other information for each trawl tow but in less detail than on<br />
TCEPRs. Between 1989/90 <strong>and</strong> 2004/05, only about 25% of all mobile bottom fishing events were<br />
reported on TCEPRs. Another 25% were bottom trawls reported on CELRs, <strong>and</strong> the remaining 50%<br />
were dredge tows for shellfish reported on CELRs. The distribution of trawling reported on CELRs is<br />
not the same as that reported on TCEPRs (Figure 7.8); the smaller trawlers using CELRs are much<br />
more likely than the larger boats to fish close to the coast <strong>and</strong> target inshore species such as flatfish,<br />
red cod, tarakihi, <strong>and</strong> red gurnard (collectively 73% of all trawl tows reported on CELRs). MPI<br />
project BEN<strong>2012</strong>/01will update the work in BEN2006/01 producing maps of swept area <strong>and</strong> footprint<br />
for more recent years.<br />
Table 7.2: Attributes, usage, <strong>and</strong> resolution of spatial reporting required on Trawl Catch Effort <strong>and</strong> Processing<br />
Returns (TCEPRs) Trawl Catch <strong>and</strong> Effort Returns (TCERs) <strong>and</strong> Catch Effort <strong>and</strong> L<strong>and</strong>ing Returns (CELRs).<br />
Year of introduction<br />
Trawl catch <strong>and</strong> effort reporting forms<br />
TCEPR TCER CELR<br />
1988/89 2007/08 1988/89<br />
Vessels using All trawlers >28 m<br />
Other vessels as directed<br />
Other vessels optional<br />
Trawl tow reporting Tow by tow, start <strong>and</strong> finish<br />
locations, speed, depth, gear<br />
All trawlers 6–28 m unless<br />
exempted<br />
Tow by tow, start location,<br />
speed, depth, gear<br />
172<br />
Trawlers not using TCER or<br />
TCEPR<br />
Shellfish dredgers<br />
Daily summary, number of<br />
tows, effort, gear<br />
Spatial resolution 1 minute (lat/long) 1 minute (lat/long) Statistical reporting area<br />
(optionally lat/long)<br />
Baird et al. (2002) <strong>and</strong> Baird et al. (2001) described the distribution <strong>and</strong> frequency of reported fishing<br />
by mobile bottom fishing gear (dredge, Danish seine, bottom trawl, bottom pair trawl, <strong>and</strong> mid-water<br />
trawl in contact with the bottom) in New Zeal<strong>and</strong>’s TS <strong>and</strong> EEZ during the 1990s <strong>and</strong> up to 2004/05,<br />
respectively. They showed that fishing was highly heterogeneous (spatially), but had considerable<br />
consistency among years; sites that were fished heavily in one year were likely to be fished heavily in<br />
other years <strong>and</strong> vice versa. A similar but more detailed analysis was conducted for the Chatham Rise<br />
<strong>and</strong> SubAntarctic areas by Baird et al. (2006). Tows reported on TCEPRs were included in the main<br />
spatial analysis but some additional analysis was possible using tows reported on CELRs. Until<br />
2006/07, many inshore vessels used CELRs <strong>and</strong> these comprised a substantial proportion of reported<br />
trawling, even for some “deepwater” species. For instance, Cryer <strong>and</strong> Hartill (2002) estimated that, in<br />
the Bay of Plenty, 78%, 75%, <strong>and</strong> 39% of trawl tows for tarakihi, gemfish, <strong>and</strong> hoki, respectively,<br />
were reported on CELR forms in the 1990s. Since 2007/08, almost all trawling effort has been<br />
reported on TCEPR or TCER forms.<br />
Baird et al. (2011) calculated three annual measures of fishing effort: the number of tows, the<br />
aggregate swept area (using assumed door spreads, see Figure 7.7), <strong>and</strong> the coverage (“footprint”) of<br />
the total trawl contact. Trawls were represented spatially as tracklines between the reported start <strong>and</strong>
AEBAR <strong>2012</strong>: Benthic impacts<br />
finish positions buffered by the assumed door spread to generate trawl polygons. The aggregate swept<br />
area for a year is the sum of the areas of the polygons <strong>and</strong> the “footprint” is the estimated area of the<br />
seabed that is covered by the polygons overlaid. The estimated swept areas <strong>and</strong> footprint do not<br />
account for any modification that might occur alongside the trawl path as represented by the swept<br />
area polygon (e.g., by suspended sediments transported by currents away from the trawl track). Baird<br />
et al. (2011) produced maps of the aggregate swept area by year for each of the 22 main target species<br />
or species groups, <strong>and</strong> various tables <strong>and</strong> figures describing trends. The annual number of trawls<br />
peaked in 1997–98 at 78 610 tows (swept area ~ 180 450 km 2 ). In 2007/08, fewer than 55 000 tows<br />
were reported on TCEPRs (~ 130 800 km 2 )<br />
Figure 7.7: Map from Baird et al. 2011 showing the intensity of bottom-contacting trawling effort reported on<br />
TCEPR forms 1989–90 to 2004–05. The colour scale indicates the aggregate swept area estimated by Baird et al. for<br />
each 5 x 5 km cell, all target species combined (e.g., the 36 most intensively fished 25 km 2 cells all had an aggregate<br />
swept area of over 2290 km 2 over 16 years, which translates to the seabed in those cells being swept by some part of a<br />
trawl 92 times in 16 years, or an average of 5.8 or more times each year). Updates for deepwater trawl fisheries are<br />
expected in 2013.<br />
173
AEBAR <strong>2012</strong>: Benthic impacts<br />
Baird et al. (2011) used reported tows on small topographic features that are a focus for orange<br />
roughy <strong>and</strong> cardinalfish fisheries by defining polygons for these tows as radii around the reported start<br />
position with the area swept estimated from the reported duration <strong>and</strong> speed of the tow. These short<br />
tows do not appear to contribute substantially to broad-scale plots like Figure 7.7, yet can represent<br />
intense fishing effort on particular, small seamount features (e.g. Rowden et al. 2005, O’Driscoll <strong>and</strong><br />
Clark 2005).<br />
Figure 7.8: Broad-scale distribution from Baird et al. 2011 of bottom trawl effort reported on CELRs (left) <strong>and</strong> on<br />
CELRs <strong>and</strong> TCEPRs combined (right), for all fishing years 1989–90 to 2004–05. Updates for deepwater trawl<br />
fisheries (but not inshore fisheries reporting on TCER) are expected in 2013.<br />
After the peak of over 140 000 reported trawl tows in 1996/97 <strong>and</strong> 1997/98 (Figure 7.9) when slightly<br />
over half of all tows were reported on TCEPRs, overall trawling effort declined to less than 100 000<br />
tows per year by 2006/07. The reported number of trawl tows has remained relatively stable at about<br />
174
AEBAR <strong>2012</strong>: Benthic impacts<br />
85–90 000 tows per year, only about 44% of which is reported on TCEPRs (virtually all other tows<br />
are reported on TCERs)<br />
Dredging for shellfish (oysters <strong>and</strong> scallops) is conducted in a number of specific areas that have<br />
separate, smaller statistical reporting areas (Figure 7.10). Over the 16-year dataset, there were almost<br />
1.5 million scallop dredge tows in the four main scallop fisheries <strong>and</strong> over 0.6 million oyster dredge<br />
tows in the two dredge oyster fisheries . These data are collected on CELRs, usually at the spatial<br />
scale of a scallop or oyster fishery area <strong>and</strong> the data have been summarised as the number of dredge<br />
tows. No estimates of the area swept by these dredges have been made, but the number of reported<br />
tows has declined markedly since the early 1990s (Figure 7.11).<br />
Total reported trawls<br />
160,000<br />
140,000<br />
120,000<br />
100,000<br />
80,000<br />
60,000<br />
40,000<br />
20,000<br />
-<br />
1990<br />
1991<br />
1992<br />
1993<br />
1994<br />
1995<br />
1996<br />
1997<br />
1998<br />
1999<br />
2000<br />
2001<br />
2002<br />
2003<br />
2004<br />
2005<br />
2006<br />
2007<br />
2008<br />
2009<br />
2010<br />
2011<br />
<strong>2012</strong><br />
175<br />
Fishing year<br />
TCER<br />
CELR<br />
TCEPR<br />
Figure 7.9: The number of trawl tows reported on Trawl Catch Effort <strong>and</strong> Processing Returns (TCEPR), Catch<br />
Effort <strong>and</strong> L<strong>and</strong>ing Returns (CELR) <strong>and</strong> Trawl Catch <strong>and</strong> Effort Return (TCER) between the 1989/90 <strong>and</strong> 2007/08<br />
fishing years. Data for the 2011/12 year may be incomplete.<br />
Our knowledge of the distribution of mobile bottom fishing effort within our TS <strong>and</strong> EEZ is, by<br />
international st<strong>and</strong>ards, very good; since 2007/08 we have had tow-by-tow reporting of almost all<br />
trawling with a spatial precision of about 1 nautical mile. The distribution of dredge tows for shellfish<br />
is not reported with such high precision, but records kept by fishers in industry logbooks are often<br />
much more detailed than the Ministry for Primary Industries st<strong>and</strong>ard returns, <strong>and</strong> have sometimes<br />
been used to support spatial analyses that would not have been possible using the st<strong>and</strong>ard returns<br />
(e.g., Tuck et al. 2006 for project ZBD2005/15 on the Corom<strong>and</strong>el scallop fishery <strong>and</strong> Michael et al.<br />
2006 for project ZBD2005/04 on the Foveaux Strait oyster fishery). These studies indicate the value<br />
of records with higher spatial precision.
AEBAR <strong>2012</strong>: Benthic impacts<br />
Figure 7.10: Maps taken from Baird et al. 2011 of statistical reporting areas for the main oyster <strong>and</strong> scallop dredge<br />
fisheries (scales differ). Note that these reporting areas are generally much smaller than the st<strong>and</strong>ard statistical<br />
reporting areas used for most finfish reporting.<br />
176
Total reported dredge tows<br />
200,000<br />
180,000<br />
160,000<br />
140,000<br />
120,000<br />
100,000<br />
80,000<br />
60,000<br />
40,000<br />
20,000<br />
0<br />
AEBAR <strong>2012</strong>: Benthic impacts<br />
1990<br />
1991<br />
1992<br />
1993<br />
1994<br />
1995<br />
1996<br />
1997<br />
1998<br />
1999<br />
2000<br />
2001<br />
2002<br />
2003<br />
2004<br />
2005<br />
2006<br />
2007<br />
2008<br />
2009<br />
2010<br />
2011<br />
<strong>2012</strong><br />
177<br />
Fishing Year<br />
oysters<br />
scallops<br />
Figure 7.11: The number of dredge tows for scallop or oysters reported on Catch Effort <strong>and</strong> L<strong>and</strong>ing Returns<br />
(CELR) between the 1989/90 <strong>and</strong> 2007/08 fishing years (data from Baird et al. 2011 <strong>and</strong> MPI databases). Data for the<br />
2011/12 year may be incomplete.<br />
7.3.3. Overlap of Fishing <strong>and</strong> Predicted Habitat Classes<br />
Baird <strong>and</strong> Wood (2010, project BEN200601) overlaid the 16-year trawl footprint up to 2004-05 on the<br />
15-class BOMEC to estimate the proportion of each class that had been trawled (<strong>and</strong> reported on<br />
TCEPRs). They found that the size of the footprint <strong>and</strong> the proportion of each class trawled varied<br />
substantially between habitat classes (Figure 7.12, Table 7.3). Class O is the largest BOMEC class but<br />
has almost no reported fishing effort. Conversely, class I is one of the smaller classes but has a larger<br />
trawl footprint that overlaps about 70% of the total class area. Two contrasting classes, together with<br />
their trawl footprints, are shown in Figure 7.13. The cumulative trawl footprint from Baird <strong>and</strong><br />
Wood’s analysis overlaps about 8% of the 4.1 million km 2 of seafloor within the New Zeal<strong>and</strong> EEZ<br />
boundary (i.e., including the Territorial Sea). However, this overlap <strong>and</strong> that for some individual<br />
BOMEC classes (particularly coastal classes A–E) will be underestimated because of the omission of<br />
CELR data from these analyses. This analysis is being updated for offshore (middle depth <strong>and</strong><br />
deepwater) trawl fisheries under project DAE2010/04, Monitoring the trawl footprint for deepwater<br />
fisheries, <strong>and</strong> the results are expected to be available in early 2013. MPI project BEN<strong>2012</strong>/01, Spatial<br />
overlap of mobile bottom fishing methods <strong>and</strong> coastal benthic habitats, will update the work in<br />
BEN2006/01, particularly focussing on the overlap between fishing <strong>and</strong> habitats in the coastal zone.
Area (1000 sq.km)<br />
Area (1000 sq.km)<br />
Percentage<br />
AEBAR <strong>2012</strong>: Benthic impacts<br />
1000<br />
800<br />
600<br />
400<br />
200<br />
0<br />
100<br />
80<br />
60<br />
40<br />
20<br />
0<br />
100<br />
90<br />
80<br />
70<br />
60<br />
50<br />
40<br />
30<br />
20<br />
10<br />
0<br />
Area of BOMEC Classes<br />
A B C D E F G H I J K L M N O<br />
BOMEC Cl a s s<br />
Fishing footprint area<br />
A B C D E F G H I J K L M N O<br />
BOMEC Cl a s s<br />
Footprint percentage<br />
A B C D E F G H I J K L M N O<br />
BOMEC Cl a s s<br />
Figure 7.12: Plots from Baird <strong>and</strong> Wood (2010) of the areas of each BOMEC Class (top), the fishing footprint up to<br />
2004/05 shown in Figure 7.8 (centre), <strong>and</strong> percentage of each BOMEC Class area covered by the fishing footprint<br />
(bottom).<br />
Table 7.3: Estimated area of each BOMEC class (within the outer boundary of the EEZ), the minimum <strong>and</strong><br />
maximum values for the trawl footprint in each, <strong>and</strong> cumulative footprint over the 16 years studied by Baird <strong>and</strong><br />
Wood (2010).<br />
BOMEC class Area (km 2 ) Min. annual footprint<br />
area (km 2 )<br />
178<br />
Max. annual<br />
footprint area (km 2 )<br />
Cumulative (16 yr)<br />
proportion overlapped<br />
A* 27 557 121 4 026 0.42<br />
B* 12 420 40 484 0.19<br />
C* 89 710 4 271 11 374 0.58<br />
D* 27 268 377 1 602 0.30<br />
E* 60 990 4 046 7 108 0.40<br />
F 38 608 517 1 391 0.13<br />
G 6 342 132 833 0.34<br />
H 138 550 9 583 20 344 0.45<br />
I 52 224 5 511 18 016 0.70<br />
J 311 361 10 469 15 975 0.18<br />
K 1 290 - 2 0.01<br />
L 198 577 4 238 13 599 0.24<br />
M 233 825 895 4 390 0.06<br />
N 493 034 601 1 054 0.02<br />
O 935 315 2 28 0.00<br />
TS & EEZ 4 115 806 46 300 90 940 0.08
AEBAR <strong>2012</strong>: Benthic impacts<br />
Figure 7.13: Maps from Baird <strong>and</strong> Wood (2010) showing BOMEC classes I (left) <strong>and</strong> M (right) overlaid with the<br />
footprint of trawls on or near the seafloor reported on TCEPR forms to 2004–05 for each 25-km 2 cell.<br />
7.3.4. Studies of the Effects of Mobile Bottom Fishing Methods in<br />
New Zeal<strong>and</strong><br />
The widespread nature of bottom trawling suggests that fishing is the main anthropogenic disturbance<br />
agent to the seabed throughout most of New Zeal<strong>and</strong>’s EEZ. Wind waves are certainly very<br />
widespread, but both field studies <strong>and</strong> modelling (Green et al. 1995) suggest that erosion of the<br />
seabed deeper than 50 m by waves occurs only very rarely in the New Zeal<strong>and</strong> EEZ. Despite their<br />
widespread distribution at the surface, therefore, wind-waves are not a dominant feature of the longterm<br />
disturbance regime throughout most of the EEZ. In some places, especially in the coastal zone<br />
<strong>and</strong> in areas close to headl<strong>and</strong>s, straits, or isl<strong>and</strong>s, currents <strong>and</strong> tides may dominate the natural<br />
disturbance regime <strong>and</strong> a community adapted to this type of disturbance will have developed.<br />
However, over most of the EEZ between about 100 <strong>and</strong> 1000 m depth, especially in areas where there<br />
are few strong currents, fishing is probably the major broad-scale disturbance agent.<br />
Several studies have been conducted since 1995 in New Zeal<strong>and</strong>, focussing on the effects of various<br />
dredge <strong>and</strong> trawl fishing methods on a variety of different habitats in several geographical locations<br />
(Table 7.4). Despite the diversity of these studies, <strong>and</strong> their different depths, locations, <strong>and</strong> habitat<br />
types, the results are consistent with the global literature on the effects of mobile bottom fishing gear<br />
on benthic communities. Generally, there are decreases in the density <strong>and</strong> diversity of benthic<br />
communities <strong>and</strong>, especially, the density of large, structure-forming epifauna, <strong>and</strong> long-lived<br />
organisms along gradients of increasing fishing intensity. Large, emergent epifauna like sponges <strong>and</strong><br />
framework-forming corals that provide structured habitat for other fauna are particularly noted as<br />
being susceptible to disturbance by mobile bottom fishing methods (Cranfield et al. 1999, 2001, 2003,<br />
Cryer et al. 2000), especially on hard (non sedimentary) seabeds (Clark & Rowden 2009, Clark et al.<br />
2010a&b, Williams et al. 2011). Even though large emergent fauna seem most susceptible, however,<br />
effects have also been shown in the s<strong>and</strong>y or silty sedimentary systems usually considered to be most<br />
resistant to disturbance (Thrush et al. 1995, 1998, Cryer et al. 2002). Also typical of the international<br />
literature is a substantial variation in the extent to which individual New Zeal<strong>and</strong> studies have shown<br />
clear effects. For instance, in Foveaux Strait, Cranfield et al. (1999, 2001, 2003) inferred substantial<br />
179
AEBAR <strong>2012</strong>: Benthic impacts<br />
changes in the benthic system caused by over 130 years of oyster dredging, but Michael et al. (2006)<br />
did not support such conclusions in the same system. Subsequent review of these studies found much<br />
common ground but no overall consensus on the long-term effects of dredging on the benthic<br />
community of the strait.<br />
These studies have focussed predominantly on changes in patterns in biodiversity associated with<br />
trawling <strong>and</strong>/or dredging <strong>and</strong> less work has been done to assess changes in ecological process or to<br />
estimate the rate of recovery from fishing. Projects that have started on recovery rates are focussed on<br />
relatively few habitats <strong>and</strong> primarily those that are known to be sensitive to physical disturbance,<br />
including by trawling or dredging (e.g., seamounts, project ENV2005/16, <strong>and</strong> areas of high current<br />
<strong>and</strong> natural biogenic structure, projects ENV9805, ENV2005/23 <strong>and</strong> BEN2009/02). Thus, the<br />
underst<strong>and</strong>ing of the consequences of fishing (or ceasing fishing) for sustainability, biodiversity,<br />
ecological integrity <strong>and</strong> resilience, <strong>and</strong> fish stock productivity in the wide variety of New Zeal<strong>and</strong>’s<br />
benthic habitats remains incomplete. Reducing this uncertainty would allow the testing of the utility<br />
<strong>and</strong> likely long-term productivity of a variety of management strategies, <strong>and</strong> enable a move towards a<br />
regime that maximises value to the nation consistent with Fisheries 2030.<br />
Table 7.4: Summary of studies of the effects of bottom trawling <strong>and</strong> dredging in New Zeal<strong>and</strong> waters.<br />
Location Approach Key findings References<br />
Mercury<br />
Isl<strong>and</strong>s s<strong>and</strong>y<br />
sediments.<br />
Scallop dredge<br />
Hauraki Gulf<br />
various soft<br />
sediments.<br />
Bottom trawl &<br />
scallop dredge.<br />
Bay of Plenty<br />
continental<br />
slope. Scampi<br />
<strong>and</strong> other<br />
bottom trawls.<br />
Foveaux Strait,<br />
sedimentary &<br />
biogenic reef.<br />
Oyster dredge.<br />
Spirits Bay,<br />
sedimentary &<br />
Experimental Density of common macrofauna at both sites decreased as a result<br />
of dredging at two contrasting sites; some populations were still<br />
significantly different from reference plots after 3 months.<br />
Observational,<br />
gradient<br />
analysis<br />
Observational,<br />
multiple<br />
gradient<br />
analyses<br />
Observational,<br />
various<br />
Observational,<br />
gradient<br />
Decreases in the density of echinoderms, longlived taxa, epifauna,<br />
especially large species, the total number of species <strong>and</strong><br />
individuals, <strong>and</strong> the Shannon-Weiner diversity index with<br />
increasing fishing pressure (including trawl <strong>and</strong> scallop dredge).<br />
Increases in the density of deposit feeders, small opportunists, <strong>and</strong><br />
the ratio of small to large heart urchins.<br />
Depth <strong>and</strong> historical fishing activity (especially for scampi) at a site<br />
were the key drivers of community structure for large epifauna.<br />
The Shannon-Weiner diversity index generally decreased with<br />
increasing fishing activity <strong>and</strong> increased with depth. Many species<br />
were negatively correlated with fishing activity; fewer were<br />
positively correlated (including the target species, scampi).<br />
Interpretations of the authors differ. Cranfield et al’s papers<br />
concluded that dredging biogenic reefs for their oysters damages<br />
their structure, removes epifauna, <strong>and</strong> exposes associated sediments<br />
to resuspension such that, by 1998, none of the original bryozoan<br />
reefs remained.<br />
Michael et al. concluded that there are no experimental estimates of<br />
the effect of dredging in the strait or on the cumulative effects of<br />
fishing or regeneration, that environmental drivers should be<br />
included in any assessment, <strong>and</strong> that the previous conclusions<br />
cannot be supported.<br />
The authors agree that biogenic bycatch in the fishery has declined<br />
over time in regularly-fished areas, that there may have been a<br />
reduction in biogenic reefs in the strait since the 1970s, <strong>and</strong> that<br />
simple biogenic reefs appear able to regenerate in areas that are no<br />
longer fished (dominated by byssally attached mussels or reefbuilding<br />
bryozoans). There is no consensus that reefs in Foveaux<br />
Strait were (or were not) extensive or dominated by the bryozoan<br />
Cinctopora.<br />
In 1999, depth was found to be the most important explanatory<br />
variable for benthic community composition but a coarse index of<br />
180<br />
Thrush et al.<br />
1995<br />
Thrush et al.<br />
1998<br />
Cryer et al.<br />
1999<br />
Cryer et al.<br />
2002<br />
Cranfield et al.<br />
1999, 2001,<br />
2003<br />
Michael et al.<br />
2006<br />
Cryer et al.<br />
2000
iogenic areas.<br />
Scallop dredge.<br />
Tasman &<br />
Golden Bays.<br />
Bottom trawl,<br />
scallop &<br />
oyster dredge<br />
Graveyard<br />
complex<br />
“seamounts”,<br />
northern<br />
Chatham Rise.<br />
Orange roughy<br />
bottom trawl.<br />
AEBAR <strong>2012</strong>: Benthic impacts<br />
analysis dredge fishing intensity was more important than substrate type for<br />
many taxonomic groups. Sponges seemed most affected by scallop<br />
dredging, <strong>and</strong> samples taken in an area once rich in sponges had<br />
few species in 1999. This area had probably been intensively<br />
dredged for scallops. Analysis of historical samples of scallop<br />
survey bycatch showed a marked decline in sponge species<br />
richness between 1996 <strong>and</strong> 1998.<br />
In 2006, significant differences were identified among areas within<br />
which fishing was or was not allowed. Species contributing to these<br />
differences included those identified as being most vulnerable to<br />
the effects of fishing. These differences could not be attributed<br />
specifically to fishing because of interactions with environmental<br />
gradients <strong>and</strong> uncertainty over the history of fishing. No significant<br />
change between 1999 <strong>and</strong> 2006 was identified.<br />
In 2010, analysis of both epifaunal <strong>and</strong> infaunal community data<br />
identified change since 2006, <strong>and</strong> significant depth, habitat <strong>and</strong><br />
fishing effects. The combined fishing effects accounted for 15 –<br />
30% of the total variance (about half of the explained variance).<br />
Individual species responses to fishing were examined, <strong>and</strong> those<br />
identified as most sensitive to fishing in this analysis had<br />
previously been categorised as sensitive on the basis of life history<br />
characteristics within the 2006 study.<br />
Observational,<br />
gradient<br />
analysis<br />
Observational,<br />
multiple<br />
analyses<br />
A gradient analysis was adopted to investigate the importance of<br />
the different factors affecting epifaunal <strong>and</strong> infaunal communities<br />
in Tasman <strong>and</strong> Golden Bays. Fishing was consistently identified as<br />
an important factor in explaining variance in community structure,<br />
with recent trawl <strong>and</strong> scallop effort being more important than<br />
other fishing terms. Important environmental variables included<br />
maximum current speed, maximum wave height, depth, % mud,<br />
<strong>and</strong> salinity. Fishing accounted for 31–50% of the explained<br />
variance in epifaunal <strong>and</strong> infaunal community composition, species<br />
richness, <strong>and</strong> Shannon-Weiner diversity. Overall, models explained<br />
30–54% of variance, <strong>and</strong> additional spatial patterns identified in the<br />
analysis explained a further 5–16% of variance.<br />
From surveys in 2001 <strong>and</strong> 2006, substrate diversity <strong>and</strong> the amount<br />
of intact coral matrix were lower on fished seamounts. Conversely,<br />
the proportions of bedrock <strong>and</strong> coral rubble were higher. No<br />
change in the megafaunal assemblage consistent with recovery<br />
over 5–10 years on seamounts where trawling had ceased. Some<br />
taxa had significantly higher abundance in later surveys. This may<br />
be because of their resistance to the direct effects of trawling, their<br />
protection in natural refuges, or because these taxa represent the<br />
earliest stages of seamount recolonisation.<br />
181<br />
Tuck et al.<br />
2009<br />
Tuck & Hewitt<br />
<strong>2012</strong><br />
Tuck et al.<br />
2011<br />
Clark et al.<br />
2010a&b<br />
Williams et al.<br />
2011<br />
An expert based assessment of 65 threats to 62 marine habitats from saltmarsh to the abyss<br />
(MacDiarmid et al. <strong>2012</strong>) concluded that only 7 of the 20 most important threats to New Zeal<strong>and</strong><br />
marine habitats were directly related to human activities within the marine environment. The most<br />
important of these was bottom trawling (ranked third equal most important), but invasive species,<br />
coastal engineering, <strong>and</strong> aquaculture were also ranked highly. However, the two top threats, five of<br />
the top six threats, <strong>and</strong> over half of the 26 top threats stemmed largely or completely from human<br />
activities external to the marine environment (the most important being ocean acidification, rising sea<br />
temperatures, <strong>and</strong> sedimentation resulting from changes in l<strong>and</strong>-use). The assessment suggested that<br />
the number <strong>and</strong> severity of threats to marine habitats declines with depth, particularly deeper than<br />
about 50 m. Shallow coastal habitats face up to 52 non-trivial threats whereas most deep water<br />
habitats are threatened by fewer than five. Coastal <strong>and</strong> estuarine reef, s<strong>and</strong>, <strong>and</strong> mud habitats were<br />
considered to be the most threatened habitats whereas slope <strong>and</strong> deep water habitats were among the<br />
least threatened.
7.3.5. Current research<br />
AEBAR <strong>2012</strong>: Benthic impacts<br />
Project BEN2007/01 is a 5-year project to assess the effects of fishing on soft sediment habitat, fauna,<br />
<strong>and</strong> processes across the range of habitat types in the TS <strong>and</strong> EEZ. Sampling <strong>and</strong> analytical strategies<br />
for such broad-scale assessments have been developed <strong>and</strong> the project has moved into a phase of data<br />
collection, collation, <strong>and</strong> analysis. Two field-based “case studies” in different habitat types will be<br />
assessed, <strong>and</strong> a variety of existing information will be drawn together <strong>and</strong> analysed to provide a TS &<br />
EEZ-wide perspective. The focus of this study is on the relative sensitivities of different habitats in<br />
the TS <strong>and</strong> EEZ to disturbance by mobile bottom fishing methods.<br />
Project DAE2010/04 provides for an annual assessment of the “footprint” of middle depth <strong>and</strong><br />
deepwater trawl fisheries, including the overlap of the footprint with various depth ranges <strong>and</strong> habitat<br />
classes. Inshore fisheries, including shellfish dredge fisheries, are not covered under this project, so<br />
the focus is on offshore fisheries <strong>and</strong> habitats.<br />
Project DEE2010/05 provides for the development of a suite of ecosystem <strong>and</strong> environmental<br />
indicators for deepwater trawl fisheries. The focus of this study is on developing a cost-effective<br />
approach to monitoring ecosystem status (e.g., providing a mechanism to detect ocean climatic<br />
changes or regime shifts that could affect fisheries production) or the potential effects of deepwater<br />
trawl fisheries (such as changes to benthic invertebrate diversity). The suite could include information<br />
that may stem from project DEE2010/06 which provides for a desk-top assessment of the extent to<br />
which information can be collected cost-effectively on trends in benthic systems inside <strong>and</strong> outside of<br />
the trawled areas.<br />
Project BEN<strong>2012</strong>/01will use existing data <strong>and</strong> classifications to describe the distribution of benthic<br />
habitats, estimate the sensitivity to fishing disturbance of the species within these habitats, <strong>and</strong> then<br />
describe the spatial pattern of fishing using bottom trawls, Danish seine <strong>and</strong> dredges, to assess the<br />
overlap with each habitat class.<br />
Several MBIE-funded projects also have strong linkages with MPI research on benthic impacts. These<br />
include “Vulnerable Deep-Sea Communities” (CO1X0906) which is analysing the time series of data<br />
from the “Graveyard seamounts” (surveys in 2001, 2006, 2009, all carried out with support from<br />
MFish or the cross-departmental Oceans Survey 20/20 programme), as well as evaluating the relative<br />
vulnerability of benthic communities in several deep-sea habitats (e.g., seamounts, canyons,<br />
continental slope, hydrothermal vents, seeps) <strong>and</strong> their risk from bottom trawling.<br />
182
7.4. Indicators <strong>and</strong> trends<br />
<strong>Annual</strong> number<br />
of tows<br />
Trend in<br />
number of tows<br />
<strong>Annual</strong> <strong>and</strong><br />
cumulative (16<br />
year) overlap of<br />
BOMEC habitat<br />
classes up to<br />
2004/05<br />
This analysis<br />
will be updated<br />
for deepwater<br />
trawl fisheries<br />
in 2013<br />
AEBAR <strong>2012</strong>: Benthic impacts<br />
2010/11 fishing year:<br />
86 024 trawl tows<br />
35 150 shellfish dredge tows<br />
Trawl effort stable, dredge effort decreasing:<br />
BOMEC<br />
class<br />
Total reported dredge tows<br />
Total reported trawls<br />
160,000<br />
140,000<br />
120,000<br />
100,000<br />
80,000<br />
60,000<br />
40,000<br />
20,000<br />
-<br />
200,000<br />
180,000<br />
160,000<br />
140,000<br />
120,000<br />
100,000<br />
80,000<br />
60,000<br />
40,000<br />
20,000<br />
Area<br />
(km 2 )<br />
0<br />
1990<br />
1991<br />
1992<br />
1993<br />
1994<br />
1995<br />
1996<br />
1997<br />
1998<br />
1999<br />
2000<br />
2001<br />
2002<br />
2003<br />
2004<br />
2005<br />
2006<br />
2007<br />
2008<br />
2009<br />
2010<br />
2011<br />
<strong>2012</strong><br />
183<br />
Fishing year<br />
TCER<br />
CELR<br />
TCEPR<br />
1990<br />
1991<br />
1992<br />
1993<br />
1994<br />
1995<br />
1996<br />
1997<br />
1998<br />
1999<br />
2000<br />
2001<br />
2002<br />
2003<br />
2004<br />
2005<br />
2006<br />
2007<br />
2008<br />
2009<br />
2010<br />
2011<br />
<strong>2012</strong><br />
Min. annual<br />
footprint area<br />
(km 2 )<br />
Fishing Year<br />
Max. annual<br />
footprint area<br />
(km 2 )<br />
oysters<br />
scallops<br />
Cumulative (16 yr)<br />
proportion<br />
overlapped<br />
A* 27 557 121 4 026 0.42<br />
B* 12 420 40 484 0.19<br />
C* 89 710 4 271 11 374 0.58<br />
D* 27 268 377 1 602 0.30<br />
E* 60 990 4 046 7 108 0.40<br />
F 38 608 517 1 391 0.13<br />
G 6 342 132 833 0.34<br />
H 138 550 9 583 20 344 0.45<br />
I 52 224 5 511 18 016 0.70<br />
J 311 361 10 469 15 975 0.18<br />
K 1 290 - 2 0.01<br />
L 198 577 4 238 13 599 0.24<br />
M 233 825 895 4 390 0.06<br />
N 493 034 601 1 054 0.02<br />
O 935 315 2 28 0.00<br />
TS & EEZ 4 115 806 46 300 90 940 0.08<br />
* the trawl footprint <strong>and</strong> proportion overlapped in coastal classes A–E will be grossly underestimated because CELR data<br />
are excluded.
7.5. References<br />
AEBAR <strong>2012</strong>: Benthic impacts<br />
Auster PJ; Langton RW (1999). The effects of fishing on fish habitat. American Fisheries Society Symposium 22:150–187.<br />
Barnes PW; Thomas JP (eds) (2005). Benthic habitats <strong>and</strong> effects of fishing. American Fisheries Society Symposium 41. American Fisheries<br />
Society, Bethesda, MD.<br />
Baird SJ; Bagley NW; Wood BA; Dunn A; Beentjes M (2002). The spatial extent <strong>and</strong> nature of mobile bottom fishing methods within the<br />
New Zeal<strong>and</strong> EEZ, 1989–90 to 1998–99. Final Research Report for Objective 1 of project ENV2000/05.<br />
Baird SJ; Wood BA (2010). Extent of coverage of 15 environmental classes within the New Zeal<strong>and</strong> EEZ by commercial trawling with<br />
seafloor contact. Final Research Report for Objective 5 of project BEN2006/01.<br />
Baird SJ; Wood BA; Bagley NW (2009). The extent of trawling on or near the seafloor in relation to benthic-optimised marine environment<br />
classes within the New Zeal<strong>and</strong> EEZ. Final Research Report for Objective 5 of project BEN200601.<br />
Baird SJ; Wood BA; Bagley NW (2011). Nature <strong>and</strong> extent of commercial fishing effort on or near the seafloor within the New Zeal<strong>and</strong> 200<br />
n. mile Exclusive Economic Zone 1989/90 to 2004/05. New Zeal<strong>and</strong> <strong>Aquatic</strong> <strong>Environment</strong> <strong>and</strong> <strong>Biodiversity</strong> Report No. 73. 144 p.<br />
Baird SJ; Wood BA; Clark MR; Bagley NW; McKenzie A (2006). Description of the spatial extent <strong>and</strong> nature of disturbances by bottom<br />
trawls in Chatham Rise <strong>and</strong> Southern Plateau fisheries. Final Research Report for project ENV2003/03. 139 p.<br />
Blyth RE; Kaiser MJ; Edwards-Jones G; Hart PJB (2004). Implications of a zoned fishery management system for marine benthic<br />
communities. Journal of Applied Ecology 41: 951–961<br />
Bowden DA; Compton TJ; Snelder TH; Hewitt JE (2011). Evaluation of the New Zeal<strong>and</strong> Marine <strong>Environment</strong> Classifications using Ocean<br />
Survey 20/20 data from Chatham Rise & Challenger Plateau. New Zeal<strong>and</strong> <strong>Aquatic</strong> <strong>Environment</strong> <strong>and</strong> <strong>Biodiversity</strong> Report No. 77.<br />
Bradshaw C; Tjensvoll I; Sköld M; Allan IJ; Molvaer J; Magnusson J; Naes K; Nilsson HC (<strong>2012</strong>). Bottom trawling resuspends sediment<br />
<strong>and</strong> releases bioavailable contaminants in a polluted fjord. <strong>Environment</strong>al Pollution 170: 232–241<br />
Bradshaw C; Veale LO; Br<strong>and</strong> AR (2002). The role of scallop-dredge disturbance in long-term changes in Irish Sea benthic communities: a<br />
re-analysis of an historical dataset. Journal of Sea Research 47: 161-184.<br />
Brodie S; Clark M (2003). The New Zeal<strong>and</strong> Seamount Management Strategy – steps towards conserving offshore marine habitat. In:<br />
Beumer, J.P.; Grant, A.; Smith, D.C. (eds). <strong>Aquatic</strong> Protected Areas: what works best <strong>and</strong> how do we know? Proceedings of the<br />
World Congress on <strong>Aquatic</strong> Protected Areas, Cairns, Australia, August 2002. Australian Society of Fish Biology, Australia., pp.<br />
664–673. Australian Society of Fish Biology, Cairns, Australia.<br />
Churchill JH (1989). The effect of commercial trawling on sediment resuspension <strong>and</strong> transport over the Middle Atlantic Bight Continental<br />
Shelf. Continental Shelf Research 9: 841-864.<br />
Clark MR (1999). Fisheries for orange roughy (Hoplostethus atlanticus) on seamounts in New Zeal<strong>and</strong>. Oceanologica Acta 22: 593-602.<br />
Clark MR; Bowden DA; Baird SJ; Stewart R (2010). Effects of fishing on the benthic biodiversity of seamounts of the “Graveyard”<br />
complex, northern Chatham Rise. NZ <strong>Aquatic</strong> <strong>Environment</strong> <strong>and</strong> <strong>Biodiversity</strong> Report No. 46. 40 p.<br />
Clark MR; Koslow JA (2007). Impacts of fisheries on seamounts. Chapter 19. p. 413–441 In: Pitcher TJ, Morato T, Hart PJB, Clark MR,<br />
Haggan N, Santos RS (eds). Seamounts: ecology, fisheries, <strong>and</strong> conservation. Blackwell Fisheries <strong>and</strong> <strong>Aquatic</strong> Resources Series<br />
12. Blackwell Publishing, Oxford. 527 pp.<br />
Clark M; O'Driscoll R (2003). Deepwater fisheries <strong>and</strong> aspects of their impact on seamount habitat in New Zeal<strong>and</strong>. Journal of Northwest<br />
Atlantic Fishery Science 31: 441–458.<br />
Clark MR; Rowden AA (2009). Effect of deepwater trawling on the macro-invertebrate assemblages of seamounts on the Chatham Rise,<br />
New Zeal<strong>and</strong>. Deep Sea Research I 56: 1540–1554<br />
Clark MR; Tracey DM; Pallentin A; Schnabel K; Anderson OF; Bowden D (2009). Voyage report of a survey of “seamounts” on the<br />
northwest <strong>and</strong> southeast Chatham Rise (TAN0905). 49 p. (unpublished report available from NIWA, Wellington).<br />
Clark MR; Watling L; Rowden AA; Guinotte JM; Smith CR (2010). A global seamount classification to aid the scientific design of marine<br />
protected area networks. Journal of Ocean <strong>and</strong> Coastal Management 54: 19–36.<br />
Clark MR; Williams A; Rowden AA; Hobday AJ; Consalvey M (2011). Development of seamount risk assessment: application of the<br />
ERAEF approach to Chatham Rise seamount features. New Zeal<strong>and</strong> <strong>Aquatic</strong> <strong>Environment</strong> <strong>and</strong> <strong>Biodiversity</strong> Report No. 74. 18 p.<br />
Craeymeersch JA; Piet GJ; Rijnsdorp AD; Buijs J (2000). Distribution of macrofauna in relation to the microdistribution of trawling effort.<br />
P 187 in Kaiser MJ; de Groot SJ (eds). The effects of fishing on nontarget species <strong>and</strong> habitats: biological, conservation, <strong>and</strong><br />
socio-economic issues. Blackwell Scientific, Oxford, UK.<br />
Cranfield HJ; Michael KP; Doonan IJ (1999). Changes in the distribution of epifaunal reefs <strong>and</strong> oysters during 130 years of dredging for<br />
oysters in Foveaux Strait, southern New Zeal<strong>and</strong>. <strong>Aquatic</strong> Conservation of Marine <strong>and</strong> Freshwater Ecosystems 9: 461–483<br />
Cranfield HJ; Carbines G; Michael KP; Dunn A; Stotter DR; Smith DJ (2001). Promising signs of regeneration of blue cod <strong>and</strong> oyster<br />
habitat changed by dredging in Foveaux Strait, southern New Zeal<strong>and</strong>. New Zeal<strong>and</strong> Journal of Marine <strong>and</strong> Freshwater<br />
Research 35: 897-908<br />
Cranfield HJ; Manighetti B; Michael KP; Hill A (2003). Effects of oyster dredging on the distribution of bryozoans biogenic reefs <strong>and</strong><br />
associated sediments in Foveaux Strait, southern New Zeal<strong>and</strong>. Continental Shelf Research 23: 1337–1357<br />
Cryer M; Coburn R; Hartill BH; O’Shea S; Kendrick T; Doonan I (1999). Scampi stock assessment for 1998 <strong>and</strong> an analysis of the fish <strong>and</strong><br />
invertebrate bycatch of scampi trawlers. New Zeal<strong>and</strong> Fisheries Assessment Research Document 99/4. 74 p<br />
Cryer M; Hartill BH (2002) Relative impacts on benthic invertebrate community structure of trawl fisheries for scampi <strong>and</strong> finfish in the<br />
Bay of Plenty. Final Research Report for Ministry of Fisheries Research Project ENV2000/05 Objective 2. 28 p.<br />
Cryer M; Hartill BH; O'Shea S (2002). Modification of marine benthos by trawling: toward a generalization for the deep ocean? Ecological<br />
Applications 12: 1824–1839<br />
Cryer M; O’Shea S; Gordon DP; Kelly M; Drury JD; Morrison MA; Hill A; Saunders H; Shankar U; Wilkinson M; Foster G (2000).<br />
Distribution <strong>and</strong> structure of benthic invertebrate communities between North Cape <strong>and</strong> Cape Reinga Final Research Report for<br />
Ministry of Fisheries Research Project ENV9805 Objectives 1–4.<br />
Davies AJ; Guinotte JM (2011). Global habitat suitability for framework-forming cold-water corals. PLoS One 6(4).<br />
Dayton PK; Thrush SF; Agardy MT; Hofman RJ (1995). <strong>Environment</strong>al effects of fishing. <strong>Aquatic</strong> Conservation: Marine <strong>and</strong> Freshwater<br />
Ecosystems 5:205–232.<br />
Dayton PK; Thrush SF; Coleman FC (2002). The Ecological Effects of Fishing in Marine Ecosystems of the United States. Arlington, VA:<br />
Pew Oceans Comm.<br />
Dichmont CM; Deng A; Punt AE; Ellis N; Venables WN; Kompas T; Ye Y; Zhou S; Bishop J (2008) Beyond biological performance<br />
measures: bringing in economics <strong>and</strong> the effects of trawling on the benthos. Fisheries Research 94: 238–250.<br />
184
AEBAR <strong>2012</strong>: Benthic impacts<br />
Ellis N; Pantus F (2001). Management strategy modelling: tools to evaluate trawl management strategies with respect to impacts on benthic<br />
biota within the Great Barrier Reef Marine Park area. Clevel<strong>and</strong>, Qld.: CSIRO Div. Marine Research. Parts 1 & 2, pp132.<br />
http://www.cmar.csiro.au/e-print/open/ellisn_2001.pdf<br />
Ferrier S; Drielsma M; Manion G; Watson G (2002). Extended statistical approaches to modelling spatial pattern in biodiversity in northeast<br />
New South Wales: II. Community-level modelling. <strong>Biodiversity</strong> <strong>and</strong> Conservation 1: 2309–2338.<br />
Ferrier S; Manion G; Elith J; Richardson K (2007). Using generalised dissimilarity modelling to analyse <strong>and</strong> predict patterns of betadiversity<br />
in regional biodiversity assessment. Diversity <strong>and</strong> Distributions 13: 252–264.<br />
Green MO; Vincent CE; McCave IN; Dickson RR; Rees JM; Pearsons ND (1995). Storm sediment transport: observations from the British<br />
North Sea shelf. Continental Shelf Research 15: 889-912.<br />
Hall SJ (1994). Physical disturbance <strong>and</strong> marine benthic communities: life in unconsolidated sediments. Oceanography <strong>and</strong> Marine Biology<br />
<strong>Annual</strong> <strong>Review</strong> 32: 179-239.<br />
Hall SJ (1999). The effects of fishing on marine ecosystems <strong>and</strong> communities. Blackwell Scientific, Oxford, UK.<br />
Hermsen JM; Collie JS; Valentine PC (2003). Mobile fishing gear reduces benthic megafaunal production on Georges Bank. Marine<br />
Ecology Progress Series 260: 97-108<br />
Hiddink JG; Jennings S; Kaiser MJ; Queiros AM; Duplisea DE; Piet GJ (2006). Cumulative impacts of seabed trawl disturbance on benthic<br />
biomass, production, <strong>and</strong> species richness in different habitats. Canadian Journal of Fisheries <strong>and</strong> <strong>Aquatic</strong> Sciences 63:721–36<br />
JG Hiddink; AF Johnson; R Kingham; H Hinz (2011). Could our fisheries be more productive? Indirect negative effects of bottom trawl<br />
fisheries on fish condition. Journal of Applied Ecology 48: 1–9.<br />
Hinz H; Hiddink JG; Forde J; Kaiser MJ (2008): Large-scale responses of nematode communities to chronic otter-trawl disturbance.<br />
Canadian Journal of Fisheries <strong>and</strong> <strong>Aquatic</strong> Sciences 65: 723-732<br />
ICES (1992). Report of the Study Group on Ecosystem Effects of Fishing Activities. ICES CM:1992/G11, 144 pp.<br />
ICES (2000a). Report of the Advisory Committee on the Marine <strong>Environment</strong> 2000. ICES Cooperative Research Report #241.<br />
ICES (2000b). Report of the Working Group on Ecosystem Effects of Fishing Activities . ICES CM 2000/ACME:02.<br />
Jennings S; Dinmore TA; Duplisea DE; Warr KJ; Lancaster JE (2001). Trawling disturbance can modify benthic production processes.<br />
Journal of Animal Ecology 70: 459–475<br />
Jennings S; Freeman S; Parker R; Duplisea DE; Dinmore TA (2005). Ecosystem Consequences of Bottom Fishing Disturbance. American<br />
Fisheries Society Symposium 41:73-90<br />
Jennings S; Kaiser MJ (1998). The effects of fishing on marine ecosystems. Advances in Marine Biology <strong>and</strong> Ecology 34:201–352.<br />
Jennings S; Pinnegar JK; Polunin NVC; Warr KJ (2001). Impacts of trawling disturbance on the trophic structure of benthic invertebrate<br />
communities. Marine Ecology Progress Series 213:127–142.<br />
Jones JB (1992). <strong>Environment</strong>al impact of trawling on the seabed: a review. New Zeal<strong>and</strong> Journal of Marine <strong>and</strong> Freshwater Research 26:<br />
59–67.<br />
Kaiser MJ; Clarke KR; Hinz H; Austen MCV; Somerfield PJ; Karakassis I (2006). Global analysis of the response <strong>and</strong> recovery of benthic<br />
biota to fishing. Marine Ecology Progress Series 311: 1–14<br />
Kaiser MJ; Collie JS; Hall SJ; Jennings S; Poiner IR (2003). Impacts of fishing gear on marine benthic habitats. Conference on Responsible<br />
Fisheries in the Marine Ecosystem. Reykjavik, Icel<strong>and</strong>, 1-4 October 2001.<br />
Kaiser MJ; de Groot, SJ (2000). Effects of fishing on non-target species <strong>and</strong> habitats: biological, conservation <strong>and</strong> socio-economic issues.<br />
Blackwell, Oxford, 399 p.<br />
Leathwick J; Francis M; Julian K (2006). Development of a demersal fish community classification for New Zeal<strong>and</strong>’s Exclusive Economic<br />
Zone. Prepared for Department of Conservation. NIWA Client Report HAM2006-062. Hamilton.<br />
Leathwick JR; Rowden AA; Nodder S; Gorman R; Bardsley S; Pinkerton M; Baird SJ; Hadfield M; Currie K; Goh A (2010). Benthicoptimised<br />
marine environment classification for New Zeal<strong>and</strong> waters. Final Research Report for Ministry of Fisheries Project<br />
BEN2006/01, Objective 5. 52 p. Unpublished report held by Ministry of Fisheries, Wellington.<br />
Leathwick JR; Snelder T; Chadderton WL; Elith J; Julian K; Ferrier S (2011). Use of generalised dissimilarity modelling to improve the<br />
biological discrimination of river <strong>and</strong> stream classifications. Freshwater Biology 56: 21–38.<br />
Lindeboom H; deGroot SJ (1998). The effects of different types of fisheries on the North Sea <strong>and</strong> Irish Sea benthic ecosystems. Netherl<strong>and</strong>s<br />
Institute of Sea Research, Texel, The Netherl<strong>and</strong>s.<br />
Lokkeborg S (2005). Impacts of trawling <strong>and</strong> scallop dredging on benthic habitats <strong>and</strong> communities. FAO Tech. Paper 472.<br />
Lundquist CJ; Thrush SF; Coco G; Hewitt JE (2010). Interactions between disturbance <strong>and</strong> dispersal reduce persistence thresholds in a<br />
benthic community. Marine Ecology Progress Series 413: 217–228.<br />
MacDiarmid A; McKenzie A; Sturman J; Beaumont J; Mikaloff-Fletcher S; Dunne J (<strong>2012</strong>). Assessment of anthropogenic threats to New<br />
Zeal<strong>and</strong> marine habitats. New Zeal<strong>and</strong> <strong>Aquatic</strong> <strong>Environment</strong> <strong>and</strong> <strong>Biodiversity</strong> Report No. 93.255 p.<br />
Michael KP; Kroger K; Richardson K; Hill N (2006). Summary of information in support of the Foveaux Strait Oyster Fishery Plan: the<br />
Foveaux Strait ecosystem <strong>and</strong> effects of oyster dredging. Final Research Report for Ministry of Fisheries project ZBD2005/04.<br />
Ministry for the <strong>Environment</strong>. 2010. Fishing Activity: Fish Stocks <strong>Environment</strong>al Snapshot. Wellington.<br />
Ministry of Fisheries 2008. Bottom Fishery Impact Assessment: Bottom Fishing Activities by New Zeal<strong>and</strong> Vessels Fishing in the High<br />
Seas in the SPRFMO Area during 2008 <strong>and</strong> 2009. Ministry of Fisheries, Wellington. 102 pp. Available from<br />
http://www.southpacificrfmo.org/benthic-impact-assessments/.<br />
McConnaughy RA; Mier KL; Dew CB (2000). An examination of chronic trawling effects on soft-bottom benthos of the eastern Bering Sea.<br />
ICES Journal of Marine Science 57: 1377–1388.<br />
National Marine Fisheries Service (2002). Workshop on the effects of fishing gear on marine habitats off the northeastern United States<br />
October 23-25, 2001. Northeast Fisheries Science Center Reference Document 02-01.<br />
National Research Council (2002). Effects of trawling <strong>and</strong> dredging in seafloor habitat. National Academy Press, Washington DC.<br />
O'Driscoll RL; Clark MR (2005). Quantifying the relative intensity of fishing on New Zeal<strong>and</strong> seamounts. New Zeal<strong>and</strong> Journal of Marine<br />
<strong>and</strong> Freshwater Research 39: 839–850.<br />
Puig P; Canals M; Company JB; Martin J; Amblas D; Lastras G; Palanques A; Calafat A (<strong>2012</strong>). Ploughing the deep sea floor. Nature 489:<br />
286–289.<br />
Reiss H; Greenstreet SPR; Siebe K; Ehrich S; Piet GJ; Quirijns F; Robinson L; Wolff WJ; Kronke I (2009). Effects of fishing disturbance on<br />
benthic communities <strong>and</strong> secondary production within an intensively fished area. Marine Ecology Progress Series 394: 201–213.<br />
Rice J (2006). Impacts of mobile bottom gears on seafloor habitats, species, <strong>and</strong> communities: a review <strong>and</strong> synthesis of selected<br />
international reviews. Canadian Science Advisory Secretariat Research Document 2006/057. 35 p. (available from<br />
http://www.dfo-mpo.gc.ca/CSAS/Csas/DocREC/2006/RES2006_057_e.pdf).<br />
Rowden AA; Clark MR; Wright IC (2005). Physical characterisation <strong>and</strong> a biologically focused classification of seamounts in the New<br />
Zeal<strong>and</strong> region. New Zeal<strong>and</strong> Journal of Marine <strong>and</strong> Freshwater Research 39: 1039–1059.<br />
185
AEBAR <strong>2012</strong>: Benthic impacts<br />
Rowden AA; Oliver MD; Clark MR; MacKay K (2008). New Zeal<strong>and</strong>’s “SEAMOUNT” database: recent updates <strong>and</strong> its potential use for<br />
ecological risk assessment. <strong>Aquatic</strong> <strong>Environment</strong> <strong>and</strong> <strong>Biodiversity</strong> Report No. 27. 49 p.<br />
Rumohr H (1998). Information on impact of trawling on benthos in Kiel Bay. Annex to Eighth Report of the Benthos Ecology Working<br />
Group. ICES, CM: 1989/L19, 80.<br />
Sainsbury KJ; Punt AE; Smith ADM (2000). Design of operational management strategies for achieving fishery ecosystem objectives. ICES<br />
Journal of Marine Science, 57: 731–741.<br />
Schratzberger M; Lampadariou N; Somerfield PJ; V<strong>and</strong>epitte L; V<strong>and</strong>en Berghe E (2009). The impact of seabed disturbance on nematode<br />
communities: linking field <strong>and</strong> laboratory observations. Marine Biology 156:709–724<br />
Sharp B; Parker S; Smith N. 2009. An impact assessment framework for bottom fishing methods in the CCAMLR Convention area.<br />
CCAMLR Science 16: 195–210<br />
Snelder TH; Leathwick JR; Dey KL; Rowden AA; Weatherhead MA; Fenwick GD; Francis MP; Gorman RM; Grieve JM; Hadfield MG;<br />
Hewitt JE; Richardson KM; Uddstrom MJ; Zeldis JR (2006). Development of an ecological marine classification in the New<br />
Zeal<strong>and</strong> region. <strong>Environment</strong>al Management 39: 12–29.<br />
Snelder TH; Leathwick JR; Dey KL; Weatherhead MA; Fenwick GD; Francis MP; Gorman RM; Grieve JM; Hadfield MG; Hewitt JE;<br />
Hume T; Richardson KM; Rowden AA; Uddstrom MJ; Wild M; Zeldis JR (2005) The New Zeal<strong>and</strong> Marine <strong>Environment</strong><br />
Classification. Ministry for the <strong>Environment</strong>. Wellington.<br />
Snelder TH; Leathwick JR; Image K; Weatherhead MA; Wild M (2004). The New Zeal<strong>and</strong> Marine <strong>Environment</strong> Classification. NIWA<br />
Client Report CHC2004-071. 86 p.<br />
Thrush SF; Dayton PK (2002). Disturbance to marine benthic habitats by trawling <strong>and</strong> dredging—implications for marine biodiversity.<br />
<strong>Annual</strong> <strong>Review</strong>s in Ecology <strong>and</strong> Systematics 33:449–73<br />
Thrush SF; Hewitt JE; Cummings VJ; Dayton PK (1995). The impact of habitat disturbance by scallop dredging on marine benthic<br />
communities: What can be predicted from the results of experiments? Marine Ecology Progress Series 129:141–150.<br />
Thrush SF; Hewitt JE; Cummings VJ; Dayton PK; Cryer M; Turner SJ; Funnell GA; Budd RG; Milburn CJ; Wilkinson MR (1998).<br />
Disturbance of the marine benthic habitat by commercial fishing: impacts at the scale of the fishery. Ecological Applications 8:<br />
866–879.<br />
Tillin HM; Hiddink JG; Jennings S; Kaiser MJ (2006). Chronic bottom trawling alters the functional composition of benthic invertebrate<br />
communities on a sea-basin scale. Marine Ecology Progress Series 318:31–45<br />
Tuck ID; Parkinson DM; Dey K; Oldman J; Wadwha S (2006). Information on benthic impacts in support of the Corom<strong>and</strong>el scallop<br />
fisheries plan. Final Research Report for Ministry of Fisheries Research Project ZBD2005/15<br />
Tuck ID; Drury J; Kelly M; Gerring P (2009) Designing a programme to monitor the recovery of the benthic community between North<br />
Cape <strong>and</strong> Cape Reinga. Final Research Report for Ministry of Fisheries Research Project ENV2005-23.<br />
Tuck ID; Hewitt JE (<strong>2012</strong>). Monitoring change in benthic communities in Spirits Bay. Final Research Report for Ministry of Fisheries<br />
research project BEN200901. 51 p.<br />
Tuck ID; Hewitt JE; H<strong>and</strong>ley S; Willis T; Carter M; Hadfield M; Gorman R; Cairney D; Brown S; Palmer A (2011). Assessing the effects of<br />
fishing on soft sediment habitat, fauna <strong>and</strong> processes. Progress Report for Ministry of Fisheries research project BEN200701.<br />
(Unpublished report held by MPI, Wellington.).<br />
Veale LO; Hill AS; Hawkins SJ; Br<strong>and</strong> AR (2000). Effects of long-term physical disturbance by commercial scallop fishing on subtidal<br />
epifaunal assemblages <strong>and</strong> habitats. Marine Biology 137: 325-337<br />
Warnkena KW; Gilla GA; Dellapennaa TM; Lehmana RD; Harperb DE; Allison MA (2003). The effects of shrimp trawling on sediment<br />
oxygen consumption <strong>and</strong> the fluxes of trace metals <strong>and</strong> nutrients from estuarine sediments. Estuarine, Coastal <strong>and</strong> Shelf Science<br />
57: 25–42<br />
Watling L; Norse EA (1998). Disturbance of the seabed by mobile fishing gear: a comparison to forest clearcutting. Conservation Biology,<br />
12: 1180–1197.<br />
Williams A; Dowdney J; Smith ADM; Hobday AJ; Fuller M (2011). Evaluating impacts of fishing on benthic habitats: a risk assessment<br />
framework applied to Australian fisheries. Fisheries Research 112: 154–167<br />
Williams A; Schlacher TA; Rowden AA; Althaus F; Clark MR; Bowden DA; Stewart R; Bax NJ; Consalvey M; Kloser RJ (2010).<br />
Seamount megabenthic assemblages fail to recover from trawling impacts. Marine Ecology 31 (Suppl. 1):183–199.<br />
186
AE&B <strong>Annual</strong> review: Ecosystem effects<br />
THEME 4: ECOSYSTEM EFFECTS<br />
187
AEBAR <strong>2012</strong>: Ecosystem effects: NZ regional climate <strong>and</strong> oceanic setting<br />
8. New Zeal<strong>and</strong> Climate <strong>and</strong> Oceanic Setting<br />
Scope of chapter Overview of primary productivity, oceanography, bentho-pelagic coupling<br />
<strong>and</strong> oceanic climate trends in the SW Pacific region.<br />
Area covered New Zeal<strong>and</strong> regional setting<br />
Focal localities Pan New Zeal<strong>and</strong> waters<br />
Key issues • Climate <strong>and</strong> oceanographic variability <strong>and</strong> change are of relevance to<br />
fisheries <strong>and</strong> the broader marine environment<br />
• Allows for improved underst<strong>and</strong>ing of the links between observed<br />
patterns <strong>and</strong> drivers of biological processes.<br />
Emerging issues • New Zeal<strong>and</strong>’s oceanic climate is changing<br />
MPI Research<br />
(current)<br />
NZ Research<br />
(current)<br />
Links to Fisheries<br />
2030 <strong>and</strong> MPI’s<br />
Our Strategy<br />
Related issues<br />
<strong>and</strong>/or Chapters<br />
• Causal mechanisms that link the dynamics of a variable marine<br />
environment to variation in biological productivity, particularly of<br />
fisheries, are not well understood in New Zeal<strong>and</strong>.<br />
• Need for improved underst<strong>and</strong>ing of the linkages between the pelagic <strong>and</strong><br />
benthic environment (i.e., bentho-pelagic coupling).<br />
• The cumulative effects of ocean climate change <strong>and</strong> other anthropogenic<br />
stressors on aquatic ecosystems (productivity, structure <strong>and</strong> function) are<br />
likely to be high.<br />
• Some long-term trends in the marine environment are available at a<br />
national scale but are not reported.<br />
Growing recognition that stressors will act individually & interactively,<br />
confounding prediction of net effects of climate change<br />
Projects include ZBD2005-05: Long-term effects of climate variation <strong>and</strong><br />
human impacts on the structure <strong>and</strong> functioning of New Zeal<strong>and</strong> shelf<br />
ecosystems; ZBD2008-11 Predicting plankton biodiversity & productivity<br />
with ocean acidification; ZBD2009-13. Ocean acidification impact on key<br />
NZ molluscs; ZBD2010-40. Marine <strong>Environment</strong>al Monitoring Programme;<br />
ZBD2010-41 Deepsea fisheries habitat <strong>and</strong> ocean acidification.<br />
NIWA Coast & Oceans Centre, Climate Centre; University of Otago-NIWA<br />
shelf carbonate geochemistry & bryozoans; Munida time-series transect;<br />
Geomarine Services-foraminiferal record of human impact; Regional Council<br />
monitoring programmes; Statistics New Zeal<strong>and</strong> <strong>Environment</strong>al Domain<br />
review.<br />
<strong>Environment</strong>al Outcome Objective 1; environmental principles of Fisheries<br />
2030; MPI’s “Our Strategy 2030”: two key stated focuses are to maximise<br />
export opportunities <strong>and</strong> improve sector productivity; increase sustainable<br />
resource use, <strong>and</strong> protect from biological risk.<br />
• Ocean related climate variability <strong>and</strong> change are predicted to have major<br />
implications for fishstock distributions <strong>and</strong> abundance, reproductive<br />
success, ecosystem goods <strong>and</strong> services, deepsea coral habitat <strong>and</strong> Habitats<br />
of Particular Significance to Fisheries Management,<br />
• A significant warming event occurred in the late 1990s<br />
• A regime shift to the negative phase of the IPO occurred in about 2000,<br />
188
AEBAR <strong>2012</strong>: Ecosystem effects: NZ regional climate <strong>and</strong> oceanic setting<br />
8.1. Context<br />
which is likely to result in fewer El Niño events for a 20–30 year period,<br />
i.e., less zonal westerly winds (already apparent compared to the 1980–<br />
2000 period) <strong>and</strong> increased temperatures; this is the first regime shift to<br />
occur since most of our fisheries monitoring time series have started (the<br />
previous shift was in the late 1970s), <strong>and</strong> will likely impact on fish<br />
productivity<br />
• New Zeal<strong>and</strong> trends of increasing air <strong>and</strong> sea temperatures <strong>and</strong> ocean<br />
acidification are consistent with global trends.<br />
Climate <strong>and</strong> oceanographic conditions play an important role in driving the productivity of our oceans<br />
<strong>and</strong> the abundance <strong>and</strong> distribution of our fishstocks, <strong>and</strong> hence fisheries. A full analysis of trends in<br />
climate <strong>and</strong> oceanographic variables in New Zeal<strong>and</strong> is given in Hurst et al. (<strong>2012</strong>) <strong>and</strong> is now being<br />
developed as an Ocean Climate Change Atlas for New Zeal<strong>and</strong> waters (Boyd <strong>and</strong> Law.2011).<br />
New Zeal<strong>and</strong> is essentially part of a large submerged continent (Figure 8.1).<br />
Figure 8.1: New Zeal<strong>and</strong> l<strong>and</strong> mass area 250,000 km 2 ; EEZ & territorial sea area (pink) 4,200,000 km 2 ; extended<br />
continental shelf extension area (light green) 1,700,000 km 2 ; Total area of marine jurisdiction 5,900,000 km 2 . The<br />
black line shows the boundary of the New Zeal<strong>and</strong> EEZ, the yellow line indicates the extension to New Zeal<strong>and</strong>’s<br />
legal continental shelf, <strong>and</strong> the red line the agreed Australia/New Zeal<strong>and</strong> boundary under UNCLOS Article 76.<br />
Image courtesy of GNS.<br />
The territorial sea (TS extending from mean low water shore line to 12 nautical miles) <strong>and</strong> Exclusive<br />
Economic Zone (the EEZ, extending from 12 nautical miles to 200 miles offshore) <strong>and</strong> the extended<br />
continental shelf (ECS) combine to produce one of the largest areas of marine jurisdiction in the<br />
world, an area of almost 6 million square kilometres, (Figure 8.1). New Zeal<strong>and</strong> waters straddle more<br />
than 25 degrees of latitude from 30º S in warm subtropical waters to 56º S in cooler, subantarctic<br />
189
AEBAR <strong>2012</strong>: Ecosystem effects: NZ regional climate <strong>and</strong> oceanic setting<br />
waters, <strong>and</strong> 28 degrees of longitude from 161º E in the Tasman Sea to 171º W in the west Pacific<br />
Ocean. New Zeal<strong>and</strong>’s coastline, with its numerous embayments, is also long, with estimates ranging<br />
from 15,000 to 18,000 km, depending on the method used for measurement (Gordon et al. 2010).<br />
New Zeal<strong>and</strong> lies across an active subduction zone in the western Pacific plate, tectonic activity <strong>and</strong><br />
volcanism have resulted in a diverse <strong>and</strong> varied seascape within the EEZ. The undersea topography<br />
comprises a relatively narrow b<strong>and</strong> of continental shelf down to 200 m water depth, extensive<br />
continental slope areas from 200 to 1000 m, extensive abyssal plains, submarine canyons <strong>and</strong> deep sea<br />
trenches, ridge systems <strong>and</strong> numerous seamounts <strong>and</strong> other underwater topographic features such as<br />
hills <strong>and</strong> knolls. There are three significant submarine plateaus, the Challenger Plateau, the Campbell<br />
Plateau in the subantarctic, <strong>and</strong> the Chatham Rise (Figure 8.2).<br />
Disturbance of current flow across the plateaus <strong>and</strong> around the New Zeal<strong>and</strong> l<strong>and</strong>mass gives rise to<br />
higher ocean productivity than might be expected, given New Zeal<strong>and</strong>’s isolated location in the<br />
generally oligotrophic western Pacific Ocean (Figure 8.3). Higher ocean colour, reflecting higher<br />
levels of productivity, is typically found around the coast <strong>and</strong> to the east across the Chatham Rise<br />
(Figure 8.3; Pinkerton et al. 2005). The coastal waters <strong>and</strong> plateaus support a range of commercial<br />
shellfish <strong>and</strong> finfish fisheries from the shoreline to depths of about 1500 m. Seamounts, seamount<br />
chains <strong>and</strong> ridge structures in suitable depths provide additional localized areas of upwelling <strong>and</strong><br />
increased productivity sometimes associated with commercial fisheries.<br />
Figure 8.2 Undersea topography of New Zeal<strong>and</strong> (red shallow to blue deep). White dash line shows the EEZ<br />
boundary. Image courtesy of NIWA.<br />
.<br />
190
AEBAR <strong>2012</strong>: Ecosystem effects: NZ regional climate <strong>and</strong> oceanic setting<br />
Figure 8.3: SeaWIFS image showing elevated chlorophyll a (green) near New Zeal<strong>and</strong>. Image courtesy of NOAA<br />
Both Figures 8.3 <strong>and</strong> 8.4 (left panel) show that the strongest chlorophyll a <strong>and</strong> ocean colour are<br />
associated with the coastal shelf around New Zeal<strong>and</strong> <strong>and</strong> the Chatham Rise. Although remote<br />
sensing cannot readily distinguish between primary productivity (from phytoplankton) <strong>and</strong> sediments<br />
in freshwater runoff, so interpretation of the relative productivity levels inshore has to be made in<br />
conjunction with knowledge of river flow, it is clear that the Chatham Rise has the highest<br />
productivity levels in the region. Globally, New Zeal<strong>and</strong> net primary productivity levels in the sea are<br />
higher compared with most of Australasia, but lower than most coastal upwelling systems around the<br />
world (Willis et al., 2007).<br />
Figure 8.4: Left panel: Ocean colour in the New Zeal<strong>and</strong> region from satellite imagery. Red shows the highest<br />
intensity of ocean colour typically associated with higher primary productivity. Right panel: The relative<br />
concentrations of particulate organic carbon (POC) that reach the seafloor. Red shows the highest levels, which are<br />
likely to be associated with areas of enhanced benthic productivity (based on the model of Lutz et al. (2007)). Images<br />
courtesy of NIWA.<br />
Patterns in surface waters of primary productivity are mirrored to an extent in the amount of “energy”<br />
that sinks to the seafloor (Figure 8.4). This POC flux is based on a model which accounts for sinking<br />
rates of dead organisms <strong>and</strong> predation in the water column (Lutz et al. 2007). This is a potential<br />
191
AEBAR <strong>2012</strong>: Ecosystem effects: NZ regional climate <strong>and</strong> oceanic setting<br />
surrogate of benthic production, <strong>and</strong> indicates where bentho-pelagic coupling may be strong. Highest<br />
levels of POC flux match with surface productivity to a large extent, with coastal waters (including<br />
around the offshore isl<strong>and</strong>s) <strong>and</strong> the Chatham Rise having high estimated production.<br />
The Tasman Sea (west of New Zeal<strong>and</strong>) is separated from the South Pacific Gyre by the New Zeal<strong>and</strong><br />
l<strong>and</strong>mass (Figure 8.5). The South Pacific Western Boundary Current, the East Australian Current<br />
(EAC) flows down the east coast of Australia, before separating from the Australian l<strong>and</strong>mass in a<br />
variable eddy field at about 31 or 32°S (Ridgway & Dunn 2003). The bulk of the separated flow<br />
crosses the Tasman Sea as the Tasman Front (Stanton 1981; Ridgway & Dunn 2003), before a portion<br />
of the flow attaches to New Zeal<strong>and</strong>, flowing down the northeast coast as the East Auckl<strong>and</strong> Current<br />
(Stanton et al. 1997). In the southern limit of the Tasman Sea is the Subtropical Front, which passes<br />
south of Tasmania <strong>and</strong> approaches New Zeal<strong>and</strong> at the latitude of Fiordl<strong>and</strong> (Stanton 1988), before<br />
diverting southward around New Zeal<strong>and</strong>, <strong>and</strong> then northward up the southeast coast of New Zeal<strong>and</strong><br />
where it is locally called the Southl<strong>and</strong> Front (Heath 1985; Chiswell 1996; Sutton 2003).<br />
Figure 8.5: Circulation around New Zeal<strong>and</strong>. TF Tasman Front (large red arrows), WAUC West Auckl<strong>and</strong> Current,<br />
EAUC East Auckl<strong>and</strong> Current, NCE North Cape Eddy, ECE East Cape Eddy, ECC East Cape Current, WE<br />
Wairarapa Eddy, DC D’Urville Current, WC Westl<strong>and</strong> Current, SC Southl<strong>and</strong> Current, SF Southl<strong>and</strong> Front, STW<br />
Subtropical Water, STF Subtropical Front (left diagonal hashed area), SAW Subantarctic Water, SAF Subantarctic<br />
Front (right diagonal hashed area), ACC Antarctic Circum-Polar Current, CSW Circum-Polar Surface Water,<br />
DWBC Deep Western Boundary Current (large purple arrows) (after Carter et al. 1998).<br />
The water in the eastern central Tasman Sea south of the Tasman Front, east of the influence of the<br />
EAC <strong>and</strong> north of the Subtropical Front is thought to be relatively quiescent. Ridgway & Dunne<br />
(2003) show eastward surface flow across the interior of the Tasman Sea sourced from the<br />
southernmost limit of the EAC, with the flow bifurcating around Challenger Plateau <strong>and</strong>, ultimately,<br />
192
AEBAR <strong>2012</strong>: Ecosystem effects: NZ regional climate <strong>and</strong> oceanic setting<br />
New Zeal<strong>and</strong>. Reid’s (1986) analysis indicates that a small anticyclonic gyre exists in the western<br />
Tasman Sea at 1000–2500 m depth. This gyre is centred at about 35°S, 155°E on the offshore side of<br />
the EAC <strong>and</strong> west of Challenger Plateau. All indications are that the eastern Tasman region overlying<br />
Challenger Plateau is not very energetic.<br />
This is in contrast with the east coast of both the North <strong>and</strong> South Isl<strong>and</strong>s, <strong>and</strong> Cook Strait, which are<br />
highly energetic. Campbell Plateau waters are well mixed though nutrient limited (iron), leading to<br />
tight coupling between trophic levels (Bradford-Grieve et al. 2003). The Subtropical Front lies along<br />
the Chatham Rise <strong>and</strong> turbulence <strong>and</strong> upwelling results in relatively high primary productivity in the<br />
area.<br />
8.2. Indicators <strong>and</strong> trends<br />
8.2.1. Sea temperature<br />
Sea surface temperature (SST), sea surface height (SSH), air temperature <strong>and</strong> ocean temperature to<br />
800m depth, all exhibit some correlation with each other over seasonal <strong>and</strong> inter-annual time scales<br />
(Hurst et al. <strong>2012</strong>). Air temperatures have increased by about 1°C since 1900 (Figure 8.6).<br />
Figure 8.6: <strong>Annual</strong> time series in New Zeal<strong>and</strong>. NOAA annual mean sea surface temperatures (blue line) 25 <strong>and</strong><br />
NIWA’s seven-station annual mean air temperature composite series (red line), expressed as anomalies relative to the<br />
1971-2000 climatological average. Linear trends over the period 1909-2009, in °C/century, are noted under the graph.<br />
(Image Source Mullan et al. 2010)<br />
Although a linear trend has been fitted to the seven-station temperatures in Figure 8.6, the variations<br />
in temperature over time are not completely uniform. For example, a markedly large warming<br />
occurred through the periods 1940-1960 <strong>and</strong> 1990-2010. These higher frequency variations can be<br />
related to fluctuations in the prevailing north-south airflow across New Zeal<strong>and</strong> (Mullan et al. 2010).<br />
Temperatures are higher in years with stronger northerly flow, <strong>and</strong> are lower in years with stronger<br />
southerly flow. One would expect this, since southerly flow transports cool air from the Southern<br />
Oceans up over New Zeal<strong>and</strong><br />
25 http://www.ncdc.noaa.gov/oa/climate/research/sst/ersstv3.php<br />
193
AEBAR <strong>2012</strong>: Ecosystem effects: NZ regional climate <strong>and</strong> oceanic setting<br />
The unusually steep warming in the 1940-1960 period is paralleled by an unusually large increase in<br />
northerly flow during this same period Mullan et al. (2010). On a longer timeframe, there has been a<br />
trend towards less northerly flow (more southerly) since about 1960 Mullan et al. (2010). However,<br />
New Zeal<strong>and</strong> temperatures have continued to increase over this time, albeit at a reduced rate<br />
compared with earlier in the 20 th century. This is consistent with a warming of the whole region of the<br />
southwest Pacific within which New Zeal<strong>and</strong> is situated (Mullan et al. 2010).<br />
Mullan et al. 2010 describe the pattern of warming in New Zeal<strong>and</strong> as consistent with changes in sea<br />
surface temperature <strong>and</strong> prevailing winds. Their review shows enhanced rates of warming (in units of<br />
°C/decade) down the Australian coast <strong>and</strong> to the east of the North Isl<strong>and</strong>, <strong>and</strong> much lower rates of<br />
warming south <strong>and</strong> east of the South Isl<strong>and</strong> (Figure 8.7).<br />
Figure 8.7: Trends in sea surface temperature, in °C/decade over the period 1909-2009, calculated from the<br />
NOAA_ERSST_v3 data-set (provided by NOAA’s ESRL Physical Sciences Division, Boulder, Colorado, USA, from<br />
their web site at http://www.esrl.noaa.gov/psd/). The data values are on a 2° latitude-longitude grid. The box around<br />
New Zeal<strong>and</strong> denotes the region used to produce the area-averaged sea temperatures plotted in Figure 2. (Image<br />
Source Mullan et al. 2010.)<br />
Figure 8.8 gives a broader spatial picture at much higher resolution (but a shorter period, since 1982).<br />
It is apparent that sea temperatures are increasing north of about 45°S; they are increasing more<br />
slowly, <strong>and</strong> actually decreasing in recent decades, off the Otago coast <strong>and</strong> south of New Zeal<strong>and</strong>. This<br />
regional pattern of cooling (or only slow warming) to the south, <strong>and</strong> strong warming in the Tasman<br />
<strong>and</strong> western Pacific can be related to increasing westerly winds <strong>and</strong> their effect on ocean circulation<br />
Mullan et al. (2010). Thompson <strong>and</strong> Solomon (2002) discuss the increase in Southern Hemisphere<br />
westerlies <strong>and</strong> the relationship to global warming; Roemmich et al. (2007) describe recent ocean<br />
circulation changes; Thompson et al. (2009) discuss the consequent effect on sea surface temperatures<br />
in the Tasman Sea.<br />
194
AEBAR <strong>2012</strong>: Ecosystem effects: NZ regional climate <strong>and</strong> oceanic setting<br />
Figure 8.8: Trends in sea surface temperature, in °C/decade over the period 1982-2009. The data are again taken<br />
from NOAA, but are based on daily interpolated satellite measurements over a much finer 0.25° grid. See<br />
http://www.ncdc.noaa.gov/oa/climate/research/sst/oi-daily.php. This product is the result of an objective analysis, an<br />
optimum interpolation rather than a pure satellite retrieval, so as to correct for issues like the effect of the Mt<br />
Pinatubo eruption aerosols on satellite detected radiances. It is described in Reynolds et al. (2007)<br />
Sea surface temperatures (SST) derived from satellite data have been compared to empirical CTD<br />
measurements made from relevant sub-areas of the Chatham Rise <strong>and</strong> Sub-Antarctic during trawl<br />
surveys. This showed good correlations, reassuring us that satellite-derived SST provided a realistic<br />
measure of sea surface temperature for these regions in years before CTD data were available<br />
O’Driscoll et al. 2011).<br />
Coastal SST data, particularly the longer time series from Leigh <strong>and</strong> Portobello, have been used in<br />
studies attempting to link processes in the marine environment with temperature. The negative<br />
relationship between SST <strong>and</strong> SOI is broadly consistent across the 40 years of data although the<br />
pattern is less clear post 1997 (Figure 8.9). The clearest fisheries example of a link between coastal<br />
SST <strong>and</strong> fish recruitment <strong>and</strong> growth is for northern stocks of snapper (Pagras auratus), where<br />
relatively high recruitment <strong>and</strong> faster growth rates have been correlated with warmer conditions from<br />
the Leigh SST series (Francis 1993, 1994a).<br />
Figure 8.9: Sea surface temperature (SST) anomolies from SST measurements at Leigh (Auckl<strong>and</strong> University Marine<br />
Laboratory) <strong>and</strong> Southern Oscillation Index (SOI) anomalies. (Image from Hurst et al <strong>2012</strong>.)<br />
195
AEBAR <strong>2012</strong>: Ecosystem effects: NZ regional climate <strong>and</strong> oceanic setting<br />
Temperature fluctuations also occur at depth in the ocean as demonstrated by changes in temperature<br />
down to 800 m in the eastern Tasman Sea between 1992 <strong>and</strong> 2008 (Figure 8.10).<br />
The ocean temperature between Sydney <strong>and</strong> Wellington has been sampled about four times per year<br />
since 1991. The measurements are made in collaboration with the Scripps Institution of<br />
Oceanography. Analyses of the subsurface temperature field using these data include Sutton &<br />
Roemmich (2001) <strong>and</strong> Sutton et al. (2005). The index presented for this transect (Figure 8.10) is for<br />
the most eastern section closest to New Zeal<strong>and</strong> (161.5°E <strong>and</strong> 172°E). The eastern Tasman is chosen<br />
because it is closer to New Zeal<strong>and</strong>, <strong>and</strong> because it has less oceanographic variability which can mask<br />
subtle interannual changes. The section of the transect shown is along fairly constant latitude is<br />
therefore unaffected by latitudinal temperature <strong>and</strong> seasonal cycle variation. The upper panel shows<br />
the temperature averaged along the transect between the surface <strong>and</strong> 800m <strong>and</strong> from 1991 to the most<br />
recent sampling.<br />
Figure 8.10: Eastern Tasman ocean temperature: Wellington to Sydney 1991–2008. Coloured scale to the right is<br />
temperature °C. (Image from Hurst et al. <strong>2012</strong>, after Sutton et al. 2005)<br />
The seasonal cycle is clearly visible in the upper 100–150m. There is a more subtle warming signal<br />
that occurred through the late 1990s, which is apparent by the isotherms increasing in depth through<br />
that time period. This warming was significant in that it extended to the full 800m of the<br />
measurements (effectively the full depth of the eastern Tasman Sea). It also began during an El Niño,<br />
period when conditions would be expected to be cool. Finally, it was thought to be linked to a largescale<br />
warming event centred on 40°S that had hemispheric <strong>and</strong> perhaps global implications. This<br />
warming has been discussed by Sutton et al. (2005) who examined the local signals, Bowen et al.<br />
(2006) who studied the propagation of the signal into the New Zeal<strong>and</strong> area, <strong>and</strong> Roemmich et al.<br />
(2007), who examined the broad-scale signal over the entire South Pacific Ocean. Roemmich et al.<br />
(2007) hypothesized that the ultimate forcing was due to an increase in high latitude westerly winds<br />
effectively speeding up the entire South Pacific gyre.<br />
Other phenomena have led to periods of warming that are not as yet fully understood. In particular a<br />
period of widespread warming in the Tasman Sea to depths of at least 800 m, 1996–2002 (Sutton et<br />
196
AEBAR <strong>2012</strong>: Ecosystem effects: NZ regional climate <strong>and</strong> oceanic setting<br />
al. 2005). Both stochastic environmental variability <strong>and</strong> predictable cycles of change influence the<br />
productivity <strong>and</strong> distribution of marine biota in our region.<br />
8.2.2. Climate variables<br />
The Interdecadal Pacific Oscillation (IPO) is a Pacific-wide reorganisation of the heat content of the<br />
upper ocean <strong>and</strong> represents large-scale, decadal temperature variability, with changes in phase (or<br />
“regime shifts”) over 10–30 year time scales. In the past 100 years, regime shifts occurred in 1925,<br />
1947, 1977 <strong>and</strong> 2000 (Figure 8.11). The latest shift should result in New Zeal<strong>and</strong> experiencing<br />
periods of reduced westerlies, with associated warmer air <strong>and</strong> sea temperatures <strong>and</strong> reduced upwelling<br />
on western coasts (Hurst et al. <strong>2012</strong>).<br />
Figure 8.11: Smoothed index of the Interdecadal Pacific Oscillation (IPO) since 1900. (Image source NIWA based on<br />
data from the United Kingdom Meteorological Office, UKMO).<br />
The El Niño-Southern Oscillation (ENSO) cycle in the tropical Pacific has a strong influence on New<br />
Zeal<strong>and</strong>. ENSO is described here by the Southern Oscillation Index (SOI), a measure of the difference<br />
in mean sea-level pressure between Tahiti (east Pacific) <strong>and</strong> Darwin (west Pacific). When the SOI is<br />
strongly positive, a La Niña event is taking place <strong>and</strong> New Zeal<strong>and</strong> tends to experience more north<br />
easterlies, reduced westerly winds, <strong>and</strong> milder, more settled, warmer anticyclonic weather <strong>and</strong> warmer<br />
sea temperatures (Hurst et al. <strong>2012</strong>). When the SOI is strongly negative, an El Niño event is taking<br />
place <strong>and</strong> New Zeal<strong>and</strong> tends to experience increased westerly <strong>and</strong> south-westerly winds <strong>and</strong> cooler,<br />
less settled weather <strong>and</strong> enhanced along shelf upwelling off the west coast South Isl<strong>and</strong> <strong>and</strong> north east<br />
North Isl<strong>and</strong> (Shirtcliffe 1990, Zeldis et al. 2004, Chang & Mullan 2003). The SOI is available<br />
monthly from 1876 (Mullan 1995) (Figure 8.12).<br />
Figure 8.12: Southern Oscillation Index (SOI) 13-month running mean 1876-2010. Red indicates warmer<br />
temperatures, blue indicates cooler conditions for New Zeal<strong>and</strong>. (Image courtesy of NIWA.)<br />
197
AEBAR <strong>2012</strong>: Ecosystem effects: NZ regional climate <strong>and</strong> oceanic setting<br />
8.2.3. Ocean acidification<br />
An increase in atmospheric CO2 since the industrial revolution has been paralleled by an increase in<br />
CO2 concentrations in the upper ocean (Sabine et al. 2004), with global ocean uptake on the order of<br />
~2 gigatonnes (Gt) per annum (~30% of global anthropogenic emissions, IPCC, 2001a). The<br />
anthropogenic CO2 signal is apparent to an average depth of ~1000m.<br />
The increasing rate of CO2 input from the atmosphere has surpassed the ocean’s natural buffering<br />
capacity <strong>and</strong> so the surface of the ocean ocean is becoming more acidic. This is because carbon<br />
dioxide absorbed by seawater reacts with H2O to form carbonic acid, the dissociation of which<br />
releases hydrogen ions, so raising the acidity <strong>and</strong> lowering pH of seawater. Since1850, average<br />
surface ocean pH has decreased by 0.1 units, with a further decrease of 0.4 units to 7.9 predicted by<br />
2100 (Houghton et al, 2001). The pH scale is logarithmic, so a 0.4 pH decrease corresponds to a<br />
150% increase in hydrogen ion concentration. Both the predicted pH in 2100 <strong>and</strong> the rate of change in<br />
pH are outside the range experienced by the oceans for at least half a million years. In the absence of<br />
any decrease in CO2 emissions this trend is proposed by Caldeira & Wickett, (2003) to continue.<br />
In New Zeal<strong>and</strong>, the projected change in surface water pH between 1990 <strong>and</strong> 2070 is a decrease of<br />
0.15-0.18 pH units (Hobday et al. 2006). The only time series of dissolved pCO2 <strong>and</strong> pH in NZ<br />
waters is the bimonthly sampling of a transect across neritic, subtropical <strong>and</strong> subantarctic waters off<br />
the Otago shelf since 1998 (University of Otago/NIWA Munida Otago Shelf Time Series). Dissolved<br />
pCO2shows some indication of an increase although this is not linear <strong>and</strong> does not correlate with rise<br />
in atmospheric CO2 (see Fig 8.13).<br />
Figure 8.13: pCO 2 (partial pressure of CO 2) in subantarctic surface seawater from the R.V. Munida transect, 1998–<br />
<strong>2012</strong>. (Image courtesy of K. Currie, NIWA)<br />
The Munida time-series pH data shows a decline in subantarctic surface waters since 1998 (Fig 8.14).<br />
Addition of a sine-wave function to the pH data suggests a) a linear decline in surface water pH <strong>and</strong> b)<br />
that winter time pH values are consistent with that expected from equilibrium with atmospheric CO2<br />
as recorded at the NIWA Baring Head atmospheric station (K. Hunter (U. Otago) & K. Currie<br />
(NIWA), pers comm.). The oscillations are primarily due to seasonal changes in water temperature<br />
<strong>and</strong> biological removal of dissolved carbon in the seawater. The time series sampling period is<br />
currently too short to distinguish long-term changes from seasonal <strong>and</strong> interannual variability, <strong>and</strong> it is<br />
not yet possible to attribute observed changes to uptake of anthropogenic carbon dioxide.<br />
198
AEBAR <strong>2012</strong>: Ecosystem effects: NZ regional climate <strong>and</strong> oceanic setting<br />
Figure 8.14: pH in Sub- Antarctic surface seawater on the R.V. Munida transect, 1998–2006. The blue points <strong>and</strong><br />
joining lines are the actual measurements, <strong>and</strong> the red line a best fit to the points using a sine wave function (to<br />
represent seasonal change). The black line represents what pH assuming equilibrium with the atmosphere<br />
concentration in the Year 1750. The yellow line is the pH assuming equilibrium with actual CO2 concentrations<br />
measured at the NIWA Baring Head Atmospheric Station. pH 25 is the pH measured at 25 o C (Image Source: A<br />
Southern Hemisphere Time Series for CO2 Chemistry <strong>and</strong> pH K. Hunter, K.C. Currie, M.R. Reid, H. Doyle. A<br />
presentation made at the International Union of Geodesy <strong>and</strong> Geophysics (IUGG) General Assembly Meeting,<br />
Melbourne June 2011.)<br />
Globally, open ocean seawater pH shows relatively low spatial <strong>and</strong> temporal variability, compared to<br />
coastal waters where pH may vary by up to 1 unit in response to precipitation, biological activity in<br />
the seawater <strong>and</strong> sediment <strong>and</strong> other coastal processes. Surface pH in the open ocean has been<br />
determined on a monthly basis at the BATS (Bermuda Time Series Station) in the North Atlantic<br />
since 1983 (Bates 2001, 2007), <strong>and</strong> at HOT (Hawaiit Time Series Station) in the North Pacific since<br />
1988 (Brix et al. 2004, Dore et al. 2009). Both time series records show long term trends of increasing<br />
pCO2 (partial pressure of CO2) <strong>and</strong> decreasing pH, with the pCO2 increasing at a rate of 1.25 μatm per<br />
year, <strong>and</strong> pH decreasing by 0.0012 pH units per annum since 1983 at Bermuda (Figure 8.15). Placed<br />
in the context of these longer time series of atmospheric CO2 measurements, the short record of the<br />
Munida SubAntarctic Water time series shows pCO2 <strong>and</strong> pH in surface seawater tracking the<br />
atmospheric CO2 (Figure 8.14). In addition, the regional means of seawater pH differ significantly<br />
with temperature, with the South Pacific at the lower end (Feely et al 2009).<br />
199
AEBAR <strong>2012</strong>: Ecosystem effects: NZ regional climate <strong>and</strong> oceanic setting<br />
Figure 8.15: Time series of atmospheric carbon dioxide at Moana Loa, seawater carbon dioxide <strong>and</strong> surface ocean pH<br />
at Ocean station ALOHA in the subtropical North Pacific Ocean near Hawaii. pH is shown as in situ pH, based on<br />
direct measurements <strong>and</strong> calculated from dissolved inorganic carbon <strong>and</strong> alkalinity in the surface layer (after Dore et<br />
al. 2009). (Image directly sourced from Feely et al. 2009 with permission.)<br />
Biological implications of ocean acidification result from increasing dissolved pCO2, increasing<br />
hydrogen ions (decreasing pH) <strong>and</strong> decreasing carbonate availability. The concern about ocean<br />
acidification is that the resulting reduction in carbonate availability may potentially impact organisms<br />
that produce shells or body structures of calcium carbonate, resulting in a redistribution of an<br />
organism’s metabolic activity <strong>and</strong> increased physiological stress. Organisms most likely to be affected<br />
are those at the base of the food chain (bacteria, protozoa, plankton), coralline algae, rhodoliths,<br />
shallow <strong>and</strong> deepwater corals, echinoderms, molluscs, <strong>and</strong> possibly cephalopods (e.g., squids) <strong>and</strong><br />
high-activity pelagic fish (e.g., tunas) (see Feely et al. 2004 <strong>and</strong> references therein; Orr et al. 2005,<br />
Langer et al. 2007). This is particularly of concern for deep-sea habitats such as seamounts, which can<br />
support structural reef-like habitat composed of stony corals (Tracey et al. 2011) as well as<br />
commercial fisheries for species such as orange roughy (Clark 1999). A shoaling carbonate saturation<br />
horizon could push such biogenic structures to the tops of seamounts, or cause widespread die-back<br />
(e.g., Thresher et al. <strong>2012</strong>). This has important implications for the structure <strong>and</strong> function of benthic<br />
communities, <strong>and</strong> perhaps also for the deep-sea ecosystems that support New Zeal<strong>and</strong>’s key<br />
deepwater fisheries. Conversely some groups, including phytoplankton <strong>and</strong> sea-grass, may benefit<br />
from the increase in dissolved pCO2 due to increased photosynthesis.<br />
Direct effects of acidification on the physiology <strong>and</strong> development of fish have also been investigated.<br />
This has particularly focussed on the freshwater stages of salmonids (due to the widespread<br />
occurrence of pollution-derived acid rain) but increasingly in marine fish, where adverse effects on<br />
physiology development have been documented (e.g. Franke, <strong>and</strong> Clemmesen, 2011). Such studies<br />
highlight the potential for increasing acidification to impact larval growth <strong>and</strong> development, with<br />
implications for survival <strong>and</strong> recruitment of both forage fish <strong>and</strong> fish harvested commercially.<br />
200
AEBAR <strong>2012</strong>: Ecosystem effects: NZ regional climate <strong>and</strong> oceanic setting<br />
8.3. Ocean climate trends <strong>and</strong> New Zeal<strong>and</strong> fisheries<br />
This section has been quoted almost directly from the summary in Hurst et al. (<strong>2012</strong>). Some general<br />
observations on recent trends in some of the key ocean climate indices that have been found to be<br />
correlated with a variety of biological processes among fish (including recruitment fluctuations,<br />
growth, distribution, productivity <strong>and</strong> catch rates) are:<br />
The Interdecadal Pacific Oscillation (IPO): available from 1900; time scale 10–30 years. The IPO<br />
has been found to have been correlated with decadal changes (‘regime shifts’) in northeast Pacific<br />
ecosystems (e.g., Alaska salmon catches). In the New Zeal<strong>and</strong> region, there is evidence of a<br />
regime shift into the negative phase of the IPO in about 2000. During the positive phase, from the<br />
late 1970’s to 2000, New Zeal<strong>and</strong> experienced periods of enhanced westerlies, with associated<br />
cooler air <strong>and</strong> sea temperatures <strong>and</strong> enhanced upwelling on western coasts. Opposite patterns are<br />
expected under a negative phase. For most New Zeal<strong>and</strong> fisheries, monitoring of changes in<br />
populations began since the late 1970’s, so there is little information on how New Zeal<strong>and</strong><br />
fishstocks might respond to these longer-term climatic fluctuations. Some of the recent changes in<br />
fish populations since the mid 1990s, for example, low western stock hoki recruitment indices<br />
(Francis 2009) <strong>and</strong> increases in some elasmobranch abundance indices (Dunn et al. 2009) may be<br />
shorter-term fluctuations that might be related in some way to regional warming during the period<br />
<strong>and</strong> only longer-term monitoring will establish whether they might be related to longer-term<br />
ecosystem changes.<br />
The Southern Oscillation Index: available from 1876; best represented as annual means. Causal<br />
relationships of correlations of SOI with fisheries processes are poorly understood but probably<br />
related in some way to one or more of the underlying ocean climate processes such as winds or<br />
temperatures. When the index is strongly negative, an El Niño event is taking place <strong>and</strong> New<br />
Zeal<strong>and</strong> tends to experience increased westerly <strong>and</strong> south-westerly winds, cooler sea surface<br />
temperatures <strong>and</strong> enhanced upwelling in some areas (see, for example, the correlation of monthly<br />
SST at Leigh <strong>and</strong> SOI indices, Figure 8.13). Upwelling has been found to be related to increased<br />
nutrient flux <strong>and</strong> phytoplankton growth in areas such as the west coast South Isl<strong>and</strong>, Pelorus<br />
Sound <strong>and</strong> north-east coast of the North Isl<strong>and</strong> (Willis et al. 2007, Zeldis et al. 2008). El Niño<br />
events are likely to occur on 3–7 year time scales <strong>and</strong> are likely to be less frequent during the<br />
negative phase of the IPO which began in about 2000. This is likely to impact positively on<br />
species that show stronger recruitment under increased temperature regimes (e.g., snapper,<br />
Francis 1993, 1994a, b).<br />
Surface wind <strong>and</strong> pressure patterns: available from 1940s; variation in patterns can be high over<br />
monthly <strong>and</strong> annual time scales <strong>and</strong> many of the indices are correlated with each other, <strong>and</strong> with<br />
SOI <strong>and</strong> IPO indices (e.g., more zonal westerly winds, more frequent or regular cycles in<br />
southerlies in the positive IPO, 1977–2000). Correlations with biological process in fish stocks<br />
may occur over short time scales (e.g., impact on fish catchability) as well as seasonal <strong>and</strong> annual<br />
scales (e.g., impact on recruitment success). Wind <strong>and</strong> pressure patterns have been found to be<br />
correlated with fish abundance indices for southern gemfish (Renwick et al. 1998), hake, red cod<br />
<strong>and</strong> red gurnard (Dunn et al. 2008), rock lobster (Booth et al. 2000), <strong>and</strong> southern blue whiting<br />
(Willis et al. 2007, Hanchet & Renwick, 1999). Causal relationships of these correlations are<br />
poorly understood but can be factored into hypothesis testing as wind <strong>and</strong> pressure patterns affect<br />
surface ocean conditions through heat flux, upwelling <strong>and</strong> nutrient availability on exposed coasts.<br />
Temperature <strong>and</strong> sea surface height: available at least monthly over long time scales (air<br />
temperatures from 1906) or relatively short time scales (ocean temperatures to 800m, SST <strong>and</strong><br />
SSH variously from 1987). Ocean temperatures, SST <strong>and</strong> SSH are all correlated with each other<br />
<strong>and</strong> smoothed air temperatures correlate well with SST in terms of interannual <strong>and</strong> seasonal<br />
variability; there are also some correlations of SST <strong>and</strong> SSH with surface wind <strong>and</strong> pressure<br />
patterns (see Dunn et al. 2009). SST has been found to be correlated with relative fish abundance<br />
201
AEBAR <strong>2012</strong>: Ecosystem effects: NZ regional climate <strong>and</strong> oceanic setting<br />
indices (derived from fisheries <strong>and</strong>/or trawl surveys) for elephantfish, southern gemfish, hoki, red<br />
cod, red gurnard, school shark, snapper, stargazer <strong>and</strong> tarakihi (Francis 1994a,b, Renwick et al<br />
1998, Beentjes & Renwick 2001, Gilbert & Taylor 2001, Dunn et al 2009). Air temperatures in<br />
New Zeal<strong>and</strong> have increased since 1900; most of the increase occurred since the mid 1940s.<br />
Increases from the late 1970s to 2000 may have been moderated by the positive phase of the IPO.<br />
Coastal SST records from 1954 (at Portobello) also show a slight increase through the series <strong>and</strong>,<br />
in general, show strong correlations with SOI (i.e., cooler temperatures in El Niño years). Other<br />
time series (SSH, ocean temperature to 800m) are comparatively short but show cycles of warmer<br />
<strong>and</strong> cooler periods on 1–6 year time scales. All air <strong>and</strong> ocean temperature series show the<br />
significant warming event during the late 1990s which has been followed by some cooling, but<br />
not to the levels of the early 1990s.<br />
Ocean colour <strong>and</strong> upwelling: these will be important time series because they potentially have a<br />
more direct link to biological processes in the ocean <strong>and</strong> are more easily incorporated into<br />
hypothesis testing. The ocean colour series starts in late 1997, so is not able to track changes that<br />
may have occurred since before the late 1990s warming cycle. These indices also need to be<br />
analysed with respect to SST, SSH <strong>and</strong> wind patterns, at similar locations or on similar spatial<br />
scales. The preliminary series developed exhibit some important spatial differences <strong>and</strong> trends<br />
that may warrant further investigation in relation to fish abundance indices. Of note are the<br />
increased chlorophyll indices off the west <strong>and</strong> south-west coast of the South Isl<strong>and</strong> in<br />
spring/summer during the last 5–6 years <strong>and</strong> the relatively low upwelling indices off the west<br />
coast South Isl<strong>and</strong> during winter in the late-1990s (Hurst et al. <strong>2012</strong>).<br />
Currents: there are no general indices of trends or variability at present. Improvements in<br />
monitoring technology (e.g., satellite observations of SSH; CTD; ADCP; ARGO floats) have<br />
resulted in more information becoming available to enable numerical models of ocean currents to<br />
be developed. On the open ocean scale, there is considerable complexity in the New Zeal<strong>and</strong> zone<br />
(e.g., frontal systems, eddy systems of the east coast). In the coastal zone, this is further<br />
complicated in coastal areas by the effects of tides, winds <strong>and</strong> freshwater (river) forcing, <strong>and</strong> a<br />
more limited monitoring capability. Nevertheless, the importance of current systems is starting to<br />
become more recognised <strong>and</strong> incorporated into analysis <strong>and</strong> modelling of fisheries processes <strong>and</strong><br />
trends. Recent examples include the retention of rock lobster phyllosoma (mid-stage larvae) in<br />
eddy systems (Chiswell & Booth 2005, 2007), the apparent bounding of orange roughy nursery<br />
grounds by the presence of a cold-water front (Dunn et al. 2009) <strong>and</strong> the drift of toothfish eggs<br />
<strong>and</strong> larvae (Hanchet et al. 2008).<br />
Acidification: The increase in atmospheric CO2 has been paralleled by an increase in CO2<br />
concentrations in the upper ocean, resulting in a decrease in pH. Maintenance of the one existing<br />
New Zeal<strong>and</strong> monitoring programme for pH <strong>and</strong> pCO2, <strong>and</strong> development of new programmes to<br />
monitor the impacts of pH on key groups of organisms are critical. Potentially vulnerable groups<br />
include organisms that produce shells or body structures of calcium carbonate (corals, molluscs,<br />
plankton, coralline algae), <strong>and</strong> also non-calcifying groups including plankton, squid <strong>and</strong> highactivity<br />
pelagic fishes. Potentially positive impacts of acidification include increased<br />
phytoplankton carbon fixation <strong>and</strong> vertical export <strong>and</strong> increased productivity of sub-tropical<br />
waters due to enhanced nitrogen fixation by cyanobacteria. Secondary effects at the ecosystem<br />
level, such as productivity, biomass, community composition <strong>and</strong> biogeochemical feedbacks, also<br />
need to be considered.<br />
Climate change was not specifically addressed as part of the report by Hurst et al. (<strong>2012</strong>), although<br />
indices described are an integral part of monitoring the speed <strong>and</strong> impacts of climate change. As noted<br />
under the air temperature section, the slightly increasing trend in temperatures since the mid 1940s is<br />
likely to have been moderated by the positive phase of the IPO, from the late 1970s to the late 1990s.<br />
With the shift to a negative phase of the IPO in 2000, it is likely that temperatures will increase more<br />
steeply. Continued monitoring of the ocean environment <strong>and</strong> response is critical. This includes not<br />
only the impacts on productivity, at all levels, but also on increasing ocean acidification.<br />
202
AEBAR <strong>2012</strong>: Ecosystem effects: NZ regional climate <strong>and</strong> oceanic setting<br />
For the New Zeal<strong>and</strong> region, key ocean climate drivers in the last decade have been:<br />
• the significant warming event in the late 1990s<br />
• the regime shift to the negative phase of the IPO in about 2000, which is likely to result in<br />
fewer El Niño events for a 20–30 year period, i.e., less zonal westerly winds (already apparent<br />
compared to the 1980–2000 period) <strong>and</strong> increased temperatures; this is the first regime shift<br />
to occur since most of our fisheries monitoring time series have started (the previous shift was<br />
in the late 1970s), <strong>and</strong><br />
• global trends of increasing air <strong>and</strong> sea temperatures <strong>and</strong> ocean acidification.<br />
8.4. References<br />
Bates, N.R. 2001. Interannual variability of oceanic CO2 <strong>and</strong> biogeochemical properties in the Western North Atlantic subtropical gyre.<br />
Deep-Sea Research II. 48:1507–1528.<br />
Bates, N.R. 2007. Interannual variability of the oceanic CO2 sink in the subtropical gyre of the North Atlantic Ocean over the last 2 decades.<br />
J. Geophysical Res. 112, C09013, doi:10.1029/2006JC003759, 2007<br />
Beentjes, M.P., Renwick, J.A. 2001. The relationship between red cod, Pseudophycis bachus, recruitment <strong>and</strong> environmental variables in<br />
New Zeal<strong>and</strong>. <strong>Environment</strong>al Biology of Fishes 61: 315–328.<br />
Bowen, M. M., Sutton, P.J.H., Roemmich, D. 2006. Wind-driven <strong>and</strong> steric fluctuations of sea surface height in the southwest Pacific,<br />
Geophys. Res. Lett., 33, L14617, doi:10.1029/2006GL026160.<br />
Brix, H; Gruber, N., Keeling, C.D. 2004. Interannual variability of the upper ocean carbon cycle at station ALOHA near Hawaii Global<br />
Biogeochemical Cycles 18(4) GB4019 Nov 24 2004.<br />
Caldeira, K., Wickett, M.E. 2003. Anthropogenic carbon <strong>and</strong> ocean pH. Nature 425:365.<br />
Chang, F.H., Mullan, B. 2003. Occurrence of major harmful algal blooms in New Zeal<strong>and</strong>: is there a link with climate variation. The<br />
Climate Update 53: 4.<br />
Chiswell SM 1996. Variability in the Southl<strong>and</strong> Current, New Zeal<strong>and</strong>. New Zeal<strong>and</strong> Journal of Marine <strong>and</strong> Freshwater Research 30: 1-17.<br />
Chiswell, S.M; Booth, J.D. 2005. Distribution of mid- <strong>and</strong> late-stage Jasus edwardsii phyllosomas: implications for larval transport. New<br />
Zeal<strong>and</strong> Journal of Marine <strong>and</strong> Freshwater Research 39. 1157–1170.<br />
Chiswell, S.M; Booth, J.D. 2007. Sources <strong>and</strong> sinks of larval settlement in Jasus edwardsii around New Zeal<strong>and</strong>: Where do larvae come<br />
from <strong>and</strong> where do they go? Marine Ecology Progress Series 354: 201-217.<br />
Clark, M.R. (1999). Fisheries for orange roughy (Hoplostethus atlanticus) on seamounts in New Zeal<strong>and</strong>. Oceanologica Acta 22(6): 593-602<br />
Dore, J.E., R. Lukas, D.W. Sadler, M.J. Church, <strong>and</strong> D.M. Karl. 2009. Physical <strong>and</strong> biogeochemical modulation of ocean acidification in the<br />
central North Pacific. Proceedings of the National Academy of Sciences of the United States of America 106(30):12,235–12,240.<br />
Dunn, M.R.; Hurst, R.; Renwick J.; Francis, R.I.C.C.; Devine, J.; McKenzie, A. 2009 . Fish abundance <strong>and</strong> climate trends in New Zeal<strong>and</strong>.<br />
New Zeal<strong>and</strong> <strong>Aquatic</strong> <strong>Environment</strong> <strong>and</strong> <strong>Biodiversity</strong> Report No. 31. 75 p.<br />
Feely, R. A.; Sabine, Christopher L.; Lee, Kitack; Berelson, Will; Kleypas, Joanie; Fabry, Victoria J.; Millero, Frank J. (2004). "Impact of<br />
Anthropogenic CO2 on the CaCO3 System in the Oceans" (abstract). Science 305 (5682): 362–366.<br />
doi:10.1126/science.1097329. PMID 15256664<br />
Feely, RA. Doney, SC. Cooley, SR. (2009). Ocean Acidification. Present conditions <strong>and</strong> future changes in a high CO2 world. Oceanography<br />
Volume 22(4): 36-47.<br />
Francis M.P. 1993. Does water temperature determine year class strength in New Zeal<strong>and</strong> snapper (Pagrus auratus, Sparidae)? Fisheries<br />
Oceanography 2(2): 65–72.<br />
Francis, M.P. 1994a. Growth of juvenile snapper, Pagrus auratus (Sparidae). New Zeal<strong>and</strong> Journal of Marine <strong>and</strong> Freshwater Research 28:<br />
201–218.<br />
Francis, M.P. 1994b. Duration of larval <strong>and</strong> spawning periods in Pagrus auratus (Sparidae) determined from otolith daily increments.<br />
<strong>Environment</strong>al biology of Fishes 39: 137–152.<br />
Franke, A. <strong>and</strong> Clemmesen, C. (2011). Effect of ocean acidification on early life stages of Atlantic herring (Clupea harengus L.).<br />
Biogeosciences Discuss., 8, 7097– 7126.<br />
Gilbert D.J., Taylor, P.R. 2001. The relationship between snapper (Pagrus auratus) year class strength <strong>and</strong> temperature for SNA2 <strong>and</strong><br />
SNA7. New Zeal<strong>and</strong> Fisheries Assessment report 2001/64. 33p.<br />
Gordon DP, Beaumont J, MacDiarmid A, Robertson DA, Ahyong ST (2010) Marine <strong>Biodiversity</strong> of Aotearoa New Zeal<strong>and</strong>. PLoS ONE<br />
5(8): e10905. doi:10.1371/journal.pone.0010905<br />
Hanchet, S. M., Renwick, J. A. 1999: Prediction of year class strength in southern blue whiting (Micromesistius australis) in New Zeal<strong>and</strong><br />
waters. New Zeal<strong>and</strong> Fisheries Assessment Research Document 99/51. 24 p.<br />
Hanchet, S.M., Fenaughty, J.M., Dunn, A., Williams, M.J.H. 2008. A hypothetical life cycle for Antarctic toothfish (Dissostichus mawsoni)<br />
in the Ross Sea region CCAMLR Science 15: 35–53.<br />
Heath RA 1985. A review of the physical oceanography of the seas around New Zeal<strong>and</strong>.1982. New Zeal<strong>and</strong> Journal of Marine <strong>and</strong><br />
Freshwater Research 19: 79.124.<br />
Hobday, A.J, Okey, T.A, Poloczanska, E.S., Kunz, T.J., Richardson, A.J. 2006. Impacts of Climate Change on Australian Marine Life.<br />
CSIRO Marine <strong>and</strong> Atmospheric Research report to the Department of the <strong>Environment</strong> <strong>and</strong> Heritage<br />
Houghton J.T., Ding, Y., Griggs, D.J., Noguer, M. van der Linden, P.J., Dai, X., Maskaell, K., Johnson, C.A. 2001. Climate change 2001:<br />
the scientific basis. Contribution of Working Group I to the third Assessment. Report of the International Panel on Climate<br />
Change. Cambridge University Press, Cambridge, UK.<br />
Hurst, R.J. Renwick, J.A. Sutton, P.J.H Uddstrom, M.J. Kennan, S.C. Law, C.S. Rickard, G.J. Korpela, A. Stewart, C. Evans J. (<strong>2012</strong>In<br />
press). Climate <strong>and</strong> oceanographic trends of potential relevantce to fisheries in the New Zeal<strong>and</strong> fisheriesRegion, 2010. New<br />
Zeal<strong>and</strong> <strong>Aquatic</strong> <strong>Environment</strong> <strong>and</strong> <strong>Biodiversity</strong> Report No. 90XX. 202p.<br />
IPCC Third Assessment Report "Climate Change 2001”.<br />
Langer, G., M. Geisen, K.-H. Baumann, J. Kläs, U. Riebesell, S. Thoms, Young, J. R. 2006. Species-specific responses of calcifying algae<br />
to changing seawater carbonate chemistry, Geochem. Geophys. Geosyst., 7 : Q09006, doi:10.1029/2005GC001227<br />
203
AEBAR <strong>2012</strong>: Ecosystem effects: NZ regional climate <strong>and</strong> oceanic setting<br />
Lutz MJ, Caldeira K, Dunbar RB, Behrenfeld MJ (2007) Seasonal rhythms of net primary production <strong>and</strong> particulate organic carbon flux to<br />
depth describe the efficiency of biological pump in the global ocean. J Geophys Res Oceans 112:C10011 doi:<br />
10.1029/2006JC003706<br />
Mullan, A. B., 1995. On the linearity <strong>and</strong> stability of Southern Oscillation-climate relationships for New Zeal<strong>and</strong>. Internatinal Journal of<br />
Climatology 15: 1365–1386.<br />
Mullan, A.B; Stuart, S.J; Hadfield, M.G; Smith, M.J (2010). Report on the <strong>Review</strong> of NIWA’s ‘Seven-Station’ Temperature Series NIWA<br />
Information Series No. 78. 175 p.<br />
O’Driscoll, R.L.; Hurst, R.J.; Dunn, M.R.; Gauthier, S.; Ballara, S.L. (2011). Trends in relative mesopelagic biomass using time series of<br />
acoustic backscatter data from trawl surveys.New Zeal<strong>and</strong> <strong>Aquatic</strong> <strong>Environment</strong> <strong>and</strong> <strong>Biodiversity</strong> Report 2011/76.<br />
Orr, J.C., Fabry, V.J., Aumont, O., Bopp, L., Doney, S.C., Feely, R.A., Gnanadesikan, A., Gruber, N., Ishida, A., Joos, F., Key, R.M.,<br />
Lindsay, K., Maier-Reimer, E., Matear, R., Monfray, P., Mouchet, A., Najjar, R.G., Plattner, G-K ., Rodgers, K.B., Sabine, C.L.,<br />
Sarmiento, J.L., Schlitzer, R., Slater, R.D., Totterdell, I.J., Weirig, M-F., Yamanaka, Y., Yool, A. 2005. Anthropogenic ocean<br />
acidification over the twenty-first century <strong>and</strong> its impact on calcifying organisms. Nature 437: 681–686. Global Biogeochemical<br />
Cycles 21: GB2028, doi:10.1029/2006GB002898, 2007<br />
Philip W. Boyd & Cliff S. Law (2011). An Ocean Climate Change Atlas for New Zeal<strong>and</strong> waters A primer for a major new web-based tool<br />
to help predict how oceanic species will be affected by climate change NIWA Information Series No. 79 ISSN 1174-264X<br />
Pinkerton, M.H., Richardson, K.M., Boyd, P.W., Gall, M.P., Zeldis, J., Oliver, M.D., Murphy, R.J. 2005. Intercomparison of ocean colour<br />
b<strong>and</strong>-ratio algorithms for chlorophyll concentration in the Subtropical Front east of New Zeal<strong>and</strong>. Remote Sensing of<br />
<strong>Environment</strong> 97: 382–402.<br />
Reid JL 1986. On the total geostrophic circulation of the South Pacific Ocean: flow patterns, tracers <strong>and</strong> transports. Progress in<br />
Oceanography 16: 1-61.<br />
Renwick, J.A., Hurst, R.J., Kidson, J.W. 1998: Climatic influences on the recruitment of Southern Gemfish (Rexea sol<strong>and</strong>ri, Gempylidae) in<br />
New Zeal<strong>and</strong> waters. International Journal of Climatology 18: 1655–1667.<br />
Reynolds, R.W., Smith, T.M.; Liu, C.; Chelton, D.B.; Casey, K.S.; Schlax, M.G. (2007). Daily High-resolution Blended Analyses for sea<br />
surface temperature. Journal of Climate, 20, 5473-5496.<br />
Ridgway KR, Dunn JR 2003. Mesoscale structure of the mean East Australian Current system <strong>and</strong> its relationship with topography. Progress<br />
in Oceanography 56: 189.222.<br />
Roemmich, D., Gilson, J.,K, Davis, R., Sutton, P., Wijffels, S., Riser, S. 2007. Decadal Spin-up of the South Pacific Subtropical Gyre.<br />
Journal of Physical Oceanography 37: 162–173.<br />
Sabine, C.L., Feely, R.A., Gruber, N., Key, R.M., Lee, K., Bullister, J.L., Wanninkhof, R., Wong, C.S., Wallace, D.W., Tilbrook, B.,<br />
Millero, F.J., Peng, T.H., Kozyr, A. Ono,. T., Rios, A.F. 2004. The oceanic sink for anthropogenic CO2. Science 305:367–371.<br />
Shirtcliffe, G.G.L., Moore, M.I., Cole, A.G., Viner, A.B., Baldwin, R. Chapman, B. 1990. Dynamics of the Cape Farewell upwelling plume,<br />
New Zeal<strong>and</strong>. New Zeal<strong>and</strong> Journal of Marine <strong>and</strong> Freshwater Research 24: 555–568.<br />
Stanton BR 1981. An oceanographic survey of the Tasman Front. New Zeal<strong>and</strong> Journal of Marine <strong>and</strong> Freshwater Research 15: 289-297.<br />
Stanton BR, Ridgway NM 1988. An oceanographic survey of the subtropical convergence zone in the Tasman Sea. New Zeal<strong>and</strong> Journal of<br />
Marine <strong>and</strong> Freshwater Research 22: 583-593.<br />
Stanton BR, Sutton PJH, Chiswell SM 1997. The East Auckl<strong>and</strong> Current, 1994.95. New Zeal<strong>and</strong> Journal of Marine <strong>and</strong> Freshwater<br />
Research 31: 537-549.<br />
Sutton PJH 2003. The Southl<strong>and</strong> Current: a subantarctic current. New Zeal<strong>and</strong> Journal of Marine <strong>and</strong> Freshwater Research 37: 645--652.<br />
Sutton, P., Bowen, M., Roemmich, D. 2005. Decadal Temperature changes in the Tasman Sea. N.Z. Journal of Marine <strong>and</strong> Freshwater<br />
Research 39(6): 1321–1329.<br />
Sutton, P.J.H.; Roemmich, D.; 2001. Ocean temperature climate off north-east New Zeal<strong>and</strong>. N.Z. Journal of Marine <strong>and</strong> Freshwater<br />
Research 35: 553–565.<br />
Sutton, R.T.; Dong, B.; Gregory, J.M. (2007). L<strong>and</strong>/sea warming ratio in response to climate change: IPCC AR4 model results <strong>and</strong><br />
comparison with observations. Geophysical Research Letters, 34, L02701, doi:10.1029/2006GL028164.<br />
Thompson, D.W.J.; Solomon, S. (2002). Interpretation of recent Southern Hemisphere climate change. Science, 296, 895-899.<br />
Thompson, P.A.; Baird, M.E.; Ingleton, T.; Doblin, M.A. (2009). Long-term changes in temperature Australian waters: implications for<br />
phytoplankton. Marine Ecology Progress Series, 394, 1-19.<br />
Thresher, R.E., Guinotte, J., Matear R., Fallon S. (<strong>2012</strong>). Adapting to the effects of climate change on Australia’s deep marine reserves.<br />
Fisheries Research <strong>and</strong> Development Corporation (FRDC)/National Climate Change Adaptation Research Fund (NCCARF)<br />
Report 2010/510, 68 p.<br />
Tracey, D.M., Rowden, A.A., Mackay, K.A., Compton, T (2011) Habitat-forming cold-water corals show affinity for seamounts in the New<br />
Zeal<strong>and</strong> region. Mar Ecol Prog Ser 430: 1–22Francis R.I.C.C. 2009. Assessment of hoki (Macruronus novaezel<strong>and</strong>iae) in 2008.<br />
New Zeal<strong>and</strong> Fisheries Assessment Report 2009/7. 80p.<br />
Willis, T.J., H<strong>and</strong>ley, S.J., Chang, F.H., Morrisey, D.J., Mullan, B., Pinkerton, M., Rodgers, K.L., Sutton, P.H.J., Tait, A. 2007. Climate change<br />
<strong>and</strong> the New Zeal<strong>and</strong> marine environment. NIWA Client Report for the Department of Conservation: NEL2007-025 October 2007,<br />
NIWA Project: DOC08305<br />
Zeldis, J.R, Howard-Williams, C, Carter, C.M., Schiel, D.R. 2008. ENSO <strong>and</strong> riverine control of nutrient loading, phytoplankton biomass<br />
<strong>and</strong> mussel aquaculture yield in Pelorus Sound, New Zeal<strong>and</strong>. http://www.int-res.com/articles/meps2008/371/m371p131.pdf<br />
Zeldis, J.R. 2004. New <strong>and</strong> remineralised nutrient supply <strong>and</strong> ecosystem metabolism on the northeastern New Zeal<strong>and</strong> continental shelf.<br />
Continental Shelf Research 24: 563–581.<br />
204
AEBAR <strong>2012</strong>: Ecosystem effects: Habitats of particular significance to fisheries management<br />
9. Habitats of particular significance for fisheries<br />
management<br />
Scope of chapter This chapter highlights subject areas that might contribute to the management<br />
of HPSFM <strong>and</strong> hence provides a guide for future research in the absence of<br />
an approved policy definition of HPSFM<br />
Area All of the New Zeal<strong>and</strong> EEZ <strong>and</strong> territorial sea (inclusive of the freshwater<br />
<strong>and</strong> estuarine areas).<br />
Locality hotspots None formally defined, but already identified likely c<strong>and</strong>idates include areas<br />
of biogenic habitat, e.g. Separation Point <strong>and</strong> Wairoa Hard, <strong>and</strong> areas<br />
identified with large catches <strong>and</strong>/or vulnerable populations of juveniles, e.g.<br />
Hoki Management Areas, packhorse crayfish legislated closures <strong>and</strong> toheroa<br />
beaches.<br />
Key issues Defining <strong>and</strong> identifying likely HPSFM <strong>and</strong> potential threats to them.<br />
Emerging issues Connectivity <strong>and</strong> intra-population behaviour variability, multiple use<br />
MPI Research<br />
(current)<br />
NZ Government<br />
Research (current)<br />
Links to 2030<br />
objectives<br />
Related<br />
chapters/issues<br />
9.1. Context<br />
Biogenic habitats as areas of particular significance for fisheries management<br />
(HAB2007/01), Toheroa abundance (TOH2007/03), Research on Biogenic<br />
Habitat-Forming Biota <strong>and</strong> their functional role in maintaining <strong>Biodiversity</strong><br />
in the Inshore Region (5-150M Depths) (ZBD2008/01 – this is also partfunded<br />
by Oceans Survey 2020, NIWA <strong>and</strong> MBIE) , Habitats of particular<br />
significance for fisheries management: Kaipara Harbour (ENV2009/07),<br />
Habitats of particular significance for inshorefinfish fisheries management<br />
(ENV2010/03) Spatial Mixing of GMU1 using Otolith Microchemistry<br />
(GMU2009/01).<br />
Ministry of Business, Innovation <strong>and</strong> Employment (MBIE) funded<br />
programmes (Coastal Conservation Management: protecting the functions of<br />
marine coastal habitats that support fish assemblages at local, regional <strong>and</strong><br />
national scales (C01X0907) Predicting the occurrence of vulnerable marine<br />
ecosystems for planning spatial management in the South Pacific region<br />
(C01X1229) <strong>and</strong> Impacts of resource use on vulnerable deep-sea<br />
communities (C01X0906).<br />
NIWA Core funding in the ’Managing marine stressors’ area under the<br />
’Coasts <strong>and</strong> Oceans’ centre, specifically the programme ’Managing marine<br />
resources’ <strong>and</strong> the project ’Measuring mapping <strong>and</strong> conserving (C01X0505)’<br />
Under the <strong>Environment</strong> Outcome habitats of special significance to fisheries<br />
need to be protected.<br />
L<strong>and</strong>-based impacts on fisheries <strong>and</strong> supporting biodiversity, bycatch<br />
composition, marine environmental monitoring.<br />
The Fisheries Act 1996, in Section 9 (<strong>Environment</strong>al principles) states that:<br />
“All persons exercising or performing functions, duties, or powers under this Act, in<br />
relation to the utilisation of fisheries resources or ensuring sustainability, shall take<br />
into account the following environmental principles:<br />
(a) Associated or dependent species should be maintained above a level that ensures<br />
their long-term viability:<br />
(b) Biological diversity of the aquatic environment should be maintained:<br />
205
AEBAR <strong>2012</strong>: Ecosystem effects: Habitats of particular significance to fisheries management<br />
(c) Habitat of particular significance for fisheries management should be<br />
protected.”<br />
No policy definition of habitat of particular significance for fisheries management (HPSFM) exists,<br />
although work is currently underway to generate one. Some guidance in terms of defining HPSFM is<br />
provided by Fisheries 2030 which specifies as an objective under the <strong>Environment</strong> Outcome that<br />
“habitats of special significance to fisheries are protected”. This wording suggests that a specific<br />
focus on habitats that are important for fisheries production should be taken rather than a more<br />
general focus that might also include other habitats that may be affected by fishing.<br />
Fisheries 2030 re-emphasises that HPSFM should be protected. No specific strategic actions are<br />
proposed to implement this protection in Fisheries 2030; although action 6.1 “To implement a revised<br />
MPA policy <strong>and</strong> legal framework” could potentially be relevant to protecting HPSFM. The<br />
management of activities other than fishing, such as l<strong>and</strong>-use <strong>and</strong> vehicle traffic, are outside the<br />
control of the Ministry for Primary Industries but Fisheries 2030 specifies actions to “Improve<br />
fisheries sector input to processes that manage RMA-controlled effects on the marine <strong>and</strong> freshwater<br />
environment” (Action 8.1) <strong>and</strong> to “Promote the development <strong>and</strong> use of RMA national policy<br />
statements, environmental st<strong>and</strong>ards, <strong>and</strong> regional coastal <strong>and</strong> freshwater plans” (Action 8.2). This<br />
suggests that the cooperation of other parties outside of the fisheries sector may be necessary in some<br />
cases to protect HPSFM.<br />
In the absence of a policy definition of HPSFM this chapter will focus on examples of habitats shown<br />
to be important for fisheries <strong>and</strong> concepts likely to be important to HPSFM. Examples of potential<br />
HPSFM include: sources of larvae; larval settlement sites; habitat for juveniles; habitat that supports<br />
important prey species; migration corridors; <strong>and</strong> spawning, pupping or egg-laying grounds. Some of<br />
these habitats may be important for only part of the life cycle of an organism, or for part of a year.<br />
The location or relative importance of habitats, compared with other limiting factors, is largely<br />
unknown for most stocks. For example, some stocks may be primarily habitat limited, whereas others<br />
may be limited by oceanographic variability, food supply, predation rates (especially during juvenile<br />
phases), or a mixture of these <strong>and</strong> other factors. In the case of stocks that are habitat limited, a<br />
management goal might be to preserve or improve some aspect of the habitat for the stock.<br />
Hundreds of legislated spatial fisheries restrictions already apply within New Zeal<strong>and</strong>’s territorial sea<br />
<strong>and</strong> exclusive economic zone (www.nabis.govt.nz), but until further policy work <strong>and</strong> research is<br />
conducted we cannot be sure the contribution they make to protecting HPSFM. Examples of these are<br />
listed below:<br />
• Separation Point in Tasman Bay, <strong>and</strong> the Wairoa Hard in Hawke Bay, were created to protect<br />
biogenic habitat which was believed to be important as juvenile habitat for a variety of fish<br />
species (Grange et al. 2003).<br />
• An area near North Cape is currently closed to packhorse lobster fishing to mitigate sub-legal<br />
h<strong>and</strong>ling disturbance in this area. This closure was established because of the small size of<br />
lobsters caught there <strong>and</strong> a tagging study that showed movement away from this area into<br />
nearby fished areas (Booth 1979).<br />
• The largest legislated closure are the Benthic Protection Areas (BPAs) which protect ~ 1.2<br />
million square km (about 31% of the EEZ) outside the territorial sea from contact of trawl<br />
<strong>and</strong> dredge gear with the bottom (Helson et al. 2010).<br />
• Commercial fishers must not use New Zeal<strong>and</strong> fishing vessels or foreign-owned New Zeal<strong>and</strong><br />
fishing vessels over 46 m in overall length for trawling in the territorial sea.<br />
206
AEBAR <strong>2012</strong>: Ecosystem effects: Habitats of particular significance to fisheries management<br />
In addition to legislated closures, a number of non-regulatory management measures exist. For<br />
example:<br />
• Spatial closures<br />
o Trawlers greater than 28 m in length are excluded from targeting hoki in four Hoki<br />
Management Areas – Cook Strait, Canterbury Banks, Mernoo Bank, <strong>and</strong> Puysegur<br />
Bank (DeepWater Group 2008). These areas were chosen because of the larger<br />
number of juveniles caught, relative to adults in these areas.<br />
o Trawling <strong>and</strong> pair trawling are both closed around Kapiti Isl<strong>and</strong><br />
• Seasonal closures<br />
o A closure to trawling exists from November the first until the 30 th of April each year<br />
in Tasman Bay.<br />
o A closure to commercial potting exists for all of CRA3 for the whole of the month of<br />
December each year.<br />
The high-level objectives <strong>and</strong> actions in Fisheries 2030 have been interpreted in the highly migratory,<br />
deepwater <strong>and</strong> middle-depths (deepwater) inshore national fish plans. The highly migratory fish plan<br />
addresses HPSFM in environment outcome 8.1 “Identify <strong>and</strong> where appropriate protect habitats of<br />
particular significance to highly migratory species, especially within New Zeal<strong>and</strong> waters”. In the<br />
deepwater fish plan the Ministry proposes in management objective 2.3 “to develop policy guidelines<br />
to determine what constitutes HPSFM then apply these policy guidelines to fisheries where<br />
necessary”. Inshore fisheries management plans (freshwater, shellfish <strong>and</strong> finfish) all contain<br />
references to identifying <strong>and</strong> managing HPSFM. These plans recognise that not all impacts stem from<br />
fisheries activities, therefore managing them may include trying to influence others to better manage<br />
their impacts on HPSFM. Work is underway on a policy definition of HPSFM that will assist<br />
implementing these outcomes <strong>and</strong> objectives.<br />
9.2. Global underst<strong>and</strong>ing<br />
This section focuses upon those habitats protected overseas for their value to fisheries <strong>and</strong> discusses<br />
important concepts that may help gauge the importance of any particular habitat to fisheries<br />
management. This information may guide future research into HPSFM in New Zeal<strong>and</strong> <strong>and</strong> any<br />
subsequent management action.<br />
9.2.1. Habitats protected elsewhere for fisheries management<br />
Certain habitats have been identified as important for marine species: shallow sea grass meadows,<br />
wetl<strong>and</strong>s, seaweed beds, rivers, estuaries, rhodolith beds, rocky reefs, crevices, boulders, bryozoans,<br />
submarine canyons, seamounts, coral reefs, shell beds <strong>and</strong> shallow bays or inlets (Kamenos et al.<br />
2004; Caddy 2008, Clark 1999, Morato et al. 2010). Discrete habitats (or parts of these) may have<br />
extremely important ecological functions, <strong>and</strong>/or be especially vulnerable to degradation. For<br />
example, seabeds with high roughness are important for many fisheries <strong>and</strong> can be easily damaged by<br />
interaction with fishing gear (Caddy 2008). Examples of these include:<br />
1. The Oculina coral banks off Florida were protected in 1994 as an experimental reserve in<br />
response to their perceived importance for reef fish populations (Rosenberg et al. 2000). Later<br />
studies confirmed that this area is the only spawning aggregation site for gag (Mycteroperca<br />
microlepis) <strong>and</strong> scamp (M. phenax) (both groper species), <strong>and</strong> other economically important<br />
reef fish in that region (Koenig et al. 2000). The size of the area within which bottom-tending<br />
gears were restricted was subsequently increased based on these findings (Rosenberg et al.<br />
2000).<br />
207
AEBAR <strong>2012</strong>: Ecosystem effects: Habitats of particular significance to fisheries management<br />
2. Lophelia cold-water coral reefs are now protected in at least Norway (Fosså et al. 2002),<br />
Sweden (Lundälv, & Jonsson 2003) <strong>and</strong> the United Kingdom (European Commission 2003)<br />
due to their importance as habitat for many species of fish (Costello et al. 2005).<br />
3. The Western Pacific Regional Fishery Management Council identified all escarpments between<br />
40 m <strong>and</strong> 280 m as Habitat Areas of Particular Concern (HAPC) for species in the bottom-fish<br />
assemblage. The water column to a depth of 1000 m above all shallow seamounts <strong>and</strong> banks<br />
was categorised as HAPC for pelagic species. Certain northwest Hawaiian Isl<strong>and</strong> banks<br />
shallower than 30 m were categorised as HAPC for crustaceans, <strong>and</strong> certain Hawaiian Isl<strong>and</strong><br />
banks shallower than 30 m were classified as Essential Fish Habitat (EFH) for precious corals.<br />
Fishing is closely regulated in the precious-coral EFH, <strong>and</strong> harvest is only allowed with highly<br />
selective gear types which limit impacts, such as manned <strong>and</strong> unmanned submersibles (West<br />
Pacific Fisheries Management Council 1998)<br />
Examples of habitats protected for their freshwater fishery values also exist. For example, the U.S.<br />
Atlantic States Interstate fishery management plan (Atlantic States Marine Fisheries Commission<br />
2000) notes the Sargasso Sea is important for spawning, <strong>and</strong> that seaweed harvesting provides a threat<br />
of unknown magnitude to eel spawning. Habitat alteration <strong>and</strong> destruction are also listed as probably<br />
impacting on continental shelves <strong>and</strong> estuaries/rivers, respectively, but the extent to which these are<br />
important is unknown.<br />
It is also possible that HPSFM may be defined by the functional importance of an area to the fishery.<br />
For example, large spawning aggregations can happen in mid-water for set periods of time<br />
(Schumacher <strong>and</strong> Kendall 1991, Livingston 1990) these could also potentially qualify as HPSFM.<br />
9.2.2. Concepts potentially important for HPSFM<br />
Many nations are now moving towards formalised habitat classifications for their coastal <strong>and</strong> ocean<br />
waters, which may include fish dynamics as part of their structure, <strong>and</strong> could potentially help to<br />
define HPSFM. Such systems help provide formal definitions for management purposes, <strong>and</strong> to ‘rank’<br />
habitats in terms of their relative values <strong>and</strong> vulnerability to threats. Examples include the Essential<br />
Fish Habitat (EFH) framework being advanced in North America (Benaka 1999, Diaz et al. 2004,<br />
Valavanis et al. 2008), <strong>and</strong> in terms of habitat, the developing NOAA Coastal <strong>and</strong> Marine Ecological<br />
Classification St<strong>and</strong>ard for North America (CMECS) (Madden et al. 2005, Keefer et al. 2008), <strong>and</strong><br />
the European Marine Life Information Network (MarLIN) framework which has developed habitat<br />
classification <strong>and</strong> sensitivity definitions <strong>and</strong> rankings (Hiscock <strong>and</strong> Tyler-Walters 2006).<br />
Habitat connectivity (the movement of species between habitats) operates across a range of spatial<br />
scales, <strong>and</strong> is a rapidly developing area in the underst<strong>and</strong>ing of fisheries stocks. These movements<br />
link together different habitats into ‘habitat chains’, which may also include ‘habitat bottlenecks’,<br />
where one or more spatially restricted habitats may act to constrain overall fish production (Werner et<br />
al. 1984). Human driven degradation or loss of such bottleneck habitats may strongly reduce the<br />
overall productivity of populations, <strong>and</strong> hence ultimately reduce long-term sustainable fisheries<br />
yields. The most widely studied of these links is between juvenile nursery habitats <strong>and</strong> often spatially<br />
distant adult population areas. Most studies published have been focussed on species that uses<br />
estuaries as juveniles; e.g. blue grouper Achoerodus viridis (a large wrasse) (Gill<strong>and</strong>ers <strong>and</strong> Kingsford<br />
1996) <strong>and</strong> snapper Pagrus auratus (Hamer et al. 2005) in Australia; <strong>and</strong> gag (Mycteroperca-<br />
Microlepis) in the United States (Ross <strong>and</strong> Moser 1995) which make unidirectional ontogenetic<br />
habitat shifts from estuaries <strong>and</strong> bays out to the open coast as they grow from juveniles to adults. The<br />
extent of wetl<strong>and</strong> habitats in the Gulf of Mexico has also been linked to the yield of fishery species<br />
dependent on coastal bays <strong>and</strong> estuaries. Reduced fishery stock production (shrimp <strong>and</strong> menhaden (a<br />
fish)) followed wetl<strong>and</strong> losses <strong>and</strong>, conversely, stock gains followed increases in the area of wetl<strong>and</strong>s<br />
(Turner <strong>and</strong> Boesch 1987). Juvenile production was limited by the amount of available habitat but,<br />
equally, reproduction, larval settlement, juvenile or adult survivorship, or other demographic factors<br />
208
AEBAR <strong>2012</strong>: Ecosystem effects: Habitats of particular significance to fisheries management<br />
could also be limited by habitat loss or degradation, <strong>and</strong> these could have knock-on effects to stock<br />
characteristics such as productivity <strong>and</strong> its variability. Other examples include movements which may<br />
be bidirectional <strong>and</strong> regular in nature e.g., seasonal migrations of adult fish to <strong>and</strong> from spawning<br />
<strong>and</strong>/or feeding grounds, e.g. grey mullet Mugil cephalus off Taiwan (Chang et al. 2004).<br />
How habitats are spatially configured to each other is also important to fish usage <strong>and</strong> associated<br />
fisheries production. For example, Nagelkerken et al. (2001) showed that the presence of mangroves<br />
in tropical systems significantly increases species richness <strong>and</strong> abundance of fish assemblages in<br />
adjacent seagrass beds. Jelbart et al. (2007) sampled Australian temperate seagrass beds close to<br />
(< 200 m) <strong>and</strong> distant from (> 500 m) mangroves. They found seagrass beds closer to mangroves had<br />
greater fish densities <strong>and</strong> diversities than more distant beds, especially for juveniles. Conversely, the<br />
densities of fish species in seagrass at low tide that were also found in mangroves at high tide were<br />
negatively correlated with the distance of the seagrass bed from the mangroves. This shows the<br />
important daily habitat connectivity that exists through tidal movements between mangrove <strong>and</strong><br />
seagrass habitats. Similar dynamics may occur in more sub-tidal coastal systems at larger spatial <strong>and</strong><br />
temporal scales. For example, Dorenbosch et al. (2005) showed that adult densities of coral reef fish,<br />
whose juvenile phases were found in mangrove <strong>and</strong> seagrass nursery habitats, were much reduced or<br />
absent on coral reefs located far distant from such nursery habitats, relative to those in closer<br />
proximity.<br />
A less studied, but increasingly recognised theme is the existence of intra-population<br />
variability in movement <strong>and</strong> other behavioural traits. Different behavioural phenotypes within<br />
a given population have been shown to be very common in l<strong>and</strong> birds, insects, mammals, <strong>and</strong><br />
other groups. An example of this is a phenomenon known as ‘partial migration’, where part<br />
of the overall population migrates each year, often over very large distances, while another<br />
component does not move <strong>and</strong> remains resident. By definition, this partial migration also<br />
results in differential use of habitats, often over large spatial scales. Recent work on white<br />
perch (Morone americana) in the United States shows this population is made up of two<br />
behavioural components: a resident natal freshwater contingent; <strong>and</strong> a dispersive brackishwater<br />
contingent (Kerr et al. 2010). The divergence appears to be a response to early life<br />
history experiences which influence individuals’ growth (Kerr 2008). The proportion of the<br />
overall population that becomes dispersive for a given year class ranges from 0% in drought<br />
years to 96% in high-flow years. Modelling of how differences in growth rates <strong>and</strong><br />
recruitment strengths of each component contributed to the overall population found that the<br />
resident component contributed to long-term population persistence (stability), whereas the<br />
dispersive component contributed to population productivity <strong>and</strong> resilience (defined as<br />
rebuilding capacity) (Kerr et al. 2010). Another species winter flounder Pseudopleuronectes<br />
americanus has also shown intra-population variability in spawning migrations; one group<br />
stays coastally resident while a second smaller group migrate into estuaries to spawn<br />
(DeCelles & Cadrin 2010). The authors went on to suggest that coastal waters in the Gulf of<br />
Maine should merit consideration in the assignment of Essential Fish Habitat for this species.<br />
Kerr <strong>and</strong> Secor (2009) <strong>and</strong> Kerr et al. (2010) argue that such phenotypic dynamics are probably very<br />
common in marine fish populations but have not yet been effectively researched <strong>and</strong> quantified. The<br />
existence of such dynamics would have important implications for fisheries management, including<br />
the possibility of spatial depletions of more resident forms <strong>and</strong> variability in the use of potential<br />
HPSFM between years. For instance, recent work on snapper in the Hauraki Gulf has shown that fish<br />
on reef habitats are more resident (ie have less propensity to migrate) than those of soft sediment<br />
habitats, <strong>and</strong> can experience higher fishing removals (Parsons et al. 2011).<br />
The most effective means of protecting a HPSFM in terms of the benefit to the fishery may differ<br />
depending on the life-history characteristics of the fish. A variety of modelling, theoretical, <strong>and</strong><br />
observational approaches have lead to the conclusion that spatial protection performs best at<br />
209
AEBAR <strong>2012</strong>: Ecosystem effects: Habitats of particular significance to fisheries management<br />
enhancing species whose adults are relatively sedentary but whose larvae are broadcast widely<br />
(Chiappone <strong>and</strong> Sealey 2000, Murawski et al. 2000, Roberts 2000, Warner et al. 2000). The sedentary<br />
habit of adults allows the stock to accrue the maximum benefit from the protection, whereas the<br />
broadcasting of larvae helps ‘seed’ segments of the population outside the protection. However, the<br />
role of spatial protection in directly protecting juveniles after they have settled to seafloor habitats (via<br />
habitat protection/recovery, <strong>and</strong>/or reduced juvenile bycatch), or their interaction with non-fisheries<br />
impacts has not yet been explicitly considered.<br />
9.3. State of knowledge in New Zeal<strong>and</strong><br />
9.3.1. Potential HPSFM in New Zeal<strong>and</strong><br />
Important areas for spawning, pupping, <strong>and</strong> egg-laying are potential HPSFM. These areas (insofar as<br />
these are known) have been identified <strong>and</strong> described using science literature <strong>and</strong> fisheries databases<br />
<strong>and</strong> summarised within two atlases, one coastal (< 200 m) <strong>and</strong> one deepwater (> 200 m). Coastally,<br />
these HPSFM areas were identified for 35 important fish species by Hurst et al. (2000). This report<br />
concluded that virtually all coastal areas were important for these functions for one species or other.<br />
The report also noted that some coastal species use deeper areas for these functions, either as<br />
juveniles, or to spawn (e.g., red cod, giant stargazer) <strong>and</strong> some coastal areas are important for<br />
juveniles of deeper spawning species (e.g., hake <strong>and</strong> ling). Some species groupings were apparent<br />
from this analysis. Elephant fish, rig, <strong>and</strong> school shark all preferred to pup or lay eggs in shallow<br />
water, <strong>and</strong> very young juveniles of these species were found in shallow coastal areas. Juvenile<br />
barracouta, jack mackerel (Trachurus novaezel<strong>and</strong>iae), kahawai, rig, <strong>and</strong> snapper were all relatively<br />
abundant (at least occasionally) in the inner Hauraki Gulf. Important areas for spawning, pupping, <strong>and</strong><br />
egg-laying were identified for 32 important deepwater fish species (200 to 1500 m depth), 4 pelagic<br />
fish species, 45 invertebrate groups, <strong>and</strong> 5 seaweeds (O'Driscoll et al. 2003). This study concluded<br />
that all areas to 1500 m deep were important for either spawning or juveniles of one or more species<br />
studied. The relative significance of areas was hard to gauge because of the variability in the data,<br />
however the Chatham Rise was identified as a “hotspot”.<br />
Areas of high juvenile abundances of certain species may be useful indicators of HPSFM for some<br />
species. A third atlas (Hurst et al. 2000b) details species distributions (mainly commercial) of adult<br />
<strong>and</strong> immature stages from trawl, midwater trawl <strong>and</strong> tuna longline where adequate size information<br />
was collected. No conclusions are made in this document, <strong>and</strong> generalisations across species are<br />
inherently difficult, therefore like the previous two atlases, this document is probably best examined<br />
for potential HPSFM in a species specific way.<br />
Certain locations within New Zeal<strong>and</strong> already seem likely to qualify as HPSFM under any likely<br />
definition. The Kaipara Harbour has been identified as particularly important for the SNA 8 stock.<br />
Analysis of otolith chemistry showed that, for the 2003 year-class, a very high proportion of new<br />
snapper recruits to the SNA 8 stock were sourced as juveniles from the Kaipara Harbour (Morrison et<br />
al. 2008). This result is likely to be broadly applicable into the future as the Kaipara provides most of<br />
the biogenic habitat available for juvenile snapper on this coast. The Kaipara <strong>and</strong> Raglan harbours<br />
also showed large catches of juvenile rig <strong>and</strong> the Waitemata, Tamaki <strong>and</strong> Porirua harbours moderate<br />
catches (Francis et al. <strong>2012</strong>). Recent extensive fish-habitat sampling within the harbour in 2010 as<br />
part of the MBIE Coastal Conservation Management programme showed juvenile snapper to be<br />
strongly associated with sub-tidal seagrass, horse mussels, sponges, <strong>and</strong> an introduced bryozoan.<br />
Negative impacts on such habitats have the potential to have far-field effects in terms of subsequent<br />
fisheries yields from coastal locations well distant from the Kaipara Harbour. Beaches that still retain<br />
substantive toheroa populations, e.g. Dargaville <strong>and</strong> Oreti beaches, may also potentially qualify as<br />
HPSFM (Beentjes 2010).<br />
210
AEBAR <strong>2012</strong>: Ecosystem effects: Habitats of particular significance to fisheries management<br />
Consistent with the international literature, biogenic (living, habitat forming) habitats have been found<br />
to be particularly important juvenile habitat for some coastal fish species in New Zeal<strong>and</strong>. For<br />
example: bryozoan mounds in Tasman Bay are known nursery grounds for snapper, tarakihi <strong>and</strong> john<br />
dory (Vooren 1975); northern subtidal seagrass meadows fulfil the same role for a range of fish<br />
including snapper, trevally, parore, garfish <strong>and</strong> spotties (Francis et al. 2005, Morrison et al. 2008,<br />
Schwarz et al. 2006, Vooren 1975); northern horse mussel beds for snapper <strong>and</strong> trevally (Morrison et<br />
al. 2009); <strong>and</strong> mangrove forests for grey mullet, short-finned eels, <strong>and</strong> parore (Morrisey et al. 2010).<br />
Many other types of biogenic habitats exist, <strong>and</strong> some of their locations are known (e.g. see Davidson<br />
et al. 2010 for biogenic habitats in the Marlborough Sounds), but their precise role as HPSFM<br />
remains to be quantified. Examples include open coast bryozoan fields, rhodoliths, polychaete (worm)<br />
species ranging in collective form from low swathes to large high mounds, sea pens <strong>and</strong> sea whips,<br />
sponges, hydroids, gorgonians, <strong>and</strong> many forms of algae, ranging from low benthic forms such as<br />
Caulerpa spp. (sea rimu) through to giant kelp (Macrocystis pyrifera) forests in cooler southern<br />
waters. Similarly, seamounts are well-known to host reef-like formations of deep-sea stony corals<br />
(e.g., Tracey et al. 2011), as well as being major spawning or feeding areas for commercial deepwater<br />
species such as orange roughy <strong>and</strong> oreos (e.g., Clark 1999, O’Driscoll & Clark 2005). However, the<br />
role of these benthic communities on seamounts in supporting fish stocks is uncertain, as spawning<br />
aggregations continue to form even if the coral habitat is removed by trawling (Clark & Dunn <strong>2012</strong>).<br />
Hence the oceanography or physical characteristics of the seamount <strong>and</strong> water column may be the key<br />
drivers of spawning or early life-history stage development, rather than the biogenic habitat.<br />
Freshwater eels are reliant upon rivers as well as coastal <strong>and</strong> oceanic environments. GIS modelling<br />
estimates that for longfin eels, about 30% of longfin habitat in the North Isl<strong>and</strong> <strong>and</strong> 34% in the South<br />
Isl<strong>and</strong> is either in a reserve or in rarely/non-fished areas, with ~ 49% of the national longfin stock<br />
estimate of about 12 000 tonnes being contained in these waterways (Graynoth et al. 2008). More<br />
regional examination of the situation for eels also exists, e.g., for the Waikato Catchment (Allen<br />
2010). Shortfin eels prefer slower-flowing coastal habitats such as lagoons, estuaries, <strong>and</strong> lower<br />
reaches of rims (Beentjes et al. 2005). In-stream cover (such as logs <strong>and</strong> debris) has been identified as<br />
important habitat, particularly in terms of influencing the survival of large juvenile eels (Graynoth et<br />
al. 2008). Short-fin eel juveniles <strong>and</strong> adults have also been found to be relatively common in estuarine<br />
mangrove forests, <strong>and</strong> their abundance positively correlated with structural complexity (seedlings,<br />
saplings, <strong>and</strong> tree densities) (Morrisey et al. 2010). In addition oceanic spawning locations are clearly<br />
important for eels, the location of these are unknown, although it has been suggested that these may<br />
be northeast of Samoa <strong>and</strong> east of Tonga for shortfins <strong>and</strong> longfins respectively (Jellyman 1994).<br />
Many of the potential HPSFM are threatened by either fisheries or l<strong>and</strong>-based effects, the reader<br />
should look to the l<strong>and</strong>-based effects chapter in this document <strong>and</strong> the eel section of the Stock<br />
assessment plenary report for further details.<br />
9.3.2. Habitat classification <strong>and</strong> prediction of biological<br />
characteristics<br />
Habitat classification schemes focused upon biodiversity protection have been developed in New<br />
Zeal<strong>and</strong> at both national <strong>and</strong> regional scales, these may help identify larger habitats which HPSFM<br />
may be selected from, but are unlikely to be useful in isolation for determining HPSFM. The Marine<br />
<strong>Environment</strong> Classification (MEC), the demersal fish MEC <strong>and</strong> the benthic optimised MEC<br />
(BOMEC) are national scale classification schemes have been developed with the goal of aiding<br />
biodiversity protection (Leathwick et al. 2004, 2006, <strong>2012</strong>). A classification scheme also exists for<br />
New Zeal<strong>and</strong>’s rivers <strong>and</strong> streams based on their biodiversity values to support the Department of<br />
Conservations Waters of National Importance (WONI) project (Leathwick <strong>and</strong> Julian 2008). Regional<br />
211
AEBAR <strong>2012</strong>: Ecosystem effects: Habitats of particular significance to fisheries management<br />
classification schemes also exist such as ones mapping the Marine habitats of Northl<strong>and</strong>, or<br />
Canterbury in order to assist in Marine Protected Area planning (Benn 2009; Kerr 2010).<br />
Another tool which may help in terms of identifying HPSFM is the predictions of richness,<br />
occurrence <strong>and</strong> abundance of small fish in New Zeal<strong>and</strong> estuaries (Francis et al. 2011). This paper<br />
contains richness predictions for 380 estuaries <strong>and</strong> occurrence predictions for 16 species. This could<br />
help minimise the need to undertake expensive field surveys to inform resource management,<br />
although environmental sampling may still be needed to drive some models.<br />
9.3.3. Current research<br />
Prior to 2007 research within New Zeal<strong>and</strong> has not been explicitly focused on identifying HPSFM.<br />
However, in line with international trends, this situation has changed in recent times, with recognition<br />
of some of the wider aspects of fisheries management <strong>and</strong> the move towards an ecosystem approach<br />
foreshadowed in Fisheries 2030.<br />
A number of Ministry <strong>and</strong> other research projects are underway, or planned, concerning HPSFM in<br />
the 2010/11 year. Project ENV200907, “Habitat of particular significance to fisheries management:<br />
Kaipara Harbour”, is underway <strong>and</strong> has the overall objective of identifying <strong>and</strong> mapping areas <strong>and</strong><br />
habitats of particular significance in the Kaipara Harbour which support coastal fisheries; <strong>and</strong><br />
identifying <strong>and</strong> assessing threats to these habitats. Included in this work is the reconstruction of<br />
environmental histories through interviews of long time local residents who have experience of the<br />
harbour, <strong>and</strong> associated collation <strong>and</strong> integration of historical data sources (e.g., catch records,<br />
photographs, diaries, maps, <strong>and</strong> fishing logs). Another output of this work will be recommendations<br />
on the best habitats <strong>and</strong> methods of monitoring to detect change to HPSFM within Kaipara harbour.<br />
Biogenic habitats on the continental shelf from ~5 to 150 m depths are currently being characterised<br />
<strong>and</strong> mapped through the biodiversity project ZBD2008/01, this will also provide new information on<br />
fisheries species utilisation of these habitats. Interviews with 50 retired fishers have provided valuable<br />
information on biogenic habitat around New Zeal<strong>and</strong>. A national survey to examine the present<br />
occurrences <strong>and</strong> extents of these biogenic habitats was completed in 2011 in collaboration with<br />
Oceans Survey 2020, NIWA <strong>and</strong> Ministry of Business, Innovation <strong>and</strong> Employment (MBIE) funding.<br />
A number of other national scale projects are also underway. A desktop review is collating<br />
information on the importance of biogenic habitats to fisheries across the entire Territorial Sea <strong>and</strong><br />
Exclusive Economic Zone (project HAB2007/01). A project has been approved to review the<br />
literature <strong>and</strong> recommend the relative urgency of research on habitats of particular significance for<br />
inshore finfish species (project ENV2010/03).<br />
The Ministry of Business, Innovation <strong>and</strong> Employment (MBIE) funded project Coastal Conservation<br />
Management started in 2009 <strong>and</strong> runs for six years. This programme aims to integrate <strong>and</strong> add to<br />
existing fish-habitat association work to develop a national scale marine fish-habitat classification <strong>and</strong><br />
predictive model framework. This project will also attempt to develop threat assessments at local,<br />
regional <strong>and</strong> national scales. MPI is maximising the synergies between its planned research <strong>and</strong> this<br />
project. As part of that synergy, work on the connectivity <strong>and</strong> stock structure of grey mullet (Mugil<br />
cephalus) is underway in collaboration with MFish project GMU2009/01. Otolith chemistry is being<br />
assessed for its utility in partitioning the GMU 1 stock into more biologically meaningful<br />
management units, <strong>and</strong> in quantifying the suspected existence of source <strong>and</strong> sink dynamics between<br />
the various estuaries that hold juvenile grey mullet nursery habitats.<br />
MBIE also funded in <strong>2012</strong> the three year project delivered by NIWA entitled Predicting the<br />
occurrence of vulnerable marine ecosystems for planning spatial management in the South Pacific<br />
region. The development of predictive models of species occurrence under this project may also aid in<br />
212
AEBAR <strong>2012</strong>: Ecosystem effects: Habitats of particular significance to fisheries management<br />
identifying HPSFM. Identification of biogenic habitat has been part of the MBIE project “Vulnerable<br />
deep-sea communities”since 2009 (<strong>and</strong> its predecessor seamount programme) which includes survys<br />
of a range of habiatts that may be important for various life-history stages of commercial fish species:<br />
seamounts, canyons, continental slope, hydrothermal vents, seeps.<br />
9.4. Indicators <strong>and</strong> trends<br />
As no HPSFM are defined this section cannot be completed.<br />
9.5. References<br />
Allen M., Rosell R., Evans D. 2006. Predicting catches for the Lough Neagh (Northern Irel<strong>and</strong>) eel fishery based on stock inputs, effort <strong>and</strong><br />
environmental variables. Fisheries Management <strong>and</strong> Ecology (13): 251-260.<br />
Allen D. 2010. Eels in the Waikato Catchment. Client report prepared for Mighty River Power Ltd. 105p.<br />
Atlantic States Marine Fisheries Commission 2000. Interstate Fishery Management Plan for American Eel. Fishery Management Report No.<br />
36 of the Atlantic States Marine Fisheries Commission. 93p.<br />
Benaka L. (Ed.) 1999. Fish habitat: essential fish habitat <strong>and</strong> rehabilitation, American Fisheries Society, Bethesda, MD. 45pp.<br />
Beentjes M. 2010. Toheroa survey of Oreti Beach, 2009, <strong>and</strong> review of historical surveys. New Zeal<strong>and</strong> Fisheries Assessment Report<br />
2010/6, ed. 40p.<br />
Beentjes M., Boubée J., Jellyman J.D., Graynoth E. 2005. Non-fishing mortality of freshwater eels (Anguilla spp.). New Zeal<strong>and</strong> Fisheries<br />
Assessment Report 2005/34. 38p.<br />
Benn, L. 2009. Marine Protected Areas (MPA): Habitat Maps for Canterbury. Internal Report for the Canterbury Conservancy.<br />
Booth J. 1979. North Cape - a 'nursery area' for the packhorse rock lobster, Jasus verreauxi (Deeapoda: Palinuridae). New Zeal<strong>and</strong> journal<br />
of Marine & Freshwater Research (13): 521-528.<br />
Caddy J.F. 2008. The importance of "Cover" in the life histories of demersal <strong>and</strong> benthic marine resources: A neglected issue in fisheries<br />
assessment <strong>and</strong> management. Bulletin of Marine Science (83): 7-52.<br />
Chang C., Iizyuka Y., Tzeng W. 2004. Migratory environmental history of the grey mullet Mugil cephalus as revealed by otolith Sr:Ca<br />
ratios. Marine Ecology Progress Series. 269: 277-288.<br />
Chiappone M., Sealey K.M.S. 2000. Marine reserve design criteria <strong>and</strong> measures of success: Lessons learned from the Exuma Cays L<strong>and</strong><br />
<strong>and</strong> Sea Park, Bahamas. Bulletin of Marine Science (66): 691-705.<br />
Clark MR (1999) Fisheries for orange roughy (Hoplostethus atlanticus) on seamounts in New Zeal<strong>and</strong>. Oceanologica Acta 22: 593-602.<br />
Clark MR, Rowden AA (2009) Effect of deepwater trawling on the macro-invertebrate assemblages of seamounts on the Chatham Rise,<br />
New Zeal<strong>and</strong>. Deep Sea Research I 56: 1540–1554.<br />
Clark, M.R.; Dunn, M.R. (<strong>2012</strong>). Spatial management of deep-sea seamount fisheries: balancing exploitation <strong>and</strong> habitat conservation.<br />
<strong>Environment</strong>al Conservation 39(2): . doi:10.1017/S0376892912000021<br />
Costello, M., McCrea, M., Freiwald, A., Lundälv, T., Jonsson, L., Bett, B., van Weering, T., de Haas, H., Roberts, J., Allen, D., 2005. Role<br />
of cold-water Lophelia pertusa coral reefs as fish habitat in the NE Atlantic, in: Freiwald, A., JM, R. (Eds.), Cold-water Corals<br />
<strong>and</strong> Ecosystems. Springer-Verlag Berlin pp. pp 771-805.<br />
Davidson, R., Richards, L., Duffy, C., Kerr, V., Freeman, D., D’Archino, R., Read, G., Abel, W., 2010. Location <strong>and</strong> biological attributes of<br />
biogenic habitats located on soft substrata in the Marlborough Sounds. , Prepared by Davidson <strong>Environment</strong>al Ltd. for<br />
Department of Conservation <strong>and</strong> Marlborough District Council. Survey <strong>and</strong> monitoring report no. 575.<br />
Diaz R., Solan M., Valente R. 2004. A review of approaches for classifying benthic habitats <strong>and</strong> evaluating habitat quality. Journal of<br />
<strong>Environment</strong>al Management 73: 165–181.<br />
Deep Water Group 2008. Operational Procedures: Hoki Fishery. 27p.<br />
Dorenbosch M., Grol M., Christianen M., Nagelkerken I. van der Velde G. 2005. Indo-Pacific seagrass beds <strong>and</strong> mangroves contribute to<br />
fish density coral <strong>and</strong> diversity on adjacent reefs. Marine Ecology Progress Series. 302: 63-76.<br />
Ellingsen, K., Hewitt, J., Thrush, S. 2007. Rare species, habitat diversity <strong>and</strong> functional redundancy in marine benthos. Journal of Sea<br />
Research 58: 291-301.<br />
European Commission, 2003. Commission Regulation (EC) No 1475/2003 of 20 August 2003 on the protection of deep-water coral reefs<br />
from the effects of trawling in an area north west of Scotl<strong>and</strong>. Official Journal L 211, 14-15.<br />
Fosså, J., Mortensen, P., Furevik, D., 2002. The deep-water coral Lophelia pertusa in Norwegian waters: distribution <strong>and</strong> fisheries impacts.<br />
Hydrobiologia 471, 1-12.<br />
Francis R., Hadfield M., Bradford-Grieve J., Renwick J., Sutton P. 2005. <strong>Environment</strong>al predictors of hoki year-class strengths: an update.<br />
Francis, M., Morrison, M., Leathwick, J., Walsh, C., 2011. Predicting patterns of richness, occurrence <strong>and</strong> abundance of small fish in New<br />
Zeal<strong>and</strong> estuaries. Marine <strong>and</strong> Freshwater Research 62, 1327-1341.<br />
Francis, M., Lyon, W., Jones, E., Notman, P., Parkinson, D., Getzlaff, C., <strong>2012</strong>. Rig nursery grounds in New Zeal<strong>and</strong>: a review <strong>and</strong> survey,<br />
New Zeal<strong>and</strong> <strong>Aquatic</strong> <strong>Environment</strong> <strong>and</strong> <strong>Biodiversity</strong> Report No. 95.<br />
Gill<strong>and</strong>ers B. Kingsford M. 1986. Elements in otoliths may elucidate the contribution of estuarine recruitment to sustaining coastal reef<br />
populations of a temperate reef fish. Marine Ecology Progress Series 141: 13 - 20.<br />
Grange K., Tovey A., Hill A.F. 2003. The spatial extent <strong>and</strong> nature of the bryozoan communities at Separation Point, Tasman Bay. 22 p.<br />
Graynoth E., Francis R., Jellyman D. 2008. Factors influencing juvenile eel (Anguilla spp.) survival in lowl<strong>and</strong> New Zeal<strong>and</strong> streams New<br />
Zeal<strong>and</strong> Journal of Marine <strong>and</strong> Freshwater Research [N. Z. J. Mar. Freshw. Res.]. Vol. 42, no. 2, pp. 153-172. Jun 2008. (42):<br />
153-172.<br />
Hall-Spencer J., Kelly J. Maggs C. 2008. Assessment of maerl beds in the OSPAR area <strong>and</strong> the development of a monitoring program.<br />
Department of <strong>Environment</strong>, Heritage <strong>and</strong> Local Government: Irel<strong>and</strong>.<br />
Hamer P., Jenkins G., Gill<strong>and</strong>ers B. 2005. Chemical tags in otoliths indicate the importance of local <strong>and</strong> distant settlement areas to<br />
populations of a temperate sparid, Pagrus auratus. Canadian Journal of Fisheries <strong>and</strong> <strong>Aquatic</strong> Sciences. 62: 623-630.<br />
Haro A., Richkus W., Whalen K., Hoar A., Busch W.D., Lary S., Brush T., Dixon D. 2000. Population decline of the American eel:<br />
Implications for research <strong>and</strong> management. Fisheries (25): 7-16.<br />
213
AEBAR <strong>2012</strong>: Ecosystem effects: Habitats of particular significance to fisheries management<br />
Helson J., Leslie S., Clement G., Wells R., Wood R. 2010. Private rights, public benefits: Industry-driven seabed protection. Marine Policy<br />
(34): 557-566.<br />
Hewitt J.E., Thrush S.F., Halliday J., Duffy C. 2005. The importance of small-scale habitat structure for maintaining beta diversity. Ecology<br />
(86): 1619-1626.<br />
Hiscock K., Tyler-Walters H. 2006. Assessing the seabed species <strong>and</strong> biotopes- the Marine Life Information Network (MarLIN).<br />
Hydrobiologica. 555: 309–320.<br />
Hurst R., Bagley N., Anderson O., Francis M., Griggs L., Clark M., Paul L., Taylor P. 2000a. Atlas of juvenile <strong>and</strong> adult fish <strong>and</strong> squid<br />
distributions from bottom <strong>and</strong> midwater trawls <strong>and</strong> tuna longlines in New Zeal<strong>and</strong> waters.<br />
Hurst R., Stevenson M., Bagley N., Griggs L., Morrison M., Francis M. 2000b. Areas of importance for spawning, pupping or egg-laying<br />
<strong>and</strong> juveniles of new Zeal<strong>and</strong> coastal fish. . 56.<br />
Inl<strong>and</strong> Fisheries Service Tasmania 2009. Tasmanian Freshwater Eel Fishery: Application to the Department of the <strong>Environment</strong>, Water,<br />
Heritage <strong>and</strong> Arts for the re-assessment of the Tasmanian Freshwater Eel Fishery. 22.<br />
Jelbart J., Ross P., Connolly R. 2007. Fish assemblages in seagrass beds are influenced by the proximity of mangrove forests. Marine<br />
Biology 150, 993–1002.<br />
Jellyman D. 1994. The fishery for freshwater eels (Anguilla spp.) in New Zeal<strong>and</strong> New Zeal<strong>and</strong> Fisheries Assessment Research Document<br />
94/14. 25p.<br />
Kamenos, N., Moore, P., Hall-Spencer, J. 2004. Small-scale distribution of juvenile gadoids in shallow inshore waters; what role does maerl<br />
play? ICES Journal of Marine Science 61,422–429.<br />
Keefer M., Peery C., Wright N., Daigle W., Caudill C., Clabough T., Griffith D., Zacharias M. 2008. Evaluating the NOAA Coastal <strong>and</strong><br />
Marine Ecological Classification St<strong>and</strong>ard in estuarine systems: A Columbia River Estuary case study. Estuarine, Coastal <strong>and</strong><br />
Shelf Science. 78: 89–106.<br />
Kerr L. 2008. Cause, consequence, <strong>and</strong> prevalence of spatial structure of white perch (Morone americana) populations in the Chesapeake<br />
Bay. Dissertation. University of Maryl<strong>and</strong>, College Park, Maryl<strong>and</strong>, USA.<br />
Kerr L., Secor D. 2009. Bioenergetic trajectories underlying partial migration in Patuxent River (Chesapeake Bay) white perch Morone<br />
americana. Canadian Journal of Fisheries <strong>and</strong> <strong>Aquatic</strong> Sciences 66:602–612.<br />
Kerr L.A., Cadrin S.X., Secor D.H. 2010. The role of spatial dynamics in the stability, resilience, <strong>and</strong> productivity of an estuarine fish<br />
population. Ecological Applications (20): 497-507.<br />
Kerr V. 2010. Marine habitat map of Northl<strong>and</strong>: mangawhai to Ahipara (vers 1).<br />
Koenig C., Coleman F., Grimes C., FitzHugh G., Scanlon K., Gledhill C., Grace M. 2000. Protection of fish spawning habitat for the<br />
conservation of warm-temperate reef-fish fisheries of shelf-edge reefs of Florida. Bulletin of Marine Science (66): 593-616.<br />
Leathwick J., Image K., Snelder T., Weatherhead M., Wild M. 2004. Definition <strong>and</strong> tests of the Marine <strong>Environment</strong> Classifications of New<br />
Zeal<strong>and</strong>’s Exclusive Economic Zone <strong>and</strong> the Hauraki Gulf. NIWA Client Report CHC2004-085. 64pp.<br />
Leathwick J.R., Dey K., Julian K. 2006. Development of a demersal fish community classification for New Zeal<strong>and</strong>s Exclusive Economic<br />
Zone. . 38.<br />
Leathwick J.R., Julian K. 2008. Updated conservation rankings for New Zeal<strong>and</strong>'s rivers <strong>and</strong> streams NIWA Report for Department of<br />
Conservation. 39.<br />
Leathwick J., Rowden A., Nodder S., Gorman, R., Bardsley S., Pinkerton, M., Baird, S., Hadfield, M., Currie, K., Goh, A. <strong>2012</strong>. Benthic<br />
optimised marine environment classification for New Zeal<strong>and</strong> waters. <strong>Aquatic</strong> <strong>Environment</strong> <strong>and</strong> <strong>Biodiversity</strong> Report No. 89.<br />
52pp.<br />
Livingston M. 1990. Spawning hoki (Macruronus novaezel<strong>and</strong>iae Hector) concentrations in Cook Strait <strong>and</strong> off the east coast of the South<br />
Isl<strong>and</strong>, New Zeal<strong>and</strong>, August-September 1987. New Zeal<strong>and</strong> Journal of Marine <strong>and</strong> Freshwater Research (24):<br />
Lundälv, T., Jonsson, L., 2003. Mapping of deep-water corals <strong>and</strong> fishery impacts in the north-east Skagerrak, using acoustical <strong>and</strong> ROV<br />
survey techniques. Proc 6th Underwater Sci Symp, Aberdeen, April 2003.<br />
Madden C., Grossman D., Goodin K. 2005. Coastal <strong>and</strong> marine ecosystems of North America; framework for an ecological classification<br />
st<strong>and</strong>ard: Version II. NatureServe, Virginia, Arlington. 48 pp.<br />
Morato, T., Hoyle, S.D., Allain, V. <strong>and</strong> Nicol, S.J. (2010a). Seamounts are hotspots of pelagic biodiversity in the open ocean. Proceedings of<br />
the National Academy of Science U S A, 107, 9707–9711. doi:10.1073/pnas.0910290107<br />
Morato, T., Hoyle, S.D., Allain, V. <strong>and</strong> Nicol, S.J. (2010b). Tuna longline fishing around West <strong>and</strong> Central Pacific seamounts. PloS ONE<br />
5(12): e14453. doi:10.1371/journal.pone.0014453<br />
Morrisey, D., Swales A., Dittmann S., Morrison M., Lovelock, C., Beard, C. 2010. The ecology <strong>and</strong> management of temperate mangroves.<br />
Oceanography <strong>and</strong> Marine Biology 48: 43–160.<br />
Morrison M., Jones E., Consalvey M., Berkenbusch K. 2008. Biogenic habitats <strong>and</strong> their value to New Zeal<strong>and</strong> fisheries. Water &<br />
Atmosphere (16): 20-21.<br />
Morrison M., Lowe M., Parsons D., Usmar N., McLeod I. 2009. A review of l<strong>and</strong>-based effects on coastal fisheries <strong>and</strong> supporting<br />
biodiversity in New Zeal<strong>and</strong>. 100p.<br />
Murawski S.A., Brown R., Lai H.L., Rago P.J., Hendrickson L. 2000. Large-scale closed areas as a fishery-management tool in temperate<br />
marine systems: The Georges Bank experience. Bulletin of Marine Science (66): 775-798.<br />
Nagelkerken I., Kleijnen S., Klop T., van den Br<strong>and</strong>, R., de la Moriniere, E., van der Velde G. 2001. Dependence of Caribbean reef fishes<br />
on mangroves <strong>and</strong> seagrass beds as nursery habitats: a comparison of fish faunas between bays with <strong>and</strong> without<br />
mangroves/seagrass beds. Marine Ecology Progress Series 214: 225–235.<br />
North Pacific Fishery Management Council. 1998. Omnibus essential fish habitat amendments for groundfish in the Bering Sea, Aleutian<br />
Isl<strong>and</strong>s, <strong>and</strong> Gulf of Alaska, king <strong>and</strong> tanner crab in the Bering Sea <strong>and</strong> Aleutian Isl<strong>and</strong>s, Alaska scallop, <strong>and</strong> Alaska salmon<br />
fishery management plans. North Pacific Fishery Management Council , Alaska.<br />
O'Driscoll R., Booth J., Bagley N., Anderson O., Griggs L., Stevenson M., Francis M. 2003. Areas of importance for spawning, pupping or<br />
egg-laying, <strong>and</strong> juveniles of New Zeal<strong>and</strong> deepwater fish, pelagic fish, <strong>and</strong> invertebrates. NIWA Technical Report 119. 377.<br />
O'Driscoll, R.L.; Clark, M.R. (2005). Quantifying the relative intensity of fishing on New Zeal<strong>and</strong> seamounts. New Zeal<strong>and</strong> Journal of<br />
Marine <strong>and</strong> Freshwater Research 39: 839–850.<br />
Parsons D., Morrison M., McKenzie J., Hartill, B, Bian R., Francis RICC (2011) A fisheries perspective of behavioural variability:<br />
differences in movement behavior <strong>and</strong> extraction rate of an exploited sparid, snapper (Pagrus auratus). Canadian Journal of<br />
Fisheries <strong>and</strong> <strong>Aquatic</strong> Sciences. 68: 632-642.<br />
Roberts C.M. 2000. Selecting marine reserve locations: Optimality versus opportunism. Bulletin of Marine Science (66): 581-592.<br />
Rosenberg A., Bigford T., Leathery S., Hill R., Bickers K. 2000. Ecosystem approach to fishery management through essential fish habitat.<br />
Bulletin of Marine Science (66): 535-542.<br />
Ross S., Moser M. 1995. Life-history of juvenile gag, Mycteroperca-microlepsis, in North-Carolina estuaries. Bulletin of Marine Science.<br />
56; 222-237.<br />
214
AEBAR <strong>2012</strong>: Ecosystem effects: Habitats of particular significance to fisheries management<br />
Schumacher J.D., Kendall A.W. 1991. Some interactions between young walleye Pollock <strong>and</strong> their environment in the western gulf of<br />
Alaska 40p.<br />
Schwarz A.-M., Morrison M., Hawes I., Halliday J. 2006. Physical <strong>and</strong> biological characteristics of a rare marine habitat: subtidal seagrass<br />
beds of offshore isl<strong>and</strong>s. 39.<br />
Thrush S.F., Gray J.S., Hewitt J.E., Ugl<strong>and</strong> K.I. 2006. Predicting the effects of habitat homogenization on marine biodiversity. Ecological<br />
Applications (16): 1636-1642.<br />
Tracey, D.M., Rowden, A.A., Mackay, K.A., Compton, T (2011) Habitat-forming cold-water corals show affinity for seamounts in the New<br />
Zeal<strong>and</strong> region. Marine Ecology Progress Series 430: 1–22.<br />
Turner G.E., Boesch D. 1987. <strong>Aquatic</strong> animal production <strong>and</strong> wetl<strong>and</strong> relationships: insights gleaned following wetl<strong>and</strong> loss or gain. In:<br />
Hooks D. (Ed.) Ecology <strong>and</strong> management of wetl<strong>and</strong>s. Croon Helms, Ltd., Beckenham, Kent, U.K. 25-39.<br />
Turner S., Schwarz A.-M. 2006. Management <strong>and</strong> conservation of seagrass in New Zeal<strong>and</strong>: an introduction. (264): 90.<br />
Vooren C. 1975. Nursery grounds of tarakihi (Teleostei: Cheilodactylidae) around New Zeal<strong>and</strong>. New Zeal<strong>and</strong> Journal of Marine <strong>and</strong><br />
Freshwater Research (9): 121-158.<br />
Warner R.R., Swearer S.E., Caselle J.E. 2000. Larval accumulation <strong>and</strong> retention: Implications for the design of marine reserves <strong>and</strong><br />
essential fish habitat. Bulletin of Marine Science (66): 821-830.<br />
Western Pacific Regional Fishery Management Council 1998. Magnuson-Stevens Act definitions <strong>and</strong> required provisions. Western Pacific<br />
Regional Fishery Management Council, Hawaii.<br />
215
AEBAR <strong>2012</strong>: Ecosystem effects: L<strong>and</strong>-based effects<br />
10. L<strong>and</strong>-based effects on fisheries, aquaculture <strong>and</strong><br />
supporting biodiversity<br />
Scope of chapter This chapter outlines the main known threats from l<strong>and</strong>-based activities to<br />
fisheries, aquaculture <strong>and</strong> supporting biodiversity. It also describes the<br />
present status <strong>and</strong> trends in l<strong>and</strong>-based impacts.<br />
Area All of the New Zeal<strong>and</strong> freshwater, EEZ <strong>and</strong> territorial sea.<br />
Focal localities Freshwater habitats <strong>and</strong> areas closest to the coast are likely to be most<br />
impacted; this will be exacerbated in areas with low water movement.<br />
Anthropogenically increased sediment run-off is particularly high from the<br />
Waiapu <strong>and</strong> Waipaoa river catchments on the east coast of the North Isl<strong>and</strong>.<br />
Areas of intense urbanisation or agricultural use of catchments are also likely<br />
to be impacted by bacteria, viruses, heavy metals <strong>and</strong> nutrients.<br />
Key issues Habitat modification, sedimentation, aquaculture, shellfish, terrestrial l<strong>and</strong>use<br />
change (particularly for urbanisation, forestry or agriculture) water<br />
quality <strong>and</strong> quantity, contamination, consequences to seafood production of<br />
increased pollutants, freshwater management <strong>and</strong> dem<strong>and</strong>.<br />
Emerging issues Impacts on habitats of particular significance to fisheries management<br />
(HPSFM), linkages through rainfall patterns to climate change, shellfish bed<br />
closures, habitat remediation, domestic animal diseases in protected marine<br />
MPI Research<br />
(current)<br />
NZ Government<br />
Research (current)<br />
Links to 2030<br />
objectives<br />
Related<br />
chapters/issues<br />
10.1. Context<br />
species, proposed aquaculture expansion, water abstraction impacts.<br />
Habitats of particular significance for fisheries management: Kaipara<br />
Harbour (ENV2009/07), Toheroa abundance (TOH2007/03), Biogenic<br />
habitats as areas of particular significance for fisheries management<br />
(HAB2007/01), Research on Biogenic Habitat-Forming Biota <strong>and</strong> their<br />
functional role in maintaining <strong>Biodiversity</strong> in the Inshore Region, 5-150m<br />
depths (ZBD2008/01 – this is also part-funded by Oceans Survey 2020,<br />
NIWA <strong>and</strong> MBIE).<br />
Ministry of Business, Innovation <strong>and</strong> Employment (MBIE) funded programs:<br />
(After the outfall: recovery from eutrophication in degraded New Zeal<strong>and</strong><br />
estuaries (UOCX0902).<br />
NIWA Core funding in two areas. Firstly, The ’Managing marine stressors’<br />
area under the ’Coasts <strong>and</strong> Oceans’ centre, specifically the programme<br />
’Managing marine resources’ <strong>and</strong> the project ’Measuring mapping <strong>and</strong><br />
conserving (C01X0505)’. Secondly, in the ’Fisheries’ Centre programme 3<br />
which deals with ecosytem-based management approaches in conjunction<br />
with the ’Coasts <strong>and</strong> Oceans’ centre.<br />
Objective 8: Improve RMA fisheries interface. Objective 4: Support<br />
aquaculture development<br />
Habitats of particular significance for fisheries management (HPSFM),<br />
marine environmental monitoring.<br />
It has been acknowledged for some time now that l<strong>and</strong>-based activities can have important effects on<br />
seafood production. The main threats to the quality <strong>and</strong> use of the world’s oceans are (GESAMP<br />
2001):<br />
• alteration <strong>and</strong> destruction of habitats <strong>and</strong> ecosystems;<br />
• effects of sewage on human health;<br />
216
AEBAR <strong>2012</strong>: Ecosystem effects: L<strong>and</strong>-based effects<br />
• widespread <strong>and</strong> increased eutrophication;<br />
• decline of fish stocks <strong>and</strong> other renewable resources; <strong>and</strong><br />
• changes in sediment flows due to hydrological changes<br />
. Coastal development is projected to impact 91% of all inhabited coasts by 2050 <strong>and</strong> will contribute<br />
to more than 80% of all marine pollution (Nellemann et al. 2008).<br />
Aquaculture <strong>and</strong> l<strong>and</strong>-based activities that may have impacts on seafood production are primarily<br />
regulated under the Resource Management Act 1991 (<strong>and</strong> subsequent amendments). Fisheries are<br />
controlled under the Fisheries Act 1996. Fisheries 2030 is a long-term policy strategy <strong>and</strong> direction<br />
paper of the Ministry for Primary Industries. It was released in 2009 <strong>and</strong> states that improving the<br />
Fisheries/Resource Management Act interface is a priority (objective 8). Strategic actions to achieve<br />
this priority are listed as:<br />
8.1 Improve fisheries sector input to processes that manage RMA-controlled effects on the<br />
marine <strong>and</strong> freshwater environment.<br />
8.2 Promote the development <strong>and</strong> use of RMA national policy statements, environmental<br />
st<strong>and</strong>ards, <strong>and</strong> regional coastal <strong>and</strong> freshwater plans<br />
The Government’s ‘Fresh Start for Freshwater Programme 26 ’ (lead by MfE <strong>and</strong> MPI) is addressing a<br />
range of issues through a water reform strategy that includes governance, setting objectives <strong>and</strong> limits,<br />
managing within limits (quality <strong>and</strong> quantity) <strong>and</strong> that better reflects Maori/Iwi rights <strong>and</strong> interests in<br />
water management. The Coastal Policy Statement (2010) also has relevance to matters of fisheries<br />
interest, e.g. Policy 20(1) (paraphrased) controls the use of vehicles on beaches where (b) harm to<br />
shellfish beds may result. MPI also works with other agencies, principally DOC, MfE <strong>and</strong> regional<br />
councils <strong>and</strong> through the Natural Resource Cluster to influence these processes to ensure<br />
consideration of l<strong>and</strong>-based impacts upon seafood production.<br />
L<strong>and</strong>-based effects on seafood production <strong>and</strong> supporting biodiversity in this context are defined as<br />
resulting either from the inputs of contaminants from terrestrial sources or through engineering<br />
structures (e.g., breakwaters, causeways, bridges) that change the nature <strong>and</strong> characteristics of coastal<br />
habitats <strong>and</strong> modify hydrodynamics. The major route for entry of l<strong>and</strong>-based contaminants into the<br />
marine environment is associated with freshwater flows (rivers, streams, direct runoff <strong>and</strong> ground<br />
water), although contaminants may enter the marine environment via direct inputs (e.g., l<strong>and</strong>slides) or<br />
atmospheric transport processes.<br />
The most important l<strong>and</strong>-based effect in New Zeal<strong>and</strong> is arguably increased sediment deposition<br />
around our coasts (Morrison et al. 2009). This deposition has been accelerated due to increased<br />
erosion from l<strong>and</strong>-use, which causes gully <strong>and</strong> channel erosion <strong>and</strong> l<strong>and</strong>slides (Glade 2003). Inputs of<br />
sediments to our coastal zone, although naturally high in places due to our high rainfall <strong>and</strong> rates of<br />
tectonic uplift (Carter 1975), have been accelerated by human activities (Goff 1997). Sediment inputs<br />
are now high by world st<strong>and</strong>ards <strong>and</strong> make up ~1% of the estimated global detrital input to the oceans<br />
(Carter et al. 1996). By contrast New Zeal<strong>and</strong> represents only ~ 0.3% of the l<strong>and</strong> area that drains into<br />
the oceans (Griffiths <strong>and</strong> Glasby 1985, Milliman <strong>and</strong> Syvitski 1992).<br />
Different l<strong>and</strong> use effects act over different scales; for example localised effects act on small streams<br />
<strong>and</strong> adjacent estuarine habitats, large scale effects extend to coastal embayments <strong>and</strong> shelf<br />
ecosystems. Associated risks will vary according to location <strong>and</strong> depend on the relevant ecosystem<br />
services (e.g. high value commercial fishery stocks) <strong>and</strong> their perceived sensitivities. The risk from<br />
stormwater pollutants will be more important near urban areas <strong>and</strong> the effects of nutrient enrichment<br />
will be more important near intensively farmed rural areas.<br />
26 http://www.mfe.govt.nz/issues/water/freshwater/fresh-start-for-fresh-water/<br />
217
AEBAR <strong>2012</strong>: Ecosystem effects: L<strong>and</strong>-based effects<br />
The risk from l<strong>and</strong>-based impacts for seafood production is that they will limit the productivity of a<br />
stock or stocks. For example, the bryozoan beds around Separation Point in Golden Bay, were<br />
protected from fishing, amongst other reasons, due to their perceived role as nursery grounds for a<br />
variety of coastal fish species in 1980 (Grange et al. 2003). Recent work has suggested the main threat<br />
to these bryozoans is now sedimentation from the Motueka River, which may inhibit recovery of any<br />
damaged bryozoans (Grange et al. 2003, Morrison et al. 2009). Any declines in this bryozoan bed <strong>and</strong><br />
associated ecological communities could also affect the productivity of adjacent fishery stocks.<br />
The New Zeal<strong>and</strong> aquaculture industry has an objective of developing into a billion dollar industry by<br />
2025 (Aquaculture New Zeal<strong>and</strong> <strong>2012</strong>). Government supports well-planned <strong>and</strong> sustainable<br />
aquaculture through its Aquaculture Strategy <strong>and</strong> Five-year Plan. One of the desired outcomes of<br />
actions by the New Zeal<strong>and</strong> Government is to enable more space to be made available for<br />
aquaculture. This outcome is likely to heighten the potential for conflict between aquaculture<br />
proponents <strong>and</strong> those creating negative l<strong>and</strong>-based effects.<br />
MPI mainly manage in the marine environment, therefore this topic area will be dealt with first. MPI<br />
also manages the freshwater eel fishery; this will be dealt with latterly within relevant sections.<br />
10.2. Global underst<strong>and</strong>ing<br />
10.2.1. L<strong>and</strong>-based influences<br />
The importance of different l<strong>and</strong>-based influences differ regionally but the South Pacific Regional<br />
<strong>Environment</strong>al Programme (SPREP, which includes New Zeal<strong>and</strong>) defines waste management <strong>and</strong><br />
pollution control as one of its four strategic priorities for 2011-2015 (SPREP 2010). “<br />
Influences, including l<strong>and</strong>-based influences, seldom work in isolation; for example the development<br />
of farming <strong>and</strong> fishing over the last hundred years has meant that increased sediment <strong>and</strong> nutrient<br />
runoff has to some degree occurred simultaneously with increased fishing pressure. However, the<br />
impact of these influences has often been studied in isolation. In a review on coastal eutrophication,<br />
Cloern (2001) stated that “Our view of the problem [eutrophication] is narrow because it continues to<br />
focus on one signal of change in the coastal zone, as though nutrient enrichment operates as an<br />
independent stressor; it does not reflect a broad ecosystem-scale view that considers nutrient<br />
enrichment in the context of all the other stressors that cause change in coastal ecosystems”. These<br />
influences (in isolation or combination) can also cause indirect effects, such as decreasing species<br />
diversity which then lessens resistance to invasion by non-indigenous species or species with different<br />
life-history strategies (Balata et al. 2007, Kneitel <strong>and</strong> Perrault 2006, Piola <strong>and</strong> Johnston 2008). Studies<br />
that research a realistic mix of influences are rare.<br />
Sediment deposition can be an important influence, particularly in areas of high rainfall, tectonic uplift,<br />
<strong>and</strong> forest clearances, or areas where these activities coincide. Sediments are known to erode from the<br />
l<strong>and</strong> at an increased rate in response to human use, for example, estimates from a largely deforested<br />
tropical highl<strong>and</strong> suggest erosion rates 10-100 times faster than pre-clearance rates (Hewawasam et al.<br />
2003). Increased sediment either deposited on the seafloor or suspended in the water column can<br />
negatively impact upon invertebrates in a number of ways including: burial, scour, inhibiting<br />
settlement, decreasing filter-feeding efficiency <strong>and</strong> decreasing light penetration, generally leading to<br />
less diverse communities, with a decrease in suspension feeders (Thrush et al. 2004). These impacts<br />
can affect the structure, composition <strong>and</strong> dynamics of benthic communities (Airoldi 2003, Thrush et al.<br />
2004). Effects of this increased sediment movement <strong>and</strong> deposition on finfish are mostly known from<br />
freshwater fish <strong>and</strong> can range from behavioural (such as decreased feeding rates) to sublethal (e.g., gill<br />
tissue disruption) <strong>and</strong> lethal as well as having effects on habitat important to fishes (Morrison et al.<br />
2009). These effects differ by species <strong>and</strong> life-stages <strong>and</strong> are dependant upon factors that include the<br />
218
AEBAR <strong>2012</strong>: Ecosystem effects: L<strong>and</strong>-based effects<br />
duration, frequency <strong>and</strong> magnitude of exposure, temperature, <strong>and</strong> other environmental variables<br />
(Servizi <strong>and</strong> Martens 1992).<br />
Increased nutrient addition to the aquatic environment can initially increase production, but with<br />
increasing nutrients there is an increasing likelihood of harmful algal blooms <strong>and</strong> cascades of effects<br />
damaging to most communities above the level of the plankton (Kennish 2002; Heisler et al. 2008).<br />
This excess of nutrients is termed eutrophication. Eutrophication can stimulate phytoplankton growth<br />
which can decrease the light availability <strong>and</strong> subsequently lead to losses in benthic production from<br />
seagrass, microalgae or macroalgae <strong>and</strong> their associated animal communities. Algal blooms then die<br />
<strong>and</strong> their decay depletes oxygen <strong>and</strong> blankets the seafloor. The lack of oxygen in the bed <strong>and</strong> water<br />
column can lead to losses of finfish <strong>and</strong> benthic communities. These effects are likely to be location<br />
specific <strong>and</strong> are influenced by a number of factors including: water transparency, distribution of<br />
vascular plants <strong>and</strong> biomass of macroalgae, sediment biogeochemistry <strong>and</strong> nutrient cycling, nutrient<br />
ratios <strong>and</strong> their regulation of phytoplankton community composition, frequency of toxic/harmful algal<br />
blooms, habitat quality for metazoans, reproduction/growth/survival of pelagic <strong>and</strong> benthic<br />
invertebrates, <strong>and</strong> subtle changes such as shifts in the seasonality of ecosystems (Cloern 2001). These<br />
effects of eutrophication abound in the literature, for example, the formation of dead (or anoxic) zones<br />
is exacerbated by eutrophication, although oceanographic conditions also play a key role (Diaz <strong>and</strong><br />
Rosenberg 2008). Dead zones have now been reported from more than 400 systems, affecting a total<br />
area of more than 245,000 square kilometres (Diaz <strong>and</strong> Rosenberg 2008). This includes anoxic events<br />
from New Zeal<strong>and</strong> in coastal north-eastern New Zeal<strong>and</strong> <strong>and</strong> Stewart Isl<strong>and</strong> (Taylor et al. 1985,<br />
Morrissey 2000).<br />
Other pollutants such as heavy metals <strong>and</strong> organic chemicals can have severe effects, but are more<br />
localised in extent than sediment or nutrient pollution (Castro <strong>and</strong> Huber 2003, Kennish 2002).<br />
Fortunately the concentration of these pollutants in most New Zeal<strong>and</strong> aquatic environments is<br />
relatively low, with a few known exceptions. Examples of this include naturally elevated levels of<br />
arsenic in Northl<strong>and</strong> 27 , Cadmium levels in Foveaux Strait oysters (Frew et al. 1996) <strong>and</strong> levels of<br />
Nickel <strong>and</strong> chromium within the Motueka river plume in Tasman Bay (Forrest et al. 2007). The<br />
Cadmium levels have caused market access issues for Foveaux Strait Oysters. Some<br />
anthropogenically generated pollutants such as copper, lead, zinc <strong>and</strong> PCBs are high in localised<br />
hotspots within urban watersheds. In the Auckl<strong>and</strong> region these hotspots tend to be in muddy<br />
estuarine sites <strong>and</strong> tidal creeks that receive runoff from older urban catchments 28 . There is a lack of<br />
knowledge on the impacts of these pollutants upon fisheries.<br />
Climate change is likely to interact with the effect of l<strong>and</strong>-based impacts as the main delivery of l<strong>and</strong>based<br />
influences is through rainfall <strong>and</strong> subsequent freshwater flows. Global climate change<br />
projections include changes in the amount <strong>and</strong> regional distribution of rainfall over New Zeal<strong>and</strong><br />
(IPCC 2007). More regional predictions include increasing frequency of heavy rainfall events over<br />
New Zeal<strong>and</strong> (Whetton et al. 1996). This is likely to exacerbate the impact of some l<strong>and</strong>-based<br />
influences as delivery peaks at times of high rainfall, e.g. sediment delivery (Morrison et al. 2009).<br />
Physical alterations of the coast are generally, but not exclusively (i.e. wetl<strong>and</strong> reclamation for<br />
agriculture), concentrated around urban areas <strong>and</strong> can have a number of consequences on the marine<br />
environment (Bulleri <strong>and</strong> Chapman 2010). Changes in diversity, habitat fragmentation or loss <strong>and</strong><br />
increased invasion susceptibility have all been identified as consequences of physical alteration. The<br />
effects of physical alterations upon fisheries remain largely unquantified; however the habitat loss or<br />
alteration portion of physical alterations will be dealt with under the habitats of particular significance<br />
for fisheries management (HPSFM) section.<br />
27 Accessible on the www.os2020.org.nz website.<br />
28 Available from the State of the Auckl<strong>and</strong> Region report 2010, Chapter 4.4 Marine, at<br />
http://www.arc.govt.nz/albany/index.cfm?FD6A3403-145E-173C-986A-A0E3C199B8C5<br />
219
AEBAR <strong>2012</strong>: Ecosystem effects: L<strong>and</strong>-based effects<br />
An area of emerging interest internationally is infectious diseases from l<strong>and</strong>-based animals affecting<br />
marine populations. Perhaps the most well-known example of this is the canine distemper outbreak in<br />
Caspian seals that cause a mass mortality in the Caspian sea in 2000 (Kennedy et al. 2000)<br />
10.2.2. Habitat restoration<br />
Habitat restoration or rehabilitation has been the subject of much recent research. Habitat restoration<br />
or rehabilitation rarely, if ever, replaces what was lost <strong>and</strong> is most applicable in estuarine or enclosed<br />
coastal areas as opposed to exposed coastal or open ocean habitats (Elliott et al. 2007). Connectivity<br />
of populations is a key consideration when evaluating the effectiveness of any marine restoration or<br />
rehabilitation (Lipcius et al. 2008). In the marine area, seagrass replanting methodologies are being<br />
developed to ensure the best survival success (Bell et al. 2008) <strong>and</strong> artificial reefs can improve<br />
fisheries catches, although whether artificial reefs boost population numbers or merely attract fish is<br />
unclear (Seaman 2007). In addition, The incorporation of habitat elements in engineering structures,<br />
e.g., artificial rockpools in seawalls, shows promise in terms of ameliorating impacts of physical<br />
alterations (Bulleri 2006). Spatial approaches to managing l<strong>and</strong>-use impacts, such as marine reserves,<br />
will be covered under the section about HPSFM.<br />
Freshwater rehabilitation has been reviewed by Roni et al. (2008). Habitat reconnection, floodplain<br />
rehabilitation <strong>and</strong> instream habitat improvement are all suggested to result in improved habitat <strong>and</strong><br />
local fish abundances. Riparian rehabilitation, sediment reduction, dam removal, <strong>and</strong> restoration of<br />
natural flood regimes have shown promise for restoring natural processes that create <strong>and</strong> maintain<br />
habitats, but there is a lack of long-term studies to gauge their success. Wild eel fisheries in America<br />
<strong>and</strong> Europe have declined over time (Allen et al. 2006, Atlantic States Marine Fisheries Commission<br />
2000, Haro et al. 2000). Declines in wild eel fisheries have been linked to a number of factors<br />
including: barriers to migration; hydro turbine mortality; <strong>and</strong> habitat loss or alteration. Information to<br />
quantitatively assess these linkages is however often lacking (Haro et al. 2000).<br />
10.3. State of knowledge in New Zeal<strong>and</strong><br />
L<strong>and</strong>-based effects will be most pronounced closest to the l<strong>and</strong>, therefore it is freshwater, estuarine,<br />
coastal, middle depths <strong>and</strong> deepwater fisheries, in decreasing order, that will be most affected. The<br />
scale of l<strong>and</strong>-use effects will, however, differ depending upon the particular influence. The most<br />
localised of these are likely to be direct physical impacts; for example, the replacement of natural<br />
shorelines with seawalls; although even direct physical impacts can have larger scale impacts, such as<br />
affecting sediment transport <strong>and</strong> subsequently beach erosion, or contributing to cumulative effects<br />
upon ecosystem responses. Point-source discharges are likely to have a variable scale of influence,<br />
<strong>and</strong> this influence is likely to increase where a number of point-sources discharge, particularly when<br />
this occurs into an embayed, low-current environment. An example of this is the multiple stormwater<br />
discharges into the Waitemata harbour in Auckl<strong>and</strong> (Hayward et al. 2006). The largest influence can<br />
be from diffuse-source discharges such as nutrients or sediment (Kennish 2002). For example, the<br />
influence of diffuse-source materials from the Motueka river catchment in Golden Bay on subtidal<br />
sediments <strong>and</strong> assemblages <strong>and</strong> shellfish quality can extend up to tens of kilometres offshore (Tuckey<br />
et al. 2006; Forrest et al. 2007), with even a moderate storm event extending a plume greater than<br />
6km offshore (Cornelisen et al. 2011). Terrestrial influences on New Zeal<strong>and</strong>’s marine environment<br />
can, at times be detected by satellites from differences in ocean colour <strong>and</strong> turbidity extending many<br />
kilometres offshore from river mouths (Gibbs et al. 2006).<br />
All coastal areas are unlikely to suffer from l<strong>and</strong>-based impacts in the same way. The quantities of<br />
pollutants or structures differ spatially. Stormwater pollutants, seawalls <strong>and</strong> jetties are more likely to<br />
be concentrated around urban areas. Nutrient inputs are likely to be concentrated either around sewage<br />
220
AEBAR <strong>2012</strong>: Ecosystem effects: L<strong>and</strong>-based effects<br />
outlets or associated with areas of intensive agriculture or horticulture. Sediment production has been<br />
mapped around the country <strong>and</strong> is greatest around the west coast of the South Isl<strong>and</strong> <strong>and</strong> the East<br />
coast of the North Isl<strong>and</strong> (Griffiths <strong>and</strong> Glasby 1985, Hicks <strong>and</strong> Shankar 2003, Hicks et al. 2011).<br />
Notably the catchments where improved l<strong>and</strong> management may result in the biggest changes to<br />
sediment delivery to coastal environments are likely to be the Waiapu <strong>and</strong> Waipaoa river catchments<br />
on the East coast of the North Isl<strong>and</strong>. In addition to this, the sensitivity of receiving environments is<br />
also likely to differ; this will be covered in subsequent sections.<br />
A MPI funded survey of scientific experts (MacDiarmid et al. <strong>2012</strong>) addressed the vulnerability to a<br />
number of threats of marine habitat types within the New Zeal<strong>and</strong>’s Territorial Sea <strong>and</strong> Exclusive<br />
Economic Zone (EEZ). Each vulnerability score was based on an assessment of five factors including<br />
the spatial scale, frequency <strong>and</strong> functional impact of the threat in the given habitat as well as the<br />
susceptibility of the habitat to the threat <strong>and</strong> the recovery time of the habitat following disturbance<br />
from that threat. The study found that the number of threats <strong>and</strong> their severity were generally<br />
considered to decrease with depth, particularly below 50m. Reef, s<strong>and</strong>, <strong>and</strong> mud habitats in harbours<br />
<strong>and</strong> estuaries <strong>and</strong> along sheltered <strong>and</strong> exposed coasts were considered to be the most highly threatened<br />
habitats. The study also reported that over half of the twenty-six top threats fully, or in part, stemmed<br />
from human activities external to the marine environment itself. The top six threats in order were:<br />
1. ocean acidification,<br />
2. rising sea temperatures resulting from global climate change,<br />
3 rd equal bottom trawling fishing,<br />
3 rd equal increased sediment loadings from river inputs<br />
5 th equal change in currents from climate change<br />
5 th equal increased storminess from climate change<br />
The reader is guided to MacDiarmid et al. (<strong>2012</strong>) for more detail including tables of threats-by-habitat<br />
<strong>and</strong> habitats-by-threat. Climate change <strong>and</strong> ocean acidification, although they can be considered l<strong>and</strong>based<br />
effects, are covered under the Chapters in this document called “New Zeal<strong>and</strong> Regional climate<br />
<strong>and</strong> oceanic setting” <strong>and</strong> “<strong>Biodiversity</strong>”.<br />
The protozoan Toxoplasma gondii has been identified as the cause of death for 7 of 28 Hector’s <strong>and</strong><br />
Maui’s dolphins examined since 2007 (W. Roe, Massey University, unpubl. data, 31 July <strong>2012</strong>).<br />
L<strong>and</strong>-based runoff containing cat faeces is believed to be the means by which Toxoplasma gondii<br />
enters the marine environment (Hill & Dubey 2002). A Hectors dolphin has also tested positive for<br />
Brucella abortus (or a similar organism) a pathogen of terrestrial mammals that can cause late<br />
pregnancy abortion, <strong>and</strong> has been seen in a range of cetacean species elsewhere 29 .<br />
10.3.1. Completed research<br />
A MPI funded project (IPA2007/07) reviewed the impacts of l<strong>and</strong> based influences on coastal<br />
biodiversity <strong>and</strong> fisheries (Morrison et al. 2009). This review used a number of lines of evidence to<br />
conclude that in this context, sedimentation is probably New Zeal<strong>and</strong>’s most important pollutant. The<br />
negative impacts of sediment include decreasing efficiency of filter-feeding shellfish (such as cockles,<br />
pipi, <strong>and</strong> scallops), reduced settlement success <strong>and</strong> survival of larval <strong>and</strong> juvenile phases (e.g., paua,<br />
kina), <strong>and</strong> reductions in the foraging abilities of finfish (e.g., juvenile snapper). Indirect effects<br />
include the modification or loss of important nursery habitats, particularly biogenic habitats (greenlipped<br />
<strong>and</strong> horse mussel beds, seagrass meadows, bryozoan <strong>and</strong> tubeworm mounds, sponge gardens,<br />
29 http://www.doc.govt.nz/Documents/conservation/native-animals/marine-mammals/maui-tmp/mauis-tmp-<br />
discussion-document-full.pdf<br />
221
AEBAR <strong>2012</strong>: Ecosystem effects: L<strong>and</strong>-based effects<br />
kelps/seaweeds, <strong>and</strong> a range of other structurally complex species). Inshore filter-feeding bivalves <strong>and</strong><br />
biogenic habitats were identified as the most likely to be adversely affected by sedimentation.<br />
Eutrophication was also identified as a potential threat from experience overseas.<br />
Marine restoration studies published in New Zeal<strong>and</strong> have focused on the New Zeal<strong>and</strong> cockle<br />
Austrovenus stutchburyi. The first of these studies identified a tagging methodology to aid relocation<br />
of transplanted individuals (Stewart <strong>and</strong> Creese 1998). Subsequent studies stressed the use of adults in<br />
restoration <strong>and</strong> the importance of site selection, either from theoretical or modelling viewpoints<br />
(Lundquist et al. 2009, Marsden <strong>and</strong> Adkins 2009). Detailed restoration methodology has been<br />
investigated in Whangarei Harbour <strong>and</strong> recommends replanting adults at densities between 222 <strong>and</strong><br />
832 m -2 (Cummings et al. 2007).<br />
Multiple influences in areas relevant to seafood production in New Zeal<strong>and</strong> have been addressed by<br />
three studies. A field experiment near Auckl<strong>and</strong> showed greater effects of three heavy metals<br />
(Copper, lead <strong>and</strong> Zinc) in combination compared to isolation on infaunal colonisation of intertidal<br />
estuarine sediments (Fukunaga et al. 2010). A survey approach looking at the interaction of sediment<br />
grain size, organic content <strong>and</strong> heavy metal contamination upon densities of 46 macrofaunal taxa<br />
across the Auckl<strong>and</strong> region also showed a predominance of multiplicative effects (Thrush et al. 2008).<br />
Although influences can work in unexpected directions; as in a study on large suspension feeding<br />
bivalves off estuary mouths where the anticipated negative impacts from sediment were not observed<br />
<strong>and</strong> these species benefited from food resources generated from those estuaries (Thrush et al. In<br />
Press).<br />
Toheroa populations are currently closed to all but customary harvesting but have failed to recover to<br />
former population levels even though periodic (<strong>and</strong> sometimes substantial) pulses in young recruits<br />
have been detected in both Northl<strong>and</strong> <strong>and</strong> Southl<strong>and</strong> (Beentjes 2010, Morrison <strong>and</strong> Parkinson 2008).<br />
Current thinking suggests a mix of influences are probably responsible for these declines including<br />
over-harvesting, l<strong>and</strong>-use changes leading to changes in freshwater seeps on the beaches <strong>and</strong> vehicle<br />
traffic (Morrison et al. 2009). A number of discrete pieces of research have been completed in this<br />
area. A review of the wider impact of vehicles on beaches <strong>and</strong> s<strong>and</strong>y dunes has been completed, <strong>and</strong><br />
suggested more research was needed on the impacts of vehicle traffic on the intertidal (Stephenson<br />
1999). A four day study over a fishing contest on 90 mile beach showed the potential of traffic to<br />
produce immediate mortalities of juvenile toheroa, but the temporal importance of this could not be<br />
gauged (Hooker <strong>and</strong> Redfearn 1998). Mortalities of toheroa from the Burt Munro Classic motorcycle<br />
race on Oreti beach have been quantified <strong>and</strong> recommendations made for how to minimise these, but<br />
again the importance of vehicle traffic for toheroa survival over longer time periods was unclear<br />
(Moller et al. 2009).<br />
The effects of large-scale habitat loss <strong>and</strong> modification on eels in New Zeal<strong>and</strong> are clearly significant,<br />
but difficult to quantify (Beentjes et al. 2005). Significant non-fisheries mortality of New Zeal<strong>and</strong><br />
freshwater longfin <strong>and</strong> shortfin eels are caused by mechanical clearance of drainage channels, <strong>and</strong><br />
damage by hydro-electric turbines <strong>and</strong> flood control pumping. Eels prefer habitat that offers cover <strong>and</strong><br />
in modified drains aquatic weed provides both daytime cover <strong>and</strong> nighttime foraging areas. Loss of<br />
weed <strong>and</strong> natural debris can thus result in significant displacement of eels to other areas. In addition,<br />
wetl<strong>and</strong>s drainage has resulted in greatly reduced available habitat for eels, particularly shortfins<br />
which prefer slower-flowing coastal habitats such as lagoons, estuaries, <strong>and</strong> lower reaches of rims.<br />
Water abstraction is one of a number of information requirements identified in this paper to better<br />
define the effects on eel populations.<br />
Rhodolith beds have been surveyed in the Bay of Isl<strong>and</strong>s <strong>and</strong> high diversity reported even in areas of<br />
abundant fine sediments (Nelson et al. <strong>2012</strong>). It is unclear if the increasing sedimentation occurring in<br />
the Te Rawhiti Reach is negatively impacting rhodoliths <strong>and</strong> whether this atypical rhodolith bed (i.e.,<br />
with abundant fine sediments) is at risk if current sedimentation <strong>and</strong> mobilisation rates continue.<br />
222
AEBAR <strong>2012</strong>: Ecosystem effects: L<strong>and</strong>-based effects<br />
A number of Integrated Catchment Management (ICM) projects are underway in New Zeal<strong>and</strong>. These<br />
take a holistic view to l<strong>and</strong> management incorporating aquatic effects; this approach could help<br />
restore water quality of both fresh <strong>and</strong> coastal waters. An overview of these projects is given in a<br />
Ministry for the <strong>Environment</strong> Report on integrated catchment management (<strong>Environment</strong>al<br />
Communications Limited 2010). Many of these projects employ restoration techniques such as<br />
riparian planting, but few assessments of the effectiveness of riparian planting exist. One assessment<br />
of the effect of nine riparian zone planting schemes in the North Isl<strong>and</strong> on water quality, physical <strong>and</strong><br />
ecological indicators concluded that riparian planting could improve stream quality; in particular rapid<br />
improvements were seen in terms of visual clarity <strong>and</strong> channel stability (Parkyn et al. 2003). Nutrient<br />
<strong>and</strong> faecal contamination results were more variable. Improvement in macroinvertebrate communities<br />
did not occur in most streams <strong>and</strong> the three factors needed for these were canopy closure (which<br />
decreased stream temperature), long lengths of riparian planting <strong>and</strong> protection of headwater<br />
tributaries. A modelling study also demonstrated the long time lag needed to grow large trees which<br />
then provide wood debris to structure channels which achieves the best stream rehabilitation results<br />
(Davies-Colley et al. 2009). Although some of these studies extend into the marine realm (at least in<br />
terms of monitoring) it is difficult to gauge the impact of these activities upon fisheries or aquaculture,<br />
particularly on wider scales because ICM studies have been localised at small scales.<br />
The review of l<strong>and</strong> based effects (Morrison et al. 2009) identified knowledge gaps <strong>and</strong> made<br />
suggestions for more relevant research on these influences:<br />
• identification of fisheries species/habitat associations for different life stages, including<br />
consideration of how changing habitat l<strong>and</strong>scapes may change fisheries production;<br />
• better knowledge of connectivity between habitats <strong>and</strong> ecosystems at large spatial scales;<br />
• the role of river plumes;<br />
• the effects of l<strong>and</strong>-based influences both directly on fished species, <strong>and</strong> indirectly through<br />
impacts on nursery habitats;<br />
• a better spatially-based underst<strong>and</strong>ing, mapping <strong>and</strong> synthesis of the integrated impacts of<br />
l<strong>and</strong>-based <strong>and</strong> marine-based influences on coastal marine ecosystems.<br />
The locations where addressing l<strong>and</strong>-based impacts is likely to result in a lowering in risk to seafood<br />
production or increased seafood production, excluding those already mentioned, are undefined.<br />
10.3.2. Current research<br />
A number of ongoing research projects exist that will improve the knowledge of l<strong>and</strong>-based impacts<br />
upon seafood production. Project ENV2009/07 investigates habitats of particular significance for<br />
fisheries management within the Kaipara Harbour <strong>and</strong> one objective is to assess fishing <strong>and</strong> l<strong>and</strong>based<br />
threats to these habitats. Current research is investigating the impact of a range of influences<br />
upon toheroa at Ninety-Mile Beach (project TOH2007/03). <strong>Environment</strong>al factors, including l<strong>and</strong>based<br />
impacts (particularly vehicle use <strong>and</strong> changing l<strong>and</strong>-use patterns) are implicated in poor<br />
recovery of this population since the closure of this commercial <strong>and</strong> recreational fishery in the 1960s.<br />
A MPI biodiversity project also has components that address l<strong>and</strong>-based effects; the threats to<br />
biogenic habitats are addressed in project ZBD2008/01.<br />
Research is also ongoing on l<strong>and</strong>-use effects at a national scale. A national scale threat analysis is also<br />
being carried out for biogenic habitats, given their likely importance for fisheries management<br />
(project HAB2007/01). A Ministry of Business, Innovation <strong>and</strong> Employment (MBIE) funded project<br />
30 of particular relevance is (project number <strong>and</strong> lead agencies in brackets): Nitrogen reduction <strong>and</strong><br />
benthic recovery (UOCX0902, University of Canterbury). This research aims to determine the<br />
trajectories <strong>and</strong> thresholds of coastal ecosystem recovery following removal of excessive nutrient<br />
30 http://www.msi.govt.nz/update-me/who-got-funded/<br />
223
AEBAR <strong>2012</strong>: Ecosystem effects: L<strong>and</strong>-based effects<br />
loading (called "eutrophication") <strong>and</strong> earthquake impacts. This will be achieved by monitoring the<br />
effects of diverting all of Christchurch’s treated wastewater discharge from the eutrophied Avon-<br />
Heathcote (Ihutai) Estuary <strong>and</strong> the subsequent earthquake induced disturbances to this diversion.<br />
Although not current research, the Department of Conservations suggested research priorities in<br />
the “<strong>Review</strong> of the Maui’s dolphin Threat management plan: Consultation paper” include<br />
objectives to determine the presence, pathways <strong>and</strong> possible mitigation of the threat from<br />
Toxoplasmosis gondii 31 .<br />
10.4. Indicators <strong>and</strong> trends<br />
A national view of the impacts of l<strong>and</strong>-based influences upon seafood production does not exist; this<br />
could be facilitated by better coordination <strong>and</strong> planning of the many disparate marine monitoring<br />
programmes running around the country. Monitoring of marine water quality <strong>and</strong> associated<br />
communities is carried out through a variety of organisations, including, universities, regional<br />
councils <strong>and</strong> aquaculture or shellfisheries operations. Regional council monitoring of water quality<br />
<strong>and</strong> associated biological communities is often reported through web sites such as the Auckl<strong>and</strong><br />
Regional Council environmental monitoring data which is available on the internet 32<br />
224<br />
or summary<br />
reports such as the Hauraki Gulf state of the <strong>Environment</strong> 2011 report 33 Water quality <strong>and</strong><br />
associated communities may also be monitored for a regional council as part of a consent application<br />
or as a stipulation for a particular marine development. The data from aquaculture <strong>and</strong> shellfisheries<br />
water quality monitoring is not generally available. Improved coordination <strong>and</strong> planning of marine<br />
monitoring has been achieved in some places, e.g., the United Kingdom 34 The Marine <strong>Environment</strong>al<br />
Monitoring Programme (ZBD2010-42), is a step towards this goal, more information is available on<br />
this project in the <strong>Biodiversity</strong> chapter of this document. Possible national scale proxies for coastal<br />
faecal contamination may exist after collating information from sanitation area monitoring for<br />
shellfish harvesting or shellfish harvesting closure information.<br />
Marine water quality indicators are available nationally from 407 coastal bathing beaches which have<br />
been monitored for human health issues, rather than environmental purposes, over the last six years 35 .<br />
No temporal trends were detectable in this relatively short time period, however changes in sites<br />
monitored over this time may have confounded this analysis. Over the 2007-8 <strong>and</strong> 2008-9 summers,<br />
79% of the swimming sites met the guidelines for contact recreation almost all the time. At least 95%<br />
of the samples at these sites had safe Enterococci levels (which is an indicator of human <strong>and</strong> animal<br />
sewage). Two percent of the sites (located within the Manukau harbour <strong>and</strong> on the West coast of<br />
Auckl<strong>and</strong>), breached the guidelines more than 25% of the time. In general, the most polluted sites<br />
were embayed locations with poor natural flushing.<br />
The Ministry for the <strong>Environment</strong> (MfE) also reports on freshwater quality. River water quality<br />
indicators that have been assessed have direct relevance to the eel, <strong>and</strong> other freshwater fisheries, <strong>and</strong><br />
this water will flow through estuaries <strong>and</strong> enter the marine environment. The National River Water<br />
Quality Network (NRWQN) has national coverage, <strong>and</strong> has been running for over 20 years <strong>and</strong> has<br />
recently reported upon the following 8 variables: temperature, dissolved oxygen, visual clarity,<br />
dissolved reactive <strong>and</strong> total phosphorous, <strong>and</strong> ammoniacal, oxidised <strong>and</strong> total nitrogen (Ballantine <strong>and</strong><br />
31 http://www.doc.govt.nz/Documents/conservation/native-animals/marine-mammals/maui-tmp/mauis-tmp-<br />
discussion-document-full.pdf<br />
32<br />
http://maps.auckl<strong>and</strong>.govt.nz/auckl<strong>and</strong>regionviewer/?widgets=HYDROTEL<br />
33<br />
http://www.arc.govt.nz/albany/fms/main/Documents/<strong>Environment</strong>/Coastal%20<strong>and</strong>%20marine/hgfstateoftheen<br />
vreport2011.pdf<br />
34<br />
http://www.cefas.co.uk/data/marine-monitoring/national-marine-monitoring-programme-(nmmp).aspx<br />
35<br />
http://www.mfe.govt.nz/environmental-reporting/freshwater/recreational/snapshot/coastal.html#results
AEBAR <strong>2012</strong>: Ecosystem effects: L<strong>and</strong>-based effects<br />
Davies-Colley 2009). Dissolved oxygen showed few meaningful trends <strong>and</strong> the ammoniacal nitrogen<br />
data suffered from a processing artefact. An upward, although not significant trend in temperature <strong>and</strong><br />
an improvement of water clarity were seen at the national scale. However, a negative correlation was<br />
seen between water clarity <strong>and</strong> percent of catchment in pasture, which suggests any expansion of<br />
pasture l<strong>and</strong>s may have impacts on clarity. Strong increasing trends over time were seen in oxidised<br />
nitrogen, total nitrogen, total phosphorous <strong>and</strong> dissolved reactive phosphorous. These latter trends all<br />
signify deteriorating water quality <strong>and</strong> are mainly attributable to increased diffuse-source pollution<br />
from the expansion <strong>and</strong> intensification of pastoral agriculture.<br />
Total Nitrogen <strong>and</strong> Phosphorous loads to the coast in New Zeal<strong>and</strong> have been modelled <strong>and</strong> were<br />
estimated at 167,300 <strong>and</strong> 63,100 t yr -1 , respectively (Elliot et al. 2005) 36 . The main sources of<br />
Nitrogen <strong>and</strong> Phosphorous were from pastoralism (70%) <strong>and</strong> erosion (53%), respectively. The dairy<br />
herd in New Zeal<strong>and</strong> has approximately doubled (increased 211%) since 1981 (whilst other grazer<br />
numbers have been relatively stable or declining) 9 . The amount of Urea <strong>and</strong> Superphosphate (New<br />
Zeal<strong>and</strong>’s most common nitrogen <strong>and</strong> phosphorous fertiliser) have increased 27.7 <strong>and</strong> 1.6 fold,<br />
respectively over the same period 37 . The use of Urea is currently around 100 kg.ha -1 for dairying <strong>and</strong><br />
~10 kg.ha -1 for sheep <strong>and</strong> beef farms (MPI <strong>2012</strong>). The area in dairy farming is ~ 2 million hectares<br />
compared to 3.6 million hectares for sheep <strong>and</strong> 2 million hectares in beef farming (MPI <strong>2012</strong>).<br />
Therefore Urea use in New Zeal<strong>and</strong> is dominated by the dairy industry. These statistics provide strong<br />
circumstantial evidence that the expansion in dairying is primarily responsible for these declines in<br />
water quality from agricultural sources.<br />
High faecal coliform counts (primarily from mammal or bird faeces) can impact upon the value<br />
gained from shellfish fisheries <strong>and</strong> aquaculture. Area closures to commercial harvesting usually<br />
depend on an areas rainfall/runoff relationship <strong>and</strong> areas closer to significant farming areas or urban<br />
concentrations are likely to be closed more frequently, due to high faecal coliform counts, than areas<br />
where the catchment is unfarmed or not heavily populated, e.g. Inner Pelorus sound is likely to be<br />
closed more frequently than outer Pelorus Sound (Marlborough Sounds) 38 . For coastal areas of the<br />
Marlborough Sounds, the Corom<strong>and</strong>el Peninsula <strong>and</strong> Northl<strong>and</strong> closures can range from a few days to<br />
over 50 percent of the time in a given year 39 . Certain fisheries may in practice be limited by the<br />
amount of time where water quality is sufficient to allow harvesting, e.g. the cockle fishery in COC1A<br />
(Snake bank in Whangarei harbour) was closed for 101, 96, 167, 96 <strong>and</strong> 117 days for the 2006-7,<br />
2007-8, 2008-9, 2009-10 <strong>and</strong> 2010-11 fishing years, respectively due to high faecal coliform counts<br />
from sewage spills or runoff 40 . Models also now exist that allow real-time prediction of E. coli pulses<br />
associated with storm events, e.g. Wilkinson et al. 2011, which may help harvesters to better cope<br />
with water quality issues.<br />
10.5. References<br />
Airoldi L. 2003. The effects of sedimentation on rocky coast assemblages. In: Oceanography <strong>and</strong> Marine Biology. 161-236.<br />
Allen M., Rosell R., Evans D. 2006. Predicting catches for the Lough Neagh (Northern Irel<strong>and</strong>) eel fishery based on stock inputs, effort <strong>and</strong><br />
environmental variables. Fisheries Management <strong>and</strong> Ecology (13): 251-260.<br />
Atlantic States Marine Fisheries Commission 2000. Interstate Fishery Management Plan for American Eel. Fishery Management Report No.<br />
36 of the Atlantic States Marine Fisheries Commission. 93p.<br />
Balata D., Piazzi L., Cinelli F. 2007. Increase of sedimentation in a subtidal system: Effects on the structure <strong>and</strong> diversity of macroalgal<br />
assemblages. Journal of Experimental Marine Biology <strong>and</strong> Ecology (351): 73-82.<br />
Ballantine D., Davies-Colley R. 2009. Water quality trends at National River Water Quality Network sites for 1989–2007. Prepared for<br />
Ministry for the <strong>Environment</strong>, NIWA Client Report: HAM2009-026. 43p.<br />
Beentjes M., Boubée J., Jellyman J.D., Graynoth E. 2005. Non-fishing mortality of freshwater eels (Anguilla spp.). New Zeal<strong>and</strong> Fisheries<br />
Assessment Report 2005/34. 38p.<br />
36 2<br />
This is an underestimate because streams with catchments less than 10km were excluded from this<br />
calculation.<br />
8<br />
http://www.stats.govt.nz/infoshare<br />
10<br />
Pers. Comms. Brian Roughan, New Zeal<strong>and</strong> Food Safety Authority.<br />
11<br />
Pers. Comms. Brian Roughan, New Zeal<strong>and</strong> Food Safety Authority.<br />
12<br />
Statistics supplied by New Zeal<strong>and</strong> Food Safety Authority in Whangarei.<br />
225
AEBAR <strong>2012</strong>: Ecosystem effects: L<strong>and</strong>-based effects<br />
Beentjes M. 2010. Toheroa survey of Oreti Beach, 2009, <strong>and</strong> review of historical surveys. 40p.<br />
Bell S.S., Tewfik A., Hall M.O., Fonseca M.S. 2008. Evaluation of seagrass planting <strong>and</strong> monitoring techniques: Implications for assessing<br />
restoration success <strong>and</strong> habitat equivalency. Restoration Ecology (16): 407-416.<br />
Bulleri F. 2006. Is it time for urban ecology to include the marine realm? Trends in Ecology & Evolution (21): 658-659.<br />
Bulleri F., Chapman M. 2010. The introduction of coastal infrastructure as a driver of change in marine environments. Journal of Applied<br />
Ecology (47): 26-35.<br />
Carter L. 1975. Sedimentation on the continental terrace around New Zeal<strong>and</strong>: A <strong>Review</strong>. Marine Geology (19): 209-237.<br />
Carter L., Carter R., McCave I., Gamble J. 1996. Regional sediment recycling in the abyssal Southwest Pacific Ocean. Geology (24): 735-<br />
738.<br />
Castro P., Huber M. 2003. Marine Biology. (Vol) 4. New York, McGraw Hill Higher Education.<br />
Cloern J. 2001. Our evolving conceptual model of the coastal eutrophication problem Marine Ecology Progress Series (210): 223-253.<br />
Cornelisen, C., Gillespie, P., Kirs, M., Young, R., Forrest, R., Barter, P., Knight, B., Harwood, V., 2011. Motueka River plume facilitates<br />
transport of ruminant faecal contaminants into shellfish growing waters, Tasman Bay, New Zeal<strong>and</strong>. New Zeal<strong>and</strong> Journal of<br />
Marine <strong>and</strong> Freshwater Research 45, 477-495.<br />
Cummings V., Hewitt J., Halliday J., Mackay G. 2007. Optimizing the success of Austrovenus stutchburyi restoration: preliminary<br />
investigations in a new zeal<strong>and</strong> estuary. Journal of Shellfish Research (26): 89-100.<br />
Davies-Colley R.J., Meleason M.A., Hall G.M.J., Rutherford J.C. 2009. Modelling the time course of shade, temperature, <strong>and</strong> wood<br />
recovery in streams with riparian forest restoration. New Zeal<strong>and</strong> Journal of Marine <strong>and</strong> Freshwater Research (43): 673-688.<br />
Diaz R.J., Rosenberg R. 2008. Spreading dead zones <strong>and</strong> consequences for marine ecosystems. Science (321): 926-929.<br />
Elliot A., Alex<strong>and</strong>er R., Schwarz G., Shankar U., Sukias J., McBride G. 2005. Estimation of nutrient sources <strong>and</strong> transport for New Zeal<strong>and</strong><br />
using the hybrid mechanistic-statistical model SPARROW. Journal of Hydrology: New Zeal<strong>and</strong> (44): 1-27.<br />
Elliott M., Burdon D., Hemingway K.L., Apitz S.E. 2007. Estuarine, coastal <strong>and</strong> marine ecosystem restoration: Confusing management <strong>and</strong><br />
science - A revision of concepts. Estuarine Coastal <strong>and</strong> Shelf Science (74): 349-366.<br />
<strong>Environment</strong>al Communications Limited 2010. Integrated cathement management - a review of literature <strong>and</strong> practice. A report for the<br />
Ministry for the <strong>Environment</strong>. . 158p.<br />
Forrest B., Gillespie P., Cornelisen C., Rogers K. 2007. Multiple indicators reveal river plume influence on sediments <strong>and</strong> benthos in a New<br />
Zeal<strong>and</strong> coastal embayment. New Zeal<strong>and</strong> Journal of Marine <strong>and</strong> Freshwater Research (41): 13-24.<br />
Frew R., Hunter K., Beyer R. 1996. Cadmium in Oysters <strong>and</strong> Sediments From Foveaux Strait, New Zeal<strong>and</strong>. Proceedings of the Trace<br />
Element Group of New Zeal<strong>and</strong>, 1996 Waikato University.,<br />
Fukunaga A., Anderson M.J., Webster-Brown J.G., Ford R.B. 2010. Individual <strong>and</strong> combined effects of heavy metals on estuarine infaunal<br />
communities. Marine Ecology-Progress Series (402): 123-136.<br />
GESAMP 2001. Protecting the oceans from l<strong>and</strong>-based activities. L<strong>and</strong>-based sources <strong>and</strong> activities affecting the quality <strong>and</strong> uses of the<br />
marine, coastal <strong>and</strong> associated freshwater environment. Nairobi, United Nations <strong>Environment</strong> Program. 168.<br />
Glade T. 2003. L<strong>and</strong>slide occurrence as a response to l<strong>and</strong> use change: A review of evidence from New Zeal<strong>and</strong>. Catena (51): 297-314.<br />
Goff J.R. 1997. A chronology of natural <strong>and</strong> anthropogenic influences on coastal sedimentation, New Zeal<strong>and</strong>. Marine Geology (138): 105-<br />
117.<br />
Grange K., Tovey A., Hill A.F. 2003. The spatial extent <strong>and</strong> nature of the bryozoan communities at Separation Point, Tasman Bay. 22 p.<br />
Griffiths G., Glasby G. 1985. Input of River-derived sediments to the New Zeal<strong>and</strong> Continental Shelf: I. Mass. Estuarine, Coastal <strong>and</strong> Shelf<br />
Science (21): 773-784.<br />
Halpern B., Selkoe K., Micheli F., Kappel C. 2007. Evaluating <strong>and</strong> ranking the vulnerability of global marine ecosystems to anthropogenic<br />
threats. Conservation Biology (21): 1301-1315.<br />
Haro A., Richkus W., Whalen K., Hoar A., Busch W.D., Lary S., Brush T., Dixon D. 2000. Population decline of the American eel:<br />
Implications for research <strong>and</strong> management. Fisheries (25): 7-16.<br />
Hayward B.W., Grenfell H.R., Sabaa A.T., Morley M.S., Horrocks M. 2006. Effect <strong>and</strong> timing of increased freshwater runoff into sheltered<br />
harbor environments around Auckl<strong>and</strong> City, New Zeal<strong>and</strong>. Estuaries <strong>and</strong> Coasts (29): 165-182.<br />
Hewawasam T., von Blanckenburg F., Schaller M., Kubik P. 2003. Increase of human over natural erosion rates in tropical highl<strong>and</strong>s<br />
constrained by cosmogenic nuclides. Geology (31): 597-600.<br />
Hicks, D., Shankar, U., McKerchar, A.I., Basher, L., Jessen, Lynn, I., Page, M., 2011. Suspended sediment yields from New Zeal<strong>and</strong> rivers.<br />
Journal of Hydrology (NZ) 50, 81-142.<br />
Hicks, D., Shankar, U., 2003. Sediment from New Zeal<strong>and</strong> rivers, NIWA Chart, Miscellaneous Series No.79.<br />
Hill, D.; Dubey, J.P. 2002: Toxoplasma gondii: transmission, diagnosis <strong>and</strong> prevention. Clinical Microbiology <strong>and</strong> Infection 8(10): 634–<br />
640.<br />
Hooker S., Redfearn P. 1998. Preliminary survey of toheroa (Paphies ventricosa) populations on Ninety Mile Beach <strong>and</strong> possible impacts of<br />
vehicle traffic. NIWA Client Report: AK98042. 34p.<br />
IPCC 2007. Contribution of Working Groups I, II <strong>and</strong> III to the Fourth Assessment Report of the Intergovernmental Panel on Climate<br />
Change. Pachauri R.<strong>and</strong>Reisinger A.E., eds. Geneva, Switzerl<strong>and</strong>., pp 104.<br />
Kennish M.J. 2002. <strong>Environment</strong>al threats <strong>and</strong> environmental future of estuaries. <strong>Environment</strong>al Conservation (29): 78-107.<br />
Kneitel J.M., Perrault D. 2006. Disturbance-induced changes in community composition increase species invasion success. Community<br />
Ecology (7): 245-252.<br />
Lipcius R.N., Eggleston D.B., Schreiber S.J., Seitz R.D., Shen J., Sisson M., Stockhausen W.T., Wang H.V. 2008. Importance of<br />
metapopulation connectivity to restocking <strong>and</strong> restoration of marine species. <strong>Review</strong>s in Fisheries Science (16): 101-110.<br />
Lundquist C.J., Oldman J.W., Lewis M.J. 2009. Predicting suitability of cockle Austrovenus stutchburyi restoration sites using<br />
hydrodynamic models of larval dispersal. New Zeal<strong>and</strong> Journal of Marine <strong>and</strong> Freshwater Research (43): 735-748.<br />
Marsden I., Adkins S. 2009. Current status of cockle bed restoration in New Zeal<strong>and</strong> Aquaculture international ISSN: 0967-6120 (Print)<br />
1573-0143X (Online).<br />
Milliman J., Syvitski J. 1992. Geomorphic/Tectonic Control of Sediment Discharge to the Ocean: The Importance of Small Mountainous<br />
Rivers. The Journal of Geology (100): 525-544.<br />
Moller J., Moller S., Futter J., Moller J., Harvey J., White H., Stirling F., Moller H. 2009. Potential impacts of vehicle traffic on recruitment<br />
of Toheroa (Paphies ventricosa) on Oreti Beach, Southl<strong>and</strong>, New Zeal<strong>and</strong>. Dunedin, University of Otago. 61p.<br />
Morrisey D.J. 2000. Predicting impacts <strong>and</strong> recovery of marine farm sites in Stewart Isl<strong>and</strong> New Zeal<strong>and</strong>, from the Findlay-Watling model.<br />
Aquaculture (185): 257-271.<br />
Morrison M., Lowe M., Parsons D., Usmar N., McLeod I. 2009. A review of l<strong>and</strong>-based effects on coastal fisheries <strong>and</strong> supporting<br />
biodiversity in New Zeal<strong>and</strong>. 100p.<br />
Morrison M., Parkinson D. 2008. Distribution <strong>and</strong> abundance of toheroa (Paphies ventricosa) on Ninety Mile Beach, March 2006. New<br />
Zeal<strong>and</strong> Fisheries Assessment Report 2008/26, ed. 27p.<br />
226
AEBAR <strong>2012</strong>: Ecosystem effects: L<strong>and</strong>-based effects<br />
Nellemann C., Hain S., Alder J.E. 2008. In Dead Water - Merging of climate change with pollution, over-harvest, <strong>and</strong> infestations in the<br />
world’s fishing grounds. United Nations <strong>Environment</strong> Programme, GRID-Arendal,. 64p.<br />
Parkyn S., Davies-Colley R., Halliday N., KJ C., GF C. 2003. Planted Riparian Buffer Zones in New Zeal<strong>and</strong>: Do They Live Up to<br />
Expectations? Restoration Ecology (11): 436-447.<br />
Piola R.F., Johnston E.L. 2008. Pollution reduces native diversity <strong>and</strong> increases invader dominance in marine hard-substrate communities.<br />
Diversity <strong>and</strong> Distributions (14): 329-342.<br />
Roni P., Hanson K., Beechie T. 2008. Global review of the physical <strong>and</strong> biological effectiveness of stream habitat rehabilitation techniques.<br />
North American Journal of Fisheries Management (28): 856-890.<br />
Seaman W. 2007. Artificial habitats <strong>and</strong> the restoration of degraded marine ecosystems <strong>and</strong> fisheries. Hydrobiologia (580): 143-155.<br />
SPREP 2010. South Pacific Regional <strong>Environment</strong> Programm, Strategic Plan 2011-2015: Draft for comment. available at www.sprep.org,<br />
ed. 29p.<br />
Stephenson G. 1999. Vehicle impacts on the biota of s<strong>and</strong>y beaches <strong>and</strong> coastal dunes: A review from a New Zeal<strong>and</strong> perspective. Science<br />
for Conservation (121): 48p.<br />
Stewart M.J., Creese R.G. 1998. Restoration of the New Zeal<strong>and</strong> little necked clam, Austrovenus stutchburyi. Journal of Shellfish Research<br />
(17): [np].<br />
Taylor F.J., Taylor N.J., Walsby J.R. 1985. A bloom of planktonic diatom Ceratulina pelagica off the coastal northeastern New Zeal<strong>and</strong> in<br />
1983, <strong>and</strong> its contribution to an associated mortality of fish <strong>and</strong> benthic fauna. Internationale Revue der gesamten Hydrobiologie<br />
und Hydrographie. 70: 773-795.<br />
Thrush S., Hewitt J., Cummings V., Ellis J., Hatton C., Lohrer A., Norkko A. 2004. Muddy waters: elevating sediment input to coastal <strong>and</strong><br />
estuarine habitats. Frontiers in ecology <strong>and</strong> the environment (2): 299-306.<br />
Thrush S.F., Hewitt J.E., Hickey C.W., Kelly S. 2008. Multiple stressor effects identified from species abundance distributions: Interactions<br />
between urban contaminants <strong>and</strong> species habitat relationships. Journal of Experimental Marine Biology <strong>and</strong> Ecology (366): 160-<br />
168.<br />
Whetton P., Mullan A.B., Pittock A. 1996. Climate change scenarios for Australia <strong>and</strong> New Zeal<strong>and</strong>. In: Bouma W., Pearman<br />
G.<strong>and</strong>Manning M. (Eds.) Greenhouse: coping with climate change. CSIRO Publishing, Collingwood, Australia. 145-168.<br />
Wilkinson, R., McKergow, L., Davies-Colley, R., Ballantine, D., Young, R., 2011. Modelling storm-event E. coli pulses from the Motueka<br />
<strong>and</strong> Sherry Rivers in the South Isl<strong>and</strong>, New Zeal<strong>and</strong>. New Zeal<strong>and</strong> Journal ofMarine <strong>and</strong> Freshwater Research 45, 369-393.<br />
227
AEBAR <strong>2012</strong>: Marine <strong>Biodiversity</strong><br />
THEME 5: MARINE BIODIVERSITY<br />
228
11. <strong>Biodiversity</strong><br />
AEBAR <strong>2012</strong>: Marine biodiversity<br />
Scope of chapter Provide an overview of the MPI <strong>Biodiversity</strong> Programme <strong>and</strong> address:<br />
National <strong>and</strong> global context of NZ marine biodiversity research; Research<br />
findings <strong>and</strong> progress of the MPI <strong>Biodiversity</strong> Research Programme from<br />
2000–<strong>2012</strong>; including one-off whole-of-government research initiatives<br />
administered under this programme (e.g. Ocean Survey 20/20 <strong>Biodiversity</strong><br />
<strong>and</strong> Fisheries projects; International Polar Year Census of Antarctic Marine<br />
life project 2007)<br />
Geographic area New Zeal<strong>and</strong> Territorial Seas, EEZ <strong>and</strong> Continental shelf extension<br />
(BioInfo); South-west Pacific Region associated with South Pacific Regional<br />
Fisheries Management Organisation (SPRFMO);Antarctic Ross Sea region<br />
(BioRoss)<br />
Focal issues New Zeal<strong>and</strong> waters have globally significant levels of marine biodiversity,<br />
<strong>and</strong> productivity particularly coastal habitats, offshore isl<strong>and</strong> habitats <strong>and</strong><br />
underwater topographical features such as seamounts, <strong>and</strong> canyons. With the<br />
exception of shallow sea ice impacted coastal habitats, these features apply<br />
also to the Ross Sea region. Adjacent international waters in the SPRFMO<br />
area contain areas likely to constitute Vulnerable Marine Ecosystems<br />
Key progress<br />
2011-12<br />
(VMEs),<br />
• Predictive habitat modelling has identified potential areas of VMEs in<br />
SPRFMO areas<br />
• Significant progress has been made on mapping deepsea fisheries<br />
habitat at risk from ocean acidification; research on shellfish has<br />
identified thermal stress <strong>and</strong> ocean acidification as two areas of concern<br />
for New Zeal<strong>and</strong> in an increasing CO2 world.<br />
• Progress has been made towards developing a national Marine<br />
<strong>Environment</strong>al Monitoring Programme<br />
• A major project on changes in marine shelf systems over the past 1000<br />
years has almost reached completion.<br />
• IPY <strong>and</strong> Chatham Challenger completed with many outputs <strong>and</strong><br />
leveraging opportunities<br />
Emerging issues • The combined effects of multiple stressors arising from climate change<br />
<strong>and</strong> a range of otheranthropogenic activities on biodiversity <strong>and</strong> marine<br />
ecosystems (structure <strong>and</strong> function) are likely to be large <strong>and</strong> complex.<br />
• Keen interest in the development of ecosystem approaches to marine<br />
resource management is developing.<br />
• The nature <strong>and</strong> functional role of marine microbial biodiversity in large<br />
scale biogeochemical <strong>and</strong> ecosystem processes are important but not<br />
well understood.<br />
• Genetic <strong>and</strong> life-history stage connectivity between <strong>and</strong> within large<br />
scale habitats may be important to the size <strong>and</strong> placement of protection<br />
zones.<br />
• Apart from fisheries data, long-term (eg decadal to millenia)<br />
observations of variability <strong>and</strong> change in the marine environment<br />
(including biodiversity) are not yet generally available at geographic<br />
scales appropriate for national reporting .<br />
• Metrics for assessing the effectiveness of current protection measures in<br />
safeguarding marine biodiversity <strong>and</strong> aquatic ecosystem health in NZ<br />
<strong>and</strong> Ross Sea region are inadequate.<br />
• Economic value of ecosystem goods <strong>and</strong> services provided by marine<br />
biodiversity to current <strong>and</strong> future generations are not addressed in<br />
extractive business models.<br />
• Marine biodiversity <strong>and</strong> its monitoring, loss reduction <strong>and</strong> enhancement<br />
229
MPI Research<br />
(current)<br />
NZ Research <strong>and</strong><br />
associated<br />
initiatives (current)<br />
Links to Fisheries<br />
2030 <strong>and</strong> MPI’s<br />
Our Strategy 2030<br />
Related<br />
chapters/issues<br />
AEBAR <strong>2012</strong>: Marine <strong>Biodiversity</strong><br />
are emerging requirements for signatories (including New Zeal<strong>and</strong>) to<br />
the CBD Aichi-Nagoya Agreement 2010<br />
• Geo-engineering methods including ocean fertilisation continues to be<br />
advocated in some areas of international climate change mitigation<br />
• Meeting New Zeal<strong>and</strong> responsibilities participate in international data<br />
collection programmes, e.g., IMOS, SOCPR ARGO, BIO-ARGO,<br />
55 biodiversity projects commissioned over the period 2000-12; Currently in<br />
4th year of a 5 year programme to address seven science objectives in the<br />
<strong>Biodiversity</strong> Programme: 1 characterisation <strong>and</strong> description; 2 ecosystem<br />
scale biodiversity; 3 functional role of biodiversity; 4 genetics; 5 ocean<br />
climate effects; 6 indicators; 7 threats to biodiversity. MPI biodiversity<br />
research has strong synergies with marine research funded by MPI <strong>Aquatic</strong><br />
<strong>and</strong> <strong>Environment</strong> Working Group (AEWG), Ministry of Business Innovation<br />
<strong>and</strong> Employment (MBIE), Department of Conservation (DOC), L<strong>and</strong><br />
Information New Zeal<strong>and</strong> (LINZ), other sections within the Ministry for<br />
Primary Industries (MPI), Ministry for the <strong>Environment</strong> (MfE),Statistics New<br />
Zeal<strong>and</strong> (Stats NZ), Te Papa <strong>and</strong> Crown Research Institutes<br />
Research programmes <strong>and</strong> database initiatives on Marine <strong>Biodiversity</strong> are run<br />
at University of Auckl<strong>and</strong> (World Register of Marine Species (WoRMS),<br />
marine reserves, rocky reef ecology, Ross Sea meroplankton, genetics);<br />
Auckl<strong>and</strong> University of Technology, University of Waikato (soft sediment<br />
functional ecology <strong>and</strong> biodiversity), Victoria University of Wellington<br />
(monitoring marine reserves, population genetics), University of Canterbury<br />
(intertidal <strong>and</strong> subtidal ecology, kelp forests <strong>and</strong> biodiversity), University of<br />
Otago (l<strong>and</strong>-use effects, bryozoans, inshore ecology, ocean acidification),<br />
National Institute of water <strong>and</strong> Atmospheric Research (NIWA) <strong>and</strong> Cawthron<br />
Institute. Former MBIE programmes i.e., Coasts & Oceans OBI C01X0501,<br />
Marine <strong>Biodiversity</strong> & Biosecurity OBI C01X0502, are now part of Core<br />
Funding managed by NIWA through the Coast <strong>and</strong> Oceans Centre; Protecting<br />
Ross Sea Ecosystems C01X1001, Climate Change Effects in the Ross Sea<br />
C01X1226, Coastal Conservation Management C01X0907, Impacts of<br />
resource use on vulnerable deep-sea communities C01X0906; DOC, MPI,<br />
NIWA <strong>and</strong> L<strong>and</strong>care Research - NZ Organisms Register.<br />
Fisheries 2030 <strong>Environment</strong>al Outcome Objective 1; environmental<br />
principles of Fisheries 2030 include: Ecosystem-based approach, Conserve<br />
biodiversity: <strong>Environment</strong>al bottom lines, Precautionary approach,<br />
Responsible international citizen, Inter-generational equity, Best available<br />
information, Respect rights <strong>and</strong> interests (MPI 2009). MPI’s Strategy “Our<br />
Strategy 2030”: two key stated focuses are to maximise export opportunities<br />
<strong>and</strong> improve sector productivity; increase sustainable resource use, <strong>and</strong><br />
protect from biological risk<br />
Multiple use, l<strong>and</strong>-based effects, variability <strong>and</strong> change, marine monitoring,<br />
cumulative effects of use <strong>and</strong> extraction in the marine environment, protected<br />
areas; benthic impacts, ecosystem approaches to fisheries <strong>and</strong> marine<br />
resource management.<br />
230
11.1. Introduction<br />
AEBAR <strong>2012</strong>: Marine <strong>Biodiversity</strong><br />
This chapter summarises the development <strong>and</strong> progress of the MPI Marine <strong>Biodiversity</strong> Research<br />
Programme 2000-<strong>2012</strong> <strong>and</strong> reviews the work commissioned in the context of national <strong>and</strong> global<br />
concerns about biodiversity <strong>and</strong> the maintenance of the marine ecosystem in a healthy functioning<br />
state, as identified by the New Zeal<strong>and</strong> <strong>Biodiversity</strong> Strategy (NZBS, Anon 2000).<br />
11.1.1. Halting the decline in biodiversity<br />
In June 2000, the ‘New Zeal<strong>and</strong> <strong>Biodiversity</strong> Strategy– Our Chance to Turn the Tide’ (NZBS) with the<br />
over-arching objectives “to halt the decline of biodiversity in New Zeal<strong>and</strong> <strong>and</strong> protect <strong>and</strong> enhance<br />
the environment” was launched as part of New Zeal<strong>and</strong>’s commitment to the international Convention<br />
on Biological Diversity 1993 (Anon 2000). To meet long-term goals of the NZBS, a comprehensive<br />
plan, with stated objectives <strong>and</strong> actions<br />
1 , was developed to address biodiversity issues in terrestrial, freshwater <strong>and</strong> marine systems. The<br />
Desired Outcomes by 2020 for the marine environment (Coasts <strong>and</strong> Oceans, Theme 3) in the NZBS<br />
were stated as:<br />
• “New Zeal<strong>and</strong>'s natural marine habitats <strong>and</strong> ecosystems are maintained in a healthy<br />
functioning state <strong>and</strong> degraded marine habitats are recovering.<br />
• A full range of marine habitats <strong>and</strong> ecosystems representative of New Zeal<strong>and</strong>'s indigenous<br />
marine biodiversity is protected.<br />
• No human-induced extinctions of marine species within New Zeal<strong>and</strong>'s marine environment<br />
have occurred.<br />
• Rare or threatened marine species are adequately protected from harvesting <strong>and</strong> other human<br />
threats, enabling them to recover.<br />
• Marine biodiversity is appreciated, <strong>and</strong> any harvesting or marine development is done in an<br />
informed, controlled <strong>and</strong> ecologically sustainable manner.”<br />
In the marine environment, biodiversity decline is characterised not only by extinctions or reduction<br />
in species richness <strong>and</strong> abundance, but also by environmental degradation such as species invasion<br />
<strong>and</strong> hybridisations, habitats that have been diminished or removed, <strong>and</strong> the disruption of ecosystem<br />
structure <strong>and</strong> function, as well as ecological processes (e.g. biological cycling of water, nutrients <strong>and</strong><br />
energy). Measuring the decline of marine biodiversity is complicated by the ‘shifting baseline<br />
syndrome’, a common obstacle to useful biodiversity assessment <strong>and</strong> monitoring 2 . Furthermore the<br />
size range of organisms sampled is often limited to macroscopic. Changes (declines) in biodiversity<br />
metrics at a macroscopic level may not detect potentially large changes in biodiversity in smaller<br />
sized organisms below our sampling threshold that may also be critical to marine ecosystem health<br />
<strong>and</strong> well-being.<br />
Responsibility for addressing Theme 3 of the <strong>Biodiversity</strong> Strategy was allocated across government<br />
departments with active roles in the management of the marine environment, including the<br />
Department of Conservation (DOC), the Ministry for <strong>Environment</strong> (MfE), <strong>and</strong> the Ministry of<br />
Fisheries (now MPI) 3 .<br />
1<br />
The New Zeal<strong>and</strong> <strong>Biodiversity</strong> Strategy with its stated goals, objectives <strong>and</strong> actions can be viewed at<br />
http://www.biodiversity.govt.nz<br />
2<br />
A National Approach to Addressing Marine <strong>Biodiversity</strong> Decline (Australian Government-available on line at<br />
www.environment.gov.au/coasts/publications/marine-diversity-decline/index.html<br />
3<br />
https://www.biodiversity.govt.nz/picture/doing/programmes/index.html<br />
231
11.1.2. Defining biodiversity<br />
AEBAR <strong>2012</strong>: Marine <strong>Biodiversity</strong><br />
New Zeal<strong>and</strong>’s <strong>Biodiversity</strong> Strategy defines biodiversity as:<br />
“The variability among living organisms from all sources including inter alia, terrestrial, marine <strong>and</strong><br />
other aquatic ecosystems <strong>and</strong> the ecological complexes of which they are a part [as defined by the<br />
CBD]; this includes diversity within species, between species <strong>and</strong> of ecosystems [as further<br />
disaggregated for New Zeal<strong>and</strong> purposes]. Components include:<br />
• Genetic diversity: the variability in the genetic make-up among individuals within a<br />
single species. In more technical terms, it is the genetic differences among populations of<br />
a single species <strong>and</strong> those among individuals within a population.<br />
• Species diversity – the variety of species—whether wild or domesticated— within a<br />
particular geographic area.<br />
• Ecological diversity – the variety of ecosystem types (such as forests, deserts, grassl<strong>and</strong>s,<br />
streams, lakes wetl<strong>and</strong>s <strong>and</strong> oceans) <strong>and</strong> their biological communities that interact with<br />
one another <strong>and</strong> their non-living environments.”<br />
MPI’s <strong>Biodiversity</strong> programme is concerned primarily with research to underpin NZBS Theme 3:<br />
<strong>Biodiversity</strong> in Coastal <strong>and</strong> Marine Ecosystems:<br />
“Coastal <strong>and</strong> marine ecosystems include estuaries, inshore coastal areas <strong>and</strong> offshore areas, <strong>and</strong><br />
all the resident <strong>and</strong> migratory marine species that live in them.<br />
New Zeal<strong>and</strong>’s ocean territory (including territorial sea <strong>and</strong> the recent continental shelf extension 4 ) is<br />
very large relative to the area of l<strong>and</strong> 5 <strong>and</strong> includes some 15-18,000 kilometres of coastline extending<br />
from the sub-tropical north to the cool Subantarctic waters to the south. New Zeal<strong>and</strong> also has a rich<br />
marine biodiversity that has been recognised as being globally significant with up to 44% estimated as<br />
endemic <strong>and</strong> comprising up to 10% of global marine biodiversity Gordon et al. 2010.<br />
An estimated 34,400 marine species <strong>and</strong> associated ecosystems around New Zeal<strong>and</strong> deliver a wide<br />
range of environmental goods <strong>and</strong> services that sustain considerable fishing, aquaculture <strong>and</strong> tourism<br />
industries as well as drive major biogeochemical <strong>and</strong> ecological processes. Several factors would<br />
suggest that this estimate of marine species number is conservative. Such factors include the region’s<br />
size, the depth range, geomorphological <strong>and</strong> hydrological complexity as well as limited water column<br />
sampling <strong>and</strong> limited benthic sampling, especially below 1500 metres. If recent indications of massive<br />
oceanic microbial diversity are taken into account (e.g. Sogin et al. 2006) then the number above is<br />
certainly conservative.<br />
New Zeal<strong>and</strong>’s marine biodiversity is affected by many uses of the marine environment, particularly<br />
fishing, aquaculture, shipping, petroleum <strong>and</strong> mineral extraction, renewable energy, tourism <strong>and</strong><br />
recreation 6 . Impacts from changing l<strong>and</strong> use, including agricultural, urban run-off <strong>and</strong> coastal<br />
development can also affect marine biodiversity (Morrison et al. 2009). The potential loss of marine<br />
biodiversity <strong>and</strong> possible functionality caused by climate change <strong>and</strong> ocean acidification are of<br />
increasing concern worldwide (e.g., Guinotte et al., 2006; Ramirez-Llodra et al. 2011; as well as in<br />
New Zeal<strong>and</strong>–see NZ Royal Society Workshop papers 7 ). The growing arrival of non-indigenous<br />
4 http://www.mfat.govt.nz/Treaties-<strong>and</strong>-International-Law/04-Law-of-the-Sea-<strong>and</strong>-Fisheries/NZ-Continental-<br />
Shelf-<strong>and</strong>-Maritime-Boundaries.php<br />
5 2 th<br />
NZ sea area is ~5.8 million km including TS, EEZ <strong>and</strong> continental shelf extension; 4 largest in the world;<br />
www.linz.govt.nz<br />
6<br />
http://www.royalsociety.org.nz/media/Future-Marine-Resource-Use-web.pdf<br />
http://www.stats.govt.nz/browse_for_stats/environment/natural_resources/fish.aspx<br />
7<br />
: http://www.royalsociety.org.nz/publications/policy/yr2009/ocean-acidification-workshop/<br />
232
AEBAR <strong>2012</strong>: Marine <strong>Biodiversity</strong><br />
(sometimes invasive) marine species is also a threat to local biodiversity (e.g., Coutts <strong>and</strong> Dodgshun<br />
2003, Cranfield et al. 2003, Gould et al. 2008 Russel et al. 2008, Williams et al. 2008).<br />
Underst<strong>and</strong>ing about New Zeal<strong>and</strong>’s coastal marine environment <strong>and</strong> its l<strong>and</strong>-sea interactions has<br />
progressed although knowledge about the state of the marine environment <strong>and</strong> marine biodiversity on<br />
a national scale remains limited. Current knowledge about New Zeal<strong>and</strong>’s <strong>and</strong> the Ross Sea’s marine<br />
biodiversity suggests that it may generally be in better shape than that of many other countries<br />
(Costello et al. 2010, Gordon et al. 2010). However, New Zeal<strong>and</strong> is less well placed when it comes<br />
to underst<strong>and</strong>ing the threats to marine biodiversity (Costello et al. 2010, MacDiarmid et al. <strong>2012</strong>) <strong>and</strong><br />
the nature of their impacts. There are significant concerns with the decline of some key species (MfE<br />
2007), localised impacts on habitats <strong>and</strong> conditions (Thrush <strong>and</strong> Dayton 2002, Cryer et al. 2002, Clark<br />
et al. 2010a., Gordon et al. 2010, Clark & Dunn <strong>2012</strong>) <strong>and</strong> emerging threats to the marine<br />
environment (MacDiarmid et al. <strong>2012</strong>) despite the combined efforts of New Zeal<strong>and</strong>’s government<br />
<strong>and</strong> stakeholders. Global scale threats associated with the potential effects of ocean acidification on<br />
microbial diversity <strong>and</strong> their roles in biogeochemical processes have yet to be quantified but could<br />
have EEZ wide implications (Bostock et al. <strong>2012</strong>).<br />
New Zeal<strong>and</strong>ers increasingly value environmental, economic <strong>and</strong> social aspects of marine<br />
biodiversity <strong>and</strong> the ecosystem services that a healthy marine environment provides. They also value<br />
the need to sustainably manage the use of coastal <strong>and</strong> marine environments <strong>and</strong> maintain biological<br />
diversity as reflected by recent policy statements by the New Zeal<strong>and</strong> Government. 8 9 A broad range<br />
of legislation, regulations <strong>and</strong> policies are in place to manage <strong>and</strong> regulate uses of the marine<br />
environment, to protect marine biodiversity, to improve management of the coastal <strong>and</strong> marine<br />
environment <strong>and</strong> to meet world-wide consumer dem<strong>and</strong>s for improved sustainability. The most recent<br />
introduction is the Exclusive Economic Zone <strong>and</strong> Continental Shelf (<strong>Environment</strong>al Effects) Act <strong>2012</strong><br />
which will come into effect once the first set of regulations is promulgated. However, progress on an<br />
integrated oceans policy <strong>and</strong> strategic direction for implementation of New Zeal<strong>and</strong>’s <strong>Biodiversity</strong><br />
Strategy has been slow compared with other countries such as Canada, the UK, the USA <strong>and</strong><br />
Australia (Peart et al. 2011).<br />
11.1.3. Implementation of New Zeal<strong>and</strong>’s <strong>Biodiversity</strong> Strategy<br />
A number of initiatives have been supported by MPI to meet the goals of the NZBS. Commitments<br />
include the creation of NABIS (the National <strong>Aquatic</strong> <strong>Biodiversity</strong> Information System) 10 , the<br />
administration of the MPI <strong>Biodiversity</strong> Research Programme, convening <strong>and</strong> chairing the <strong>Biodiversity</strong><br />
Research Advisory Group 11 , <strong>and</strong> developing a Marine Protected Area policy with DOC. DOC also<br />
surveys <strong>and</strong> monitors aspects of marine biodiversity, particularly in marine reserves 12 . MfE has<br />
encouraged Regional Councils to develop coastal monitoring programmes <strong>and</strong> with MPI <strong>and</strong> DOC,<br />
initiated an approach to Marine <strong>Environment</strong>al Classification 13 . <strong>Biodiversity</strong> related research has also<br />
been carried out through MPI’s Biosecurity Science Strategy. One result includes mapping <strong>and</strong><br />
valuation of marine biodiversity around New Zeal<strong>and</strong>’s coastline 14 .<br />
8<br />
MfE Proposed National Policy Statement on Indigenous Biological Diversity (biodiversity) under the<br />
Resource Management Act 1991 www.mfe.govt.nz/publications/biodiversity/indigenous-biodiversity/proposednational-policy-statement/statement.pdf<br />
9<br />
New Zeal<strong>and</strong> Coastal Policy Statement 2010 www.doc.govt.nz/conservation/marine-<strong>and</strong>-coastal/coastalmanagement/nz-coastal-policy-statement/<br />
10<br />
NABIS is an interactive database accessible at www.nabis.govt.nz<br />
11<br />
www.fish.govt.nz/en-nz/Research+Services/Background+Information/<strong>Biodiversity</strong>+background.htm<br />
12<br />
www.doc.govt.nz<br />
13<br />
www.mfe.govt.nz/issues/biodiversity/initiatives/marine.html#regional<br />
14<br />
www.biosecurity.govt.nz/biosec/research<br />
233
AEBAR <strong>2012</strong>: Marine <strong>Biodiversity</strong><br />
Marine biodiversity research is also supported through public good funding <strong>and</strong> is conducted mainly<br />
by Universities <strong>and</strong> CRIs. Both have contributed to New Zeal<strong>and</strong>’s high profile on the international<br />
scientific network for marine biodiversity through participation in global initiatives such as the<br />
Census of Marine Life as well as to local programmes that have improved underst<strong>and</strong>ing of the role of<br />
biodiversity in the marine ecosystem. The Museums of Auckl<strong>and</strong>, Canterbury, Otago <strong>and</strong> Wellington<br />
(Te Papa) also conduct biodiversity sampling expeditions <strong>and</strong> national collections of specimens have<br />
been set up within Museums <strong>and</strong> also at NIWA. Regional Councils give effect to NZBS; Coastal<br />
<strong>Biodiversity</strong> Policy Statement 2011, protected areas <strong>and</strong> spatial planning.<br />
11.1.4. New challenges <strong>and</strong> agendas<br />
Since the launch of the <strong>Biodiversity</strong> Stratey, there have been substantial changes in Government goals<br />
for New Zeal<strong>and</strong>. In July 2009, the Minister of Science set an overarching goal for research science<br />
<strong>and</strong> technology 15 :<br />
“to improve New Zeal<strong>and</strong>’s economic performance while continuing to strengthen our society<br />
<strong>and</strong> protect our environment”.<br />
This goal is reflected in first progress report on “Building Natural Resources” as part of the Business<br />
Growth Agenda 16 released December <strong>2012</strong>. The Business Growth Agenda sets an ambitious goal of<br />
increasing the ratio of exports to GDP to 40% by 2025. Meeting the target will require the value of<br />
our exports to double in real terms by 2025. The report states that one of the goals is to “Make the<br />
most of the considerable opportunities for New Zeal<strong>and</strong> to gain much greater value from its extensive<br />
marine <strong>and</strong> aquaculture resources”.<br />
The biological economy of the sea (currently largely fisheries <strong>and</strong> aquaculture, oil <strong>and</strong> gas, minerals)<br />
is a significant part of the overall economy <strong>and</strong> may have potential for growth (e.g. unlocking the<br />
potential of the fisheries sector–Fisheries 2030 (MPI 2009 17 ). It is essential that the aquatic<br />
environment <strong>and</strong> biodiversity on which industry depends are not adversely affected by these or other<br />
impacting activities.<br />
Bodies such as the Marine Stewardship Council (MSC 18 ) require fisheries to satisfy stringent<br />
environmental requirements to achieve certification. Many fisheries management systems throughout<br />
the globe have begun to develop policies that are ecosystem based. Implementation has met with<br />
varied success, <strong>and</strong> measurement of success is a challenge.<br />
The large scale threats to the marine environment posed by increasing global impacts of<br />
anthropogenic stressors such as climate change <strong>and</strong> ocean acidification, increasing exploitation of<br />
resources (living or non-living) <strong>and</strong> the cumulative effect of multiple uses of the marine environment<br />
(e.g., renewable energy, commercial fisheries, recreational fisheries, aquaculture, hydrocarbon <strong>and</strong><br />
mineral extraction) remain.<br />
Scientific research has provided information about the predicted distribution <strong>and</strong> abundance of marine<br />
biodiversity in some areas of New Zeal<strong>and</strong>’s coasts <strong>and</strong> oceans, but progress on validation in areas<br />
that remain unsampled has been slow. The structure <strong>and</strong> function of biodiversity of macrofauna within<br />
some New Zeal<strong>and</strong> <strong>and</strong> Ross Sea marine ecosystems is well understood <strong>and</strong> available information has<br />
15<br />
MoRST feedback document on New Zeal<strong>and</strong>’s research science <strong>and</strong> technology:<br />
www.morst.govt.nz/Documents/publications/policy<br />
16<br />
https://www.mbie.govt.nz/what-we-do/business-growth-agenda/pdf-folder/BGA-Natural-Resources-report-<br />
December-<strong>2012</strong>.pdf<br />
17<br />
MFish (2009). Fisheries 2030 report. New Zeal<strong>and</strong>ers maximising benefits from the use of fisheries within<br />
environmental limits available from http://www.fish.govt.nz/en-nz/Fisheries+2030/default.htm<br />
18<br />
Marine Stewardship Council www.msc.org<br />
234
AEBAR <strong>2012</strong>: Marine <strong>Biodiversity</strong><br />
been used to assess the habitat types at greatest risk from disturbance, particularly fishing. However,<br />
the proportions of marine habitat types should be or can be protected to maintain a healthy aquatic<br />
environment is unknown.<br />
There is growing awareness of the likely importance of the huge diversity, biomass <strong>and</strong> species mix of<br />
micro-organisms, nano- <strong>and</strong> pico-plankton, <strong>and</strong> is a fast developing field of research. The rate of<br />
change <strong>and</strong> the resilience of biodiversity to the cumulative effect of multiple stressors across large<br />
spatial scales (e.g. ocean acidification, temperature increase <strong>and</strong> oxygen depletion), particularly as<br />
utilisation of marine resources increases, remain semi-quantified (Ramerez-Llodra et al. 2011).<br />
Underst<strong>and</strong>ing the dynamics of climate change <strong>and</strong> predicting the impacts on food webs <strong>and</strong> fisheries<br />
are only just being investigated (e.g., Fulton 2004, Brown et al. 2010, Garcia <strong>and</strong> Rosenberg 2010).<br />
11.2. Global underst<strong>and</strong>ing <strong>and</strong> developments<br />
In April 2002, the Parties to the Convention on Biological Diversity (CBD) committed to achieve by<br />
2010 a significant reduction of the current rate of biodiversity loss at the global, regional <strong>and</strong> national<br />
level as a contribution to poverty alleviation <strong>and</strong> to the benefit of all life on Earth. This target was<br />
subsequently endorsed by the World Summit on Sustainable Development <strong>and</strong> the United Nations<br />
General Assembly <strong>and</strong> was incorporated as a target under the Millennium Development Goals 19 .<br />
The third edition of the Global <strong>Biodiversity</strong> Outlook confirmed that the 2010 biodiversity target had<br />
not been met, <strong>and</strong> the CBD 2010 Strategic Plan notes that “actions [to achieve the 2010 target] have<br />
not been on a scale sufficient to address the pressures on biodiversity 20 . Moreover there has been<br />
insufficient integration of biodiversity issues into broader policies, strategies, programmes <strong>and</strong><br />
actions, <strong>and</strong> therefore the underlying drivers of biodiversity loss have not been significantly reduced”.<br />
The Strategic Plan includes a new series of targets for 2020 under the heading “Taking action now to<br />
decrease the direct pressures on biodiversity”. The Strategic Plan for 2011–2020 was updated,<br />
revised <strong>and</strong> adopted by over 200 countries, including New Zeal<strong>and</strong> 21 .<br />
The eleventh meeting of the Conference of the Parties to the Convention on Biological Diversity (held<br />
8-19 Oct <strong>2012</strong>) 22 generated some agreed outcomes of relevance for New Zeal<strong>and</strong>, in particular:<br />
• There was confirmation that the application of the scientific criteria for EBSAs <strong>and</strong> the<br />
selection of conservation <strong>and</strong> management measures is a matter for states <strong>and</strong> relevant intergovernmental<br />
bodies but that it is an open <strong>and</strong> evolving process that should continue to allow<br />
ongoing improvement <strong>and</strong> updating as new information comes to h<strong>and</strong><br />
• It was recognised that there was a need to promote additional research <strong>and</strong> monitoring in<br />
accordance with national <strong>and</strong> international laws, to improve the ecological or biological<br />
information in each region with a view to facilitating the further description of the areas<br />
described<br />
• There is a tentative schedule of further regional workshops to facilitate the description of<br />
areas meeting the criteria for EBSAs.<br />
19 UNEP's work to promote environmental sustainability, the object of Millenium Development Goal 7,<br />
underpins global efforts to achieve all of the Goals agreed by world leaders at the Millennium Summit<br />
http://www.unep.org/MDGs/<br />
20 www.cbd.int/2010-target<br />
21 draft updated <strong>and</strong> revised Strategic Plan for the Convention on Biological Diversity for the post-2010 period<br />
(UNEP/CBD/WG-RI/3/3) http://www.cbd.int/nagoya/outcomes/<br />
22 http://www.cbd.int/doc/?meeting=cop-11 UNEP/CBD/COP/11/23 Marine <strong>and</strong> Coastal <strong>Biodiversity</strong>:<br />
Revised Voluntary Guidelines for the Consideration of <strong>Biodiversity</strong> in <strong>Environment</strong>al Impact Assessments <strong>and</strong><br />
Strategic <strong>Environment</strong>al Assessments in Marine <strong>and</strong> Coastal Areas<br />
235
AEBAR <strong>2012</strong>: Marine <strong>Biodiversity</strong><br />
New Zeal<strong>and</strong> government agencies will need to consider how to update the NZBS to better align with<br />
the Aichi <strong>Biodiversity</strong> targets.<br />
11.2.1. The decade of biodiversity 2011-2020<br />
The United Nations General Assembly at its 65th session declared the period 2011-2020 to be “the<br />
United Nations Decade on <strong>Biodiversity</strong>, with a view to contributing to the implementation of the<br />
Strategic Plan for <strong>Biodiversity</strong> for the period 2011-2020” (Resolution 65/161). It will serve to support<br />
<strong>and</strong> promote implementation of the objectives of the Strategic Plan for <strong>Biodiversity</strong> <strong>and</strong> the Aichi-<br />
Nagoya <strong>Biodiversity</strong> Targets. The principal instruments for implementation are to be National<br />
<strong>Biodiversity</strong> Strategies <strong>and</strong> Action Plans or equivalent instruments (NBSAPs). CBD signatory nations<br />
are expected to revise their NBSAPs <strong>and</strong> to “ensure that this strategy is mainstreamed into the<br />
planning <strong>and</strong> activities of all those sectors whose activities can have an impact (positive <strong>and</strong> negative)<br />
on biodiversity” (http://www.cbd.int/nbsap/). Throughout the United Nations Decade on <strong>Biodiversity</strong>,<br />
governments are encouraged to develop, implement <strong>and</strong> communicate the results of progress on their<br />
NBSAPs as they implement the CBD Strategic Plan for <strong>Biodiversity</strong>.<br />
There are five strategic goals <strong>and</strong> 20 ambitious yet achievable targets. Collectively known as the<br />
Aichi Targets, they are part the Strategic Plan for <strong>Biodiversity</strong>. The five Strategic Goals are:<br />
• Goal A - Address the underlying causes of biodiversity loss by mainstreaming biodiversity<br />
(NBSAPs) across government <strong>and</strong> society<br />
• Goal B - Reduce the direct pressures on biodiversity <strong>and</strong> promote sustainable use<br />
• Goal C - Improve the status of biodiversity by safeguarding ecosystems, species <strong>and</strong> genetic<br />
diversity<br />
• Goal D - Enhance the benefits to all from biodiversity <strong>and</strong> ecosystem services<br />
• Goal E - Enhance implementation through participatory planning, knowledge management <strong>and</strong><br />
capacity building<br />
Targets 6-11 specifically refer to fisheries <strong>and</strong> marine ecosystems <strong>and</strong> are provided in Appendix 1 to<br />
this Chapter.<br />
The CBD also calls for renewed efforts specifically on coastal <strong>and</strong> marine biodiversity: “The road<br />
ahead for coastal areas lies in better <strong>and</strong> more effective implementation of integrated marine <strong>and</strong><br />
coastal area management in the context of the Convention’s ecosystem approach. This includes<br />
putting in place marine <strong>and</strong> coastal protected areas to promote the recovery of biodiversity <strong>and</strong><br />
fisheries resources <strong>and</strong> controlling l<strong>and</strong>-based sources of pollution. For open ocean <strong>and</strong> deep sea<br />
areas, sustainability can only be achieved through increased international cooperation to protect<br />
vulnerable habitats <strong>and</strong> species.” 23 The CBD held regional workshops during 2011 to identify<br />
information sources that might inform the location of Ecologically or Biolologically Sensitive Areas<br />
(EBSAs). New Zeal<strong>and</strong> participated in the SW Pacific workshop, <strong>and</strong> EBSAs were identified 24 The<br />
criteria for identifying EBSAs <strong>and</strong> Vulnerable Marine Ecosystems as recommended through UNGA<br />
<strong>and</strong> managed by Regional Fisheries Management Organisations 25 . The <strong>2012</strong> SPRFMO Science<br />
Working Group noted that the differing approaches to identifying VMEs <strong>and</strong> EBSAs could lead to<br />
conflicts in how areas possible in need of protection are defined.<br />
23 www.cbd.int/marine/done.shtml<br />
24 www.cbd.int/doc/meetings/cop/cop-11/official/cop-11-03-en.doc<br />
25 http://www.un.org/Depts/los/consultative_process/documents/no4_spc2.pdf<br />
236
AEBAR <strong>2012</strong>: Marine <strong>Biodiversity</strong><br />
11.2.2. Global marine assessment<br />
The biological diversity of the 72% of the planet covered by seawater is a crucial component of global<br />
resource security, ecosystem function <strong>and</strong> to climate dynamics. The Marine <strong>Biodiversity</strong> Outlook<br />
Reports <strong>and</strong> Summaries prepared by UNEP’s Regional Seas Programme for the 10th Conference of<br />
Parties of the Convention on Biological Diversity (CBD) held in 2010 provide the first systematic<br />
overview at a sub-global scale of the state of knowledge of marine biodiversity, the pressures it faces<br />
currently <strong>and</strong> the management frameworks in place for addressing those pressures 26 .<br />
The regional reports reflect a poor outlook for the continuing well being of marine biodiversity, which<br />
faces increasing pressures in all regions from l<strong>and</strong> sourced pollution, ship sourced pollution <strong>and</strong><br />
impacts of fishing. These pressures are serious <strong>and</strong> generally increasing despite measures in place to<br />
address them. They are amplified by predicted impacts of ocean warming, acidification <strong>and</strong> habitat<br />
change arising from climate <strong>and</strong> atmospheric change. Without significant management intervention<br />
marine biological diversity is likely to deteriorate substantially in the next 20 years with growing<br />
consequences for resource <strong>and</strong> physical security of coastal nations.<br />
With respect to fisheries, the main findings of the reports are that in most regions fisheries peaked at<br />
some point between the mid-1980s <strong>and</strong> mid-2000s that catch expansion is not possible in many cases<br />
<strong>and</strong> that increased exploitation levels would lead to lower catch levels.<br />
All regions report increases in shipping at levels which generally reflect annual economic growth. All<br />
regions report progress in the establishment of Marine Protected Areas but current levels of 1.2% of<br />
global ocean surface or 4.3% of continental shelf areas fall far short of the 10% target set by CBD<br />
COP7 in 2004. It is likely to be many years before this target is reached. The figures do not include<br />
some managed fishery areas that have objectives consistent with multiple sustainable use <strong>and</strong> overall<br />
objectives for conservation but even if these are taken into account the proportion managed with<br />
objectives that explicitly address sustainability of biodiversity or ecosystem processes is inadequate.<br />
The need to plan <strong>and</strong> implement ecosystem scale <strong>and</strong> ecosystem-based management of the seas is<br />
urgent.<br />
After many years of international negotiations on the need to strengthen the science‐policy interface<br />
on biodiversity <strong>and</strong> ecosystem services at all levels, more than 90 governments (including New<br />
Zeal<strong>and</strong>) agreed in April <strong>2012</strong> to officially establish the Intergovernmental Science-Policy Platform<br />
on <strong>Biodiversity</strong> <strong>and</strong> Ecosystem Services (IPBES) 27 . It will be a leading global body providing<br />
scientifically sound <strong>and</strong> relevant information to support more informed decisions on how biodiversity<br />
<strong>and</strong> ecosystem services are conserved <strong>and</strong> used around the world.<br />
The United Nations Conference on Sustainable Development (UNCSD), also known as the Rio+20<br />
Conference (June 2011) 28 had a strong sustainability focus <strong>and</strong> generated an outcome document<br />
entitled "the future we want" which had a section on oceans (para 158 - 177) including:<br />
• Support for the Regular Process of Global Reporting <strong>and</strong> Assessment of the State of the<br />
Marine <strong>Environment</strong> established under the General Assembly <strong>and</strong> looked forward to the<br />
completion of the first global integrated assessment of the state of the marine environment by<br />
2014 29 .<br />
26 UNEP (2003) Global Marine Assessments: a survey of global <strong>and</strong> regional marine environmental assessments<br />
<strong>and</strong> related scientific activities. UNEP-WCMC/UNEP/UNESCO-IOC. 132p available online at www.unepwcmc.org/resources/publications/ss1/GMA_<strong>Review</strong>.pdf<br />
27 http://www.iucn.org/what/<br />
28 http://sustainabledevelopment.un.org/futurewewant.html Rio +20 outcome document<br />
29 Integrated assessment of the state of the marine environment by 2014.<br />
http://www.un.org/depts/los/global_reporting/Santiago_Regular_Proceess_Workshop_Presentations/GRAME_<br />
Outline_of_the_First_Integrated_Assessment_Report.pdf<br />
237
AEBAR <strong>2012</strong>: Marine <strong>Biodiversity</strong><br />
• The ongoing work of the Ad Hoc Open-ended Informal Working Group on Study Issues<br />
Relating to the Conservation <strong>and</strong> Sustainable Use of Marine <strong>Biodiversity</strong> Beyond Areas of<br />
National Jurisdiction <strong>and</strong> the wish to, by the end of the 69th session (2014) make a decision<br />
about the development of an international instrument under UNCLOS.<br />
• A concern about the health of oceans <strong>and</strong> marine biodiversity <strong>and</strong> the work of the IMO <strong>and</strong><br />
relevant conventions including initiatives like the London Protocol on ocean fertilisation <strong>and</strong><br />
teh global programme of action for the protection of the marine environment from l<strong>and</strong> based<br />
activities.<br />
• The Rio+20 outcome also endorsed a process to develop sustainable development goals (to<br />
apply to all countries) which will include oceans issues. (This is still in its nascent stage <strong>and</strong> a<br />
clear work programme will be finalised by Sept 2013).<br />
11.2.3. Ocean climate change <strong>and</strong> ocean acidification<br />
Ocean climate change at the global scale overshadows the existing challenges of managing local<br />
impacts causing declines in marine biodiversity in the face of current levels of human use <strong>and</strong> impact.<br />
The projected increases in temperature, acidity, severe storm incidence <strong>and</strong> sea level present major<br />
challenges for biodiversity management. This is reflected in changes at the Great Barrier Reef in<br />
Australia, which is a globally iconic marine ecosystem that has been subject to adaptive scientificallybased<br />
ecosystem-based management for more than 30 years. An Outlook Report by the Great Barrier<br />
Reef Marine Park Authority (2009) concluded that “without significant additional management<br />
intervention, some components of the ecosystem will deteriorate in the next 20 years <strong>and</strong> only a few<br />
areas are likely to be healthy <strong>and</strong> resilient in 50 years.” Without strong ecosystem based management<br />
the global threats to marine biodiversity may be similar <strong>and</strong> their implications for food <strong>and</strong> physical<br />
security could be substantial.<br />
The Outlook Report provides a reasonable underst<strong>and</strong>ing of the nature <strong>and</strong> extent of the problems<br />
facing marine biodiversity <strong>and</strong> marine resources. There are examples of effective actions to address<br />
some of these problems but management performance is generally insufficient <strong>and</strong> inadequately<br />
coordinated to address the growing problems of marine biodiversity decline <strong>and</strong> ecosystem change.<br />
Climate change can adversely impact on the spatial patterns of marine biodiversity <strong>and</strong> ecosystem<br />
function through changes in species distributions, species mix <strong>and</strong> habitat availability, particularly at<br />
critical stages of species life histories. A study of the global patterns of climate change impacts on<br />
ocean biodiversity projected the distributional ranges of a sample of 1066 exploited marine fish <strong>and</strong><br />
invertebrates for 2050 using a newly developed dynamic bioclimate envelope model which showed<br />
that climate change may lead to numerous local extinctions in the sub-polar regions, the tropics <strong>and</strong><br />
semi-enclosed seas (Cheung et al. 2009). Simultaneously, species invasion is projected to be most<br />
intense in the Arctic <strong>and</strong> the Southern Ocean. With these elements taken together, the model predicted<br />
dramatic species turnovers of over 60% of the present biodiversity, implying ecological disturbances<br />
that potentially disrupt ecosystem services (Cheung et al. 2009).<br />
The World Bank, together with IUCN <strong>and</strong> <strong>Environment</strong>al Services Association released a brief for<br />
decision-makers entitled, "Capturing <strong>and</strong> Conserving Natural Coastal Carbon – Building Mitigation,<br />
Advancing Adaptation 30 ". This brief highlights the crucial importance of carbon sequestered in<br />
coastal wetl<strong>and</strong>s <strong>and</strong> in submerged vegetated habitats such as seagrass beds, for climate change<br />
mitigation.<br />
30 UNFCCC COP-16 event. Cancun Messe, Jaguar. ‘Blue Carbon: Valuing CO2 Mitigation by Coastal Marine<br />
Systems. Sequestration of Carbon Along Our Coasts: Are We Missing Major Sinks <strong>and</strong> Sources?’<br />
238
AEBAR <strong>2012</strong>: Marine <strong>Biodiversity</strong><br />
The Intergovernmental Panel on Climate Change (IPCC) is preparing material for the 5 th IPCC Report<br />
in 2014 <strong>and</strong> for the first time includes chapters to explicitly address ocean climate change issues 31 .<br />
The Working Group I <strong>and</strong> Working Group II Contributions to the Fifth Assessment Report include<br />
chapters on the ocean (WG I) <strong>and</strong> Climate Change 2014: Impacts, Adaptation, <strong>and</strong> Vulnerability<br />
including Chapters on Coastal <strong>and</strong> Oceans ecosystems, <strong>and</strong> sections on biodiversity(WGII). Working<br />
Group I will consider "Ocean biogeochemical changes, including ocean acidification" in their Chapter<br />
3 (Observations - Ocean), <strong>and</strong> "Processes <strong>and</strong> underst<strong>and</strong>ing of changes, including ocean<br />
acidification" in their Chapter 6 on "Carbon <strong>and</strong> other biogeochemical cycles". Working Group II will<br />
consider "Water property changes, including temperature <strong>and</strong> ocean acidification" in their Chapter 6<br />
on "Ocean Systems". In addition, "Carbon Cycle including Ocean Acidification" has been identified<br />
as a "Cross-Cutting Theme" across (predominantly) WG1 <strong>and</strong> WG2.<br />
Hobday et al. (2006) reported on the relative risks <strong>and</strong> likely impacts of ocean climate change <strong>and</strong><br />
ocean acidification to marine life in Australian waters (Figure 11.1). This approach was extremely<br />
useful for summarising risks <strong>and</strong> threats of climate change on marine systems to policy makers <strong>and</strong><br />
the subsequent development of the Commonwealth <strong>Environment</strong> Research Facilities (CERF) Marine<br />
<strong>Biodiversity</strong> Hub in Australia 32.<br />
The Hub analysed patterns <strong>and</strong> dynamics of marine biodiversity through four research programmes to<br />
determine the appropriate units <strong>and</strong> models for effectively predicting Australia’s marine biodiversity.<br />
These programmes were designed to develop <strong>and</strong> deliver tools needed to manage Australia’s marine<br />
biodiversity in a changing ocean climate. The final report from three years intense research is<br />
available at the website 33. Australia also has The Marine Adaptation Network that comprises a<br />
framework of five connecting marine themes (integration; biodiversity <strong>and</strong> resources; communities;<br />
markets <strong>and</strong> policy) that cut across climate change risk, marine biodiversity <strong>and</strong> resources, socioeconomics,<br />
policy <strong>and</strong> governance, <strong>and</strong> includes ecosystems <strong>and</strong> species from the tropics to<br />
Australian Antarctic waters 34 .<br />
In late June 2011, two science-based reports heightened concerns about the critical state of the<br />
world’s oceans in response to ocean climate change. One focuses on the potential impacts of ocean<br />
acidification on fisheries <strong>and</strong> higher trophic level ecology <strong>and</strong> takes a modelling approach to scaling<br />
from physiology to ecology (Le Quesne <strong>and</strong> Pinnegar 2011) <strong>and</strong> the other assesses the critical state of<br />
the world’s oceans in relation to climate change <strong>and</strong> other stressors (Rogers <strong>and</strong> Laffoley (2011).<br />
11.2.1. Census of Marine Life 2000–2010<br />
In 2010, the international initiative to conduct a Census of Marine Life 35 was concluded after ten<br />
years of accessing <strong>and</strong> databasing existing records, sampling <strong>and</strong> exploration around the globe. The<br />
Census is an unprecedented collaboration among researchers from more than 80 nations to assess <strong>and</strong><br />
explain the diversity, distribution, <strong>and</strong> abundance of life in the oceans. During the last decade, the<br />
2,700 scientists involved in the Census have mounted 540 expeditions, identified more than 6,000<br />
potentially new species, catalogued upward of 31 million distribution records, <strong>and</strong> generated 2,600<br />
scientific publications. NIWA scientists were part of the team that led CenSeam 36 , the seamount<br />
component of the Census of Marine Life, <strong>and</strong> scientists from NIWA <strong>and</strong> the University of Auckl<strong>and</strong><br />
played significant roles in a number of other programmes.The New Zeal<strong>and</strong> IPY-CAML voyage to<br />
the Ross Sea in 2008 was a major contribution to CAML.<br />
31 http://www.global-greenhouse-warming.com/IPCC-5th-Report.html<br />
32 www.marinehub.org/<br />
33 www.marinehub.org/<br />
34 arnmbr.org/content/index.php/site/aboutus/<br />
35 www.coml.org/results-publications<br />
36 www.coml.org/global-census-marine-life-seamounts-censeam<br />
239
AEBAR <strong>2012</strong>: Marine <strong>Biodiversity</strong><br />
Figure 11.1: Potential biological impacts of climate change on Australian marine life. The ratings in this table are<br />
based on the expected responses to predicted changes in Sea Surface Temperature (SST), salinity, wind, pH, mixed<br />
layer depth <strong>and</strong> sea level, <strong>and</strong> from literature reviews for each species group. The implicit assumption underlying this<br />
table is that Australian marine species will respond in similar ways to their counterparts throughout the world<br />
(Hobday et al. 2006.) Note: phenology means life cycle.<br />
The Census increased the total number of known marine species by about 20,000, from 230,000 in<br />
2000 to about 250,000 in 2010. Among the millions of specimens collected in both familiar <strong>and</strong><br />
seldom-explored waters, the Census found more than 6,000 potentially new species <strong>and</strong> completed<br />
formal descriptions of more than 1,200 of them. It also found that some species considered to be rare<br />
are more common than previously thought (Ausubel et al. 2010). The digital archive (the Ocean<br />
Biogeographic Information System OBIS (http://www.iobis.org/) has now grown to 31 million<br />
observations, <strong>and</strong> the Census compiled the first regional <strong>and</strong> global comparisons of marine species<br />
diversity. It helped to create the first comprehensive list of the known marine species, <strong>and</strong> also helped<br />
to compose web pages for more than 80,000 species in the Encyclopaedia of Life 37 .<br />
Applying genetic analysis on an unprecedented scale to a dataset of 35,000 species from widely<br />
differing major groupings of marine life, the Census graphed the proximity <strong>and</strong> distance of relations<br />
37 www.eol.org/<br />
240
AEBAR <strong>2012</strong>: Marine <strong>Biodiversity</strong><br />
among distinct species, providing new insight into the genetic structure of marine diversity. With the<br />
genetic analysis often called barcoding, the Census sometimes decreased diversity but generally its<br />
analyses exp<strong>and</strong>ed the number of species, especially the number of different microbes, including<br />
bacteria <strong>and</strong> archaea.<br />
The Census has overwhelmingly demonstrated that the total number of species in the ocean remain<br />
largely unknown. The Census also demonstrated that evidence of human impacts on the oceans<br />
extends to all depths <strong>and</strong> habitats <strong>and</strong> that we still have much to learn to integrate use of resources<br />
with stewardship of a healthy marine ecosystem. The Census results could logically extrapolate to at<br />
least a million kinds of eukaryotic marine life that earn the rank of species <strong>and</strong> to tens or even<br />
hundreds of millions of kinds of microbes.<br />
A summary of the overall state of knowledge about marine biodiversity after the Census by Costello<br />
et al. (2010) places New Zeal<strong>and</strong> 6 th out of 18 national regions based on the collective knowledge<br />
assembled by the Census National <strong>and</strong> Regional Implementation Committees (NRIC) <strong>and</strong> comparing<br />
the Spearman rank correlation coefficients between known diversity (total species richness, alien<br />
species, <strong>and</strong> endemics) <strong>and</strong> available resources, such as numbers of taxonomic guides <strong>and</strong> experts.<br />
(Figure 11.2).<br />
Figure 11.2: The regions are ranked by their state-of-knowledge index (mean ± st<strong>and</strong>ard error) across taxa. Dashed<br />
line represents the overall mean. (Image Source Costello et al. 2010).<br />
All NRICs reported what they considered the main threats to marine biodiversity in their region,<br />
citing published data <strong>and</strong> expert opinions. Although the reports were not st<strong>and</strong>ardised, the threats<br />
identified were grouped into several overarching issues. We integrated these data on biodiversity<br />
threats so as to rank each threat from 1 (very low) to 5 (very high threat) in each region. New Zeal<strong>and</strong><br />
was placed 12 th out of 1 8 regions in terms of overall threat levels to biodiversity, overfishing <strong>and</strong><br />
alien species invasion. Habitat loss <strong>and</strong> ocean acidification were identified as the biggest threats to<br />
marine biodiversity in New Zeal<strong>and</strong> (Costello et al. 2010).<br />
241
AEBAR <strong>2012</strong>: Marine <strong>Biodiversity</strong><br />
11.2.2. Global monitoring <strong>and</strong> indicators for marine biodiversity<br />
There are numerous schemes within <strong>and</strong> between nations to monitor the marine environment,<br />
including physical, chemical <strong>and</strong> biological components. Marine biodiversity indicators have been<br />
developed for the UK <strong>and</strong> the EU 38 . Marine environmental monitoring networks have been developed<br />
in the USA, Canada, Australia <strong>and</strong> South Africa. Global networks include the Global Ocean<br />
Observing System (GOOS) which is a permanent global system for observations, modelling <strong>and</strong><br />
analysis of marine <strong>and</strong> ocean variables; Global Climate Observing System (GCOS 39 ) which<br />
stimulates, encourages, coordinates <strong>and</strong> otherwise facilitates observations by national or international<br />
organizations. A Southern Ocean Observing System (SOOS) is under development. 40<br />
Others include:<br />
• ARGO an international deepwater monitoring system of free floating buoys that are part of<br />
the integrated global observation strategy 41 .<br />
• The Ocean Observation Systems (OOS) in Canada have demonstrated many positive benefits.<br />
• The Continuous Plankton Recorder (CPR) Surveys have been collecting data from the North<br />
Atlantic <strong>and</strong> the North Sea on the ecology <strong>and</strong> biogeography of plankton since 1931 42 . Sister<br />
CPR surveys around the globe include the SCAR SO-CPR Survey established in 1991 by the<br />
Australian Antarctic Division to map the spatial-temporal patterns of zooplankton <strong>and</strong> then to<br />
use the sensitivity of plankton to environmental change as early warning indicators of the<br />
health of the Southern Ocean. It also serves as reference for other monitoring programs such<br />
as CCAMLR's Ecosystem Monitoring Program C- EMP <strong>and</strong> the developing Southern Ocean<br />
Observing System 43 .<br />
• The Marine <strong>Environment</strong>al Change Network (MECN) is a collaboration between<br />
organisations in Engl<strong>and</strong>, Scotl<strong>and</strong>, Wales, Isle of Man <strong>and</strong> Northern Irel<strong>and</strong> collecting longterm<br />
time series information for marine waters 44 .<br />
• The MECN has developed links with other networks coordinating long-term data collection<br />
<strong>and</strong> time series. These networks include the Marine <strong>Biodiversity</strong> <strong>and</strong> Ecosystem Functioning<br />
European Union Network of Excellence (MarBEF 45 ) which coordinates long-term marine<br />
biodiversity monitoring at a European level.<br />
• New Zeal<strong>and</strong> has now formed a partnership with Australia’s Integrated Marine Observing<br />
System (IMOS 46 ) was established in 2007. IMOS is designed to be a fully integrated national<br />
array of observing equipment to monitor the open oceans <strong>and</strong> coastal marine environment<br />
around Australasia, covering physical, chemical <strong>and</strong> biological variables. All IMOS data is<br />
freely <strong>and</strong> openly available through the IMOS Ocean Portal for the benefit of Australian <strong>and</strong><br />
New Zeal<strong>and</strong> marine <strong>and</strong> climate science as a whole. Oceans 2025 47 is an initiative of the<br />
Natural <strong>Environment</strong> Research Council (NERC) funded Marine Research Centres. This<br />
addresses environmental issues that require sustained long-term observations.<br />
A challenge for MPI <strong>and</strong> New Zeal<strong>and</strong> researchers is how to assimilate any or all of the above<br />
monitoring approaches as a means of measuring biodiversity baseline levels <strong>and</strong> the nature <strong>and</strong> extent<br />
38 http://jncc.defra.gov.uk/page-4233<br />
39 www.ioc-goos.org/index.php?option=com_content&view=article&id=12&Itemid=26&lang=en<br />
40 http://www.scar.org/soos/<br />
41 http://www.qc.dfo-mpo.gc.ca/publications/science/evaluation-assessment-eng.asp.<br />
42 www.sahfos.ac.uk/<br />
43 www.sahfos.ac.uk/sister-survey/sister-surveys/-southern-ocean-continuous-plankton-recorder-survey-<br />
(scar).aspx<br />
44 http://www.mba.ac.uk/MECN/<br />
45 http://www.marbef.org/<br />
46 http://imos.org.au/<br />
47 http://www.oceans2025.org/<br />
242
AEBAR <strong>2012</strong>: Marine <strong>Biodiversity</strong><br />
of biodiversity changes, especially as a means of assessing the effectiveness of management measures<br />
to protect or enhance biodiversity or halt its decline.<br />
11.2.3. Economic valuation of biodiversity<br />
The national <strong>and</strong> global responsibility for New Zeal<strong>and</strong> to maintain a strong environmental record in<br />
fisheries <strong>and</strong> other marine-based industries is increasing. There is growing awareness of international<br />
treaties <strong>and</strong> agreements that New Zeal<strong>and</strong> is party to. Global markets are becoming increasingly<br />
sensitive to our national environmental record. Fishing companies who meet rigorous st<strong>and</strong>ards<br />
receive Marine Stewardship Council Certification for certain fisheries (currently, hoki trawl, southern<br />
blue whiting pelagic trawl <strong>and</strong> albacore tuna troll fisheries). Proposals to exploit other living marine<br />
resources or extract non-living marine resources are increasingly under scrutiny to ensure that such<br />
activities do not adversely degrade the marine environment or impact on marine living resource<br />
industries.<br />
The invisibility of biodiversity values has often encouraged inefficient use or even destruction of the<br />
natural capital that is the foundation of our economies. A recent international initiative “The<br />
Economics of Ecosystems <strong>and</strong> <strong>Biodiversity</strong>” (TEEB) 48 demonstrates the application of economic<br />
thinking to the use of biodiversity <strong>and</strong> ecosystem services. This can help clarify why prosperity <strong>and</strong><br />
poverty reduction depend on maintaining the flow of benefits from ecosystems; <strong>and</strong> why successful<br />
environmental protection needs to be grounded in sound economics, including explicit recognition,<br />
efficient allocation, <strong>and</strong> fair distribution of the costs <strong>and</strong> benefits of conservation <strong>and</strong> sustainable use<br />
of natural resources. Valuation is seen as a tool to help recalibrate the faulty economic compass that<br />
has led to decisions about the environment (<strong>and</strong> biodiversity) that are prejudicial to both current wellbeing<br />
<strong>and</strong> that of future generations.<br />
11.3. State of knowledge in New Zeal<strong>and</strong><br />
The past 750 years of human activity have impacted on marine environments. For example, depletion<br />
of fur seals <strong>and</strong> sea lions occurred from the earliest days of human settlement, not just with European<br />
arrival (Smith 2005, 2011). There was also a pulse of sedimentation coinciding with the initial<br />
clearance of 40% of NZ forests within 200 years of Polynesian settlement (McWethy et al. 2010).<br />
Impacts have occurred near population centres, as well as more remote areas <strong>and</strong> to depths in excess<br />
of 1000 metres (MacDiarmid et al. <strong>2012</strong>, Ministry for Primary Industries <strong>2012</strong>). In some cases by<br />
looking back over historical records it becomes apparent how much biodiversity loss has occurred.<br />
Over long time spans incremental impacts can lead to major shifts in biodiversity composition. An<br />
analysis of marine biodiversity decline over a couple of decades could miss the major changes that<br />
can occur incrementally over long periods.<br />
While New Zeal<strong>and</strong> has reasonable archaeological, historical <strong>and</strong> contemporary data on the decline in<br />
abundance of individual marine species, in some cases over a period of 750 years (e.g., MacDiarmid<br />
et al. in press), current trends in the status of New Zeal<strong>and</strong>’s marine biodiversity are difficult to<br />
determine for several reasons. These include a lack of both pre-disturbance baseline <strong>and</strong> recent<br />
information, <strong>and</strong> a lack of a nationally coordinated approach to assessing <strong>and</strong> monitoring marine<br />
biodiversity<br />
A re-evaluation of the threat status of New Zeal<strong>and</strong>'s marine invertebrates was undertaken by the<br />
Department of Conservation in 2009, <strong>and</strong> identified no taxa that had improved in threat status as a<br />
result of past or ongoing conservation management action, nor any taxa that had worsened in threat<br />
48 TEEB (2010) The Economics of Ecosystems <strong>and</strong> <strong>Biodiversity</strong>: Mainstreaming the Economics of Nature: A<br />
synthesis of the approach, conclusions <strong>and</strong> recommendations of TEEB. www.teebweb.org/<br />
243
AEBAR <strong>2012</strong>: Marine <strong>Biodiversity</strong><br />
status because of known changes in their distribution, abundance or rate of population decline<br />
(Freeman et al. 2010). The authors cautioned however that only a small fraction of New Zeal<strong>and</strong>'s<br />
marine invertebrate fauna had been evaluated for their threat status <strong>and</strong> that many taxa remain ‘data<br />
deficient’ or unlisted.<br />
A re-evaluation of marine mammal threat status found that relative to the previous listing, the threat<br />
status of two species worsened: the NZ sea lion (Phocarctos hookeri) was uplisted to Nationally<br />
Critical <strong>and</strong> the bottlenose dolphin (Tursiops truncatus) was uplisted to Nationally Endangered. No<br />
species was considered to have an improved status (See Chapter on marine mammales <strong>and</strong> also Baker<br />
et al. 2010).<br />
The most recent State of the <strong>Environment</strong> Report in New Zeal<strong>and</strong> (MfE 2007) covers terrestrial <strong>and</strong><br />
freshwater organisms in its <strong>Biodiversity</strong> section 49 . Comment on marine biodiversity is provided in the<br />
Oceans section which states:<br />
“Of the almost 16,000 known marine species in New Zeal<strong>and</strong>, 444 are listed as threatened.<br />
Well-known species of particular concern include both subspecies of Hector’s dolphin, New<br />
Zeal<strong>and</strong> sea lion, southern right whale, Fiordl<strong>and</strong> crested penguin, <strong>and</strong> New Zeal<strong>and</strong> fairy<br />
tern. L<strong>and</strong>-based pressures on the inshore marine environment, as well as pressures on<br />
fisheries stocks, can be expected to persist <strong>and</strong>, therefore, continue to pose a challenge to the<br />
health of the marine environment. The increasing number of introduced species brought to<br />
New Zeal<strong>and</strong> through marine-based trade <strong>and</strong> travel, <strong>and</strong> climate change may exacerbate<br />
existing pressures. Further information about our marine environment is needed if we are to<br />
help set priorities for future use <strong>and</strong> protection of our oceans”.<br />
Two major knowledge gaps identified by MfE 2007 that hinder resource management are sparse<br />
biodiversity baseline information; <strong>and</strong> the lack of a systematic national-scale approach to monitoring<br />
biodiversity trends (i.e. by comparing subsequent studies to the baseline information) in New Zeal<strong>and</strong>.<br />
The most recent summary of knowledge about marine biodiversity in New Zeal<strong>and</strong> is provided by<br />
Gordon (2009, 2010, <strong>2012</strong>) <strong>and</strong> Gordon et al. (2010). Figure 11.3 gives a tally of 17,058 living<br />
species in the EEZ, including 4,320 known undescribed species in collections.<br />
The Hub analysed patterns <strong>and</strong> dynamics of marine biodiversity through four research programmes to<br />
determine the appropriate units <strong>and</strong> models for effectively predicting Australia’s marine biodiversity.<br />
These programmes were designed to develop <strong>and</strong> deliver tools needed to manage Australia’s marine<br />
biodiversity in a changing ocean climate. The final report from three years intense research is<br />
available at the website 50. Australia also has The Marine Adaptation Network that comprises a<br />
framework of five connecting marine themes (integration; biodiversity <strong>and</strong> resources; communities;<br />
markets <strong>and</strong> policy) that cut across climate change risk, marine biodiversity <strong>and</strong> resources, socioeconomics,<br />
policy <strong>and</strong> governance, <strong>and</strong> includes ecosystems <strong>and</strong> species from the tropics to<br />
Australian Antarctic waters 51 .<br />
Species diversity for the most intensively studied animal phyla (Cnidaria, Mollusca, Brachiopoda,<br />
Bryozoa, Kinorhyncha, Echinodermata, Chordata) is more or less equivalent to that in the ERMS<br />
(European Register of Marine Species) region, an area 5.5 times larger than the New Zeal<strong>and</strong> EEZ<br />
(Gordon et al. 2010), suggesting that the NZ region biodiversity is proportionately richer than the<br />
ERMS region (Figure 11.3).<br />
49 State of the <strong>Environment</strong> MfE 2007.<br />
50 www.marinehub.org/<br />
51 arnmbr.org/content/index.php/site/aboutus/<br />
244
AEBAR <strong>2012</strong>: Marine <strong>Biodiversity</strong><br />
Taxonomic group No. Species 1 State of No. Introduced No. Experts No. ID<br />
knowledge<br />
species<br />
guides 2<br />
Domain Prokaryota 3<br />
79<br />
3<br />
>1<br />
3<br />
1<br />
Cyanobacteria<br />
40<br />
2<br />
1<br />
1<br />
1<br />
Domain Eukaryota 3 16,979 3-4 159 58 75<br />
Kingdom Chromista 3 2,643 3-4 11 7 2<br />
Ochrophyta 858 4-5 11 1 1<br />
Myzozoa incl. Dinoflagellata 249 3-4 0 2 0<br />
Foraminifera 1141 4-5 3 2 2<br />
Kingdom Plantae 3 702 4-5 12 12 3<br />
Chlorophyta 156 3-4 0 12 1<br />
Rhodophyta 541 3-4 12 0 1<br />
Tracheophyta 5 5 0 3 2<br />
Kingdom Protozoa 3 43 2-3 4 5 4<br />
Kingdom Fungi 89 3 0 1 0<br />
Kingdom Animalia 3 13,502 3-4 150 40 66<br />
Porifera 742 3 7 1 4<br />
Cnidaria 1,116 4 23 0 6<br />
Platyhelminthes 323 2 2 1 1<br />
Mollusca 3,813 4 14 1 3<br />
Annelida 792 4 32 1 2<br />
Arthropoda (esp. Crustacea) 2,926 3-4 27 13 17<br />
Bryozoa 953 4 24 1 4<br />
Echinodermata 623 5 0 3 6<br />
Tunicata 192 5 0 3 6<br />
Other invertebrates 456 2-5 3 7 12<br />
Vertebrata (Pisces) 1,387 4-5 6 6 7<br />
Other vertebrates 179 5 0 4 4<br />
TOTAL REGIONAL<br />
17,058 3-4 177 62 76<br />
DIVERSITY 3<br />
1<br />
Sources of the tallies: scientific literature, books, field guides, technical reports, museum collections.<br />
2<br />
Identification guides cited in Gordon et al. 2010.<br />
3<br />
Totals from Gordon 2010, <strong>2012</strong> <strong>and</strong> Gordon et al. 2010 <strong>and</strong> unpublished NIWA data.<br />
Figure 11.3: Diversity of marine species found in the New Zeal<strong>and</strong> region (after Gordon 2010, <strong>2012</strong>; Gordon et al.<br />
2010 <strong>and</strong> current unpublished NIWA data).<br />
In late June 2011, two science-based reports heightened concerns about the critical state of the<br />
world’s oceans in response to ocean climate change. One focuses on the potential impacts of ocean<br />
acidification on fisheries <strong>and</strong> higher trophic level ecology <strong>and</strong> takes a modelling approach to scaling<br />
from physiology to ecology (Le Quesne <strong>and</strong> Pinnegar 2011) <strong>and</strong> the other assesses the critical state of<br />
the world’s oceans in relation to climate change <strong>and</strong> other stressors (Rogers <strong>and</strong> Laffoley (2011).<br />
In New Zeal<strong>and</strong>, new marine research projects initiated in <strong>2012</strong> include ‘Marine Futures’ that aims to<br />
develop an agreed decision-making framework, enabling participation of all stakeholders (public, iwi,<br />
industry, government), that facilitates economic growth, improves marine stewardship <strong>and</strong> ensures<br />
that cumulative stresses placed on the environment do not degrade the ecosystem beyond its<br />
ecological adaptive capacity.( C01X1227). The ‘Ross Sea Climate & Ecosystem’will model likely<br />
future changes in the physical environment of the region <strong>and</strong> potential consequences of these changes<br />
on the ecosystem in terms of functional links between the environment <strong>and</strong> the marine food web.<br />
(C01X1226). ‘Management of offshore mining’will develop a clear framework that will guide<br />
appropriate <strong>and</strong> robust environmental impact assessments <strong>and</strong> the development of integrated<br />
environmental management plans for the marine-mining sector, other resource users <strong>and</strong> resource<br />
management agencies. (C01X1228)<br />
Core purpose funding within the Coasts <strong>and</strong> Oceans Centre at NIWA include “Managing Marine<br />
Stressors: Quantifying <strong>and</strong> predicting the effects of natural variability, climate change <strong>and</strong><br />
anthropogenic stressors to enable ecosystem-based approaches to the management of New Zeal<strong>and</strong>’s<br />
marine resources” <strong>and</strong> within the Fisheries Centre, “Ecosystem Approaches to Fisheries Management:<br />
Determine the impact of fisheries on the aquatic environment to inform an ecosystem-based approach<br />
245
AEBAR <strong>2012</strong>: Marine <strong>Biodiversity</strong><br />
to fisheries management <strong>and</strong> contribute to broader ecosystem-based management approaches in<br />
conjunction with the Coasts & Oceans Centre.<br />
11.3.1. The MPI <strong>Biodiversity</strong> Research Programme<br />
The recognition of increasing societal expectation to use fisheries management measures that will<br />
achieve biodiversity conservation has signalled by MPI through Fisheries 2030 52 in its long-term<br />
commitment to– “ecosystem based fisheries management” <strong>and</strong> to ensuring that “biodiversity <strong>and</strong> the<br />
function of ecological systems, including trophic linkages, are conserved”. While New Zeal<strong>and</strong>’s<br />
environmental record with regard to fishing is perceived to be relatively high on an international<br />
scale, the Ministry is not complacent about the ongoing requirement to monitor <strong>and</strong> provide evidence<br />
that measures to achieve biodiversity conservation needs are being met. This is particularly true of the<br />
need to better underst<strong>and</strong> <strong>and</strong> mitigate the effects of fishing on the areas impacted by fishing.The<br />
effects of fishing on the aquatic environment <strong>and</strong> risks to biodiversity <strong>and</strong> marine ecosystems are<br />
recognised in Fisheries Plans. Research continues to be supported through the Deepwater Research<br />
Plan, as well as the <strong>Aquatic</strong> <strong>Environment</strong> <strong>and</strong> <strong>Biodiversity</strong> Research Programmes.<br />
There are also a range of societal values beyond commercial, customary <strong>and</strong> recreational take from<br />
the sea that are recognised as part of “strengthening our society” (see footnote 12). These include<br />
aesthetic <strong>and</strong> cultural values as well as other economic values such as tourism <strong>and</strong> marine recreation<br />
other than fishing 53 . To link socio-economic values of biodiversity to science supporting fisheries<br />
management will require a multi-disciplinary approach only just beginning in New Zeal<strong>and</strong>.<br />
MPI responded to the NZBS in 2000 with the establishment of the MPI <strong>Biodiversity</strong> Programme<br />
which has run successfully for more than 10 years with 55 research projects <strong>and</strong> a large number of<br />
published outputs, presentations <strong>and</strong> contributions to NZ <strong>and</strong> CCAMLR management measures.<br />
The Ministry is one of several New Zeal<strong>and</strong> government agencies with a strong interest <strong>and</strong> a<br />
statutory management m<strong>and</strong>ate in the Ross Sea region of Antarctica through the Antarctic Marine<br />
Living Resources Act 1981. MPI Antarctic science contributes strongly to New Zeal<strong>and</strong>’s whole-ofgovernment<br />
involvement in contributions to the Commission for the Convention on Antarctic Marine<br />
Living Resources (CCAMLR) <strong>and</strong> the Antarctic Treaty. Research conducted under the MPI Antarctic<br />
<strong>Biodiversity</strong> Programme seeks to help New Zeal<strong>and</strong> deliver on its international obligations to support<br />
an ecosystem-based approach to management in Antarctic waters. There are strong links with the MPI<br />
Antarctic Working Group research <strong>and</strong> with other Ross Sea ecosystems research carried out under<br />
NIWA core purpose Fisheries, <strong>and</strong> Coast <strong>and</strong> Oceans Centres (e.g., Sharp et al. 2010).<br />
The biodiversity research programme set up under the NZBS was established with a multi-stakeholder<br />
biodiversity research advisory group (BRAG), chaired by the former Ministry of Fisheries (now MPI).<br />
The research commissioned for the period 2001–2005 reflected goals set by the NZBS <strong>and</strong> the<br />
BRAG, while remaining compatible with the Ministry of Fisheries Statements of Intent (SOIs).<br />
During the first three years of this period, MPI also commissioned marine biosecurity research under<br />
NZBS, but this was transferred to Biosecurity New Zeal<strong>and</strong> (MAFBNZ) in 2004. From 2006 to 2010,<br />
the programme evolved further with the development of a new 5-year work programme to address<br />
shortcomings identified in the review of the NZBS by Clark <strong>and</strong> Green (2006). An overview of the<br />
<strong>Biodiversity</strong> Programme at a glance is given in Figure 11.4.<br />
52 Fisheries 2030 The full document can be downloaded from www.fish.govt.nz/en-nz/Fisheries+2030<br />
53 MARBEF: The Valencia Declaration 2008 www.marbef.org/worldconference<br />
246
AEBAR <strong>2012</strong>: Marine <strong>Biodiversity</strong><br />
BIODIVERSITY THEMES KEY QUESTIONS<br />
BIODIVERSITY PATTERNS &<br />
DISTRIBUTION<br />
• Fauna <strong>and</strong> flora (taxonomy,<br />
biosystematics)<br />
• Distribution & abundance of major<br />
groups<br />
• <strong>Review</strong>s of existing knowledge<br />
• Biogeography<br />
• Drivers of observed patterns<br />
HABITAT DIVERSITY<br />
• Biogenic reefs<br />
• Rocky reefs<br />
• Rhodolith beds<br />
• Seamounts<br />
• Soft sediments<br />
• Habitat mapping EEZ<br />
• Deepsea habitats<br />
• Physical <strong>and</strong> biological characterisation<br />
FUNCTIONAL DIVERSITY<br />
• The role of different animal/plant groups<br />
in the ecosystem<br />
• Trophic processes<br />
• Bentho-pelagic processes<br />
GENETIC DIVERSITY<br />
• Barcode of Life<br />
• Connectivity (populations, areas)<br />
THREATS TO BIODIVERSITY<br />
• Climate change <strong>and</strong> variability<br />
• Invasive organisms; fishing<br />
• L<strong>and</strong>-use effects<br />
• Cumulative effects<br />
METHODS<br />
• Measuring biodiversity<br />
• Classification<br />
• Predictive modelling<br />
• <strong>Biodiversity</strong> indicators<br />
• Monitoring biodiversity<br />
• Ecosystem approaches<br />
BIOROSS/ & IPY RESEARCH<br />
• Bioross coastal biodiversity<br />
• Subtidal ice-sea interface<br />
• Census of Antarctic marine Life survey<br />
for IPY, Ross Sea<br />
• Trophic modelling Ross Sea<br />
• Balleny Isl<strong>and</strong>s survey for MPA<br />
• Functional habitats<br />
Figure 11.4: Summary of MPI <strong>Biodiversity</strong> Research Programme 2000–<strong>2012</strong>.<br />
247<br />
• What is the abundance <strong>and</strong> distribution of marine<br />
biodiversity in NZ?<br />
• What are the key drivers of observed patterns in<br />
biodiversity?<br />
• How much marine endemism is there in NZ<br />
waters?<br />
• What is the organism size distribution?<br />
• How do patterns in biodiversity change over time?<br />
• What are the relative goods <strong>and</strong> services offered<br />
by each habitat to aquatic environment health?<br />
• Can the assemblages <strong>and</strong> biodiversity of marine<br />
habitats in the EEZ be predicted by modelling?<br />
• Which habitats are at greatest risk from extraction<br />
practices?<br />
• What proportion of a given habitat needs to remain<br />
intact for healthy ecosystem functioning?<br />
• How does biodiversity contribute to the resilience<br />
of ecosystems to perturbation?<br />
• Can we use ecosystem function to classify<br />
biodiversity?<br />
• Which key processes need to be retained?<br />
• What barriers drive connectivity within species?<br />
• What is the role of endemism in characterising the<br />
evolutionary history <strong>and</strong> taxonomy?<br />
• What are the key threats?<br />
• Does biodiversity increase resilience to climate<br />
change?<br />
• Which components of the ecosystem will be most<br />
at risk from climate change?<br />
• How can we best measure <strong>and</strong> portray<br />
biodiversity?<br />
• How scalable are results from a local scale to an<br />
ecosystem scale?<br />
• What do we need to monitor to measure risks <strong>and</strong><br />
change to ecosystem health?<br />
• How can we measure the economic value of<br />
biodiversity <strong>and</strong> ecosystem services?<br />
• What is the connectivity between biodiversity in<br />
the Ross Sea <strong>and</strong> NZ?<br />
• How are biota adapted to polar conditions <strong>and</strong><br />
what is their sensitivity to perturbation?<br />
• Are MPAs a useful protection tool for the Ross<br />
Sea?<br />
• Are climate change effects on the ocean already<br />
impacting on the Ross Sea biota?
AEBAR <strong>2012</strong>: Marine <strong>Biodiversity</strong><br />
ACHIEVEMENTS & KNOWLEDGE TO DATE CURRENT WORK<br />
• Taxonomy of coralline algae <strong>and</strong> bryozoans ( 2 ID Guides)<br />
• New species from surveys added to benthic ID Guides<br />
• <strong>Review</strong> of macroalgae distribution on soft sediments<br />
• Contribution to several books on marine biodiversity in NZ<br />
• EEZ surveys on Fjordl<strong>and</strong>, Spirit’s Bay, Kermadec seamounts,<br />
Farewell Spit, Norfolk Ridge, Chatham Rise <strong>and</strong> Challenger Plateau.<br />
• Links to MAFBNZ biodiversity mapping; MEC, MFish BOMEC<br />
• Extensive new data sets <strong>and</strong> specimen collections obtained<br />
• Ecological input to improve MEC (fish, benthic invertebrates)<br />
• Deep-sea habitats , biogenic habitat <strong>and</strong> soft-sediment reviewed<br />
• Ocean Survey 20/20 habitats mapped Chatham-Challenger<br />
• <strong>Biodiversity</strong> of Kermadec <strong>and</strong> Chatham Rise seamounts mapped<br />
• Foveaux Strait habitats mapped<br />
• Classification of seamounts <strong>and</strong> VMEs developed<br />
• Testing of MEC with Chatham Challenger data<br />
• Rhodolith beds as havens of biodiversity in NZ<br />
• Rocky reef ecosystem function studied<br />
• Chatham Rise fish feeding study completed<br />
• Productivity in horse mussel <strong>and</strong> echinoderm benthic communities<br />
determined<br />
• Bioindicators in estuarine systems in Otago determined<br />
• Chatham-Challenger functional component analysis completed<br />
• Shellhash habitat function in the coastal zone<br />
• Molecular ID of certain fish <strong>and</strong> plankton determined<br />
• EEZ <strong>and</strong> Ross Seaspecies added to Barcode of Life Database,<br />
• Genetic assessment of ocean microbe diversity<br />
• Seamount connectivity reviewed<br />
• Threats <strong>and</strong> impacts to biodiversity <strong>and</strong> ecosystem functioning<br />
beyond natural environmental variation identified<br />
• Monitoring of plankton on transect NZ to Ross Sea annually<br />
• Changes in coccolithophore diversity <strong>and</strong> abundance in NZ waters<br />
<strong>and</strong> predicted change as temp <strong>and</strong> acidification increase asessed<br />
• Long-term effects of climate change on shelf ecosystems determined<br />
• Diversity metrics <strong>and</strong> other indicators to monitor change developed<br />
• Large-scale sampling protocols for habitat mapping determined<br />
• Acoustic habitat mapping tools developed<br />
• Workshop held on qualitative modelling <strong>and</strong> marine environment<br />
monitoring<br />
• Development of “OFOP” <strong>and</strong> DTIS-visual analytical methods<br />
• Predictive modelling techniques progressed for biodiversity on<br />
different scales<br />
• Development of data to end-user portal interfaced with NABIS<br />
• Latitudinal gradient project <strong>and</strong> ICECUBE completed in Ross sea<br />
• Fish taxonomy <strong>and</strong> ID guide developed for the Ross Sea<br />
• Foodweb <strong>and</strong> role of silverfish vs krill studied<br />
• IPY-CAML 2008; Ross Sea 2006, BioRoss 2004 surveys done<br />
• Subtidal <strong>and</strong> offshore biodiversity sampled, Balleny Isl<strong>and</strong>s 2006<br />
• Seaweed diversity determined at Balleny Isl<strong>and</strong>s<br />
• Bioregionalisation of the Ross Sea region completed<br />
248<br />
• Ongoing taxonomic work in<br />
relation to deep sea corals<br />
(VMEs)<br />
• Ongoing taxonomic work on<br />
specimens collected from the<br />
Chatham-Challenger project<br />
<strong>and</strong> from the IPY –CAML<br />
project.<br />
• Mapping biogenic structures<br />
• Mapping deepsea fisheries<br />
habitats in relation to ocean<br />
acidification threats from<br />
changing saturation horizons<br />
• Modelling benthic impacts<br />
• Ocean acidification on<br />
shellfish<br />
• Response <strong>and</strong> recovery of<br />
seabed to disturbancemodelling<br />
project<br />
• Connectivity among coastal<br />
fish populations<br />
• Experimental response of<br />
shellfish pH <strong>and</strong> temp.<br />
• CPR monitoring<br />
• Initial appraisal for MEMP<br />
• Acidification in deepwater<br />
fish habitat<br />
• Development of functional<br />
biota model for habitat<br />
classification<br />
• Qualitative <strong>and</strong> quantitative<br />
modelling of rocky reef<br />
ecosystem<br />
• Predictive modelling VMEs<br />
• Measuring risk <strong>and</strong> resilience<br />
(Chat-Chall objective)<br />
• finalisation IPY analyses<br />
• Uptake of biodiversity<br />
results to CCAMLR trophic<br />
modelling <strong>and</strong> biomass<br />
estimation, VMEs<br />
• New spp logged for CAML<br />
• <strong>Review</strong> of squids, octopus<br />
Figure 11.4: Continued Summary of MPI <strong>Biodiversity</strong> Research Programme 2000–<strong>2012</strong>.
AEBAR <strong>2012</strong>: Marine <strong>Biodiversity</strong><br />
11.3.2. Overall progress in MPI marine biodiversity research<br />
The MPI <strong>Biodiversity</strong> Research programme has three overarching science goals:<br />
• To describe <strong>and</strong> characterise the distribution <strong>and</strong> abundance of fauna <strong>and</strong> flora, as expressed<br />
through measures of biodiversity, <strong>and</strong> improving underst<strong>and</strong>ing about the drivers of the<br />
spatial <strong>and</strong> temporal patterns observed.<br />
• To determine the functional role of different organisms or groups of organisms in marine<br />
ecosystems, <strong>and</strong> assess the role of marine biodiversity in mitigating the impacts of<br />
anthropogenic disturbance on healthy ecosystem functioning.<br />
• To identify which components of biodiversity are required to ensure the sustainability of<br />
healthy marine ecosystems as well as to meet societal values on biodiversity.<br />
More specific Science Objectives developed below have been modified by BRAG over time <strong>and</strong> are<br />
used to focus the research commissioned:<br />
1. To classify <strong>and</strong> characterise the biodiversity, including the description <strong>and</strong> documentation of<br />
biota, associated with nearshore <strong>and</strong> offshore marine habitats in New Zeal<strong>and</strong>.<br />
2. To develop ecosystem-scale underst<strong>and</strong>ing of biodiversity in the New Zeal<strong>and</strong> marine<br />
environment.<br />
3. To investigate the role of biodiversity in the functional ecology of nearshore <strong>and</strong> offshore<br />
marine communities.<br />
4. To assess developments in all aspects of diversity, including genetic marine biodiversity <strong>and</strong><br />
identify key topics for research.<br />
5. To determine the effects of climate change <strong>and</strong> increased ocean acidification on marine<br />
biodiversity, as well as effects of incursions of non-indigenous species, <strong>and</strong> other threats<br />
<strong>and</strong> impacts.<br />
6. To develop appropriate diversity metrics <strong>and</strong> other indicators of biodiversity that can be used<br />
to monitor change.<br />
7. To identify threats <strong>and</strong> impacts to biodiversity <strong>and</strong> ecosystem functioning beyond natural<br />
environmental variation.<br />
To date, 55 research projects have been commissioned. Early studies focused primarily on Objectives<br />
1 <strong>and</strong> 2 <strong>and</strong> resulted in reviews, Identification Guides, habitat <strong>and</strong> community characterisations, <strong>and</strong><br />
revised taxonomy for certain groups of organisms. These objectives have also resulted in large<br />
collaborative ship-based surveys that have contributed to improved seabed classification in New<br />
Zeal<strong>and</strong> waters <strong>and</strong> the exploration of new habitats in the region <strong>and</strong> in Antarctic waters. Over time,<br />
the complexity <strong>and</strong> scale of studies has increased with projects on the functional ecology of marine<br />
ecosystems from localised experimental manipulation to broad-scale observations across 100s km 2<br />
under Objective 3. Such studies have also pursued the development of improved measures of<br />
biodiversity <strong>and</strong> indicators under Objectives 6 <strong>and</strong> 7. A study on changes in shelf ecosystems over the<br />
past 1000 years is yielding insights into the effects of long-term climate change, l<strong>and</strong>-use effects <strong>and</strong><br />
fishing on marine ecosystems while more recently, some studies have begun to address the effects of<br />
ocean acidification on marine biodiversity under Objective 5. A study underway has reviewed genetic<br />
variation in the New Zeal<strong>and</strong> marine environment <strong>and</strong> is conducting field observations on several<br />
species to examine genetic variation across latitudinal gradients. Aspects of the seven Objectives have<br />
also been addressed through a range of biodiversity projects in the Ross Sea region including the<br />
International Polar Year Census of Antarctic Marine Life project (IPY-CAML). A key to study<br />
findings is consideration of biodiversity within the context of the carrying capacity of the system <strong>and</strong><br />
the natural assemblages of biota supported by that system in the absence of human disturbance.<br />
Progress in the MPI <strong>Biodiversity</strong> Programme is summarised in Figure 11.5.<br />
249
Progression of research<br />
underst<strong>and</strong>ing<br />
1. <strong>Review</strong> extent of<br />
knowledge of<br />
biodiversity (desktop)<br />
2. Identify & characterise<br />
species <strong>and</strong> habitat<br />
diversity (field work,<br />
qualitative analysis,<br />
taxonomy & systematics)<br />
3. Quantify biodiversity<br />
distribution, abundance<br />
(replication, purpose<br />
designed surveys)<br />
4. Model <strong>and</strong> predict<br />
biodiversity distribution<br />
<strong>and</strong> abundance<br />
5. Assess or measure<br />
functional processes in<br />
healthy marine<br />
ecosystems<br />
(experiments, process<br />
studies)<br />
6. Assess the role of<br />
genetic diversity<br />
7. Assess interactions <strong>and</strong><br />
connectivity on<br />
ecosystem scale,<br />
(genetics, modelling)<br />
8. Develop indicators <strong>and</strong><br />
measures to monitor<br />
bio-diversity,<br />
ecosystem health<br />
9. Define key risks <strong>and</strong><br />
threats to biodiversity<br />
10. Define st<strong>and</strong>ards for<br />
maintaining<br />
biodiversity <strong>and</strong> healthy<br />
ecosystem functioning<br />
11. Examine strategies to<br />
mitigate remedy or<br />
avoid threats to<br />
biodiversity<br />
12. Monitor risks <strong>and</strong><br />
compliance with<br />
st<strong>and</strong>ards<br />
Science<br />
objective †<br />
1-7<br />
1<br />
1<br />
1<br />
2, 3<br />
4<br />
2, 5<br />
6<br />
5, 7<br />
6<br />
6<br />
6<br />
AEBAR <strong>2012</strong>: Marine <strong>Biodiversity</strong><br />
Estuarine/<br />
Coastal 0-30 m<br />
250<br />
Shelf<br />
30-200 m<br />
Slope<br />
200-1500 m<br />
Deep/Abyss<br />
>1500 m<br />
Antarctica<br />
All depths<br />
Figure 11.5. Progress on biodiversity research commissioned by MPI 2000–2010. Dark grey: Significant progress<br />
(several projects completed <strong>and</strong> results emerging from research underway). Light grey: Limited progress (some<br />
results emerging, more research needed). White: no substantive research. Diagonal-hatch: progress linked to large<br />
whole-of-government projects (e.g. Ocean Survey 2020) <strong>and</strong>/or other funding outside MPI (e.g. MBIE (MSI) funded<br />
Outcome Based Investment projects, DOC Marine Coastal Services, MAFBNZ marine biosecurity research).<br />
†<br />
Science objectives are- 1 characterisation <strong>and</strong> description; 2 ecosystem scale biodiversity; 3 functional role of<br />
biodiversity; 4 genetics; 5 ocean climate effects; 6 indicators; 7 threats to biodiversity. The objectives are<br />
detailed in MPI <strong>Biodiversity</strong> Programme: Part 2. Medium Term Research Plan 2011-2014.<br />
The chart depicts a logical flow down the page of increasing conceptual complexity from cataloguing<br />
of biodiversity to increasingly complex underst<strong>and</strong>ing of environmental drivers <strong>and</strong> functionality of<br />
biodiversity; <strong>and</strong> ultimately methods to develop st<strong>and</strong>ards <strong>and</strong> protection of biodiversity. Across the
AEBAR <strong>2012</strong>: Marine <strong>Biodiversity</strong><br />
chart, the marine environment is graded from the coastline to offshore regions, <strong>and</strong> Antarctica. A full<br />
list of projects can be obtained from the MPI <strong>Biodiversity</strong> Medium Term research programme 2010-<br />
2014.<br />
Greatest progress has been made in the shallower inshore parts of the marine environment, not least<br />
because of cost <strong>and</strong> ease of access. However, by leveraging from existing offshore projects,<br />
significant progress has also been made to depths of 1500 m.<br />
MPI <strong>Biodiversity</strong> research based in Antarctica lags behind EEZ-based research, simply because of the<br />
difficulty in securing additional funding to access <strong>and</strong> work in such a remote <strong>and</strong> hostile marine<br />
environment. While the top left side of the figure shows the area of greatest progress, it would be a<br />
mistake to conclude that biodiversity work is completed here.<br />
11.3.1. Progress on Science Objective 1. Characterisation <strong>and</strong><br />
Classification of <strong>Biodiversity</strong><br />
The characterisation <strong>and</strong> classification of biodiversity requires an assessment of the abundance <strong>and</strong><br />
distribution of marine life. Building on earlier research to map fish <strong>and</strong> squid species (Anderson et al.<br />
1998, Bagley et al. 2000) <strong>and</strong> the biodiversity of the New Zeal<strong>and</strong> ecoregion (Arnold 2004), literature<br />
reviews, taxonomic studies <strong>and</strong> habitat mapping surveys have been undertaken.<br />
<strong>Review</strong>s <strong>and</strong> books<br />
The following lists scientific reviews <strong>and</strong> books on biodiversity that were commissioned by the<br />
programme:<br />
ZBD2000-01 A review of current knowledge describing the biodiversity of the Ross Sea<br />
region (Bradford-Grieve <strong>and</strong> Fenwick 2001, 2002; Fenwick <strong>and</strong> Bradford-Grieve 2002a,<br />
2002b, Varian 2005)<br />
ZBD2000-06 “The Living Reef: The Ecology of New Zeal<strong>and</strong>'s Rocky Reefs” (eds. Andrew<br />
<strong>and</strong> Francis 2003)<br />
ZBD2000-08 A review of current knowledge describing New Zeal<strong>and</strong>’s Deepwater Benthic<br />
<strong>Biodiversity</strong> (Key 2002),<br />
ZBD2000-09 Antarctic fish taxonomy (Roberts <strong>and</strong> Stewart 2001)<br />
ZBD2001-02 Documentation of New Zeal<strong>and</strong> Seaweed (Nelson et al. 2002)<br />
ZBD2001-04 “Deep Sea New Zeal<strong>and</strong>” (Batson 2003)<br />
ZBD2001-05 Crustose coralline algae of New Zeal<strong>and</strong> (Harvey et al. 2005, Farr et al. 2009,<br />
Broom et al. 2008)<br />
ZBD2001-06 <strong>Biodiversity</strong> of New Zeal<strong>and</strong>’s soft-sediment communities (Rowden et al.<br />
2011)<br />
ZBD2003-09 Macquarie Ridge Complex Research <strong>Review</strong> (Grayling 2004)<br />
ZBD2008-27 Scoping investigation into New Zeal<strong>and</strong> abyss <strong>and</strong> trench biodiversity (Lörz et<br />
al. <strong>2012</strong>).<br />
In addition a major work which includes marine species – “The New Zeal<strong>and</strong> Inventory of<br />
<strong>Biodiversity</strong>” (Gordon 2009, Gordon 2010, Gordon <strong>2012</strong>), has been completed. Field identification<br />
guides have also been published by MPI on deepsea invertebrates (–projects ENV2005-20 <strong>and</strong><br />
ZBD2010-39, Tracey et al. 2005, 2007, 2011), bryozoans (project IPA2009/14 Smith <strong>and</strong> Gordon<br />
2011) <strong>and</strong> on fish species (IDG2006-01 MacMillan et al. (2011 a, b, c) which further contribute to the<br />
accurate monitoring <strong>and</strong> identification of biodiversity in New Zeal<strong>and</strong> waters.<br />
Projects<br />
Several hundred new species of marine organisms have been discovered, <strong>and</strong> the known range of<br />
species extended, through exploratory surveys such as the NORFANZ project ZBD2002-16 (Clark<br />
251
AEBAR <strong>2012</strong>: Marine <strong>Biodiversity</strong><br />
<strong>and</strong> Roberts 2008); MSI’s Seamount Programme, mainly commissioned through public-good science,<br />
supplemented by MPI projects ZBD2000-04, e.g., Rowden et al. 2002 <strong>and</strong> 2003, ZBD2001-10<br />
(Rowden et. al 2004), ZBD2004-01 (Rowden et al. 2010) <strong>and</strong> MPI projects ENV2005-15, ENV2005-<br />
16 (Clark et al. 2010, Rowden et al. 2008) <strong>and</strong> the Ocean Survey 20/20 programme (Clark et al.<br />
2009); inshore surveys of bryozoans at Tasman Bay ZBD2000-03 (Grange et al. 2003); Farewell Spit,<br />
ZBD2002-18 (Battley et al. 2005), Fiordl<strong>and</strong>, ZBD2003-04 (Wing 2005); coralline algae ZBD2001-<br />
05, ZBD2004-07 (Harvey et al. 2005, Farr et al. 2009); soft sediment environments ZBD2003-08<br />
(Neill et al. 2011); rhodolith community study ZBD2009- 03 (Nelson et al. <strong>2012</strong>); offshore surveys of<br />
the Chatham Rise <strong>and</strong> Challenger Plateau funded through Ocean Survey 20/20 programme,<br />
ZBD2006-04 (Nodder 2008) <strong>and</strong> ZBD2007-01 (Nodder et al. 2011; Hewitt et al. 2011; Bowden 2011,<br />
Bowden <strong>and</strong> Hewitt <strong>2012</strong>; Bowden et al. 2011b; Bowden et al. in press).<br />
Research in the Ross Sea Region (BioRoss projects) have also generated records of new species<br />
including MPI projects ZBD2000-02 (Page et al. 2001), ZBD2001-03 (Norkko et al. 2002),<br />
ZBD2002-02 (Sewell et al. 2006, Sewell 2005, 2006), ZBD2003-02 (Cummings et al. 2003, 2006),<br />
ZBD2003-03 (Rowden et al. <strong>2012</strong>a, Rowden et al. in press), ZBD2005-03 (MacDiarmid <strong>and</strong> Stewart<br />
<strong>2012</strong>), ZBD2006-03 (Cummings et al. 2003, 2006; Norkko et al. 2002), ZBD2008-23 (Nelson et al.<br />
2010)<strong>and</strong> IPY2007-01 (Bowden et al. 2011a, Clark et al. 2010, Eakin et al. 2009, Hanchet, et al.<br />
2008a Hanchet 2008b, Hanchet 2008c, Hanchet et al. 2008d. Hanchet 2009, Hanchet 2010, Koubbi et<br />
al. in press, Lörz <strong>and</strong> Coleman 2009, Lörz in press, Lörz et al. in press, Mitchell 2008, O’Driscoll et<br />
al. 2009. O'Driscoll 2009, O’Driscoll, et al. 2010, O’Loughlin et al. 2010)<br />
Habitat diversity, classification <strong>and</strong> characterisation<br />
The development of the Marine <strong>Environment</strong> Classification or “MEC” (Snelder et al. 2006) was an<br />
important step in the delineation of areas with similar environmental attributes in the offshore<br />
environment. However, significant environmental drivers of variability in marine biodiversity, such as<br />
substrate type for seafloor organisms, were absent from the classification. In 2005, DOC <strong>and</strong> MPI<br />
jointly commissioned a project to optimise the MEC using fish distribution data. This project<br />
(ZBD2005-02) demonstrated a substantial improvement in the MEC classification for offshore<br />
habitats (Leathwick et al. 2006a, b, c). In 2006, three projects to map coastal biodiversity were<br />
completed in the Corom<strong>and</strong>el scallop, Foveaux Strait oyster <strong>and</strong> southern blue whiting fisheries as<br />
part of fishery plan development for these fisheries (ZBD2005-04, ZBD2005-15, ZBD2005-16).<br />
These projects found that the biological distribution of organisms <strong>and</strong> their habitats were not well<br />
predicted by the MEC. MPI project (BEN2006-01) aimed to further optimise the MEC by producing a<br />
methodology for a Benthic Optimised MEC (Leathwick et al. 2009).MPI Ecological studies to<br />
improve habitat classification <strong>and</strong> vulnerability indices have also been completed through MPI<br />
AEWG projects on seamounts (ENV2005-15, ENV2005-16) (e.g., Clark et al. 2010), <strong>and</strong> to<br />
supplement other studies funded by MPI, <strong>and</strong> MSI (e.g. ZBD2004-01, ZBD2001-10, ZBD2000-04,<br />
<strong>and</strong> CO1X0508).<br />
Distribution maps providing indicative abundance <strong>and</strong> characterisation of biodiversity are now<br />
emerging <strong>and</strong> have been produced through projects using predictive modelling tools e.g., Compton et<br />
al. <strong>2012</strong>; the fish optimised MEC in project ZBD2005-02 (Leathwick et al. 2006a, 2006b, 2006c), the<br />
benthic optimised MEC (Leathwick et al. 2009) <strong>and</strong> Chatham-Challenger project ZBD2007-01<br />
(Hewitt et al. 2011, Bowden et al. <strong>2012</strong>, Compton et al. in press).<br />
Progress has advanced considerably in recent years with the introduction of the whole-of-government<br />
Ocean Survey 20/20 Programme <strong>and</strong> Biosecurity New Zeal<strong>and</strong> mapping projects (Beaumont et al.<br />
2008, 2010) In addition, MPI implemented spatial management tools (Benthic Protection Areas 54 )<br />
implemented on the basis of the Marine <strong>Environment</strong> Classification 55 56 to address broader statutory<br />
responsibilities on the environmental effects of fishing on biodiversity.<br />
54 www.fish.govt.nz/en-nz/<strong>Environment</strong>al/Seabed+Protection+<strong>and</strong>+Research/Benthic+Protection+Areas.htm<br />
55 Marine <strong>Environment</strong>al Classification. (2005). Can be viewed online at<br />
http://www.mfe.govt.nz/publications/ser/marine-environment-classification-jun05/index.html<br />
252
AEBAR <strong>2012</strong>: Marine <strong>Biodiversity</strong><br />
ZBD2007-01 Chatham-Challenger seabed habitats-post voyage analyses.<br />
This large project has been completed. Progress for each objective is as follows:<br />
1. To count, measure, <strong>and</strong> identify to species level (where possible, otherwise to genus) all<br />
macro invertebrates (>2 mm) <strong>and</strong> fish collected during Oceans Survey 20/20 voyages.<br />
Completed (Figure 6, Bowden 2011).<br />
2. To count, measure <strong>and</strong> identify to species-level (where possible, otherwise to genus or family)<br />
all meiofauna (>45μm to
AEBAR <strong>2012</strong>: Marine <strong>Biodiversity</strong><br />
Survey 20/20 samples. Completed. (Bowden et al.in press, Bowden et al 2011b, Compton et<br />
al <strong>2012</strong>).<br />
15. To assess the extent to which the 2005 MEC <strong>and</strong> subsequent variants can provide costeffective,<br />
reliable means of assessing biodiversity at the scale of the Oceans 20/20 surveys.<br />
Completed. (Bowden et al. 2011b).<br />
16. Collating all information <strong>and</strong> analysis from all objectives, devise a series of statistically<br />
supported recommendations for surveying marine biodiversity in the future. This should<br />
include, but may not be limited to, statistical analyses <strong>and</strong> modelling. Bowden <strong>and</strong> Hewitt<br />
2011).<br />
ZBD2008-05 Macroalgal diversity associated with soft sediment habitats.<br />
Although macroalgae normally require hard substrata for attachment <strong>and</strong> occur less frequently<br />
in soft sediment environments they contribute to biodiversity in a range of soft sediment<br />
environments providing structural complexity, modifying flow <strong>and</strong> sediment regimes, <strong>and</strong><br />
contributing to productivity. Soft sediment habitats where macroalgae are found are<br />
physically highly diverse, ranging from harbours <strong>and</strong> estuaries (with varying sediment types<br />
<strong>and</strong> sizes, freshwater influence, tidal flushing, current flows), to coarse stabilised sediments<br />
(shell fragments, cobbles, coarse gravels), <strong>and</strong> biogenic habitats such as worm tubes, horse<br />
mussel beds, brachiopod beds, mangrove forests, rhodolith (maerl) beds <strong>and</strong> seagrass<br />
meadows.<br />
The state of knowledge of macroalgal diversity, distribution <strong>and</strong> abundance is poor, <strong>and</strong> there<br />
are few examples of targeted collecting programmes for macroalgal assemblages, particularly<br />
in soft sediment habitats. This research conducted (a) a targeted collection programme across<br />
diverse soft sediment environments to develop a permanent reference collection of<br />
representative macroalgae, <strong>and</strong> (b) examined algal distribution in soft sediment habitats in<br />
relation to selected environmental variables.<br />
Macroalgal sampling trips to Kaipara (1), Whangarei (3) <strong>and</strong> Otago (4) Harbours were<br />
completed. Further sampling trips were planned for 2010, however, no further collections will<br />
be made in Kaipara Harbour. Approximately 2400 collections of algae were made from soft<br />
sediments in these harbours. In Whangarei <strong>and</strong> Otago Harbours, collections were made from a<br />
range of soft sediment habitats including mud, s<strong>and</strong>, shell gravel, sea grass, scallop, pipi <strong>and</strong><br />
horse mussel beds. At each site algae were collected opportunistically, quantitatively (i.e. by<br />
quadrats), or by both methods. St<strong>and</strong>ard ecological methods (e.g. species area curves, count<br />
frequencies) were used to assess the appropriateness of the methods.<br />
A database was developed for information about specimens <strong>and</strong> collection sites. Information<br />
was gathered on environmental variables within the target harbours. Identified algal<br />
distributions were analysed relative to these environmental variables.<br />
Collections were made from three harbours with the primary focus on Whangarei <strong>and</strong> Otago<br />
Harbours where seasonal sampling programmes were conducted in spring <strong>and</strong> in autumn. In<br />
the Kaipara Harbour sampling was conducted only in spring. Two hundred <strong>and</strong> forty four taxa<br />
sampled from intertidal <strong>and</strong> subtidal sites <strong>and</strong> a range of habitats: 146 (112 spring, 102<br />
autumn) from Whangarei, 43 Kaipara, 150 (107 spring, 115 autumn) from Otago. Diversity<br />
indices indicate that the collecting was not saturated <strong>and</strong> predict that there is higher diversity<br />
of macroalgae in these harbours than found in the samples obtained.<br />
The flora composition in the harbours was found to differ markedly e.g., only 67 taxa (45%)<br />
of the Whangarei flora were found to be in common with Otago Harbour collections; 17 taxa<br />
(39% ) of the Kaipara flora was in common with the Otahgo flora, in common (39% of K<br />
found in O); 27 taxa (63%) of the Kaipara flora was also found in Whangarei.19 nonindigenous<br />
species were found in the harbours, including two new records for the New<br />
254
AEBAR <strong>2012</strong>: Marine <strong>Biodiversity</strong><br />
Zeal<strong>and</strong> algal flora (confirmed by sequence data), Hypnea cornuta <strong>and</strong> Polysiphonia<br />
morrowii. In Whangarei Harbour 8 non-indigenous species were found (4 new records for<br />
harbour including Hypnea), in Kaipara Harbour 4 species were found including 2 new records<br />
for the harbour, <strong>and</strong> in Otago Harbour 11 non-indigenous species were found including 1 new<br />
record as well as P. morrowii. More taxa were collected in the subtidal (107) in Whangarei<br />
Harbour than in the intertidal (84), compared with Otago where numbers of intertidal taxa<br />
(120) exceeded the subtidal taxa collected (83).<br />
Two methods were employed to enable high resolution sampling <strong>and</strong> these provided differing<br />
outcomes in the two main harbours sampled, clearly indicating that there was value in<br />
collecting by both methods in order to adequately sample the diversity: Whangarei Harbour<br />
90 taxa were collected in quadrat sampling compared with 118 taxa via opportunistic<br />
collections, <strong>and</strong> in the Otago Harbour 107 taxa were collected in quadrat sampling <strong>and</strong> 118<br />
taxa via opportunistic collections.<br />
ZBD2008-27 <strong>Review</strong> of deep-sea benthic biodiversity associated with trench, canyon <strong>and</strong> abyssal<br />
habitats below 1500 m depth in New Zeal<strong>and</strong> waters<br />
The state of knowledge of benthic biodiversity <strong>and</strong> ecosystem functioning in deep-sea<br />
abyssal, canyon <strong>and</strong> trench habitats in the New Zeal<strong>and</strong> Exclusive Economic Zone <strong>and</strong> the<br />
Ross Sea region, was summarised <strong>and</strong> recommendations for future deep-sea research in<br />
depths exceeding 1500 m were made. All biological information in scientific papers <strong>and</strong><br />
reports from New Zeal<strong>and</strong> below 1500 m was reviewed <strong>and</strong> an exhaustive search of multiple<br />
data sources was conducted.<br />
The area of the deep seafloor below 1500 m covers more than 65% of New Zeal<strong>and</strong>‘s<br />
Exclusive Economic Zone. A total of 1489 benthic gear deployments have been conducted by<br />
New Zeal<strong>and</strong>-based sampling initiatives since 1955, most of which were focused on obtaining<br />
geological samples. Less than 0.002 % of New Zeal<strong>and</strong>‘s deep-sea environment (i.e. in terms<br />
of seabed area) below 1500 m has been sampled. All taxonomy-based studies of all taxa<br />
reported in New Zeal<strong>and</strong> waters below 1500 m have been reviewed. To date, 8 species of<br />
Bacteria, 293 species of Protozoa, 785 species of invertebrates, <strong>and</strong> 56 fish species have been<br />
recorded from water depths greater than 1500 m.<br />
More than 8000 images are known to have been taken of the seafloor below 1500 m in the<br />
New Zeal<strong>and</strong> region, covering an area of approximately 0.016 km2. Over 4000 of the images<br />
held at NIWA exist either as paper prints or negatives <strong>and</strong> ideally should be digitised for<br />
future storage <strong>and</strong> access for analyses. Analysis of these photographic images should yield<br />
considerable information about deep-sea biodiversity <strong>and</strong> ecosystem function in the New<br />
Zeal<strong>and</strong> region <strong>and</strong> could be used to answer a number of research questions (especially<br />
around deep-sea benthic biodiversity).<br />
Recommendations on how to potentially further analyse existing data from images, databases<br />
<strong>and</strong> actual specimens were provided. The technical challenges, including gear requirements to<br />
sample deep-sea New Zeal<strong>and</strong> benthos <strong>and</strong> potential future investments, were summarised.<br />
(see Coleman <strong>and</strong> Lörz 2010; Lörz 2011a, 2011b; Lörz et al. <strong>2012</strong>a, <strong>2012</strong>b).<br />
ZBD2008-50 Chatham Rise biodiversity hotspots.<br />
This survey covered the “Graveyard Seamount Complex” <strong>and</strong> “Andes Seamount Complex”<br />
on the Chatham Rise. Objectives were to monitor changes over time on Graveyard hills<br />
subject to differing management regimes (some open to fishing, some closed), as well as to<br />
compare seamount biodiversity between different regions of the Rise. It was linked to the<br />
CoML CenSeam programme, <strong>and</strong> the former FRST Seamounts research, now under the<br />
MBIE Vulnerable Deep-sea Communities project. The data from that survey are being<br />
255
AEBAR <strong>2012</strong>: Marine <strong>Biodiversity</strong><br />
worked up under the latter project (see Clark et al. 2009).). Analyses comparing the 3 surveys<br />
of the Graveyard complex between 2001 <strong>and</strong> 2009 indicate there are changes in some taxa<br />
following cessation of fishing operations on one of the features in 2001, but little sign of any<br />
recovery of stony coral species <strong>and</strong> associated benthic communities . Preliminary results were<br />
presented at the <strong>2012</strong> Deep Sea Biology Symposium (Clark et al. <strong>2012</strong>).<br />
ZBD2009-03 The vulnerability of rhodoliths to environmental stressors <strong>and</strong> characterisation of<br />
associated biodiversity.<br />
Rhodoliths are free-living calcified red algae. They occur worldwide, forming structurally <strong>and</strong><br />
functionally complex benthic marine habitats. Rhodolith beds form a unique ecosystem with a<br />
high benthic biodiversity supporting many species, including some that are rare <strong>and</strong> unusual.<br />
Recent international studies show that these fragile algae are at risk from the impacts of a range<br />
of human activities e.g., physical disruption, reduction in water quality, alterations to water<br />
movement, <strong>and</strong> aquaculture installations. Impacts of fragmentation may be critical in terms of<br />
biodiversity <strong>and</strong> abundance associated with rhodolith beds.<br />
The focus of this programme was to improve knowledge about the location, extent or ecosystem<br />
functioning of rhodolith beds in New Zeal<strong>and</strong>. The ecology of subtidal rhodolith beds was<br />
been investigated for the first time in New Zeal<strong>and</strong>, characterising two rhodolith species,<br />
Lithothamnion crispatum <strong>and</strong> Sporolithon durum, examining the structure <strong>and</strong> physical<br />
characteristics of beds at two locations <strong>and</strong> documenting their associated biodiversity. In<br />
addition the responses of these rhodolith species to environmental stressors were investigated<br />
for the first time.<br />
This study documented high biodiversity in two subtidal rhodolith beds sited in relatively<br />
close proximity in the coastal zone, with significant differences in biotic composition. The<br />
rhodolith beds studied (located in the Bay of Isl<strong>and</strong>s) differed significantly in terms of water<br />
motion, sediment characteristics <strong>and</strong> light levels. <strong>Biodiversity</strong> of the rhodolith beds was<br />
investigated sampling (1) invertebrates at three levels of association (epifauna, infauna,<br />
cryptofauna), (2) macroalgae, (3) fishes, as well as recording the biogenic <strong>and</strong> non-biogenic<br />
substrates:<br />
• a number of undescribed taxa were discovered as well as new records for the<br />
New Zeal<strong>and</strong> region, <strong>and</strong> range extensions of species known elsewhere,<br />
• more than double the number of invertebrate taxa were present in the rhodolith<br />
beds than found outside the beds,<br />
• both rhodolith beds harboured high diversity of associated macroalgae <strong>and</strong><br />
invertebrates but with markedly different species composition,<br />
• the floral <strong>and</strong> faunal composition differed significantly between sites.<br />
Both species of rhodolith were found to be vulnerable to the impacts of increasing<br />
temperature <strong>and</strong> decreasing pH. There was a significant difference between the effects of<br />
treatments on the two species <strong>and</strong> further statistical analysis showed significant interaction<br />
between temperature <strong>and</strong> pH level on growth. Overall the greatest effect on growth rate came<br />
with the combination of high temperature (25° C) <strong>and</strong> low pH (7.65) on Lithothamnion<br />
crispatum which showed negative growth, indicating probable dissolution. In experiments<br />
investigating other environmental stressors, temperature was found to be more important for<br />
the survival <strong>and</strong> growth of the rhodolith species examined than the effects of burial, light <strong>and</strong><br />
fragmentation.<br />
The extent of rhodolith beds in other parts of the New Zeal<strong>and</strong> region remain to be<br />
documented, including those in coastal areas (including intertidal beds) <strong>and</strong> subtidal beds on<br />
the shelf.<br />
256
AEBAR <strong>2012</strong>: Marine <strong>Biodiversity</strong><br />
ZBD2010-40 Predictive modelling of the distribution of vulnerable marine ecosystems in the South<br />
Pacific Ocean region.<br />
In January 2010 New Zeal<strong>and</strong> <strong>and</strong> the United States held their second Joint Commission<br />
meeting (JCM) on Scientific <strong>and</strong> Technological Cooperation. The meeting was to share<br />
knowledge about common interests <strong>and</strong> capabilities <strong>and</strong> identify areas for future<br />
collaboration. The JCM consisted of six workshops held simultaneously around the North<br />
Isl<strong>and</strong> <strong>and</strong> an officials meeting held in Wellington. One of the six workshops, ocean <strong>and</strong><br />
marine sciences, identified an area of interest in a joint project in the South Pacific Regional<br />
Fisheries Management Organisation (SPRFMO) area to map <strong>and</strong> groundtruth vulnerable<br />
marine ecosystem (VME) distribution.<br />
The 3rd New Zeal<strong>and</strong> <strong>and</strong> United States Joint Commission on Science <strong>and</strong> Technology<br />
Cooperation (JCM) met on 19 <strong>and</strong> 20 September <strong>2012</strong> in Washington. Building on several<br />
recommendations from the previous JCM (held in January 2010), <strong>and</strong> on the Marine<br />
Conservation Think Tank VME Workshop report 3: Science requirements for effective High<br />
Seas governance, held on 2-5 December 2011 (Lundquist et al <strong>2012</strong>) 1, Topic 1 for the<br />
Oceans <strong>and</strong> Marine Workshop <strong>and</strong> the 3rd JCM meeting was again Vulnerable Marine<br />
Ecosystems (VMEs). Several actions were developed at the workshop <strong>and</strong> these included:<br />
‘Increase in situ deep-sea exploration <strong>and</strong> VME studies in regions of common interest by<br />
exploring options for NOAA/WHOI participation (including use of ROV/AUV technologies)<br />
in New Zeal<strong>and</strong> funded initiative <strong>and</strong> voyage to explore <strong>and</strong> ground-truth VMEs in the South<br />
Pacific’ <strong>and</strong> ‘Facilitate U.S. researcher involvement in NIWA Louisville Ridge Exploration.’<br />
There are relatively few data available on the distribution of VME species or taxa in the South<br />
Pacific Ocean (Parker et al. 2009) although studies have been conducted in Antarctica<br />
(Tracey et al. 2010, Parker et al. 2009) to use for the objective planning of spatial protection<br />
measures to protect those taxa, particularly in the SPRFMO Area. It is therefore becoming<br />
increasingly important to develop robust predictions of where VMEs are likely to occur, using<br />
habitat prediction <strong>and</strong> species distribution models. Such models have recently been developed<br />
<strong>and</strong>/or are in the process of being refined for certain VME taxa on a global scale (e.g.<br />
Actinaria, Guinotte et al. 2006; Scleractinia, Tittensor et al. 2009). However, the spatial<br />
resolution of existing models is coarse (larger than the scale of the topographic features<br />
typically targeted during demersal high seas fishing), <strong>and</strong> the level of uncertainty around the<br />
predictions is variable or still unknown.<br />
Phase 1 a project to use modelling to predict the location of VMEs in the SPRFMO area was<br />
initiated between the US <strong>and</strong> New Zeal<strong>and</strong> (ZBD2010-40) <strong>and</strong> has now been completed. The<br />
objectives of the project were to:<br />
1. To develop <strong>and</strong> test spatial habitat modelling approaches for predicting distribution<br />
patterns of vulnerable marine ecosystems in the Convention Area of the South Pacific<br />
Regional Fisheries Management Organisation with agreed international partners.<br />
2. To collate data sets <strong>and</strong> evaluate modelling approaches which are likely to be useful<br />
to predict the distribution of vulnerable marine ecosystems in the South Pacific Ocean<br />
region.<br />
Data for ten Vulnerable Marine Ecosystems (VME) taxa were compiled from different data<br />
sources to produce a single groomed dataset for VME indicator taxa in the New Zeal<strong>and</strong><br />
region. Regional-tuned environmental data layers <strong>and</strong> global environmental data layers were<br />
obtained from available data sources. Using these data, three types of predictive models were<br />
made for each VME indicator taxon. Two models were made using regional-tuned<br />
environmental data layers, using maximum entropy analysis (MaxEnt) <strong>and</strong> boosted regression<br />
tree (BRT) techniques to provide a comparison of the different model approaches. The third<br />
type of model made used the MaxEnt approach, but using globally available environmental<br />
257
AEBAR <strong>2012</strong>: Marine <strong>Biodiversity</strong><br />
data layers. Having a third model meant that model performance could be compared based on<br />
the use of different environmental data layers. Three model types for all VME taxa have been<br />
completed <strong>and</strong> the performance of the different modelling approaches <strong>and</strong> usefulness of the<br />
environmental data sets described.<br />
The next phases of the project will be undertaken as part of a MBIE-funded project that will<br />
revise models that predict the sites of Vulnerable Marine Ecosystems from existing data by<br />
conducting a ground truthing survey of benthic biodiversity on the Lewisville Ridge in<br />
2013/14 (Ministry of Business Innovation <strong>and</strong> Employment project code C01X1229). This<br />
will be used to inform New Zeal<strong>and</strong> <strong>and</strong> South Pacific Regional Fisheries Management<br />
Organisation initiatives on spatial management in the South Pacific region, <strong>and</strong> potentially the<br />
New Zeal<strong>and</strong> EEZ.<br />
Other research relevant or specifically linked to the projects above, is listed in Table 11.1.<br />
Table 11.1: Other research linked to Objective 1 habitat classification <strong>and</strong> characterisation.<br />
MPI HAB2007-01 Biogenic habitats as areas of particular significance for fisheries<br />
management<br />
ZBD2006-02 NABIS ongoing development<br />
Useful data related to defining potential VMEs are collected by MPI scientific fisheries<br />
observers working on NZ authorised fishing vessels that operate on the high seas in the<br />
South Pacific.<br />
CRI core C01X501 Coasts & oceans Centre (NIWA) ecosystem based management, habitat model<br />
purpose development with Auckl<strong>and</strong> Regional Council<br />
funding C01X0907 Coastal Conservation Management (fish habitat classification)<br />
DOC<br />
(NIWA)C01X502 <strong>Biodiversity</strong> & Biosecurity (NIWA)<br />
C01X0508 Seamount fisheries (linking acoustic backscatter to habitat type <strong>and</strong> biota)<br />
(NIWA)<br />
CO1X0906 Vulnerable deep-sea communities (mapping <strong>and</strong> sampling a range of deep-sea<br />
habitats (seamounts, slope, canyons, seeps, vents) (NIWA)<br />
CO1X0702 Kermadec Arc minerals (mapping <strong>and</strong> sampling the biodiversity of several<br />
Kermadec Arc seamounts) (NIWA)<br />
MEC development <strong>and</strong> application to MPAs, Regional surveys<br />
OTHER University studies, Regional Council studies<br />
ZBD2010-40 Mapping VMEs in the SPRFMO area Part 1. Predictive modelling desktop study<br />
EMERGING ISSUES<br />
What portion of a given habitat type should remain intact to support sustainable ecosystems?<br />
What are the most effective predictive tools for predicting biodiversity in areas as yet unsampled?<br />
Can ecological mapping used in OS20/20 projects to date be extended to other areas of New Zeal<strong>and</strong>?<br />
11.3.2. Progress on Science Objective 2. Ecosystem-scale research<br />
Marine ecosystems influence, <strong>and</strong> are influenced by, a wide array of oceanic, climatic, <strong>and</strong> ecological<br />
processes across a broad range of spatial <strong>and</strong> temporal scales. Marine communities are generally<br />
dynamic, can occur over large areas <strong>and</strong> have strong links to other communities through processes<br />
such as migration <strong>and</strong> long-distance physical transport (e.g. of larvae, nutrients, <strong>and</strong> biomass).<br />
Patterns observed on a small scale can interact with larger <strong>and</strong> longer-scale processes that in turn<br />
result in large scale patterns. Marine food webs are usually complex <strong>and</strong> dynamic over time (Link<br />
1999). To distinguish useful descriptors of long-term ecosystem change from short-term fluctuations<br />
requires innovative approaches to integrate broad-scale correlative studies from smaller scale<br />
manipulative experiments (Hewitt et al. 1998, 2007).<br />
Recent theoretical <strong>and</strong> technical advances show great promise toward the goal of underst<strong>and</strong>ing the<br />
role of biodiversity in ecosystems. Technologies for remote sensing <strong>and</strong> deepwater surveying,<br />
combined with powerful integrative <strong>and</strong> interpretive tools such as GIS, climate modelling, qualitative<br />
ecosystem modelling, <strong>and</strong> trophic ecosystem modelling, will contribute to the development of an<br />
258
AEBAR <strong>2012</strong>: Marine <strong>Biodiversity</strong><br />
ecosystem-based approach to management (Thrush et al. 1997, 2000), with potential benefits for<br />
marine conservation <strong>and</strong> management. Ecosystem modelling of species distribution (<strong>and</strong> habitats)<br />
with respect to known <strong>and</strong> projected environmental parameters will improve predictability for both<br />
broad <strong>and</strong> fine-scale biodiversity distribution. This has already resulted in improved definition of<br />
environmental classifications addressing biodiversity assessment. It is also important to make<br />
progress in establishing the links between biodiversity <strong>and</strong> the long-term viability of fish stocks under<br />
various harvesting strategies. It is also important that modellers consider processes from all ecosystem<br />
function perspectives i.e., top-down effects such as predation (e.g. trophic modelling), bottom-up<br />
effects such as the environment (e.g., habitat classification based on environmental variable), <strong>and</strong><br />
wasp-waisted systems where there are major effects in both directions.<br />
Projects<br />
ZBD2002-06A: Impacts of terrestrial run-off on the biodiversity of rocky reefs Completed.<br />
(Schwarz et al. 2006).<br />
ZBD2004-02: Ecosystem scale trophic relationships of fish on the Chatham Rise. Completed.<br />
(Connell et al. 2010, Dunn 2009, Dunn et al. in press, Dunn et al. 2010a, b, c, Eakin et al.<br />
2009, Forman <strong>and</strong> Dunn 2010, Horn et al. 2010, Stevens <strong>and</strong> Dunn 2010. Follow-up research<br />
on isotope signatures to improve the trophic data from ZBD2004-02 has been incorporated<br />
into the NIWA’s Coast <strong>and</strong> Ocean programme <strong>and</strong> trophic modelling is underway in this<br />
programme.<br />
ZBD2004-08 Sea-grass meadows as biodiversity <strong>and</strong> connectivity hotspots.<br />
This contract links closely with the MBIE project Coastal Conservation Management<br />
(CO1X0907). National scale sampling across North <strong>and</strong> South Isl<strong>and</strong> seagrass meadows in a<br />
range of estuarine <strong>and</strong> coastal settings has shown that seagrass meadows overall consistently<br />
supported higher species richness, biomass, <strong>and</strong> productivity of invertebrates (infaunal <strong>and</strong><br />
epifaunal). Associated sampling of small fish assemblages found that while seagrass meadows<br />
provided a nursery function to a number of species, this function was most pronounced in<br />
northern New Zeal<strong>and</strong> systems, where relatively high numbers of juvenile snapper, trevally,<br />
spotties, parore, <strong>and</strong> garfish/piper were caught. However, there was strongly spatial variation<br />
across different estuary <strong>and</strong> coast settings (MBIE91B).<br />
ZBD2004-19 Ecological function <strong>and</strong> critical trophic linkages in New Zeal<strong>and</strong> softsediment<br />
habitats. Project completed. (see Lohrer et al. 2010.)<br />
ZBD2005-05 Effects of climate variation <strong>and</strong> human impacts on the structure <strong>and</strong> functioning of<br />
New Zeal<strong>and</strong> shelf ecosystems.<br />
The project is a multidisciplinary study to utilise archeological, paleoecological, <strong>and</strong> historical<br />
data to retrospectively model ecosystem states during different historical <strong>and</strong> prehistoric time<br />
periods. The project is collaborating with the international History of Marine Animal<br />
Populations (HMAP) project, itself a part of the Census of Marine Life (CoML) programme.<br />
The data have been used as inputs to a mass balance model of the shelf ecosystem starting<br />
with the present day Hauraki Gulf. A short video about the NZ Taking Stock project was<br />
made by HMAP staff <strong>and</strong> is currently available on the HMAP website<br />
http://hmapcoml.org/projects/nz/. Several presentations have been made at NZ <strong>and</strong><br />
international conferences as results have emerged.<br />
ZBD2008-01 Inshore biogenic habitats.<br />
Existing knowledge on biogenic habitat-formers in the
AEBAR <strong>2012</strong>: Marine <strong>Biodiversity</strong><br />
Over 600 targets of interest were identified <strong>and</strong> marked on marine charts, with more than 200<br />
of these targets being biogenic in nature. Fieldwork has been completed to verify <strong>and</strong> quantify<br />
biodiversity in biogenic habitats using Ocean Survey 20/20 vessel days on Tangaroa <strong>and</strong> a<br />
new MSI project to extend the survey potential of the project. New biogenic habitats have<br />
been identified, including extensive worm tube ‘meadows’ off the east coast of the South<br />
Isl<strong>and</strong> (“the Hay Paddock” <strong>and</strong> “Wire-weed”), with associated relatively high epi-faunal<br />
invertebrate diversity compared to adjacent bare sediments. Over 60 new species were also<br />
collected (dominated by sponges), along with range extensions of many other species.<br />
Analyses are underway for key selected areas included in the Tangaroa voyages, including<br />
offshore North Taranaki Bight, Ranfurly Bank, the polychaete meadows mentioned above,<br />
<strong>and</strong> the Otago Peninsula bryozoan fields.<br />
IPA2009-11. Trophic <strong>Review</strong>.<br />
This project publishes a report prepared on the feeding habits of New Zeal<strong>and</strong> fishes 1960 to<br />
2000 (Stevens et al. 2011)<br />
Other research relevant or specifically linked to the projects above, is listed in Table 11.2.<br />
Table 11.2: Other research linked to ecosystem scale underst<strong>and</strong>ing of biodiversity in the marine environment.<br />
MPI ENV2006-04 Ecosystem indicators for New Zeal<strong>and</strong> fisheries<br />
ENV2007-04 Climate <strong>and</strong> oceanographic trends relevant to New Zeal<strong>and</strong> fisheries<br />
ENV2007-06 Trophic relationships of commercial middle depth species on the Chatham Rise<br />
CRI Core C01X501 coasts & oceans productivity plankton-mesopelagic fish trophic relations Chatham Rise<br />
purposes IO 2. Second Fisheries Oceanography voyage to Chatham Rise: mesopelagics <strong>and</strong> hyperbenthics<br />
OTHER AUT deepsea <strong>and</strong> subtidal food web dynamics; offshore & coastal biodiversity post graduate<br />
studies<br />
11.3.3. Progress on Science Objective 3. The role of biodiversity in<br />
the functional ecology of nearshore <strong>and</strong> offshore communities.<br />
An identified outcome of the <strong>Biodiversity</strong> Strategy is that by 2020 “New Zeal<strong>and</strong>’s natural marine<br />
habitats <strong>and</strong> ecosystems are maintained in a healthy functioning state. Degraded marine habitats are<br />
recovering.” Sustaining ecosystem integrity in marine habitats requires a thorough underst<strong>and</strong>ing of<br />
the ecological <strong>and</strong> anthropogenic drivers affecting biodiversity <strong>and</strong> ecosystem function, <strong>and</strong> the ability<br />
to manage human impacts in marine environments.<br />
Near-shore environments range from wetl<strong>and</strong>s to estuaries, coasts <strong>and</strong> continental shelf ecosystems,<br />
they contain a variety of habitats <strong>and</strong> often contain species that are particularly important, either for<br />
cultural, recreational, <strong>and</strong> commercial reasons, or because the species exerts disproportionate<br />
influence on community structure <strong>and</strong> ecosystem function. Near-shore ecosystems are the multi-use<br />
ecosystems most subjected to multiple stressors. Due to ocean-coast <strong>and</strong> l<strong>and</strong>-coast interactions these<br />
ecosystems will be subjected to the greatest range of stresses associated with global warming. Nearshore<br />
environments may also contain habitats that are particularly important for biodiversity in other<br />
environments, for instance by providing larval/juvenile nursery areas or by exporting nutrients. The<br />
MPI <strong>Biodiversity</strong> Programme has directed funds into research examining the implications of<br />
environmental <strong>and</strong> human impacts on the functional ecology of these key species <strong>and</strong> habitats.<br />
Near-shore ecosystems are complex <strong>and</strong> changes in diversity <strong>and</strong> community composition may be<br />
driven by multiple variables. Interactions between variables are likely to be non-linear, with<br />
disturbance thresholds <strong>and</strong> the potential for multiple stable states. As a consequence, it is often<br />
difficult to distinguish ‘natural’ from ‘anthropogenic’ impacts affecting ecosystem dynamics. MPI<br />
260
AEBAR <strong>2012</strong>: Marine <strong>Biodiversity</strong><br />
BioInfo research seeks to help disentangle this complexity, recognising that there will be<br />
contributions to this from both biodiversity research <strong>and</strong> Fisheries Services research.<br />
Regional Councils <strong>and</strong> universities support some research projects <strong>and</strong> survey programmes in coastal<br />
<strong>and</strong> estuarine waters by investigating the effects of sedimentation, pollution, ocean outfalls, s<strong>and</strong><br />
dredge spoils, s<strong>and</strong> mining <strong>and</strong> nutrient enrichment on the marine ecosystem 58 . Although this<br />
workstream applies to offshore areas as well as near-shore, research to date has focussed on the nearshore.<br />
Projects<br />
ZBD2005-09 Rocky reef ecosystems - how do they function?<br />
The draft report for this project has been submitted <strong>and</strong> reviewed (Beaumont et al. In press).<br />
The Hauraki Gulf in north-eastern New Zeal<strong>and</strong> offers one of the best opportunities to<br />
investigate how rocky reef ecosystems function <strong>and</strong> what impact fishing <strong>and</strong> other human<br />
activities may have on them. This study took advantage of these circumstances to first review<br />
the extensive literature to set the parameters of a model of how north-eastern New Zeal<strong>and</strong> reef<br />
ecosystems function. The study used the model to identify key species <strong>and</strong> interactions, <strong>and</strong><br />
explore the impacts of fishing. Field work was then undertaken across the range of reefs within<br />
the Hauraki Gulf to test the model predictions, describe spatial variation in patterns of<br />
abundance of key species, determine trophic relationships <strong>and</strong> investigate the linkages of reefs<br />
to other habitats.<br />
A qualitative model of northeast New Zeal<strong>and</strong> rocky reef ecosystems was developed to explore<br />
the complexity of interactions amongst New Zeal<strong>and</strong> rocky reef species <strong>and</strong> the impacts of<br />
exploitation. This model was developed on the basis of a review <strong>and</strong> summary of interactions<br />
among reef components. A key modelling outcome was the highly predictive but opposite<br />
responses by small lobsters <strong>and</strong> large predatory invertebrates to changes in the abundance of a<br />
range of other groups. This suggests that these two groups are ideal c<strong>and</strong>idates as variables for<br />
monitoring reef ecosystem responses to perturbations. The modelling agreed with a welldocumented<br />
example of responses to a perturbation in fishing pressure in the Leigh Marine<br />
Reserve. However, the predictability was low for all responses. This implies, for example, that<br />
the reduction of kina in the Leigh Marine Reserve <strong>and</strong> the subsequent increase in macro-algae<br />
consequent to an increase in lobster abundance may not necessarily occur in another area.<br />
Field sampling at ten rocky reef sites across the Hauraki Gulf revealed differences among sites<br />
in community structure of macroalgae <strong>and</strong> invertebrates within all habitat strata. Of the<br />
environmental factors available, depth followed by a measure of water clarity (mean secchi)<br />
explained the most variation in the dependent variables (invertebrate taxa) from the quadrat<br />
data. Fish abundance data showed a similar, though weaker, trend across sites with depth,<br />
distance across the Gulf, <strong>and</strong> water clarity being the most important factors. The strong<br />
association between depth <strong>and</strong> water clarity <strong>and</strong> abundances of key taxa was expected <strong>and</strong> is<br />
similar to that found in earlier studies. With the exception of crayfish, there was no apparent<br />
overall relationship between invertebrate <strong>and</strong> fish abundances <strong>and</strong> marine reserve status of<br />
study sites, though the baited underwater video data showed snapper to be significantly larger<br />
within marine reserve sites than at fished sites.<br />
Stable isotope analysis of tissue samples collected from key species from all study sites allowed<br />
insight into the functional relationships among species as well as dietary sources of carbon.<br />
Many of the study taxa, from the primary producers through to the predators, had the most<br />
depleted δ 13 C values at the furthest inshore <strong>and</strong> offshore sites (e.g. Poor Knights <strong>and</strong> Long Bay)<br />
58 See MFish <strong>Biodiversity</strong> Research Programme 2010: Part 4. Reference Materials <strong>and</strong> Other research<br />
261
AEBAR <strong>2012</strong>: Marine <strong>Biodiversity</strong><br />
<strong>and</strong> the highest δ 13 C values at the coastal sites (e.g. Leigh, Tawharanui <strong>and</strong> Kawau). Without<br />
direct modelling of end point source signatures we cannot definitively determine the percentage<br />
contribution of each carbon source. However, we suggest that the depleted δ 13 C of taxa from<br />
offshore sites is the result of a pelagic source of C <strong>and</strong> the enriched δ 13 C at coastal sites is the<br />
result of a more benthic input of C than at offshore sites, with sources including kelp detritus.<br />
Taxa at the inner gulf sites are also likely to be subjected to a proportion of benthicaly-derived<br />
enriched δ 13 C. There were no obvious effects of marine reserve status on the isotopic signatures<br />
of study taxa with the exception of slightly enriched δ 13 C of kina <strong>and</strong> snapper at Leigh, <strong>and</strong> of<br />
kina at Tawharanui.<br />
Otolith microchemistry results for parore <strong>and</strong> snapper indicate strong connectivity between reef<br />
<strong>and</strong> non-reef systems within the wider Hauraki Gulf ecosystem. The majority of fishes<br />
sampled (both species) were likely to have originated as juveniles from lower salinity water<br />
environments such as estuaries fringing the Gulf. For snapper, our data suggest that only a<br />
small percentage of juveniles derive from reefs themselves. However, greater sampling<br />
replication is now required across a range of reef sites to better define the ratio of reef- versus<br />
estuary-derived juveniles, given the low percentage of reef-derived snapper.<br />
A qualitative model of northeast New Zeal<strong>and</strong> rocky reef ecosystems was developed to explore<br />
the complexity of interactions amongst New Zeal<strong>and</strong> rocky reef species <strong>and</strong> the impacts of<br />
exploitation. This model was developed on the basis of a review <strong>and</strong> summary of interactions<br />
among reef components. A key modelling outcome was the highly predictive but opposite<br />
responses by small lobsters <strong>and</strong> large predatory invertebrates to changes in the abundance of a<br />
range of other groups. This suggests that these two groups are ideal c<strong>and</strong>idates as variables for<br />
monitoring reef ecosystem responses to perturbations. The modelling agreed with a well<br />
documented example of responses to a perturbation in fishing pressure in the Leigh Marine<br />
Reserve. However, the predictability was low for all responses. This implies, for example, that<br />
the reduction of kina in the Leigh Marine Reserve <strong>and</strong> the subsequent increase in macro-algae<br />
consequent to an increase in lobster abundance may not necessarily occur in another area.<br />
Field sampling at ten rocky reef sites across the Hauraki Gulf revealed differences among sites<br />
in community structure of macroalgae <strong>and</strong> invertebrates within all habitat strata. Of the<br />
environmental factors available, depth followed by a measure of water clarity (mean secchi)<br />
explained the most variation in the dependent variables (invertebrate taxa) from the quadrat<br />
data. Fish abundance data showed a similar, though weaker, trend across sites with depth,<br />
distance across the Gulf, <strong>and</strong> water clarity being the most important factors. The strong<br />
association between depth <strong>and</strong> water clarity <strong>and</strong> abundances of key taxa was expected <strong>and</strong> is<br />
similar to that found in earlier studies. With the exception of crayfish, there was no apparent<br />
overall relationship between invertebrate <strong>and</strong> fish abundances <strong>and</strong> marine reserve status of<br />
study sites, though the baited underwater video data showed snapper to be significantly larger<br />
within marine reserve sites than at fished sites.<br />
Stable isotope analysis of tissue samples collected from key species from all study sites allowed<br />
insight into the functional relationships among species as well as dietary sources of carbon.<br />
Many of the study taxa, from the primary producers through to the predators, had the most<br />
depleted δ 13 C values at the furthest inshore <strong>and</strong> offshore sites (e.g. Poor Knights <strong>and</strong> Long Bay)<br />
<strong>and</strong> the highest δ 13 C values at the coastal sites (e.g. Leigh, Tawharanui <strong>and</strong> Kawau). Without<br />
direct modelling of end point source signatures we cannot definitively determine the percentage<br />
contribution of each carbon source. However, we suggest that the depleted δ 13 C of taxa from<br />
offshore sites is the result of a pelagic source of C <strong>and</strong> the enriched δ 13 C at coastal sites is the<br />
result of a more benthic input of C than at offshore sites, with sources including kelp detritus.<br />
Taxa at the inner gulf sites are also likely to be subjected to a proportion of benthicaly-derived<br />
enriched δ 13 C. There were no obvious effects of marine reserve status on the isotopic signatures<br />
of study taxa with the exception of slightly enriched δ 13 C of kina <strong>and</strong> snapper at Leigh, <strong>and</strong> of<br />
kina at Tawharanui.<br />
262
AEBAR <strong>2012</strong>: Marine <strong>Biodiversity</strong><br />
Otolith microchemistry results for parore <strong>and</strong> snapper indicate strong connectivity between reef<br />
<strong>and</strong> non-reef systems within the wider Hauraki Gulf ecosystem. The majority of fishes<br />
sampled (both species) were likely to have originated as juveniles from lower salinity water<br />
environments such as estuaries fringing the Gulf. For snapper, our data suggest that only a<br />
small percentage of juveniles derive from reefs themselves. However, greater sampling<br />
replication is now required across a range of reef sites to better define the ratio of reef- versus<br />
estuary-derived juveniles, given the low percentage of reef-derived snapper.<br />
ZBD2008-07 Carbonate Sediments: The positive <strong>and</strong> negative effects of l<strong>and</strong>-coast interactions on<br />
functional diversity (complete):<br />
L<strong>and</strong>-coast interactions can profoundly influence coastal biodiversity <strong>and</strong> ecosystem function.<br />
Estuarine primary productivity derived from phytoplankton, resuspended phytobenthos, aquatic<br />
vegetation <strong>and</strong> fringing habitat plant material is exported to the adjacent coast on outgoing tides<br />
<strong>and</strong> contributes to secondary production in the vicinity of the estuary mouth. However, l<strong>and</strong>derived<br />
sediments <strong>and</strong> contaminants that are discharged from estuaries can also stress open<br />
coastal populations. The balance of these competing processes was evaluated using a<br />
combination of laboratory <strong>and</strong> field investigations. A survey of two coastal locations (outside<br />
Whangapoua <strong>and</strong> Tairua harbours on the Corom<strong>and</strong>el Peninsula, New Zeal<strong>and</strong>) quantified<br />
shifts in community structure in mollusc-dominated habitats <strong>and</strong> demonstrated that both<br />
distance from the mouth of the estuary <strong>and</strong> the size <strong>and</strong> density of large shellfish living in the<br />
sediments affect the composition <strong>and</strong> functionality seafloor communities. Tracing the<br />
importance of different estuary-derived food resources (seagrass, mangrove, estuarine<br />
phytoplankton <strong>and</strong> phytobenthos) using stable isotopes emphasized the importance of estuarine<br />
productivity to coastal bivalve. The work in the field has been supplemented with laboratory<br />
feeding trials, with the goal of verifying isotopic uptake rates in bivalve body tissues in a<br />
carefully controlled experimental setting. Trophic connections have important effects on<br />
coastal biodiversity. Underst<strong>and</strong>ing ecosystem processes <strong>and</strong> dynamics <strong>and</strong> their implications<br />
for functional biodiversity emphasises the importance of shifting the management focus from<br />
exploitation to resilience. Enhancing or maintaining this biodiversity will require more<br />
integrative ecosystem-based management focused on maintaining the resilience of coastal<br />
ecosystems.<br />
Other research relevant or specifically linked to the projects above, are listed in Table 11.3.<br />
Table 11.3: Other research linked to investigation of the role of biodiversity in the functional ecology of nearshore<br />
<strong>and</strong> offshore marine communities.<br />
MPI ZBD2005-04 Information on benthic impacts in support of the Foveaux Strait Oyster Fishery<br />
Plan<br />
ZBD2005-15 Information on benthic impacts in support of the Corom<strong>and</strong>el Scallops Fishery<br />
Plan<br />
ENV2005-23 Monitoring recovery of the benthic community between North Cape <strong>and</strong> Cape<br />
Reinga<br />
BEN2007-01 Assessing the effects of fishing on soft sediment habitat, fauna, <strong>and</strong> processes<br />
CRI Core<br />
purpose<br />
HAB2007-01 Biogenic habitats as areas of particular significance for fisheries management<br />
C01X1005— Management Of Cumulative Effects Of Stressors On <strong>Aquatic</strong> Ecosystems ;<br />
CO1X0907 Coastal Conservation Management, Freshwater <strong>and</strong> Estuaries <strong>and</strong> Coasts <strong>and</strong><br />
Oceans<br />
DOC Conservancy surveys<br />
BNZ Biosecurity surveys<br />
OTHER Universities<br />
EMERGING ISSUES<br />
Cumulative footprint of human activities; underst<strong>and</strong>ing cumulative impacts <strong>and</strong> risks; marine spatial planning<br />
L<strong>and</strong>-base effects on marine biodiversity <strong>and</strong> inshore/offshore habitats; pollution in offshore<br />
Ecosystem-based management <strong>and</strong> integrative governance<br />
Defining marine ecosystem services, linking them to ecosystem function <strong>and</strong> societal values<br />
263
AEBAR <strong>2012</strong>: Marine <strong>Biodiversity</strong><br />
11.3.4. Progress on Science Objective 4. Marine genetic<br />
biodiversity<br />
Genetic biodiversity can be measured directly by measurement made at the genes <strong>and</strong> chromosomes<br />
scale or indirectly by measuring physical features at the organism scale (assuming they have a genetic<br />
basis).<br />
Genetic diversity is fundamental to the long-term survival, stability <strong>and</strong> success of a species. Central<br />
to this is the “metapopulation” concept where populations are sufficiently genetically distinct from<br />
each other to be identifiable as individual units. A low level of recruitment between populations<br />
counters the effects of r<strong>and</strong>om genetic drift <strong>and</strong> inbreeding depression of genetic diversity.<br />
Human activities can profoundly affect genetic diversity both within populations <strong>and</strong> between<br />
populations. For example, shipping activity (movement across the globe) <strong>and</strong> aquaculture practices<br />
(transfer of organisms to different areas) can increase population connectivity such that genetic<br />
biodiversity may decrease between populations. In extreme cases, populations can become the same<br />
genetically (homogeneous) although considerable within population diversity may remain. In the<br />
event of increased genetic connectivity, a species may become more susceptible to extinction through<br />
biological or catastrophic stochasticity. That is, in the absence of between population diversity there is<br />
insufficient genetic variance to adapt to the effects of climate change, disease epidemics <strong>and</strong> so on.<br />
In contrast, under the much more common scenario of habitat fragmentation caused by human<br />
activities (fishing, pollution), decreased connectivity between populations will result in greater<br />
between-population diversity, but a reduction of within-population diversity. This also results in a<br />
decrease in a species survival (fitness) because fragmented or isolated populations may become<br />
extinct through environmental <strong>and</strong> genetic stochasticity or localised depletion. Periodic fluctuations in<br />
annual temperature for example can lead to small scale population extinction, which in the absence of<br />
recruitment between populations will result, over time, in the demise of all populations.<br />
To reduce the risk of species loss information about the genetic diversity both within populations<br />
(population isolation) <strong>and</strong> between populations (population connectivity) is needed. Without such<br />
information, the effects of perturbation on a species persistence <strong>and</strong> survival cannot be predicted.<br />
Furthermore, the links between genetic diversity, the dispersal capacity (mode of reproduction <strong>and</strong> life<br />
history development) of a species <strong>and</strong> the minimum viable population (MVP) size required in the<br />
marine environment to ensure population persistence, are little understood. For example, the MVP<br />
size for a species with a large dispersal capacity is likely to be quite different from that of a species<br />
with a relatively restricted dispersal capacity. Examining the connectivity between populations in the<br />
marine environment is fundamental to resolving some of the central challenges in ecology <strong>and</strong> has<br />
almost been ignored in the management of New Zeal<strong>and</strong> fisheries or protection of biodiversity.<br />
Projects<br />
ZBD2002-12 Molecular identification of cryptogenic/invasive marine species – gobies.<br />
Project complete. (Lavery et al. 2006.)<br />
ZBD2009/10 Multi-species analysis of coastal marine connectivity.<br />
An extensive literature review of published <strong>and</strong> unpublished information about connectivity<br />
of New Zeal<strong>and</strong> coastal biota has been completed. <strong>Review</strong>s were made of 58 studies of 42<br />
taxa to identify the taxon or taxa studied, the habitat where each study took place, <strong>and</strong><br />
geographic location of sampling sites used by each study. From these data, gaps in knowledge<br />
about taxa, habitats <strong>and</strong> spatial coverage of sampling were identified. Recommendations<br />
about four species to be studied, habitats that they should be collected from, <strong>and</strong> location of<br />
sampling sites were made. Recommendations included a st<strong>and</strong>ardised collecting protocol <strong>and</strong><br />
264
AEBAR <strong>2012</strong>: Marine <strong>Biodiversity</strong><br />
for the development <strong>and</strong> application of microsatellite markers to quantify the population<br />
genetic structure <strong>and</strong> the coastal connectivity of these taxa (Gardner et al. 2010).<br />
Two PhD students are carrying out field work, genetic analyses, <strong>and</strong> writing up (in the form<br />
of two theses) of this research. Both studies are underway. Fieldwork has begun on two<br />
flatfish species <strong>and</strong> two species of shellfish. The project been extended to incorporate a<br />
subtidal species of shellfish. A new component of the coastal connectivity project has been<br />
added to include work on the New Zeal<strong>and</strong> scallop, Pecten novaezel<strong>and</strong>iae. This work focuses<br />
on population genetic structure <strong>and</strong> genetic connectivity at two different spatial scales <strong>and</strong><br />
uses microsatellite markers (consistent with the use of microsatellite markers for the 4 species<br />
already under investigation in the original ZBD2009-10 project). First, the extension work<br />
focusses on scallops in the Hauraki Gulf <strong>and</strong> Corom<strong>and</strong>el Peninsula region. Scallops have<br />
been collected from several populations in this region <strong>and</strong> further samples will be added in the<br />
next two years. Second, the extension work focuses on scallops across New Zeal<strong>and</strong> (the full<br />
range of this species’ distribution). Samples have been sourced from several regions including<br />
the fiords, the far north, <strong>and</strong> central New Zeal<strong>and</strong>. In both cases, genetic connectivity will be<br />
assessed to determine linkages among populations at the two different spatial scales. The<br />
smaller spatial scale information will be of particular relevance to the scallop fishery in the<br />
Hauraki Gulf <strong>and</strong> Corom<strong>and</strong>el Peninsula region, whereas the larger scale work will<br />
complement ongoing studies of coastal connectivity at the national scale already under<br />
examination as part of the project. A PhD student has been recruited for this work <strong>and</strong> a suite<br />
of microsatellite markers has been developed for the New Zeal<strong>and</strong> scallop <strong>and</strong> testing of<br />
population genetic variation is underway<br />
Other research relevant or specifically linked to the projects above, are listed in Table 11.4.<br />
Table 11.4: Other research linked to marine genetic biodiversity.<br />
MPI ENH2007-01 Stock enhancement of blackfoot paua<br />
GEN2007-01 Genetic population profile of blackfoot paua<br />
ENH2007-02 Outbreeding depression in invertebrate populations<br />
IPY2007-01 Objective 11. Barcode of life<br />
MBIE C01X0502 <strong>Biodiversity</strong>& Biosecurity<br />
MPI Base line surveys for non-indigenous species<br />
OTHER Universities [?]<br />
BRAG PROJECTS FOR 2011-12<br />
Extension to ZBD2009-10 to include subtidal shellfish<br />
EMERGING ISSUES<br />
Can genetics combined with hydrographic models usefully contribute to the identification of biodiversity hotspots<br />
<strong>and</strong>/or to source-sink relationships within ecosystems?<br />
11.3.5. Progress on Science Objective 5. Effects of climate change<br />
<strong>and</strong> variability on marine biodiversity<br />
Cyclical changes or trends in climate <strong>and</strong> oceanography <strong>and</strong> associated effects such as increased<br />
ocean acidification <strong>and</strong> how they affect the marine ecosystem as a whole have long-term implications<br />
for trophic interactions <strong>and</strong> biodiversity, as well as functional aspects of the system e.g.<br />
biogeochemical processes. With significant improvement in remote sensing tools <strong>and</strong> global<br />
monitoring of climate change, new patterns are emerging indicating that there are long-term cycles.<br />
Examples include the Interdecadal Pacific Oscillation as well as shorter periods of change in relation<br />
to the El Niño Southern Oscillation that affect ocean ecosystems. Further, physical phenomena such<br />
as the deep subtropical gyre ‘spin-up’ in the South Pacific which resulted in a warmer ocean around<br />
New Zeal<strong>and</strong> from 1996–2002, can have flow-on effects on ecosystem functioning.<br />
265
AEBAR <strong>2012</strong>: Marine <strong>Biodiversity</strong><br />
A new report was launched in 2010 by the United Nations on ocean acidification 59 Among other<br />
findings, the study shows that increasing ocean acidification will mean that by 2100 some 70% of<br />
cold water corals, (a key refuge <strong>and</strong> feeding ground for some commercial fish species), will be<br />
exposed to corrosive waters (see also Tracey et al. 2011). In addition, given the current greenhouse<br />
gas emission rates, it is predicted that the surface water of the highly productive Arctic Ocean will<br />
become under-saturated with respect to essential carbonate minerals by the year 2032, <strong>and</strong> the<br />
Southern Ocean by 2050 with disruptions to large components of the marine food source, in particular<br />
those calcifying species, such as foraminifera, pteropods, coccolithophores, which rely on calcium<br />
carbonate.<br />
Emerging research suggests that many of the effects of ocean acidification on marine organisms <strong>and</strong><br />
ecosystems will be variable <strong>and</strong> complex <strong>and</strong> will affect different species in different ways. Evidence<br />
from naturally acidified locations confirms, however, that although some species may benefit,<br />
biological communities in acidified seawater conditions are less diverse <strong>and</strong> calcifying (calciumreliant)<br />
species are absent whereas algae tend to dominate.<br />
Many questions remain regarding the biological <strong>and</strong> biogeochemical consequences of ocean<br />
acidification for marine biodiversity <strong>and</strong> ecosystems, <strong>and</strong> the impacts of these changes on ecosystems<br />
<strong>and</strong> the services they provide, for example, in fisheries, coastal protection, tourism, carbon<br />
sequestration <strong>and</strong> climate regulation.<br />
Studies to predict changes in biodiversity in relation to climate change in more than a rudimentary<br />
way are beyond the state of current knowledge in New Zeal<strong>and</strong>. Nevertheless, surveys of biodiversity<br />
that have occurred or are planned will provide a snapshot against which future research results or<br />
trends can be compared.<br />
Meeting the challenges of climate change <strong>and</strong> identifying crucial issues for marine biodiversity is an<br />
area of high political interest internationally 60 <strong>and</strong> has been identified as a gap in biodiversity research<br />
in New Zeal<strong>and</strong> 61<br />
Projects<br />
ZBD2005-05 Long-term effects of climate variation <strong>and</strong> human impacts on the structure <strong>and</strong><br />
functioning of New Zeal<strong>and</strong> shelf ecosystems.<br />
This is a large scale project to investigate changes in shelf ecosystems over a 1000 year timescale<br />
to provide context <strong>and</strong> perspective on issues of natural variation versus human impacts on<br />
marine biodiversity.<br />
The project is a multidisciplinary study to collate <strong>and</strong> sythesise paleoecological, archaeological,<br />
historical, <strong>and</strong> contemporary data relating to changes in the structure <strong>and</strong> functioning of New<br />
Zeal<strong>and</strong> shelf ecosystems since human arrival about 750 years ago. The data have been used to<br />
model present <strong>and</strong> four past states of the Hauraki Gulf ecosystem over the last 1000 years.<br />
The project is collaborating with the international History of Marine Animal Populations (HMAP)<br />
project, itself a part of the Census of Marine Life (CoML) programme. A short video about the<br />
NZ Taking Stock project was made by HMAP staff <strong>and</strong> is currently available on the HMAP<br />
website http://hmapcoml.org/projects/nz/.<br />
59<br />
http://www.un.org/apps/news/story.asp?NewsID=36941&Cr=emissions&Cr1 Downloadable Report The<br />
<strong>Environment</strong>al Consequences of Ocean Acidification<br />
60<br />
http://biodiversity-l.iisd.org/news/ungas-second-committee-considers-biodiversity-<strong>and</strong>-sustainabledevelopment/<br />
61<br />
Green, W.; Clarkson, B. (2006). <strong>Review</strong> of the New Zeal<strong>and</strong> <strong>Biodiversity</strong> Strategy Themes<br />
266
AEBAR <strong>2012</strong>: Marine <strong>Biodiversity</strong><br />
Fifteen reports stemming from this project have been submitted to the Ministry <strong>and</strong> are at various<br />
stages of review, acceptance <strong>and</strong> publication. Four reports are still to be delivered. The report<br />
most relevant to this section is Pinkerton (In press). Other reports published to date are Carroll et<br />
al. (In press); Jackson et al. (In Press); Lalas et al. (In Press) a; b; Lalas & MacDiarmid (In Press);<br />
Lorrey et al. (In Press); MacDiarmid et al. (In Press a; b); Maxwell & MacDiarmid (In Press);<br />
Neil et al. (In Press); Paul (<strong>2012</strong>); Parsons et al. (In Press); Smith (2011).<br />
ZBD2008-11 Predicting plankton biodiversity & productivity with ocean acidification.<br />
This multi-year project is inter-linked with the Coasts <strong>and</strong> Oceans OBI <strong>and</strong> has the following<br />
objectives:<br />
1. To document the spatial <strong>and</strong> inter-annual variability of coccolithophore abundance <strong>and</strong><br />
biomass, <strong>and</strong> assess in terms of the phytoplankton abundance, biomass <strong>and</strong> community<br />
composition in sub-tropical <strong>and</strong> sub-Antarctic water.<br />
2. To document the seasonal <strong>and</strong> inter-annual variability of foraminifera <strong>and</strong> pteropod<br />
abundance <strong>and</strong> biomass at fixed locations in sub-tropical <strong>and</strong> sub-Antarctic water by analysis<br />
of sediment trap material from time-series data collection.<br />
3. To document the spatial <strong>and</strong> seasonal distribution of the key coccolithophore species,<br />
Emiliana huxleyi, using both archived <strong>and</strong> ongoing ingestion of satellite images of Ocean<br />
Colour, <strong>and</strong> ground-truth the reflectance algorithm for E huxleyi for future application in New<br />
Zeal<strong>and</strong> waters<br />
4. To determine the sensitivity of, <strong>and</strong> response of E. huxleyi <strong>and</strong> other EEZ coccolithophores to<br />
pH under a range of realistic atmospheric CO2 concentrations in perturbation experiments,<br />
using monocultures <strong>and</strong> mixed populations from in situ sampling.<br />
5. To document the spatial variability of diazotrophs (nitrogen-fixing organisms) <strong>and</strong> associated<br />
nitrogen fixation rate, <strong>and</strong> assess in terms of phytoplankton abundance, biomass <strong>and</strong><br />
community composition in sub-tropical waters north of New Zeal<strong>and</strong>.<br />
6. To determine the sensitivity of diazotrophs to ocean acidification composition in sub-tropical<br />
waters north of New Zeal<strong>and</strong>.<br />
The project is proceeding according to plan <strong>and</strong> is still primarily in the sample collection phase<br />
with some data analysis but limited interpretation to date. The biodiversity record of<br />
coccolithophore species in New Zeal<strong>and</strong> waters has been extended, with a transect across the<br />
Tasman Sea <strong>and</strong> a number of transects across the Chatham Rise. A bloom of the coccolithophore<br />
Emiliana huxleyi on the Chatham Rise was extensively characterised in terms of surface water<br />
biogeochemistry, <strong>and</strong> subsequently successfully cultured in the lab. Seasonal <strong>and</strong> interannual<br />
variability of E. huxleyi blooms were further characterised by extending the true colour satellite<br />
image analysis of presence/absence of coccolithophore blooms in the New Zeal<strong>and</strong> EEZ. This<br />
was augmented by sample collection for ground-truthing of published calcite algorithms (for<br />
satellite detection of coccolithophore blooms) <strong>and</strong> application of a published calcite algorithm to<br />
New Zeal<strong>and</strong> waters for 2002-3. Coccolithophore acidification sensitivity experiments were run<br />
in the Tasman Sea <strong>and</strong> the Chatham Rise region, with preliminary analysis indicating a decline in<br />
coccolithophore abundance under high CO2, but not when accompanied by elevated temperature<br />
as predicted under future climate change scenarios. Analysis of sediment trap samples for<br />
pteropod <strong>and</strong> foraminifera identification <strong>and</strong> abundance was completed for 2000-2010, with<br />
significant interannual variability noted in both, but also some indication of a recent decline in<br />
pteropod abundance in Sub-Antarctic water. Sample analysis from the 2010 Tasman Sea voyage<br />
identified the presence of nitrogen-fixing unicellular cyanobacteria <strong>and</strong> significant nitrogen<br />
fixation south of the Tasman Front, in contrast to previous observations. In acidification<br />
sensitivity experiments on this voyage nitrogen fixation did not change or decreased under high<br />
CO2 concentrations, in contrast to published data. Outputs to date include Boyd et al. (in press).<br />
ZBD2009-13 Ocean acidification impact on key NZ molluscs.<br />
Ocean acidification associated with increased atmospheric CO2 levels is a pressing threat to<br />
coastal <strong>and</strong> oceanic ecosystems. The chemical reaction which occurs when this CO2 is dissolved<br />
in seawater results in a well documented decrease in seawater pH (<strong>and</strong> an increase in seawater<br />
267
AEBAR <strong>2012</strong>: Marine <strong>Biodiversity</strong><br />
acidity), which may physically dissolve CaCO3 shells <strong>and</strong>/or skeletons <strong>and</strong> affect the<br />
shell/skeleton generation, as well as influencing many other physiological processes. Flow on<br />
effects to the viability of populations <strong>and</strong> the economic benefit that can be derived from<br />
commercially important species are likely. There is very little information on how key NZ<br />
calcifying species will respond to this change.<br />
This project is using laboratory experiments to quantify responses of key New Zeal<strong>and</strong> mollusc<br />
species (paua, Haliotus iris, cockles, Austrovenus stutchburyi, <strong>and</strong> oysters Tiostrea chiliensis) to<br />
levels of ocean CO2 saturation predicted to occur in NZ waters over the following decades.<br />
Results will be combined with information on the role of these key species in influencing<br />
ecosystem structure <strong>and</strong> function, to assess local <strong>and</strong> ecosystem-scale implications of acidification<br />
of NZ coastal waters expected in the following decades.<br />
ZBD2010-41. Potential effects of ocean acidification on habitat forming deep-sea corals in the New<br />
Zeal<strong>and</strong> region.<br />
Specific Objectives of this research were to 1. Determine the carbonate mineralogy of selected<br />
deep-sea corals found in the New Zeal<strong>and</strong> region, 2. Assess the distribution of deep-sea coral<br />
species in the region relative to improved knowledge of current <strong>and</strong> predicted aragonite (ASH)<br />
<strong>and</strong> calcite saturation horizons (CSH), <strong>and</strong> 3. Assess potential locations vulnerable to deepwater<br />
upwelling <strong>and</strong> areas of key deep-water fishery habitat. Through a literature search <strong>and</strong> analysis,<br />
the project aimed to determine the most appropriate tools to age corals <strong>and</strong> measure the effects of<br />
ocean acidification on deep-sea habitat-forming corals, <strong>and</strong> recommend the best approach for<br />
future assessments of the direct effects of declining ocean pH on these key fauna.<br />
Under Objective 1, new results of investigations into the carbonate mineralogy of selected deepsea<br />
corals found in the New Zeal<strong>and</strong> region were presented, <strong>and</strong> previous work on coral<br />
mineralogy summarised. The mineralogy <strong>and</strong> trace element concentration (Sr <strong>and</strong> Mg) of the five<br />
branching stony coral species (Order: Scleractinia) Goniocorella dumosa, Solenosmilia<br />
variabilis, Enallopsammia rostrata, Madrepora oculata, <strong>and</strong> the endemic Oculina virgosa, <strong>and</strong><br />
for the key habitat forming gorgonian coral species (Order: Alcyonacea) Keratoisis spp.,<br />
Lepidisis spp., Paragorgia spp. <strong>and</strong> Primnoa sp., was ascertained. Stony branching corals are all<br />
aragonitic with high Sr <strong>and</strong> low Mg while most of the gorgonian corals are made of high Mg <strong>and</strong><br />
low Sr, with high Mg calcite (>8 mol% Mg). The gorgonian sea fan, Primnoa sp., is aragonitic.<br />
Under Specific Objective 2, up to date position <strong>and</strong> depth data were used to produce distribution<br />
maps for the study species. Data compare well with previous publications from biodiversity<br />
research, research trawl, <strong>and</strong> observer sampling effort on wide regional distribution, but<br />
individual species display variations within the region. The peak depth distributions are unimodal<br />
at about 800-1000 m for most of the above species, but G. dumoas, E. rostrata, <strong>and</strong> Lepidisis<br />
spp. show bi-modal distributions <strong>and</strong> O. virgosa occurs primarily in shallow depths. In the<br />
second year of the project these distribution data will be compared with existing <strong>and</strong> predicted<br />
aragonite <strong>and</strong> calcite saturation horizons, particularly in areas of key deepwater fishery habitat.<br />
Also under Specific Objective 2, on-going opportunistic water sampling analyses are being<br />
carried out to determine alkalinity <strong>and</strong> dissolved inorganic carbon (DIC), <strong>and</strong> modelling to<br />
determine aragonite (ASH) <strong>and</strong> calcite saturation horizon (CSH) data is in progress. The aim is to<br />
compare water carbonate chemistry with regional biogeochemistry models <strong>and</strong> future scenarios<br />
to identify areas potentially at risk from ocean acidification.<br />
Under Specific Objective 3, at-sea sampling of live corals for aquarium studies has been carried<br />
out to investigate the feasibility of keeping the corals alive for growth <strong>and</strong> ocean acidification<br />
experiments. The corals collected in April, <strong>2012</strong> are still alive in the laboratory <strong>and</strong> include one<br />
small colony of S. variabilis. A literature search <strong>and</strong> analysis to determine the most appropriate<br />
tools to age <strong>and</strong> measure the effects of ocean acidification on deep-sea habitat-forming corals is<br />
268
AEBAR <strong>2012</strong>: Marine <strong>Biodiversity</strong><br />
in progress. From these trials <strong>and</strong> reviews, recommendations on the best approach for future<br />
assessments of the direct effects of changes in ocean pH on these key fauna will be made.<br />
Other research relevant or specifically linked to the projects above, are listed in Table 11.5.<br />
Table 11.5: Other research linked to effects of climate change <strong>and</strong> variability on marine biodiversity.<br />
MPI SAM2005-02 Effects of climate on commercial fish abundance<br />
ENV2007-04 Climate <strong>and</strong> oceanographic trends relevant to New Zeal<strong>and</strong> fisheries<br />
MBIE C01X502 Coasts & Oceans Centre<br />
DOC Baseline surveys; protected deepsea corals (Tracey et al. 2011; Baird et al. <strong>2012</strong>)<br />
OTHER University of Otago-NIWA shelf carbonate geochemistry <strong>and</strong> bryozoans<br />
Geomarine Services-foraminiferal record of human impact<br />
Regional Council monitoring programmes<br />
EMERGING ISSUES (this objective)<br />
What papers can be generated on the effects of climate change on marine biodiversity in NZ in time for 5 th<br />
IPCC report?<br />
How does climate change influence marine microbial diversity, species mix <strong>and</strong> biogeochemical roles?<br />
How will harmful toxic algal blooms be affected by warming seas? (e.g. Chang 2003, Chang et al. 2003)<br />
11.3.6. Progress on Science Objective 6. <strong>Biodiversity</strong> metrics <strong>and</strong><br />
other indicators for monitoring change<br />
In the mid 1990s, monitoring of marine biodiversity <strong>and</strong> the marine environment was a topic of<br />
considerable discussion, yielding several reports on developing MfE indicators 62 However, since the<br />
publication of MfE’s indicators in 2001, a much reduced set of core indicators that relate to the<br />
marine environment have been reported on 63 . A new international initiative launched in 2010<br />
“<strong>Biodiversity</strong> Indicators Partnership 64 ” provides guidelines <strong>and</strong> examples of biodiversity indicators<br />
developed around the globe, however, Oceania does not appear to have any partnership identified.<br />
The link between this initiative <strong>and</strong> OECD environmental indicators is unclear.<br />
A serious gap identified by Green <strong>and</strong> Clarkson (2006) 65 in their review of progress on<br />
implementation of the NZBS was the lack of development of an integrated national monitoring system<br />
(see <strong>Biodiversity</strong> Research Programme 2010: Part 4). Efforts to respond to this gap within the<br />
<strong>Biodiversity</strong> Programme resulted in the immediate initiation of a 5-year Continuous Plankton<br />
Recorder project, <strong>and</strong> a series of workshops to determine how best to approach monitoring on a<br />
national scale (ZBD2008-14). [One objective of monitoring would be to test the effectiveness of<br />
management measures.]<br />
Projects<br />
ZBD2004-10 Development of bioindicators in coastal ecosystems.<br />
62<br />
Downloadable MfE reports Confirmed indicators for the marine environment 2001, ME398; An analysis of<br />
potential indicators for marine biodiversity 1998 TR44; <strong>Environment</strong>al Performance Indicators: an analysis of<br />
potential indicators for fishing impacts 1998 TR43; <strong>Environment</strong>al Performance Indicators: Summary of<br />
Proposed Indicators for the Marine <strong>Environment</strong> 1998, ME296; <strong>Environment</strong>al Performance Indicators: Marine<br />
environment potential indicators for physical <strong>and</strong> chemical processes, <strong>and</strong> human uses <strong>and</strong> values 1998 TR45;<br />
Potential coastal <strong>and</strong> estuarine indicators - a review of current research <strong>and</strong> data 1997 TR40; Monitoring <strong>and</strong><br />
indicators of the coastal <strong>and</strong> estuarine environment - a literature review 1997 TR39<br />
63<br />
http://www.mfe.govt.nz/environmental-reporting/about/tools-guidelines/indicators/core-indicators.html<br />
64<br />
www.bipnational.net/IndicatorInitiatives<br />
65<br />
Green, W.; Clarkson, B. (2006). <strong>Review</strong> of the New Zeal<strong>and</strong> <strong>Biodiversity</strong> Strategy Themes.<br />
269
AEBAR <strong>2012</strong>: Marine <strong>Biodiversity</strong><br />
Project complete (Savage 2009). Agricultural <strong>and</strong> urban development can increase run-off <strong>and</strong> lead<br />
to excessive nutrient loadings in fragile coastal environments that are nursery grounds for a diverse<br />
array of coastal <strong>and</strong> estuarine species, as well as other resident organisms. This project investigated<br />
the development of bioindicators to strengthen the ability of managers to detect <strong>and</strong> quantify<br />
changes in anthropogenic nitrogen inputs to coastal <strong>and</strong> estuarine ecosystems by comparing six<br />
study sites with different levels of development ranging from pristine through to fully urban. The<br />
results show a strong positive relationship between the percent agricultural l<strong>and</strong> in surrounding<br />
catchments <strong>and</strong> total nitrogen (TN) loading to nearshore environments.<br />
These results also hint at differences in dissolved <strong>and</strong> particulate nitrogen source pools, <strong>and</strong><br />
highlight the importance of using complementary components of food webs <strong>and</strong> high spatial<br />
replication to show linkages between watershed l<strong>and</strong> use <strong>and</strong> chemical markers in biota. The<br />
effects of nutrient enrichment were transmitted up the food web, with growth of secondary<br />
consumers, Notolabrus celidotus (spotties) <strong>and</strong> Grahamina nigripenne (estuarine triplefins)<br />
generally enhanced in nutrient enriched coastal areas. Benthic prey dominated the diets of these<br />
fish species, with amphipods <strong>and</strong> brachyurans being the most important prey items for triplefins<br />
<strong>and</strong> spotties, respectively. However, there were site-specific differences in prey importance <strong>and</strong><br />
diet diversity. Both triplefins <strong>and</strong> spotties consumed considerably more diverse prey items at<br />
pristine than nutrient-enriched coastal areas. Food web models based on stomach content analyses<br />
<strong>and</strong> dual isotope ratios suggest that there are shifts in the relative importance of the different<br />
organic matter sources supporting food structure among the different coastal ecosystems due to<br />
nutrient enhancement from l<strong>and</strong>-based activities. [how might these results be used in a biodiversity<br />
management context?]<br />
ZBD2008-14 What <strong>and</strong> where should we monitor to detect long-term marine biodiversity <strong>and</strong><br />
environmental changes?<br />
Two workshops <strong>and</strong> a follow up meeting were held with stakeholders in 2008/09 to discuss a<br />
marine environmental monitoring programme (MEMP) for New Zeal<strong>and</strong>, to detect long-term<br />
changes in the marine environment, building on existing time series <strong>and</strong> data collection<br />
(Livingston 2009). The MEMP was formulated into a developmental project staged over 3 years<br />
<strong>and</strong> submitted to the former Ministry of Research Science <strong>and</strong> Technology’s Cross Departmental<br />
Research Pool (CDRP) for funding starting July 2010. Since that time, CDRP funding has been<br />
withdrawn. Instead a call for proposals taking a more modest approach to developing MEMP<br />
beginning with collation of all potential data series into a metadata database, a scientific evaluation<br />
of the existing time series as to their ‘fit to purpose’ for MEMP was made <strong>and</strong> tender evaluations<br />
are underway.<br />
Monitoring change in the marine environment is the only way we can measure long-term trends,<br />
mitigate risk <strong>and</strong> provide evidence of changes which may require policy or management practice<br />
response. DOC has since been developing an integrated approach to monitoring biodiversity<br />
particularly on the l<strong>and</strong> but also in marine reserves 66 .<br />
ZBD2008-15 Continuous Plankton Recorder Project: implementation <strong>and</strong> identification.<br />
This project adopts the methods used in a long-term programme that has proved highly relevant to<br />
measuring biological changes in the ocean, i.e., the Continuous Plankton Recorder Programme in<br />
the North Atlantic (SAHFOS) <strong>and</strong> more recently the Southern Ocean 67 . This 5-year MPI project<br />
aims to map changes in the quantitative distribution of epipelagic plankton, including<br />
phytoplankton, zooplankton <strong>and</strong> euphausiid (krill) life stages annually when vessels depart <strong>and</strong><br />
return from New Zeal<strong>and</strong> on their journey to the Ross Sea toothfish fishery each year in<br />
November/December, <strong>and</strong> February/March traversing key water masses <strong>and</strong> ocean fronts in New<br />
66 The Department of Conservation <strong>Biodiversity</strong> Monitoring <strong>and</strong> Reporting System Fact Sheet July 2010<br />
67 Southern Ocean CPR programme http://data.aad.gov.au/aadc/cpr/<br />
270
AEBAR <strong>2012</strong>: Marine <strong>Biodiversity</strong><br />
Zeal<strong>and</strong>’s EEZ as well as south to the Ross Sea. Four years the transectshave been collected, staff<br />
have been trained in plankton ID work <strong>and</strong> over three years of samples analysed.<br />
ZBD2010-42 Marine <strong>Environment</strong>al Monitoring Programme.<br />
This project continues from ZBD2008-14. A starting point to the assessment <strong>and</strong> reporting of<br />
broad-scale changes in New Zeal<strong>and</strong>’s marine environment is to define basic criteria <strong>and</strong> locate all<br />
existing <strong>and</strong> past time series of marine environmental data to improve awareness <strong>and</strong> access to<br />
these data. After this, these data can be evaluated as to their fitness-for-purpose for contributing<br />
towards a national Marine <strong>Environment</strong>al Monitoring Programme (MEMP). To date an online<br />
catalogue has been designed <strong>and</strong> a portal to this is available at http:\geodata.govt.nz.<br />
Questionnaires were developed to determine what marine environmental time series data were<br />
available within New Zeal<strong>and</strong>. Information to date gives us 131 databases, 50% of these are listed<br />
as having ongoing funding (although not necessarily for all locations), <strong>and</strong> another 19% are listed<br />
as likely to continue. Over 70% are publically available. Most cover more than one location,<br />
although this is dependent on how the databases are constructed, e.g., DOC at present has a<br />
separate database for each marine reserve, while regional councils tend to have separate databases<br />
for different subjects (e.g., contaminant monitoring, ecological monitoring). Around 95estuaries<br />
<strong>and</strong> harbours are being sampled, which is not surprising given that the majority of the information<br />
comes from Regional Councils (Figure 1). There are 78 coastal locations <strong>and</strong> 33 marine reserves.<br />
The second phase, determining fitness-for-purpose, was begun at a workshop held at NIWA on<br />
11th June (see objective 3). Priority variables for inclusion in a national monitoring programme<br />
have been identified from responses to a questionnaire sent to scientific experts <strong>and</strong> central <strong>and</strong><br />
regional government departments involved in monitoring <strong>and</strong>/or reporting. Core reference sites<br />
<strong>and</strong> major gaps in the spatial network are presently being determined <strong>and</strong> the requirements for<br />
spatial <strong>and</strong> temporal sampling determined. The project is due to be completed by June 2013.<br />
Other research relevant or specifically linked to the projects above, are listed in Table 11.6.<br />
Table 11.6: Other research linked to biodiversity metrics <strong>and</strong> other indicators for monitoring change.<br />
MPI ENV2006-15: Database <strong>and</strong> fishing indicator on seamount habitats (Rowden et al 2008)<br />
BEN2009-02 (Tuck et al. 2010)<br />
ENV2006-04: Fisheries indicators from trawl surveys (Tuck 2009)<br />
DEE2010-05<br />
MBIE Core funding for Coasts <strong>and</strong> Oceans Centre<br />
DOC Conservancy projects-Hawke’s Bay;<br />
OTHER Regional Councils, Universities<br />
EMERGING ISSUES<br />
Monitoring coastal waters <strong>and</strong> New Zeal<strong>and</strong>’s oceans to report on a national scale remains a major gap<br />
There is little longterm commitment to direct monitoring the marine environment<br />
11.3.7. Scientific Objective 7. Identifying threats <strong>and</strong> impacts to<br />
biodiversity <strong>and</strong> ecosystem functioning<br />
Many marine ecosystems in New Zeal<strong>and</strong> have been modified in some way through the harvesting of<br />
marine biota, the selective reduction of certain species <strong>and</strong> size/age classes, modification of food<br />
webs, including the detrital components <strong>and</strong> habitat destruction. Benthic communities including<br />
seamount communities, volcanic vent communities, bryozoans, corals, hydroids <strong>and</strong> sponges are<br />
vulnerable to human disturbance. The mechanical disturbance of marine habitats that occurs with<br />
some activities such as trawling, dredging, dumping, <strong>and</strong> oil, gas <strong>and</strong> mineral exploration <strong>and</strong><br />
extraction; can substantially change the structure <strong>and</strong> composition of benthic communities. The<br />
271
AEBAR <strong>2012</strong>: Marine <strong>Biodiversity</strong><br />
invasion of alien species into New Zeal<strong>and</strong> waters is also a real threat, with evidence of nuisance<br />
species already well established 68<br />
A number of inshore marine ecosystems (especially estuaries <strong>and</strong> other sheltered waters) have been<br />
modified by sediment, contaminants <strong>and</strong> nutrients derived from human l<strong>and</strong> use activities (Morrison<br />
et al. 2009). Coastal margin development has had a major impact on some inshore marine<br />
communities.<br />
A recent project commissioned by the MPI <strong>Aquatic</strong> <strong>Environment</strong> Programme, identifies key threats to<br />
the marine environment (BEN2007-05) is complete <strong>and</strong> has listed <strong>and</strong> ranked the top threats to New<br />
Zeal<strong>and</strong>’s marine environment, as perceived by expert opinion. Relevant findings are that the highest<br />
ranking threats are ocean acidification, increasing sea water temperatures <strong>and</strong> bottom trawling (across<br />
all habitats) <strong>and</strong> that the most threatened habitats are intertidal reef systems in harbours <strong>and</strong> estuaries<br />
(MacDiarmid et al. <strong>2012</strong>). Ecological risk assessment (ERA) methods have also been reviewed (under<br />
ENV200515, Rowden et al. 2008), <strong>and</strong> a trial Level 2+ assessment completed on Chatham Rise<br />
seamounts to estimate the relative risk to seamount benthic habitat from bottom trawling (under<br />
ENV200516, Clark et al. 2011). An MPI project (DEE2010-04) has resulted in a new ecological risk<br />
assessment being developed that is tailored for New Zeal<strong>and</strong> deepwater fisheries (Clark et al. in<br />
press).<br />
Projects<br />
ZBD2009-25 Predicting impacts of increasing rates of disturbance on functional diversity in<br />
marine benthic ecosystems. The objectives of this project are to:<br />
1. Further develop l<strong>and</strong>scape/seascapes ecological model of disturbance/recovery dynamics in<br />
marine benthic communities, incorporating habitat connectivity, based on existing model by<br />
Lundquist et al. (2010).<br />
2. Predict impacts of increasing rates of disturbance on rare species abundance, functional<br />
diversity, relative importance of biogenic habitat structure, <strong>and</strong> ecosystem productivity.<br />
3. Use literature <strong>and</strong> expert knowledge to quantify rare species abundance, biomass, functional<br />
diversity, habitat structure, <strong>and</strong> productivity of various successional community types in the<br />
model.<br />
4. Field test predictions of the model in appropriate marine benthic communities where<br />
historical rates of disturbance are known, <strong>and</strong> benthic communities have been sampled.<br />
The baseline model, incorporating connectivity, has been created in Matlab. Objective 2<br />
(predictions for functional biodiversity based on model) is underway. Some progress has been<br />
made on objective 3 (quantify functional biodiversity from existing data) through familiarisation<br />
of the programmers with the datasets of the Ocean Survey 2020 Chatham/Challenger project<br />
(ZBD2007-01) <strong>and</strong> biodiversity analyses to date for objective 8 of that project. Objective 4 is in<br />
process, with the majority of the field test funded by BEN2007-01. Researchers from both<br />
projects have met to discuss <strong>and</strong> modify the draft sampling design in order to best allocate<br />
sampling to test the predictions of the functional diversity model. The field testing took place in<br />
March-April 2010 in Tasman/Golden Bay.<br />
Other research relevant or specifically linked to the projects above, are listed in Table 11.7.<br />
68 http://www.biosecurity.govt.nz/biosec/camp-acts/marine<br />
http://www.biosecurity.govt.nz/pests/salt-freshwater/saltwater<br />
http://www.biosecurity.govt.nz/about-us/our-publications/technical-papers<br />
272
AEBAR <strong>2012</strong>: Marine <strong>Biodiversity</strong><br />
Table 11.7: Other research linked to threats to <strong>and</strong> impacts on biodiversity.<br />
MPI BEN2007-05 Assessment of anthropogenic threats to New Zeal<strong>and</strong> marine habitats. MacDiarmid<br />
et al <strong>2012</strong><br />
DEE2010-04<br />
MBIE CO1X0906 Vulnerable deep-sea communities (mapping <strong>and</strong> sampling a range of deep-sea<br />
habitats (seamounts, slope, canyons, seeps, vents), <strong>and</strong> determining relative risk to their benthic<br />
communities from human activities<br />
EMERGING ISSUES<br />
The socio-economic valuation of biodiversity in NZ has not been adequately addressed.<br />
The cumulative footprint of anthropogenic activities on the NZ marine environment has not been assessed.<br />
Potential development of seabed mining makes this a priority in deepwater environments as well as coastal.<br />
11.3.8. <strong>Biodiversity</strong> in Antarctica: BioRoss Project Summaries <strong>and</strong><br />
Progress<br />
The objectives of BioRoss are to improve underst<strong>and</strong>ing of the biodiversity <strong>and</strong> functional ecology of<br />
selected marine communities in the Ross Sea. These objectives are being achieved by commissioning<br />
directed research on the diversity <strong>and</strong> function of selected marine communities in the Ross Sea region.<br />
BioRoss is committed to linking with ongoing Ross Sea ecosystems research through the Antarctic<br />
Working Group, <strong>and</strong> supporting climate change related research, especially at high latitudes.<br />
Data acquisition from the Antarctic marine environment is logistically difficult <strong>and</strong> expensive.<br />
Nevertheless, the seven biodiversity Science Objectives listed above also drive BioRoss research<br />
projects. The BioRoss survey in 2004 <strong>and</strong> the Latitudinal Gradient Project ICECUBE have provided<br />
significant new information on biodiversity, species abundance <strong>and</strong> distribution that are now<br />
facilitating research into functional ecology <strong>and</strong> longer term monitoring programmes. This research<br />
has the potential to lead into other research on genetic diversity, climate variability <strong>and</strong> the<br />
development of indicators. The research results are also being used in the MPI Antarctic Research<br />
Programme projects on ecosystem modelling of the Ross Sea.<br />
The MPI Antarctic Research <strong>and</strong> BioRoss Programmes are also directly involved in supporting the<br />
development of protection measures around the Balleny Isl<strong>and</strong>s. In 2005 MPI scientists <strong>and</strong> Ministry<br />
of Foreign Affairs <strong>and</strong> Trade (MFAT) personnel prepared a paper for submission to CCAMLR<br />
justifying MPA designation around the isl<strong>and</strong>s to protect ecosystem processes occurring there that<br />
may be important for the stability <strong>and</strong> function of the wider Ross Sea regional ecosystem.<br />
To collect data in support of the MPA proposal, MPI BioRoss funded a targeted research voyage to<br />
the Balleny Isl<strong>and</strong>s in February 2006 (ZBD2005-01), <strong>and</strong> also provided supplementary funding to<br />
carry out opportunistic biological sampling at the Balleny Isl<strong>and</strong>s on a voyage to the Ross Sea that<br />
was primarily funded by LINZ to do bathymetric mapping.<br />
The field sampling of these projects were successful, both providing important data <strong>and</strong> specimens<br />
from the Balleny Isl<strong>and</strong>s area <strong>and</strong> supplementary information for the Antarctic Working Group<br />
Research Programme. The results will inform research planning for subsequent projects. Support for<br />
Ross Sea region biodiversity will remain a high priority for future research in the BioRoss<br />
Programme.<br />
In addition, BioRoss funded a further ICECUBE project to sample the Antarctic coastline during the<br />
summer season of 2006/07 (ZBD2006-03). ICECUBE is a key part of the international Latitudinal<br />
Gradient Project to explore hypotheses about environmental drivers of structure <strong>and</strong> function in subtidal<br />
ecosystems along the western Ross Sea coastline (Cummings et al. 2008 ). This project acquired<br />
funding for three seasons (2007/08, 08/09, 09/10) as part of the MBIE IPY contestable round (see also<br />
Cummings et al. 2011 <strong>and</strong> Thrush <strong>and</strong> Cummings 2011). Published reports <strong>and</strong> papers from the MPI<br />
273
AEBAR <strong>2012</strong>: Marine <strong>Biodiversity</strong><br />
Ross Sea coastal projects include Cummings et al. 2003, 2006, 2008, 2010, 2011. De Domenico et al.<br />
2006, Grotti et al, 2008, Guidetti et al. 2006, Norkko et al. 2002, 2004, 2005, 2007; Pinkerton et al.<br />
2006, Schwarz et al. 2003, 2005, Sharp et al. 2010, Sutherl<strong>and</strong> 2008, Thrush et al. 2006, 2010 <strong>and</strong> in<br />
press.<br />
The New Zeal<strong>and</strong> Government provided one-off funding for a Census of Antarctic Marine Life<br />
(CAML) survey to the Ross Sea from R.V. Tangaroa as part of New Zeal<strong>and</strong>’s involvement in the<br />
2007-08 International Polar Year activities. The CAML Voyage was a large cooperative research<br />
effort under the banner of Ocean Survey 20/20 with considerable international collaboration,<br />
simultaneously utilising a number of different vessels with different strengths <strong>and</strong> capabilities.<br />
Progress on the two projects IPY2007-01 <strong>and</strong> IPY2007-02, is detailed below.<br />
Projects<br />
ZBD2002-02 Whose larvae is that? Molecular identification of planktonic larvae of the Ross Sea.<br />
Completed. (See Sewell et al. 2006, Sewell 2005, Sewell 2006.)<br />
ZBD2003-03 <strong>Biodiversity</strong> of deepwater invertebrates <strong>and</strong> fish communities of the north western<br />
Ross Sea. Completed. Two AEBR reports were produced by Rowden et al. (<strong>2012</strong>a, in press) <strong>and</strong> a<br />
Voyage Report, Mitchell <strong>and</strong> Clark 2004. A number of papers have also been published in the<br />
scientific literature using specimens or data from the 2004 biodiversity survey (e.g. De Domenico<br />
et al. 2006, Schiaparelli et al. 2006, Rehm et al. 2007, Kröger & Rowden 2008, Clark et al. 2010)<br />
ZBD2005-01 Balleny Isl<strong>and</strong>s Ecology Research, Tiama Voyage (2006).<br />
This voyage collected a large amount of new data from the Balleny Isl<strong>and</strong>s <strong>and</strong> surrounding waters<br />
using a range of methods, including bird <strong>and</strong> mammal observations, whale biopsy sampling, shorebased<br />
penguin colony surveys, SCUBA dive quadrats <strong>and</strong> transects, tissue collections for stable<br />
isotope analyses, <strong>and</strong> continuous acoustic/bathymetric data collection (Smith 2006). Some of the<br />
specimens <strong>and</strong> data have been used for other studies.<br />
ZBD2005-03 Opportunistic biological data during 2006 Ross Sea voyage utilising Tangaroa.<br />
This project is complete (MacDiarmid <strong>and</strong> Stewart <strong>2012</strong>).In brief it proved feasible to assess<br />
demersal fish abundance using the camera <strong>and</strong> lights. Because sampling was restricted to areas<br />
outside the main fishery, no toothfish were observed. The camera system, (a predecessor to the deep<br />
towed imaging system (DTIS)) proved capable of characterizing the demersal fish habitat<br />
associations. Sampling using a variety of methods yielded specimens <strong>and</strong> tissue samples of a wide<br />
variety of benthic <strong>and</strong> pelagic organisms. The acoustic information collected on water column<br />
organisms was less useful than desired because of interference from the bottom profiling aspects of<br />
the voyage. Marine mammals <strong>and</strong> seabirds were routinely recorded <strong>and</strong> automated sampling of the<br />
surface waters using a continuous plankton recorder <strong>and</strong> instruments to record sea surface<br />
temperature, salinity <strong>and</strong> chlorophyll-a concentration was successful.<br />
ZBD2008-23 Macroalgae diversty <strong>and</strong> benthic community structure at the Balleny Isl<strong>and</strong>s.<br />
Project complete. As a result of this study, the known macroalgal flora of the Balleny Isl<strong>and</strong>s has<br />
increased from 13 to 27 species, <strong>and</strong> there are 2 new records for the Ross Sea in addition to the 3<br />
new records reported by Page et al. (2001). The biodiversity however remains poorly known, <strong>and</strong><br />
detailed comparisons with other parts of the Antarctic region would be premature. A high<br />
proportion of the taxa reported here are known from only one collection, with a further group of<br />
taxa known from either two or three collections. Many of the taxa cannot be fully documented as<br />
there is insufficient mature material available.<br />
The samples collected as part of a benthic survey at Borradaile Isl<strong>and</strong>, one of the Balleny Isl<strong>and</strong>s<br />
group, during the 2006 Tiama expedition have been analysed to provide an assessment of benthic<br />
community structure. The Borradaile Isl<strong>and</strong> sites were located in a high energy environment,<br />
sediments had relatively high organic <strong>and</strong> chlorophyll a content, <strong>and</strong> considerably lower<br />
274
AEBAR <strong>2012</strong>: Marine <strong>Biodiversity</strong><br />
concentrations of degraded plant material (phaeophytin) than noted in previously surveyed<br />
southern Ross Sea locations. Borradaile Isl<strong>and</strong> macrofaunal diversity was within the range noted for<br />
the more southern sites; macrofaunal abundance however, was more variable. Epifaunal diversity<br />
was very low, with the seastar Odontaster validus the only large epifaunal taxon found. In contrast,<br />
the Borradaile Isl<strong>and</strong> dive sites had high macroalgal diversity. Although not observed at these dive<br />
sites, the Tiama voyage researchers noted shallow water areas with high diversities of encrusting<br />
organisms. This study has provided the first analysis of shallow water benthic communities of the<br />
Balleny Isl<strong>and</strong>s. While it has shown some interesting similarities <strong>and</strong> contrasts in benthic diversity<br />
with other coastal Ross Sea locations, this information from Borradaile Isl<strong>and</strong> may not be<br />
representative of the entire Balleny area, <strong>and</strong> further surveys from other sites within the Balleny<br />
group are recommended (Nelson et al. 2010).<br />
ZBD2008-20 Ross Sea Ecosystem function: predicting consequences of shifts in food supply.<br />
Project complete. Detailed information on the uptake <strong>and</strong> incorporation of different primary food<br />
sources to key epibenthic species help predict consequences of potential environmental change. Over<br />
a two year period, in situ investigations into responses to, <strong>and</strong> utilisation of, primary food sources by<br />
a common ophiuroid, were conducted at two contrasting coastal Ross Sea locations, Granite Harbour<br />
<strong>and</strong> New Harbour. At both locations, benthic net primary production was measured <strong>and</strong> the<br />
contributions of large macrobenthic organisms to ecosystem functions such as organic matter<br />
processing <strong>and</strong> nutrient recycling were quantified. Granite Harbour benthic soft-sediments supplied<br />
overlying waters with regenerated ammonium <strong>and</strong> phosphate, <strong>and</strong> the ophiuroid significantly<br />
increased the rates of nutrient release. Ultimately, the nutrients will be used by microalgae in the<br />
water column <strong>and</strong> under the ice. Detrital algae (phaeophytin) were present in sediments at greater<br />
concentrations than fresh microalgal material (chlorophyll a), <strong>and</strong> appears to be functionally<br />
important; it was a significant predictor of dissolved oxygen, phosphate, ammonium <strong>and</strong> nitrate-plusnitrite<br />
flux. Benthic organisms in predominantly ice covered Ross Sea locations such as Granite<br />
Harbour probably feed on degraded detrital algae for much of year, given the limited amount of fresh<br />
microalgae available due to the dimly lit environment, <strong>and</strong> the consequently low rates of in situ<br />
benthic primary production. Results of the New Harbour investigations contrast those of Granite<br />
Harbour, reflecting the very different ice conditions at these two locations (Cummings et al. 2010;<br />
Lohrer et al. <strong>2012</strong>).<br />
IPY2007-01 NZ International Polar Year Census of Antarctic Marine Life<br />
Overall science objectives for the Project were developed by MPI, NIWA <strong>and</strong> other interested <strong>and</strong><br />
participatory parties in discussions held through the Ocean Survey 20/20 Science Working Group.<br />
1. To measure <strong>and</strong> describe the relationships between patterns of marine organisms, their<br />
biodiversity <strong>and</strong> environmental variables between longitudes ~170°E <strong>and</strong> ~175°W, <strong>and</strong><br />
depths down to ~3500-4000m in the Ross Sea region.<br />
2. To assess the trophic interrelationships of the major functional groups in the Ross Sea <strong>and</strong><br />
regional ecosystem, with particular reference to improving inputs to ecosystem modelling.<br />
3. To obtain baseline measures of the marine environment <strong>and</strong> identify a suite of ecosystem or<br />
environmental indicators that could potentially be used to monitor change in response to<br />
environmental or anthropogenic forcing in the Ross Sea region<br />
All specific objectives apart from objective 2 have now been completed.<br />
Specific Objective 1: To measure seabed depth <strong>and</strong> rugosity using the multibeam system (whenever<br />
possible) to identify topographic features such as bottom type, iceberg scouring, seamounts etc <strong>and</strong><br />
to determine areas for targeted benthic fauna sampling. (not funded in this project). Objective<br />
Completed. (Mitchell 2008, Hanchet et al. 2008)<br />
275
AEBAR <strong>2012</strong>: Marine <strong>Biodiversity</strong><br />
Specific Objective 2: To continue the analysis of opportunistic seabird <strong>and</strong> marine mammal<br />
distribution observations from this <strong>and</strong> previous BioRoss voyages <strong>and</strong> published records, <strong>and</strong> in<br />
relation to environmental variables. (Draft report completed.)<br />
The distributions of the seabird <strong>and</strong> marine mammal taxa reported from two RV Tangaroa voyages<br />
(TAN200602 <strong>and</strong> TAN200802) have been mapped. These represent the count data of seabirds<br />
recorded during the 2006 Ross Sea voyage <strong>and</strong> the locations of images of seabird taxa (recorded<br />
opportunistically) from the 2008 IPY-CAML voyage <strong>and</strong> records from observers from the<br />
toothfish fishery. The distributions include the presence data of taxa over waters south of about 60°<br />
S to the Ross Sea. Additional work to explain the distribution of the most common seabirds in<br />
relation to environmental variables has been proposed but has not yet started.<br />
Specific Objective 3: To identify <strong>and</strong> determine near-surface spatial distribution, diversity <strong>and</strong><br />
abundance of phytoplankton, <strong>and</strong> zooplankton, based on Continuous Plankton Recorder samples<br />
collected during transit to <strong>and</strong> from the Ross Sea.<br />
The Continuous Plankton Recorder (CPR) was deployed during the IPY voyage, both during the<br />
transit to <strong>and</strong> from Wellington, <strong>and</strong> within the Ross Sea itself. CPR silks collected during transit<br />
were preserved in formalin <strong>and</strong> sent to Australian Antarctic Division where they were analyzed for<br />
zooplankton species composition <strong>and</strong> abundance. CPR silks collected within the Ross Sea were<br />
preserved in ethanol for the analysis of epipelagic meroplankon. In addition to the zooplankton,<br />
sampling, water samples were collected for phytoplankton analysis using the underway water<br />
sampling system from a depth of 7 m, corresponding to the approximate depth of CPR sampling.<br />
In addition to the work described above, ICOMM (International census of marine microbes)<br />
samples collected during the IPY-CAML survey (10 m depth x 4 stations) have been analysed by<br />
collaborators in the USA (Ghiglione et al. <strong>2012</strong>).<br />
Specific Objective 4: To analyse underway <strong>and</strong> station data collected on salinity, temperature <strong>and</strong><br />
chlorophyll a data, spot optical measurements with the SeaWiFS Profiling Multichannel<br />
Radiometer (SPMR), surface samples for chlorophyll a, nutrients <strong>and</strong> particle analysis as well as<br />
underway nutrient observations to allow ground-truthing of data collection from satellites <strong>and</strong><br />
identify water masses (e.g. surface seawater temperature, <strong>and</strong> chlorophyll concentration).<br />
This objective addressed background physical <strong>and</strong> surface biological conditions at the time of the<br />
IPY-CAML survey. The objective was split into two parts 1. characterisation of the biological<br />
environment <strong>and</strong> bio-optical regime using continuous underway sampling, <strong>and</strong> 2. identification of<br />
thermohaline fronts using discrete <strong>and</strong> underway sampling of temperature, salinity <strong>and</strong> nutrient<br />
profiles. The combined dataset was used to validate satellite data of temperature <strong>and</strong> surface<br />
chlorophyll distributions, providing a synoptic overview of physical <strong>and</strong> biological conditions<br />
during the survey.<br />
Specific Objective 5: To identify <strong>and</strong> determine the spatial distribution, abundance (biomass),<br />
diversity, <strong>and</strong> size structure of epipelagic, mesopelagic (<strong>and</strong> possibly bathypelagic) species using<br />
acoustics data, target strength estimation techniques <strong>and</strong> net sampling.<br />
This objective addressed samples collected using the mesopelagic trawl <strong>and</strong> acoustic data collected<br />
from midwater marks using the ship’s echosounders. Results were presented at five conferences:<br />
1) CAML-IPY Symposium in Genoa, Italy, May 2009; 2) CCAMLR SG-ASAM meeting in<br />
Genoa, Italy, May 2009; 3) Antarctic New Zeal<strong>and</strong> conference in Auckl<strong>and</strong>, July 2009; New<br />
Zeal<strong>and</strong> Marine Sciences’ Society conference in Stewart Isl<strong>and</strong>, July 2011; <strong>and</strong> International Polar<br />
Year Symposium, Montreal, Canada, April <strong>2012</strong>. Results were also presented to the Ross Sea<br />
Bioregionalisation workshop in Wellington in June 2009 (see below) <strong>and</strong> were incorporated in the<br />
bioregionalisation reports prepared for CCAMLR (SC-CAMLR-XXIV-BG-25) <strong>and</strong> the Antarctic<br />
Treaty Consultative Meeting (ATCM). Reports include those by Koubbi et al. (2011), O’Driscoll<br />
(2009), O’Driscoll et al. (2009, 2011), Pinkerton et al. (in press), <strong>and</strong> Hanchet et al. (in press).<br />
276
AEBAR <strong>2012</strong>: Marine <strong>Biodiversity</strong><br />
Specific Objective 6: To identify <strong>and</strong> measure diversity, distribution <strong>and</strong> densities of<br />
mesozooplankton, macrozooplankton <strong>and</strong> meroplankton.<br />
This objective addressed the samples taken by Multiple Opening/Closing Net <strong>and</strong> <strong>Environment</strong>al<br />
Sampling System (MOCNESS) from the sea surface to the sea floor. The samples were<br />
quantitatively divided at sea to allow several complementary analyses to be performed. In terms of<br />
the mesozooplankton community in the Ross Sea, copepods were the dominant zooplankton<br />
collected in most samples, <strong>and</strong> this was primarily calanoids <strong>and</strong> cyclopoids (i.e., Oithona spp.).<br />
However, in certain cases pteropods (Limacina helacina antarctica) <strong>and</strong> salps (Salpa thompsoni)<br />
made important contributions to mesozooplankton abundance. Total water column<br />
mesozooplankton biomass ranged between 0.6-9.1 g C m -2 <strong>and</strong> was usually highest close to the<br />
surface. Mesozooplankton biomass in the Ross Sea was generally higher than expected, <strong>and</strong> can<br />
rival that of productive subantarctic regions (e.g., South Georgia). Salps were the main<br />
macrozooplankton species recorded in the MOCNESS samples <strong>and</strong> a paper describing the<br />
population ecology <strong>and</strong> distribution of Salpa thompsoni on the continental slope <strong>and</strong> around the<br />
seamounts to the north of the Ross Sea has been published by Pakhamov et al. (2011).<br />
Samples were also preserved in ethanol for the analysis of meroplankton species composition <strong>and</strong><br />
DNA sequencing. Larvae from at least eight phyla were found, with a remarkable dominance of<br />
annelids in both abundance <strong>and</strong> diversity. Overall, larval abundances observed were lower than<br />
other Antarctic studies, likely attributable to the late summer sampling, months after Ross Sea’s<br />
phytoplankton bloom <strong>and</strong> the main trigger of spawning in many benthic invertebrates. Analysis of<br />
variation in meroplankton community composition showed significant differences among<br />
geographic regions (Shelf, Slope <strong>and</strong> waters of the Antarctic Circumpolar Current - ACC), among<br />
water masses (Shelf Water, Antarctic Surface Water, <strong>and</strong> Circumpolar Deep Water), <strong>and</strong> among<br />
depth strata (upper, midwater <strong>and</strong> bottom). Overall, near surface waters showed greater larval<br />
abundances, <strong>and</strong> these values decreased from the continental shelf to the slope, declining further in<br />
the deeper waters of the ACC. Differences between these locations were due not only to the<br />
presence or absence of certain taxa, but also a result of changes in OTU abundance.<br />
Specific Objective 7: To determine diversity, distribution <strong>and</strong> densities of viral, bacterial,<br />
phytoplankton <strong>and</strong> microzooplankton species in the water column.<br />
The full data sets have been completed <strong>and</strong> loaded into an MPI database <strong>and</strong> to the South western<br />
Pacific OBIS node (Gordon 2000). Phytoplankton <strong>and</strong> nanoplankton cell counts have revealed that<br />
there is a significant difference between shelf <strong>and</strong> abyssal site water column assemblages, both in<br />
terms of cell numbers, diversity <strong>and</strong> density. These data now have to be integrated with the water<br />
column data to help underst<strong>and</strong> what may be driving the changes in these compositions.<br />
Specific Objective 8: To determine the spatial distribution, abundance (biomass), diversity, <strong>and</strong> size<br />
structure of shelf <strong>and</strong> slope demersal fish species <strong>and</strong> associated invertebrate species using a<br />
demersal survey.<br />
This objective had three key tasks; (i) to identify specimens, update the Ross Sea species list <strong>and</strong><br />
determine biodiversity, (ii) to identify fish assemblages <strong>and</strong> relate them to environmental data, <strong>and</strong><br />
(iii) to compare estimates of fish density <strong>and</strong> abundance between trawls, visual (video & still<br />
images) <strong>and</strong> acoustic sampling techniques. A fourth key task, to determine density <strong>and</strong> abundance<br />
of demersal fish using a bottom trawl survey, was funded under MPI project ANT2007-02. Results<br />
have been published as three scientific journal papers with an additional paper in review, <strong>and</strong> have<br />
been submitted to several CCAMLR working group meetings.<br />
A paper on the distribution <strong>and</strong> diversity of demersal <strong>and</strong> pelagic fish species in the Ross Sea<br />
region including results from both the BioRoss <strong>and</strong> IPY surveys <strong>and</strong> collections from the toothfish<br />
fishery will soon be published (Hanchet et al. in press). A diverse collection of over 2,500 fish<br />
277
AEBAR <strong>2012</strong>: Marine <strong>Biodiversity</strong><br />
specimens was obtained from the BioRoss <strong>and</strong> IPY-CAML surveys representing 110 species in 21<br />
families. When combined with previous documented material this gave a total species list of 175,<br />
of which 137 were from the Ross Sea shelf <strong>and</strong> slope (to the 2,000 m isobath). Demersal species<br />
richness, diversity <strong>and</strong> evenness indices all decreased going from the shelf to the slope <strong>and</strong> the<br />
seamounts. In contrast, indices for pelagic species were similar for the slope <strong>and</strong> seamounts/abyss<br />
but were much lower for the shelf.<br />
A paper on the variation of demersal fish assemblages in the western Ross Sea including results<br />
from both the BioRoss <strong>and</strong> IPY surveys has been published (Clark et al. 2010). The distribution<br />
<strong>and</strong> abundance of 96 species able to be identified to species level collected in these surveys were<br />
examined to determine if demersal fish communities varied throughout the area, <strong>and</strong> what<br />
environmental factors might influence this. Three broad assemblages were identified, in the<br />
southern Ross Sea (south of 74ºS), central–northern Ross Sea (between latitudes 71º–74ºS), <strong>and</strong><br />
the seamounts further north (65º–68ºS) where some species more typical of sub-Antarctic latitudes<br />
were observed. Multivariate analyses indicated that environmental factors of seafloor rugosity<br />
(roughness), temperature, depth, <strong>and</strong> current speed were the main variables determining patterns in<br />
demersal fish communities.<br />
Acoustic data collected during the demersal survey suggest that there may be potential to use<br />
fisheries acoustic methods to obtain estimates of grenadier abundance (O’Driscoll et al. in press).<br />
The acoustic target strength distribution of single targets close to the bottom was very similar to<br />
that predicted based on the measured size range of grenadiers. There are also positive correlations<br />
between acoustic backscatter <strong>and</strong> trawl catches of grenadiers.<br />
Photographic data collected using NIWA’s Deep Towed Imaging System (DTIS) suggest that<br />
there may be potential to use photographic methods to obtain estimates of community structure<br />
<strong>and</strong> grenadier abundance (Bowden et al. in prep.).<br />
Twenty-three sites spanning the continental shelf, northern continental slope, abyssal plain, <strong>and</strong><br />
two seamounts were sampled using the towed camera <strong>and</strong> either demersal trawl or beam trawl,<br />
allowing direct comparisons between sampling methods. Patterns of species turnover between sites<br />
were similar across all methods. Estimates of fish population densities from the towed camera <strong>and</strong><br />
beam trawl data were also comparable but those from the demersal trawl were consistently lower<br />
than for the other methods. Macrourus spp. grenadiers were ca. eight times less abundant in the<br />
demersal trawl than the video data but more large individuals were sampled by the trawl than the<br />
video <strong>and</strong> biomass estimates were similar.<br />
Specific Objective 9: To determine the diversity, abundance/density, spatial distribution, <strong>and</strong><br />
physical habitat associations of benthic assemblages across a body size spectrum from megafauna<br />
to bacteria, for shelf, slope, seamounts, <strong>and</strong> abyssal sites in the Ross Sea.<br />
Using cameras, corers, epibenthic sleds, <strong>and</strong> trawls, benthic bacteria, macro-infauna, macrohyperbenthic<br />
fauna, <strong>and</strong> mega-epifauna were sampled at sites on the continental shelf <strong>and</strong><br />
previously unsampled areas on the northern continental slope of the Ross Sea, the abyssal plain,<br />
<strong>and</strong> seamounts to the north. Photographic data from seamounts in the northern Ross Sea region<br />
revealed a diverse <strong>and</strong> abundant fauna. Particularly striking were benthic communities comprised<br />
of stalked crinoids <strong>and</strong> brachiopods on Admiralty Seamount <strong>and</strong> the flanks of Scott Isl<strong>and</strong> which<br />
are reminiscent of an archaic fauna that may have survived through the isolation of these<br />
seamounts <strong>and</strong> reduced predator species (Bowden et al. 2010).<br />
Taxonomists in New Zeal<strong>and</strong> <strong>and</strong> around the world identified more than 150,000 individual<br />
specimens representing more than 700 species, many undescribed, across sixteen phyla for the<br />
mega-epifauna groups alone (e.g. Lörz 2009, 2010, Eléaume et al. 2011). At least three genera <strong>and</strong><br />
sixty-two species are new to science. All eukaryotic components of the benthic fauna showed<br />
similar broad-scale distributional trends across the study region. Total abundances <strong>and</strong> numbers of<br />
278
AEBAR <strong>2012</strong>: Marine <strong>Biodiversity</strong><br />
taxa were orders of magnitude higher on the continental shelf than on the slope or abyss plain, <strong>and</strong><br />
shelf, slope, <strong>and</strong> abyssal samples were distinct from each other in multivariate analyses. Diversity,<br />
however, was comparable between shelf <strong>and</strong> abyssal sites <strong>and</strong> lowest on the slope. Bacterial<br />
diversity was highest in abyssal <strong>and</strong> slope samples, but abundance, biomass, production, <strong>and</strong><br />
activity of all enzymes except proteinase, which was highest in the abyss, were significantly higher<br />
in shelf samples. Benthic mega-epifaunal community composition was more strongly correlated<br />
with depth <strong>and</strong> seabed current speed than either water column productivity or seasonal ice cover,<br />
indicating that local hydrodynamics <strong>and</strong> their influence on advection of primary production are<br />
more important in determining distributions across the shelf than are local variations in production.<br />
Fauna on the seamounts were distinct from all other samples <strong>and</strong> were comprised of both Antarctic<br />
<strong>and</strong> Southern Ocean species, including remarkable populations of a new hyocrinid species on<br />
Admiralty seamount (Bowden et al. 2011, Eléaume et al. 2011).<br />
Published research to date has provided new insights into the distributions of several taxonomic<br />
groups (Lörz et al. 2009) , raised questions about the history of the northern seamount fauna over<br />
evolutionary time (Bowden et al. 2011), <strong>and</strong> contributed to a meta-analysis of the relationship<br />
between productivity <strong>and</strong> diversity in the deep sea (Leduc et al. <strong>2012</strong>). In combination with<br />
molecular phylogenies <strong>and</strong> existing data from around Antarctica, results from this project represent<br />
a major contribution to knowledge of the Antarctic marine ecosystem.<br />
Specific Objective 10: To describe trophic/ecosystem relationships in the Ross Sea ecosystem<br />
(pelagic <strong>and</strong> benthic, fish <strong>and</strong> invertebrates).<br />
Progress has been made on obtaining data from which to elucidate trophic relationships between<br />
organisms in the Ross Sector of Antarctica collected on the IPY-CAML survey in February–March<br />
2008. Two methods have been used. First, 1081 stomachs from 22 species of Antarctic fish were<br />
examined <strong>and</strong> the contents of the full or partially-full stomachs (comprising 776 fish) were<br />
identified to 68 prey codes. Index of Relative Importance (IRI) has been calculated from these data<br />
<strong>and</strong> diet overlap between fish species is presented. Second, stable isotope <strong>and</strong> elemental<br />
composition analysis of samples were carried out for carbon <strong>and</strong> nitrogen. In total, nearly 2000<br />
samples were analysed. Samples include:<br />
• Fish (N=662 muscle, N=377 liver samples, 22 species);<br />
• Cephalopods (N=193);<br />
• Pelagic invertebrates (N=407);<br />
• Benthic sediments (N=36);<br />
• Phytoplankton (N=92);<br />
• Benthic invertebrates (N=200 completed, 95 pending analysis);<br />
Results have already been used to assist in parameterising <strong>and</strong> validating the quantitative model of<br />
the food web of the Ross Sea (paper accepted by CCAMLR Science). Research on the shrinkage of<br />
Antarctic silverfish carried out as part of this objective has contributed to a paper presented to the<br />
Ministry of Fisheries Antarctic Fisheries Working Group <strong>and</strong> accepted for submission to the<br />
CCAMLR working group on fisheries assessment in September 2010 (Pinkerton et al. 2007,<br />
2009a, 2009b).<br />
Specific Objective 11: Assess molecular taxonomy <strong>and</strong> population genetics of selected Antarctic<br />
fauna <strong>and</strong> flora to estimate evolutionary divergence within <strong>and</strong> among ocean basins in circumpolar<br />
species. Provide DNA barcoding for all fish <strong>and</strong> multi-cellular invertebrate species by sequencing<br />
reference specimens in conjunction with Canadian Barcoding Centre, for specimen identification<br />
in gut content, plankton, <strong>and</strong> in taxonomic <strong>and</strong> population genetic projects.<br />
DNA data sets generated for selected Ross Sea taxa were combined with parallel data sets<br />
generated by other Institutes in order to estimate divergence within <strong>and</strong> among regions in the<br />
Southern Ocean. High levels of divergence, indicative of cryptic speciation, were found in all<br />
279
AEBAR <strong>2012</strong>: Marine <strong>Biodiversity</strong><br />
major groups tested to date. Fishes: DNA sequencing of the COI gene revealed four well supported<br />
clades among the three recognized species of Macrourus in the Southern Ocean, indicating the<br />
presence of an undescribed species (Smith et al. 2011). A conclusion subsequently supported by<br />
meristic <strong>and</strong> morphometric examination of specimens with the description of a new species by<br />
McMillan et al. (<strong>2012</strong>). DNA barcodes also showed high sequence divergence among specimens<br />
of the slender codling Halargyreus johnsonii from New Zeal<strong>and</strong> <strong>and</strong> the Southern Ocean,<br />
indicative of a cryptic species in this cosmopolitan species (Smith et al. 2011). A study of<br />
snailfishes collected during the IPY survey <strong>and</strong> from the toothfish fishery showed high species<br />
diversity with more than 34 Ross Sea liparid species in three genera; 18 of them new to science<br />
divergence (Stein <strong>2012</strong>).<br />
Invertebrates: A combined NZ-BAS data set on the octopod genus Pareledone provided one of the<br />
largest barcoding studies on a Southern Ocean genus. Ross Sea specimens provisionally identified<br />
as Pareledone aequipapillae appeared in a discrete clade to specimens from the Antarctic<br />
Peninsula, with a barrier to gene flow to the west of the Antarctic Peninsula (Allcock et al. 2010).<br />
Large numbers of echinoderms have been tissue sampled <strong>and</strong> sequenced for COI <strong>and</strong> include the<br />
Asteroidea, Ophiuroidea, Echinoidea, Holothuroidea, <strong>and</strong> the crinoids (Dettai et al. in press). In the<br />
Ophiuroidea two dominant patterns emerged: a. widely distributed species showing shallow<br />
divergence by location <strong>and</strong> b. species with deeper divergence associated with location or depth,<br />
that represent cryptic species. A similar pattern emerged in the smaller set of Asteroid sequences,<br />
with deep divergences within some Ross Sea taxa. Preliminary results for the amphipod genus<br />
Rhacotropis showed 5 well supported clades, indicative of cryptic taxa; while for the genus<br />
Epimeria (27 specimens from the Ross Sea) there were two well supported clades for specimens<br />
identified as Epimeria robusta, <strong>and</strong> likewise for specimens identified as E. schiaparelli, indicative<br />
of cryptic taxa (Lörz 2009, 2010, Lörz et al. in press). These taxa show shallow morphological<br />
differences.<br />
IPY2007-02 NZ IPY-CAML Cephalopoda.<br />
This project will report on the diversity of Antarctic Cephalopoda (Octopus <strong>and</strong> Squid), including a<br />
complete inventory of taxa, <strong>and</strong> reports on ontogenetic <strong>and</strong> sexual variation in species, their<br />
systematics, diversity, distribution, life histories, <strong>and</strong> trophic importance. A MAppSc thesis has been<br />
completed as part of this project (Garcia 2010).<br />
Other research relevant or specifically linked to the projects above, are listed in Table 11.8.<br />
Table 11.8: Other research linked to MPI Ross Sea Antarctica biodiversity programme.<br />
MPI<br />
ANT2011-01 Stock modelling, fishery effects <strong>and</strong> ecosystems of the Ross Sea<br />
MBIE C01X1001 Protecting Ross Sea Ecosystems. Comparative distribution <strong>and</strong> ecology of Macrourus<br />
caml <strong>and</strong> M. whitsoni in the Ross Sea region; feeding relationships of fish species in the Ross Sea<br />
region; Spatial processes, including spatial marine protection; Ecosystem modelling of the Ross<br />
Sea region).(Pinkerton et al. <strong>2012</strong>a,b; Murphy et al. <strong>2012</strong>)<br />
DOC Leigh Torres NIWA/Alison<br />
OTHER Universities NIWA;Lincoln, Canterbury, Otago, Auckl<strong>and</strong>, Waikato<br />
EMERGING ISSUES<br />
Coastal research <strong>and</strong> functional ecology-ongoing need<br />
Taxonomic issues for fish <strong>and</strong> invertebrates (from IPY)ANT 2005-02<br />
Water samples from throughout water column to assess microbial content (from IPY) check with Els<br />
280
AEBAR <strong>2012</strong>: Marine <strong>Biodiversity</strong><br />
11.4. Progress <strong>and</strong> re-alignment<br />
Given that the MPI <strong>Biodiversity</strong> programme has been running for 11+ years, <strong>and</strong> that a number of<br />
new strategic documents <strong>and</strong> directions are emerging across government, it is time to look both back<br />
<strong>and</strong> forward <strong>and</strong> review the programme to ensure its alignment with more recent strategic documents.<br />
In 2000, five strategic outcomes were built into the MPI <strong>Biodiversity</strong> Research Programme:<br />
That by 2010:<br />
i) the MPI <strong>Biodiversity</strong> programme will have become an integral part of the research effort<br />
devoted to underst<strong>and</strong>ing New Zeal<strong>and</strong>’s marine environment.<br />
ii) research planning will benefit from close cooperative relationships within the Ministry of<br />
Fisheries, with other government agencies, <strong>and</strong> with external stakeholders.<br />
iii) mutually beneficial collaborative research projects will be carried out alongside other New<br />
Zeal<strong>and</strong> <strong>and</strong> international research providers, especially for vessel-based research.<br />
iv) MPI <strong>Biodiversity</strong> projects will have contributed substantially to an improved underst<strong>and</strong>ing<br />
of New Zeal<strong>and</strong>’s marine biodiversity <strong>and</strong> its role in marine ecosystem function, yielding<br />
scientifically rigorous outputs for a national <strong>and</strong> international professional audience.<br />
v) results generated by MPI <strong>Biodiversity</strong> projects will be incorporated into management<br />
policy, with clear benefits for the New Zeal<strong>and</strong> marine environment.<br />
The <strong>Biodiversity</strong> Programme has been highly effective in delivering on the first 4 <strong>and</strong> part of the 5 th of<br />
the five outcomes. A missing element is some measure of “clear benefits for the New Zeal<strong>and</strong> marine<br />
environment”. In recent years, significant all-of-government projects have been administered through<br />
the programme, <strong>and</strong> one-off funding applications made jointly with other stakeholders have been<br />
successful. The Programme has made a significant contribution to increasing underst<strong>and</strong>ing about<br />
biodiversity in the marine environment. Achievements in each outcome are addressed below.<br />
i) Has the <strong>Biodiversity</strong> Research Programme become integrated with New Zeal<strong>and</strong>’s research effort<br />
to underst<strong>and</strong> the marine environment?<br />
Seven science objectives were developed by multiple stakeholders through the <strong>Biodiversity</strong> Research<br />
Advisory Group. The agreed objectives include ecosystem-scale studies in the New Zeal<strong>and</strong> marine<br />
environment, the classification <strong>and</strong> characterisation of the biodiversity of nearshore <strong>and</strong> offshore<br />
marine habitats, the role of biodiversity in the functional ecology of marine communities, connectivity<br />
<strong>and</strong> genetic marine biodiversity, the assessment of the effects of climate change <strong>and</strong> increased ocean<br />
acidification, identification of indicators of biodiversity that can be used to monitor change,<br />
identification of key threats to biodiversity, identification of threats <strong>and</strong> impacts to biodiversity <strong>and</strong><br />
ecosystem functioning beyond natural environmental variation.<br />
Projects ranged from localised experiments on seabed communities of shellfish <strong>and</strong> echinoderms, to<br />
integrated studies of rocky reef systems <strong>and</strong> offshore fishery-scale trophic studies. The effects of<br />
ocean climate change (temperature, acidification) are being explored on shellfish, rhodolith<br />
communities, plankton productivity <strong>and</strong> the microbial productivity engines of polar waters. A major<br />
project to investigate shelf communities in relation to climate over the past 1000 years has resulted in<br />
the development of new methods <strong>and</strong> insights to past changes <strong>and</strong> human impact on New Zeal<strong>and</strong>’s<br />
marine environment.<br />
A total of 55 projects were commissioned <strong>and</strong> managed within this 10 year period, yielding over 100<br />
final research reports, most of which have been published through MPI Publications (Marine<br />
Biosecurity <strong>and</strong> <strong>Biodiversity</strong> Reports <strong>and</strong> <strong>Aquatic</strong> <strong>Environment</strong> <strong>and</strong> <strong>Biodiversity</strong> Reports), books,<br />
Identification Guides <strong>and</strong> mainstream scientific literature. A number of other publications are still in<br />
preparation. In addition, several workshops have been run through the Programme, including<br />
qualitative modelling techniques, how to set up a marine monitoring programme <strong>and</strong> predictive<br />
281
AEBAR <strong>2012</strong>: Marine <strong>Biodiversity</strong><br />
modelling. A large number of science providers, including NIWA, Cawthron Institute, University of<br />
Auckl<strong>and</strong>, Auckl<strong>and</strong> University of Technology, University of Waikato, Victoria University of<br />
Wellington, University of Otago, University of Canterbury <strong>and</strong> Massey University have been directly<br />
commissioned or sub-contracted to take part in or conduct research projects through the Programme<br />
during the 10-year period. For some, the projects have provided critical synergies with MBIE funded<br />
OBIs or projects, while others have provided one-off opportunities for marine biodiversity<br />
investigation or opportunistic leveraging for research voyages.<br />
Research into the biodiversity of habitats such as seamounts has been completed <strong>and</strong> new methods to<br />
assess the vulnerability of seabed habitats have been developed. The l<strong>and</strong>-sea interface is being<br />
investigated <strong>and</strong> projects have shown how l<strong>and</strong> use in a given catchment can affect nutrient transfer<br />
<strong>and</strong> the living conditions <strong>and</strong> impact diversity <strong>and</strong> functioning of estuarine <strong>and</strong> coastal organisms.<br />
Publication <strong>and</strong> presentation of the results from these projects has resulted in widespread contribution<br />
to the development of Marine Science in New Zeal<strong>and</strong>. Partnership with overseas researchers <strong>and</strong><br />
presentations to international meetings <strong>and</strong> conferences has added to the growing global initiatives on<br />
marine biodiversity research questions.<br />
Feedback from stakeholders has indicated that the move to a 5 year research planning horizon was<br />
welcomed by research providers, but some stakeholders felt that Requests for Proposals should be at a<br />
higher level than individual projects to safeguard intellectual property on new ideas <strong>and</strong> methods.<br />
ii) Does research planning now benefit from close cooperative relationships within the Ministry<br />
of Fisheries, with other government agencies, <strong>and</strong> with external stakeholders?<br />
The <strong>Biodiversity</strong> Programme is very co-operative. Of 38 projects underway in the last 5 years, 14<br />
have formal collaborative components across government departments, with other stakeholders or<br />
multiple research providers <strong>and</strong> 10 have formal linkages to international research programmes. Within<br />
MPI <strong>and</strong> with other stakeholders (NGOs, industry, other government departments), the <strong>Biodiversity</strong><br />
Projects have contributed to discussions about Marine Stewardship Council (MSC) certification, to<br />
decision papers on aspects of Antarctic management under CAMLR, fulfilling MPI commitments to<br />
the NZ <strong>Biodiversity</strong> Strategy, <strong>and</strong> to MPI progress towards recognising the role of the ecosystem in<br />
underpinning sustainable <strong>and</strong> healthy fisheries production. There are many other examples, e.g. the<br />
programme has towards DOC <strong>and</strong> MPI decisions on marine protected areas. The interaction at the<br />
research <strong>and</strong> policy advice stages of resource management feeds back into the BRAG planning for<br />
future research.<br />
There are close links with the MPI <strong>Aquatic</strong> <strong>Environment</strong> research programme, the National <strong>Aquatic</strong><br />
<strong>Biodiversity</strong> Information System (NABIS), an MPI web-based interactive data access <strong>and</strong> mapping<br />
tool) <strong>and</strong> the MPI Antarctic Research programme. These <strong>and</strong> other links have enabled contributions<br />
resulting from progress on l<strong>and</strong>-sea interface research, habitats of significance to fisheries<br />
management, trophic studies (MSC Certification), climate change (effects on shellfish) <strong>and</strong> habitat<br />
classification (fish optimised MEC, testing of MEC <strong>and</strong> BOMEC). The successful involvement of the<br />
<strong>Biodiversity</strong> Programme in major all-of-government projects such as Ocean Survey 20/20 <strong>and</strong> IPY-<br />
CAML, has also raised the profile of MPI <strong>and</strong> the research it has commissioned both across New<br />
Zeal<strong>and</strong> <strong>and</strong> internationally.<br />
Datasets, voucher specimens <strong>and</strong> samples from all biodiversity research projects have resulted in a<br />
substantial amount of material that has been physically preserved <strong>and</strong> housed in the Te Papa Fish<br />
Collection <strong>and</strong> NIWA National Invertebrate Collection. All data are held in databases either at MPI,<br />
NIWA or Te Papa, <strong>and</strong> accessibility is being improved. The recent Bay of Isl<strong>and</strong>s Ocean Survey<br />
20/20 Portal was very well received <strong>and</strong> nominated for NZ Govt Open Source awards. It will also<br />
incorporate data access from Chatham Challenger <strong>and</strong> IPY projects. Data from a number of MPI<br />
biodiversity projects have also been entered into international biodiversity databases such as OBIS<br />
<strong>and</strong> from there into the Global <strong>Biodiversity</strong> Information Facility (GBIF).<br />
282
AEBAR <strong>2012</strong>: Marine <strong>Biodiversity</strong><br />
<strong>Biodiversity</strong> Research planning receives regular input from DOC, SeaFIC, MfE, Cawthron Institute,<br />
NIWA, GNS, LINZ, MAFBNZ, Te Papa, University of Auckl<strong>and</strong>, AUT, University of Otago,<br />
MoRST, MFAT, Regional Councils <strong>and</strong> others. Research planning for 2011-12 <strong>and</strong> beyond will<br />
include a re-alignment of the current research programme to take account of new developments such<br />
as Fisheries 2030, MfE’s National Monitoring programme, DOC’s integrated coastal monitoring<br />
programme, Statistic New Zeal<strong>and</strong>’s <strong>Environment</strong>al Domain Plan 69 , <strong>and</strong> international commitments<br />
such as the recent CBD COP10 Aichi-Nagoya Agreement.<br />
Feedback <strong>and</strong> support for projects by external stakeholders has shown that the Programme has been<br />
effective in promoting inter-agency collaboration. The Programme has also had close links with<br />
Research Data Management <strong>and</strong> the Observer Programme for certain projects (e.g trophic studies on<br />
the Chatham Rise, ZBD2004-02). With the former restructure of MPI <strong>and</strong> now the merger with MAF,<br />
<strong>and</strong> the move to Fisheries 2030 <strong>and</strong> Fisheries Plans, it important that the Programme develops strong<br />
relationships with the Fisheries Management <strong>and</strong> Strategy (International) groups within MPI <strong>and</strong> at<br />
MAF.<br />
iii) Have mutually beneficial collaborative research projects been carried out alongside other<br />
New Zeal<strong>and</strong> <strong>and</strong> international research providers, especially for vessel-based research?<br />
As discussed above, collaborative research projects across government <strong>and</strong> among research providers<br />
have resulted in many mutually beneficial data <strong>and</strong> specimen collection, surveys of New Zeal<strong>and</strong><br />
marine biodiversity in NZ territorial seas, the EEZ <strong>and</strong> the Ross Sea, groundbreaking research into<br />
seamount biodiversity <strong>and</strong> the identification of VMEs, <strong>and</strong> research for international collaboration,<br />
particularly vessel based studies. Large scale vessel dependent oceanic research projects have made<br />
significant gains in baseline knowledge about the distribution <strong>and</strong> abundance of biodiversity in the<br />
EEZ/Ross Sea region. Vessel-based projects include: NORFANZ (Norfolk Isl<strong>and</strong>-Australia-New<br />
Zeal<strong>and</strong> survey of biodiversity on Norfolk Ridge <strong>and</strong> Lord Howe Rise); BioRoss (MPI-LINZ, first NZ<br />
survey of biodiversity in the Ross Sea); Chatham-Challenger (LINZ-MPI-NIWA-DOC first Ocean<br />
Survey 20/20 project), NZ IPY-CAML (MPI-LINZ-NIWA (with international <strong>and</strong> NZ wide<br />
collaboration) survey of the Ross Sea as part of International Polar Year; <strong>Biodiversity</strong> of seamounts<br />
(MPI-NIWA-LINZ-MBIE voyages to the Kermadec Arc <strong>and</strong> on the Chatham Rise). These projects<br />
have generated huge geo-referenced datasets <strong>and</strong> thous<strong>and</strong>s of specimens for Te Papa <strong>and</strong> National<br />
Invertebrate Collections. They have also resulted in the identification of new species, new genera <strong>and</strong><br />
new families, as well as new records extending the known distribution of species. These surveys have<br />
contributed to habitat classification, identified areas of high biodiversity <strong>and</strong> challenged paradigms on<br />
the environmental drivers that determine biodiversity. More recently they have provided new<br />
information on the effects of ocean acidification on the productivity of polar seas, <strong>and</strong> in New Zeal<strong>and</strong><br />
waters.<br />
Vessel dependent coastal projects have also generated significant new underst<strong>and</strong>ing about the<br />
distribution of inshore biota, <strong>and</strong> the role they play in maintaining a healthy ecosystem. Experimental<br />
field work on the productivity of the seabed has been carried out in NZ waters (Fiordl<strong>and</strong>, Otago, Bay<br />
of Isl<strong>and</strong>s, Hauraki Gulf, Kaipara <strong>and</strong> Manukau Harbours), <strong>and</strong> along the west coast of the Ross Sea.<br />
The impact of l<strong>and</strong> practices on the l<strong>and</strong>-sea interface has also highlighted real downstream effects on<br />
the productivity of the coastal environment. These projects have provided new insights into the<br />
connectivity between different species groups, <strong>and</strong> data are being used in a number of ways to assist<br />
with spatial planning by RMAs.<br />
Feedback from stakeholders has indicated that the collaborative voyages administered through the<br />
Programme have successfully created synergy <strong>and</strong> opportunity for New Zeal<strong>and</strong> scientists as well as<br />
facilitating new international collaborations.<br />
69 http://www.stats.govt.nz/browse_for_stats/environment/natural_resources/environment-domain-plan-<br />
stocktake-paper.aspx<br />
283
AEBAR <strong>2012</strong>: Marine <strong>Biodiversity</strong><br />
iv) Have MPI [MFish] <strong>Biodiversity</strong> projects contributed substantially to an improved<br />
underst<strong>and</strong>ing of New Zeal<strong>and</strong>’s marine biodiversity <strong>and</strong> its role in marine ecosystem function,<br />
yielding scientifically rigorous outputs for a national <strong>and</strong> international professional audience?<br />
In the early years, the Programme focussed primarily on taxonomy <strong>and</strong> the description of marine<br />
biodiversity. As the Programme matured, projects to address biodiversity roles in ecosystem function<br />
were introduced. Some were experimental <strong>and</strong> on a local scale while others were on a regional scale.<br />
Recent projects have addressed patterns of marine biodiversity in relation to environmental drivers<br />
with ecosystem function. This enabled modelling to predict the distribution of biodiversity in<br />
unsurveyed areas of ocean, <strong>and</strong> evaluation of the vulnerability of biodiversity to perturbations such as<br />
climate change, as well as the modelling of trophic interactions among key fish species. Presentations<br />
of research results have been made to numerous overseas <strong>and</strong> New Zeal<strong>and</strong> science audiences, <strong>and</strong><br />
publications in the mainstream literature have been encouraged. IPY, Chat chall, Alison s etc CBD-<br />
FAO Int seabed authority<br />
v) Have results generated by MPI [MFish] <strong>Biodiversity</strong> projects been incorporated into<br />
management policy, with clear benefits for the New Zeal<strong>and</strong> marine environment?<br />
Examples of incorporation into management policy with clear benefits for the marine environment<br />
include the increased awareness of research topics initiated in the biodiversity programme by policy<br />
analysts to core <strong>Aquatic</strong> <strong>Environment</strong> research projects <strong>and</strong> Fishery Plans, (l<strong>and</strong>-use effects, climate<br />
change in the ocean, habitat classification); links to the Antarctic research programme <strong>and</strong> uptake into<br />
CCAMLR (ecotrophic studies, ecosystem baselines, VME risk assessment, bioregionalisation), spatial<br />
management (seamount closures, BPAs, MPAs, RMAs), the need by MfE to report on the marine<br />
environment at a national scale (plankton recording programme, Marine <strong>Environment</strong>al Monitoring<br />
Programme). MPI biodiversity advice is frequently requested to contribute to cross-government<br />
initiatives including Ocean Survey 20/20, DOC Sub-Antarctic Isl<strong>and</strong>s Forum National Monitoring,<br />
Stats New Zeal<strong>and</strong> Tier 1 statistic review <strong>and</strong> <strong>Environment</strong>al Domain Stocktake, International Year of<br />
<strong>Biodiversity</strong>, OECD <strong>and</strong> CBD reports, International Oceans Issues, SPRFMO, NRS marine issues<br />
paper, the Antarctic Science Framework, Ocean Fertilisation <strong>and</strong> IPCC Finally, the programme has<br />
contributed to New Zeal<strong>and</strong>’s efforts in the international Census of Marine Life <strong>and</strong> an ongoing<br />
assessment of New Zeal<strong>and</strong>’s progress in Marine <strong>Biodiversity</strong> has been proposed as a new Tier 1<br />
<strong>Environment</strong>al Statistic. However, the benefits to the marine environment are more inferred than<br />
demonstrated. There is substantially increased awareness within MPI <strong>and</strong> across government, that the<br />
health of fisheries <strong>and</strong> other valued uses of the sea depend on intact ecosystem services provided by<br />
the diversity of organisms, the diversity of habitats <strong>and</strong> the genetic diversity found in the marine<br />
environment. Statements of intent <strong>and</strong> long-term strategic documents such as Fisheries 2030 <strong>and</strong> Fish<br />
Plans have biodiversity protection <strong>and</strong> an ecosystem approach to fisheries management objectives<br />
explicitly stated. Future research questions will also need to address follow-up of management<br />
decisions to assess whether <strong>and</strong> to what extent the objectives have been achieved.<br />
In 2000, the concept of research on marine biodiversity was hotly debated among stakeholders <strong>and</strong> the<br />
benefit of the research (other than to scientists) was not widely accepted. In 2010, it is clear that much<br />
of the research in this biodiversity programme has been about defining <strong>and</strong> mapping the biological<br />
diversity of the sea, its roles in marine ecosystem function, threats to these roles <strong>and</strong> how best<br />
biodiversity <strong>and</strong> its successful protection can be measured. Huge advances have been made in<br />
providing new identification tools for major groups (e.g. Coralline algae …). Much progress has been<br />
made, <strong>and</strong> the programme has successfully raised the profile of biodiversity in coastal <strong>and</strong> ocean<br />
environmental management, in particular fisheries management, <strong>and</strong> biodiversity research uptake into<br />
policy <strong>and</strong> management decisions within MPI <strong>and</strong> across government.<br />
284
11.4.1. Concluding remarks<br />
AEBAR <strong>2012</strong>: Marine <strong>Biodiversity</strong><br />
New Zeal<strong>and</strong> is moving into an era of unprecedented <strong>and</strong> increasing interest in the utilisation of<br />
marine resources. Mineral, petroleum <strong>and</strong> gas resources are estimated to be worth billions of dollars to<br />
the economy (Glasby <strong>and</strong> Wright 1990), <strong>and</strong> new environmental legislation has been drafted (the<br />
Exclusive Economic Zone <strong>and</strong> Continental Shelf (<strong>Environment</strong>al Effects) Act <strong>2012</strong>). Changes inshore<br />
are also taking effect with the <strong>Environment</strong>al Protection Authority Act passed by Parliament on 11<br />
May 2011. This Act establishes a new <strong>Environment</strong>al Protection Authority (EPA) as a st<strong>and</strong>alone<br />
crown agent from 1 July 2011. The newly released Coastal Policy statement <strong>and</strong> proposed Policy<br />
Statement on Indigenous <strong>Biodiversity</strong> demonstrates an awareness by Government that much of New<br />
Zeal<strong>and</strong>’s primary production based economy is dependent on clean “green” policies supporting<br />
effective environmental management both on l<strong>and</strong>, freshwater <strong>and</strong> in the sea.<br />
New Zeal<strong>and</strong> is also a signatory to the CBD Aichi-Nagoya Agreement with a new International<br />
Decade for <strong>Biodiversity</strong> that runs 2011-2020 <strong>and</strong> New Zeal<strong>and</strong>’s contribution to the identification of<br />
EBSAs in the SW Pacific, <strong>and</strong> to GOBI. Progress in our knowledge of the marine biodiversity <strong>and</strong><br />
ecosystem services provided by the marine environment has clearly been made over the last decade.<br />
However, we need a more co-ordinated approach across government to link science to policy needs.<br />
For example, there is a compelling need for large-scale projects such as mapping seafloor habitats <strong>and</strong><br />
establishing long-term nation-wide monitoring <strong>and</strong> reporting schemes to measure the effects of ocean<br />
climate change, regular assessment of the cumulative effects of anthropogenic activities <strong>and</strong> multiple<br />
stressors in the ocean <strong>and</strong> the effectiveness of their management. Without these, we face the risks that<br />
New Zeal<strong>and</strong>’s “green” br<strong>and</strong>ing will be increasingly challenged, <strong>and</strong> that tipping points in the health<br />
of the aquatic environment may be reached too soon for evasive action to be taken.<br />
285
11.5. References<br />
AEBAR <strong>2012</strong>: Marine <strong>Biodiversity</strong><br />
Allcock A, Norman M, Smith P, Steinke D, Stevens D, Strugnell J (2010) Cryptic speciation <strong>and</strong> the circumpolarity debate: A case study on<br />
endemic Southern Ocean octopuses using the COI barcode of life. Deep-Sea Research II (2010), doi:10.1016/j.dsr2.2010.05.016<br />
Anderson OF, Bagley NW, Hurst RJ, Francis MP, Clark MR, et al. (1998). Atlas of New Zeal<strong>and</strong> fish <strong>and</strong> squid distributions from research<br />
bottom trawls. NIWA Tech Rep.42:1–303.<br />
Andrew, N. Francis, M. (eds.) (2003). The Living Reef: The Ecology of New Zeal<strong>and</strong>'s Rocky Reefs. Craig Potton Publishing, Nelson, New<br />
Zeal<strong>and</strong>.<br />
Anon (2000). The New Zeal<strong>and</strong> <strong>Biodiversity</strong> Strategy. Our chance to turn the tide. Department of Conservation <strong>and</strong> Ministry for the<br />
<strong>Environment</strong>. 146 p.<br />
Arnold A, (editor). (2004) Wellington: WWF-New Zeal<strong>and</strong>;. Shining a spotlight on the biodiversity of New Zeal<strong>and</strong>'s Marine Ecoregion.<br />
Asnaghi, V., Bertolotto, R., Giussani, V., Mangialajo, L., Hewitt, J., Thrush, S., Moretto, P., Castellano, M., Rossi, A., Povero, P., Cattaneo-<br />
Vietti, R. & Chiantore, M. (<strong>2012</strong>). Interannual variability in Ostreopsis ovata bloom dynamic along Genoa coast (North-western<br />
Mediterranean): a preliminary modeling approach. Cryptogamie Algologique,33:181-189.<br />
Ausubel, JH. Crist DT. Waggoner PE. (Eds) (2010). First census of marine life 2010 highlights of a decade of discovery Contributors: 2,700<br />
marine scientists from around the globe. A publication of the Census of Marine Life Census of Marine Life International<br />
Secretariat Consortium for Ocean Leadership Washington, DC USA www.coml.org<br />
Baco AR, Rowden AA, Levin LA, Smith CR, Bowden D. (2009). Initial characterization of cold seep faunal communities on the New<br />
Zeal<strong>and</strong> margin. Mar Geol. doi: 10.1016/j.margeo.2009.06.015.<br />
Bagley NW, Anderson OF, Hurst RJ, Francis MP, Taylor PJ. (2000). Atlas of New Zeal<strong>and</strong> fish <strong>and</strong> squid distributions from midwater<br />
trawls, tuna longline sets, <strong>and</strong> aerial sightings. NIWA Tech Rep.;72:1–171.<br />
Baird, S.J., Tracey, D., Mormede, S., Clark, M. (<strong>2012</strong>). The distribution of protected corals in New Zeal<strong>and</strong> waters. NIWA Client Report<br />
No: WLG<strong>2012</strong>-43 prepared for Department of Conservation, Wellington. 93 p.<br />
Baker CS, Chilvers BL, Constantine R, DuFresne S, Mattlin RH, van Helden A, Hitchmough R (2010). Conservation status of New Zeal<strong>and</strong><br />
marine mammals (suborders Cetacea <strong>and</strong> Pinnipedia), 2009. New Zeal<strong>and</strong> Journal of Marine <strong>and</strong> Freshwater Research 44: 101<br />
115.<br />
Batson, P. (2003). Deep New Zeal<strong>and</strong>: Blue Water, Black Abyss. Christchurch:Canterbury University Press.<br />
Battley, P.F., Melville, D.S., Schuckard, R., Ballance, P.F. (2005). Quantitative survey of the intertidal benthos of Farewell Spit, Golden<br />
Bay. Marine <strong>Biodiversity</strong> Biosecurity Report No. 7. 19 p.<br />
Beaumont J, MacDiarmid A, D'Archino R. (2010 ). Mapping the environmental values of New Zeal<strong>and</strong>'s marine ecosystem: A metaanalysis.<br />
Biosecurity NZ Tech Pap.;2010:1–76.<br />
Beaumont J, Oliver M, MacDiarmid A. (2008). Mapping the values of New Zeal<strong>and</strong>'s coastal waters. 1. <strong>Environment</strong>al values. Biosecurity<br />
NZ Tech Pap.;2008/16:1–89.<br />
Beaumont, J., MacDiarmid, A.B., Morrison, M. (in press). Rocky reef ecosystems – how do they function? Final Research Report for<br />
project ZBD200509 to MPI 296 p.<br />
Bostock, H., Tracey, D., Cummings, V., Mikaloff-Fletcher, S., Williams, M., Guy, C., Neil, H., Currie, K. (<strong>2012</strong>). Ocean acidification in<br />
fisheries habitat (ZBD201041). Research Progress Report prepared for the Ministry of Primary Industries Fisheries. 39 p.<br />
Bowden, D.A. (2011). Benthic invertebrate samples <strong>and</strong> data from the Ocean Survey 20/20 voyages to the Chatham Rise <strong>and</strong> Challenger<br />
Plateau, 2007. New Zeal<strong>and</strong> <strong>Aquatic</strong> <strong>Environment</strong> <strong>and</strong> <strong>Biodiversity</strong> Report No. 65. 40 p.<br />
Bowden D.A., Schiaparelli S., Clark M.R., Rickard G.J. (2011) A lost World? Archaic crinoid-dominated assemblages on an Antarctic<br />
seamount. Deep Sea Research Part II. Topical Studies in Oceanography 58:119-127<br />
Bowden DA, Hewitt J, Verdier A-L, Pallentin A (in press) (Project ZBD200701 Objective 14, The potential of multibeam echosounder data<br />
for predicting benthic invertebrate assemblages across Chatham Rise <strong>and</strong> Challenger Plateau. Draft <strong>Aquatic</strong> <strong>Environment</strong> <strong>and</strong><br />
<strong>Biodiversity</strong> Report, Ministry of Fisheries, New Zeal<strong>and</strong>, Wellington<br />
Bowden DA, Hewitt J. (<strong>2012</strong>). Recommendations for surveys of marine benthic biodiversity: outcomes from the Chatham-Challenger<br />
Ocean Survey 20/20 Post-Voyage Analyses Project New Zeal<strong>and</strong> <strong>Aquatic</strong> <strong>Environment</strong> <strong>and</strong> <strong>Biodiversity</strong> Report No. xx91. 34 p.<br />
Bowden, D.A.; Compton, T.J.; Snelder, T.H.; Hewitt, J.E. (2011b). Evaluation of the New Zeal<strong>and</strong> Marine <strong>Environment</strong> Classifications<br />
using Ocean Survey 20/20 data from Chatham Rise <strong>and</strong> Challenger Plateau. New Zeal<strong>and</strong> <strong>Aquatic</strong> <strong>Environment</strong> <strong>and</strong> <strong>Biodiversity</strong><br />
Report No. 77. 27 p.<br />
Bowden, DA, Hanchet, SM, Marriott, PM (in prep.). Population estimates of Ross Sea demersal fish: a comparison between video <strong>and</strong> trawl<br />
methods. (Submitted as short note to Fisheries Research)<br />
Boyd, P.W., Law, C.S. <strong>and</strong> S. C. Doney (in press). A climate change atlas for the Ocean. Oceanography.<br />
Bradford-Grieve J. Absence of government leadership is damaging the health of systematics <strong>and</strong> taxonomy in the UK. NZ Sci Rev.<br />
2008;65:84–88.<br />
Bradford-Grieve, J., Fenwick, G. (2001). A review of the current knowledge describing the biodiversity of the Ross Sea region.FRR<br />
Ministry of Fisheries Final Research Report for Project<br />
Bradford-Grieve, J., Fenwick, G. (2002). A review of the current knowledge describing the biodiversity of the Balleny Isl<strong>and</strong>s.<br />
FRR ZBD2000/01<br />
Bradford-Grieve J, Probert K, Lewis K, Sutton P, Zeldis J. (2006). New Zeal<strong>and</strong> shelf region In: Robinson AR, Brink KH, editors. The<br />
global coastal ocean: regional studies <strong>and</strong> syntheses. The Sea 14. New York: John Wiley & Sons, Inc;. pp. 1451–1492.<br />
Broom, J.E.S.; Hart, D.R.; Farr, T.J.; Nelson, W.A.; Neill, K.F.; Harvey, A.H.; Woelkerling, W.J. (2008). Utility of psbA <strong>and</strong> nSSU<br />
for phylogenetic reconstruction in the Corallinales based on New Zeal<strong>and</strong> taxa. Molecular Phylogenetics & Evolution 46: 958-<br />
973.<br />
Brown, CJ, Fulton, EA, Hobday, AJ, Matear, RJ, Possingham, HP, Bulman, C, Christensen, V, Forrest, RE, Gehrke, PC, Gribble, NA,<br />
Griffiths, SP, Lozano-Montes, H, Martin, JM, Metcalf, S, Okey, TA, Watson, R <strong>and</strong> Richardson, AJ (2010) Effects of climatedriven<br />
primary production change on marine food webs: implications for fisheries <strong>and</strong> conservation. Global Change Biology, 16<br />
4: 1194-1212<br />
Carroll, E.; J.A Jackson, JA; Paton, D.; Smith, T (in press). Estimating 19 th <strong>and</strong> 20 th century right whale catches <strong>and</strong> removals around east<br />
Australia <strong>and</strong> New Zeal<strong>and</strong>. Final Research Report ZBD200505, MS12 Part C.<br />
Chang FH, Mullan B. 2003. Occurrence of major harmful algal blooms in New Zeal<strong>and</strong>: is there a link with climate variations? Climate<br />
Update.;53(11):4.<br />
286
AEBAR <strong>2012</strong>: Marine <strong>Biodiversity</strong><br />
Chang FH, Zeldis J, Gall M, Hall J. (2003). Seasonal <strong>and</strong> spatial variation of phytoplankton assemblages, biomass <strong>and</strong> cell size from spring<br />
to summer across the north-eastern New Zeal<strong>and</strong> continental shelf. J Plankt Res.;25:737–758.<br />
Chang, F.H.; Williams, M.J.M.; Schwarz, J.; Hall, J.; Stewart, R.; Maas, E.W. (<strong>2012</strong>). Spatial variation of phytoplankton assemblages <strong>and</strong><br />
biomass in the New Zeal<strong>and</strong> sector of the Southern Ocean during the late austral summer 2008 Polar Biology.<br />
Cheung L, Lam VWY, Sarmiento JL, Kearney K, Watson R, Pauly D, (2009). Projecting global marine biodiversity impacts under climate<br />
change scenarios. Fish <strong>and</strong> Fisheries 10(3):235-251<br />
Clark M, O'Shea S. 2001 Hydrothermal vent <strong>and</strong> seamount fauna from the southern Kermadec Ridge, New Zeal<strong>and</strong>. InterRidge<br />
News.;10(2):14–17.<br />
Clark MR, O'Driscoll R. (2003). Deepwater fisheries <strong>and</strong> aspects of their impact on seamount habitat in New Zeal<strong>and</strong>. J Northw Atlantic<br />
Fish Sci.;31:441–458.<br />
Clark MR, Rowden AA. (2009). Effect of deepwater trawling on the macro-invertebrate assemblages of seamounts on the Chatham Rise,<br />
New Zeal<strong>and</strong>. Deep-Sea Res I.;56:1540–54.<br />
Clark, M.R, Dunn, M.R., McMillan, P.J., Pinkerton, M.H., Stewart, A., Hanchet, S.M. (2010b). Latitudinal variation of demersal fish<br />
assemblages in the western Ross Sea. CCAMLR document WG-FSA-10/P3. 13 p. (Antarctic Science, 2010.<br />
http://dx.doi.org/10.1017/S0954102010000441)<br />
Clark, M.R., Bowden, D.A., Baird, S.J., Stewart, R. (2010a). Effects of fishing on the benthic biodiversity of seamounts of the “Graveyard”<br />
complex, northern Chatham Rise. New Zeal<strong>and</strong> <strong>Aquatic</strong> <strong>Environment</strong> <strong>and</strong> <strong>Biodiversity</strong> Report No. 46. 40 p.<br />
Clark, M.R., Roberts, C.D. (2008). Fish <strong>and</strong> invertebrate biodiversity on the Norfolk Ridge <strong>and</strong> Lord Howe Rise, Tasman Sea (NORFANZ<br />
voyage, 2003). New Zeal<strong>and</strong> <strong>Aquatic</strong> <strong>Environment</strong> <strong>and</strong> <strong>Biodiversity</strong> Report No. 28. 131 p.<br />
Clark, M.R., Stokes, K., Baird, S.J. (in press). Development of a methodology for ecological risk assessments for New Zeal<strong>and</strong> deepwater<br />
fisheries. New Zeal<strong>and</strong> <strong>Aquatic</strong> <strong>Environment</strong> <strong>and</strong> <strong>Biodiversity</strong> Report.<br />
Clark, M.R.; Tittensor, D.P. (2010). An index to assess the risk to stony corals from bottom trawling on seamounts. Marine Ecology<br />
31(suppl 1): 200–211.<br />
Clark, M.R.; Tracey, D.M.; Pallentin, A.; Schnabel, K.; Anderson, O.F.; Bowden, D. (2009). Voyage report of a survey of “seamounts” on<br />
the northwest <strong>and</strong> southeast Chatham Rise (TAN0905). 49 p. (unpublished report available from NIWA, Wellington).<br />
Clark, M.R.; Watling, L.; Rowden, A.A.; Guinotte, J.M.; Smith, C.R (2010). A global seamount classification to aid the scientific design of<br />
marine protected area networks. Journal of Ocean <strong>and</strong> Coastal Management 54: 19–36.<br />
Clark, M.R.; Williams, A.; Rowden, A.A.; Hobday, A.J.; Consalvey, M. (2011). Development of seamount risk assessment: application of<br />
the ERAEF approach to Chatham Rise seamount features. New Zeal<strong>and</strong> <strong>Aquatic</strong> <strong>Environment</strong> <strong>and</strong> <strong>Biodiversity</strong> Report No. 74.<br />
18p.<br />
Coleman, C.O.; Lörz, A.-N. (2010). A new species of Camacho (Crustacea, Amphipoda, Aoridae) from the Chatham Rise, New Zeal<strong>and</strong>.<br />
Zoosystematics <strong>and</strong> Evolution 86(1): 33-40.<br />
Compton TJ, Julian K, Leathwick JR, Bowden DA (Project ZBD200701 Objective 12, in press) Modelling distributions of benthic<br />
invertebrate taxa across Chatham Rise <strong>and</strong> Challenger Plateau in relation to environmental variables. Ministry of Fisheries<br />
Wellington, New Zeal<strong>and</strong><br />
Compton, T. J., D. A. Bowden, C. Rol<strong>and</strong> Pitcher, J. E. Hewitt, <strong>and</strong> N. Ellis. (<strong>2012</strong>). Biophysical patterns in benthic assemblage<br />
composition across contrasting continental margins off New Zeal<strong>and</strong>. Journal of Biogeography DOI 10.1111/j.1365-<br />
2699.<strong>2012</strong>.02761.x<br />
Connell, AM, Dunn, MR <strong>and</strong> Forman, J. (2010). Diet <strong>and</strong> dietary variation of New Zeal<strong>and</strong> hoki Macruronus novaezel<strong>and</strong>iae. New Zeal<strong>and</strong><br />
Journal of Marine <strong>and</strong> Freshwater Research 44(4):289 - 308<br />
Costello MJ, Coll M, Danovaro R, Halpin P, Ojaveer H, et al. (2010) A Census of Marine <strong>Biodiversity</strong> Knowledge, Resources, <strong>and</strong> Future<br />
Challenges. PLoS ONE 5(8): e12110. doi:10.1371/journal.pone.0012110<br />
Coutts ADM, Dodgshun TJ. (1998). The nature <strong>and</strong> extent of organisms in vessel sea-chests: a protected mechanism for marine<br />
bioinvasions. Mar Poll Bull. 2007;54:875–886.<br />
Cranfield HJ, Gordon DP, Willan RC, Marshall BA, Battershill CN. Adventive marine species in New Zeal<strong>and</strong>. NIWA Technical<br />
Report.;34:1–48.<br />
Cranfield HJ, Manighetti B, Michael KP, Hill A (2003). Effects of oyster dredging on the distribution of bryozoan biogenic reefs <strong>and</strong><br />
associated sediments in Foveaux Strait, southern New Zeal<strong>and</strong>. Continental Shelf Res.;23:1337–1357. Cryer M, Hartill B,<br />
O'Shea S. 2002 Modification of marine benthos by trawling: toward a generalization for the deep ocean? Ecol<br />
Applications.;12:1824–1839.<br />
Cranfield, H. J.; Gordon, D. P.; Willan, R. C.; Marshall, B. A.; Battershill, C. N.; Francis, M. P.; Nelson, W. A.; Glasby, C. J.; Read, G. B.<br />
(1998). Adventive marine species in New Zeal<strong>and</strong>. NIWA Technical Report 34: 1-48.<br />
Cryer M, Hartill B, O'Shea S. 2002 Modification of marine benthos by trawling: toward a generalization for the deep ocean? Ecol<br />
Applications.;12:1824–1839.<br />
Cummings, V. Thrush, S. Andrew, N. Norkko, A. Funnell, G. Budd, R. Hewitt, J. Gibbs, M. Mercer, S. Marriott, P. Anderson, O. (2003).<br />
Ecology <strong>and</strong> biodiversity of coastal benthic communities in McMurdo Sound, Ross Sea: emerging results Final Research Report<br />
ZBD2002-01<br />
Cummings, V., Hewitt, J., Van Rooyen, A., Currie, K., Beard, S., Thrush, S., Norkko, J., Barr, N., Heath, P., Halliday, J., Sedcole, R.,<br />
Gomez, A., McGraw, C., Metcalf, V. (2011). Ocean acidification at high latitudes: potential effects on functioning of the<br />
Antarctic bivalve Laternula elliptica. PLoS ONE 6(1):e16069.<br />
Cummings, V., Thrush, S., Andrew, N., Norkko, A., Funnell, G., Budd, R., Gibbs, M., Hewitt, J., S. Mercer, S., Marriott, P., Anderson, O.<br />
(2003). Ecology <strong>and</strong> biodiversity of coastal benthic communities in McMurdo Sound, Ross Sea: emerging results. Final Research<br />
Report for Ministry of Fisheries Research Project ZBD2002/01 Objectives 1 & 2. National Institute of Water <strong>and</strong> Atmospheric<br />
Research. 105 p.<br />
Cummings, V., Thrush, S., Schwarz, A.-M., Funnell, G., Budd, R. (2006). Ecology of coastal benthic communities of the northwestern Ross<br />
Sea. New Zeal<strong>and</strong> <strong>Aquatic</strong> <strong>Environment</strong> <strong>and</strong> <strong>Biodiversity</strong> Report No 6. 67 p.<br />
Cummings, V.J., Thrush, S., Chiantore, M., Hewitt, J. & Cattaneo-Vietti, R. (2010). Macrobenthic communities of the north-western Ross<br />
Sea shelf: links to depth, sediment characteristics <strong>and</strong> latitude. Antarctic Science, 22:793-804.<br />
Cummings, V.J., Thrush, S.F., Marriott, P.M., Funnell, G.A., Norkko, A., Budd, R.G. (2008). Antarctic coastal marine ecosystems<br />
(ICECUBE). Final Research Report for Ministry of Fisheries Research Project ZBD2006-03 73 p.<br />
Cummings, V.J., Thrush, S.F., Norkko, A., Andrew, N.L., Hewitt, J.E., Funnell, G.A., Schwarz, A-M. (2006). Accounting for local scale<br />
variability in benthos: implications for future assessments of latitudinal trends in the coastal Ross Sea. Antarctic Science 18(4):<br />
633-644.<br />
D’Archino, R.; Neill, K.F.; Nelson, W.A. (in press) Recognition <strong>and</strong> distribution of Polysiphonia morrowii (Rhodomelaceae, Rhodophyta)<br />
in New Zeal<strong>and</strong>. Botanica Marina.<br />
287
AEBAR <strong>2012</strong>: Marine <strong>Biodiversity</strong><br />
D’Archino, R.; Sutherl<strong>and</strong>, J.E. (in press) First record of the genus Dudresnaya (Dumontiaceae, Rhodophyta) in New Zeal<strong>and</strong><br />
waters. Phycological Research.<br />
De Domenico, F., Chiantore, M., Buongiovanni, S., Paola Ferranti, M., Ghione, S., Thrush, S., Cummings, V., Hewitt, J., Kroeger, K.,<br />
Cattaneo-Vietti, R. (2006). Latitude versus local effects on echinoderm assemblages along the Victoria L<strong>and</strong> coast, Ross Sea,<br />
Antarctica. Antarctic Science 18(4): 655-662.<br />
Dettai et al. (+45 authors). (2011). DNA barcoding <strong>and</strong> molecular systematics of the benthic <strong>and</strong> demersal organisms of the CEAMARC<br />
survey. Polar Science 5: 298–312.<br />
Dodgshun T, Coutts A. (2003). Opening the lid on sea chests. Seafood NZ.;11:35. Dunn MR (2009) Feeding habits of the ommastrephid<br />
squid Nototodarus sloanii on the Chatham Rise, New Zeal<strong>and</strong>. NZ J Mar Freshw Res 43:1103–1113<br />
Dunn MR (2009) Feeding habits of the ommastrephid squid Nototodarus sloanii on the Chatham Rise, New Zeal<strong>and</strong>. NZ J Mar Freshw Res<br />
43:1103–1113<br />
Dunn MR, Connell AM, Forman J, Stevens DW, Horn PL (2010a) Diet of Two Large Sympatric Teleosts, the Ling (Genypterus blacodes)<br />
<strong>and</strong> Hake (Merluccius australis). PLoS ONE 5(10):<br />
Dunn MR. Griggs, L. Forman J. Horn PL (2010b). Feeding habits <strong>and</strong> niche separation among the deep-sea chimaeroid fishes Harriotta<br />
raleighana, Hydrolagus bemisi <strong>and</strong> Hydrolagus novaezeal<strong>and</strong>iae Marine Ecology Progress Series 407: 209–225<br />
Dunn, MR. Horn PL. Connell, AM. Stevens, DW. Forman, J. Pinkerton, M. Griggs, L. Notman, P. Wood B. (in press). Ecosystem-scale<br />
trophic relationships: diet composition <strong>and</strong> guild structure of middle-depth fish on the Chatham Rise. AEBR series<br />
Dunn, MR. Szabo, A. McVeagh, MS. Smith, PJ. (2010c). The diet of deepwater sharks <strong>and</strong> the benefits of using DNA identification of prey.<br />
Deep-Sea Research Part 1. 57(7): 923-930<br />
Eakin, R.A.; Eastman, J.T.; Near, T.J. (2009). A new species <strong>and</strong> a molecular phylogenetic analysis of the Antarctic Fish Genus<br />
Pogonophryne (Notothenioidei: Artedidraconidae). Copeia 2009, No. 4, 705–713.<br />
Eleaume M, Hemery LG, Bowden DA, Roux M (in press) A large new species of the genus Ptilocrinus (Echinodermata, stalked Crinoidea,<br />
Hyocrinidae) from Antarctic seamounts. Polar Biology DOI: 10.1007/s00300-011-0993-2<br />
Farr, T.; Broom, J.; Hart, D.; Neill, K.; Nelson, W. (2009). Common coralline algae of northern New Zeal<strong>and</strong>: an identification guide.<br />
NIWA Information Series No. 70.<br />
Fenwick, G., Bradford-Grieve, J. (2002a). Recommendations for future directed research to describe the biodiversity of the Ross Sea region.<br />
FRR ZBD2000/01<br />
Fenwick, G., Bradford-Grieve, J. (2002b). Human pressures on Ross Sea region marine communities: recommendations for future research.<br />
FRR ZBD2000/01<br />
Floerl O, & Hewitt J. (<strong>2012</strong>). Chatham-Challenger OS 20/20 Post Voyage Analyses: Objective 9- Patterns in species composition. New<br />
Zeal<strong>and</strong> <strong>Aquatic</strong> <strong>Environment</strong> <strong>and</strong> <strong>Biodiversity</strong> Report No. 97. 40 p.<br />
Forman; JS. Dunn MR. (2010). The influence of ontogeny <strong>and</strong> environment on the diet of lookdown dory, Cyttus traversi New Zeal<strong>and</strong><br />
Journal of Marine <strong>and</strong> Freshwater Research Volume 44(4): 329 - 342<br />
Freeman DJ, Marshall BA, Ahyong ST, Wing SR, Hitchmough RA (2010). The conservation status of New Zeal<strong>and</strong> marine invertebrates,<br />
2009. New Zeal<strong>and</strong> Journal of Marine <strong>and</strong> Freshwater Research 44: 129 148.<br />
Frost, M. T, Jefferson, R. & Hawkins, S. J. (Editors). (2006). The evaluation of time series: their scientific value <strong>and</strong> contribution to policy<br />
needs. Report prepared by the Marine <strong>Environment</strong>al Change Network (MECN) for the Department for <strong>Environment</strong>, Food <strong>and</strong><br />
Rural Affairs (DEFRA). Marine Biological Association, Plymouth. Contract CDEP 84/5/311. Marine Biological Association<br />
Occasional Publications No. 22. 94pp.<br />
Fulton, E.A.; Smith, A.D.M.; Webb, H.; Slater, J. (2004). Ecological indicators for the impacts of fishing on non-target species,<br />
communities <strong>and</strong> ecosystems: <strong>Review</strong> of potential indicators. AFMA Final Research report R99/1546: 119pp.<br />
Garcia, A. (2010). Comparative study of the morphology <strong>and</strong> anatomy of octopuses of the family Octopodidae. (AUT MAppSc).247 p.<br />
Garcia, S.M., Rosenberg, A.A. (2010). Food security <strong>and</strong> marine capture fisheries: characteristics, trends, drivers <strong>and</strong> future perspectives.<br />
Phil. Trans. R. Soc. B 365, 2869–2880 doi:10.1098/rstb.2010.0171<br />
Gardner, J.P.A., Bell, J.J., Constable, H.B., Hannan, D., Ritchie, P.A., Zuccarello, G.C. (2010). Multi-species coastal marine connectivity: a<br />
literature review with recommendations for further research. New Zeal<strong>and</strong> <strong>Aquatic</strong> <strong>Environment</strong> <strong>and</strong> <strong>Biodiversity</strong> Report No. 58.<br />
47 p.<br />
Ghiglione, J.-F.; Gal<strong>and</strong>, P.E.; Pommier, T.; Pedrós-Alió, C.; Maas, E.W.; Bakker, K.; Bertilson, S.; Kirchman, D.L.; Lovejoy, C.; Yager,<br />
P.L.; Murray, A.E. (<strong>2012</strong>). Pole-to-pole biogeography of surface <strong>and</strong> deep marine bacterial communities. Proceedings of the<br />
National Academy of Sciences. <br />
Ghiglione, J-F; Gal<strong>and</strong>, P.E.; Pommier, T.; Pedros-Alio, C.; Maas, E.W.; Bakker, K.; Bertilson, S.; Kirchman, D.L.; Lovejoy, C.; Yager,<br />
P.L.; Murray, A.E. (<strong>2012</strong>). Pole to pole biogeography of surface <strong>and</strong> deep marine bacterial communities.<br />
www.pnas.org/cgi/doi/10.1073/pnas.1208160109.<br />
Glasby GP, Wright IC. (1990). Marine mineral potential in New Zeal<strong>and</strong>'s Exclusive Economic Zone. Mar Mining.;9:403–427.<br />
Gordon DP (2000). The Pacific Ocean <strong>and</strong> global OBIS: a New Zeal<strong>and</strong> perspective. Oceanography.;13:41–47.<br />
Gordon DP (Ed.) (2009). New Zeal<strong>and</strong> Inventory of <strong>Biodiversity</strong> Volume One. Kingdom Animalia: Radiata, Lophotrochozoa,<br />
Deuterostomia. Canterbury University Press, Christchurch. 568+16 p.<br />
Gordon DP (Ed.) (2010) New Zeal<strong>and</strong> Inventory of <strong>Biodiversity</strong> Volume Two. Kingdom Animalia: Chaetognatha, Ecdysozoa <strong>and</strong><br />
Ichnofossils. Canterbury University Press, Christchurch. 528+16 p.<br />
Gordon DP (Ed.) (<strong>2012</strong>) New Zeal<strong>and</strong> Inventory of <strong>Biodiversity</strong> Volume Three. Kingdoms Bacteria, Protozoa, Chromista, Plantae, Fungi.<br />
Canterbury University Press, Christchurch. 616+16 p.Gordon DP, editor. (2009). Volume 1. Kingdom Animalia: Radiata,<br />
Lophotrochozoa, Deuterostomia. Christchurch: Canterbury University Press; New Zeal<strong>and</strong> inventory of biodiversity. p. 568+16.<br />
Gordon DP, Beaumont J, MacDiarmid A, Robertson DA, Ahyong ST (2010) Marine <strong>Biodiversity</strong> of Aotearoa New Zeal<strong>and</strong>. PLoS ONE<br />
5(8): e10905. doi:10.1371/journal.pone.0010905<br />
Gordon DP, Bisby FA. (2009) Introduction. In: Gordon DP, editor. New Zeal<strong>and</strong> inventory of biodiversity. Volume 1. Kingdom Animalia:<br />
Radiata, Lophotrochozoa, Deuterostomia. Christchurch: Canterbury University Press;. pp. 9–12.<br />
Gordon DP, Hosie AM, Carter MC. (2008) Post-2000 detection of warm-water alien bryozoan species in New Zeal<strong>and</strong> ― the significance<br />
of recreational vesels. Virginia Mus Nat Hist Spec Pub.;15:37–48.<br />
Gould B, Ahyong ST. (2008) Marine Invasive Taxonomic Service. Biosecurity.;85:18–19.<br />
Grange, K.R., Tovey, A., Hill, A.E. (2003). The spatial extent <strong>and</strong> nature of the bryozoan communities at Separation Point, Tasman Bay.<br />
Marine <strong>Biodiversity</strong> Biosecurity Report No. 4. 22 p.<br />
Grayling, S. (2004). A review of scientific studies conducted on the Macquarie Ridge. Final Research Report (ZBD2003-09) held at MPI.<br />
33p.<br />
Grotti, M.;Soggia, F.;Lagomarsino, C.;Dalla Riva, S.;Goessler, W., Francesconi, K.A. (2008). Natural variability <strong>and</strong> distribution of trace<br />
elements in marine organisms from Antarctic coastal environments. Antarctic Science 20(1): 39-51. (peer)<br />
288
AEBAR <strong>2012</strong>: Marine <strong>Biodiversity</strong><br />
Guidetti, M. Marcato, S. Chiantore, M. Patarnello, T. Albertelli, G. Cattaneo-Vietti, R. (2006). Exchange between populations of<br />
Adamussium colbecki (Mollusca: Bivalvia) in the Ross Sea. Antarctic Science 18(4): 645-653.<br />
Guinotte, J.M., J. D. Bartley, A. Iqbal, D. G. Fautin, R. W. Buddemeier (2006). Modeling habitat distribution from organism occurrences<br />
<strong>and</strong> environmental data: case study using anemonefishes <strong>and</strong> their sea anemone hosts. Marine Ecology Progress Series, 316: 269-<br />
283.<br />
Hanchet, S.M. (Compiler) (2009). New Zeal<strong>and</strong> IPY-CAML Progress Report. August 2009. 76 p.<br />
Hanchet, S.M. (Compiler) (2010). New Zeal<strong>and</strong> IPY-CAML Progress Report. July 2010. p.<br />
Hanchet, S.M., Fu, D., Dunn, A. (2008a). Indicative estimates of biomass <strong>and</strong> yield of Whitson’s grenadier (M. whitsoni) on the continental<br />
slope of the Ross Sea in Subareas 88.1 <strong>and</strong> 88.2. WG-FSA-08/32.<br />
Hanchet, S.M., Stewart, A.L., McMillan, P.J., Clark, M., O’Driscoll, R.L., Stevenson, M.L. (in press). Diversity, relative abundance, new<br />
locality records, <strong>and</strong> updated fish fauna of the Ross Sea, Antarctica. Antarctic Science.<br />
Hanchet, S.M.; Mitchell, J.; Bowden, D.; Clark, M; Hall, J.; O’Driscoll, R.; Pinkerton, M.; Robertson, D. (2008b). Preliminary report of the<br />
New Zeal<strong>and</strong> RV Tangaroa IPY-CAML survey of the Ross Sea region, Antarctica in February-March 2008. Unpublished NIWA<br />
report to CCAMLR working group on ecosystem monitoring <strong>and</strong> management. WG-EMM-08/18. 15 p.<br />
Hanchet, S.M.; Mitchell, J.; Bowden, D.; Clark, M; Hall, J.; O’Driscoll, R. (2008c). Ocean survey 20/20: New Zeal<strong>and</strong> IPY-CAML Final<br />
Voyage Report. NIWA Client Report: WLG2008-74, October 2008. 193 p.<br />
Hanchet, S.M.; Stevenson, M.L., Jones, C., Marriott, P.M., McMillan, P.J. O’Driscoll, R.L. Stevens, D., Stewart, A.L., Wood, B.A (2008d).<br />
Biomass estimates <strong>and</strong> size distributions of demersal finfish on the Ross Sea shelf <strong>and</strong> slope from the New Zeal<strong>and</strong> IPY-CAML<br />
survey, February-March 2008. WG-FSA-08/31.<br />
Harvey, A.S., Woelkerling, W.J., Farr, T.J., Neill, K.F., Nelson, W.A., (2005). Coralline algae of central New Zeal<strong>and</strong>: an identification<br />
guide to common ‘crustose’ species. NIWA Information Series No. 57.<br />
Heimeier, D. Lavery, S. Sewell MA. (2010). Using DNA barcoding <strong>and</strong> phylogenetics to identify Antarctic invertebrate larvae: Lessons<br />
from a large scale study Marine Genomics 3:165–177<br />
Hewitt J, Lundquist CJ, Bowden DA (Project ZBD2007-01 Objective 6, in review) Chatham-Challenger Ocean Survey 20/20 Post Voyage<br />
Analyses: Diversity Metrics. Ministry of Fisheries, New Zeal<strong>and</strong>, Wellington<br />
Hewitt J, Thrush S, Lohrer A, Townsend M (2010). A latent threat to biodiversity: consequences of small-scale heterogeneity loss.<br />
<strong>Biodiversity</strong> <strong>and</strong> Conservation 19:1315-1323<br />
Hewitt J., Julian, K; Bone, E K; (2010). Chatham–Challenger Ocean Survey 20/20 Post-Voyage Analyses: Objective 10 – Biotic habitats<br />
<strong>and</strong> their sensitivity to physical disturbance New Zeal<strong>and</strong> <strong>Aquatic</strong> <strong>Environment</strong> <strong>and</strong> <strong>Biodiversity</strong> Report No.<br />
Hewitt JE, Anderson MJ, Hickey C, Kelly S, Thrush SF (2009). Enhancing the ecological significance of contamination guidelines through<br />
integration with community analysis. <strong>Environment</strong>al Science <strong>and</strong> Technology 43:2118-2123<br />
Hewitt JE, Thrush SF, Cummings VJ, Turner SJ (1998) The effect of changing sampling scales on our ability to detect effects of large-scale<br />
processes on communities. Journal of Experimental Marine Biology <strong>and</strong> Ecology 227: 251-264<br />
Hewitt JE, Thrush SF, Dayton PD (2008). Habitat variation, species diversity <strong>and</strong> ecological functioning in a marine system. Journal of<br />
Experimental Marine Biology <strong>and</strong> Ecology 366:116-122<br />
Hewitt, J., Thrush, S., Lohrer, A. & Townsend, M. (2010). A latent threat to biodiversity: consequences of small-scale heterogeneity loss.<br />
<strong>Biodiversity</strong> <strong>and</strong> Conservation, 19:1315-1323.<br />
Hewitt, J.E. & Thrush, S.F. (2010). Empirical evidence of an approaching alternate state produced by intrinsic community dynamics,<br />
climatic variability <strong>and</strong> management actions. Marine Ecology Progress Series, 413:267-276.<br />
Hewitt, J.E., Thrush, S.F., Dayton, P.K., Bonsdorff, E. (2007). The effect of spatial <strong>and</strong> temporal heterogeneity on the design <strong>and</strong> analysis of<br />
empirical studies of scale-dependent systems. The American Naturalist 168 (3): 398–408.<br />
Hobday, AJ, Okey, TA, Poloczanska, ES, Kunz, TJ & Richardson, AJ (eds) (2006) Impacts of Climate Change on Australian Marine Life,<br />
CSIRO Marine <strong>and</strong> Atmospheric research report to the Australian Greenhouse Office, Canberra<br />
Horn, P. L. Forman J. Dunn M. R. (2010). Feeding habits of alfonsino Beryx splendens. Journal of Fish Biology 76:2382–2400<br />
Horn, P.L., Dunn, M.R. (2010). Inter-annual variability in the diets of hoki, hake, <strong>and</strong> ling on the Chatham Rise from 1990 to 2009. New<br />
Zeal<strong>and</strong> <strong>Aquatic</strong> <strong>Environment</strong> <strong>and</strong> <strong>Biodiversity</strong> Report No. 54. 57 p.<br />
Hurst RJ, Bagley NW, Anderson OF, Francis MJ, Griggs LH, (2000). Atlas of juvenile <strong>and</strong> adult fish <strong>and</strong> squid distributions from bottom<br />
<strong>and</strong> midwater trawls <strong>and</strong> tuna longlines in New Zeal<strong>and</strong> waters. NIWA Tech Rep;84:1–612.<br />
Jackson, J; Carroll, E; Smith, TD; Patenaude, N; Baker, CS (in press). Taking Stock: the historical demography of the New Zeal<strong>and</strong> right<br />
whale (the Tohora)1830-2008. Final Research Report ZBD200505, MS12 Part D.<br />
Key, J.M. (2002). A review of current knowledge describing New Zeal<strong>and</strong>'s deepwater benthic biodiversity. Marine <strong>Biodiversity</strong><br />
Biosecurity Report No. 1. 25 p.<br />
Koubbi, P.; Masato, M.; Duhamel, G.; Goarant, A.; Hulley, P-A; O’Driscoll, R.; Takashi, I.; Pruvost, P.; Tavenier, E.; Hosie, G. (2011).<br />
Ecological importance of micronektonic fish for the ecoregionalisation of the Indo-Pacific sector of the Southern Ocean: role of<br />
myctophids. Deep Sea Research II 58: 170–180.Koubbi, P.; Masato, M.; Duhamel, G.; Goarant, A.; Hulley, P-A; O’Driscoll, R.;<br />
Takashi, I.; Pruvost, P.; Tavenier, E.; Hosie, G. (in press). Ecological importance of micronektonic fish for the ecoregionalisation<br />
of the Indo-Pacific sector of the Southern Ocean: role of myctophids. Deep Sea Research II.<br />
Lalas, L; MacDiarmid AB (in press). Rapid re-colonisation of south-eastern South Isl<strong>and</strong> by New Zeal<strong>and</strong> fur seals Arctocephalus forsteri.<br />
Final Research Report ZBD200505 MS12 Part E.<br />
Lalas, L; MacDiarmid AB; Abraham, E. (in press). : Estimates of annual food consumption by a population of New Zeal<strong>and</strong> fur seals. Final<br />
Research Report ZBD200505 MS12 Part F.<br />
Lalas, L; MacDiarmid AB; Abraham, E. (in press). : Estimates of annual food consumption by a population of New Zeal<strong>and</strong> sea lions. Final<br />
Research Report ZBD200505 MS12 Part G.<br />
Lavery, S., Clements, K., Hickey, A. (2006). Molecular identification of cryptogenic/invasive gobies in New Zeal<strong>and</strong>. New Zeal<strong>and</strong> <strong>Aquatic</strong><br />
<strong>Environment</strong> <strong>and</strong> <strong>Biodiversity</strong> Report No 5. 48 p.<br />
Le Quesne, W. J. F. <strong>and</strong> Pinnegar, J. K. (2011), The potential impacts of ocean acidification: scaling from physiology to fisheries. Fish <strong>and</strong><br />
Fisheries, 12: no. doi: 10.1111/j.1467-2979.2011.00423.x<br />
Leathwick JR, Elith J, Francis MP, Hastie T, Taylor P (2006a) Variation in demersal fish species richness in the oceans surrounding New<br />
Zeal<strong>and</strong>: an analysis using boosted regression trees. Mar Ecol Prog Ser 321:267–281<br />
Leathwick JR, Rowden A, Nodder S, Gorman R, Bardsley S, Pinkerton M, Baird SJ, Hadfield M, Currie K, Goh A (2010). Development of<br />
a benthic-optimised marine environment classification for waters within the New Zeal<strong>and</strong> EEZ. Final Research Report for<br />
Ministry of Fisheries Research Project BEN200601, Objective 5. (Unpublished report held by Ministry of Fisheries, Wellington.)<br />
Leathwick, J., Francis, M., <strong>and</strong> Julian, K. (2006b). Development of a demersal fish community map for New Zeal<strong>and</strong>’s Exclusive Economic<br />
Zone. NIWA Client Report HAM2006-062, prepared for Department of Conservation. National Institute of Water &<br />
Atmospheric Research, Hamilton, New Zeal<strong>and</strong>.<br />
289
AEBAR <strong>2012</strong>: Marine <strong>Biodiversity</strong><br />
Leathwick, J.R.; Dey, K.L.; Julian, K. (2006c). Development of a marine environmental classification optimised for demersal fish. NIWA<br />
Client report HAM2006–063<br />
Leduc, D., A. A. Rowden, D. A. Bowden, P. K. Probert, C. A. Pilditch, <strong>and</strong> S. D. Nodder. (<strong>2012</strong>). Unimodal relationship between biomass<br />
<strong>and</strong> species richness of deep-sea nematodes: implications for the link between productivity <strong>and</strong> diversity. Marine Ecology<br />
Progress Series 454:53-64.<br />
Levin, L.A., Gambi, M.C., Barry, J.P., Genin, A. & Thrush, S. (2011). The Dayton legacy: baselines, benchmarks, climate, disturbance <strong>and</strong><br />
proof. Marine Ecology, 32:261-165.<br />
Link, J. (1999) Reconstructing Food Webs <strong>and</strong> Managing Fisheries. Ecosystem Approaches for Fisheries Management. Proceedings of the<br />
16th Lowell Wakefield Fisheries Symposium. AK-SG-99-01:571-588.<br />
Livingston ME (2009). Towards a National Marine <strong>Environment</strong> Monitoring Programme in New Zeal<strong>and</strong>. A discussion paper submitted to<br />
the <strong>Biodiversity</strong> Research Advisory Group Workshop on Marine <strong>Environment</strong>al Monitoring, July 2009. (Unpublished report held<br />
at MFishMPI, Wellington)<br />
Livingston, M. (2004). A sampling programme to construct <strong>and</strong> quantify food-webs in two key areas supporting important fish <strong>and</strong><br />
invertebrate species in New Zeal<strong>and</strong>. Final Research Report for Ministry of Fisheries Project ENV2002-07, Objective 1. NIWA.<br />
Lohrer, A.M., Chiaroni, L.D., Thrush, S.F., Hewitt, J.E. (2010). Isolated <strong>and</strong> interactive effects of two key species on ecosystem function<br />
<strong>and</strong> trophic linkages in New Zeal<strong>and</strong> soft-sediment habitats. New Zeal<strong>and</strong> <strong>Aquatic</strong> <strong>Environment</strong> <strong>and</strong> <strong>Biodiversity</strong> Report No. 44.<br />
69 p.<br />
Lohrer, A.M., Cummings, V.J., Thrush, S.F. (<strong>2012</strong>). Altered sea ice thickness <strong>and</strong> permanence affects benthic ecosystem functioning in<br />
coastal Antarctica. Ecosystems 10.1007/s10021-012-9610-7.<br />
Lohrer, A.M., Halliday, N.J., Thrush, S.F., Hewitt, J.E. & Rodil, I.F. (2010). Ecosystem functioning in a disturbance-recovery context:<br />
contribution of macrofauna to primary production <strong>and</strong> nutrient release on intertidal flats. Journal of Experimental Marine Biology<br />
<strong>and</strong> Ecology, 390:6-13.<br />
Lohrer, A.M., Hewitt, J.E., Hailes, S.F., Thrush, S.F., Ahrens, M. & Halliday, J. (2011). Contamination on s<strong>and</strong>flats <strong>and</strong> the decoupling of<br />
linked ecological functions. Austral Ecology, 36:378–388.<br />
Lohrer, A.M., Rodil, I.F., Townsend, M., Chiaroni, L.D., Hewitt, J.E., Thrush, S.F. (In press) Biogenic habitat transitions influence<br />
facilitation in a marine soft-sediment ecosystem. Ecology.<br />
Lohrer, A.M., Townsend, M., Rodil, I.F., Hewitt, J.E., Thrush, S.F. (In press) Detecting shifts in ecosystem functioning: the decoupling of<br />
fundamental relationships with increased pollutant stress on s<strong>and</strong>flats. Marine Pollution Bulletin.<br />
Lorrey, A. et al. (in press). Natural drivers of environmental change in New Zeal<strong>and</strong>’s marine environment during the last millennium. Final<br />
Research Report: ZBD200505 MS 6 Part A,<br />
Lörz, A.N. (2011a). Pacific Epimeriidae (Amphipoda: Crustacea): Epimeria. Journal of the Marine Biological Association of the United<br />
Kingdom 91(2): 471-477.<br />
Lörz, A.-N. (2011b). <strong>Biodiversity</strong> of an unknown New Zeal<strong>and</strong> habitat: bathyal invertebrate assemblages in the benthic boundary layer.<br />
Marine <strong>Biodiversity</strong> 41(2): 299-312.<br />
Lörz AN, Smith PJ, Linse K, Steinke D. (in press.) High genetic diversity within Epimeria georgiana (Amphipoda) from the southern Scotia<br />
Arc. Marine <strong>Biodiversity</strong> (PDF)<br />
Lörz A-N & Coleman O (2009), Living jems: jewel-like creatures from the deep. Water <strong>and</strong> Atmosphere 17(1) 16-17 2009<br />
Lörz A-N (2009): Synopsis of Amphipoda from two recent Ross Sea voyages with description of a new species of Epimeria (Epimeriidae,<br />
Amphipoda, Crustacea). Zootaxa (2167): 59-68<br />
Lörz A-N, Maas E, Linse K, <strong>and</strong> Coleman C.O. (2009)., Do circum-Antarctic species exist in peracarid Amphipoda? A case study in the<br />
genus Epimeria Costa, 1851 (Crustacea: Peracarida: Epimeriidae). Zookeys (18): 91-128 SI<br />
Lörz, A.N.; Berkenbusch, K.; Nodder, S.; Ahyong, S.; Bowden, D.; McMillan, P.; Gordon, D.; Mills, S.; Mackay, K.;. (<strong>2012</strong>a). A review of<br />
deep-sea benthic biodiversity associated with trench, canyon <strong>and</strong> abyssal habitats below 1500 m depth in New Zeal<strong>and</strong> waters.<br />
New Zeal<strong>and</strong> aquatic environment <strong>and</strong> biodiversity report ; Ministry of Fisheries, Wellington. 133 p.<br />
Lörz, A.N.; Linse, K.; Smith, P.; Steinke, D. (<strong>2012</strong>b). First evidence for underestimated biodiversity of Rhachotropis (Crustacea,<br />
Amphipoda) with description of a new species. PloS ONE 7(3): e32365.<br />
Lörz, AN (2010) Deep-sea Rhachotropis (Crustacea: Amphipoda: Eusiridae) from New Zeal<strong>and</strong> <strong>and</strong> the Ross Sea with key to the Pacific,<br />
Indian Ocean <strong>and</strong> Antarctic species. ZOOTAXA, (2482): 22-48<br />
Lundquist, CJ. Thrush, SF. Coco, G. Hewitt, JE (2010). Interactions between distributions <strong>and</strong> dispersal decrease persistence thresholds of a<br />
marine benthic community. Mar. Ecol. Prog. Ser. 413: 217-228.<br />
Maas, E. M.; Voyles, K.M.; Pickmere, S.; Hall, J.A.; Bowden, D.A.; Clark, M.R. (2010). Bacterial <strong>and</strong> Archaeal diversity <strong>and</strong> exo-enzyme<br />
activity in Ross Sea, Antarctica sediments. Poster presented at SAME 11- Symposium on <strong>Aquatic</strong> Microbial Ecology, Piran,<br />
Slovenia, 30th August - 4th September 2010.<br />
Maas, E.W.; Law, C.S.; Hall, J.A.; Pickmere, S.; Currie, K.I.; Chang, F.H.; Voyles, K.M.; Caird, D. (<strong>2012</strong>). Effect of ocean acidification on<br />
bacterial abundance, activity <strong>and</strong> diversity in the Ross Sea <strong>Aquatic</strong> Microbial Ecology (in review).<br />
Maas, E.W.; Voyles, K.M.; Caird, D.; Pickmere, S.; Hall, J.A. (<strong>2012</strong>). Bacterioplankton abundance, activity <strong>and</strong> diversity in the Ross Sea<br />
Antarctica. <strong>Aquatic</strong> Microbial Ecology (in review).<br />
MacDiarmid A, editor. (2007). A summary of the biodiversity in the New Zeal<strong>and</strong> Marine Ecoregion. Wellington: WWF-New Zeal<strong>and</strong>;.<br />
The treasures of the sea: Ngā taonga a Tangaroa.<br />
MacDiarmid, A. Stewart, R (<strong>2012</strong>). Ross Sea <strong>and</strong> Balleny Isl<strong>and</strong>s biodiversity: routine observations <strong>and</strong> opportunistic sampling of biota<br />
made during a geophysical survey to the Ross Sea in 2006. . <strong>Aquatic</strong> <strong>Environment</strong> <strong>and</strong> <strong>Biodiversity</strong> Report No. XX, 99 p.<br />
MacDiarmid, A.; McKenzie, A.; Sturman, J.; Beaumont, J.; Mikaloff-Fletcher, S.; Dunne, J. (<strong>2012</strong>). Assessment of anthropogenic threats to<br />
New Zeal<strong>and</strong> marine habitats New Zeal<strong>and</strong> <strong>Aquatic</strong> <strong>Environment</strong> <strong>and</strong> <strong>Biodiversity</strong> Report No. 93.255 p.<br />
MacDiarmid, A.B.; Cleaver, P; Stirling, B. (in press). Historical evidence for exploitation of the marine environment in the Hauraki Gulf<br />
<strong>and</strong> along the Otago/Catlins shelf 1790- 1930 <strong>Aquatic</strong> <strong>Environment</strong> <strong>and</strong> <strong>Biodiversity</strong> Report No XX.,<br />
MacDiarmid, AB Smith I, Paul L, Francis M, McKenzie A, Parsons D, Hartill B, Stirling B, Cleaver et al (in press) A complete history of<br />
the exploitation of an ecologically important inshore finfish species in the Hauraki Gulf, New Zeal<strong>and</strong>: a synthesis of<br />
archaeological, historical <strong>and</strong> fisheries data. <strong>Aquatic</strong> <strong>Environment</strong> <strong>and</strong> <strong>Biodiversity</strong> Report XX, 25 p.<br />
McKenzie, A; MacDiarmid, AB (in press). Biological parameters <strong>and</strong> biomass estimates for some commercial fish stocks in the Hauraki<br />
Gulf <strong>and</strong> Otago-Catlins shelf for the period 1930-2006. <strong>Aquatic</strong> <strong>Environment</strong> <strong>and</strong> <strong>Biodiversity</strong> Report XX, 97 p.<br />
McMillan, P.J.; Francis, M.P.; G.D., J.; Paul, L.J.; Marriott, P.J.; Mackay, E.; Wood, B.A.; Griggs, L.H.; Sui, H.; Wei, F. (2011a). New<br />
Zeal<strong>and</strong> fishes. Volume 1: A field guide to common species caught by bottom <strong>and</strong> midwater fishing. New Zeal<strong>and</strong> <strong>Aquatic</strong><br />
<strong>Environment</strong> <strong>and</strong> <strong>Biodiversity</strong> Report 68.<br />
290
AEBAR <strong>2012</strong>: Marine <strong>Biodiversity</strong><br />
McMillan, P.J.; Francis, M.P.; Paul, L.J.; Marriott, P.J.; Mackay, E.; Baird, S.J.; Griggs, L.H.; Sui, H.; Wei, F. (2011b). New Zeal<strong>and</strong> fishes.<br />
Volume 2: A field guide to less common species caught by bottom <strong>and</strong> midwater fishing. New Zeal<strong>and</strong> <strong>Aquatic</strong> <strong>Environment</strong> <strong>and</strong><br />
<strong>Biodiversity</strong> Report 78.<br />
McMillan, P.J.; Griggs, L.H.; Francis, M.P.; Marriott, P.J.; Paul, L.J.; Mackay, E.; Wood, B.A.; Sui, H.; Wei, F. (2011c). New Zeal<strong>and</strong><br />
fishes. Volume 3: A field guide to common species caught by surface fishing. New Zeal<strong>and</strong> <strong>Aquatic</strong> <strong>Environment</strong> <strong>and</strong><br />
<strong>Biodiversity</strong> Report 69.<br />
McMillan, PJ, Iwamoto, T, Stewart, A, Smith, PJ. (<strong>2012</strong>). A new species of grenadier, genus Macrourus (Teleostei, Gadiformes,<br />
Macrouridae) from the southern hemisphere <strong>and</strong> a revision of the genus. Zootaxa, 3165, 1–24.<br />
McWethy, D.B., Whitlock, C., Wilmshurst, J.M., McGlone, M.S., Fromont, M., Li, X., Dieffenbacher-Krall, A., Hobbs, W.O., Fritz, S.C.,<br />
Cook, E.R. (2010). Rapid l<strong>and</strong>scape transformation in South Isl<strong>and</strong>, New Zeal<strong>and</strong>, following initial Polynesian settlement.<br />
Proceedings of the national Academy of Sciences 107: 21343–21348.<br />
MfE (2007). <strong>Environment</strong> New Zeal<strong>and</strong> 2007.<br />
Maxwell, K; MacDiarmid, AB (in press). Oral histories of marine fish <strong>and</strong> shellfish state <strong>and</strong> use in the Hauraki Gulf <strong>and</strong> along the<br />
Otago/Catlins coast 1940-2000. <strong>Aquatic</strong> <strong>Environment</strong> <strong>and</strong> <strong>Biodiversity</strong> Report XX.<br />
Ministry for Primary Industries (<strong>2012</strong>). Report from the Fisheries Assessment Plenary, May <strong>2012</strong>: stock assessments <strong>and</strong> yield estimates.<br />
Compiled by the Fisheries Science Group, Ministry for Primary Industries, Wellington, New Zeal<strong>and</strong>. 1194 p.<br />
Mitchell L. Sogin, Hilary G. Morrison, Julie A. Huber, David Mark Welch, Susan M. Huse, Phillip R. Neal, Jesus M. Arrieta, <strong>and</strong> Gerhard J.<br />
Herndl (2006). Microbial diversity in the deep sea <strong>and</strong> the underexplored “rare biosphere” Proceedings Natural Academy Science<br />
U S A. 2006 August 8; 103(32): 12115–12120.www.ncbi.nlm.nih.gov/pmc/articles/PMC1524930/<br />
Mitchell, J. (2008). Initial environmental evaluation (IEE) NZ IPY-CAML voyage 2008 report. Report prepared for Antarctic Policy Unit,<br />
Ministry of Foreign Affairs <strong>and</strong> Trade. May 2008. 35 p.<br />
Mitchell, J. MacDiarmid, A. (2006) Voyage Report TAN06-02 EASTERN ROSS SEA VOYAGE Unpublished report for MPI project<br />
ZBD2005-03<br />
Mitchell, J.; Clark, M. (2004). Voyage report TAN04-02. Western Ross Sea voyage 2004. Hydrographic <strong>and</strong> biodiversity survey RV<br />
Tangaroa 27 January to 13 March 2004. Cape Adare, Cape Hallett, Possession Isl<strong>and</strong>s <strong>and</strong> Balleny Isl<strong>and</strong>s, Antarctica. NIWA<br />
Voyage Report TAN04-02. 102 p. (Unpublished report held in NIWA library, Wellington.)<br />
Morrison M, Lowe M, Parsons D, Usmar N, McLeod I (2009). A review of l<strong>and</strong>-based effects on coastal fisheries <strong>and</strong> supporting<br />
biodiversity in New Zeal<strong>and</strong>. New Zeal<strong>and</strong> <strong>Aquatic</strong> <strong>Environment</strong> <strong>and</strong> <strong>Biodiversity</strong> Report No. 37. 100 p.<br />
Murphy, E.J., Cavanagh, R.D., Hofmann, E. E., Hill, S.L., Constable, A.J., Costa, D.P., Pinkerton, M.H., Johnston, N. M., Trathan, P. N.,<br />
Klinck, J.M., Wolf-Gladrow, D.A., Daly, K.L., Maury, O. <strong>and</strong> Doney, S.C. (<strong>2012</strong>) Developing integrated models of Southern<br />
Ocean food webs: including ecological complexity, accounting for uncertainty <strong>and</strong> the importance of scale. Progress in<br />
Oceanography, http://dx.doi.org/10.1016/j.pocean.<strong>2012</strong>.03.006.<br />
Needham, H.C., Pilditch, C.A., Lohrer, A. & Thrush, S. (2010). Habitat dependence in the functional traits ofAustrohelice crassa, a key<br />
bioturbating species. Marine Ecology Progress Series, 414:179-193.<br />
Needham, H.C., Pilditch, C.A., Lohrer, A.M. & Thrush, S.F. (2011). Context-specific bioturbation mediates changes to ecosystem<br />
functioning. Ecosystems, 14:1096-1109.<br />
Needham, H.R., Pilditch, C.A., Lohrer, A.M., Thrush, S.F. (In press). Density <strong>and</strong> habitat dependent effects of crab burrows on sediment<br />
erodibility. Journal of Sea Research<br />
Neil, H., et al (in press). Insights into historical marine productivity using ancient fish otoliths. Final Research Report: ZBD200505 MS 6<br />
Part B,<br />
Neill, K., D’Archino, R., Farr, T., Nelson, W. (<strong>2012</strong>). Macroalgal diversity associated with soft sediment habitats in New Zeal<strong>and</strong>. NZ<br />
<strong>Aquatic</strong> <strong>Environment</strong> <strong>and</strong> <strong>Biodiversity</strong> Report 87. 127 pp.<br />
Nelson WA, Gordon DP. (1997). Assessing New Zeal<strong>and</strong>'s marine biological diversity — a challenge for policy makers <strong>and</strong> systematists.<br />
NZ Sci Rev.;54:58–66.<br />
Nelson, W., Cummings, V., D’Archino, R., Halliday, J., Marriott, P., Neill, K. (2010). Macroalgae <strong>and</strong> benthic biodiversity of the Balleny<br />
Isl<strong>and</strong>s, Southern Ocean. New Zeal<strong>and</strong> <strong>Aquatic</strong> <strong>Environment</strong> <strong>and</strong> <strong>Biodiversity</strong> Report No. 55. 99 p.<br />
Nelson, W.A. Villouta, E. Neill, K.F. Williams, G.C.Adams, N.M. Slivsgaard, (2002)R. Marine Macroalgae of Fiordl<strong>and</strong>, New Zeal<strong>and</strong><br />
Tuhinga 13: 117–152 Copyright © Te Papa Museum of New Zeal<strong>and</strong><br />
Nelson, W.A.; Neill, K.; Farr, T.; Barr, N.; D’Archino, R.; Miller, S.; Stewart, R. (<strong>2012</strong>). Rhodolith beds in northern New<br />
Zeal<strong>and</strong>:characterisation of associated biodiversity <strong>and</strong> vulnerability to environmental stressors. New Zeal<strong>and</strong> <strong>Aquatic</strong><br />
<strong>Environment</strong> <strong>and</strong> <strong>Biodiversity</strong> Report 99. 102 pp.<br />
Nelson, W.A. (2009). Calcified macroalgae - critical to coastal ecosystems <strong>and</strong> vulnerable to change: A review. Marine <strong>and</strong> Freshwater<br />
Research 60:787-801.<br />
Nodder S, Maas E, Bowden D, Pilditch C. (2011) Physical, Biogeochemical <strong>and</strong> Microbial Characteristics of Sediment Samples from the<br />
Chatham Rise <strong>and</strong> Challenger Plateau. New Zeal<strong>and</strong>. Draft <strong>Aquatic</strong> <strong>Environment</strong> <strong>and</strong> <strong>Biodiversity</strong> Report No 70.<br />
Nodder SD (2008) OS 20/20 Chatham Rise & Challenger Plateau Hydrographic, <strong>Biodiversity</strong> & Seabed Habitats, NIWA Client Report:<br />
WLG2008-27, National Institute of Water & Atmospheric Research, Wellington, New Zeal<strong>and</strong><br />
Norkko, A., Andrew, N., Thrush, S., Cummings, V., Schwarz, A-M., Hawes, I., Mercer, S., Budd, R. Gibbs, M., Funnell, G., Hewitt, J.,<br />
Goring, D. (2002). Ecology <strong>and</strong> biodiversity of coastal benthic communities in McMurdo Sound, Ross Sea: development of<br />
sampling protocols <strong>and</strong> initial results. Final Research Report for Ministry of Fisheries Research Project ZBD2001/02, Objectives<br />
1, 2 & 3. 119p. (peer)<br />
Norkko, A., Thrush, S.F., Cummings, V.J., Funnell, G.A., Schwarz, A-M.S., Andrew, N.L., Hawes, I. (2004). Ecological role of<br />
Phyllophora antarctica drift accumulations in coastal soft-sediment communities of McMurdo Sound, Antarctica. Polar Biology<br />
27: 482-494.<br />
Norkko, A., Thrush, S.F., Cummings, V.J., Gibbs, M.M., Andrew, N.L., Norkko, J., Schwarz, A.-M. (2007). Trophic structure of coastal<br />
Antarctic food webs associated with changes in sea ice <strong>and</strong> food supply. Ecology 88: 2810-2820.<br />
Norkko, J., Norkko, A. Thrush, S.F., Cummings, V.J. (2005). Growth under environmental extremes: spatial <strong>and</strong> temporal patterns in<br />
nucleic acid ratios in two Antarctic bivalves. Journal of Experimental Marine Biology <strong>and</strong> Ecology 326: 114-156.<br />
Norkko, J., Norkko, A., Thrush, S.F., Valanko, S. & Suurkuukka, H. (2010). Conditional responses to increasing scales of disturbance, <strong>and</strong><br />
potential implications for threshold dynamics in soft-sediment communities. Marine Ecology Progress Series, 413:253-266.<br />
O’Driscoll, R.L., Macaulay, G.J., Gauthier, S., Pinkerton, M., Hanchet, S. (2010). Distribution, abundance <strong>and</strong> acoustic properties of<br />
Antarctic silverfish (Pleuragramma antarcticum) in the Ross Sea. CCAMLR document WG-FSA-10/P4. 17 p. (Deep-Sea<br />
Research II (2010), http://dx.doi.org/10.1016/j.dsr2.2010.05.018)<br />
O'Driscoll R.L. (2009). Preliminary acoustic results from the New Zeal<strong>and</strong> IPY-CAML survey of the Ross Sea region in February-March<br />
2008. Final Research Report for MFishMPI project IPY200701 objective 8. 14 p.<br />
291
AEBAR <strong>2012</strong>: Marine <strong>Biodiversity</strong><br />
O'Driscoll R.L.; Macaulay, G.J.; Gauthier, S.; Pinkerton, M.; Hanchet, S. (2009). Preliminary acoustic results from the New Zeal<strong>and</strong> IPY-<br />
CAML survey of the Ross Sea region in February-March 2008. CCAMLR SG-ASAM-09-05. 37 p.<br />
O'Driscoll, R.L.; Hanchet, S.M.; Miller, B.S. (in press). Can acoustic methods be used to monitor grenadier (Macrouridae) abundance in the<br />
Ross Sea region? Journal of Ichthyology.<br />
O'Driscoll, R.L.; Macaulay, G.J.; Gauthier, S.; Pinkerston, M; Hanchet, S. (2011). Distribution, abundance, <strong>and</strong> acoustic properties of<br />
Antarctic silverfish (Pleuragramma antarcticum) in the Ross Sea. Deep Sea Research II 58: 181–195.<br />
O'Loughlin MP, Paulay G, Davey N, Michonneau F (2011) The Antarctic region as a marine biodiversity hotspot for echinoderms: Diversity<br />
<strong>and</strong> diversification of sea cucumbers. Deep Sea Research Part II: Topical Studies in Oceanography 58:264-275<br />
Paavo, B., Jonker, R., Thrush, S. & Probert, P.K. 2011. Macrofaunal community patterns of adjacent coastal sediments with wave-reflecting<br />
or wave-dissipating characteristics. Journal of Coastal Research, 27:515-528.<br />
Page M.J.; Alcock, N.; Gordon, D.; Kelly-Shanks, M.; Nelson, W.; Neill, K.; Watson, J. (2001). Preliminary assessment of the biodiversity<br />
of benthic macrofauna of the western Ross Sea, Antarctica. Final Research Report to the Ministry of Fisheries. 29 p<br />
Pakhomov, E.A.; Hall, J; Williams, M.J.M.; Hunt, B.P.V.; Stevens, C.J. (2011) Biology of Salpa thompsoni in waters adjacent to the Ross<br />
Sea, Southern Ocean, during austral summer 2008. Polar Biology 34: 257-271. (DOI 10.1007/s00300-010-0878-9)<br />
Parker, S.J, A.J. Penney <strong>and</strong> M.R. Clark (2009). Detection criteria for managing trawl impacts on vulnerable marine ecosystems in high seas<br />
fisheries of the South Pacific Ocean. Marine Ecology Progress Series, 397: 309–317.<br />
Parker, S.J., S. Mormede, D. Tracey <strong>and</strong> M. Carter. (2009). Evaluation of VME taxa monitoring by scientific observers from New Zeal<strong>and</strong><br />
in the Ross Sea Antarctic toothfish longline fishery during the 2008-09 season. Document WG-TASO 09/08. CCAMLR, Hobart,<br />
Australia. 13p.<br />
Parravicini, V., Thrush, S.F., Chiantore, M., Morri, C., Croci, C. & Bianchi, C.N. (2010). The legacy of past disturbance: Chronic angling<br />
impairs long-term recovery of marine epibenthic communities from acute date-mussel harvesting. Biological<br />
Conservation, 143:2435-2440.<br />
Parsons, D et al. (<strong>2012</strong>). Risks of shifting baselines highlighted by anecdotal accounts of New Zeal<strong>and</strong>’s snapper fishery . New Zeal<strong>and</strong><br />
Journal of Marine <strong>and</strong> Freshwater Research 43: 965-983.<br />
Paul, L. (in press). Trends in the exploitation of finfish from the Hauraki Gulf, 1850−2006. <strong>Aquatic</strong> <strong>Environment</strong> <strong>and</strong> <strong>Biodiversity</strong> Report<br />
No. XX, 156 p.<br />
Paul, L., (<strong>2012</strong>). A history of the Firth of Thames dredge fishery for mussels: use <strong>and</strong> abuse of a coastal resource, New Zeal<strong>and</strong> <strong>Aquatic</strong><br />
<strong>Environment</strong> <strong>and</strong> <strong>Biodiversity</strong> Report No. 94, p. 27.<br />
Peart, R, Serjeant, K. Mulcahy K. (2011). Governing our oceans. <strong>Environment</strong>al reform for the exclusive Economic Zone. <strong>Environment</strong>al<br />
Defence Society Policy Paper; Available as e-book: http://www.eds.org.nz/.<br />
Pinkerton, M. (in press) Mass balance modeling of a NZ shelf ecosystem since 1200AD. <strong>Aquatic</strong> <strong>Environment</strong> <strong>and</strong> <strong>Biodiversity</strong> Report No. .<br />
Pinkerton, M., Hanchet, S., Bradford-Grieve, J., Cummings, V., Wilson, P., Williams, M. (2006). Modelling the effects of fishing in the<br />
Ross Sea. Final Research Report for Ministry of Fisheries Research Project ANT2004-05. 169 p.<br />
Pinkerton, M.H., A. Dunn <strong>and</strong> S.M. Hanchet. (2007). Ecological risk management <strong>and</strong> the fishery for Antarctic toothfish (Dissostichus<br />
mawsoni) in the Ross Sea, Antarctica. Pp 22. Document EMM-07-24, CCAMLR, Hobart, Australia.<br />
Pinkerton, M.H., J. Bradford-Grieve <strong>and</strong> S.M. Hanchet. (2009a). A balanced model of the food web of the Ross Sea, Antarctica. Submitted<br />
to CCAMLR Science. Under review.<br />
Pinkerton, M.H.; Forman, J.; Bury, S.J.; Brown, J.; Horn, P.; O’Driscoll, R.L. (in press). Diet <strong>and</strong> trophic niche of Antarctic silverfish<br />
(Pleuragramma antarcticum) in the Ross Sea, Antarctica. Journal of Fish Biology.<br />
Pinkerton, M.H.; J. Forman; D.W. Stevens; S.J. Bury; J. Brown (<strong>2012</strong>a). Diet <strong>and</strong> trophic niche of Macrourus spp. (Gadiformes,<br />
Macrouridae) in the Ross Sea region of the Southern Ocean. Journal of Ichthyology, Special Issue on Grenadiers (Ed: Alexei<br />
Orlov). (in press)<br />
Pinkerton, M.H.; V. Cummings; J. Forman; J. Brown; S.J. Bury (2009b). Trophic connections in the Ross Sea: information from stomach<br />
contents analysis <strong>and</strong> stable isotopes of carbon <strong>and</strong> nitrogen. Report to Ministry of Fisheries, project IPY200701 Obj10. Pp 18.<br />
Probert PK, McKnight DG, Grove SL. (1997) Benthic invertebrate bycatch from a deep-water trawl fishery, Chatham Rise, New Zeal<strong>and</strong>.<br />
Aquat Conserv: Mar Freshw Ecosyst.;7:27–40.<br />
Ramirez-Llodra E, Tyler PA, Baker MC, Bergstad OA, Clark MR, et al. (2011). Man <strong>and</strong> the Last Great Wilderness: Human Impact on the<br />
Deep Sea. PLoS ONE 6(8): e22588. doi:10.1371/journal.pone.0022588<br />
Reid, D.J., Chiaroni, L.D., Hewitt, J.E., Lohrer, A.M., Matthaei, C.D., Phillips, N.R., Scarsbrook, M.R., Smith, B.J., Thrush, S.F.,<br />
Townsend, C.R., Van Houte-Howes, K.S.S. & Wright-Stow, A.E. 2011. Sedimentation effects on the benthos of streams <strong>and</strong><br />
estuaries: A cross-ecosystem comparison. Marine <strong>and</strong> Freshwater Research, 62:1201-1213.<br />
Roberts CD, Stewart AL. (2001). Ross Sea fishes: a collection-based biodiversity research programme. Seafood New Zeal<strong>and</strong>, Dec. 9(11):<br />
79-84.<br />
Rodil, I.F., Lohrer, A.M., Chiaroni, L.D., Hewitt, J.E. & Thrush, S. (2011). Disturbance of s<strong>and</strong>flats by thin deposits of terrigenous<br />
sediment: consequences for primary production <strong>and</strong> nutrient release. Ecological Applications, 21:416-426.<br />
Rodríguez LO, editor. [UNEP/CBD/SBSTTA/4/INF6.]. Paris: IUBS/DIVERSITAS; (2000). Implementing the GTI: Recommendations from<br />
DIVERSITAS Core Programme Element 3, Including an Assessment of Present Knowledge of Key Species Groups.<br />
Rogers, A.D. & Laffoley, D.d’A. (2011). International Earth system expert workshop on ocean Stresses <strong>and</strong> impacts. Summary report. IPSO<br />
Oxford, 18 pp.<br />
Rowden AA, Berkenbusch K, Brewin PE, Dalen J, Neill KF, Nelson WA, Oliver MD, Probert PK, Schwarz A-M, Sui PH, Sutherl<strong>and</strong> D<br />
(2007). A review of the marine soft-sediment assemblages of New Zeal<strong>and</strong>. NZ <strong>Aquatic</strong> <strong>Environment</strong> <strong>and</strong> <strong>Biodiversity</strong> Report.<br />
184 pp.<br />
Rowden AA, O'Shea S, Clark MR. (2002) Benthic biodiversity of seamounts on the northwest Chatham Rise. [NZ Min Fish] Mar Biodiv<br />
Biosecurity Rep.;2:1–21.<br />
Rowden, A.A. Kroger K. Clark, M. (in press). <strong>Biodiversity</strong> of macroinvertabrates <strong>and</strong> fish assemblages of the Balleny Isl<strong>and</strong>s seamounts.<br />
AEBR Series<br />
Rowden, A.A., Clark, M.R, O'Shea, S., McKnight, D.G. (2003). Benthic biodiversity of seamounts on the southern Kermadec volcanic arc.<br />
Marine <strong>Biodiversity</strong> Biosecurity Report No. 3. 23 p.<br />
Rowden, A.A., Clark, M.R. (2010). Benthic biodiversity of seven seamounts on the southern end of the Kermadec volcanic arc, northeast<br />
New Zeal<strong>and</strong>. New Zeal<strong>and</strong> <strong>Aquatic</strong> <strong>Environment</strong> <strong>and</strong> <strong>Biodiversity</strong> Report No. 62. 31 p.<br />
Rowden, A.A., Clark, M.R., O'Shea, S. (2004). Benthic biodiversity of seamounts on the Northl<strong>and</strong> Plateau. Marine <strong>Biodiversity</strong><br />
Biosecurity Report No. 5. 21 p.<br />
Rowden, A.A., Oliver, M., Clark, M.R., Mackay, K. (2008). New Zeal<strong>and</strong>'s "SEAMOUNT" database: recent updates <strong>and</strong> its potential use<br />
for ecological risk assessment. New Zeal<strong>and</strong> <strong>Aquatic</strong> <strong>Environment</strong> <strong>and</strong> <strong>Biodiversity</strong> Report No. 27. 49 p.<br />
292
AEBAR <strong>2012</strong>: Marine <strong>Biodiversity</strong><br />
Rowden, A.A., O'Shea, S., Clark, M.R. (2002). Benthic biodiversity of seamounts on the northwest Chatham Rise. Marine <strong>Biodiversity</strong><br />
Biosecurity Report No. 2. 21 p.<br />
Rowden, A.A.; Clark, M.R.; Wright, I.C. (2005). Physical characterisation <strong>and</strong> a biologically focused classification of "seamounts" in the<br />
New Zeal<strong>and</strong> region. New Zeal<strong>and</strong> Journal of Marine <strong>and</strong> Freshwater Research 39: 1039-1059.<br />
Russell LK, Hepburn CD, Hurd CL, Stuart MD. 2008 The exp<strong>and</strong>ing range of Undaria pinnatifida in southern New Zeal<strong>and</strong>: distribution,<br />
dispersal mechanisms <strong>and</strong> the invasion of wave-exposed environments. Biol Invasions.;10:103–115.<br />
Safi, K.; Robinson, K.; Hall, J.; Schwarz, J.; Maas, E. (<strong>2012</strong>). Ross Sea deep-ocean <strong>and</strong> epipelagic microzooplankton during the summerautumn<br />
transition period. <strong>Aquatic</strong> Microbial Ecology 67(2): 123-137.<br />
Savage C, Thrush SF, Lohrer AM, Hewitt JE (<strong>2012</strong>) Ecosystem Services Transcend Boundaries: Estuaries Provide Resource Subsidies <strong>and</strong><br />
Influence Functional Diversity in Coastal Benthic Communities. PLoS ONE 7(8): e42708. doi:10.1371/journal.pone.0042708<br />
Savage, C. (2009). Development of bioindicators for the assimilation of terrestrial nutrient inputs in coastal ecosystems as a tool for<br />
watershed management. New Zeal<strong>and</strong> <strong>Aquatic</strong> <strong>Environment</strong> <strong>and</strong> <strong>Biodiversity</strong> Report No. 30. 35 p.<br />
Schiaparelli S, Alvaro MC, Bohn J, Albertelli G (2010) 'Hitchhiker' polynoid polychaetes in cold deep waters <strong>and</strong> their potential influence<br />
on benthic soft bottom food webs. Antarctic Science 22:399-407<br />
Schiel. D.R. (2011) Biogeographic patterns <strong>and</strong> long-term changes on New Zeal<strong>and</strong> coastal reefs: Non-trophic cascades from diffuse <strong>and</strong><br />
local impacts. Journal of Experimental Marine Biology <strong>and</strong> Ecology 400:1-2, 33-51 Online publication date: 1-Apr-2011 Read<br />
More: http://www.esajournals.org/doi/abs/10.1890/03-3107<br />
Schwarz, A., Taylor, R., Hewitt, J., Phillips, N., Shima, J., Cole, R., Budd, R. (2006). Impacts of terrestrial runoff on the biodiversity of<br />
rocky reefs. New Zeal<strong>and</strong> <strong>Aquatic</strong> <strong>Environment</strong> <strong>and</strong> <strong>Biodiversity</strong> Report No 7. 109 p.<br />
Schwarz, A-M., Hawes, I., Andrew, N., Mercer, S., Cummings, V., Thrush, S. (2005). Primary production potential of non-geniculate<br />
coralline algae at Cape Evans, Ross Sea, Antarctica. Marine Ecology Progress Series 294: 131-140.<br />
Schwarz, A-M., Hawes, I., Andrew, N., Norkko, A., Cummings, V., Thrush, S. (2003). Macroalgal photosynthesis near the southern global<br />
limit for growth; Cape Evans, Ross Sea, Antarctica. Polar Biology 26: 789-799.<br />
Sewell, M.A., (2005). Examination of the meroplankton community in the southwestern Ross Sea, Antarctica, using a collapsible plankton<br />
net. Polar Biol. 28:119–131.<br />
Sewell, M.A., (2006). The meroplankton community of the northern Ross Sea: a preliminary comparison with the McMurdo Sound region.<br />
Antarct. Sci. 18:595–602.<br />
Sewell, M.A., Lavery, S., Baker, C.S. (2006). Whose larva is that? Molecular identification of planktonic larvae of the Ross Sea. New<br />
Zeal<strong>and</strong> <strong>Aquatic</strong> <strong>Environment</strong> <strong>and</strong> <strong>Biodiversity</strong> Report No. 3. 57 p.<br />
Sharp, B.R., S.J. Parker, M.H. Pinkerton (lead authors); also B.B. Breen, V. Cummings, A. Dunn, S.M. Grant, S.M. Hanchet, H.J.R. Keys,<br />
S.J. Lockhart, P.O’B. Lyver, R.L. O’Driscoll, M.J.M. Williams, P.R. Wilson. (2010). Bioregionalisation <strong>and</strong> Spatial Ecosystem<br />
Processes in the Ross Sea Region. CCAMLR document WG-EMM-10/30, Hobart, Australia.<br />
Smith AM. (2009) Bryozoans as southern sentinels of ocean acidification: a major role for a minor phylum. Mar Freshw Res.;60:475–482.<br />
Smith AM. Gordon, D. (2011). Bryozoans of southern New Zeal<strong>and</strong> Field Identification Guide AEBR.<br />
Smith PJ, Steinke D, McMillan PJ, Stewart AL, McVeagh SM, Diaz De Astarloa JM, Welsford D, Ward RD. (2011). DNA barcoding<br />
highlights a cryptic species of grenadier (genus Macrourus) in the Southern Ocean. Journal of Fish Biology, 78(1):355-65.<br />
Smith PJ, Steinke, D, McMillan PJ, Stewart AL, Ward RD. (2011). DNA barcoding of morids (Actinopterygii, Moridae) reveals deep<br />
divergence in the anti tropical Halargyreus johnsoni but little distinction between Antimora rostrata <strong>and</strong> A. microlepis.<br />
Mitochondrial DNA, (doi:10.3109/19401736.2010.532329).<br />
Smith, F. (2006). Balleny Isl<strong>and</strong>s Ecology Research Voyage Report, R.V. Tiama. Unpublished report held at Ministry of Fisheries for<br />
project ZBD2005/01.<br />
Smith, I.W.G. (2005). Retreat <strong>and</strong> resilience: Fur seals <strong>and</strong> human settlement in New Zeal<strong>and</strong>. In: Monks, G.G. (ed) The Exploitation <strong>and</strong><br />
Cultural Importance of Marine Mammals. Oxford, Oxbow Books. 6-18.<br />
Smith, I.W.G. (2011). Estimating the magnitude of pre-European Maori marine harvest in two New Zeal<strong>and</strong> study areas, New Zeal<strong>and</strong><br />
<strong>Aquatic</strong> <strong>Environment</strong> <strong>and</strong> <strong>Biodiversity</strong> Report, No. 82, p. 72 p)<br />
Smith, P.J., Steinke, D., McMillan, P.J., McVeagh, S.M., Struthers, C.D. (2008). DNA database for commercial marine fish. New Zeal<strong>and</strong><br />
<strong>Aquatic</strong> <strong>Environment</strong> <strong>and</strong> <strong>Biodiversity</strong> Report No. 22. 62 p.<br />
Snelder T, Leathwick J, Dey K, Rowden A, Weatherhead M, (2006). Development of an ecological marine classification in the New<br />
Zeal<strong>and</strong> region. Envir Managemt.;39:12–29.<br />
Stein D. (<strong>2012</strong>). Snailfishes (Family Liparidae) of the Ross Sea, Antarctica, <strong>and</strong> closely adjacent waters. Zootaxa 3285. 120 pp. ISBN 978-<br />
1-86977-870-5 (Online edition)<br />
Stevens DW. Dunn MR. (2010). Different food preferences in four sympatric deep-sea Macrourid fishes. Marine Biology. DOI<br />
10.1007/s00227-010-1542-1<br />
Stevens, D.W.; Hurst, R.J.; Bagley, N.W. (2011). Feeding habits of New Zeal<strong>and</strong> fishes: a literature review <strong>and</strong> summary of research trawl<br />
database records 1960 to 2000. New Zeal<strong>and</strong> <strong>Aquatic</strong> <strong>Environment</strong> <strong>and</strong> <strong>Biodiversity</strong> Report No<br />
Sutherl<strong>and</strong> DL. (2008). Surface-associated diatoms from marine habitats at Cape Evans, Antarctica, including the first record of living<br />
Eunotogramma marginopunctatum. Polar Biology DOI 10.1007/s00300-008-0426-z.<br />
Thrush SF <strong>and</strong> Dayton PK (2002) Disturbance to marine benthic habitats by trawling <strong>and</strong> dredging: implications for marine biodiversity.<br />
<strong>Annual</strong> <strong>Review</strong> of Ecology <strong>and</strong> Systematics 33:449–473<br />
Thrush, S.F. <strong>and</strong> Cummings, V.J. (2011). Massive icebergs, alteration in primary food resources <strong>and</strong> change in benthic communities at Cape<br />
Evans, Antarctica. Marine Ecology, 32:289–299.<br />
Thrush, S.F. & Dayton, P. (2010). What can ecology contribute to Ecosystem-based Management of marine fisheries? <strong>Annual</strong> <strong>Review</strong>s in<br />
Marine Science, 2:419-441.<br />
Thrush, S.F. & Lohrer, A.M. (<strong>2012</strong>). Why bother going outside: the role of observational studies in underst<strong>and</strong>ing biodiversity-ecosystem<br />
function relationships. In, Marine biodiversity futures <strong>and</strong> ecosystem functioning Frameworks, methodologies <strong>and</strong> integration,<br />
edited by D. M. Paterson, M. Solan <strong>and</strong> R. Aspenal, Oxford University Press, p198-212.<br />
Thrush, S.F. D. Lohrer <strong>and</strong> C. Savage (in press) Carbonate sediments: the positive <strong>and</strong> negative effects of l<strong>and</strong>-coast interactions on<br />
functional diversity, AEBR report;<br />
Thrush, S.F., Chiantore, M., Asnagi, V., Hewitt, J., Fiorentino, D. & Cattaneo-Vietti, R. (2011). Habitat-diversity relationships in rocky<br />
shore algal turf infaunal communities Marine Ecology Progress Series, 424:119-132.<br />
Thrush, S.F., Cummings, V.J. (in press) Massive icebergs, alteration in primary food resources <strong>and</strong> change in benthic communities at Cape<br />
Evans, Antarctica. Marine Ecology.<br />
Thrush, S.F., Cummings, V.J. (2011). Massive icebergs, alteration in primary food resources <strong>and</strong> change in benthic communities at Cape<br />
Evans, Antarctica. Marine Ecology 32 (3): 289–299. doi: 10.1111/j.1439-0485.2011.00462.x<br />
293
AEBAR <strong>2012</strong>: Marine <strong>Biodiversity</strong><br />
Thrush, S.F., Dayton, P.K., Cattaneo-Vietti, R., Chiantore, M., Cummings, V.J., Andrew, N.L., Hawes, I., Kim, S., Kvitek, R., Schwarz, A.-<br />
M. (2006). Broad-scale factors influencing the biodiversity of coastal benthic communities of the Ross Sea. Deep Sea Research II<br />
53: 959–971.<br />
Thrush, S.F., Hewitt, J., Cummings, V.J., Norkko, A. & Chiantore, M. (2010). β-Diversity <strong>and</strong> species accumulation in Antarctic coastal<br />
benthos: Influence of habitat, distance <strong>and</strong> productivity on ecological connectivity. PLoS ONE,5:E11899.<br />
Thrush, S.F., Hewitt, J.E. & Lohrer, A.M. (<strong>2012</strong>). Interaction networks in coastal soft-sediments highlight the potential for change in<br />
ecological resilience. Ecological Applications, 22:1213–1223.<br />
Thrush, S.F., Hewitt, J.E., Lohrer A.M., Chiaroni L.D. (In press). When small changes matter: the role of cross-scale interactions between<br />
habitat <strong>and</strong> ecological connectivity in recovery. Ecological Applications.<br />
Thrush, S.F.; Hewitt, J.E.; Cummings, V.J.; Green, M.O.; Funnell, G.A.; Wilkinson, M.R. (2000). The generality of field experiments:<br />
interactions between local <strong>and</strong> broad-scale processes. Ecology 81: 399–415.<br />
Thrush, S.F.; Pridmore, R.D.; Bell, R.G.; Cummings, V.J.; Dayton, P.K.; Ford, R.; Grant, J.; Hewitt, J.E.; Hines, A.H.; Hume, T.M.; Lawrie,<br />
S.M.; Legendre, P.; McArdle, B.H.; Morrisey, D.; Schneider, D.C.; Turner, S.J.; Walters, R.; Whitlatch, R.B.; Wilkinson, M.R.<br />
(1997). The s<strong>and</strong>flat habitat: Scaling from experiments to conclusions. Journal of Experimental Marine Biology <strong>and</strong> Ecology<br />
216: 1_9. [did not see this referred to in the text]<br />
Tittensor, D.P., A.R. Baco, P.E. Brewin, M.R. Clark, M. Consalvey, J. Hall-Spencer, A.A. Rowden, T. Schlacher, K.I. Stocks <strong>and</strong> A.D.<br />
Rogers (2009). Predicting global habitat suitability for stony corals on seamounts. Journal of Biogeography, 36: 1111–1128.<br />
Townsend, M., Thrush, S. & Carbines, M. (2011). Simplfying the complex: an ecosystem principles approach to goods <strong>and</strong> services<br />
management in marine coastal systems. Marine Ecology Progress Series, 434:291-301.<br />
Tracey, D.; Baird, S.J.; S<strong>and</strong>ers, B.M.; Smith, M.H. (2011). Distribution of protected corals in relation to fishing effort <strong>and</strong> assessment of<br />
accuracy of observer identification. NIWA Client Report No: WLG2011-33 prepared for Department of Conservation,<br />
Wellington. 74 p.<br />
Tracey, D., Carter, M., Parker, S. (2010). Evaluation of VME taxa monitoring by scientific observers. Final Research Report for Ministry of<br />
Fisheries Research Project ANT2009/01 Objective 8. 17 p.<br />
Tracey, D., Rowden, A., Mackay, K., Compton, T. (2011). Habitat-forming coldwater corals show affinity for seamounts in the New<br />
Zeal<strong>and</strong> region. Mar Ecol Prog Ser 430, 1–22.<br />
Tracey, D., Susan Jane Baird, S.J. Brian S<strong>and</strong>ers, B., Smith, M. H. Smith (2011). Identification of Protected Corals: distribution in relation<br />
to fishing effort <strong>and</strong> accuracy of observer identifications (MCSINT 2010/03). Final Report prepared for Marine Conservation<br />
Services (MCS), Department of Conservation | Te Papa Atawhai. 74 p.<br />
Tracey, D.M., Anderson, O.F., Clark, M.R., Oliver, M.D. (2005). A guide to common deepsea invertebrates in New Zeal<strong>and</strong> waters. New<br />
Zeal<strong>and</strong> <strong>Aquatic</strong> <strong>Environment</strong> <strong>and</strong> <strong>Biodiversity</strong> Report No. 1. 160 p.<br />
Tracey, D.M., Anderson, O.F., Naylor, J. R. (2007). A guide to common deepsea invertebrates in New Zeal<strong>and</strong> waters. New Zeal<strong>and</strong><br />
<strong>Aquatic</strong> <strong>Environment</strong> <strong>and</strong> <strong>Biodiversity</strong> Report No. 10. 282 p.<br />
Tracey, D.M.; Anderson, O.F.; Naylor, R.J. (2011). A guide to common deepsea invertebrates in New Zeal<strong>and</strong> waters. New Zeal<strong>and</strong><br />
<strong>Aquatic</strong> <strong>Environment</strong> <strong>and</strong> <strong>Biodiversity</strong> Report 86. 317 p.<br />
Tuck, I., Cole, R., Devine, J. (2009). Ecosystem indicators for New Zeal<strong>and</strong> fisheries. New Zeal<strong>and</strong> <strong>Aquatic</strong> <strong>Environment</strong> <strong>and</strong> <strong>Biodiversity</strong><br />
Report No. 42. 188 p.<br />
Tuck, I., Drury, J., Kelly, M., Gerring, P. (2010). Designing a programme to monitor the recovery of the benthic community between North<br />
Cape <strong>and</strong> Cape Reinga. New Zeal<strong>and</strong> <strong>Aquatic</strong> <strong>Environment</strong> <strong>and</strong> <strong>Biodiversity</strong> Report No. 53. 78 p.<br />
Turner SJ, Thrush SF, Hewitt JE, Cummings VJ, Funnell GA. (1999). Fishing impacts <strong>and</strong> the degradation or loss of habitat structure. Fish<br />
Managemt Ecol.;6:401–420.<br />
Varian, S.J. (2005). A summary of the values of the Balleny Isl<strong>and</strong>s, Antarctica. Marine <strong>Biodiversity</strong> Biosecurity Report No. 6. 13 p.<br />
Williams R, Gould B, Christian S. Shipwrecks 2008— an international biosecurity risk? Surveillance.;35:4–6.<br />
Williams, A.; Schlacher, T.A.; Rowden, A.A.; Althaus, F.; Clark, M.R.; Bowden, D.A.; Stewart, R.; Bax, N.J.; Consalvey, M.; Kloser, R.J.<br />
(2010) Seamount megabenthic assemblages fail to recover from trawling impacts. Marine Ecology 31(suppl. 1): 183–199.<br />
Wing, S.R. (2005) Fiordl<strong>and</strong> <strong>Biodiversity</strong> Research Cruise Final Research Report ZBD2003-04<br />
Woelkerling, Wm J.; Nelson, W.A. (2004). A baseline summary <strong>and</strong> analysis of the taxonomic biodiversity of coralline red algae<br />
(Corallinales, Rhodophyta) recorded from the New Zeal<strong>and</strong> region. Cryptogamie Algologie 25: 39-106.<br />
Woodin, S.A., Wethey, D.S., Hewitt, J.E. & Thrush, S.F. (<strong>2012</strong>). Small scale terrestrial clay deposits on intertidal s<strong>and</strong>flats: Behavioral<br />
changes <strong>and</strong> productivity reduction. Journal of Experimental Marine Biology <strong>and</strong> Ecology,413:184–191.<br />
294
11.6. Appendix<br />
AEBAR <strong>2012</strong>: Marine <strong>Biodiversity</strong><br />
Technical rationale for the goals <strong>and</strong> targets of the strategic plan for the period 2011-<br />
2020. UNEP/CBD/COP/10/9 18 July 2010.<br />
Strategic goal A. Address the underlying causes of biodiversity loss by mainstreaming biodiversity across<br />
government <strong>and</strong> society<br />
Strategic actions should be initiated immediately to address, over a longer term, the underlying causes of<br />
biodiversity loss. This requires policy coherence <strong>and</strong> the integration of biodiversity into all national<br />
development policies <strong>and</strong> strategies <strong>and</strong> economic sectors <strong>and</strong> at all levels of government. Approaches to<br />
achieve this include communication, education <strong>and</strong> public awareness, appropriate pricing <strong>and</strong> incentives, <strong>and</strong><br />
the broader use of planning tools such as strategic environmental assessment. Stakeholders across all sectors of<br />
government, society <strong>and</strong> the economy, including business, will need to be engaged as partners to implement<br />
these actions. Consumers <strong>and</strong> citizens must also be mobilized to contribute to biodiversity conservation <strong>and</strong><br />
sustainable use, to reduce their ecological footprints <strong>and</strong> to support action by Governments.<br />
[Note: Targets 1-5 not given here.] Targets 6-11 are directly quoted from the document.<br />
Target 6: By 2020, overfishing is ended, destructive fishing practices are eliminated, <strong>and</strong> all fisheries are<br />
managed sustainably.] or [By 2020, all exploited fish stocks <strong>and</strong> other living marine <strong>and</strong> aquatic resources<br />
are harvested sustainably [<strong>and</strong> restored], <strong>and</strong> the impact of fisheries on threatened species <strong>and</strong> vulnerable<br />
ecosystems are within safe ecological limits.<br />
Overexploitation is the main pressure on marine fisheries globally <strong>and</strong> the World Bank estimates that<br />
overexploitation represents a lost profitability of some $50 billion per year <strong>and</strong> puts at risk some 27 million jobs<br />
<strong>and</strong> the well-being of more than one billion people. Better fisheries management, which may include a reduction<br />
in fishing effort is needed to reduce pressure on ecosystems <strong>and</strong> to ensure the sustainable use of fish stocks. The<br />
specific target should be regarded as a step towards ensuring that all fisheries are sustainable while building<br />
upon existing initiatives such as the Code of Conduct for Responsible Fishing. Indicators to measure progress<br />
towards this target include the Marine Trophic Index, the proportion of products derived from sustainable<br />
sources <strong>and</strong> trends in abundance <strong>and</strong> distribution of selected species. Other possible indicators include the<br />
proportion of collapsed species, fisheries catch, catch per unit effort, <strong>and</strong> the proportion of stocks overexploited.<br />
Baseline information for several of these indicators is available from the Food <strong>and</strong> Agriculture Organization of<br />
the United Nations.<br />
Target 7: By 2020, areas under agriculture, aquaculture <strong>and</strong> forestry are managed sustainably, ensuring<br />
conservation of biodiversity.<br />
The increasing dem<strong>and</strong> for food, fibre <strong>and</strong> fuel will lead to increasing losses of biodiversity <strong>and</strong> ecosystem<br />
services if management systems do not become increasingly sustainable with regard to the biodiversity. Criteria<br />
for sustainable forest management have been adopted by the forest sector <strong>and</strong> there are many efforts by<br />
Governments, indigenous <strong>and</strong> local communities, NGOs <strong>and</strong> the private sector to promote good agricultural,<br />
aquaculture <strong>and</strong> forestry practices. The application of the ecosystem approach would also assist with the<br />
implementation of this target. While, as yet, there are no universally agreed sustainability criteria, given the<br />
diversity of production systems <strong>and</strong> environmental conditions, each sector <strong>and</strong> many initiatives have developed<br />
their own criteria which could be used pending the development of a more common approach. Similarly, the use<br />
of certification <strong>and</strong> labelling systems or st<strong>and</strong>ards could be promoted as part of this target. Relevant indicators<br />
for this target include the area of forest, agricultural <strong>and</strong> aquaculture ecosystems under sustainable management,<br />
the proportion of products derived from sustainable sources <strong>and</strong> trends in genetic diversity of domesticated<br />
animals, cultivated plants <strong>and</strong> fish species of major socioeconomic importance. Existing sustainability<br />
certification schemes could provide baseline information for some ecosystems <strong>and</strong> sectors.<br />
UNEP/CBD/COP/10/9 Page 5 /...<br />
295
AEBAR <strong>2012</strong>: Marine <strong>Biodiversity</strong><br />
Target 8: By 2020, pollution, including from excess nutrients, has been brought to levels that are not<br />
detrimental to ecosystem function <strong>and</strong> biodiversity.<br />
Pollution, including nutrient loading is a major <strong>and</strong> increasing cause of biodiversity loss <strong>and</strong> ecosystem<br />
dysfunction, particularly in wetl<strong>and</strong>, coastal, marine <strong>and</strong> dryl<strong>and</strong> areas. Humans have already more than doubled<br />
the amount of “reactive nitrogen” in the biosphere, <strong>and</strong> business-as-usual trends would suggest a further<br />
increase of the same magnitude by 2050. The better control of sources of pollution, including efficiency in<br />
fertilizer use <strong>and</strong> the better management of animal wastes, coupled with the use of wetl<strong>and</strong>s as natural water<br />
treatment plants where appropriate, can be used to bring nutrient levels below levels that are critical for<br />
ecosystem functioning, without curtailing the application of fertilizer in areas where it is necessary to meet soil<br />
fertility <strong>and</strong> food security needs. Similarly, the development <strong>and</strong> application of national water quality guidelines<br />
could help to limit pollution <strong>and</strong> excess nutrients from entering freshwater <strong>and</strong> marine ecosystems. Relevant<br />
indicators include nitrogen deposition <strong>and</strong> water quality in freshwater ecosystems. Other possible indicators<br />
could be the ecological footprint <strong>and</strong> related concepts, total nutrient use, nutrient loading in freshwater <strong>and</strong><br />
marine environments, <strong>and</strong> the incidence of hypoxic zones <strong>and</strong> algal blooms. Data which could provide baseline<br />
information already exists for several of these indicators, including the global aerial deposition of reactive<br />
nitrogen <strong>and</strong> the incidence of marine dead zones (an example of human-induced ecosystem failure).<br />
Target 9: By 2020, invasive alien species are identified, prioritized <strong>and</strong> controlled or eradicated <strong>and</strong><br />
measures are in place to control pathways for the introduction <strong>and</strong> establishment of invasive alien species.<br />
Invasive alien species are a major threat to biodiversity <strong>and</strong> ecosystem services, <strong>and</strong> increasing trade <strong>and</strong> travel<br />
means that this threat is likely to increase unless additional action is taken. Pathways for the introduction of<br />
invasive alien species can be managed through improved border controls <strong>and</strong> quarantine, including through<br />
better coordination with national <strong>and</strong> regional bodies responsible for plant <strong>and</strong> animal health. While welldeveloped<br />
<strong>and</strong>, globally-applicable indicators are lacking, some basic methodologies do exist which can serve as<br />
a starting point for further monitoring or provide baseline information. Process indicators for this target could<br />
include the number of countries with national invasive species policies, strategies <strong>and</strong> action plans <strong>and</strong> the<br />
number of countries which have ratified international agreements <strong>and</strong> st<strong>and</strong>ards related to the prevention <strong>and</strong><br />
control of invasive alien species. One outcome-oriented indicator is trends in invasive alien species while other<br />
possible indicators could include the status of alien species invasion, <strong>and</strong> the Red List Index for impacts of<br />
invasive alien species.<br />
Target 10: By [2020][2015], to have minimized the multiple pressures on coral reefs, <strong>and</strong> other vulnerable<br />
ecosystems impacted by climate change or ocean acidification, so as to maintain their integrity <strong>and</strong><br />
functioning.<br />
Given the ecological inertias related to climate change <strong>and</strong> ocean acidification, it is important to urgently reduce<br />
other pressures on vulnerable ecosystems such as coral reefs so as to give vulnerable ecosystems time to cope<br />
with the pressures caused by climate change. This can be accomplished by addressing those pressures which are<br />
most amenable to rapid positive changes <strong>and</strong> would include activities such as reducing pollution <strong>and</strong><br />
overexploitation <strong>and</strong> harvesting practices which have negative consequences on ecosystems. Indicators for this<br />
target include the extent of biomes ecosystems <strong>and</strong> habitats (% live coral, <strong>and</strong> coral bleaching), Marine Trophic<br />
Index, the incidence of human-induced ecosystem failure, <strong>and</strong> the health <strong>and</strong> well-being of communities who<br />
depend directly on local ecosystem goods <strong>and</strong> services, proportion of products derived from sustainable sources.<br />
UNEP/CBD/COP/10/9 Page 6 /...<br />
Strategic goal C: To improve the status of biodiversity by safeguarding ecosystems, species <strong>and</strong> genetic<br />
diversity<br />
Whilst longer term actions to reduce the underlying causes of biodiversity loss are taking effect, immediate<br />
actions, such as protected areas, species recovery programmes, l<strong>and</strong>-use planning approaches, the restoration of<br />
degraded ecosystems <strong>and</strong> other targeted conservation interventions can help conserve biodiversity <strong>and</strong> critical<br />
ecosystems. These might focus on culturally-valued species <strong>and</strong> key ecosystem services, particularly those of<br />
importance to the poor, as well as on threatened species. For example, carefully sited protected areas could<br />
prevent the extinction of threatened species by protecting their habitats, allowing for future recovery.<br />
Target 11: By 2020, at least [15%][20%] of terrestrial, inl<strong>and</strong>-water <strong>and</strong> [X%] of coastal <strong>and</strong> marine<br />
areas, especially areas of particular importance for biodiversity <strong>and</strong> ecosystem services, are conserved<br />
through comprehensive, ecologically representative <strong>and</strong> well-connected systems of effectively managed<br />
protected areas <strong>and</strong> other means, <strong>and</strong> integrated into the wider l<strong>and</strong>- <strong>and</strong> seascape.<br />
Currently, some 13 per cent of terrestrial areas <strong>and</strong> 5 per cent of coastal areas are protected, while very little of<br />
the open oceans are protected. Therefore reaching the proposed target implies a modest increase in terrestrial<br />
protected areas globally, with an increased focus on representativity <strong>and</strong> management effectiveness, together<br />
296
AEBAR <strong>2012</strong>: Marine <strong>Biodiversity</strong><br />
with major efforts to exp<strong>and</strong> marine protected areas. Protected areas should be integrated into the wider l<strong>and</strong>-<br />
<strong>and</strong> seascape, bearing in mind the importance of complementarity <strong>and</strong> spatial configuration. In doing so, the<br />
ecosystem approach should be applied taking into account ecological connectivity <strong>and</strong> the concept of ecological<br />
networks, including connectivity for migratory species. Protected areas should also be established <strong>and</strong> managed<br />
in close collaboration with, <strong>and</strong> through participatory <strong>and</strong> equitable processes that recognize <strong>and</strong> respect the<br />
rights of indigenous <strong>and</strong> local communities, <strong>and</strong> vulnerable populations. Other means of protection may also<br />
include restrictions on activities that impact on biodiversity, which would allow for the safeguarding of sites in<br />
areas beyond national jurisdiction in a manner consistent with the jurisdictional scope of the Convention as<br />
contained in Article 4. Relevant indicators to measure progress towards this target are the coverage of sites of<br />
biodiversity significance covered by protected areas <strong>and</strong> the connectivity/fragmentation of ecosystems. Other<br />
possible indicators include the overlay of protected areas with ecoregions, <strong>and</strong> the governance <strong>and</strong> management<br />
effectiveness of protected areas. Good baseline information already exists from sources such as the World<br />
Database of Protected Areas the Alliance for Zero Extinction, <strong>and</strong> the IUCN Red List of Threatened Species <strong>and</strong><br />
the IUCN World Commission on Protected Areas.<br />
297
12. Appendices<br />
AEBAR <strong>2012</strong>: Appendices<br />
12.1. Terms of Reference for the <strong>Aquatic</strong> <strong>Environment</strong><br />
Working Group in <strong>2012</strong><br />
Overall purpose<br />
For all New Zeal<strong>and</strong> fisheries in the New Zeal<strong>and</strong> TS <strong>and</strong> EEZ as well as other important fisheries in<br />
which New Zeal<strong>and</strong> engages:<br />
to assess, based on scientific information, the effects of (<strong>and</strong> risks posed by) fishing, aquaculture, <strong>and</strong><br />
enhancement on the aquatic environment, including:<br />
• bycatch <strong>and</strong> unobserved mortality of protected species (e.g. seabirds <strong>and</strong> marine<br />
mammals), fish, <strong>and</strong> other marine life, <strong>and</strong> consequent impacts on populations<br />
• effects of bottom fisheries on benthic biodiversity, species, <strong>and</strong> habitat<br />
• effects on biodiversity, including genetic diversity<br />
• changes to ecosystem structure <strong>and</strong> function from fishing, including trophic effects<br />
• effects of aquaculture <strong>and</strong> fishery enhancement on the environment <strong>and</strong> on fishing<br />
Where appropriate <strong>and</strong> feasible, such assessments should explore the implications of the effect,<br />
including with respect to government st<strong>and</strong>ards, other agreed reference points, or other relevant<br />
indicators of population or environmental status. Where possible, projections of future status under<br />
alternative management scenarios should be made.<br />
AEWG assesses the effects of fishing or environmental status, <strong>and</strong> may evaluate the consequences of<br />
alternative future management scenarios. AEWG does not make management recommendations or<br />
decisions (this responsibility lies with MPI fisheries managers <strong>and</strong> the Minister responsible for<br />
Fisheries).<br />
MPI also convenes a <strong>Biodiversity</strong> Research Advisory Group (BRAG) which has a similar review<br />
function to the AEWG. Projects reviewed by BRAG <strong>and</strong> AEWG have some commonalities in that<br />
they relate to aspects of the marine environment. However, the key focus of projects considered by<br />
BRAG is on marine issues related to the functionality of the marine ecosystem <strong>and</strong> its productivity,<br />
whereas projects considered by AEWG are more commonly focused on the direct effects of fishing.<br />
Preparatory tasks<br />
1. Prior to the beginning of AEWG meetings each year, MPI fisheries scientists will produce a<br />
list of issues for which new assessments or evaluations are likely to become available prior to<br />
the next scheduled sustainability round or decision process. AEWG Chairs will determine the<br />
final timetables <strong>and</strong> agendas.<br />
2. The Ministry’s research planning processes should identify most information needs well in<br />
advance but, if urgent issues arise, MPI-Fisheries or st<strong>and</strong>ards managers will alert MPI-<br />
Fisheries science managers <strong>and</strong> the Principal Advisor Fisheries Science, at least 3 months<br />
prior to the required AEWG meetings to other cases for which assessments or evaluations are<br />
urgently needed.<br />
298
Technical objectives<br />
AEBAR <strong>2012</strong>: Appendices<br />
3. To review any new research information on fisheries impacts, including risks of impacts, <strong>and</strong><br />
the relative or absolute sensitivity or susceptibility of potentially affected species, populations,<br />
habitats, <strong>and</strong> systems.<br />
4. To estimate appropriate reference points for determining population, system, or<br />
environmental status, noting any draft or published St<strong>and</strong>ards.<br />
5. To conduct environmental assessments or evaluations for selected species, populations,<br />
habitats, or systems in order to determine their status relative to appropriate reference points<br />
<strong>and</strong> St<strong>and</strong>ards, where such exist.<br />
6. In addition to determining the status of the species, populations, habitats, <strong>and</strong> systems relative<br />
to reference points, <strong>and</strong> particularly where the status is unknown, AEWG should explore the<br />
potential for using existing data <strong>and</strong> analyses to draw conclusions about likely future trends in<br />
fishing effects or status if current fishing methods, effort, catches, <strong>and</strong> catch limits are<br />
maintained, or if fishers or fisheries managers are considering modifying them in other ways.<br />
7. Where appropriate <strong>and</strong> practical, to conduct or request projections of likely future status using<br />
alternative management actions, based on input from AEWG, fisheries plan advisers <strong>and</strong><br />
fisheries <strong>and</strong> st<strong>and</strong>ards managers, noting any draft or published St<strong>and</strong>ards.<br />
8. For species or populations deemed to be depleted or endangered, to develop ideas for<br />
alternative rebuilding scenarios to levels that are likely to ensure long-term viability based on<br />
input from AEWG, fisheries managers, noting any draft or published St<strong>and</strong>ards.<br />
9. For species, populations, habitats, or systems for which new assessments are not conducted in<br />
the current year, to review <strong>and</strong> update any existing Fisheries Assessment Plenary report text in<br />
order to determine whether the latest reported status summary is still relevant; else to revise<br />
the evaluations based on new data or analyses, or other relevant information.<br />
Working Group input to annual <strong>Aquatic</strong> <strong>Environment</strong> <strong>and</strong> <strong>Biodiversity</strong> <strong>Review</strong><br />
10. To include in contributions to the environment analogue of the Fisheries Assessment Plenary<br />
Report (the <strong>Aquatic</strong> <strong>Environment</strong> <strong>and</strong> <strong>Biodiversity</strong> <strong>Review</strong>, AEBAR) summaries of<br />
information on selected issues that may relate to species, populations, habitats, or systems that<br />
may be affected by fishing. These contributions are analogous to Working Group Reports<br />
from the Fisheries Assessment Working Groups.<br />
11. To provide information <strong>and</strong> scientific advice on management considerations (e.g. area<br />
boundaries, by-catch issues, effects of fishing on habitat, other sources of mortality, <strong>and</strong> input<br />
controls such as mesh sizes <strong>and</strong> minimum legal sizes) that may be relevant for setting<br />
sustainability measures.<br />
12. To summarise the assessment methods <strong>and</strong> results, along with estimates of relevant st<strong>and</strong>ards,<br />
references points, or other metrics that may be used as benchmarks or to identify risks to the<br />
aquatic environment.<br />
13. It is desirable that full agreement among technical experts is achieved on the text of<br />
contributions to the AEBAR. If full agreement among technical experts cannot be reached,<br />
the Chair will determine how this will be depicted in the AEBAR, will document the extent to<br />
which agreement or consensus was achieved, <strong>and</strong> record <strong>and</strong> attribute any residual<br />
disagreement in the meeting notes.<br />
299
AEBAR <strong>2012</strong>: Appendices<br />
14. To advise the Principal Advisor Fisheries Science, about issues of particular importance that<br />
may require review by a plenary meeting or summarising in the AEBAR, <strong>and</strong> issues that are<br />
not believed to warrant such review. The general criterion for determining which issues<br />
should be discussed by a wider group or summarised in the AEBAR is that new data or<br />
analyses have become available that alter the previous assessment of an issue, particularly<br />
assessments of population status or projection results. Such information could include:<br />
• New or revised estimates of environmental reference points, recent or current population<br />
status, trend, or projections<br />
• The development of a major trend in bycatch rates or amount<br />
• Any new studies or data that extend underst<strong>and</strong>ing of population, system, or<br />
environmental susceptibility to an effect or its recoverability, fishing patterns, or<br />
mitigation measures that have a substantial implications for a population, system, or<br />
environment or identify risks associated with fishing activity<br />
• Consistent performance outside accepted reference points or St<strong>and</strong>ards<br />
Membership <strong>and</strong> Protocols for all Science Working Groups (paragraph numbers<br />
consistent with those in Terms of Reference for Fisheries Assessment Working Groups)<br />
Working Group chairs<br />
17. The Ministry will select <strong>and</strong> appoint the Chairs for Working Groups. The Chair will be a MPI<br />
fisheries scientist who is an active participant in the Working Group, providing technical<br />
input, rather than simply being a facilitator. Working Group Chairs will be responsible for:<br />
* ensuring that Working Group participants are aware of the Terms of Reference for the<br />
working group, <strong>and</strong> that the Terms of Reference are adhered to by all participants.<br />
* setting the rules of engagement, facilitating constructive questioning, <strong>and</strong> focussing on<br />
relevant issues.<br />
* ensuring that all peer review processes are conducted in accordance with the Research <strong>and</strong><br />
Science Information St<strong>and</strong>ard for New Zeal<strong>and</strong> Fisheries 110 (the Research St<strong>and</strong>ard), <strong>and</strong> that<br />
research <strong>and</strong> science information is reviewed by the Working Group against the P R I O R<br />
principles for science information quality (page 6) <strong>and</strong> the criteria for peer review (pages 12-<br />
16) in the St<strong>and</strong>ard.<br />
* requesting <strong>and</strong> documenting the affiliations of participants at each Working Group meeting<br />
that have the potential to be, or to be perceived to be, a conflict of interest of relevance to the<br />
research under review (refer to page 15 of the Research St<strong>and</strong>ard). Chairs are responsible for<br />
managing conflicts of interest, <strong>and</strong> ensuring that fisheries management implications do not<br />
jeopardise the objectivity of the review or result in biased interpretation of results.<br />
* ensuring that the quality of information that is intended or likely to inform fisheries<br />
management decisions is ranked in accordance with the information ranking guidelines in the<br />
Research St<strong>and</strong>ard (page 21-23), <strong>and</strong> that resulting information quality ranks are<br />
appropriately documented in Working Group reports <strong>and</strong>, where appropriate, in Status of<br />
Stock summary tables.<br />
* striving for consensus while ensuring the transparency <strong>and</strong> integrity of research analyses,<br />
results, conclusions <strong>and</strong> final reports.<br />
* reporting on Working Group recommendations, conclusions <strong>and</strong> action items; <strong>and</strong> ensuring<br />
follow-up <strong>and</strong> communication with the MPI Principal Advisor Fisheries Science, relevant<br />
MPI fisheries management staff, <strong>and</strong> other key stakeholders.<br />
110 Link to the Research St<strong>and</strong>ard: http://www.fish.govt.nz/ennz/Publications/Research+<strong>and</strong>+Science+Information+St<strong>and</strong>ard.htm<br />
300
Working Group members<br />
AEBAR <strong>2012</strong>: Appendices<br />
18. Working Groups will consist of the following participants:<br />
* MPI fisheries science chair – required<br />
* Research providers – required (may be the primary researcher, or a designated substitute<br />
capable of presenting <strong>and</strong> discussing the agenda item)<br />
* Other scientists not conducting analytical assessments to act in a peer review capacity<br />
* Representatives of relevant MPI fisheries management teams<br />
* Any interested party who agrees to the st<strong>and</strong>ards of participation below.<br />
19. Working Group participants must commit to:<br />
* participating in the discussion<br />
* resolving issues<br />
* following up on agreements <strong>and</strong> tasks<br />
* maintaining confidentiality of Working Group discussions <strong>and</strong> deliberations (unless otherwise<br />
agreed in advance, <strong>and</strong> subject to the constraints of the Official Information Act)<br />
* adopting a constructive approach<br />
* avoiding repetition of earlier deliberations, particularly where agreement has already been<br />
reached<br />
* facilitating an atmosphere of honesty, openness <strong>and</strong> trust<br />
* respecting the role of the Chair<br />
* listening to the views of others, <strong>and</strong> treating them with respect<br />
20. Participants in Working Group meetings will be expected to declare their sector affiliations<br />
<strong>and</strong> contractual relationships to the research under review, <strong>and</strong> to declare any substantial<br />
conflicts of interest related to any particular issue or scientific conclusion.<br />
21. Working Group participants are expected to adhere to the requirements of independence,<br />
impartiality <strong>and</strong> objectivity listed under the Peer <strong>Review</strong> Criteria in the Research St<strong>and</strong>ard<br />
(pages 12-16). It is understood that Working Group participants will often be representing<br />
particular sectors <strong>and</strong> interest groups, <strong>and</strong> will be expressing the views of those groups.<br />
However, when reviewing the quality of science information, representatives are expected to<br />
step aside from their sector affiliations, <strong>and</strong> to ensure that individual <strong>and</strong> sector views do not<br />
result in bias in the science information <strong>and</strong> conclusions.<br />
Information Quality Ranking:<br />
22. Science Working Groups are required to rank the quality of research <strong>and</strong> science<br />
information that is intended or likely to inform fisheries management decisions, in<br />
accordance with the science information quality ranking guidelines in the Research<br />
St<strong>and</strong>ard (pages 21-23). This information quality ranking must be documented in<br />
Working Group reports <strong>and</strong>, where appropriate, in Status of Stock summary tables.<br />
* Working Groups are not required to rank all research projects <strong>and</strong> analyses, but key pieces of<br />
information that are expected or likely to inform fisheries management decisions should<br />
receive a quality ranking.<br />
* Explanations substantiating the quality rankings must be included in Working Group reports.<br />
In particular, the quality shortcomings <strong>and</strong> concerns for moderate/mixed <strong>and</strong> low quality<br />
information must be documented.<br />
* The Chair, working with participants, will determine which pieces of information require a<br />
quality ranking. Not all information resulting from a particular research project would be<br />
expected to achieve the same quality rank, <strong>and</strong> different quality ranks may be assigned to<br />
301
AEBAR <strong>2012</strong>: Appendices<br />
different components, conclusions or pieces of information resulting from a particular piece<br />
of research.<br />
Working Group papers:<br />
23. Working group papers will be posted on the MPI-Fisheries website prior to meetings if<br />
they are available. As a general guide, Powerpoint presentations <strong>and</strong> draft or discussion<br />
papers should be available at least 2 working days before a meeting, <strong>and</strong> near-final<br />
papers should be available at least 5 working days before a meeting if the Working<br />
Group is expected to agree to the paper. However, it is also likely that many papers will<br />
be tabled during the meeting due to time constraints. If a paper is not available for<br />
sufficient time before the meeting, the Chair may provide for additional time for written<br />
comments from Working Group members.<br />
24. Working Group papers are “works in progress” whose role is to facilitate the discussion<br />
of the Working Groups. They often contain preliminary results that are receiving peer<br />
review for the first time <strong>and</strong>, as such, may contain errors or preliminary analyses that will<br />
be superseded by more rigorous work. For these reasons, no-one may release the<br />
papers or any information contained in these papers to external parties. In general,<br />
Working Group papers should never be cited. Exceptions may be made in rare<br />
instances by obtaining permission in writing from the Principal Advisor Fisheries<br />
Science, <strong>and</strong> the authors of the paper.<br />
25. Participants who use Working Group papers inappropriately, or who do not adhere to the<br />
st<strong>and</strong>ards of participation, may be requested by the Chair to leave a particular meeting or,<br />
in more serious instances, to refrain from attending one or more future meetings.<br />
26. Meetings will take place as required, generally January-April <strong>and</strong> July-November for FAWGs<br />
<strong>and</strong> throughout the year for other working groups (AEWG, BRAG, Marine Amateur Fisheries<br />
<strong>and</strong> Antarctic Working Groups).<br />
27. A quorum will be reached when the Chair, the designated presenter, <strong>and</strong> three or more other<br />
technical experts are present. In the absence of a quorum, the Chair may decide to proceed as<br />
a sub-group, with outcomes being taken forward to the next meeting at which a quorum is<br />
formed.<br />
28. The Chair is responsible for deciding, with input from the entire Working Group, but<br />
focussing primarily on the technical discussion <strong>and</strong> the views of technical expert members:<br />
* The quality <strong>and</strong> acceptability of the information <strong>and</strong> analyses under review<br />
* The way forward to address any deficiencies<br />
* The need for any additional analyses<br />
* Contents of Working Group reports<br />
* Choice of base case models <strong>and</strong> sensitivity analyses to be presented<br />
* The status of the stocks, or the status/performance in relation to any relevant environmental<br />
st<strong>and</strong>ards or targets<br />
29. The Chair is responsible for facilitating a consultative <strong>and</strong> collaborative discussion.<br />
30. Working Group meetings will be run formally, with agendas pre-circulated, <strong>and</strong> formal<br />
records kept of recommendations, conclusions <strong>and</strong> action items.<br />
31. A record of recommendations, conclusions <strong>and</strong> action items will be posted on the MPI-<br />
Fisheries website after each meeting has taken place.<br />
302
AEBAR <strong>2012</strong>: Appendices<br />
32. Data upon which analyses presented to the Working Groups are based must be provided to<br />
MPI in the appropriate format <strong>and</strong> level of detail in a timely manner (i.e. the data must be<br />
available <strong>and</strong> accessible to MPI; however, data confidentiality concerns mean that such data<br />
are not necessarily available to Working Group members)<br />
33. The outcome of each Working Group round will be evaluated, with a view to identifying<br />
opportunities to improve the Working Group process. The Terms of Reference may be<br />
updated as part of this review.<br />
34. MPI fisheries scientists <strong>and</strong> science officers will provide administrative support to the<br />
Working Groups.<br />
Record-keeping<br />
35. The overall responsibility for record-keeping rests with the Chair of the Working Group, <strong>and</strong><br />
includes:<br />
* keeping notes on recommendations, conclusions <strong>and</strong> follow-up actions for all Working Group<br />
meetings, <strong>and</strong> to ensure that these are available to all members of the Working Group <strong>and</strong> the<br />
Principal Advisor Fisheries Science in a timely manner. If full agreement on the<br />
recommendations or conclusions cannot readily be reached amongst technical experts, then<br />
the Chair will document the extent to which agreement or consensus was achieved, <strong>and</strong> record<br />
<strong>and</strong> attribute any residual disagreement in the meeting notes.<br />
* compiling a list of generic assessment issues <strong>and</strong> specific research needs for each Fishstock or<br />
species or environmental issue under the purview of the Working Group, for use in<br />
subsequent research planning processes.<br />
12.2. AEWG Membership <strong>2012</strong><br />
Convenors: Martin Cryer (protected species) <strong>and</strong> Rich Ford (other issues)<br />
Members: Blake Abernethy, Ed Abraham, Owen Anderson, William Arlidge, Chris Baigent,<br />
Karen Baird, Suze Baird, Barry Baker, Michael Batson, Michelle Beritzhoff, Jenny<br />
Black, Tiffany Bock, Laura Boren, Yol<strong>and</strong> Bosiger, Paul Breen, Stephen Brouwer,<br />
Martin Cawthorn, Simon Childerhouse, Louise Chilvers, Tom Clarke, Malcolm<br />
Clark, Deanna Clement, George Clement, Owen Cox, Rohan Currey, Igor Debski, Ian<br />
Doonan, Alastair Dunn, Charles Edwards, Ursula Ellenburg, Jack Fenaughty, Chris<br />
Francis, Malcolm Francis, Kevin Hackwell, Judi Hewitt, Rosie Hurst, Aaron Irving,<br />
Catherine Jones, Dan Kluza, Craig Lawson, Mary Livingston, Dave Lundquist, Greg<br />
Lydon, Warrick Lyon, Pamela Mace, Darryl Mackenzie, Rob Mattlin, Tania<br />
McPherson, Sarah Meadows, David Middleton, Laura Mitchell, Sophie Mormede,<br />
Mark Morrison, Richard O’Driscoll, Tracey Osborne, Milena Palka, Johanna Pierre,<br />
Irene Pohl, Kris Ramm, Vicky Reeve, Pat Reid, Yvan Richard, Jim Roberts, Ashley<br />
Rowden, Carol Scott, Ben Sharp, Liz Slooten, Paul Starr, Kevin Stokes, Katrina<br />
Subedar, John Taunton-Clarke, Alex Thompson, David Thompson, Finlay Thompson,<br />
Geoff Tingley, Ian Tuck, Dee Wallace, Barry Weeber, Richard Wells, Francene<br />
Wineti, Ray Wood, Bob Zuur.<br />
303
AEBAR <strong>2012</strong>: Appendices<br />
12.3. Terms of Reference for the <strong>Biodiversity</strong> Research<br />
Advisory Group (BRAG) <strong>2012</strong><br />
Overall purpose<br />
Since 2000, the objectives of the <strong>Biodiversity</strong> Research Programme have been drawn directly from<br />
MFish commitments to Theme 3 of the New Zeal<strong>and</strong> <strong>Biodiversity</strong> Strategy. Within this framework,<br />
the <strong>Biodiversity</strong> Medium Term Research Plan has been adapted over time as new issues emerge, to<br />
build on synergies with other research programmes <strong>and</strong> work where biodiversity is under greatest<br />
threat from fishing or other anthropogenic activity.<br />
Within the constraints of the overall purpose of the Programme,<br />
“To improve our underst<strong>and</strong>ing of New Zeal<strong>and</strong> marine ecosystems in terms of species<br />
diversity, marine habitat diversity, <strong>and</strong> the processes that lead to healthy ecosystem<br />
functioning, <strong>and</strong> the role that biodiversity has for such key processes111;”<br />
<strong>and</strong> the NZBS definition of biodiversity (the variability among living organisms from all sources<br />
including inter alia, terrestrial, marine <strong>and</strong> other aquatic ecosystems <strong>and</strong> the ecological complexes of<br />
which they are a part; this includes diversity within species, between species <strong>and</strong> of ecosystem) the<br />
science currently commissioned broadly aims to:<br />
• Describe <strong>and</strong> characterise the distribution <strong>and</strong> abundance of fauna <strong>and</strong> flora, as expressed<br />
through measures of biodiversity, <strong>and</strong> improving underst<strong>and</strong>ing about the drivers of the<br />
spatial <strong>and</strong> temporal patterns observed;<br />
• determine the functional role of different organisms or groups of organisms in marine<br />
ecosystems, <strong>and</strong> assess the role of marine biodiversity in mitigating the impacts of<br />
anthropogenic disturbance on healthy ecosystem functioning;<br />
• identify which components of biodiversity must be protected to ensure the sustainability of a<br />
healthy marine ecosystem as well as to meet societal values on biodiversity.<br />
MPI also convenes an <strong>Aquatic</strong> <strong>Environment</strong> Working Group (AEWG) which has a similar review<br />
function to the BRAG. Projects reviewed by BRAG <strong>and</strong> AEWG have some commonalities in that<br />
they relate to aspects of the marine environment. However, the key focus of projects considered by<br />
BRAG is on marine issues related to the functionality of the marine ecosystem <strong>and</strong> its productivity,<br />
whereas projects considered by AEWG are more commonly focused on the direct effects of fishing.<br />
BRAG may identify natural resource management issues that extend beyond fisheries management<br />
<strong>and</strong> make recommendations on priority areas of research that will inform MPI or other government<br />
departments of emerging science results that require the attention of managers, policymakers <strong>and</strong><br />
decision-makers in the marine sector. BRAG does not make management recommendations or<br />
decisions (this responsibility lies with the MPI Fisheries Management Group <strong>and</strong> the Minister of<br />
Primary Industry).<br />
Preparatory tasks<br />
1. Prior to the beginning of BRAG meetings each year, MPI fisheries scientists will produce a<br />
list of issues for which new research projects are likely to required in the forthcoming<br />
financial year. The BRAG Chair will determine the final timetables <strong>and</strong> agendas.<br />
111 See MFish <strong>Biodiversity</strong> Research Programme 2010: Part 1. Context <strong>and</strong> Purpose<br />
304
AEBAR <strong>2012</strong>: Appendices<br />
2. The Ministry’s research planning processes should identify most information needs well in<br />
advance but, if urgent issues arise, MPI fisheries managers will alert the <strong>Aquatic</strong> <strong>Environment</strong><br />
<strong>and</strong> <strong>Biodiversity</strong> Science Manager <strong>and</strong> the Principal Advisor Fisheries Science at least three<br />
months prior to the required meetings where possible.<br />
BRAG Technical objectives<br />
3. To review, discuss <strong>and</strong> convey views on the results of marine biodiversity research projects<br />
contracted by Ministry for Primary Industries MPI (formerly Ministry of Fisheries).<br />
It is the responsibility of the BRAG to review, discuss, <strong>and</strong> convey views on the results of marine<br />
biodiversity research projects contracted by MPI <strong>and</strong> the former Ministry of Fisheries. The review<br />
process is an evaluation of how existing research results can be built upon to address emerging<br />
research issues <strong>and</strong> needs. It is essentially an evaluation of "what we already know" <strong>and</strong> how this can<br />
be used to obtain "what we need to know”. This information should be used by the BRAG to identify<br />
gaps in our knowledge <strong>and</strong> for developing research plans to address these gaps.<br />
4. Discuss, evaluate, make recommendations <strong>and</strong> convey views on a 3 to 5 year Medium Term<br />
Research Plan.<br />
It is the responsibility of BRAG participants to discuss, evaluate, make recommendations <strong>and</strong> convey<br />
views on a 3 to 5 year Medium Term Research Plan for its particular research area as required.<br />
Individual related projects on a species or fishery or research topic need to be integrated into Medium<br />
Term Research Plans. The Medium Term Research Plans should encompass research needs <strong>and</strong><br />
directions for at least the next 3 to 5 years.<br />
The <strong>Biodiversity</strong> Medium Term Research Plan is aligned to relevant strategic <strong>and</strong> policy directions<br />
such as the "MPI Statement of Intent" <strong>and</strong> any Strategic Research Plan (Fisheries 2030, Deepwater 10<br />
year research plan) <strong>and</strong> fisheries plans developed for the appropriate species/fishery or research area,<br />
including biodiversity.<br />
The recommendations on project proposals for the next financial year will be submitted via the Chair<br />
of BRAG to the Principal Science Advisor Fisheries (MPI).<br />
5. The <strong>Biodiversity</strong> Research Programme includes research in New Zeal<strong>and</strong>’s TS, EEZ,<br />
Extended Continental Shelf, the South Pacific Region <strong>and</strong> the Ross Sea region <strong>and</strong> has seven<br />
scientific work streams as follows:<br />
• To develop ecosystem-scale underst<strong>and</strong>ing of biodiversity in the New<br />
Zeal<strong>and</strong> marine environment<br />
• To classify <strong>and</strong> characterise the biodiversity, including the description <strong>and</strong><br />
documentation of biota, associated with nearshore <strong>and</strong> offshore marine<br />
habitats in New Zeal<strong>and</strong><br />
• To investigate the role of biodiversity in the functional ecology of nearshore<br />
<strong>and</strong> offshore marine communities.<br />
• To assess developments in all aspects of biodiversity, including genetic<br />
marine biodiversity <strong>and</strong> identify key topics for research<br />
• To determine the effects of climate change <strong>and</strong> increased ocean acidification<br />
on marine biodiversity, as well as effects of incursions of non-indigenous<br />
species, <strong>and</strong> other threats <strong>and</strong> impacts.<br />
305
AEBAR <strong>2012</strong>: Appendices<br />
• To develop appropriate diversity metrics <strong>and</strong> other indicators of biodiversity<br />
that can be used to monitor change<br />
• To identify threats <strong>and</strong> impacts to biodiversity <strong>and</strong> ecosystem functioning<br />
beyond natural environmental variation<br />
BRAG input to MPI “<strong>Aquatic</strong> <strong>Environment</strong> <strong>and</strong> <strong>Biodiversity</strong> <strong>Annual</strong> <strong>Review</strong>”<br />
6. To contribute to <strong>and</strong> summarise progress on biodiversity research in the <strong>Aquatic</strong> <strong>Environment</strong><br />
<strong>and</strong> <strong>Biodiversity</strong> <strong>Annual</strong> <strong>Review</strong>. This contribution is analogous to Working Group Reports<br />
from the Fishery Assessment Working Groups.<br />
7. To summarise the assessment methods <strong>and</strong> results, along with estimates of relevant st<strong>and</strong>ards,<br />
references points, or other metrics that may be relevant to biodiversity objectives by MPI, the<br />
<strong>Biodiversity</strong> Strategy <strong>and</strong> international obligations.<br />
8. It is desirable that full agreement among technical experts is achieved on the text of these<br />
contributions. If full agreement among technical experts cannot be reached, the Chair will<br />
determine how this will be depicted in the <strong>Aquatic</strong> <strong>Environment</strong> <strong>and</strong> <strong>Biodiversity</strong> <strong>Annual</strong><br />
<strong>Review</strong>, will document the extent to which agreement or consensus was achieved, <strong>and</strong> record<br />
<strong>and</strong> attribute any residual disagreement in the meeting notes.<br />
9. To advise the Principal Science Advisor Fisheries (MPI), about issues of particular<br />
importance that may require review by a plenary meeting or summarising in the <strong>Aquatic</strong><br />
<strong>Environment</strong> <strong>and</strong> <strong>Biodiversity</strong> <strong>Annual</strong> <strong>Review</strong>. The general criterion for determining which<br />
issues should be discussed by a wider group include:<br />
• Emerging issues, recent or current biodiversity status assessments, trends, or<br />
projections<br />
• The development of a major trend in the marine environment that will impact on<br />
marine productivity or ecosystem resilience to stressors<br />
• Any new studies or data that impact on international obligations<br />
Membership <strong>and</strong> Protocols for all Science Working Groups (NOTE: paragraph<br />
numbers consistent with those in Terms of Reference for Fisheries Assessment Working<br />
Groups)<br />
Working Group chairs<br />
17. The Ministry will select <strong>and</strong> appoint the Chairs for Working Groups. The Chair will be a MPI<br />
fisheries scientist who is an active participant in the Working Group, providing technical<br />
input, rather than simply being a facilitator. Working Group Chairs will be responsible for:<br />
* ensuring that Working Group participants are aware of the Terms of Reference for the<br />
working group, <strong>and</strong> that the Terms of Reference are adhered to by all participants.<br />
* setting the rules of engagement, facilitating constructive questioning, <strong>and</strong> focussing on<br />
relevant issues.<br />
* ensuring that all peer review processes are conducted in accordance with the Research <strong>and</strong><br />
Science Information St<strong>and</strong>ard for New Zeal<strong>and</strong> Fisheries 112 (the Research St<strong>and</strong>ard), <strong>and</strong> that<br />
112 Link to the Research St<strong>and</strong>ard: http://www.fish.govt.nz/ennz/Publications/Research+<strong>and</strong>+Science+Information+St<strong>and</strong>ard.htm<br />
306
AEBAR <strong>2012</strong>: Appendices<br />
research <strong>and</strong> science information is reviewed by the Working Group against the P R I O R<br />
principles for science information quality (page 6) <strong>and</strong> the criteria for peer review (pages 12-<br />
16) in the St<strong>and</strong>ard.<br />
* requesting <strong>and</strong> documenting the affiliations of participants at each Working Group meeting<br />
that have the potential to be, or to be perceived to be, a conflict of interest of relevance to the<br />
research under review (refer to page 15 of the Research St<strong>and</strong>ard). Chairs are responsible for<br />
managing conflicts of interest, <strong>and</strong> ensuring that fisheries management implications do not<br />
jeopardise the objectivity of the review or result in biased interpretation of results.<br />
* ensuring that the quality of information that is intended or likely to inform fisheries<br />
management decisions is ranked in accordance with the information ranking guidelines in the<br />
Research St<strong>and</strong>ard (page 21-23), <strong>and</strong> that resulting information quality ranks are<br />
appropriately documented in Working Group reports <strong>and</strong>, where appropriate, in Status of<br />
Stock summary tables.<br />
* striving for consensus while ensuring the transparency <strong>and</strong> integrity of research analyses,<br />
results, conclusions <strong>and</strong> final reports.<br />
* reporting on Working Group recommendations, conclusions <strong>and</strong> action items; <strong>and</strong> ensuring<br />
follow-up <strong>and</strong> communication with the MPI Principal Advisor Fisheries Science, relevant<br />
MPI fisheries management staff, <strong>and</strong> other key stakeholders.<br />
Working Group members<br />
18. Working Groups will consist of the following participants:<br />
* MPI fisheries science chair – required<br />
* Research providers – required (may be the primary researcher, or a designated substitute<br />
capable of presenting <strong>and</strong> discussing the agenda item)<br />
* Other scientists not conducting analytical assessments to act in a peer review capacity<br />
* Representatives of relevant MPI fisheries management teams<br />
* Any interested party who agrees to the st<strong>and</strong>ards of participation below.<br />
19. Working Group participants must commit to:<br />
* participating in the discussion<br />
* resolving issues<br />
* following up on agreements <strong>and</strong> tasks<br />
* maintaining confidentiality of Working Group discussions <strong>and</strong> deliberations (unless otherwise<br />
agreed in advance, <strong>and</strong> subject to the constraints of the Official Information Act)<br />
* adopting a constructive approach<br />
* avoiding repetition of earlier deliberations, particularly where agreement has already been<br />
reached<br />
* facilitating an atmosphere of honesty, openness <strong>and</strong> trust<br />
* respecting the role of the Chair<br />
* listening to the views of others, <strong>and</strong> treating them with respect<br />
20. Participants in Working Group meetings will be expected to declare their sector affiliations<br />
<strong>and</strong> contractual relationships to the research under review, <strong>and</strong> to declare any substantial<br />
conflicts of interest related to any particular issue or scientific conclusion.<br />
21. Working Group participants are expected to adhere to the requirements of independence,<br />
impartiality <strong>and</strong> objectivity listed under the Peer <strong>Review</strong> Criteria in the Research St<strong>and</strong>ard<br />
(pages 12-16). It is understood that Working Group participants will often be representing<br />
particular sectors <strong>and</strong> interest groups, <strong>and</strong> will be expressing the views of those groups.<br />
However, when reviewing the quality of science information, representatives are expected to<br />
307
AEBAR <strong>2012</strong>: Appendices<br />
step aside from their sector affiliations, <strong>and</strong> to ensure that individual <strong>and</strong> sector views do not<br />
result in bias in the science information <strong>and</strong> conclusions.<br />
Information Quality Ranking:<br />
22. Science Working Groups are required to rank the quality of research <strong>and</strong> science<br />
information that is intended or likely to inform fisheries management decisions, in<br />
accordance with the science information quality ranking guidelines in the Research<br />
St<strong>and</strong>ard (pages 21-23). This information quality ranking must be documented in<br />
Working Group reports <strong>and</strong>, where appropriate, in Status of Stock summary tables.<br />
* Working Groups are not required to rank all research projects <strong>and</strong> analyses, but key pieces of<br />
information that are expected or likely to inform fisheries management decisions should<br />
receive a quality ranking.<br />
* Explanations substantiating the quality rankings must be included in Working Group reports.<br />
In particular, the quality shortcomings <strong>and</strong> concerns for moderate/mixed <strong>and</strong> low quality<br />
information must be documented.<br />
* The Chair, working with participants, will determine which pieces of information require a<br />
quality ranking. Not all information resulting from a particular research project would be<br />
expected to achieve the same quality rank, <strong>and</strong> different quality ranks may be assigned to<br />
different components, conclusions or pieces of information resulting from a particular piece<br />
of research.<br />
Working Group papers:<br />
23. Working group papers will be posted on the MPI-Fisheries website prior to meetings if<br />
they are available. As a general guide, Powerpoint presentations <strong>and</strong> draft or discussion<br />
papers should be available at least 2 working days before a meeting, <strong>and</strong> near-final<br />
papers should be available at least 5 working days before a meeting if the Working<br />
Group is expected to agree to the paper. However, it is also likely that many papers will<br />
be tabled during the meeting due to time constraints. If a paper is not available for<br />
sufficient time before the meeting, the Chair may provide for additional time for written<br />
comments from Working Group members.<br />
24. Working Group papers are “works in progress” whose role is to facilitate the discussion<br />
of the Working Groups. They often contain preliminary results that are receiving peer<br />
review for the first time <strong>and</strong>, as such, may contain errors or preliminary analyses that will<br />
be superseded by more rigorous work. For these reasons, no-one may release the<br />
papers or any information contained in these papers to external parties. In general,<br />
Working Group papers should never be cited. Exceptions may be made in rare<br />
instances by obtaining permission in writing from the Principal Advisor Fisheries<br />
Science, <strong>and</strong> the authors of the paper.<br />
25. Participants who use Working Group papers inappropriately, or who do not adhere to the<br />
st<strong>and</strong>ards of participation, may be requested by the Chair to leave a particular meeting or,<br />
in more serious instances, to refrain from attending one or more future meetings.<br />
26. Meetings will take place as required, generally January-April <strong>and</strong> July-November for FAWGs<br />
<strong>and</strong> throughout the year for other working groups (AEWG, BRAG, Marine Amateur Fisheries<br />
<strong>and</strong> Antarctic Working Groups).<br />
27. A quorum will be reached when the Chair, the designated presenter, <strong>and</strong> three or more other<br />
technical experts are present. In the absence of a quorum, the Chair may decide to proceed as<br />
308
AEBAR <strong>2012</strong>: Appendices<br />
a sub-group, with outcomes being taken forward to the next meeting at which a quorum is<br />
formed.<br />
28. The Chair is responsible for deciding, with input from the entire Working Group, but<br />
focussing primarily on the technical discussion <strong>and</strong> the views of technical expert members:<br />
* The quality <strong>and</strong> acceptability of the information <strong>and</strong> analyses under review<br />
* The way forward to address any deficiencies<br />
* The need for any additional analyses<br />
* Contents of Working Group reports<br />
* Choice of base case models <strong>and</strong> sensitivity analyses to be presented<br />
* The status of the stocks, or the status/performance in relation to any relevant environmental<br />
st<strong>and</strong>ards or targets<br />
29. The Chair is responsible for facilitating a consultative <strong>and</strong> collaborative discussion.<br />
30. Working Group meetings will be run formally, with agendas pre-circulated, <strong>and</strong> formal<br />
records kept of recommendations, conclusions <strong>and</strong> action items.<br />
31. A record of recommendations, conclusions <strong>and</strong> action items will be posted on the MPI-<br />
Fisheries website after each meeting has taken place.<br />
32. Data upon which analyses presented to the Working Groups are based must be provided to<br />
MPI in the appropriate format <strong>and</strong> level of detail in a timely manner (i.e. the data must be<br />
available <strong>and</strong> accessible to MPI; however, data confidentiality concerns mean that such data<br />
are not necessarily available to Working Group members)<br />
33. The outcome of each Working Group round will be evaluated, with a view to identifying<br />
opportunities to improve the Working Group process. The Terms of Reference may be<br />
updated as part of this review.<br />
34. MPI fisheries scientists <strong>and</strong> science officers will provide administrative support to the<br />
Working Groups.<br />
Record-keeping<br />
35. The overall responsibility for record-keeping rests with the Chair of the Working Group, <strong>and</strong><br />
includes:<br />
* keeping notes on recommendations, conclusions <strong>and</strong> follow-up actions for all Working Group<br />
meetings, <strong>and</strong> to ensure that these are available to all members of the Working Group <strong>and</strong> the<br />
Principal Advisor Fisheries Science in a timely manner. If full agreement on the<br />
recommendations or conclusions cannot readily be reached amongst technical experts, then<br />
the Chair will document the extent to which agreement or consensus was achieved, <strong>and</strong> record<br />
<strong>and</strong> attribute any residual disagreement in the meeting notes.<br />
* compiling a list of generic assessment issues <strong>and</strong> specific research needs for each Fishstock or<br />
species or environmental issue under the purview of the Working Group, for use in<br />
subsequent research planning processes.<br />
309
AEBAR <strong>2012</strong>: Appendices<br />
12.4. BRAG attendance 2011-<strong>2012</strong><br />
Convenor: Mary Livingston (MPI chair),<br />
Members: Malcolm Clark, Mark Morrison, Wendy Nelson, Cliff Law, Di Tracey, Dennis<br />
Gordon, Anne-Nina Lorz, Stuart Hanchet, Richard O’Driscoll, Jonathon Gardner,<br />
Simon Thrush, David Bowden, Matt Pinkerton, Els Maas, Ashley Rowden, Carolyn<br />
Lundquist, Judi Hewitt, Drew Lohrer, Alison MacDiarmid, Julie Hall, Vonda<br />
Cummings, Kate Neill, Tracy Farr, Di Tracey, Barb Hayden (all NIWA), Richard<br />
Wells, Greg Lydon (SeaFIC), Rich Ford (MPI), Shane Lavery, Mark Costello<br />
(Auckl<strong>and</strong> University)<br />
12.5. Generic Terms of Reference for Research Advisory<br />
Groups (Sept 2010)<br />
Overall purpose<br />
1. The purpose of the Research Advisory Groups (RAGs) is to develop research proposals to<br />
meet management information needs <strong>and</strong> support st<strong>and</strong>ards development.<br />
Context<br />
2. To assist RAG members with their work this section outlines the wider process that RAGs<br />
will operate within.<br />
Fisheries Plans will guide the management of fisheries<br />
3. From 1 July 2011 the Ministry of Fisheries (MFish) will be using Fisheries Plans in the<br />
following five areas to guide the management of fisheries:<br />
• Deepwater<br />
• Highly Migratory Species<br />
• Inshore – Finfish<br />
• Inshore – Freshwater<br />
• Inshore – Shellfish<br />
4. In each of those five areas there will be:<br />
• A Fisheries Plan that sets out management objectives over a 5 year period.<br />
• An <strong>Annual</strong> Operational Plan that sets out what will be done in a financial year to help<br />
meet those objectives, including in the areas of science research, compliance <strong>and</strong> observer<br />
coverage (i.e., the <strong>Annual</strong> Operational Plan will be where priorities are set each year).<br />
Note that external stakeholders will have an opportunity to provide comment on<br />
prioritisation through draft <strong>Annual</strong> Operational Plans.<br />
• An <strong>Annual</strong> <strong>Review</strong> Report that will assess progress made against the management<br />
objectives, <strong>and</strong> help identify gaps to be considered in setting the next set of priorities.<br />
RAGs will largely be aligned to the Fisheries Plan areas<br />
5. There will be a RAG for each of the five Fisheries Plan areas above.<br />
310
AEBAR <strong>2012</strong>: Appendices<br />
6. In addition there will be a RAG for <strong>Aquatic</strong> <strong>Environment</strong> (St<strong>and</strong>ards), for research needed to<br />
support st<strong>and</strong>ards development, <strong>and</strong> another for Antarctic research. (Note that biodiversity<br />
research is dealt with through a separate process that has more of a cross-agency focus.)<br />
RAGs will develop research proposals to be considered as part of a subsequent<br />
prioritisation process<br />
7. As part of the process for developing the <strong>Annual</strong> Operational Plans, the identification <strong>and</strong><br />
prioritisation of science research will broadly occur as follows:<br />
i. MFish fisheries managers will identify the fisheries management objectives <strong>and</strong><br />
information needs that they want the relevant RAG to consider. This will be done in<br />
conjunction with MFish scientists, <strong>and</strong> will draw on the following:<br />
• The relevant <strong>Annual</strong> <strong>Review</strong> Report discussed above<br />
• Existing research plans<br />
• Science Assessment Working Groups’ feedback arising from research that has been<br />
evaluated previously<br />
• Ad-hoc issues as they arise<br />
• Initial indications of the available budget<br />
ii. The RAGs will then develop proposals for scientific research to meet those management<br />
<strong>and</strong> information needs.<br />
iii. MFish fisheries managers will then run a process for prioritising the research proposals<br />
that have been developed <strong>and</strong> updating multi-year research plans, in conjunction with<br />
MFish scientists. This will be part of the wider process for developing <strong>Annual</strong><br />
Operational Plans.<br />
8. In the <strong>Aquatic</strong> <strong>Environment</strong> (St<strong>and</strong>ards) <strong>and</strong> Antarctic areas a similar process will be<br />
followed to that above, involving relevant MFish managers.<br />
9. In practice, these processes are likely to iterate between the above steps, e.g., when<br />
prioritising research proposals fisheries managers may identify additional questions that they<br />
want a RAG to consider.<br />
10. RAGs will only be convened when necessary. If, for example, all of the research for the<br />
coming year under review has previously been approved as part of a multi-year funding<br />
package for an area, <strong>and</strong> no additional management needs have emerged, the relevant RAG<br />
will not be convened.<br />
11. During 2010-11 RAGs will be used, as required, in all areas except Inshore, given that the<br />
three Inshore Fisheries Plans are still being developed through the year. For the Inshore areas<br />
a transitional process will be used, with RAGs commencing during 2011-12.<br />
Research proposals<br />
12. RAGs will provide recommendations to fisheries managers on research to meet management<br />
needs. This section provides more detail on the research proposals that the RAGs will<br />
produce.<br />
13. The RAGs will produce an initial set of project proposals to meet the management <strong>and</strong><br />
information needs provided to the RAG, for consideration in the subsequent prioritisation<br />
process.<br />
14. The proposals may be in the form of multi-year projects where appropriate.<br />
311
AEBAR <strong>2012</strong>: Appendices<br />
15. While the prioritisation of research is outside the scope of the work of the RAGs, the<br />
proposals will include information on potential cost <strong>and</strong> feasibility to guide decisions on<br />
prioritisation. Cost estimates should be specified as ranges so as to not unduly influence<br />
subsequent research provider costings.<br />
16. Where the RAG identifies more than one desirable option for scientific research to meet<br />
management <strong>and</strong> information needs, the RAG’s proposals will cover those options, their<br />
relative pros <strong>and</strong> cons, their respective potential costs, <strong>and</strong> the RAG’s recommendation as to<br />
the preferred option.<br />
17. Once prioritisation decisions have been made on the initial set of research proposals, the RAG<br />
may be asked to produce more fully developed project proposals for inclusion in the relevant<br />
<strong>Annual</strong> Operational Plan, <strong>and</strong> for the purposes of cost recovery consultation <strong>and</strong> tendering.<br />
Membership<br />
18. Membership of RAGs is expertise-based.<br />
19. Membership will be by invitation from MFish only.<br />
20. A RAG will consist of a core group of one MFish scientist <strong>and</strong> one manager from the relevant<br />
Fisheries Plan or St<strong>and</strong>ards team, with the option to “call in” relevant technical expertise<br />
(internal <strong>and</strong>/or external) as needed.<br />
21. External participants will be paid for their time. This will include preparing for <strong>and</strong> attending<br />
RAG meetings, <strong>and</strong> any time spent writing proposals.<br />
Protocols<br />
22. All RAG members will commit to:<br />
• participating in the discussion in an objective <strong>and</strong> unbiased manner;<br />
• resolving issues;<br />
• following up on agreements <strong>and</strong> tasks;<br />
• adopting a constructive approach;<br />
• facilitating an atmosphere of honesty, openness <strong>and</strong> trust;<br />
• having respect for the role of the Chair; <strong>and</strong><br />
• listening to the views of others, <strong>and</strong> treating them with respect.<br />
23. RAG meetings will be run formally with agendas pre-circulated <strong>and</strong> formal records kept of<br />
recommendations, conclusions <strong>and</strong> action items.<br />
24. Participants who do not adhere to the st<strong>and</strong>ards of participation may be requested by the Chair<br />
to leave a particular meeting or, in more serious instances, will be excluded from the RAG.<br />
Chairpersons<br />
25. The Chair of each RAG will be a MFish scientist with appropriate expertise.<br />
26. The Chair commits to undertaking the following roles:<br />
• The Chair is an active participant in RAGs, who also provides technical input, rather than<br />
simply being a facilitator.<br />
• The Chair is responsible for: setting the rules of engagement; promoting full participation<br />
by all members; facilitating constructive questioning; focussing on relevant issues;<br />
312
AEBAR <strong>2012</strong>: Appendices<br />
reporting on RAG recommendations, conclusions <strong>and</strong> action items, <strong>and</strong> ensuring followup;<br />
<strong>and</strong> communicating with relevant MFish managers.<br />
27. The Chair is responsible for facilitating consultative <strong>and</strong> collaborative discussions.<br />
Decision-making<br />
28. The Chair is responsible for working towards an agreed view of the RAG members on their<br />
recommendations to the fisheries manager, but where that proves not to be possible then the<br />
Chair is responsible for determining the final recommendation. Minority views should be<br />
clearly represented in proposals in those cases.<br />
29. A record of recommendations, conclusions <strong>and</strong> action items will be circulated by e-mail after<br />
each meeting by the Chair.<br />
30. Each RAG round will be evaluated by MFish, with a view to identifying opportunities to<br />
improve the process. The Terms of Reference may be updated as part of this review.<br />
Non-disclosure agreements<br />
31. Participants may be asked to sign a Non-Disclosure Agreement relating to documents that<br />
disclose cost details.<br />
Conflicts of Interest<br />
32. New Zeal<strong>and</strong> is a small country <strong>and</strong> fisheries research is a relatively limited market, even<br />
internationally. People with the necessary skills <strong>and</strong> knowledge to participate in this advisory<br />
process may also have close working relationships with industry, research providers <strong>and</strong> other<br />
stakeholders. This will apply to nearly all external members of a RAG.<br />
33. Participants will be asked to declare any “actual, perceived or likely conflicts of interest”<br />
before involvement in a RAG is approved, <strong>and</strong> any new conflicts that arise during the process<br />
should be declared immediately. These will be clearly documented by the Chair.<br />
34. Management of conflicts of interest will be determined by the Chair in consultation with<br />
Fisheries Managers, <strong>and</strong> approved by the Deputy Chief Executive, Fisheries Management<br />
prior to meetings commencing.<br />
Frequency of Meetings<br />
35. Relevant MFish managers, in consultation with the Chair of the RAG, will decide on the<br />
frequency <strong>and</strong> timing of RAG meetings.<br />
Documents <strong>and</strong> record-keeping<br />
36. Unless signalled by the Chair, all RAG documents (papers, agendas, formal records of<br />
recommendations, conclusions <strong>and</strong> action items) will be available to all interested parties<br />
through the Ministry of fisheries website (www.fish.govt.nz), except where confidentiality is<br />
required for reasons of commercial sensitivity (e.g. cost estimates).<br />
37. RAG documents will be distributed securely.<br />
38. Participants who use RAG papers inappropriately may not be invited to subsequent RAG<br />
meetings.<br />
313
AEBAR <strong>2012</strong>: Appendices<br />
39. The overall responsibility for record-keeping rests with the Chair <strong>and</strong> includes:<br />
• Records of recommendations, conclusions <strong>and</strong> follow-up actions for all RAG meetings<br />
<strong>and</strong> to ensure that these are available in a timely manner.<br />
• If full agreement on the recommendations or conclusions cannot readily be reached<br />
amongst technical experts, then the Chair will document the extent to which agreement or<br />
consensus was achieved, <strong>and</strong> record <strong>and</strong> attribute any residual disagreement in the<br />
meeting notes.<br />
12.6. Fisheries 2030<br />
Use outcome – Fisheries resources are used in a manner that provides the greatest overall economic,<br />
social, <strong>and</strong> cultural benefit. This means having:<br />
• An internationally competitive <strong>and</strong> profitable seafood industry that makes a significant<br />
contribution to our economy<br />
• High-quality amateur fisheries that contribute to the social, cultural, <strong>and</strong> economic well-being<br />
of all New Zeal<strong>and</strong>ers<br />
• Thriving customary fisheries, managed in accordance with kaitiakitanga, supporting the<br />
cultural well-being of iwi <strong>and</strong> hapū<br />
• Healthy fisheries resources in their aquatic environment that reflect <strong>and</strong> provide for intrinsic<br />
<strong>and</strong> amenity value.<br />
Governance conditions – Fundamental to achieving our goal is the recognition that our approach<br />
must be based on sound governance. This means having arrangements that lead to:<br />
• The Treaty partnership being realised through the Crown <strong>and</strong> Māori clearly defining their<br />
respective rights <strong>and</strong> responsibilities in terms of governance <strong>and</strong> management of fisheries<br />
resources<br />
• The public having confidence <strong>and</strong> trust in the effectiveness <strong>and</strong> integrity of the fisheries <strong>and</strong><br />
aquaculture management regimes<br />
• All stakeholders having rights <strong>and</strong> responsibilities related to the use <strong>and</strong> management of<br />
fisheries resources that are understood <strong>and</strong> for which people can be held individually <strong>and</strong><br />
collectively accountable<br />
• Having an enabling framework that allows stakeholders to create optimal economic, social,<br />
<strong>and</strong> cultural value from their rights <strong>and</strong> interests<br />
• An accountable, responsive, dynamic, <strong>and</strong> transparent system of management.<br />
Fisheries 2030 draws on a number of values <strong>and</strong> principles. These seek to outline the behaviour <strong>and</strong><br />
approach that should be used to undertake the actions, make decisions, <strong>and</strong> achieve the goal for New<br />
Zeal<strong>and</strong> fisheries.<br />
Values<br />
• Tikanga: the Mäori way of doing things; correct procedure, custom, habit, lore, method,<br />
manner, rule, way, code, meaning, reason, plan, practice, convention. It is derived from the<br />
word tika meaning ‘right’ or ‘correct’.<br />
• Kaitiakitanga: The root word in kaitiakitanga is tiaki, which includes aspects of guardianship,<br />
care, <strong>and</strong> wise management. Kaitiakitanga is the broad notion applied in different situations.<br />
• Kotahitanga: Collective action <strong>and</strong> unity.<br />
• Manaakitanga: Manaakitanga implies a duty to care for others, in the knowledge that at some<br />
time others will care for you. This can also be translated in modern Treaty terms as “create no<br />
further grievances in the settlement of current claims”.<br />
• Integrity: Be honest <strong>and</strong> straightforward in our dealings with one another. If we agree to do<br />
something we will carry it out.<br />
314
AEBAR <strong>2012</strong>: Appendices<br />
• Respect: Treat each other with courtesy. We will respect each other’s right to have different<br />
values <strong>and</strong> hold different opinions.<br />
• Constructive relationship: Strive to build <strong>and</strong> maintain constructive ways of working with<br />
each other, which can endure.<br />
• Achieving results: Focus on producing a solution rather than just discussing the problem.<br />
Principles<br />
• Ecosystem-based approach: We apply an ecosystem-based approach to fisheries management<br />
decision-making.<br />
• Conserve biodiversity: Use should not compromise the existence of the full range of genetic<br />
diversity within <strong>and</strong> between species.<br />
• <strong>Environment</strong>al bottom lines: Biological st<strong>and</strong>ards define the limits of extraction <strong>and</strong> impact<br />
on the aquatic environment.<br />
• Precautionary approach: Particular care will be taken to ensure environmental sustainability<br />
where information is uncertain, unreliable, or inadequate.<br />
• Address externalities: Those accessing resources <strong>and</strong> space should address the impacts their<br />
activities have on the environment <strong>and</strong> other users.<br />
• Meet Settlement obligations: Act in ways that are consistent with the Treaty of Waitangi<br />
principles <strong>and</strong> deliver settlement obligations.<br />
• Responsible international citizen: Manage in the context of international rights, obligations,<br />
<strong>and</strong> our strategic interests.<br />
• Inter-generational equity: Current use is achieved in a manner that does not unduly<br />
compromise the opportunities for future generations.<br />
• Best available information: Decisions need to be based on the best available <strong>and</strong> credible<br />
biological, economic, social, <strong>and</strong> cultural information from a range of sources.<br />
• Respect rights <strong>and</strong> interests: Policies should be formulated <strong>and</strong> implemented to respect<br />
established rights <strong>and</strong> interests.<br />
• Effective management <strong>and</strong> services: Use least-cost policy tools to achieve objectives where<br />
intervention is necessary <strong>and</strong> ensure services are delivered efficiently.<br />
• Recover management costs for the reasonable expenses of efficiently provided management<br />
<strong>and</strong> services, from those who benefit from use, <strong>and</strong> those who cause the risk or adverse effect.<br />
• Dynamic efficiency: Frameworks should be established to allow resources to be allocated to<br />
those who value them most.<br />
Fisheries 2030 includes a “plan of action” for the five years from 2009, including: improving the<br />
management framework; supporting aquaculture <strong>and</strong> international objectives; ensuring sustainability<br />
of fish stocks; improving fisheries information; building sector leadership <strong>and</strong> capacity; meeting<br />
obligations to Māori; <strong>and</strong> enabling collective management responsibility. The key components<br />
guiding this document are ensuring sustainability of fish stocks <strong>and</strong> improving fisheries information:<br />
Ensuring sustainability of fish stocks<br />
• Setting <strong>and</strong> implementing fisheries harvest strategy st<strong>and</strong>ards<br />
• Setting <strong>and</strong> monitoring environmental st<strong>and</strong>ards, including for threatened <strong>and</strong> protected<br />
species <strong>and</strong> seabed impacts<br />
• Enhancing the framework for fisheries management planning, including the use of decision<br />
rules to adjust harvest levels over time<br />
Improving fisheries information<br />
• Determining best options for information collection on catch from amateur fisheries,<br />
including the implementation of charter boat reporting<br />
• Improving our knowledge of fish stocks <strong>and</strong> the environmental impacts of fishing through<br />
long-term research plans<br />
• Gaining access to increased research <strong>and</strong> development funding<br />
315
AEBAR <strong>2012</strong>: Appendices<br />
12.7. OUR STRATEGY 2030: Growing <strong>and</strong> protecting New<br />
Zeal<strong>and</strong><br />
Also available at: http://www.mpi.govt.nz/Portals/0/Documents/about-maf/strategy.pdf<br />
316
AEBAR <strong>2012</strong>: Appendices: Past projects<br />
12.8. Other strategic policy documents<br />
12.8.1. <strong>Biodiversity</strong> Strategy<br />
New Zeal<strong>and</strong>’s <strong>Biodiversity</strong> Strategy was launched in 2000 in response to the decline of New<br />
Zeal<strong>and</strong>’s indigenous biodiversity — described in the State of New Zeal<strong>and</strong>’s <strong>Environment</strong> report as<br />
our “most pervasive environmental issue”. It can be found on the government’s biodiversity website<br />
at:<br />
(http://www.biodiversity.govt.nz/picture/doing/nzbs/contents.html)<br />
The Strategy also reflects New Zeal<strong>and</strong>’s commitment, through ratification of the international<br />
Convention on Biological Diversity, to help stem the loss of biodiversity worldwide. Strategic Priority<br />
7 of the strategy was “To manage the marine environment to sustain biodiversity”. Fishing practices,<br />
the effects of activities on l<strong>and</strong>, <strong>and</strong> biosecurity threats are identified as constituting the areas of<br />
greatest risk to marine biodiversity. Pertinent objectives <strong>and</strong> summarised actions from the strategy are<br />
as follows:<br />
Objective 3.1: Improving our knowledge of coastal <strong>and</strong> marine ecosystems (Substantially increase<br />
our knowledge of coastal <strong>and</strong> marine ecosystems <strong>and</strong> the effects of human activities on them,<br />
especially assessing the importance of, <strong>and</strong> threats facing, marine biodiversity, <strong>and</strong> establishing<br />
environmental monitoring capabilities to assess the effectiveness of measures to avoid, remedy or<br />
mitigate impacts on marine biodiversity).<br />
Objective 3.4: Sustainable marine resource use practices (Protect biodiversity in coastal <strong>and</strong><br />
marine waters from the adverse effects of fishing <strong>and</strong> other coastal <strong>and</strong> marine resource uses,<br />
especially maintaining harvested species at sustainable levels, integrating marine biodiversity<br />
protection into an ecosystem approach, applying a precautionary approach, identifying marine species<br />
<strong>and</strong> habitats most sensitive to disturbance, <strong>and</strong> integrating environmental impact assessments into<br />
fisheries management decision making.)<br />
Objective 3.6: Protecting marine habitats <strong>and</strong> ecosystems (Protect a full range of natural marine<br />
habitats <strong>and</strong> ecosystems to effectively conserve marine biodiversity, using a range of appropriate<br />
mechanisms, including legal protection, especially establishing a network of areas that protect marine<br />
biodiversity.)<br />
Objective 3.7: Threatened marine <strong>and</strong> coastal species management (Protect <strong>and</strong> enhance<br />
populations of marine <strong>and</strong> coastal species threatened with extinction, <strong>and</strong> prevent additional species<br />
<strong>and</strong> ecological communities from becoming threatened.)<br />
In addition to its annual reviews (http://www.biodiversity.govt.nz/news/publications/index.html), the<br />
<strong>Biodiversity</strong> Strategy was reviewed by Green <strong>and</strong> Clarkson at the end of its 5-year term. This review<br />
was published in 2006 (http://www.biodiversity.govt.nz/pdfs/nzbs-5-year-review-synthesis-report.pdf). Most<br />
relevant to this synopsis were their findings on Objective 3.4 (Sustainable marine resource use) where<br />
they cited “Moderate progress”. “The policy move towards adopting a more ecosystem approach to<br />
fisheries management should be encouraged <strong>and</strong> strengthened. We acknowledge, however, the<br />
difficulties associated with obtaining the necessary information to make this approach effective. There<br />
are links to Objective 3.1 <strong>and</strong> the need for a more coordinated approach to identifying priority areas<br />
for marine research.”<br />
317
AEBAR <strong>2012</strong>: Appendices<br />
12.8.2. Biosecurity Strategy<br />
In its 2003 Biosecurity Strategy, The Ministry of Agriculture <strong>and</strong> Forestry’s Biosecurity NZ defined<br />
biosecurity as “the exclusion, eradication or effective management of risks posed by pests <strong>and</strong><br />
diseases to the economy, environment <strong>and</strong> human health”. New Zeal<strong>and</strong> is highly dependent on<br />
effective biosecurity measures because our indigenous flora, fauna, biodiversity, <strong>and</strong>, consequently,<br />
our primary production industries, including fisheries are uniquely at risk from invasive species.<br />
Information can be found on the Biosecurity New Zeal<strong>and</strong> website at:<br />
(http://www.biosecurity.govt.nz/biosec/sys/strategy/biostrategy/biostrategynz<br />
A complementary Biosecurity Science Strategy for New Zeal<strong>and</strong> was developed in 2007 to address<br />
the science expectations of the Biosecurity Strategy. The science strategy identified the need to:<br />
• prioritise science needs;<br />
• minimise biosecurity risks at the earliest stage possible by increasing focus on research that is<br />
strategic <strong>and</strong> proactive;<br />
• improve planning, integration <strong>and</strong> communication in the delivery of science;<br />
• ensure research outputs can be used effectively to improve biosecurity operations <strong>and</strong><br />
decision making.<br />
12.8.3. Marine Protected Areas Policy<br />
The Marine Protected Areas (MPA) Policy <strong>and</strong> Implementation Plan was released for consultation in<br />
December 2005 jointly by the Ministry of Fisheries <strong>and</strong> Department of Conservation. It confirmed<br />
Government’s commitment to ensuring that New Zeal<strong>and</strong>’s marine biodiversity was protected, <strong>and</strong><br />
established MPA Policy as a key component of that commitment. The MPA Policy objective is to<br />
protect marine biodiversity by establishing a network of Marine Protected Areas that is<br />
comprehensive <strong>and</strong> representative of New Zeal<strong>and</strong>’s marine habitats <strong>and</strong> ecosystems. The Policy<br />
involved a four-stage approach to implementation:<br />
Stage 1: Development of the approach to classification, formulation of a st<strong>and</strong>ard of protection,<br />
<strong>and</strong> mapping of existing protected areas <strong>and</strong>/or mechanisms. Scientific workshops<br />
will be used to assist with the process, <strong>and</strong> the results will be put on the website for<br />
comment<br />
Stage 2: Development of the MPA inventory, identification of gaps in the MPA network, <strong>and</strong><br />
prioritisation of new MPAs<br />
Stage 3: Establishment of new MPAs to meet gaps in the network. This will be undertaken at a<br />
regional level <strong>and</strong> a national process will be followed for offshore MPAs<br />
Stage 4: Evaluation <strong>and</strong> monitoring.<br />
Stage 1 <strong>and</strong> the inventory specified for Stage 2 are complete <strong>and</strong> regional forums were established for<br />
the Subantarctic <strong>and</strong> West Coast bioregions. In June 2009, these planning forums released<br />
consultation documents on implementation of the MPA Policy in their bioregions:<br />
Consultation Document - Implementation of the Marine Protected Areas Policy in the Territorial Seas<br />
of the Subantarctic Biogeographic Region of New Zeal<strong>and</strong>:<br />
http://www.biodiversity.govt.nz/pdfs/seas/subantarctics-mpa-policy-consultation-document.pdf<br />
Proposed Marine Protected Areas for the South Isl<strong>and</strong>’s West Coast Te Tai o Poutini: A public<br />
consultation document:<br />
http://www.westmarine.org.nz/documents/ProposedMPAsWestCoastSubmissiondocumentwebresv2.pdf<br />
The MPA Classification, Protection St<strong>and</strong>ard, Implementation Guidelines, together with a summary<br />
of subsequent consultation processes around implementing the policy can be found on the<br />
Government <strong>Biodiversity</strong> website at:<br />
http://www.biodiversity.govt.nz/seas/biodiversity/protected/mpa_consultation.html<br />
318
AEBAR <strong>2012</strong>: Appendices: Past projects<br />
12.8.4. Revised Coastal Policy Statement<br />
The revised New Zeal<strong>and</strong> Coastal Policy Statement (NZCPS) came into force in December 2010,<br />
replacing the original 1994 NZCPS. The statement is to be applied, as required by the Resource<br />
Management Act 1991 (RMA), by persons exercising functions <strong>and</strong> powers under that Act. The<br />
documentation can be read on the Department of Conservation’s website at:<br />
http://www.doc.govt.nz/publications/conservation/marine-<strong>and</strong>-coastal/new-zeal<strong>and</strong>-coastal-policystatement/new-zeal<strong>and</strong>-coastal-policy-statement-2010/<br />
The NZCPS does not directly apply to fisheries management decision-making, although the Minister<br />
of Fisheries is required to have regard to the Statement when making decisions on sustainability<br />
measures under section 11 of the Fisheries Act. In addition, this synopsis include chapters on l<strong>and</strong> use<br />
issues <strong>and</strong> habitats of particular significance for fisheries management for which the main threats are<br />
managed under the RMA (e.g., l<strong>and</strong> use practices could increase sedimentation <strong>and</strong> affect the<br />
estuarine nursery grounds of important fishstocks). In other areas, management of effects under the<br />
RMA can complement management of the effects of fishing (e.g., complementary management of the<br />
habitat <strong>and</strong> bycatch of a protected species). The following objectives <strong>and</strong> policies are considered<br />
relevant (numbering as per NZCPS, text in parentheses summarises subheadings in the Statement of<br />
most relevance to fisheries values):<br />
Objective 1: To safeguard the integrity, form, functioning <strong>and</strong> resilience of the coastal<br />
environment <strong>and</strong> sustain its ecosystems, including marine <strong>and</strong> intertidal areas, estuaries, dunes<br />
<strong>and</strong> l<strong>and</strong> (especially by maintaining or enhancing natural biological <strong>and</strong> physical processes in the<br />
coastal environment).<br />
Objective 6: To enable people <strong>and</strong> communities to provide for their social, economic, <strong>and</strong><br />
cultural wellbeing <strong>and</strong> their health <strong>and</strong> safety, through subdivision, use, <strong>and</strong> development<br />
(especially by recognising that the protection of habitats of living marine resources contributes to<br />
social, economic <strong>and</strong> cultural wellbeing <strong>and</strong> that the potential to utilise coastal marine natural<br />
resources should not be compromised by activities on l<strong>and</strong>).<br />
Policy 5: L<strong>and</strong> or waters managed or held under other Acts (especially to consider effects on<br />
coastal areas held or managed under other Acts with conservation or protection purposes <strong>and</strong> to avoid,<br />
remedy or mitigate adverse effects of activities in relation to those purposes).<br />
Policy 8: Aquaculture: Recognise the significant existing <strong>and</strong> potential contribution of<br />
aquaculture to the social, economic <strong>and</strong> cultural well-being of people <strong>and</strong> communities<br />
(especially by taking account of the social <strong>and</strong> economic benefits of aquaculture, recognising the need<br />
for high water quality, <strong>and</strong> including provision for aquaculture in the coastal environment).<br />
Policy 11: Indigenous biodiversity: To protect indigenous biological diversity in the coastal<br />
environment (especially by avoiding, remedying or mitigating adverse effects on: habitats that are<br />
important during the vulnerable life stages of indigenous species; ecosystems <strong>and</strong> habitats that are<br />
particularly vulnerable to modification; <strong>and</strong> habitats of indigenous species that are important for<br />
recreational, commercial, traditional or cultural purposes).<br />
Policy: 21 Enhancement of water quality: Where the quality of water in the coastal environment<br />
has deteriorated so that it is having a significant adverse effect on ecosystems, natural habitats,<br />
or water based recreational activities, or is restricting existing uses, such as aquaculture,<br />
shellfish gathering, <strong>and</strong> cultural activities, give priority to improving that quality.<br />
Policy 22: Sedimentation (especially with respect to impacts on the coastal environment).<br />
319
AEBAR <strong>2012</strong>: Appendices<br />
Policy 23: Discharge of contaminants (especially with respect to impacts on ecosystems <strong>and</strong><br />
habitats).<br />
12.8.5. Management of Activities in the EEZ<br />
In August 2007 the Ministry for the <strong>Environment</strong> (MfE) released a discussion paper “Improving<br />
regulation of environmental effects in New Zeal<strong>and</strong>’s Exclusive Economic Zone” seeking comment on<br />
a preferred legislative option for managing the impacts of activities in the EEZ. The discussion paper<br />
stated that environmental effects in the EEZ were, at that time, managed by sector-specific legislation,<br />
which creates the following problems:<br />
• gaps <strong>and</strong> inconsistencies in the operational control of environmental effects<br />
• unclear environmental outcomes against which activities <strong>and</strong> their effects should be assessed<br />
• uncertainty for investors about the regulatory environment<br />
• uncertainty about how the effects of activities on each other should be managed.<br />
The MfE website (http://www.mfe.govt.nz/issues/oceans/current-work/index.html) states that EEZ<br />
legislation is a priority for the current government. In response to the Gulf of Mexico oil spill, the<br />
Ministry of Economic Development is commissioning an independent study on New Zeal<strong>and</strong>'s health,<br />
safety <strong>and</strong> environmental provisions around minerals activities such as deep sea drilling. This report,<br />
along with the proposed legislation developed by the last government, will be considered by Ministers<br />
before making final policy <strong>and</strong> timeline decisions for EEZ legislation.<br />
Proposals for EEZ legislation to manage effects other than those caused by fishing do not directly<br />
apply to fisheries management decision-making under the Fisheries Act. However, there are issues<br />
around the management of cumulative effects (e.g., of more than one activity on benthic<br />
communities) <strong>and</strong> around effects of any proposed new activities in the EEZ on fishing activity already<br />
occurring. Some projects already completed or currently underway are likely to be useful for these<br />
processes (e.g., detailed maps of fishing effort produced under ENV2001/07 <strong>and</strong> BEN2006/01 <strong>and</strong><br />
enhancements of the Marine <strong>Environment</strong> Classification produced under ZBD2005-02 for demersal<br />
fishes <strong>and</strong> BEN2006/01A for benthic invertebrates).<br />
12.8.6. Ministry for Research Science <strong>and</strong> Technology<br />
Roadmaps<br />
The Ministry for Science Research <strong>and</strong> Technology (MRST, now a component of the Ministry of<br />
Business, Innovation <strong>and</strong> Employment, MBIE) stated in its 2006 overview “Science for New Zeal<strong>and</strong>”<br />
that our science system aims to set long-term direction for RS&T, but allows flexibility to alter<br />
direction as needs <strong>and</strong> opportunities change. Recent direction setting has replaced periodic national<br />
processes with a range of continuous processes, often focused on particular areas or topics including:<br />
• Government-led strategy processes around particular areas of national need or opportunity.<br />
The <strong>Biodiversity</strong> Strategy <strong>and</strong> Biosecurity Strategy are recent examples that have led to<br />
changes in institutional arrangements, policies, <strong>and</strong> funding in RS&T.<br />
• More focused processes by research organisations <strong>and</strong> or user communities around how a<br />
particular area of science could better support national needs, or may be needed to retain or<br />
build new capability. These may be endorsed by Ministers or implemented directly by<br />
research organisations.<br />
• ‘Roadmaps for Science’, led by MRST, aimed at developing <strong>and</strong> coordinating RS&T<br />
directions <strong>and</strong> bringing a stronger RS&T perspective to other Government strategies.<br />
Roadmaps describe New Zeal<strong>and</strong>’s current research activity, interpret Government’s<br />
objectives <strong>and</strong> strategies in the area, <strong>and</strong> provide guidance to public research investment<br />
agencies as well as other participants in the science system.<br />
320
AEBAR <strong>2012</strong>: Appendices: Past projects<br />
Roadmaps for Science were published by MRST for Energy Research (December 2006), Nanoscience<br />
& Nanotechnologies (February 2007), Biotechnology Research (March 2007), <strong>and</strong> <strong>Environment</strong><br />
Research (June 2007). Probably the most relevant of these is that for <strong>Environment</strong> Research which<br />
can be found at MRST’s website at:<br />
http://www.msi.govt.nz/update-me/archive/publications-archive/<br />
(if you would like to request a copy of this publication, please email info@msi.govt.nz).<br />
It is important to note that these roadmaps relate primarily to research funded by the erstwhile<br />
Foundation for Research Science <strong>and</strong> Technology (FRST, now also part of MBIE) <strong>and</strong> much less to<br />
applied, operational research purchased by the Ministry of Fisheries <strong>and</strong> some other government<br />
departments. However, the <strong>Environment</strong>al Roadmap for Science noted that environmental<br />
management decisions increasingly require an underst<strong>and</strong>ing of whole system processes <strong>and</strong> a multidimensional<br />
approach. More integrated <strong>and</strong> systems-based approaches can offer environmental<br />
managers <strong>and</strong> decision-makers answers to many of the questions they are facing. A crucial task then<br />
becomes one of creating a New Zeal<strong>and</strong> science environment within which systems-based approaches<br />
can develop <strong>and</strong> flourish, acknowledging that small-scale studies remain important to underpin these<br />
approaches. MRST identified three overarching themes that require additional focus: systems<br />
underst<strong>and</strong>ing <strong>and</strong> integration (e.g., ecosystem aspects of fisheries management); transfer <strong>and</strong> uptake<br />
(including adaptive management to advance scientific underst<strong>and</strong>ing); <strong>and</strong> information systems<br />
(including management of databases <strong>and</strong> collections.<br />
From a suite of six key research areas (global environmental change, l<strong>and</strong>, water <strong>and</strong> coasts, including<br />
the coastal marine area, urban design <strong>and</strong> hazards, biosecurity, biodiversity, <strong>and</strong> oceanic systems),<br />
MRST identified five key research directions, two of which are of most relevance to fisheries<br />
interests:<br />
Direction 4: Over the next few years, the government will give priority to developing more integrated<br />
multidisciplinary approaches, <strong>and</strong> to improving transfer, uptake <strong>and</strong> information systems in the<br />
following areas:<br />
• global environmental change – with a focus on providing the knowledge for integrated<br />
ecological, physical <strong>and</strong> socio-economic modelling of climate change impacts on water <strong>and</strong><br />
soil resources, l<strong>and</strong> use, biosecurity, biodiversity <strong>and</strong> potential global impacts;<br />
• l<strong>and</strong>, water <strong>and</strong> coasts – with a focus on sustainable l<strong>and</strong> <strong>and</strong> coastal aquatic use, including<br />
the impacts of l<strong>and</strong> use on freshwater <strong>and</strong> the impacts of freshwater, l<strong>and</strong> management <strong>and</strong><br />
aquatic production on coastal marine environments;<br />
• biosecurity – reflecting the directions set in the Biosecurity Science Research <strong>and</strong> Technology<br />
Strategy.<br />
Direction 5: Over the longer-term, the government will focus on more integrated multidisciplinary<br />
approaches, <strong>and</strong> improved transfer <strong>and</strong> uptake, <strong>and</strong> information systems in the biodiversity <strong>and</strong><br />
oceanic systems areas.<br />
MRST believes that the <strong>Environment</strong>al Science Roadmap will make a difference by:<br />
• Equipping environmental managers with integrated research results <strong>and</strong> tools which will help<br />
them avoid, remedy or mitigate future environmental problems.<br />
• Enhancing New Zeal<strong>and</strong>’s potential as a test bed <strong>and</strong> world leader for new innovations <strong>and</strong><br />
business developments in environmental technologies.<br />
• Improved predictions of <strong>and</strong> responses to natural hazards events.<br />
• Improved responses to climate change.<br />
321
AEBAR <strong>2012</strong>: Appendices<br />
12.8.7. National Plan of Action to Reduce the Incidental<br />
Catch of Seabirds in New Zeal<strong>and</strong> Fisheries<br />
The National Plan of Action (NPOA) to Reduce the Incidental Catch of Seabirds in New Zeal<strong>and</strong><br />
Fisheries came into action in April 2004. The NPOA-Seabirds provides a framework to inform the<br />
management of seabird/fisheries interactions. It also sets a number of time-bound objectives to be<br />
reached by partnering with the fishing industry to reduce the incidental catch of seabirds.<br />
The document is available online at:<br />
http://www.doc.govt.nz/documents/conservation/native-animals/birds/npoa.pdf<br />
A revised version of this document is currently under consultation, with a draft version available<br />
online through the consultations page of the Fisheries website of the Ministry for Primary Industries<br />
at:<br />
http://www.fish.govt.nz/en-nz/Consultations/default.htm?wbc_purpose=bas<br />
Note that these links are likely to change due to the current revision. The revised document will be available<br />
early in 2013.<br />
12.8.8. New Zeal<strong>and</strong> National Plan of Action for the<br />
Conservation <strong>and</strong> Management of Sharks<br />
The New Zeal<strong>and</strong> National Plan of Action (NPOA) for the Conservation <strong>and</strong> Management of Sharks<br />
was approved by the Minister of Fisheries on 13 October 2008. The purpose of the NPOA-Sharks is<br />
to ensure the conservation <strong>and</strong> management of sharks <strong>and</strong> their long-term sustainable use. It also<br />
contains a set of actions in order to meet this purpose. The document is available online at:<br />
http://www.fish.govt.nz/NR/rdonlyres/F0530841-CD61-4C3E-<br />
9E50153A281A4180/0/NPOAsharks.pdf<br />
Note that the NPOA-Sharks is currently under review with a revised edition due in 2013.<br />
322
AEBAR <strong>2012</strong>: Appendices: Past projects<br />
12.9. Appendix of <strong>Aquatic</strong> <strong>Environment</strong> <strong>and</strong> <strong>Biodiversity</strong><br />
funded <strong>and</strong> related projects<br />
The following listing of projects are those relevant to aquatic environment research that have been<br />
through research planning <strong>and</strong> subsequently been funded by the Ministry of Fisheries (MFish), the<br />
Ministry for Primary Industries (MPI) or the fishing industry. These projects have been ordered by the<br />
research themes:<br />
1. Protected species<br />
2. Non-protected bycatch<br />
3. Benthic impacts<br />
4. Ecosystem effects<br />
5. <strong>Biodiversity</strong><br />
Within these themes projects are ordered chronologically (from the most recent to the oldest). A list of<br />
references cited within the table is included at the end of this appendix.<br />
Each project or row of the table is described by a project number (used by MFish/MPI), a project title,<br />
specific objectives (where there are many objectives <strong>and</strong> some are clearly not relevant to aquatic<br />
environment research they may not be listed), project status <strong>and</strong> any relevant citations from the<br />
project.<br />
Citations listed below can be accessed differently depending upon the type of output. Finalised FARs<br />
(Fisheries Assessment Reports) <strong>and</strong> AEBRs (<strong>Aquatic</strong> <strong>Environment</strong> <strong>and</strong> <strong>Biodiversity</strong> Reports),<br />
historical FARDs (Fisheries Assessment Research Documents) <strong>and</strong> MMBRs (Marine <strong>Biodiversity</strong><br />
<strong>and</strong> Biosecurity Reports), <strong>and</strong> some FRRs (final Research Reports) can be found at:<br />
http://fs.fish.govt.nz/Page.aspx?pk=61&tk=209. Increasingly, reports will be available from the MPI<br />
website at: http://www.mpi.govt.nz/news-resources/publications. For unpublished documents or those not<br />
available on either of these websites please contact Science.Officer@mpi.govt.nz. Every attempt has<br />
been made to make this table comprehensive <strong>and</strong> correct, but if any errors are found please send<br />
suggested corrections or additions through to Science.Officer@mpi.govt.nz.<br />
323
PROTECTED SPECIES<br />
AEBAR <strong>2012</strong>: Appendices: Past projects<br />
Project<br />
Code<br />
Project Title Specific Objectives Status Citation/s<br />
PRO<strong>2012</strong>-02 Assessment of the risk to 1. To scope the risk assessment, including producing an agreed list of Approved but<br />
marine mammal<br />
marine mammal populations (in concert with MAF <strong>and</strong> DOC).<br />
not contracted<br />
populations from New 2. To review the literature, compile the required information <strong>and</strong> evaluate the<br />
Zeal<strong>and</strong> commercial appropriate level of risk assessment for the marine mammal populations<br />
fisheries<br />
identified in objective 1.<br />
3. To conduct a risk assessment for the marine mammal populations<br />
identified in objective 1 using, where possible, a risk index reflecting the ratio<br />
of fisheries-related mortality to the level of potential biological removal.<br />
4. To refine the results of the risk assessment for priority marine mammal<br />
populations by incorporating spatially <strong>and</strong> temporally-explicit abundance,<br />
distribution <strong>and</strong> capture information.<br />
PRO<strong>2012</strong>-07 Cryptic mortality of<br />
seabirds in trawl <strong>and</strong><br />
longline fisheries<br />
1. To review available information from international literature <strong>and</strong><br />
unpublished sources to characterize <strong>and</strong> inform estimation of cryptic<br />
mortality <strong>and</strong> live releases for at-risk seabirds in New Zeal<strong>and</strong> trawl <strong>and</strong><br />
longline fisheries<br />
2. To review the extent to which fisheries observer data informing current<br />
estimates of seabird captures may be used to also estimate cryptic<br />
mortalities in different fishery groups in the seabird risk assessment, <strong>and</strong><br />
identify key assumptions <strong>and</strong> associated uncertainty in the estimation of<br />
cryptic mortalities.<br />
3. To identify those species <strong>and</strong>/or fishery groups for which current<br />
uncertainty regarding cryptic mortality contributes most strongly to high risk<br />
scores for at-risk seabird species, <strong>and</strong> recommend options to improve<br />
estimation of cryptic mortality for those species / fishery group combinations.<br />
324<br />
Approved but<br />
not contracted
PROTECTED SPECIES continued<br />
AEBAR <strong>2012</strong>: Appendices: Past projects<br />
Project<br />
Code<br />
Project Title Specific Objectives Status Citation/s<br />
PRO<strong>2012</strong>-08 Improved estimation of 1. To generate seabird distribution map layers for seabird species which the Approved but<br />
spatio-temporal overlap existing level 1 risk assessment identifies as being at-risk, but for which no not contracted<br />
with fisheries for at-risk level 2 assessment has been completed. 2. To modify seabird distribution<br />
seabird species<br />
layers used in the current level 2 risk assessment, for those species that the<br />
L2 assessment identifies as at-risk <strong>and</strong> for which: i) spatial distributions used<br />
in the current L2 assessment are known to be wrong, or ii) improved spatial<br />
distribution layers are readily available (e.g. from new satellite telemetry<br />
data). 3. To seasonally disaggregate seabird spatial distribution data layers<br />
for those at-risk seabird species with a strongly seasonal abundance <strong>and</strong>/or<br />
distribution in the New Zeal<strong>and</strong> EEZ4. To utilize updated spatial/seasonal<br />
seabird distribution layers to generate improved estimates of spatio-temporal<br />
overlap with fisheries, for integration into the existing level 2 seabird risk<br />
assessment framework.<br />
PRO<strong>2012</strong>-09 Improvements to key 1. To improve estimates of the population size of specified seabirds where Approved but<br />
information gaps for this will substantially reduce uncertainty in the risk ratio estimated in the not contracted<br />
highest risk seabird Level 2 seabird risk assessment.<br />
populations TBC<br />
2. To improve estimates of the age at first breeding for specified seabird<br />
populations where this will substantially reduce uncertainty in the risk ratio<br />
estimated in the Level 2 seabird risk assessment.<br />
3. To improve estimates of the average adult survival rate for specified<br />
seabird populations where this will substantially reduce uncertainty in the risk<br />
ratio estimated in the Level 2 seabird risk assessment.<br />
PRO<strong>2012</strong>-10 Level 3 risk assessment for<br />
Antipodean albatross TBC<br />
ENV2011-01 NPOA-sharks science<br />
reivew<br />
1. Develop an Antipodean albatross population model<br />
2. Assess the effect of fisheries mortality on population viability<br />
3. As information permits, assess the effect of alternative management<br />
strategies<br />
1. To collate <strong>and</strong> summarise information in support of a review of the<br />
National Plan of Action for the Conservation <strong>and</strong> Management of Sharks<br />
(NPOA-sharks).<br />
2. To identify research gaps from objective 1 <strong>and</strong> suggest cost-effective<br />
ways these could be addressed.<br />
325<br />
Approved but<br />
not contracted<br />
Completed Francis & Lyon <strong>2012</strong>
AEBAR <strong>2012</strong>: Appendices: Past projects<br />
PROTECTED SPECIES continued<br />
Project Code Project Title Specific Objectives Status Citation/s<br />
No project<br />
number<br />
A risk assessment of<br />
threats to Maui’s dolphins<br />
SRP2011-03 Probabilistic modelling of<br />
sea lion interactions<br />
To evaluate of the risks posed to Maui’s dolphin to support the review of the<br />
TMP.<br />
1. Estimate the probability that a sea lion suffers mild head trauma following a<br />
collision with a SLED grid<br />
326<br />
Completed Currey et al. <strong>2012</strong><br />
Completed Abraham 2011<br />
SRP2011-04 HSL Modelling 1. Revise Breen-Fu-Gilbert sea lion model Completed Breen et al. 2010<br />
DEE2010-03 Development of a<br />
methodology to estimate<br />
crypticmortalities to ETP<br />
species from DW fishing<br />
activity<br />
No project<br />
number<br />
A risk assessment<br />
framework for incidental<br />
seabird mortality<br />
associated with New<br />
Zeal<strong>and</strong> fishing in the New<br />
Zeal<strong>and</strong> EEZ<br />
PRO2010-01 Estimating the nature <strong>and</strong><br />
extent of incidental<br />
captures of seabirds,<br />
marine mammals <strong>and</strong><br />
turtles in New Zeal<strong>and</strong><br />
commercial fisheries<br />
PRO2010-02 Research into key areas of<br />
uncertainty or<br />
development of mitigation<br />
techniques for the revised<br />
npoa-seabirds<br />
1. To conduct a review of existing national <strong>and</strong> international techniques to<br />
estimate cryptic mortality of endangered, threatened <strong>and</strong> protected species<br />
caused by deepwater fishing activities<br />
2. To develop one or more approaches to estimating cryptic mortality of<br />
endangered, threatened <strong>and</strong> protected species caused by deepwater fishing<br />
activities<br />
3. To field test one or more approaches to estimating cryptic mortality of<br />
endangered, threatened <strong>and</strong> protected species caused by deepwater fishing<br />
activities<br />
To describe the conceptual <strong>and</strong> methodological framework of this risk<br />
assessment approach to guide the completion of similar risk assessments<br />
elsewhere.<br />
1. To estimate the nature <strong>and</strong> extent of captures of seabirds, marine mammals<br />
<strong>and</strong> turtles, <strong>and</strong> the warp strikes of seabirds in New Zeal<strong>and</strong> fisheries for the<br />
fishing years 2009/10, 2010/11 <strong>and</strong> 2011/12.<br />
1.To provide the information necessary to underpin the revised NPOA-seabirds<br />
or develop mitigation techniques to reduce risk identified via the revised NPOAseabirds.<br />
Ongoing<br />
analysis<br />
Completed Sharp et al. 2011<br />
Ongoing<br />
analysis<br />
Ongoing<br />
analysis<br />
Thompson et al. 2011
AEBAR <strong>2012</strong>: Appendices: Past projects<br />
PROTECTED SPECIES continued<br />
Project Code Project Title Specific Objectives Status Citation/s<br />
SRP2010-03 Fur Seal interactions with<br />
a SED excluder device<br />
SRP2010-05 Fur seal interaction with<br />
an SLED excluder device<br />
IPA2009-09 Sea Lion bioenergetics<br />
modelling<br />
IPA2009-16 Preliminary impact<br />
assessment of NZ sea lion<br />
interaction with SLEDS<br />
IPA2009-<br />
19/20<br />
No project<br />
number<br />
Level 2 seabird risk<br />
assessment rerun<br />
External review of NZ sea<br />
lion bycatch necropsy data<br />
<strong>and</strong> methods<br />
PRO2009-01A Abundance & distribution<br />
of Hector's &<br />
maui'sdolphins (5 year<br />
project)<br />
1. Fur seal interactions with SED excluder device (Dr J Lyle) Completed Lyle 2011<br />
• Using a series of 10-15 impact tests at a maximum collision speed of 5 or 6 ms-<br />
1, develop a “HIC map” for the SLED grid to enable the consequences of<br />
collisions with different parts of the grid by sea lions of different head masses to<br />
be predicted (scaling values (for eq 3) will include -1/3, -2/3, <strong>and</strong> -3/4)<br />
• Using a small number of collision tests, verify that the HIC for a glancing blow<br />
can be predicted with sufficient accuracy by resolving vectors<br />
• Calculate the maximum possible sensitivity to different boundary conditions<br />
using the relative masses of the SLED grid <strong>and</strong> sea lion heads<br />
• Clarify in the final research report that undertaking tests in air (as opposed to<br />
underwater) should not affect the results<br />
1. To review <strong>and</strong> collate data on growth, metabolism, diet <strong>and</strong> reproductive<br />
parameters of NZ sea lions or, if data are inexistent, of other sea lions species<br />
2. To analyse the energy density of various NZ sea lion prey items<br />
3. To incorporate the data acquired in objectives 1. <strong>and</strong> 2. into a bioenergetics<br />
model to estimate the energy <strong>and</strong> food requirements of NZ sea lions<br />
1. Preliminary impact assessment of New Zeal<strong>and</strong> sea lion interactions with<br />
SLEDs<br />
1. To examine the risk of incidental mortality from commercial fishing for 64<br />
seabird species in New Zeal<strong>and</strong> trawl <strong>and</strong> longline fisheries<br />
The primary purposes of this review were to determine whether, in the opinion of<br />
a group of independent experts:<br />
- the interpretation of necropsy findings <strong>and</strong> trauma classification system used by<br />
Dr Wendi Roe are valid<br />
- sea lions recovered from trawl nets have sustained clinically significant trauma<br />
- some or all of the sea lions exiting through SLEDs are likely to survive<br />
1. To estimate the distribution of the South Coast South Isl<strong>and</strong> Hector’s dolphin<br />
sub-population in both winter <strong>and</strong> summer.<br />
2. The work for this sub-project was subsequently extended to include data<br />
collection necessary to estimate abundance.<br />
327<br />
Completed Ponte et al. 2011<br />
Completed Meynier 2010<br />
Completed Ponte et al. 2010<br />
Completed Richard et al. 2011<br />
Completed Roe 2010a<br />
Completed Clement & Mattlin 2010
PROTECTED SPECIES continued<br />
Project<br />
Code<br />
PRO2009-<br />
01B<br />
PRO2009-<br />
04<br />
AEBAR <strong>2012</strong>: Appendices: Past projects<br />
Project Title Specific Objectives Status Citation/s<br />
Abundance, distribution, <strong>and</strong> productivity of<br />
Hector’s (<strong>and</strong> Maui’s) dolphins<br />
Development <strong>and</strong> efficacy of seabird mitigation<br />
measures<br />
ENV2008-03 Bycatch of basking sharks in New Zeal<strong>and</strong><br />
fisheries<br />
PRO2008-<br />
01<br />
Risk assessment of protected species bycatch in<br />
NZ fisheries<br />
1. To estimate the likely precision of abundance estimates<br />
from summer aerial surveys for Hector’s dolphins along the<br />
East Coast South Isl<strong>and</strong> (ECSI; from Farewell Spit to<br />
Nugget Point) under different levels of sampling intensity<br />
<strong>and</strong> stratification.<br />
2. To estimate the likely precision of abundance estimates<br />
<strong>and</strong> the likely quality of distribution information from winter<br />
aerial surveys for Hector’s dolphins along the ECSI under<br />
different levels of sampling intensity <strong>and</strong> stratification.<br />
3. To identify <strong>and</strong> quantify trade-offs between the precision<br />
of abundance estimates <strong>and</strong> the quality of distribution<br />
information as well as between overall precision <strong>and</strong> likely<br />
cost (e.g., based on the number of flying hours required).<br />
4. To identify key areas <strong>and</strong> times for which it would be<br />
particularly useful to have information on Hector’s dolphin<br />
distribution (e.g., where risk may come from overlap with<br />
particular fisheries) <strong>and</strong> quantify trade-offs between the<br />
precision of ECSI-wide surveys <strong>and</strong> collecting such finescale<br />
information.<br />
5. Assess the extent to which two-phase or adaptive<br />
approaches would be useful to improve the surveys’ utility<br />
for assessing dolphin distribution, particularly the seaward<br />
limit.<br />
1. To test the efficacy of a variety of configurations of<br />
mitigation techniques at reducing seabird mortality (or<br />
appropriate proxies for mortality) in longline fisheries<br />
1. To review the productivity of basking sharks<br />
2. To describe the nature <strong>and</strong> extent of fishery-induced<br />
mortality of basking sharks in New Zeal<strong>and</strong> waters <strong>and</strong><br />
recommend methods of reducing the overall catch.<br />
1. To provide an assessment of the risk posed by different<br />
fisheries to the viability of New Zeal<strong>and</strong> protected species,<br />
<strong>and</strong> to assign a risk category to all New Zeal<strong>and</strong> fishing<br />
operations.<br />
328<br />
Ongoing<br />
analysis<br />
Completed No reports specified<br />
as required output<br />
Completed Francis & Smith 2010<br />
Completed Waugh et al. 2009
AEBAR <strong>2012</strong>: Appendices: Past projects<br />
PROTECTED SPECIES continued<br />
Project Code Project Title Specific Objectives Status Citation/s<br />
SAP2008-14 Sea lion population<br />
modelling, additional<br />
Deepwater<br />
Group<br />
Necropsy of marine<br />
mammals captured in New<br />
Zeal<strong>and</strong> fisheries in the<br />
2007-08 fishing year<br />
IPA2007-09 Protected species risk<br />
assessment<br />
PRO2007-01 Estimating the nature <strong>and</strong><br />
extent of incidental<br />
captures of seabirds in<br />
New Zeal<strong>and</strong> commercial<br />
fisheries<br />
PRO2007-02 Estimating the nature <strong>and</strong><br />
extent of incidental<br />
captures of seabirds in<br />
New Zeal<strong>and</strong> commercial<br />
fisheries<br />
1. To assess the likely performance of different bycatch control rules for the<br />
SQU6T fishery.<br />
2. To correct <strong>and</strong> update the Breen-Fu-Gilbert (2008) sea lion model- including<br />
assessment of the performance of 200-series <strong>and</strong> 300-series management<br />
control rules.<br />
3. To document the development of the model- including all four objectives of<br />
project IPA2006/09 <strong>and</strong> objective 1 of this project- in a single report suitable for<br />
an international review.<br />
Necropsy of marine mammals captured in New Zeal<strong>and</strong> fisheries in the 2007-08<br />
fishing year<br />
To provide an asessment of the risk posed by different fisheroes to the viability of<br />
NZ protected species- <strong>and</strong> to assign a risk category to all NZ fishing operations<br />
1. Estimate capture rates per unit effort <strong>and</strong> total captures of seabirds for the<br />
New Zeal<strong>and</strong> EEZ <strong>and</strong> in selected fisheries by method, area, target fishery, in<br />
relation to mitigation methods in use, <strong>and</strong>, where possible, by seabird species for<br />
the fishing year 2006/07, 2007/08 <strong>and</strong> 2008/09.<br />
2. Examine the incidence of seabird warp strike in trawl fisheries where these<br />
data are available from fisheries observers, <strong>and</strong> estimate the rate of incidents<br />
(birds affected per hour) <strong>and</strong> total number of seabirds affected by fishery, area<br />
<strong>and</strong> method. Examine the factors (fishery, environmental, seasonal, mitigation,<br />
area) that influence the probability of warp-strike occurring.<br />
329<br />
Completed Breen et al. 2010<br />
Completed Roe 2009a<br />
Completed Waugh et al. 2008<br />
Completed Abraham 2010; Abraham &<br />
Thompson 2009a; 2010;<br />
2011a; b; Thompson &<br />
Abraham 2009a; Abraham et<br />
al. 2010b<br />
Completed Abraham et al. 2010a;<br />
Thompson & Abraham<br />
2009a; 2009b; 2009c; 2010;<br />
2011; Thompson et al.<br />
2010a; 2010b
AEBAR <strong>2012</strong>: Appendices: Past projects<br />
PROTECTED SPECIES continued<br />
Project Code Project Title Specific Objectives Status Citation/s<br />
ENV2006-05 The use of electronic<br />
monitoring technology in<br />
New Zeal<strong>and</strong> longline<br />
fisheries<br />
IPA2006-02 The efficacy of warp strike<br />
mitigation devices: trials in<br />
the 2006 squid fishery<br />
IPA2006-09 Modelling interactions<br />
between trawl fisheries<br />
<strong>and</strong> New Zeal<strong>and</strong> Sea lion<br />
interactions<br />
1. Trial the deployment of electronic monitoring systems in selected longline<br />
fisheries, monitoring<br />
incidental take of protected species.<br />
2. Evaluate the efficacy of electronic monitoring in allowing enumeration <strong>and</strong><br />
identification of<br />
protected species captures.<br />
3. Recommend options for data management <strong>and</strong> information transfer arising<br />
from the deployment<br />
of electronic monitoring in selected fisheries.<br />
1. Groom the mitigation trial data <strong>and</strong> produce a summary of the data (100%)<br />
2. Examine strike rates <strong>and</strong> capture rates on warps <strong>and</strong> mitigation devices<br />
(100% )<br />
3. Determine the relative efficacy of mitigation devices tested in the trial (100%)<br />
4. Make recommendations regarding future trials (100%)<br />
5. Compare seabird warp strike data for 2005 <strong>and</strong> 2006 (100%)<br />
6. Work with SeaFIC <strong>and</strong> the mitigation trials TAG to produce analyses <strong>and</strong><br />
outputs (100%)<br />
1. Model the New Zeal<strong>and</strong> sea lion population <strong>and</strong> explore alternative<br />
management procedures for controlling New Zeal<strong>and</strong> sea lion bycatch in the<br />
SQU 6T fishery<br />
2. Collate <strong>and</strong> review all available sea lion biological data- fisheries data- <strong>and</strong><br />
sea lion bycatch data relevant to a population model <strong>and</strong> management strategy<br />
evaluation for the Auckl<strong>and</strong> Isl<strong>and</strong>s sea lion population<br />
3. Update <strong>and</strong> improve the existing Breen <strong>and</strong> Kim sea lion population model<br />
(2003) to incorporate all relevant data <strong>and</strong> address model uncertainties including<br />
but not necessarily limited to those identified by the AEWG<br />
4. Fit the revised model to all available data <strong>and</strong> test sensitivity including but not<br />
necessarily limited to runs identified by the AEWG<br />
5. Test a range of management procedures (rules) with the model to determine if<br />
they meet agreed management criteria<br />
330<br />
Completed McElderry et al. 2008<br />
Completed Middleton & Abraham 2007<br />
Completed Breen 2008
AEBAR <strong>2012</strong>: Appendices: Past projects<br />
PROTECTED SPECIES continued<br />
Project Code Project Title Specific Objectives Status Citation/s<br />
IPA2006-13 Identification of Marine<br />
Mammals Captured in<br />
New Zeal<strong>and</strong> Fisheries<br />
PRO2006-01 Data collection of<br />
demographic,<br />
distributional <strong>and</strong> trophic<br />
information on selected<br />
seabird species to allow<br />
estimation of effects of<br />
fishing on population<br />
viability<br />
PRO2006-02 Modelling of the effects of<br />
fishing on the population<br />
viability of selected<br />
seabirds<br />
PRO2006-04 Estimation of the nature<br />
<strong>and</strong> extent of incidental<br />
captures of seabirds in<br />
New Zeal<strong>and</strong> commercial<br />
fisheries<br />
PRO2006-05 Estimating the nature <strong>and</strong><br />
extent of marine mammal<br />
captures in New Zeal<strong>and</strong><br />
commercial fisheries<br />
1. To determine, through examination of returned marine mammal carcasses,<br />
the species, sex, reproductive status, <strong>and</strong> age-class of marine mammals<br />
returned from New Zeal<strong>and</strong> fisheries.<br />
2. To detail any injuries <strong>and</strong>, where possible, the cause of mortality of marine<br />
mammals returned from New Zeal<strong>and</strong> fisheries, <strong>and</strong> examine relationships<br />
between injuries <strong>and</strong> body condition, breeding status, <strong>and</strong> other associated<br />
demographic characteristics.<br />
1 To gather demographic, distributional <strong>and</strong> dietary information on selected<br />
seabird species to allow assessment of effects of fishing on population viability.<br />
1. Model the effects of fisheries mortalities on population viability compared with<br />
other sources of mortality or trophic effects of fishing<br />
2. Examine the overlap of fishing activity with species distribution at sea for<br />
different stages of the breeding <strong>and</strong> life-cycle <strong>and</strong> for different sexes, <strong>and</strong> assess<br />
the likely risk to species or populations from fisheries (by target species fisheries,<br />
fishing methods, area <strong>and</strong> season) in the New Zeal<strong>and</strong> EEZ<br />
1. To estimate the nature <strong>and</strong> extent of captures <strong>and</strong> warp-strikes of seabirds<br />
in New Zeal<strong>and</strong> fisheries for the fishing year 2005/06.<br />
1. To estimate <strong>and</strong> report the total numbers, releases <strong>and</strong> deaths of marine<br />
mammals where possible by species, fishery <strong>and</strong> fishing method, caught in<br />
commercial fisheries for the years 1990 to the end of the fishing year 2005/06.<br />
2. To analyse factors affecting the probability of fur seal captures for the years<br />
1990 to the end of the fishing year 2005/06.<br />
3. To classify fishing areas, seasons <strong>and</strong> fishing methods into different risk<br />
categories in relation to the probability of marine mammal incidental captures for<br />
the years from 1990 through to the end of the fishing year 2005/06.<br />
331<br />
Completed Roe 2009b<br />
Completed Sagar & Thompson 2008;<br />
Sagar et al. 2009a; b; 2010a;<br />
b; c; Baker et al. 2008; 2009;<br />
2010<br />
Completed Francis & Bell 2010; Francis<br />
<strong>2012</strong><br />
Completed Baird & Smith 2008<br />
Completed Mormede et al. 2008; Baird<br />
2008a; 2008b; Smith & Baird<br />
2009; Smith & Baird 2011;<br />
Baird 2011.
AEBAR <strong>2012</strong>: Appendices: Past projects<br />
PROTECTED SPECIES continued<br />
Project Code Project Title Specific Objectives Status Citation/s<br />
PRO2006-07 Characterise noncommercial<br />
fisheries<br />
interactions<br />
ENV2005-06 Estimation of protected<br />
species captures in<br />
longline fisheries using<br />
electronic monitoring<br />
ENV2005-01 Estimation of the nature<br />
<strong>and</strong> extent of incidental<br />
captures of seabirds in<br />
New Zeal<strong>and</strong> fisheries<br />
ENV2005-02 Estimation of the nature<br />
<strong>and</strong> extent of marine<br />
mamal captures in New<br />
Zeal<strong>and</strong> fisheries<br />
ENV2005-04 Identification of marine<br />
mammals captured in New<br />
Zeal<strong>and</strong><br />
1. To characterise non-commercial fisheries interactions with seabirds <strong>and</strong><br />
marine mammals<br />
2. Characterise non-commercial fisheries risk to seabirds <strong>and</strong> marine mammals<br />
by area <strong>and</strong> method<br />
Recommend mitigation measures appropriate for uptake in non-commercial<br />
fisheries in which seabird or marine mammal captures occur<br />
1. To provide estimates of seabird <strong>and</strong> marine mammal mortalities from longline<br />
fisheries in New Zeal<strong>and</strong> using electronic monitoring systems <strong>and</strong> to recommend<br />
deployment <strong>and</strong> data management options for ongoing use of these systems for<br />
estimation of protected species incidental take.<br />
1. To estimate the nature <strong>and</strong> extent of captures of seabirds in selected New<br />
Zeal<strong>and</strong> fisheries for the fishing year 2004/05.<br />
To examine the nature <strong>and</strong> extent of the captures of marine mammals in New<br />
Zeal<strong>and</strong> fisheries, for the whole New Zeal<strong>and</strong> EEZ, by Fishery Management<br />
Area <strong>and</strong> fishing season, <strong>and</strong> by smaller metric as appropriate for the fishing<br />
year 2004/05.<br />
2. Examine alternative methods for estimating sea lion captures <strong>and</strong> recommend<br />
one or more alternative st<strong>and</strong>ardised methods for describing <strong>and</strong> estimating sea<br />
lion captures in the SQU 6T fishery.<br />
1. To determine the species- sex- <strong>and</strong> where possible- age <strong>and</strong> reproductive<br />
status of marine mammals captured in New Zeal<strong>and</strong> fisheries.<br />
2. To necropsy marine mammals captured incidentally to New Zeal<strong>and</strong> fishing<br />
operations to determine life-history characteristics <strong>and</strong> the likely cause of<br />
mortality.<br />
3. To determine- through examination of returned marine mammal carcasses-<br />
the taxon to species-level- sex- <strong>and</strong> reproductive status- <strong>and</strong> age-class of marine<br />
mammals captured in New Zeal<strong>and</strong> fisheries.<br />
4. To detail the injuries <strong>and</strong> where possible the cause of mortality of marine<br />
mammals returned from New Zeal<strong>and</strong> fisheries- along with their body condition<br />
<strong>and</strong> breeding status- <strong>and</strong> other associated demographic characteristics.<br />
5. To detail the protocol used for the necropsy of marine mammals- to provide a<br />
st<strong>and</strong>ardised procedure for autopsy to determine species- age- sex <strong>and</strong><br />
associated demographic characteristics for fishery-killed specimens.<br />
332<br />
Completed Abraham et al. 2010a;<br />
Thompson & Abraham<br />
2009a; 2009b; 2009c; 2010;<br />
2011; Thompson et al.<br />
2010a; b; c<br />
Completed McElderry et al. 2007<br />
Completed Baird & Smith 2007a; Baird &<br />
Gibbert 2010<br />
Completed Abraham 2008; Baird 2007;<br />
Smith & Baird 2007b; Baird &<br />
Smith 2007b<br />
Completed Roe 2007
AEBAR <strong>2012</strong>: Appendices: Past projects<br />
PROTECTED SPECIES continued<br />
Project Code Project Title Specific Objectives Status Citation/s<br />
ENV2005-09 Data collection to estimate<br />
key performance<br />
indicators in the Chatham<br />
albatross, Diomedea<br />
eremita.<br />
ENV2005-13 Assessment of risk to<br />
yellow-eyed penguin<br />
Megady-ptes antipodes<br />
from fisheries incidental<br />
mortality<br />
ENV2004-04 Characterisation of<br />
seabird captures in New<br />
Zeal<strong>and</strong> fisheries<br />
ENV2004-05 Modelling of impacts of<br />
fishing-related mortality on<br />
New Zeal<strong>and</strong> seabird<br />
populations<br />
1. To gather data on key population parameters for Chatham albatross<br />
Diomedea eremita- to enable population viability to be assessed- <strong>and</strong> the<br />
responses of key parameters to fisheries mortality <strong>and</strong> fisheries management<br />
activities to mitigate fisheries related risk<br />
2. To undertake field research to collect data on population growth rates- adult<br />
survival- inter-breeding season survival- mortality due to predation at the colonyfecundity<br />
<strong>and</strong> associated parameters for Chatham Albatross- following the study<br />
design project<br />
3. To undertake field research to determine the range <strong>and</strong> extent foraging<br />
movements of Chatham albatrosses within New Zeal<strong>and</strong> fishing waters- <strong>and</strong><br />
examine the nature <strong>and</strong> extent of any association between Chatham albatrosses<br />
<strong>and</strong> fishing activities.<br />
1. To review existing data on yellow-eyed penguin M. antipodes population<br />
performance <strong>and</strong> fisheries information <strong>and</strong> provide an analysis of the potential<br />
effect of fishing mortality <strong>and</strong> other factors on population viability.<br />
2. To recommend data collection requirements <strong>and</strong> protocols for the assessment<br />
of the effects of fishing on yellow-eyed penguins.<br />
333<br />
Completed No reports specified as<br />
required output<br />
Completed Maunder 2007<br />
1. Characterisation of seabird captures in New Zeal<strong>and</strong> fisheries. Completed Mackenzie & Fletcher 2006<br />
1. To examine <strong>and</strong> identify modelling approaches to analyse seabird<br />
demographic impacts that may be occurring as a result of fisheries mortality.<br />
2. To compile databases of available demographic <strong>and</strong> distributional data on<br />
selected seabirds affected by fisheries mortality <strong>and</strong> New Zeal<strong>and</strong> fisheries <strong>and</strong><br />
estimate key population parameters <strong>and</strong> seasonal distribution for each species.<br />
3. To estimate rates of removals related to fishing activities in New Zeal<strong>and</strong> for<br />
selected seabird species, where possible by age class <strong>and</strong> sex.<br />
4. To describe the spatial overlap of seabird distributions at sea, with fisheries<br />
where the risk of incidental mortality has been demonstrated to be moderate to<br />
high.<br />
5. To examine the potential for factors other than fisheries removals within the<br />
New Zeal<strong>and</strong><br />
zone to influence the population dynamics of the selected study species.<br />
6. To characterise selected seabird populations’ abilities to sustain removals<br />
related to fishing operations within the New Zeal<strong>and</strong> EEZ, <strong>and</strong> to recommend,<br />
where possible environmental st<strong>and</strong>ards for assessing the sustainability of<br />
selected fishing operations in relation to impacts on seabird populations.<br />
Completed Fletcher et al. 2008
AEBAR <strong>2012</strong>: Appendices: Past projects<br />
PROTECTED SPECIES continued<br />
Project Code Project Title Specific Objectives Status Citation/s<br />
ENV2004-02 Estimation of New<br />
Zeal<strong>and</strong> sea lion incidental<br />
captures in New Zeal<strong>and</strong><br />
Fisheries<br />
1. To estimate the level of New Zeal<strong>and</strong> sea lion (Phocartos hookeri) incidental<br />
capture in New Zeal<strong>and</strong> fisheries<br />
334<br />
Completed Smith & Baird 2007a<br />
ENV2004-06 Maui's dolphin study 1. To quantify <strong>and</strong> compare summer <strong>and</strong> winter distribution of maui's dolphin Completed Slooten et al. 2005<br />
IPA2004-14 Seabird warp strike in the<br />
southern squid trawl<br />
fishery<br />
ENV2003-05 <strong>Review</strong> of the Current<br />
Threat Status of<br />
Associatedor Dependent<br />
Species<br />
No project<br />
number<br />
QMA SQU6T New<br />
Zeal<strong>and</strong> sea lion incidental<br />
catch <strong>and</strong> necropsy data<br />
for the fishing years 2000-<br />
01, 2001-02 <strong>and</strong> 2002-03<br />
MOF2002-03L Exploring alternative<br />
management procedures<br />
for controlling bycatch of<br />
Hooker’s sea lions in the<br />
SQU 6T squid fishery<br />
ENV2001-01 Estimation of seabird<br />
incidental captures in New<br />
Zeal<strong>and</strong> fisheries<br />
ENV2001-02 Incidental capture of<br />
Phocarctos hookeri (New<br />
Zeal<strong>and</strong> sea lions) in<br />
New Zeal<strong>and</strong> commercial<br />
fisheries, 2001-02.<br />
ENV2001-03 Estimation of<br />
Arctocephalus forsteri<br />
(New Zeal<strong>and</strong> fur seal)<br />
incidental captures in New<br />
Zeal<strong>and</strong> fisheries<br />
1. To document seabird warp strike in the southern squid trawl fishery, 2004-05 Completed Abraham & Kennedy 2008<br />
1. To assess the current threat status of selected associated or dependent<br />
species.<br />
Completed Baird et al. 2010<br />
Objectives unknown Completed Mattlin 2004<br />
Objectives unknown Completed Breen & Kim 2006<br />
1. To estimate the level of seabird incidental capture in New Zeal<strong>and</strong> fisheries.<br />
2. To recommend appropriate levels of observer coverage for estimation of<br />
seabird incidental capture in New Zeal<strong>and</strong> fisheries.<br />
1. To estimate <strong>and</strong> report the total numbers of captures, releases, <strong>and</strong> deaths of<br />
Phocarctos hookeri caught in fishing operations, including separate estimates for<br />
SQU 6T <strong>and</strong> other areas, as appropriate, during the 2001102 fishing year,<br />
including confidence limits <strong>and</strong> an investigation of any statistical bias in the<br />
estimate.<br />
1. To estimate the level of Arctocephalus forsteri incidental capture in New<br />
Zeal<strong>and</strong> fisheries.<br />
2. To recommend appropriate levels of observer coverage for estimation of<br />
Arctocephalus forsteri incidental capture in New Zeal<strong>and</strong> fisheries.<br />
Completed Baird 2004a; b; c; Smith &<br />
Baird 2008b<br />
Completed Baird 2005a; b; c; Baird &<br />
Doonan 2005<br />
Completed Smith & Baird 2008a; Baird<br />
2005d; e; f
AEBAR <strong>2012</strong>: Appendices: Past projects<br />
PROTECTED SPECIES continued<br />
Project Code Project Title Specific Objectives Status Citation/s<br />
ENV2000-01 Protected species bycatch 1. To estimate the total numbers of captures, releases, <strong>and</strong> deaths of seabirds<br />
<strong>and</strong> marine mammals - by species -caught in fishing operations during the 1999-<br />
2000 fishing year.<br />
ENV2000-02 Estimation of incidental<br />
mortality of New Zeal<strong>and</strong><br />
sea lions in New Zeal<strong>and</strong><br />
fisheries<br />
ENV99-01 Incidental capture of<br />
seabirds, marine<br />
mammals <strong>and</strong> sealions in<br />
commercial fisheries in<br />
New Zeal<strong>and</strong> waters<br />
ENV98-01 Estimation of nonfish<br />
bycatch in commercial<br />
fisheries in New Zeal<strong>and</strong><br />
waters, 1997–98<br />
No project<br />
number<br />
<strong>Annual</strong> review of bycatch<br />
in southern bluefin <strong>and</strong><br />
related tuna longline<br />
fisheries in the New<br />
Zeal<strong>and</strong> 200 n. mile<br />
Exclusive Economic Zone<br />
SANF01 Report on the incidental<br />
capture of nonfish species<br />
during fishing operations<br />
in New Zeal<strong>and</strong> waters<br />
No project<br />
number<br />
No project<br />
number<br />
No project<br />
number<br />
Nonfish Species <strong>and</strong><br />
Fisheries Interactions<br />
Nonfish Species <strong>and</strong><br />
Fisheries Interactions<br />
Incidental catch of<br />
Hooker's sea lion in the<br />
southern trawl fishery for<br />
squid, summer 1994<br />
1. To examine the factors that may influence the level of incidental mortality of<br />
New Zeal<strong>and</strong> sea lion in New Zeal<strong>and</strong> fisheries<br />
2. To recommend appropriate levels of observer coverage for estimation of<br />
incidental mortality of New Zeal<strong>and</strong> sea lion in New Zeal<strong>and</strong> sea lion fisheries<br />
335<br />
Completed Baird 2003<br />
Completed Doonan 2001; Bradford<br />
2002; Smith & Baird 2005a; b<br />
Objectives unknown Completed Baird 2001; Doonan 2000<br />
Objectives unknown Completed Baird 1999b; Baird &<br />
Bradford 1999<br />
Objectives unknown Completed Baird et al. 1998<br />
Objectives unknown Completed Baird 1997<br />
Objectives unknown Completed Baird 1996<br />
Objectives unknown Completed Baird 1995<br />
Objectives unknown Completed Doonan 1995
AEBAR <strong>2012</strong>: Appendices: Past projects<br />
PROTECTED SPECIES continued<br />
Project Code Project Title Specific Objectives Status Citation/s<br />
No project<br />
number<br />
No project<br />
number<br />
No project<br />
number<br />
Analyses of factors which<br />
influence seabird bycatch<br />
in the Japanese southern<br />
bluefin tuna longline<br />
fishery in New Zeal<strong>and</strong><br />
waters, 1989-93<br />
Nonfish Species <strong>and</strong><br />
Fisheries Interactions<br />
Incidental catch of fur<br />
seals in the west coast<br />
South Isl<strong>and</strong> hoki trawl<br />
fishery, 1989-92<br />
1. to assess the inhence that 15 monitored environmental <strong>and</strong> fishery related<br />
factors had on seabird bycatch rates, <strong>and</strong> to gauge the effectiveness of various<br />
mitigation measures<br />
336<br />
Completed Duckworth 1995<br />
Objectives unknown Completed Baird 1994<br />
Objectives unknown Completed Mattlin 1993
AEBAR <strong>2012</strong>: Appendices: Past projects<br />
NON-PROTECTED BYCATCH<br />
Project Code Project Title Specific Objectives Status Citation/s<br />
No project<br />
number<br />
Incidental catch of non-fish<br />
species by setnets in New<br />
Zeal<strong>and</strong> waters<br />
DAE2010-02 Bycatch monitoring &<br />
quantication for scampi<br />
bottom trawl<br />
ENV2009-02 Bycatch <strong>and</strong> discards in<br />
oreo <strong>and</strong> orange roughy<br />
trawl fisheries<br />
IDG2009-01 Finfish field identification<br />
guide<br />
ENV2008-01 Fish <strong>and</strong> invertebrate<br />
bycatch <strong>and</strong> discards in<br />
southern blue whiting<br />
fisheries<br />
ENV2008-02 Estimation of non-target<br />
fish catch <strong>and</strong> both target<br />
<strong>and</strong> non-target fish<br />
discards in hoki, hake <strong>and</strong><br />
ling trawl fisheries<br />
ENV2008-04 Productivity of deepwater<br />
sharks<br />
Objectives unknown Completed Taylor 1992<br />
1. To estimate the quantity of non-target fish species caught, <strong>and</strong> the target <strong>and</strong><br />
non-target fish species discarded in the specified fishery, for the fishing years<br />
since the last review, using data from Ministry of Fisheries Observers <strong>and</strong><br />
commercial fishing returns.<br />
2. To compare estimated rates <strong>and</strong> amounts of bycatch <strong>and</strong> discards from this<br />
study with previous projects on bycatch in the specified fishery.<br />
3. To compare any trends apparent in bycatch rates in the specifiedfishery with<br />
relevant fishery independent trawl surveys.<br />
4. To provide annual estimates of bycatch for nine Tier 1 species fisheries <strong>and</strong><br />
incorporate into the <strong>Aquatic</strong> <strong>Environment</strong> <strong>and</strong> <strong>Biodiversity</strong> Report specified in<br />
Objective 3 for SQU, SCI, HAK, HOK, JMA, ORH, OEO, LIN, SBW<br />
1. To estimate the quantity of non-target fish species caught, <strong>and</strong> the target <strong>and</strong><br />
non-target fish species discarded, in the trawl fisheries for oreos for the fishing<br />
years 2002/03 to 2008/09 using data from Scientific Observers <strong>and</strong> commercial<br />
fishing returns.<br />
2. To estimate the quantity of non-target fish species caught, <strong>and</strong> the target <strong>and</strong><br />
non-target fish species discarded, in the trawl fisheries for orange roughy for the<br />
fishing years 2004/05 to 2008/09 using data from Scientific Observers <strong>and</strong><br />
commercial fishing returns.<br />
1. To complement the field identification guide under IDG2006/01 with the<br />
remaining 120 fish species caught by commercial fishers in New Zeal<strong>and</strong> waters<br />
1. To estimate the quantity of non-target fish species caught, <strong>and</strong> the target <strong>and</strong><br />
non-target fish species discarded, in the trawl fisheries for southern blue whiting<br />
for the fishing years 2002/03 to 2006/07 using data from Scientific Observers<br />
<strong>and</strong> commercial fishing returns.<br />
Estimates of the catch of non-target fish species, <strong>and</strong> the discards of target <strong>and</strong><br />
non-target fish species in the hoki (Macruronus novaezel<strong>and</strong>iae), hake<br />
(Merluccius australis), <strong>and</strong> ling (Genypterus<br />
blacodes) trawl fisheries for the fishing years 2003–04 to 2006–07 using data<br />
from Scientific Observers <strong>and</strong> commercial fishing returns<br />
1. To determine the growth rate, age at maturity, longevity <strong>and</strong> natural mortality<br />
rate of shovelnose dogfish (Deania calcea) <strong>and</strong> leafscale gulper shark<br />
(Centrophorus squamosus).<br />
337<br />
Completed Anderson <strong>2012</strong><br />
Completed Anderson 2011<br />
Completed McMillan 2011 a;b;c<br />
Completed Anderson 2009b<br />
Completed Ballara et al. 2010<br />
In the process<br />
of publication<br />
Parker & Francis <strong>2012</strong>
AEBAR <strong>2012</strong>: Appendices: Past projects<br />
NON-PROTECTED BYCATCH continued<br />
Project Code Project Title Specific Objectives Status Citation/s<br />
ENV2007-03 Productivity <strong>and</strong> Trends in<br />
Rattail Bycatch Species<br />
DEE2006-03 Monitoring the abundance<br />
of deepwater sharks<br />
ENV2006-01 Bycatch <strong>and</strong> discards in<br />
ling longline fisheries<br />
IDG2006-01 Finfish field indentification<br />
guide<br />
TUN2006-02 Estimation of non-target<br />
fish catches in the tuna<br />
longline fishery<br />
TUN2004-01 Estimation of non-target<br />
fish catches in the tuna<br />
ENV2005-17 Estimation of non-target<br />
fish catch <strong>and</strong> both target<br />
<strong>and</strong> non-target fish<br />
discards in jack mackerel<br />
trawl fisheries<br />
1. To estimate growth, longevity, rate of natural mortality, <strong>and</strong> length at maturity<br />
of four key rattail bycatch species in New Zeal<strong>and</strong> trawl fisheries.<br />
2. To examine data from trawl surveys <strong>and</strong> other data sources for trends in catch<br />
rates or indices of relative abundance for species in Objective 1.<br />
1. To monitor the abundance of deepwater sharks taken by commercial trawl<br />
fisheries<br />
To estimate the quantity of non-target fish species caught, <strong>and</strong> the target <strong>and</strong><br />
non-target fish species discarded, in the longline fisheries for ling for the fishing<br />
years 1998/99 to 2005/06 using data from MFish Observers <strong>and</strong> commercial<br />
fishing returns.<br />
1. To produce a field guide for fish species in New Zeal<strong>and</strong><br />
2. To produce a field identification guide for all QMS <strong>and</strong> other fish species<br />
commonly caught in commercial <strong>and</strong> non-commercial fisheries<br />
1. To estimate the catches, catch rates, <strong>and</strong> discards of non-target fish in tuna<br />
longline fisheries data from the Observer Programme <strong>and</strong> commercial fishing<br />
returns for the 2005/06 fishing year.<br />
2. To describe bycatch trends in tuna longline fisheries using data from this<br />
project <strong>and</strong> the results of previous similar projects.<br />
To estimate the catch rates of non-target fish in the 10ngline fisheries for tuna<br />
using data from the Observer Programme <strong>and</strong> commercial fishing returns for the<br />
2002/03, 2003/04 <strong>and</strong> 2004/05 fishing years.<br />
2. To estimate the quantities of non-target fish caught in the longline fisheries for<br />
tuna using data from the Observer Programme <strong>and</strong> commercial fishing returns<br />
for the 2002/03, 2003/04 <strong>and</strong> 2004/05 fishing years.<br />
3. To estimate the discards of non-target fish caught in the longline fisheries for<br />
tuna using data from the Observer Programme <strong>and</strong> commercial fishing returns<br />
for the 2002/03, 2003/04 <strong>and</strong> 2004/05 fishing years.<br />
4. To describe trends in the non-target fish catches in the tuna longline fisheries<br />
using data from this project <strong>and</strong> the results of previous similar projects.<br />
1. To estimate the quantity of non-target fish species caught, <strong>and</strong> the target <strong>and</strong><br />
non-target fish species discarded, in the trawl fisheries for jack mackerel for the<br />
fishing years 20011/2002 to 2004/05 using data from Mfish observers <strong>and</strong><br />
commercial fishing returns.<br />
338<br />
Completed Stevens et al. 2010<br />
Completed Blackwell 2010<br />
Completed Anderson 2008<br />
Completed McMillan 2011 a;b;c<br />
Completed Griggs et al. 2008<br />
Completed Griggs et al. 2007<br />
Completed Anderson 2007a
AEBAR <strong>2012</strong>: Appendices: Past projects<br />
NON-PROTECTED BYCATCH continued<br />
Project Code Project Title Specific Objectives Status Citation/s<br />
ENV2005-18 Estimation of non-target<br />
fish catch <strong>and</strong> both target<br />
<strong>and</strong> non-target fish<br />
discards in orange roughy<br />
trawl fisheries<br />
ENV2003-01 Estimation of non-target<br />
catches in the hoki fishery<br />
ENV2002-01 Estimation of non-target<br />
fish catch <strong>and</strong> both target<br />
<strong>and</strong> non-target fish<br />
discards for the tuna<br />
longline fishery<br />
ENV2001-04 Non-target fish catch <strong>and</strong><br />
discards in selected New<br />
Zeal<strong>and</strong> fisheries<br />
ENV2001-05 To assess the productivity<br />
<strong>and</strong> relative abundance of<br />
deepwater sharks<br />
ENV2001-07 Reducing bycatch in<br />
scampi trawl fisheries<br />
1. To estimate the quantity of non-target fish species caught, <strong>and</strong> the target <strong>and</strong><br />
non-target fish species discarded, in the trawl fisheries for orange roughy for the<br />
fishing years 1999/2000 to 2003/04 using data from Scientific Observers <strong>and</strong><br />
commercial fishing returns.<br />
1. To estimate the catch rates, quantity <strong>and</strong> discards of non-target fish catches<br />
<strong>and</strong> the discards of target fish catches in trawl fisheries for hoki, using data from<br />
the Observer Programme <strong>and</strong> commercial fishing returns for the 1999/00 to<br />
2002/03 fishing years.<br />
2. To compare <strong>and</strong> contrast the estimates from the four years of data in Specific<br />
Objective 1 above with the 1990/91 through 1998/99 series previously reported.<br />
1.To estimate the catch rates, quantity <strong>and</strong> discards of non-target fish,<br />
particularly oceanic shark species, broadbill swordfish <strong>and</strong> marlin species,<br />
caught in the longline fisheries for tuna, using data from Scientific Observers <strong>and</strong><br />
commercial fishing returns for the 2000/01 <strong>and</strong> 2001/02 fishing years.<br />
To generate estimates of the catch of non-target fish species, <strong>and</strong> the discards<br />
of target <strong>and</strong> non-target fish species in three important New Zeal<strong>and</strong> trawl<br />
fisheries: arrow squid (Nototodarus sloani & N. gouldi), jack mackerel (Trachurus<br />
declivis, T. novaezel<strong>and</strong>iae, & T. symmetricus murphyi) <strong>and</strong> scampi<br />
(Metanephrops challengeri)<br />
1. To review the relative abundance, distribution <strong>and</strong> catch composition of the<br />
most commonly caught deepwater shark species: shovelnose dogfish (Deania<br />
catcea), Baxter's dogfish (Etmopterus baxten), Owston's dogfish<br />
(Cenhoscymnus owstoni), longnosed velvet dogfish (Centroscymnus crepidater),<br />
leafscale gulper shark (Cenhophom quamosus), <strong>and</strong> the seal shark (Dalatias<br />
ticha).<br />
1. Collate <strong>and</strong> review the international literature on methods of reducing bycatch<br />
in crustacean trawl fisheries.<br />
2. <strong>Review</strong> <strong>and</strong> analyse the data from New Zeal<strong>and</strong> studies.<br />
3. Develop recommendations on future approaches to reducing bycatch in the<br />
New Zeal<strong>and</strong> scampi fishery, including some general thoughts on the<br />
experimental design of field trials.<br />
339<br />
Completed Anderson 2009a<br />
Completed Anderson & Smith 2005<br />
Completed Ayers et al. 2004<br />
Completed Anderson 2004<br />
Completed Balckwell & Stevenson 2003<br />
Completed Hartill et al. 2006
AEBAR <strong>2012</strong>: Appendices: Past projects<br />
NON-PROTECTED BYCATCH continued<br />
Project Code Project Title Specific Objectives Status Citation/s<br />
PAT2000-01 <strong>Review</strong> of rattail <strong>and</strong> skate<br />
bycatch, <strong>and</strong> analysis of<br />
rattail st<strong>and</strong>ardised CPUE<br />
from the Ross Sea<br />
toothfish fishery in<br />
Subarea 88.1, from 1997-<br />
1998 to 2001-02<br />
ENV99-02 Estimation of non-target<br />
fish catch <strong>and</strong> both target<br />
<strong>and</strong> non-target fish<br />
discards in selected New<br />
Zeal<strong>and</strong> fisheries<br />
ENV98-02 Pelagic shark bycatch in<br />
the New Zeal<strong>and</strong> tuna<br />
longline fishery<br />
No project<br />
number<br />
Fish bycatch in New<br />
Zeal<strong>and</strong> tuna longline<br />
fisheries<br />
ENV97-01 Estimation of nonfish<br />
bycatch in New Zeal<strong>and</strong><br />
fisheries<br />
Objectives unknown Completed Feanaughty et al. 2003;<br />
Marriot et al. 2003<br />
1. To estimate the quantity of non-target fish species caught in the trawl fisheries<br />
for hoki <strong>and</strong> orange roughy for the fishing years 1990-91 to 1998-99 using data<br />
from Scientific Observers, commercial fishing returns <strong>and</strong> from research trawl<br />
surveys.<br />
2. To estimate the quantity of target <strong>and</strong> non-target fish species discarded in the<br />
trawl fisheries for hoki <strong>and</strong> orange roughy for the fishing years 1990-91 to 1998-<br />
99 using data from Scientific Observers, commercial fishing returns <strong>and</strong> from<br />
research trawl surveys.<br />
3. To explore the effects of various factors on the total catch of non-target fish<br />
species <strong>and</strong> the discards of target <strong>and</strong> non-target fish species in the trawl<br />
fisheries for hoki <strong>and</strong> orange roughy for the fishing years 1990-91 to 1998-99.<br />
4. To recommend appropriate levels of observer coverage for estimation of nontarget<br />
fish catch <strong>and</strong> discards of target <strong>and</strong> non-target fish species in the hoki<br />
<strong>and</strong> orange roughy fisheries.<br />
Completed Anderson et al. 2001<br />
To determine pelagic shark bycatch in the New Zeal<strong>and</strong> tuna longline fishery Completed Francis et al. 2001<br />
Objectives unknown Completed Francis et al. 1999; 2000<br />
1. Unknown<br />
2. To provide weekly within season estimates of total captures, releases, <strong>and</strong><br />
deaths by sex <strong>and</strong> area for New Zeal<strong>and</strong> sea lions taken in the southern squid<br />
trawl fishery beginning two (2) weeks after the start of the fishery until 15 May<br />
1998. Estimates of the confidence intervals <strong>and</strong> coefficient of variation of the<br />
point estimates must also be provided.<br />
3. Unknown<br />
340<br />
Completed Doonan 1998; Baird 1999a;<br />
Baird et al. 1999
AEBAR <strong>2012</strong>: Appendices: Past projects<br />
NON-PROTECTED BYCATCH continued<br />
Project Code Project Title Specific Objectives Status Citation/s<br />
SCI97-01 Scampi stock assessment<br />
for 1998 <strong>and</strong> an analysis<br />
of the fish <strong>and</strong> invertebrate<br />
bycatch of<br />
scampi trawlers<br />
1. To summarise catch, effort, observer, <strong>and</strong> research information for scampi<br />
fisheries in QMAs 1,2,3,4 (east <strong>and</strong> western portions), <strong>and</strong> 6A in 1998<br />
341<br />
Completed Cryer et al. 1999
AEBAR <strong>2012</strong>: Appendices: Past projects<br />
BENTHIC IMPACTS<br />
Project Code Project Title Specific Objectives Status Citation/s<br />
BEN<strong>2012</strong>-02<br />
Spatial overlap of mobile<br />
bottom fishing methods<br />
<strong>and</strong> coastal benthic<br />
habitats<br />
DAE2010-04 Monitoring the trawl<br />
footprint for deepwater<br />
fisheries<br />
DEE2010-06 Design a camera / transect<br />
study<br />
BEN2009-02 Monitoring recovery of<br />
benthic communities in<br />
Spirits Bay<br />
Internally<br />
funded 1<br />
Internally<br />
funded 2<br />
Internally<br />
funded 3<br />
Internally<br />
funded 4<br />
1. To use existing information <strong>and</strong> classifications to describe the distribution of<br />
benthic habitats throughout New Zeal<strong>and</strong>’s coastal zone (0–200 m depth).<br />
2. To rank the vulnerability to fishing disturbance of habitat classes from<br />
Objective 1.<br />
3. To describe the spatial pattern of fishing using bottom trawls, Danish seine<br />
nets, <strong>and</strong> shellfish dredges <strong>and</strong> assess overlap with each of the habitat classes<br />
developed in Objective 1.<br />
1. To estimate the 2009/10 trawl footprint <strong>and</strong> map the spatial <strong>and</strong> temporal<br />
distribution of bottom contact trawling throughout the EEZ between 1989/90 <strong>and</strong><br />
2009/10.<br />
2. To produce summary statistics, for major deepwater fisheries <strong>and</strong> the<br />
aggregate of all deepwater fisheries, of the spatial extent <strong>and</strong> frequency of<br />
fishing by year, by depth zone, by fishable area, <strong>and</strong> by habitat class, <strong>and</strong> to<br />
identify any trends or changes.<br />
1. To design <strong>and</strong> provide indicative costs for a programme to monitor trends in<br />
deepwater benthic habitats <strong>and</strong> communities.<br />
2. To explore the feasibility of using existing trawl <strong>and</strong> acoustic surveys to<br />
capture data relevant to monitoring trends in deepwater benthic habitats <strong>and</strong><br />
communities.<br />
1. To survey Spirits Bay <strong>and</strong> Tom Bowling Bay benthic invertebrate communities<br />
according to the monitoring programme designed in ENV2005/23.<br />
2. To assess changes in benthic communities inside <strong>and</strong> outside the closed area<br />
since 1997.<br />
SPRFMO 1. To develop detection criteria for measuring trawl impacts on vulnerable marine<br />
ecosystems in high sea fisheries of the South Pacific Ocean<br />
SPRFMO 1. To document protection measures implemented by New Zeal<strong>and</strong> for<br />
vulnerable marine ecosystems in the South Pacific Ocean<br />
CCAMLR 1. An Impact Assessment Framework for Bottom Fishing Methods in the<br />
CCAMLR Convention Area<br />
SPRFMO 1. to develop a bottom Fishery Impact Assessment: Bottom Fishing Activities by<br />
New Zeal<strong>and</strong> Vessels Fishing in the High Seas in the SPRFMO Area during<br />
2008 <strong>and</strong> 2009<br />
342<br />
Approved but<br />
not contracted<br />
Ongoing<br />
analysis<br />
Ongoing<br />
analysis<br />
In the process<br />
of publication<br />
Black et al. In Press<br />
Tuck & Hewitt In Press<br />
Completed Parker et al. 2009a<br />
Completed Penney et al. 2009<br />
Completed Sharp et al. 2009<br />
Completed Ministry of Fisheries 2008
AEBAR <strong>2012</strong>: Appendices: Past projects<br />
BENTHIC IMPACTS continued<br />
Project Code Project Title Specific Objectives Status Citation/s<br />
IFA2008-04 Guide for the rapid<br />
identification of material in<br />
the process of managing<br />
Vulnerable Marine<br />
Ecosystems<br />
IFA2007-02 Development of a Draft<br />
New Zeal<strong>and</strong> High-Seas<br />
Bottom Trawling Benthic<br />
Assessment St<strong>and</strong>ard<br />
BEN2007-01 Assessing the effects of<br />
fishing on soft sediment<br />
habitat, fauna, <strong>and</strong><br />
processes<br />
BEN2006-01 Mapping the spatial <strong>and</strong><br />
temporal extent of fishing<br />
in the EEZ<br />
To produce a guide for the rapid identification of material in the process of<br />
managing Vulnerable Marine Ecosystems<br />
1. To generate data summaries <strong>and</strong> maps of New Zeal<strong>and</strong>’s recent historic highseas<br />
bottom trawling catch <strong>and</strong> effort in the proposed convention area of the<br />
South Pacific Regional Fisheries Management Organization (SPRFMO).<br />
2. To map vulnerable marine ecosystems (VMEs) in the SPRFMO area.<br />
3. To develop a draft st<strong>and</strong>ard for assessment of benthic impacts of high-seas<br />
bottom trawling on VMEs in the proposed SPRFMO convention area.<br />
1. To design <strong>and</strong> test sampling <strong>and</strong> analytical strategies for broad-scale<br />
assessments of habitat <strong>and</strong> faunal spatial structure <strong>and</strong> variation across a variety<br />
of seafloor habitats.<br />
2. To design <strong>and</strong> carry out experiments to assess the effects of bottom trawling<br />
<strong>and</strong> dredging on benthic communities <strong>and</strong> ecological processes important to the<br />
sustainability of fishing at scales of relevance to fishery managers.<br />
1. To update maps <strong>and</strong> develop GIS layers of fishing effort from project<br />
ENV2000/05 to show the spatial <strong>and</strong> temporal distribution of mobile bottom<br />
fishing throughout the EEZ between 1989/90 <strong>and</strong> 2004/05.<br />
2. To produce summary statistics of major fisheries <strong>and</strong> the aggregate of all<br />
bottom impacting fisheries in terms of the extent <strong>and</strong> frequency of fishing by<br />
year, by depth zone, by fishable area, <strong>and</strong>, to the extent possible, by habitat<br />
type.<br />
3. To identify <strong>and</strong> document any major trends or changes in fishing effort or<br />
fishing behaviour.<br />
4. To identify, discuss the implications of, <strong>and</strong> make recommendations on data<br />
quality <strong>and</strong> other problems with current reporting systems that complicate<br />
characterisation <strong>and</strong> quantification of bottom fishing effort.<br />
5. To integrate information on the distribution, frequency, <strong>and</strong> magnitude of<br />
fishing disturbance with habitat characteristics throughout the EEZ, using<br />
information stored in national databases, expert opinion, <strong>and</strong> the MEC.<br />
343<br />
Completed Tracey et al. 2008<br />
Completed Parker 2008<br />
Ongoing<br />
analysis<br />
Completed Baird et al. 2009; 2011; Baird<br />
& Wood 2010; Leathwick et<br />
al. 2010; <strong>2012</strong>
AEBAR <strong>2012</strong>: Appendices: Past projects<br />
BENTHIC IMPACTS continued<br />
Project Code Project Title Specific Objectives Status Citation/s<br />
ENV2005-15 Information for managing<br />
the Effects of Fishing on<br />
Physical Features of the<br />
Deep-sea <strong>Environment</strong><br />
ENV2005-16 Investigate the Effects of<br />
Fishing on Physical<br />
Features of the Deep-sea<br />
<strong>Environment</strong><br />
ENV2005-17 Estimation of non-target<br />
fish catch <strong>and</strong> both target<br />
<strong>and</strong> non-target fish<br />
discards in jack mackerel<br />
trawl fisheries<br />
ENV2005-18 Estimation of non-target<br />
fish catch <strong>and</strong> both target<br />
<strong>and</strong> non-target fish<br />
discards in orange roughy<br />
trawl fisheries<br />
1. To provide an updated database that identifies all known seamounts in the<br />
“New Zeal<strong>and</strong> region”, encompassing the area from 24o00’ – 57o30’S, 157o00’E<br />
– 167o00’W. The database will catalogue relevant data (e.g. physical, biological,<br />
location, fishing effort) for individual seamounts.<br />
2. To identify indicators <strong>and</strong> measures suitable for the assessment of risk<br />
pertaining to the effects of fishing disturbance on the benthic biota of seamounts,<br />
<strong>and</strong> review suitable ecological risk assessment methods, that can be derived or<br />
utilise information contained within the seamount database.<br />
1. To monitor changes in fauna <strong>and</strong> habitats over time on selected UTFs in the<br />
Chatham Rise area that have a range of fishing histories.<br />
2. To continue development of the risk assessment model to predict the effects<br />
of fishing, <strong>and</strong> provide options for the management of UTF ecosystems.<br />
1. To estimate the quantity of non-target fish species caught, <strong>and</strong> the target <strong>and</strong><br />
non-target fish species discarded, in the trawl fisheries for jack mackerel for the<br />
fishing years 20011/2002 to 2004/05 using data from Mfish observers <strong>and</strong><br />
commercial fishing returns.<br />
1. To estimate the quantity of non-target fish species caught, <strong>and</strong> the target <strong>and</strong><br />
non-target fish species discarded, in the trawl fisheries for orange roughy for the<br />
fishing years 1999/2000 to 2003/04 using data from Scientific Observers <strong>and</strong><br />
commercial fishing returns.<br />
344<br />
Completed Rowden et al. 2008; Clark et<br />
al. 2010b<br />
Completed Clark et al. 2010a; b; c; 2011<br />
Completed Anderson 2007a<br />
Completed Anderson 2009a
AEBAR <strong>2012</strong>: Appendices: Past projects<br />
BENTHIC IMPACTS continued<br />
Project Code Project Title Specific Objectives Status Citation/s<br />
ENV2005-20 Benthic invertebrate<br />
sampling <strong>and</strong> species<br />
identification in trawl<br />
fisheries<br />
ENV2005-23 Monitoring recovery of the<br />
benthic community<br />
between North Cape <strong>and</strong><br />
Cape Reinga<br />
ZBD2005-04 Information on benthic<br />
impacts in support of the<br />
Foveaux Strait Oyster<br />
Fishery Plan<br />
1. To produce identification guides for benthic invertebrate species encountered<br />
in the catches of commercial <strong>and</strong> research trawlers.<br />
1. To design a monitoring programme that will provide the following quantitative<br />
estimates:<br />
i) Estimates of the nature <strong>and</strong> extent of past fishing impacts on the benthic<br />
community between North Cape <strong>and</strong> Cape Reinga;<br />
ii) Estimates of change over time in areas previously fished but subsequently<br />
closed to fishing. Estimated parameters will include indices representing<br />
biodiversity, community composition, <strong>and</strong> biogenic structure;<br />
iii) Estimates of change over time in areas environmentally comparable to those<br />
assessed in (ii), above, but subject to ongoing fishing impacts; <strong>and</strong><br />
iv) Estimates of change over time in areas comparable to those above, but not<br />
impacted by fishing (if any such areas can be found).<br />
1. To assess the distribution- vulnerability to disturbance- <strong>and</strong> ecological<br />
importance of habitats in Foveaux Strait- <strong>and</strong> describe the spatial distribution of<br />
the Foveaux Strait oyster fishery relative to those habitats.<br />
2. To assemble <strong>and</strong> collate existing information on the Foveaux Strait system<br />
between the Sol<strong>and</strong>er Isl<strong>and</strong>s <strong>and</strong> Ruapuke Isl<strong>and</strong> or other area to be agreed<br />
with MFish.<br />
3. To map- using best available information- substrate type- bathymetry- wave<br />
energy- <strong>and</strong> tidal flow in this area.<br />
4. To assess the extent to which these data can be used to define useful<br />
functional categories that might serve as habitat classes.<br />
5. To rank the vulnerability to fishing disturbance of habitat classes developed in<br />
Objective 3 using approximate regeneration times.<br />
6. To describe the functional role <strong>and</strong> ecosystem services provided by each<br />
habitat class developed in Objective 3- including an assessment of the relative<br />
importance of each to overall ecosystem function <strong>and</strong> productivity.<br />
7. To describe the spatial pattern <strong>and</strong> intensity of dredge fishing for Foveaux<br />
Strait oysters over the past 10 fishing years <strong>and</strong> relate this to natural disturbance<br />
regimes <strong>and</strong> habitat classes developed in Objective 3.<br />
8. To carry out a qualitative video survey of benthic habitats in Foveaux Strait-<br />
both within the established commercial oyster fishery area <strong>and</strong> areas outside the<br />
fishery area but within OYU 5.<br />
345<br />
Completed Tracey et al. 2007; Williams<br />
et al. 2010; Clark et al. 2009<br />
Completed Tuck et al. 2010<br />
Completed Michael et al. 2006
AEBAR <strong>2012</strong>: Appendices: Past projects<br />
BENTHIC IMPACTS continued<br />
Project Code Project Title Specific Objectives Status Citation/s<br />
ZBD2005-15 Information on benthic<br />
impacts in support of the<br />
Corom<strong>and</strong>el Scallops<br />
Fishery Plan<br />
ZBD2005-16 Information on benthic<br />
impacts in support of the<br />
Southern Blue Whiting<br />
Fishery Plan<br />
ENV2004-02 Estimation of New<br />
Zeal<strong>and</strong> sea lion incidental<br />
captures in New Zeal<strong>and</strong><br />
Fisheries<br />
ENV2003-03 Determining the spatial<br />
extent, nature <strong>and</strong> effect of<br />
mobile bottom fishing<br />
methods<br />
1. To assemble <strong>and</strong> collate existing information on the corom<strong>and</strong>el Scallop<br />
Fishery between cape Rodney <strong>and</strong> Town Point or other, wider area to be agreed<br />
with Mfish.<br />
2. To map, using best available information, substrate type, bathymetry, wave<br />
energy, <strong>and</strong> tidal flow in this area.<br />
3. To assess the extent to which data can be used to define useful functional<br />
categories that might serves as habitat classes.<br />
4. To rank the vulnerability of fishing disturbance of habitat classes developed in<br />
Objective 3 using approximate regeneration times.<br />
5. To describe the functional role <strong>and</strong> ecosystem services provided by each<br />
habitat class developed in Objective 3, including an assessment of the relative<br />
importance of each to overall ecosystem function <strong>and</strong> productivity.<br />
6. To describe the spatial pattern <strong>and</strong> intensity of dredge <strong>and</strong> trawl fishing within<br />
the Corom<strong>and</strong>el scallop fishery over the past 15 fishing years <strong>and</strong> relate this to<br />
natural disturbance regimes <strong>and</strong> habitat classes developed in Objective 3.<br />
1. To assemble <strong>and</strong> collate existing information on the Southern Blue Whiting<br />
fishery in SBW6A, SBW6B, SBW6I, <strong>and</strong> SBW6R or other wider area to be<br />
agreed with MFish<br />
2. To map, using best available information, substratum type, bathymetry, wave<br />
energy, tides, <strong>and</strong> ocean currents in these areas<br />
3. To assess the extent to which these data can be used to define useful<br />
functional categories that might serve as habitat categories.<br />
4. To rank the vulnerability to fishing disturbance of habitat classes developed in<br />
Objective 3 using approximate regeneration times.<br />
5. To describe the functional role <strong>and</strong> ecosystem services provided by each<br />
habitat class developed in Objective 3, including an assessment of the relative<br />
importance of each to overall ecosystem function <strong>and</strong> productivity.<br />
6. To describe the spatial pattern <strong>and</strong> intensity of trawl fishing within the<br />
Southern Blue Whiting fishery over the past 10 fishing years <strong>and</strong> relate this to<br />
natural disturbance regimes <strong>and</strong> habitat classes developed in Objective 3.<br />
1. To estimate the level of New Zeal<strong>and</strong> sea lion (Phocartos hookeri) incidental<br />
capture in New Zeal<strong>and</strong> fisheries<br />
1. To determine the spatial extent, nature <strong>and</strong> time between disturbances of<br />
mobile bottom fishing methods in the Chatham Rise trawl fisheries.<br />
346<br />
Completed Tuck et al. 2006a; b<br />
Completed Cole et al. 2007<br />
Completed Smith & Baird 2007a<br />
Completed Baird et al. 2006
AEBAR <strong>2012</strong>: Appendices: Past projects<br />
BENTHIC IMPACTS continued<br />
Project Code Project Title Specific Objectives Status Citation/s<br />
ENV2002-04 Benthic invertebrate<br />
sampling <strong>and</strong> specific<br />
identification in trawl<br />
fisheries<br />
ENV2001-07 Reducing bycatch in<br />
scampi trawl fisheries<br />
ENV2001-09 The effects of mobile<br />
bottom fishing gear on<br />
bentho-pelagic coupling<br />
ENV2001-15 The effects of bottom<br />
impacting trawling on<br />
seamounts<br />
OYS2001-01 Foveaux Strait oyster<br />
stock assessment<br />
ENV2000-05 Spatial extent, nature <strong>and</strong><br />
impact of mobile bottom<br />
fishing methods in the<br />
New Zeal<strong>and</strong> EEZ<br />
ENV2000-06 <strong>Review</strong> of technologies<br />
<strong>and</strong> practices to reduce<br />
bottom trawl bycatch <strong>and</strong><br />
seafloor disturbance in<br />
New Zeal<strong>and</strong><br />
1. To quantify <strong>and</strong> map the benthic invertebrate species incidental catch in<br />
commercial <strong>and</strong> research trawling throughout the New Zeal<strong>and</strong> EEZ<br />
1. Collate <strong>and</strong> review the international literature on methods of reducing bycatch<br />
in crustacean trawl fisheries.<br />
2. <strong>Review</strong> <strong>and</strong> analyse the data from New Zeal<strong>and</strong> studies.<br />
3. Develop recommendations on future approaches to reducing bycatch in the<br />
New Zeal<strong>and</strong> scampi fishery, including some general thoughts on the<br />
experimental design of field trials.<br />
To describe any effects of fishing that might modify bentho-pelagic coupling (a<br />
complex, interlinked suite of processes transferring energy, oxygen, carbon, <strong>and</strong><br />
nutrients between pelagic <strong>and</strong> benthic systems), to consider the scale of such<br />
possible effects, <strong>and</strong> to put the summary in a New Zeal<strong>and</strong> context.<br />
1. To design a programme in New Zeal<strong>and</strong> waters previously trawled <strong>and</strong> now<br />
closed to trawling to monitor the rate of regeneration of benthic communities on<br />
seamounts.<br />
1. To carry out a survey <strong>and</strong> determine the distribution <strong>and</strong> absolute abundance<br />
of pre-recruit <strong>and</strong> recruited oysters in both non-commercial <strong>and</strong> commercial<br />
areas of Foveaux Strait. The target coefficient of variation (c.v.) of the estimate<br />
of absolute recruited abundance is 20%.<br />
2. To estimate the sustainable yield for the areas of the commercial oyster<br />
fishery in Foveaux Strait for the year 2002 oyster season.<br />
3. To identify <strong>and</strong> count benthic macro-biota collected during the dredge survey.<br />
1. To determine the spatial extent, nature <strong>and</strong> impact of mobile bottom fishing<br />
methods within the New Zeal<strong>and</strong> EEZ.<br />
347<br />
Completed Tracey et al. 2005<br />
Completed Hartill et al. 2006<br />
Completed Cryer et al. 2004<br />
Completed Clark & O'Driscoll 2003;<br />
Clark & Rowden 2009<br />
Completed Rowden et al. 2007<br />
Completed Cryer <strong>and</strong> Hartill 2002; Baird<br />
et al. 2002<br />
Objectives unknown Completed Booth et al. 2002; Beentjes<br />
& Baird 2004
AEBAR <strong>2012</strong>: Appendices: Past projects<br />
BENTHIC IMPACTS continued<br />
Project Code Project Title Specific Objectives Status Citation/s<br />
ENV98-05 The effects of fishing on<br />
the benthic community<br />
structure between North<br />
Cape <strong>and</strong> Cape Reinga<br />
1. To determine the effects of fishing on the benthic community structure<br />
between North Cape <strong>and</strong> Cape Reinga.<br />
348<br />
Completed Cryer et al. 2000
AEBAR <strong>2012</strong>: Appendices: Past projects<br />
ECOSYSTEM EFFECTS<br />
Project Code Project Title Specific Objectives Status Citation/s<br />
ENV<strong>2012</strong>-01 A literature review of<br />
Nitrogen levels <strong>and</strong><br />
adverse ecological effects<br />
in embayments in<br />
temperate regions.<br />
ZBD<strong>2012</strong>-06 Ocean status: trends in NZ<br />
marine environment <strong>and</strong><br />
Tier 1 statistic<br />
1. To complete a literature review of Nitrogen levels <strong>and</strong> adverse ecological<br />
impacts from temperate embayments in order to assist aquaculture consenting<br />
authorities in determining at what concentration of Nitrogen adverse effects may<br />
be expected.<br />
1. To provide an up to date overview of climatic trends <strong>and</strong> cycles <strong>and</strong> how they<br />
affect New Zeal<strong>and</strong> oceanographic conditions, <strong>and</strong> highlight key changes since<br />
the previous assessment.<br />
2. To identify c<strong>and</strong>idate oceanographic variables for potential development as<br />
part of the proposed Tier 1 Statistic, Atmospheric <strong>and</strong> Ocean Climate Change<br />
ANT2011-01 Antarctic fisheries 1. To develop, implement <strong>and</strong> refine approaches for assessing the stock status<br />
of toothfish (Dissostichus spp.) in the Ross Sea region.<br />
2. To develop, implement <strong>and</strong> refine approaches for assessing <strong>and</strong> monitoring<br />
the status of non-target fish species, <strong>and</strong> dependent <strong>and</strong> related species.<br />
3. To develop, implement <strong>and</strong> refine approaches for underst<strong>and</strong>ing <strong>and</strong><br />
managing the ecological relationships between the toothfish (Dissostichus spp.)<br />
fishery <strong>and</strong> the Ross Sea ecosystem.<br />
DAE2010-01 Taxonomic identification of<br />
benthic specimens<br />
DAE2010-03 Ecological risk<br />
assessment for deepwater<br />
stocks<br />
DEE2010-04 Development of a<br />
methodology for<br />
<strong>Environment</strong>al Risk<br />
Assessments for<br />
deepwater fisheries<br />
DEE2010-05 Development of a suite of<br />
environmental indicators<br />
for deepwater fisheries<br />
ENV2010-03 Habitats of particular<br />
significance for inshore<br />
finfish fisheries<br />
management<br />
1. To identify benthic invertebrates in samples taken during research trawls <strong>and</strong><br />
by Observers on fishing vessels.<br />
2. To update relevant databases recording the catch of invertebrates in research<br />
trawls <strong>and</strong> commercial fishing.<br />
1. To undertake a qualitative (level 1) risk assessment for tier 3 fishstocks within<br />
the deepwater fisheries plan.<br />
To review approaches to Ecological Risk Assessments (ERA) <strong>and</strong> methods<br />
available for deepwater fisheries both QMS <strong>and</strong> non-QMS.<br />
2. To develop <strong>and</strong> recommend a generic, cost effective, method for ERA in<br />
deepwater fisheries by using or modifying methods identified in Objective 1.<br />
1. To review the literature <strong>and</strong> hold a workshop to recommend a suite of<br />
ecosystem <strong>and</strong> environmental indicators that will contribute to assessing the<br />
performance of deepwater fisheries within an environmental context.<br />
2. To examine available data <strong>and</strong> design a data collection programme to enable<br />
future calculation of the indicators identified in Specific Objective 1.<br />
1. To review the literature to determine the most important juvenile or<br />
reproductive (spawning, pupping or egg-laying) areas for inshore finfish target<br />
species.<br />
2. To use a gap analysis to prioritize areas for future research concerning the<br />
important juvenile or reproductive (spawning, pupping or egg-laying) areas for<br />
target inshore finfish fisheries<br />
349<br />
Approved but<br />
not contracted<br />
Approved but<br />
not contracted<br />
Ongoing<br />
analysis<br />
Ongoing<br />
analysis<br />
Ongoing<br />
analysis<br />
Completed Clark et al. In Press<br />
Ongoing<br />
analysis<br />
Ongoing<br />
analysis
AEBAR <strong>2012</strong>: Appendices: Past projects<br />
ECOSYSTEM EFFECTS continued<br />
Project Code Project Title Specific Objectives Status Citation/s<br />
ENV2010-<br />
05A&B <strong>and</strong><br />
SEA 2010-15<br />
Habitats of particular<br />
significance for fisheries<br />
management: shark<br />
nursery areas<br />
ZBD2010-42 Development of a National<br />
Marine <strong>Environment</strong><br />
Monitoring Programme<br />
1. Identify, from the literature, important nursery grounds for rig in estuaries<br />
around mainl<strong>and</strong> New Zeal<strong>and</strong>.<br />
2. Design <strong>and</strong> carry out a survey of selected estuaries <strong>and</strong> harbours around New<br />
Zeal<strong>and</strong> to quantify the relative importance of nursery ground areas.<br />
3. Identify threats to these nursery ground areas <strong>and</strong> recommend mitigation<br />
measures.<br />
1. To design a Marine Evnironment Monitoring Programme (MEMP) to track the<br />
physical, chemical <strong>and</strong> biological changes taking place across New Zeal<strong>and</strong>'s<br />
marine environment over the long term<br />
2. To prepare an online inventory (metadatabase) of repeated (time series)<br />
biological <strong>and</strong> abiotic marine observations/datasets in New Zeal<strong>and</strong><br />
3. To review, evaluate fitness for purpose, <strong>and</strong> identify gaps in the utility <strong>and</strong><br />
interoperability of these datasets for inclusion in MEMP from both science <strong>and</strong><br />
policy perspectives<br />
4. To design a MEMP that includes relevant existing data collection <strong>and</strong><br />
proposed new time series<br />
ANT2009-01 Antarctic fisheries 1. To explore the biology of fishes captured in the toothfish fishery to underpin<br />
future stock assessment <strong>and</strong> ecosystem modelling research<br />
2. To develop <strong>and</strong> refine stock assessment approaches for toothfish in the Ross<br />
Sea<br />
3. To assess the status of toothfish stocks in the Ross Sea<br />
4. To explore the Ross Sea toothfish fishery at an ecosystem level<br />
5. To review <strong>and</strong> further develop procedures for the ageing of Antarctic toothfish<br />
(Dissostichus mawsoni) <strong>and</strong> Patagonian toothfish (D. eleginoides).<br />
6. To review <strong>and</strong> update the species profiles for toothfish<br />
7. To characterise the toothfish fishery in the Ross Sea up to 2009/10<br />
8. To further develop toothfish biological <strong>and</strong> modelling parameters<br />
9. To assess the status of the Ross Sea toothfish stock(s) with respect to<br />
CCAMLR performance measures<br />
10. To further develop approaches to assessing the status of skates in the Ross<br />
Sea region with respect to CCAMLR performance measures<br />
11. Further develop the SPM approach<br />
12. To develop new approaches <strong>and</strong> refine existing approaches to underst<strong>and</strong>ing<br />
the impacts of fishing on potential VMEs<br />
13. To further develop ecosystem monitoring through the analysis of the diet of<br />
toothfish in the north <strong>and</strong> slope fisheries.<br />
14. To refine the draft data collection plan for the Ross Sea region fisheries <strong>and</strong><br />
undertake associated preliminary reviews of fishery <strong>and</strong> observer performance<br />
against targets immediately post-season<br />
350<br />
In the process<br />
of publication<br />
Ongoing<br />
analysis<br />
Francis et al. <strong>2012</strong>; Jones et<br />
al. In Press<br />
Completed Parker & Bowden 2010;<br />
Parker et al. 2009c; Tracey<br />
et al. 2010
AEBAR <strong>2012</strong>: Appendices: Past projects<br />
ECOSYSTEM EFFECTS continued<br />
Project Code Project Title Specific Objectives Status Citation/s<br />
ENV2009-04 Trends in relative<br />
mesopelagic biomass<br />
using time series of<br />
acoustic backscatter data<br />
from trawl surveys<br />
ENV2009-07 Habitats of particular<br />
significance for<br />
fisheriesmanagement:<br />
kaipara harbour<br />
GMU2009-01 Spatial Mixing of GMU1<br />
using Otolith<br />
Microchemistry<br />
IPA2009-11 Trophic studies publication<br />
of review<br />
ANT2008-03 Ecosystem effects of<br />
fishing in the Ross Sea<br />
AQE2008-02 <strong>Review</strong> of ecological<br />
effects of farming shellfish<br />
<strong>and</strong> other species<br />
1. To evaluate relative changes in abundance of mesopelagic fish <strong>and</strong> other<br />
biological components from acoustic records collected during Chatham Rise <strong>and</strong><br />
Sub-Antarctic trawl surveys.<br />
2. To explore links between trends in mesopelagic biomass <strong>and</strong> climate variables<br />
<strong>and</strong> variations, <strong>and</strong> condition indices of commercial species in the Chatham Rise<br />
<strong>and</strong> Sub-Antarctic areas.<br />
1. Collate <strong>and</strong> review information on the role <strong>and</strong> spatial distribution of habitats in<br />
the Kaipara Harbour that support fisheries production.<br />
2. Assess historical, current, <strong>and</strong> potential anthropogenic threats to these<br />
habitats that could affect fisheries values, including fishing <strong>and</strong> l<strong>and</strong>-based<br />
threats.<br />
3. Design <strong>and</strong> implement cost-effective habitat mapping <strong>and</strong> monitoring surveys<br />
of habitats of particular significance for fisheries management in the Kaipara<br />
Harbour.<br />
1. To determine the level of spatial mixing <strong>and</strong> connectivity of grey mullet (Mugil<br />
cephalus) populations using otolith microchemistry.<br />
2. To collect <strong>and</strong> analyse the chemical composition of grey mullet otoliths.<br />
3. To analyse the otoliths collected under Objective 1 to determine if the samples<br />
can be spatially separated.<br />
1. To publish the comprehensive review of New Zeal<strong>and</strong>-wide trophic studies<br />
completed in 2000 that was prepared by NIWA.<br />
To evaluate the VMEIO classification accuracy of observers, identify potential<br />
causes for taxonomic confusion, <strong>and</strong> make recommendations for improvements<br />
in the classification guide, observer training, <strong>and</strong> in the data collection protocols<br />
1. To collate <strong>and</strong> review information on the ecological effects of farming mussels<br />
(Perna canaliculus), including offshore mussel farming <strong>and</strong> spat catching, in the<br />
New Zeal<strong>and</strong> marine environment.<br />
2. To collate <strong>and</strong> review information on the ecological effects of farming oysters<br />
in the New Zeal<strong>and</strong> marine environment.<br />
3. To collate <strong>and</strong> review information on the ecological effects of farming species<br />
other than mussels (Perna canaliculus), oysters, <strong>and</strong> finfish, in the New Zeal<strong>and</strong><br />
marine environment.<br />
351<br />
Completed O'Driscoll et al. 2011<br />
Ongoing<br />
analysis<br />
Ongoing<br />
analysis<br />
Completed Stevens et al. 2011<br />
Completed Parker et al. 2009b; 2010<br />
Completed Keeley et al. 2009
AEBAR <strong>2012</strong>: Appendices: Past projects<br />
ECOSYSTEM EFFECTS continued<br />
Project Code Project Title Specific Objectives Status Citation/s<br />
TOH2008-01 Distribution <strong>and</strong><br />
abundance of Toheroa<br />
IFA2008-08 Inputs to the Ross Sea<br />
bioregionalisation<br />
ANT2007-01 Biology of fishes in the<br />
toothfish fishery<br />
BEN2007-01 Assessing the effects of<br />
fishing on soft sediment<br />
habitat, fauna, <strong>and</strong><br />
processes<br />
BEN2007-05 Risk assessment<br />
framework for assessing<br />
fishing &other<br />
anthropogenic effects on<br />
coastal fisheries<br />
ENH2007-01 Stock enhancement of<br />
blackfoot paua<br />
1. To estimate the size structure <strong>and</strong> absolute abundance of toheroa on Oreti<br />
Beach, during February 2009. The target c.v. for the estimate of absolute<br />
abundance of legal sized toheroa ( 100 mm shell length) is 20%.<br />
2. To describe changes in the size structure <strong>and</strong> absolute abundance of toheroa<br />
on Oreti Beach by comparing the results from this work with those from previous<br />
surveys.<br />
3. To estimate the size structure <strong>and</strong> absolute abundance of toheroa on<br />
Bluecliffs Beach, during February 2009. The target c.v. for the estimate of<br />
absolute abundance of legal sized toheroa ( 100 mm shell length) is 20%.<br />
4. To describe changes in the size structure <strong>and</strong> absolute abundance of toheroa<br />
on Bluecliffs Beach by comparing the results from this work with those from<br />
previous surveys.<br />
1. To produce one or more benthic invertebrate classifications of the Ross Sea<br />
region;<br />
2. To use fishery catch data to examine spatial distributions of major demersal<br />
fish species;<br />
3. To prepare other biological or environmental spatial data layers for use in the<br />
Ross Sea workshop.<br />
3. To develop an identification guide for observers of benthic invertebrate<br />
species (especially sponges, corals etc) caught in the Ross Sea region fisheries.<br />
1. To design <strong>and</strong> test sampling <strong>and</strong> analytical strategies for broad-scale<br />
assessments of habitat <strong>and</strong> faunal spatial structure <strong>and</strong> variation across a variety<br />
of seafloor habitats.<br />
2. To design <strong>and</strong> carry out experiments to assess the effects of bottom trawling<br />
<strong>and</strong> dredging on benthic communities <strong>and</strong> ecological processes important to the<br />
sustainability of fishing at scales of relevance to fishery managers.<br />
1. To collate existing information on the distribution, intensity, <strong>and</strong> frequency of<br />
anthropogenic disturbances in the coastal zone that could be used in a risk<br />
assessment model to estimate their likely aggregate effect on ecosystem<br />
function across habitats <strong>and</strong> over different scales of ecosystem functioning <strong>and</strong><br />
biological organization.<br />
2. To develop a risk assessment framework in conjunction with a variety of<br />
stakeholders <strong>and</strong> environmental scientists.<br />
1. To assess the survival rate of enhanced paua from introduction into the wild<br />
through to harvest.<br />
2. To assess the genetic diversity of hatchery spawned juvenile paua bred for<br />
enhancement purposes.<br />
3. To assess interactions between introduced <strong>and</strong> wild paua populations <strong>and</strong> to<br />
recommend research <strong>and</strong> monitoring to quantify those impacts that are<br />
potentially adverse.<br />
352<br />
Completed Beentjes 2010<br />
Completed Pinkerton et al. 2009a<br />
Completed Parker et al. 2008<br />
Ongoing<br />
analysis<br />
Completed MacDiarmid et al. <strong>2012</strong><br />
Ongoing<br />
analysis
AEBAR <strong>2012</strong>: Appendices: Past projects<br />
ECOSYSTEM EFFECTS continued<br />
Project Code Project Title Specific Objectives Status Citation/s<br />
ENV2007-04 Climate <strong>and</strong><br />
Oceanographic Trends<br />
Relevant to New Zeal<strong>and</strong><br />
Fisheries<br />
ENV2007-06 Trophic Relationships of<br />
Commercial Middle Depth<br />
Species on the Chatham<br />
Rise<br />
HAB2007-01 Biogenic habitats as areas<br />
of particular significance<br />
for fisheries management<br />
1. To summarise, for fisheries managers, climatic <strong>and</strong> oceanographic<br />
fluctuations <strong>and</strong> cycles that affect productivity, fish distribution <strong>and</strong> fish<br />
abundance in New Zeal<strong>and</strong>.<br />
1. To quantify the inter-annual variability in the diets of hoki, hake <strong>and</strong> ling on the<br />
Chatham Rise 1992–2007<br />
2.To quantify seasonal dietary cycles for hoki, hake <strong>and</strong> ling that have been<br />
collected from the commercial fleet throughout the year<br />
1. To collate <strong>and</strong> review available information on the location, value, functioning,<br />
threats to, <strong>and</strong> past <strong>and</strong> current status of biogenic habitats that may be important<br />
for fisheries production in the New Zeal<strong>and</strong> marine environment.<br />
2. To identify information gaps, in the New Zeal<strong>and</strong> context, <strong>and</strong> recommend<br />
measures to address those important to an ecosystem approach to fisheries<br />
management<br />
1. To review <strong>and</strong> collate scientific knowledge <strong>and</strong> research on the impacts of<br />
IPA2007-07 L<strong>and</strong> Based Effects on<br />
Costal Fisheries<br />
l<strong>and</strong>-based activities on coastal fisheries <strong>and</strong> biodiversity<br />
TOH2007-03 Toheroa Abundance 1. To investigate variations in the abundance of toheroa.<br />
2. To investigate sources of mortality of toheroa <strong>and</strong> factors affecting the<br />
recruitment of toheroa<br />
ENV2006-04 Ecosystem indicators for 1. To carry out a literature review of potential fish-based ecosystem indicators<br />
New Zeal<strong>and</strong> fisheries <strong>and</strong> identify a suite of indicators to be tested in Objective 2<br />
2. To test a suite of fish-based ecosystem indicators (identified by Objective 1)<br />
on existing trawl survey time series in New Zeal<strong>and</strong>. The utility of these<br />
indicators for monitoring the effects of fishing in New Zeal<strong>and</strong> should also be<br />
evaluated<br />
GBD2006-01 DNA database for<br />
1. To collect DNA sequences for vouchered specimens of commercially<br />
commercial marine fish important marine fishes <strong>and</strong> submit the DNA data to the international Barcode of<br />
<strong>and</strong> invertebrates<br />
Life Database (BOLD).<br />
2. To collect DNA sequences for vouchered specimens of commercially<br />
important marine invertebrates <strong>and</strong> submit the DNA data to the international<br />
Barcode of Life Database (BOLD).<br />
Note: The funding was limited to $60 000 for this Objective. Therefore MFish<br />
agreed to omit the invertebrate species (Objective 2) from this project <strong>and</strong><br />
reduce the number of fish species sequenced from 100 to 80 (up to 5 specimens<br />
per species). During the course of the project MFish staff asked NIWA to identify<br />
smoked eel product, suspect shark fillets, <strong>and</strong> possible paua slime with DNA<br />
markers, consequently the project was modified to accommodate these requests<br />
353<br />
Completed Hurst et al. <strong>2012</strong><br />
Completed Horn & Dunn 2010<br />
Ongoing<br />
analysis<br />
Completed Morrisson et al. 2009<br />
Ongoing<br />
analysis<br />
Williams et al. In Press<br />
Completed Tuck et al. 2009<br />
Completed No reports specified as<br />
required output
AEBAR <strong>2012</strong>: Appendices: Past projects<br />
ECOSYSTEM EFFECTS continued<br />
Project Code Project Title Specific Objectives Status Citation/s<br />
SAP2006-06 West coast south isl<strong>and</strong><br />
review<br />
IPA2006-08 <strong>Review</strong> of the Ecological<br />
Effects of Marine Finfish<br />
aquaculture: Final Report<br />
ANT2005-02 Aspects of the biology of<br />
fishes in the toothfish<br />
fishery<br />
ANT2005-04 Ecosystem modelling of<br />
the Ross Sea<br />
ENV2005-08 Experimental design of a<br />
programme of indicators<br />
SAM2005-02 Effects of climate on<br />
commercial fish<br />
abundance<br />
1. To publish a review document summarising oceanic <strong>and</strong> environmental<br />
research information particularly relevant to hoki- but also other fisheries- that<br />
spawn off Westl<strong>and</strong> in winter<br />
2. Update the draft chapters prepared in 2004 by oceanographers- modellers<br />
<strong>and</strong> scientists towards the overall objective<br />
3. Incorporate a section on other west coast spawning fisheries<br />
1. Summarise <strong>and</strong> review existing information on ecological effects of finfish<br />
farming on the marine environment in New Zeal<strong>and</strong> <strong>and</strong> overseas<br />
1. Estimate length <strong>and</strong> age at maturity for Antarctic toothfish in the Ross Sea<br />
2. Examine TOA length at age by depth <strong>and</strong> area<br />
3. Estimate biological parameters for TOA (M, growth rates corrected for<br />
selectivity, h, r)<br />
4. Determine stock structure of TOA based on parasite data<br />
5. Determine length-weight relationships, diet, reproduction, age <strong>and</strong> growth of<br />
C.dewitti<br />
6. ID <strong>and</strong> speciation of Antarctic skates<br />
7. Develop an ID guide for scientific Observers of fish in the Ross Sea fishery<br />
8. Identify heavy metal contents of selected fish species in the Ross Sea fishery<br />
1. Carry out stable isotope analysis of TOA <strong>and</strong> 3 key fish prey to determine<br />
trophic links<br />
2. Determine squid diet by analysis of squid beaks for stable isotope analysis<br />
3. Participate in the design of an IPY survey<br />
4. Participate in EMM as required<br />
1. To assess the utility/feasibility of using demographic information to assess the<br />
effects of<br />
fishing on seabird populations.<br />
2. To identify population indicators <strong>and</strong> to provide sampling protocols <strong>and</strong><br />
experimental<br />
design for selected high to medium priority seabird populations.<br />
3. To recommend experimental protocols for sampling of selected seabird<br />
populations in New Zeal<strong>and</strong><br />
influenced by fisheries mortality, employing robust-design methodology <strong>and</strong><br />
including<br />
recommendations for inclusions of data into Ministry of Fisheries databases.<br />
To examine the possible effects of climate on fishery yields <strong>and</strong> abundance<br />
indices for commercial fisheries around New Zeal<strong>and</strong><br />
354<br />
Completed Bradford-Grieve & Livingston<br />
2011<br />
Completed Forrest et al. 2007<br />
Completed McMillan et al. 2007; Smith<br />
et al. 2007; Sutton et al. 2006<br />
Completed Pinkerton et al. 2007b<br />
Completed MacKenzie & Fletcher 2010<br />
Completed Dunn et al. 2009
AEBAR <strong>2012</strong>: Appendices: Past projects<br />
ECOSYSTEM EFFECTS continued<br />
Project Code Project Title Specific Objectives Status Citation/s<br />
ANT2004-01 Characterisation of the<br />
toothfish fishery<br />
ANT2004-05 Modelling of the<br />
ecosystem effects of<br />
fishing in the Ross Sea<br />
HOK2004-01 Hoki Population modelling<br />
<strong>and</strong> stock assessment<br />
AQE2003-01 Effects of aquaculture <strong>and</strong><br />
enhancement stock<br />
sources on wild fisheries<br />
resources <strong>and</strong> the marine<br />
environment.<br />
EEL2003-01 Non-fishing mortality of<br />
freshwater eels<br />
MOF2003-01 The implications of marine<br />
reserves for fisheries<br />
resources <strong>and</strong><br />
management in the New<br />
Zeal<strong>and</strong> context<br />
ENV2002-03 Beach cast seaweed<br />
review<br />
1. update descriptive analysis of toothfish fishery in the Ross Sea to 04/05<br />
2. analyse age, LF <strong>and</strong> sex ratio for toothfish <strong>and</strong> rattails for 04/05<br />
3. update <strong>and</strong> refine the CPUE for TOA in Ross Sea for 04/05<br />
4. determine diet of sub-adult TOA in the Ross Sea<br />
5. review the TOA parasite collection protocol<br />
6. document TOA tagging protocol<br />
7. review approaches to monitoring <strong>and</strong> assessing rattails <strong>and</strong> skates in the Ross<br />
Sea<br />
8. descriptive analysis of stake tagging programme in the Ross Sea<br />
9. determine factors affecting bycatch of rattails <strong>and</strong> skates between vessels<br />
10. carry out risk assessment for M. whitsoni <strong>and</strong> A. georgina in the Ross Sea<br />
1. develop an effects of fishing model based around toothfish fishery<br />
2. investigate possible consequences of different management strategies<br />
3. make recommendations for future research to decrease uncertainty in the<br />
model<br />
2. To investigate the prediction of year class strength from environmental<br />
variables.<br />
355<br />
Completed Smith & Notman 2005;<br />
Stevens 2006<br />
Completed Pinkerton et al. 2005; 2006<br />
Completed Francis et al. 2005<br />
1. To identify, discuss the effects <strong>and</strong> qualitatively assess the risks of<br />
aquaculture <strong>and</strong> enhancement stocks improved by hatchery technology on New<br />
Zeal<strong>and</strong>’s wild fisheries resources <strong>and</strong> the marine environment.<br />
2. To identify, discuss the effects <strong>and</strong> qualitatively assess the risks associated<br />
with the translocation of aquaculture <strong>and</strong> enhancement stocks on New Zeal<strong>and</strong>’s<br />
wild fisheries resources <strong>and</strong> the marine environment.<br />
3. To make recommendations on priority issues, risks, or research to be<br />
undertaken, as a result of information discussed <strong>and</strong> evaluated in objectives 1-2.<br />
Completed Speed 2005<br />
1. To undertake a feasibility study on establishing an estimate of the mortality of<br />
eels caused by hydroelectric turbines <strong>and</strong> other point sources of mortality caused<br />
by human activity.<br />
Completed Bentjees et al. 2005<br />
Objectives unknown Completed Speed et al. 2006<br />
1. To collate existing information on the role of beach-cast seaweed in coastal<br />
ecosystems to assess the nature <strong>and</strong> extent of the impacts that the removal of<br />
beach cast seaweed may have on the marine environment.<br />
2. On the basis of the review in Specific Objective 1 above, to identify key<br />
research gaps related to any marine environment impacts that the removal of<br />
beach cast seaweed may have.<br />
Completed Zemke-White et al. 2005
AEBAR <strong>2012</strong>: Appendices: Past projects<br />
ECOSYSTEM EFFECTS continued<br />
Project Code Project Title Specific Objectives Status Citation/s<br />
ENV2002-07 Energetics <strong>and</strong> trophic<br />
relationships of important<br />
fish <strong>and</strong> invertebrate<br />
species<br />
CRA2000-01 Rock lobster stock<br />
assessment<br />
ENV2000-04 Identification of areas of<br />
habitat of particular<br />
significance for fisheries<br />
management within the<br />
New Zeal<strong>and</strong> EEZ<br />
MOF2000-<br />
02A<br />
Future research<br />
requirements for the Ross<br />
Sea Antarctic toothfish<br />
(Dissostichus mawsoni)<br />
fishery.<br />
ENV99-03 Identification of areas of<br />
habitat of particular<br />
significance for fisheries<br />
management within the<br />
NZ EEZ.<br />
ENV99-04 A framework for evaluating<br />
spatial closures as a<br />
fisheries management tool<br />
No project<br />
number<br />
The fishery for freshwater<br />
eels (Anguilla spp.) in New<br />
Zeal<strong>and</strong><br />
1. To quantify food webs supporting important fish <strong>and</strong> invertebrate species Completed Livingston 2004<br />
Objective 11: To conduct a desktop study to identifi <strong>and</strong> explore data needs<br />
associated with<br />
managing the effects of rock lobsterfishing on the environment.<br />
Completed Breen 2005<br />
1. To review literature <strong>and</strong> existing data for all significant fish species, including<br />
all QMS species, encountered from the 200 1500 m contour within the New<br />
Zeal<strong>and</strong> EEZ to:<br />
a) determine areas of important juvenile fish habitat;<br />
b) determine areas of importance to spawning fish populations; <strong>and</strong><br />
c) determine areas of importance for shark populations for pupping or egg laying.<br />
2. To review literature <strong>and</strong> existing data for all significant pelagic fish species<br />
(excluding highly migratory species) encountered within the New Zeal<strong>and</strong> EEZ<br />
to:<br />
a) determine areas of important juvenile fish habitat;<br />
b) determine areas of importance to spawning fish populations; <strong>and</strong><br />
c) determine areas of importance for shark populations for pupping or egg laying<br />
3. To review literature <strong>and</strong> existing data for all significant marine invertebrate<br />
species encountered within the New Zeal<strong>and</strong> EEZ to:<br />
a) determine areas of important juvenile habitat; <strong>and</strong><br />
b) determine areas of importance to spawning populations<br />
Completed O'Driscoll et al. 2003<br />
Objectives unknown Completed Hanchet 2000<br />
1. To determine areas of habitat of importance to fisheries management within<br />
the New Zeal<strong>and</strong> EEZ for selected fish species in selected areas<br />
356<br />
Completed Hurst et al. 2000<br />
Unknown Completed Bentley et al. 2004<br />
Objectives unknown Completed Jellyman 1994
AEBAR <strong>2012</strong>: Appendices: Past projects<br />
BIODIVERSITY<br />
Project Code Project Title Specific Objectives Status Citation/s<br />
SRP2011-02 IDG 2009-01 field guide<br />
completion<br />
ZBD2010-39 Improved benthic<br />
invertebrate species<br />
identification in trawl<br />
fisheries<br />
ZBD2010-40 Predictive modelling of the<br />
distribution of vulnerable<br />
marine ecosystems in the<br />
South Pacific Ocean<br />
region.<br />
ZBD2010-41 Ocean acidification in<br />
fisheries habitat<br />
IPA2009-14 Bryozoan identificaiton<br />
guides<br />
ZBD2009-03 To evaluate the<br />
vulnerability of New<br />
Zeal<strong>and</strong> rhodolith species<br />
to environmental stressors<br />
<strong>and</strong> to characterise<br />
diversity of rhodolith beds.<br />
1. IDG 2009-01 field guide completion Completed McMillan 2011 a;b;c<br />
1. To revise <strong>and</strong> update the document “A guide to common deepsea<br />
invertebrates in New Zeal<strong>and</strong> waters (second edition)” to allow a third edition of<br />
this guide to be printed<br />
1. To develop & test spatial habitat modelling approaches for predicting<br />
distribution patterns of vulnerable marine ecosystmes in the convention Area of<br />
the South Pacific Regional Fisheries Management Organisation with agreed<br />
international partners.<br />
2. To collate datasets <strong>and</strong> evaluate modelling approaches which are likely to be<br />
useful to predict the distribtuion of vulnerable marine ecosystmes in the South<br />
pacific Ocean region.<br />
1. To assess the risks of ocean acidification to deep sea corals <strong>and</strong> deepwater<br />
fishery habitat<br />
2. To determine the carbonate mineralogy of selected deep sea corals found in<br />
the New Zeal<strong>and</strong> region<br />
3. To assess the distribution of deep sea coral species in the New Zeal<strong>and</strong><br />
region relative to improved knowledge of current <strong>and</strong> predicted aragonite <strong>and</strong><br />
calcite saturation horizons, assessment of potential locations vulnerable to deep<br />
water upwelling<br />
4. Through a literature search <strong>and</strong> analysis, determine the most appropriate tools<br />
to age <strong>and</strong> measure the effects of ocean acidification on deep sea habitatforming<br />
corals, <strong>and</strong> recommend the best approach for future assessments of the<br />
direct effects<br />
1. For each of ~50 species of common bryozoans, provide photos <strong>and</strong> text to<br />
allow for identification. Provide information on distribution <strong>and</strong> habitat (as far as<br />
is known) <strong>and</strong> further references for each species <strong>and</strong> on bryozoans as a whole.<br />
2. Submit these data for publication in the Ministry of Fisheries series New<br />
Zeal<strong>and</strong> <strong>Aquatic</strong> <strong>Environment</strong> <strong>and</strong> <strong>Biodiversity</strong> Research.<br />
1. To characterise the distribution <strong>and</strong> physical characteristics of two New<br />
Zeal<strong>and</strong> rhodolith beds <strong>and</strong> characterise the associated biodiversity.<br />
2. To measure the growth rates <strong>and</strong> evaluate the vulnerability of New Zeal<strong>and</strong><br />
species of rhodoliths to environmental stressors.<br />
357<br />
Completed Tracey et al. 2011a<br />
Ongoing<br />
analysis<br />
Ongoing<br />
analysis<br />
Tracey et al. 2011b<br />
Completed Smith & Gordon 2011<br />
Completed Nelson et al. <strong>2012</strong>
AEBAR <strong>2012</strong>: Appendices: Past projects<br />
BIODIVERSITY continued<br />
Project Code Project Title Specific Objectives Status Citation/s<br />
ZBD2009-10 Multi-species analysis of<br />
coastal marine<br />
connectivity<br />
ZBD2009-13 Ocean acidification impact<br />
on key nz molluscs<br />
ZBD2009-25 Predicting impacts of<br />
increasing rates of<br />
disturbance on functional<br />
diversity in marine benthic<br />
ecosystems<br />
1. Determine overall patterns of regional connectivity in a broad range of NZ<br />
coastal marine organisms to define the geographic units of genetic diversity for<br />
protection <strong>and</strong> the dispersal processes that maintain this diversity.<br />
2. <strong>Review</strong> previous studies of marine connectivity <strong>and</strong> population genetics in NZ<br />
coastal organisms to determine the preliminary range of patterns observed <strong>and</strong><br />
the principal gaps (taxonomic geographic <strong>and</strong> ecological) in our underst<strong>and</strong>ing.<br />
3. In a range of invertebrate <strong>and</strong> vertebrate marine organisms determine<br />
geographic patterns of genetic variation using st<strong>and</strong>ardised sampling <strong>and</strong><br />
molecular techniques.<br />
4. Analyse data across past <strong>and</strong> present studies to reveal both common <strong>and</strong><br />
unique patterns of connectivity around the NZ coastline <strong>and</strong> the locations of<br />
common barriers to dispersal.<br />
1. Controlled laboratory experiments will be used to determine the effect of pCO2<br />
levels that are predicted to occur in NZ waters over the next few decades on<br />
appropriate life history stages of at least two key NZ mollusc species. A number<br />
of response variables will be assessed.<br />
2. Implications of these responses to the local <strong>and</strong> broader ecosystems will be<br />
assessed.<br />
1. Further develop the l<strong>and</strong>scape ecological model of disturbance/recovery<br />
dynamics in marine benthic communities, incorporating habitat connectivity,<br />
based on existing model by Lundquist, Thrush, <strong>and</strong> Hewitt.<br />
2. Predict impacts of increasing rates of disturbance on rare species abundance,<br />
functional diversity, relative importance of biogenic habitat structure, <strong>and</strong><br />
ecosystem productivity.<br />
3. Use literature <strong>and</strong> expert knowledge to quantify rare species abundance,<br />
biomass, functional diversity, habitat structure, <strong>and</strong> productivity of various<br />
successional community types in the model.<br />
4.Field test predictions of the model in appropriate marine benthic communities<br />
where historical rates of disturbance are known, <strong>and</strong> benthic communities have<br />
been sampled.<br />
358<br />
Completed Gardner et al. 2010<br />
Ongoing<br />
analysis<br />
Ongoing<br />
analysis<br />
Cummings 2011; Cummings<br />
et al. 2011b<br />
Lundquist et al. 2010
AEBAR <strong>2012</strong>: Appendices: Past projects<br />
BIODIVERSITY continued<br />
Project Code Project Title Specific Objectives Status Citation/s<br />
ZBD2008-01 Biogenic large–habitat–<br />
former hotspots in the<br />
near-shore coastal zone<br />
(50–250 m); quantifying<br />
their location, identity,<br />
function, threats <strong>and</strong><br />
protection<br />
ZBD2008-05 Macroalgal diversity<br />
associated with soft<br />
sediment habitats<br />
ZBD2008-07 Carbonate sediments: the<br />
positive <strong>and</strong> negative<br />
effects of l<strong>and</strong>-coast<br />
interactions on functional<br />
diversity<br />
1. To collect <strong>and</strong> integrate existing knowledge on biogenic habitat-formers in the<br />
AEBAR <strong>2012</strong>: Appendices: Past projects<br />
BIODIVERSITY continued<br />
Project Code Project Title Specific Objectives Status Citation/s<br />
ZBD2008-11 Predicting changes in<br />
plankton biodiversity <strong>and</strong><br />
productivity of the EEZ in<br />
response to climate<br />
change induced ocean<br />
acidification<br />
ZBD2008-14 What <strong>and</strong> where should<br />
we monitor to detect longterm<br />
marine biodiversity<br />
<strong>and</strong> environmental<br />
changes-remote sensing,<br />
biota, context, inshore<br />
offshore workshop<br />
1. To document the spatial <strong>and</strong> inter-annual variability of coccolithophore<br />
abundance <strong>and</strong> biomass- <strong>and</strong> assess in terms of the phytoplankton abundancebiomass<br />
<strong>and</strong> community composition in sub-tropical <strong>and</strong> sub-Antarctic water.<br />
2. To document the seasonal <strong>and</strong> inter-annual variability of foraminifera <strong>and</strong><br />
pteropod abundance <strong>and</strong> biomass at fixed locations in sub-tropical <strong>and</strong> sub-<br />
Antarctic water by analysis of sediment trap material from time-series data<br />
collection.<br />
3. To document the spatial <strong>and</strong> seasonal distribution of the key coccolithophore<br />
species- Emiliana huxleyi- using both archived <strong>and</strong> ongoing ingestion of satellite<br />
images of Ocean Colour- <strong>and</strong> ground-truth the reflectance.<br />
4. To determine the sensitivity of- <strong>and</strong> response of E. huxleyi <strong>and</strong> other EEZ<br />
coccolithophores to pH under a range of realistic atmospheric CO2<br />
concentrations in perturbation experiments- using monocultures <strong>and</strong> mixed<br />
populations from in situ sampling.<br />
5. To document the spatial variability of diazotrophs (nitrogen-fixing organisms)<br />
<strong>and</strong> associated nitrogen fixation rate- <strong>and</strong> assess in terms of phytoplankton<br />
abundance- biomass <strong>and</strong> community composition in sub-tropical waters north of<br />
the STF.<br />
7. To determine the sensitivity of- <strong>and</strong> response of Trichodesmium spp. <strong>and</strong><br />
other diazotrophs to pH under a range of realistic atmospheric CO2<br />
concentrations in perturbation experiments using monocultures<br />
1. Identify the key questions to be addressed by long-term monitoring of marine<br />
biodiversity <strong>and</strong> environment.<br />
2. Identify appropriate monitoring indices, how they should be spatially<br />
distributed <strong>and</strong> their sampling frequency.<br />
3. Identify relevant existing monitoring programmes across the range of New<br />
Zeal<strong>and</strong> agencies <strong>and</strong> science providers <strong>and</strong> identify gaps.<br />
4. Provide those agencies setting environmental goals/ st<strong>and</strong>ards or research<br />
needs (MoRST, FRST, MFish, DoC, MfE, Commissioner for the <strong>Environment</strong>)<br />
with a thorough situational analysis, including a list of priority monitoring<br />
projects/plans.<br />
360<br />
Ongoing<br />
analysis<br />
Ongoing<br />
analysis<br />
Law et al. <strong>2012</strong>: Boyd & Law<br />
2011<br />
Livingston 2009
AEBAR <strong>2012</strong>: Appendices: Past projects<br />
BIODIVERSITY continued<br />
Project Code Project Title Specific Objectives Status Citation/s<br />
ZBD2008-15 Continuous plankton<br />
recorder project:<br />
implementation <strong>and</strong><br />
identification<br />
ZBD2008-20 Ross sea benthic<br />
ecosystem function:<br />
predicting consequences<br />
of shifts in food supply<br />
ZBD2008-22 Acidification <strong>and</strong><br />
ecosystem impacts in NZ<br />
<strong>and</strong> southern ocean<br />
waters (data collected<br />
during IPY).<br />
ZBD2008-23 Macroalgae diversty <strong>and</strong><br />
benthic community<br />
structure at the Balleny<br />
Isl<strong>and</strong>s<br />
1. To set up a time series of annual CPR data collection by deployment from a<br />
toothfish vessel on the annual summer transit between New Zeal<strong>and</strong> <strong>and</strong> the<br />
Ross Sea.<br />
2. To identify phytoplankton <strong>and</strong> zooplankton according to strict observation<br />
protocols determined by the SAHFOS[1] CPR Survey <strong>and</strong> SO-CPR[2].<br />
3. To enter species data, frequency <strong>and</strong> location along the transect into a<br />
spreadsheet that will allow spatial mapping of the plankton density <strong>and</strong><br />
distribution.<br />
4. To analyse the full dataset after 5 years of data collection to: (a) determine<br />
trends in the dataset <strong>and</strong> (b) compare results with Australian datasets available<br />
through SO-CPR.<br />
5. To evaluate the continuation of the programme<br />
1. To increase underst<strong>and</strong>ing of Ross Sea coastal benthic ecosystem function<br />
2. Conduct in situ investigations into responses to <strong>and</strong> utilisation of primary food<br />
sources by key species, at two contrasting coastal Ross Sea locations<br />
1. To assess the response of cocolithophorids, <strong>and</strong> their replacement by noncalcifying<br />
organisms during incubation under a range of dissolved CO2<br />
concentrations.<br />
2. To describe <strong>and</strong> characterise changes in abundance <strong>and</strong> biodiversity of<br />
microbial components of the samples incubated at sea under a range of<br />
dissolved CO2 concentrations.<br />
3.To predict the likely impacts of higher acidity on foodwebs <strong>and</strong> on carbon<br />
fixation under scenarios to be encountered in the Southern Ocean under<br />
forecasted trends associated with climate change.<br />
1. To describe <strong>and</strong> characterise macroalgae diversity from the Balleny Isl<strong>and</strong>s<br />
<strong>and</strong> the Western Ross Sea.<br />
2. To describe <strong>and</strong> quantify benthic community structure from one location at the<br />
Balleny Isl<strong>and</strong>s<br />
3. To complete anatomical <strong>and</strong> morphological investigations & molecular<br />
sequencing required for the identification of macroalgae samples from the<br />
Balleny Isl<strong>and</strong>s & western Ross Sea coastline to describe & characterise<br />
macroalgae diversity in Balleny Isds<br />
4. To process <strong>and</strong> analyse samples collected at the Balleny Isl<strong>and</strong>s- to analyse<br />
them using ICECUBE methodology- <strong>and</strong> compare results with those from other<br />
ICECUBE sampling locations along the Ross Sea coastline<br />
361<br />
Ongoing<br />
analysis<br />
Completed Cummings & Lohrer 2011;<br />
Cummings et al. 2011a;<br />
Lohrer et al. <strong>2012</strong><br />
Completed Maas et al. 2010b<br />
Completed Nelson et al. 2010
AEBAR <strong>2012</strong>: Appendices: Past projects<br />
BIODIVERSITY continued<br />
Project Code Project Title Specific Objectives Status Citation/s<br />
ZBD2008-27 Scoping investigation into<br />
New Zeal<strong>and</strong> abyss <strong>and</strong><br />
trench biodiversity<br />
ZBD2008-50 OS2020 Chatham Rise<br />
<strong>Biodiversity</strong> Hotspots<br />
IPY2007-02 International polar year<br />
census of antarctic marine<br />
life post-voyage<br />
analysis:Ross Sea -<br />
Southern Ocean<br />
<strong>Biodiversity</strong><br />
1. <strong>Review</strong> what is already known of abyssal, canyon <strong>and</strong> trench faunas in NZ.<br />
2. <strong>Review</strong> what is already known of abyssal, canyon <strong>and</strong> trench faunas around<br />
the world.<br />
3. Prioritise science questions <strong>and</strong> locations for exploration.<br />
4. Assess NZ capacity to sample at the required depths; identify sampling<br />
equipment needs.<br />
5. Design a suitable vessel-based sampling programme<br />
1. To improve underst<strong>and</strong>ing of the effects of trawl fishing in New Zeal<strong>and</strong> on the<br />
biodiversity of seamounts- knolls <strong>and</strong> hills.<br />
2. To describe differences in benthic biodiversity between northwestern <strong>and</strong><br />
eastern regions of the Chatham Rise<br />
3. To continue the time series of observations in the NW Chatham Rise to<br />
demonstrate recovery in terms of biodiversity<br />
4. To extend the observations on fished-unfished contrasts <strong>and</strong> recovery of<br />
fauna on protected seamounts to an oceanographically distinct location<br />
1. To measure <strong>and</strong> describe key elements of species distribution- abundance<br />
(density or biomass) & biodiversity for the Ross Sea <strong>and</strong> Southern Ocean for<br />
main habitats <strong>and</strong> key functional ecosystem roles- for major groups- virusesbacteria-<br />
archaea........<br />
2. To report on the diversity of Antarctic Cephalopoda (Octopus <strong>and</strong> Squid)including<br />
a complete inventory of taxa- & reports on ontogenetic & sexual<br />
variation in species- their systematics- diversity- distribution- life histories- &<br />
trophic importance.<br />
3. To Beak/Biomass Regression Equations<br />
4. Life cycle determination<br />
362<br />
Completed Lörz et al. <strong>2012</strong><br />
Completed Clark et al. 2009<br />
Completed Garcia 2010
AEBAR <strong>2012</strong>: Appendices: Past projects<br />
BIODIVERSITY continued<br />
Project Code Project Title Specific Objectives Status Citation/s<br />
IPY2007-01 International polar year<br />
census of antarctic marine<br />
life post-voyage<br />
analysis:Ross Sea -<br />
Southern Ocean<br />
<strong>Biodiversity</strong><br />
1. To measure seabed depth <strong>and</strong> rugosity using the multibeam system to identify<br />
topographic features such as bottom type, iceberg scouring, seamounts etc <strong>and</strong><br />
to determine areas for targeted benthic faunal sampling.<br />
2. To continue the analysis of opportunistic seabird <strong>and</strong> marine mammal<br />
distribution observations from this <strong>and</strong> previous BioRoss voyages <strong>and</strong> published<br />
records, <strong>and</strong> in relation to environmental variables.<br />
3. To identify <strong>and</strong> determine near-surface spatial distribution, diversity <strong>and</strong><br />
abundance of phytoplankton, <strong>and</strong> zooplankton, based on Continuous Plankton<br />
Recorder samples collected during transit to <strong>and</strong> from the Ross Sea.<br />
4. To collect & analyse data collected both underway, & at stations for salinity,<br />
temperature nutrient <strong>and</strong> chlorophyll a data, spot optical measurements with the<br />
SeaWiFS.<br />
5. To identify <strong>and</strong> determine the spatial distribution, abundance (biomass),<br />
diversity, <strong>and</strong> size structure of epipelagic, mesopelagic (<strong>and</strong> possibly<br />
bathypelagic) species using acoustics <strong>and</strong> net sampling.<br />
6. To identify <strong>and</strong> measure diversity, distribution & densities of mesozooplankton,<br />
macrozooplankton & meroplankton (as collected by all plankton sampling<br />
methods except transit CPR samples).<br />
7. To determine diversity, distribution & densities of viral, bacterial, phytoplankton<br />
& microzooplankton species in the water column.<br />
8. To determine the spatial distribution, abundance (biomass), diversity, <strong>and</strong> size<br />
structure of shelf <strong>and</strong> slope demersal fish species <strong>and</strong> associated invertebrate<br />
species using a demersal survey.<br />
9. To determine the diversity, abundance/density, spatial distribution, <strong>and</strong><br />
physical habitat associations of benthic assemblages across a body size<br />
spectrum from megafauna to bacteria, for shelf, slope, seamounts, <strong>and</strong> abyssal<br />
sites in Ross Sea.<br />
10. To describe trophic/ecosystem relationships in the Ross Sea ecosystem<br />
(pelagic <strong>and</strong> benthic, fish <strong>and</strong> invertebrates).<br />
11. Assess molecular taxonomy <strong>and</strong> population genetics of selected Antarctic<br />
fauna <strong>and</strong> flora to estimate evolutionary divergence within <strong>and</strong> among ocean<br />
basins in circumpolar species. Provide DNA barcoding.<br />
363<br />
Completed Allcock et al. 2009; 2010;<br />
Submitted; Alvaro et al.<br />
2011; Bowden et al. 2011a;<br />
In Prep; Clark et al. 2010a;<br />
Dettai et al. 2011; Eakin et al.<br />
2009; Eleaume et al. 2011; In<br />
Prep; Ghiglione et al. <strong>2012</strong>;<br />
Gordon 2000; Grotti et al.<br />
2008; Hanchet et al. 2008a;<br />
2008b; 2008c; 2008d;<br />
Hanchet 2009; 2010;<br />
Hanchet et al. In Press;<br />
Heimeier et al. 2010; Hemery<br />
et al. In prep; Koubbi et al.<br />
2011; Leduc et al. <strong>2012</strong>a; b;<br />
Linse et al. 2007; Lörz 2009;<br />
Lörz 2010a; 2010b; 2010c;<br />
Lörz & Coleman 2009; Lörz<br />
et al. 2007; 2009; <strong>2012</strong>a; b;<br />
In Press; In Prep; Maas et al.<br />
2010a; McMillan et al. <strong>2012</strong>.;<br />
Mitchell 2008; Nielsen et al.<br />
2009; Norkko et al. 2005;<br />
O'Driscoll 2009; O'Driscoll et<br />
al. 2009; 2010; O’Driscoll et<br />
al. In Press; O'Loughlin et al.<br />
2011; Pakhomov et al. 2011;<br />
Pinkerton et al. 2007a;<br />
Pinkerton et al. 2009a; b;<br />
Pinkerton et al. In review; In<br />
press; Schiaparelli et al.<br />
2006; 2008; 2010; Smith et<br />
al. 2011a; b; Stein <strong>2012</strong>;<br />
Strugnell et al. Submitted
AEBAR <strong>2012</strong>: Appendices: Past projects<br />
BIODIVERSITY continued<br />
Project Code Project Title Specific Objectives Status Citation/s<br />
ZBD2007-01 Chatham-Challenger<br />
Oceans 20/20 Post-<br />
Voyage<br />
1. To quantify in an ecological manner- the biological composition <strong>and</strong> function of<br />
the seabed at varying scales of resolution- on the Chatham Rise <strong>and</strong> Challenger<br />
Plateau<br />
2. To elucidate the relative importance of environmental drivers- including<br />
fishing- in determining sea bed community composition <strong>and</strong> structure.<br />
3. To determine if remote-sensed data (e.g. acoustic) <strong>and</strong> environmentally<br />
derived classification schemes (e.g. marine environmental classification system)<br />
can be utilized to predict bottom community composition- function <strong>and</strong> diversity<br />
4. To count- measure- <strong>and</strong> identify to species-level (where possible- otherwise to<br />
genus) all macro invertebrates (> 2 mm) <strong>and</strong> fish collected during Oceans 20/20<br />
voyages.<br />
5. To count- measure <strong>and</strong> identify to species-level (where possible- otherwise to<br />
genus or family) all meiofauna (> 2 mm) from multicore samples collected during<br />
the Oceans 20/20 voyages.<br />
6. To count- measure <strong>and</strong> identify to species- level (where possible- otherwise to<br />
genus or family) all fauna collected by hyper-benthic sled during the Oceans<br />
20/20 voyages.<br />
7. To count- measure- <strong>and</strong> identify to species-level all macrofauna observed on<br />
DTIS images collected during the Oceans 20/20 voyages. The number of<br />
biogenic features (burrows/mounds) <strong>and</strong> habitat (spatial) complexity should also<br />
be estimated.<br />
8. To count- measure- <strong>and</strong> identify to species-level (where possible- otherwise to<br />
genus or family) all macrofauna observed on DTIS video footage collected during<br />
the Oceans 20/20 voyages.<br />
9. To calculate <strong>and</strong> compare the performance of a suite of diversity measures<br />
(species <strong>and</strong> taxonomic-based) at varying levels of resolution.<br />
10. To estimate particle size composition <strong>and</strong> organic content of sediment<br />
samples. Sediment samples should be aggregated over the top 5 cm of<br />
sediment.<br />
11. To measure the bacterial biomass (top 2 cm) of the sediment <strong>and</strong> in the<br />
sediment surface water samples- collected during the Oceans 20/20 voyages<br />
12. To elucidate the relationships- patterns <strong>and</strong> contrasts in species composition-<br />
assemblages- habitats- biodiversity <strong>and</strong> biomass (abundance) both within <strong>and</strong><br />
between stations- strata <strong>and</strong> areas.<br />
13. To define habitats (biotic) encountered during the survey <strong>and</strong> assess their<br />
relative sensitivity to modification by physical disturbance- their recoverability<br />
<strong>and</strong> their importance to ecosystem function / production.<br />
14. To quantify the productivity- energy flow (trophic networks) <strong>and</strong> the energetic<br />
coupling (bentho pelagic or otherwise) of the area surveyed areas at various<br />
levels of resolution.<br />
364<br />
Completed Bowden 2011; Bowden et al.<br />
2011 ; In press; Bowden &<br />
Hewitt <strong>2012</strong>; Compton et al.<br />
<strong>2012</strong>; Coleman <strong>and</strong> Lörz<br />
2010; Hewitt et al. 2011a;<br />
2011b; Lörz 2011a; 2011b;<br />
Nodder et al. <strong>2012</strong>; Floerl et<br />
al. <strong>2012</strong>
AEBAR <strong>2012</strong>: Appendices: Past projects<br />
15. To assess the extent to which patterns of species distributions <strong>and</strong><br />
communities can be predicted using environmental data (including fishing)<br />
collected during the Ocean 20/20 voyages or held in other databases.<br />
16. To provide an interactive- high resolution mapping facility for displaying &<br />
plotting all data collected & derived indices. Includes environmental data- the<br />
abundance of species- indices of biomass or diversity- <strong>and</strong> statistically derived<br />
groupings<br />
17. To assess the extent to which acoustic- environmental- or other remotesensed<br />
data can provide cost-effective- reliable means of assessing biodiversity<br />
at the scale of the Oceans 20/20 surveys.<br />
18. To assess the extent to which the 2005 MEC <strong>and</strong> subsequent variants can<br />
provide cost-effective- reliable means of assessing biodiversity at the scale of the<br />
Oceans 20/20 surveys.<br />
19. Collating all information <strong>and</strong> analysis from all objectives- devise a series of<br />
statistically supported recommendations for surveying marine biodiversity in the<br />
future. Including- but may not be limited to- statistical analyses <strong>and</strong> modelling.<br />
BIODIVERSITY continued<br />
Project Code Project Title Specific Objectives Status Citation/s<br />
ZBD2006-02 Ongoing NABIS<br />
development<br />
As part of NABIS, users will be able to identify spatial information relating to the<br />
annual distribution (average distribution over the period of a year) of particular<br />
species within the waters around New Zeal<strong>and</strong> <strong>and</strong> in the terrestrial environment<br />
(including off shore isl<strong>and</strong>s) of New Zeal<strong>and</strong>. Users will also be able to<br />
interrogate metadata <strong>and</strong> attribute data related to the information layers<br />
presented. Users will employ NABIS to identify where a particular species is<br />
found, to identify what species are found within an area of interest, <strong>and</strong> be able<br />
to compare the spatial distribution of a particular species with other information<br />
layers.<br />
2. Some species may have notable changes in their spatial distribution<br />
throughout a year. For such species, users of NABIS will be able to view spatial<br />
information relating to the seasonal distribution of particular species within the<br />
waters around New Zeal<strong>and</strong> <strong>and</strong> in the terrestrial environment (including offshore<br />
isl<strong>and</strong>s) of New Zeal<strong>and</strong>. Users will also be able to interrogate metadata <strong>and</strong><br />
attribute data related to the information layers presented. For species with a<br />
seasonal component to their biological distribution, users will employ NABIS to<br />
identify where a particular species is found within the waters around New<br />
Zeal<strong>and</strong> <strong>and</strong> in the terrestrial environment (including off shore isl<strong>and</strong>s) of New<br />
Zeal<strong>and</strong> at a particular time of the year, to identify what species are found within<br />
an area of interest at a particular time of year, or be able to compare the<br />
distribution of a particular species at a particular time of year, with other<br />
information layers.<br />
3. To provide analysis of the data used in determining the hotspot distribution.<br />
365<br />
Completed Anderson 2007b
AEBAR <strong>2012</strong>: Appendices: Past projects<br />
BIODIVERSITY continued<br />
Project Code Project Title Specific Objectives Status Citation/s<br />
ZBD2006-03 Antarctic coastal marine<br />
systems<br />
ZBD2006-04 Chatham/challenger<br />
oceans 20/20<br />
ZBD2005-02 Marine <strong>Environment</strong><br />
Classification Project<br />
ZBD2005-09 Rocky reef ecosystems -<br />
how do they function?<br />
Integrating the roles of<br />
primary <strong>and</strong> secondary<br />
production, biodiversity<br />
<strong>and</strong> connectivity across<br />
coastal habitats<br />
1. Quantify patterns in benthic community structure <strong>and</strong> function at two coastal<br />
Ross Sea locations (Terra Nova Bay <strong>and</strong> Cape Evans).<br />
2. Quantify benthic community structure <strong>and</strong> function at selected locations in<br />
Terra Nova Bay <strong>and</strong> Cape Evans.<br />
1. To collect seabed fauna, sediment samples <strong>and</strong> photographic images along<br />
transects in the Chatham Rise <strong>and</strong> the Challenger Plateau, as determined by the<br />
sampling protocol described in the Voyage Programmes for Voyages 2 <strong>and</strong> 3 of<br />
the project. Multibeam data should be collected opportunistically as time allows.<br />
2. To describe the distribution of broad macro epifauna groups (I.D. level to be<br />
determined at sea during Surveys 2 & 3), their relative abundance, the substrate<br />
<strong>and</strong> habitat types, including representative photographic images of each sea-bed<br />
habitat <strong>and</strong> associated fauna along transects in the survey areas.<br />
3. To provide a description of the observed evidence of fishing along transects.<br />
4. To provide indicative measures of alpha biodiversity (richness, number of<br />
taxonomic groups) at appropriate scales within <strong>and</strong> between transects, <strong>and</strong><br />
between the Chatham Rise <strong>and</strong> the Challenger Plateau.<br />
5. To determine broad scale variability in sea-bed habitats <strong>and</strong> associated<br />
biodiversity within <strong>and</strong> between MEC classes at 20 class level.<br />
6. To process <strong>and</strong> archive biological samples <strong>and</strong> data into databases <strong>and</strong><br />
collections for future analysis in meeting the Overall Objectives above.<br />
1. Co-fund the Marine <strong>Environment</strong> Classification Project (being done by NIWA)<br />
with the Department of Conservation.<br />
1. To develop a qualitative numerical model of how New Zeal<strong>and</strong>’s rocky reef<br />
systems are functionally structured<br />
2. To quantify the effects of human predation, <strong>and</strong> environmental degradation<br />
across reef gradients – top-down, or bottom-up functioning?<br />
3. To advance our underst<strong>and</strong>ing of how subtidal reef systems are fuelled<br />
through primary <strong>and</strong> secondary production (from a range of sources), the role<br />
that biodiversity plays, <strong>and</strong> how this varies across different reef settings.<br />
4. To quantify how subtidal reef systems are linked with other habitats <strong>and</strong><br />
ecosystems at broader spatial scales, including the connectivity of MPAs with<br />
other habitats <strong>and</strong> areas.<br />
366<br />
Completed Cummings et al. 2003;<br />
2006b; 2008; Thrush &<br />
Cummings 2011; Thrush et<br />
al. 2010<br />
Completed Nodder 2008; Nodder et al.<br />
2011<br />
Completed Snelder et al. 2005; 2006;<br />
Leathwick et al. 2006a; b; c<br />
In the process MacDiarmid et al. In Press c<br />
of publication
AEBAR <strong>2012</strong>: Appendices: Past projects<br />
BIODIVERSITY continued<br />
Project Code Project Title Specific Objectives Status Citation/s<br />
ZBD2005-03 Tangaroa ross sea voyage 1. To test the feasibility of obtaining estimates of demersal fish relative<br />
abundance using cameras with <strong>and</strong> without flood lights in areas of high<br />
importance for the Ross Sea toothfish fishery (principally 800-1200 m).<br />
2. To utilise deepwater camera transects, supported by other direct sampling<br />
methods, to characterise the relative abundance, distribution, <strong>and</strong> diversity of<br />
demersal fish species (assuming Objective 1 yields satisfactory results) <strong>and</strong> of<br />
benthic macro-invertebrates, <strong>and</strong> to examine relationships between demersal<br />
fishes <strong>and</strong> benthic habitats/communities. Camera transects will be deployed<br />
opportunistically, with focus on the following high-priority areas (in order of high<br />
to low priority) wherever possible:<br />
i) Areas of the continental shelf break at depths of high importance for the<br />
toothfish fishery (principally 800-1200 m but also 600-800m & 1200-1500 m if<br />
time permits),<br />
ii) Shallow (50-200 m) water in the immediate vicinity of the Balleny Isl<strong>and</strong>s;<br />
iii) Deeper water in the vicinity of the Balleny Isl<strong>and</strong>s; iv) seamounts around <strong>and</strong><br />
between Scott Isl<strong>and</strong> <strong>and</strong> the Balleny Isl<strong>and</strong>s; <strong>and</strong> v) at other locations (< 600 m)<br />
as opportunity arises (e.g. around Scott Isl<strong>and</strong>, western Ross Sea, south-eastern<br />
Ross Sea).<br />
3. To collect specimens/tissues of selected benthic <strong>and</strong> pelagic organisms with<br />
priority in the vicinity of the Balleny Isl<strong>and</strong>s (<strong>and</strong> to the east/southeast, for pelagic<br />
specimens especially Antarctic krill species) <strong>and</strong> deliver specimens to other<br />
projects for stable isotope analysis in order to contribute to underst<strong>and</strong>ing of<br />
trophic relationships.<br />
4. To acquire a continuous acoustic survey of the water column, opportunistically<br />
undertake species verification of acoustic marks, integrate the acoustic marks<br />
<strong>and</strong> produce a GIS map of verified <strong>and</strong> unverified distributions of functionally<br />
important mesopelagic species (e.g. krill, Antarctic silverfish).<br />
5. To undertake routine identification <strong>and</strong> abundance estimates of marine<br />
mammal <strong>and</strong> seabird species <strong>and</strong> deliver raw <strong>and</strong> GIS summarised data to other<br />
related projects in order to generate spatially <strong>and</strong> temporally explicit population<br />
biomass <strong>and</strong> foraging distribution estimates for top air-breathing predators in the<br />
Ross Sea.<br />
6. To undertake automated water sampling in order to monitor the identities <strong>and</strong><br />
spatial <strong>and</strong> temporal distributions of plankton in the Ross Sea region <strong>and</strong> to allow<br />
ground-truthing of data collection from satellites (e.g. surface seawater<br />
temperature, <strong>and</strong> chlorophyll-a concentration).<br />
367<br />
In the process<br />
of publication<br />
MacDiarmid & Stewart In<br />
Press; Mitchell & MacDiarmid<br />
2006
AEBAR <strong>2012</strong>: Appendices: Past projects<br />
BIODIVERSITY continued<br />
Project Code Project Title Specific Objectives Status Citation/s<br />
ZBD2005-01 Balleny Isl<strong>and</strong>s Ecology<br />
Research, Tiama Voyage<br />
(2006)<br />
1. To characterise shallow benthic communities across a range of habitat<br />
settings around the Balleny Isl<strong>and</strong>s, utilising a range of data collection<br />
methodologies (including SCUBA-based rock-wall suspension feeder photo<br />
quadrats, SCUBA-based linear video transects, <strong>and</strong> drop camera photography),<br />
<strong>and</strong> to analyse community patterns with reference to possible<br />
physical/oceanographic, biological, <strong>and</strong>/or biogeographic influences on<br />
community structure.<br />
2. To characterise aspects of the marine food web of the Balleny Isl<strong>and</strong>s area,<br />
using stable isotope analysis of specimens from important functional groups, <strong>and</strong><br />
to make inferences about factors affecting ecosystem-scale trophodynamics in<br />
the Balleny Isl<strong>and</strong>s area <strong>and</strong> potential implications for the function of the wider<br />
ecosystem.<br />
3. To characterise the spatial <strong>and</strong> temporal distributions of higher-level consumer<br />
species (birds, seals <strong>and</strong> whales) <strong>and</strong> of dominant pelagic prey (i.e. krill swarms)<br />
by opportunistically recording all at-sea sightings, <strong>and</strong> by systematic observation<br />
of l<strong>and</strong>based top predators (birds <strong>and</strong> seals) while sailing along the coast of the<br />
isl<strong>and</strong>s.<br />
4. To collect <strong>and</strong> photograph <strong>and</strong>/or retain fish specimens from shallow benthic<br />
environments using a range of fishing methods, including food-baited fish traps,<br />
lightbaited fish traps, rotenone sampling, <strong>and</strong>/or baited lines.<br />
5. To continuously collect bathymetric data <strong>and</strong> water-column acoustic data (i.e.<br />
mesopelagic acoustic marks) throughout the voyage, using an acoustic sounder.<br />
6. To opportunistically collect a variety of data/materials during shore-based<br />
l<strong>and</strong>ings, including wherever possible: i) breast feathers from living penguins; ii)<br />
tissue samples/feathers/bones from dead seals/penguins/other sea birds; iii) seal<br />
scats; iv) visual estimates of adult <strong>and</strong> juvenile penguin numbers; v) visual<br />
assessments of penguin colony status; vi) photographs of penguin colonies; vii)<br />
sediment excavations of occupied <strong>and</strong> ab<strong>and</strong>oned colonies. (Where appropriate<br />
these data will contribute to Objective 2).<br />
368<br />
Terminated Smith 2006
AEBAR <strong>2012</strong>: Appendices: Past projects<br />
BIODIVERSITY continued<br />
Project Code Project Title Specific Objectives Status Citation/s<br />
ZBD2005-05 Long-term effects of<br />
climate variation <strong>and</strong><br />
human impacts on the<br />
structure <strong>and</strong> functioning<br />
of New Zeal<strong>and</strong> shelf<br />
ecosystems<br />
ZBD2004-01 Baseline information on<br />
the diversity <strong>and</strong> function<br />
of marine ecosystems<br />
ZBD2004-02 Ecosystem-scale trophic<br />
relationships: diet<br />
composition <strong>and</strong> guild<br />
structure of middle-depth<br />
fish on the chatham rise<br />
1. To estimate changes in marine productivity via fluctuations in ocean climate<br />
<strong>and</strong> terrestrial nutrient input over the last 1000 years.<br />
2. To assess <strong>and</strong> collate ex isting archaeological, historical <strong>and</strong> contemporary<br />
data (including catch records <strong>and</strong> stock assessments) on relevant components of<br />
the marine ecosystem to provide a detailed description of change in the shelf<br />
marine ecosystem in two areas of contrasting human occupation over last 1000<br />
years.<br />
3. To collect additional oral histories from Maori <strong>and</strong> non-Maori fishers <strong>and</strong><br />
shellfish gathers regarding the distribution, sizes <strong>and</strong> relative abundance<br />
(compared to present availability) of key fish <strong>and</strong> invertebrate stocks in both<br />
regions during the first half of the 20th century before the start of widespread<br />
modern industrial fishing.<br />
4. To build mass-balance ecosystem models (e.g. Ecopath) of the coastal <strong>and</strong><br />
shelf ecosystem in each area for five critical time periods: now, 60 years BP<br />
(before modern industrial fishing), 250 years BP (before European whaling <strong>and</strong><br />
sealing), 600 y BP (early Maori phase) <strong>and</strong> 1000 years BP (before human<br />
settlement).<br />
5. To use qualitative modelling techniques to determine the critical interactions<br />
amongst species <strong>and</strong> other ecosystem components in order to identify those that<br />
should be a priority for future research.<br />
1. To quantify, <strong>and</strong> compare, the macro-invertebrate assemblage composition of<br />
a number of<br />
seamounts at the southernmost end of the Kermadec volcanic arc.<br />
2. To compare the macro-invertebrate diversity of the southernmost end of the<br />
Kermadec<br />
volcanic arc with that of seamounts already sampled <strong>and</strong> reported on.<br />
1. To quantitatively characterise the diets of abundant middle-depth fish species<br />
on the Chatham Rise, by analysis of fish stomach contents collected from the<br />
January 2005, January 2006 <strong>and</strong> January 2007 Chatham Rise middle-depths<br />
trawl surveys.<br />
2. To quantitatively characterise Chatham Rise fish diets throughout the year, for<br />
a period of 24 months, by analysis of fish stomach contents collected<br />
opportunistically aboard industry vessels.<br />
3. To describe <strong>and</strong> examine patterns of diet variation within each fish species as<br />
a function of spatial, temporal, <strong>and</strong> environmental variables, <strong>and</strong> of fish size.<br />
4. To define <strong>and</strong> characterise trophic guilds for abundant fish species on the<br />
Chatham Rise, using multivariate analysis of fish diet data, <strong>and</strong> to analyse the<br />
nature <strong>and</strong> relative strength of potential trophic interactions between guilds.<br />
5. To create <strong>and</strong> populate a diets database to store all of the dietary information<br />
collected under Objectives 1 <strong>and</strong> 2, <strong>and</strong> for use in subsequent dietary studies.<br />
369<br />
In the process<br />
of publication<br />
Carroll et al. In Press;<br />
Jackson et al. In Press; Lalas<br />
et al. In Press a; b; Lalas &<br />
MacDiarmid In Press; Lorrey<br />
et al. In Press; MacDiarmid<br />
et al. In Press a; b; Maxwell<br />
& MacDiarmid In Press; Neil<br />
et al. In Press; Paul <strong>2012</strong>;<br />
Parsons et al. In Press;<br />
Pinkerton In Press; Smith<br />
2011<br />
Completed Rowden & Clark 2010; Smith<br />
et al. 2008<br />
Completed Connell et al. 2010; Dunn<br />
2009; Dunn et al. 2010a; b;<br />
c; Dunn et al. In press;<br />
Forman & Dunn 2010; Horn<br />
et al. 2010; Stevens & Dunn<br />
2010;
AEBAR <strong>2012</strong>: Appendices: Past projects<br />
BIODIVERSITY continued<br />
Project Code Project Title Specific Objectives Status Citation/s<br />
ZBD2004-05 Assessment <strong>and</strong> definition<br />
of the biodiversity of<br />
coralline algae of northern<br />
New Zeal<strong>and</strong><br />
ZBD2004-10 Development of<br />
bioindicators in coastal<br />
ecosystems<br />
ZBD2004-19 Ecological function <strong>and</strong><br />
critical trophic linkages in<br />
New Zeal<strong>and</strong> softsediment<br />
habitats<br />
ZBD2003-02 <strong>Biodiversity</strong> of Coastal<br />
Benthic Communities of<br />
the North Western Ross<br />
Sea.<br />
ZBD2003-03 <strong>Biodiversity</strong> of deepwater<br />
invertebrates <strong>and</strong> fish<br />
communities of the north<br />
western Ross Sea<br />
1. To assess <strong>and</strong> define the biodiversity of coralline algae in northern New<br />
Zeal<strong>and</strong>.<br />
2. To develop rapid identification tools for coralline algae using molecular<br />
sequencing data.<br />
3. To contribute representative material to the national Coralline Algal<br />
Collections.<br />
4. To produce ID guides to common coralline algae of northern New Zeal<strong>and</strong>.<br />
1. Investigate linkages between l<strong>and</strong> use patterns in catchments <strong>and</strong> nitrogen<br />
loading to recipient<br />
estuaries <strong>and</strong> coastal ecosystems<br />
2. Characterise isotopic signatures of selected bioindicator organisms in relation<br />
to different<br />
terrestrial nutrient loads; <strong>and</strong><br />
3. Validate the use of bioindicators using controlled laboratory <strong>and</strong> field<br />
experiments.<br />
1. Define the interactive effects of two functionally important benthic species in<br />
maintaining critical trophic linkages in soft-sediment systems from a series of<br />
integrated field experiments.<br />
2. Quantify effects of heart urchins (Echinocardium australe) on sediment<br />
properties- benthic primary production- <strong>and</strong> macrofaunal diversity through<br />
manipulative field experiments in Mahurangi Harbour.<br />
3. Test for interactions between pinnid bivalves (Atrina zel<strong>and</strong>ica) <strong>and</strong> heart<br />
urchins (Echinocardium australe) in field experiments- <strong>and</strong> measure their<br />
respective <strong>and</strong> combined contributions to sediment properties- benthic primary<br />
production- <strong>and</strong> macrofau na<br />
4. Determine the dependence of results from objectives 1 <strong>and</strong> 2 (functional<br />
contributions of Echinocardium <strong>and</strong> Atrina) in an environmental context by<br />
conducting experiments along an estuarine-coastal gradient.<br />
1. Quantify patterns in biodiversity <strong>and</strong> community structure in the coastal Ross<br />
Sea region<br />
2. Quantify biodiversity in benthic communities at selected locations in the Ross<br />
sea north of Terra Nova Bay<br />
3. Describe ecosystem function at selected locations in the Ross Sea north of<br />
Terra Nova Bay.<br />
1. To describe, <strong>and</strong> quantify the diversity of, the benthic macroinvertebrates <strong>and</strong><br />
fish assemblages of the Balleny Isl<strong>and</strong>s <strong>and</strong> adjacent seamounts, <strong>and</strong> to<br />
determine the importance of certain environmental variables influencing<br />
assemblage composition.<br />
370<br />
Completed Farr et al. 2009<br />
Completed Savage 2009<br />
Completed Lohrer et al. 2010<br />
Completed Cummings et al. 2003;<br />
2006a; 2010; De Domenico<br />
et al. 2006; Guidetti et al.<br />
2006; Norkko et al. 2004<br />
Completed Rowden et al. <strong>2012</strong>a; In<br />
Press; Mitchell & Clark 2004
AEBAR <strong>2012</strong>: Appendices: Past projects<br />
BIODIVERSITY continued<br />
Project Code Project Title Specific Objectives Status Citation/s<br />
ZBD2003-04 Fiordl<strong>and</strong> <strong>Biodiversity</strong><br />
Research Cruise<br />
ZBD2003-09 Macquarie Ridge<br />
Complex Research<br />
<strong>Review</strong><br />
ZBD2002-01 Ecology of Coastal<br />
Benthic Communities in<br />
Antarctica<br />
ZBD2002-02 Whose larvae is that?<br />
Molecular identification of<br />
planktonic larvae of the<br />
Ross Sea.<br />
ZBD2002-06A Impacts of terrestrial runoff<br />
on the biodiversity of<br />
rocky reefs<br />
1. How can ecotone boundaries be defined?<br />
2. If you have an ecotone boundary defining the edge of a commercial exclusion<br />
zone how wide is the transition zone across the boundary?<br />
3. If you have an area delineated as a marine protected area or a commercial<br />
exclusion zone, does it adequately represent the different habitats or biodiversity<br />
of the whole region?<br />
To review <strong>and</strong> summarise both biological <strong>and</strong> physical research carried out on or<br />
around the section of the Macquarie Ridge Complex that lies between New<br />
Zeal<strong>and</strong> <strong>and</strong> Macquarie Isl<strong>and</strong><br />
371<br />
Completed Wing 2005<br />
Completed Grayling 2004<br />
Objectives unknown Completed Schwarz et al. 2003; 2005;<br />
Thrush et al. 2006; Thrush &<br />
Cummings 2011; Cummings<br />
et al. 2003; Sharp et al.<br />
2010; Sutherl<strong>and</strong> 2008<br />
1. To use molecular sequencing tools in the taxonomic identification of<br />
cryptic/invasive marine<br />
2. To provide a molecular description <strong>and</strong> characterisation of gobies that are<br />
introduced (Arenigobius bifrenatus <strong>and</strong> Acentrogobius pflaumii) cryptogenic<br />
(Parioglossus marginalis) or native (eg.Favonigobius lentiginosus <strong>and</strong> F.<br />
expuisitus).<br />
3. To describe the molecular diversity of the above species throughout their<br />
native <strong>and</strong> introduced distributions- <strong>and</strong> characterise a range of the greatest<br />
potential invasive gobioid <strong>and</strong> blennioid species from the Australasian region.<br />
4. To develop molecular criteria to rapidly identify invasive or cryptogenic gobioid<br />
<strong>and</strong> blennioid fish<br />
1. Conduct field <strong>and</strong> laboratory experiments to determine relationships between<br />
sediment loading, epifaunal assemblages, <strong>and</strong> mortality of filter feeding<br />
invertebrates.<br />
2. Conduct field <strong>and</strong> laboratory experiments to identify the influence of sediment<br />
on early life stages of key grazers.<br />
3. Determine photosynthetic characteristics <strong>and</strong> survival of large brown<br />
seaweeds <strong>and</strong> understorey algal species in relation to a sediment gradient.<br />
Completed Sewell 2005; 2006; Sewell et<br />
al. 2006<br />
Completed Schwarz et al. 2006
AEBAR <strong>2012</strong>: Appendices: Past projects<br />
BIODIVERSITY continued<br />
Project Code Project Title Specific Objectives Status Citation/s<br />
ZBD2002-12 Molecular identification of<br />
cryptogenic/invasive<br />
marine species – gobies.<br />
ZBD2002-16 Joint New Zeal<strong>and</strong> <strong>and</strong><br />
Australian Norfolk Ridge<br />
ZBD2002-18 Quantitative survey of the<br />
intertidal benthos of<br />
Farewell Spit Golden Bay<br />
ZBD2001-02 Documentation of New<br />
Zeal<strong>and</strong> Seaweed<br />
ZBD2001-03 Ecology <strong>and</strong> biodiversity of<br />
coastal benthic<br />
communities in Antarctica.<br />
1. To use molecular sequencing tools in the taxonomic identification of<br />
cryptic/invasive marine species<br />
2. To provide a molecular description <strong>and</strong> characterisation of gobies that are<br />
introduced (Arenigobius bifrenatus <strong>and</strong> Acentrogobius pflaumii) cryptogenic<br />
(Parioglossus marginalis) or native (eg.Favonigobius lentiginosus <strong>and</strong> F.<br />
expuisitus).<br />
3. To describe the molecular diversity of the above species throughout their<br />
native <strong>and</strong> introduced distributions- <strong>and</strong> characterise a range of the greatest<br />
potential invasive gobioid <strong>and</strong> blennioid species from the Australasian region.<br />
4. To develop molecular criteria to rapidly identify invasive or cryptogenic gobioid<br />
<strong>and</strong> blennioid fish.<br />
1. To describe the marine biodiversity of the Norfolk Ridge <strong>and</strong> Lord Howe Rise<br />
seamount communities.<br />
2. To survey- sample <strong>and</strong> document the marine biodiversity <strong>and</strong> environmental<br />
data from seamounts on the Norfolk Ridge <strong>and</strong> Lord Howe Rise to a depth of at<br />
least 1-000m depth. (b) To preserve samples of fishes <strong>and</strong> invertebrates <strong>and</strong><br />
hold these in ac...<br />
1. To undertake a baseline survey of intertidal macrobenthic organisms at<br />
Farewell Spit Nature Reserve <strong>and</strong> adjacent flats.<br />
2. To undertake an initial field survey of Zostera distribution at Farewell Spit<br />
Nature Reserve <strong>and</strong> adjacent intertidal flats.<br />
3. To undertake a preliminary survey of sediment characteristics of the intertidal<br />
flats at Farewell Spit Nature Reserve <strong>and</strong> adjacent flats.<br />
1. To publish a regional algal flora of Fiordl<strong>and</strong> based on voucher herbarium<br />
specimens.<br />
2. To assemble a database of references <strong>and</strong> to review the current state of<br />
knowledge about New Zeal<strong>and</strong> macroalgae.<br />
1. To develop sampling protocols for estimating the relative abundance of algae<br />
<strong>and</strong> benthic invertebrates<br />
2. To quantify patterns in biodiversity <strong>and</strong> benthic community structure at two<br />
locations in McMurdo Sound<br />
3. To analyse Ross Isl<strong>and</strong> Sea-Level data.<br />
372<br />
Completed Lavery et al. 2006<br />
Completed Clark & Roberts 2008<br />
Completed Battley et al. 2005<br />
Completed Nelson et al. 2002<br />
Completed Norkko et al 2002<br />
ZBD2001-04 “Deep Sea New Zeal<strong>and</strong>” To help publish the book "Deep Sea New Zeal<strong>and</strong>" Completed Batson 2003<br />
ZBD2001-05 Crustose coralline algae of<br />
New Zeal<strong>and</strong><br />
1. To assess the biodiversity of crustose coralline algae in NZ using modern<br />
taxonomic methods <strong>and</strong> molecular sequence tools.<br />
2. To establish the NZ National Coralline Algal Collection.<br />
3. To produce identification guides to NZ species.<br />
Completed Harvey et al. 2005; Farr et<br />
al. 2009; Broom et al 2008
AEBAR <strong>2012</strong>: Appendices: Past projects<br />
BIODIVERSITY continued<br />
Project Code Project Title Specific Objectives Status Citation/s<br />
ZBD2001-06 <strong>Biodiversity</strong> of New<br />
Zeal<strong>and</strong>’s soft-sediment<br />
communities<br />
ZBD2001-10 Additional Research on<br />
<strong>Biodiversity</strong> of Seamounts<br />
MOF2000-01 Bryozoan thickets off<br />
Otago Peninsula<br />
ZBD2000-01 A review of current<br />
knowledge describing the<br />
biodiversity of the Ross<br />
Sea region<br />
ZBD2000-02 Exploration <strong>and</strong><br />
description of the<br />
biodiversity, in particular<br />
the benthic macrofauna, of<br />
the western Ross Sea<br />
1. To review the current knowledge of the biodiversity of macroinvertebrates <strong>and</strong><br />
macrophytes living in <strong>and</strong> on soft-sediment substrates in New Zeal<strong>and</strong>“s<br />
harbours- estuaries- beaches <strong>and</strong> to 1000 m water depth.<br />
2. To review existing published <strong>and</strong> unpublished sources of information on softsediment<br />
marine assemblages around New Zeal<strong>and</strong>.<br />
3. Using the results of Objective 1- identify gaps in the knowledge- hotspots of<br />
biodiversity- areas of particular vulnerability- <strong>and</strong> make recommendations on<br />
areas or assemblages that could be the subject of directed research in future<br />
years.<br />
Completed Rowden et al. <strong>2012</strong>b<br />
1. To determine the macro-invertebrate assemblage composition on Cavalii<br />
seamount, <strong>and</strong> adjacent seamount W1, by photographic transects <strong>and</strong><br />
epibenthic sled sampling.<br />
2. To determine the distniution of macro-invertebrate assemblages on the<br />
seamounts.<br />
3. To compare the macro-invertebrate species diversity of neighbouring<br />
seamounts.<br />
4. To evaluate <strong>and</strong> collect samples fiom suitable macro-invertebrate species for<br />
genetic analysis.<br />
5. To map bathymetry <strong>and</strong> habitat characteristics of the seamounts.<br />
6. To compare macro-invertebrate assemblage composition of the seamounts<br />
with nearby hard bottom low relief (under 100 m) on the slope, if suitable areas<br />
can be located.<br />
Completed Rowden et. al 2004<br />
Objectives unknown Completed Batson & Probert 2000<br />
1. To review <strong>and</strong> document existing published <strong>and</strong> unpublished information<br />
describing the biodiversity of the Ross Sea region.<br />
2. To identify <strong>and</strong> document Ross Sea region marine communities that are under<br />
high pressure or likely to come under high pressure from human activities in the<br />
near future.<br />
1. To utilise sampling opportunities provided by the presence of RV Tangaroa in<br />
the western Ross Sea in February / March 2001 to make collections of<br />
(primarily) benthic organisms as a contribution to the underst<strong>and</strong>ing of<br />
biodiversity in the region.<br />
2. To identify <strong>and</strong> document the organisms collected <strong>and</strong> provide for their proper<br />
storage in national collections.<br />
3. To describe the logistic constraints of working in the Ross Sea region, <strong>and</strong><br />
make recommendations for future research to improve underst<strong>and</strong>ing of<br />
biodiversity in the Ross Sea.<br />
373<br />
Completed Bradford-Grieve & Fenwick<br />
2001a; 2001b; Fenwick &<br />
Bradford-Grieve 2002a;<br />
2002b; Bradford-Grieve &<br />
Fenwick 2002; Varian 2005<br />
Completed Page et al. 2001
AEBAR <strong>2012</strong>: Appendices: Past projects<br />
BIODIVERSITY continued<br />
Project Code Project Title Specific Objectives Status Citation/s<br />
ZBD2000-03 The spatial extent <strong>and</strong><br />
nature of the<br />
bryozoan communities at<br />
Separation<br />
Point, Tasman Bay<br />
ZBD2000-04 Supplementary Research<br />
on <strong>Biodiversity</strong> of<br />
Seamounts<br />
ZBD2000-06 “The Living Reef: The<br />
Ecology of New Zeal<strong>and</strong>'s<br />
Rocky Reefs”<br />
ZBD2000-08 A review of current<br />
knowledge describing New<br />
Zeal<strong>and</strong>’s Deepwater<br />
Benthic <strong>Biodiversity</strong><br />
1. To assess the present state <strong>and</strong> extent of bryozoan communities around<br />
Separation Point.<br />
2. To characterise the bryozoan communities around Separation Point.<br />
1. To determine the biodiversity of seamounts of the southern Kermadec<br />
volcanic arc (Rumble V, Rumble 111, Brothers).<br />
2. To describe the distribution of fauna, with an emphasis on mapping the nature<br />
<strong>and</strong> extent, of biodiversity associated with hydrothermal vents.<br />
3. To compare the biodiversity of the thee seamounts, <strong>and</strong> adjacent slope.<br />
4. To collect samples from near the vent sources (if possible, as these are<br />
thought to be very localised) to measure chemical <strong>and</strong> thermal aspects of the<br />
environment<br />
374<br />
Completed Grange et al. 2003<br />
Completed Rowden et al. 2002 <strong>and</strong><br />
2003; Clark & O'Driscoll 2003<br />
1. Funding to support the publication of this book. Completed Andrew & Francis (Eds.)<br />
2003<br />
1. To review <strong>and</strong> document existing published <strong>and</strong> unpublished reports <strong>and</strong> data<br />
describing New Zeal<strong>and</strong>’s deepwater benthic biodiversity.<br />
2. To make recommendations on representative communities <strong>and</strong> potentially<br />
impacted communities that could be the subject of directed research.<br />
Completed Key 2002<br />
ZBD2000-09 Antarctic fish taxonomy 1. Ross Sea fishes processing <strong>and</strong> identification Completed Roberts & Stewart & 2001
References<br />
AEBAR <strong>2012</strong>: Appendices<br />
Abraham, E., 2008. Evaluating methods for estimating the incidental capture of New Zeal<strong>and</strong> sea lions, New Zeal<strong>and</strong> <strong>Aquatic</strong><br />
<strong>Environment</strong> <strong>and</strong> <strong>Biodiversity</strong> Report No. 15, 25 p.<br />
Abraham, E., 2010. Warp strike in New Zeal<strong>and</strong> trawl fisheries, 2004-05 to 2008-09, New Zeal<strong>and</strong> <strong>Aquatic</strong> <strong>Environment</strong> <strong>and</strong><br />
<strong>Biodiversity</strong> Report No. 60, 29 p.<br />
Abraham, E., 2011. Probability of Mild Traumatic Brain Injury for sea lions interacting with SLEDs, Unpublished Final Research<br />
Report for Ministry of Fisheries project SRP2011-03 (held by the Ministry of Fisheries, Wellington), 21 p.<br />
Abraham, E., Berkenbusch, K., Richard, Y., 2010. The capture of seabirds <strong>and</strong> marine mammals in New Zeal<strong>and</strong> noncommercial<br />
fisheries, New Zeal<strong>and</strong> <strong>Aquatic</strong> <strong>Environment</strong> <strong>and</strong> <strong>Biodiversity</strong> <strong>Review</strong>. No. 64, 52 p.<br />
Abraham, E., Kennedy, A., 2008. Seabird warp strike in the southern squid trawl fishery, 2004-05, New Zeal<strong>and</strong> <strong>Aquatic</strong><br />
<strong>Environment</strong> <strong>and</strong> <strong>Biodiversity</strong> Report No. 16, 39 p.<br />
Abraham, E., Thompson, F., 2009a. Capture of protected species in New Zeal<strong>and</strong> trawl <strong>and</strong> longline fisheries, 1998-99 to<br />
2006-07, New Zeal<strong>and</strong> <strong>Aquatic</strong> <strong>Environment</strong> <strong>and</strong> <strong>Biodiversity</strong> Report No. 32, 197 p.<br />
Abraham, E., Thompson, F., 2009b. Warp strike in New Zeal<strong>and</strong> trawl fisheries, 2004-05 to 2006-07, New Zeal<strong>and</strong> <strong>Aquatic</strong><br />
<strong>Environment</strong> <strong>and</strong> <strong>Biodiversity</strong> Report No. 33, 21 p.<br />
Abraham, E., Thompson, F., 2010. Summary of the capture of seabirds, marine mammals, <strong>and</strong> turtles in New Zeal<strong>and</strong><br />
commercial fisheries, 1998-99 to 2008-09, New Zeal<strong>and</strong> <strong>Aquatic</strong> <strong>Environment</strong> <strong>and</strong> <strong>Biodiversity</strong> Report No. 80., 172 p p.<br />
Abraham, E., Thompson, F., 2011a. Estimated capture of seabirds in New Zeal<strong>and</strong> trawl <strong>and</strong> longline fisheries, 2002-03 to<br />
2008-09, New Zeal<strong>and</strong> <strong>Aquatic</strong> <strong>Environment</strong> <strong>and</strong> <strong>Biodiversity</strong> Report No. 79., 74 p.<br />
Abraham, E., Thompson, F., 2011b. Summary of the capture of seabirds, marine mammals, <strong>and</strong> turtles in New Zeal<strong>and</strong><br />
commercial fisheries, 1998-99 to 2008-09, Unpublished Final Research Report for the Ministry of Fisheries project<br />
PRO2007-01 170 p p.<br />
Abraham, E., Thompson, F., Oliver, M., 2010. Summary of the capture of seabirds, marine mammals, <strong>and</strong> turtles in New<br />
Zeal<strong>and</strong> commercial fisheries, 1998-99 to 2007-08, New Zeal<strong>and</strong> <strong>Aquatic</strong> <strong>Environment</strong> <strong>and</strong> <strong>Biodiversity</strong> Report No. 45,<br />
148 p.<br />
Allcock, A., Barratt, I., Eleaume, M., Linse, K., Norman, M., Smith, P., Steinke, D., Stevens, D., Strugnell, J., 2010. Cryptic<br />
speciation <strong>and</strong> the circumpolarity debate: A case study on endemic Southern Ocean octopuses using the COI barcode<br />
of life. Deep Sea Research doi:10.1016/j.dsr2.2010.05.016.<br />
Allcock, A., Norman, M., Smith, P., Steinke, D., Stevens, D., Strugnell, J., 2009. Cryptic speciation <strong>and</strong> the circumpolarity<br />
debate: a case study on endemic Southern Ocean octopuses using the COI barcode of life, CAML Symposium,<br />
Genoap.<br />
Allcock, A., Others, Submitted. Bipolarity in marine invertebrates: myth or marvel. p.<br />
Alvaro, M., Blazewicz-Paszkowycz, M., Davey, N., Schiaparelli, S., 2011. Skin-digging tanaids: the unusal parasitic behaviour<br />
of Exspinia typica in Antarctic waters <strong>and</strong> worldwide deep basins. Antarctic Science 23: : 343-348.<br />
Anderson, O., 2004. Fish discards <strong>and</strong> non-target fish catch in the trawl fisheries for arrow squid, jack mackerel, <strong>and</strong> scampi in<br />
New Zeal<strong>and</strong> waters, New Zeal<strong>and</strong> Fisheries Assessment Report 2004/10, 61 p.<br />
Anderson, O., 2007a. Fish discards <strong>and</strong> non-target fish catch in the New Zeal<strong>and</strong> jack mackerel trawl fishery, 2001-02 to 2004-<br />
05., New Zeal<strong>and</strong> <strong>Aquatic</strong> <strong>Environment</strong> <strong>and</strong> <strong>Biodiversity</strong> Report No. 8, 36 p.<br />
Anderson, O., 2007b. NABIS biological distributions, Unpublished Final Research Report for Ministry of Fisheries Project<br />
ZBD2006-02, held by the Ministry of Fisheries. , 20 p.<br />
Anderson, O., 2008. Fish <strong>and</strong> invertebrate bycatch <strong>and</strong> discards in ling longline fisheries, 1998-2006, New Zeal<strong>and</strong> <strong>Aquatic</strong><br />
<strong>Environment</strong> <strong>and</strong> <strong>Biodiversity</strong> Report No. 23, 43 p.<br />
Anderson, O., 2009a. Fish discards <strong>and</strong> non-target fish catch in the New Zeal<strong>and</strong> orange roughy trawl fishery: 1999-2000 to<br />
2004-05, New Zeal<strong>and</strong> <strong>Aquatic</strong> <strong>Environment</strong> <strong>and</strong> <strong>Biodiversity</strong> Report No. 39, 40 p.<br />
Anderson, O., 2009b. Fish <strong>and</strong> invertebrate bycatch <strong>and</strong> discards in southern blue whiting fisheries, 2002–07, New Zeal<strong>and</strong><br />
<strong>Aquatic</strong> <strong>Environment</strong> <strong>and</strong> <strong>Biodiversity</strong> Report. No. 43, 42 p.<br />
Anderson, O., 2011. Fish <strong>and</strong> invertebrate bycatch <strong>and</strong> discards in orange roughy <strong>and</strong> oreo fisheries from 1990-91 until 2008-<br />
09, New Zeal<strong>and</strong> <strong>Aquatic</strong> <strong>Environment</strong> <strong>and</strong> <strong>Biodiversity</strong> Report No. 67, 60 p.<br />
Anderson, O., <strong>2012</strong>. Fish <strong>and</strong> invertebrate bycatch <strong>and</strong> discards in New Zeal<strong>and</strong> scampi fisheries from 1990–91 until 2009–10.,<br />
New Zeal<strong>and</strong> <strong>Aquatic</strong> <strong>Environment</strong> <strong>and</strong> <strong>Biodiversity</strong> Report No. 100, 65 p.<br />
Anderson, O., Gilbert, D., Clark, M., 2001. Fish discards <strong>and</strong> non-target catch in the trawl fisheries for orange roughy <strong>and</strong> hoki<br />
in New Zeal<strong>and</strong> waters for the fishing years 1990-91 to 1998-99, New Zeal<strong>and</strong> Fisheries Assessment Report 2001/16,<br />
57 p.<br />
Anderson, O., Smith, M., 2005. Fish discards <strong>and</strong> non-target fish catch in the New Zeal<strong>and</strong> hoki trawl fishery, 1999/2000 to<br />
2002/03., New Zeal<strong>and</strong> Fisheries Assessment Report 2005/03, 37 p.<br />
Andrew, N., Francis, M., 2003. The living Reef: the ecology of New Zeal<strong>and</strong>'s Living Reef. Criag Potton Publishing, Nelson, 283<br />
p.<br />
Ayers, D., Francis, M., Griggs, L., Baird, S., 2004. Fish bycatch in New Zeal<strong>and</strong> tuna longline fisheries, 2000-01 <strong>and</strong> 2001-02,<br />
New Zeal<strong>and</strong> Fisheries Assessment Report 2004/46, 47 p.<br />
Baird, S., 1994. Nonfish Species <strong>and</strong> Fisheries Interactions Working Group Report. , N.Z. Fisheries Assessment Working<br />
Group Report 94/1, N.Z. Ministry of Agriculture <strong>and</strong> Fisheries, Wellington, 54 p.<br />
Baird, S., 1995. Nonfish Species <strong>and</strong> Fisheries Interactions Working Group Report. , N.Z. Fisheries Assessment Working<br />
Group Report - April 1995. 95/1, N.Z. Ministry of Agriculture <strong>and</strong> Fisheries, Wellington, 24 p.<br />
Baird, S., 1996. Nonfish Species <strong>and</strong> Fisheries Interactions Working Group Report. , N.Z. Fisheries Assessment Working<br />
Group Report - May 1996. 96/1, N.Z. Ministry of Agriculture <strong>and</strong> Fisheries, Wellington, 34 p.<br />
Baird, S., 1997. Report on the incidental capture of nonfish species during fishing operations in New Zeal<strong>and</strong> waters,<br />
Unpublished Final Research Report for Ministry of Fisheries SANF01 contract, 15 p plus appendices on New Zeal<strong>and</strong><br />
fur seal-trawl fishery interaction (54 p) <strong>and</strong> seabird-tuna longline fishery interaction (34 p) p.<br />
Baird, S., 1999a. Determination of factors which affect nonfish bycatch in some New Zeal<strong>and</strong> fisheries, Unpublished Final<br />
Research Report for Ministry of Fisheries Project ENV9701 ─ Objective 3, 83 p.<br />
Baird, S., 1999b. Estimation of nonfish bycatch in commercial fisheries in New Zeal<strong>and</strong> waters, 1997-98, Unpublished Final<br />
Research Report for Objective 1 of Ministry of Fisheries Project ENV9801, 57 p.<br />
375
AEBAR <strong>2012</strong>: Appendices<br />
Baird, S., 2001. Estimation of the incidental capture of seabird <strong>and</strong> marine mammal species in commercial fisheries in New<br />
Zeal<strong>and</strong> waters, 1998-99, New Zeal<strong>and</strong> Fisheries Assessment Report 2001/14, 43 p.<br />
Baird, S., 2003. New Zeal<strong>and</strong> breeding seabirds: human-induced mortality ― a review, Unpublished Report prepared for the<br />
Ministry of Fisheries Project ENV2000/09, 74 p.<br />
Baird, S., 2004a. Estimation of the incidental capture of seabird <strong>and</strong> marine mammal species in commercial fisheries in New<br />
Zeal<strong>and</strong> waters, 1999-2000, New Zeal<strong>and</strong> Fisheries Assessment Report 2004/41, 56 p.<br />
Baird, S., 2004b. Incidental capture of seabird species in commercial fisheries in New Zeal<strong>and</strong> waters, 2000-01, New Zeal<strong>and</strong><br />
Fisheries Assessment Report 2004/58, 63 p.<br />
Baird, S., 2004c. Incidental capture of seabird species in commercial fisheries in New Zeal<strong>and</strong> waters, 2001-02. , New Zeal<strong>and</strong><br />
Fisheries Assessment Report 2004/60, 51 p.<br />
Baird, S., 2005a. Incidental capture of Phocarctos hookeri (New Zeal<strong>and</strong> sea lions) in New Zeal<strong>and</strong> commercial fisheries, 2002-<br />
03, New Zeal<strong>and</strong> Fisheries Assessment Report 2005/8, 17 p.<br />
Baird, S., 2005b. Incidental capture of Phocarctos hookeri (New Zeal<strong>and</strong> sea lions) in New Zeal<strong>and</strong> commercial fisheries, 2002-<br />
03, New Zeal<strong>and</strong> Fisheries Assessment Report 2005/9, 13 p.<br />
Baird, S., 2005c. Incidental capture of seabird species in commercial fisheries in New Zeal<strong>and</strong> waters, 2002/03., New Zeal<strong>and</strong><br />
Fisheries Assessment Report 2005/02, 50 p.<br />
Baird, S., 2005d. Incidental capture of New Zeal<strong>and</strong> fur seals (Arctocephalus forsteri) in commercial fisheries in New Zeal<strong>and</strong><br />
waters, 2000-01., New Zeal<strong>and</strong> Fisheries Assessment Report 2005-11, 34 p.<br />
Baird, S., 2005e. Incidental capture of New Zeal<strong>and</strong> fur seals (Arctocephalus forsteri) in commercial fisheries in New Zeal<strong>and</strong><br />
waters, 2002-03, New Zealad Fisheries Assessment Report 2005/12, 35 p.<br />
Baird, S., 2005f. Incidental capture of New Zeal<strong>and</strong> fur seals (Arctocephalus forsteri)in commercial fisheries in New Zeal<strong>and</strong><br />
waters, 2001-02, New Zeal<strong>and</strong> Fisheries Assessment Report 2005/12, 33 p.<br />
Baird, S., 2007. Incidental capture of cetaceans in commercial fisheries in New Zeal<strong>and</strong> waters 2003-04 <strong>and</strong> 2004-05, New<br />
Zeal<strong>and</strong> <strong>Aquatic</strong> <strong>Environment</strong> <strong>and</strong> <strong>Biodiversity</strong> Report. No. 13, 27 p.<br />
Baird, S., 2008a. Incidental capture of cetaceans in commercial fisheries in New Zeal<strong>and</strong> waters, 1994-95 to 2005-06, New<br />
Zeal<strong>and</strong> <strong>Aquatic</strong> <strong>Environment</strong> <strong>and</strong> Marine <strong>Biodiversity</strong> Report No. 21, 29 p.<br />
Baird, S., 2008b. Incidental capture of New Zeal<strong>and</strong> fur seals (Arctocephalus Jorsteri) in longline fisheries in New Zeal<strong>and</strong><br />
waters, 1994-95 to 2005-06. , New Zeal<strong>and</strong> <strong>Aquatic</strong> <strong>Environment</strong> <strong>and</strong> <strong>Biodiversity</strong> Report No. 20, 21 p.<br />
Baird, S., 2011. New Zeal<strong>and</strong> fur seals - summary of current knowledge, New Zeal<strong>and</strong> <strong>Aquatic</strong> <strong>Environment</strong> <strong>and</strong> <strong>Biodiversity</strong><br />
Report No. 72, 51 p.<br />
Baird, S., Bagley, N., Wood, B., Dunn, A., Beentjes, M., 2002. The spatial extent <strong>and</strong> nature of mobile bottom fishing methods<br />
within the New Zeal<strong>and</strong> EEZ, 1989-90 to 1998-99, Unpublished Final Research Report for Objective 1 of project<br />
ENV2000/05. p.<br />
Baird, S., Bradford, E., 1999. Factors that may influence the bycatch of nonfish species in some New Zeal<strong>and</strong> fisheries,<br />
Unpublished final Research Report completed for Objective 3 of Ministry of Fisheries Project ENV9801, 106 p.<br />
Baird, S., Bradford, E., 2000a. Factors that may have influenced bycatch of New Zeal<strong>and</strong> fur seals (Arctocephalus forsteri) in<br />
the west coast South Isl<strong>and</strong> hoki fishery, NIWA Technical Report 92, 35 p.<br />
Baird, S., Bradford, E., 2000b. Factors that may have influenced the capture of seabirds in New Zeal<strong>and</strong> tuna longline fisheries,<br />
NIWA Technical Report 93, 61 p.<br />
Baird, S., Doonan, L., 2005. Phocarctos hookeri (New Zeal<strong>and</strong> sea lions): incidental captures in New Zeal<strong>and</strong> commercial<br />
fisheries during 2000-2001 <strong>and</strong> in-season estimates of captures during squid trawling in SQU 6T in 2002., New Zeal<strong>and</strong><br />
Fisheries Assessment Report 2005/17, 18 p.<br />
Baird, S., Francis, M., Griggs, L., Dean, H., 1998. <strong>Annual</strong> review of bycatch in southern bluefin <strong>and</strong> related tuna longline<br />
fisheries in the New Zeal<strong>and</strong> 200 n. mile Exclusive Economic Zone, CCSBT-ERS/9806/31 (Report prepared for the<br />
Third Meeting of the Ecologically Related Species Working Group, Tokyo, 9-13 June 1998)p.<br />
Baird, S., Gilbert, D., 2010. Initial assessment of risk posed by trawl <strong>and</strong> longline fisheries to selected seabird taxa breeding in<br />
New Zeal<strong>and</strong> waters, New Zeal<strong>and</strong> <strong>Aquatic</strong> <strong>Environment</strong> <strong>and</strong> <strong>Biodiversity</strong> Report No. 50, 98 p.<br />
Baird, S., Griggs, L., 2005. Estimation of within-season chartered southern bluefin tuna (Thunnus maccoyii) longline seabird<br />
incidental captures, 2003, New Zeal<strong>and</strong> Fisheries Assessment Report 2OO5/01, 15 p.<br />
Baird, S., S<strong>and</strong>ers, B., Dean, H., Griggs, L., 1999. Estimation of nonfish bycatch in commercial fisheries in New Zeal<strong>and</strong><br />
waters, 1990-91 to 1993-94, Final Research Report for Ministry of Fisheries Project ENV9701 - Objective 1, 63 p.<br />
.<br />
Baird, S., Smith, M., 2007a. Incidental capture of seabird species in commercial fisheries in New Zeal<strong>and</strong> waters, 2003-04 <strong>and</strong><br />
2004-05, New Zeal<strong>and</strong> <strong>Aquatic</strong> <strong>Environment</strong> <strong>and</strong> <strong>Biodiversity</strong> Report No. 9, 108 p.<br />
Baird, S., Smith, M., 2007b. Incidental capture of New Zeal<strong>and</strong> fur seals (Arctocephalus forsteri) in commercial fisheries in New<br />
Zeal<strong>and</strong> waters, 2003-04 <strong>and</strong> 2004-05, New Zeal<strong>and</strong> <strong>Aquatic</strong> <strong>Environment</strong> <strong>and</strong> <strong>Biodiversity</strong> Report. No. 14, 98 p<br />
Baird, S., Smith, M., 2008. Incidental capture of seabird species in commercial fisheries in New Zeal<strong>and</strong> waters, 2005-06, New<br />
Zeal<strong>and</strong> <strong>Aquatic</strong> <strong>Environment</strong> <strong>and</strong> <strong>Biodiversity</strong> Report, No. 18, 124 p.<br />
Baird, S., Wood, B., 2010. Extent of coverage of 15 environmental classes within the New Zeal<strong>and</strong> EEZ by commercial trawling<br />
with seafloor contact, Unpublished Final Research Report for Objective 5 of project BEN2006/01. p.<br />
Baird, S., Wood, B., Bagley, N., 2009. The extent of trawling on or near the seafloor in relation to benthic-optimised marine<br />
environment classes within the New Zeal<strong>and</strong> EEZ, Unpublished Final Research Report for Objective 5 of project<br />
BEN200601. p.<br />
Baird, S., Wood, B., Bagley, N., 2011 Nature <strong>and</strong> extent of commercial fishing effort on or near the seafloor within the New<br />
Zeal<strong>and</strong> 200 n. Mile Exclusive Economic Zone, 1989-90 to 2004-05. , New Zeal<strong>and</strong> <strong>Aquatic</strong> <strong>Environment</strong> <strong>and</strong><br />
<strong>Biodiversity</strong> Report No. 73, 143 p.<br />
Baird, S., Wood, B., Clark, M., Bagley, N., McKenzie, A., 2006. Description of the spatial extent <strong>and</strong> nature of disturbances by<br />
bottom trawls in Chatham Rise <strong>and</strong> Southern Plateau fisheries, Unpublished Final Research Report for project<br />
ENV2003/03, 139 p.<br />
Baker, B., Cunningham, R., Hedley, G., King, S., 2008. Data collection of demographic, distributional <strong>and</strong> trophic information on<br />
the Westl<strong>and</strong> petrel to allow estimation of effects of fishing on population viability, Unpublished Final Research Report<br />
to the Ministry of Fisheries, 47 p.<br />
Baker, B., Hedley, G., Cunningham, R., 2010. Data collection of demographic, distributional, <strong>and</strong> trophic information on the<br />
flesh-footed shearwater to allow estimation of effects of fishing on population viability: 2009― 10 Field Season,<br />
Unpublished Final Research Report for the Ministry of Fisheries 62 p.<br />
376
AEBAR <strong>2012</strong>: Appendices<br />
Baker, G., Jensz, K., Cunningham, R., 2009. Data collection of demographic, distributional <strong>and</strong> trophic information on the whitecapped<br />
albatross to allow estimation of effects of fishing on population viability ― 2009 Field Season, Unpublished<br />
Research Report for the Ministry of Fisheries, 15 p.<br />
Ballara, S., Anderson, O., 2009. Fish discards <strong>and</strong> non-target fish catch in the trawl fisheries for arrow squid <strong>and</strong> scampi in New<br />
Zeal<strong>and</strong> waters, New Zeal<strong>and</strong> <strong>Aquatic</strong> <strong>Environment</strong> <strong>and</strong> <strong>Biodiversity</strong> Report No. 38, 102 p.<br />
Ballara, S., O’Driscoll, R., Anderson, O., 2010. Fish discards <strong>and</strong> non-target fish catch in the trawl fisheries for hoki, hake, <strong>and</strong><br />
ling in New Zeal<strong>and</strong> waters, New Zeal<strong>and</strong> <strong>Aquatic</strong> <strong>Environment</strong> <strong>and</strong> <strong>Biodiversity</strong> Report. No. 48, 100 p.<br />
Batson, P., 2003. Deep New Zeal<strong>and</strong>: Blue Water, Black Abyss. Canterbury University Press, Christchurch, 240 p.<br />
Batson, P., Probert, P.K., 2000. Bryozoan thickets off Otago Peninsula, New Zeal<strong>and</strong> Fisheries Assessment Report 2000/46,<br />
31 p.<br />
Battley, P., Melville, D., Schuckard, R., Ballance, P., 2005. Quantitative survey of the intertidal benthos of Farewell Spit, Golden<br />
Bay., Marine <strong>Biodiversity</strong> Biosecurity Report No. 7, 119 p.<br />
Beentjes, M., 2010. Toheroa survey of Oreti Beach, 2009, <strong>and</strong> review of historical surveys, New Zeal<strong>and</strong> Fisheries Assessment<br />
Report 2010/6, 40 p.<br />
Beentjes, M., Baird, S., 2004. <strong>Review</strong> of dredge fishing technologies <strong>and</strong> practice for application in New Zeal<strong>and</strong>, New Zeal<strong>and</strong><br />
Fisheries Assessment Report 2004/37, 40 p.<br />
Beentjes, M., Boubee, J., Jellyman, D., E, G., 2005. Non-fishing mortality of freshwater eels (Anguilla spp.). New Zeal<strong>and</strong><br />
Fisheries Assessment Report 2005/34, 38 p.<br />
Bentley, N., Davies, C., McNeill, S., Davies, N., 2004. A framework for evaluating spatial closures as a fisheries management<br />
tool., New Zeal<strong>and</strong> Fisheries Assessment Report 2004/25, 25 p.<br />
Black, J., Wood, R., Berthelsen, T., In Press. Monitoring New Zeal<strong>and</strong>’s trawl footprint for deepwater fisheries: 1989-1990 to<br />
2009-2010, New Zeal<strong>and</strong> <strong>Aquatic</strong> <strong>Environment</strong> <strong>and</strong> <strong>Biodiversity</strong> Report No. XX., xx p.<br />
Blackwell, R., 2010. Distribution <strong>and</strong> abundance of deepwater sharks in New Zeal<strong>and</strong> waters, 2000-01 to 2005-06, New<br />
Zeal<strong>and</strong> <strong>Aquatic</strong> <strong>Environment</strong> <strong>and</strong> <strong>Biodiversity</strong> Report No. 57, 51 p.<br />
Blackwell, R., Stevenson, M., 2003. <strong>Review</strong> of the distribution <strong>and</strong> abundance of deepwater sharks in New Zeal<strong>and</strong> waters,<br />
New Zeal<strong>and</strong> Fisheries Assessment Report 2003/40, 48 p.<br />
Booth, J., Baird, S., Stevenson, M., Bagley, N., Wood, B., 2002. <strong>Review</strong> of technologies <strong>and</strong> practices to reduce bottom trawl<br />
bycatch <strong>and</strong> seafloor disturbance in New Zeal<strong>and</strong>, Unpublished Fisheries Research Assessment Report prepared for<br />
the Ministry of Fisheries as completion of ENV2000/06, 61 p.<br />
Bowden, D., 2011. Benthic invertebrate samples <strong>and</strong> data from the Ocean Survey 20/20 voyages to the Chatham Rise <strong>and</strong><br />
Challenger Plateau, 2007, New Zeal<strong>and</strong> <strong>Aquatic</strong> <strong>Environment</strong> <strong>and</strong> <strong>Biodiversity</strong> Report No. 65, 40 p.<br />
Bowden, D., Schiaparelli, S., Clark, M., Rickard, G., 2011a. A lost world? Archaic crinoid-dominated assemblages on an<br />
Antarctic seamount. Deep Sea Research Part II: Topical Studies in Oceanography 58: 119-127.<br />
Bowden, D., Compton, T., Snelder, T., Hewitt, J., 2011b. Evaluation of the New Zeal<strong>and</strong> Marine <strong>Environment</strong> Classifications<br />
using Ocean Survey 20/20 data from Chatham Rise <strong>and</strong> Challenger Plateau. , New Zeal<strong>and</strong> <strong>Aquatic</strong> <strong>Environment</strong> <strong>and</strong><br />
<strong>Biodiversity</strong> Report No. 77, 27 p.<br />
Bowden, D., Hanchet, S., Marriott, P., In Prep. Population estimates of Ross Sea demersal fish: a comparison between video<br />
<strong>and</strong> trawl methods. (Submitted as short note to Fisheries Research).<br />
Bowden, D., Hewitt, J., <strong>2012</strong>. Recommendations for surveys of marine benthic biodiversity: outcomes from the Chatham-<br />
Challenger Ocean Survey 20/20 Post-Voyage Analyses Project New Zeal<strong>and</strong> <strong>Aquatic</strong> <strong>Environment</strong> <strong>and</strong> <strong>Biodiversity</strong><br />
Report, No. 91, 34 p.<br />
Bowden, D., Hewitt, J., Verdier, A.-L., Pallentin, A., In Press. The potential of multibeam echosounder data for predicting<br />
benthic invertebrate assemblages across Chatham Rise <strong>and</strong> Challenger Plateau, Draft Final Research Report Ministry<br />
of Fisheries, New Zeal<strong>and</strong>, Wellingtonp.<br />
Boyd, P., Law, C., 2011. An Ocean Climate Change Atlas for New Zeal<strong>and</strong> waters:A primer for a major new web-based tool to<br />
help predict how oceanic species will be affected by climate change, NIWA Information Series No. 79 ISSN 1174-264X,<br />
, 24 p.<br />
Bradford, E., 2002. Estimation of the variance of mean catch rates <strong>and</strong> total catches of non-target species in New Zeal<strong>and</strong><br />
fisheries., New Zeal<strong>and</strong> Fisheries Assessment Report 2002/54, 60 p.<br />
Bradford, E., 2003. Factors that might influence the catch <strong>and</strong> discards of non-target fish species on tuna long-lines, New<br />
Zeal<strong>and</strong> Fisheries Assessment Report 2003/57, 75 p.<br />
Bradford-Grieve, J., Fenwick, G., 2001a. A review of the current knowledge describing the biodiversity of the Balleny Isl<strong>and</strong>s,<br />
Unpublished Final Research Report to the Ministry of Fisheriesp.<br />
Bradford-Grieve, J., Fenwick, G., 2001b. A review of the current knowledge describing the biodiversity of the Ross Sea region,<br />
Unpublished Final Research Report to the Ministry of Fisheries, xxp.<br />
Bradford-Grieve, J., Fenwick, G. 2002. A review of the current knowledge describing the biodiversity of the Balleny Isl<strong>and</strong>s.<br />
FRR ZBD2000/01, xx p.<br />
Bradford-Grieve, J., Livingston, M.E., 2011. Spawning fisheries <strong>and</strong> the productivity of the marine environment off the west<br />
coast of the South Isl<strong>and</strong>, New Zeal<strong>and</strong>, New Zeal<strong>and</strong> <strong>Aquatic</strong> <strong>Environment</strong> <strong>and</strong> <strong>Biodiversity</strong> Report. 84, 136 p.<br />
Breen, P., 2005. Managing the effects of fishing on the environment what does it mean for the rock lobster (Jasus edwardsii)<br />
fishery?, New Zeal<strong>and</strong> Fisheries Assessment Report 2005/73, 45 p.<br />
Breen, P., 2008. Sea lion data for use in the population model for Project IPA200609. , Unpublished Final Research Report for<br />
Ministry of Fisheries, 30 March 2008 18 pp. plus Confidential Appendix of 16 p.<br />
Breen, P., Fu, D., Gilbert, D., 2010. Sea lion population modelling <strong>and</strong> management procedure evaluations, Unpublished<br />
Report for Project SAP2008/14, Objective 2: Presented to AEWG March 22 2010, Wellington, New Zeal<strong>and</strong>p.<br />
Breen, P., Fu, D., Gilbert, D., 2010. Sea lion population modelling <strong>and</strong> management procedure evaluations, Unpublished<br />
Report for Project SAP2008/14, Objective 2. Presented to AEWG March 22 2010, Wellington, New Zeal<strong>and</strong>.p.<br />
Breen, P., Kim, S., 2006. Exploring alternative management procedures for controlling bycatch of Hooker’s sea lions in the<br />
SQU 6T squid fishery, Unpublished Final Research Report For Ministry of Fisheries Project M0F2002/03L, Objective 3.<br />
Revision 5, 3 February 2006, 88 p.<br />
Broom, J., Hart, D., Farr, T., Nelson, W., Neill, K., Harvey, A., Woelkerling, W., 2008. Utility of psbA <strong>and</strong> nSSU for phylogenetic<br />
reconstruction in the Corallinales based on New Zeal<strong>and</strong> taxa. Molecular Phylogenetics <strong>and</strong> Evolution 46: 958-973.<br />
Carroll, E., Jackson, J., Paton, D., Smith, T., In Press. Estimating nineteenth <strong>and</strong> twentieth century right whale catches <strong>and</strong><br />
removals around east Australia <strong>and</strong> New Zeal<strong>and</strong>, New Zeal<strong>and</strong> <strong>Aquatic</strong> Enviornment <strong>and</strong> <strong>Biodiversity</strong> Report, xx p.<br />
377
AEBAR <strong>2012</strong>: Appendices<br />
Clark, M., Dunn, M., McMillan, P., Pinkerton, M., Stewart, A., Hanchet, S., 2010a. Latitudinal variation of demersal fish<br />
assemblages in the western Ross Sea. Antarctic Science 22 (6): 782-792.<br />
Clark, M., Watling, L., Rowden, A., Guinotte, J., Smith, C., 2010b. A global seamount classification to aid the scientific design of<br />
marine protected area networks. Journal of Ocean <strong>and</strong> Coastal Management 54: 19-36.<br />
Clark, M., Bowden, D., Baird, S., Stewart, R., 2010c. Effects of fishing on the benthic biodiversity of seamounts of the<br />
“Graveyard” complex, northern Chatham Rise, New Zeal<strong>and</strong> <strong>Aquatic</strong> <strong>Environment</strong> <strong>and</strong> <strong>Biodiversity</strong> Report, No. 46, 40<br />
p.<br />
Clark, M., O'Driscoll, R., 2003. Deepwater fisheries <strong>and</strong> aspects of their impact on seamount habitat in New Zeal<strong>and</strong>. Journal of<br />
Northwest Atlantic Fishery Science 31: 441−458.<br />
Clark, M., Roberts, C., 2008. Fish <strong>and</strong> invertebrate biodiversity on the Norfolk Ridge <strong>and</strong> Lord Howe Rise, Tasman Sea<br />
(NORFANZ voyage, 2003), New Zeal<strong>and</strong> <strong>Aquatic</strong> <strong>Environment</strong> <strong>and</strong> <strong>Biodiversity</strong> Report. No. 28, 131 p.<br />
Clark, M., Rowden, A., 2009. Effect of deepwater trawling on the macro-invertebrate assemblages of seamounts on the<br />
Chatham Rise, New Zeal<strong>and</strong>. Deep Sea Research I 56: 1540-1554.<br />
Clark, M., Tracey, D., Pallentin, A., Schnabel, K., Anderson, O., Bowden, D., 2009 Voyage report of a survey of “seamounts” on<br />
the northwest <strong>and</strong> southeast Chatham Rise (TAN0905), Unpublished report available from NIWA, Wellington, 49 p.<br />
Clark, M., Williams, A., Rowden, A., Hobday, A., Consalvey, M., 2011 Development of seamount risk assessment: application<br />
to the ERAEF approach to Chatham Rise seamount features., New Zeal<strong>and</strong> <strong>Aquatic</strong> <strong>Environment</strong> <strong>and</strong> <strong>Biodiversity</strong><br />
Report No. 74, 18 p p.<br />
Clement, D., Mattlin, R., 2010. Abundance, distribution <strong>and</strong> productivity of Hector’s (<strong>and</strong> Maui’s) dolphins, Unpublished Final<br />
Research report for the Ministry of Fisheriesp.<br />
Cole, R., Stevenson, M., Hanchet, S., Gorman, R., Rickard, G., Morrisey, D., H<strong>and</strong>ley, S., 2007. Information on benthic impacts<br />
in support of the Southern Blue Whiting Fishery Plan, Unpublished Final Research Report for Ministry of Fisheries<br />
Research Project ZBD2005-16, Objectives 1-6p.<br />
Coleman, C., Lörz, A., 2010. A new species of Camacho (Crustacea, Amphipoda, Aoridae) from the Chatham Rise, New<br />
Zeal<strong>and</strong>. Zeitschrift fűr Zoologische Systematik und Evolutionsforschung 86 (1): 33-40.<br />
Compton, T., Bowden, D., Pitcher, R., Hewitt, J., Ellis, N., <strong>2012</strong>. Biophysical patterns in benthic assemblage composition across<br />
contrasting continental margins off New Zeal<strong>and</strong>. Journal of Biogeography: doi:10.1111/j.1365-2699.<strong>2012</strong>.02761.x.<br />
Connell, A., Dunn, M., Forman, J., 2010. Diet <strong>and</strong> dietary variation of New Zeal<strong>and</strong> hoki Macruronus novaezel<strong>and</strong>iae. New<br />
Zeal<strong>and</strong> Journal of Marine <strong>and</strong> Freshwater Research 44 (4): 289 - 308.<br />
Cryer, M., Coburn, R., Hartill, B., O’Shea, S., Kendrick, T., Doonan, I., 1999. Scampi stock assessment for 1998 <strong>and</strong> an<br />
analysis of the fish <strong>and</strong> invertebrate bycatch of scampi trawlers, New Zeal<strong>and</strong> Fisheries Assessment Research<br />
Document 99/4, 74 p.<br />
Cryer, M., Hartill, B., 2002. Relative impacts on benthic invertebrate community structure of trawl fisheries for scampi <strong>and</strong> finfish<br />
in the Bay of Plenty, Unpublished Final Research Report for Ministry of Fisheries Research Project ENV2000/05<br />
Objective 2, 28 p.<br />
Cryer, M., Nodder, S., Thrush, S., Lohrer, A., Gorman, R., Vopel, K., Baird, S., 2004. The effects of trawling <strong>and</strong> dredging on<br />
bentho-pelagic coupling processes in the New Zeal<strong>and</strong> EEZ., Draft New Zeal<strong>and</strong> Fisheries Assessment Report<br />
2004/xx., 66 p.<br />
Cryer, M., O’Shea, S., Gordon, D., Kelly, M., Drury, J., Morrison, M., Hill, A., Saunders, H., Shankar, U., Wilkinson, M., Foster,<br />
G., 2000. Distribution <strong>and</strong> structure of benthic invertebrate communities between North Cape <strong>and</strong> Cape Reinga<br />
Unpublished Final Research Report for Ministry of Fisheries Research Project ENV1998-05 Objectives 1-4p.<br />
Cummings, V., 2011. Ocean acidification: impacts on key NZ molluscs, Unpublished Progress Report for ZBD2009-13, 6 p.<br />
Cummings, V., Lohrer, D., 2011a. Ross Sea ecosystem function: predicting consequences of shifts in food supply, Unpublished<br />
Final Research Report for Ministry of fisheries Project ZBD2008-20, held by the Ministry of Fisheries, 53 p<br />
Cummings, V., Hewitt, J., Van Rooyen, A., Currie, K., Beard, S., Thrush, S., Norkko, J., Barr, N., Heath, P., Halliday, J.,<br />
Sedcole, R., Gomez, A., McGraw, C., Metcalf, V., 2011b. Ocean acidification at high latitudes: potential effects on<br />
functioning of the Antarctic bivalve Laternula elliptica. PLoS ONE 6 (1): e16069.<br />
doi:16010.11371/journal.pone.0016069.<br />
Cummings, V., Thrush, S., Andrew, N., Norkko, A., Funnell, G., Budd, R., Hewitt, J., Gibbs, M., Mercer, S., Marriott, P.,<br />
Anderson, O., 2003. Ecology <strong>and</strong> biodiversity of coastal benthic communities in McMurdo Sound, Ross Sea: emerging<br />
results, Unpublished Final Research Report for the Ministry of Fisheries, xx p.<br />
Cummings, V., Thrush, S., Chiantore, M., Hewitt, J., Cattaneo-Vietti, R., 2010. Macrobenthic communities of the north western<br />
Ross Sea shelf: links to depth, sediment characteristics <strong>and</strong> latitude. Antarctic Science 22 (6): 793-804.<br />
Cummings, V., Thrush, S., Marriott, P., Funnell, G., Norkko, A., Budd, R., 2008. Antarctic coastal marine ecosystems<br />
(ICECUBE), Unpublished Final Research Report for Ministry of Fisheries Research Project, 73 p.<br />
Cummings, V., Thrush, S., Norkko, A., Andrew, N., Hewitt, J., Funnell, G., Schwarz, A.-M., 2006a. Accounting for local scale<br />
variability in benthos: implications for future assessments of latitudinal trends in the coastal Ross Sea. Antarctic<br />
Science 18 (4): 633-644.<br />
Cummings, V., Thrush, S., Schwarz, A.-M., Funnell, G., Budd, R., 2006b. Ecology of coastal benthic communities of the<br />
northwestern Ross Sea., New Zeal<strong>and</strong> <strong>Aquatic</strong> <strong>Environment</strong> <strong>and</strong> <strong>Biodiversity</strong> Report. No. 6, 67 p.<br />
Currey, R., Boren, L., Sharp, B., Peterson, D., <strong>2012</strong>. A risk assessment of threats to Maui’s dolphins, Ministry for Primary<br />
Industries <strong>and</strong> Department of Conservation, Wellington, 51 p.<br />
De Domenico, F., Chiantore, M., Buongiovanni, S., Paola Ferranti, M., Ghione, S., Thrush, S., Cummings, V., Hewitt, J.,<br />
Kroeger, K., Cattaneo-Vietti, R., 2006. Latitude versus local effects on echinoderm assemblages along the Victoria<br />
L<strong>and</strong> coast, Ross Sea, Antarctica. Antarctic Science 18 (4): 655-662.<br />
Dettai, (+45 authors), 2011. DNA barcoding <strong>and</strong> molecular systematics of the benthic <strong>and</strong> demersal organisms of the<br />
CEAMARC survey. Polar Science 5 298-312.<br />
Doonan, I., 1995. Incidental catch of Hooker's sea lion in the southern trawl fishery for squid, summer 1994, N.Z. Fisheries<br />
Assessment Research Document 95/22, 13 p.<br />
Doonan, I., 1998. Estimation of sealion captures in southern fisheries in 1998. Final Research Report for Ministry of Fisheries<br />
Research Project ENV1997/01 Objective 2, 7 p.<br />
Doonan, I., 2001. Estimation of Hooker's sea lion, Phocarctos hookeri, captures in the southern squid trawl fisheries, 2001.,<br />
New Zeal<strong>and</strong> Fisheries Assessment Report 2001/67, 10 p.<br />
Doonan, I.J., 2000. Estimation of Hooker's sea lion, Phocarctos hookeri, captures in the southern squid trawl fisheries in 2000,<br />
New Zeal<strong>and</strong> Fisheries Assessment Report 2000/41, 11 p.<br />
378
AEBAR <strong>2012</strong>: Appendices<br />
Duckworth, K., 1995. Analyses of factors which influence seabird bycatch in the Japanese southern bluefin tuna longline fishery<br />
in New Zeal<strong>and</strong> waters, 1989-93, New Zeal<strong>and</strong> Fisheries Assessment Report 1995/26, 59 p.<br />
Dunn, M., 2009 Feeding habits of the ommastrephid squid Nototodarus sloanii on the Chatham Rise, New Zeal<strong>and</strong>. Journal of<br />
marine <strong>and</strong> Freshwater Research 43: 1103-1113<br />
Dunn, M., Connell, A., Forman, J., Stevens, D., Horn, P., 2010a. Diet of Two Large Sympatric Teleosts, the Ling (Genypterus<br />
blacodes) <strong>and</strong> Hake (Merluccius australis). PLoS ONE 5 (10): e13647. doi:13610.11371/journal.pone.0013647<br />
Dunn, M., Griggs, L., Forman, J., PL, H., 2010b. Feeding habits <strong>and</strong> niche separation among the deep-sea chimaeroid fishes<br />
Harriotta raleighana, Hydrolagus bemisi <strong>and</strong> Hydrolagus novaezeal<strong>and</strong>iae Marine Ecology Progress Series 407: 209-<br />
225.<br />
Dunn, M., Szabo, A., McVeagh, M., Smith, P., 2010c. The diet of deepwater sharks <strong>and</strong> the benefits of using DNA identification<br />
of prey. Deep-Sea Research Part 1 57 (7): 923-930.<br />
Dunn, M., Hurst, R., Renwick, J., Francis, R., Devine, J., McKenzie, A., 2009. Fish abundance <strong>and</strong> climate trends in New<br />
Zeal<strong>and</strong>, New Zeal<strong>and</strong> <strong>Aquatic</strong> <strong>Environment</strong> <strong>and</strong> <strong>Biodiversity</strong> Report. No. 31, 75 p.<br />
Dunn, M., PL, H., Connell, A., Stevens, D., Forman, J., Pinkerton, M., Griggs, L., Notman, P., B, W., In Press. Ecosystem-scale<br />
trophic relationships: diet composition <strong>and</strong> guild structure of middle-depth fish on the Chatham Rise., New Zeal<strong>and</strong><br />
<strong>Aquatic</strong> <strong>Environment</strong> <strong>and</strong> <strong>Biodiversity</strong> Report, xx p.<br />
Eakin, R., Eastman, J., Near, T., 2009. A new species <strong>and</strong> a molecular phylogenetic analysis of the Antarctic Fish Genus<br />
Pogonophryne (Notothenioidei: Artedidraconidae). Copeia No. 4: 705-713.<br />
Eléaume, M., Hemery, V., Bowden, D., Roux, M., 2011. A large new species of the genus Ptilocrinus (Echinodermata,<br />
Crinoidea, Hyocrinidae) from Antarctic seamounts. Polar Biology, DOI: 10.1007/s00300-011-0993-2.<br />
Eleaume, M., Hemery, V., Roussel, S., S, S., Steinke, D., Strugnell, J., Hibberd, T., Bohn, J., Riddle, M., Ameziane, N., In Prep.<br />
Southern Ocean crinoid diversity patterns <strong>and</strong> processes. Polar Biology<br />
Farr, T., Broom, J., Hart, D., Neill, K., Nelson, W., 2009. Common coralline algae of northern New Zeal<strong>and</strong>: an identification<br />
guide, NIWA Information Series No. 70, 120 p.<br />
Fenaughty, J., Stevens, D., Hanchet, S., 2003. Diet of the Antarctic toothfish (Dissostichus mawsoni) from the Ross Sea,<br />
Antarctica (Subarea 88.1). CCAMLR Science 10: 113-123.<br />
Fenwick, G., Bradford-Grieve, J., 2002a. Human pressures on Ross Sea region marine communities: recommendations for<br />
future research, Unpublished Final Research Report for the Ministry of Fisheries, xx p.<br />
Fenwick, G., Bradford-Grieve, J., 2002b. Recommendations for future directed research to describe the biodiversity of the Ross<br />
Sea region, Unpublished Final Research Report for the Ministry of Fisheries, xx p.<br />
Fletcher, D., Mackenzie, D., Dillingham, P., 2008. Modelling of impacts of fishing-related mortality on NZ seabird populations,<br />
Unpublished Final Research Report on ENV2004/05, xx p.<br />
Floerl, O., J, H., Bowden, D., <strong>2012</strong>. Chatham-Challenger OS 20/20 Post Voyage Analyses: (ZBD2007-01) Objective 9- Patterns<br />
in species composition. , New Zeal<strong>and</strong> <strong>Aquatic</strong> <strong>Environment</strong> <strong>and</strong> <strong>Biodiversity</strong> Report No. 97, 40 p.<br />
Forman, J., Dunn, MR, 2010. The influence of ontogeny <strong>and</strong> environment on the diet of lookdown dory, Cyttus traversi New<br />
Zeal<strong>and</strong> Journal of Marine <strong>and</strong> Freshwater Research 44 (4): 329-342.<br />
Forrest, B., Keeley, N., Gillespie, P., Hopkins, G., Knight, B., Govier, D., 2007. <strong>Review</strong> of the Ecological Effects of Marine<br />
Finfish Aquaculture: Final Report, Unpublished Cawthron Report for the Ministry of Fisheries, 80 p.<br />
Francis, M., Griggs, L., Baird, S., 2001. Pelagic shark bycatch in the New Zeal<strong>and</strong> tuna longline fishery. Marine <strong>and</strong> Freshwater<br />
Research 52: 165-178.<br />
Francis, M., Griggs, L., Baird, S., 2004. Fish bycatch in New Zeal<strong>and</strong> tuna longline fisheries, 1998-99 to 1999-2000, New<br />
Zeal<strong>and</strong> Fisheries Assessment Report 2004/22, 62 p.<br />
Francis, M., Griggs, L., Baird, S., Murray, T., Dean, H., 1999. Fish bycatch in New Zeal<strong>and</strong> tuna longline fisheries, NIWA<br />
Technical Report 55, 70 p.<br />
Francis, M., Griggs, L., Baird, S., Murray, T., Dean, H., 2000. Fish bycatch in New Zeal<strong>and</strong> tuna longline fisheries, 1988-89 to<br />
1997-98, NIWA Technical Report 76, 79 p.<br />
Francis, M., Lyon, W., <strong>2012</strong>. <strong>Review</strong> of research <strong>and</strong> monitoring studies on New Zeal<strong>and</strong> sharks, skates, rays <strong>and</strong> chimaeras,<br />
2008−<strong>2012</strong>., New Zeal<strong>and</strong> <strong>Aquatic</strong> <strong>Environment</strong> <strong>and</strong> <strong>Biodiversity</strong> Report No. 102, 70 p.<br />
Francis, M., Lyon, W., Jones, E., Notman, P., Parkinson, D., Getzlaff, C., <strong>2012</strong>. Rig nursery grounds in New Zeal<strong>and</strong>: a review<br />
<strong>and</strong> survey, New Zeal<strong>and</strong> <strong>Aquatic</strong> <strong>Environment</strong> <strong>and</strong> <strong>Biodiversity</strong> Report No. 95p.<br />
Francis, M., Smith, M., 2010. Basking shark (Cetorhinus maximus) bycatch in New Zeal<strong>and</strong> fisheries, 1994-95 to 2007-08, New<br />
Zeal<strong>and</strong> <strong>Aquatic</strong> <strong>Environment</strong> <strong>and</strong> <strong>Biodiversity</strong> Report No. 49, 57 p.<br />
Francis, R., <strong>2012</strong>. Fisheries Risks to the Population Viability of White-capped Albatross Thalassarche steadi, New Zeal<strong>and</strong><br />
<strong>Aquatic</strong> <strong>Environment</strong> <strong>and</strong> <strong>Biodiversity</strong> Report. No. 104, 24 p.<br />
Francis, R., Bell, E., 2010. Fisheries risks to the population viability of black petrel (Procellaria parkinsoni), New Zeal<strong>and</strong><br />
<strong>Aquatic</strong> <strong>Environment</strong> <strong>and</strong> <strong>Biodiversity</strong> Report No. 51, 57 p.<br />
Francis, R., Hadfield, M., Bradford-Grieve, J., Renwick, J., Sutton, P., 2005. <strong>Environment</strong>al predictors of hoki year-class<br />
strengths: an update, New Zeal<strong>and</strong> Fisheries Assessment Report 2005/58p.<br />
Garcia, A., 2010. Comparative study of the morphology <strong>and</strong> anatomy of octopuses of the family Octopodidae. Auckl<strong>and</strong><br />
University of Technology, 247 p.<br />
Gardner, J., Bell, J., Constable, H., Hannan, D., Ritchie, P., Zuccarello, G., 2010. Multi-species coastal marine connectivity: a<br />
literature review with recommendations for further research, New Zeal<strong>and</strong> <strong>Aquatic</strong> <strong>Environment</strong> <strong>and</strong> <strong>Biodiversity</strong><br />
Report. No. 58, 47 p.<br />
Ghiglione, J.-F., Gal<strong>and</strong>, P., Pommier, T., Pedros-Alio, C., Maas, E.W., Bakker, K., Bertilson, S., Kirchman, D., Lovejoy, C.,<br />
Yager, P., Murray, A., <strong>2012</strong>. Pole to pole biogeography of surface <strong>and</strong> deep marine bacterial communities. Proceedings<br />
of the national Academy of Sciences of the United States of America www.pnas.org/cgi/doi/10.1073/pnas.1208160109.<br />
Gordon, D., 2000. The Pacific Ocean <strong>and</strong> global OBIS: a New Zeal<strong>and</strong> perspective. Oceanography 13: 41-47.<br />
Grange, K., Tovey, A., Hill, A., 2003. The spatial extent <strong>and</strong> nature of the bryozoan communities at Separation Point, Tasman<br />
Bay, Marine <strong>Biodiversity</strong> Biosecurity Report No. 4, 22 p.<br />
Grayling, S. 2004. A review of scientific studies conducted on the Macquarie Ridge. Unpublished Final Research Report<br />
(ZBD2003-09) for the Ministry of Fisheries. 33p.<br />
Griggs, L., Baird, S., Francis, M., 2007. Fish bycatch in the New Zeal<strong>and</strong> tuna longline fisheries 2002-03 to 2004-05, New<br />
Zeal<strong>and</strong> Fisheries Assessment Report 2007/18, 58 p.<br />
Griggs, L., Baird, S., Francis, M., 2008. Fish bycatch in New Zeal<strong>and</strong> tuna longline fisheries in 2005-06., New Zeal<strong>and</strong> Fisheries<br />
Assessment Report 2008/27, 47 p.<br />
379
AEBAR <strong>2012</strong>: Appendices<br />
Grotti, M., Soggia, F., Lagomarsino, C., Dalla Riva, S., Goessler, W., Francesconi, K., 2008. Natural variability <strong>and</strong> distribution<br />
of trace elements in marine organisms from Antarctic coastal environments. Antarctic Science 20 (1): 39-51.<br />
Guidetti, M., Marcato, S., Chiantore, M., Patarnello, T., Albertelli, G., Cattaneo-Vietti, R., 2006. Exchange between populations<br />
of Adamussium colbecki (Mollusca: Bivalvia) in the Ross Sea. Antarctic Science 18 (4): 645-653.<br />
Hanchet, S., 2000. Future research requirements for the Ross Sea Antarctic toothfish (Dissostichus mawsoni) fishery. ,<br />
Unpublished Final Research Report for MFish Research Project MOF2000/02A Objective 8, 10 p.<br />
Hanchet, S., Fu, D., Dunn, A., 2008a. Indicative estimates of biomass <strong>and</strong> yield of Whitson’s grenadier (M. whitsoni) on the<br />
continental slope of the Ross Sea in Subareas 88.1 <strong>and</strong> 88.2. , WG-FSA-08/32p.<br />
Hanchet, S., Mitchell, J., Bowden, D., Clark, M., Hall, J., O’Driscoll, R., 2008b. Ocean survey 20/20: New Zeal<strong>and</strong> IPY-CAML<br />
Final Voyage Report, NIWA Client Report: WLG2008-74, October 2008, 193 p.<br />
Hanchet, S., Mitchell, J., Bowden, D., Clark, M., Hall, J., O’Driscoll, R., Pinkerton, M., Robertson, D., 2008c. Preliminary report<br />
of the New Zeal<strong>and</strong> RV Tangaroa IPY-CAML survey of the Ross Sea region, Antarctica in February-March 2008,<br />
Unpublished NIWA report to CCAMLR working group on ecosystem monitoring <strong>and</strong> management, WG-EMM-08/18, 15<br />
p.<br />
Hanchet, S., Stevenson, M., Jones, C., Marriott, P., McMillan, P., O’Driscoll, R., Stevens, D., Stewart, A., Wood, B., 2008d.<br />
Biomass estimates <strong>and</strong> size distributions of demersal finfish on the Ross Sea shelf <strong>and</strong> slope from the New Zeal<strong>and</strong><br />
IPY-CAML survey, February-March 2008., WG-FSA-08/31p.<br />
Hanchet, S., Stewart, A., McMillan, P., Clark, M., O’Driscoll, R., Stevenson, M., (In Press). Diversity, relative abundance, new<br />
locality records, <strong>and</strong> updated fish fauna of the Ross Sea, Antarctica. Antarctic Science.<br />
Hanchet, S.C., 2009. New Zeal<strong>and</strong> IPY-CAML Progress Report, 76 p.<br />
Hanchet, S.C., 2010. New Zeal<strong>and</strong> IPY-CAML Progress Report, 76 p.<br />
Hartill, B., Cryer, N., MacDiarmid, A., 2006. Reducing bycatch in New Zeal<strong>and</strong>'s scampi trawl fisheries, New Zeal<strong>and</strong> <strong>Aquatic</strong><br />
<strong>Environment</strong> <strong>and</strong> <strong>Biodiversity</strong> Report No. 4, 53 p p.<br />
Harvey, A., Woelkerling, W., Farr, T., Neill, K., Nelson, W., 2005. Coralline algae of central New Zeal<strong>and</strong>: an identification guide<br />
to common ‘crustose’ species, NIWA Information Series No. 57p.<br />
Heimeier, D., Lavery, S., Sewell, MA, 2010. Using DNA barcoding <strong>and</strong> phylogenetics to identify Antarctic invertebrate larvae:<br />
Lessons from a large scale study. Marine Genomics 3: 165-177.<br />
Hemery, L., Eléaum, M., Roussel, V., Ameziane, N., Wilson, N., In Prep. Circumpolar distribution of a complex of cryptic<br />
species.<br />
Hewitt, J., Julian, K., Bone, E., 2011a. Chatham-Challenger Ocean Survey 20/20 Post-Voyage Analyses: Objective 10 - Biotic<br />
habitats <strong>and</strong> their sensitivity to physical disturbance., New Zeal<strong>and</strong> <strong>Aquatic</strong> <strong>Environment</strong> <strong>and</strong> <strong>Biodiversity</strong> Report No.<br />
81, 36 p.<br />
Hewitt, J., Lundquist, C., Bowden, D., 2011b. Chatham-Challenger Ocean Survey 20/20 Post Voyage Analyses: Diversity<br />
Metrics, New Zeal<strong>and</strong> <strong>Aquatic</strong> <strong>Environment</strong> <strong>and</strong> <strong>Biodiversity</strong> Report No. 83, 64 p.<br />
Horn, P., Dunn, M., 2010. Inter-annual variability in the diets of hoki, hake, <strong>and</strong> ling on the Chatham Rise from 1990 to 2009,<br />
New Zeal<strong>and</strong> <strong>Aquatic</strong> <strong>Environment</strong> <strong>and</strong> <strong>Biodiversity</strong> Report No. 54, 57 p.<br />
Horn, P., Forman, J, Dunn, MR., 2010. Feeding habits of alfonsino Beryx splendens. Journal of Fish Biology 76: 2382-2400<br />
Hurst, R., Renwick, J., Sutton, P., Uddstrom, M., Kennan, S., Law, C., Rickard, G., Korpela, A., Stewart, C., J, E., <strong>2012</strong>. Climate<br />
<strong>and</strong> ocean trends of potential relevance to fisheries in the New Zeal<strong>and</strong> Region, 2010, New Zeal<strong>and</strong> <strong>Aquatic</strong><br />
<strong>Environment</strong> <strong>and</strong> <strong>Biodiversity</strong> Report No. 90, 202 p.<br />
Hurst, R., Stevenson, M., Bagley, N., Griggs, L., Morrison, M., Francis, M., 2000. Areas of importance for spawning, pupping or<br />
egg-laying <strong>and</strong> juveniles of new Zeal<strong>and</strong> coastal fish, Unpublished Final Research Report for Ministry of Fisheries<br />
Research Project ENV1999/03 Objective 1, 56 p.<br />
Jackson, J., Carroll, E., Smith, T., Patenaude, N., Baker, C., In Press. Taking stock – the historical demography of the New<br />
Zeal<strong>and</strong> right whale (the Tohora) 1820-2008, New Zeal<strong>and</strong> <strong>Aquatic</strong> Enviornment <strong>and</strong> <strong>Biodiversity</strong> Report, xx p.<br />
Jellyman, D., 1994. The fishery for freshwater eels (Anguilla spp.) in New Zeal<strong>and</strong> New Zeal<strong>and</strong> Fisheries Assessment<br />
Research Document 94/14, 25 p.<br />
Jones, E., Francis, M., Paterson, C., Rush, N., Morrison, M., In Press. Habitats of particular significance for fisheries<br />
management: identification of threats <strong>and</strong> stressors to rig nursery areas., New Zeal<strong>and</strong> <strong>Aquatic</strong> <strong>Environment</strong> <strong>and</strong><br />
<strong>Biodiversity</strong> Report, xx p.<br />
Key, J., 2002. A review of current knowledge describing New Zeal<strong>and</strong>'s deepwater benthic biodiversity, Marine <strong>Biodiversity</strong><br />
Biosecurity Report No. 1, 25 p.<br />
Koubbi, P., Masato, M., Duhamel, G., Goarant, A., Hulley, P.-A., O’Driscoll, R., Takashi, I., Pruvost, P., Tavenier, E., Hosie, G.,<br />
2011. Ecological importance of micronektonic fish for the ecoregionalisation of the Indo-Pacific sector of the Southern<br />
Ocean: role of myctophids. . Deep Sea Research II. 58: 170-180.<br />
Lalas, C., MacDiamid, A., Abraham, E., In Press a. Estimates for annual consumption by a recovered population of New<br />
Zeal<strong>and</strong> fur Seals., New Zeal<strong>and</strong> <strong>Aquatic</strong> Enviornment <strong>and</strong> <strong>Biodiversity</strong> Report xx p.<br />
Lalas, C., MacDiamid, A., Abraham, E., In Press b. Estimates for annual consumption rates by New Zeal<strong>and</strong> sea lions., New<br />
Zeal<strong>and</strong> <strong>Aquatic</strong> Enviornment <strong>and</strong> <strong>Biodiversity</strong> Report xx p.<br />
Lalas, C., MacDiarmid, A., In Press. Rapid recolonisation of south-eastern New Zeal<strong>and</strong> by New Zeal<strong>and</strong> fur seals<br />
Arctocephalus forsteri, New Zeal<strong>and</strong> <strong>Aquatic</strong> Enviornment <strong>and</strong> <strong>Biodiversity</strong> Report xx p.<br />
Lavery, S., Clements, K., Hickey, A., 2006. Molecular identification of cryptogenic/invasive gobies in New Zeal<strong>and</strong>., New<br />
Zeal<strong>and</strong> <strong>Aquatic</strong> <strong>Environment</strong> <strong>and</strong> <strong>Biodiversity</strong> Report No. 5, 48 p.<br />
Leathwick, J., Dey, K., Julian, K., 2006a. Development of a marine environmental classification optimised for demersal fish,<br />
NIWA Client report HAM2006-063p.<br />
Leathwick, J., Elith, J., Francis, M., Hastie, T., Taylor, P., 2006b. Variation in demersal fish species richness in the oceans<br />
surrounding New Zeal<strong>and</strong>: an analysis using boosted regression trees. Marine Ecology Progress Series 321: 267-281.<br />
Leathwick, J., Francis, M., Julian, K., 2006c. Development of a demersal fish community map for New Zeal<strong>and</strong>’s Exclusive<br />
Economic Zone, NIWA Client Report HAM2006-062, prepared for Department of Conservation, National Institute of<br />
Water & Atmospheric Research, Hamilton, New Zeal<strong>and</strong>. p.<br />
Leathwick, J., Rowden, A., Nodder, S., Gorman, R., Bardsley, S., Pinkerton, M., Baird, S., Hadfield, M., Currie, K., Goh, A.,<br />
<strong>2012</strong>. A Benthic-optimised Marine <strong>Environment</strong> Classification (BOMEC) for New Zeal<strong>and</strong> waters, New Zeal<strong>and</strong> <strong>Aquatic</strong><br />
<strong>Environment</strong> <strong>and</strong> <strong>Biodiversity</strong> Report No 89, 54 p.<br />
380
AEBAR <strong>2012</strong>: Appendices<br />
Leathwick JR, Rowden A, Nodder S, Gorman R, Bardsley S, Pinkerton M, Baird SJ, Hadfield M, Currie K, Goh A 2010.<br />
Development of a benthic-optimised marine environment classification for waters within the New Zeal<strong>and</strong> EEZ. Final<br />
Research Report for Ministry of Fisheries Research Project BEN200601, Objective 5.<br />
Leduc, D., Rowden, A., Bowden, D., Probert, P., Pilditch, C., <strong>2012</strong>a. Direct evidence for a unimodal relationship between<br />
productivity <strong>and</strong> deep-sea benthic diversity. Marine Ecology Progress Series 454: 53-64.<br />
Leduc, D., Rowden, A., Bowden, D., Probert, P., Pilditch, C., Nodder, S., <strong>2012</strong>b. Unimodal relationship between biomass <strong>and</strong><br />
species richness of deep-sea nematodes: implications for the link between productivity <strong>and</strong> diversity. Marine Ecology<br />
Progress Series 454: 53-64.<br />
Linse, K., Cope, T., Lörz, A., S<strong>and</strong>s, C., 2007. Is the Scotia Sea a centre of Antarctic marine diversification? Some evidence of<br />
cryptic speciation in the circum-Antarctic bivalve Lissarca notorcadensis (Arcoidea : Philobryidae). Polar Biology 30:<br />
1059-1068.<br />
Livingston, M., 2004. A sampling programme to construct <strong>and</strong> quantify food-webs in two key areas supporting important fish<br />
<strong>and</strong> invertebrate species in New Zeal<strong>and</strong>, Unpublished Final Research Report for Ministry of Fisheries Project<br />
ENV2002-07, Objective 1 NIWA, xx p.<br />
Livingston, M., 2009. Towards a National Marine <strong>Environment</strong> Monitoring Programme in New Zeal<strong>and</strong>: A discussion paper<br />
submitted to the <strong>Biodiversity</strong> Research Advisory Group Workshop on Marine <strong>Environment</strong>al Monitoring, Unpublished<br />
report held at MPI, Wellington, xx p.<br />
Livingston, M., Clark, M., Baird, S., 2003. Trends in incidental catch of major fisheries on the Chatham Rise for Orfishing years<br />
1989-90 to 1998-99., New Zeal<strong>and</strong> Fisheries Assessment Report 2003/52, 74 p.<br />
Lohrer, A., Chiaroni, L., Thrush, S.F., Hewitt, J., 2010. Isolated <strong>and</strong> interactive effects of two key species on ecosystem function<br />
<strong>and</strong> trophic linkages in New Zeal<strong>and</strong> soft-sediment habitats, New Zeal<strong>and</strong> <strong>Aquatic</strong> <strong>Environment</strong> <strong>and</strong> <strong>Biodiversity</strong> Report<br />
No. 44, 69 p.<br />
Lohrer, A., Cummings, V., Thrush, S., <strong>2012</strong>. Altered sea ice thickness <strong>and</strong> permanence affects benthic ecosystem functioning<br />
in coastal Antarctica. Ecosystems 10.1007/s10021-10012-19610-10027.<br />
Lorrey, A., Goff, J., McFadgen, B., Chagué-Goff, C., Neil, H., MacDiarmid, A., In Press. A synthesis of climatic <strong>and</strong> geophysical<br />
driver activity in New Zeal<strong>and</strong> <strong>and</strong> environmental changes during the last 1000 years, New Zeal<strong>and</strong> <strong>Aquatic</strong><br />
Enviornment <strong>and</strong> <strong>Biodiversity</strong> Report, xx p.<br />
Lörz, A., 2009. Synopsis of Amphipoda from two recent Ross Sea voyages with description of a new species of Epimeria<br />
(Epimeriidae, Amphipoda, Crustacea). Zootaxa 2167: 59-68.<br />
Lörz, A., 2010a. Deep-sea Rhachotropis (Crustacea: Amphipoda: Eusiridae) from New Zeal<strong>and</strong> <strong>and</strong> the Ross Sea with key to<br />
the Pacific, Indian Ocean <strong>and</strong> Antarctic species. Zootaxa 2482: 22-48.<br />
Lörz, A., 2010b. New Zeal<strong>and</strong> Amphipoda, Conference presentation, XIVth International Colloquium on Amphipoda, Seville,<br />
Spain p.<br />
Lörz, A.-N., 2010c. Deep-sea Rhachotropis (Crustacea: Amphipoda: Eusiridae) from New Zeal<strong>and</strong> <strong>and</strong> the Ross Sea with key<br />
to the Pacific, Indian Ocean <strong>and</strong> Antarctic species. Zootaxa 2482 22-48.<br />
Lörz, A., 2011a. <strong>Biodiversity</strong> of unknown New Zeal<strong>and</strong> habitat: bathyal invertebrate assemblages in the benthic boundary layer.<br />
Marine <strong>Biodiversity</strong> 41 (2): 287-297.<br />
Lörz, A., 2011b. Pacific Epimeriidae (Amphipoda, Crustacea): Epimeria. Journal of the Marine Biological Association of the<br />
United Kingdom 91 (2): 471-477.<br />
Lörz, A., Maas, E., Linse, K., Coleman, C., 2009 Do circum-Antarctic species exist in peracarid Amphipoda? A case study in the<br />
genus Epimeria Costa, 1851 (Crustacea, Peracarida, Epimeriidae). In: Bruce N (Ed) Advances in the taxonomy <strong>and</strong><br />
biogeography of Crustacea in the Southern Hemisphere. ZooKeys 18: 91-128.<br />
Lörz, A., Maas, E., Linse, K., Fenwick, G., 2007. Epimeria schiaparelli sp. nov., an amphipod crustacean (family Epimeriidae)<br />
from the Ross Sea, Antarctica, with molecular characterisation of the species complex. Zootaxa 1402: 23-37.<br />
Lörz, A., Smith, P., Linse, K., Steinke, D., <strong>2012</strong>a. First Molecular Evidence for Underestimated <strong>Biodiversity</strong> of Rhachotropis<br />
(Crustacea, Amphipoda), with Description of a New Species. . PLoS ONE 7 (3): e32365.<br />
doi:32310.31371/journal.pone.0032365.<br />
Lörz, A.-N., Berkenbusch, K., Nodder, S., Ahyong, S., Bowden, D., McMillan, P., Gordon, D., Mills, L., Mackay, K., <strong>2012</strong>b. A<br />
review of deep-sea biodiversity associated with trench, canyon <strong>and</strong> abyssal habitats deeper than 1500 m in New<br />
Zeal<strong>and</strong> waters New Zeal<strong>and</strong> <strong>Aquatic</strong> <strong>Environment</strong> <strong>and</strong> <strong>Biodiversity</strong> Report, No. 92, 133 p.<br />
Lörz, A., Smith, P., Linse, K., Steinke, D., In Prep. Molecular insights to deep-sea Rhachotropis from New Zeal<strong>and</strong> <strong>and</strong> the<br />
Ross Sea with description of a new species.<br />
Lörz, A., Smith, P., Linse, K., Steinke, D., In press. High genetic diversity within Epimeria georgiana (Amphipoda) from the<br />
southern Scotia Arc. Marine <strong>Biodiversity</strong>.<br />
Lörz, A.-N., Coleman, O., 2009. Living jems: jewel-like creatures from the deep. Water <strong>and</strong> Atmosphere 17 (1): 16-17.<br />
Lundquist, C., Thrush, S., Coco, G., Hewitt, J., 2010. Interactions between distributions <strong>and</strong> dispersal decrease persistence<br />
thresholds of a marine benthic community. Marine Ecology Progress Series 413: 217-228.<br />
Lyle, J., 2011. SRP2010-03: Fur seal interactions with SED excluder device, Unpublished Final Research Report for Ministry<br />
ofFisheries, 26 July 2011, 20 p.<br />
Maas, E., Voyles, K., Pickmere, S., Hall, J., Bowden, D., Clark, M., 2010a. Bacterial <strong>and</strong> Archaeal diversity <strong>and</strong> exo-enzyme<br />
activity in Ross Sea, Antarctica sediments. , Poster presented at SAME 11- Symposium on <strong>Aquatic</strong> Microbial Ecology,<br />
Piran, Slovenia, 30th August - 4th September 2010.p.<br />
Maas, E., Law, C., Hall, J., Chang, H., Bury, S., Robinson, K., Thompson, K., Voyles, M., 2010b. Impacts of ocean acidification<br />
on planktonic ecosystems of the southern ocean, Unpublished Final Research Report for Ministry of Fisheries Project<br />
ZBD2008-22, held by the Ministry of Fisheries, 44 p.<br />
MacDiarmid, A., Cleaver, P., Stirling, B., In Press a. Historical evidence for the state <strong>and</strong> exploitation of the marine environment<br />
in the Hauraki Gulf <strong>and</strong> along the Otago-Catlins shelf 1769 - 1950, New Zeal<strong>and</strong> <strong>Aquatic</strong> Enviornment <strong>and</strong> <strong>Biodiversity</strong><br />
Report xx p.<br />
MacDiarmid, A., Smith, I., Paul, L., Francis, M., McKenzie, A., Parsons, D., Hartill, B., Stirling, B., Cleaver, P., In Press b. A<br />
complete history of the exploitation of an ecologically important inshore finfish species in the Hauraki Gulf, New<br />
Zeal<strong>and</strong>: a synthesis of archaeological, historical <strong>and</strong> fisheries data, New Zeal<strong>and</strong> <strong>Aquatic</strong> Enviornment <strong>and</strong><br />
<strong>Biodiversity</strong> Report <strong>Aquatic</strong> <strong>Environment</strong> <strong>and</strong> <strong>Biodiversity</strong> Report xx p.<br />
MacDiarmid, A., Beaumont, J., MacDiarmid, A., Morrison, M., McKenzie, A., Abraham, E., Taylor, R., Gill<strong>and</strong>ers, B., Bury, S.,<br />
Cowles, A., Parsons, D., Cole, R., Pinkerton, M., Walker, J., In Press c. Rocky reef ecosystems – how do they function,<br />
New Zeal<strong>and</strong> <strong>Aquatic</strong> Enviornment <strong>and</strong> <strong>Biodiversity</strong> Report xx p.<br />
381
AEBAR <strong>2012</strong>: Appendices<br />
MacDiarmid, A., McKenzie, A., Sturman, J., Beaumont, J., Mikaloff-Fletcher, S., Dunne, J., <strong>2012</strong>. Assessment of anthropogenic<br />
threats to New Zeal<strong>and</strong> marine habitats, <strong>Aquatic</strong> <strong>Environment</strong> <strong>and</strong> <strong>Biodiversity</strong> Report No. 93, 255 p.<br />
MacDiarmid, A., Stewart, R., In Press. Routine <strong>and</strong> opportunistic sampling of Ross Sea <strong>and</strong> Balleny Isl<strong>and</strong>s <strong>Biodiversity</strong>, New<br />
Zeal<strong>and</strong> <strong>Aquatic</strong> <strong>Environment</strong> <strong>and</strong> <strong>Biodiversity</strong> Report xx p.<br />
MacKenzie, D., Fletcher, D., 2006. Characterisation of seabird captures in NZ fisheries, Unpublished Final Research Report<br />
prepared for the Ministry of Fisheries, Proteus Wildlife Research Consultants, 99 p.<br />
MacKenzie, D., Fletcher, D., 2010. Designing a programme of indicators of population performance with respect to captures of<br />
seabirds in New Zeal<strong>and</strong> fisheries, Unpublished Final Research Report for Ministry of fisheries project ENV2005-08,<br />
held by the Ministry of Fisheriesp.<br />
Marriot, P., Horn, P., McMillan, P., 2003. Species identification <strong>and</strong> age estimation for the ridge-scaled Macrourid (Macrourus<br />
whitsoni) the Ross Sea. CCAMLR Science 10: 37-51.<br />
Mattlin, R., 1993. Incidental catch of fur seals in the west coast South Isl<strong>and</strong> hoki trawl fishery, 1989-92, New Zeal<strong>and</strong> Fisheries<br />
Assessment Report 1993/19p.<br />
Mattlin, R., 2004. QMA SQU6T New Zeal<strong>and</strong> sea lion incidental catch <strong>and</strong> necropsy data for the fishing years 2000-01, 2001-<br />
02 <strong>and</strong> 2002-03, Unpublished Report prepared for the NZ Ministry of Fisheries, Wellington, NZ. July 2004, 21 p.<br />
Mattlin, R.H., 1993. Incidental catch of fur seals in the west coast South Isl<strong>and</strong> hoki trawl fishery, 1989-92, New Zeal<strong>and</strong><br />
Fisheries Assessment Research Document 93/19., 17 p.<br />
Maunder, M., 2007. Assessment of risk of yellow-eyed penguins Megadyptes antipodes from fisheries incidental mortality in<br />
New Zeal<strong>and</strong> fisheries <strong>and</strong> definition of information requirements for managing fisheries related risk Unpublished<br />
Final Research Report for the Ministry of Fisheries, 29 p.<br />
Maxwell, K., MacDiarmid, A., In Press. Oral histories of Maori marine resource state <strong>and</strong> use in the Hauraki Gulf <strong>and</strong> along the<br />
Otago-Catlins coast 1940-2008, Darft <strong>Aquatic</strong> <strong>Environment</strong> <strong>and</strong> <strong>Biodiversity</strong> Report xx p.<br />
McElderry, H., Schrader, J., Anderson, S., 2007. Electronic Monitoring to Assess Protected Species Interactions in New<br />
Zeal<strong>and</strong> Longline Fisheries: A Pilot Study Unpublished report prepared for the New Zeal<strong>and</strong> Ministry of Fisheries,<br />
Wellington, NZ by Archipelago Marine Research Ltd., Victoria, British Columbia, Canada., 45 p.<br />
McElderry, H., Schrader, J., Anderson, S., 2008. Electronic monitoring to assess protected species interactions in New Zeal<strong>and</strong><br />
longline fisheries: a pilot study, New Zeal<strong>and</strong> <strong>Aquatic</strong> <strong>Environment</strong> <strong>and</strong> <strong>Biodiversity</strong> Report No. 24, 39 p.<br />
McMillan, P., Griggs, L., Francis, M., Marriott, P., Paul, L., Mackay, E., Wood, B., Sui, H., Wei, F., 2011a. New Zeal<strong>and</strong> fishes.<br />
1: A guide to common species caught by trawling, New Zeal<strong>and</strong> <strong>Aquatic</strong> <strong>Environment</strong> <strong>and</strong> <strong>Biodiversity</strong> Report. No. 68,<br />
331 p.<br />
McMillan, P., Griggs, L., Francis, M., Marriott, P., Paul, L., Mackay, E., Wood, B., Sui, H., Wei, F., 2011b. New Zeal<strong>and</strong> fishes.<br />
2: A guide to less common species caught by trawling, New Zeal<strong>and</strong> <strong>Aquatic</strong> <strong>Environment</strong> <strong>and</strong> <strong>Biodiversity</strong> Report. No<br />
78, 184 p.<br />
McMillan, P., Griggs, L., Francis, M., Marriott, P., Paul, L., Mackay, E., Wood, B., Sui, H., Wei, F., 2011c. New Zeal<strong>and</strong> fishes 3:<br />
A guide to common species caught by surface fishing methods, New Zeal<strong>and</strong> <strong>Aquatic</strong> <strong>Environment</strong> <strong>and</strong> <strong>Biodiversity</strong><br />
Report No. 69, 147 p.<br />
McMillan, P., Iwamoto, T., Stewart, A., Smith, P., <strong>2012</strong>. A new species of grenadier, genus Macrourus (Teleostei, Gadiformes,<br />
Macrouridae) from the Antarctic <strong>and</strong> a revision of the genus. Zootaxa 3165: 1-24.<br />
McMillan, P., Marriott, P., Hanchet, S., Fenaughty, J., Mackay, E., Sui, H., 2007. Field identification guide to the main fishes<br />
caught in the Ross Sea long-line fishery., Unpublished Final Research Report to the Ministry of Fisheries. Project<br />
ANT2005/02, objective 7. , 14 p.<br />
Meynier, L., 2010. New Zeal<strong>and</strong> sea lion bio-energetic modelling, Unpublished Final Report for Project IPA2009-09. Presented<br />
to AEWG May 17 2011, Wellington, New Zeal<strong>and</strong>, 34 p.<br />
Michael, K., Kroger, K., Richardson, K., Hill, N., 2006. Summary of information in support of the Foveaux Strait Oyster Fishery<br />
Plan: the Foveaux Strait ecosystem <strong>and</strong> effects of oyster dredging, Unpublished Final Research Report for Ministry of<br />
Fisheries project ZBD2005-04, xx p.<br />
Middleton, D., Abraham, E., 2007. The efficacy of warp strike mitigation devices: trials in the 2006 squid fishery, Unpublished<br />
Final Research Report for the Ministry of Fisheries for project IPA2006-02, xx p.<br />
Ministry of Fisheries, 2008. Bottom Fishery Impact Assessment: Bottom Fishing Activities by New Zeal<strong>and</strong> Vessels Fishing in<br />
the High Seas in the SPRFMO Area during 2008 <strong>and</strong> 2009, Available from http://www.southpacificrfmo.org/benthicimpact-assessments/,<br />
Wellington, 102 p.<br />
Mitchell, J., 2008. Initial environmental evaluation (IEE) NZ IPY-CAML voyage 2008 report, Unpublished Report prepared for<br />
Antarctic Policy Unit, Ministry of Foreign Affairs <strong>and</strong> Trade., 35 p.<br />
Mitchell, J., Clark, M., 2004. Voyage report TAN04-02. Western Ross Sea voyage 2004. Hydrographic <strong>and</strong> biodiversity survey<br />
RV Tangaroa 27 January to 13 March 2004. Cape Adare, Cape Hallett, Possession Isl<strong>and</strong>s <strong>and</strong> Balleny Isl<strong>and</strong>s,<br />
Antarctica. , NIWA Voyage Report TAN04-02, Unpublished report held in NIWA library, Wellington, 102 p.<br />
Mitchell, J., MacDiarmid, A., 2006. Voyage Report TAN06-02 Eatern Ross Sea Voyage, Unpublished report for MFish project<br />
ZBD2005-03, xx p.<br />
Mormede, S., Baird, S., Smith, M., 2008 Factors that may influence the probability of fur seal capture in selected New Zeal<strong>and</strong><br />
fisheries, New Zeal<strong>and</strong> <strong>Aquatic</strong> <strong>Environment</strong> <strong>and</strong> <strong>Biodiversity</strong> Report. No. 19, 42 p.<br />
Morrison, M., D, P., 2008. Distribution <strong>and</strong> abundance of toheroa (Paphies ventricosa) on Ninety Mile Beach, March 2006, New<br />
Zeal<strong>and</strong> Fisheries Assessment Report 2008/26, 27 p.<br />
Morrison, M., Lowe, M., Parsons, D., Usmar, N., McLeod, I., 2009. A review of l<strong>and</strong>-based effects on coastal fisheries <strong>and</strong><br />
supporting biodiversity in New Zeal<strong>and</strong>, New Zeal<strong>and</strong> <strong>Aquatic</strong> <strong>Environment</strong> <strong>and</strong> <strong>Biodiversity</strong> Report No. 37, 100 p.<br />
Murray, T., Taylor, P., Greaves, J., Bartle, J., Molloy, J., 1992. Seabird bycatch by Southern Fishery longline vessels in New<br />
Zeal<strong>and</strong> waters, New Zeal<strong>and</strong> Fisheries Assessment Research Document 92/22, 21 p.<br />
Naylor, J., Webber, W., Booth, J., 2005. A guide to common offshore crabs in New Zeal<strong>and</strong> waters., New Zeal<strong>and</strong> <strong>Aquatic</strong><br />
<strong>Environment</strong> <strong>and</strong> <strong>Biodiversity</strong> Report No. 2, 47 p.<br />
Neil, H., MacDiarmid, A., Marriot, P., Paul, L., Horn, P., In Press. Insights into historical New Zeal<strong>and</strong> marine shelf productivity<br />
using ancient fish otoliths, Unpublished Final Research Report for Project ZBD200505 MS6 - Part B, Ministry of<br />
Fisheries, Wellington, New Zeal<strong>and</strong>., xx p.<br />
Neill, K., D’Archino, R., Farr, T., Nelson, W., <strong>2012</strong>. Macroalgal diversity associated with soft sediment habitats in New Zeal<strong>and</strong>,<br />
New Zeal<strong>and</strong> <strong>Aquatic</strong> <strong>Environment</strong> <strong>and</strong> <strong>Biodiversity</strong> Report No. 87, 130 p.<br />
Nelson, W., Cummings, V., D’Archino, R., Halliday, J., Marriott, P., Neill, K., 2010. Macroalgae <strong>and</strong> benthic biodiversity of the<br />
Balleny Isl<strong>and</strong>s, Southern Ocean, New Zeal<strong>and</strong> <strong>Aquatic</strong> <strong>Environment</strong> <strong>and</strong> <strong>Biodiversity</strong> Report No. 55, 99 p.<br />
382
AEBAR <strong>2012</strong>: Appendices<br />
Nelson, W., Neill, K., Farr, T., Barr, N., D’Archino, R., Miller, S., Stewart, R., <strong>2012</strong>. Rhodolith Beds in Northern New Zeal<strong>and</strong>:<br />
Characterisation of Associated <strong>Biodiversity</strong> <strong>and</strong> Vulnerability to <strong>Environment</strong>al Stressors., New Zeal<strong>and</strong> <strong>Aquatic</strong><br />
<strong>Environment</strong> <strong>and</strong> <strong>Biodiversity</strong> Report No. 99, 102 p.<br />
Nelson, W., Villouta, E., Neill, K., Williams, G., Adams, N., Slivsgaard, R., 2002. Marine Macroalgae of Fiordl<strong>and</strong>, New Zeal<strong>and</strong><br />
Tuhinga 13: 117-152<br />
Nielsen, J., Lavery, S., Lörz, A., 2009. Synopsis of a new collection of sea spiders (Arthropoda: Pycnogonida) from the Ross<br />
Sea, Antarctica. Polar Biology 32: 1147-1155.<br />
Nodder, S., 2008. OS 20/20 Chatham Rise & Challenger Plateau Hydrographic, <strong>Biodiversity</strong> & Seabed Habitats, NIWA Client<br />
Report: WLG2008-27, National Institute of Water & Atmospheric Research, Wellington, New Zeal<strong>and</strong>p.<br />
Nodder, S., Bowden, D., A, P., Mackay, K., <strong>2012</strong>. Seafloor habitats <strong>and</strong> benthos of a continentalridge: Chatham Rise, New<br />
Zeal<strong>and</strong>. , in: Harris, P., Baker, E. (Eds.), Seafloor geomorphology as benthic habitat: GEOHAB atlas of geomorphic<br />
features <strong>and</strong> benthic habitats. Elsevier, London, pp. 763-776.<br />
Nodder, S., Maas, E., Bowden, D., Pilditch, C., 2011. Physical, biogeochemical, <strong>and</strong> microbial characteristics of sediment<br />
samples from the Catham Rise <strong>and</strong> Challenger Plateau., <strong>Aquatic</strong> <strong>Environment</strong> <strong>and</strong> <strong>Biodiversity</strong> Report No. 70p.<br />
Norkko, A., Andrew, N., Thrush, S., Cummings, V., Schwarz, A.-M., Hawes, I., Mercer, S., Budd, R., Gibbs, M., Funnell, G.,<br />
Hewitt, J., Goring, D., 2002. Ecology <strong>and</strong> biodiversity of coastal benthic communities in McMurdo Sound, Ross Sea:<br />
development of sampling protocols <strong>and</strong> initial results, Unpublished Final Research Report for Ministry of Fisheries<br />
Research Project ZBD2001/02, Objectives 1, 2 & 3. , 119 p.<br />
Norkko, A., Thrush, S., Cummings, V., Funnell, G., Schwarz, A.-M., Andrew, N., Hawes, I., 2004. Ecological role of Phyllophora<br />
antarctica drift accumulations in coastal soft-sediment communities of McMurdo Sound, Antarctica. Polar Biology 27:<br />
482-494.<br />
Norkko, A., Thrush, S., Cummings, V., Gibbs, M., Andrew, N., Norkko, J., Schwarz, A.-M., 2007. Trophic structure of coastal<br />
Antarctic food webs associated with changes in sea ice <strong>and</strong> food supply. Ecology 88: 2810-2820.<br />
Norkko, J., Norkko, A., Thrush, S., Cummings, V., 2005. Growth under environmental extremes: spatial <strong>and</strong> temporal patterns<br />
in nucleic acid ratios in two Antarctic bivalves. Journal of Experimental Marine Biology <strong>and</strong> Ecology 326: 114-156<br />
O’Driscoll, R., Hurst, R., Dunn, M., Gauthier, S., Ballara, S., 2011. Trends in relative mesopelagic biomass using time series of<br />
acoustic backscatter data from trawl surveys, New Zeal<strong>and</strong> <strong>Aquatic</strong> <strong>Environment</strong> <strong>and</strong> <strong>Biodiversity</strong> Report. No. 96, 99 p.<br />
O’Driscoll, R., Macaulay, G., Gauthier, S., Pinkerton, M., Hanchet, S., 2010. Distribution, abundance <strong>and</strong> acoustic properties of<br />
Antarctic silverfish (Pleuragramma antarcticum) in the Ross Sea. CCAMLR document WG-FSA-10/P4 58 (1-2): 181-<br />
195.<br />
O'Driscoll, R., 2009 Preliminary acoustic results from the New Zeal<strong>and</strong> IPY-CAML survey of the Ross Sea region in February-<br />
March 2008, Unpublished Final Research Report for MFish project IPY200701 objective 8, 14 p.<br />
O'Driscoll, R., Booth, J., Bagley, N., Anderson, O., Griggs, L., Stevenson, M., Francis, M., 2003. Areas of importance for<br />
spawning, pupping or egg-laying, <strong>and</strong> juveniles of New Zeal<strong>and</strong> deepwater fish, pelagic fish, <strong>and</strong> invertebrates., NIWA<br />
Technical Report 119, 377 p.<br />
O'Driscoll, R., Hanchet, S., Miller, B., In press. Can acoustic methods be used to monitor grenadier (Macrouridae) abundance<br />
in the Ross Sea region. Journal of Ichthyology.<br />
O'Driscoll, R., Macaulay, G., Gauthier, S., Pinkerton, M., Hanchet, S., 2009. Preliminary acoustic results from the New Zeal<strong>and</strong><br />
IPY-CAML survey of the Ross Sea region in February-March 2008, CCAMLR SG-ASAM-09-05, 37 p.<br />
O'Loughlin, M., Paulay, G., Davey, N., Michonneau, F., 2011. The Antarctic region as a marine biodiversity hotspot for<br />
echinoderms: Diversity <strong>and</strong> diversification of sea cucumbers. Deep Sea Research Part II: Topical Studies in<br />
Oceanography 58: 264-275.<br />
Page, M., Alcock, N., Gordon, D., Kelly-Shanks, M., Nelson, W., Neill, K., Watson, J., 2001. Preliminary assessment of the<br />
biodiversity of benthic macrofauna of the western Ross Sea, Antarctica, Unpublished Final Research Report to the<br />
Ministry of Fisheries, 29 p.<br />
Pakhomov, E., Hall, J., Williams, M., Hunt, B., Stevens, C., 2011. Biology of Salpa thompsoni in waters adjacent to the Ross<br />
Sea, Southern Ocean, during austral summer 2008. Polar Biology 34: 257-271.<br />
Parker, S., 2008. Development of a New Zeal<strong>and</strong> High Seas Bottom Trawling Benthic Assessment St<strong>and</strong>ard for Evaluation of<br />
Fishing Impacts to Vulnerable Marine Ecosystems in the South Pacific Ocean, Unpublished Final Research Report for<br />
Ministry of Fisheries Research Projects IFA2007-02 Objectives 3 <strong>and</strong> 4p.<br />
Parker, S., Bowden, D., 2010. Identifying taxonomic groups vulnerable to bottom longline fishing gear in the Ross Sea region.<br />
CCAMLR Science 17: 105-127.<br />
Parker, S., Francis, M., <strong>2012</strong>. Productivity of two species of deepwater sharks, Deania calcea <strong>and</strong> Centrophorus squamosus in<br />
New Zeal<strong>and</strong>, <strong>Aquatic</strong> <strong>Environment</strong> <strong>and</strong> <strong>Biodiversity</strong> Report No. 103, 48 p.<br />
Parker, S., Penney, A., Clark, M., 2009a. Detection criteria for measuring trawl impacts on vulnerable marine ecosystems in<br />
high sea fisheries of the South pacific Ocean. Marine Ecology Progress Series 397: 309-317.<br />
Parker, S., Mormede, S., Tracey, D., Carter, M., 2009b. Evaluation of VME taxa monitoring by scientific observers from five<br />
vessels in the Ross Sea Antarctic toothfish longline fishery during the 2008-09 season, Unpublished Final Research<br />
Report for the Ministry of Fisheries, xx p.<br />
Parker, S., Tracey, D., Mackay, E., Mills, S., Marriott, P., Anderson, O., Schnabel, K., Bowden, D., Lockhart, S., 2009c.<br />
CCAMLR VME taxa Identification guide Version 2009., Available at http://www.ccamlr.org/pu/e/sc/obs/vme-guide.pdf,<br />
Hobart, Tasmania, Australia, 4 p.<br />
Parker, S., Tracey, D., Mackay, E., Mills, S., Marriott, P., Anderson, O., Schnabel, K., Bowden, D., Kelly, M., 2008.<br />
Classification guide for potentially vulnerable invertebrate taxa in the Ross Sea long-line fishery, Unpublished Final<br />
Research Report for Ministry of Fisheries Research Project ANT2007-01 (Objective 3), 7 p.<br />
Parker, S., Wood, B., Hanchet, S., Dunn, A., 2010. A bathymetric data framework for fisheries management in the Ross Sea<br />
region, Unpublished Final Research Report for the Ministry of Fisheries, 14 p.<br />
Parsons, D., Morrison, M., MacDiarmid, A., Stirling, B., Cleaver, P., Smith, I., Butcher, M., In press. Long-term effects of climate<br />
variation <strong>and</strong> human impacts on the structure <strong>and</strong> functioning of New Zeal<strong>and</strong>'s Shelf Ecosystems, New Zeal<strong>and</strong><br />
<strong>Aquatic</strong> Enviornment <strong>and</strong> <strong>Biodiversity</strong> Report xx p.<br />
Paul, L., <strong>2012</strong>. A history of the Firth of Thames dredge fishery for mussels: use <strong>and</strong> abuse of a coastal resource, New Zeal<strong>and</strong><br />
<strong>Aquatic</strong> <strong>Environment</strong> <strong>and</strong> <strong>Biodiversity</strong> Report No. 94, 27 p.<br />
Penney, A., Parker, S., Brown, J., 2009. Protection measures implemented by New Zeal<strong>and</strong> for vulnerable marine ecosystems<br />
in the South Pacific Ocean. Marine Ecology Progress Series 397: 341-354.<br />
383
AEBAR <strong>2012</strong>: Appendices<br />
Pinkerton, M., In Press. Trophic modelling of a New Zeal<strong>and</strong> marine shelf ecosystem since AD 1000 New Zeal<strong>and</strong> <strong>Aquatic</strong><br />
Enviornment <strong>and</strong> <strong>Biodiversity</strong> Report xx p.<br />
Pinkerton, M., Bradford-Grieve, J., Hanchet, S., In <strong>Review</strong>. A balanced model of the food web of the Ross Sea, Antarctica.<br />
Submitted to CCAMLR Science.<br />
Pinkerton, M., Hanchet, S., Bradford-Grieve, J., Cummings, V., Wilson, P., Williams, M., 2006. Modelling the effects of fishing in<br />
the Ross Sea, Unpublished Final Research Report for Ministry of Fisheries Research Project ANT2004-05, 169 p.<br />
Pinkerton, M., Cummings, V., Forman, J., Brown, J., Bury, S., 2009b. Trophic connections in the Ross Sea: information from<br />
stomach contents analysis <strong>and</strong> stable isotopes of carbon <strong>and</strong> nitrogen., Unpublished Report to Ministry of Fisheries,<br />
project IPY200701 Obj10, 18 p.<br />
Pinkerton, M., Dunn, A., Hanchet, S., 2007a. Ecological risk management <strong>and</strong> the fishery for Antarctic toothfish (Dissostichus<br />
mawsoni) in the Ross Sea, Antarctica, Document EMM-07-24, CCAMLR, Hobart, Australia, 22 p.<br />
Pinkerton, M., Bury, S., Vorster, I., Hanchet, S., 2007b. Stable isotope analysis of Southern Ocean fish tissue samples:<br />
preliminary results, Unpublished Final Research Report to the Ministry of Fisheries. Project ANT2005/04, objective 1,<br />
32 p.<br />
Pinkerton, M., Forman, J., Bury, S., Brown, J., Horn, P., O’Driscoll, R., In press. Diet <strong>and</strong> trophic niche of Antarctic silverfish<br />
(Pleuragramma antarcticum) in the Ross Sea, Antarctica. Journal of Fish Biology.<br />
Pinkerton, M., Hanchet, S., Bradford Grieve, J., 2005. Modelling the effects of fishing in the Ross Sea, Unpublished Final<br />
Research Report for MFish Research Project ANT2004/05, 130 p.<br />
Pinkerton, M., Mormede, S., Bowden, D., 2009a. Inputs to the Ross Sea Bioregionalisation/Spatial Management planning<br />
workshop, Unpublished Final Research Report to the Ministry of Fisheries, 40 p.<br />
Ponte, G., van den Berg, A., Anderson, R., 2010. Impact characteristics of the New Zeal<strong>and</strong> Fisheries sea lion exclusion device<br />
stainless steel grid, IPA2009-16 Report prepared for NZ Ministry of Fisheries (Project IPA2009-16), Oct. 2010, 24 p.<br />
Ponte, G., van den Berg, A., Anderson, R., 2011. Further analysis of the impact characteristics of the New Zeal<strong>and</strong> Fisheries<br />
sea lion exclusion device stainless steel grid, Unpublished Report prepared for NZ Ministry of Fisheries (Project<br />
SRP2010-05), 24 p.<br />
Richard, Y., Abraham, E., Filippi, D., 2011. Assessment of the risk to seabird populations from New Zeal<strong>and</strong> commercial<br />
fisheries, Unpublished Final Research Report held by the Ministry of Fisheries, xx p.<br />
Roberts, C., Stewart, A., 2001. Ross Sea fishes: a collection-based biodiversity research programme. Seafood New Zeal<strong>and</strong> 9<br />
(11): 79-84.<br />
Roe, W., 2007. Necropsy of marine mammals captured in New Zeal<strong>and</strong> fisheries in the 2005-06 fishing year, New Zeal<strong>and</strong><br />
<strong>Aquatic</strong> <strong>Environment</strong> <strong>and</strong> <strong>Biodiversity</strong> Report No. 11, 24 p.<br />
Roe, W., 2009a. Necropsy of marine mammals captured in New Zeal<strong>and</strong> fisheries in the 2007-08 fishing year, New Zeal<strong>and</strong><br />
<strong>Aquatic</strong> <strong>Environment</strong> <strong>and</strong> <strong>Biodiversity</strong> Report. No. 34, 35 p.<br />
Roe, W., 2009b. Necropsy of marine mammals captured in New Zeal<strong>and</strong> fisheries in the 2006-07 fishing year, New Zeal<strong>and</strong><br />
<strong>Aquatic</strong> <strong>Environment</strong> <strong>and</strong> <strong>Biodiversity</strong> Report No. 29, 32 p.<br />
Roe, W., 2010a External review of NZ sea lion bycatch necropsy data <strong>and</strong> methods, Unpublished Report prepared for the NZ<br />
Ministry of Fisheries, Wellington, 8 p.<br />
Roe, W., 2010b. Necropsy of marine mammals captured in New Zeal<strong>and</strong> fisheries in the 2008-09 fishing year, New Zeal<strong>and</strong><br />
<strong>Aquatic</strong> <strong>Environment</strong> <strong>and</strong> <strong>Biodiversity</strong> Report No. 47, 22 p.<br />
Roe, W., Meynier, L., <strong>2012</strong>. <strong>Review</strong> of Necropsy Records for Bycaught NZ sea lions (Phocarctos hookeri), 2000-2008, New<br />
Zeal<strong>and</strong> <strong>Aquatic</strong> <strong>Environment</strong> <strong>and</strong> <strong>Biodiversity</strong> Report No. 98, 46 p.<br />
Rowden, A., Clark, M., 2010. Benthic biodiversity of seven seamounts on the southern end of the Kermadec volcanic arc,<br />
northeast New Zeal<strong>and</strong>, New Zeal<strong>and</strong> <strong>Aquatic</strong> <strong>Environment</strong> <strong>and</strong> <strong>Biodiversity</strong> Report No. 62, 31 p.<br />
Rowden, A., Clark, M., O'Shea, S., 2004. Benthic biodiversity of seamounts on the Northl<strong>and</strong> Plateau, Marine <strong>Biodiversity</strong><br />
Biosecurity Report No. 5, 21 p.<br />
Rowden, A., Clark, M., O'Shea, S., McKnight, D., 2003. Benthic biodiversity of seamounts on the southern Kermadec volcanic<br />
arc, Marine <strong>Biodiversity</strong> Biosecurity Report. No. 3, 23 p.<br />
Rowden, A., Cranfield, H., Mann, P., Wood, A.L., 2007. Benthic macrofauna bycatch of oyster dredging in Foveaux Strait., New<br />
Zeal<strong>and</strong> Fisheries Assessment Report 2007/10, 27 p.<br />
Rowden, A., Kroeger, K., Clark, M., <strong>2012</strong>a. <strong>Biodiversity</strong> of macroinvertabrates <strong>and</strong> fish assemblages of the northwestern Ross<br />
Sea shelf, New Zeal<strong>and</strong> <strong>Aquatic</strong> <strong>Environment</strong> <strong>and</strong> <strong>Biodiversity</strong> Report No. 101, 111 p.<br />
Rowden, A., Berkenbusch, K., Brewin, P., Dalen, J., Neill, K., Nelson, W., Oliver, M., Probert, P., Schwarz, A.-M., Sui, P.,<br />
Sutherl<strong>and</strong>, D., <strong>2012</strong>b. A review of the marine soft-sediment assemblages of New Zeal<strong>and</strong>, New Zeal<strong>and</strong> <strong>Aquatic</strong><br />
<strong>Environment</strong> <strong>and</strong> <strong>Biodiversity</strong> Report No. 92, 165 p.<br />
Rowden, A., Kroeger, K., Clark, M., In Press. <strong>Biodiversity</strong> of macroinvertabrates <strong>and</strong> fish assemblages of the Balleny Isl<strong>and</strong>s<br />
seamounts, New Zeal<strong>and</strong> <strong>Aquatic</strong> <strong>Environment</strong> <strong>and</strong> <strong>Biodiversity</strong> Report, xx p.<br />
Rowden, A., Oliver, M., Clark, M., Mackay, K., 2008. New Zeal<strong>and</strong>'s "SEAMOUNT" database: recent updates <strong>and</strong> its potential<br />
use for ecological risk assessment, New Zeal<strong>and</strong> <strong>Aquatic</strong> <strong>Environment</strong> <strong>and</strong> <strong>Biodiversity</strong> Report. No. 27, 49 p.<br />
Rowden, A., O'Shea, S., Clark, M., 2002. Benthic biodiversity of seamounts on the northwest Chatham Rise. , Marine<br />
<strong>Biodiversity</strong> <strong>and</strong> Biosecurity Report. 2, 1-21 p.<br />
Sagar, P., Charteris, M., Carroll, J., Sagar, P., 2009a. Population assessment of Salvin’s albatrosses at the Snares Western<br />
Chain, 29 September - 17 October 2008, Unpublished Final Research Report for the Ministry of Fishereis, 4 p.<br />
Sagar, P., Fraser, M., Hunt, S., Scofield, P., Robertson, C., 2009b. Population dynamics of the Chatham Albatross at The<br />
Pyramid, 9 November- 7 December 2008, Unpublished Final Research Report for the Ministry of Fisheries, 5 p.<br />
Sagar, P., Carroll, J., Charteris, M., 2010a. Population assessment of Salvin’s albatrosses at the Snares Western Chain, 29<br />
September - 14 October 2009, Unpublished Final Research Report for Mnistry of Fisheries, 4 p.<br />
Sagar, P., Fraser, M., Cameron, N., Scofield, P., Robertson, C., 2010b. Population assessment of Northern Buller’s Albatross<br />
<strong>and</strong> Northern Giant Petrels at the Forty-Fours, Chatham Isl<strong>and</strong>s, 1 - 8 December 2009, Unpublished Final Research<br />
Report to the Ministry of Fisheries. Project PRO2006-05, 11 p.<br />
Sagar, P., Fraser, M., Palmer, D., Deppe, L., Scofield, P., Robertson, C., 2010c. Population dynamics of the Chatham Albatross<br />
at The Pyramid, 20 November- 14 December 2009, Unpublished Final Research Report for the Ministry of Fisheries, 6<br />
p.<br />
Sagar, P., Thompson, D., 2008. Data collection of demographic, distributional, <strong>and</strong> trophic information on selected petrels, New<br />
Zeal<strong>and</strong> <strong>Aquatic</strong> <strong>Environment</strong> <strong>and</strong> <strong>Biodiversity</strong> Report No. 17, 12 p.<br />
384
AEBAR <strong>2012</strong>: Appendices<br />
Savage, C., 2009. Development of bioindicators for the assimilation of terrestrial nutrient inputs in coastal ecosystems as a tool<br />
for watershed management, New Zeal<strong>and</strong> <strong>Aquatic</strong> <strong>Environment</strong> <strong>and</strong> <strong>Biodiversity</strong> Report No. 30, 35 p.<br />
Savage, C., Thrush, S., Lohrer, A., Hewitt, J., <strong>2012</strong>. Ecosystem Services Transcend Boundaries: Estuaries Provide Resource<br />
Subsidies <strong>and</strong> Influence Functional Diversity in Coastal Benthic Communities. PLoS ONE 7 (8 ): e42708.<br />
doi:42710.41371/journal.pone.0042708.<br />
Schiaparelli, S., Alvaro, M., Bohn, J., Albertelli, G., 2010 'Hitchhiker' polynoid polychaetes in cold deep waters <strong>and</strong> their<br />
potential influence on benthic soft bottom food webs. Antarctic Science 22: 399-407.<br />
Schiaparelli, S., Lörz, A., Cattaneo-Vietti, R., 2006. Diversity <strong>and</strong> distribution of mollusc assemblages on the Victoria L<strong>and</strong> coast<br />
<strong>and</strong> the Balleny Isl<strong>and</strong>s, Ross Sea, Antarctica. Antarctic Science 18 (4): 615-631.<br />
Schiaparelli, S., Olivero, M., Taviani, M., Griffiths, H., Lörz, A., Albertelli, G., 2008. Circumpolar distribution of the pycnogonidectoparasitic<br />
gastropod Dickdellia labioflecta (Dell, 1990) (Mollusca: Zerotulidae). Antarctic Science 20: 497-498.<br />
Schwarz, A., Taylor, R., Hewitt, J., Phillips, N., Shima, J., Cole, R., Budd, R., 2006. Impacts of terrestrial runoff on the<br />
biodiversity of rocky reefs, New Zeal<strong>and</strong> <strong>Aquatic</strong> <strong>Environment</strong> <strong>and</strong> <strong>Biodiversity</strong> Report No. 7, 109 p.<br />
Schwarz, A.-M., Hawes, I., Andrew, N., Mercer, S., Cummings, V., Thrush, S., 2005. Primary production potential of nongeniculate<br />
coralline algae at Cape Evans, Ross Sea, Antarctica. Marine Ecology Progress Series 294: 131-140.<br />
Schwarz, A.-M., Hawes, I., Andrew, N., Norkko, A., Cummings, V., Thrush, S., 2003. Macroalgal photosynthesis near the<br />
southern global limit for growth; Cape Evans, Ross Sea, Antarctica. Polar Biology 26: 789-799.<br />
Sewell, M.A., 2005. Examination of the meroplankton community in the southwestern Ross Sea, Antarctica, using a collapsible<br />
plankton net. Polar Biology. 28:119–131.<br />
Sewell, M.A., 2006. The meroplankton community of the northern Ross Sea: a preliminary comparison with the McMurdo<br />
Sound region. Antarctic. Science. 18:595–602.<br />
Sewell, M., Lavery, S., Baker, C., 2006 Whose larva is that? Molecular identification of larvae of the Ross Sea, New Zeal<strong>and</strong><br />
<strong>Aquatic</strong> <strong>Environment</strong> <strong>and</strong> <strong>Biodiversity</strong> Report No. 3, 57 p.<br />
Sharp, B., Parker, S., Pinkerton, M., (lead authors), also Breen, B., Cummings, V., Dunn, A., Grant, S., Hanchet, S., Keys, H.,<br />
Lockhart, S., Lyver, P.B., O’Driscoll, R., Williams, M., Wilson, P., 2010. Bioregionalisation <strong>and</strong> Spatial Ecosystem<br />
Processes in the Ross Sea Region, CCAMLR document WG-EMM-10/30, Hobart, Australiap.<br />
Sharp, B., Parker, S., Smith, N., 2009. An Impact Assessment Framework for Bottom Fishing Methods in the CCAMLR<br />
Convention Area. CCAMLR Science 16: 195-210.<br />
Sharp, B., Waugh, S., Walker, N., 2011. A risk assessment framework for incidental seabird mortality associated with New<br />
Zeal<strong>and</strong> fishing in the New Zeal<strong>and</strong> EEZ., Unpublished report held by the Ministry of Fisheries, Wellington., 39 p.<br />
Slooten, E., Dawson, S., Rayment, W., Childerhouse, S., 2005. Distribution of Maui's dolphin, Cephalorynchus hectori maui,<br />
New Zeal<strong>and</strong> Fisheries Assessment Report. 2005/28, 21 p.<br />
Smith, A., Gordon, D., 2011. Bryozoans of southern New Zeal<strong>and</strong>: a field identification guide, New Zeal<strong>and</strong> <strong>Aquatic</strong><br />
<strong>Environment</strong> <strong>and</strong> <strong>Biodiversity</strong> Report. No. 75, 65 p.<br />
Smith, F., 2006. Balleny Isl<strong>and</strong>s Ecology Research Voyage Report, R.V. Tiama, Unpublished report held at Ministry of Fisheries<br />
for project ZBD2005/01p.<br />
Smith, I., 2011. Estimating the magnitude of pre-European Maori marine harvest in two New Zeal<strong>and</strong> study areas, New Zeal<strong>and</strong><br />
<strong>Aquatic</strong> <strong>Environment</strong> <strong>and</strong> <strong>Biodiversity</strong> Report, No. 82, 72 p.<br />
Smith, M., Baird, S., 2005a. Factors that may influence the level of incidental mortality of New Zeal<strong>and</strong> sea lions (Phocarctos<br />
hookeri) in the squid (Nototodarus spp.) trawl fishery in SQU 6T, New Zeal<strong>and</strong> Fisheries Assessment Report 2005/20,<br />
35 p.<br />
Smith, M., Baird, S., 2005b. Representativeness of past observer coverage, <strong>and</strong> future coverage required for estimation of New<br />
Zeal<strong>and</strong> sea lion (Phocarctos hookeri)captures in the SQU 6T fishery., New Zeal<strong>and</strong> Fisheries Assessment Report 39<br />
p.<br />
Smith, M., Baird, S., 2007a. Estimation of incidental captures of New Zeal<strong>and</strong> sea lions (Phocarctos hookeri) in New Zeal<strong>and</strong><br />
fisheries in 2003-04, with particular reference to the SQU 6T squid trawl fishery, New Zeal<strong>and</strong> Fisheries Assessment<br />
Report 2007/7, 32 p.<br />
Smith, M., Baird, S., 2007b. Estimation of incidental captures of New Zeal<strong>and</strong> sea lions (Phocarctos hookeri) in New Zeal<strong>and</strong><br />
fisheries in 2004-05, with particular reference to the SQU 6T squid trawl fishery., New Zeal<strong>and</strong> <strong>Aquatic</strong> <strong>Environment</strong><br />
<strong>and</strong> <strong>Biodiversity</strong> Report No. 12, 31 p.<br />
Smith, M., Baird, S., 2008a. Observer coverage required for the prediction of incidental capture of New Zeal<strong>and</strong> fur seals in<br />
New Zeal<strong>and</strong> commercial fisheries, New Zeal<strong>and</strong> <strong>Aquatic</strong> <strong>Environment</strong> <strong>and</strong> <strong>Biodiversity</strong> Report. No. 26, 76 p.<br />
Smith, M., Baird, S., 2008b. Observer coverage required for the prediction of incidental capture of seabirds in New Zeal<strong>and</strong><br />
commercial fisheries, New Zeal<strong>and</strong> <strong>Aquatic</strong> <strong>Environment</strong> <strong>and</strong> <strong>Biodiversity</strong> Report No. 25, 107 p.<br />
Smith, M., Baird, S., 2009. Model-based estimation of New Zeal<strong>and</strong> fur seal (Arctocephalus forsteri) incidental captures <strong>and</strong><br />
strike rates for trawl fishing in New Zeal<strong>and</strong> waters for the years 1994-95 to 2005-06, New Zeal<strong>and</strong> <strong>Aquatic</strong><br />
<strong>Environment</strong> <strong>and</strong> <strong>Biodiversity</strong> Report No. 40, 90 p.<br />
Smith, M., Baird, S., 2011. Predicted incidental captures of New Zeal<strong>and</strong> sea lions (Phocarctos hookeri) in the Auckl<strong>and</strong> Isl<strong>and</strong>s<br />
SQU 6T squid trawl fishery for 1995 to 2006., New Zeal<strong>and</strong> <strong>Aquatic</strong> <strong>Environment</strong> <strong>and</strong> <strong>Biodiversity</strong> Report. No. 71, 40 p.<br />
Smith, P., Notman, P., 2005. Inventory of biological samples collected from Antarctic toothfish Dissostichus mawsoni over<br />
summer 2005, Unpublished Final Research Report for Ministry of Fisheries Project ANT200401, Objective 5p.<br />
Smith, P., Roberts, C., Stewart, A., McVeagh, M., Struthers, C., 2007. Identification <strong>and</strong> speciation of Antarctic skates,<br />
Unpublished Final Research Report to the Ministry of Fisheries ANT2005/02, objective 5, 27 p.<br />
Smith, P., Steinke, D., McMillan, P., McVeagh, S., Struthers, C., 2008. DNA database for commercial marine fish, New Zeal<strong>and</strong><br />
<strong>Aquatic</strong> <strong>Environment</strong> <strong>and</strong> <strong>Biodiversity</strong> Report No. 22, 62 p.<br />
Smith, P., Steinke, D., McMillan, P., Stewart, A., McVeagh, S., Diaz De Astarloa, J., Welsford, D., Ward, R., 2011a. DNA<br />
barcoding highlights a cryptic species of grenadier (genus Macrourus) in the Southern Ocean Journal of Fish Biology<br />
78 (1): 355-365.<br />
Smith, P., Steinke, D., McMillan, P., Stewart, A., Ward, R., 2011b. DNA barcoding of morids (Actinopterygii, Moridae) reveals<br />
deep divergence in the anti tropical Halargyreus johnsoni but little distinction between Antimora rostrata <strong>and</strong> A.<br />
microlepis Mitochondrial DNA (doi:10.3109/19401736.2010.532329).<br />
Snelder, T.H., Leathwick, J.R., Dey, K.L., Rowden, A.A., Weatherhead, M.A., Fenwick, G.D., Francis, M.P., Gorman, R.M.,<br />
Grieve, J.M., Hadfield, M.G., Hewitt, J.E., Richardson, K.M., Uddstrom, M.J., Zeldis, J.R., 2005. The New Zeal<strong>and</strong><br />
Marine <strong>Environment</strong>al Classification, Unpublished Report for the Ministry for the <strong>Environment</strong>, 80 p.<br />
385
AEBAR <strong>2012</strong>: Appendices<br />
Snelder, T., Leathwick, J., Dey, K., Rowden, A., Weatherhead, M., 2006. Development of an ecological marine classification in<br />
the New Zeal<strong>and</strong> region. <strong>Environment</strong>al Management 39: 12-29.<br />
Speed, S., 2005. <strong>Review</strong> of the effects of aquaculture <strong>and</strong> enhancement stock sources on wild fisheries resources <strong>and</strong> the<br />
marine environment- report on Objective 1 & 2, Unpublished Final Research Report for the Ministry of Fisheries, 128 p.<br />
Speed, S., McLary, D., Jones, E., 2006 The implications of marine reserves for fisheries resources <strong>and</strong> management in the<br />
New Zeal<strong>and</strong> context, Unpublished Final Research Report for the Ministry of fisheries, 72 p.<br />
Stein, D., <strong>2012</strong>. Snailfishes (Family Liparidae) of the Ross Sea, Antarctica, <strong>and</strong> closely adjacent waters. Zootaxa 3285 ( ISBN<br />
978-1-86977-870-5 (Online edition)): 120.<br />
Stevens, D., 2006. Stomach contents of sub-adult Antarctic toothfish (Dissostichus mawsoni) from the western Ross Sea,<br />
Antarctica, Unpublished Final Research Report to Ministry of Fisheries, New Zeal<strong>and</strong> for project ANT2004-01,<br />
Objective 4., xx p.<br />
Stevens, D., Dunn, M., 2010. Different food preferences in four sympatric deep-sea Macrourid fishes. Marine Biology DOI<br />
10.1007/s00227-010-1542-1.<br />
Stevens, D., Hurst, R., Bagley, N., 2011. Feeding habits of New Zeal<strong>and</strong> fishes: a literature review <strong>and</strong> summary of research<br />
trawl database records 1960 to 2000, New Zeal<strong>and</strong> <strong>Aquatic</strong> <strong>Environment</strong> <strong>and</strong> <strong>Biodiversity</strong> Report, No. 85, 218 p.<br />
Stevens, D., Smith, M., Grimes, P., Devine, J., Sutton, C., MacGibbon, D., Maolagain, C., 2010. Age, growth, <strong>and</strong> maturity of<br />
four New Zeal<strong>and</strong> rattail species, <strong>Aquatic</strong> <strong>Environment</strong> <strong>and</strong> Biodoversity Report. No. 59, 39 p.<br />
Strugnell, J., Watts, P., Smith, P., Allcock, A., Submitted. Persistent genetic signatures of historic climatic events in an Antarctic<br />
octopus.p.<br />
Sutherl<strong>and</strong>, D., 2008. Surface-associated diatoms from marine habitats at Cape Evans, Antarctica, including the first record of<br />
living Eunotogramma marginopunctatum. Polar Biology DOI 10.1007/s00300-008-0426-z.<br />
Sutton, C., Manning, M., Stevens, D., Marriott, P., 2006. Biological parameters for icefish (Chionobathyscus dewitti) in the Ross<br />
Sea, Antarctica, Unpublished Final Research Report to the Ministry of Fisheries. Project ANT2005/02, objective 5, 27 p.<br />
Taylor, P., 1992. Incidental catch of non-fish species by setnets in New Zeal<strong>and</strong> waters, New Zeal<strong>and</strong> Fisheries Assessment<br />
Research Document 92/21, 23 p.<br />
Thatje, S., Lörz, A., 2005. First record of lithodid crabs from Antarctic waters off the Balleny Isl<strong>and</strong>s. Polar Biology 28 (4): 334-<br />
337.<br />
Thompson, F., Abraham, E., 2009a. Six monthly summary of the capture of protected species in New Zeal<strong>and</strong> commercial<br />
fisheries, summer 2007-08, New Zeal<strong>and</strong> <strong>Aquatic</strong> <strong>Environment</strong> <strong>and</strong> <strong>Biodiversity</strong> Report. No. 35, 22 p.<br />
Thompson, F., Abraham, E., 2009b. Dolphin bycatch in New Zeal<strong>and</strong> trawl fisheries, 1995-96 to 2006-07, New Zeal<strong>and</strong> <strong>Aquatic</strong><br />
<strong>Environment</strong> <strong>and</strong> <strong>Biodiversity</strong> Report No. 36, 24 p.<br />
Thompson, F., Abraham, E., 2009c. Estimation of the capture of New Zeal<strong>and</strong> sea lions (Phocarctos hookeri) in trawl fisheries<br />
from 1995-96 to 2006-07, New Zeal<strong>and</strong> <strong>Aquatic</strong> <strong>Environment</strong> <strong>and</strong> <strong>Biodiversity</strong> Report No. 41, 31 p.<br />
Thompson, F., Abraham, E., 2010. Estimation of fur seal (Arctocephalus forsteri) bycatch in New Zeal<strong>and</strong> trawl fisheries, 2002-<br />
03 to 2008-09, New Zeal<strong>and</strong> <strong>Aquatic</strong> <strong>Environment</strong> <strong>and</strong> <strong>Biodiversity</strong> Report No. 61, 37 p.<br />
Thompson, F., Abraham, E., 2011. Estimation of the capture of New Zeal<strong>and</strong> sea lions (Phocarctos hookeri) in trawl fisheries,<br />
from 1995-96 to 2008-09, New Zeal<strong>and</strong> <strong>Aquatic</strong> <strong>Environment</strong> <strong>and</strong> <strong>Biodiversity</strong> Report No. 66, 25 p.<br />
Thompson, F., Abraham, E., Berkenbusch, K., 2010a. Common dolphin (Delphinus delphis) bycatch in New Zeal<strong>and</strong> mackerel<br />
trawl fisheries, 1995–96 to 2008–09, New Zeal<strong>and</strong> <strong>Aquatic</strong> <strong>Environment</strong> <strong>and</strong> <strong>Biodiversity</strong> Report No. 63, 20 p.<br />
Thompson, F., Abraham, E., Berkenbusch, K., 2011. Marine mammal bycatch in New Zeal<strong>and</strong> trawl fisheries, 1995-96 to 2009-<br />
10, Draft Final Research Report for Ministry of Fisheries project PRO2010-01 (Unpublished report held by the Ministry<br />
of Fisheries, Wellington), 80 p.<br />
Thompson, F., Abraham, E., Oliver, MD, 2010b. Estimation of fur seal bycatch in New Zeal<strong>and</strong> trawl fisheries, 2002-03 to 2007-<br />
08, New Zeal<strong>and</strong> <strong>Aquatic</strong> <strong>Environment</strong> <strong>and</strong> <strong>Biodiversity</strong> Report. No. 56, 29 p.<br />
Thompson, F., Oliver, M., Abraham, E., 2010c. Estimation of the capture of New Zeal<strong>and</strong> sea lions (Phocarctos hookeri) in<br />
trawl fisheries, from 1995-96 to 2007-08, New Zeal<strong>and</strong> <strong>Aquatic</strong> <strong>Environment</strong> <strong>and</strong> <strong>Biodiversity</strong> Report No. 52, 25 p.<br />
Thrush, S., Cummings, V., 2011. Massive icebergs, alteration in primary food resources <strong>and</strong> change in benthic communities at<br />
Cape Evans, Antarctica. Marine Ecology.<br />
Thrush, S., Dayton, P., Cattaneo-Vietti, R., Chiantore, M., Cummings, V., Andrew, N., Hawes, I., Kim, S., Kvitek, R., Schwarz,<br />
A.-M., 2006. Broad-scale factors influencing the biodiversity of coastal benthic communities of the Ross Sea, Deep Sea<br />
Research II. 53, 959-971 p.<br />
Thrush, S., Hewitt, J., Cummings, V., Norkko, A., Chiantore, M., 2010. β-diversity <strong>and</strong> species accumulation in Antarctic coastal<br />
benthic communities: the role of habitat, distance <strong>and</strong> productivity on ecological connectivity. , PLoSONE<br />
http://dx.plos.org/10.1371/journal.pone.0011899p.<br />
Thrush, S., Lohrer, D., Savage, C., In Press. Carbonate sediments: the positive <strong>and</strong> negative effects of l<strong>and</strong>-coast interactions<br />
of functional diversity, <strong>Aquatic</strong> <strong>Environment</strong> <strong>and</strong> <strong>Biodiversity</strong> Report, xx p.<br />
Tracey, D., Anderson, O., Clark, M., Oliver, M., (Comps.), 2005. A guide to common deepsea invertebrates in New Zeal<strong>and</strong><br />
waters, New Zeal<strong>and</strong> <strong>Aquatic</strong> <strong>Environment</strong> <strong>and</strong> <strong>Biodiversity</strong> Report No. 1, 160 p.<br />
Tracey, D., Anderson, O., Naylor, J.C., 2011a. A guide to common deepsea invertebrates in New Zeal<strong>and</strong> waters, New Zeal<strong>and</strong><br />
<strong>Aquatic</strong> <strong>Environment</strong> <strong>and</strong> <strong>Biodiversity</strong> Report No. 86, 317 p.<br />
Tracey, D., Rowden, A., Mackay, K., Compton, T., 2011b. Habitat-forming cold-water corals show affinity for seamounts in the<br />
New Zeal<strong>and</strong> region. . Marine Ecology Progress Series 430: 1-22.<br />
Tracey, D., Anderson, O., Naylor, J.R., (Comps.), 2007. A guide to common deepsea invertebrates in New Zeal<strong>and</strong> waters,<br />
New Zeal<strong>and</strong> <strong>Aquatic</strong> <strong>Environment</strong> <strong>and</strong> <strong>Biodiversity</strong> Report No.10., 282 p.<br />
Tracey, D., Carter, M., Parker, S., 2010. Evaluation of VME taxa monitoring by scientific observers, Unpublished Final<br />
Research Report for Ministry of Fisheries Research Project ANT2009/01 Objective 8, 17 p.<br />
Tracey, D., Parker, S., Mackay, E., Anderson, O., Ramm, K., 2008. Classification guide for potentially vulnerable invertebrate<br />
taxa in the SPRFMO Area, Idenitifcation guide for Ministry of fisheries 1p.<br />
Tuck, I., Cole, R., Devine, J., 2009. Ecosystem indicators for New Zeal<strong>and</strong> fisheries, New Zeal<strong>and</strong> <strong>Aquatic</strong> <strong>Environment</strong> <strong>and</strong><br />
<strong>Biodiversity</strong> Report No. 42, 188 p.<br />
Tuck, I., Drury, J., Kelly, M., Gerring, P., 2010. Designing a programme to monitor the recovery of the benthic community<br />
between North Cape <strong>and</strong> Cape Reinga, New Zeal<strong>and</strong> <strong>Aquatic</strong> <strong>Environment</strong> <strong>and</strong> <strong>Biodiversity</strong> Report No. 53, 78 p.<br />
Tuck, I., Hewitt, J., In Press. Monitoring change in benthic communities in Spirits bay, <strong>Aquatic</strong> <strong>Environment</strong> <strong>and</strong> <strong>Biodiversity</strong><br />
Report, xx p.<br />
386
AEBAR <strong>2012</strong>: Appendices<br />
Tuck, I., Parkinson, D., Dey, K., Oldman, K., Sadhwa, W., 2006. Information on benthic impacts in support of the corom<strong>and</strong>el<br />
Scallops fishery plan, Unpublished Ministry of Fisheries Final Research Report 64 p.<br />
Tuck, I., Parkinson, K., Dey, J., Oldman, S., Wadwha, 2006. Information on benthic impacts in support of the Corom<strong>and</strong>el<br />
scallop fisheries plan. info for SCA-CS fish plan, Unpublished Final Research Report for Ministry of Fisheries Research<br />
Project ZBD2005-15p.<br />
Varian, S., 2005. A summary of the values of the Balleny Isl<strong>and</strong>s, Antarctica, Marine <strong>Biodiversity</strong> Biosecurity Report No. 6, 13 p.<br />
Waugh, S., Filippi, D., Walker, N., Kirby, D., 2008. Updated preliminary results of an ecological risk assessment for seabirds<br />
<strong>and</strong> marine mammals with risk of fisheries interactions Western <strong>and</strong> Central pacific Fisheries Comission (WCPFC)<br />
Working Group - Fisheries Stock Assessment. 08/51p.<br />
Waugh, S., Fillipi, D., Abraham, E., 2009. Ecological Risk Assessment for Seabirds in New Zeal<strong>and</strong> fisheries, Unpublished<br />
Final Research Report for the Ministry of Fisheries 58 p.<br />
Williams, A., Schlacher, T., Rowden, A., Althaus, F., Clark, M., Bowden, D., Stewart, R., Bax, N., Consalvey, M., Kloser, R.,<br />
2010. Seamount megabenthic assemblages fail to recover from trawling impacts. Marine Ecology 31(suppl. 1): 183-<br />
199.<br />
Wing, S., 2005. Fiordl<strong>and</strong> <strong>Biodiversity</strong> Research Cruise, Unpublished Final Research Report for ZBD2003-04, xx p.<br />
Zemke-White, W.L., Speed, S.R., McClary, D.J., 2005. Beach-cast seaweed: a review, New Zeal<strong>and</strong> Fisheries Assessment<br />
Report 2005/44, 47 p.<br />
387
ISBN: 978-0-478-40503-3 (print)<br />
ISBN: 978-0-478-40504-0 (online)<br />
Ministry for Primary Industries<br />
Manatū Ahu Matua<br />
Pastoral House<br />
25 The Terrace<br />
PO Box 2526, Wellington, 6140<br />
New Zeal<strong>and</strong><br />
www.mpi.govt.nz