Recommended
5 best practices for managing high-volume app logs

Managing app logs might seem like a mundane task, but it’s a cornerstone of app development and maintenance.
Therefore, following ineffective management practices can have a lot of negative consequences.
To name a few, mismanaged logs can lead to overlooked errors and app issues, as well as security vulnerabilities that may eventually lead to significant financial losses.
Luckily, this article is here to help.
We’ll guide you through every step, from the initial collection of logs to their eventual deletion.
Along the way, you’ll learn best practices, tools, and strategies to ensure your logs are not just data but actionable insights.
Ready to dive into the world of app logs?
Let’s kick things off by talking about generating logs.
Table of Contents
To effectively manage and utilize app logs, the first step is collecting some.
It’s essential to ensure that you’re collecting logs from each service within your application. In many scenarios, this task is straightforward.
For instance, certain model-view-controller frameworks or cloud services like AWS and Azure automatically generate logs.
But to capture all the necessary logs, especially those crucial for developers to debug an app, you might need specialized software.

Bug & crash reporting tool for mobile apps.
Enter Shake.
Shake is a bug-reporting tool designed for mobile apps. It simplifies the process of generating app logs for debugging by automatically logging everything developers need to pinpoint and fix issues.
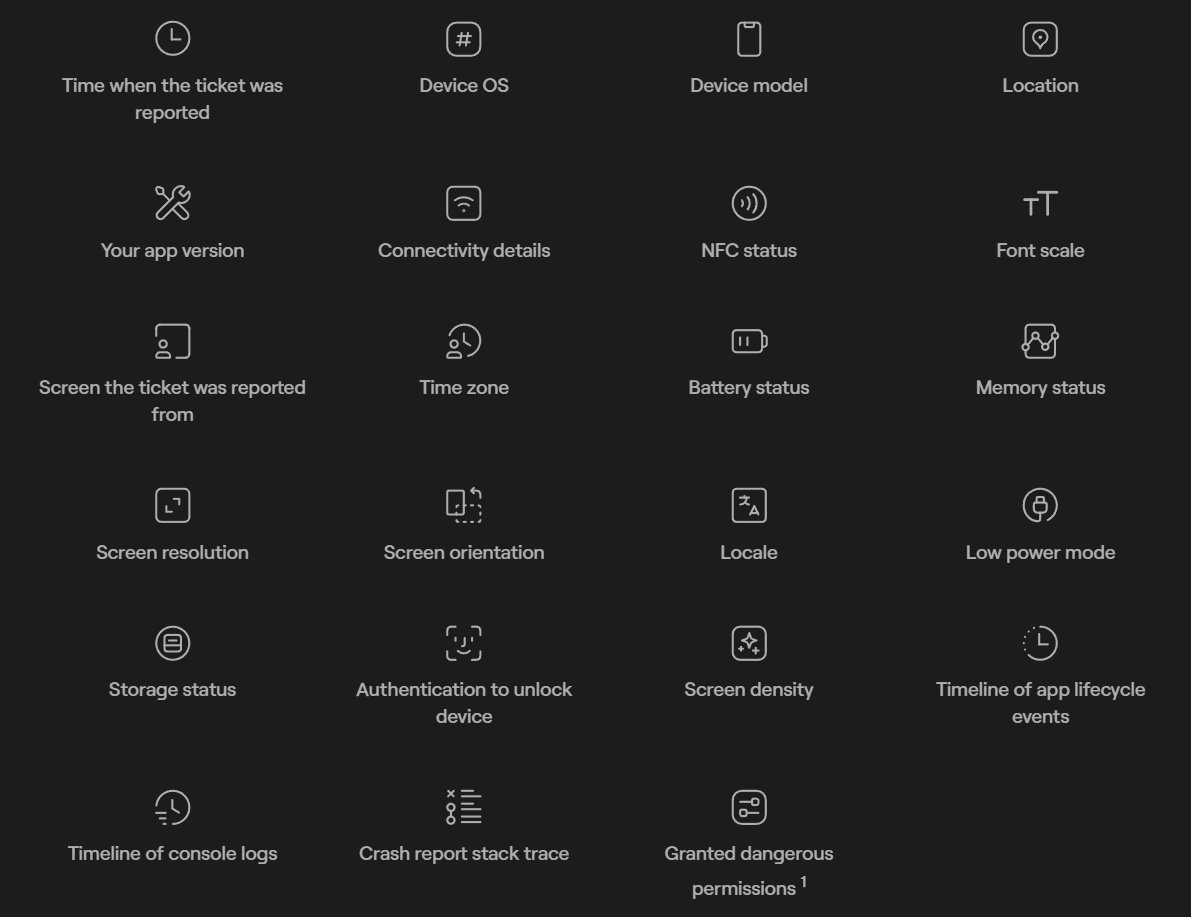
The image above showcases the data that Shake automatically attaches to tickets.
Along with this data, our tool provides a detailed activity history, which contains the following pieces of information:
What’s more, some of this information can be recorded moments before a critical error or an app crash with Shake’s black box feature, ensuring developers have key insights into the source of the problem.
In conclusion, collecting comprehensive logs is an essential first step in effective log management and tools like Shake can make this process seamless and thorough.
It’s clear that to cover all app services, you’ll be collecting logs from many sources.
While each of the sources we will cover can provide essential log data by itself, collecting logs from multiple sources ensures a holistic view of your application’s performance and potential issues.
This app logging practice helps provide insights by finding patterns, correlations, and anomalies that might be missed if logs were collected from limited sources.
Additionally, when something goes wrong, having a diverse set of data can help developers trace the issue through every layer and app component.
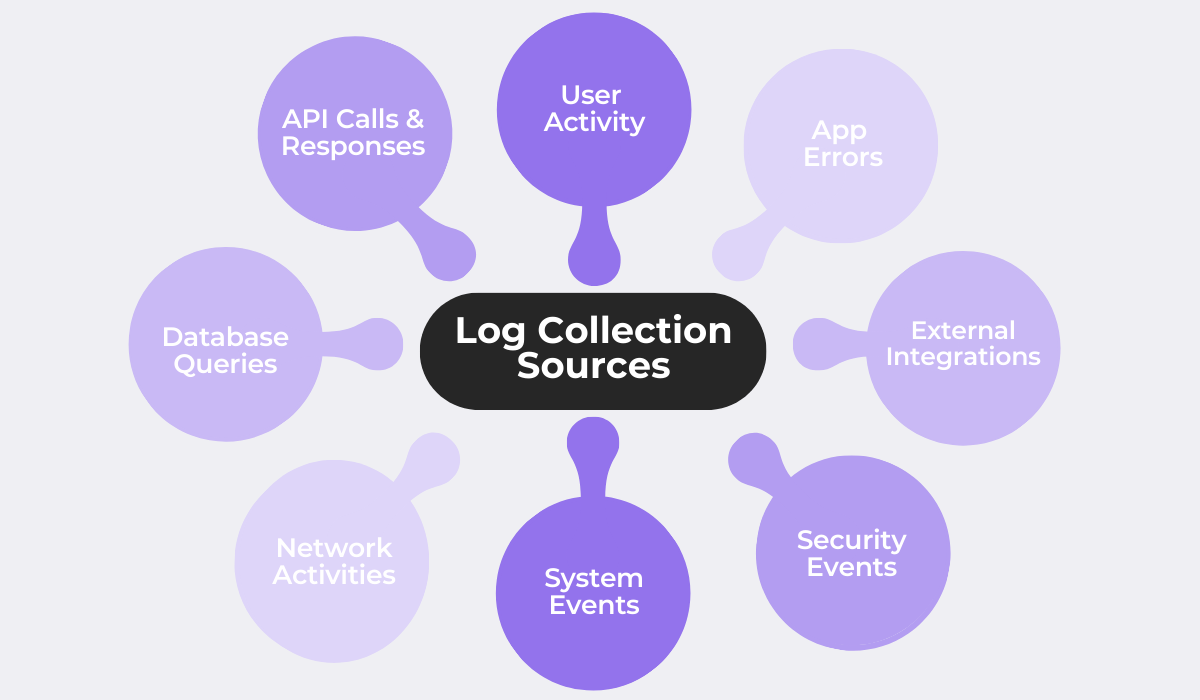
The image above shows some of the sources for logs you might want to collect. Each source serves a different purpose and is a part of the greater picture.
Collecting logs from various sources typically involves integrating logging mechanisms into each component or service of your application.
For example, developers can enable SQL debugging to log all SQL statements being executed, which can be invaluable for troubleshooting database-related issues.
Overall, by collecting logs from a wide range of sources, you get a 360-degree view of your application and ensure no component is missed.
With so many logs coming from different sources, you need to make sense of them all.
Aggregating logs into a standardized format is a pivotal step in effective app logging, which ensures consistency across logs and makes them easily digestible for both humans and machines.
Consider a typical log depicting a successful login.
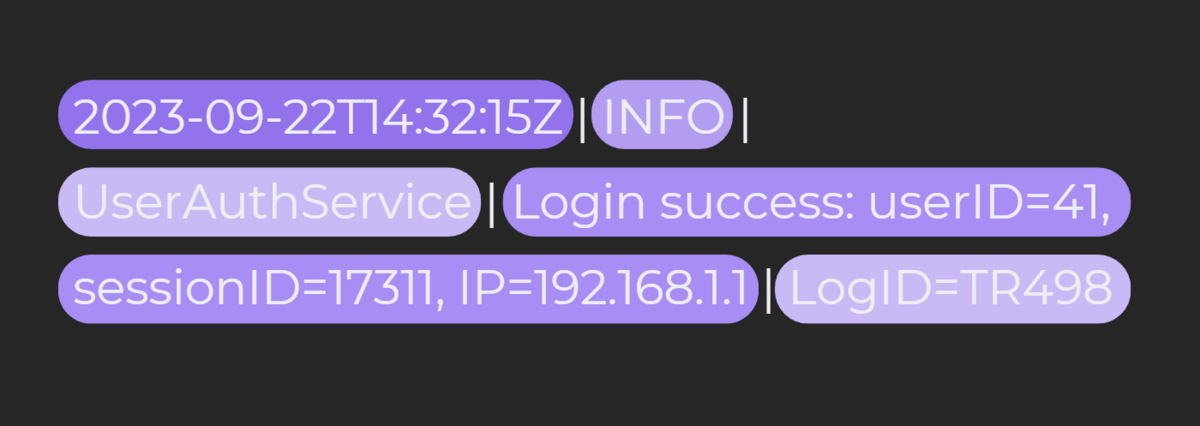
Logs like the one above are often automatically generated by user authentication systems.
This log, for instance, has several distinct components, from the date and log level to the message and ID of the log.
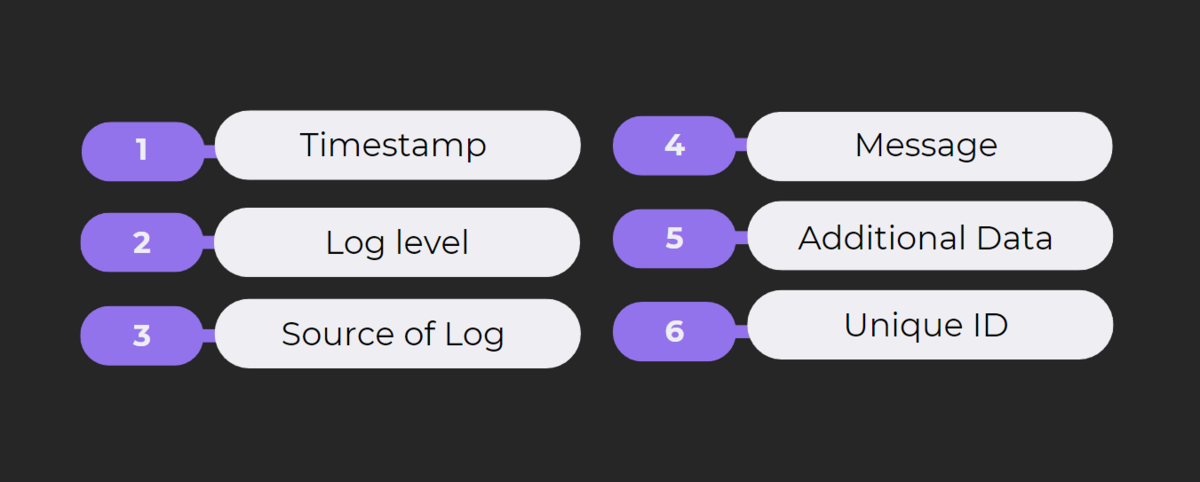
One essential practice is to ensure logs taken from every source and app service adhere to a similar structure and have each element in a consistent order.
Aggregating the logs and ensuring uniformity allows developers and system administrators to swiftly understand and act on the log information.
Moreover, converting all logs into a structured format, like JSON, enhances their accessibility to automated tools and machines.
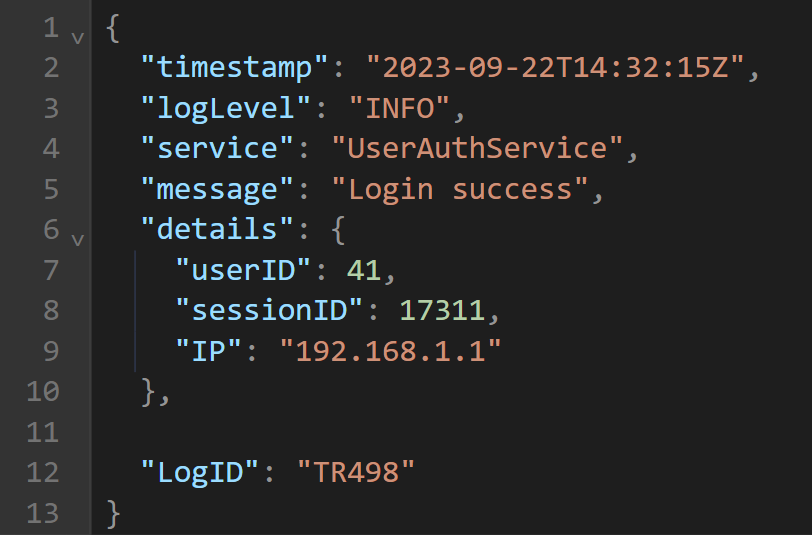
The image above shows the log from our example in JSON format, which simplifies data representation, making it more organized and easier to parse.
JSON, being a lightweight data interchange format, is both human-readable and machine-parsable.
In conclusion, by aggregating logs and standardizing their formats, you streamline the process of log analysis, making it efficient and effective.
Now that you’ve got these logs in a neat format, where do you put them?
Storing logs efficiently is as crucial as collecting them.
Centralizing log storage offers several advantages that mainly aim to ensure logs are easily and quickly accessible by each stakeholder in an organization.
Storing logs in a centralized database ensures the following:
One popular method to process and store logs is the ELK stack. ELK stands for Elasticsearch, Logstash, and Kibana.
In the context of storage, Logstash processes incoming logs, and Elasticsearch stores them.
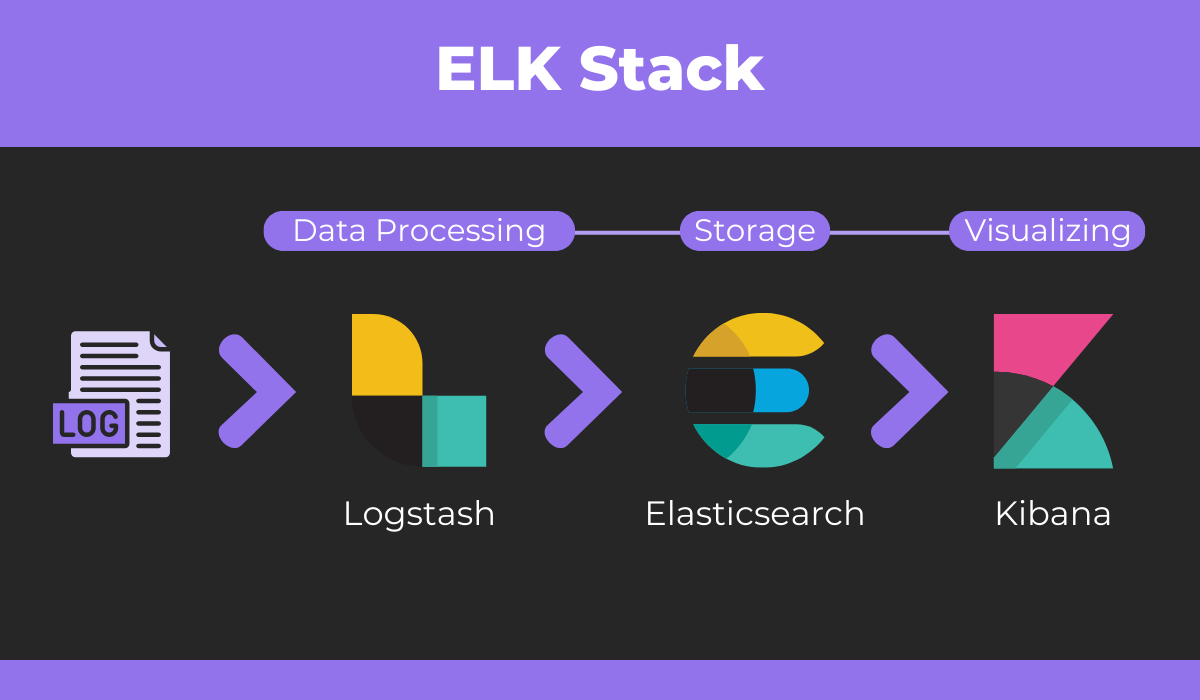
We’ll mention the visualization and analysis aspects of the ELK stack and Kibana in the next section.
But for now, it’s enough that you understand that centralizing logs is essential to optimizing storage and simplifying the next step in log management.
From collection to storage, we’ve set the stage. Now, let’s dive into the heart of log management—log analysis.
Analyzing logs is a paramount step as it transforms all of the raw data you collected into actionable insights. It’s the bridge between mere data collection and utilizing the same data for informed decision-making.
Log analysis serves several different functions, some of which are shown next.
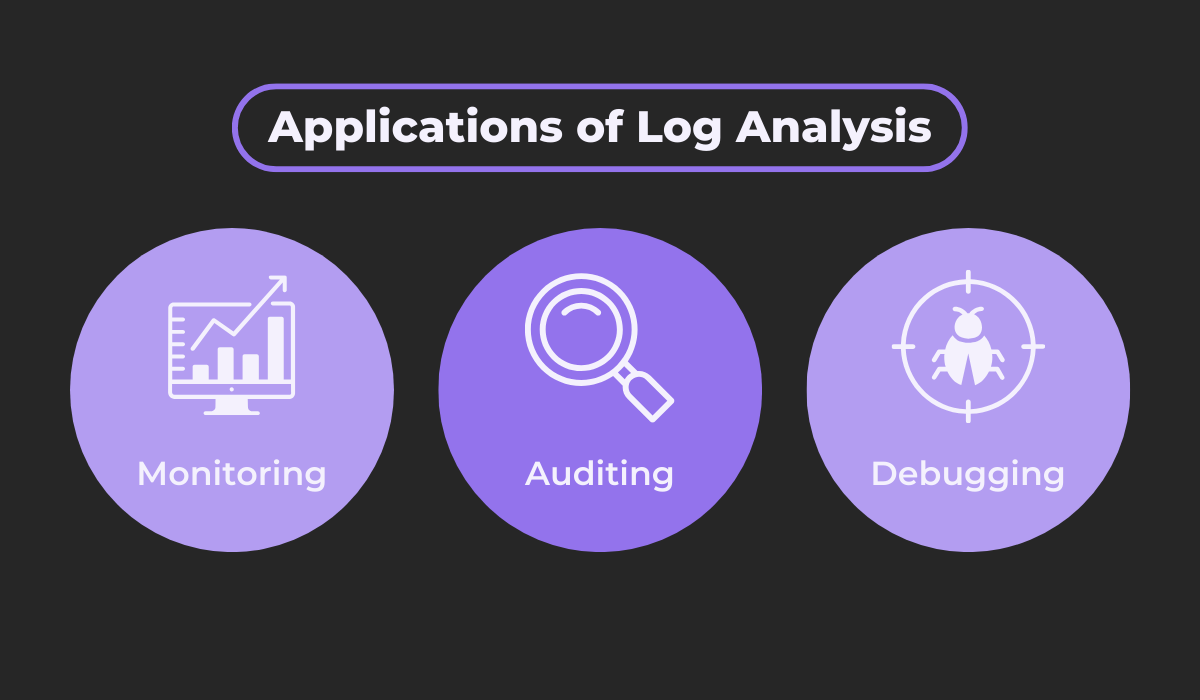
By analyzing logs, you can monitor your app and keep a pulse on its health, ensuring everything runs smoothly and identifying potential issues before they escalate.
Moreover, logs provide a record of all activities, which is invaluable for the QA team to perform audits and ensure compliance with internal security policies or external regulations.
Finally, if things go wrong, analyzing logs is the key strategy the dev team uses to debug an app.
We touched upon the ELK stack in the previous section.
In the context of log analysis, Elasticsearch enables you to search and analyze the log data, and Kibana helps visualize it and present it in an easily digestible format.
Other tools on the market, like Sematext offer similar analysis features.
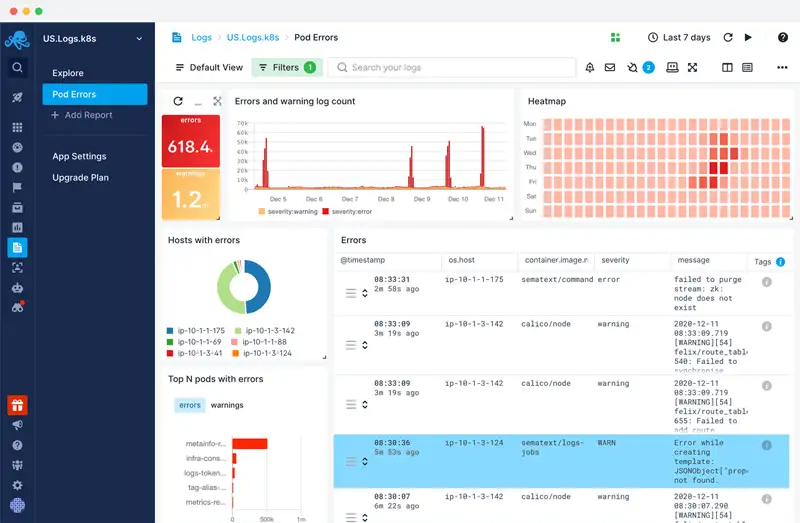
The dashboard above showcases a typical log analysis, highlighting the error and warning level log count, among other data points.
The analysis dashboards are customizable, so different stakeholders can set them up to get access to the metrics they need.
As you can see, log analysis is the key to unlocking the value of your data.
Use the right tools, ask the right questions, and let your logs guide your next steps.
For our sixth guide section, we have continuous log monitoring and alerts.
Setting up the right alerts and automating this process ensures that you’re always in the loop and continuously monitoring your logs for any anomalies, potential security breaches, or critical errors.
And all of it is done in real-time.
Your first step should be to choose what to keep an eye on.
Take a look at some commonly monitored activities:
Once you’ve decided on the activities, it’s time to set up alerts.
Many platforms offer features for continuous log monitoring.
Let’s take Google Cloud as an example. It allows you to easily create log-based alerts.
Just give a description of the alert, choose the relevant logs, and set up the triggers and notification options.
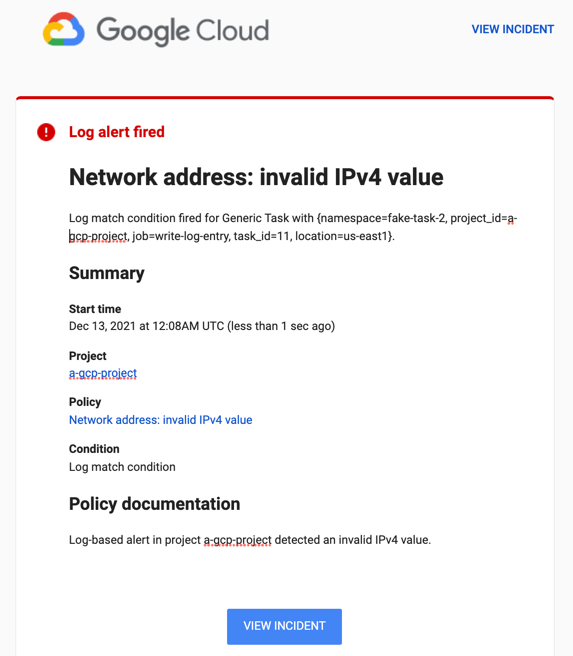
And with that, the right teams will receive a notification if any crucial data appears in your logs.
If you configured an email notification channel in Google Cloud, then the notification would look something like the screenshot above.
In summary, it’s a good idea to keep a watchful eye on your logs, and with the right alerts, you can monitor them and ensure no critical event goes unnoticed.
Logs aren’t just a developer’s tool but a treasure trove of insights for various stakeholders.
From system administrators to product managers, different teams can glean valuable information from logs, provided they have access.
However, although all stakeholders should be able to access log data, not every piece of data needs to be accessible to everyone.

Bug and crash reporting tool for apps that gets you all the right data.
Giving unrestricted access can pose security risks and can simply be counterproductive. Just imagine sifting through heaps of unrelated logs just to find that one piece of information relevant to your task.
For example, as Keith Kuchler writes in a DevOps article:
…developers don’t need access to all of your production logs if approximately 95 percent of their work happens prior to reaching the production environment.
This is where Role-Based Access Control (RBAC) comes into play.
RBAC ensures that stakeholders have access only to the logs pertinent to their roles.
Some log management solutions, like Papertrail, offer features to streamline this process, as shown next.
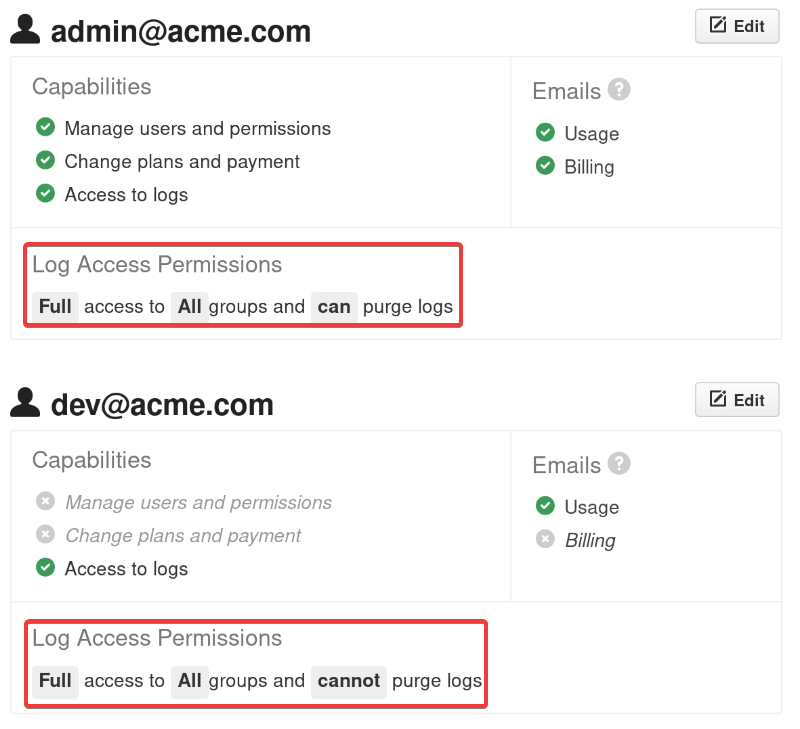
In the image, you can see a hypothetical team setup. The admin has full log access across all groups and can purge logs.
In contrast, the developer, while having access to all logs, can’t purge any of them.
By setting up such access controls, you ensure that your team can efficiently use log data without being overwhelmed or accessing sensitive information they shouldn’t.
Logs are powerful pieces of information but only in the right hands, so carefully setting accessibility is essential.
When the usefulness of logs ends, you need to figure out what to do with them.
Logs, like all data, have a life cycle.
While they’re invaluable when fresh, as they age, their immediate relevance diminishes.
However, that doesn’t mean they should be discarded immediately. Archiving is the middle ground between immediate access and deletion.
Why not just keep everything on hand? Well, storage isn’t infinite.
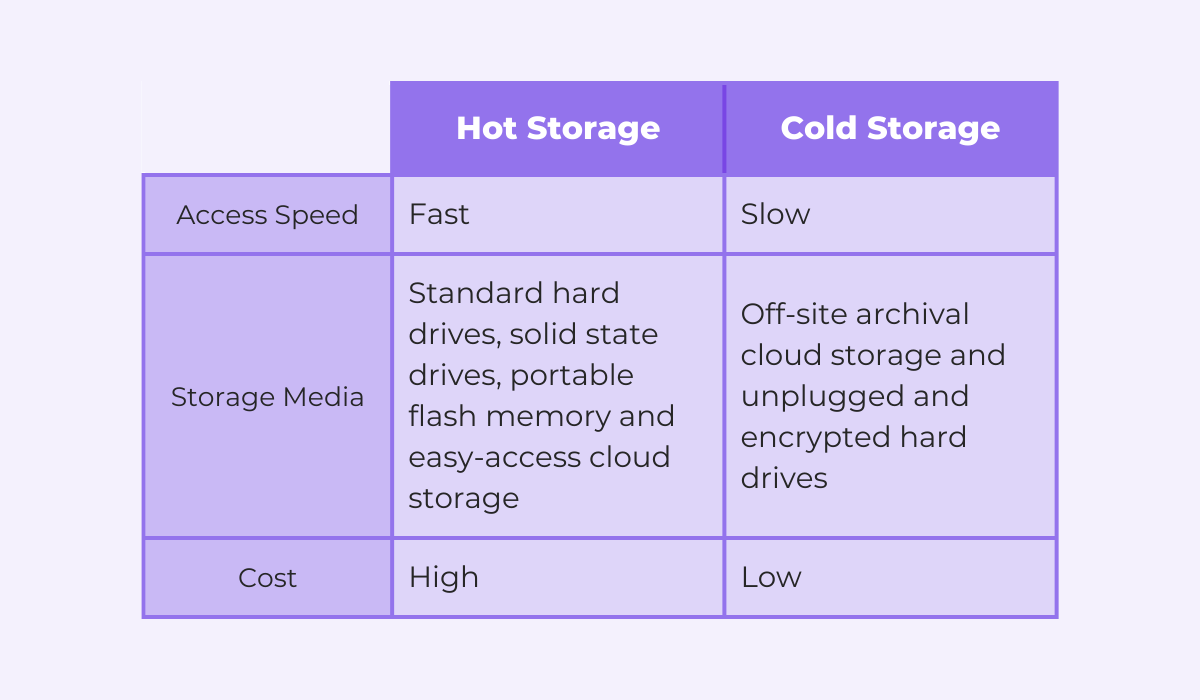
The image above compares the easily accessible hot storage and the cold storage, usually utilized for archiving data.
Storing all of your logs in standard drives or easily accessible cloud storage is unnecessary and will quickly empty out your wallet.
A more cost-effective approach is to regularly transfer older logs to cold storage solutions, either physical storage or archival cloud storage like Amazon S3 Glacier.
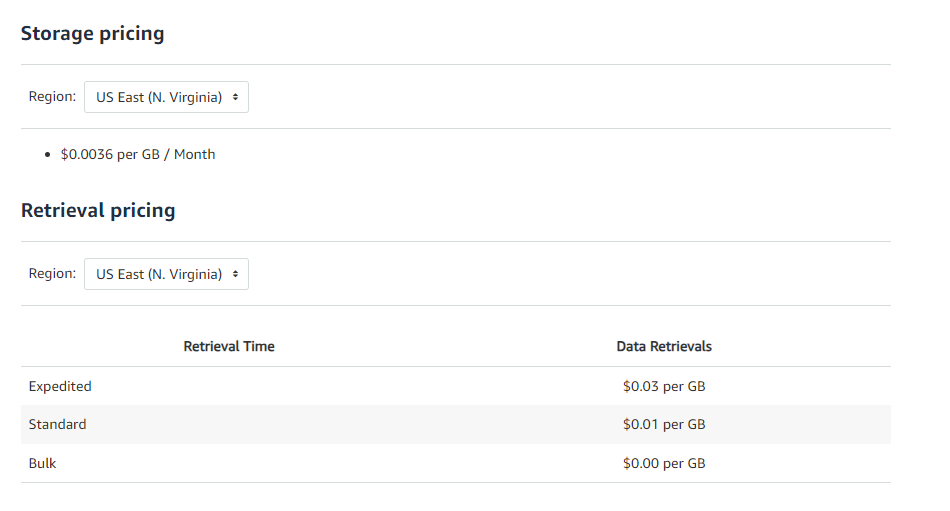
As you can see from the image above, this type of storage is significantly more affordable, as you only need to pay a fraction of a dollar as a monthly fee for each gigabyte you store.
However, make sure to factor in retrieval times and potential fees if you need to access this archived data.
So, while logs are invaluable, it’s essential to manage their lifecycle efficiently.
Archiving offers a balanced approach, ensuring data is available if needed, without incurring unnecessary costs.
Finally, some logs either don’t need to be archived at all or may eventually need to be deleted from any archives when they have no further use.
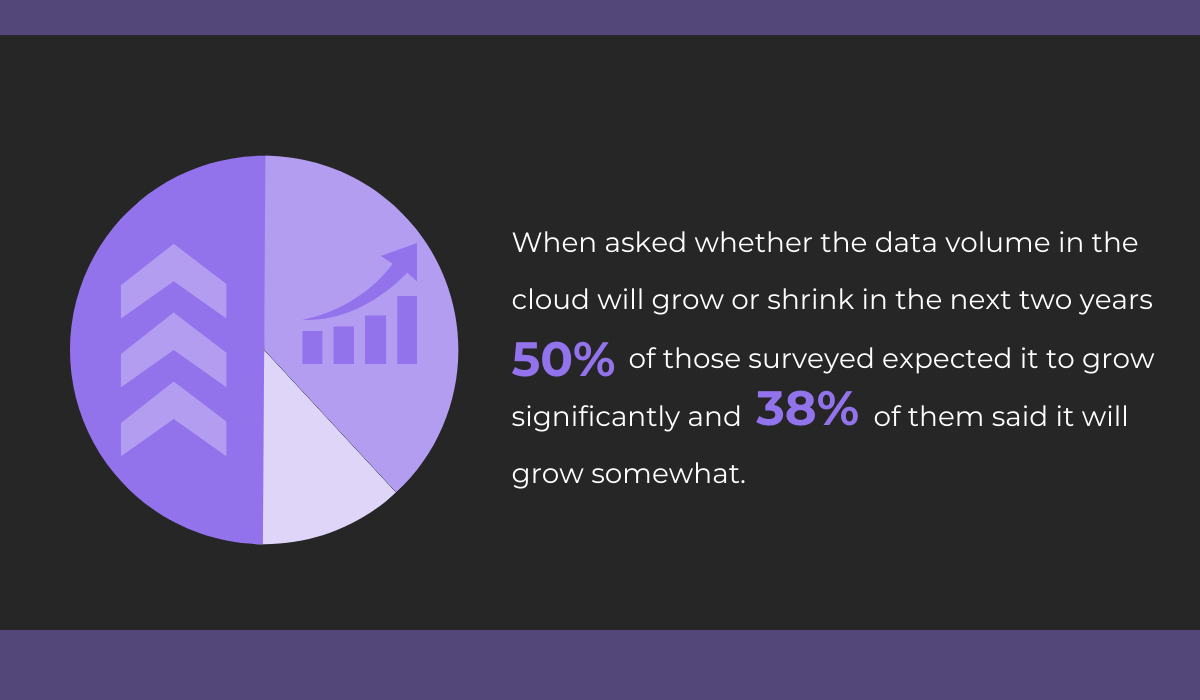
You can’t buy physical storage infinitely, and according to a Forrester report, professionals believe the volume of data in the cloud will increase in the coming years.
For businesses, this means that even the cost of archival storage can become a significant expense over time.
So, what’s the solution?
Well, you need to take care of any inefficient log retention practices and put policies in place to clarify how long logs should be kept and when they should be deleted.
Most log management tools have features to set up specific deletion rules for your logs. Take Graylog, for instance.
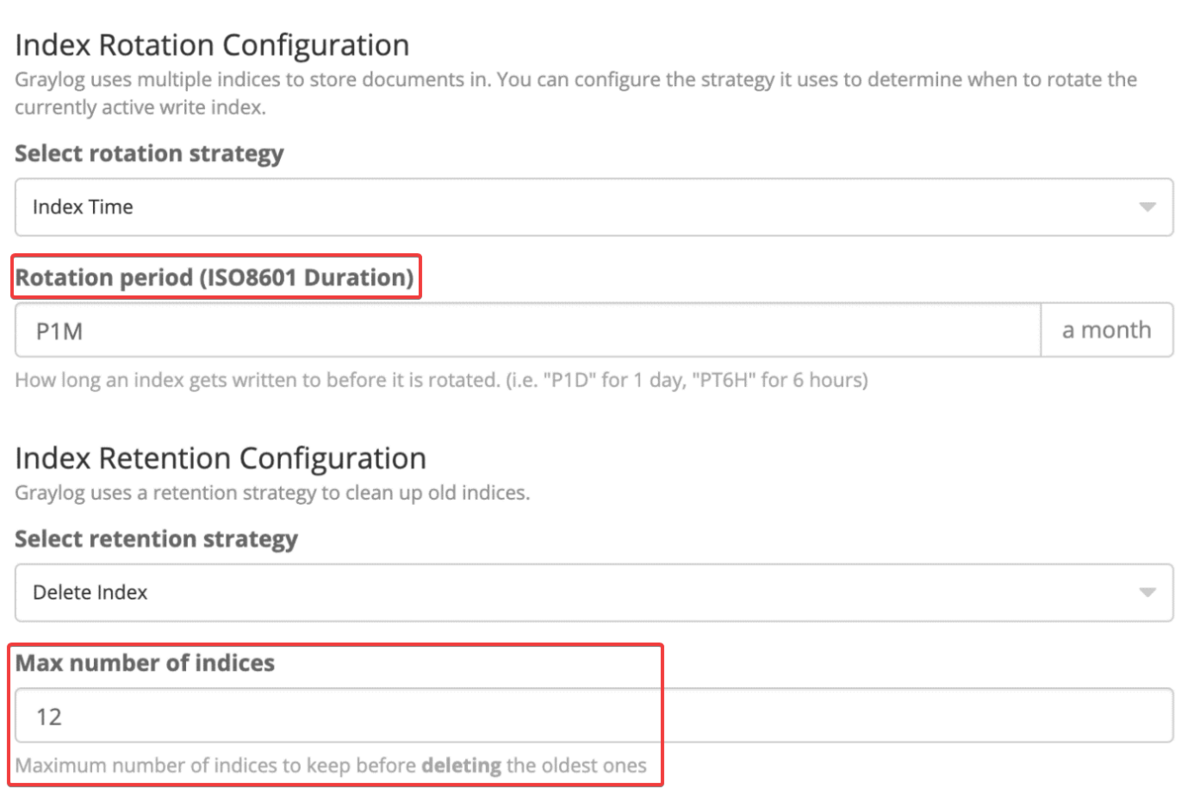
In the example shown above, there’s a 1-month rotation, meaning logs are stored in a cycle of one month.
With 12 indexes kept, it ensures a full year of data is retained. After that, older logs are deleted to make space for new ones.
However, a word of caution: some logs have mandatory storage durations.
For instance, logs related to security incidents or those compliant with HIPAA must be retained for at least six years.
But for general logs, without such constraints, setting them up for periodic deletion instead of archiving can be a wise move.
In conclusion, while logs are invaluable, it’s essential to set up deletion policies, ensuring your storage remains optimized without compromising on essential data.
Throughout this comprehensive guide, we’ve journeyed through the intricacies of effective log management, touching on nine vital aspects that can make or break this aspect of app management.
Hopefully, you now have a clearer understanding of the importance of each step and the variety of log management tools and techniques you have at your disposal.
By following our guidelines, you can ensure that your app’s logs aren’t just meaningless data points but a source of actionable insights—aiding in quicker issue resolution, enhanced app security, and streamlined operations.
So, take control of your log management practices and use our insights to elevate your approach to handling these key pieces of data.
Shake is a bug and crash reporting tool for mobile apps. It helps developers solve reported issues in their app faster, without having to bother the user.

Add to app in minutes

Doesn’t affect app speed

GDPR & CCPA compliant