
ABSTRACT
Background Aberrant methylation of DNA acts epigenetically to skew the gene transcription rate up or down. In this study, we have developed a comprehensive computational framework for the stage-specific analysis of methylation patterns in colorectal cancer.
Methods Combining public-domain methylation and clinical data from TCGA, the methylation β - matrix was converted into M-value matrix, annotated with sample stages and analysed for stage-specific genes using multiple approaches involving stage-differentiated linear modelling of methylation patterns or their correlation with the phenotype and expression patterns. Differentially methylated genes (DMGs) were identified using a contrast against control samples (adjusted p-value <0.001 and |log fold-change of M-value| >2). These results were further filtered using a series of all possible pairwise stage contrasts (p-value <0.05) to obtain stage-specific DMGs. These were then subjected to a consensus analysis, followed by Kaplan–Meier survival analysis to explore the relationship between methylation and prognosis for the consensus stage-salient biomarkers.
Results We found significant genome-wide changes in methylation patterns in cancer samples relative to controls agnostic of stage. Our stage-differentiated analysis yielded the following stage-salient genes: one stage-I gene (“FBN1”), one stage II specific gene (“FOXG1”), one stage III specific gene (“HCN1”) and four stage IV specific genes (“NELL1”, “ZNF135”, “FAM123A”, “LAMA1”), which could be used for stage-specific diagnosis. All the biomarkers were hypermethylated, indicating down-regulation and signifying a CpG island Methylator Phenotype (CIMP) manifestation. A prognostic signature consisting of FBN1 and FOXG1was significantly associated with patient survival (p-value < 0.01) and could be used as a biomarker panel for early-stage CRC prognosis.
Conclusion Our workflow for stage-differentiated consensus analysis has yielded stage-salient diagnostic biomarkers as well as an early-stage prognostic biomarker panel. In addition, our studies have affirmed a novel CIMP-like signature in colorectal cancer, urging clinical validation.
Supplementary Information Supplementary information could be found at https://doi.org/10.6084/m9.figshare.13013852
INTRODUCTION
Colorectal cancer (CRC) is a clinically important malignant disease with devastating incidence and mortality, claiming the third spot among all cancers globally, only after lung and breast cancers, and accounting for 1.36 million new cases annually [1]. The etiology of CRC involves chromosomal instability (CIN) (involving accumulation of mutation in oncogenes and tumor suppressor genes), microsatellite instability (MSI) (leading to loss of DNA mismatch repair) and CpG island methylator phenotype (CIMP), each of which accounts for nearly 85%, 15% and 10–40% respectively of all reported sporadic cases [2, 3,4].Epigenetic dysregulation is a key driver of these processes, and DNA methylation is the most important epigenetic modification [5,6]. DNA hypomethylation could cause gain-of-function of oncogenes [7], and might severely aid tumor progression in the advanced stages [8]. More recently, Timp et al. found that large hypomethylation blocks (hundreds of kb) are a universal characteristic of colorectal cancers and other solid tumors [9]. DNA hypomethylation could also contribute to tumor initiation and progression by a general increase in genomic instability [10]. DNA hypermethylation could cause a loss of function of tumor suppressor genes, and hypermethylation in the germline could cause heritable loss of gene expression through genomic imprinting. Aberrant DNA hypermethylation of specific CpG islands has been observed to occur in colorectal cancer. The CpG island methylator phenotype (CIMP) was first described in a subset of colorectal cancers in 1999 [11] and was subsequently narrowed down to hypermethylation of five genes CACNA1G, IGF2, NEUROG1, RUNX3 and SOCS1 [12]. It is noted that the methylation changes contributing to phenotypic aberrations occur not only in the promoter regions but also in the gene coding regions and intron-exon structures[13-16].The persistence of such modifications throughout the tumor cell lifetime was demonstrated by Lengauer et al. [17], who also showed correlation between genome instability and methylation aberrations, suggesting that methylation abnormalities played a key role in tumorigenic chromosomal segregation processes.
The Cancer Genome Atlas (TCGA) is a comprehensive resource of genome-wide mutation, expression and DNA methylation profiles for 46 types of cancers [18]. Besides the TCGA, the International Human Epigenetic Consortium (IHEC) is specifically devoted to data-driven understanding of the role of epigenomics in normal vs disease states [19]. Methylation patterns constitute an emerging class of promising prognostic factors due to the following reasons: (i) the persistence of widespread DNA methylation changes; (ii) the occurrence of such changes much ahead of the consequent changes in gene expression; and (iii) the ability to detect these changes in body fluids and blood plasma [20]. Early detection may reduce the mortality rate by tailoring the treatment regimen, with fewer side-effects and better patient compliance. Few methylation markers have been previously translated to clinically applicable biomarkers [21]. Chen et al., heralded an era of methylation-based tests by demonstrating an effective screening method to identify multiple types of cancer based on a blood test four years before conventional diagnosis [22]. A consensus approach to identifying significant methylation signatures in each stage of colorectal cancer progression would increase the utility and reliability of putative biomarkers. This motivated our interest in investigating stage-specific DMGs using several model-driven approaches, and evaluating their prognostic significance.
METHODS
Data Preprocessing
Processed 27k methylation data (gdac.broadinstitute.org_COADREAD.Merge_methylation _humanmethylation27_jhu_usc_edu_Level_3_within_bioassay_data_set_function_data.Leve l_3.2016012800.0.0.tar) was retrieved from The Cancer Genome Atlas (TCGA) through firebrowse portal (www.firebrowse.org) [23] and the latest clinical data (clinical.cases_selected.tar.gz) was obtained from the GDC data portal (https://portal.gdc.cancer.gov/repository) by matching on patient barcode. The data containing the methylation β-values for each probe in each sample was converted into a matrix with probes as rows and samples as columns. Each probe corresponds to one CpG site in the genome. A single gene may be under the control of multiple epigenetic sites, hence multiple probes may be associated with the same gene. It is noted that multiple probes usually exist for the same gene. The probes which have “NA” values were discarded from the analysis. To transform the range of methylation values from (0,1) to (-∞,+∞), we used the following function on the β-matrix values, to obtain the M-value matrix [24]:
 In our study, two M-value matrices were considered: one, where all the probes were used in the analysis; and two, where the probes corresponding to one gene were represented by an average of their values (“averep”), thus reducing the M-value matrix from a probe-sample matrix to a gene-sample matrix. Further, we filtered out the probes/genes showing little change in methylation (defined as σ < 1) across all samples in the M-value matrices. The stages were annotated for both the β-matrix and M-value matrices using the clinical data encoded in the “Pathologic_stage” attribute. Samples with “NA” values for stage information were discarded from the analysis. The sample counts in various stages are represented in Table 1.
Sample Counts in COADREAD 27kcancer data from TCGA. In the final analysis, the sub-stages were combined into the parent stage.
The final β and M-value matrices were subjected to stage-differentiated contrast analysis with a battery of six different methods, described below. All analysis was carried out on R [25].
Models
Linear model analysis: Linear modelling is essential to identify linear trends in expression across cancer stages and thereby detect stage-sensitive patterns. We used the R limma, we used the R LIMMA package [26] for Linear modelling
Using the complete M-value matrix, with multiple probes per gene (given in S1).
In both the linear models, the control samples contributed to the intercept of the design matrix, while the stages were represented as indicator variables [27]. The linear fit was subjected to empirical Bayes adjustment to obtain moderated t-statistics. These results were then used for the stage-differentiated contrast analysis (described below).
Linear modelling with the averep matrix: This is essentially similar to the above model, except that the input is the averep matrix, where each gene is represented by the average M-value across all its probes (dataset provided in S2). These alternative representations of the methylation data negotiate a tradeoff with respect to information preservation and interpretability.
Association between methylation status and phentoype: The strength of the association between the methylation levels of CpG sites and the phenotype of interest (CRCstage) could enable the identification of relevant markers. We used the R package CpGassoc [28] to perform this analysis with the stage-annotated β-matrix as input. Five factors were specified (control, stage I, stage II, stage III, stage IV), and the stage-differentiated contrast analysis protocol (given below) was then carried out.
The Chip Analysis Methylation Pipeline (ChAMP): The Chip Analysis Methylation Pipeline (ChAMP) integrative analysis suite uses limma to identify differentially methylated probes (DMPs) from the β-matrix [29]. A mapping of sample IDs with the clinical stage phenotype was provided as an additional input file. The results from this analysis were subjected to the stage-differentiated contrast analysis. In addition, the identification of differentially methylated regions (DMRs), consisting of polygenic genomic blocks, was performed using DMRcate in ChAMP (with preset p-value cutoff <0.05) [30]. GSEA was used to identify the enrichment of DMPs and DMRs in the MSigDB pathways [31], using the Fisher Exact test calculation with adjusted p-value < 0.05.
Modelling expression from methylation: We used the R BioMethyl package to model a gene’s aggregate expression level from its methylation patterns recorded in the β-matrix [32]. The estimated gene expression matrix was then subjected to linear modelling with limma, and subsequently stage-differentiated contrast analysis was carried out.
Correlation between gene methylation and expression: We used MethylMix2.0 to estimate the correlation between the actual methylation and expression patterns of each gene [33]. The expression data for the samples of interest were retrieved from TCGA (gdac.broadinstitute.org_COADREAD.Merge_rnaseqv2_illuminaga_rnaseqv2_unc_edu_Lev el_3_RSEM_genes_data.Level_3.2016012800.0.0.tar.gz). MethylMix was executed with the preset correlation cutoff (> |0.3|), and statistical significance was assessed using Wilcoxon Rank Sum test with preset p-value (< 0.05).
Stage-differentiated contrast analysis (common to the linear models)
A directed two-tier set of contrasts was performed in limma to drill down to the stage-specific genes:
Tier I: Stage-differentiated contrast against controls. Four pairwise contrasts were performed, one for each of the stages I, II, III and IV. To identify reliable DMGs, the following criteria were used: |lfc M-value| >2, and adj. p-value <0.001.
Tier II: Inter-stage contrasts. Six pairwise contrasts between the stages (namely, I-II, I-III, I-IV, II-III, II-IV, and III-IV) were performed (p-value for each contrast <0.05).
To illustrate, aputative DMG identified in Tier I would undergo three inter-stage contrasts in Tier II, to ensure stage-specificity. For example, a stage-II DMG established by Tier I, would undergo the following inter-stage contrasts: Stage-II vs Stage-I, stage-II vs stage-III and stage-II vs stage-IV, before being confirmed as a stage II-specific DMG.
Identification of stage-salient biomarkers
Finding the consensus of a set of methods with different algorithms overcomes the biases specific to individual methods, and enables screening out false positives. Consensus was obtained by finding the agreement among the results of the various methods used. If three methods agreed for any stage-specific differentially methylated gene DMG, it was adjudged as a consensus stage-salient biomarker.
Survival analysis
The survival data for each patient was obtained from the following attributes encoded in the clinical data: patient.vital_status, patient.days_to_followup, and patient.days_to _death. The association between consensus stage-specific differentially methylated genes and case overall survival (OS) was evaluated by univariate Cox proportional hazards regression model using the R survival package [34]. This uncovered potential prognostic stage-salient genes) from the methylation analysis, using a significance cutoff < 0.05. Such prognostic genes were used as the independent variables in a regression model to estimate the survival risk of each patient. Based on this risk score, patients with colorectal cancer were categorized into high and low groups by the optimal cut point determined by the maxstat (maximally selected rank statistic) value [35]. Kaplan-Meier estimation was used to evaluate if the median survival time was significantly different between these two groups. This enabled the assessment of prognostic relevance of the identified consensus stage-specific differentially methylated genes.
RESULTS
Linear modelling at the probe-level
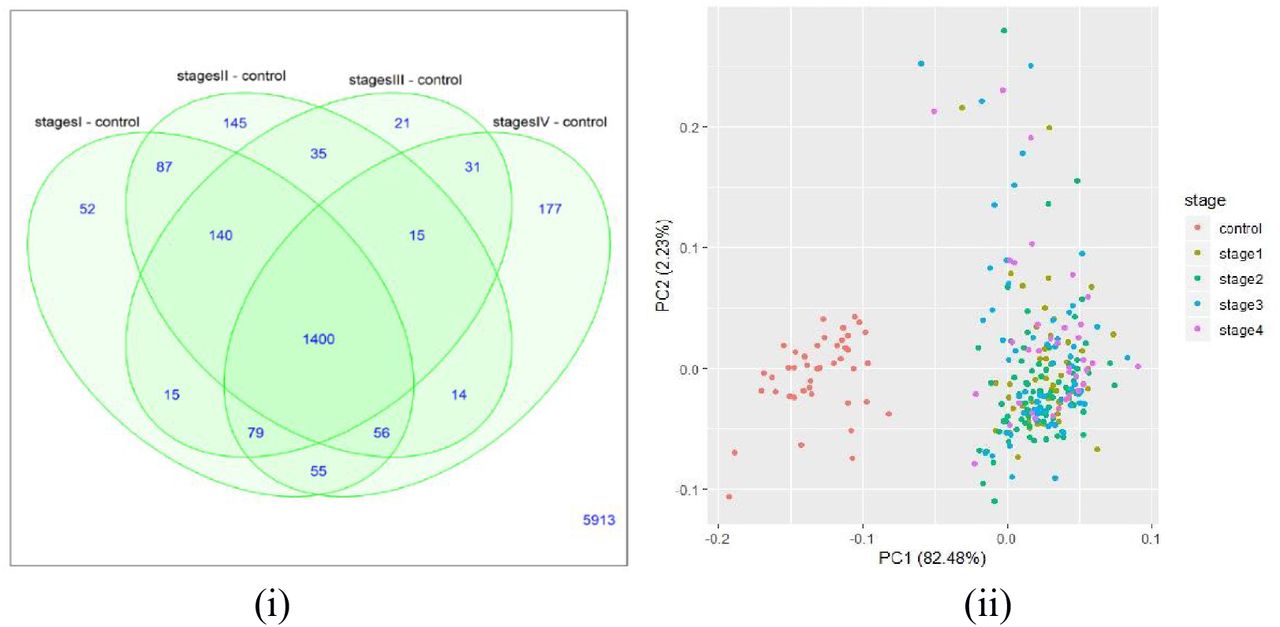
The number of significant genes present in each stage-control pair from the Tier-I contrasts is shown in figure 1(i). Using the top 100 genes of the linear model (given in Supplementary Information S3), we found a clear separation between controls and stage samples (Figure 1(ii)). The top differentially methylated genes identified from the linear model were visualized using boxplots (Supplementary Information S3). Figure 2 represents the boxplots for TMEM179, mutations in which could cause MSI [36], and MEOX2 whose promoter methylation status is a known CRC marker [37].The significant genes for each stage were identified and the first four genes from each stage were represented in the heatmap in figure 3.The top ten genes (ranked by adjusted p-value) in each stage with respect to control are shown in Table 2, along with their |lfc M-value| and inferred regulation status. Figure 4 shows boxplots of methylation levels. The top 100 genes significant for each stage were used for the consensus analysis and the lists of genes that were specific in each stage was given in S3.
Top 10 genes of the linear model at the probe level. The log fold-change of mvalue of the probe in each stage relative to the controls, followed by p-value adjusted for the false discovery rate, and the methylation status of the gene in the cancer stages with respect to the control

(i).Venn diagram for M-value analysis showing the distribution of number of significant genes in each stage relative to the control. (ii) Sample distribution obtained by plotting the first two principal components for the top 100 genes from the linear model. A clear separation of controls and cancer samples (labelled by stage) could be seen.
Boxplots for the differentially expressed Methylated genes using M value analysis (i) TMEM179 (ii) MEOX2

Heatmap for significant Differentially Methylated genes – M value analysis

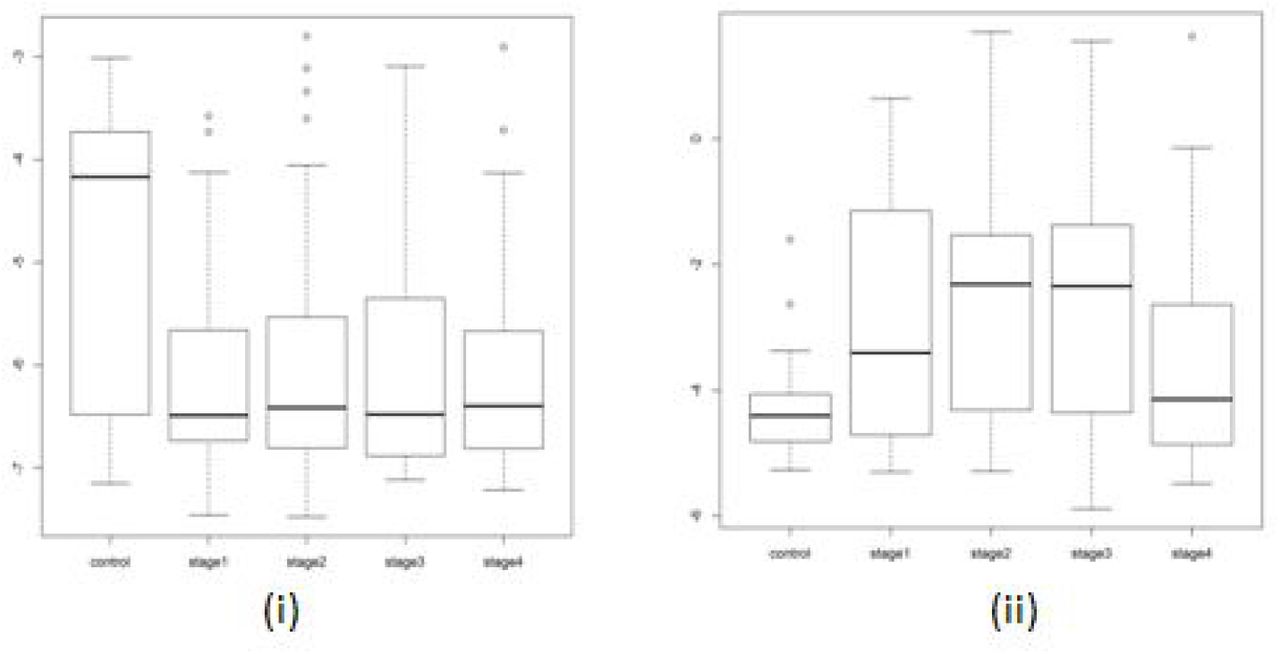
Boxplots of top 5 linear model genes. For each gene, notice that the trend in methylation could be either hypermethylated or hypomethylated relative to the control. For example TM4SF19 and KRTAP11-1 are hypomethylated where as CNRIP1, LOC100302652;GPR75 are hypermethylated.
Linear modelling at the gene-level (averep)
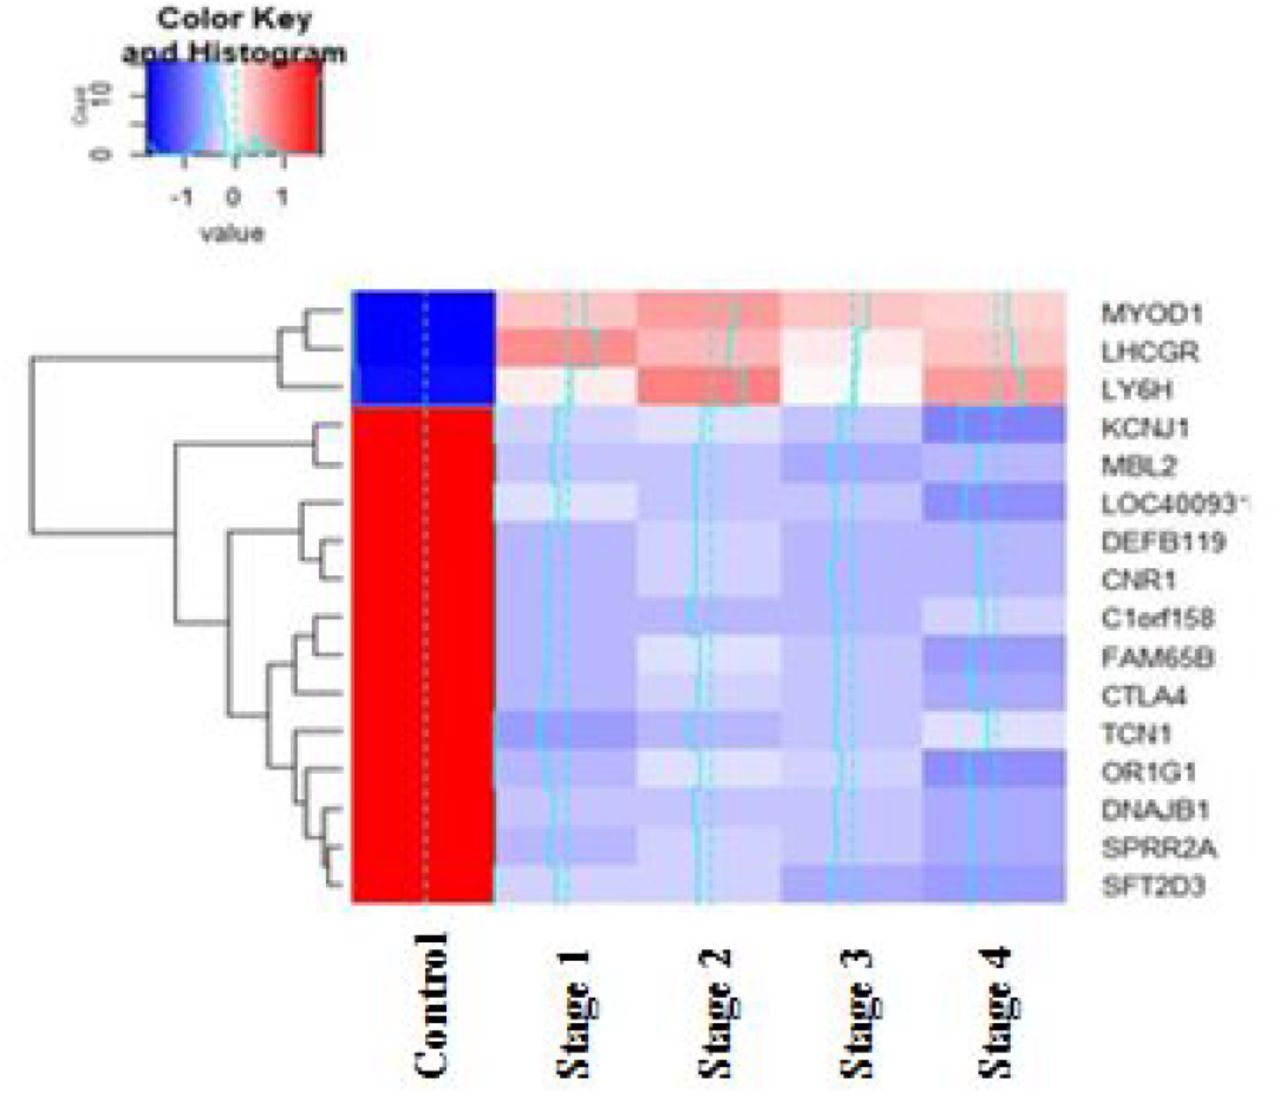
The genes with more than one probe were averaged to a single methylation value, which was then further analyzed. The number of genes present in each stage-control pair from the Tier-I contrasts is shown in figure 5(i). Using the top 100 genes of the linear model (given in Supplementary Information S4), we found a clear separation between controls and stage samples (Figure 5(ii). The top differentially methylated genes identified from linear model were visualised using boxplots (Supplementary information S4). Figure 6 shows the boxplots for two such genes, NALCN and GLRX. Mutations in NALCN have been reported in sporadic CRC [38]; here NALCN is seen to be significantly hypermethylated (Figure 6), indicating the same outcome (loss of function) could be effected in multiple ways. GLRX is a target of the activating transcription factor MEOX2 [39]. The significant stage-specific genes were identified, and the top four genes based on adj. P-values from each stage were used to construct the heatmap in Figure7. The top ten genes (ranked by adjusted p-value) in each stage with respect to control are shown in Table 3, along with their |lfc M-value| and inferred regulation status. Figure 8 shows boxplots of the methylation levels. It is observed that LY6H showed both hypermethylation and hypomethylation when compared to the control samples, indicating the need for experiments to clarify its role in colorectal cancer progression. The top significant 100 genes of each stage were used for consensus analysis and the lists of genes that were specific in each stage was given in S4.
Top 10 genes of the linear model at the gene level, using average values of methylation. The log fold-change of M-value of the gene in each stage (relative to the control) is given, followed by p-value adjusted for the false discovery rate and the methylation status of the gene in the cancer stages with respect to the control. A consistent methylation pattern is observed for all the top genes.

(i).Venn diagram for Gene-level analysis showing the distribution of number of significant genes in each stage relative to the control. (ii) Sample distribution obtained by plotting the first two principal components for the top 100 genes from the linear model. A clear separation of controls and cancer samples (labelled by stage) could be seen.

Boxplots for the differentially expressed Methylated genes using averep analysis (i) NALCN (ii) GLRX

Heatmap for significant Differentially Methylated genes – Gene mapped analysis

Boxplots of top 5 linear model genes. For each gene, notice that the trend in expression could be either hypermethylated or hypomethylated relative to the control. For example TM4SF19 and KRTAP11-1 are hypomethylated where as LOC100302652;GPR75, CNRIP1, ADHFE1are hypermathylated
Association with phenotype
The results of the CpGassoc analysis are shown in Figure 9. Significant genes for each stage were identified using the criteria given in Methods (Figure 9). The top 100 genes of each stage from this analysis (given in Supplementary Information S5) were taken for consensus analysis.

Venn diagram for CpG association analysis showing the distribution of number of significant genes in each stage
DMP analysis with ChAMP
The quality of the data was evaluated using ChAMP and shown in Figure 10.

Data distribution (i) based on Genomic position: opensea, shore, island, shelf; (ii) based on gene context: TSS, exon IGR, 5’UTR, 3’UTR (ii) based on TSS region
The DMPs were identified using CHAMP analysis from the β matrix, and illustrated in Figure 11(i). Figure 11(ii) shows a representative DMR plot. In the ChAMP analysis, most of the inter-stage contrasts yielded null results (i.e, no significant genes), except for stageII – stageIV contrast. For this reason, the top 100 DMPs from the stage vs control contrasts were used for consensus analysis directly. Contrasts with significant DMPs were subjected to DMR analysis. The stage-specific DMR regions determined are provided in S6, and summarized in Table 4. It was noted that 31 DMRs were identical across stages (given in S7).The DMPs and DMRs from the analysis were subjected to GSEA and the results of the procedure are provided in S6.
Number of DMRs for each comparison

(i) DMP plot of FCN2 for control and stage I illustrating significant hypomethylation (ii) DMR plot EYA4 transcriptional activator for control and stage 1 illustrating significant hypermethylation. Solid lines represent mean values while dashed lines represent the loess.
Methylation and Gene Expression Correlation analysis report
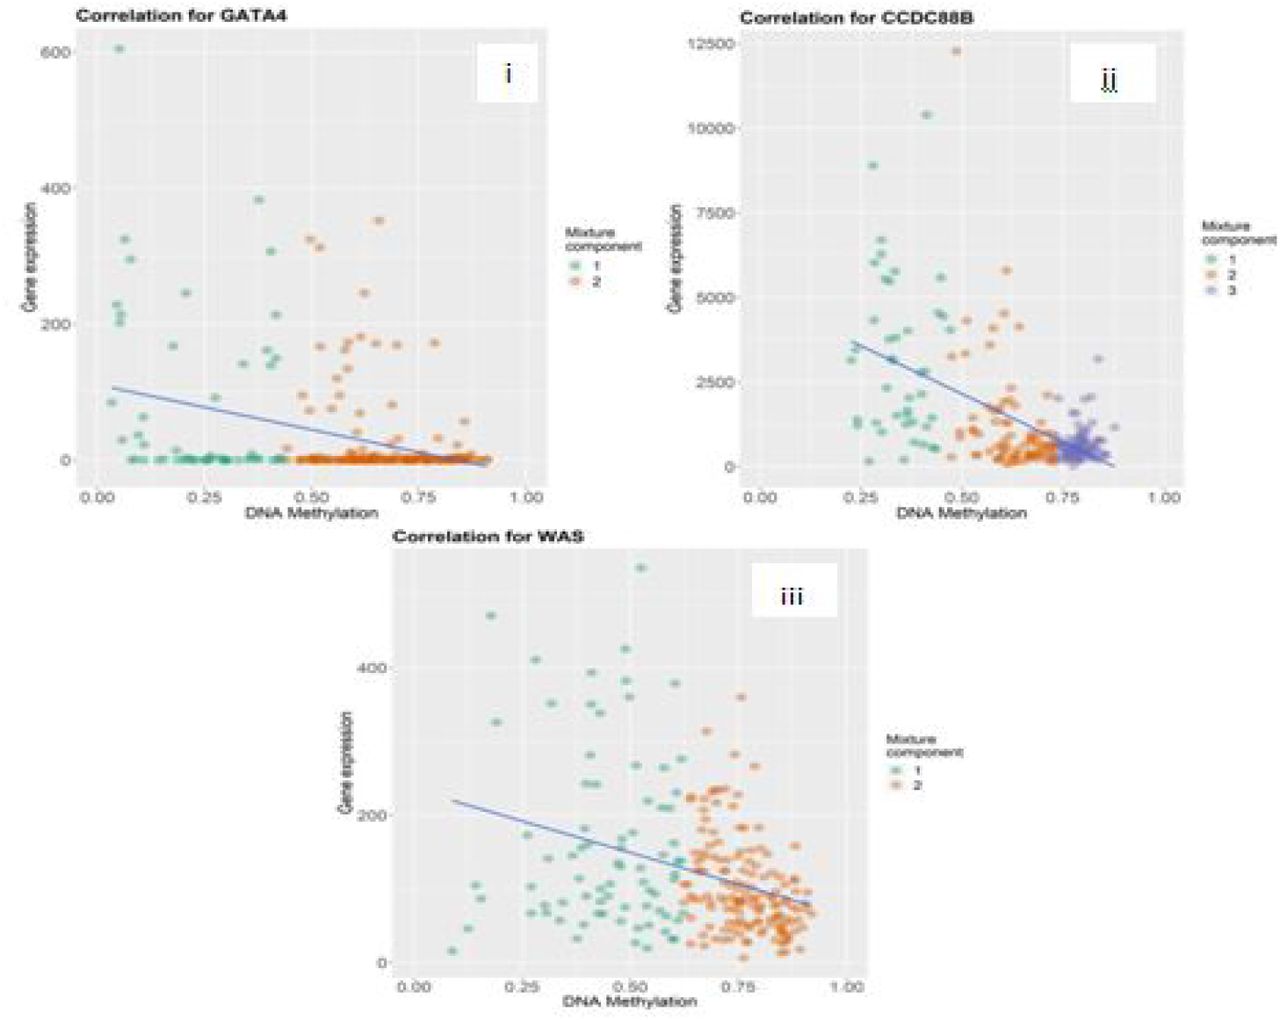
Figure 12 illustrates the correlation determined by MethylMix between the methylation levels and gene expression. Mixture models of genes, indicative of the number of methylation states, were constructed using MethylMix (Figure 13). No driver genes were determined for the between stage comparison based on this algorithm. The number of driver genes that were identified in comparisons is represented in Table 5. This package produces results calculating the DM values (differentially methylated values) based on which the hyper or hypomethylated genes were determined. The range of DM values was from −0.7 to 0.8. All the genes which were identified as stage IV specific topped among the fifty genes when sorted using DM values. These results were provided in S8. Top 100 genes from each comparison were taken for consensus analysis. It was seen that 56 genes were common in all the four comparisons; notably, CCDC88B, C1orf59, CHFR, ZP2, HOXA9, ELF5, FAM50B, MUC17, TBX20, VSIG2 were the top ten common genes. These 56 genes represented stage-agnostic genes which hold immense potential for the treatment of colorectal cancer; they are listed in the Supplementary Information S9.
Number of driver genes in each comparison
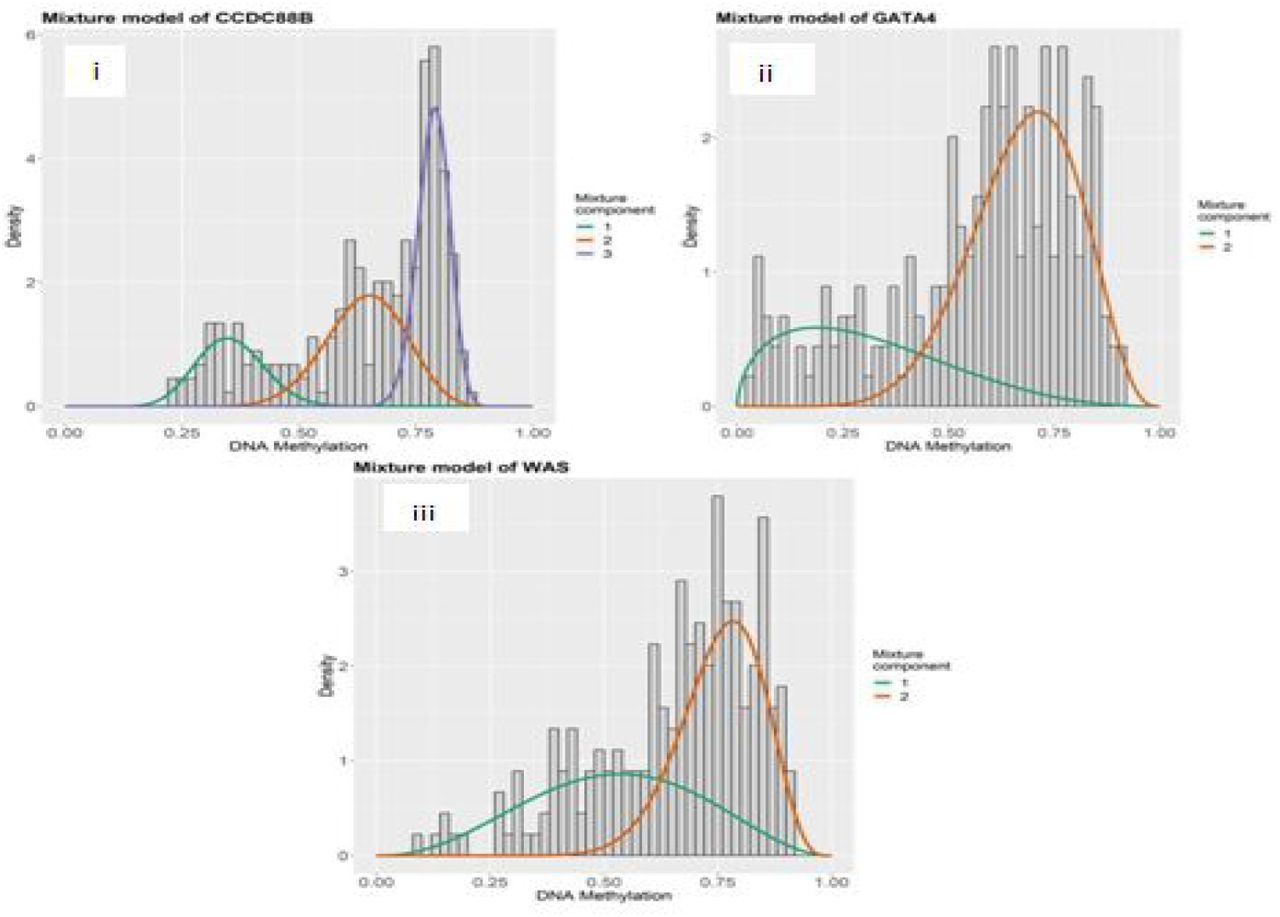
Mixture models of the genes GATA4, CCDC88B, and WAS. The x-axis indicates the degree of methylation, the y-axis indicates the proportion of density at different degrees, and the mixture component curves are density fits of the values.

Correlation plots for i. GATA4, ii.CCDC88B, iii.WAS. A negative correlation between methylation and expression is evident, indicating that methylation acts to repress gene transcription, though the strength of the inverse correlation varies from gene to gene. Colour indicates the mixture model fit (cf. Fig. 12).
BioMethyl results
The significant stage-specific DEGs identified by this BioMethyl are shown in Figure 14. Top 100 genes of each stage from this analysis were taken for consensus analysis. The stage-specific genes from this analysis are presented in the Supplementary Information S10.

Venn diagram for BioMethyl-based Gene expression modelling showing the distribution of number of significant genes in each stage relative to the control.
Stage-salient biomarkers
The top 100 significantly differentially-expressed genes of each stage from all the methods discussed above (provided in Supplementary Info S11) were used for the consensus determination. Our consensus analysis yielded seven stage-specific DMGs: one stage I specific genes (“FBN1”), one stage II specific gene (“FOXG1”), one stage III specific gene (“HCN1”) and four stage IV specific genes (“NELL1”, “ZNF135”, “FAM123A”, “LAMA1”). It was validated that each of these stage-specific genes presented an |lfc M-value| > 0.4 with respect to the other stages, establishing their stage-salience. Figures 15,16 represent the boxplots for the consensus biomarkers and Table 6 presents a summary of the consensus analysis. Gene ontology analysis of the consensus biomarkers yielded processes related to structural integrity of cell division processes, immunity dysfunction, and cell migration (Table 7) [40]. Detailed GO results are presented in the Supplementary Information S12.
Stage-salient biomarkers. The results of the consensus analysis and univariate survival analysis are summarized.
Gene Ontology for Stage specific genes

Boxplots for stage-salient genes. (i) Stage I specific Gene FBN1, (ii) Stage II specific Gene – FOXG1, (iii) Stage III specific Gene – HCN1.

Boxplots for Stage IV specific Genes (i) LAMA1, (ii) NELL1, (iii) FAM123A, (iv) ZNF135.
Survival analysis
We constructed independent prognostic models as well as combined models known Colorectal cancer Signatures (CRS) obtained by integrating the stage-salient genes. The results of the survival analysis are summarised in Table 8. The Kaplan-Meier plots for the stage salient genes are shown in Fig. 17. From the K-M analysis, we found that CRS12 and CRS34 signatures were effective in discriminating cases with significantly worse OS (P ≤ 0.02) based on the estimated signature scores (Figure 18). Survival plots for all possible signatures are provided in the Supplementary Information S13.
Coefficients based on cox regression analysis

K-M plots for the prognostically significant stage-salient genes. (A) FBN1, (B) FOXG1, (C) HCN1, and (D) LAMA1.

Survival analysis for the combination biomarker panels shows significance. (A) Early-stage panel; and (B) Late-stage panel.
DISCUSSION
CRC development is due to the accumulation of genetic and epigenetic changes of which DNA methylation is of prime importance. DNA methylation profiles of colorectal cancer have been investigated in several previous studies using various approaches [41, 42]. It is well-known that changes in methylation status correspond with CRC progression [43]. Here we have designed a comprehensive approach to systematically analyze stage-differentiated DNA methylation patterns in colorectal cancer and their relationship to patient survival. Our study has yielded consensus stage-salient significantly differentially methylated genes and evaluated their prognostic value. A total of seven genes were identified by at least two methods, and of those, six were identified by at least three methods, the exception being the stage I-specific FBN1. None of the stage-salient genes is included as a cancer gene or hallmark gene in the Cancer Gene Census [44], while HCN1 alone is reported as a candidate cancer gene based on mouse insertional mutagenesis experiments [45]. Below, a discussion of all the stage-salientDMGs (Table 6) is provided with respect to the existing literature.
Early-stage salient DMGs
Promoter hypermethylation of FBN1, a glycoprotein component of calcium-binding extracellular matrix microfibrils [46], is a recognized biomarker of CRC [47, 48]. Our analysis supports this literature, while pinpointing the stage I-specificity in its action. FOXG1 is well-known as an etiological factor in certain neurological disorders and plays a role in the epithelial-mesenchymal transition of CRC cells, a key hallmark of cancer progression and is known to be overexpressed in CRC patients [49]. It is a nodal gene, with connections to oncogenic pathways like WNT pathway in hepatocellular carcinoma [50] and TGF-β pathway in ovarian cancer [51]. Interestingly, FOXG1 was found to be a hypermethylated stage-II specific gene. HCN1, coding for hyperpolarization-activated cyclic nucleotide-gated channel is associated with low survival rates in breast, brain, and colorectal cancer [52]. We have identified HCN1 as a stage-III hypermethylated gene, suggesting a loss-of-function mechanism for its tumorigenic potential.
Stage-IV salient DMGs
Our study clearly indicated that hypermethylation of LAMA1 (which codes for α-laminin of the extracellular matrix) is a stage IV-specific signature. Experimental evidence for the hypermethylation of the promoter region of LAMA1 in CRC patients is available [53]. NELL1 is a known tumor suppressor gene [54], whose hypermethylation is associated with poor survival outcomes [55]. Our results that NELL1 is a stage IV-specific hypermethylated gene resonates with the above findings. ZNF135 is involved in regulation of cell morphology and cytoskeletal organizations, and its expression and epigenetic regulation have been reported to be key in cancers of the cervix and esophagus, respectively [56, 57]. Here we have found that epigenetic silencing of ZNF135 is a key feature of stage-IV CRC. FAM123A, also known as AMER2, is associated with microtubule proteins [58], and is a lesser known cousin of FAM123B, a tumor-suppressor whose loss-of-function by mutation, methylation and copy-number aberrations is known play pivotal roles in colorectal cancer, especially in older patients [59,60,61]. It is significant that our study has uncovered FAM123A as a hypermethylated stage IV-specific DMG, signalling the need for experimental investigations. There is very little literature on the cancer significance of any of the above stage-salient genes, marking our findings as novel and important in the context of gaps in our knowledge.
Aberrant methylation of CpG promoter regions causes stable repression of transcription leading to gene-silencing [62,63]. In the context of tumorigenic processes, this is likely to lead to loss-of-function of tumor-suppressor genes. Multiple CpG islands might be methylated simultaneously in some cancers, paving the way for CpG island methylator phenotype (CIMP), first discovered in colorectal cancer [64]. CIMP is characterised by hypermethylation of CpG islands surrounding the promoter regions of genes involved in cancer onset and progression [65]. The phenotype is heterogenous with the type of tumor [66] and dependent on definition [67]. In this background, it is less straightforward to interpret the functional importance of hypermethylation of individual genes. Still it is clear from Table 6 that the stage-salient hypermethylated biomarkers identified in our study could constitute an aggregate novel CIMP. The CIMP has been associated with advanced T staging (T3/T4) [68], which accords with our finding of five hypermethylated stage IV-salient DMGs. Epigenetic intervention for CIMP-positive cancers has been suggested as a possible treatment strategy [69].
The biomarkers contributing to the putative CIMP were tested with Cox regression and then evaluated independently as well as in combination for prognostic significance. Five of the seven stage-salient genes were prognostically significant in both the Cox univariate model and the Kaplan-Meier analysis (Table 6). A multivariate analysis of biomarker panels uncovered two signatures, an early-stage CRS12, and a late-stage CRS34 that might be prognostically valuable. In particular, CRS12 suggests a significant early-stage biomarker panel (p-value < 0.01) for the effective prognosis and stage-sensitive detection of colorectal cancer.
The current standard of CRC screening is colonoscopy, an invasive method with a significant rate of complications. A non-invasive method based on molecular diagnostics would improve patient satisfaction and efficiency. Several studies have been conducted to identify and/or validate biomarkers for CRC diagnosis. It is recognized that DNA methylation patterns could serve as valid biomarker candidates [70,71]. Freitas et al., have validated the performance of a 3-gene biomarker panel for the detection of colorectal cancer irrespective of the molecular subtype [72]. However optimal stage-salient epigenetic biomarkers have not yet been reported. Using hypermethylated DNA patterns as cancer markers offers the advantage of providing small targets with high concentrations of CpG for assays, useful for the subsequent design of analytical amplicons[73].Hypermethylation in gene body and upstream control regions like enhancers and insulators might affect transcription differently than hypermethylation of promoter regions [74.75]. Further DNA methylation in noncoding RNA genes seem to be important in tumor formation and progression [76]. Non-encoding RNAs themselves play a significant role in epigenetic modification through the phenomenon of RNA-directed DNA methylation [77].The nuanced relationship between methylation and gene transcription does urge the interpretation of our results with caution, contingent on experimental validation, however we would reiterate the efficacy of our study design in teasing out valid epigenetic biomarkers. Since methylation is a direct, ubiquitous and effective mechanism of epigenetic regulation used by plants and animals [78], it is hoped that our studies would further advance our understanding of the complex nuanced effects of methylation events and patterns, including in the developmental stages of life.
CONCLUSION
We have developed a stage-differentiated comprehensive computational framework for the consensus identification of significant differentially methylated genes. Our analysis has yielded seven stage-salient genes, all hitherto unreported in the literature: one stage I-specific gene (“FBN1”), one stage II-specific gene (“FOXG1”), one stage III-specific gene (“HCN1”) and four stage IV-specific genes (“NELL1”, “ZNF135”, “FAM123A”, “LAMA1”).All the stage-salient genes were found to be hypermethylated, indicating a novel CIMP-like character possibly promoting epigenetic destabilisation that merits further investigations. Prognostic evaluation of biomarker signatures composed of these stage-salient genes yielded the highest significance for a panel of the four stage IV-specific genes. The robust consensus approaches employed here would increase the reliability of identified epigenetic biomarkers both for diagnostic and prognostic purposes, and greatly advance the early detection of cancers and their treatment. Our approach is extendable to the investigation of epigenomics in other cancers, normal/disease conditions, and developmental biology.
Data Availability
All data and results are available as available as supplementary information: https://doi.org/10.6084/m9.figshare.13013852
COMPETING INTERESTS
The authors declare no competing interests, financial or otherwise.
AUTHOR CONTRIBUTIONS
A.P. conceived, designed and supervised the work. A.R. and S.M. performed the research; A.P., S.M., and A.R. analyzed the results. A.P. and S.M. wrote the manuscript. All authors approved the manuscript.
ACKNOWLEDGMENTS
We are grateful to the School of Chemical and BioTechnology, SASTRA Deemed University for research, computing and infrastructure support. A.P. would like to acknowledge funding from DST-SERB grant EMR/2017/000470/BBM.
REFERENCES


