

Use of DFT Calculations as a Tool for Designing New Solvatochromic Probes for Biological Applications
Department of Chemistry & Biochemistry, University of Missouri St. Louis, St. Louis, MO 63121, USA
Liquids 2024, 4(1), 148-162; https://doi.org/10.3390/liquids4010007
Submission received: 24 November 2023
/
Revised: 5 January 2024
/
Accepted: 29 January 2024
/
Published: 4 February 2024
(This article belongs to the Special Issue Solvatochromic Probes and Their Applications in Molecular Interaction Studies—a Themed Issue to Honor Professor Dr. Christian Reichardt)
Abstract
:The intramolecular charge transfer behavior of push–pull dyes is the origin of their sensitivity to environment. Such compounds are of interest as probes for bioimaging and as biosensors to monitor cellular dynamics and molecular interactions. Those that are solvatochromic are of particular interest in studies of lipid dynamics and heterogeneity. The development of new solvatochromic probes has been driven largely by the need to tune desirable properties such as solubility, emission wavelength, or the targeting of a particular cellular structure. DFT calculations are often used to characterize these dyes. However, if a correlation between computed (dipole moment) and experimentally measured solvatochromic behavior can be established, they can also be used as a design tool that is accessible to students. Here, we examine this correlation and include case studies of the effects of probe modifications and conformation on dipole moments within families of solvatochromic probes. Indeed, the ground state dipole moment, an easily computed parameter, is correlated with experimental solvatochromic behavior and can be used in the design of new environment-sensitive probes before committing resources to synthesis.
1. Introduction
Fluorescence has become one of the most common means of molecular detection. Sensitivity, ease-of-use, and the broad array of fluorescence techniques have fueled these developments. Fluorescent molecules that exhibit differential emission properties in response to environment, e.g., viscosity and/or solvent polarity, are solvatochromic and thus particularly efficient probes [1].
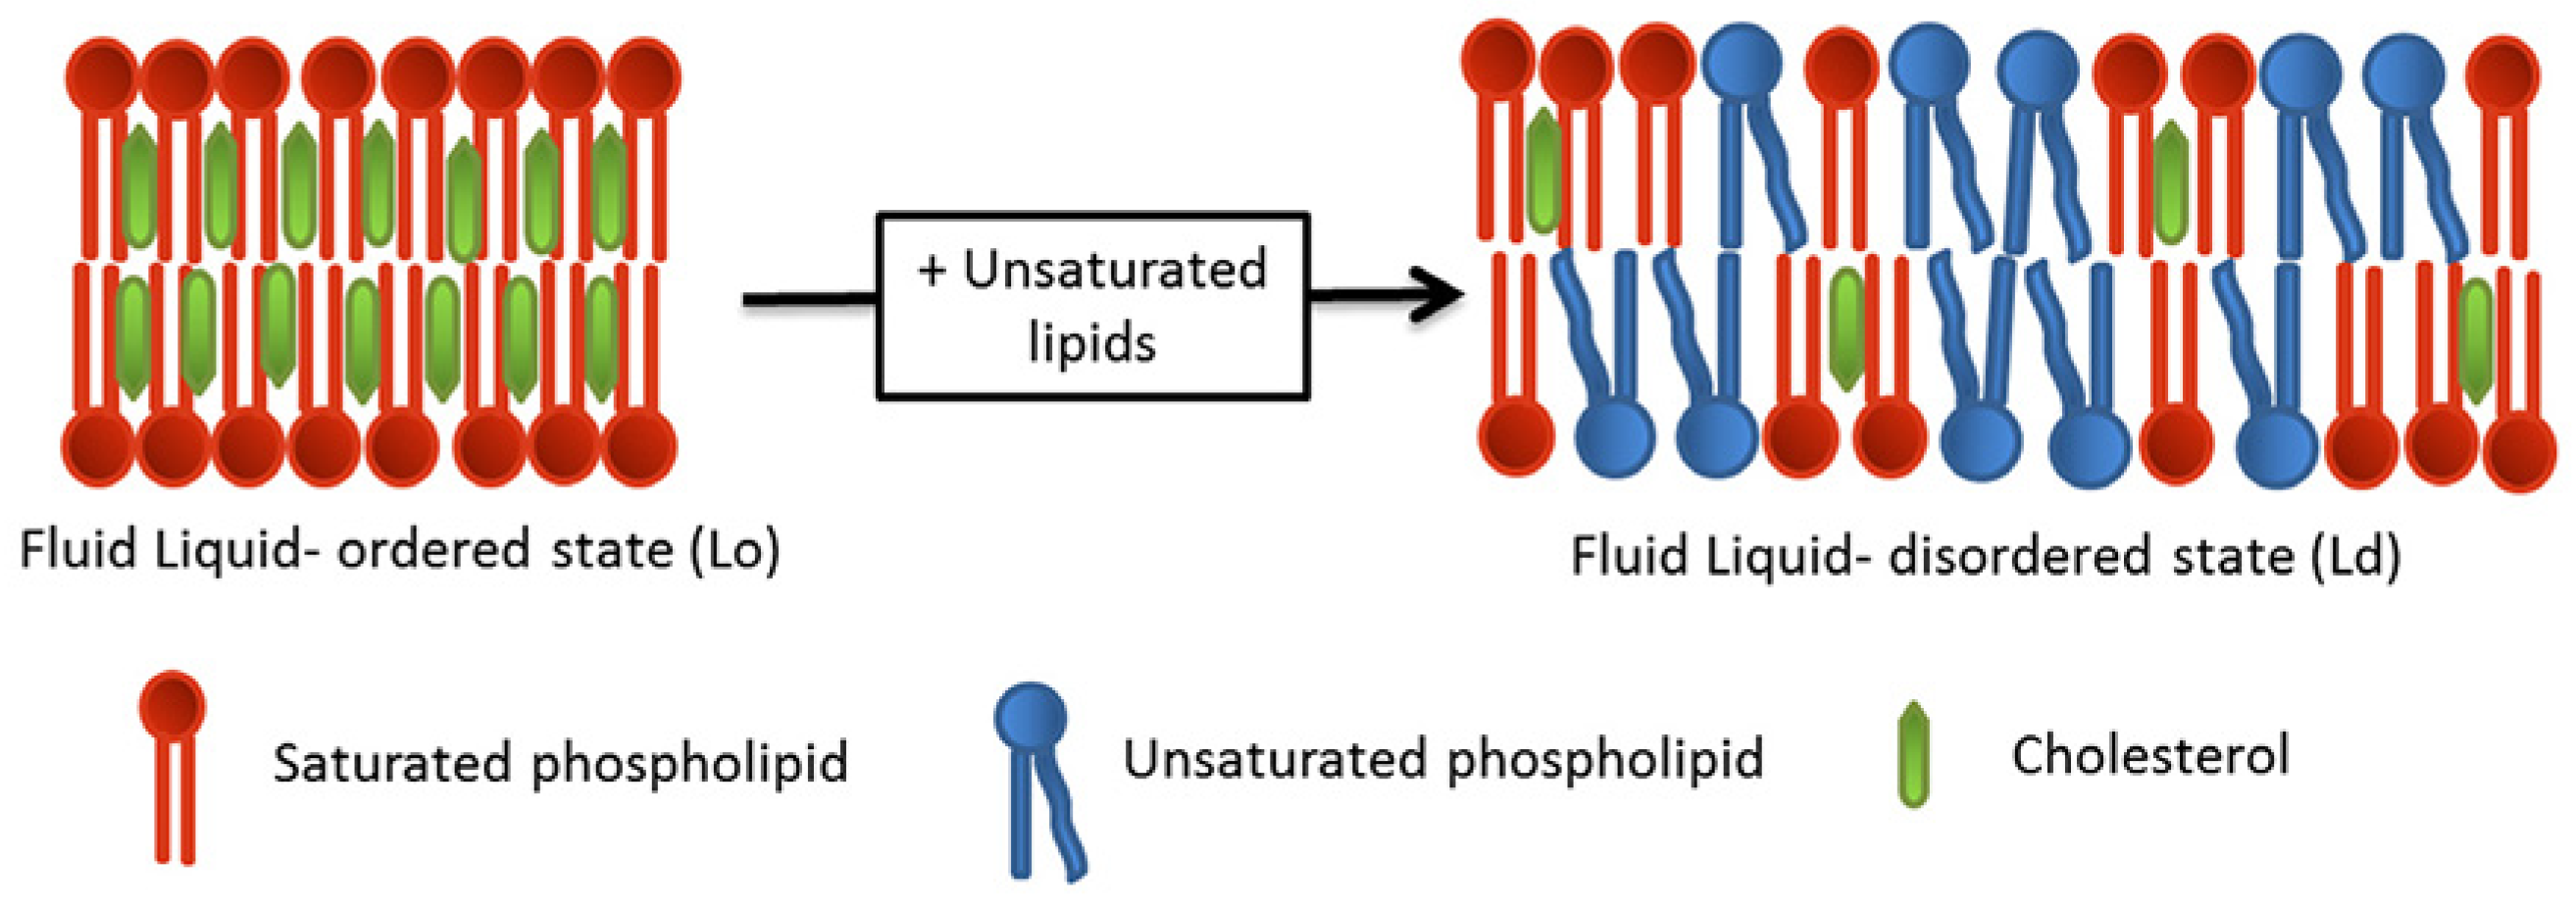
For many years, cellular membranes, composed primarily of amphipathic phospholipids, were principally thought to serve as boundaries and barriers for cells. However, in the past few decades, we have come to better understand a remarkable dynamic complexity. The existence of lipid rafts, or mobile domains, that are distinct in their composition and properties from the surrounding lipid has been known for some time [2,3]. Lipids containing more unsaturated phospholipids and cholesterol tend to be more rigid and less hydrated and therefore more nonpolar [4,5], with lower local viscosity (Lo; Figure 1). Conversely, regions with more saturated phospholipids and less cholesterol have more mobility, are more polar, and exhibit higher local viscosity (Ld).
Thus, the structures of cellular membranes lend themselves well to the application of solvatochromic probes. There are a number of well-known fluorescent probes of lipid order. These are well discussed in recent reviews [1,4], and some are discussed below.
What has driven interest in these probes is a developing understanding of the role of lipid order and lipid dynamics in a variety of important cellular processes. One of these is cellular stress, in the form of starvation or oxidative stress. Dioxaborine- and Nile Red- based dyes have been recently applied to map the effects of these types of stresses on cellular lipid structures [6,7]. Characterizing changes in lipid order as a result of apoptosis, or programmed cell death, is another area of strong interest. Here, Nile Red and hydroxyflavones have been applied [8,9], and this area of probe application has been reviewed recently [10]. Another cellular process being probed with solvatochromic lipid dyes is viral entry. Laurdan and DiO are two probes that have been applied in this area [11,12,13,14].
1.1. Desirable Properties in a Solvatochromic Probe
Advantageous excitation and emission wavelength ranges are of primary concern in choosing a probe application. This would include ranges that do not overlap with other emission signals in a cell (350–550 nm; [15,16,17]). This is the primary driving force for the development of red emitting probes, e.g., 600–750 nm [18,19,20]. Also important are properties that affect sensitivity. An ideal, sensitive fluorescent probe should have appropriate solubilities, high extinction coefficients (>30,000 M−1 cm−1), high quantum yields in the medium of interest (>50%), and sufficient photostability for the purpose [21]. Often, a delicate balance of all of these properties is required for the application of a probe, and sometimes, it is necessary to compromise on one or more of these elements to achieve an experimental goal. For example, some of the most commonly used solvatochromic probes (laurdan and NR12S) do not have the most desirable photostability [16].
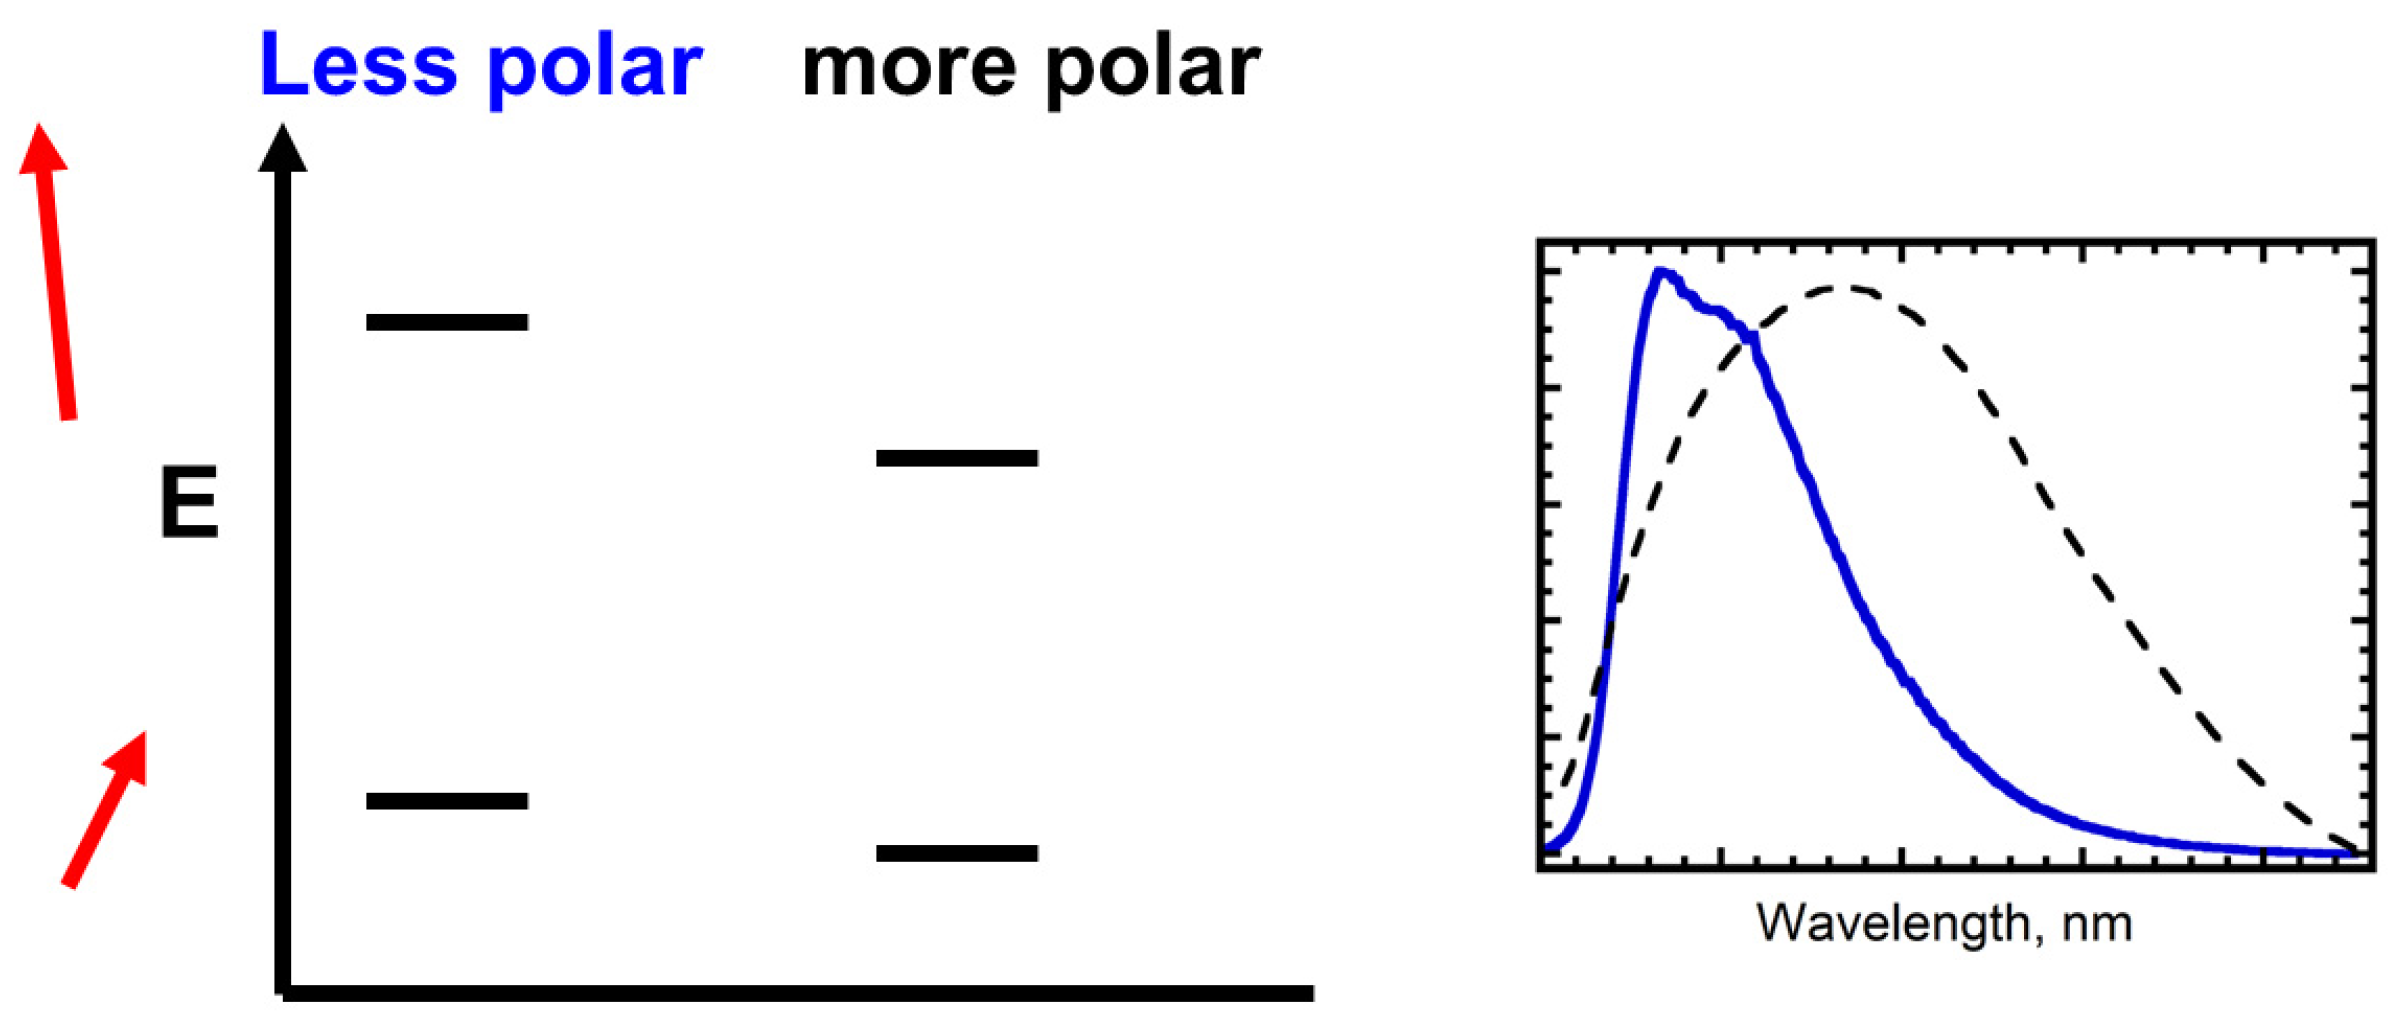
The structural features that lend themselves to solvatochromism include extended π systems. Second, molecules that respond to solvent polarity typically have large dipole moments and, more precisely, a large difference between the ground and excited state dipole moments. Structurally, this translates to uneven distribution of electrons in the molecule, usually facilitated by the presence of polar groups, more specifically, electron donating and electron withdrawing groups separated by an extended system of conjugation through which electrons can easily travel via push–pull or intramolecular charge transfer (ICT) behavior [22]. If a more polar solvent stabilizes the probe in its excited state (larger probe dipole moment) to a greater extent than it stabilizes the ground state (smaller probe dipole moment), positive solvatochromism results [23]. This is exhibited as a red (bathochromic) shift in optical spectra (Figure 2). If, instead, a more polar solvent stabilizes the ground state of the probe more than the excited state, negative solvatochromism results (not shown). In this case, the transition is of higher energy and the optical spectrum exhibits a blue or hypsochromic shift [23].
1.2. The Problem of Design
The early history of applying solvatochromic probes to the study of lipids was serendipitous, that is, dyes in the Nile Red family were known to be sensitive to solvent polarity [18]. However, more recently the optimal properties of a solvatochromic dye have received more direct attention. Older dyes have been used as scaffolding and modified for specific purposes. Much of the design of solvatochromic probes stems from specific needs such as solubility in a lipid environment [21], facile synthetic routes, and a general understanding that useful push–pull dyes require electron donating and withdrawing groups separated by extended conjugation. Occasionally, functional groups are added because they are thought to optimize for specific properties such as organelle targeting [7], photostability [16], or solubility [24]. The somewhat meandering history of lipid probe literature does not typically document extensive rational design. Indeed, there is very little literature on the rational design of these dyes [24,25,26]. Desirable behaviors of these dyes are discussed, but usually in hindsight.
While there are a number solvatochromic dyes widely used for biological imaging, it is generally acknowledged that due to the complexity of properties that require balance for an application, there is an ongoing need to develop new dyes [1]. For synthetic chemists, this provides an attractive challenge. However, not all researchers possess this skill or have ready access to it. It would be advantageous to have a means of assessing the potential of new structures for solvatochromic behavior before committing the resources for synthesis and characterization.
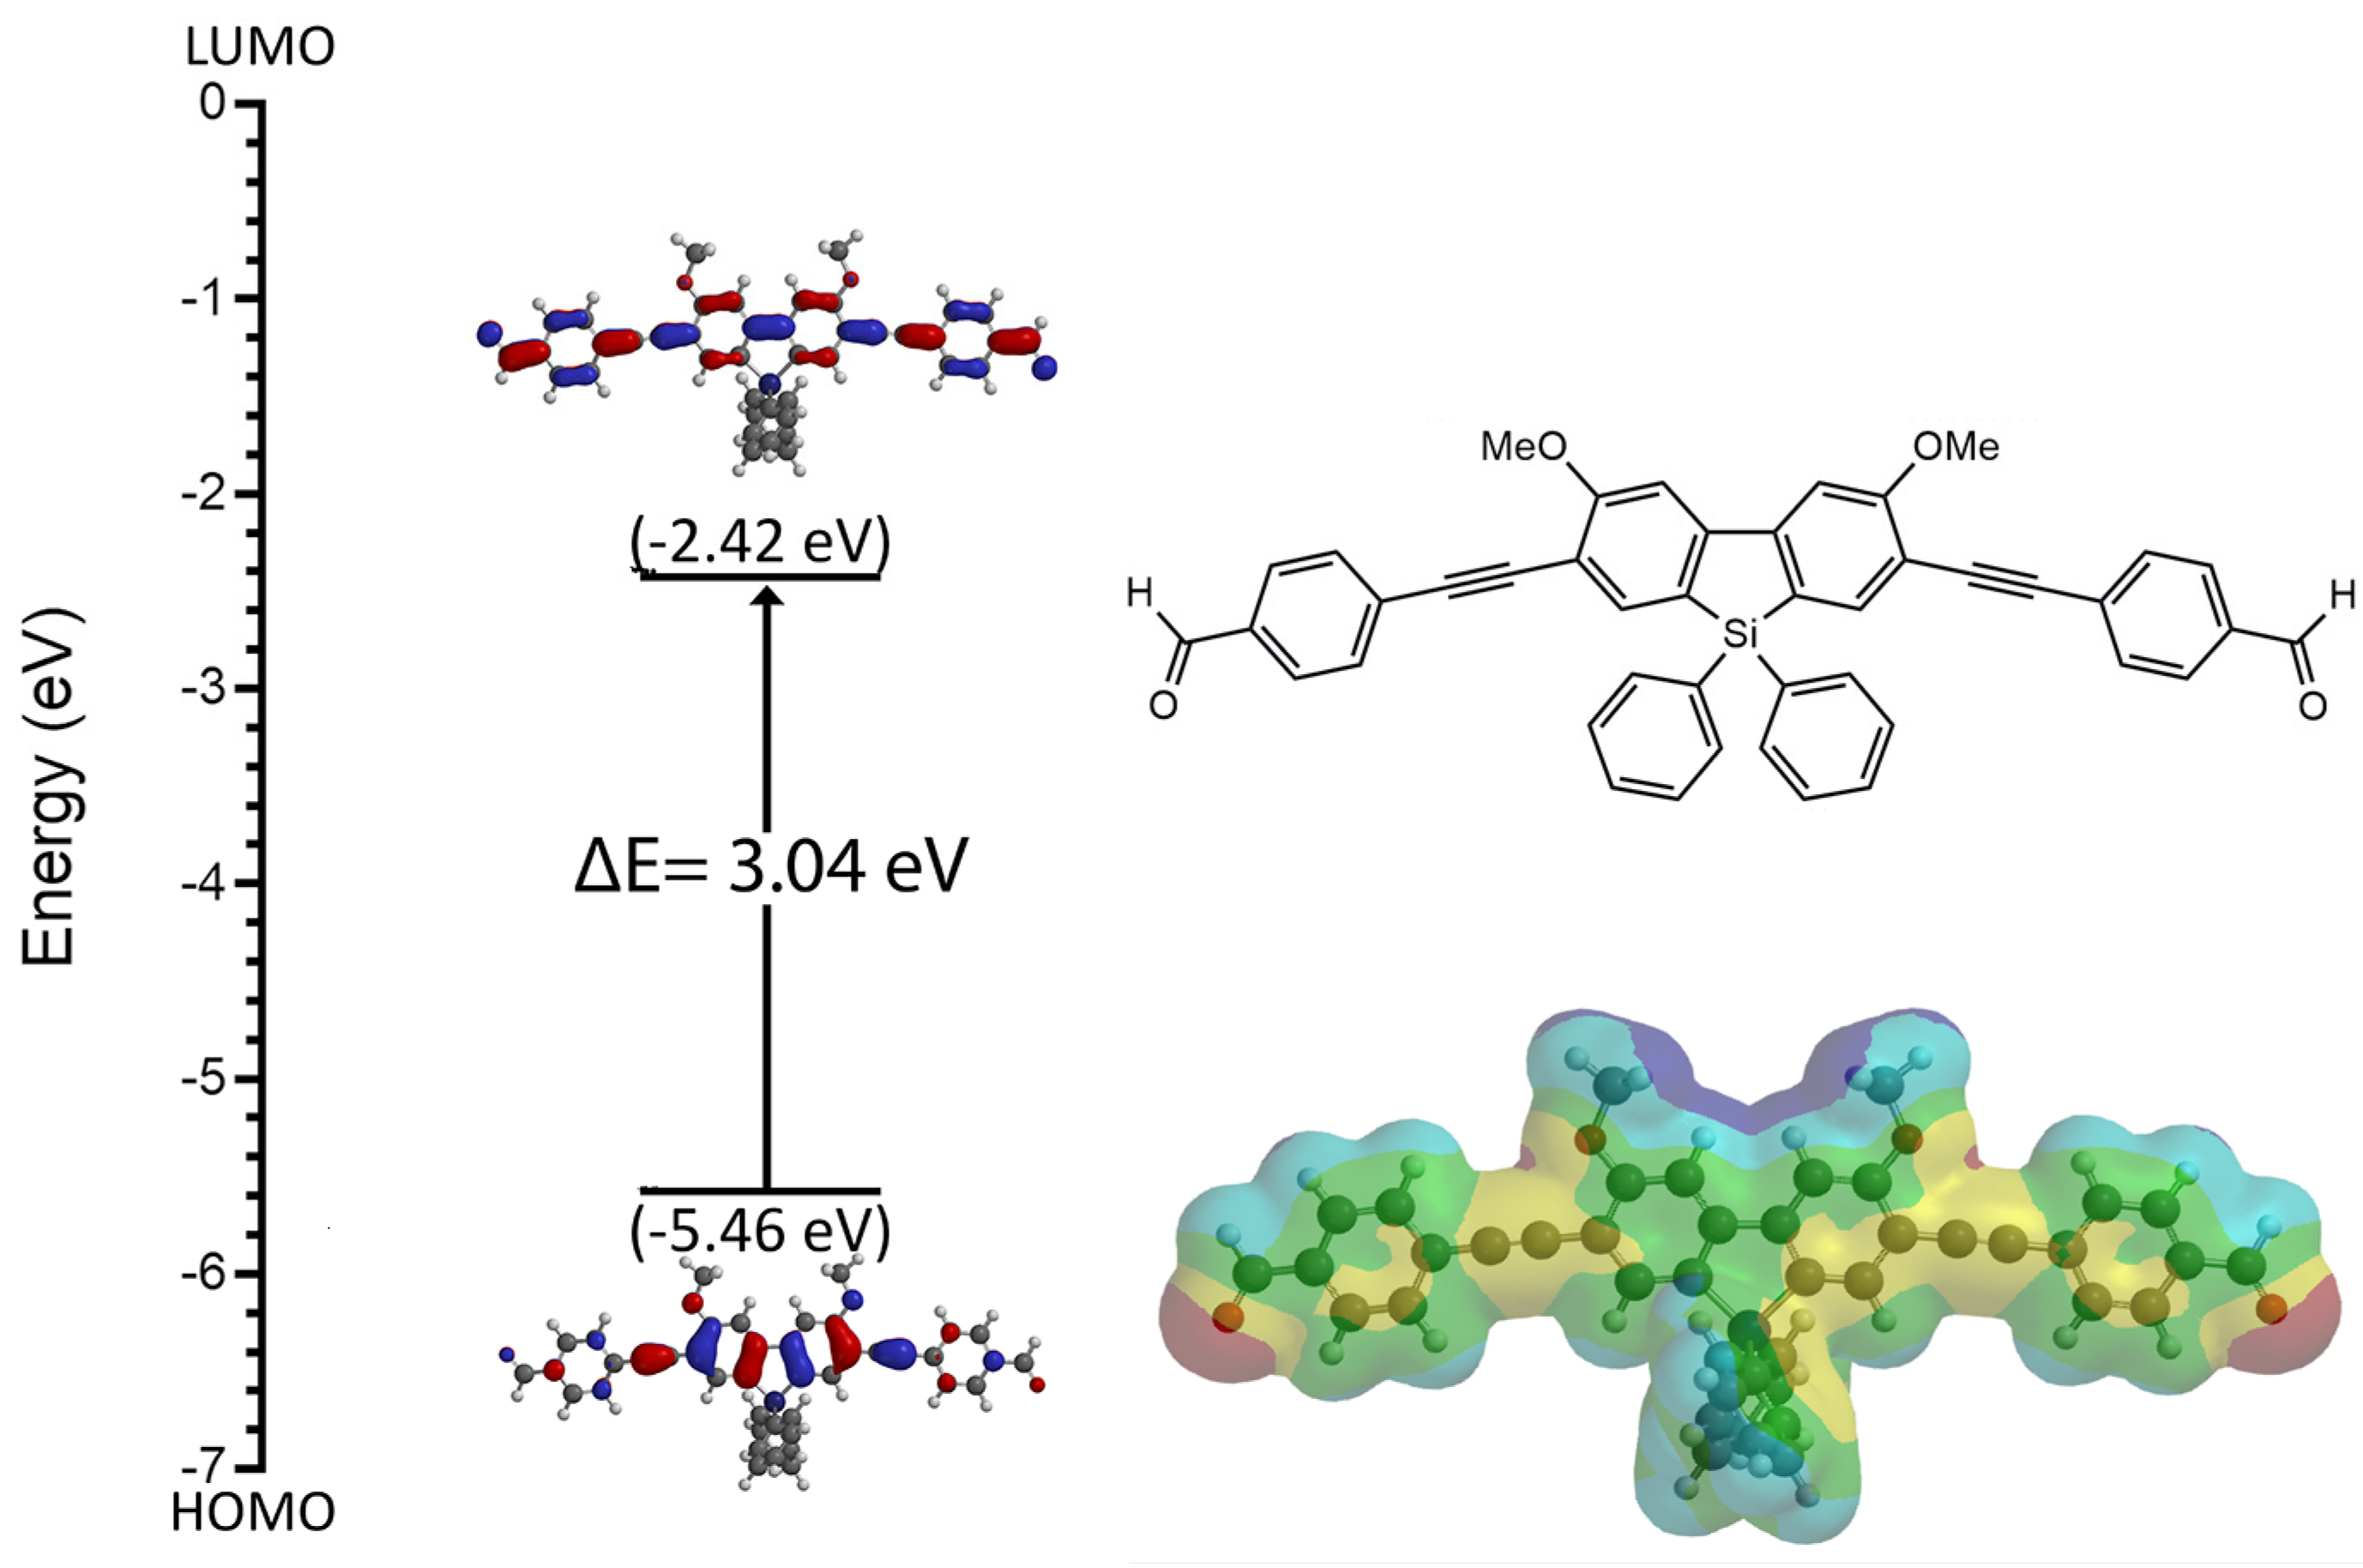
Density functional theory (DFT) calculations are a common feature of papers that describe the synthesis and characterization of new solvatochromic probes. These calculations are readily accessible to even the most junior researchers via programs like Spartan and Gaussian, and these calculations provide a number of molecular parameters that are correlated with good solvatochromic behavior. The first are the energies of HOMO and LUMO, from which the difference is easily computed. Small HOMO LUMO gaps (e.g., 3–5 eV; [27,28]) facilitate electronic transitions and are common among solvatochromic probes. Secondly, maps of the HOMO and LUMO in ground and excited states illustrate the movement of electron density of the molecule upon excitation. Another important visual is the electrostatic potential (ESP) map, which illustrates charge distribution. When dramatic, these latter images can clearly show the potential for intramolecular charge transfer (ICT) or push–pull behavior, a hallmark feature of solvatochromic probes. See Figure 3 for examples of these types of DFT data for a solvatochromic probe.
Although the landscape of solvatochromic probe design is complex, it would be desirable and supportive to be able to compute a single, accessible parameter that is correlated with experimental solvatochromic behavior. Transition dipole moments (μe − μg) are of course informative. A common range for these values for solvatochromic probes is 5–14 D, but these are often computed from the slopes of Lippert–Mataga plots and thus are derived from experimental data [26,30,31]. Exited state dipole moments are seldom reported [30]. Computed ground state dipole moments are sometimes reported and are often large for solvatochromic probes [31,32,33]. Discussed here is the potential of DFT, in particular, ground state dipole moments, to contribute to the design process, rather than as a form of characterization presented with synthesis. First, reported data on a few series of known solvatochromic dyes are compiled to determine the extent to which a computed dipole moment correlates with experimentally determined solvatochromic behavior. Then, we will examine, in retrospect, how modifications to known families of dye structures can affect the ground state dipole moment and electrostatic potential maps. The effect of conformation on computed dipole moments will also be examined. Then, we will explore the application of DFT in the design of metallafluorenes as lipid probes. All of these investigations are accessible to students and can provide excellent training in molecular properties and probe design.
2. Methods
2.1. DFT Calculations
Routine dipole moments were computed using Spartan ’18 (Wavefunction, Irvine, CA, USA). The probe structures were first energy minimized. Using the density functional basis set B3LYP-6-31G*, the equilibrium geometry was calculated in the ground state in polar solvent (DMF). Output includes the dipole moment. To systematically search for low energy conformers (conformer distribution), the density functional sets wB97X-V and 6-311+G were applied.
2.2. Determination of ET30 and Lippert–Mataga Slopes
The Stokes shift () is calculated as follows:
where is the max of the absorption spectra and is the max of the emission spectra in wavenumbers (cm-1).
Small variations in the forms of solvent polarizability are often applied [32,34,35,36], and this can lead to some variability. To normalize that, Stokes shift data from the literature were plotted vs. a form of the solvent polarizability function , defined as follows [37]:
where () is the dielectric constant and () is the refractive index of the solvent. Polarity functions were either obtained from the literature [34,38] or computed from solvent reference data [39]. Table 1 features a summary of solvent data used in this study. Published Stokes shift data were plotted vs. both the above polarizability function and vs. ET30 [23] using Kaleidagraph 3.51 software (Synergy Software, Reading, PA, USA).
3. Results
3.1. Experimental Assessments of Solvatochromism
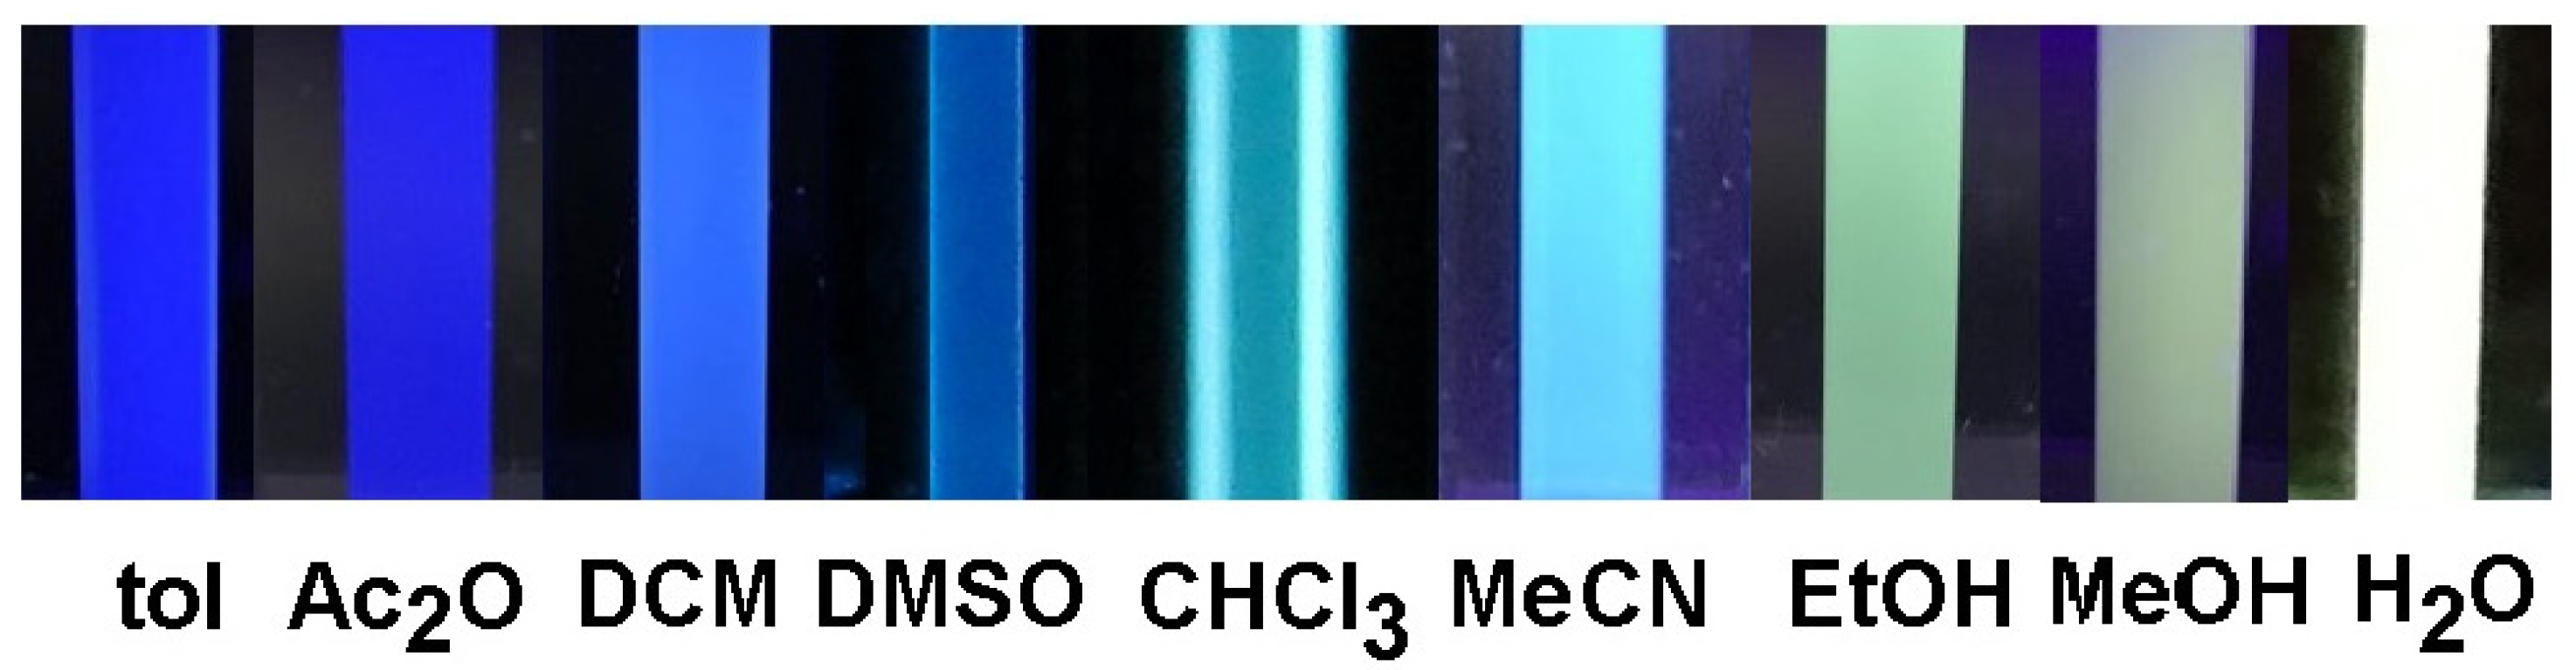
The quickest and most entertaining way to assess the solvatochromism of a probe is to observe solutions in various solvents under a UV lamp (Figure 4). Solvatochromism is usually formally assessed by measuring the Stokes shift, that is, the difference in wavenumbers between the excitation and emission maxima (), in a range of solvents of differing polarity. The absorbance (or excitation) maximum of a probe can sometimes respond to solvent polarity, but in general, emission peak maxima are more sensitive to this property.
These solvent polarities are typically represented by either a form of a solvent polarizability function dependent on the solvent dielectric constant and refractive index [34,38] or by Reichardt’s ET30 series [23]. Such data for solvents used in this study are summarized in Table 1 (Section 2).
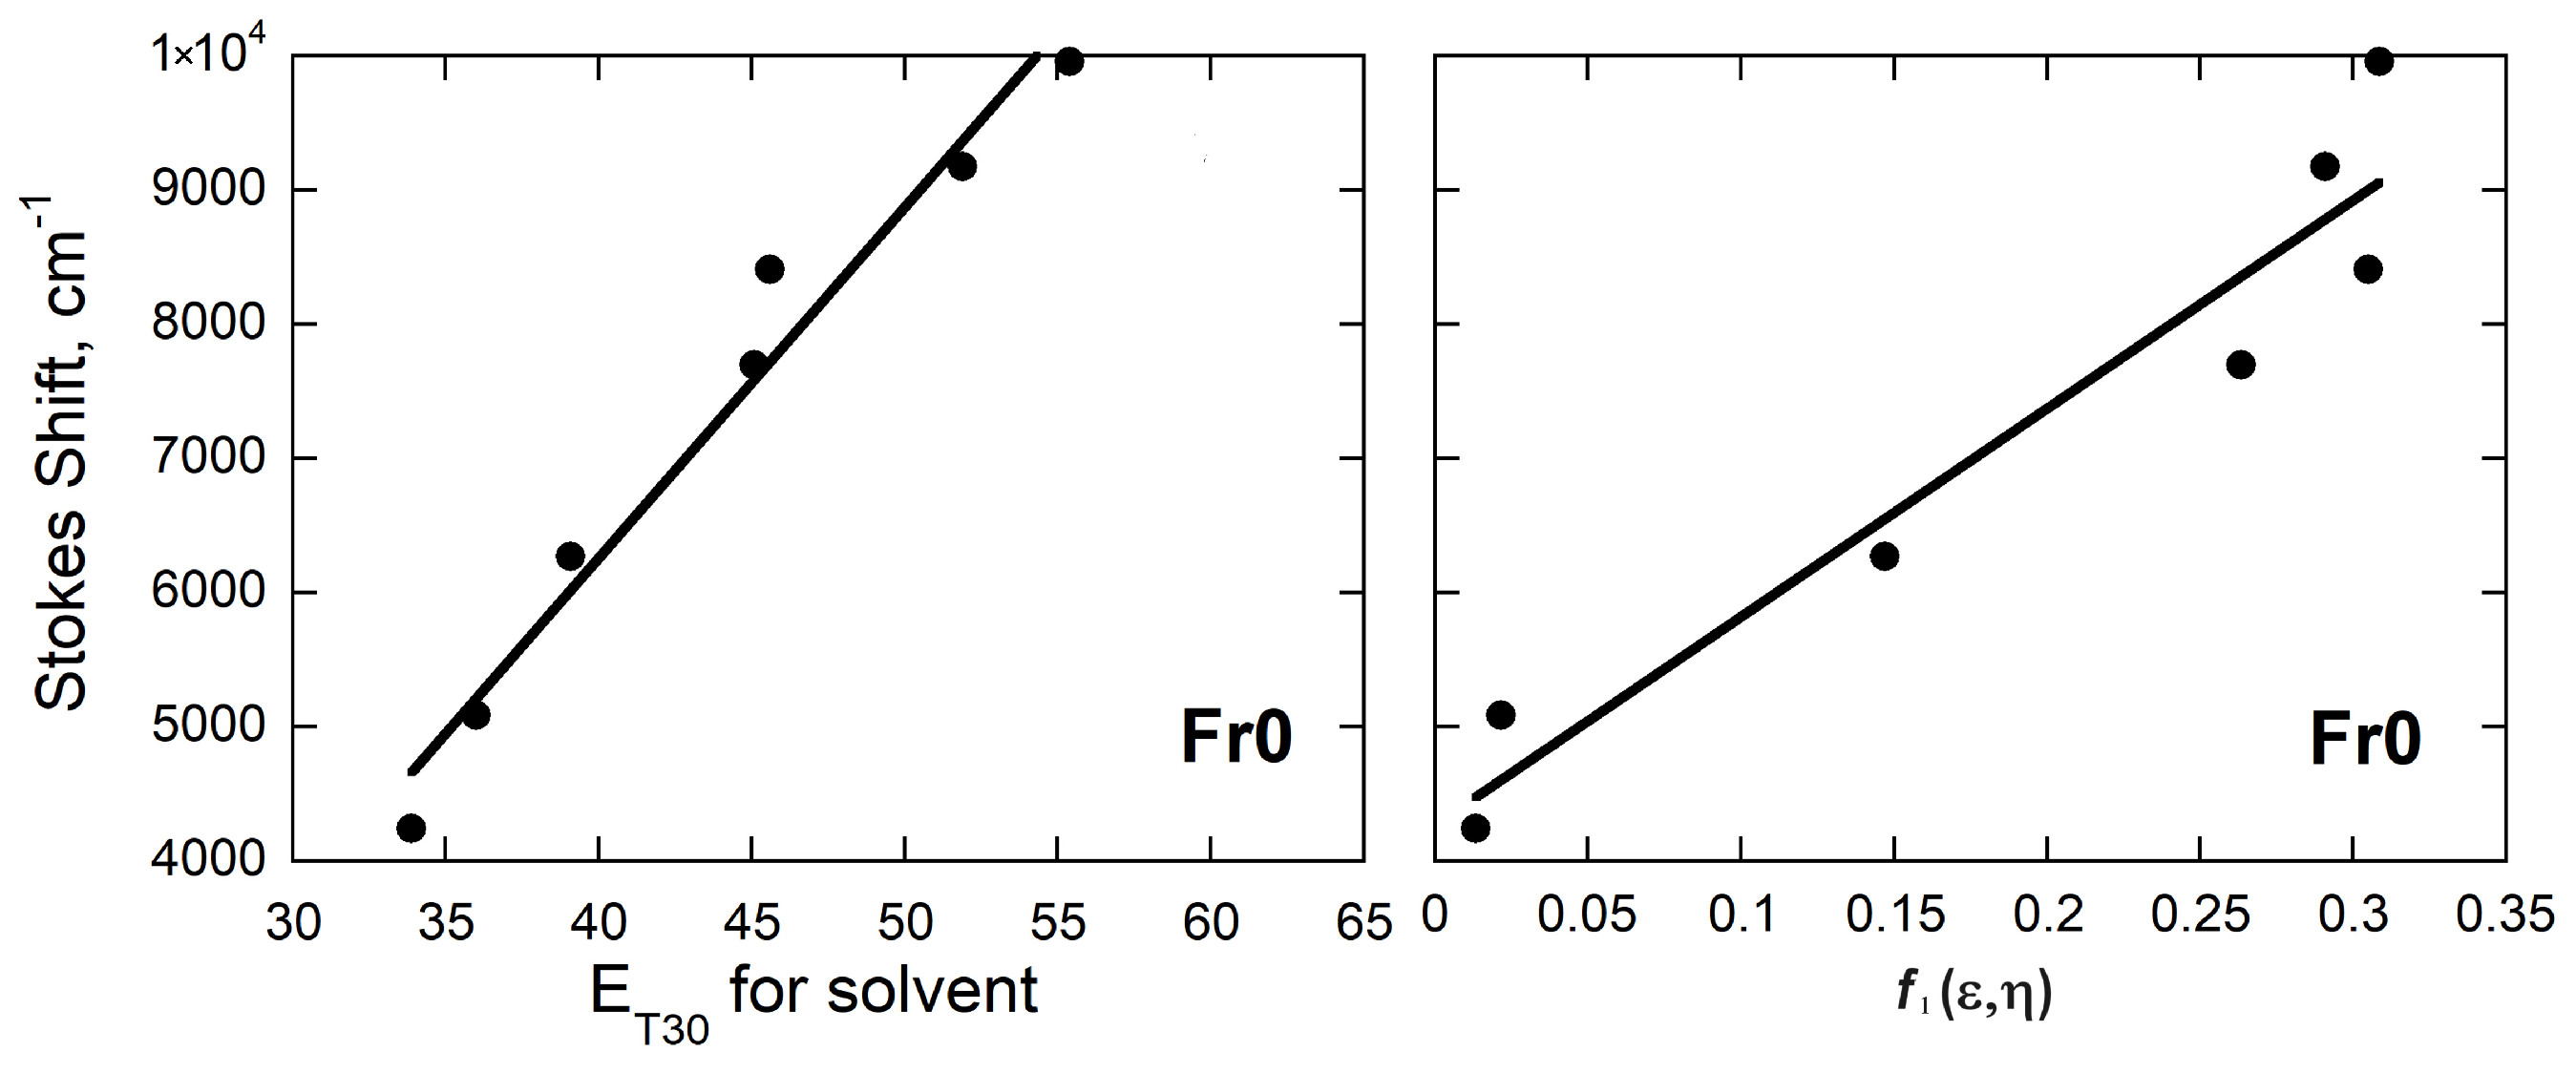
Lippert–Mataga plots of the Stokes shift vs. the former function (Figure 5) remain in general use [37,40], although variations in the function are not uncommon [32,34,35,36]. In addition, theoretical variations in the treatment of solvent behavior have emerged from Bakshiev [38,41,42] and Kawski, Chamma, and Vaillet (KCV) [31,43] that are sometimes reported in addition to (or in lieu of) Lippert–Mataga plots [34,38,40]. All of these variations can be reflected in the quality of the correlation with the Stokes shift behavior of solvatochromic probes [35,38,40]. Further, probes can often have specific solvent interactions that can reduce the quality of the correlation depending on how well the theory aligns with solvent behavior.
Depending on the application, authors may or may not generate these plots, even though it is easily rendered from reported Stokes shift data and solvent reference data.
Published Lippert–Mataga slopes for solvatochromic probes are in excess of 3000 [40,43,45,46]. Another version of the Stokes shift and solvent behavior correlation uses the Reichardt ET30 series and is also common [26,32,47,48]. Here, large slopes of 100–600, either positive or negative, are indicative of significant solvatochromism. Those with little to no solvatochromic behavior (like many of the metallafluorenes) have single digit slopes.
3.2. Solvatochromic Behavior vs. Dipole Moment
To the author’s knowledge, there is no published source for a collection of solvatochromic data of various probes. There are two goals: One is to initiate a growing list of these data. The other is to assess a possible correlation between the computed ground state dipole moment and the experimental data for published solvatochromic probes. To that end, Stokes shift data for a collection of solvatochromic probes were gleaned from published data and used to prepare ET30 and Lippert–Mataga plots to generate slopes that relate experimental spectral data with a measure of solvent polarizability. Because the primary interest here is understanding how modifications to a known probe affect the ground state dipole moment, the primary focus is on prodan, Nile Red, and fluorene-based probes and their derivatives. To add strength to the examination of a possible correlation between experimental and computational data, a few other known solvatochromic probes have been included.
Even the gathering of published experimental data and the computation of slopes was informative: The number and identify of solvents used were quite variable across the literature. Indeed, in the author’s experience, solubility can be a factor. Scatter in the plots of experimental data vs. solvent property data is not unusual and is typically attributed to solvent interactions [34,45]. A more sophisticated understanding of this scatter or uncertainty is that the commonly used mathematical treatments of solvent behavior may not always accurately account for properties and interactions that can affect the behavior of solvatochromic probes. To further complicate the analysis, it is not uncommon for poor correlations to be published and even interpreted. Noise in these plots is usually attributed to solvent interactions [34,45]. To reduce the introduction of noise from the experimental plots into the secondary correlation of slope with computed dipole moments, only slopes with correlations in excess of 0.8 are reported.
The resulting Lippert–Mataga and ET30 slopes and ground state dipole moments appear in Table 2. ET30 slopes range from 320 to single digits. Correspondingly, the highest Lippert–Mataga slopes are close to 17,000, while the lowest ones are near 100. These spreads provide substantial dynamic range to explore subsequent correlations. For some probes explored here, there was no identifiable correlation between published Stokes shift data and solvent polarizability. This was noted for either Lippert–Mataga or ET30 for Nile Red, 2APMC, and 2BME (Table 2), but was also true of other probes for which there was no discernible correlation for either Lippert–Mataga or ET30 (A1–A3 [24]). Large computed ground state dipole moments range from 8 to 37 D, but lower values are also represented. For a few probes, a range of dipole moments is tabulated. This is related to conformation, which is discussed in more detail below.
3.3. Assessing a Correlation between Experimental Spectral Data and Computed Dipole Moments
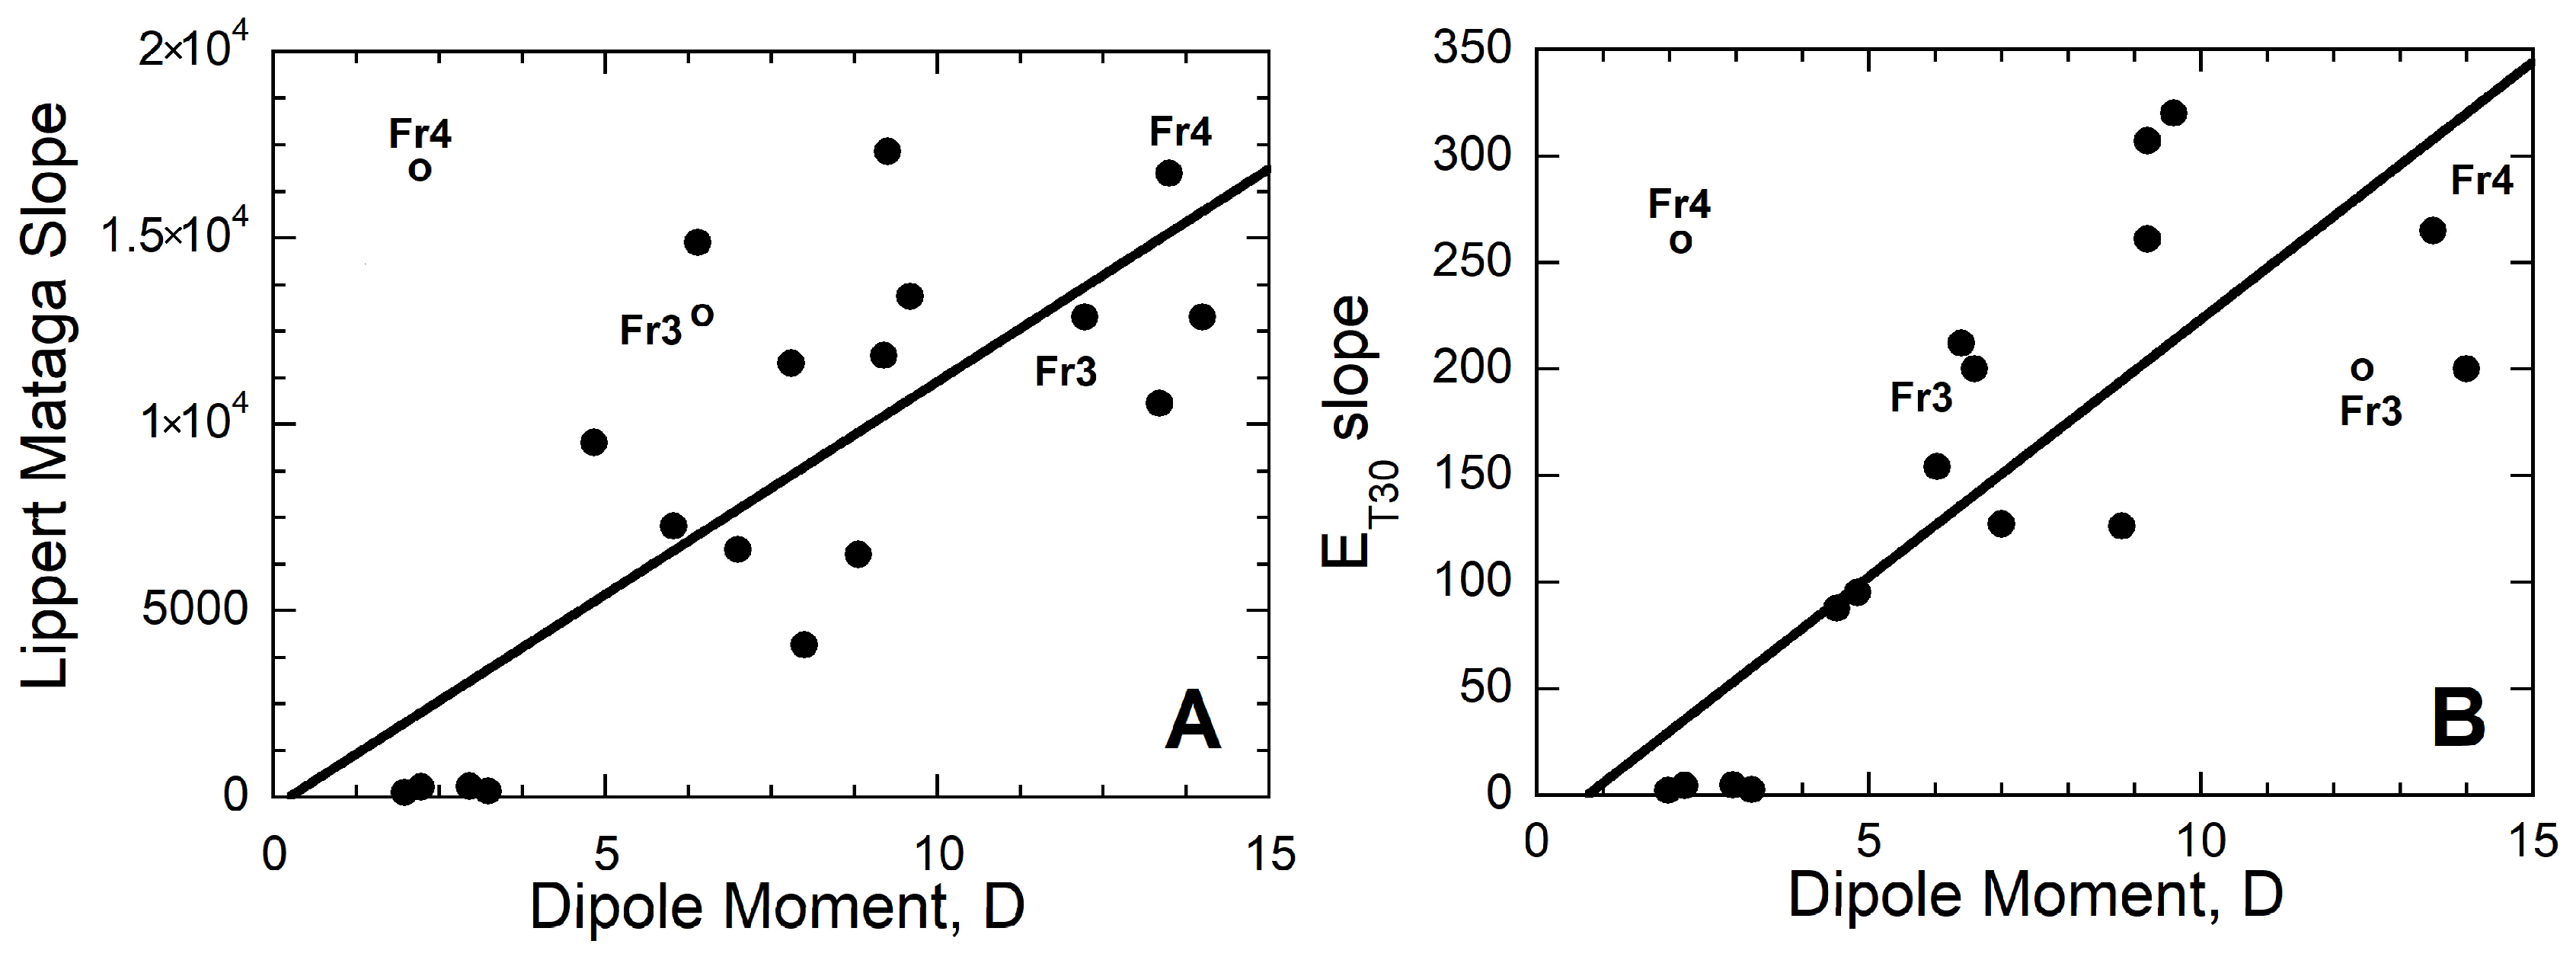
To more clearly explore the correlation between the ground state dipole moment and experimental data via Lippert–Mataga and ET30 slopes, these data were plotted against one another (Figure 6A,B). Given the nature of the data, some scatter is expected in this secondary plot. In spite of that, however, there is a convincing correlation between the computed ground state dipole moment and both slopes for this series of solvatochromic probes.
A couple of outlying points provide an opportunity to explore some possible reasons for this weaker correlation. One possibility is that there is noise in the primary plot that determines the slope and might be traceable to errors or choice of solvents. Another more intriguing possibility is related to the importance of bond angles and conformation on the computed dipole moment for probes. While some of the probes in Table 2 do not have rotatable bonds that significantly affect the distribution of polar atoms, a number do have important points of conformational variability. This issue is explored in more detail below.
3.4. Effects of Probe Modifications and Conformation on Dipole Moment and Electrostatic Potential
Here, we explore issues of modification, conformation, and design, using families of solvatochromic probes as examples.
3.4.1. Impact of Probe Modification: Fluorene Series
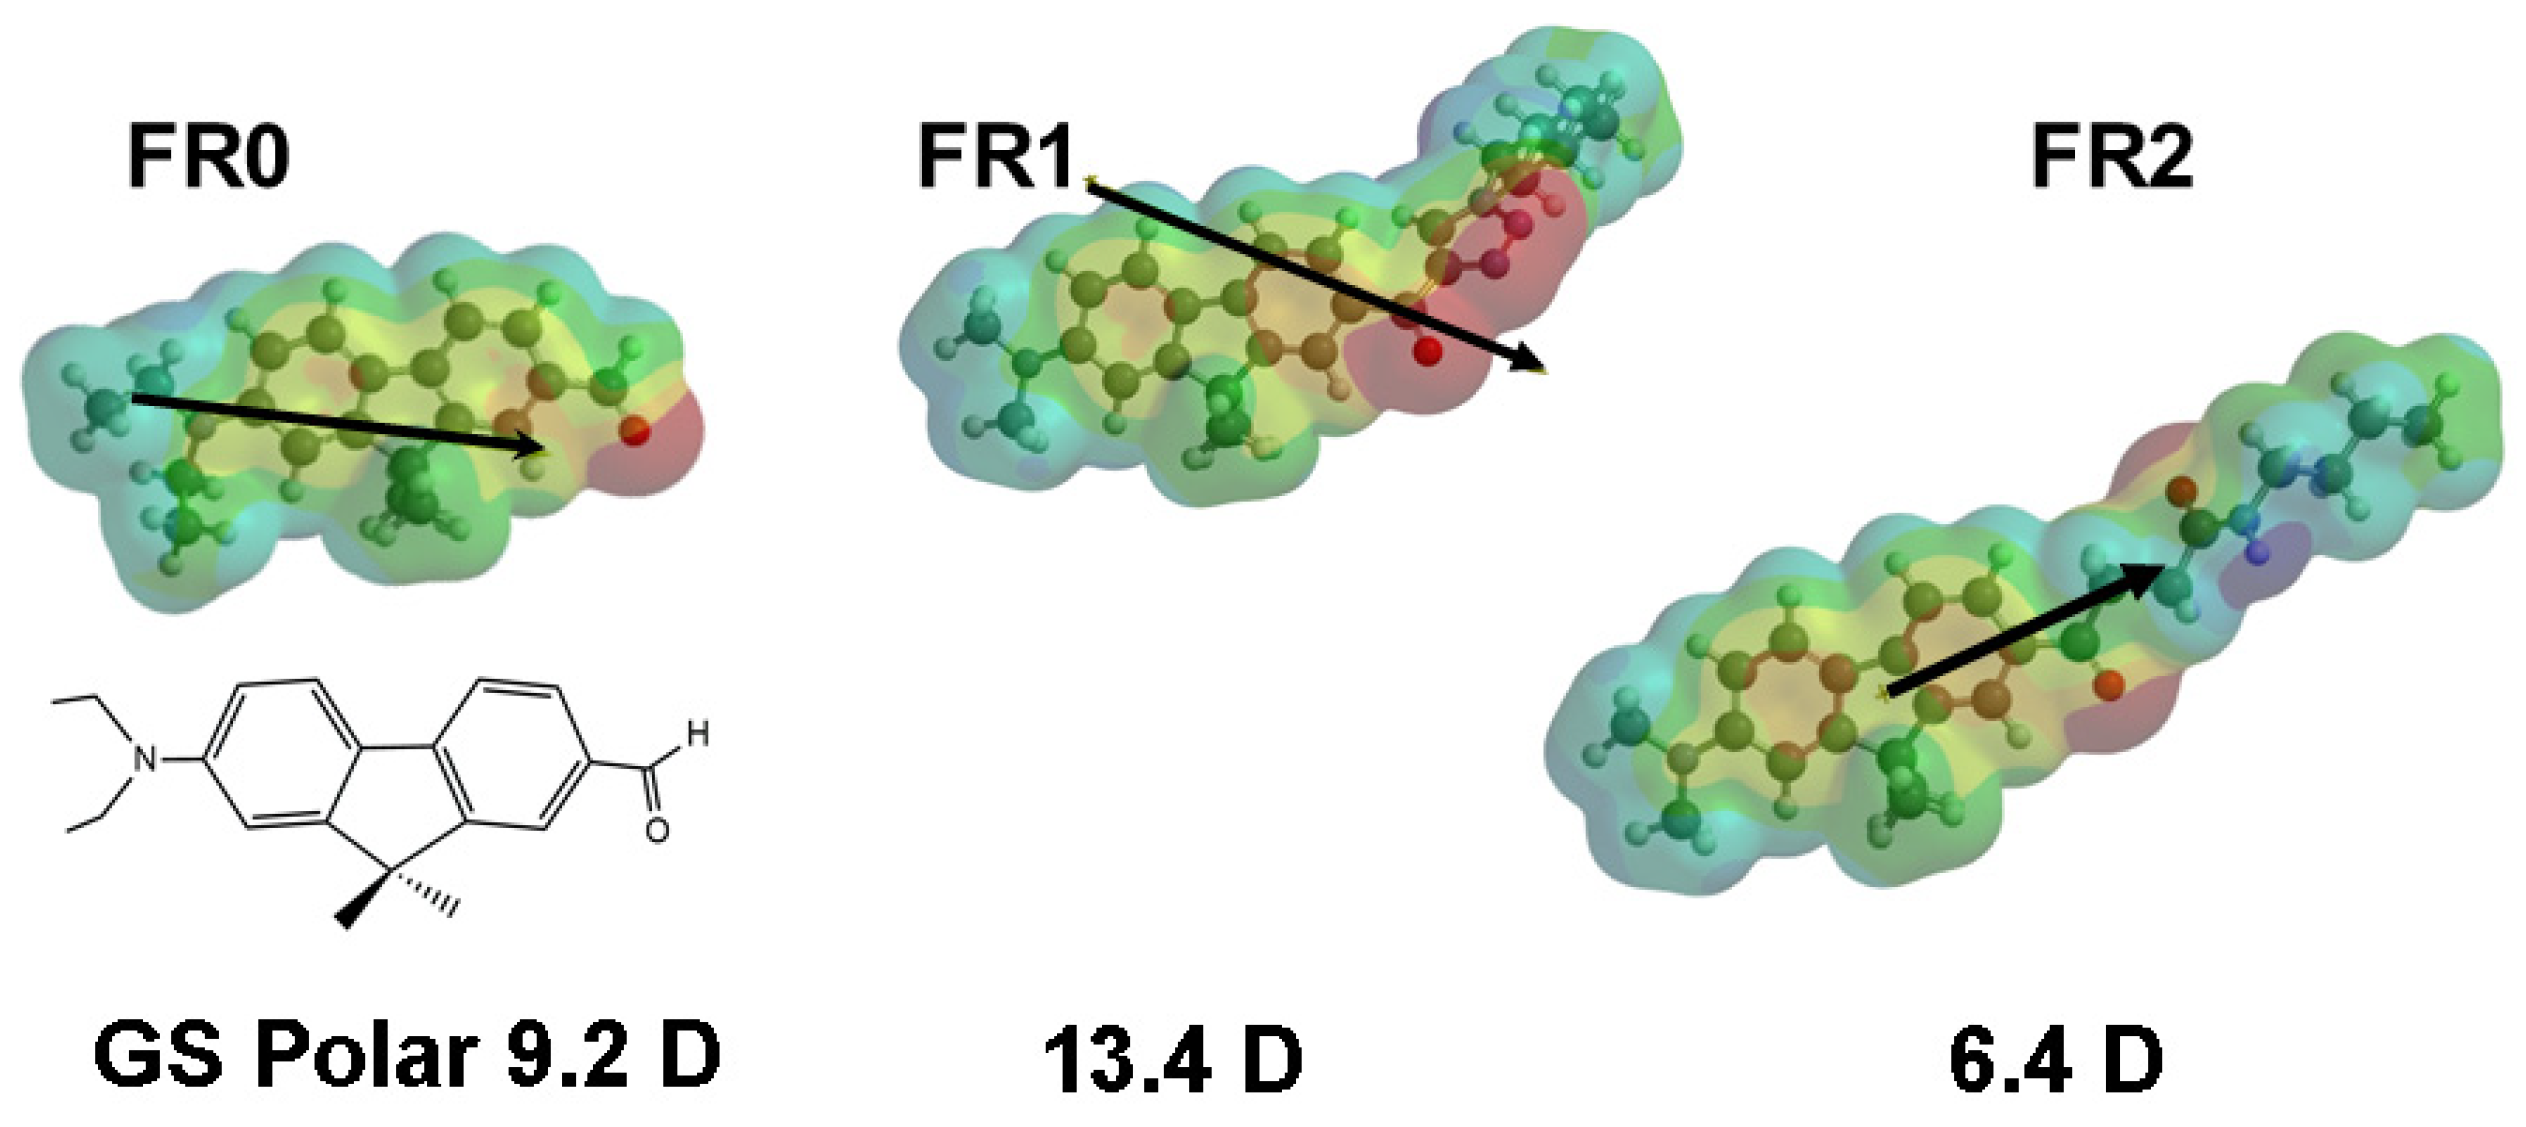
The conjugated polycyclic structure of fluorene makes it an ideal aromatic core for solvatochromic probes. Indeed, fluorene-based dyes have been investigated as membrane probes and show promising quantum yields and photostability [16,21,53,54,55]. The structural diversity of these probes provide an opportunity to examine the effect on the ground state dipole moment (Table 2). In Figure 7, two examples are shown illustrating how modifications to Fr0 affect both the direction and magnitude of the ground state dipole moment and could therefore affect the solvatochromic response. Modifications made at the Fr0 carbonyl, in particular, the introduction of additional polar atoms, have a significant impact on the dipole moment. These data from this series illustrate that modifying a known solvatochromic probe can affect the dipole moment and, by extension, the solvatochromic behavior either in an advantageous or disadvantageous way.
3.4.2. Impact on Conformation: Fluorene and Nile Red Series
It is reasonable to expect that when the spatial relationships among polar atoms in the molecule are changed, the dipole moment will also change. Therefore, it is essential to explore conformational aspects when using DFT for design purposes. Discussed here are two approaches.
In an initial computation on Fr3, with no attention to conformation, the ground state dipole moment was 6.37 D, which led to an outlying point (open circle in Figure 6). However, exploring a different orientation for the heterocyclic ring and the rest of the sidechain yielded a higher dipole moment (12.23 D) that aligns better with the other correlated data. A similar pattern was observed for Fr4 and alternate conformations.
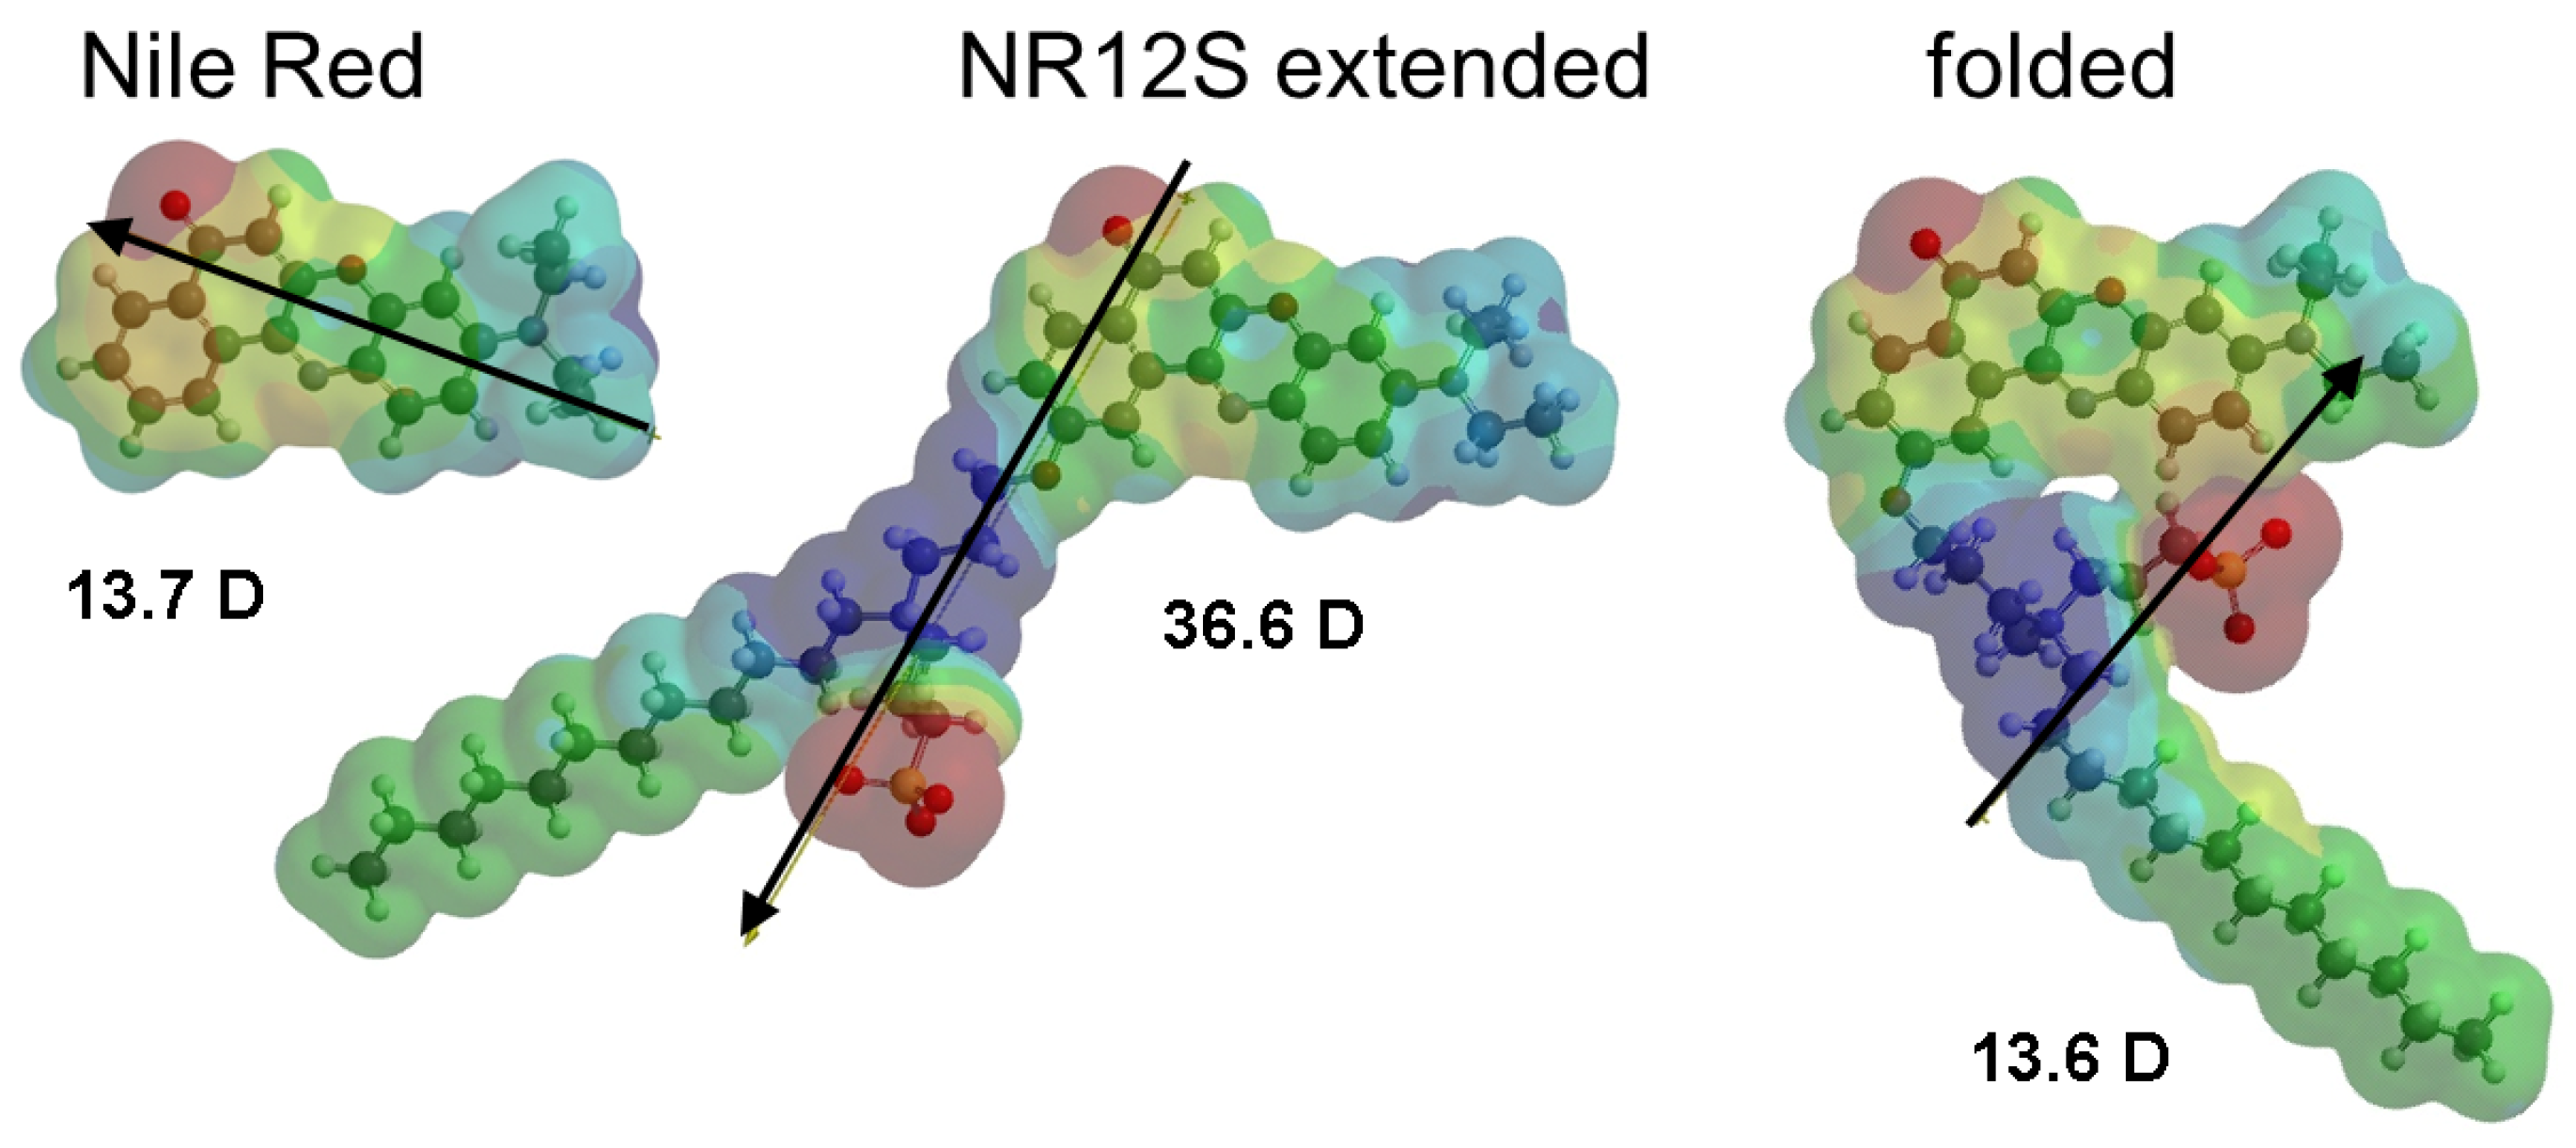
Nile Red remains one of the most commonly used solvatochromic probes [1,17,18,21,56]. This dye was known many decades before its application to the study of lipid dynamics and has a large reported ground state dipole moment (8 D; [31]); Table 1).
A number of Nile Red derivatives have been prepared with goals in mind that include membrane solubility [21,24] and organelle targeting [56]. How is the dipole moment affected by these designs? The most commonly used of these is NR12S [21]. With the chain extending out from the polycyclic core, the computed dipole moment is much larger, 36.6 D (Figure 8, Table 1). If, instead, the chain is rotated over the polycyclic core, the dipole moment is closer to that of Nile Red. However, the electron distribution is visibly altered by the addition of the chain, and this is reflected in the direction of the dipole moments of these molecules.
Spartan and other similar software packages do offer a systematic conformational search, which allow for the exploration of a large number of conformers without input. A number of solvatochromic probes, including NR12S, have a large number of rotatable bonds, which extends the computation time dramatically and must be factored into investigations. To illustrate this option here, an automatic conformer distribution search was conducted on 2BME (Table 2), which has limited points of bond rotation (and therefore more manageable computation times). Interestingly, the reported dipole moment of 2 D falls well outside the correlation [45]. However, the distribution search yielded a higher dipole moment (7.8 D) in these low energy conformers, which fell well into correlation with the spectral data. Where possible, exploration of conformation is therefore highly recommended, bearing in mind the effect of a large number of rotatable bonds on computation time.
Finally, it is important to note that molecular conformations might not necessarily be known in the environment upon which the probe is reporting. However, it is also possible that dipole moments that align with the correlation might correspond to a dominant bond angle/conformation in the medium in which the probe is applied. Collectively, these data suggest a possibly useful correlation between experimental and computed solvatochromic behavior. And while commonly used solvatochromic probes are represented here, a continued expansion of the library would inform the correlation.
3.4.3. Use of DFT in Probe Design: 2,7-Disubstituted Metallafluorenes
The 2,7 positions of fluorene are synthetically accessible locations for extending the conjugation, as well as for providing a means of influencing electron movement for ICT behavior and possibly engineering solvatochromic behavior. There are a few examples of 2,7 substitution via alkene linkers [57]. These are indeed solvatochromic, but as shown above, flexibility can impact electron distribution. This is easily managed with an alkynyl linker [58]. This was then followed by a series of papers that expanded the library of 2,7 substituents [59,60,61,62].
We have assessed a small library of these compounds (MFs) via both experimental and theoretical approaches. First, this substituent does influence spectral behavior (, λmax, and quantum yield), which indicates that these substitutions can be an effective means of tuning these properties [29]. We showed that a few 2,7-disubstituted metallafluorenes can detect detergents and stain cells [63,64].
More recently, we noted that 2,7-benzaldehyde substitution results in an impressive ground state dipole moment (9 D), visible solvatochromic behavior, and competitive Lippert–Mataga and ET30 slopes (6500 and 126, respectively) [29]. In contrast, MFs with other electron withdrawing substituents have low dipole moments (e.g., 3 D) and are not solvatochromic. However, since solvent spectral data are seldom reported for nonsolvatochromic compounds, these data serve as important controls for the correlations.
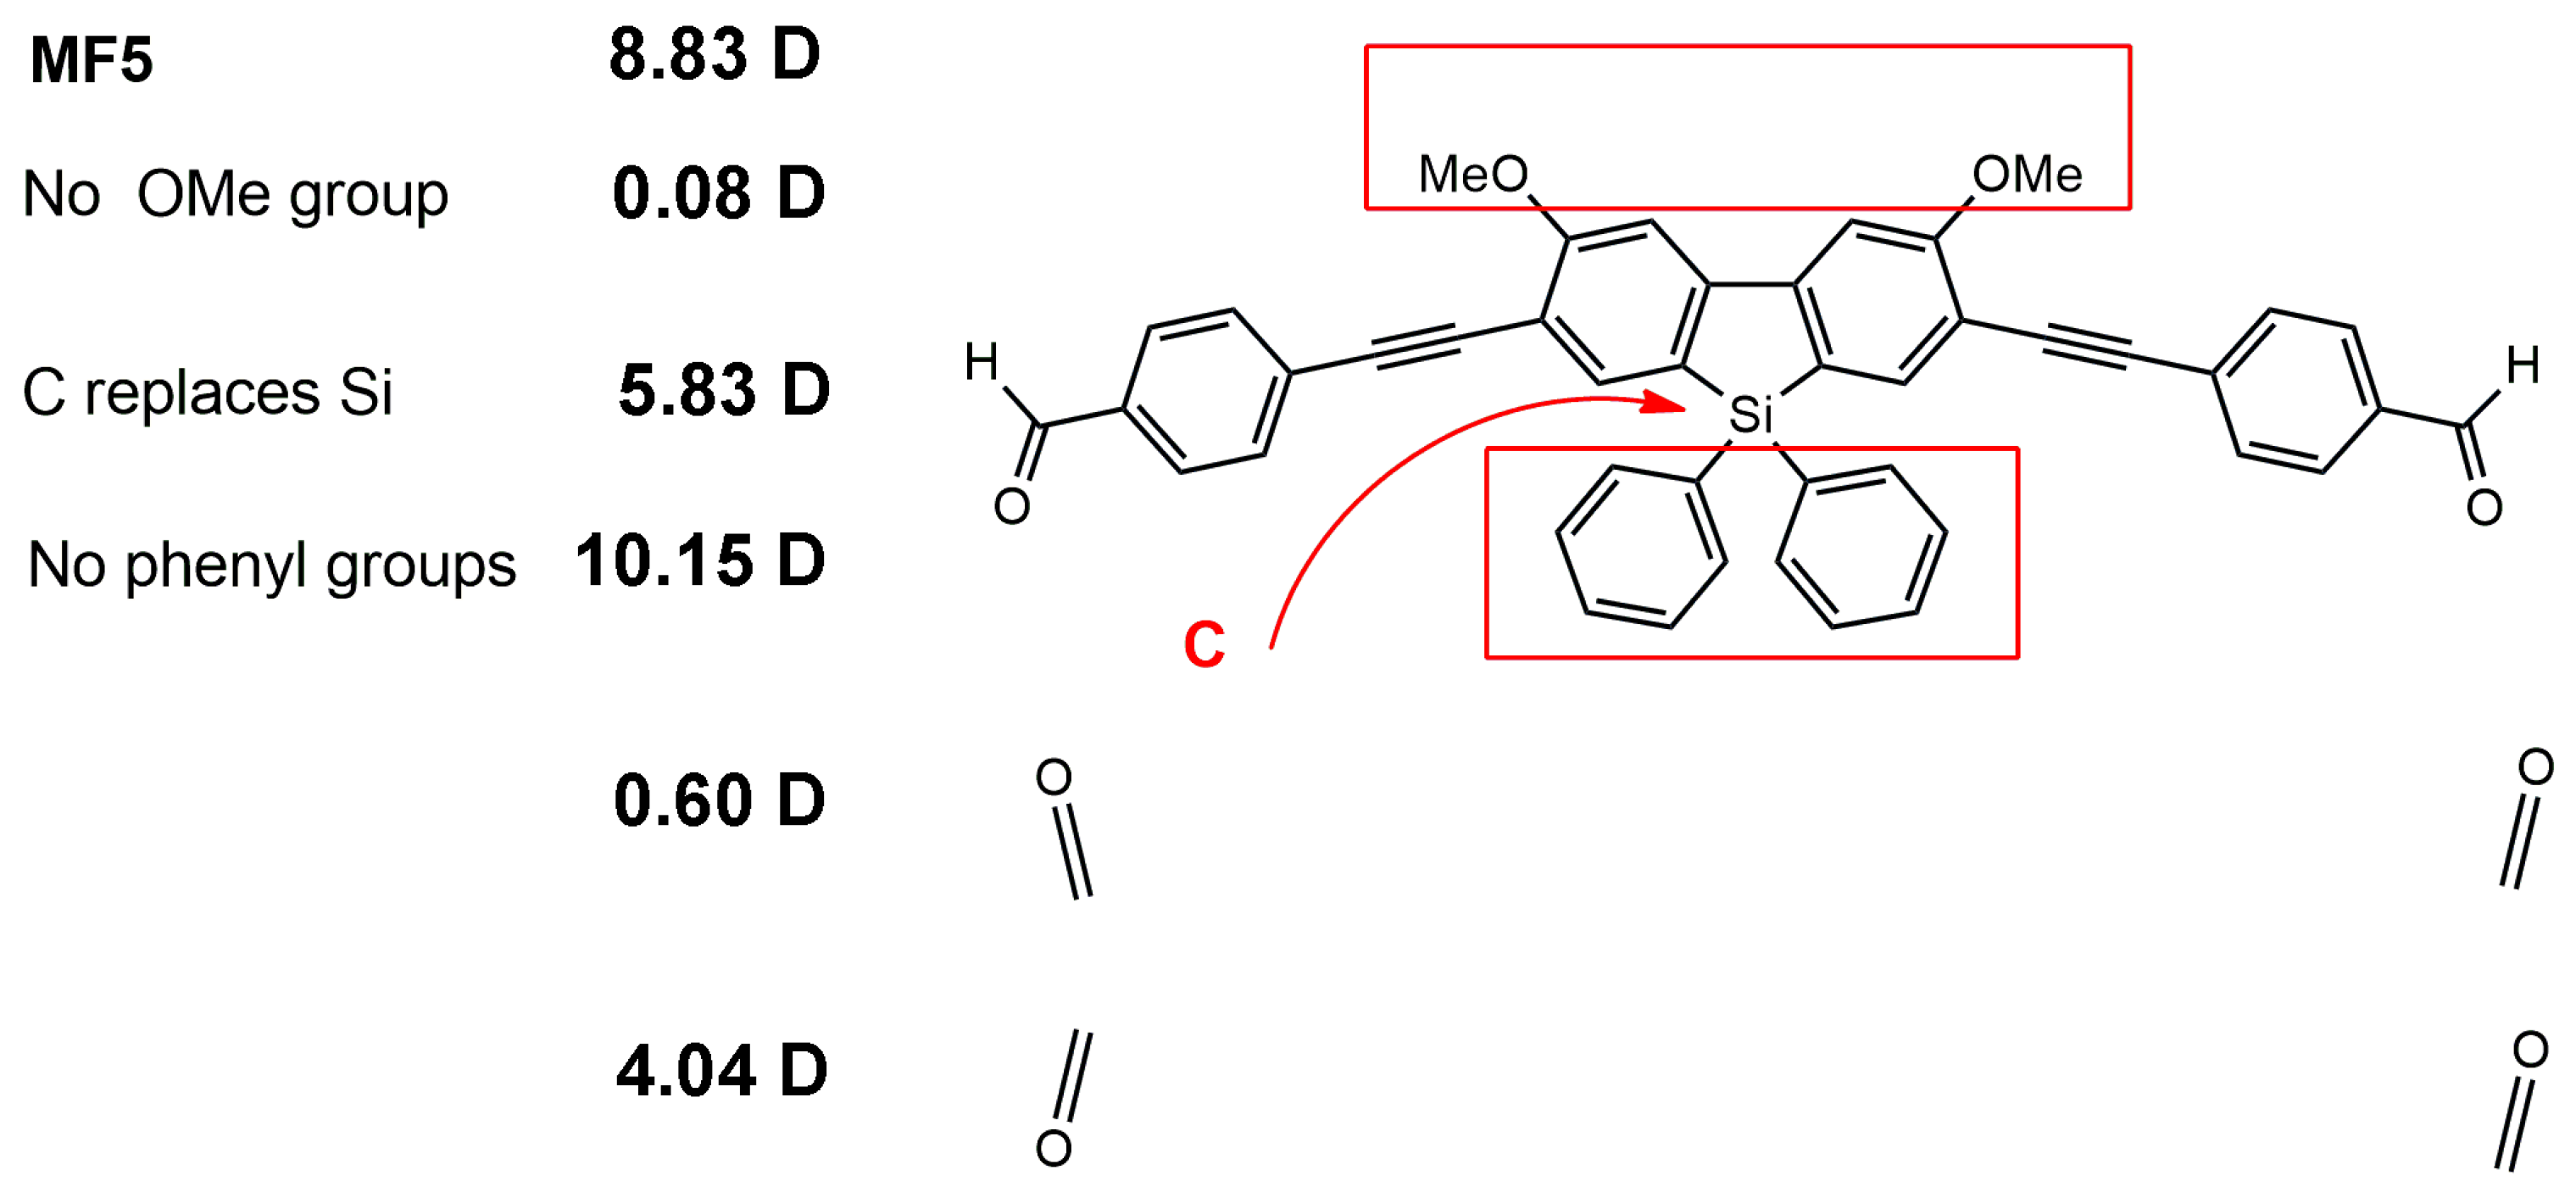
This general structure also provides a wealth of opportunities for exploring the design of solvatochromic probes, and DFT is especially useful in exploring structure space without committing resources for synthesis. As an example, a structure–dipole moment relationship exploration was conducted via DFT calculations on a series of MFs related to MF5. As summarized in Figure 9, the methoxy groups are absolutely critical to the magnitude of the dipole moment; substituting the central atom with C decreased the dipole moment, while removing the phenyl groups increased it. Thus, even within the fluorene core there are opportunities to increase the dipole moment and hence solvatochromism.
Further, consistent with the conformational variations explored above for other probes, dipole moment varies with the rotation of the carbonyl; even the preferred conformation cannot be easily known in the environment.
Finally, one can take this exercise further and design new molecules with high dipole moments. For example, benzoxazole or benzimidazole derivatives are fluorescent [65,66,67]. 2,7-disubstitution of sila- or germafluorene with these groups form chimeric probes which increase the computed ground state dipole moment in polar solvent to 15 and 13 D, respectively [68]. These are excellent leads for increasing the solvatochromic behavior of metallafluorenes.
4. Conclusions
Derivatization of existing probes is often conducted with a goal to increase desirable properties such as solubility and emission wavelength. However, such modifications can have an impact on the ground state dipole moment and could affect solvatochromic behavior. Through the analysis of published Stokes shift data for a few series of known solvatochromic probes, an informative correlation between the computed ground state dipole moment and experimental solvatochromic behavior has been established. Molecular conformations accessible via bond rotation can also affect the ground state dipole moment and thus the correlation, which is an important factor in conducting DFT calculations for this purpose. Expanding the library of computed data for other solvatochromic probes would be needed to assess the greater generality of the correlation. Finally, while DFT calculations are a common form of probe characterization, they can also provide powerful design tools for the development of new solvatochromic probes, as well as a way to enlist the efforts of junior scientists to contribute productively to probe development.
Funding
This research received no external funding.
Data Availability Statement
The datasets generated during and/or analyzed during the current study are available from the corresponding author on reasonable request.
Conflicts of Interest
The author holds and has filed patents that are relevant to the content of this article: US Patent 20220162235 and provisional patent 63/511,403.
Abbreviations
DFT: density functional theory; HOMO, highest occupied molecular orbital; LUMO, lowest unoccupied molecular orbital; MF, metallafluorene.
References
- Klymchenko, A.S. Solvatochromic and Fluorogenic Dyes as Environment-Sensitive Probes: Design and Biological Applications. Acc. Chem. Res. 2017, 50, 366–375. [Google Scholar] [CrossRef]
- Sezgin, E.; Levental, I.; Mayor, S.; Eggeling, C. The mystery of membrane organization: Composition, regulation and roles of lipid rafts. Nat. Rev. Mol. Cell Biol. 2017, 18, 361–374. [Google Scholar] [CrossRef]
- Levental, I.; Levental, K.R.; Heberle, F.A. Lipid Rafts: Controversies Resolved, Mysteries Remain. Trends Cell Biol. 2020, 30, 341–353. [Google Scholar] [CrossRef]
- Klymchenko, A.S.; Kreder, R. Fluorescent probes for lipid rafts: From model membranes to living cells. Chem. Biol. 2014, 21, 97–113. [Google Scholar] [CrossRef] [PubMed]
- Zalba, S.; Ten Hagen, T.L. Cell membrane modulation as adjuvant in cancer therapy. Cancer Treat. Rev. 2017, 52, 48–57. [Google Scholar] [CrossRef] [PubMed]
- Ashoka, A.H.; Ashokkumar, P.; Kovtun, Y.P.; Klymchenko, A.S. Solvatochromic Near-Infrared Probe for Polarity Mapping of Biomembranes and Lipid Droplets in Cells under Stress. J. Phys. Chem. Lett. 2019, 10, 2414–2421. [Google Scholar] [CrossRef] [PubMed]
- Danylchuk, D.I.; Jouard, P.-H.; Klymchenko, A.S. Targeted Solvatochromic Fluorescent Probes for Imaging Lipid Order in Organelles under Oxidative and Mechanical Stress. J. Am. Chem. Soc. 2021, 143, 912–924. [Google Scholar] [CrossRef] [PubMed]
- Darwich, Z.; Klymchenko, A.S.; Kucherak, O.A.; Richert, L.; Mely, Y. Detection of apoptosis through the lipid order of the outer plasma membrane leaflet. Biochim. Biophys. Acta 2012, 1818, 3048–3054. [Google Scholar] [CrossRef] [PubMed]
- Shynkar, V.V.; Klymchenko, A.S.; Kunzelmann, C.; Duportail, G.; Muller, C.D.; Demchenko, A.P.; Freyssinet, J.M.; Mely, Y. Fluorescent biomembrane probe for ratiometric detection of apoptosis. J. Am. Chem. Soc. 2007, 129, 2187–2193. [Google Scholar] [CrossRef] [PubMed]
- Niu, J.; Ma, Y.; Yang, Y.; Lv, H.; Wang, J.; Wang, T.; Liu, F.; Xu, S.; Jiang, Z.; Lin, W. Lighting up the changes of plasma membranes during apoptosis with fluorescent probes. Coord. Chem. Rev. 2023, 476, 214926. [Google Scholar] [CrossRef]
- Yang, S.T.; Kreutzberger, A.J.B.; Kiessling, V.; Ganser-Pornillos, B.K.; White, J.M.; Tamm, L.K. HIV virions sense plasma membrane heterogeneity for cell entry. Sci. Adv. 2017, 3, e1700338. [Google Scholar] [CrossRef] [PubMed]
- Carravilla, P.; Nieva, J.L.; Eggeling, C. Fluorescence Microscopy of the HIV-1 Envelope. Viruses 2020, 12, 348. [Google Scholar] [CrossRef] [PubMed]
- Chojnacki, J.; Waithe, D.; Carravilla, P.; Huarte, N.; Galiani, S.; Enderlein, J.; Eggeling, C. Envelope glycoprotein mobility on HIV-1 particles depends on the virus maturation state. Nat. Comm. 2017, 8, 545. [Google Scholar] [CrossRef] [PubMed]
- Lorizate, M.; Brugger, B.; Akiyama, H.; Glass, B.; Muller, B.; Anderluh, G.; Wieland, F.T.; Krausslich, H.G. Probing HIV-1 membrane liquid order by Laurdan staining reveals producer cell-dependent differences. J. Biol. Chem. 2009, 284, 22238–22247. [Google Scholar] [CrossRef]
- Algar, W.R.; Hildebrandt, N.; Vogel, S.S.; Medintz, I.L. FRET as a biomolecular research tool—Understanding its potential while avoiding pitfalls. Nat. Methods 2019, 16, 815–829. [Google Scholar] [CrossRef]
- Shaya, J.; Collot, M.; Benailly, F.; Mahmoud, N.; Mely, Y.; Michel, B.Y.; Klymchenko, A.S.; Burger, A. Turn-on Fluorene Push-Pull Probes with High Brightness and Photostability for Visualizing Lipid Order in Biomembranes. ACS Chem. Biol. 2017, 12, 3022–3030. [Google Scholar] [CrossRef]
- Martinez, V.; Henary, M. Nile Red and Nile Blue: Applications and Syntheses of Structural Analogues. Chemistry 2016, 22, 13764–13782. [Google Scholar] [CrossRef] [PubMed]
- Greenspan, P.; Mayer, E.P.; Fowler, S.D. Nile red: A selective fluorescent stain for intracellular lipid droplets. J. Cell Biol. 1985, 100, 965–973. [Google Scholar] [CrossRef]
- Wang, Y.; Chen, J.; Di, C.; Hu, Y.; Munyemana, J.C.; Shu, Y.; Wang, J.-H.; Qiu, H. A novel colorimetric and red-emitting fluorescent probe based on benzopyrylium derivatives for selective detection and imaging of SO2 derivatives in cells and zebrafish. Dye. Pigment. 2023, 212, 111129. [Google Scholar] [CrossRef]
- Liu, F.; Wang, Z.; Wang, W.; Luo, J.-G.; Kong, L. Red-Emitting Fluorescent Probe for Detection of γ-Glutamyltranspeptidase and Its Application of Real-Time Imaging under Oxidative Stress in Cells and In Vivo. Anal. Chem. 2018, 90, 7467–7473. [Google Scholar] [CrossRef]
- Kucherak, O.A.; Oncul, S.; Darwich, Z.; Yushchenko, D.A.; Arntz, Y.; Didier, P.; Mely, Y.; Klymchenko, A.S. Switchable nile red-based probe for cholesterol and lipid order at the outer leaflet of biomembranes. J. Am. Chem. Soc. 2010, 132, 4907–4916. [Google Scholar] [CrossRef]
- Misra, R.M.; Bhattacharyya, S.P. Intramolecular Charge Transfer: Theory and Applications, 1st ed.; Wiley-VCH.: Weinheim, Germany, 2018. [Google Scholar]
- Reichardt, C. Solvatochromic Dyes as Solvent Polarity Indicators. Chem. Rev. 1994, 94, 2319–2358. [Google Scholar] [CrossRef]
- Sun, R.; Wan, W.; Jin, W.; Bai, Y.; Xia, Q.; Wang, M.; Huang, Y.; Zeng, L.; Sun, J.; Peng, C.; et al. Derivatizing Nile Red fluorophores to quantify the heterogeneous polarity upon protein aggregation in the cell. Chem. Commun. 2022, 58, 5407–5410. [Google Scholar] [CrossRef]
- Liu, L.; Lei, Y.; Zhang, J.; Li, N.; Zhang, F.; Wang, H.; He, F. Rational Design for Multicolor Flavone-Based Fluorophores with Aggregation-Induced Emission Enhancement Characteristics and Applications in Mitochondria-Imaging. Molecules 2018, 23, 2290. [Google Scholar] [CrossRef] [PubMed]
- Shaya, J.; Fontaine-Vive, F.; Michel, B.Y.; Burger, A. Rational Design of Push-Pull Fluorene Dyes: Synthesis and Structure-Photophysics Relationship. Chemistry 2016, 22, 10627–10637. [Google Scholar] [CrossRef] [PubMed]
- Tarai, A.; Huang, M.; Das, P.; Pan, W.; Zhang, J.; Gu, Z.; Yan, W.; Qu, J.; Yang, Z. ICT and AIE Characteristics Two Cyano-Functionalized Probes and Their Photophysical Properties, DFT Calculations, Cytotoxicity, and Cell Imaging Applications. Molecules 2020, 25, 585. [Google Scholar] [CrossRef] [PubMed]
- Li, L.; Xu, Y.; Chen, Y.; Zheng, J.; Zhang, J.; Li, R.; Wan, H.; Yin, J.; Yuan, Z.; Chen, H. A Family of Push-Pull Bio-Probes for Tracking Lipid Droplets in Living Cells with the Detection of Heterogeneity and Polarity. Anal. Chim. Acta 2020, 1096, 166–173. [Google Scholar] [CrossRef]
- Jarrett-Noland, S.; McConnell, W.; Braddock-Wilking, J.; Dupureur, C. Solvatochromic Behavior of 2,7-Disubstituted Sila- and Germafluorenes. Chemosensors 2023, 11, 160. [Google Scholar] [CrossRef]
- Mes, G.; de Jong, B.; van Ramesdonk, H.; Verhoeven, J.; Warman, J.; de Haas, M.; Horsman-van den Dool, L. Excited-State Dipole Moment and Solvatochromism of Highly Fluorescent Rod-Shaped Bichromophoric Molecules. J. Am. Chem. Soc. 1984, 106, 6524–6528. [Google Scholar] [CrossRef]
- Kawski, A.; Bojarski, P.; Kuklinski, B. Estimation of ground- and excited-state dipole moments of Nile Red dye from solvatochromic effect on absorption and fluorescence spectra. Chem. Phys. Lett. 2008, 463, 410–412. [Google Scholar] [CrossRef]
- Vequi-Suplicy, C.C.; Coutinho, K.; Lamy, M.T. Electric dipole moments of the fluorescent probes Prodan and Laurdan: Experimental and theoretical evaluations. Biophys. Rev. 2014, 6, 63–74. [Google Scholar] [CrossRef] [PubMed]
- Mukherjee, S.; Chattopadhyay, A.; Samanta, A.; Soujanya, T. Dipole Moment Change of NBD Group upon Excitation Studied Using Solvatochromic and Quantum Chemical Approaches: Implications in Membrane Research. J. Phys. Chem. 1994, 98, 2809–2812. [Google Scholar] [CrossRef]
- Patil, O.; Ingalgondi, P.; Mathapati, G.; Gounalli, S.; Sankarappa, T.; Hanagodimath, S. Ground and Excited State Dipole Moments of a Dye. J. Appl. Phys. 2016, 8, 55–59. [Google Scholar]
- Gulseven Sidir, Y.; Sidir, I. Solvent effect on the absorption and fluorescence spectra of 7-acetoxy-6-(2,3-dibromopropyl)-4,8-dimethylcoumarin: Determination of ground and excited state dipole moments. Spectrochim. Acta A Mol. Biomol. Spectrosc. 2013, 102, 286–296. [Google Scholar] [CrossRef] [PubMed]
- Yablon, D.G.; Schilowitz, A.M. Solvatochromism of Nile Red in nonpolar solvents. Appl. Spectrosc. 2004, 58, 843–847. [Google Scholar] [CrossRef] [PubMed]
- Vazquez, M.E.; Blanco, J.B.; Imperiali, B. Photophysics and biological applications of the environment-sensitive fluorophore 6-N,N-dimethylamino-2,3-naphthalimide. J. Am. Chem. Soc. 2005, 127, 1300–1306. [Google Scholar] [CrossRef] [PubMed]
- Karthik, C.; Manjuladevi, V.; Gupta, R.; Kumari, S. Solvatochromism of tricycloquinazoline based disk-shaped liquid crystal: A potential molecular probe for fluorescence imaging. RSC Adv. 2015, 5, 84592–84600. [Google Scholar] [CrossRef]
- Lide, D.R. Handbook of Chemistry and Physics, 87th ed.; Lide, D.R., Ed.; CRC Press: Boca Raton, FL, USA, 2006. [Google Scholar]
- Thipperudrappa, J. Analaysis of solvatochromism of a biologically active ketocyanine dye using different solvent polarity scales and estimation of dipole moments. Int. J. Life Sci. Pharm. Res. 2014, 4, 1–11. [Google Scholar]
- Bakhshiev, N.G. Universal Intermolecular Interactions and Their Effect on the Position the Electronic Spectra of Molecules in Two Component Solutions. Opt. Spektrosk. 1964, 16, 821–832. [Google Scholar]
- Chamma, A.; Viallet, P. Determination du moment dipolaire d'une molecule dans un etat excite singulet. Comptes Rendus Acad. Des. Sci. 1970, 27, 1901–1904. [Google Scholar]
- Kumari, R.; Varghese, A.; George, L. Estimation of Ground-State and Singlet Excited-State Dipole Moments of Substituted Schiff Bases Containing Oxazolidin-2-One Moiety through Solvatochromic Methods. J. Fluor. 2017, 27, 151–165. [Google Scholar] [CrossRef]
- Kucherak, O.A.; Didier, P.; Mély, Y.; Klymchenko, A.S. Fluorene Analogues of Prodan with Superior Fluorescence Brightness and Solvatochromism. J. Phys. Chem. Lett. 2010, 1, 616–620. [Google Scholar] [CrossRef]
- Renuka, C.G.; Shivashankar, K.; Boregowda, P.; Bellad, S.S.; Muregendrappa, M.V.; Nadaf, Y.F. An Experimental and Computational Study of 2-(3-Oxo-3H-benzo[f] chromen-1-ylmethoxy)-Benzoic Acid Methyl Ester. J. Solut. Chem. 2017, 46, 1535–1555. [Google Scholar] [CrossRef]
- Aaron, J.-J.; Buna, M.; Parkanyi, C.; Antonious, M.S.; Tine, A.; Cisse, L. Quantitative Treatment of the Effect of Solvent on the Electronic Absorption and Fluorescence Spectra of Substituted Coumarins: Evaluation of the First Excited Singlet-State Dipole Moments. J. Fluor. 1995, 5, 337–347. [Google Scholar] [CrossRef]
- Cha, S.; Choi, M.G.; Jeon, H.R.; Chang, S.K. Negative Solvatochromism of Merocyanine Dyes: Application as Water Content Probes for Organic Solvents. Sens. Actuators B Chem. 2011, 157, 14–18. [Google Scholar] [CrossRef]
- Arathi, A.S.; Mallick, S.; Koner, A.L. Tuning Aggregation-Induced Emission of 2,3-Napthalimide by Employing Cyclodextrin Nanocavities. ChemistrySelect 2016, 1, 3535–3540. [Google Scholar] [CrossRef]
- Pandey, A.; Rai, R.; Pal, M.; Pandey, S. How polar are choline chloride-based deep eutectic solvents? Phys. Chem. Chem. Phys. 2014, 16, 1559–1568. [Google Scholar] [CrossRef] [PubMed]
- Kim, H.M.; Choo, H.J.; Jung, S.Y.; Ko, Y.G.; Park, W.H.; Jeon, S.J.; Kim, C.H.; Joo, T.; Cho, B.R. A two-photon fluorescent probe for lipid raft imaging: C-laurdan. Chembiochem 2007, 8, 553–559. [Google Scholar] [CrossRef] [PubMed]
- Niko, Y.; Kawauchi, S.; Konishi, G. Solvatochromic pyrene analogues of Prodan exhibiting extremely high fluorescence quantum yields in apolar and polar solvents. Chemistry 2013, 19, 9760–9765. [Google Scholar] [CrossRef]
- Giordano, L.; Shvadchak, V.V.; Fauerbach, J.A.; Jares-Erijman, E.A.; Jovin, T.M. Highly Solvatochromic 7-Aryl-3-hydroxychromones. J. Phys. Chem. Lett. 2012, 3, 1011–1016. [Google Scholar] [CrossRef] [PubMed]
- Zhang, H.; Fan, J.; Dong, H.; Zhang, S.; Xu, W.; Wang, J.; Gao, P.; Peng, X. Fluorene-Derived Two-Photon Fluorescent Probes for Specific and Simultaneous Bioimaging of Endoplasmic Reticulum and Lysosomes: Group-Effect and Localization Hua. J. Mater. Chem. B 2013, 1, 5450–5455. [Google Scholar] [CrossRef]
- Chen, R.F.; Fan, Q.L.; Liu, S.J.; Zhu, R.; Pu, K.Y.; Huang, W. Fluorene and Silafluorene Conjugated Copolymer: A New Blue Light-Emitting Polymer. Synth. Met. 2006, 156, 1161–1167. [Google Scholar] [CrossRef]
- Yang, T.; Zuo, Y.; Zhang, Y.; Gou, Z.; Wang, X.; Lin, W. Novel Fluorene-Based Fluorescent Probe with Excellent Stability for Selective Detection of SCN- and Its Applications in Paper-Based Sensing and Bioimaging. J. Mat. Chem. B 2019, 7, 4649–4654. [Google Scholar] [CrossRef]
- Niko, Y.; Klymchenko, A.S. Emerging Solvatochromic Push-Pull Dyes for Monitoring the Lipid Order of Biomembranes in Live Cells. J. Biochem. 2021, 170, 163–174. [Google Scholar] [CrossRef] [PubMed]
- Auvray, M.; Bolze, F.; Clavier, G.; Mahuteau-Betzer, F. Silafluorene as a promising core for cell-permeant, highly bright and two-photon excitable fluorescent probes for live-cell imaging. Dye. Pigment. 2021, 187, 109083–109091. [Google Scholar] [CrossRef]
- Li, L.; Xu, C.; Li, S. Synthesis and photophysical properties of highly emissive compounds containing a dibenzosilole core. Tet. Lett. 2010, 51, 622–624. [Google Scholar] [CrossRef]
- Hammerstroem, D.W.; Braddock-Wilking, J.; Rath, N.P. Synthesis and characterization of luminescent 2,7-disubstituted silafluorenes. J. Organomet. Chem. 2016, 813, 110–118. [Google Scholar] [CrossRef]
- Hammerstroem, D.W.; Braddock-Wilking, J.; Rath, N.P. Luminescent 2,7-disubstituted germafluorenes. J. Organomet. Chem. 2017, 830, 196–202. [Google Scholar] [CrossRef]
- Germann, S.; Jarrett, S.J.; Dupureur, C.M.; Rath, N.P.; Gallaher, E.; Braddock-Wilking, J. Synthesis of Luminescent 2-7 Disubstituted Silafluorenes with alkynyl-carbazole, -phenanthrene, and -benzaldehyde substituents. J. Organomet. Chem. 2020, 927, 121514. [Google Scholar] [CrossRef]
- Braddock-Wilking, J.; Dupureur, C.; Germann, S.; Spikes, H. Luminescent Silafluorene and Germafluorene Compounds. U.S. Patent 20220162235, 26 May 2022. [Google Scholar]
- Spikes, H.J.; Jarrett-Noland, S.J.; Germann, S.M.; Braddock-Wilking, J.; Dupureur, C.M. Group 14 Metallafluorenes as Sensitive Luminescent Probes of Surfactants in Aqueous Solution. J. Fluor. 2021, 31, 961–969. [Google Scholar] [CrossRef]
- Spikes, H.J.; Jarrett-Noland, S.J.; Germann, S.M.; Olivas, W.; Braddock-Wilking, J.; Dupureur, C.M. Group 14 Metallafluorenes for Lipid Structure Detection and 2 Cellular Imaging. Chem. Proc. 2021, 5, 83–88. [Google Scholar] [CrossRef]
- Xiong, J.F.; Li, J.X.; Mo, G.Z.; Huo, J.P.; Liu, J.Y.; Chen, X.Y.; Wang, Z.Y. Benzimidazole derivatives: Selective fluorescent chemosensors for the picogram detection of picric acid. J. Org. Chem. 2014, 79, 11619–11630. [Google Scholar] [CrossRef] [PubMed]
- Reiser, A.; Leyshon, L.; Saunders, D.; Mijovic, M.; Bright, A.; Bogie, J. Fluorescence of Aromatic Benzoxazole Derivatives. J. Am. Chem. Soc. 1972, 94, 2414–2421. [Google Scholar] [CrossRef]
- Barwiolek, M.; Wojtczak, A.; Kozakiewicz, A.; Babinska, M.; Tafelska-Kaczmarek, A.; Larsen, E.; Szlyk, E. The synthesis, characterization and fluorescence properties of new benzimidazole derivatives. J. Lum. 2019, 211, 88–95. [Google Scholar] [CrossRef]
- Dupureur, C.; Jarrett-Noland, S.; McConnell, W.; Gnawali, G.; Germann, S.; Braddock-Wilking, J. Chimeric Environment Sensitive Fluorescent Probes. Provisional Patent Application 63/511,403, 30 June 2023. [Google Scholar]
Figure 1.
Lo and Ld states of phospholipids. From Ref. [5] with permission.
Figure 1.
Lo and Ld states of phospholipids. From Ref. [5] with permission.

Figure 2.
Positive solvatochromism. When moving to a solvent of greater polarity, the excited state dipole moment (red) is larger than the ground state dipole moment (red), resulting in a red shift (right, dashed).
Figure 2.
Positive solvatochromism. When moving to a solvent of greater polarity, the excited state dipole moment (red) is larger than the ground state dipole moment (red), resulting in a red shift (right, dashed).

Figure 3.
Example of DFT data for solvatochromic probe MF5. ESP map (lower right) is for the ground state in polar solvent. Adapted from [29]. Red indicates areas of highest electron density, and blue the lowest.
Figure 3.
Example of DFT data for solvatochromic probe MF5. ESP map (lower right) is for the ground state in polar solvent. Adapted from [29]. Red indicates areas of highest electron density, and blue the lowest.

Figure 4.
Solvatochromism of MF5 in various solvents. Imaged upon excitation at 395 nm. H2O refers to 10 mM Tris, pH 8.
Figure 4.
Solvatochromism of MF5 in various solvents. Imaged upon excitation at 395 nm. H2O refers to 10 mM Tris, pH 8.

Figure 5.
Lippert–Mataga (left) and ET30 (right) plot for the solvatochromic dye Fr0. Plots were generated with data obtained from Ref. [44] as described in Section 2.

Figure 6.
Correlations between experimental measures of solvatochromism and computed ground state dipole moment. (A) Lippert–Mataga and (B) ET30. Data for the probes were taken from Table 2.
Figure 6.
Correlations between experimental measures of solvatochromism and computed ground state dipole moment. (A) Lippert–Mataga and (B) ET30. Data for the probes were taken from Table 2.

Figure 7.
Effect of modifications to fluorene on computed ground state dipole moment in polar solvent as observed from electrostatic potential (ESP) diagrams obtained from DFT calculations, as described in Section 2. Red indicates areas of highest electron density and blue the lowest.
Figure 7.
Effect of modifications to fluorene on computed ground state dipole moment in polar solvent as observed from electrostatic potential (ESP) diagrams obtained from DFT calculations, as described in Section 2. Red indicates areas of highest electron density and blue the lowest.

Figure 8.
Impact of substitution and conformation on the computed ground state dipole moment of Nile Red as observed from electrostatic potential (ESP) diagrams obtained from DFT calculations, as described in the Methods section. A single bond moving the chain was rotated manually in Spartan. Red indicates areas of highest electron density and blue the lowest.

Figure 9.
Structure–dipole moment relationships for MF5. Ground state dipole moments were computed via DFT as described in Section 2. Red boxes highlight groups removed.
Figure 9.
Structure–dipole moment relationships for MF5. Ground state dipole moments were computed via DFT as described in Section 2. Red boxes highlight groups removed.


Table 1.
Solvent data used in this study a.
| Solvent | Dielectric Constant b | Refractive Index b η | ET30 c | f1,η) d |
|---|---|---|---|---|
| Water | 80.1 | 1.3330 | 63.1 | 0.3217 |
| Glycol | 37.0 | 1.4385 | 56.3 | 0.2719 |
| Methanol | 32.7 | 1.3284 | 55.4 | 0.3086 |
| Ethanol | 24.5 | 1.3614 | 51.9 | 0.2911 |
| Dichloromethane | 8.93 | 1.4241 | 40.7 | 0.2172 |
| Tetrahydrofuran | 7.58 | 1.4072 | 37.4 | 0.2096 |
| Ethyl acetate | 6.00 | 1.3724 | 38.1 | 0.1993 |
| Toluene | 2.38 | 1.4969 | 33.9 | 0.01350 |
| Dioxane | 2.22 | 1.4224 | 36.0 | 0.02164 |
| Carbon tetrachloride | 2.24 | 1.4601 | 32.4 | 0.01400 |
| Acetonitrile | 37.5 | 1.3441 | 45.6 | 0.30500 |
| Dimethylformamide | 36.7 | 1.4305 | 43.2 | 0.27440 |
| DMSO | 46.7 | 1.4783 | 45.1 | 0.26340 |
| Chloroform | 4.81 | 1.4458 | 39.1 | 0.14700 |
| Cyclohexane | 2.02 | 1.4262 | 30.9 | -0.001600 |
| n-hexane | 1.88 | 1.3749 | 31.0 | -0.0014 |
| Acetone | 20.7 | 1.3587 | 42.2 | 0.2842 |
| Benzene | 2.27 | 1.5011 | 34.3 | 0.001700 |
| Diethyl ether | 4.33 | 1.3524 | 34.5 | 0.16760 |
Table 2.
Data for some solvatochromic probes.
| Probe | Structure | Lippert–Mataga Slope | ET30 Slope | Dipole Moment, D a | Ref. |
|---|---|---|---|---|---|
| Nile Red |  | 4083 | c | 8.0 b | [21,36] |
| NR12S |  | 12,860 | 200 | 14–37 d | [21] |
| Prodan |  | 3881 b | 127 | 7.7 | [49] |
| C laurdan |  | 6334 | 82 | 6.9 | [50] |
| PA |  | 7256 b | 154 | 6.0 | [51] |
| PK |  | 9503 | 95 | 4.8 | [51] |
| 7AMC |  | 11,840 | 307 | 9.2 | [52] |
| FR0 |  | 18380 | 267 | 9.2 | [44] |
| FR1/PP3 |  | 14,170 | 280 | 13.4 | [26] |
| FR2/PP6 |  | 14,880 | 212 | 6.4 | [26] |
| FR3 |  | 12,880 | 200 | 6.4–12.2 d | [16] |
| FR4 |  | 16,720 | 265 | 2.2–13.5 d | [16] |
| FR8 |  | 13,440 | 320 | 9.56 | [44] |
| 2,5APMC |  | c | 88 | 4.5 b | [40] |
| 2BME |  | 11,640 | c | 2.0–7.8 e | [45] |
| MF1 |  | 293 | 4.6 | 3.0 | [29] |
| MF2 |  | 157 | 2.5 | 3.2 | [29] |
| MF3 |  | 124 | 2.1 | 2.0 | [29] |
| MF4 |  | 253 | 4.3 | 2.2 | [29] |
| MF5 |  | 6500 | 126 | 8.8 | [29] |
a Computed in polar solvent for this work using Spartan unless otherwise indicated. b Literature values. c No meaningful correlations of solvent data with Stokes shift (R < 0.8). d Dipole moment varies with manual bond rotation. e Dipole moment of lowest energy conformers explored using Spartan.
Disclaimer/Publisher’s Note: The statements, opinions and data contained in all publications are solely those of the individual author(s) and contributor(s) and not of MDPI and/or the editor(s). MDPI and/or the editor(s) disclaim responsibility for any injury to people or property resulting from any ideas, methods, instructions or products referred to in the content. |
© 2024 by the author. Licensee MDPI, Basel, Switzerland. This article is an open access article distributed under the terms and conditions of the Creative Commons Attribution (CC BY) license (https://creativecommons.org/licenses/by/4.0/).
Share and Cite
MDPI and ACS Style
Dupureur, C.M. Use of DFT Calculations as a Tool for Designing New Solvatochromic Probes for Biological Applications. Liquids 2024, 4, 148-162. https://doi.org/10.3390/liquids4010007
AMA Style
Dupureur CM. Use of DFT Calculations as a Tool for Designing New Solvatochromic Probes for Biological Applications. Liquids. 2024; 4(1):148-162. https://doi.org/10.3390/liquids4010007
Chicago/Turabian StyleDupureur, Cynthia M. 2024. "Use of DFT Calculations as a Tool for Designing New Solvatochromic Probes for Biological Applications" Liquids 4, no. 1: 148-162. https://doi.org/10.3390/liquids4010007