
Effects of Structure and Particle Size of Iron, Cobalt and Ruthenium Catalysts on Fischer–Tropsch Synthesis

1
Center for Applied Energy Research, University of Kentucky, 2540 Research Park Drive, Lexington, KY 40511, USA
2
Department of Chemical and Biological Engineering, University of Saskatchewan, Saskatoon, SK S7N 5A9, Canada
*
Author to whom correspondence should be addressed.
Reactions 2021, 2(1), 62-77; https://doi.org/10.3390/reactions2010006
Submission received: 7 December 2020
/
Revised: 3 March 2021
/
Accepted: 11 March 2021
/
Published: 19 March 2021
(This article belongs to the Special Issue Catalytic Conversion of Carbonaceous Materials to Fuels and Chemicals)
Abstract
:This review emphasizes the importance of the catalytic conversion techniques in the production of clean liquid and hydrogen fuels (XTF) and chemicals (XTC) from the carbonaceous materials including coal, natural gas, biomass, organic wastes, biogas and CO2. Dependence of the performance of Fischer–Tropsch Synthesis (FTS), a key reaction of the XTF/XTC process, on catalyst structure (crystal and size) is comparatively examined and reviewed. The contribution illustrates the very complicated crystal structure effect, which indicates that not only the particle type, but also the particle shape, facets and orientation that have been evidenced recently, strongly influence the catalyst performance. In addition, the particle size effects over iron, cobalt and ruthenium catalysts were carefully compared and analyzed. For all Fe, Co and Ru catalysts, the metal turnover frequency (TOF) for CO hydrogenation increased with increasing metal particle size in the small size region i.e., less than the size threshold 7–8 nm, but was found to be independent of particle size for the catalysts with large particle sizes greater than the size threshold. There are some inconsistencies in the small particle size region for Fe and Ru catalysts, i.e., an opposite activity trend and an abnormal peak TOF value were observed on a Fe catalyst and a Ru catalyst (2 nm), respectively. Further study from the literature provides deeper insights into the catalyst behaviors. The intrinsic activity of Fe catalysts (10 nm) at 260–300 °C is estimated in the range of 0.046–0.20 s−1, while that of the Co and Ru catalysts (7–70 nm) at 220 °C are 0.1 s−1 and 0.4 s−1, respectively.
1. Introduction
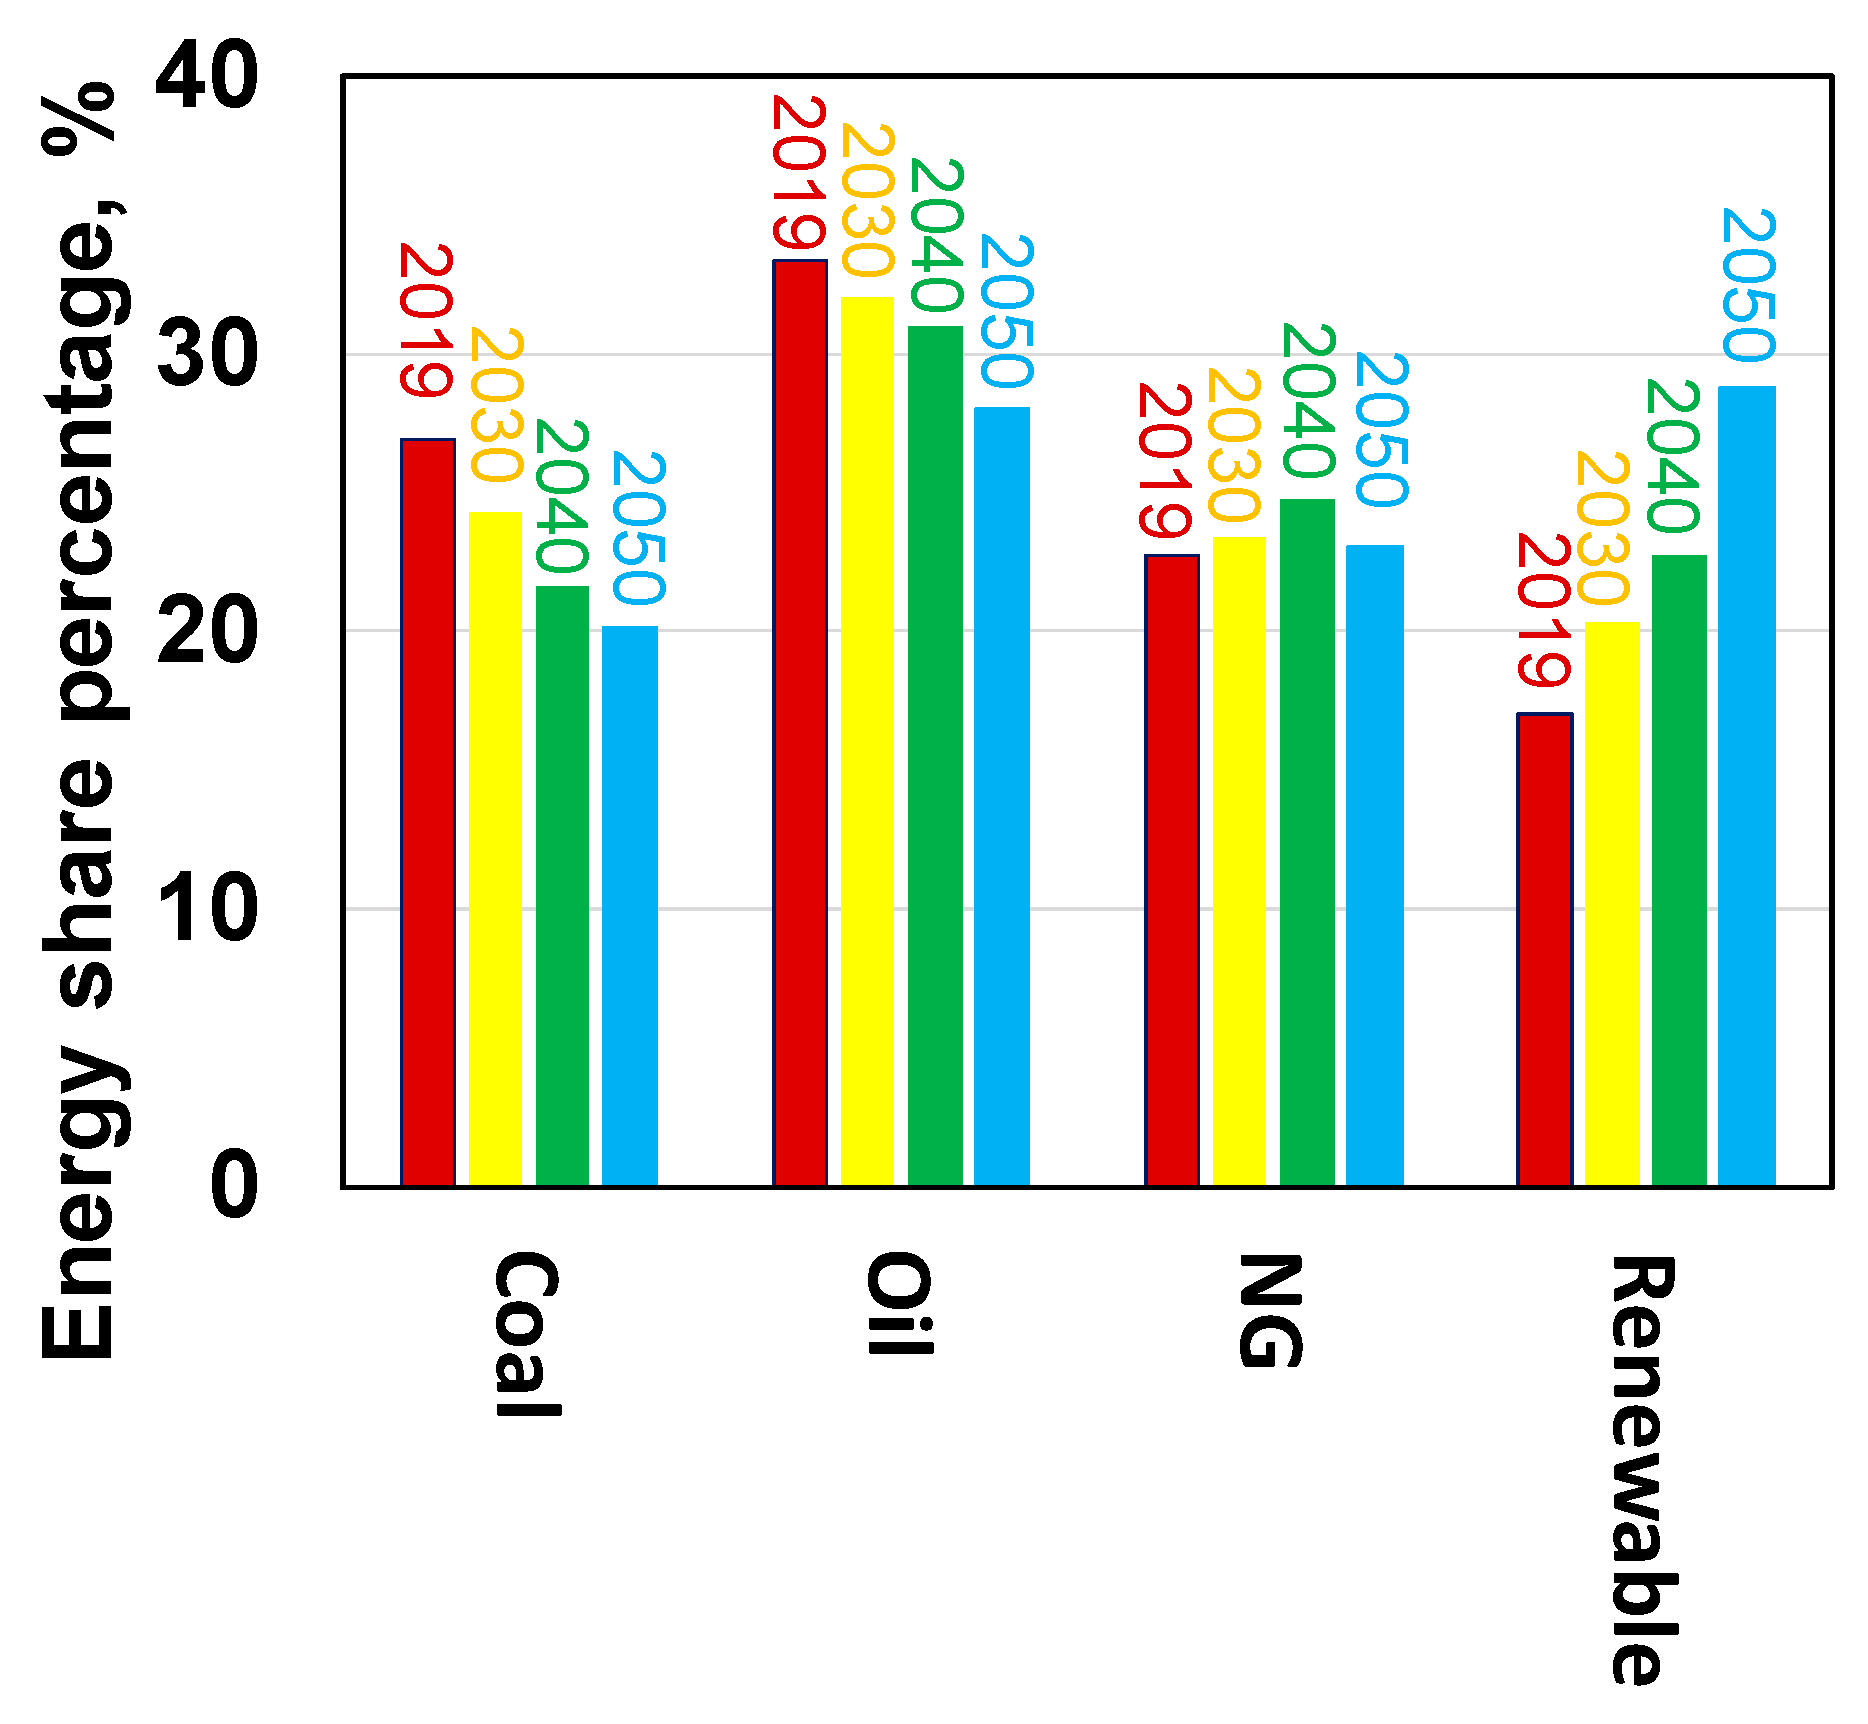
To supply vast energy needs in the world while meeting more stringent environmental regulation to reduce the greenhouse gas emission, the global energy structure dominated by the fossil fuels such as oil, coal and natural gas is required to turn to low carbon system in the next thirty years [1]. For example, based on the US Energy Information Administration (EIA), energy consumption data (see Figure 1), world fossil fuels continuously dominate accounting for 77–84% of energy consumptions by 2040 and 71.5% by 2050 through the reduction of oil and coal usage by 3–7% points. Meanwhile, the renewable energy including nuclear and hydro energy accounts for 17% in 2016 and increase to 22.3% and 28% by 2040 and 2050, respectively. At the present consumption rate, it produces about 30 billion tons of CO2 per year, mainly from power plants and heavy industries. Therefore, cleaner utilization of the fossil fuels; development of renewable energy primarily based on solar, wind and hydropower; CO2 utilization technologies; and increase in efficiency of chemical processes will play important role in reducing CO2 emission. However, despite an expected increase in the fraction of the renewable energy and/or H2 energy, catalytic conversion of the abundant world reserved and newly produced carbonaceous resources (X) including coal, natural gas, biomass, organic wastes, biogas and CO2 to liquid and hydrogen fuels (XTF) and chemicals (XTC), continues to play important role in carbon utilization, carbon neutrality and supplying clean energy. Moreover, the renewable technologies that are currently being developed, cannot achieve the required scale in the short to medium term. For example, the renewable energy, if excludes the nuclear and hydro power, only can provide 5–11% of energy required in the world. This scenario becomes more prominent in the nations having abundant carbonaceous resources, such as China, India, South Africa, USA, and European countries. Furthermore, when the advanced renewable technologies and the technologies of CO2 capture, sequestration and utilization are developed and commercialized in the future, it could lead to significantly lower the cost of gasification of various carbonaceous materials to syngas and make the XTF/XTC technologies to be more attractive in the clean utilization of the abundant carbon resources.
One of the heart of the XTF/XTC technologies is the Fischer–Tropsch synthesis (FTS) reaction, which converts a syngas mixture derived from various carbonaceous materials to hydrocarbons and alcohols (Equations (1)–(3)), meanwhile, a side reaction of water gas shift (WGS) is usually accompanied (Equation (4)).
CO + H2 → CnH2n + 2 + H2O (ΔH = −165 kJ/mol)
CO + H2 → CnH2n + H2O (ΔH = −165 kJ/mol)
CO + H2 → CnH2n + 2O + H2O (ΔH = −165 kJ/mol)
CO + H2O = CO2 + H2 (ΔH = −42 kJ/mol)
This technology, because of its importance in industry, has received extensive attention since its discovery in 1923, which led to many FT plants in the world based on large number of fundamental and applied studies [2,3]. The most common catalysts for FTS reaction are the transition metal catalysts i.e., iron, cobalt and Ruthenium, among them the Fe and Co catalysts are largely researched and commercialized because of their high activity, high selectivity to heavy hydrocarbons, and low cost [2,3,4,5]. For example, iron and cobalt catalysts can produce hydrocarbons with a chain growth probability over 0.9, and C5+ selectivity surpasses 88% when operated at low temperature ≤230 °C in a slurry phase reactor [5]. In case of Ru based catalysts, many fundamental studies have been also carried out irrespective of the extremely high cost of Ru [6,7,8,9,10]. The Ru catalysts have been reported to be most active, high resistant to water and oxygenate-containing environment, and favor the production of high molecular weight hydrocarbons. This, in turn, results in a decreased cost of FTS fuels production, which is an important requisite to successfully convert biomass-derived syngas into hydrocarbons [6,7]. However, in spite of numerous studies on this topic, there is still no clear picture what the catalysts’ potential performance can reach or what the intrinsic activities per site of Fe, Co and Ru are.
Among the vast number of studies on the FTS reaction, there is one important topic regarding the dependence of catalyst performance on catalyst structure (crystal and size). In this review, recent fundamental development in the aspect over Fe, Co and Ru catalysts are discussed, results among different studies are critically reviewed and compared. It is expected that through better understanding the structure effects and the reaction performance of Fe, Co and Ru catalysts, deep insights into catalysis on the catalysts’ surface and catalysts’ potential activity can be provided, which should be helpful for the design of new generation of catalysts with super activity, stability and selectivity.
2. Results and Discussion
2.1. Catalyst Crystal Structure and Catalytic Performance
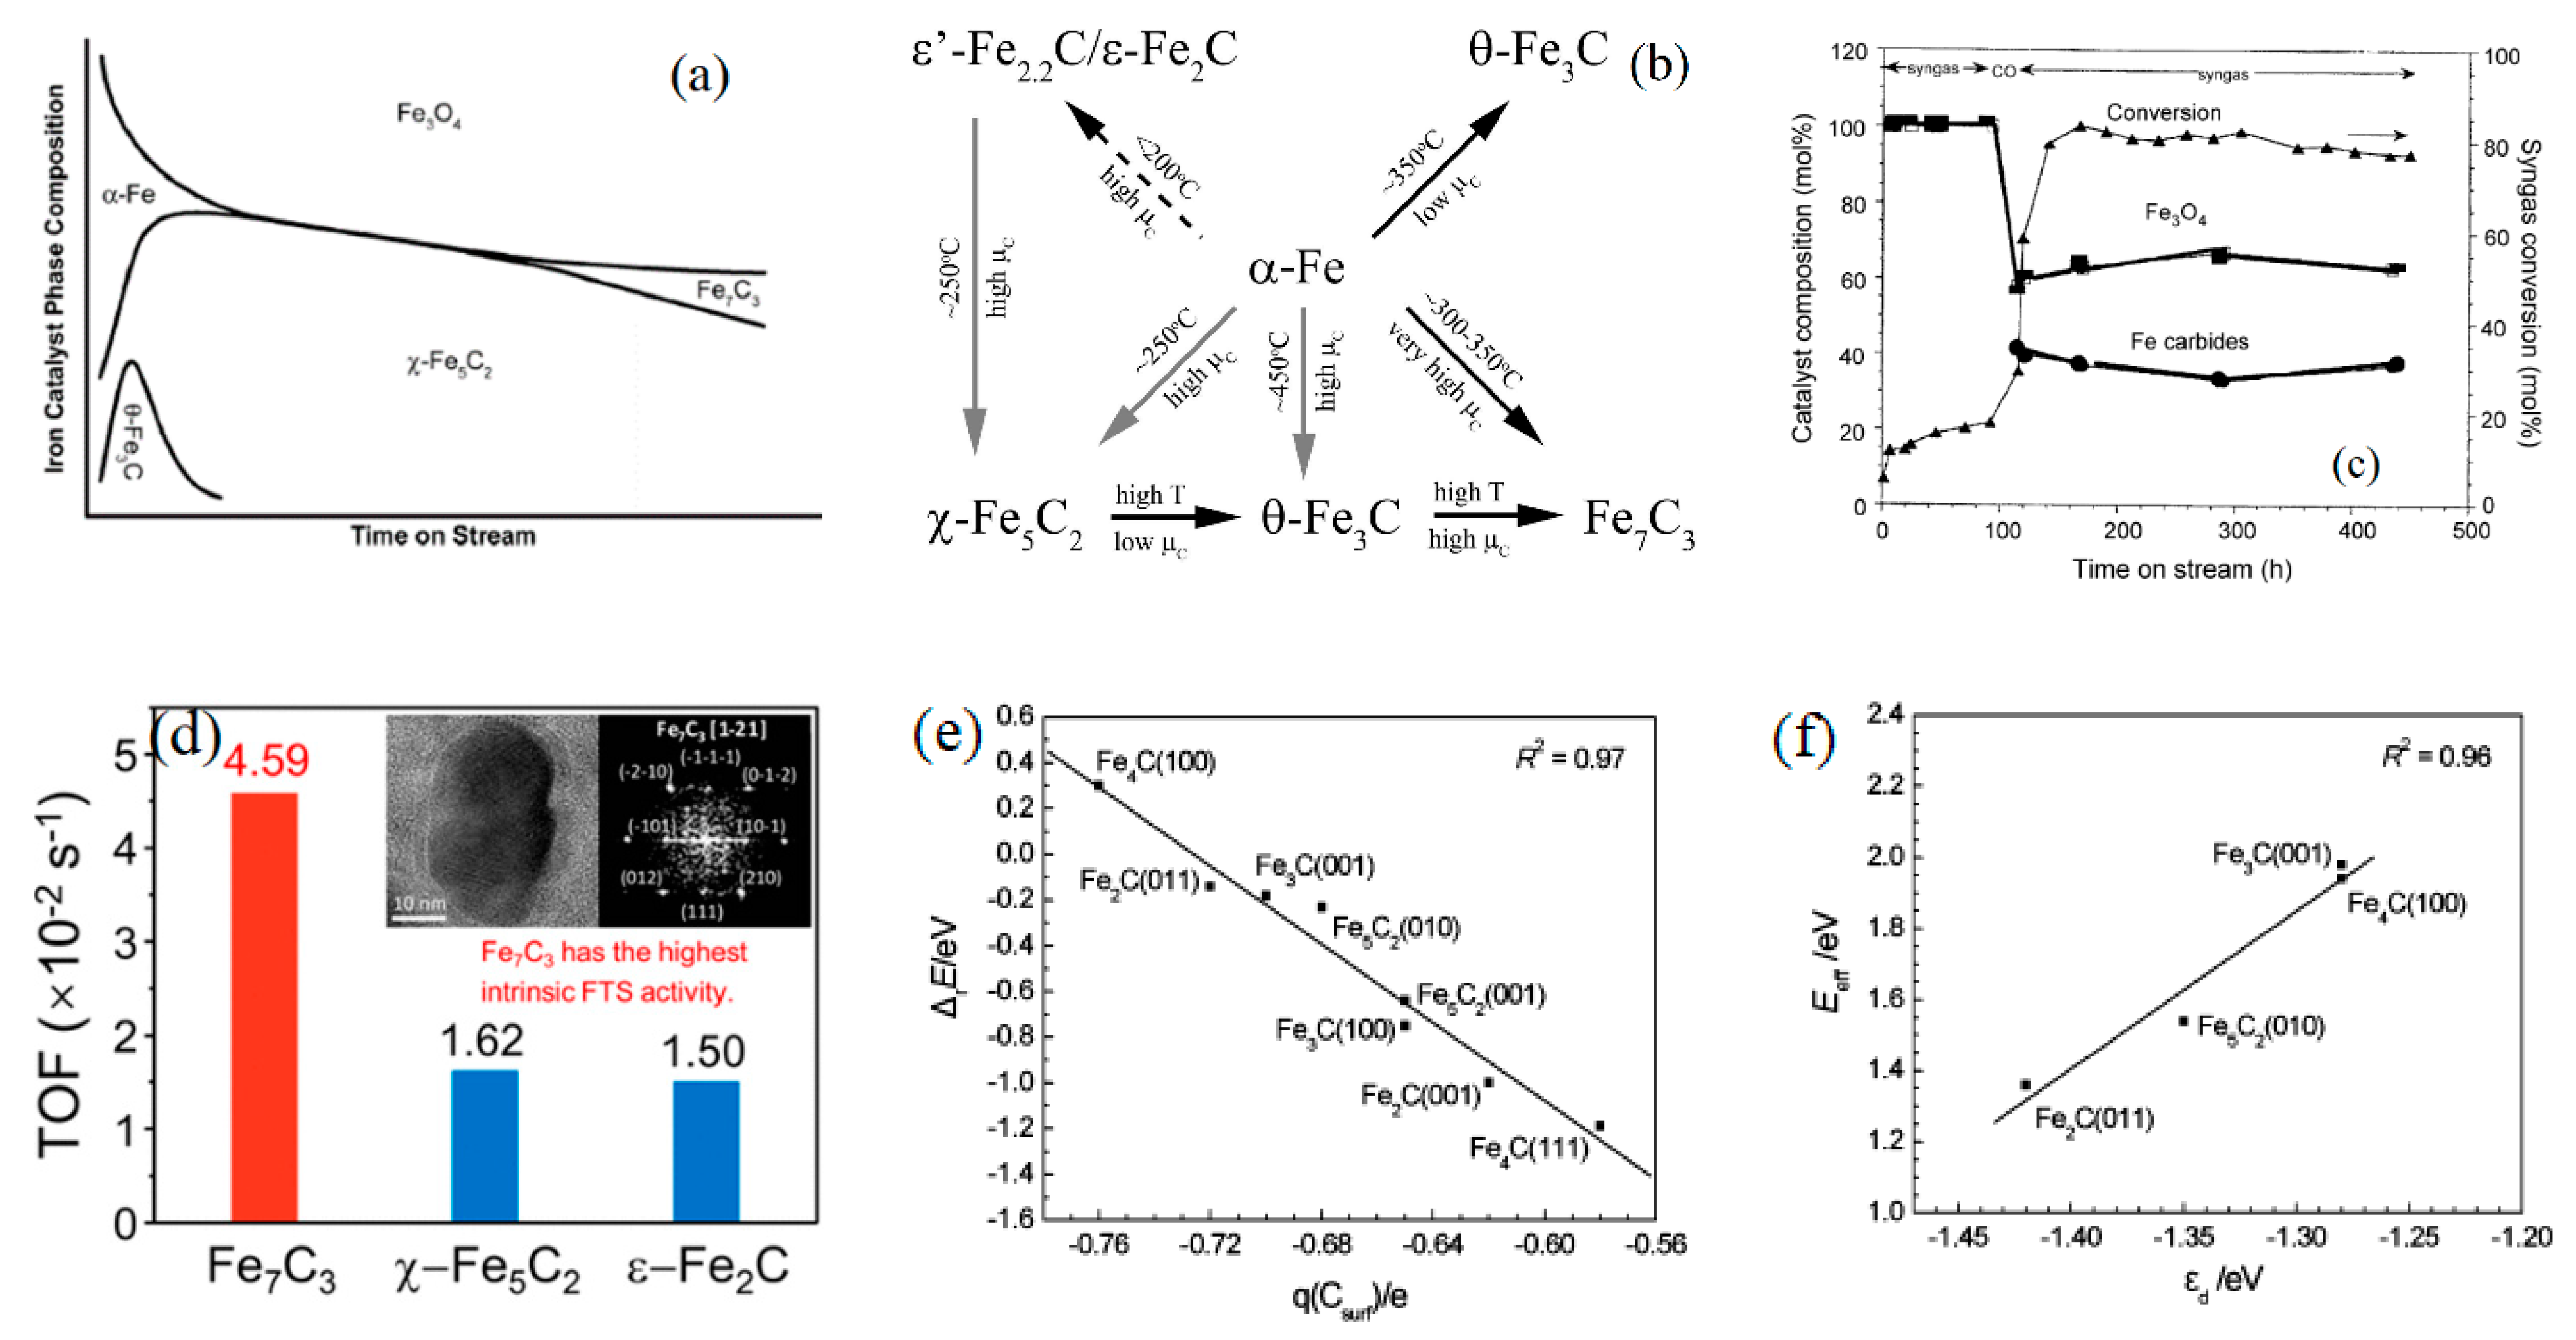
The crystal structure of the FTS catalysts plays crucial role in controlling FTS performance. In case of iron catalyst, several iron carbides with different structures, for example θ-Fe3C, χ-Fe5C2, and ε-Fe2C/ε’-Fe2.2C, and Fe7C3 (Figure 2a–d), have been identified as active phases for the FTS reaction [11,12,13,14,15]. Dry [11] has reported phase change in iron for an iron catalyst that was operated in a fluidized bed reactor at 327 °C. The metallic Fe was quickly converted to θ-Fe3C and χ-Fe5C2, while Fe7C3 (Eckstrom and Adcock) was observed at very high pressure i.e., >6.0 MPa. No clear correlation between iron catalyst and carbide phase was reported. In the study of Smit et al. [12], the stability and reactivity of iron carbide phases (θ, χ and ε) in FTS catalysts as a function of relevant reaction conditions were studied experimentally and theoretically. These authors have reported that thermodynamic stability of the carbide phases and the transformation among the carbides are highly dependent on the carbon chemical potential (μc) imposed by the chemical (gas phase) surroundings. Increasing temperature from 150 to 450 °C led to linearly decreasing of the μc, while it increased with increasing pressure from 1 to 2.0 MPa or CO/H2 ratio from 0.25 to 0.45. The trigonal prismatic (TP) carbides such as θ-Fe3C, γ-Fe5C2, and Fe7C3 are reported to be more stable than the octahedral carbides (O) ε-Fe2C and η-Fe2C at lower μC (higher temperature, lower CO pressure). At very low μC (−7.7 eV) θ-Fe3C phase is more stable than ε-Fe2.2C, and θ-Fe3C becomes more stable with respect to γ-Fe5C2 at low μC (−7.6 eV) conditions; however, Fe7C3 was reported to be stable with respect to γ-Fe5C2 at higher μC (~7.25 eV). The detailed carbides transformation is outlined in Figure 2b. Davis [13] characterized 100Fe/3.7Si/0.7K catalyst that was collected at different time period during the FTS at 270 °C, 1.3 MPa, H2/CO = 0.7 and 10–90% CO conversion. After syngas activation followed by 100 h of FTS reaction, the iron catalyst showed low activity (5–20%CO conversion) and then it was re-pretreated by CO for 24 h. The iron catalyst activity was increased significantly after it returned to normal FTS condition, and a stable CO conversion of 90% was obtained in the next 300 h, which was accompanied by mainly Fe3O4 in the first 100 h and about 40% iron carbides and 60% Fe3O4 in the remaining 300 h (Figure 2c). This study likely indicates that catalyst activity is associated with carbide phase (s). Recently, Change et al. [14] was able to show significant difference in the activities of various iron carbides. The group designed and studied the activity of different carbides on a model Fe/SiO2 catalyst at 260 °C, 3 MPa and H2/CO = 2 in a micro-fixed bed reactor. Different iron carbides including ε-Fe2C, Fe7C3, and χ-Fe5C2 were synthesized by treating the calcined Fe/SiO2 catalyst with different gas atmospheres (CO, H2, or syngas) at 300 °C. The intrinsic FTS activity of Fe7C3 was found to be the highest with a turnover frequency (TOF) of 4.59 × 10⁻² s−1, while χ-Fe5C2 and ε-Fe2C had only about 1/3 of the activity (Figure 2d); meanwhile, ε-Fe2C yielded the lowest methane selectivity.
Quantum computation i.e., ab-initio, kinetic Monte Carlo (kMC) and density functional theory (DFT) provided deeper insights into the catalysis phenomena on active metal surface. It was found that the catalyst activity also varied with facet and dimension, corner, edge of active sites. Huo et al. [16] used DFT approach to elucidate why methane formation energy varied with carbide phases (i.e., high CH4 formation rate on Fe2C(011) and Fe5C2(010) surface, and inactive CH4 rate on Fe3C(001) and Fe4C(100) surface). These authors found that reaction energy and effective barrier of CH4 formation have a linear relationship with the charge of the surface C atom and the d-band center of the surface (Figure 2e,f). Similar results were also reported on Co and Ru surface by van Santen et al. [17]. CO dissociation energy at dense terraces surfaces of Co or Ru can be much higher than that of step–edge sites (200 vs. <100 kJ/mol), which requires a step-edge site on metals for CO activation.
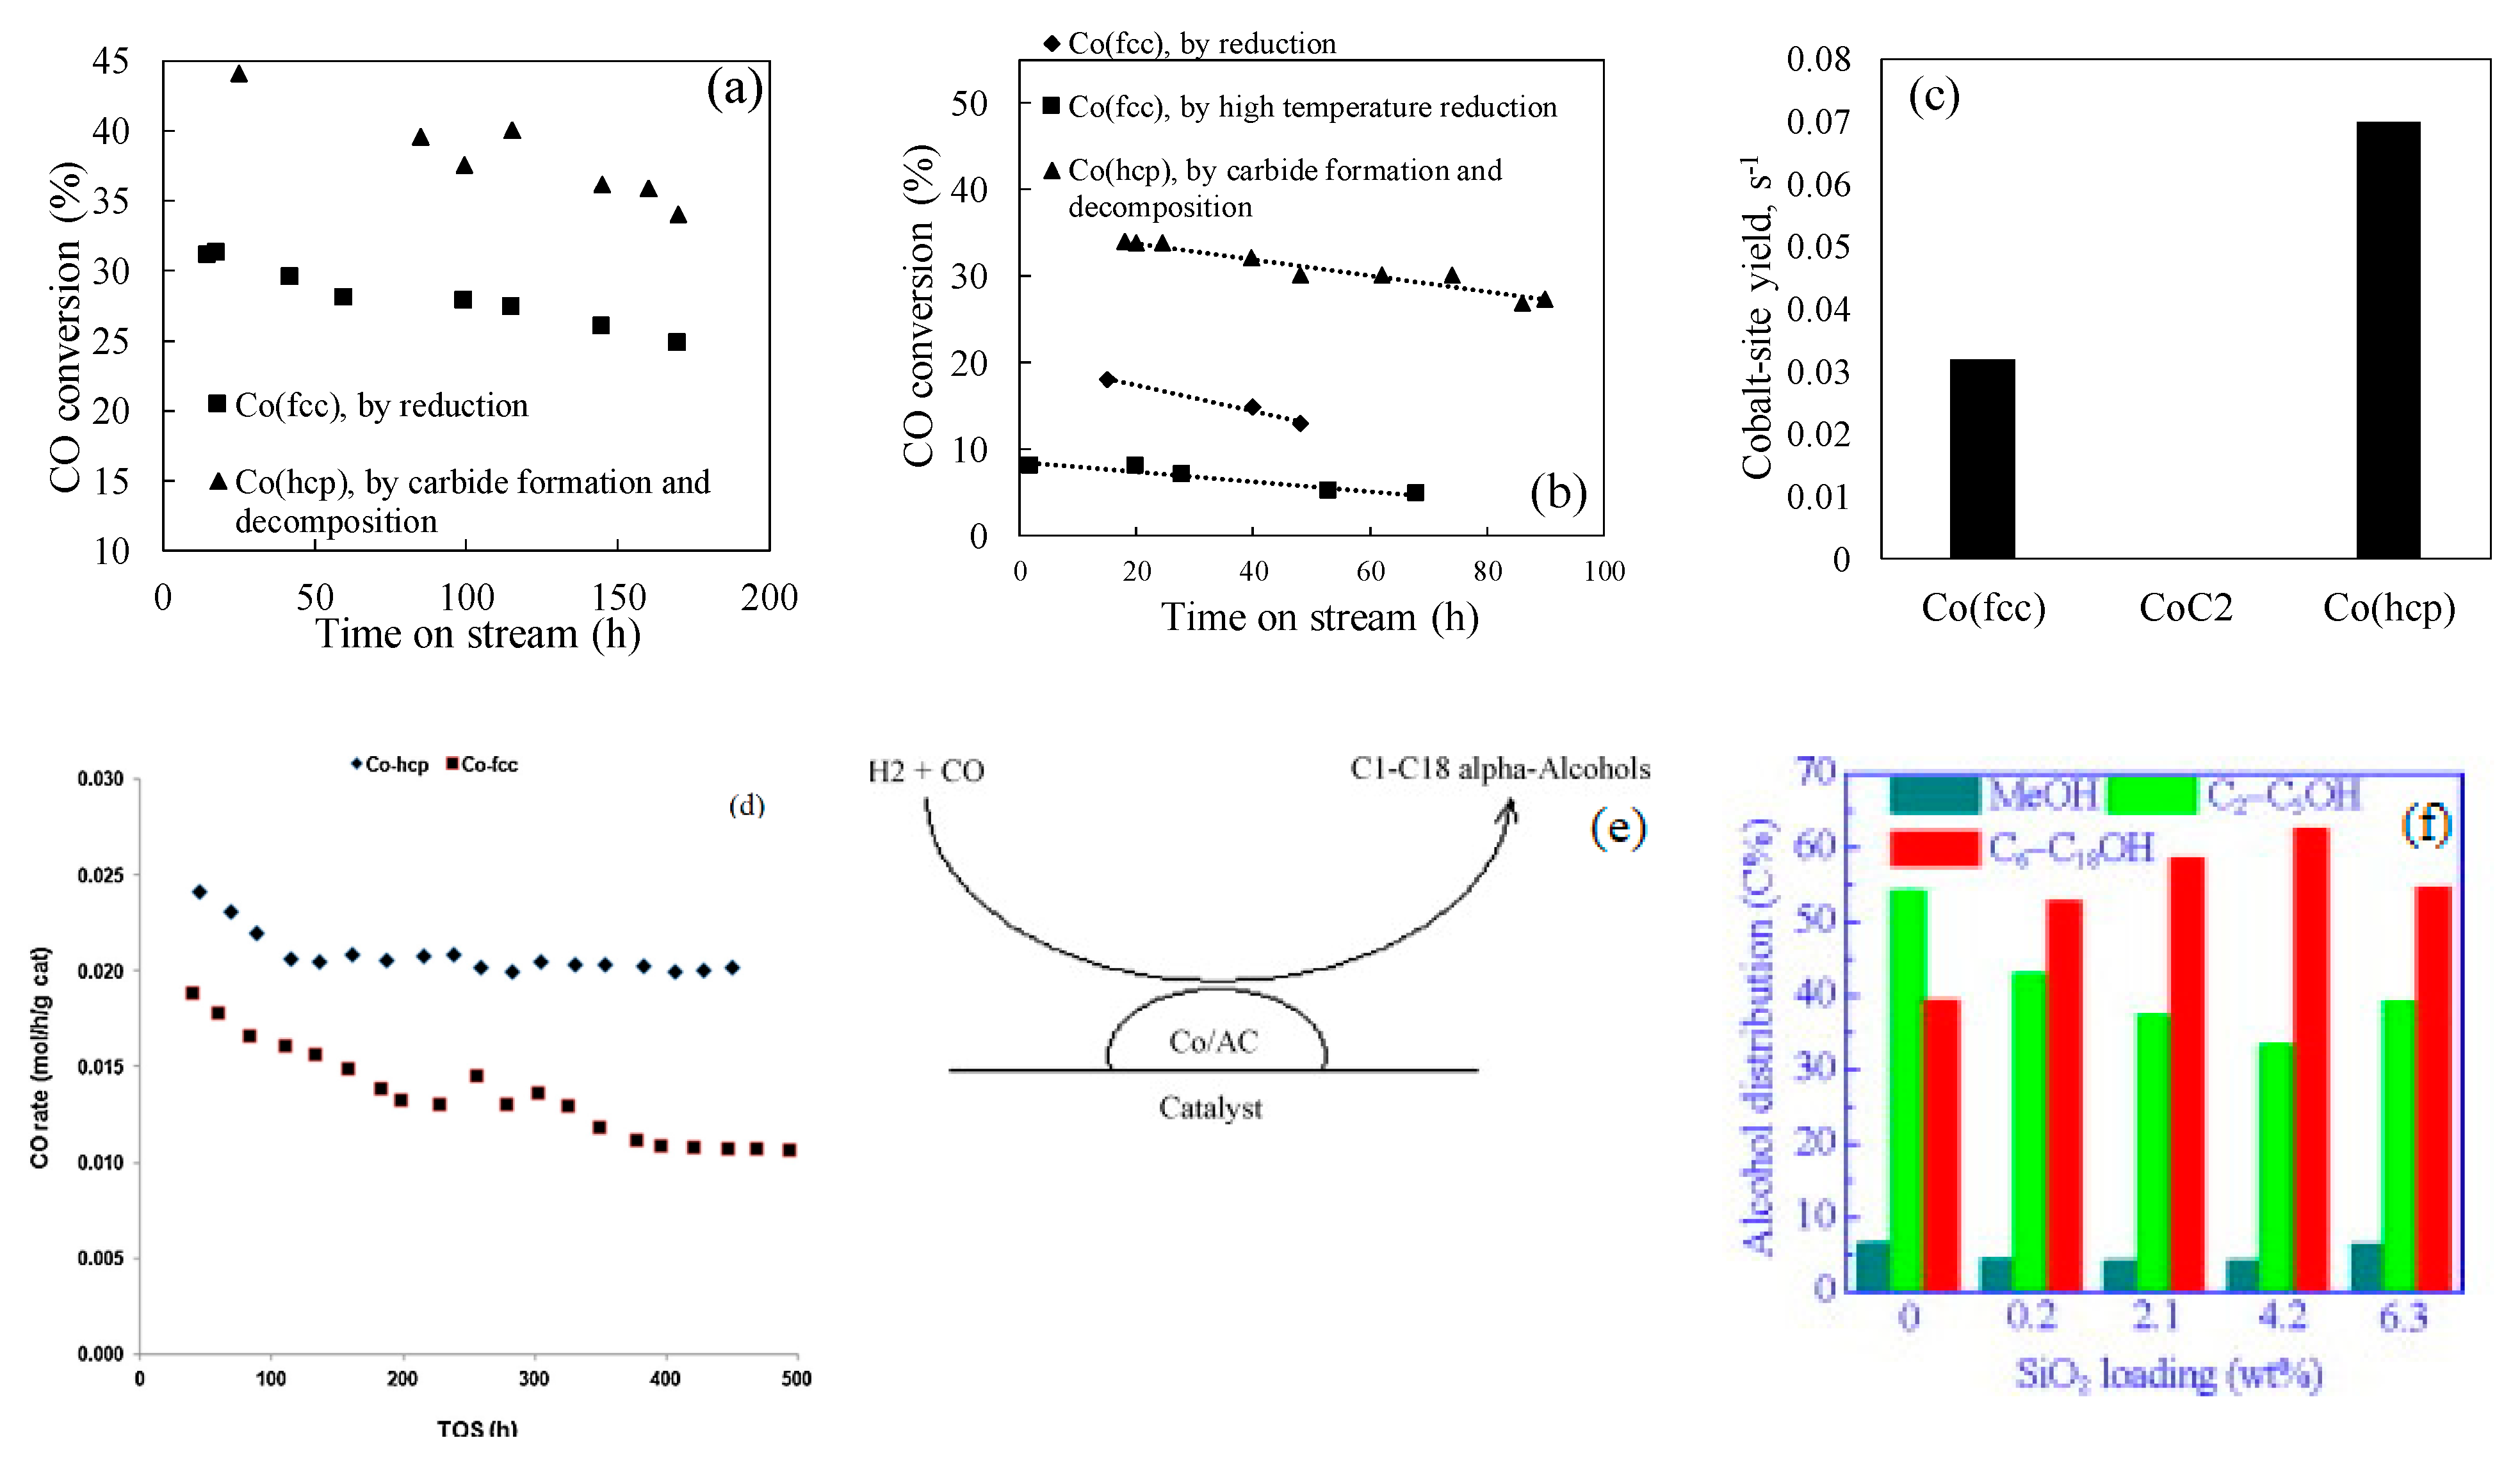
FTS performance of cobalt catalyst strongly depends on cobalt crystal structure as well. Two types of cobalt metal structures (active phases), i.e., face centered cubic (fcc), hexagonal close packed (hcp), have been reported, which were synthesized under different pretreatment conditions, for example, Co-fcc was formed on various Al2O3, SiO2 and TiO2 supported catalysts using hydrogen reduction at high temperature over 350 °C, while the hexagonal close packed cobalt metal (Co-hcp) was preferentially formed when the cobalt catalysts were treated by hydrogen at low temperature below 330 °C, or by syngas reduction or by carburation followed by hydrogenation i.e., H2-CO-H2 pretreatment steps between 230–350 °C [18,19,20,21,22,23,24]. When these cobalt phases are exposed to typical FTS conditions, the Co-hcp and Co-fcc display much different intrinsic activity [19,20,21,22,24]. Ducreux et al. [19] prepared SiO2, Al2O3 and TiO2 supported 11–13%Co catalysts with and without 0.45%Ru in order to explore a possible relationship between microstructure of the cobalt catalysts and catalytic activity. These authors observed complete reduction of CoO to cobalt metal by H2 on Al2O3 above 550 °C, while it was completed on Co/SiO2 at lower temperatures. In both cases, mixed Co (hcp) and (fcc) cobalt were formed, but low temperatures tend to form high fraction Co (hcp). When the catalysts were reduced by CO at 230 °C for 15 h followed by H2 reduction at the same temperature, cobalt carbide (Co2C) was decomposed and more Co (hcp) stacking was detected. Examining the activity of different Co/Al2O3 and Co/SiO2 catalysts indicated that activity of the catalyst, most enriched in Co hcp stacking, was found to be 50% higher than the catalyst most enriched in Co fcc stacking on Al2O3 support (XCO = 30 to 45%, Figure 3a), but the activity difference between the two cobalt phases was enlarged by more than triple fold on a Ru promoted Co/SiO2 supported catalyst (XCO = 8 to 34%, Figure 3b). Later, Sadeqzadeha et al. [21] and Gnanamani et al. [22] used similar approach i.e., using pure H2 reduction at 350 °C, or CO (230 °C)-H2 (230 °C) or H2 (350 °C)–CO (230 °C)-H2 (230 °C) reduction procedures to prepare Co-hcp and Co-fcc on 0.1%Pt-25%Co/Al2O3 and 20%Co/SiO2 catalysts, respectively. Activity of the Co-hcp rich catalyst was over one time higher than the Co-fcc rich 25%Co-0.1%Pt/Al2O3 catalyst (Co STY at 220 °C, 2.0 MPa, H2/CO = 2.0, and 40% CO conversion: 0.032 to 0.072 s−1, Figure 3c), while the TOF was only about 32% higher on 20%Co/SiO2 (CO rate at 200 °C, 1.99 MPa, H2/CO = 2.0, and 3.0 NL/gcat/h: 0.024 to 0.034 mol/gcat/h, Figure 3d). Liu et al. [25] reported lower activation energy for the CO activation on Co (hcp) than Co (fcc), which is consistent well with the higher activity of the Co (hcp) structure. It is likely that the Ru and Pt promoters benefit the formation of Co-hcp phase. Moreover, the two cobalt phases gave different hydrocarbon selectivity, Co-hcp yielded low CH4 and high C5+ selectivity [22], indicating relatively high hydrogenation barrier but low C-C coupling energy on the Co-hcp phase. Cobalt carbide is another different Co phase, which was reported to be inactive for FTS reaction [21,26,27]. However, Ding et al. [28,29] studied the synthesis of C1-C18 alcohols from syngas over La-Co/AC catalysts at 222 °C, 3 MPa, H2/CO = 2.0. High alcohol selectivity i.e., 37–39% was reported under the conditions, which was attributed to La promoting the formation of Co2C that benefited the alcohol formation.
In case of Ru FTS catalyst, the same face centered cubic and hexagonal close packed Ru metal structures as cobalt catalyst have been reported. Interestingly, the Ru catalysts show distinctive reverse activity trend with the Ru phases. Both experiment and theoretical DFT calculation by Li et al. [30] consistently indicated that the activity of the Ru-fcc was significantly higher than the Ru-hcp at the same particle size 6.8 nm, CO rate at 160 °C was found to be 37.8 vs. 11.8 molCO/mol-Ru/h for the Ru-fcc and Ru-hcp, respectively. This could be due to the fact that fcc and hcp Ru bulks exhibited very different morphologies, the fcc Ru was octahedron like populated mainly by close-packed (111) facets, and the hcp Ru was a dihedral-like shape populated mainly by open facets, which gave greater amounts of Ru-fcc open facets and more active sites for CO dissociation, even though the intrinsic activity of hcp phase is higher than fcc due to the low energy barrier for CO dissociation on the hcp phase on both Co and Ru metals (Co-hcp 1.07 ev vs. Co-fcc 1.47 ev [25], Ru-hcp 1.0 ev vs. Ru-fcc 1.2ev) [30].
It should be noted that the structure of the catalysts that plays crucial roles on the FTS reaction are not only controlled by pretreatment conditions [14,18,19,20,21,22,23,24], but also are adjusted greatly by promoters and supports/binders [31,32,33,34,35]. For example, K [31,32] and Mn [33,34] were reported to promote and suppress iron carburization, respectively, leading to different amounts of iron carbides. Incorporation of SiO2 to iron catalysts restrained carburization of iron catalysts but promoted heavier hydrocarbons formation and catalyst stability [35]. Most recently, Lu et al. [15] reported that SiO2 or Al2O3 supports showed electronic impact on iron atomic status, resulting in an improved amounts of C-rich iron carbide active phase (ε-Fe2C) that was claimed to have more positive roles on the activity of supported Fe/Al2O3 and Fe/SiO2 catalysts under 280 °C, 1 MPa, H2/CO = 1, and 10 NL/g-cat/h. The similar notable support effects on Ru catalyst have also been evidenced [6,36,37]. The discussion of additional support effects on the properties of FTS catalysts is beyond the scope of this review.
In summary, the crystal structure (phase and morphology) of iron, cobalt and Ru catalysts, that can be controlled by adjusting pretreatment conditions, supports/binders and promoters, remarkably impact on FTS performance. The influence are very complicated not only because of many active phases of each metal present during FTS, but also because of different morphologies formed including shape, facet and orientation, edge and corner on each phase, which could change amounts of active sites, and CO adsorption mechanism (multiple reaction mechanisms could occur on each catalyst surface), consequently leading to different catalyst activity, selectivity and stability [16,25,30]. Further improving FTS catalyst performance towards better stability and higher heavier hydrocarbon yield is challenge and this requires tremendous efforts including experimental optimization of the catalyst structure coped with the advanced technique of molecular-level catalyst design i.e., DFT.
2.2. Metal Particle Size Effects on Catalyst Performance
Metal particle size effect, which is related to the structure sensitiveness of the catalyst, has been extensively studied in the past decades [8,38,39,40,41,42,43,44,45,46,47,48,49,50,51,52,53,54,55,56,57,58,59,60,61,62,63,64,65,66,67,68,69,70,71,72,73,74,75]. Since Boudart et al. [38] proposed the concept and assumed FTS is a structure insensitive reaction, it took long time to amend the conclusion. Iglesia’s group used Co or Ru catalysts with the metal particle size over 8 nm and had drawn the conclusion of independent of catalysts performance on the metal particle size/dispersion (structure insensitive) [8,40,41]. This conclusion is not in line with the earlier particle size studies on iron catalysts by Vannice [42] and Bartholomew groups [43], which noticed lower activity on smaller Fe particles in less than 9 nm particles. A conclusive cobalt particle size effect on FTS has not been made until de Jong group [44] studied the effect in a tiny to big particle size range (2.6–27 nm). In contrast, the Fe and Ru particle size effects are less consistent even though it has attracted significant interests from academics. The review and discussion on the recent exploration of the particle size effects on Co, Fe and Ru catalysts are given below. Important insights into the particle size effects are also provided.
2.2.1. Examples of Cobalt Catalyst
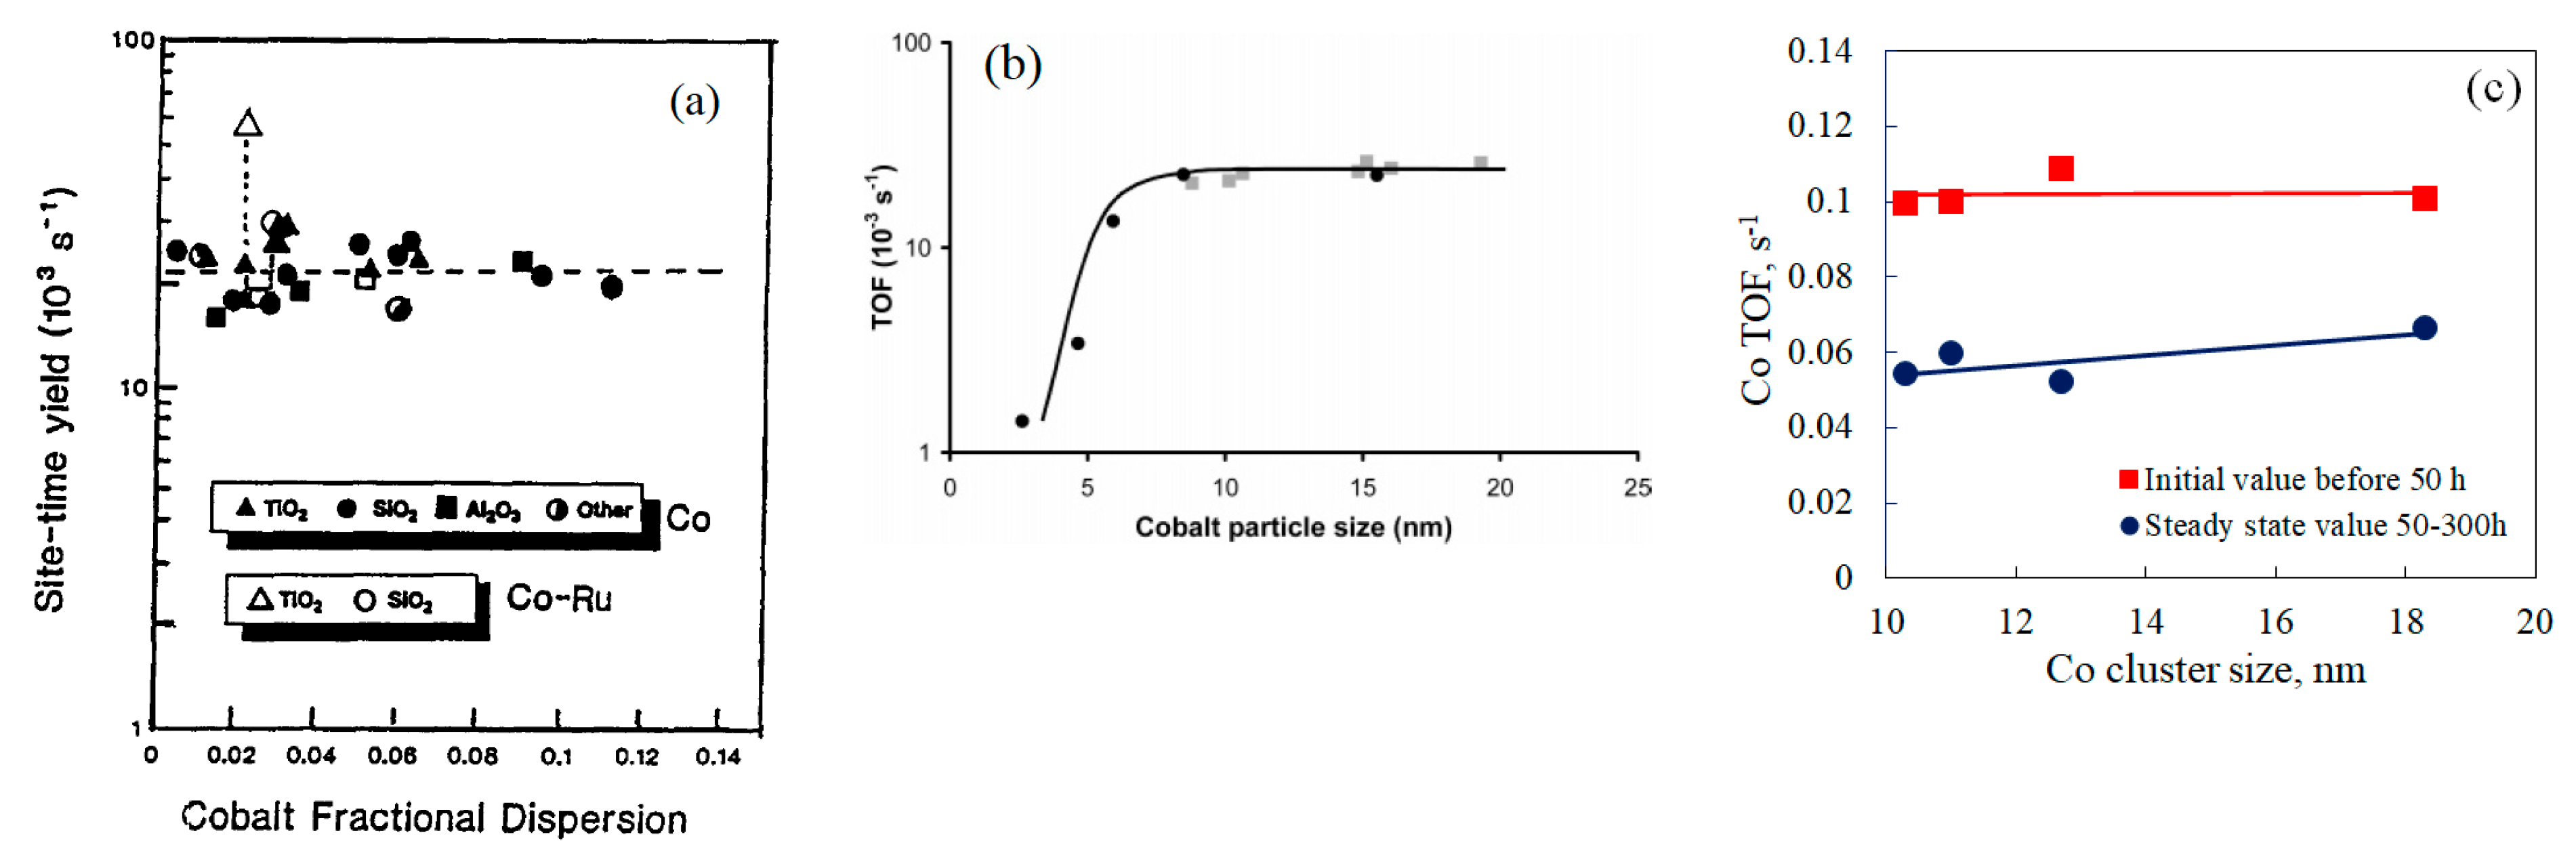
As mentioned above, Iglesia [41] found that the CO turnover frequency (TOF) remained constant at 0.021 s−1 (independent of Co dispersion and support type) in the Co particle size range of 8–96 nm under 200 °C, 2 MPa, H2/CO = 2.05, and 55–65%CO conversion (Figure 4a), apparently, the effect of the smaller Co size less than 8 nm was ignored. A comprehensive Co particle size effect study was represented by the recent study of Bezemer et al. [44], who used 1.0–22%Co/CNF (Carbon Nanofiber), prepared by impregnation (IWI) and homogeneous deposition precipitation (HDP), that yielded 2.6–27 nm Co particles. These authors reported that Co TOF was only 0.0014 s−1 at 2.6 nm, which increased with increasing Co particle size up to 8.0 nm, reaching at a constant value of 0.023 s−1 at 210 °C, 3.5 MPa, and H2/CO = 2.0 (Figure 4b). Therefore, both the Iglesias and Bezemer groups found that Co TOF was independent of Co particle size for the catalysts with sizes greater than 8 nm at typical FT conditions. C5+ selectivity and olefin selectivity were reported to increase with increasing Co particle size up to 16 nm, accompanied with a decrease in CH4 selectivity. In several subsequent studies on Co particle size effect, Breejen et al. [45] used the steady-state isotopic transient kinetic analysis (SSITKA) technique to elucidate nature of the small Co size effect (<8 nm). It was postulated that small particles block edge/corner sites and show a low intrinsic activity at the small terraces; furthermore, small Co particles were assumed to possess higher H2 coverages, leading to higher CH4 selectivity. Holmen et al. [46] obtained the maximum C5+ selectivity (84.2%) under 210 °C 2.0 MPa, H2/CO = 2.1, and 43–46%CO conversion at an average Co particle size of 8 nm on Al2O3 support, above 10 nm, C5+ selectivity was nearly unchanged. Prieto et al. [47] also reported the two regions of Co particle size i.e., < >10 nm, that showed different activity trends over 10%Co/ITQ-2(zeolite) catalysts. The maximum and constant TOF (0.0086 s−1) at 220 °C, 2 MPa, H2/CO = 2, and 10%CO conversion was observed at the Co size range of 10–141 nm. Small cobalt particles (5.6–10 nm) showed lower activity, that was ascribed to the formation of partially oxidized Co species (Cod+) at the Co-support interface. Gavrilovic et al. [62] and Park et al. [64] also conducted Co particle size effect in 6–13 nm and 3–16 nm ranges using 0.5%Re20%Co/Al2O3 and 5%Co/Al2O3, respectively. Similar activity and C5+ selectivity trends were obtained in the cobalt particle size ranges smaller and larger than 9.3–10 nm.
An attention that must be paid is that the Co TOF varies significantly in different studies although researchers reach a consensus on the Co particle size effect. Iglesia [41] obtained an apparent Co TOF of 0.021 s−1 on various supported catalysts at 200 °C and 2.0 MPa in a fixed bed reactor, which is equivalent to 0.05 s−1 at 220 °C; the TOF value of Bezemer et al. [44] on CNF support at 210 °C and 3.5 MPa was 0.023 s−1, equivalent to 0.038 s−1 at 220 °C. Prieto et al. [47] reported the lowest Co TOF values of 0.0086 s−1 on Co/ITQ-2-zeolite under similar process conditions. In the study of Park et al. [64], a high cobalt initial TOF value (24–40 h) of 0.08 s−1 was obtained on a 5%Co/Al2O3 catalysts with mean cobalt particle size of 9.3 nm under 220 °C, 1.0 MPa, H2/CO = 2.0 and 30% CO conversion. Recently, Ma et al. [48] studied the effects of 0.5% noble metals (Pt, Re, Ru) on 25%Co/Al2O3 catalyst for FTS reaction under 220 °C, 2.0 MPa, H2/CO = 2.1 and 50% CO conversion in 1-L CSTR. By taking into account the chemisorption results on the cobalt catalysts, they obtained a high initial Co TOF of 0.1 s−1 in the cobalt particle size range 10.0–18.6 nm on the Pt, Re, Ru promoted and unpromoted 25% Co/Al2O3 catalysts (Figure 4c), which is in line with Park’s study. At steady state, the Co TOF based on the initial Co dispersion was reduced to 0.05–0.067 s−1, which is close to the apparent TOF values in the study of Iglesia [41], but much greater than that in the studies of Bezemer and Prieto.
Several reasons are proposed to be responsible for the discrepancy: (1) support/transport effect, (2) deactivation, and (3) experimental error. The cobalt initial TOF value of 0.1 s−1 reported by Ma et al. [48] was obtained in a CSTR using fine particles i.e., 45–90 μm, thus the value reflects the intrinsic Co activity because the internal and external mass transfer were eliminated and the deactivation was ignored; while the studies of Iglesia [41], Bezemer et al. [44] and Prieto et al. [47] employed large catalyst particles i.e., 170 mm, 500 mm or 250–400 mm, respectively, which included the mass transfer effect in the reaction, consequently, it decreased the catalysts’ activities. However, the activity difference resulted by the difference in mass transfer of the 170–500 mm particles is estimated to be less than 17–30% at initial and steady state periods in term of a recent study on the sieve size effect using 20–390 mm Co/Al2O3 catalyst particles [49]. Thus, the mass transfer effect is unlikely the main cause while the deactivation should be primarily responsible for the different TOF values obtained in these studies.
Further analysis of the data of Ma et al. [48] indicates that after 120–200 h of testing, the Co TOF value based on the initial Co dispersion was decreased by 34–52% and the higher loss percentage was observed on the smaller Co particles. Assuming that the intrinsic activity of Co sites at a given set of conditions was unchanged, the loss in 34–52% activity might indicate a loss in the same amount of Co active sites, or even loss in more amounts of cobalt active sites i.e., 50–90% in other studies [41,44,47]. These data suggest that the majority of cobalt active sites did not participate the reaction in the lab testing or in the commercial practice [50] due to site blocking, or deactivation. Therefore, design of new generation of cobalt FTS catalyst by preserving as much as Co active sites during FTS reaction and maximizing cobalt particles’ activity is an urgent and important task, which could dramatically improve product yields and reduce capital cost in FTS.
2.2.2. Examples of Iron Catalyst
The iron particle size effects on FTS reaction were studied by many researchers as well, but the conclusion is still debatable. Earlier studies on the topic were conducted on 2.5–6.0%Fe/Carbon (C) catalysts by Vaccine group [42], and on 1–10%Fe on C or/Al2O3 catalysts by Bartholomew group [43]. Both groups reported consistently that smaller Fe particles displayed lower activity after H2 pretreatment at 350 °C, for example, the TOF for CO hydrogenation at 220 °C, 0.1 MPa and H2/CO = 2.0 increased from 0.86 to 4.4 × 10⁻³ s−1 in a study by Vannice et al. [42] and 0.69 to 18 × 10−3 s−1 in a study by Bartholomew et al. [43] with increasing Fe particle size from 0.6 to 9 nm. These authors did not provide CH4 selectivity data, but an estimation based on the available CH4 and CO rates suggested lower CH4 selectivity on smaller iron carbides; furthermore, smaller Fe carbides were reported to have lower activation energy (84–95 kJ/mol or 64–105 kJ/mol). These results are presumably due to the difference in electronic density on the small and large particles, different Fe-C interaction, and/or a decrease in the corner and edge sites on large crystallites that were responsible for the increases in both turnover frequency and activation energy with increasing crystallite size. Small Fe particles i.e., 1–2 nm led to high deactivation rate [42,43].
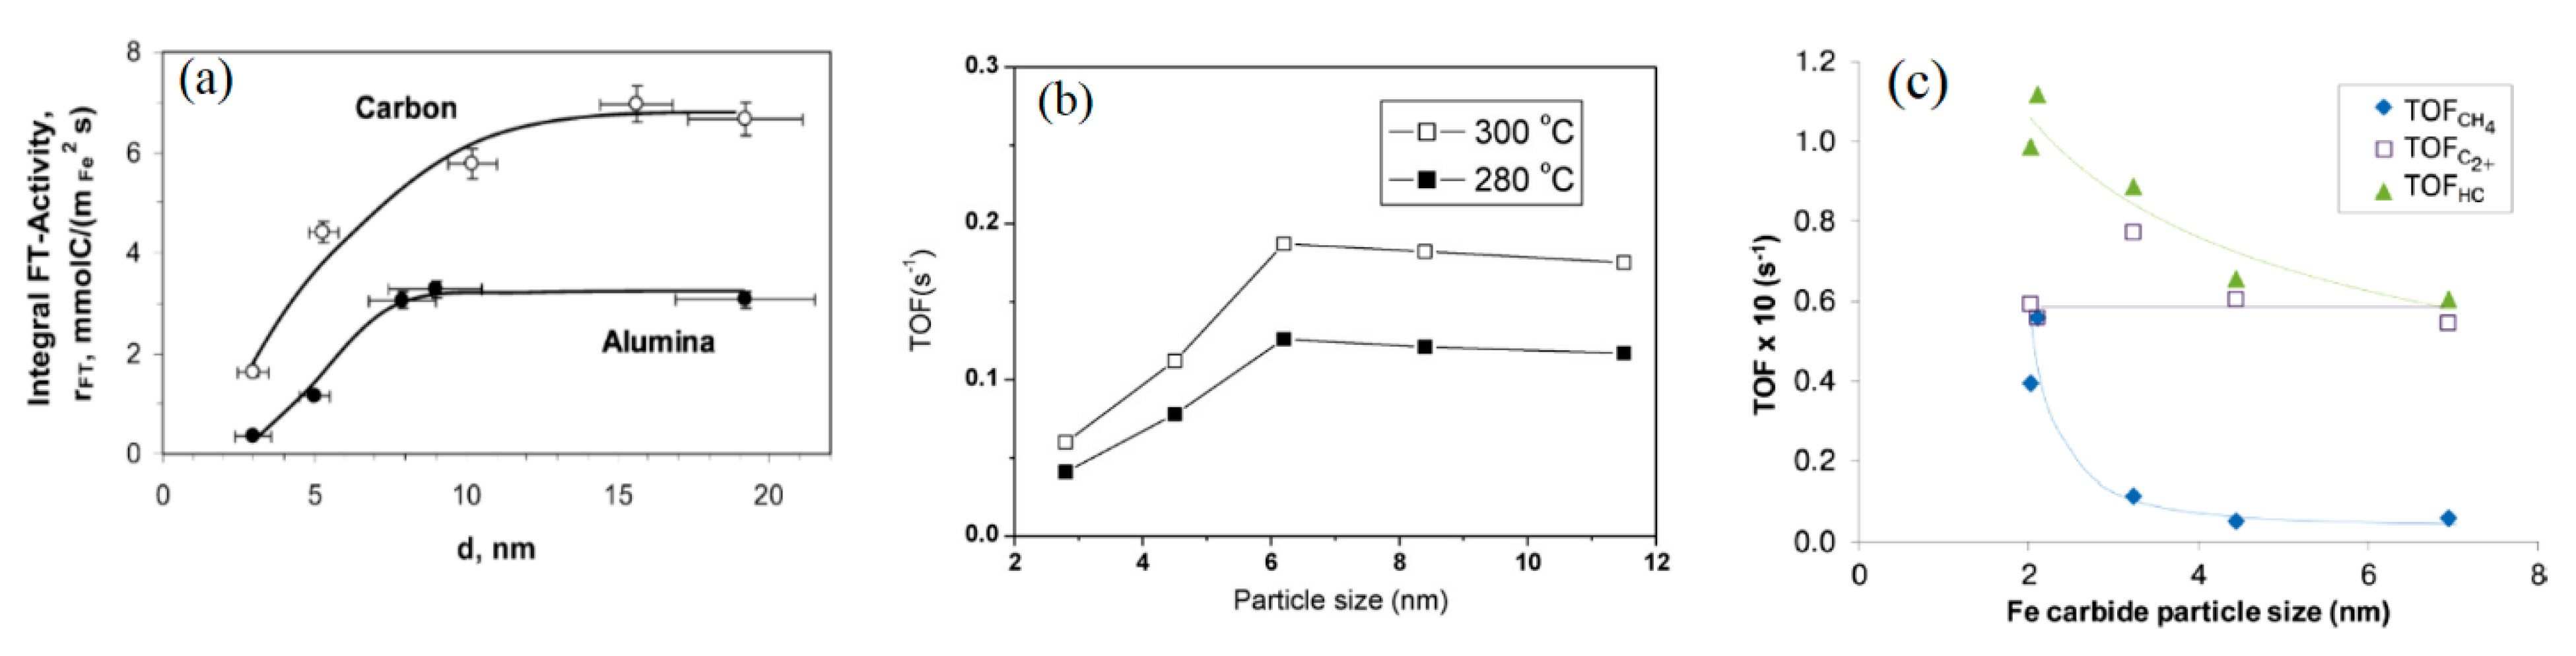
Recently, a progress on the study on Fe particle size effect was made by several research groups [51,52,53]. van Steen et al. [51] and Park et al. [52] explored the effects of Fe particle size in the ranges 3.0–19.2 nm over 2.8–4.7%Fe/C, 4.6–5.6%Fe/g-Al2O3 and 2–12 nm over 5%Fe/Al2O3 catalysts, on FTS performance, respectively. After H2 reduction at 350 °C, lower initial TOF on smaller Fe particles (3–10 nm by Steen, 2.0–6.2 nm by Park) was noticed, then it remained nearly constant up to the particle size of 19.2 nm or 12 nm. For example, the stable TOF values for the Fe/Al2O3 and Fe/C catalysts with larger Fe particles in van Steen study under 270 °C, 3.0 MPa, H2/CO = 2.0, 7.2 or 18 NL/g-cat/h (40 and 8% CO conversion) were 3.1 and 6.0 mmol/m2-Fe/s, respectively (Figure 5a), and 0.187 s−1 in Park study under 300 °C, 1 MPa, 3.6 L/gcat/h, and H2/CO = 2 (Figure 5b). Thus, part of the van Steen and Park results in the small Fe particle size region are consistent with the previous studies of Vannice et al. [42] and Bartholomew et al. [43], and a most recent study by Gu et al. [72], which reported an increase in Fe TOF with increasing iron particle size in the 2.5–12 nm range under 350 °C, 0.1–10 MPa, and H2/CO = 1.0 and 60% CO conversion. However, there is a difference in the Fe particle size threshold (10 vs. 6.2 nm), at which the TOF starts to be stable, in the studies. The difference could arise from the support effects and/or errors in the characterization and activity measurements.
Interestingly, de Jong group [53,73] studied the conversion of syngas to light olefins (FTO) over 1, 2, 5, 10 and 20% Fe supported on carbon nano fiber (CNT) with and without Na and S promoters in a micro fixed bed reactor. A different Fe particle size effect from that in the van Steen et al. [51] and Park et al. studies [52] was reported in the Fe size range of 2–17 nm [53] or 3–9 nm [73]. After the iron catalysts were reduced in H2 at 350 °C for 2 h, it led to a decreased trend of CO to hydrocarbons TOF from 0.1 to 0.06 s−1 with increasing FexC size from 2 to 7 nm at 340 °C, 2 MPa, H2/CO = 1, and 5.45 NL/g-cat/h [53] (Figure 5c). At a low pressure 0.1 MPa and 350 °C, the same trend was also obtained, however, the CO conversion remained nearly unchanged (9–11%) for the unpromoted 1, 2, 5, 10 and 20%Fe/CNT catalysts at a constant flow rate (6 mL/min vs. 0.02 g cat). With the absence of the Fe reduction degree data, it is estimated from the available rates and Fe dispersion data that the extent of Fe reduction is relative constant despite significant change in Fe loading from 1 to 20%. These results are unusual that cannot be explained by the common knowledge of metal loading effect. It is likely that many iron active sites on high Fe loading catalysts did not participate in reaction in the low pressure. The authors also reported higher CH4 selectivity on smaller Fe particles, which is consistent with the study of Park et al. [52], but against the results of Vannice et al. [42] and Bartholomew et al. [43]. The reasons for the opposite Fe particle size effects obtained by Torres et al. [53] and Gu et al. [73] is not known. Additional efforts are needed to clarify the issue of iron particle size effect.
Further comparison of various studies on Fe catalysts suggests that the TOF values of the Fe particles over 7 nm reported by Park et al. [52], Chang et al. [14] and Ma et al. [5] under 260–300 °C, 1–3 MPa, H2/CO = 1–2 and 20–50% CO conversion are essentially consistent, and they fall into the range 0.046–0.20 s−1. These high TOF values should be close to the Fe intrinsic activity due to the consistency of the results and the ignored mass transfer effect by using fine particles in these studies. Thus, the Fe TOF values reported can serve as reference for the design of highly active Fe catalysts. Recently, Keyvanloo et al. [54] prepared highly active 40%Fe/AlSi and 40%Fe/AIG (including 5%La) supported catalysts. The activity of the supported Fe catalysts with 8 nm FexC under 260 °C, 2.0 MPa, H2/CO = 1 was estimated to be 0.045 s−1, which is consistent with the reported TOF value. However, the CO TOF for the Fe catalyst with 7 nm Fe particle size reported by Torres et al. [53] was about 10 times lower, 0.017 s−1 at 300 °C (corrected from 0.06 s−1 at 340 °C and assuming Ea = 90 kJ/mol), while the activity on the Fe/C and Fe/Al2O3 catalysts reported by Barkhuizen et al. [51] was significantly beyond the range (80–200 times higher), 12–51 s−1 at 260–300 °C (estimated from the reported 3–6 mmol/m2Fe/s at 270 °C and assuming Fe density 20.4 atoms/nm2). The primary causes for the large difference in the TOF in the studies [51,53] are not known.
2.2.3. Examples of Ruthenium Catalyst
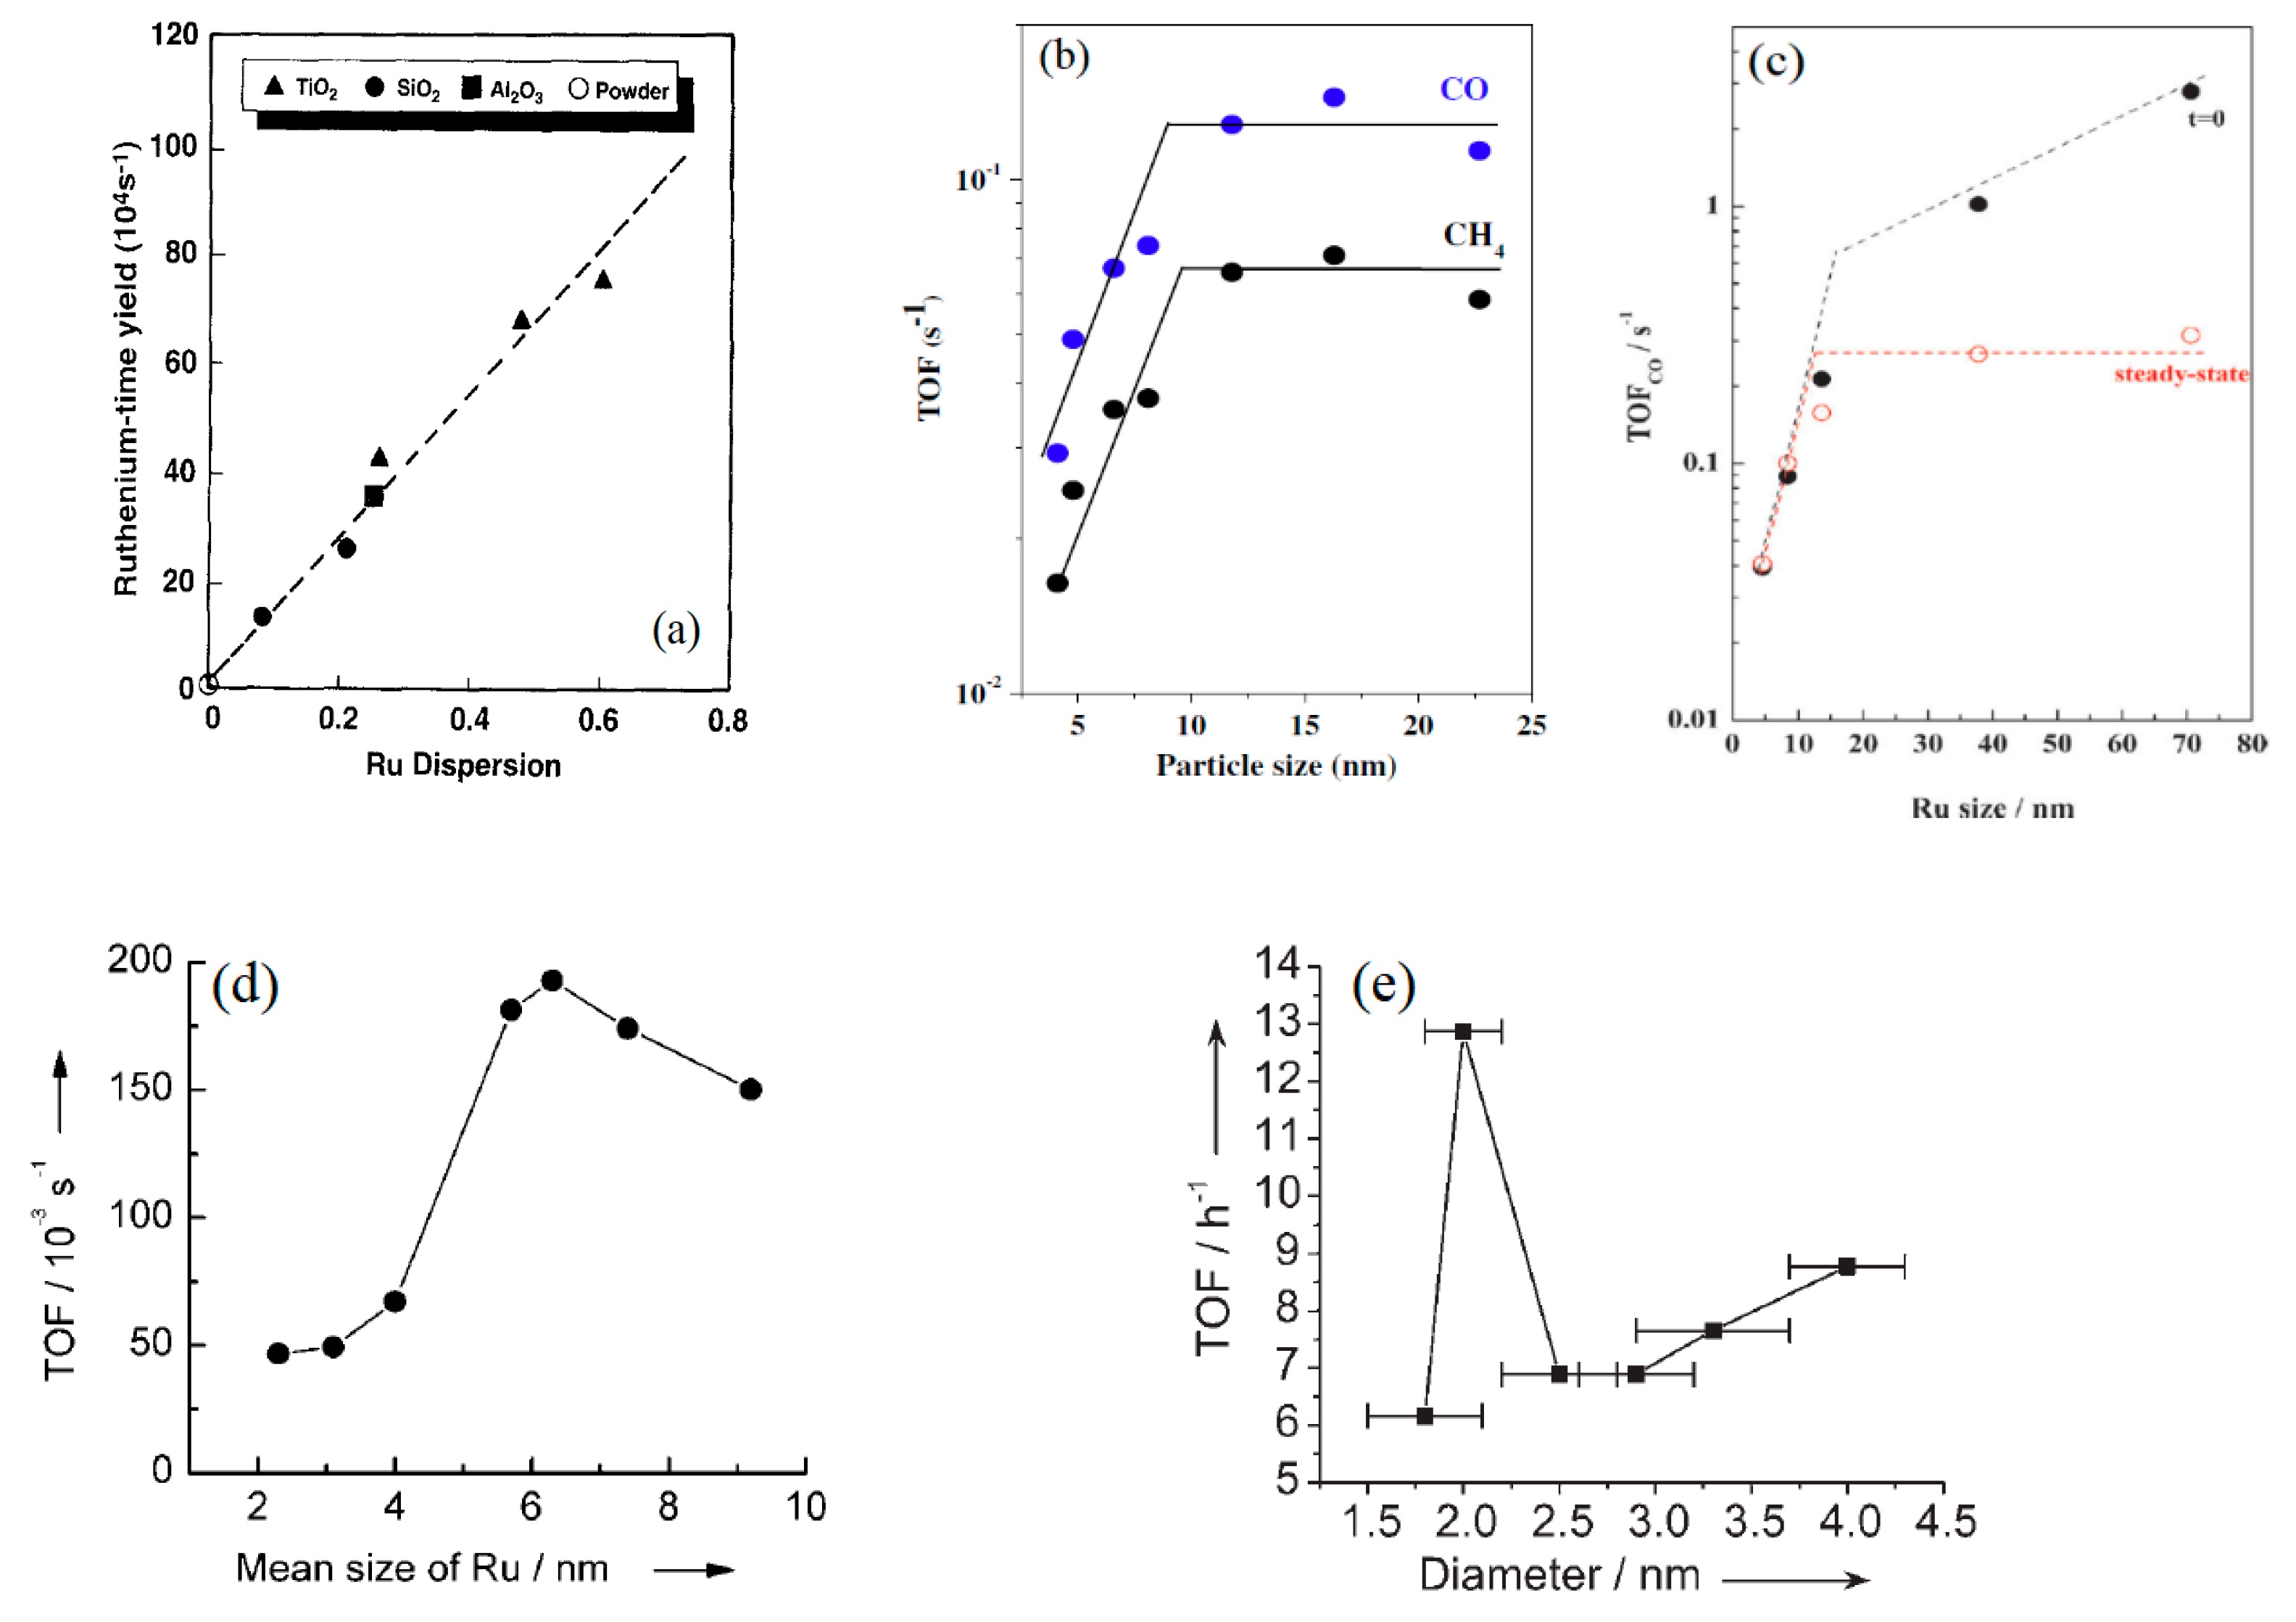
The effects of Ru particle size on FTS were explored by many researchers and the results are more similar to that of the Co particle size effect as discussed above, but some differences from study to study still exist. Systematic early studies on the effect of Ru particle size on FTS performance were reported by Kellner et al. [55] and Iglesia [8], which suggested structure insensitive of the FTS reaction, i.e., both studies indicated Ru time yield was independent of support type (Al2O3, SiO2, and TiO2) and increased linearly with increasing Ru dispersion. The Ru time yield changed from 0.0012 to 0.0065 s−1 at 203 °C, 0.56 MPa, H2/CO = 2.1 and 45–60% CO conversion when Ru dispersion increased from 8.5 to 46% (Figure 6a) [8]. Based on the relationship between the Ru particles size and dispersion (dRu = 132/D), 8.5 to 46% Ru dispersion corresponds to the Ru particle size of 3.0 to 15.5 nm, in which the slope yields a constant Ru TOF of 1.41 × 10⁻² s−1. In recent years, there has been an increasing interest in exploring the Ru particle size effect, probably inspired by the early Ru works and/or by the recent studies of Co particle size effect. A similar trend (constant TOF) at large Ru particles of 10–23 nm (0.108 s−1 at 250 °C, 0.2 MPa, and H2/CO = 10) using Ru/Al2O3 catalyst or at 7–12 nm (0.105 s−1 at 240 °C, 1.5 MPa, and H2/CO = 2) using 3.6–17.3%.Ru/C catalyst was reported by Carballo et al. [7] and Eslava et al. [56], respectively; at Ru sizes smaller than 7 or 10 nm, Ru TOF was found to increase with increasing Ru size (Figure 6b). Apparently, the results of Carballo and Eslava about the Ru particle size effect were quite similar to that of the Co particle size effect (Co size threshold: 8–10 nm) [41,44,45,46,47,64] and some of the Fe particle size effect studies (Fe size threshold: 7–10 nm) [51,52]. The smaller nano Ru particles showed lower activity, which was explained by strong adsorption of surface species and blocking of active sites. Later, Carballo et al. [57] reported a different Ru particle size effect on the initial activity in the Ru particle size range 4 to 71 nm over 3%Ru/Al2O3 (Figure 6c). The initial TOF values increased with Ru particle size, but the incremental pace became slower at the Ru size greater than 10 nm. This unique trend of the initial activity was presumably due to loss in the step-edges sites on the large Ru particles i.e., >10 nm, for CO dissociation, while the terraces sites might remain unchanged. The small Ru particles likely favored the production of CH4 and lowered C5+ hydrocarbons.
Recently, Wang group [58,75] studied the Ru size effects in the range of 2.4–10 nm with 3%Ru on various supported catalysts (SiO2, Al2O3, TiO2, MaO, ZrO2, HY, NaY, H-beat, CNT, AC, graphite) at a high temperature 260 °C, and 2.0 MPa H2/CO = 1.0, 2.4 NL/g-cat/h. Such Ru size effect namely a constant TOF beyond 7 nm Ru size as discussed above was not observed, instead a peak TOF (0.193 s−1) (Figure 6d) and a peak selectivity to C10-C20 (~62%) were reported at the Ru size of 6.3 nm [58]. The TOF was decreased in the large Ru size range between 7 and 10 nm, which is different from the studies of Carballo [7], Iglesia [8] and Kellner [55]. The catalyst deactivation and/or support effect could be responsible for the varied results. Xiao et al. [59] recently studied the effects of Ru size on FTS activity in aqueous phase. Authors obtained a narrow Ru particle size 1.8–4 nm by changing Ru loading from 0.5 to 5% on PVP. The authors observed a maximum activity of 6.9 mol/mol Ru/h at a low temperature 150 °C and 3 MPa, H2/CO = 2.0 in a batch reactor, which was 6–35 times higher than that of other Ru/SiO2 and Ru/Al2O3 catalysts. The results suggest a strong support effect on the Ru/SiO2 and Ru/Al2O3 catalysts. More interestingly, an unprecedented peak TOF value of 12.9 h−1 at the Ru size of 2.0 nm was reported, after that Ru size point, the TOF increased gradually with increasing Ru size from 2.5 to 4.0 nm (Figure 6e). This result is rather unique, that no atomic-level explanation is currently available to rationalize the variation.
The above studies suggest more complicated Ru particle size effects despite many of the studies tend to show similar Ru size effect to the Co catalyst (two size regions’ effects). Additional efforts are needed to elucidate the unusual trends on the Ru catalyst. On the other hand, it is difficult to compare the Ru activity per active site (TOF) in different studies because temperatures used were varied. Corrections in the Ru TOF obtained at different temperatures to the values at a given temperature i.e., 220 °C, assuming the Ru activation energy for CO hydrogenation is 65 kJ/mol, make it possible to understand the catalyst’s working efficiency. It is found that the estimated Ru TOF values in the Ru size 7–40 nm under 220 °C, 0.56–4 MPa, H2/CO = 2.0 in most Ru studies [7,8,56,57,58,59], fall into 0.025–0.075 s−1. However, the results in several other studies over Ru catalysts are different. Based on the initial Ru activity of a 3%Ru/γ-Al2O3 with Ru size of 70 nm in the study of Carballo et al. [57], and a study with Pt promoted Ru shell catalyst (Pt/Ru = 1/9) in aqueous FTS reaction by Li et al. [30], the estimated Ru TOF at 6.8 nm at 220 °C and 2–4 MPa was about one order of magnitude higher, reaching 0.4–0.44 s−1. This Ru TOF value is slightly higher than that in a recent study with an active 2.2% Ru/TiO2 catalyst having similar Ru particle size [60], which gave Ru TOF of 0.3 s−1 at 220 °C and 2 MPa. Comparing these high Ru TOF values, it is concluded that the intrinsic activity of the Ru catalyst at 220 °C should fall into 0.4–0.44 s−1. The low activity of the Ru catalysts suggests that most Ru research catalysts were far from the high efficiency, and majority of Ru active sites in catalysts had not participated in the FT reaction. In terms of the above data analysis, the design of new Ru catalyst should aim at taking advantage of every Ru sites for the FTS reaction, so that potential productivity of the Ru catalyst can be reached. The study further suggests that the intrinsic activity of Ru catalyst is about 3 times higher than that of Co catalyst (TOF: 0.4 vs. 0.1 s−1 at 220 °C).
3. Conclusions
Fossil fuel energy will continue to be the dominant energy resource in the world over the next several decades; thus, catalytic conversion of carbonaceous containing materials including coal, natural gas, biomass, organic wastes, biogas and CO2 to liquid and hydrogen fuels (XTF) and chemicals (XTC) can serve as a sustainable, efficient and clean approach to partly supply nations’ energy need and reduce CO2 emission. FTS is one of the important XTF/XTC processes that play a key role in cleaner utilization of the carbon resources for fuels and chemicals production.
The recent studies on the effects of FTS catalysts’ structure (crystal and size) on FTS performance is comparatively reviewed and summarized. The crystal structure of the catalysts plays decisive roles on FTS performance, but the effects are so complicated. Not only the crystal type but also morphology including shape, facet, edge and corner, affect catalyst activity and selectivity. Due to differing carbon chemical potential, one active iron carbide site that is good for high activity may not favor the formation of the desired products. For example, Fe7C3 is the most active, while ε-Fe2C gives lower methane selectivity. In the case of Co and Ru catalysts, close packed metal (hcp) and face centered cubic (fcc) have been evidenced, but two phases in the two types of catalysts show opposite activity trends at the same particle size, i.e., Co: hcp > fcc, Ru: fcc > hcp, which reflects complex effects of morphology and facet on the Co and Ru catalysts. Multiple reaction pathways could occur on catalyst step-edge or terraces sites due to different CO/H dissociation energy on the sites. The phase transformation for all three types of FTS catalysts during the reaction (FexC ⇌ FeyC ⇌ Fe3O4, hcp ⇌ fcc) make the FTS catalysis even more complicated. Therefore, further improving stability, activity and selectivity of FTS catalyst is challenging and should consider the environment that the catalyst is exposed to. It is possible to successfully tune catalyst structure toward the target products with the aid of the advanced technique of molecular level catalyst design plus massive experimental trials.
The recent studies related to particle size effects were thoroughly compared and discussed in this review. Based on the extensive studies on the topic, it was concluded that there are two metal size regions in which the FTS activity (TOF) of Co, Fe and Ru catalysts changed with particle size in a different manner. In the small particle size region, for example, below 8 nm for cobalt particles or 7 nm for iron and ruthenium particles, the activity of the catalysts started to increase dramatically, whereas in the big particle size greater than the threshold, the activity was independent of metal particle size. The threshold of the particle size reported in some studies was extended to 10 nm. The reasons why small metal particles offered low activity has been explained by site blocking at particles’ edge or corner, and/or oxidation of small nanoparticles. However, inconsistent results in the small particle size region for the iron and ruthenium catalysts present in some studies i.e., opposite activity trend on small iron particles and peak TOF value at 2 nm ruthenium particle, were observed. Thus, the effects of particle size on the FTS activity of iron and ruthenium catalysts have not reached a consensus. Additional studies are needed to clarify the discrepancy.
The activity of the Co, Fe and Ru catalysts were studied by analyzing activity data of many researchers. Based on the literature studies, the intrinsic activity of Co and Ru particles of 7–70 nm at 220 °C were estimated to be 0.1 s−1 and 0.4–0.44 s−1, respectively, while that of the Fe catalysts of 10 nm at 260–300 °C was 0.046–0.20 s−1. However, most of the research catalysts or some industrial catalysts only contributed 10–50% of potential activity due to the support, electronic or deactivation effects. Therefore, further improvement of activity of the FTS catalysts to a higher level is an important and urgent task in future study.
Author Contributions
Conceptualization, methodology, validation, data analysis, original draft preparation and editing: W.M.; Conceptualization, review and editing, validation, A.K.D. All authors have read and agreed to the published version of the manuscript.
Funding
This research received no external funding.
Acknowledgments
The authors would like to acknowledge the support of the Commonwealth of Kentucky and Canada Research Chair Program. This paper is dedicated to the late Burtron H. Davis, who inspires us from heaven.
Conflicts of Interest
The authors declare no conflict of interest.
References
- U.S. Energy Information Administration’s International Energy Outlook 2020 (IEO2020). Available online: https://www.eia.gov/outlooks/ieo/pdf/ieo2020.pdf (accessed on 30 October 2020).
- Dry, M. The Fischer–Tropsch Process: 1950–2000; Elsevier: Amsterdam, The Netherlands, 2002; Volume 71, pp. 227–241. [Google Scholar] [CrossRef]
- Xiang, H.W.; Yang, Y.; Li, Y.W. Indirect coal-to-liquids technology from fundamental research to commercialization. Sci. Sin. Chim. 2014, 14, 1876–1892. [Google Scholar] [CrossRef]
- Khodakov, A.Y.; Chu, W.; Fongarland, P. Advances in the Development of Novel Cobalt Fischer-Tropsch Catalysts for Synthesis of Long-Chain Hydrocarbons and Clean Fuels. Chem. Rev. 2007, 107, 1692–1744. [Google Scholar] [CrossRef] [PubMed]
- Ma, W.; Jacobs, G.; Spark, D.E.; Todic, B.; Bukur, D.B. Quantitative comparison of iron and cobalt based catalysts for the Fischer-Tropsch synthesis under clean and poisoning conditions. Catal. Today 2020, 343, 125–136. [Google Scholar] [CrossRef]
- Carballo, J.M.G.; Finocchio, E.; García, S.; Rojas, S.; Ojeda, M.; Busca, G.; Fierro, J.L.G. Support effects on the structure and performance of ruthenium catalysts for the Fischer–Tropsch synthesis. Catal. Sci. Technol. 2011, 1, 1013–1023. [Google Scholar] [CrossRef]
- Carballo, J.M.G.; Yang, J.; Holmen, A.; Garcia-Rodriguez, S.; Rojas, S.; Ojeda, M.; Fierro, J.L.G. Catalytic effects of ruthenium particle size on the Fischer–Tropsch Synthesis. J. Catal. 2011, 284, 102–108. [Google Scholar] [CrossRef]
- Iglesia, E.; Soled, R.S.L.; Fiato, A. Fischer-Tropsch synthesis on cobalt and ruthenium. Metal dispersion and support effects on reaction rate and selectivity. J. Catal. 1992, 137, 212–224. [Google Scholar] [CrossRef]
- Yang, J.; Shafer, W.D.; Pendyala, V.R.R.; Jacobs, G.; Ma, W.; Chen, D.; Holmen, A.; Davis, B.H. Fischer–Tropsch Synthesis: Deuterium Kinetic Isotopic Effect for a 2.5 % Ru/NaY Catalyst. Top. Catal. 2014, 57, 508–517. [Google Scholar] [CrossRef]
- Ma, W.P.; Shafer, W.D.; Martinelli, M.; Sparks, D.E.; Davis, B.H. Fischer-Tropsch Synthesis: Using deuterium tracer coupled with kinetic approach to study the kinetic isotopic effects of iron, cobalt and ruthenium catalysts. Catal. Today 2020, 343, 137–145. [Google Scholar] [CrossRef]
- Dry, M.E. Fischer-Tropsch Synthesis. In Catalysis—Science and Technology; Anderson, J.R., Boudart, M., Eds.; Springer: New York, NY, USA, 1981; Chapter 4; Volume 1, p. 196. [Google Scholar]
- De Smit, E.; Cinquini, F.; Beale, A.M.; Safonova, O.V.; van Beek, W.; Sautet, P.; Weckhuysen, B.M. Stability and Reactivity of ϵ−χ−θ Iron Carbide Catalyst Phases in Fischer−Tropsch Synthesis: Controlling μC. J. Am. Chem. Soc. 2010, 132, 14928–14941. [Google Scholar] [CrossRef]
- Davis, B.H. Fischer–Tropsch Synthesis: Reaction mechanisms for iron catalysts. Catal. Today 2009, 141, 25–33. [Google Scholar] [CrossRef]
- Chang, Q.; Zhang, C.; Liu, C.; Wei, Y.; Cheruvathur, A.V.; Dugulan, A.I.; Niemantsverdriet, J.W.; Liu, X.; He, Y.; Qing, M.; et al. Relationship between Iron Carbide Phases (ε-Fe2C, Fe7C3, and χ-Fe5C2) and Catalytic Performances of Fe/SiO2 Fischer–Tropsch Catalysts. ACS Catal. 2018, 8, 3304–3316. [Google Scholar] [CrossRef]
- Lu, F.X.; Chen, X.; Lei, Z.G.; Wen, L.X.; Zhang, Y. Revealing the activity of different iron carbides for Fischer-Tropsch synthesis. Appl. Catal. B Environ. 2021, 281, 119521. [Google Scholar] [CrossRef]
- Huo, C.F.; Li, Y.W.; Wang, J.; Jiao, H. Insight into CH4 Formation in Iron-Catalyzed Fischer−Tropsch Synthesis. J. Am. Chem. Soc. 2009, 131, 14713–14721. [Google Scholar] [CrossRef]
- Van Santen, R.A.; Ghouri, M.M.; Shetty, S.; Hensen, E.M.H. Structure sensitivity of the Fischer–Tropsch reaction: Molecular kinetics simulations. Catal. Sci. Technol. 2011, 1, 891–911. [Google Scholar] [CrossRef]
- Ralston, W.T.; Melaet, G.; Saephan, T.; Somorjai, G.A. Evidence of Structure Sensitivity in the Fischer–Tropsch Reaction on Model Cobalt Nanoparticles by Time-Resolved Chemical Transient. Angew. Chem. Int. Ed. 2017, 56, 7415–7419. [Google Scholar] [CrossRef]
- Ducreux, O.; Rebours, B.; Lynch, J.; Roy-Auberger, M.; Bazin, D. Microstructure of Supported cobalt Fischer-Tropsch catalysts. Oil Gas Sci. Tech. 2009, 64, 49–62. [Google Scholar] [CrossRef] [Green Version]
- Khodakov, A.Y. Fischer-Tropsch synthesis: Relations between structure of cobalt catalysts and their catalytic performance. Catal. Today 2009, 144, 251–257. [Google Scholar] [CrossRef]
- Sadeqzadeh, M.; Karaca, H.; Safonova, O.V.; Fongarland, P.; Chambrey, S.; Roussel, P.; Griboval-Constant, A.; Lacroix, M.; Curulla-Ferre, D.; Luck, F.; et al. Identification of the active species in the working alumina-supported cobalt catalyst under various conditions of Fischer–Tropsch synthesis. Catal. Today 2011, 164, 62–67. [Google Scholar] [CrossRef]
- Gnanamani, M.K.; Jacobs, G.; Shafer, W.D.; Davis, B.H. Fischer–Tropsch synthesis: Activity of metallic phases of cobalt supported on silica. Catal. Today 2013, 215, 13–17. [Google Scholar] [CrossRef]
- Dinega, D.P.; Bawendi, M.G. A Solution-Phase Chemical Approach to a New Crystal Structure of Cobalt. Angew. Chem. Int. Ed. 1999, 38, 1788–1791. [Google Scholar] [CrossRef]
- Enache, D.I.; Rebours, B.; Roy-Auberger, M.; Revel, R. In Situ XRD Study of the Influence of Thermal Treatment on the Characteristics and the Catalytic Properties of Cobalt-Based Fischer–Tropsch Catalysts. J. Catal. 2002, 205, 346–353. [Google Scholar] [CrossRef]
- Liu, J.; Su, H.; Sun, D.; Zhang, B.; Li, W. Crystallographic dependence of CO activation on cobalt catalysts: HCP versus FCC. J. Am. Chem. Soc. 2013, 135, 16284–16287. [Google Scholar] [CrossRef]
- Mohandas, J.C.; Gnanamani, M.K.; Jacobs, G.; Ma, W.P.; Ji, Y.; Khalid, S.; Davis, B.H. Fischer Tropsch Synthesis: Characterization and Reaction Testing of Cobalt Carbide. ACS Catal. 2011, 1, 1581–1588. [Google Scholar] [CrossRef]
- Jalama, K.; Ma, W.P.; Jacob, G.; Sparks, D.; Qian, D.L.; Davis, B.H. Fischer-Tropsch synthesis over Pt/Co/Al2O3 catalyst: Improvement in catalyst stability by activation with diluted CO. Appl. Catal. 2020, 602, 117645. [Google Scholar] [CrossRef]
- Jiao, G.P.; Ding, Y.J.; Zhu, H.J.; Li, X.; Li, J.; Lin, R.; Dong, W.; Gong, L.; Pei, Y.; Lu, Y. Effect of La2O3 doping on syntheses of C1–C18 mixed linear α-alcohols from syngas over the Co/AC catalysts. Appl. Catal. 2009, 364, 137–142. [Google Scholar] [CrossRef]
- Pei, Y.P.; Ding, Y.J.; Zhu, H.J.; Du, H. One-step production of C1–C18 alcohols via Fischer-Tropsch reaction over activated carbon-supported cobalt catalysts: Promotional effect of modification by SiO2. Chin. J. Catal. 2015, 36, 355–361. [Google Scholar] [CrossRef]
- Li, W.Z.; Liu, J.X.; Gu, J.; Zhou, W.; Yao, S.Y.; Si, R.; Guo, Y.; Su, H.Y.; Yan, C.H.; Li, W.X.; et al. Chemical Insights into the Design and Development of Face-Centered Cubic Ruthenium Catalysts for Fischer–Tropsch Synthesis. J. Am. Chem. Soc. 2017, 139, 2267–2276. [Google Scholar] [CrossRef]
- Yang, Y.; Xiang, H.W.; Xu, Y.Y.; Bai, L.; Li, Y.W. Effect of potassium promoter on precipitated iron-manganese catalyst for Fischer-Tropsch synthesis. Appl. Catal. 2004, 266, 181–194. [Google Scholar] [CrossRef]
- Tian, Z.P.; Wang, C.H.; Yue, J.; Zhang, X.H.; Ma, L.L. Effect of a potassium promoter on the Fischer–Tropsch synthesis of light olefins over iron carbide catalysts encapsulated in graphene-like carbon. Catal. Sci. Technol. 2019, 9, 2728–2741. [Google Scholar] [CrossRef]
- Tao, Z.; Yang, Y.; Wan, H.; Li, Y.W. Effect of manganese on a potassium-promoted iron-based Fischer-Tropsch synthesis catalyst. Catal. Lett. 2007, 114, 161–168. [Google Scholar] [CrossRef]
- Ribeiro, M.C.; Jacobs, G.; Pendyala, R.; Davis, B.H.; Cronauer, D.C.; Kropf, A.J.; Marshall, C.L. Fischer−Tropsch Synthesis: Influence of Mn on the Carburization Rates and Activities of Fe-Based Catalysts by TPR-EXAFS/XANES and Catalyst Testing. J. Phys. Chem. C 2011, 115, 4783–4792. [Google Scholar] [CrossRef]
- Yang, Y.; Xiang, H.W.; Tian, L.; Wang, H.; Zhang, C.H.; Tao, Z.C.; Xu, Y.Y.; Zhong, B.; Li, Y.W. Structure and Fischer–Tropsch performance of iron–manganese catalyst incorporated with SiO2. Appl. Catal. A Gen. 2005, 284, 105–122. [Google Scholar] [CrossRef]
- Nurunnabi, M.; Murata, K.; Okabe, K.; Inaba, M.; Takahara, I. Performance and characterization of Ru/Al2O3 and Ru/SiO2 catalysts modified with Mn for Fischer-Tropsch synthesis. Appl. Catal. 2008, 340, 203–211. [Google Scholar] [CrossRef]
- Chen, Y.W.; Wang, H.T.; Goodwin, J.G.; Shiflett, W.K., Jr. Fischer-tropsch synthesis over zeolite-supported ruthenium catalysts derived from Ru3(CO)12. Appl. Catal. 1983, 8, 303–314. [Google Scholar] [CrossRef]
- Boudart, M. Advances in Catalysis and Related Subjects; Eley, D.D., Ed.; Academic Press: New York, NY, USA, 1969; Volume 20, p. 85. [Google Scholar]
- Li, J.L.; Coville, N.J. The effect of boron on the catalyst reducibility and activity of Co/TiO2 Fischer–Tropsch catalysts. Appl. Catal. 1999, 181, 201–208. [Google Scholar] [CrossRef]
- Iglesia, E.; Reyes, S.C.; Madon, R.J.; Soled, S.L. Selectivity Control and Catalyst Design in the Fischer-Tropsch Synthesis: Sites, Pellets, and Reactors. Adv. Catal. 1993, 39, 221–302. [Google Scholar] [CrossRef]
- Iglesia, E. Design, synthesis, and use of cobalt-based Fischer-Tropsch synthesis catalysts. Appl. Catal. A Gen. 1997, 161, 59–78. [Google Scholar] [CrossRef]
- Vannice, M.A. CO hydrogenation over well-dispersed carbon-supported iron catalysts. J. Catal. 1983, 75, 416–422. [Google Scholar]
- Jones, V.K.; Neubauer, L.R.; Bartholomew, C.H. Effects of crystallite size and support on the CO hydrogenation activity/selectivlty properties of Fe/Carbon. J. Phys. Chem. 1986, 90, 4832–4839. [Google Scholar] [CrossRef]
- Bezemer, G.L.; Bitter, J.H.; Kuipers, P.C.E.; Oosterbeek, H.; Holewijn, J.E.; Xu, X.; Kapteijn, F.; van Dillen, A.J.; de Jong, K.P. Cobalt particle size effects in the Fischer-Tropsch reaction studied with carbon nanofiber supported catalysts. J. Am. Chem. Soc. 2006, 128, 3956–3964. [Google Scholar] [CrossRef] [PubMed] [Green Version]
- Den Breejen, J.P.; Radstake, P.B.; Bezemer, G.L.; Bitter, J.H.; Frøseth, V.; Holmen, A.; de Jong, K.P. On the origin of the cobalt particle size effects in Fischer-Tropsch catalysis. J. Am. Chem. Soc. 2009, 131, 7197–7203. [Google Scholar] [CrossRef]
- Borg, Ø.; Dietzel, P.D.; Spjelkavik, A.I.; Tveten, E.Z.; Walmsley, J.C.; Diplas, S.; Eri, S.; Holmen, A.; Rytter, E. Fischer-Tropsch synthesis: Cobalt particle size and support effects on intrinsic activity and product distribution. J. Catal. 2008, 259, 161–164. [Google Scholar] [CrossRef]
- Prieto, G.; Martínez, A.; Concepción, P.; Moreno-Tost, R. Cobalt particle size effects in Fischer–Tropsch synthesis: Structural and in situ spectroscopic characterisation on reverse micelle-synthesised Co/ITQ-2 model catalysts. J. Catal. 2009, 266, 129–144. [Google Scholar] [CrossRef]
- Ma, W.; Jacobs, G.; Keogh, R.A.; Bukur, D.B.; Davis, B.H. Fischer-Tropsch synthesis: Effect of Pd, Pt, Re, and Ru noble metal promoters on the activity and selectivity of a 25%Co/Al2O3 catalyst. Appl. Catal. 2012, 437, 1–9. [Google Scholar] [CrossRef]
- Pendyala, V.R.R.; Jacobs, G.; Ma, W.; Klettlinger, J.L.S.; Yen, C.H.; Davis, B.H. Fischer-Tropsch synthesis: Effect of catalyst particle (sieve) size range on activity, selectivity, and aging of a Pt promoted Co/Al2O3 catalyst. Chem. Eng. J. 2014, 249, 279–284. [Google Scholar] [CrossRef]
- Saib, A.M.; Borgna, A.; de Loosdrecht, J.V.; van Berge, P.J.; Niemantsverdriet, J.W. XANES study of the susceptibility of nano-sized cobalt crystallites to oxidation during realistic Fischer–Tropsch synthesis. Appl. Catal. A 2006, 312, 12–19. [Google Scholar] [CrossRef]
- Barkhuizen, D.; Mabaso, E.I.; Viljoen, E.; Welker, C.; Claeys, M.; van Steen, E.; Fletcher, J.C.Q. Experimental approaches to the preparation of supported metal nanoparticles. Pure Appl. Chem. 2006, 78, 1759–1769. [Google Scholar] [CrossRef] [Green Version]
- Park, J.Y.; Lee, Y.J.; Khanna, P.K.; Jun, K.W.; Bae, J.W.; Kim, Y.H. Alumina-supported iron oxide nanoparticles as Fischer–Tropsch catalysts:Effect of particle size of iron oxide. J. Mol. Catal. A Chem. 2010, 323, 84. [Google Scholar] [CrossRef]
- Torres, G.H.M.; Bitter, J.H.; Davidian, T.; Ruitenbeek, M.; Dugulan, A.I.; de Jong, K.P. Iron particle size effects for direct production of lower olefins from synthesis gas. J. Am. Chem. Soc. 2012, 134, 16207–16215. [Google Scholar] [CrossRef] [PubMed] [Green Version]
- Keyvanloo, K.; Mardkhe, M.K.; Alam, T.M.; Bartholomew, C.H.; Woodfield, B.F.; Hecker, W.C. Supported Iron Fischer–Tropsch Catalyst: Superior Activity and Stability Using a Thermally Stable Silica-Doped Alumina Support. ACS Catal. 2014, 4, 1071–1077. [Google Scholar] [CrossRef]
- Kellner, C.S.; Bell, A.T. Effects of dispersion on the activity and selectivity of alumina-supported ruthenium catalysts for carbon monoxide hydrogenation. J. Catal. 1982, 75, 251–261. [Google Scholar] [CrossRef]
- Eslava, J.L.; Sun, X.H.; Gascon, J.; Kapteijnb, F.; Ramos, I. Ruthenium particle size and cesium promotion effects in Fischer–Tropsch synthesis over high surface-area graphite supported catalysts. Catal. Sci. Technol. 2017, 7, 1235–1244. [Google Scholar] [CrossRef] [Green Version]
- Carballo, J.M.G.; Alonso, F.J.P.; Ojeda, M.; Garcia-Garcia, F.J.; Fierro, J.L.G.; Rojas, S. Evidences of Two-Regimes in the Measurement of Ru Particle Size Effect for CO Dissociation during Fischer–Tropsch Synthesis. ChemCatChem 2014, 6, 2084–2094. [Google Scholar] [CrossRef]
- Kang, J.; Zhang, S.; Zhang, Q.; Wang, Y. Ruthenium nanoparticles supported on carbon nanotubes as efficient catalysts for selective conversion of synthesis gas to diesel fuel. Angew. Chem. Int. Ed. 2009, 48, 2565–2568. [Google Scholar] [CrossRef] [PubMed]
- Xiao, C.X.; Cai, Z.P.; Wang, T.; Kou, Y.; Yan, N. Aqueous-Phase Fischer–Tropsch Synthesis with a Ruthenium Nanocluster Catalyst. Angew. Chem. 2008, 120, 758–761. [Google Scholar] [CrossRef]
- Zhang, Y.; Yang, X.; Yang, X.; Duan, H.; Qi, H.; Su, Y.; Liang, B.; Tao, H.; Liu, B.; Chen, D.; et al. Tuning reactivity of Fischer–Tropsch synthesis by regulating TiOx overlayer over Ru/TiO2 nanocatalysts. Nat. Commun. 2020, 11, 3185. [Google Scholar] [CrossRef]
- Fu, T.J.; Li, Z.H. Review of recent development in Co-based catalysts supported on carbon materials for Fischer–Tropsch synthesis. Chem. Eng. Sci. 2015, 135, 3–20. [Google Scholar] [CrossRef]
- Gavrilović, L.; Save, J.; Blekkan, E.A. The effect of potassium on cobalt-based Fischer–Tropsch catalysts with different cobalt particle sizes. Catalysts 2019, 9, 351. [Google Scholar] [CrossRef] [Green Version]
- Ghogia, A.C.; Nzihou, A.; Serp, P.; Soulantica, K.; Pham Minh, D. Cobalt catalysts on carbon-based materials for Fischer-Tropsch synthesis: A review. Appl. Catal. 2021, 609, 117906. [Google Scholar] [CrossRef]
- Park, J.-Y.; Lee, Y.J.; Karandikar, P.R.; Jun, K.W.; Ha, K.S.; Park, H.G. Fischer–Tropsch catalysts deposited with size-controlled Co3O4 nanocrystals: Effect of Co particle size on catalytic activity and stability. Appl. Catal. 2012, 411, 15–23. [Google Scholar] [CrossRef]
- Qi, Z.; Chen, L.; Zhang, S.; Su, J.; Somorjai, G.A. A mini review of cobalt-based nanocatalyst in Fischer-Tropsch synthesis. Appl. Catal. 2020, 602, 17701. [Google Scholar] [CrossRef]
- Yang, J.; Frøseth, V.; Chen, D.; Holmen, A. Particle size effect for cobalt Fischer–Tropsch catalysts based on in situ CO chemisorption. Surf. Sci. 2016, 648, 67–73. [Google Scholar] [CrossRef]
- Zhang, Q.; Deng, W.P.; Wang, Y. Recent advances in understanding the key catalyst factors for Fischer-Tropsch synthesis. J. Energy Chem. 2013, 22, 27–38. [Google Scholar] [CrossRef]
- Jacobs, G.; Ma, W.P.; Gao, P.; Todic, B.; Bhatelia, T.; Bukur, D.B.; Khalid, S.; Davis, B.H. Fischer-Tropsch Synthesis: Differences Observed in Local Atomic Structure and Selectivity with Pd Compared to Typical Promoters (Pt, Re, Ru) of Co/Al2O3 Catalysts. Top. Catal. 2012, 55, 811–817. [Google Scholar] [CrossRef]
- Ghasvareh, P.; Smith, K.J. Effects of Co particle size on the stability of Co/Al2O3 and Re-Co/Al2O3 catalysts in a slurry-phase Fischer-Tropsch reactor. Energy Fuels 2016, 30, 9721–9729. [Google Scholar] [CrossRef]
- Jacobs, G.; Ma, W.P.; Davis, B.H. Influence of Reduction Promoters on Stability of Cobalt/γ-Alumina Fischer-Tropsch Synthesis Catalysts. Catalysts 2014, 4, 49–76. [Google Scholar] [CrossRef]
- Liu, J.X.; Wang, P.; Xu, W.; Hensen, E.J. Particle size and crystal phase effects in Fischer-Tropsch catalysts. Engineering 2017, 3, 467–476. [Google Scholar] [CrossRef]
- Gu, B.; Zhou, C.; He, S.; Moldovan, S.; Chernavskii, P.A.; Ordomsky, V.V.; Khodakov, A.Y. Size and promoter effects on iron nanoparticles confined in carbon nanotubes and their catalytic performance in light olefin synthesis from syngas. Catal. Today 2020, 357, 203–213. [Google Scholar] [CrossRef]
- Xie, J.; Torres Galvis, H.M.; Koeken, A.C.J.; Kirilin, A.; Dugulan, A.I.; Ruitenbeek, M.; de Jong, K.P. Size and Promoter Effects on Stability of Carbon-Nanofiber-Supported Iron-Based Fischer–Tropsch Catalysts. ACS Catal. 2016, 6, 4017–4024. [Google Scholar] [CrossRef] [Green Version]
- Wang, H.W.; Lu, J.L. A review on particle size effect in metal-catalyzed heterogeneous reactions. Chin. Chem. 2020, 38, 1422–1444. [Google Scholar] [CrossRef]
- Kang, J.; Deng, W.P.; Zhang, Q.H.; Wang, Y. Ru particle size effect in Ru/CNT-catalyzed Fischer-Tropsch synthesis. J. Energy Chem. 2013, 22, 321–328. [Google Scholar] [CrossRef]
Figure 1.
World primary Energy and projection (data from [1]).
Figure 1.
World primary Energy and projection (data from [1]).

Figure 2.
(a) Iron carbide structures vary with reaction time (from [11]), (b) Iron carbide structures and thermodynamics (reproduced with permission from [12] Copyright 2010, Elsevier), (c) iron phase composition and activity (reproduced with permission from [13] Copyright 2009, Elsevier), (d) Activity as a function of iron carbide type (reproduced with permission from [14] Copyright 2018, ACS), (e) bottom-middle and (f) Relationships between reaction energy (ΔrE) of CH4 formation and Mulliken charge (q) of the surface C atom as well as effective barrier (Eeff) of CH4 formation and d-band center (εd) of the surface. (reproduced with permission from [16] Copyright 2009, ACS).

Figure 3.
(a) FT activity of Co/Al2O3 catalyst (from [19]), (b) FT activity of Co/SiO2 catalyst (from [19]), (c) FT activity of Co/Al2O3 catalyst (reproduced with permission from [21] Copyright 2011, Elsevier), (d) FT activity of Co/SiO2 catalyst (reproduced with permission from [22] Copyright 2013, Elsevier). (e) C1–C18 alcohols formation on Co/AC catalyst (reproduced with permission from [28] Copyright 2009, Elsevier), (f) C1-C18 alcohols formation on Co/AC catalyst (reproduced with permission from [29] Copyright 2015, Elsevier).

Figure 4.
(a) Effect of cobalt dispersion (ratio of surface Co to total Co atoms), 200 °C, 2.0 MPa, H2/CO = 2.05, 55–65% CO conversion, C5+ selectivity > 80% (reproduced with permission from [41] Copyright 1997, Elsevier), (b) the influence of cobalt particle size on the TOF at 3.5 MPa, 210 °C and H2/CO = 2.0 (reproduced with permission from [44] Copyright 2006, Elsevier), (c) the influence of cobalt particle size on Co TOF at 2.2 MPa, 220 °C and H2/CO = 2.1 (data from [48]).

Figure 5.
(a) Initial integral activity per unit surface area over carbon supported iron-based catalysts at 270 °C and 3.0 MPa H2/CO = 2, 7.2 NL/g-cat/h, and XCO = 20–75%; alumina-supported catalysts: 18 NL/g-cat/h, and, XCO = 6–15% (from [51]), (b) The influence of iron particle size on the TOF at 280 and 300 °C, 1.0 MPa, 7.2 NL/g-cat/h, and H2/CO = 2.0 (reproduced with permission from [52] Copyright 2010, Elsevier), (c) TOF as a function of iron carbide size 340 °C, 2.0 MPa, H2/CO = 1, (reproduced with permission from [53] Copyright 2012, ACS).

Figure 6.
(a) Effects of ruthenium dispersion on Fischer–Tropsch synthesis rates at 203 °C, H2/CO = 2.1, 0.56MPa, 45–60% CO conversion (reproduced with permission from [8] Copyright 1992, Academic Press. Inc.), (b) Effects of Ru particle size on turnover frequencies for CO consumption and CH4 formation rates at 250 °C; 0.2 MPa, H2/CO = 1 (reproduced with permission from [7] Copyright 2011, Elsevier), (c) Evolution of TOF CO with Ru particle size at the beginning of the reaction, t = 0, and after 20 h on stream, steady-state regime (reproduced with permission from [57] Copyright 2014, Wiley-VCH Verlag GmbH & Co.), (d) Dependence of TOF on the mean size of Ru particles at 260 °C; 2 MPa, H2/CO = 1 (reproduced with permission from [58] Copyright 2009, Wiley-VCH Verlag GmbH & Co.), (e) TOF as a function of diameter of the Ru nanoparticles at 150 °C; 3 MPa, H2/CO = 2 (reproduced with permission from [59] Copyright 2008, Wiley-VCH Verlag GmbH & Co.).

Publisher’s Note: MDPI stays neutral with regard to jurisdictional claims in published maps and institutional affiliations. |
© 2021 by the authors. Licensee MDPI, Basel, Switzerland. This article is an open access article distributed under the terms and conditions of the Creative Commons Attribution (CC BY) license (http://creativecommons.org/licenses/by/4.0/).
Share and Cite
MDPI and ACS Style
Ma, W.; Dalai, A.K. Effects of Structure and Particle Size of Iron, Cobalt and Ruthenium Catalysts on Fischer–Tropsch Synthesis. Reactions 2021, 2, 62-77. https://doi.org/10.3390/reactions2010006
AMA Style
Ma W, Dalai AK. Effects of Structure and Particle Size of Iron, Cobalt and Ruthenium Catalysts on Fischer–Tropsch Synthesis. Reactions. 2021; 2(1):62-77. https://doi.org/10.3390/reactions2010006
Chicago/Turabian StyleMa, Wenping, and Ajay K. Dalai. 2021. "Effects of Structure and Particle Size of Iron, Cobalt and Ruthenium Catalysts on Fischer–Tropsch Synthesis" Reactions 2, no. 1: 62-77. https://doi.org/10.3390/reactions2010006