

Multifunctional Fiber-Reinforced Polymer Composites for Damage Detection and Memory

Civil Engineering and Engineering Mechanics, Columbia University, New York, NY 10027, USA
*
Author to whom correspondence should be addressed.
J. Compos. Sci. 2023, 7(9), 383; https://doi.org/10.3390/jcs7090383
Submission received: 22 June 2023
/
Revised: 2 August 2023
/
Accepted: 8 September 2023
/
Published: 12 September 2023
(This article belongs to the Topic Advanced Carbon Fiber Reinforced Composite Materials)
Abstract
:Self-structural health monitoring (SHM) functionalities for fiber-reinforced polymer composites have become highly sought after to ensure the structural safety of newly advancing components in the automotive, civil, mechanical, and aerospace industries. This paper introduces a self-damage detection and memory (SDDM) hybrid composite material, where the structural carbon fiber tow is transformed into a piezoresistive sensor network, and the structural glass fiber operates as electrical insulation. In this study, SDDM specimens were fabricated, and tensile and impact tests were performed. The tensile tests of SDDM specimens find two distinct loading peaks: first where the carbon fiber fails, and second where the glass fiber fails. A linear correlation was observed between the carbon fiber resistance and composite strain up to a threshold, beyond which a sharp nonlinear increase in resistance occurred. The resistance then approached infinity, coinciding with the first loading peak and failure of the carbon fiber elements. This demonstrates the potential for a damage early warning threshold. Additionally, the effect of stitching the sensor tow in a zig-zag pattern over a large area was investigated using tailored fiber placement (TFP) of 1-loop, 3-loop, and 5-loop specimens. Tensile testing found that increasing the number of loops improved the sensor’s accuracy for strain sensing. Furthermore, impact tests were conducted, and as the impact energy progressively increased, the sensor resistance permanently increased. This illustrates a capability for self-memory of microdamage throughout the life cycle of the structure, potentially useful for predicting the remaining life of the composite.
1. Introduction
Fiber-reinforced polymer (FRP) composites, being light in weight and high in strength and stiffness, have emerged as the next-generation structural materials. However, such materials are susceptible to impact damage, which is difficult to detect by the naked eye. It commonly requires the component to be taken out of service and inspected using expensive non-destructive evaluation equipment such as ultrasonics and infrared thermography. Furthermore, the failure mechanism in FRP composites is often unpredictable and could be catastrophic with no early-warning signs. Therefore, vigilant in situ continuous SHM functionality is needed to ensure structural safety and reduce maintenance costs of FRP composite structures.
The currently available SHM methods often require a sensor system to be installed after curing, which takes up space and adds weight. Additionally, the cost of manufacturing, installation, maintenance, and data processing makes the practice of SHM increasingly complex and costly to implement. A recent literature review publication [1] discusses the ongoing developments in advanced SHM systems for FRP composites, including fiber Bragg grating sensors, infrared thermography digital image correlation (DIC), and piezoresistive and semiconductor strain sensors. They each have specific limitations inhibiting full-scale manufacturing and continuous monitoring of composite structures.
A 2021 literature review paper focuses on the more promising piezoresistive strain sensing methods for SHM of FRP composites via monitoring the sensing materials’ electrical resistance [2]. The paper reviewed four primary strategies: self-sensing by electroding elements of the complete carbon FRP (CFRP) part, the use of surface-attached films or patterns, the impregnation of reinforcements with piezoresistive matrices, and lastly, the integration of filaments/yarns during manufacturing. CFRP electrical property measurement has been shown to be a successful method of tracking a larger area of a composite [3,4]. This is conventionally achieved with electrodes installed at the edges of the composite. A recent study demonstrated how a grid of surface-mounted electrodes can be used to detect impact damage [5]. However, current practices are cumbersome; electrodes are applied to the surface after curing, where contact with the conductive carbon fiber requires sanding and preparation. Multiple electrode pairs can be set up; however, each pair requires its own set of lead wires to the control unit. These multiple sets of surface electrodes add to the bulkiness of the monitoring system. Additionally, a nonspecific width between the electrodes is monitored rather than a specific sensing line and nearby microcracks can go undetected. This is unattractive in many applications. Often, the precise location of the damage is desired. With surface electroding, this would require a network of electrodes with individual electrical attachments, similar to the grid method in [5].
The following three strain monitoring strategies require sensor materials to be added to the FRP composite structures. For example, conductive nanoparticles were applied to the surface in patterns to effectively measure surface strain [6,7,8,9]. They take the form of various graphene and silver nanoparticles printed in serpentine patterns that resemble conventional strain gauges. Such surface strain sensors can be strategically placed in regions of interest. However, a major downside is introduced since damage detection is limited to these adhered regions. Another example is to impregnate conductive nanofillers into composite matrices for strain monitoring. They are effective in capturing matrix-dominated failure modes, and the nanofillers could strengthen the mechanical properties of the composite [10]. However, even the dispersion of nanoparticles into the matrix has proven burdensome and difficult for industrial manufacturing.
Two works [11,12] have shown the feasibility of woven carbon fiber sensors cured into a large FRP plate with applications in concrete beam monitoring and reinforcement. Uniaxial strain measurements were captured using the inherent piezoresistive effect of a tow woven into basalt-reinforcing fibers. Additional research into piezoresistive fibers has shown the sensing capabilities of mixing carbon and glass filaments at the microscale, with the carbon fiber bundle measuring 0.5 mm in diameter [13]. The study highlighted how quasi-static load/unload tension cycles create a nonstationary resistance change in the sensor. This work was expanded on by a study demonstrating the nonlinear behavior of carbon fiber tows near failure [14].
Moreover, two studies have reviewed the recent advancements in the electrical resistance change (ERC) method [15,16]. Analytical solutions of the coupled electromechanical behavior of self-sensing carbon fiber have shown promise. A shear–lag model was created to determine the stress–strain damage fiber relationship, which was then input into an electrical model to determine fiber–fiber contacts. Additionally, monitoring a carbon fiber laminate’s resistance under quasi-static cyclic tension loading has shown to be an effective strain sensor, with the study finding that longitudinal resistance decreases and transverse resistance increases with cyclic stress [17]. The authors used an stress level of 32% and attributed the behavior to fiber straightening.
Strain has also been successfully measured via the ERC method for continuous carbon fiber tows. A study on a parallel array of long-gauge carbon fiber tows also found a high degree of correlation between resistance and strain, highlighting that the noise followed a normal distribution with a standard deviation of 50 microstrain [18]. Further work on carbon fiber tows as strain sensors demonstrated that pre-tensioning methods were able to improve the sensor’s performance [19]. Similarly, post-tensioning methods, where the composite underwent 3 h at 60% , were shown to reduce signal fluctuation errors by a factor greater than 4 [20].
However, there still remains a need for affordable and continuous in situ solutions for monitoring large area composites. Single-line carbon fiber sensing tows are able to fill this role: they can be located in an predetermined path to sense a unique region, and can also be routed to cover more area. Among the limited work in this area, one study utilized a carbon fiber sensor tow placed in a zig-zag pattern to monitor the strain of a GFRP composite [21]. The authors used one carbon fiber sensor tow pattern, with a primary goal to investigate typical measurement errors, finding a linearity error of less than 8%, hysteresis error of 2%, and creep error of less than 4%.
This paper aims to build upon the sparse prior research into single-line carbon fiber tows as strain sensors, especially in larger area composites. Past work has demonstrated that there is a nontrivial degree of error in the ERC method for carbon fiber composites. Certain factors have been shown to improve performance, such as the pre-tensioning and post-tensioning effects; however, these methods are limited in their industrial applications. Pre-tensioning requires intricate and costly jigs that are not suited to interface with high-volume resin transfer molding processes. Moreover, post-tensioning is difficult in practice; loading cured 3D parts presents a major obstacle in production, and even if achieved, could induce damage due to the high stress required for fiber alignment. Therefore, there still remains a major need to more accurately monitor large-scale composites.
The zig-zag sensor tow pattern has been shown to reliably monitor a large area, however, performance improvements due to variations in the zig-zag pattern have yet to be investigated. This is among the primary aims of this study. Moreover, the sensor’s integration into newly developing hybrid carbon–glass material systems has yet to be studied. These hybrid systems are having increasing appeal in industry due to their lower material costs and high energy absorption. This work aims to create an integrated multifunctional hybrid carbon and glass system, where accurate strain sensing is achieved by a low gsm zig-zag carbon fiber sensor layer, and electrical insulation is provided by the structural glass fibers that are comingled with the structural carbon fibers. The zig-zag sensor pattern can be adapted to monitor specific complex regions or the entire composite part.
Addressing the limitations in prior work and the unmet needs for SHM of FRP composites, this work seeks to provide a self-damage detection and memory (SDDM) composite with (i) strain-sensing via continuous spatial monitoring rather than point-wise monitoring; (ii) a zig-zag pattern to improve performance; (iii) simple layer-wise low-gsm preform integration enabling high-volume manufacturing with limited post-molding installation; (iv) multifunctional utilization of the hybrid material system; (v) damage early warning due to lower strain-to-failure of the sensor versus the hybrid system; and (vi) an ability to monitor large and complex areas.
This paper first presents the conceptual design of the proposed multifunctional FRP composites (Section 2). The paper then focuses on the experimental investigation of self-damage detection and damage memory functionalities, including test specimen fabrication (Section 3), tensile tests (Section 4), and progressive impact tests (Section 5).
2. Proposed SDDM FRP Composite
The concept of the proposed SDDM FRP composite is illustrated in Figure 1a, a cross-sectional view of a hypothetical four-layer unidirectional hybrid composite comprised of commingled carbon fiber and glass fiber tows in a polymer matrix. Taking advantage of the electrical conductivity and the inherent piezoresistive effect of carbon fibers, any structural carbon fiber tow (such as the one in red in Figure 1a) can be selected to serve as a uniaxial strain sensor. Furthermore, the structural glass fiber tows are used for the electrical insulation of the sensor tow. This eliminates the need for adding a foreign insulation material, which would increase not only the weight and cost but also cause concerns of sensor debonding. The proposed SDDM composite can be manufactured using a variety of fiber-reinforcing material systems, not just comingled glass fiber and carbon fiber tows. Figure 1b depicts a hypothetical two-layer carbon SDDM composite that includes two thin glass veils for electrical insulation.
Under mechanical stress, the electrical resistance of the sensor tow increases as the strain increases. Thus, the current strain level can be determined and used for damage detection by tracking the live in situ resistance of the sensor tow. A threshold tolerance level can be set, and a pass–fail alarm system for damage early warning can be established.
When the composite undergoes repetitive loading, the sensor tow might suffer microdamage, such as microfractures of some carbon filaments, causing a permanent increase in the sensor tow’s resistance (because electrical continuity along the tow is partially disrupted). In other words, the microdamage that occurs can be memorized by the sensor tow’s permanently increased resistance value. By tracking the resistance history, there is a potential for predicting the remaining life of the composite structure.
The sensor tow can be designed in various patterns, as depicted in Figure 2. Sensor tow arrangements, such as the one shown in Figure 2b, can be implemented to monitor a larger area using only one pair of electrodes. Such a strain gauge pattern also increases the accuracy of the strain sensor.
The low-cost manufacturing process of the sensor is a further novelty of the proposed SDDM composite. Prefabricated carbon fiber sensor tows and microcircuits can be stitched to the carbon–glass fiber preforms during their weaving process. The presence of the sensor in the fiber preform was not found to inhibit the FRP composite molding process and is, therefore, compliant with both high-pressure resin transfer molding (HP-RTM) and vacuum-assisted resin transfer molding (VARTM).
The proposed SDDM composite provides some significant advantages over the previous sensor systems reported in the literature: First, the use of the structural fiber tow itself as a sensor (versus installing a foreign sensor fiber/device) is expected to produce more direct, accurate, and reliable damage detection and SHM results. Second, there is flexibility to design the sensor tow layout patterns to minimize the number of electrodes while maximizing the sensitivity of the strain sensor. Third, no foreign materials are added or need to be installed on the surface after composite curing, making SDDM composites attractive for applications in, for example, automotive vehicles where a single-part composite panel is necessary that does not take up extra space or require expensive post-molding installation. Lastly, and most importantly, SDDM functionalities are introduced, which are experimentally demonstrated as follows.
3. Design and Fabrication of Test Specimens
SDDM composite specimens with an embedded carbon fiber sensor tow were designed and fabricated for two modes of testing: (i) tensile testing and (ii) progressive impact testing. In each test method, the electromechanical response of the sensor was evaluated, and the resistance was measured with a BK Precision 5492C Digital Benchtop Multimeter. Specimens were molded using a standard VARTM process.
(i) Quasi-static monotonic tensile tests were conducted to investigate the composite’s self-damage detection functionality. Moreover, the effect of stitching the sensor tow in a zig-zag pattern, similar to a foil strain gauge, was investigated. Six specimens were fabricated: two 1-loop, two 3-loop, and two 5-loop. The tensile specimens consisted of two preforms stitched with tailored fiber placement (TFP): one preform with unidirectional hybrid glass tows and carbon fiber tows (81% and 21%, respectively), and another preform with the looped carbon fiber sensor tows. The specimens were tabbed at each end to ensure failure within the gauge length. Two types of strain sensors were used as references: a non-contact digital image correlation (DIC) camera and a surface-clipped extensometer.
(ii) Progressively increasing free-fall impact tests were carried out to evaluate the sensor’s capability for damage memory. The impact specimens consisted of two layers placed in a 0/90 orientation for two-way bending. The specimens were restrained with aluminum plates and C-clamps.
3.1. Materials
The specimens consisted of a hybrid carbon fiber and glass fiber custom preform and an additional single 3k sensor tow. The primary TFP single-layer unidirectional hybrid material, fabricated by Coats Group (Figure 3a), was composed of Toray 24k T700S carbon and OC SE8380 T30 H-Glass. The carbon and glass tows were stitched to a 50 gsm glass backing layer in a ratio of 19:81, respectively.
The carbon fiber sensor tow, electrically isolated by the glass fiber and connected to the resistance measurement circuit, consisted of 3k filament count Toray T700 fibers. To cure the specimens, Hexion EPIKOTE 06150 epoxy resin and EPIKURE 06150 curing agent were used in conjunction with HELOXY 06805 additive.
3.2. Electrical Insulation of Carbon Fiber Sensor Tow
To ensure the carbon fiber sensor tow was electrically insulated from the other structural carbon fibers, the sensor tow was placed only in contact with glass fibers, as shown in Figure 4. In this study, the electrical insulation results from being bounded by the two adjacent 50 gsm glass backing layers that hold the hybrid structural carbon–glass tows in place. No foreign material was used for the sensor insulation.
3.3. Molding and Specimen Preparation
The tensile test specimen plaque was fabricated using two preforms: a TPF sensor tow preform and a hybrid fabric preform. The TFP sensor tow preform consisted of a 3k carbon fiber tow custom stitched in a looped pattern to a glass backing layer, as shown in Figure 3b. The sensor tows and structural layers were cured at temperature into a laminate using a VARTM process. The Hexion epoxy system described previously was used, and the plaque was cured in the oven at 60 degrees Celsius for 25 min with a constant 1 atm vacuum pressure applied.
Copper rivets and lead wires were then installed to make a reliable electrical connection to the sensor tow. To facilitate a robust connection, the sensor tow had predefined electrical terminal locations where the tow was densely weaved on top of itself in a 10 mm × 10 mm square. The built-up carbon fiber square creates a tolerance to ensure that the 1/8” rivet hole can adequately cut through enough carbon fibers and connect to the sensor tow cross-section. The rivets were located away from the gauge section to ensure the contacts were not influenced by the loading. Prior to the tensile testing regimen, a plaque was fabricated to compare the rivet connection and a traditional silver conductive epoxy connection. Eight connections were analyzed, finding that the rivets added an average of 0.111 ohms with a standard deviation of 0.037 ohms. The higher lead resistance remains very small, at 0.2% of the initial resistance of the sensor tow. Such resistance contributions can be subtracted when calculating the fractional change.
In line with the specifications of ASTM D3039 regarding the preparation of composite tensile testing coupons [22], ” thick G10 garolite tabs were attached with an adhesive (Epon Resin 828 and Epikure 3125). The adhesive was cured for 2 h at 120 degrees Celsius. The bondline thickness was maintained using glass spacer beads within the adhesive and weighted plates on top of the tabs to remove entrapped air. After the elevated temperature cure, the tabbed plaque was left to rest for 24 h with the weighted plates. Next, specimens measuring approximately 60 mm × 250 mm were cut from the plaque using a diamond blade table saw.
4. Tensile Testing to Investigate Self-Damage Detection
One of the primary objectives of this study was to investigate the damage detection functionality of the SDDM composite material. Moreover, 1-loop, 3-loop, and 5-loop configurations were explored. To accomplish this, a parametric relationship between resistance and strain was analyzed. As the strain increases to the extent that the carbon fiber filaments in the tow start to break, the resistance of the tow drastically rises. When the carbon fiber tow completely breaks, the resistance increases to higher-order magnitudes, approaching infinity.
4.1. Tensile Test Setup
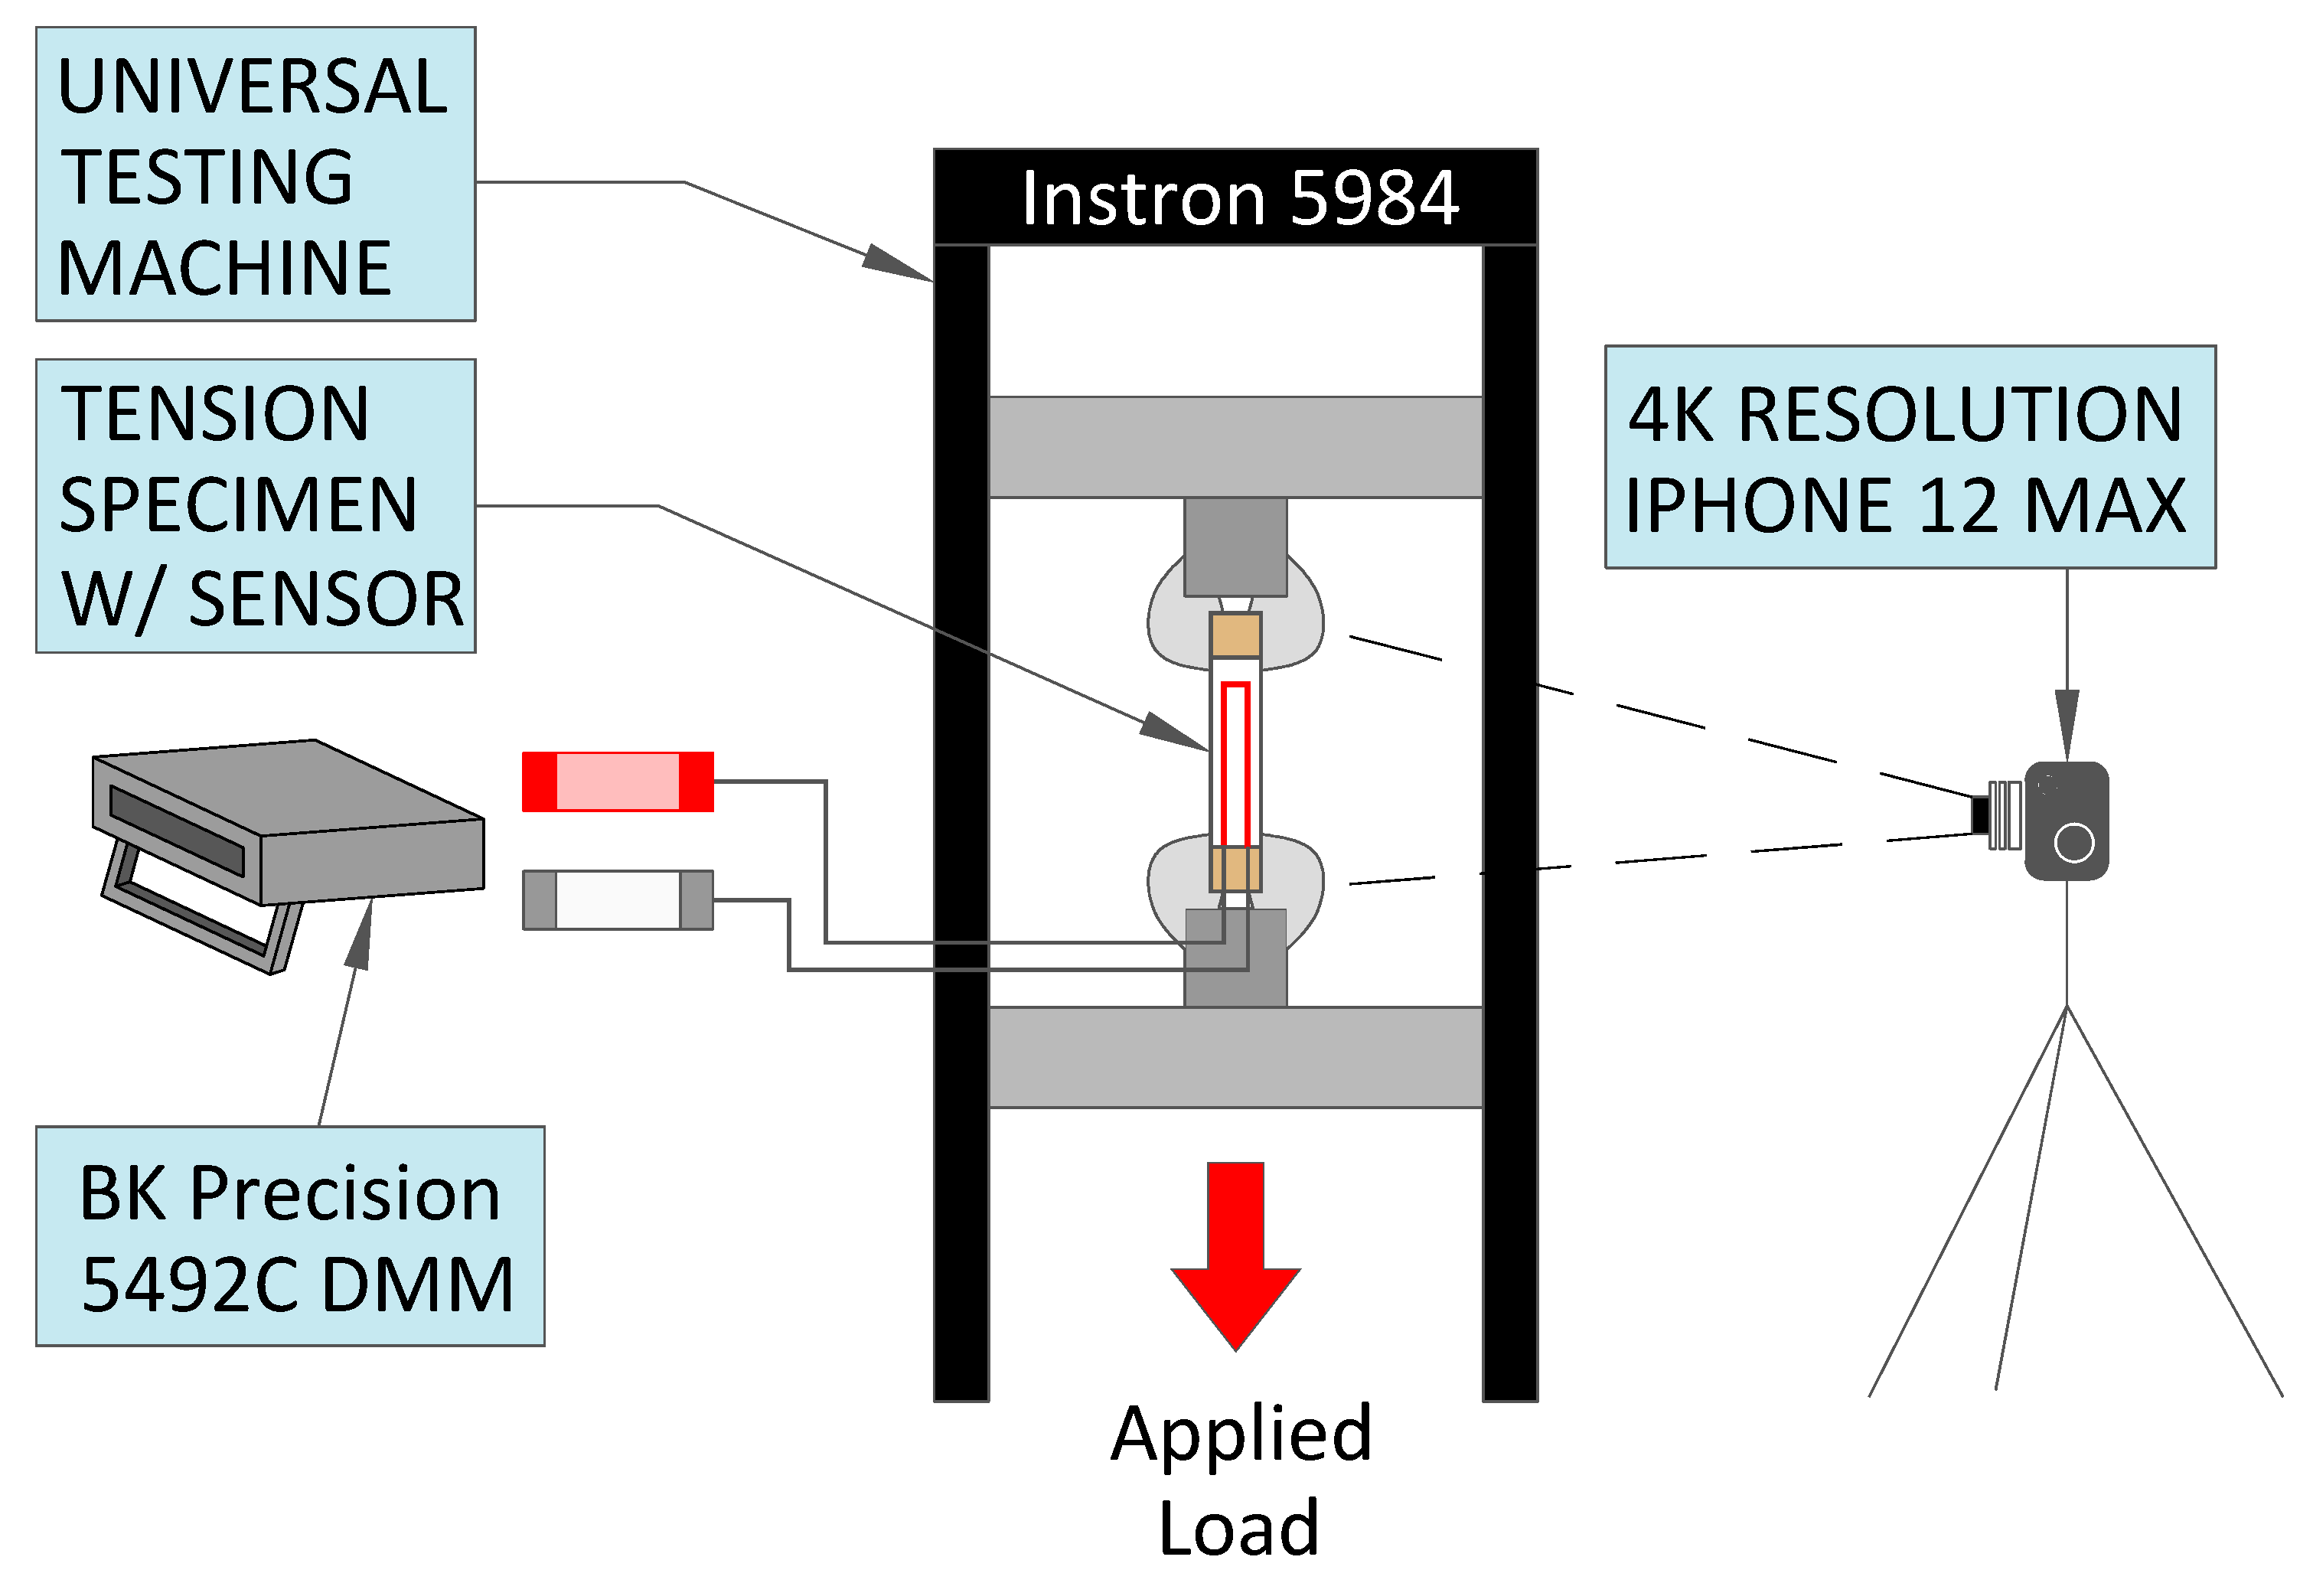
The tensile tests were carried out using an Instron 5984 34k universal testing machine. This is a PC-based load and displacement-controlled electromechanical testing machine with a maximum load capacity of 150 kN (34 kips) in tension and compression. The control platform Bluehill 3 allows the operator to define, program, and perform standardized test methods (e.g., ASTM, ANSI, etc.) and custom test methods. In addition, the program environment is tailored to support databasing and auto-reporting of both simple and complex, repetitive testing campaigns. The tensile test setup is displayed in Figure 5.
In total, six tension specimens are presented here: two 1-loop (specimens 1A and 1B), two 3-loop (specimens 3A and 3B), and two 5-loop (specimens 5A and 5B). Each tension specimen was tested to total failure, which was defined as a 70% drop in the relative load. The tests were conducted under displacement control with a cross-head speed of 1.0 mm/min. The geometric properties of the presented specimens are shown in Table 1.
4.2. Strain Measurement
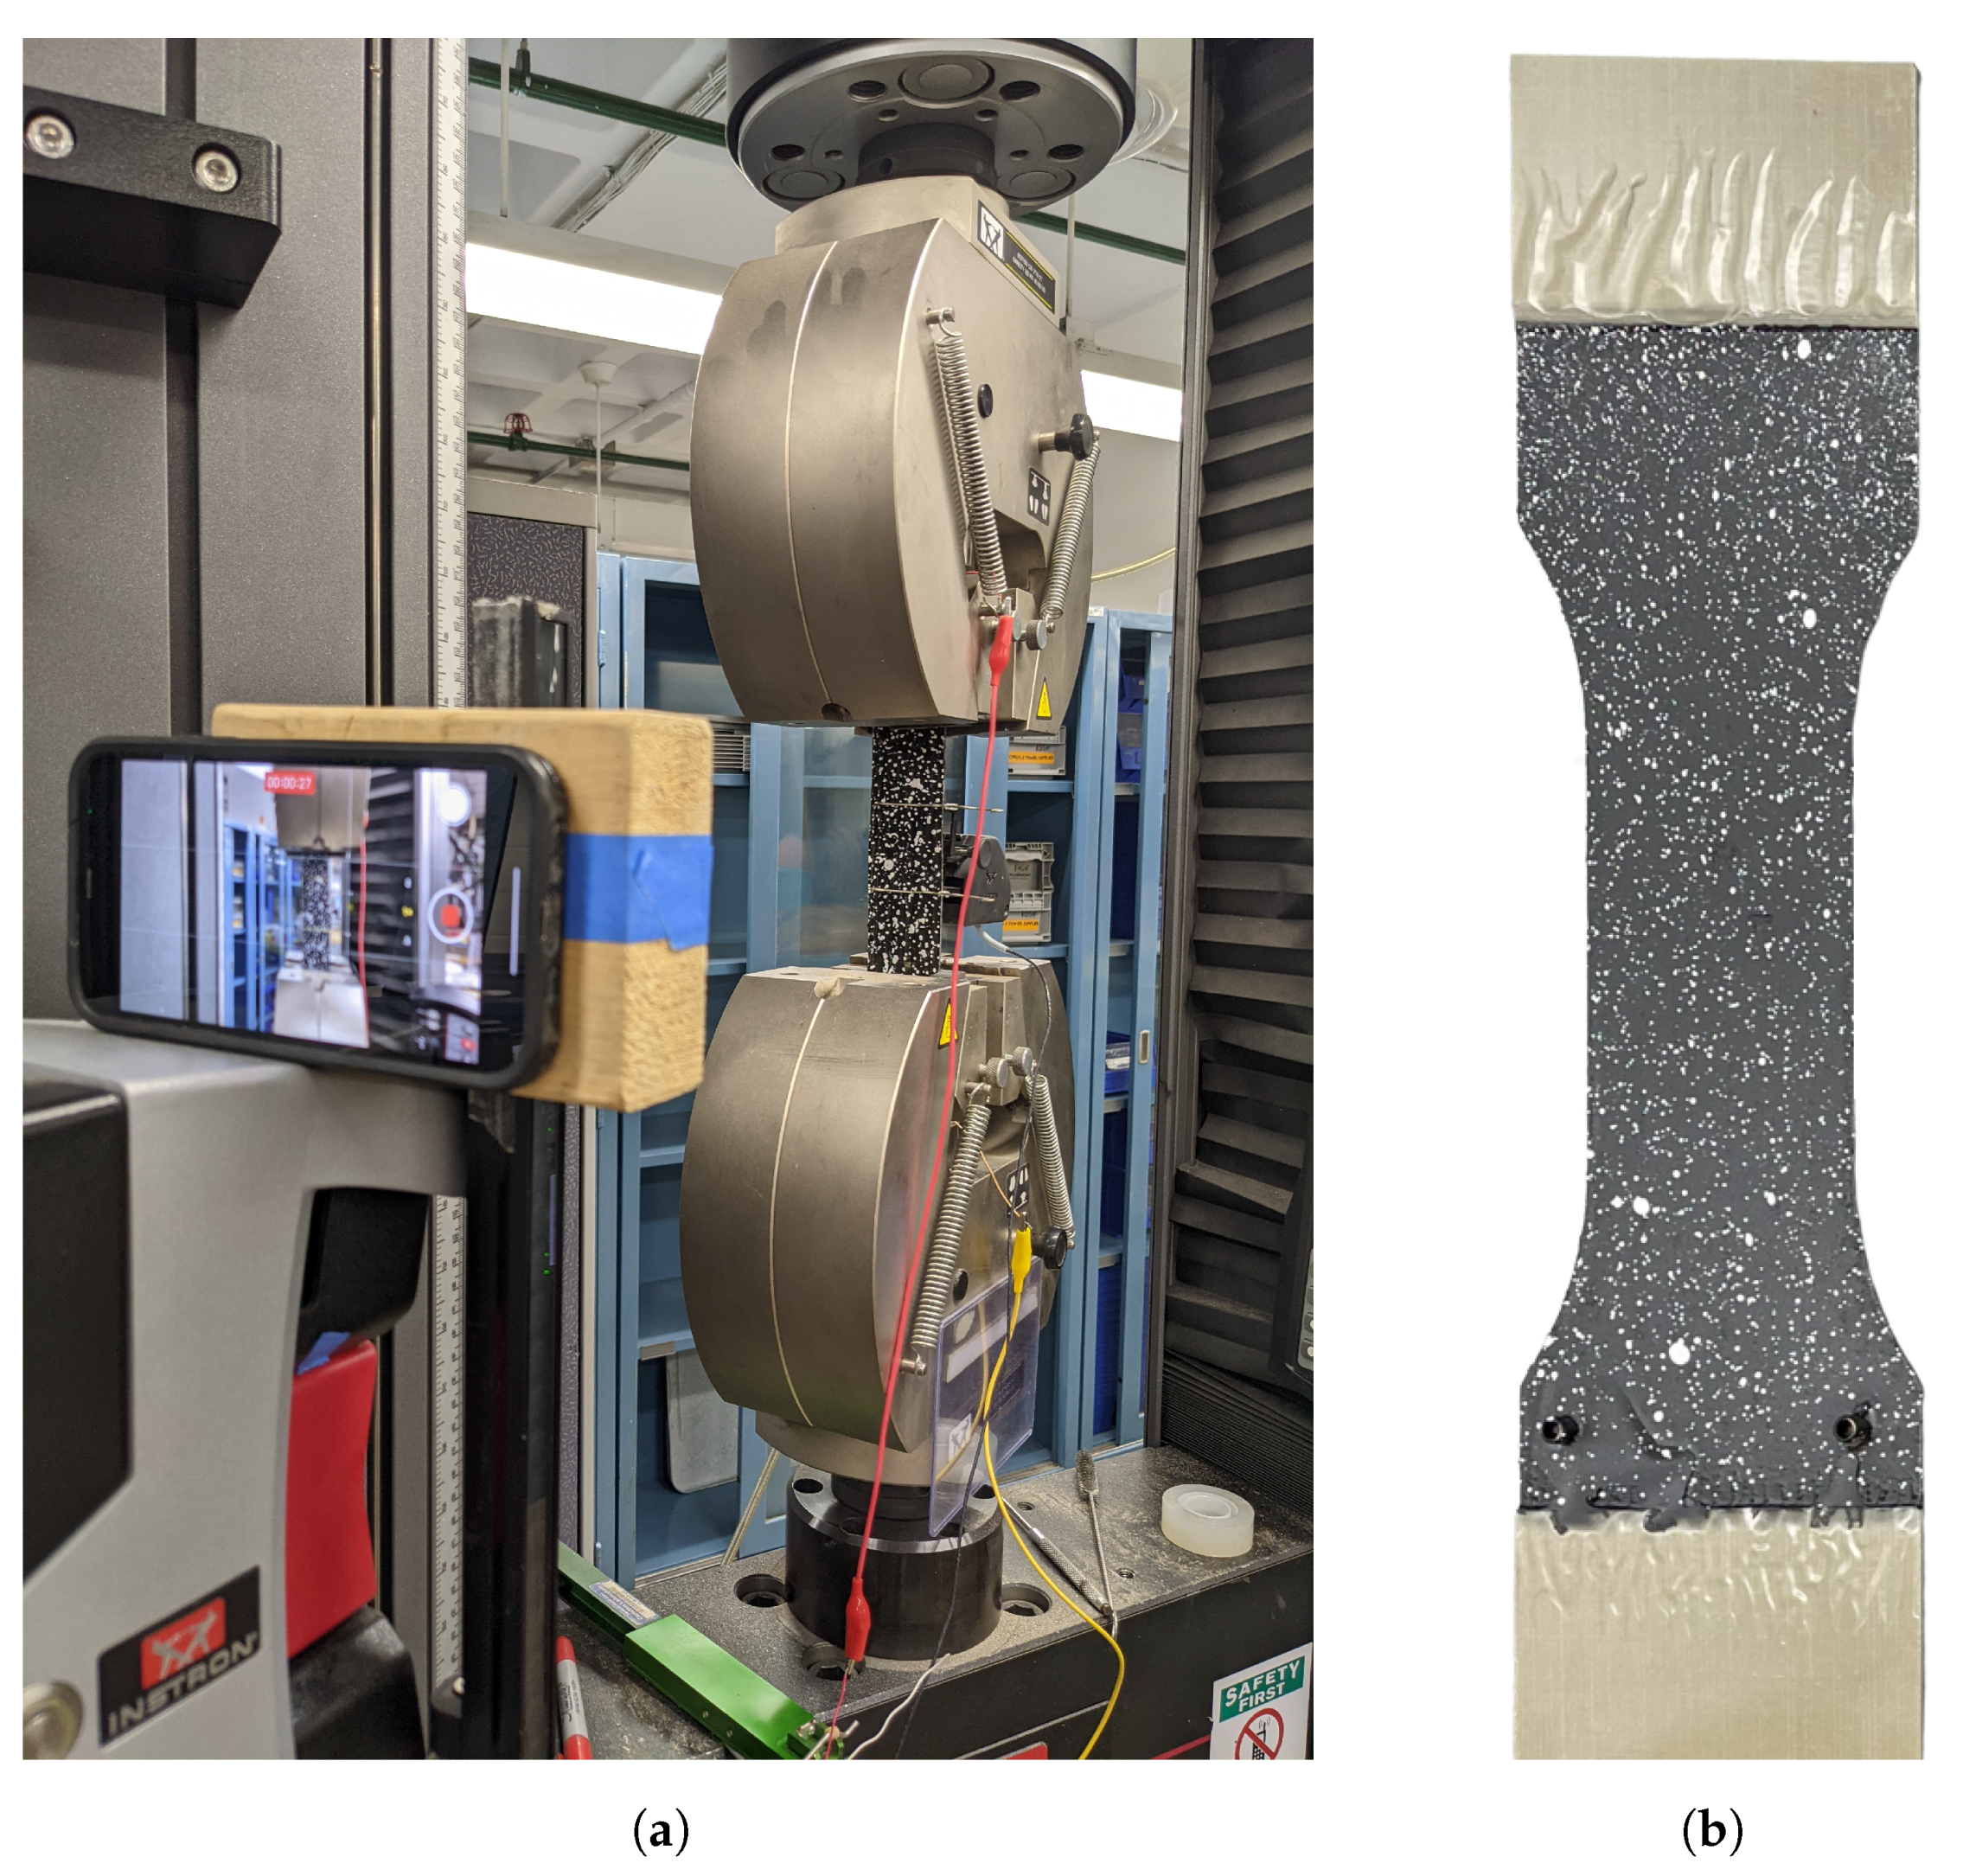
Figure 6a shows the overall tensile test setup. Strain data of the test specimen was measured using two methods for cross-validation: (i) a surface-mounted extensometer measurement approach; and (ii) a non-contact computer vision-based DIC measurement method. The first approach used an Instron 2630-114/452 static axial clip-on extensometer, as shown in Figure 6b. This is a type 1 extensometer with a 0.2” travel and 2.0” gauge length. An iPhone 12 Pro with 12 MP resolution, as shown in Figure 6a, was used to take videos, which were then DIC-processed to obtain a strain–time history at any specimen surface location or even an entire surface strain map. The strain data obtained by the extensometer were compared with those obtained from DIC.
Computer vision DIC is a non-contact optical-based technique that can produce a time history of a full-field 2D strain map. This is achieved by solving an optimization problem founded on a transport model such as optical flow, where the pattern is assumed to follow the deformation of the underlying test markers. DIC is an established method used in the literature, and its full description goes beyond the scope of this work; the reader is referred to [23,24] for a more detailed treatment of this technique. In this study, DICe, an open-source digital image correlation software, was used to compute full-field displacements and strains [25]. The following DICe processing settings were used: sssig threshold of 152, pixel subset of 31, pixel step size of 15, pixel gauge size of 45, and Gauss filter enabled with a 5-pixel window. The source code and documentation can be found in the publicly accessible repository on Github [26]. In general, a visual pattern with high contrast is beneficial in order to more accurately track the object’s surface displacement. Accordingly, a speckle pattern of white dots was spray-painted onto the black surface of the tensile specimens, as shown in Figure 6b. The specimens were placed in a down draft fume/paint hood with their surface oriented vertically and the paint nozzle was depressed from approximately 18 inches away.
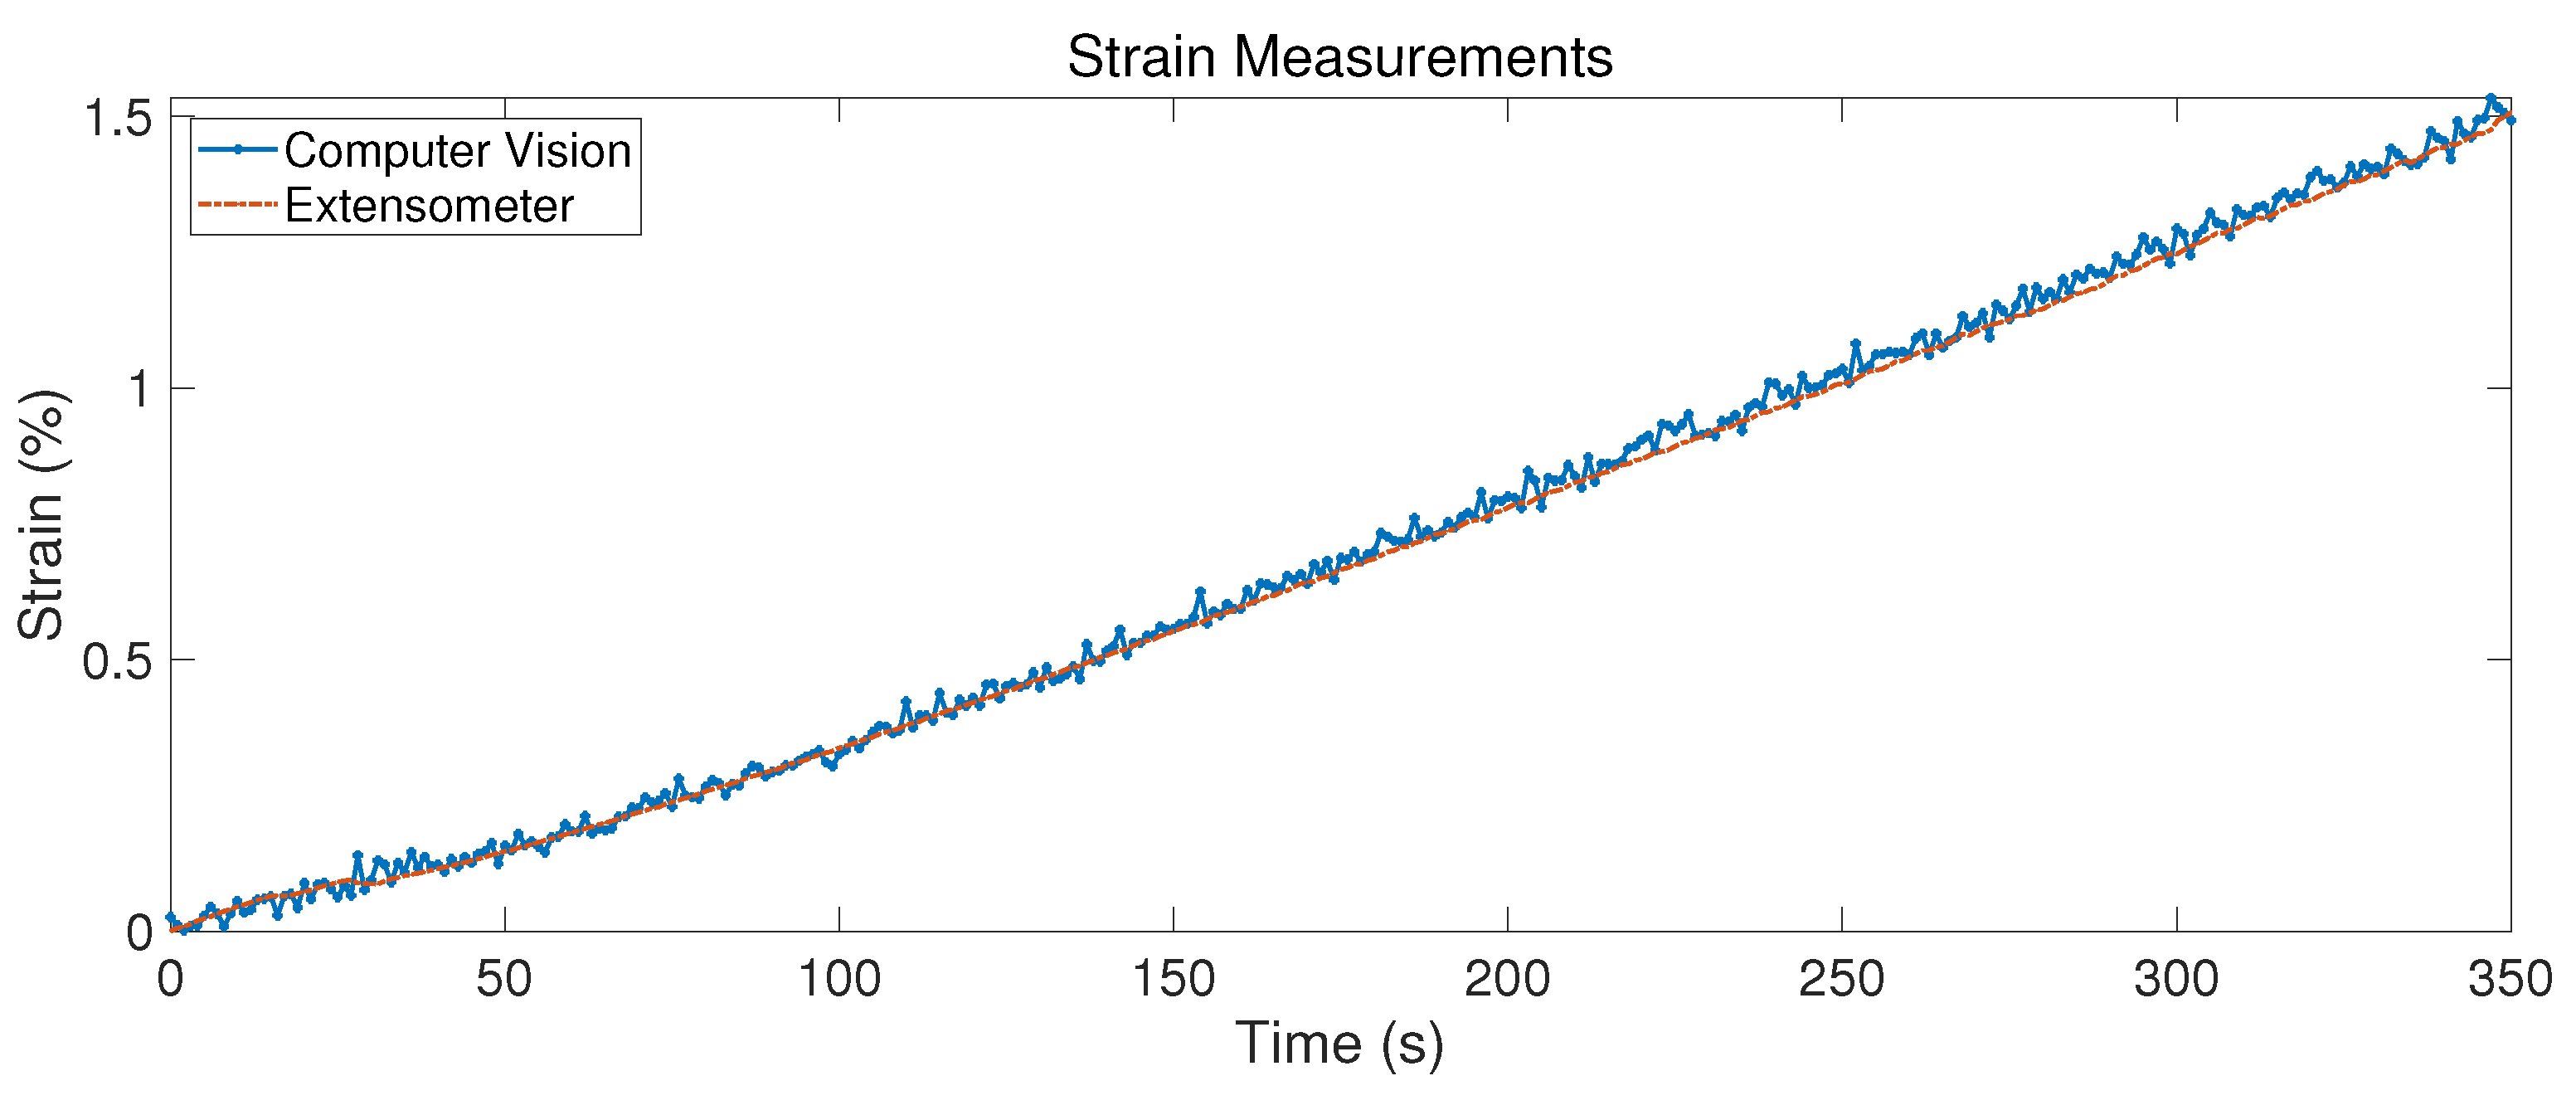
Figure 7 shows the strain measurement results obtained with the two approaches during one of the tensile tests. It was confirmed that they match well for all the tensile tests. Given the successful validation, the non-contact computer vision method is recommended for future tensile tests. All the test results presented below are based on the computer vision strain measurements.
4.3. Tensile Test Results
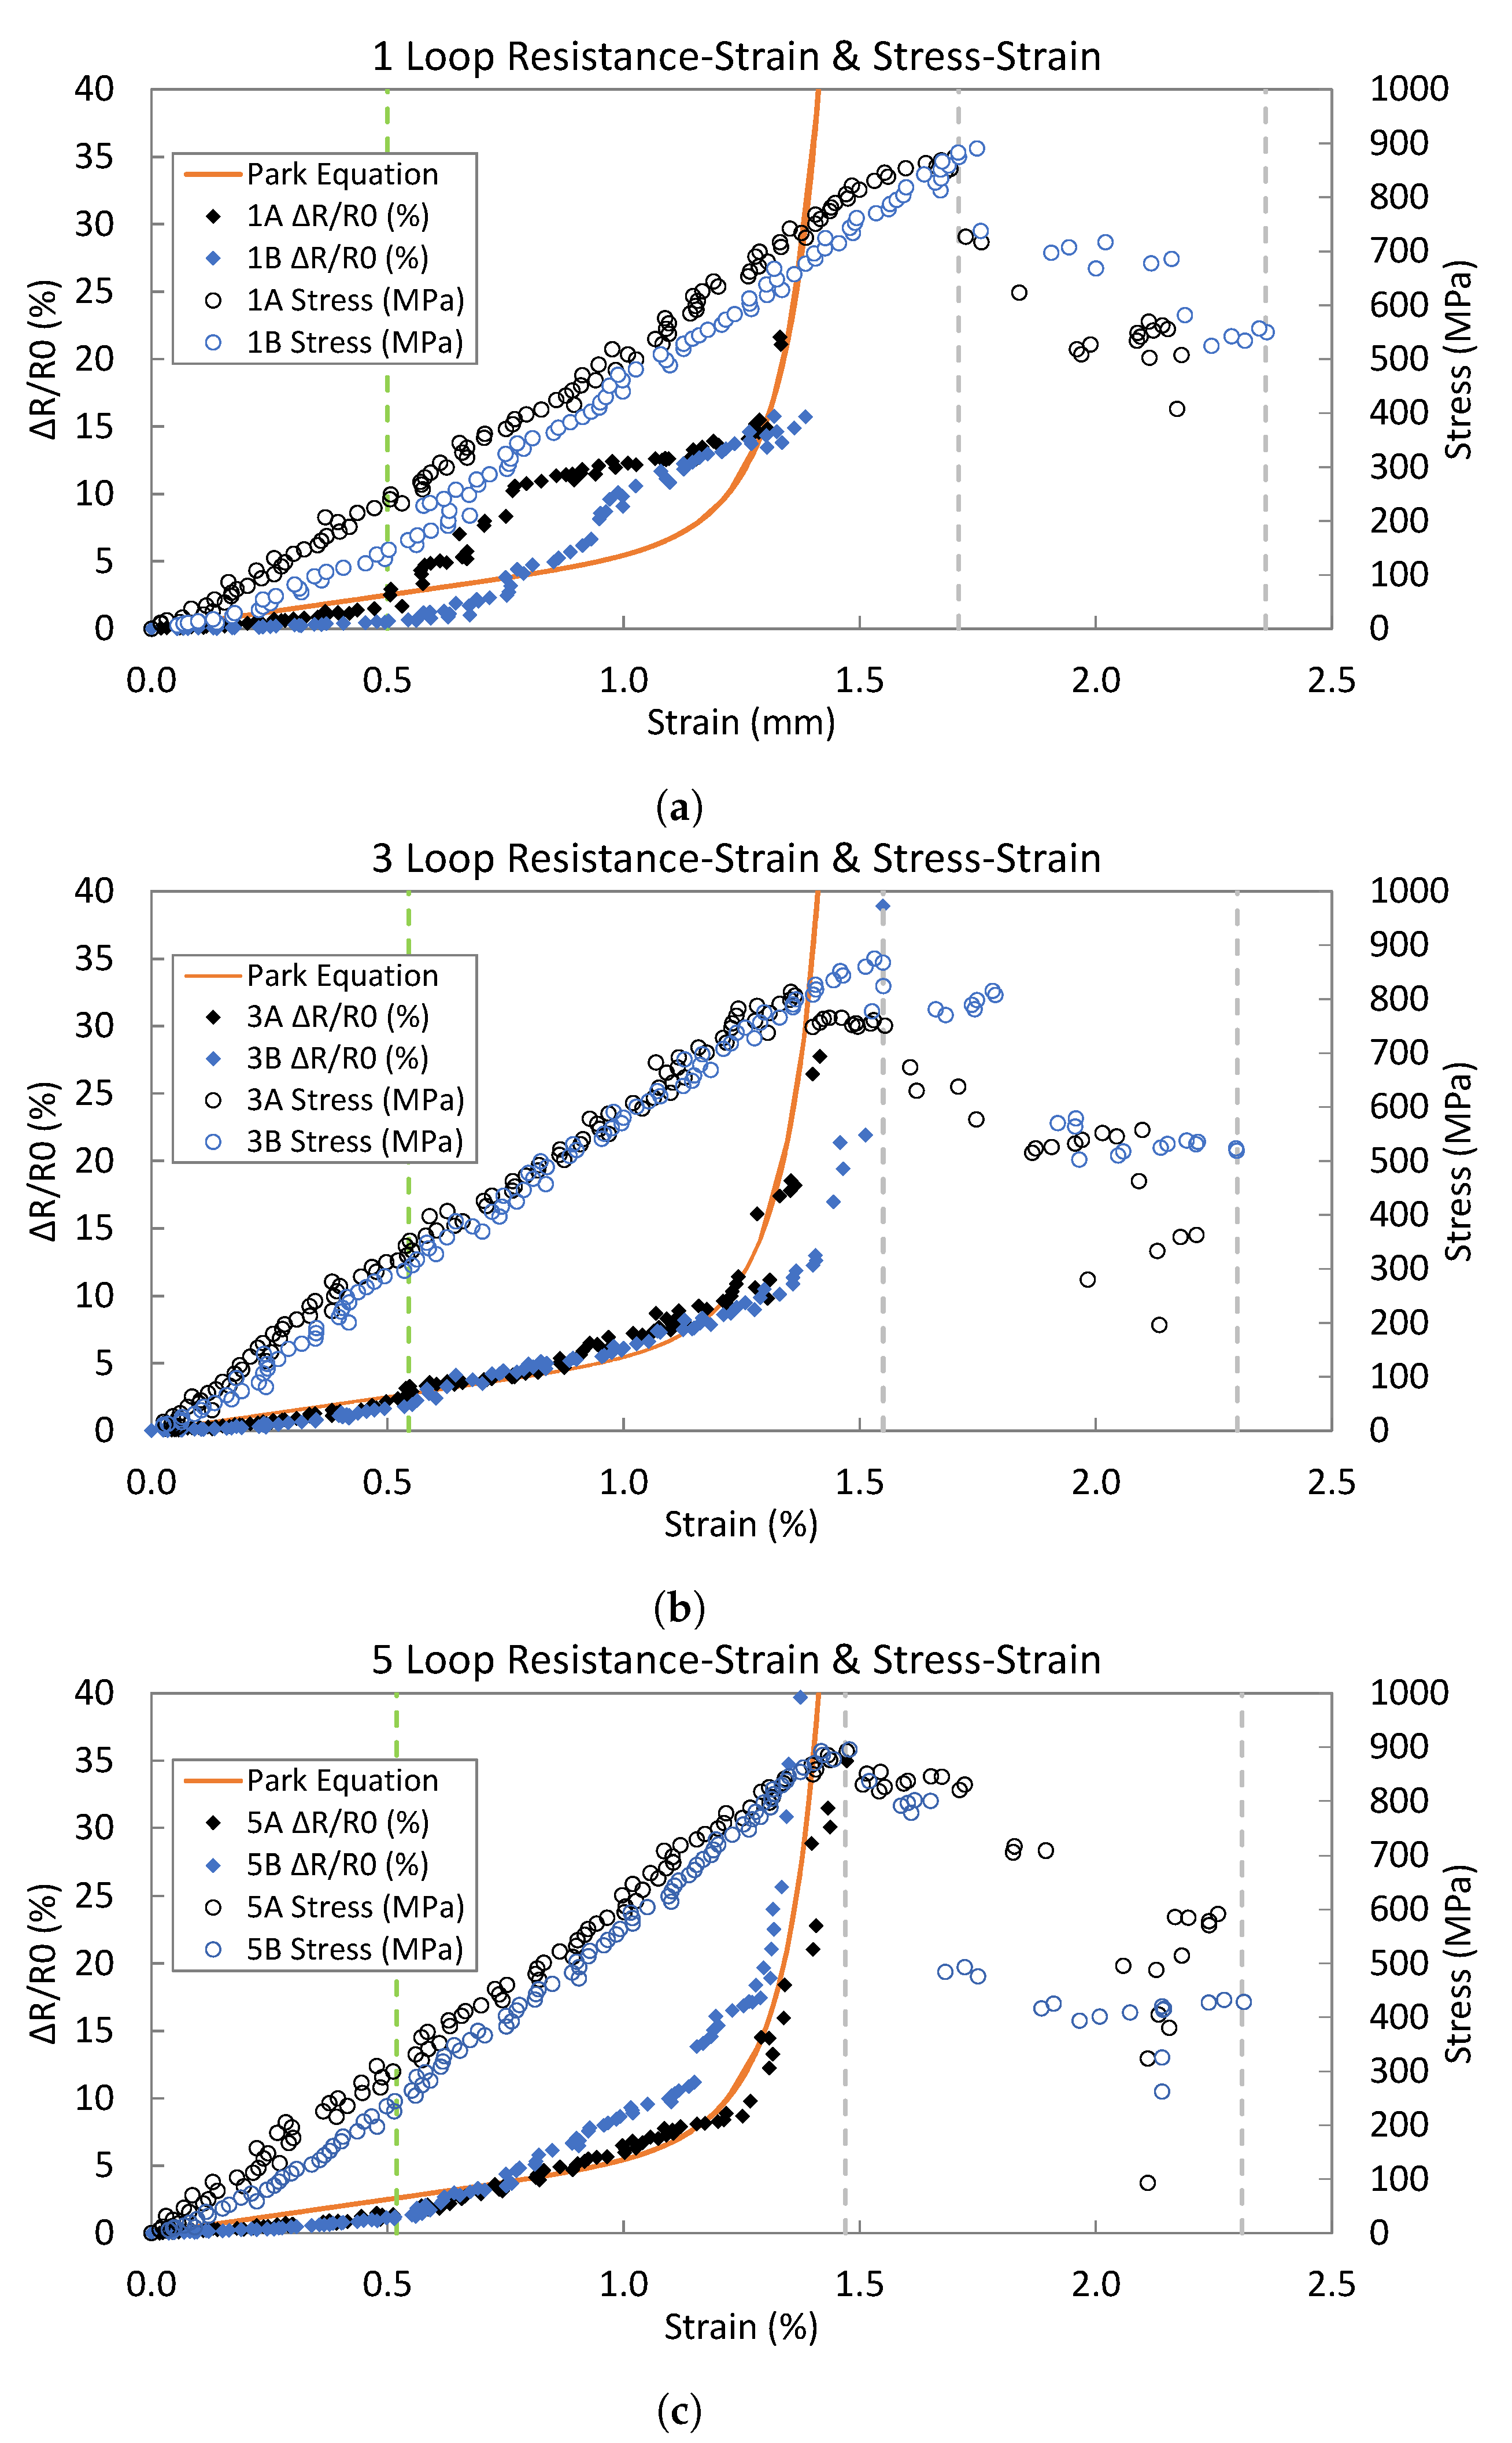
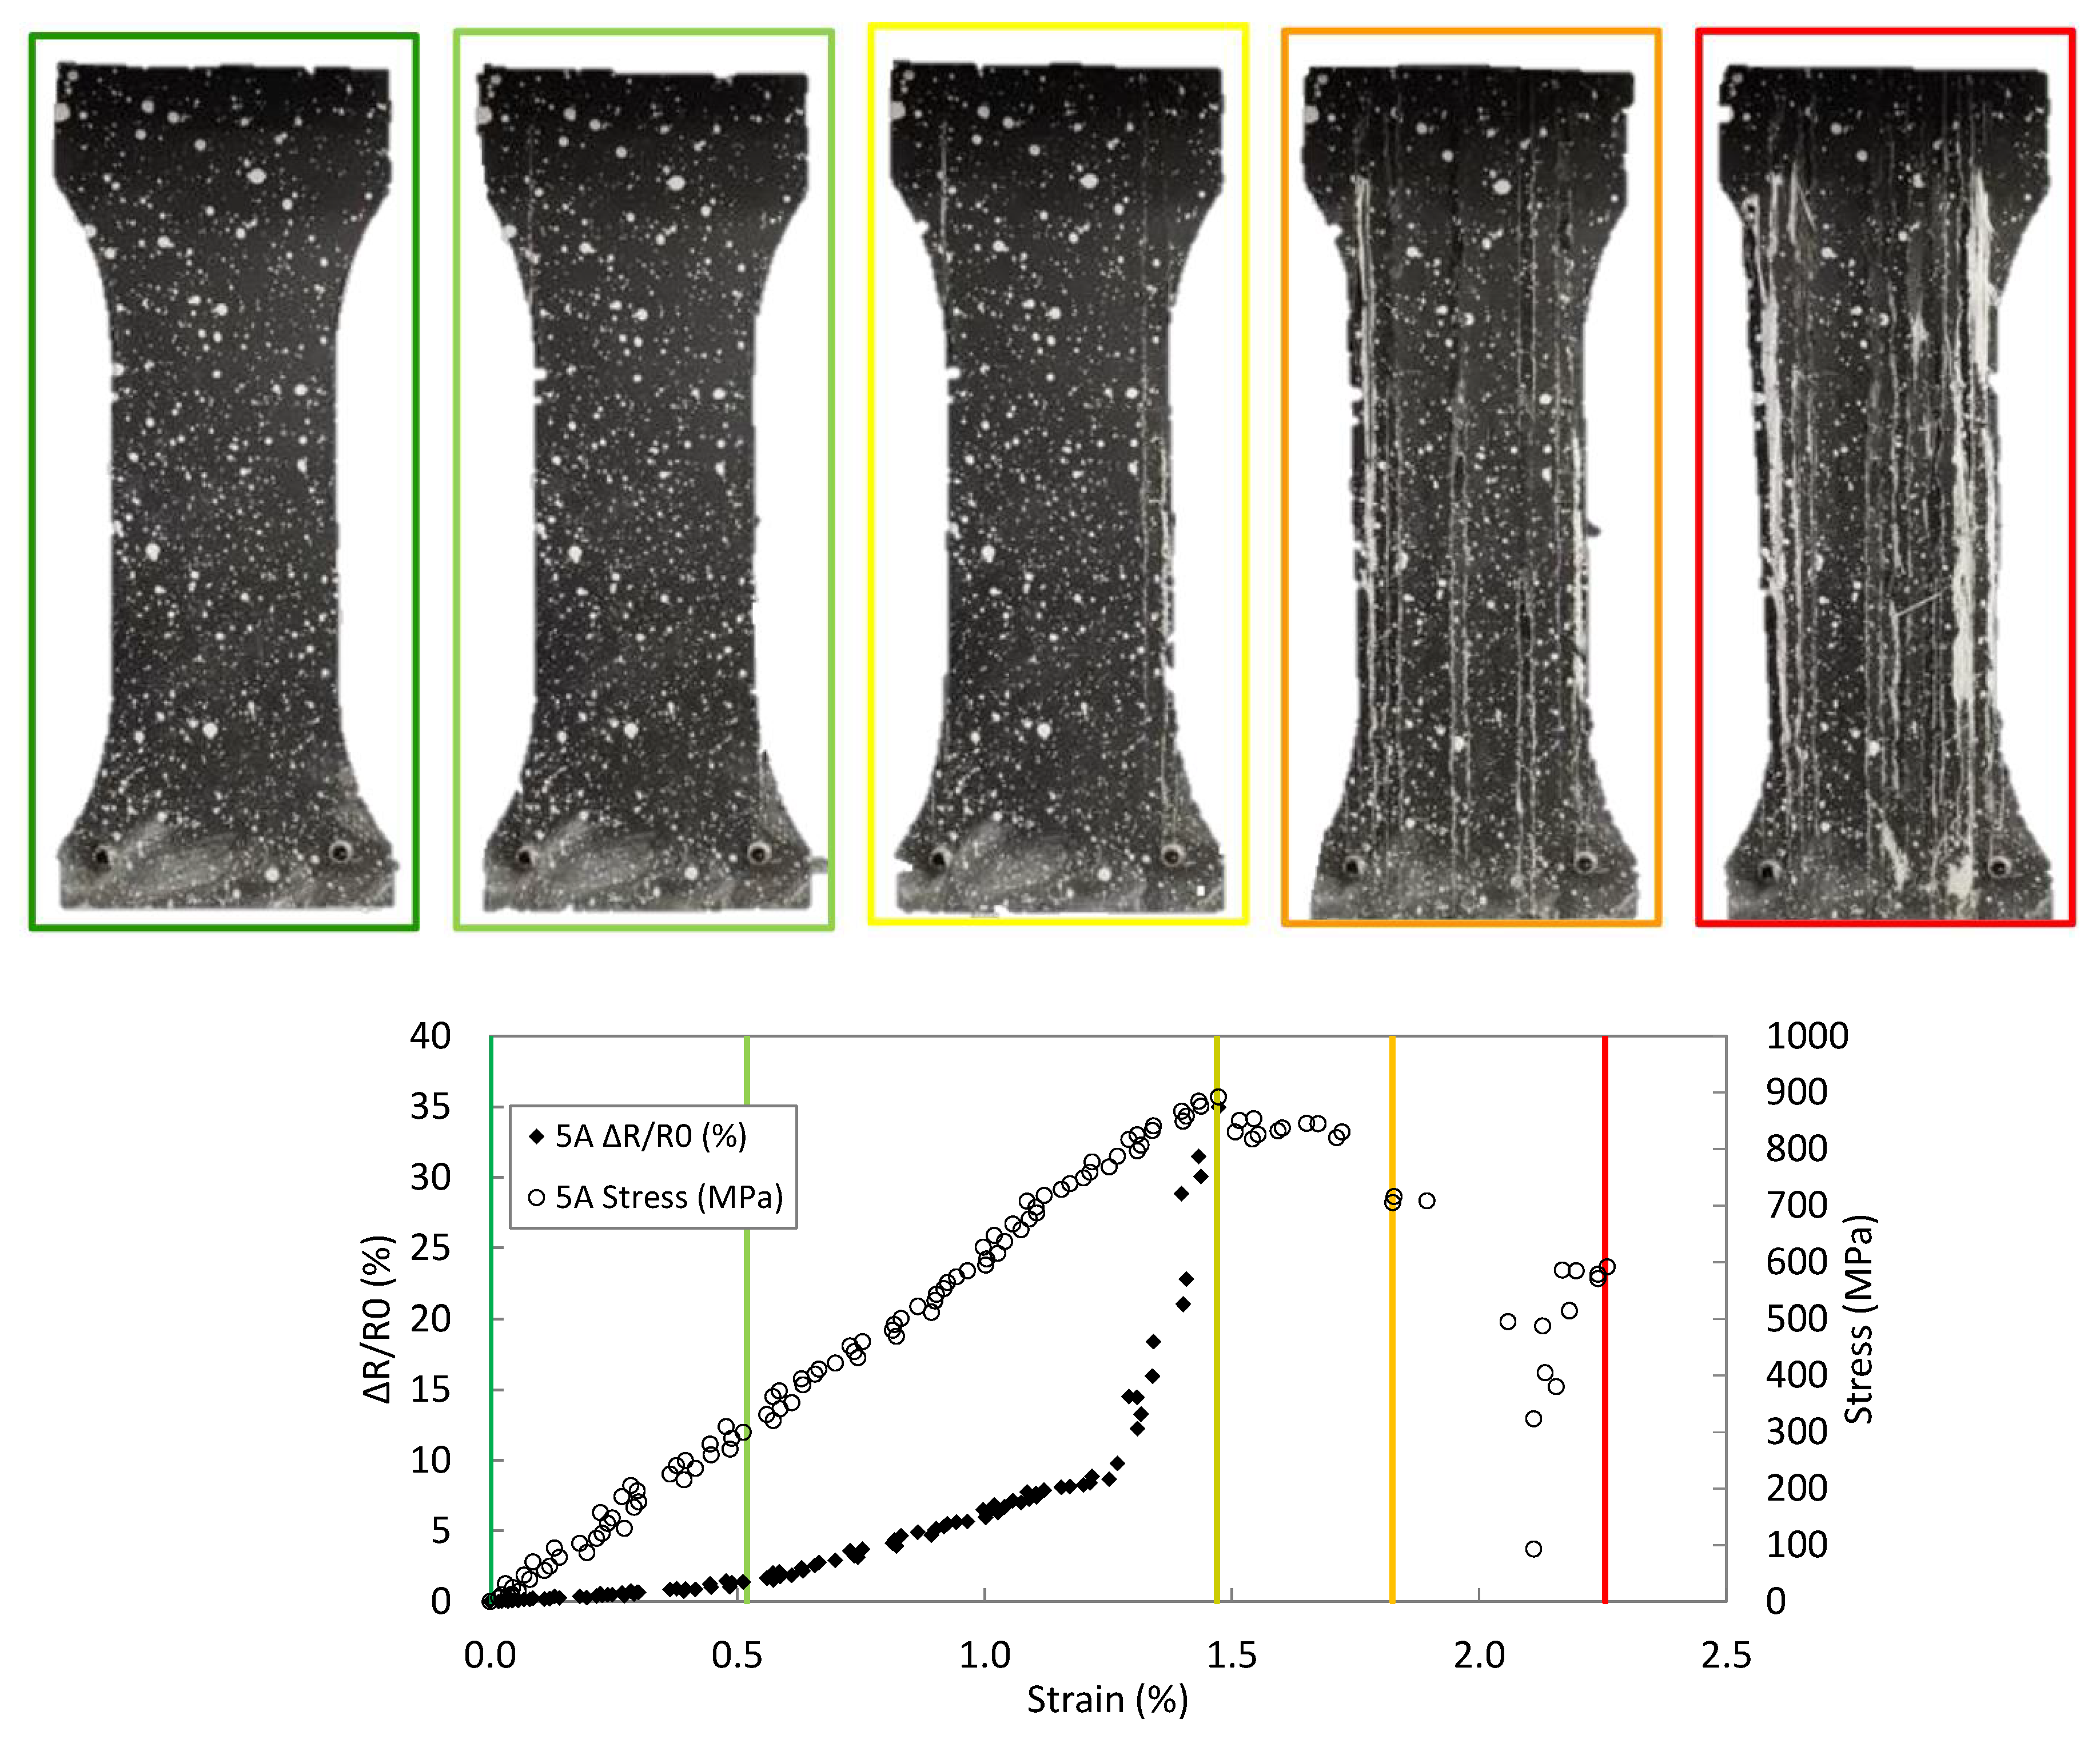
Figure 8 shows the tensile test results of the six tested specimens, grouped by the number of sensor tow loops. The stress data on the left vertical axis were derived from the applied load of the tensile test machine. Then, the resistance data on the right vertical axis refers to the normalized variation in the equivalent resistance measurements by the DMM. The resistance change is calculated as the percent change with respect to the initial resistance, which is measured for the unloaded state of the specimen.
From Figure 8, the tensile test specimen can be seen to exhibit a linear stress–strain relationship until the first failure initiation at approximately 900 MPa. During this loading, there were very limited signs of degradation from visual observation of the specimen. There were no warning signs before failure.
Despite the absence of warning signs during testing, the resistance characteristics of the carbon sensor tow did reveal signals for damage early warning. As shown in Figure 8b, the sensor resistance exhibited a linear relationship with the specimen strain up to a certain strain value—referred to as the linear–nonlinear transition strain and the corresponding sensor resistance /, abbreviated as . After the strain reaches , the sensor resistance drastically increased, ultimately approaching infinity when the specimen completely failed. Past research has observed a similar phenomenon, i.e., the two distinct phases—an initial linear resistance–strain phase followed by a nonlinear phase [3,26,27].
Furthermore, the results were compared to the analytical model presented by Park et al. [28]. The work was based on a DC circuit model and utilized the concept of electrical ineffective length, where damage causes fibers to no longer create electrical continuity. The equation was based on the global load sharing model and the probabilistic Weibull fiber strength distribution curve:
In the previous equation, is the applied strain, is the fiber electrical ineffective length, is the gauge length, is the fiber modulus, is the Weibull scale parameter, m is the Weibull shape parameter, and is the proportionality constant. Park et al., found the optimal value to be 5 mm, which was also used in this work. The 3k sensor tow was composed of Toray T700 carbon fiber, with Weibull parameters and m of 2.70 GPa and 9.03, respectively, as found empirically in literature [29]. The proportionality constant can be found using the aforementioned linear–nonlinear transition parameters and .
The / data for each of the six specimens were analyzed using a cost-minimization function [30] to determine the LNLT points, which is reported in Table 2. The LNLT values were then used to plot and compare the DC parallel circuit model equation developed by Park et al. to the results found here. The model provides a good approximation for the nonlinear regression but does not accurately capture the initial stages of loading.
The resistance–strain data in conjunction with Park’s model highlight important differences between the 1-loop, 3-loop, and 5-loop specimens; the root-mean-square errors were found to be 4.91, 3.18, and 1.63, respectively. Thus, similar to a foil strain gauge, it appears that a greater number of loops provides increased sensor accuracy.
Additional mechanical properties obtained from the tensile tests are summarized in Table 2, where, for example, specimen 1A has a 1-loop sensor tow and specimen 3A consists of a 3-loop sensor tow. Slight variations in Young’s modulus occur between the specimens; 5-loop specimens are the stiffest due to the increase in carbon fiber volume, while the 1-loop specimens are the most compliant. Specimen 3A appears to have some inconsistencies in fabrication, resulting in lower E and values than expected. Additionally, were nearly identical for all specimens. An interesting linear relationship between and Young’s modulus can be observed, with a correlation coefficient of 0.94 among all samples.
4.4. Damage Early Warning
The tensile test results in Figure 8 demonstrate a potential for using the linear–nonlinear transition value of resistance as a threshold for early warning of composite damage. A variety of work has been performed to characterize the stochastic failure mechanism, including experimental work based on mesoscale (tow level) fatigue strength [31] and microscale (filament level) probabilistic failure [32]. On the mesoscale level, this phenomenon has a direct effect on the overall electrical resistance of a carbon fiber tow. Once a filament is broken, the most optimal continuous electrical path is discontinued, which increases the overall measured sensor resistance. Li et al. built upon the DC circuit model to track the continuity between failing filaments within a tow [33], which was later expanded upon by Kalashnyk et al. [14].
Returning to the tensile tests reported here, when the load surpassed the linear–nonlinear transition strain () and resistance (), the sensor and the composite both underwent permanent damage. This damage resulted from individual filaments rupturing, which were imperceptible to the observer before the composite failure initiated and audible breakage was heard. The evolution of damage is highlighted in Figure 9, where still-frames from the tensile test are shown. Therefore, by tracking the resistance of the sensor tow, a direct assessment of the composite health can be made. And importantly, because the sensor tow is composed of identical carbon fiber as the base structural composite fabric, damage occurring in the composite structure is accurately reflected in the carbon fiber sensor tow. In other words, the sensor tow’s electrical resistance can be used as a reliable indicator of the overall composite health condition.
Furthermore, the tensile tests of the SDDM hybrid composite showed two distinct loading peaks, highlighting the predominant failure mechanism of hybrid composites. In Figure 9, the load increases to the highest value of 900 MPa, after which the carbon fiber tows were observed to fracture. Throughout this sequence, the glass fiber remains intact and, therefore, after the carbon fiber fails the glass fiber becomes the primary load-carrying component due to its higher ultimate strain capacity. Afterward, the displacement-controlled loading continues, and increasing strain is applied to the specimen. The stiffest and highest-strength carbon fiber elements have now failed, and consequently, the stress decreases as the weaker glass fibers carry the load. The composite ultimately fails when the glass fiber’s strength is overcome. Compared to the immediate failure of CFRP composites, hybrid composites behave very differently. This two-peak mechanism is why the carbon fiber sensor tow demonstrates potential to serve as damage early warning for composite failure: the sensor detects strain throughout the microdamage loading phase, and can serve as a pass–fail mechanism with the resistance approaching infinity once irreversible damage occurs at the loading peak.
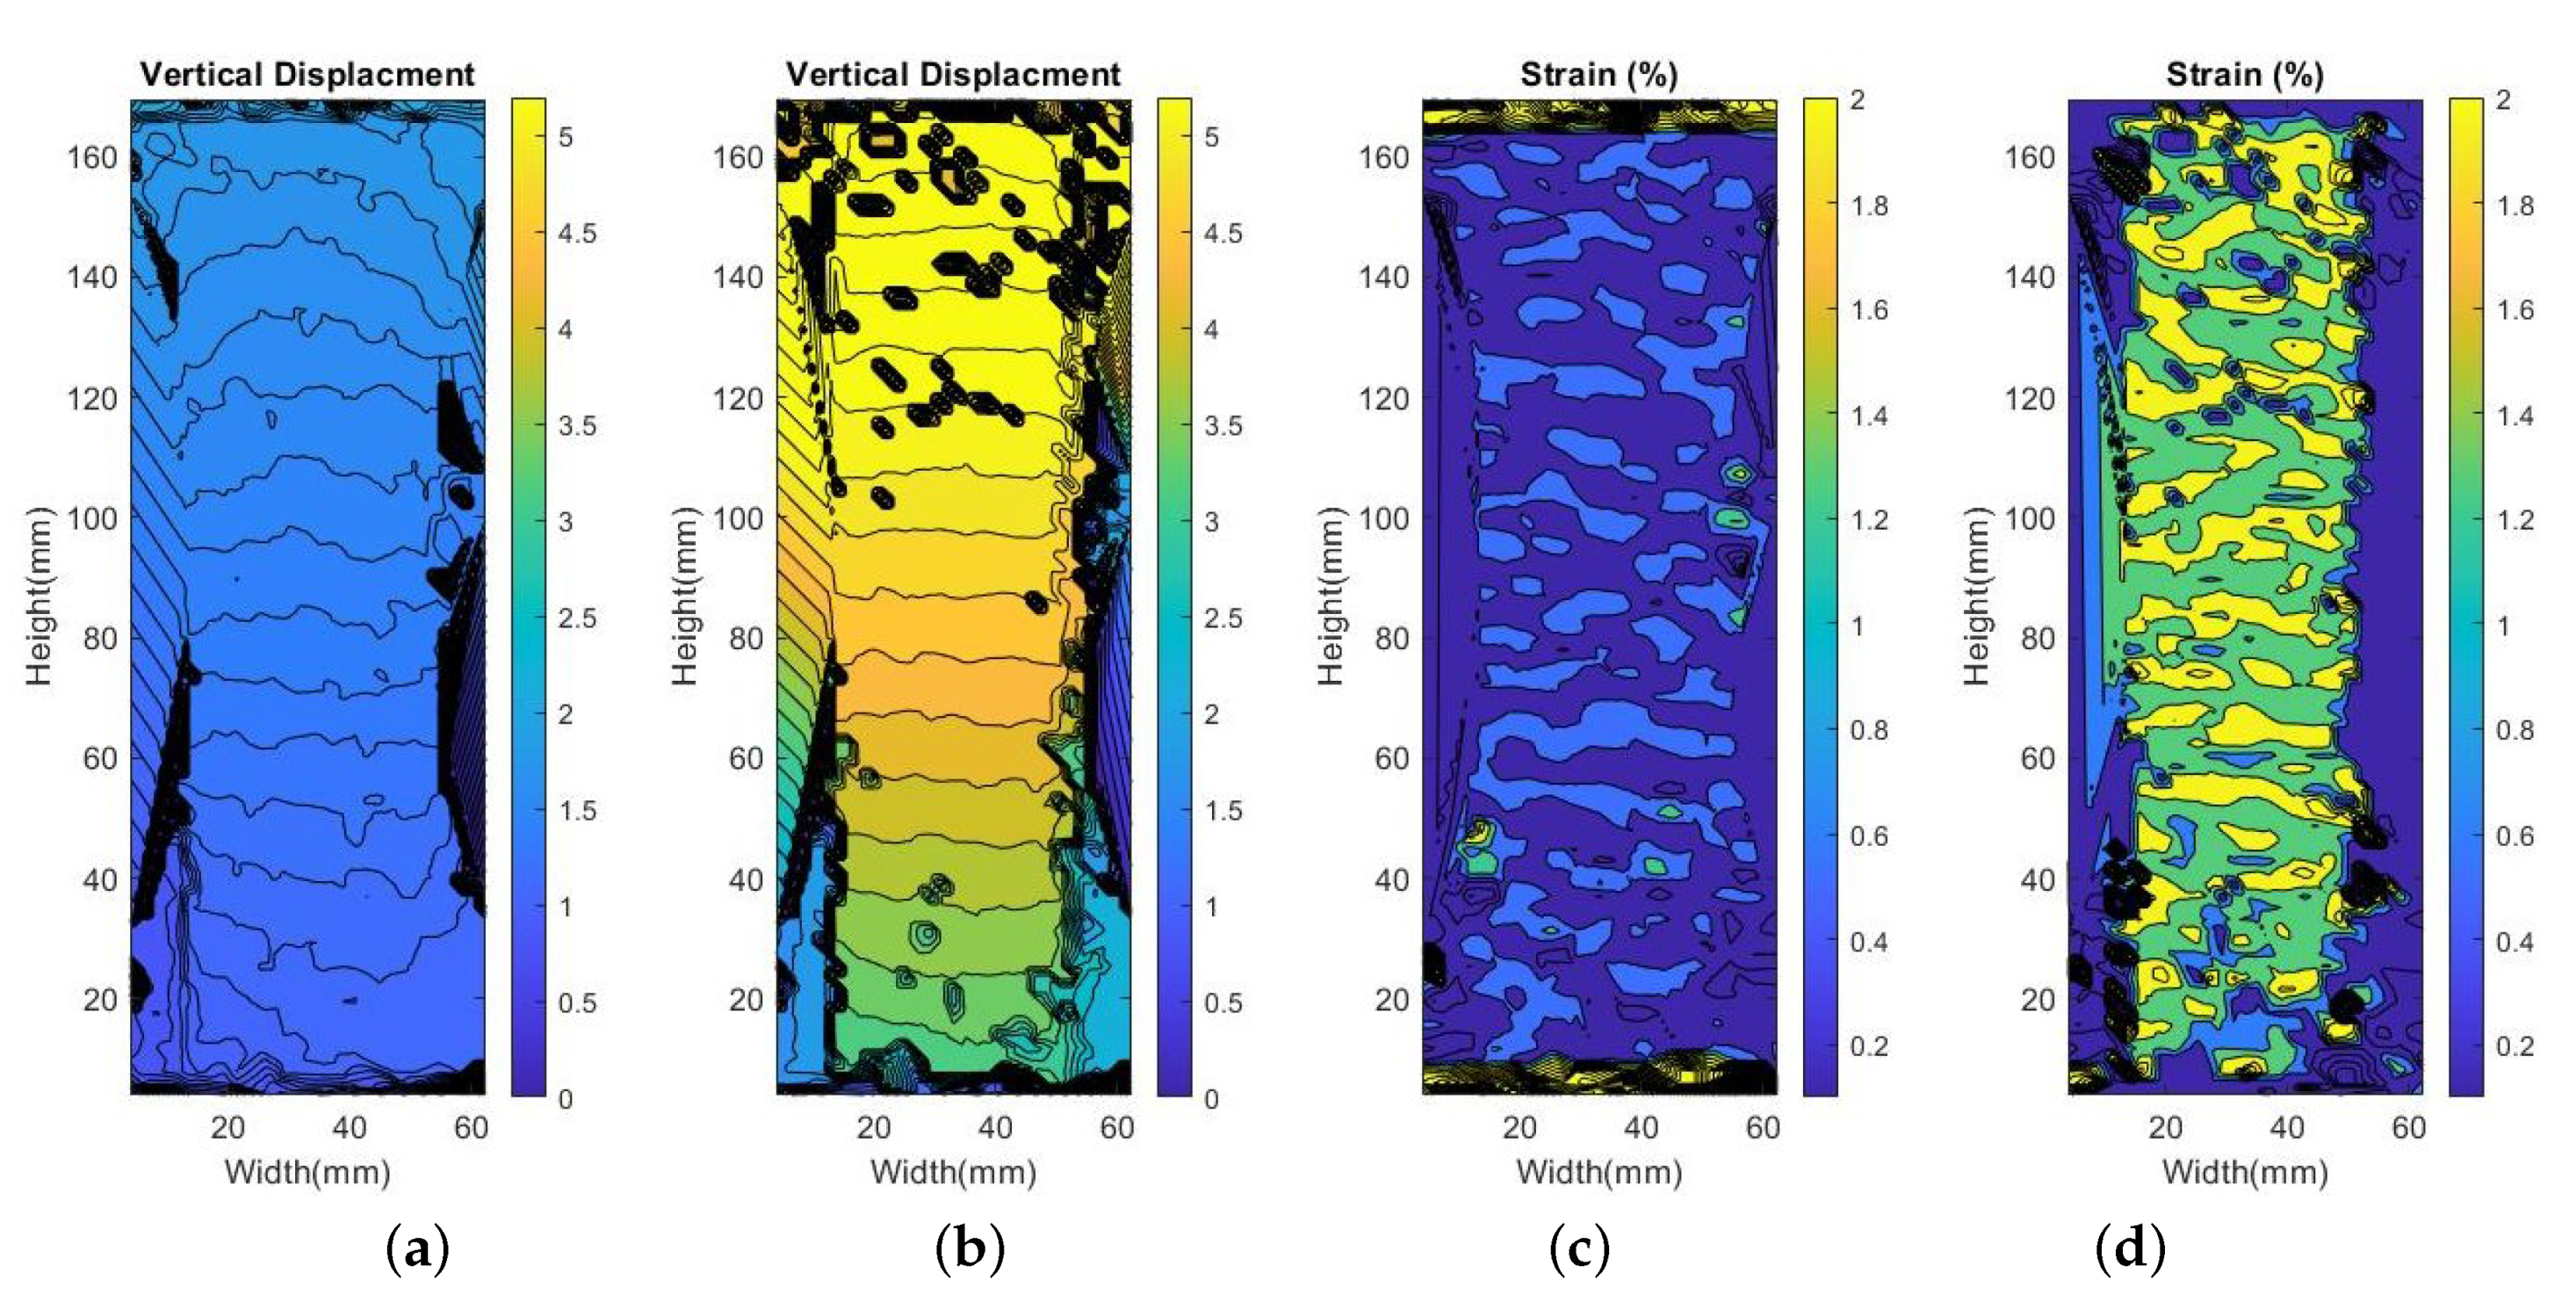
In addition, the light green and yellow time instances displayed in Figure 9 are expanded on in Figure 10 by showing the computer vision displacement and strain results: the light green instance occurs at 200 s as the strain reaches the transition value (Figure 10a,c), and the yellow instance occurs at 350 s right before the first loading peak (Figure 10b,d). From Figure 10a,b it is possible to observe the increasing displacement of the specimen’s bottom section, which reaches about 5 mm before failure. The corresponding strain maps in Figure 10c,d show a consistent strain field along the specimen, with strain values remaining small around 0.5% at the composite’s and then approaching 1.5–2% at the first loading peak where the carbon fiber fails and the glass fiber takes over.
5. Progressive Impact Testing to Demonstrate Sensor Damage Memory
As revealed in the tensile tests, when the specimen strain increased to the linear–nonlinear transition value, some sensing carbon fiber filaments started to break, resulting in a drastic increase in the overall resistance, which is non-reversible and permanent. To further investigate this phenomenon and potentially use the permanent increase in resistance for damage memory, impact tests were designed and conducted in this study, in which the impact load was progressively increased.
As shown previously, the carbon fiber tow sensor resistance has a permanent, nonlinear response to increasing tensile loads. This behavior can be utilized to determine the health of a monitored part. For example, a baseline sensor resistance measurement is taken when the composite is known to be unloaded (similarly, an advanced continuous monitoring campaign can evaluate many data points to determine an average, standard deviation, etc.). Then, resistance is tracked as the part undergoes loading. After loading is complete, the resistance is compared to the baseline case, and if they are the same, then it is known that no fibers within the sensor have broken. Each continuous electrical fiber path remains unchanged, and the overall tow resistance also stays the same. In this case, no damage has occurred to the part. The applied stress was maintained below the observed in the tensile testing program. Conversely, if there was a permanent increase in resistance, then it is assumed that a breakage happened in the sensor tow’s fibers. The applied stress surpassed the LNLT. And importantly, because the sensor tow fibers have nearly identical mechanical properties to the structural carbon fibers of the part, it is then known that irreversible damage has occurred in the entire composite. This must be distinguished from recoverable elastic strain.
5.1. Progressive Impact Test Setup
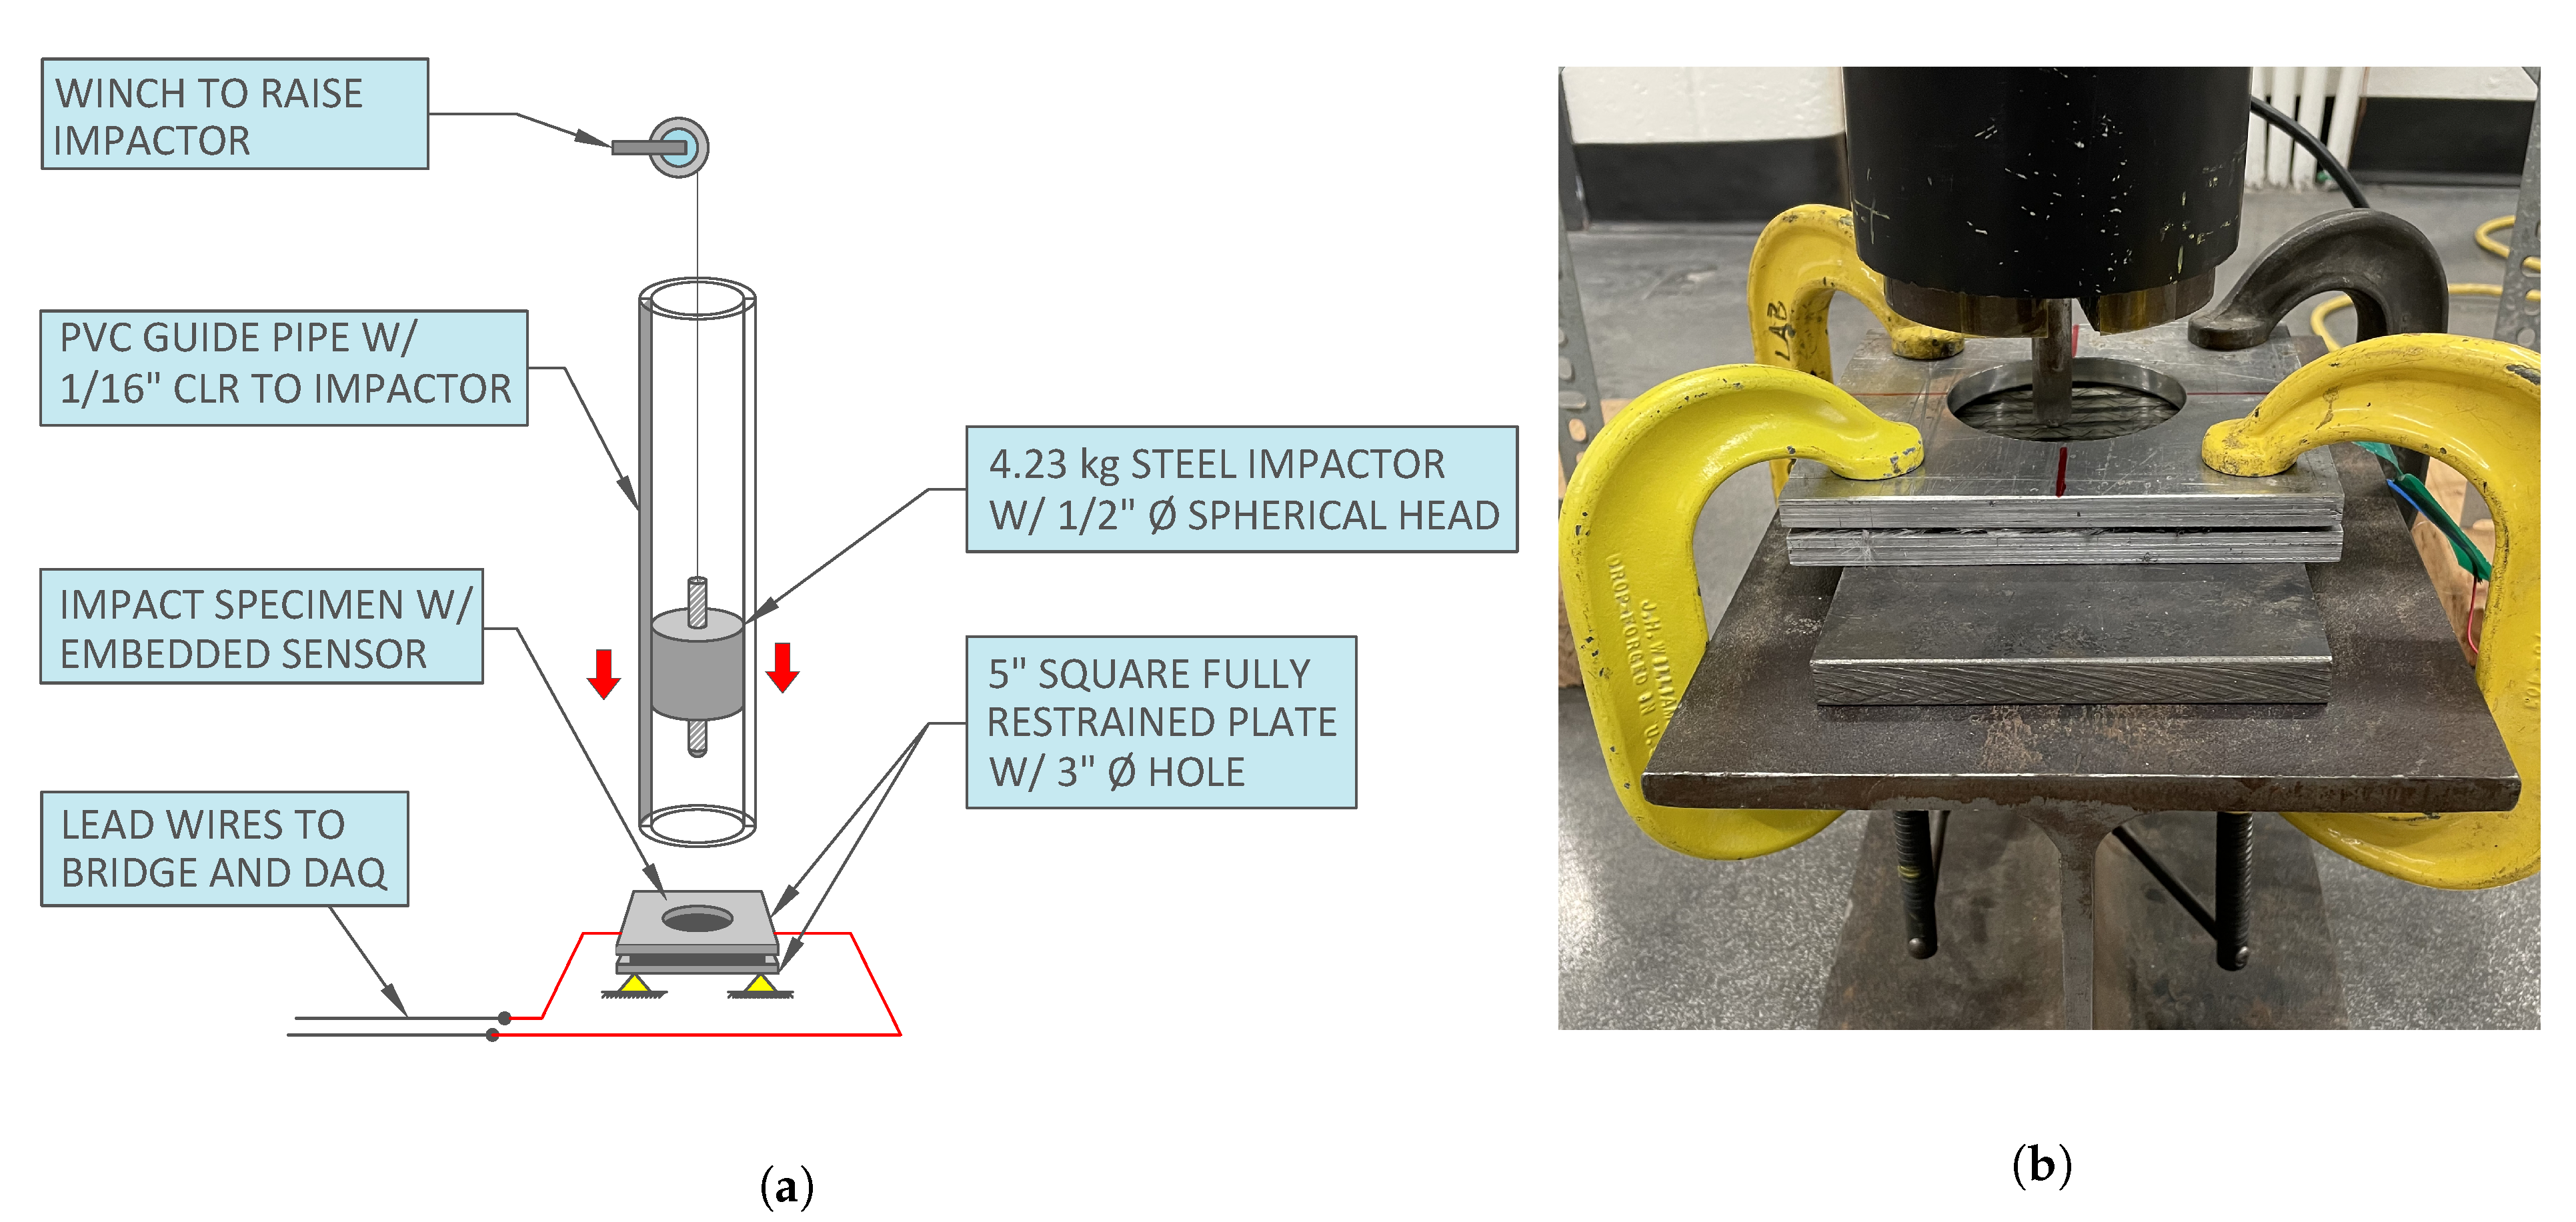
When selecting the appropriate test method to demonstrate the sensor’s ability to track cumulative damage, it is important to acknowledge that there are multiple ways to apply loads to cause damage. In the present study, an impact load test was selected, and the testing machine was custom-built, involving a free-fall weight (impactor). The overall setup is illustrated in Figure 11. The 4.23 kg steel impactor with a 1/2” spherical head was released from a designed height, generating an impact load on the test specimen that is fully restrained at its circular edge.
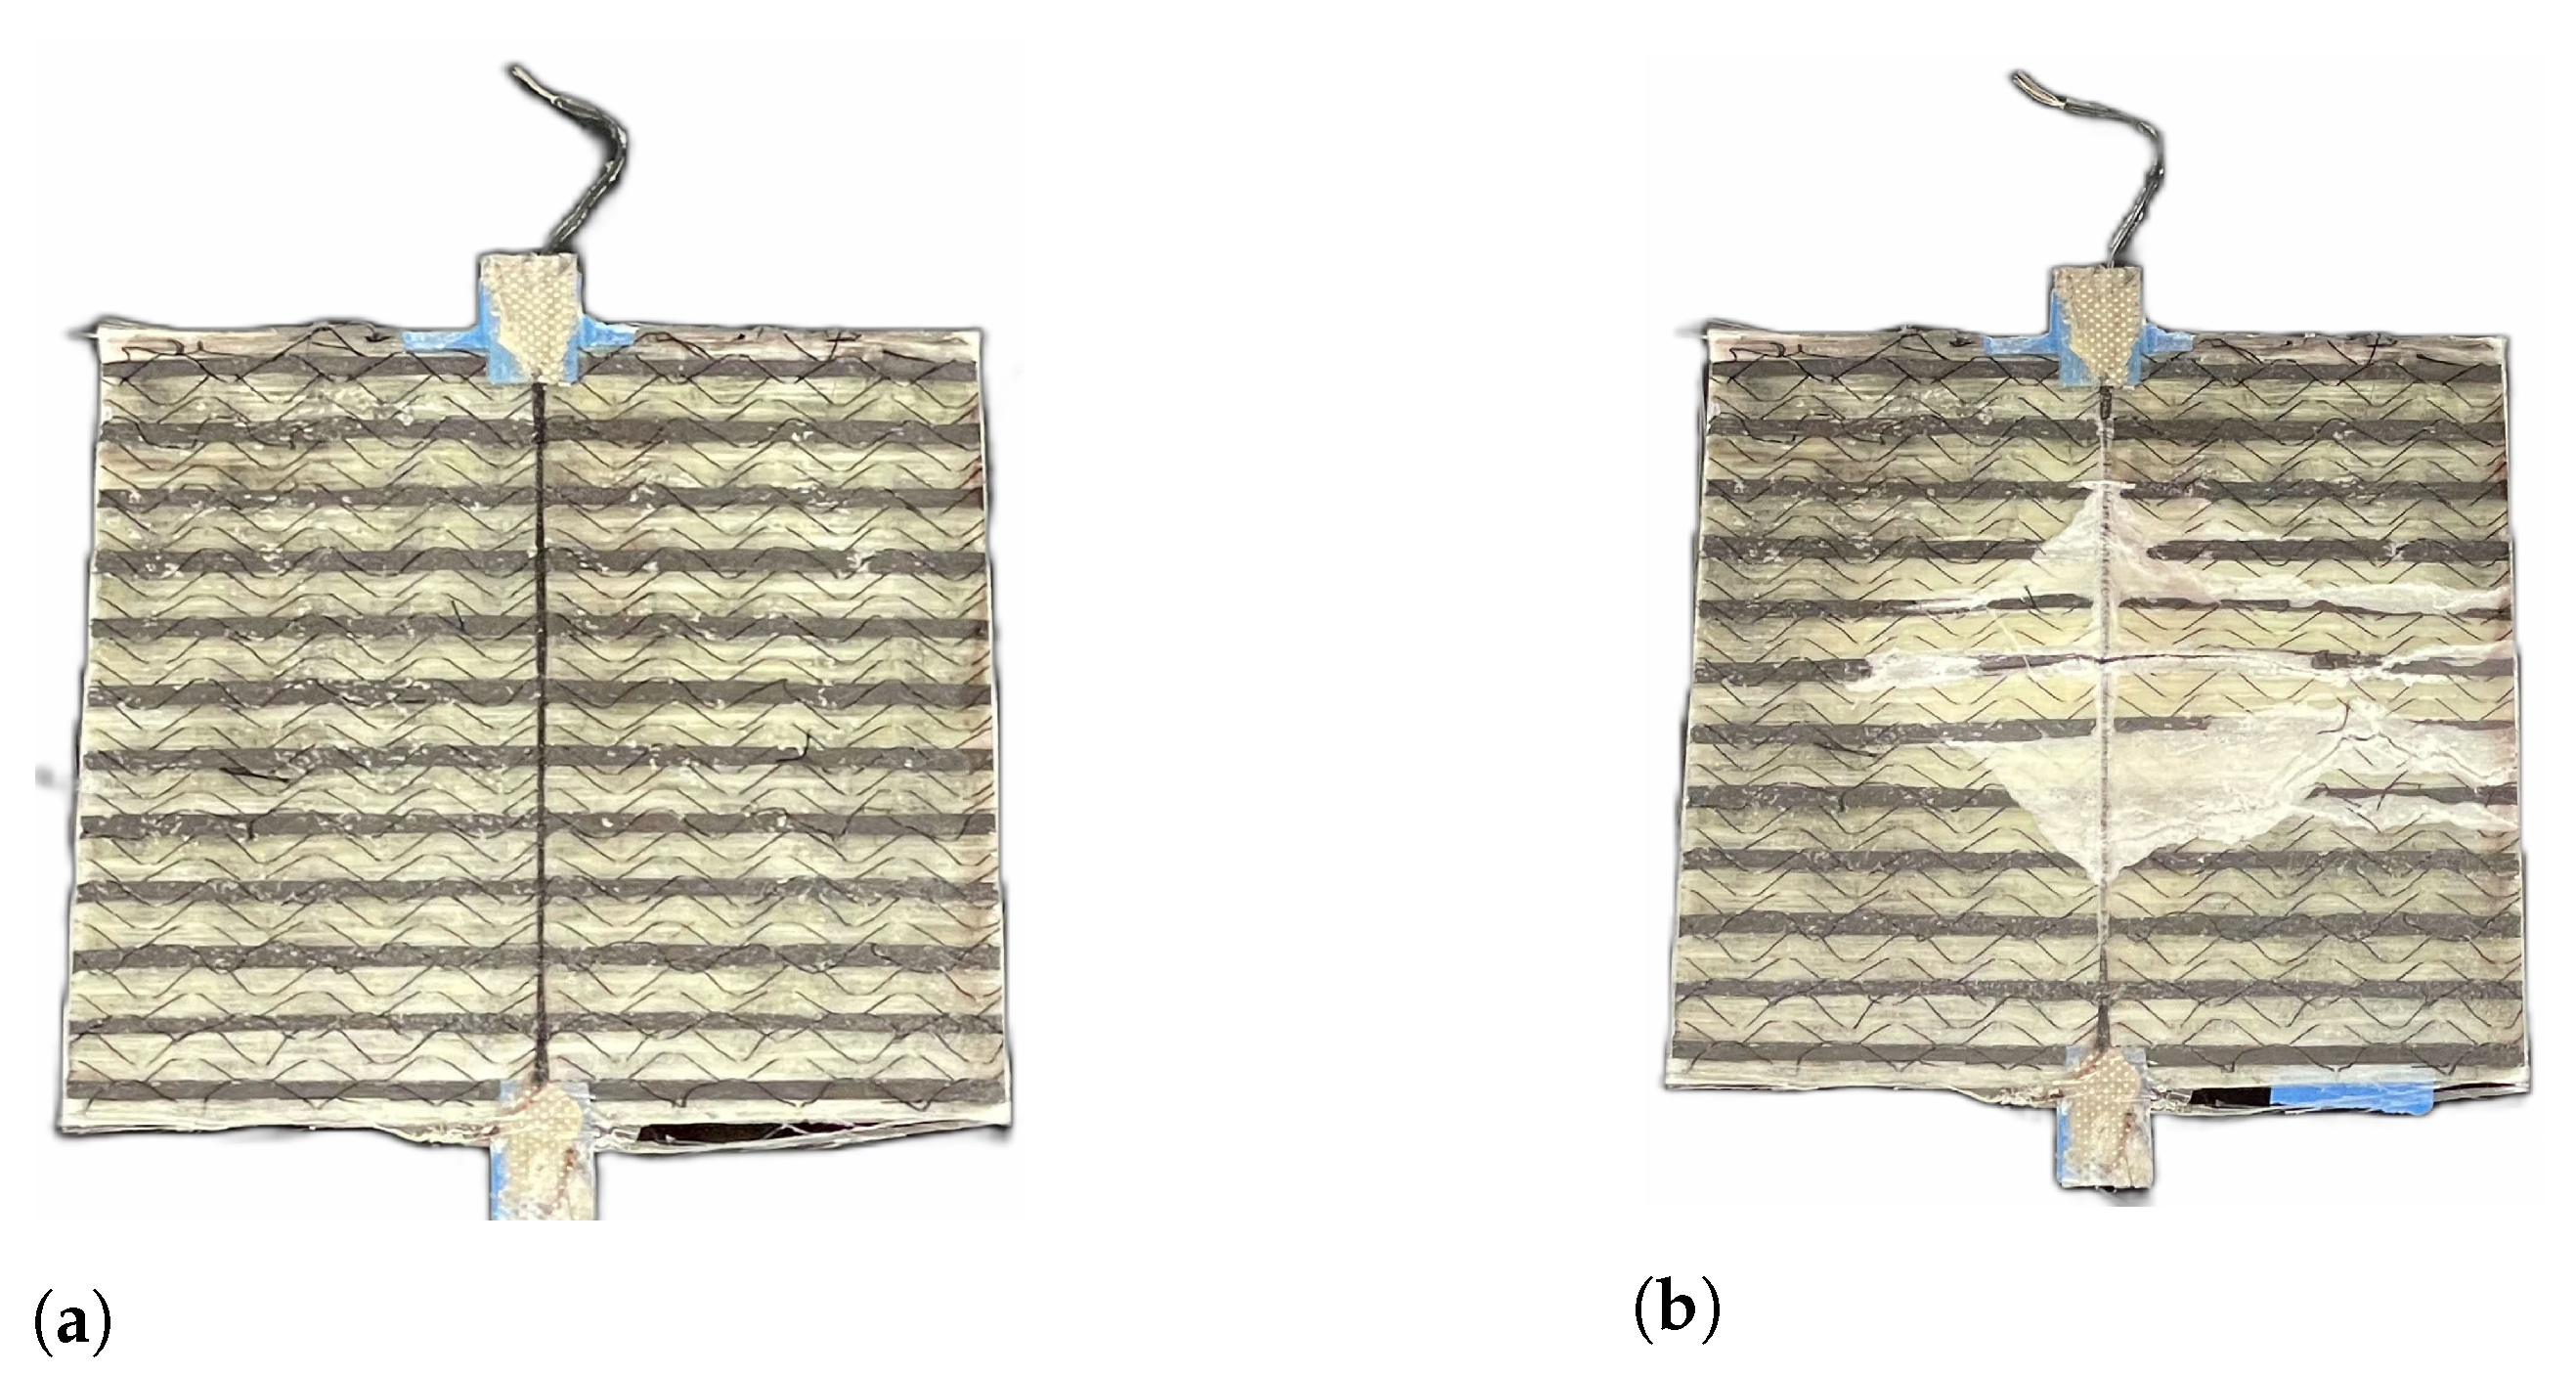
During the impact test, the impactor height was progressively increased in order to increase the impact energy to induce progressive damage to the composite specimen. The impactor was raised using a cable winch inside a 4” clear diameter PVC pipe secured with aluminum struts to facilitate a consistent impact location. Before dropping the impactor, slack in the cable was let out to minimize the effects of friction. To this end, low friction tape was placed around the cylindrical portion of the impactor that could potentially contact the PVC pipe. The impact specimen was composed of two layers of hybrid fabric oriented in a 0/90 layup. The fabric used was the same as that described in Section 3.2. Included in the layup was the 3k carbon fiber tow sensor located at the tension face of the 0/90 structural layers, which was enclosed with an electrically insulating glass veil layer on the bottom. Figure 12 shows an impact specimen before and after testing.
The 5” × 5” composite laminate is fully restrained by two 1/2” thick 5” × 5” aluminum plates, each with a 3” clear hole in the center, allowing for vertical deflection. The primary failure mode is fixed–fixed bending between the continuously circular restraint plates. The carbon fiber sensor tow embedded in the composite specimen monitors the resistance change during the entire impact event. The resistance data were acquired at a 1000 Hz sampling rate using a similar data acquisition system as described in the tensile tests referenced in Section 4.1.
5.2. Progressive Impact Test Results
In total, three identical specimens were built and tested (C.1, C.2, and C.3), and each was subjected to seven impact tests with progressively increased weight-dropping height. The first test was conducted with a drop height of 2 cm, which corresponds to an impact energy of 0.85 J. Each subsequent test was 2 cm higher than the previous test. Testing was concluded once the specimens reached total failure and the sensor resistance approached infinity.
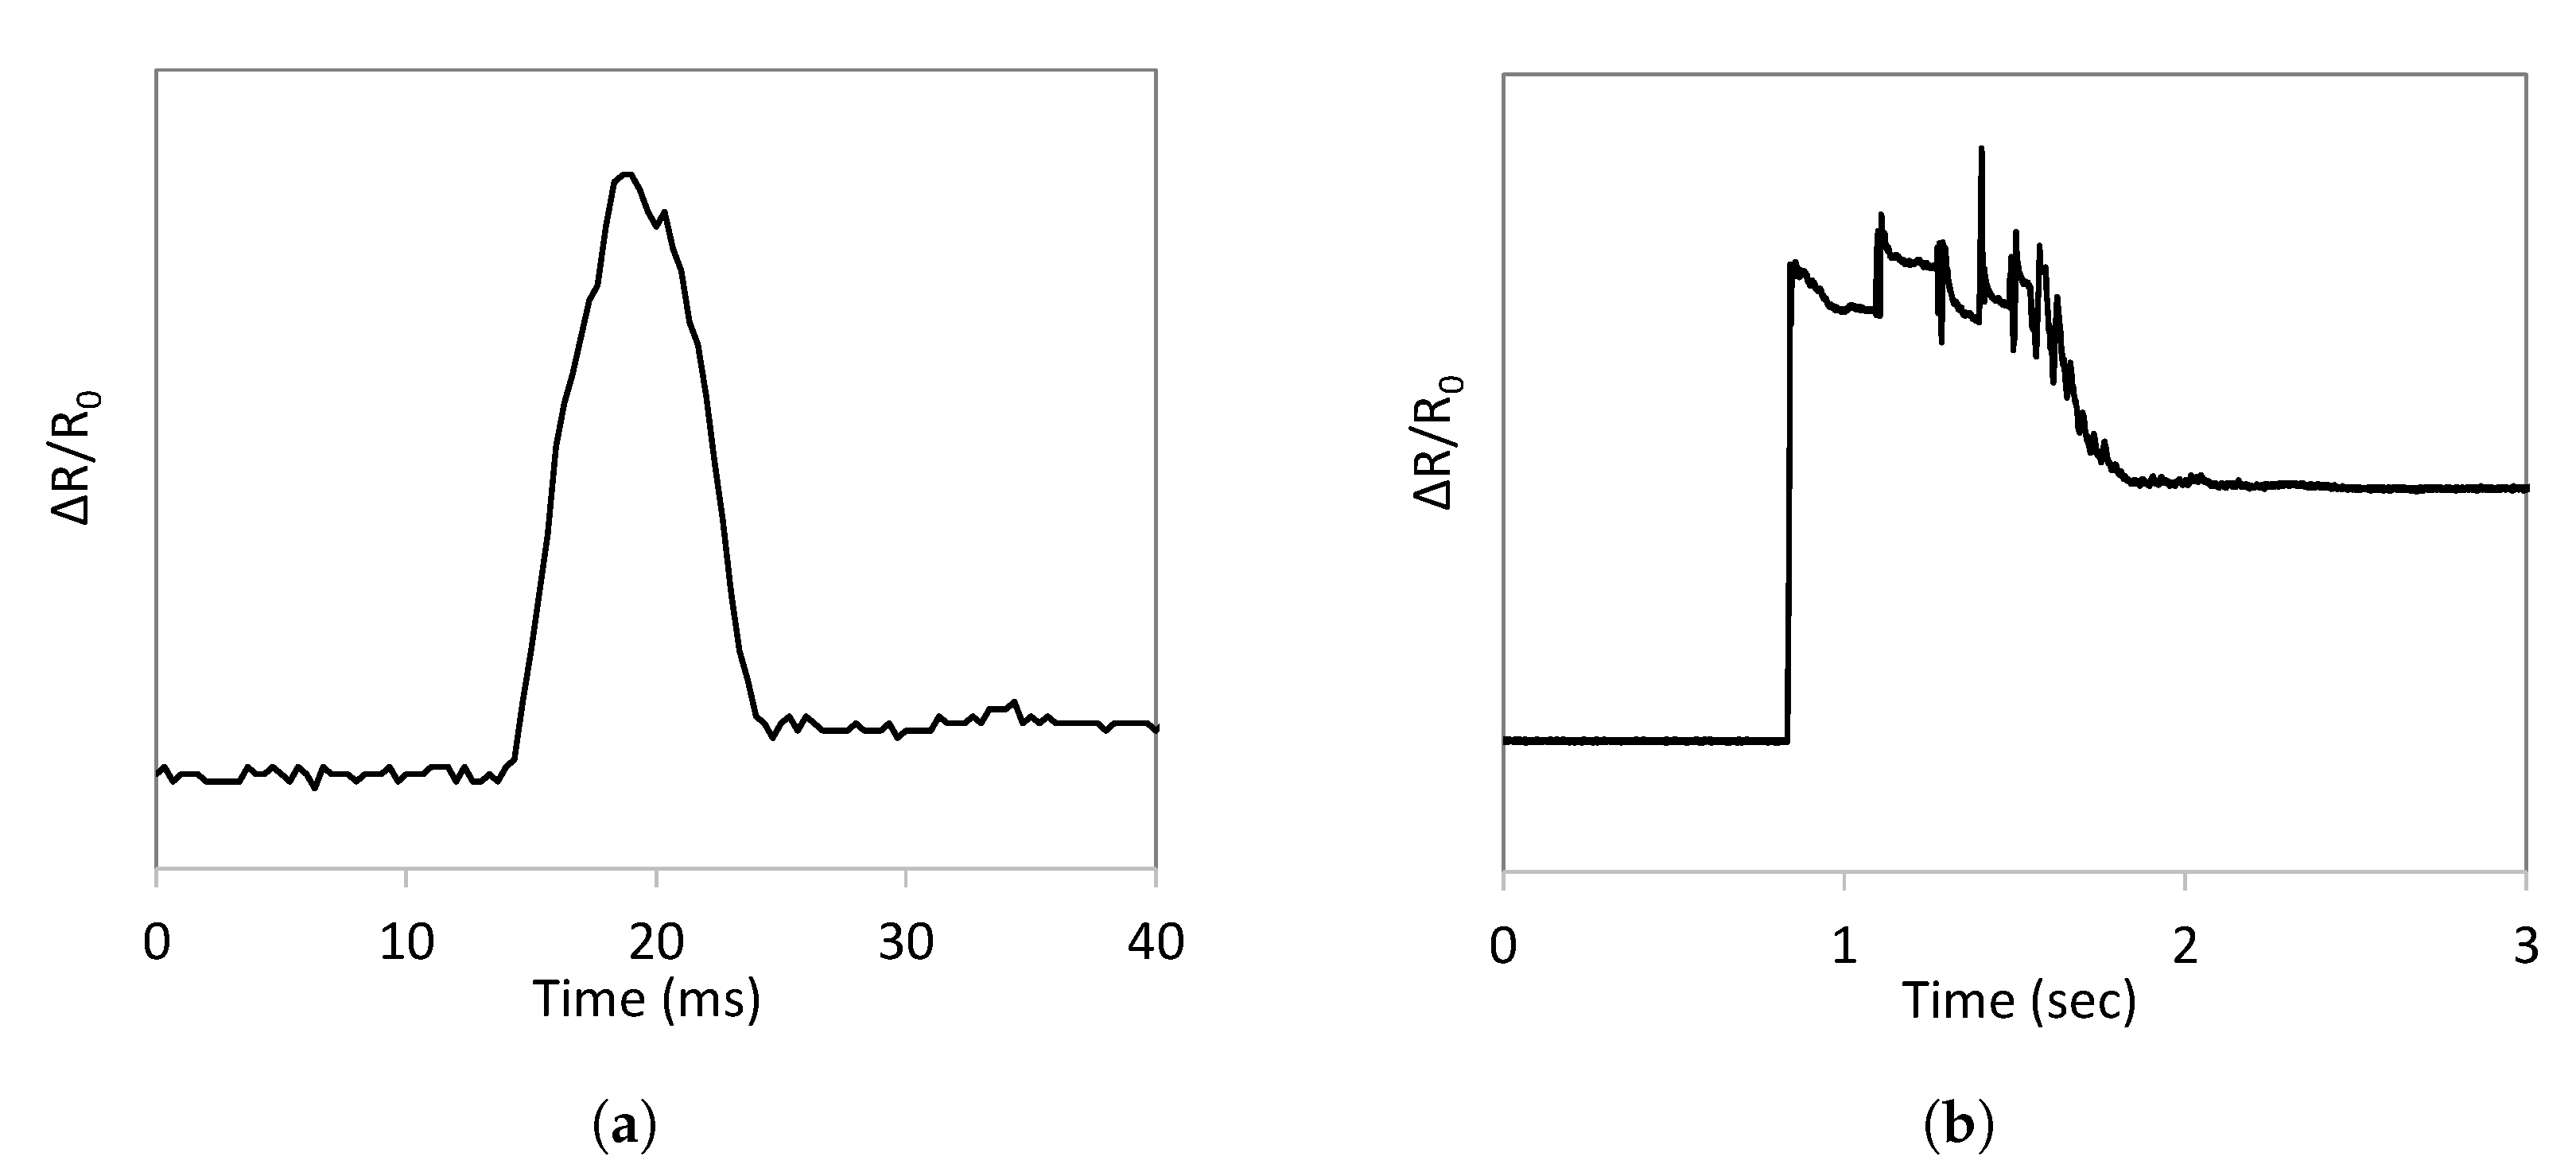
Figure 13 is included to show an example of two potential impact loading scenarios: low impact energy with minimal damage shown in Figure 13a, and high impact energy with significant damage shown in Figure 13b.
In Figure 13a, the resistance rose and then returned to very close to the starting value in a rapid duration. The shape of the resistance–time history resembled the impact loading pulse, and thus, the resistance appeared to be proportional to the applied load. The impact looked to have induced little damage to the specimen. No visible damage appeared on the specimen surface either. This is indicative of little to no damage to the specimen.
Figure 13b depicts an example of the opposite case where there was permanent damage due to high impact energy. The shape of the resistance–time history no longer exhibits a linear relationship (parabolic pulse) with the impact loading, and the post-impact resistance is permanently increased. Figure 13b shows a longer time-span where the impactor bounces multiple times before coming to a stop, giving a fluctuating signal The resistance rose and did not return to the initial value. This indicates that the impact ruptured some sensor tow filaments, resulting in an irreversible, permanent increase in the overall resistance of the sensor tow.
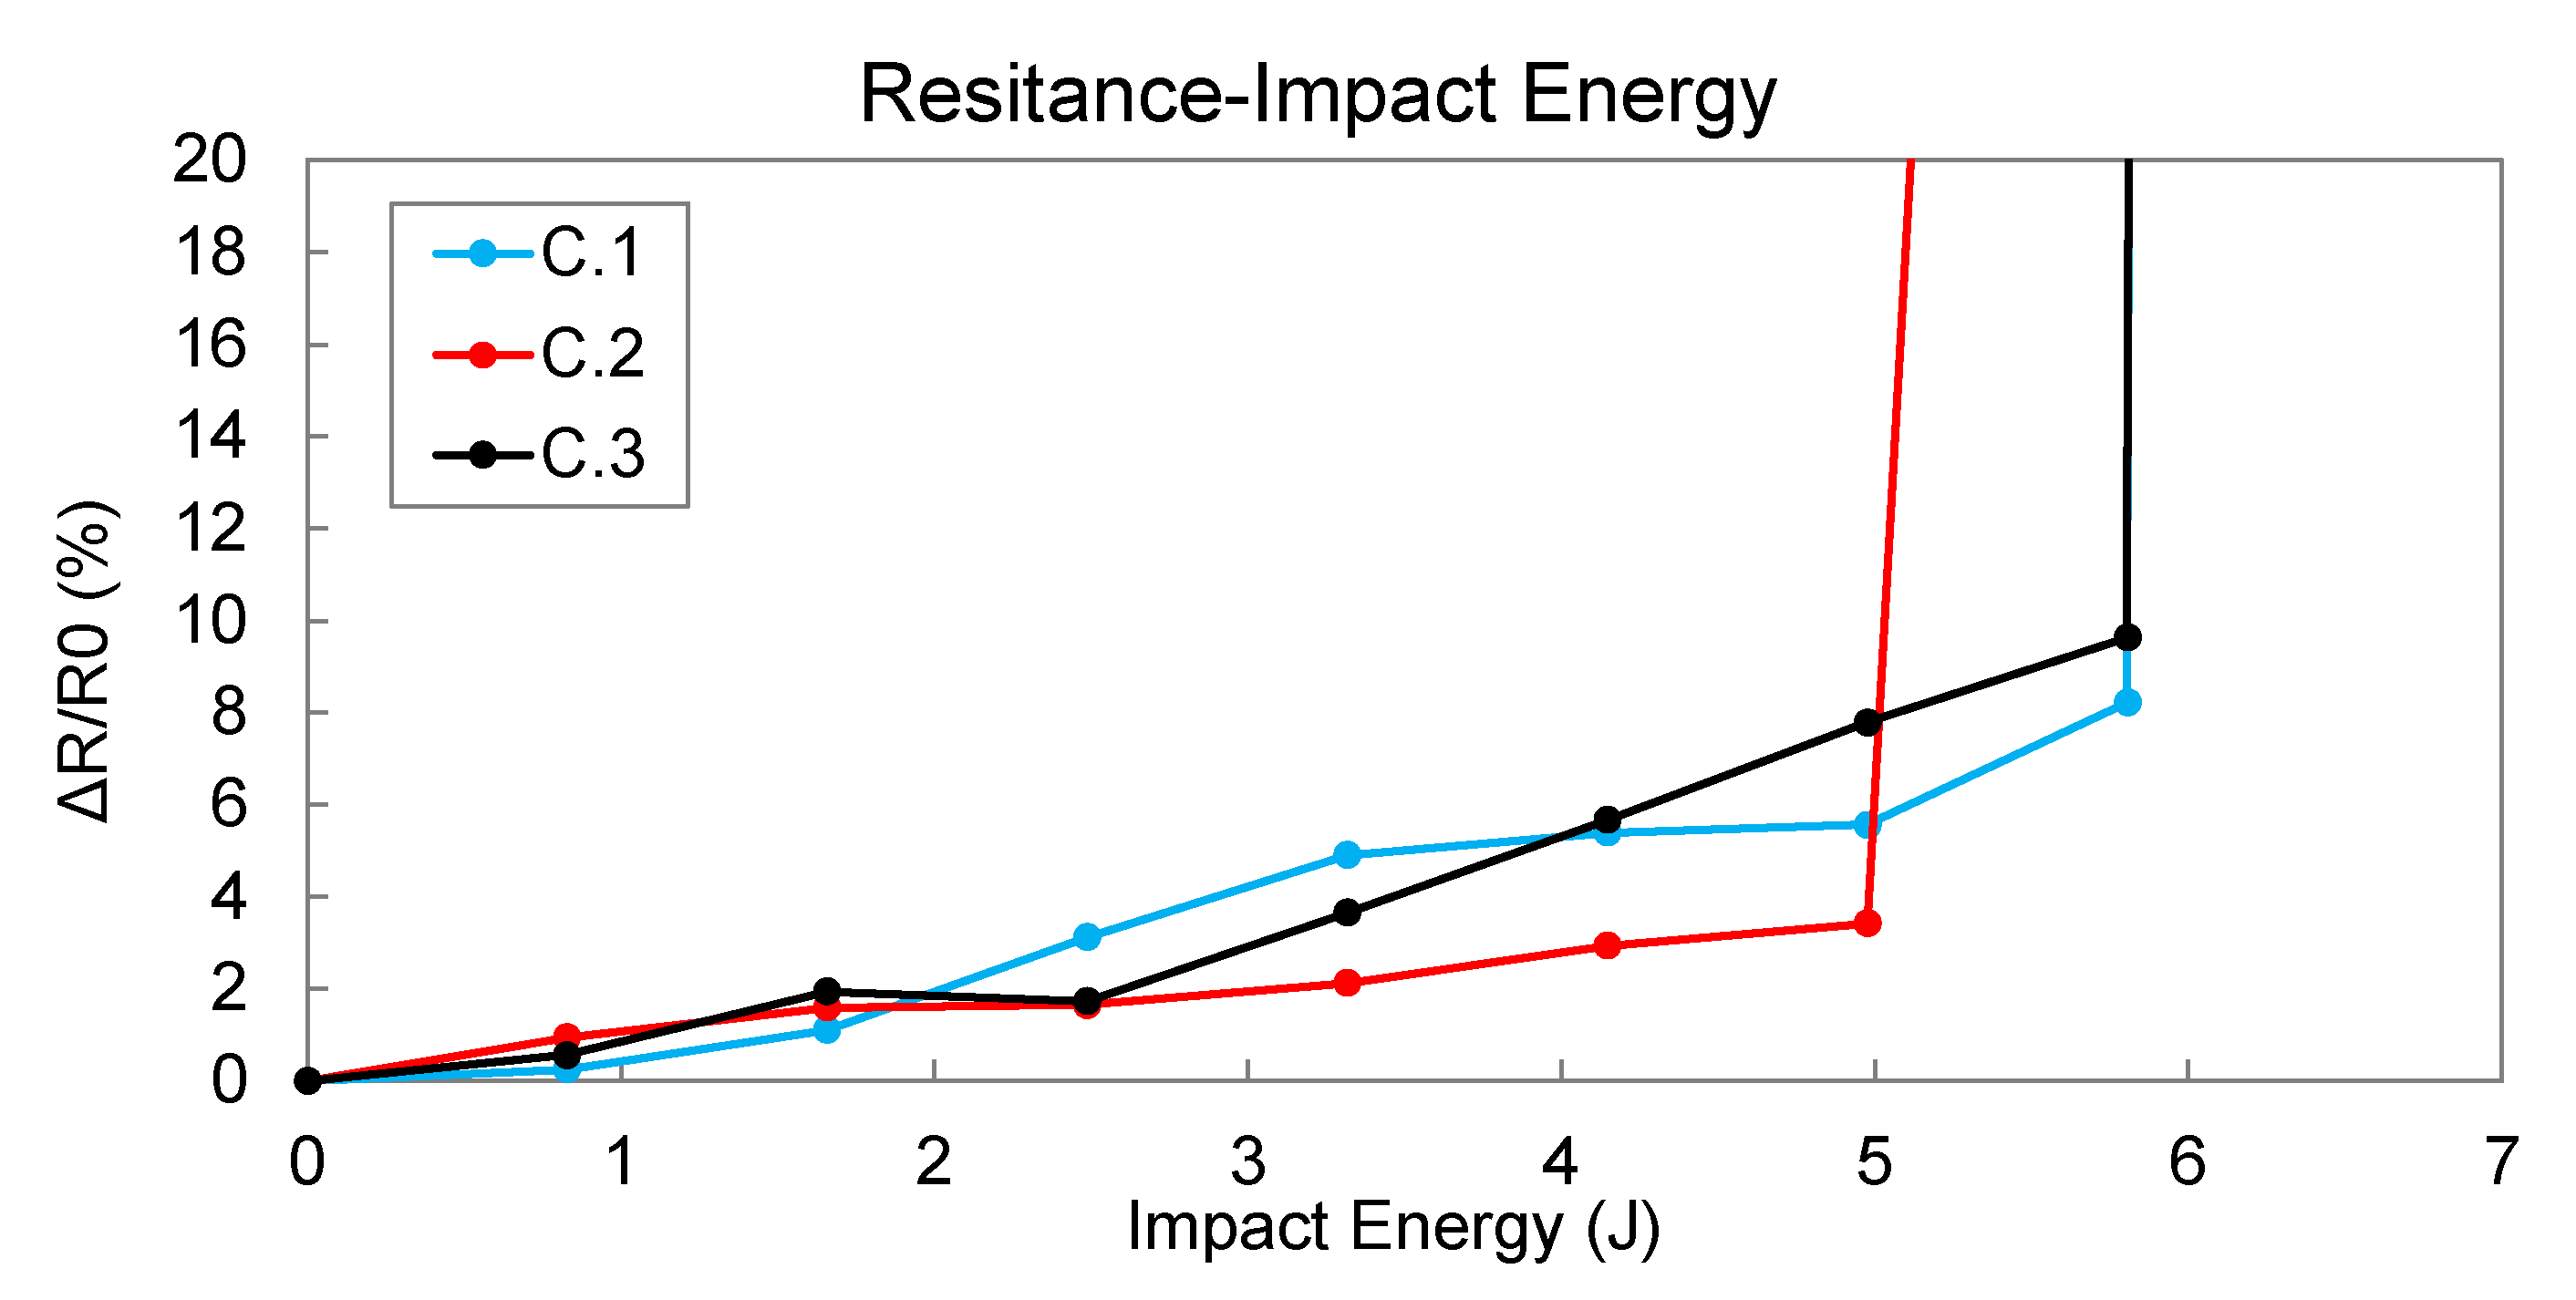
Figure 14 plots the post-impact resistance values (percent change versus the initial pre-experiment resistance) as a function of impact energy for the three tested specimens. All three specimens show a nearly linear relationship between impact energy and permanent change in resistance before complete failure. Specimens C.1 and C.3 failed after the seventh impact at 5.8 J, and the resistance concurrently approached infinity. Specimen C.2 saw a large increase in the resistance value after the sixth impact at 4.97 J before similarly failing afterward. Table 3 reports the mean / values for each impact energy and the maximum difference between the mean and the three specimens.
As seen in both the tensile tests shown in Figure 8 and impact tests shown in Figure 13, significant damage accumulation occurs when / surpasses and approaches approximately 10%. The lowest thresholds of C.1, C.2, and C.3 before ultimate failure each exceeded the . The progressive impact tests demonstrate the intrinsic damage memory and early-warning functionality of the carbon fiber sensor tow—the specimen’s impact history is captured by the sensor tow’s resistance values. Each time the specimen suffered impact damage, the resistance increased, which was irreversible. The observed permanent change in resistance must be distinguished from irreversible elastic strain. No direct assessment of the recoverable strain was measured, however, impact testing has demonstrated that resistance can be used as the primary variable for damage early warning. As shown by Li et al. [33] and Kalashnyk et al. [14], the change in resistance can be expressed as a function of discontinuous filament paths, and accordingly, the proportion of damaged fibers can be extrapolated. This correlation between electrical resistance and intact fibers gives a continuous, in situ assessment of overall composite health.
Future work can be performed to enumerate the correlation between the impact energy, plate strain, and sensor resistance. Such studies could produce a model for predicting the remaining life of a composite structure based on its past impact loading and microdamage history.
6. Conclusions
To address the difficulty in damage detection of fiber-reinforced polymer composites, this paper presents a low-cost SDDM hybrid composite material in which the structural carbon fiber tow itself is transformed into a piezoresistive sensor network, and the structural glass fiber operates as electrical insulation. The use of structural materials as sensors not only saves costs but also eliminates the discontinuities in the preform, thickness variations, and extensive wiring caused by embedding conventional sensors in the preform.
In this study, SDDM specimens were designed and fabricated, and tensile and impact tests were conducted to demonstrate the self-damage detection and damage memory functionalities in addition to the function as a structural material. Tensile testing found two distinct loading peaks: first where the carbon fiber fails, and second where the glass fiber fails. As the loading approached the first peak, the carbon fiber sensor tow resistance increased linearly up to a threshold (approximately 0.5% strain), beyond which the resistance drastically increased and ultimately approached infinity, which coincided with the first-peak failure of the carbon fiber load-carrying components (approximately 1.5% strain). Loading was observed to continue at higher strains, but lower stress levels, until the glass fiber finally failed. The findings here build upon the past research of single-line carbon fiber sensing tows [19,20], and furthermore integrate the sensor into a novel hybrid composite. Sensor tow patterns with 1 loop, 3 loops, and 5 loops were investigated, advancing the previous zig-zag sensor patterns [21] in order to more accurately monitor larger areas.
Tensile testing demonstrated that increasing the number of carbon fiber loops over a sensing area improved the sensor’s accuracy: the 5-loop design provided a significant reduction in RMS error over the 1-loop configuration, as measured in deviation from the idealized nonlinear resistance model developed by Park et al. [28]. The observed linear–nonlinear transition value of the sensor resistance could be useful as a threshold for damage early warning. Moreover, the finer spatial resolution of higher loop configurations demonstrates the potential for monitoring large-area composites.
Impact loading tests were conducted, in which the impact energy was progressively increased. It was found that when the impact energy was low, the measured resistance–time histories showed a pulse shape similar to the applied load, and the post-impact resistance returned very close to the pre-impact value, indicating little damage to the specimen. As the impact energy increases, the sensor tow’s after-impact resistance increases, which is irreversible and permanent. The permanent increase in the resistance is approximately proportional to the impact energy. The permanent increase in resistance is most likely caused by the microfracture of the sensor carbon fiber filaments. In other words, the impact-induced microdamage in the composite can be reflected and memorized in the sensor tow’s resistance value. A future study will be conducted to further investigate the damage memory functionality and develop a model for predicting the remaining life of a composite structure based on its loading and microdamage history.
The proposed SDDM composite address the gap in prior art to provide a cost-effective, high-volume solution for monitoring large-area composites. The sensor system is greatly suited for advanced and rapid molding processes such as HP-RTM. A TFP sensor tow preform can be molded in conjunction with the structural carbon fiber and glass fiber layers, requiring limited assembly time, adding little weight, and taking up little space. The multi-loop design can be modified to cover large areas, with the higher-loop configurations enabling accurate monitoring of high stress regions.
Author Contributions
Conceptualization, M.Q.F.; methodology, L.B.D., E.M.T. and M.Q.F.; software, E.M.T. and L.B.D.; validation, L.B.D. and E.M.T.; formal analysis, L.B.D. and E.M.T.; investigation, L.B.D. and E.M.T.; resources, M.Q.F.; data curation, L.B.D. and E.M.T.; writing—original draft preparation, L.B.D. and E.M.T.; writing—review and editing, L.B.D., E.M.T. and M.Q.F.; visualization, L.B.D. and E.M.T.; supervision, M.Q.F.; project administration, M.Q.F.; funding acquisition, M.Q.F. All authors have read and agreed to the published version of the manuscript.
Funding
The information, data, or work presented herein was funded in part by the Office of Energy Efficiency and Renewable Energy (EERE), U.S. Department of Energy, under Award Number DE-EE0009204.
Institutional Review Board Statement
The information, data, or work presented herein was funded in part by an agency of the United States Government. Neither the United States Government nor any agency thereof, nor any of their employees, makes any warranty, express or implied, or assumes any legal liability or responsibility for the accuracy, completeness, or usefulness of any information, apparatus, product, or process disclosed or represents that its use would not infringe privately owned rights. Reference herein to any specific commercial product, process, or service by trade name, trademark, manufacturer, or otherwise does not necessarily constitute or imply its endorsement, recommendation, or favoring by the United States Government or any agency thereof. The views and opinions of authors expressed herein do not necessarily state or reflect those of the United States Government or any agency thereof.
Data Availability Statement
The data presented in this study are available on request from the corresponding author.
Acknowledgments
The authors would like to thank first the PI of the project, Venkat Aitharaju of General Motors Research and Development, and then George Han and Colin Rowbottom of Coats Group for their numerous contributions. This work was also made possible by the continual support of Carleton Lab at Columbia University, with special thanks to Liming Li, Will Hunnicutt, Freddie Wheeler Jr., and Jamie Basirico. Lastly, the authors would like to thank Adam Burley of Tenjin Automotive for his guidance.
Conflicts of Interest
The authors declare no conflict of interest.
References
- Arena, M.; Viscardi, M. Strain State Detection in Composite Structures: Review and New Challenges. J. Compos. Sci. 2020, 4, 60. [Google Scholar] [CrossRef]
- Nauman, S. Piezoresistive Sensing Approaches for Structural Health Monitoring of Polymer Composites—A Review. Eng 2021, 2, 197–226. [Google Scholar] [CrossRef]
- Abry, J.; Bochard, S.; Chateauminois, A.; Salvia, M.; Giraud, G. In situ detection of damage in CFRP laminates by electrical resistance measurements. Compos. Sci. Technol. 1999, 59, 925–935. [Google Scholar] [CrossRef]
- Abry, J.; Choi, Y.; Chateauminois, A.; Dalloz, B.; Giraud, G.; Salvia, M. In-situ monitoring of damage in CFRP laminates by means of AC and DC measurements. Compos. Sci. Technol. 2001, 61, 855–864. [Google Scholar] [CrossRef]
- Sannamani, M.; Gao, J.; Chen, W.W.; Tallman, T.N. Damage Detection in Non-Planar Carbon Fiber-Reinforced Polymer Laminates via Electrical Impedance Tomography with Surface-Mounted Electrodes and Directional Sensitivity Matrices. Compos. Sci. Technol. 2022, 224, 109429. [Google Scholar] [CrossRef]
- Zhang, Y.; Anderson, N.; Bl, S.; Nutt, S.; Jursich, G.; Joshi, S. All-printed strain sensors: Building blocks of the aircraft structural health monitoring system. Sens. Actuators A Phys. 2017, 253, 165–172. [Google Scholar] [CrossRef]
- Anas, M.; Nasir, M.A.; Asfar, Z.; Nauman, S.; Akalin, M.; Ahmad, F. Structural health monitoring of GFRP laminates using graphene-based smart strain gauges. J. Braz. Soc. Mech. Sci. Eng. 2018, 40, 397. [Google Scholar] [CrossRef]
- Makireddi, S.; Varghese, F.V.; Balasubramaniam, K. Non-monotonic piezoresistive behaviour of graphene nanoplatelet (GNP)-polymer composite flexible films prepared by solvent casting. Express Polym. Lett. 2017, 11, 581–588. [Google Scholar] [CrossRef]
- Kranbuehl, D.; Aandahl, H.; Haralampus-Grynaviski, N.M.; Newby, W.; Hood, D.; Boiteux, G.; Seytre, G.; Pascault, J.P.; Maazouz, A.; Gerard, J.F.; et al. Use of in-situ dielectric sensing for intelligent processing and health monitoring. In Proceedings of the 3rd International Conference on Intelligent Materials and 3rd European Conference on Smart Structures and Materials, Lyon, France, 3–5 June 1996; pp. 112–117. [Google Scholar]
- Zambrzycki, M.; Fraczek-Szczypta, A. Conductive hybrid polymer composites based on recycled carbon fibres and carbon nanofillers. J. Mater. Sci. 2018, 53, 7403–7416. [Google Scholar] [CrossRef]
- Fouad, N.; Saifeldeen, M.A. Smart self-sensing fiber-reinforced polymer sheet with woven carbon fiber line sensor for structural health monitoring. Adv. Struct. Eng. 2021, 24, 17–24. [Google Scholar] [CrossRef]
- Salvado, R.; Lopes, C.; Szojda, L.; Araújo, P.; Gorski, M.; Velez, F.; Castro-Gomes, J.; Krzywon, R. Carbon Fiber Epoxy Composites for Both Strengthening and Health Monitoring of Structures. Sensors 2015, 15, 10753–10770. [Google Scholar] [CrossRef]
- Nanni, F.; Ruscito, G.; Forte, G.; Gusmano, G. Design, manufacture and testing of self-sensing carbon fibre–glass fibre reinforced polymer rods. Smart Mater. Struct. 2007, 16, 2368–2374. [Google Scholar] [CrossRef]
- Kalashnyk, N.; Faulques, E.; Schjødt-Thomsen, J.; Jensen, L.R.; Rauhe, J.C.M.; Pyrz, R. Monitoring self-sensing damage of multiple carbon fiber composites using piezoresistivity. Synth. Met. 2017, 224, 56–62. [Google Scholar] [CrossRef]
- Scholle, P.; Sinapius, M. A review on the usage of continuous carbon fibers for piezoresistive self strain sensing fiber reinforced plastics. J. Compos. Sci. 2021, 5, 96. [Google Scholar] [CrossRef]
- Wen, J.; Xia, Z.; Choy, F. Damage detection of carbon fiber reinforced polymer composites via electrical resistance measurement. Compos. B Eng. 2011, 42, 77–86. [Google Scholar] [CrossRef]
- Wang, X.; Chung, D. Continuous carbon fibre epoxy-matrix composite as a sensor of its own strain. Smart Mater. Struct. 1996, 5, 796–800. [Google Scholar] [CrossRef]
- Huang, H.; Wu, Z. Static and dynamic measurement of low-level strains with carbon fibers. Sens. Actuators A Phys. 2012, 183, 140–147. [Google Scholar] [CrossRef]
- Yang, C.Q.; Wang, X.L.; Jiao, Y.J.; Ding, Y.L.; Zhang, Y.F.; Wu, Z.S. Linear strain sensing performance of continuous high strength carbon fibre reinforced polymer composites. Compos. B Eng. 2016, 102, 86–93. [Google Scholar] [CrossRef]
- Saifeldeen, M.A.; Fouad, N.; Huang, H.; Wu, Z. Advancement of long-gauge carbon fiber line sensors for strain measurements in structures. J. Intell. Mater. Syst. Struct. 2016, 28, 878–887. [Google Scholar] [CrossRef]
- Kunadt, A.; Starke, E.; Pfeifer, G.; Cherif, C. Messtechnische Eigenschaften von Dehnungssensoren aus Kohlenstoff-Filamentgarn in einem Verbundwerkstoff Measuring Performance of Carbon Filament Yarn Strain Sensors Embedded in a Composite. Tech. Mess. 2010, 77, 113–120. [Google Scholar] [CrossRef]
- ASTM D3039/D3039M-17; Standard Test Method for Tensile Properties of Polymer Matrix Composite Materials. ASTM International: West Conshohocken, PA, USA, 2017.
- McCormick, N.; Lord, J. Digital image correlation. Mater. Today 2010, 13, 52–54. [Google Scholar] [CrossRef]
- Sutton, M.A.; Orteu, J.J.; Schreier, H. Image Correlation for Shape, Motion and Deformation Measurements; Springer: New York, NY, USA, 2009. [Google Scholar]
- Turner, D.Z. Digital Image Correlation Engine (DICe) Reference Manual. Sandia Nat. Lab.: Livermore, CA, USA, 2015. Sandia Rep. SAND2015-10606 O. Available online: https://github.com/dicengine/dice (accessed on 20 August 2022).
- Mekid, S.; Daraghma, H.; Bashmal, S. Electromechanical Assessment and Induced Temperature Measurement of Carbon Fiber Tows under Tensile Condition. Materials 2020, 13, 4234. [Google Scholar] [CrossRef] [PubMed]
- Yao, X.; Luan, C.; Zhang, D.; Lan, L.; Fu, J. Evaluation of Carbon Fiber-Embedded 3D Printed Structures for Strengthening and Structural-Health Monitoring. Mater. Des. 2017, 114, 424–432. [Google Scholar] [CrossRef]
- Park, J.B.; Okabe, T.; Takeda, N.; Curtin, W.A. Electromechanical modeling of unidirectional CFRP composites under tensile loading condition. Compos. Part A Appl. Sci. Manuf. 2002, 33, 267–275. [Google Scholar] [CrossRef]
- Zhou, Y.; Baseer, M.A.; Mahfuz, H.; Jeelani, S. Statistical analysis on the fatigue strength distribution of T700 carbon fiber. Compos. Sci. Technol. 2006, 66, 2100–2106. [Google Scholar] [CrossRef]
- Killick, R.; Fearnhead, P.; Eckley, I.A. Optimal detection of changepoints with a linear computational cost. J. Am. Stat. Assoc. 2012, 107, 1590–1598. [Google Scholar] [CrossRef]
- Wu, X.-F.; Oksana, Z. Experimental Study of the Probabilistic Fatigue Residual Strength of a Carbon Fiber-Reinforced Polymer Matrix Composite. J. Compos. Sci. 2020, 4, 173. [Google Scholar] [CrossRef]
- Harikrishnan, R.; Mohite, P.M.; Upadhyay, C.S. Generalized Weibull model-based statistical tensile strength of carbon fibres. Arch. Appl. Mech. 2018, 88, 1617–1636. [Google Scholar] [CrossRef]
- Li, H.; Zhou, W.; Ou, J. Study on electromechanical behavior of unidirectional carbon fibre sheet without epoxy resin matrix. Adv. Struct. Eng. 2004, 7, 437–445. [Google Scholar] [CrossRef]
Figure 1.
(a) Sensor can be designed in various patterns to monitor large areas; (b) an example of a traditional two-layer CFRP composite with an embedded sensor for SDDM capabilities (for more information regarding the tensile specimen configuration used in this study, refer to Figure 4 for the cross-section and Section 3.1 for the materials).

Figure 2.
Examples of sensor tow design: (a) a straight sensor tow; (b) a sensor tow in a strain gauge pattern.
Figure 2.
Examples of sensor tow design: (a) a straight sensor tow; (b) a sensor tow in a strain gauge pattern.

Figure 3.
(a) Design of 1-loop, 3-loop, and-5 loop tensile specimens; (b) unidirectional carbon and glass hybrid fabric material; (c) tailored fiber placement (TFP) sensor preforms.
Figure 3.
(a) Design of 1-loop, 3-loop, and-5 loop tensile specimens; (b) unidirectional carbon and glass hybrid fabric material; (c) tailored fiber placement (TFP) sensor preforms.

Figure 4.
Cross-sectional view of hybrid composite layup used for tensile testing. The 3k sensor tow used is composed of T700 carbon fiber.
Figure 4.
Cross-sectional view of hybrid composite layup used for tensile testing. The 3k sensor tow used is composed of T700 carbon fiber.

Figure 5.
Tensile test setup with DIC strain capturing and benchtop DMM resistance monitoring.

Figure 6.
Tensile testing setup: (a) view of the specimen installed on the Instron 5984 with the camera for non-contact DIC strain-field mapping; (b) tensile test specimen with patterns for DIC mapping.
Figure 6.
Tensile testing setup: (a) view of the specimen installed on the Instron 5984 with the camera for non-contact DIC strain-field mapping; (b) tensile test specimen with patterns for DIC mapping.

Figure 7.
Comparison of strain–time history measured using computer vision and extensometer.

Figure 8.
Tensile test results of (a) 1-loop, (b) 3-loop, and (c) 5-loop specimens showing resistance–strain and stress–strain measurements. The green vertical line denotes the threshold, and the two gray vertical lines show the carbon fiber loading peak and then the glass fiber loading peak.
Figure 8.
Tensile test results of (a) 1-loop, (b) 3-loop, and (c) 5-loop specimens showing resistance–strain and stress–strain measurements. The green vertical line denotes the threshold, and the two gray vertical lines show the carbon fiber loading peak and then the glass fiber loading peak.

Figure 9.
Tensile test of specimen 5A progressing left-to-right: testing begins (dark green), the resistance passes (light green), the specimen reaches max strength where the carbon fiber is mostly failed and resistance approaches infinity (yellow), the specimen undergoes high-strain loading predominantly resisted by the glass fibers (orange), then ultimately reaches complete failure (red).

Figure 10.
Displacement maps (a,b) and strain maps (c,d) at two time instances within the linear and nonlinear resistance change zones. (a,c) show the specimen at 200 s before the strain reached the transition value, and (b,d) show the same specimen at 350 s at the first loading peak.
Figure 10.
Displacement maps (a,b) and strain maps (c,d) at two time instances within the linear and nonlinear resistance change zones. (a,c) show the specimen at 200 s before the strain reached the transition value, and (b,d) show the same specimen at 350 s at the first loading peak.

Figure 11.
(a) Impact test setup with drop tower, impactor, and restraint plates; (b) close up view of impact test setup with impact specimen, restraint plates, clamps, and impactor above.
Figure 11.
(a) Impact test setup with drop tower, impactor, and restraint plates; (b) close up view of impact test setup with impact specimen, restraint plates, clamps, and impactor above.

Figure 12.
Photo of impact specimen C.1 taken (a) before test and (b) after test.

Figure 13.
Sensor resistance–time histories measured during progressive impact tests: (a) low impact energy; (b) high impact energy.
Figure 13.
Sensor resistance–time histories measured during progressive impact tests: (a) low impact energy; (b) high impact energy.

Figure 14.
Permanent change in resistance of 3 identical impact specimens with increasing impact energy.
Figure 14.
Permanent change in resistance of 3 identical impact specimens with increasing impact energy.


Table 1.
Geometrical properties of the tensile test specimens.
| Specimen 1A | Specimen 1B | Specimen 3A | Specimen 3B | Specimen 5A | Specimen 5B | |
|---|---|---|---|---|---|---|
| Thickness (mm) | 1.81 | 1.73 | 1.80 | 1.80 | 1.74 | 1.78 |
| Width (mm) | 39.49 | 39.50 | 39.52 | 39.51 | 39.51 | 39.50 |
Table 2.
Electromechanical properties of test specimens: Young’s modulus (E); critical stress (); ultimate strain (); initial resistance (); and resistance change and strain at the linear–nonlinear transition ( and ).
Table 2.
Electromechanical properties of test specimens: Young’s modulus (E); critical stress (); ultimate strain (); initial resistance (); and resistance change and strain at the linear–nonlinear transition ( and ).
| Specimen | E (MPa) | (MPa) | (%) | (%) | (%) | |
|---|---|---|---|---|---|---|
| 1A | 541 | 876 | 2.23 | 50.5 | 2.29 | 0.49 |
| 1B | 566 | 897 | 2.74 | 51.2 | 2.76 | 0.51 |
| 3A | 558 | 817 | 2.25 | 127.9 | 2.66 | 0.52 |
| 3B | 595 | 878 | 2.65 | 130.6 | 3.96 | 0.57 |
| 5A | 653 | 896 | 2.26 | 193.6 | 4.24 | 0.52 |
| 5B | 666 | 899 | 2.31 | 188.8 | 4.39 | 0.52 |
Table 3.
Impact test mean resistance change and maximum difference in resistance change from mean.
| Impact Energy (J) | /, Mean | Maximum Difference from Mean |
|---|---|---|
| 0.8 | 0.58 | 0.36 |
| 1.6 | 1.54 | 0.44 |
| 2.5 | 2.16 | 0.95 |
| 3.3 | 3.55 | 1.44 |
| 4.1 | 4.66 | 1.73 |
| 5.0 | 5.83 | 1.95 |
| 5.8 | 8.92 | 0.70 |
Disclaimer/Publisher’s Note: The statements, opinions and data contained in all publications are solely those of the individual author(s) and contributor(s) and not of MDPI and/or the editor(s). MDPI and/or the editor(s) disclaim responsibility for any injury to people or property resulting from any ideas, methods, instructions or products referred to in the content. |
© 2023 by the authors. Licensee MDPI, Basel, Switzerland. This article is an open access article distributed under the terms and conditions of the Creative Commons Attribution (CC BY) license (https://creativecommons.org/licenses/by/4.0/).
Share and Cite
MDPI and ACS Style
Demo, L.B.; Tronci, E.M.; Feng, M.Q. Multifunctional Fiber-Reinforced Polymer Composites for Damage Detection and Memory. J. Compos. Sci. 2023, 7, 383. https://doi.org/10.3390/jcs7090383
AMA Style
Demo LB, Tronci EM, Feng MQ. Multifunctional Fiber-Reinforced Polymer Composites for Damage Detection and Memory. Journal of Composites Science. 2023; 7(9):383. https://doi.org/10.3390/jcs7090383
Chicago/Turabian StyleDemo, Luke B., Eleonora M. Tronci, and Maria Q. Feng. 2023. "Multifunctional Fiber-Reinforced Polymer Composites for Damage Detection and Memory" Journal of Composites Science 7, no. 9: 383. https://doi.org/10.3390/jcs7090383