
Mitochondrial Metabolism Characterization of Four Different Fish Cell Lines


Immunobiology for Aquaculture Group, Department of Cell Biology and Histology, Faculty of Biology, Campus of International Excellence, Campus Mare Nostrum, University of Murcia, 30100 Murcia, Spain
*
Author to whom correspondence should be addressed.
Fishes 2022, 7(6), 354; https://doi.org/10.3390/fishes7060354
Submission received: 10 November 2022
/
Revised: 23 November 2022
/
Accepted: 25 November 2022
/
Published: 28 November 2022
(This article belongs to the Section Physiology and Biochemistry)
Abstract
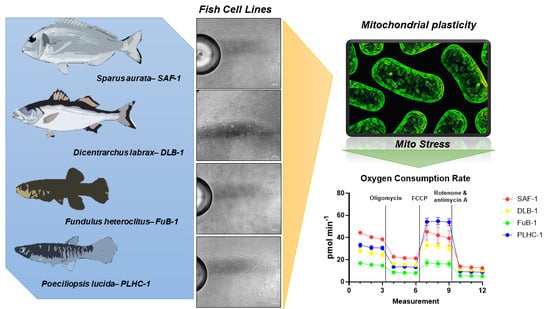
:Mitochondria are a crucial cellular organelle that organizes a wide range of biological processes, from energy production and calcium homeostasis to cell proliferation, differentiation, and death as well as inflammation. Mitochondria also support immune cell phenotypes and function. The aim of this communication is to evaluate the mitochondrial status and plasticity of four fish cell lines: SAF-1 (derived from gilthead sea bream skin), DLB-1 (derived from European sea bass brain), FuB-1 (established from mummichog brain), and PLHC-1 (a topminnow hepatocellular carcinoma). A mitochondrial stress assay was performed to compare the bioenergetic capabilities of these four fish cell lines as well as the importance of choosing the correct cell line when performing different in vitro studies.
1. Introduction
Mitochondria are one of the major cellular organelles that orchestrate a vast range of biological processes, including energy production, redox signaling, reactive oxygen species (ROS) genesis, and calcium homeostasis [1,2]. Mitochondria are also involved in cell proliferation, differentiation, and death as well as inflammation. Mitochondria also sustain immune cell phenotypes and their function [3,4]. All this evidence and the development of potent analyzers that allow the study of cell biology in real time, live cell kinetics, and some phenotypic measures helped us to develop the present study.
On the other hand, the increase in in vitro studies to the detriment of in vivo studies is a growing reality due to lower costs, the faster execution of experiments, fewer animals sacrificed for research purposes, and fewer ethical problems [2]. A useful tool for these studies is the use of fish cell lines that can be used as a study model for the animals from which they were obtained. These cell lines can be used to evaluate the effects of different compounds, e.g., in toxicological, pharmacological, functional compound, and antioxidant studies. Currently, acute toxicity testing in fish is a legal requirement in many countries as part of environmental risk assessment [5,6,7,8]. From this perspective, the cellular response is determined by the metabolism of the cells themselves and by the detoxification capacity, among other parameters. Therefore, the study of chemicals affecting mitochondrial bioenergetics may be decisive [1]. It is reasonable to consider that the origins of the different cell lines, as well as their culture conditions, will largely determine the different mitochondrial parameters. We selected the SAF-1 and DLB-1 cell lines because they were obtained from sea bream and European sea bass, respectively, two of the most representative species of Mediterranean aquaculture. Moreover, both cell lines have been widely used in studies of exposure to different substances or stimuli (such as antioxidants, toxins, microplastics, or yeast extracts) [9,10,11,12,13]. In addition, due to the glial origin of the DLB-1 line, it has been used in studies related to viruses that have the brain as a target organ, especially nodavirus (NNV) [14,15]. The FuB-1 line obtained from mummichog brain was also selected because its use as a model fish is widespread in different fields [16,17,18]. Both the FuB-1 and DLB-1 lines have been used in virology, immunology, and toxicology [8,12]. Finally, the PLHC-1 line is one of the most widely used lines in the field of fish ecotoxicology [19]. Its hepatic nature makes it of great biological interest, as it maintains and possesses CYP1A activity, which is induced by numerous toxins [19]. The intention of this work was to evaluate the mitochondrial status and plasticity of four fish cell lines (SAF-1, DLB-1, FuB-1, and PLHC-1) using the mitochondrial stress assay. In addition, we intended to establish the technical parameters for performing this type of analysis in these cell lines. Similarities and differences in ATP production, basal and maximal respiration, and mitochondrial oxygen consumption were analyzed.
2. Materials and Methods
2.1. Cell Culture
The SAF-1 cell line (ECACC 00122301), established from fibroblasts (Sparus aurata), was seeded in Leibowitz L-15 medium (Sigma, Madrid, Spain) supplemented with 10% fetal bovine serum (SBF, Sigma), 2 mM L-glutamine (Sigma), 100 I.U. mL−1 penicillin (Sigma), and 100 μg mL−1 streptomycin (Sigma, Madrid, Spain) and incubated at 25 °C. The DLB-1 cell line (CVCL_HG31), obtained from brain (Dicentrarchus labrax), was also cultured at 25 °C in Leibovitz L-15 medium supplemented with 10% SBF, 20 mM HEPES (Sigma), L-glutamine, and antibiotics (as described above). The FuB-1 line (CVCL_YJ47) was also obtained from brain (Fundulus heteroclitus) and was cultured in the same manner as described for DLB-1 with 0.16% sodium chloride (NaCl, Sigma). Finally, the PLHC-1 cell line (ATCC® CRL-2406), obtained from a hepatocellular carcinoma (Poeciliopsis lucida), was grown in Eagle’s minimal essential medium (EMEM) with 2 mM L-glutamine (Sigma), 0.1 mM nonessential amino acids (Sigma), 1 mM sodium pyruvate (Sigma), 5% SBF, 100 U. I. mL−1 penicillin, and 100 μg mL−1 streptomycin, and incubated at 30 °C. All the cells were incubated at 85% humidity and 5% CO2. The cells were allowed to grow until 80% confluence was achieved and were routinely detached with trypsin. The cells were counted, adjusted to 1 × 10⁴ cells mL−1, and seeded in 96-well Seahorse plates (Agilent Technologies, Santa Clara, CA, USA) for 24 h at the appropriate temperature for each cell line.
2.2. Mitochondrial Stress
Different parameters of mitochondrial metabolism were assessed using the Agilent Seahorse XF mitochondrial stress test kit (Agilent Technologies), according to the manufacturer’s instructions [6]. The Seahorse XFe96 Analyzer reader (Agilent Technologies), which determines the oxygen consumption rate (OCR) and the extracellular acidification rate (TAEC), was used. The standard culture medium was removed, and cells were incubated with 180 μL of Seahorse XF DMEM medium supplemented with 1 mM pyruvate, 2 mM glutamine, and 10 mM glucose (Agilent Technologies). In the case of the FuB-1 cell line, 0.16% NaCl was also added. The recommended concentrations for oligomycin (1.5 μM), carbonylcyanide-p-trifluoromethoxyphenylhydrazone (FCCP, 0.5 μM), and rotenone + antimycin A (0.5 μM) were used. For the PLHC-1 cell line, 2 μM FCCP was used instead of 0.5 µM. The Mito Stress assay was performed according to the standard protocol. After the completion of the assay, the fluorescence intensity of the Hoechst staining was determined and imported into Wave 2.6.3 software for the normalization of the results (Supplementary Figure S1). The Seahorse XF Mito Stress Test Report Generator tool was used to perform the analysis of the results. All analyses were performed in sextuplicate.
2.3. Statistical Analysis
The statistical differences between groups were evaluated by a one-way ANOVA analysis, followed by the Bonferroni (when the variable was homogeneous) or Games–Howell tests (when the variable was not homogeneous). The normality of the variables was confirmed by the Shapiro–Wilk test, and the homogeneity of variance was confirmed by Levene’s test. The significance level was 95% in all cases (p < 0.05). All data were analyzed using SPSS for Windows® (version 20.0, SPSS Inc., Chicago, IL, USA).
3. Results and Discussion
According to the Cellosaurus database, available at Expasy (https://web.expasy.org/cellosaurus/, accessed on 19 November 2022), there are currently about 934 fish cell lines, the most common being those obtained from fins or embryos [7], with few derived from nerve tissues [8]. In this study, we chose four different cell lines due to their remarkable research interest as well as their specific features, as commented above.
We used a mitochondrial stress test to compare the bioenergetic capacities of four fish cell lines. In the test, the four cell populations were sequentially exposed to oligomycin (ATP synthase inhibitor), the uncoupler carbonyl cyanide-4-(trifluoromethoxy) phenylhydrazone (FCCP), and an inhibitor of the complex III electron transport chain, antimycin A. Under these conditions, different parameters of cell mitochondria were estimated (Figure 1).
The parameters were the basal respiration (which evaluates the OCR used to satisfy the cellular ATP produced from mitochondrial proton leakage), maximal respiration (representing the maximum respiration rate that cells can achieve), proton leak (estimated as the remaining basal respiration not coupled to ATP production, which can be interpreted as a signal of mitochondrial damage or can be understood as a mechanism to regulate mitochondrial ATP production), ATP production (indicating the ATP produced by mitochondria and contributing to the cell’s energy reserve), nonmitochondrial oxygen consumption (oxygen that is not used in mitochondrial respiration), spare respiratory capacity, % of spare respiratory capacity (indicating the ability of cells to react to energy demand and how cellular respiration approaches the maximum, giving an indicator of cell flexibility), and finally coupling efficiency [20]. While it is true that different culture conditions could condition the basal metabolic rates of the present cell lines (and this is a limitation of the present study), the aim of the study was to assess the mitochondrial plasticity and bioenergetic dynamics of the cells.
The SAF-1 and PHLC-1 lines showed higher rates of basal respiration and maximal respiration (p < 0.05) than the FuB-1 cell line (Figure 1). In addition, ATP production was significantly higher in the SAF-1 and PHLC-1 cells compared to the values observed in the FuB-1 and DLB-1 cells (p < 0.05). The hepatic nature of PLHC-1 cells, as well as the high incubation temperature (30 °C instead of 25 °C), may explain the higher metabolic rate and mitochondrial capacity observed in them [21]. To the best of our knowledge, no comparison between the metabolic rates of different fish cell lines, such as those presented here, has been performed to date. However, several publications have indicated that the basal levels of different enzyme activities are mostly higher in SAF-1 than in DLB-1 [12,22]. These previous observations, together with the data presented in this study, suggest a higher metabolic rate, mitochondrial plasticity, and cellular flexibility in cells from the SAF-1 and PLHC-1 lines than in cells from the DLB-1 and FuB-1 lines, both derived from brain.
Regarding FuB-1, the mitochondrial parameters that were analyzed, such as the basal respiration, maximal respiration, proton leakage, ATP production, nonmitochondrial oxygen consumption, and reserve respiratory capacity were, in general, significantly lower (p < 0.05) than the values obtained in cells of the SAF-1 and PLHC-1 lines. These observations suggest that FuB-1 cells have a lower metabolic rate and lower cellular flexibility, showing a lower relative oxygen consumption capacity and reserve respiratory capacity than those exhibited by gill fibroblasts and liver cells [20]. In addition, FuB-1 showed lower metabolic and ATP production rates, indicating a lower capacity to produce potential energy, suggesting a lower adaptive capacity [23,24]. These results suggest the possibility that FuB-1 is the most sensitive to exposure to different compounds of the four tested cell lines [25].
The established cell line DLB-1 was obtained using a retrovirus for immortalization in European sea bass brain samples and expresses glial cell markers [26]. Most of the parameters analyzed in this study in the DLB-1 cells did not differ significantly from the results obtained in FuB-1 cells, which may be due to the fact that both cell lines were obtained from the same organ. However, the nonmitochondrial oxygen consumption was higher in SAF-1 and DLB-1 cells compared to the values observed in FuB-1 cells (p < 0.05), which could indicate some ability of these cells to obtain energy apart from mitochondria [27]. In addition, DLB-1 cells have certain resemblances to epithelial cells [26], which could explain the observed similarities at the mitochondrial level between these cells and cells of the SAF-1 line. Many more studies are needed to allow a better functional characterization of all these cells.
Finally, PLHC-1 cells showed the highest adaptive capacity and the highest indicator of mitochondrial flexibility and plasticity, which could be due to their higher metabolic rate and the need for a higher incubation temperature (compared to the other studied cell lines). In conclusion, the cells of the two brain cell lines showed lower metabolic rates and ATP production, indicating a lower capacity to produce potential energy, suggesting a lower adaptive capacity and, in fact, a higher sensitivity to different toxicants and/or stressors and, subsequently, to their environment than the other two lines. These results lay the groundwork for future studies, whether toxicological, metabolic, or otherwise, to explore the issue further. At the same time, they underline the importance of choosing the right cell line when performing different in vitro studies.
Supplementary Materials
The following supporting information can be downloaded at: https://www.mdpi.com/article/10.3390/fishes7060354/s1, Figure S1. Photomicrograph of the different cell lines SAF-1, DLB-1, FuB-1 and PLHC-1 (100X) after completion of the Mito Stress assay. The adherent cells were stained with Hoechst 33342 (5 μg mL−1, 20 min, 25 °C). The wells were then examined by fluorescence microscopy and photographed (Zeiss Axio Observer 7).
Author Contributions
Conceptualization, M.Á.E.; methodology, C.E.-R. and J.M.-L.; software, C.E.-R. and J.M.-L.; validation, C.E.-R.; formal analysis, C.E.-R.; investigation, C.E.-R., J.M.-L. and M.Á.E.; resources, M.Á.E.; data curation, C.E.-R.; writing—original draft preparation, C.E.-R. and J.M.-L.; writing—review and editing, C.E.-R., J.M.-L. and M.Á.E.; visualization, C.E.-R., J.M.-L. and M.Á.E.; supervision, M.Á.E.; project administration, M.Á.E.; funding acquisition, M.Á.E. All authors have read and agreed to the published version of the manuscript.
Funding
This work has been funded by the proyecto de investigación PID2020-113637RB-C21 financiado por MCIN/AEI/10.13039/501100011033 and is part of the ThinkInAzul program supported by the MCIN with funding from European Union Next Generation EU (PRTR-C17.I1) and by the Comunidad Autónoma de la Región de Murcia-Fundación Séneca (Spain).
Institutional Review Board Statement
Not applicable.
Data Availability Statement
The data are available on the DIGITUM institutional repository from the University of Murcia: http://hdl.handle.net/10201/125423 (accessed on 10 November 2022).
Conflicts of Interest
The authors declare no conflict of interest.
References
- Basu, H.S.; Wilganowski, N.; Robertson, S.; Reuben, J.M.; Cohen, E.N.; Zurita, A.; Ramachandran, S.S.; Xiao, L.L.-C.; Titus, M.; Wilding, G. Prostate Cancer Cells Survive Anti-androgen and Mitochondrial Metabolic Inhibitors by Modulating Glycolysis and Mitochondrial Metabolic Activities. Prostate 2021, 81, 799–811. [Google Scholar] [CrossRef] [PubMed]
- Azevedo, R.D.S.; Falcão, K.V.G.; Amaral, I.P.G.; Leite, A.C.R.; Bezerra, R.S. Mitochondria as Targets for Toxicity and Metabolism Research Using Zebrafish. Biochim. Biophys. Acta. Gen. Subj. 2020, 1864, 129634. [Google Scholar] [CrossRef] [PubMed]
- Weinberg, S.E.; Sena, L.A.; Chandel, N.S. Mitochondria in the Regulation of Innate and Adaptive Immunity. Immunity 2015, 42, 406–417. [Google Scholar] [CrossRef] [PubMed] [Green Version]
- Riley, J.S.; Tait, S.W. Mitochondrial DNA in Inflammation and Immunity. EMBO Rep. 2020, 21, e49799. [Google Scholar] [CrossRef] [PubMed]
- Schug, H.; Maner, J.; Hülskamp, M.; Begnaud, F.; Debonneville, C.; Berthaud, F.; Gimeno, S.; Schirmer, K. Extending the Concept of Predicting Fish Acute Toxicity In Vitro to the Intestinal Cell Line RTgutGC. ALTEX 2020, 37, 37–46. [Google Scholar] [CrossRef] [PubMed]
- Minghetti, M.; Leaver, M.J.; Taggart, J.B.; Casadei, E.; Auslander, M.; Tom, M.; George, S.G. Copper Induces Cu-ATPase ATP7A MRNA in a Fish Cell Line, SAF1. Comp. Biochem. Physiol. Part C Toxicol. Pharmacol. 2011, 154, 93–99. [Google Scholar] [CrossRef] [Green Version]
- Espinosa, C.; García Beltrán, J.M.; Esteban, M.A.; Cuesta, A. In Vitro Effects of Virgin Microplastics on Fish Head-Kidney Leucocyte Activities. Environ. Pollut. 2018, 235, 30–38. [Google Scholar] [CrossRef]
- Trapani, A.; Mandracchia, D.; Di Franco, C.; Cordero, H.; Morcillo, P.; Comparelli, R.; Cuesta, A.; Esteban, M.A. In Vitro Characterization of 6-Coumarin Loaded Solid Lipid Nanoparticles and Their Uptake by Immunocompetent Fish Cells. Colloids Surf. B Biointerfaces 2015, 127, 79–88. [Google Scholar] [CrossRef]
- Almeida, M.; Martins, M.A.; Soares, A.M.V.; Cuesta, A.; Oliveira, M. Polystyrene Nanoplastics Alter the Cytotoxicity of Human Pharmaceuticals on Marine Fish Cell Lines. Environ. Toxicol. Pharmacol. 2019, 69, 57–65. [Google Scholar] [CrossRef]
- García Beltrán, J.M.; Espinosa, C.; Guardiola, F.A.; Esteban, M.Á. Dietary Dehydrated Lemon Peel Improves the Immune but Not the Antioxidant Status of Gilthead Seabream (Sparus aurata L.). Fish Shellfish Immunol. 2017, 64, 426–436. [Google Scholar] [CrossRef]
- Valero, Y.; López-Vázquez, C.; Souto, S.; Olveira, J.G.; Cuesta, A.; Bandín, I. Differential Nervous Necrosis Virus (NNV) Replication in Five Putative Susceptible Cell Lines. Pathogens 2021, 10, 1565. [Google Scholar] [CrossRef] [PubMed]
- Chaves-Pozo, E.; Bandín, I.; Olveira, J.G.; Esteve-Codina, A.; Gómez-Garrido, J.; Dabad, M.; Alioto, T.; Ángeles Esteban, M.; Cuesta, A. European Sea Bass Brain DLB-1 Cell Line Is Susceptible to Nodavirus: A Transcriptomic Study. Fish Shellfish Immunol. 2019, 86, 14–24. [Google Scholar] [CrossRef] [PubMed]
- Leach, G.J.; Taylor, M.H. The Role of Cortisol in Stress-Induced Metabolic Changes in Fundulus heteroclitus. Gen. Comp. Endocrinol. 1980, 42, 219–227. [Google Scholar] [CrossRef] [PubMed]
- Fangue, N.; Hofmeister, M.; Schulte, P. Intraspecific Variation in Thermal Tolerance and Heat Shock Protein Gene Expression in Common Killifish, Fundulus heteroclitus. J. Exp. Biol. 2006, 209, 2859–2872. [Google Scholar] [CrossRef] [PubMed] [Green Version]
- Carvan, M.J.; Gallagher, E.P.; Goksøyr, A.; Hahn, M.E.; Joakim Larsson, D.G. Fish Models in Toxicology. Zebrafish 2007, 4, 9–20. [Google Scholar] [CrossRef] [PubMed]
- Ruiz-Palacios, M.; Almeida, M.; Martins, M.A.; Oliveira, M.; Esteban, M.Á.; Cuesta, A. Establishment of a Brain Cell Line (FuB-1) from Mummichog (Fundulus heteroclitus) and Its Application to Fish Virology, Immunity and Nanoplastics Toxicology. Sci. Total Environ. 2020, 708, 134821. [Google Scholar] [CrossRef]
- Bols, N.C.; Dayeh, V.R.; Lee, L.E.J.; Schirmer, K. Use of Fish Cell Lines in the Toxicology and Ecotoxicology of Fish. Piscine Cell Lines in Environmental Toxicology. Biochem. Mol. Biol. Fishes 2005, 6, 43–84. [Google Scholar] [CrossRef]
- Hua, Q.; Mi, B.; Xu, F.; Wen, J.; Zhao, L.; Liu, J.; Huang, G. Hypoxia-Induced LncRNA-AC020978 Promotes Proliferation and Glycolytic Metabolism of Non-Small Cell Lung Cancer by Regulating PKM2/HIF-1α Axis. Theranostics 2020, 10, 4762–4778. [Google Scholar] [CrossRef]
- Bairoch, A. The Cellosaurus, a Cell-Line Knowledge Resource. J. Biomol. Tech. 2018, 29, 25–38. [Google Scholar] [CrossRef]
- Divakaruni, A.S.; Paradyse, A.; Ferrick, D.A.; Murphy, A.N.; Jastroch, M. Analysis and Interpretation of Microplate-Based Oxygen Consumption and PH Data. Methods Enzymol. 2014, 547, 309–354. [Google Scholar] [CrossRef]
- Berntsen, H.H.; Bech, C. Incubation Temperature and Physiological Aging in the Zebra Finch. PLoS ONE 2021, 16, e0260037. [Google Scholar] [CrossRef] [PubMed]
- Espinosa, C.; Manuguerra, S.; Cuesta, A.; Esteban, M.A.; Santulli, A.; Messina, C.M. Sub-Lethal Doses of Polybrominated Diphenyl Ethers Affect Some Biomarkers Involved in Energy Balance and Cell Cycle, via Oxidative Stress in the Marine Fish Cell Line SAF-1. Aquat. Toxicol. 2019, 210, 1–10. [Google Scholar] [CrossRef] [PubMed]
- Bonora, M.; Patergnani, S.; Rimessi, A.; De Marchi, E.; Suski, J.M.; Bononi, A.; Giorgi, C.; Marchi, S.; Missiroli, S.; Poletti, F.; et al. ATP Synthesis and Storage. Purinergic Signal. 2012, 8, 343–357. [Google Scholar] [CrossRef] [Green Version]
- Ibrahim, A.; Yucel, N.; Kim, B.; Arany, Z. Local Mitochondrial ATP Production Regulates Endothelial Fatty Acid Uptake and Transport. Cell Metab. 2020, 32, 309–319.e7. [Google Scholar] [CrossRef]
- Jaber, S.M.; Yadava, N.; Polster, B.M. Mapping Mitochondrial Respiratory Chain Deficiencies by Respirometry: Beyond the Mito Stress Test. Exp. Neurol. 2020, 328, 113282. [Google Scholar] [CrossRef] [PubMed]
- Morcillo, P.; Chaves-Pozo, E.; Meseguer, J.; Esteban, M.Á.; Cuesta, A. Establishment of a New Teleost Brain Cell Line (DLB-1) from the European Sea Bass and Its Use to Study Metal Toxicology. Toxicol. In Vitro 2017, 38, 91–100. [Google Scholar] [CrossRef] [PubMed]
- Plitzko, B.; Loesgen, S. Measurement of Oxygen Consumption Rate (OCR) and Extracellular Acidification Rate (ECAR) in Culture Cells for Assessment of the Energy Metabolism. Bio-Protocol 2018, 8, e2850. [Google Scholar] [CrossRef]
Figure 1.
Comparison of cell respiratory capacities between different cell lines (SAF-1, DLB-1, FuB-1, and PLHC-1). Oxygen consumption rates (OCR) were measured following overnight cell proliferation. The Mito Stress Test was conducted following the injection of the test drug, which consisted of the sequential additions of oligomycin (1.5 μM), FCCP (0.5 μM; 2 µM in the case of PLHC-1), and rotenone + antimycin A (0.5 μM). The different parameters were calculated using Wave 2.6.3 software and the Seahorse XF Mito Stress Test Report Generator tool, according to the Agilent Technologies procedures. Absolute OCR values are shown (means ± SDs, n = 5 wells). Statistical differences are denoted by different letters (p < 0.05).

Publisher’s Note: MDPI stays neutral with regard to jurisdictional claims in published maps and institutional affiliations. |
© 2022 by the authors. Licensee MDPI, Basel, Switzerland. This article is an open access article distributed under the terms and conditions of the Creative Commons Attribution (CC BY) license (https://creativecommons.org/licenses/by/4.0/).
Share and Cite
MDPI and ACS Style
Espinosa-Ruiz, C.; Mayor-Lafuente, J.; Esteban, M.Á. Mitochondrial Metabolism Characterization of Four Different Fish Cell Lines. Fishes 2022, 7, 354. https://doi.org/10.3390/fishes7060354
AMA Style
Espinosa-Ruiz C, Mayor-Lafuente J, Esteban MÁ. Mitochondrial Metabolism Characterization of Four Different Fish Cell Lines. Fishes. 2022; 7(6):354. https://doi.org/10.3390/fishes7060354
Chicago/Turabian StyleEspinosa-Ruiz, Cristóbal, Javier Mayor-Lafuente, and M. Ángeles Esteban. 2022. "Mitochondrial Metabolism Characterization of Four Different Fish Cell Lines" Fishes 7, no. 6: 354. https://doi.org/10.3390/fishes7060354