Impedance Characterization of an LCO-NMC/Graphite Cell: Ohmic Conduction, SEI Transport and Charge-Transfer Phenomenon


Departament d’Enginyeria Electrònica, Grup de Processat d’Energia i Circuits Integrats (EPIC), Escola d’Enginyeria de Barcelona Est (EEBE), Universitat Politècnica de Catalunya-BarcelonaTech, 08019 Barcelona, Spain
*
Author to whom correspondence should be addressed.
Batteries 2018, 4(3), 43; https://doi.org/10.3390/batteries4030043
Submission received: 13 July 2018
/
Revised: 10 August 2018
/
Accepted: 21 August 2018
/
Published: 10 September 2018
Abstract
:Currently, Li-ion cells are the preferred candidates as energy sources for existing portable applications and for those being developed. Thus, a proper characterization of Li-ion cells is required to optimize their use and their manufacturing process. In this study, the transport phenomena and electrochemical processes taking place in LiCoO2-Li(NiMnCo)O2/graphite (LCO-NMC/graphite) cells are identified from half-cell measurements by means of impedance spectroscopy. The results are calculated from current densities, instead of absolute values, for the future comparison of this data with other cells. In particular, impedance spectra are fitted to simple electrical models composed of an inductive part, serial resistance, and various RQ networks—the parallel combination of a resistor and a constant phase element—depending on the cell. Thus, the evolution of resistances, capacitances, and the characteristic frequencies of the various effects are tracked with the state-of-charge (SoC) at two aging levels. Concretely, two effects are identified at the impedance spectrum; one is clearly caused by the charge transfer at the positive electrode, whereas the other one is presumably caused by the transport of lithium ions across the solid electrolyte interphase (SEI) layer. Moreover, as the cells age, the characteristic frequency of the charge transfer is drastically reduced by a factor of around 70%.
1. Introduction
Li-ion batteries are widespread in many portable applications ranging from cellphones to electro-mobility. These batteries offer high energy and power densities which make them suitable for such applications [1,2,3]. However, their performance degrades with time and use. This is because the materials constituting the cells wear and age, limiting their lifetime. Taking this degradation into consideration is of particular importance in applications such as the electric vehicle because batteries account for a large part of the total costs, and safety and reliability might be jeopardized [4,5,6].
Large research efforts have been made to understand aging in Li-ion batteries [7,8,9,10,11,12,13]. Aging is commonly evaluated in terms of capacity fade or impedance rise under different conditions [9]. Both capacity fade and impedance rise are not due to a single cause but to a combination of various aging mechanisms, such as the solid electrolyte interphase (SEI) formation, mechanical degradation, or lithium plating [14]. Moreover, to quantify and manage the concurrent impacts on aging of temperature, depth of discharge, and current density is a very challenging task [9]. Thus, even though aging mechanisms are mostly identified and defined, they are still neither well understood nor quantified [9,15]. In fact, a reliable system to provide a quantitative estimation of aging is still not commercially available.
Electrochemical impedance spectroscopy (EIS) is a non-destructive technique that is commonly employed to evaluate transport phenomena and electrochemical reactions [9,16,17,18,19,20,21]. In the particular case of batteries, EIS provides information about the kinetic and mass transport properties of the cells and allows the relation of these electrical measurements to the physical processes. One of the advantages of EIS is that the measured effects can be easily translated into equivalent electrical circuits, which are commonly based on combinations of resistive, capacitive, and inductive elements along with constant phase elements (CPEs) [20,21,22,23,24]. In the literature, it is common to find the evolution of the resistive parts with state-of-charge (SoC) [9,18,22,25,26] but less information is available about the evolution of capacitance or characteristic frequency [20,26]. Nevertheless, in order to get a better understanding of the electrochemical processes and transport phenomena that take place in the cells, capacitance and frequency are also important parameters to be considered. For instance, information about the SEI or the thickness of the electrical double layer, can be obtained from capacitance [27]. Moreover, the characteristic frequency accounts for the speed at which the various processes take place. Although the evolution with SoC of those parameters is not commonly tracked, concrete values of capacitance and characteristic frequency at particular SoCs or temperatures can be found in the literature [7,16,18,23].
In this context, however, interpreting impedance spectroscopy data requires a previous knowledge of the field, and additional tests have to be carried out to determine the physical origin of the various contributions [28]. Furthermore, the impedance of a cell is influenced by the contributions of both positive and negative electrodes and it is not straightforward to determine which electrode is causing each of the physical processes. In the literature, two different approaches are commonly considered to overcome this: on the one hand, cells are disassembled and half-cells or symmetrical cells are built and tested [7,16,17,18,24,25], on the other hand, full cells are directly measured but in a three-electrode configuration by adding a reference electrode [10,29,30,31,32,33,34].
In this contribution, we aim to investigate the impedance response of a commercial LiCoO2-Li(NiMnCo)O2/graphite (LCO-NMC/graphite) cell at various SoCs and two different aging levels at 25 °C in order to obtain a deeper understanding of battery degradation. We compare the impedance spectra of a full cell with the results of half-cells (anode—Li and Li—cathode in a two-electrode configuration in all cases) to determine the electrode that causes each of the electrochemical and transport processes. We represent the evolution as a function of the SoC of resistances, capacitances, and characteristic frequencies. As stated above, resistance is commonly studied but capacitance and frequency are not. These variables are valuable to understand the dynamic effects of the batteries, whereas resistance is related to the static effects. In addition, the results are provided in units relative to the active surface area of the electrodes for the sake of comparison with other cells. Thus, we aim to contribute to the better understanding and characterization of commercial lithium-ion cells. These results may help to optimize battery design and operation.
2. Results and Discussion
Firstly, we present the impedance responses of half-cells, then the impedance spectra of the full cells, and finally we compare both spectra. To this end, simple electrical circuits are fitted to the various impedance responses. From the fitting results, the evolution of impedance with SoC is evaluated for each cell and each electrochemical or transport process. Furthermore, the results are represented at two aging states: fresh and aged (refer to Section 3 for their description). From the results, the major contributors to impedance are identified for each of the electrodes and their physical origins are discussed.
2.1. Half-Cells Impedance
Impedance responses of positive and negative electrodes are studied by means of half-cell measurements. Firstly, we evaluate the impedance spectra of the negative electrode half-cell—composed of graphite and metallic lithium—and we track the evolution of the resistances, capacitances, and characteristic frequencies of the various electrochemical and transport processes. Then, we perform the same analysis in positive electrode half-cells—composed of LCO-NMC and metallic lithium—and we track the evolution of resistances, capacitances, and frequencies with lithium composition. It should be noted that the ohmic resistance of the half-cells is not evaluated in this study. This resistance cannot be compared to the ohmic resistance measured in the full cell configuration because we add a new separator and fresh electrolyte during the manufacturing process of the half-cells (refer to Section 3.2 for more details).
2.1.1. Negative Electrode (Graphite/Li Half-Cell)
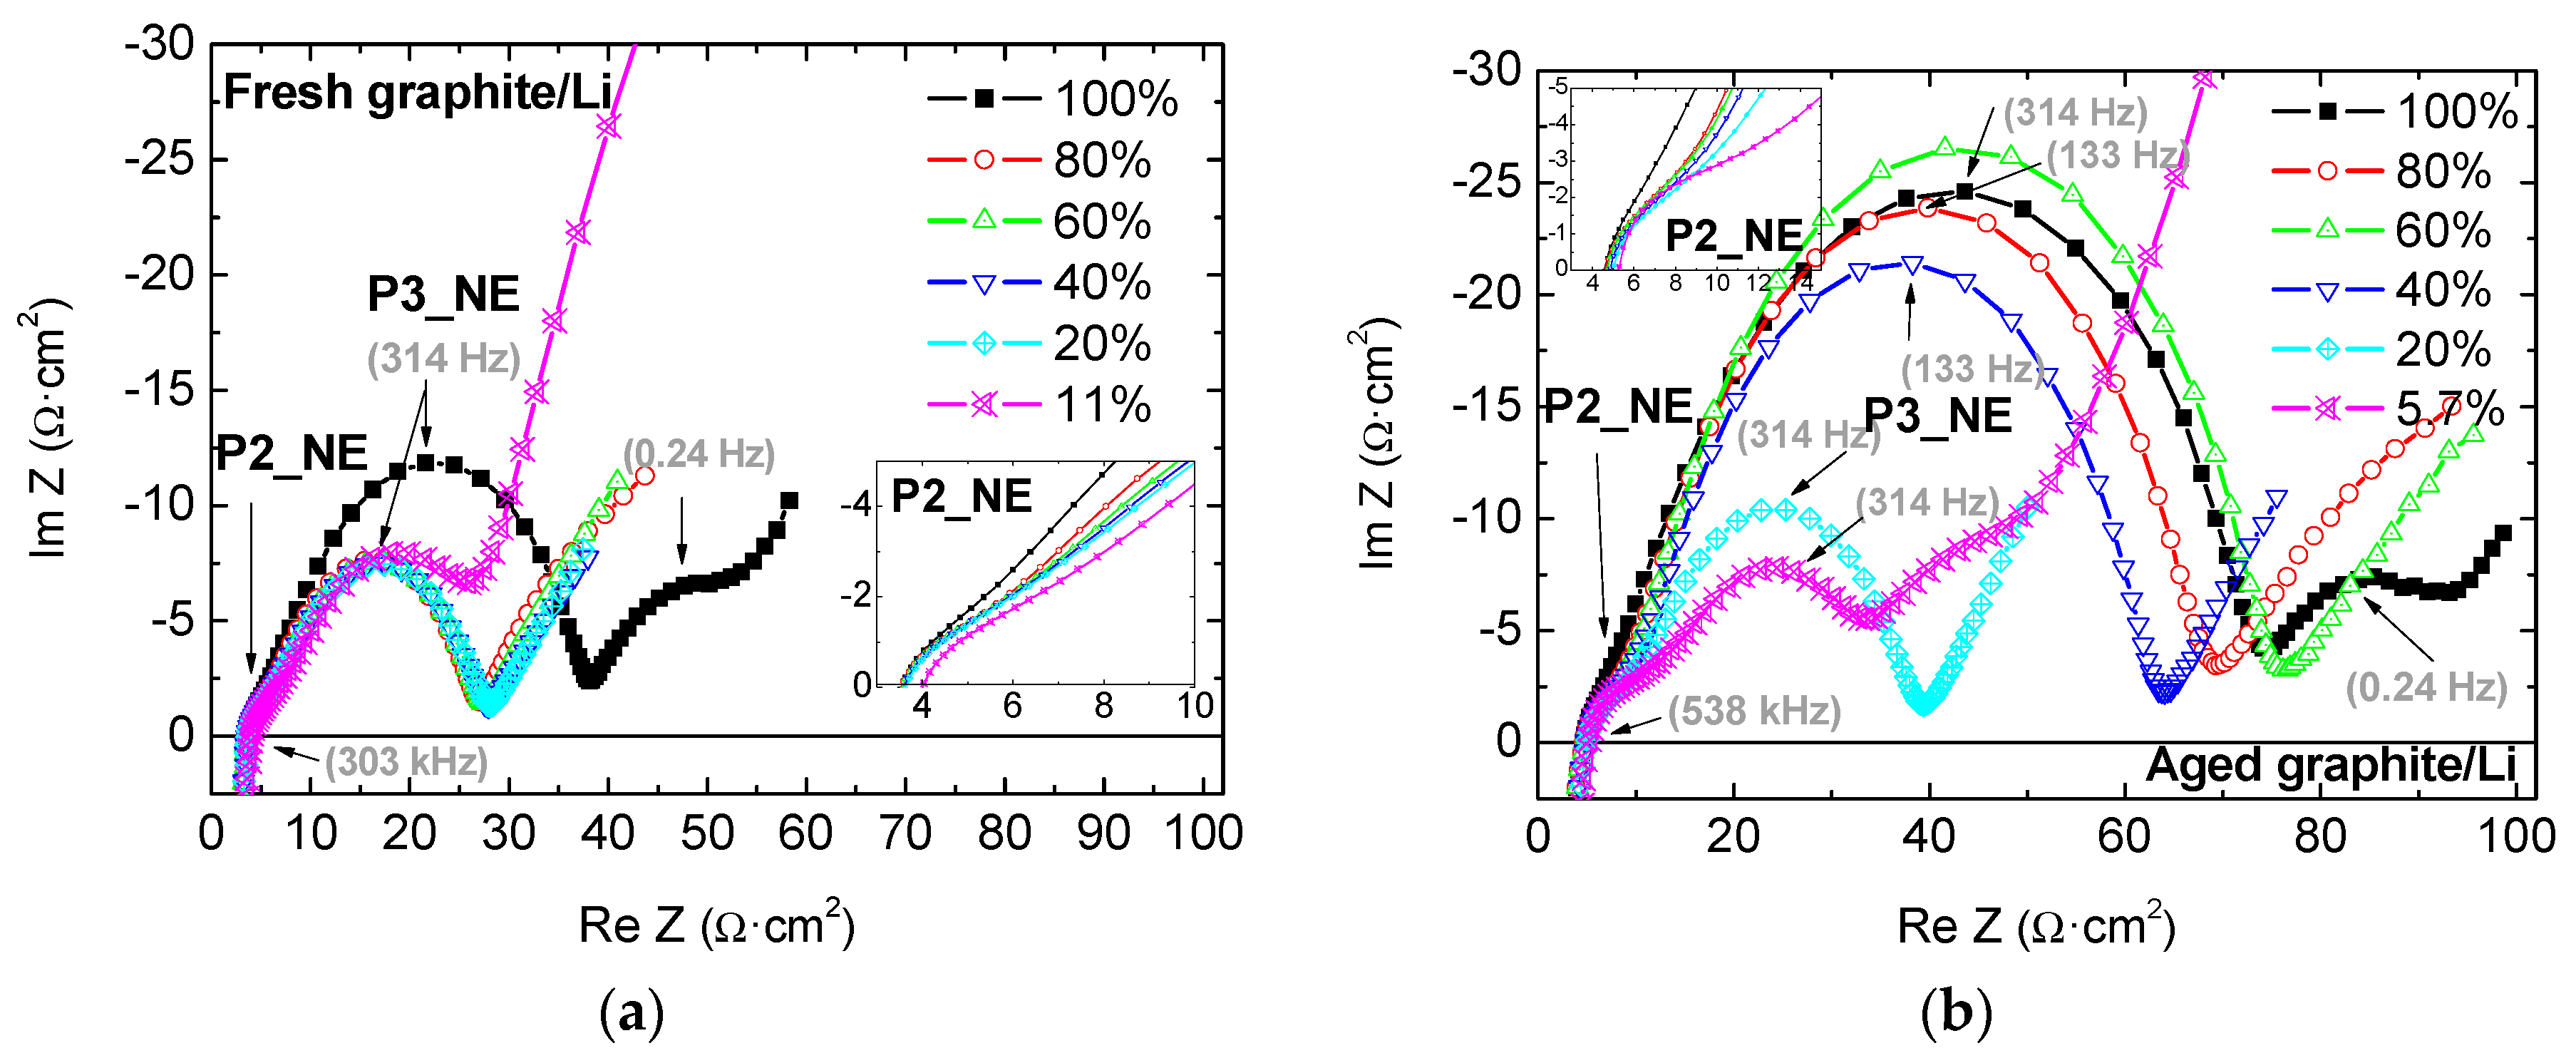
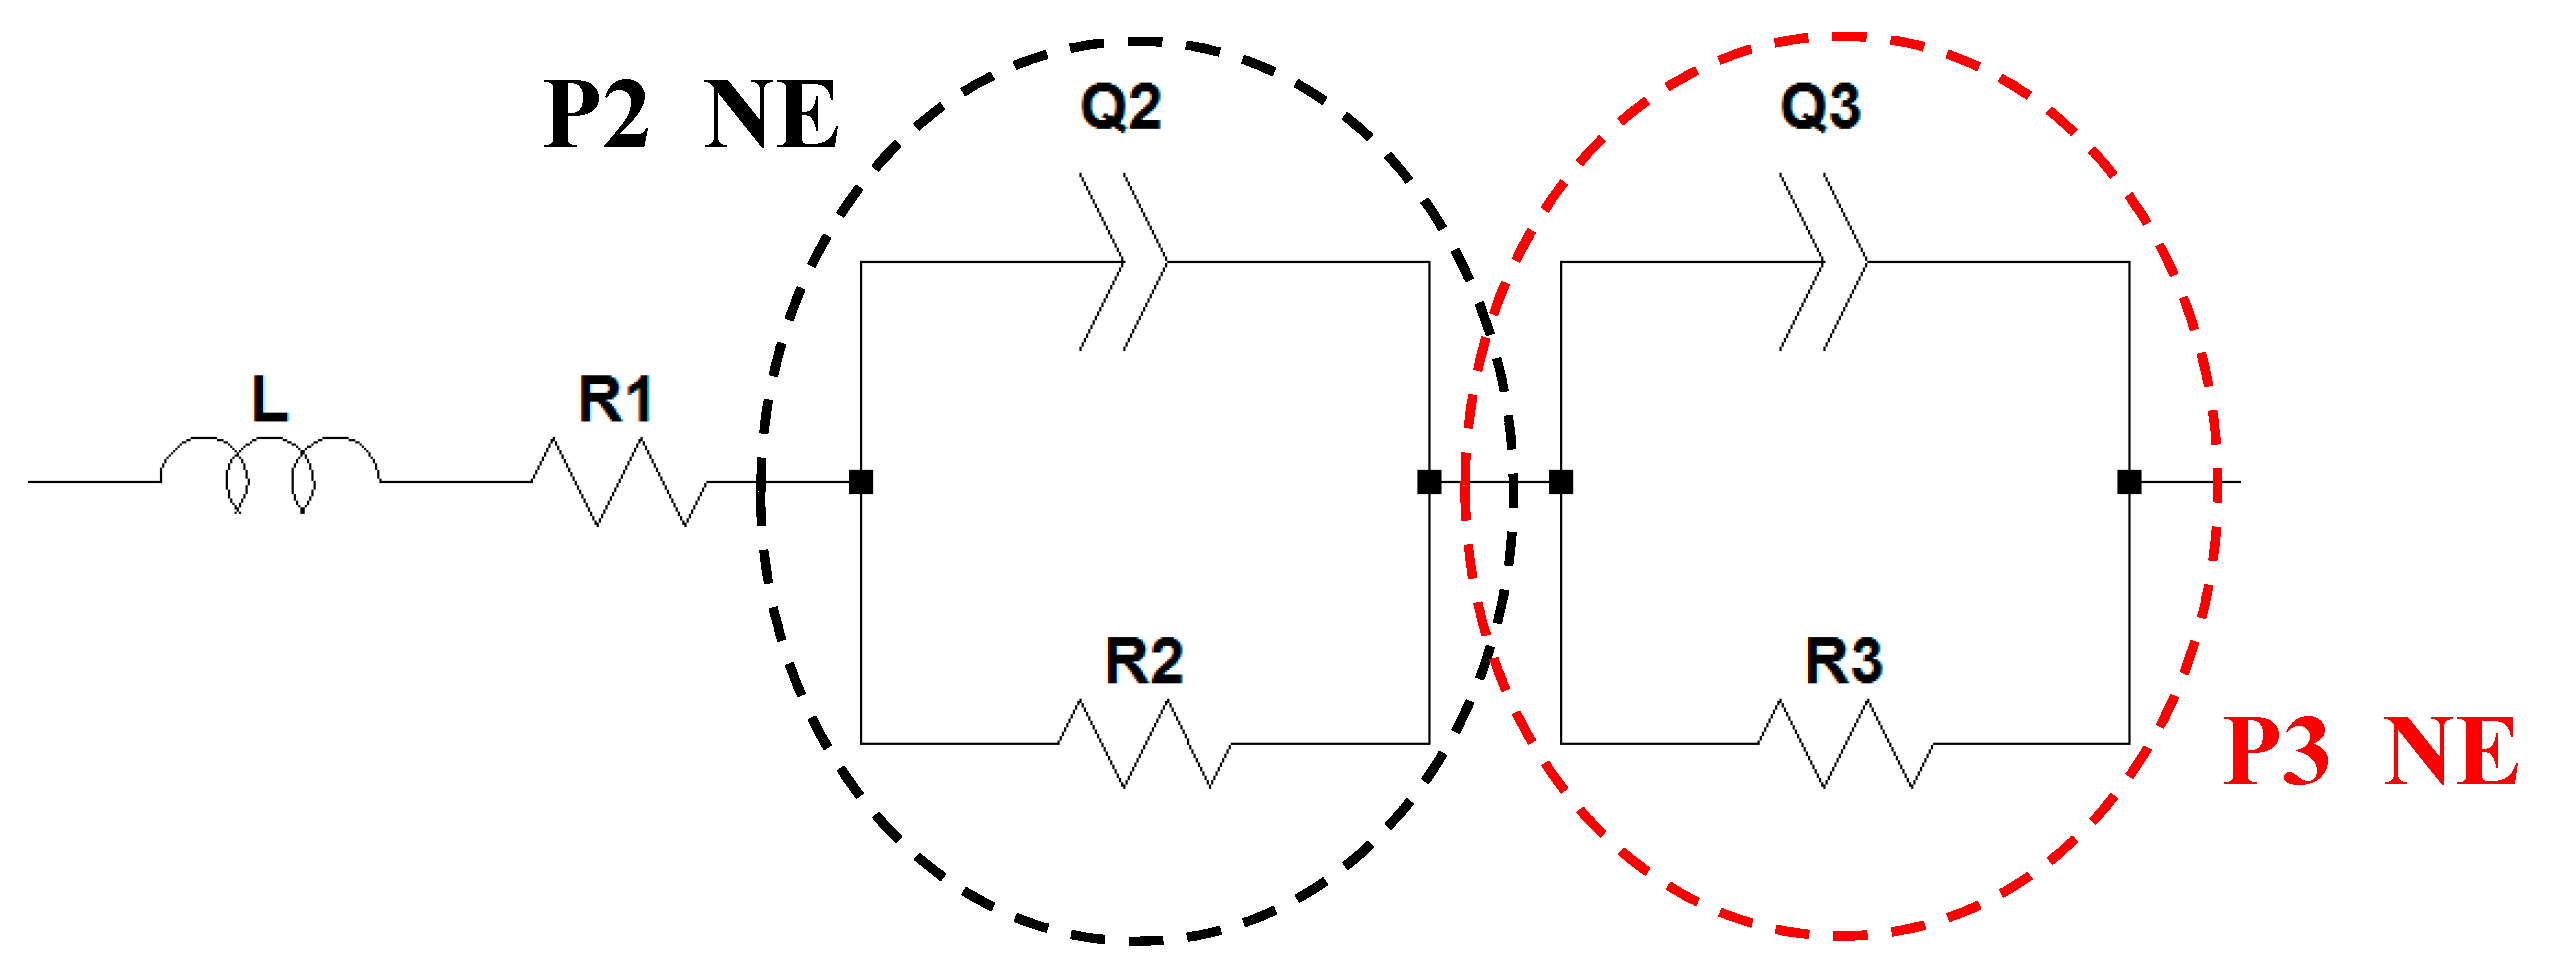
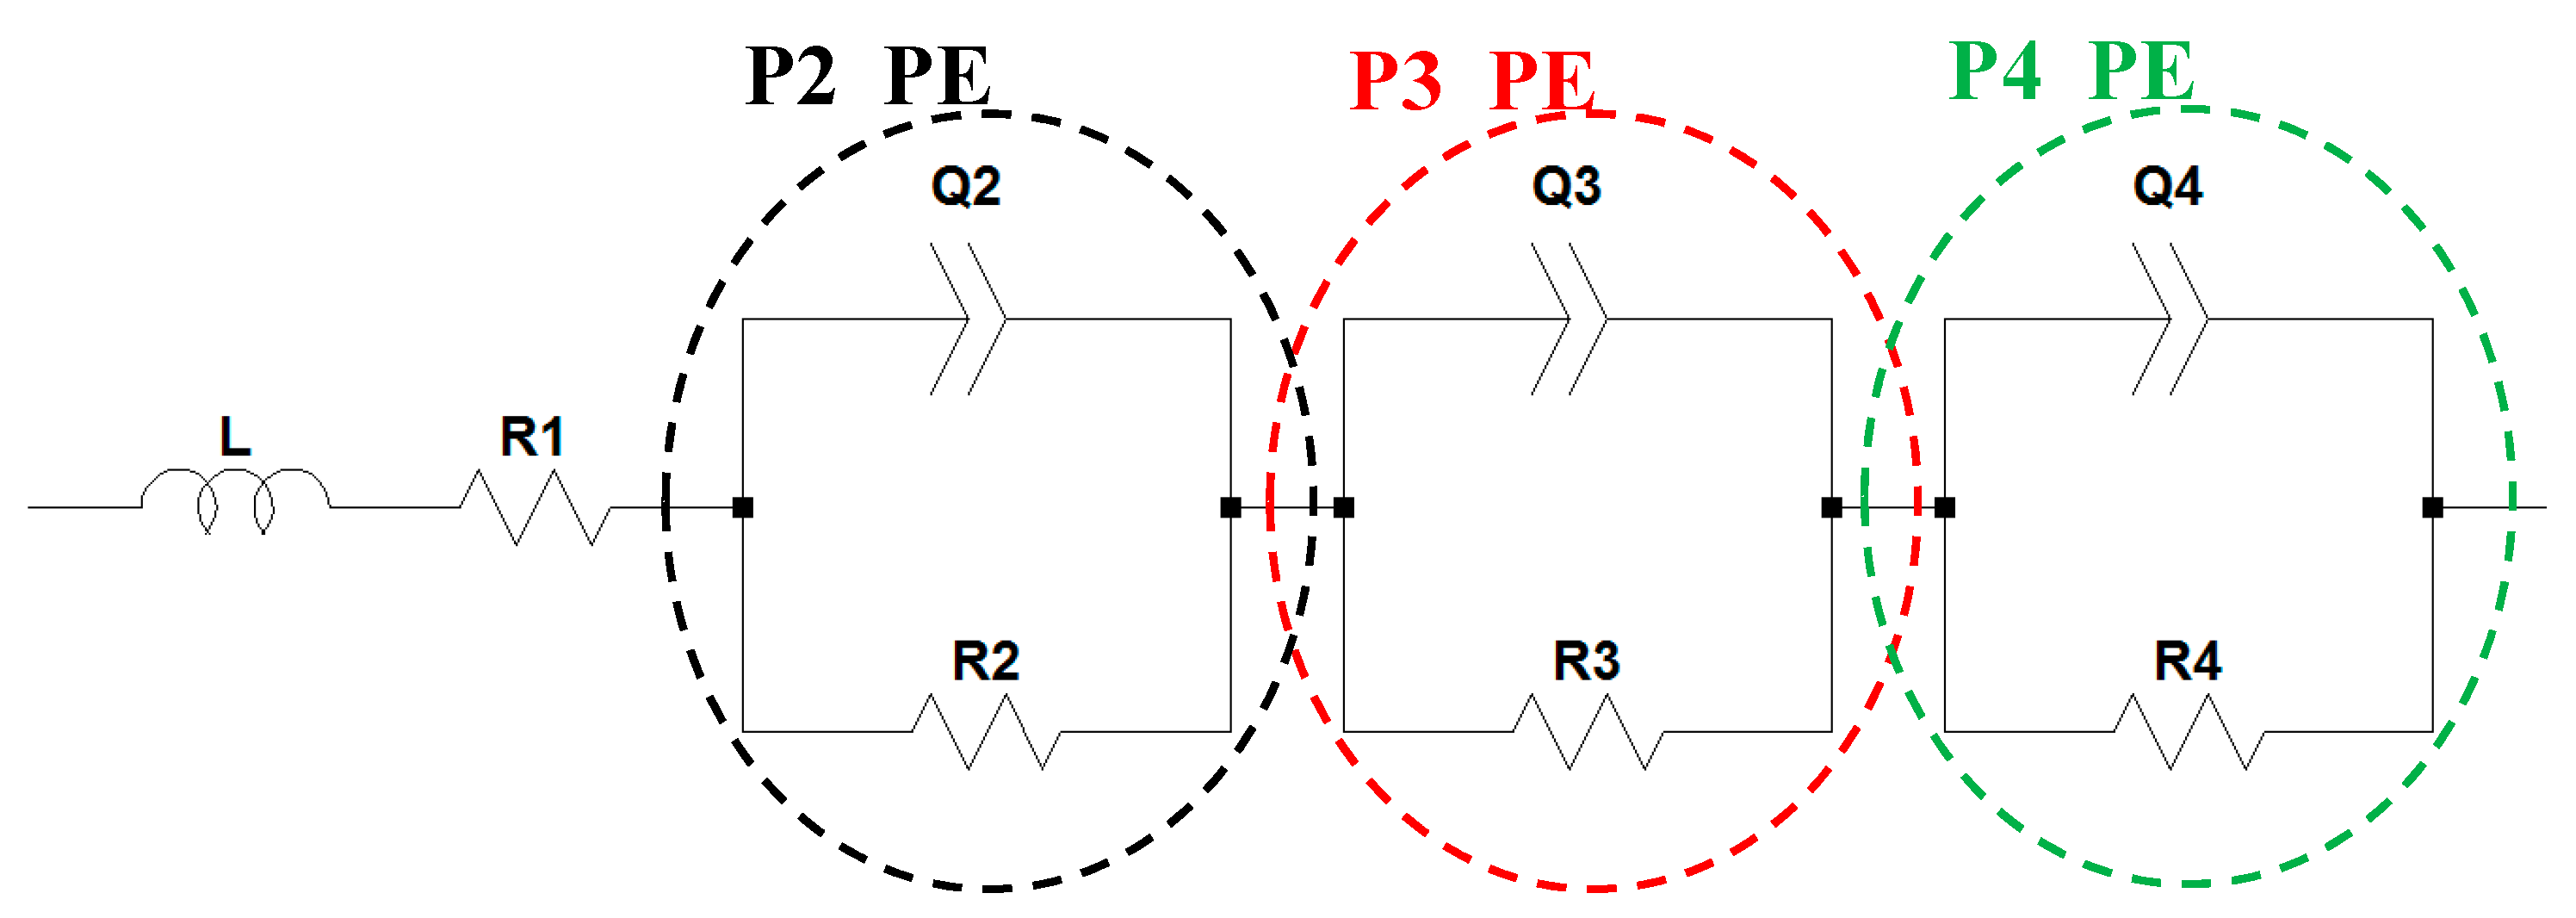
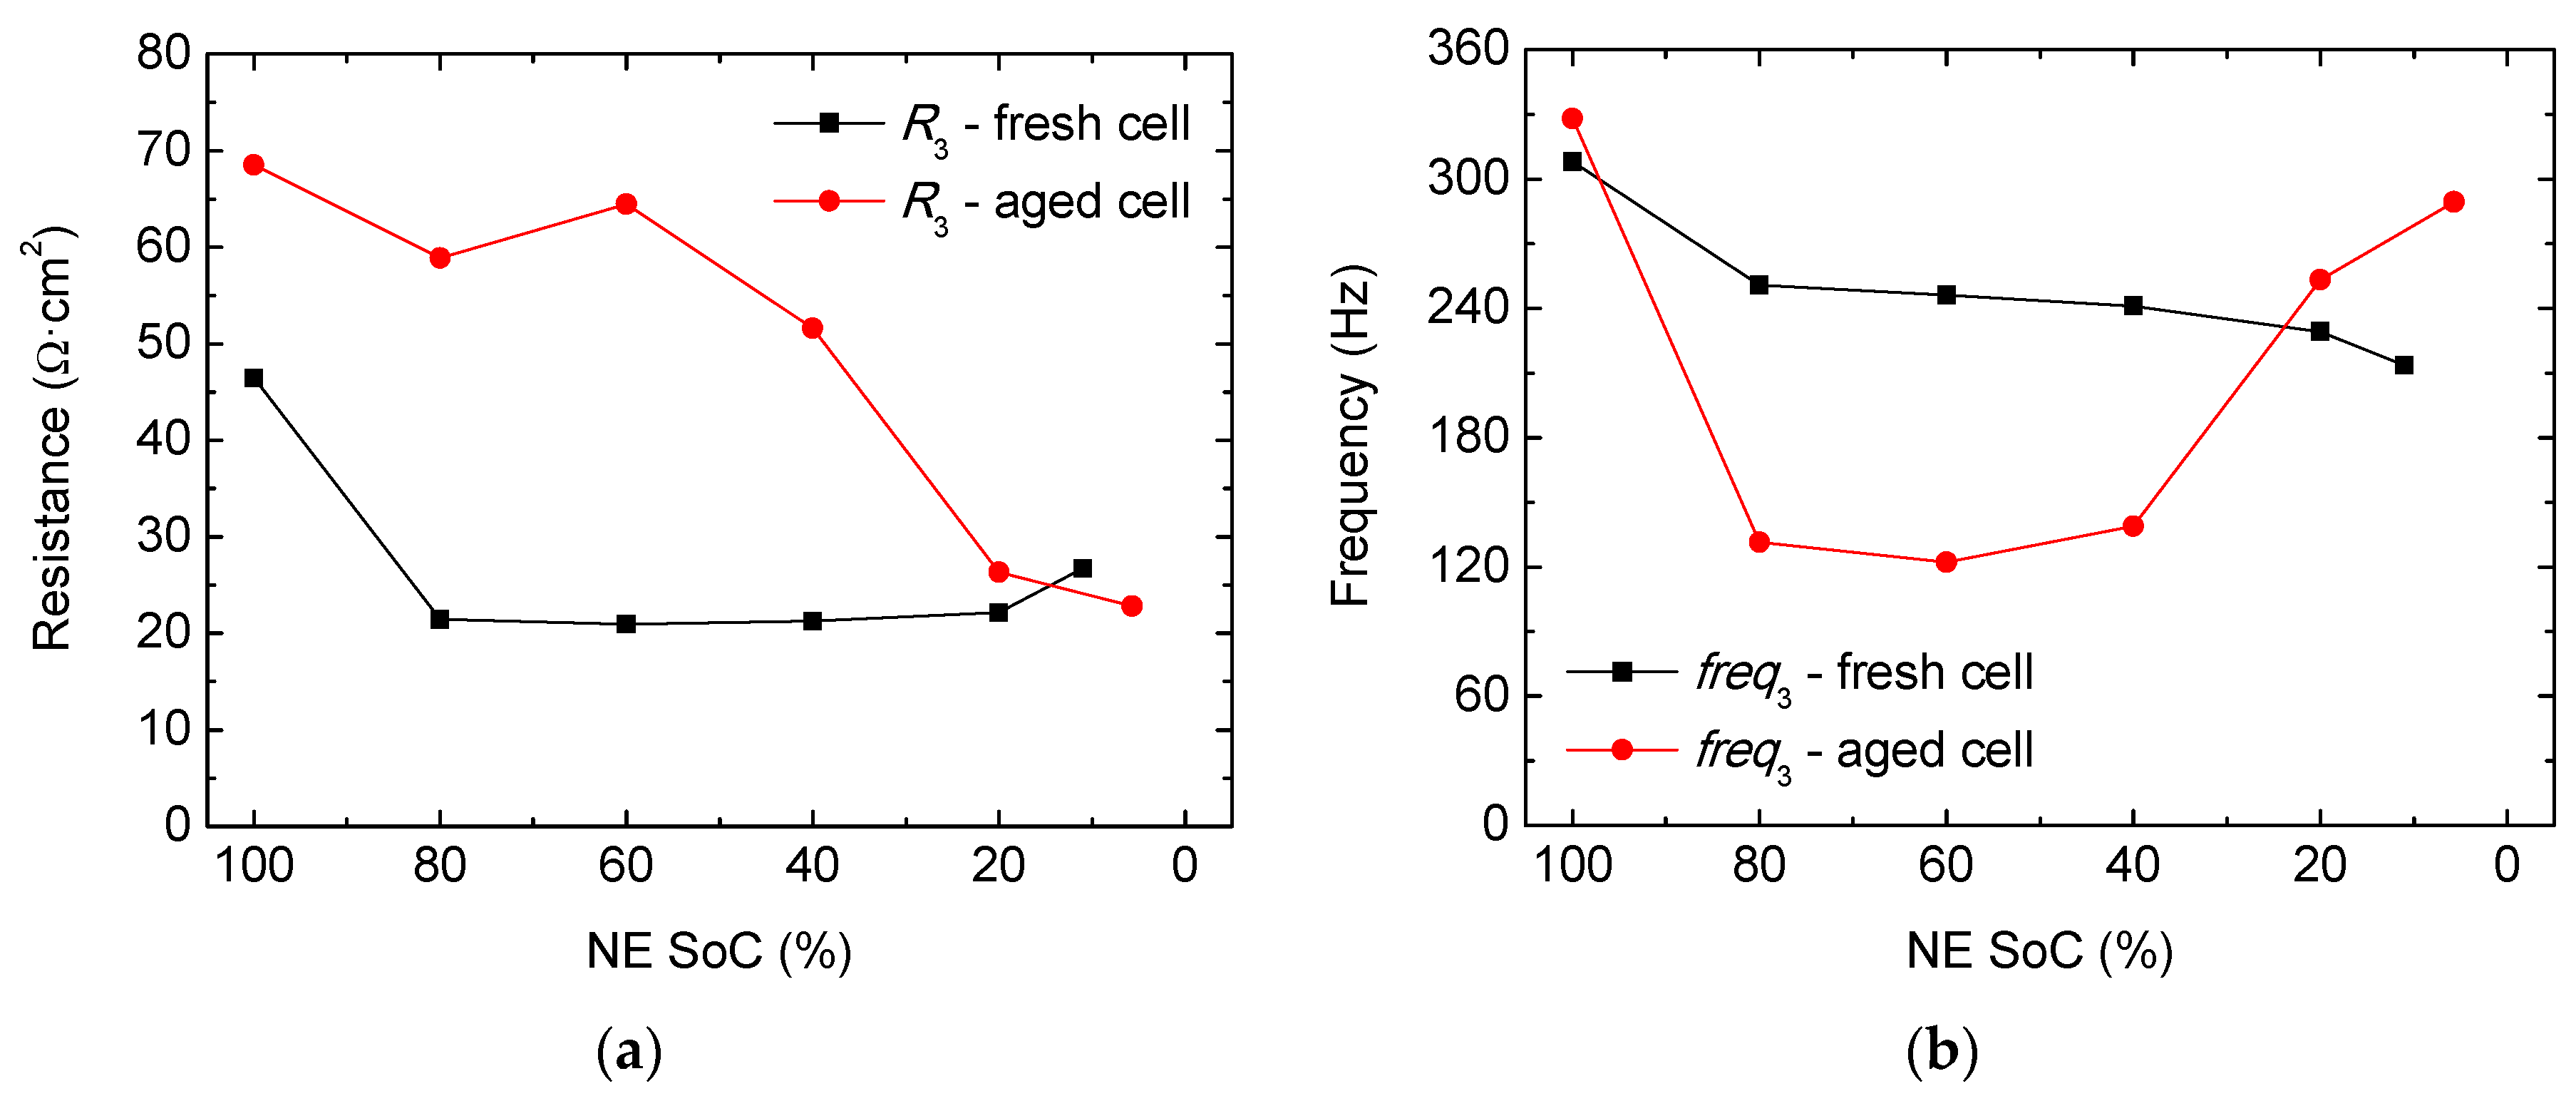
At the impedance spectrum of the negative electrode, two semicircles are distinguishable in all SoCs and at both aging levels (Figure 1). The first semicircle is located at high frequencies, between 10 kHz and 60 kHz, and shows a small radius (P2_NE), illustrated in the insets of Figure 1. The second semicircle (P3_NE), which shows the highest impedance contribution, is located at medium frequencies (between 120 Hz and 350 Hz depending on SoC and aging) (Figure 1a,b). Moreover, there is a third semicircle at very low frequencies (below 1 Hz), which can only be identified at lowest and the highest negative electrode (NE) SoCs. However, this third semicircle has not been investigated because only frequencies above 1 Hz have been fitted. Thus, we selected the number of RQ networks (see Figure 2) depending on the number of semicircles we could identify in the frequency range of interest (as is also found in Reference [35]). In these conditions, the most appropriate electrical model to describe the behavior of these half-cells at 25 °C is composed of an inductive part (L), a pure resistive component (R1), and two RQ networks (Figure 2).
In our analysis, we track the evolution of capacitance with SoC even though constant-phase elements are employed in the equivalent circuits, as in the case of Figure 2 and Figure 3b. This is because it is more significant to compare capacitance values that have a physical meaning rather than a CPE (for further information about CPEs, refer to Section 3.5). The relationship between capacitance and CPEs is obtained through Equation (1).
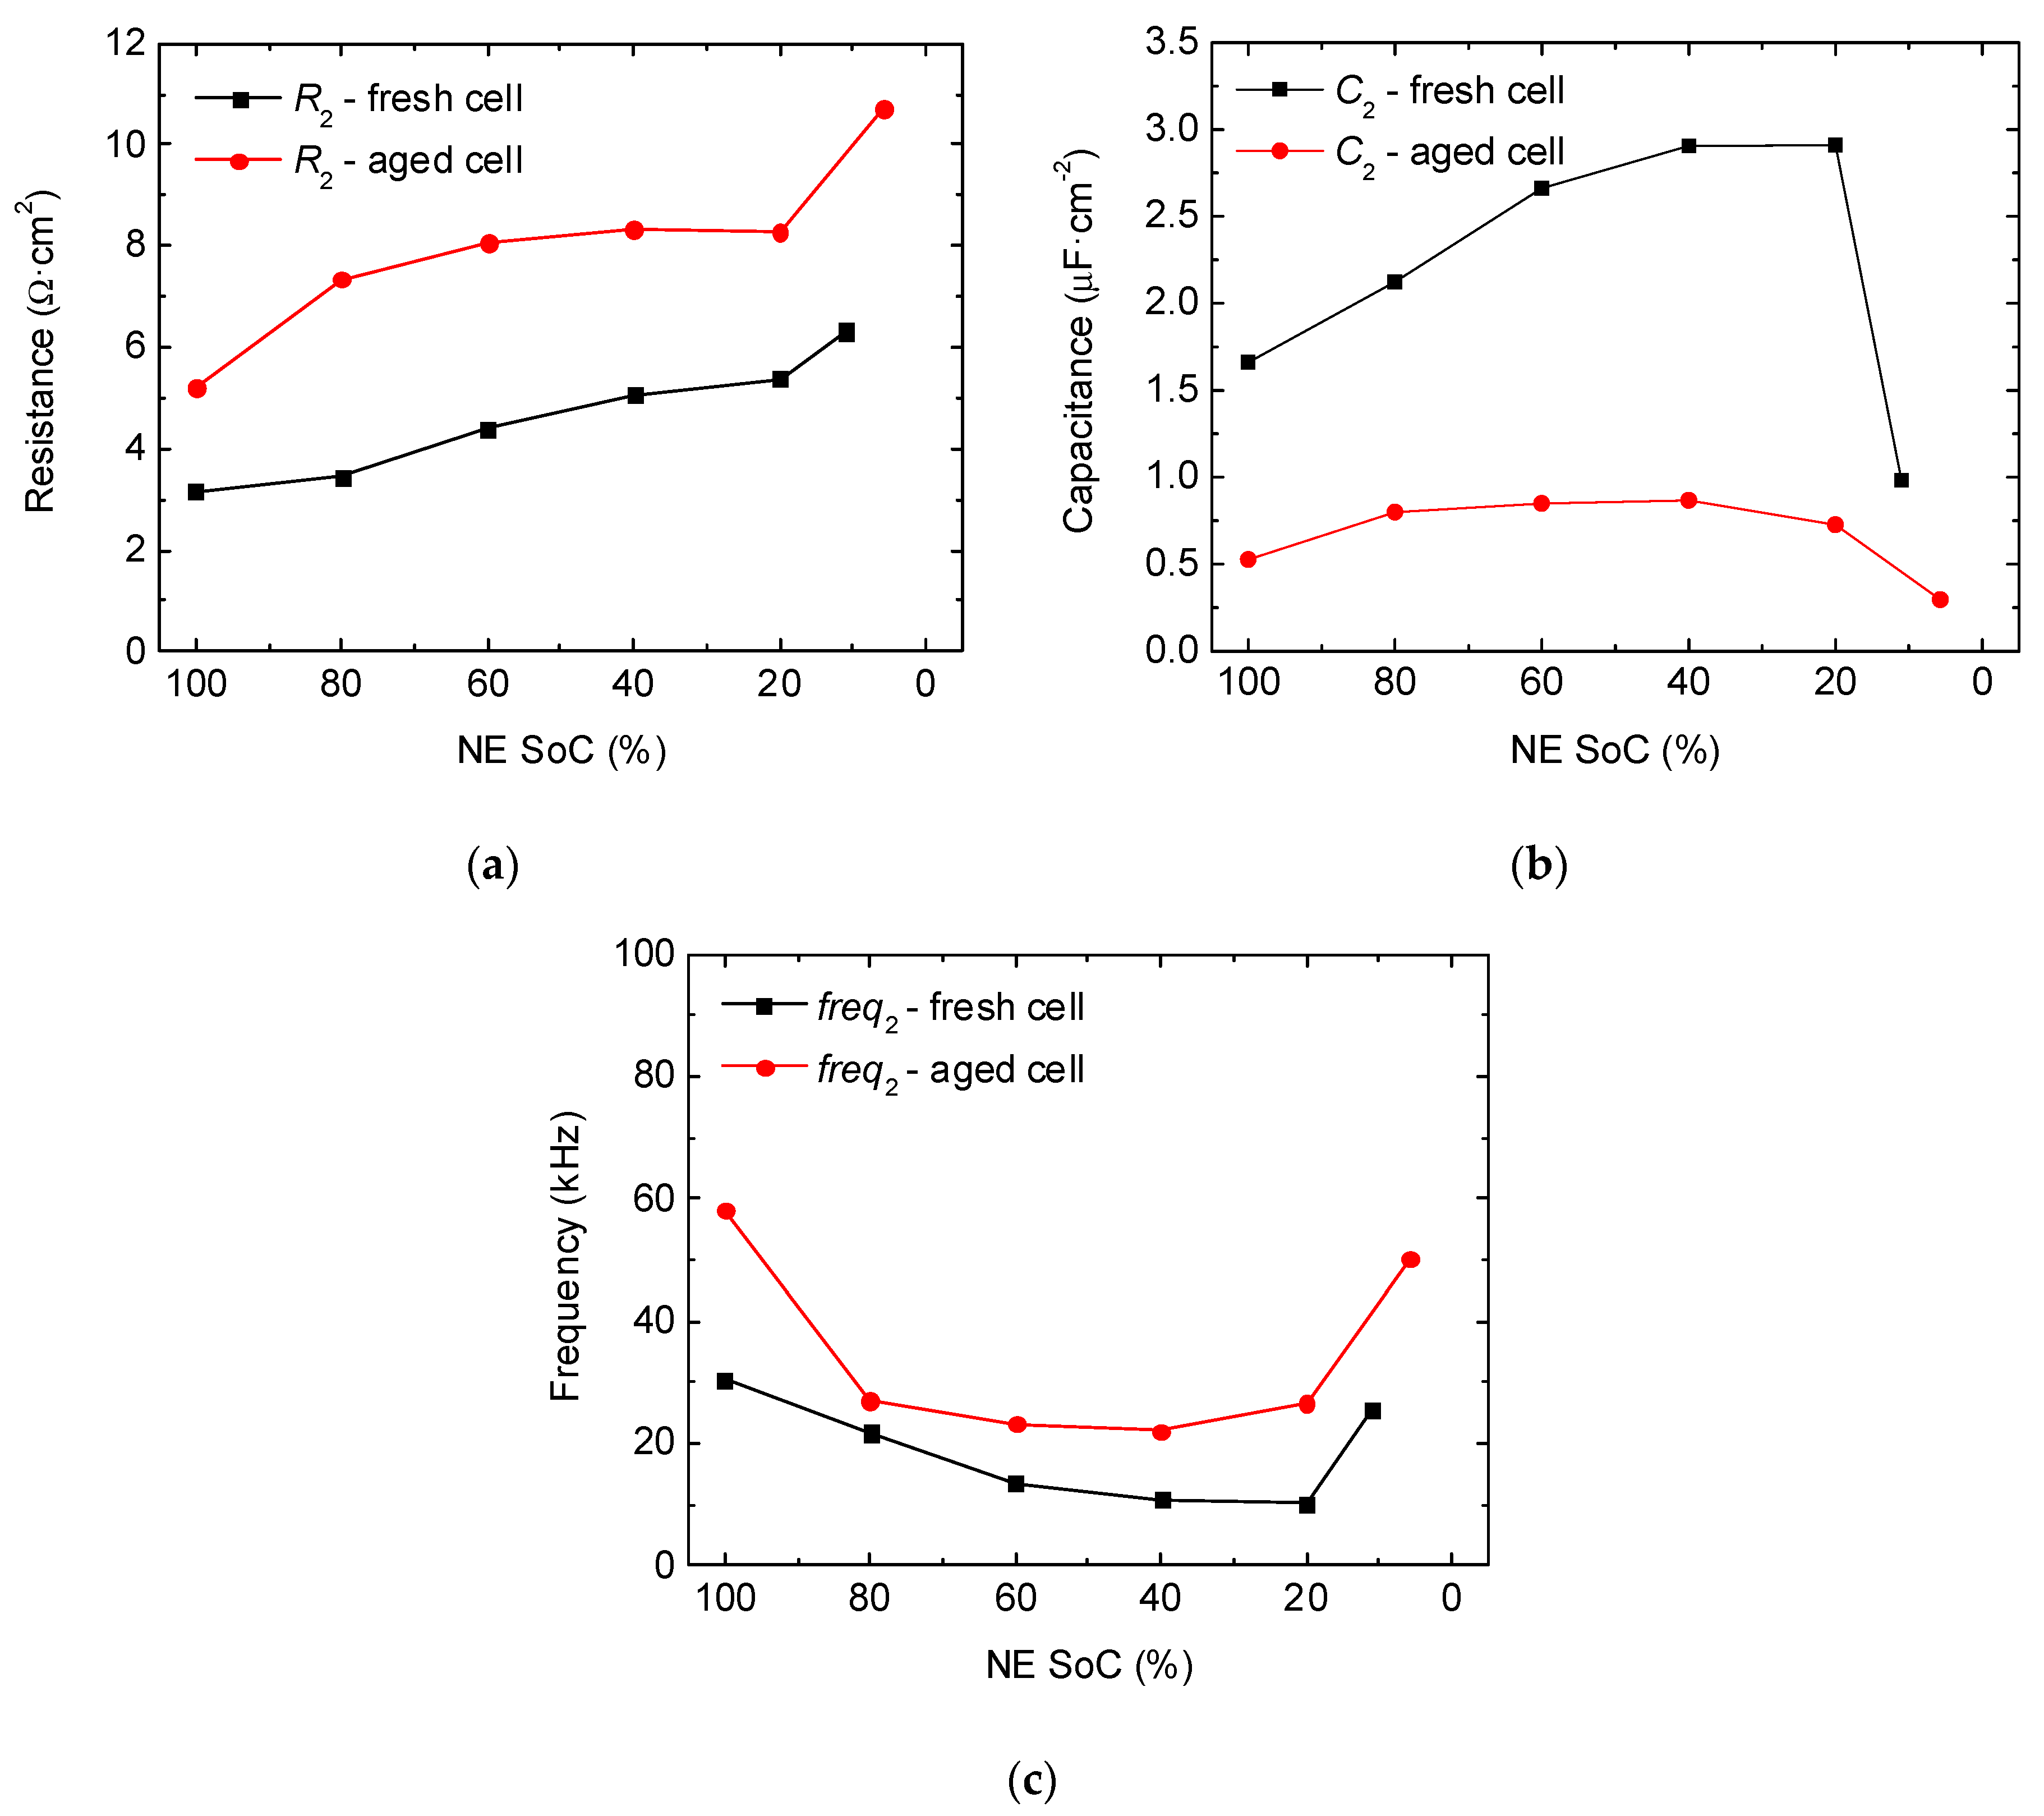
For the fresh cell, we find that the resistance corresponding to P2_NE increases as the SoC decreases (Figure 3a). Nevertheless, the capacitance increases at the first stages of the discharge, varies slowly at intermediate SoCs, and decreases again at low SoCs (Figure 3b). The opposite trend is found for the characteristic frequency (Figure 3c). Concretely, the characteristic frequency mostly stays between 10 kHz and 60 kHz depending on the evaluated SoC and aging level. In the literature, processes which take place above 1 kHz are commonly related to particle-to-particle interfaces or to the interfaces between active material particles and current collectors [28,32,36], but in some cases they have also been attributed to the SEI layer [28,37,38]. Thus, one might think that the physical origin of P2_NE should correspond to one of those. We will discuss this further in Section 2.1.2.
If the results obtained from the aged cell data are compared to the fresh cells, we find that the SoC’s dependency on all parameters—resistance, capacitance, and characteristic frequency—is maintained during the aging test (Figure 3). However, if we track their evolution, we observe that as the cell ages, the resistance increases (Figure 3a), the capacitance decreases (Figure 3b), and the frequency slightly increases (Figure 3c).
The semicircle that appears in the negative electrode half-cell at intermediate frequencies (labeled as P3_NE in Figure 1) shows a pronounced overlapping of the various processes taking place at both the metallic lithium and graphite electrodes. Thus, as the metallic lithium electrode is not present in the full-cell configuration, the obtained results from the fitting process of P3_NE are presented in Appendix A (Figure A1).
2.1.2. Positive Electrode (LCO-NMC/Li Half-Cell)
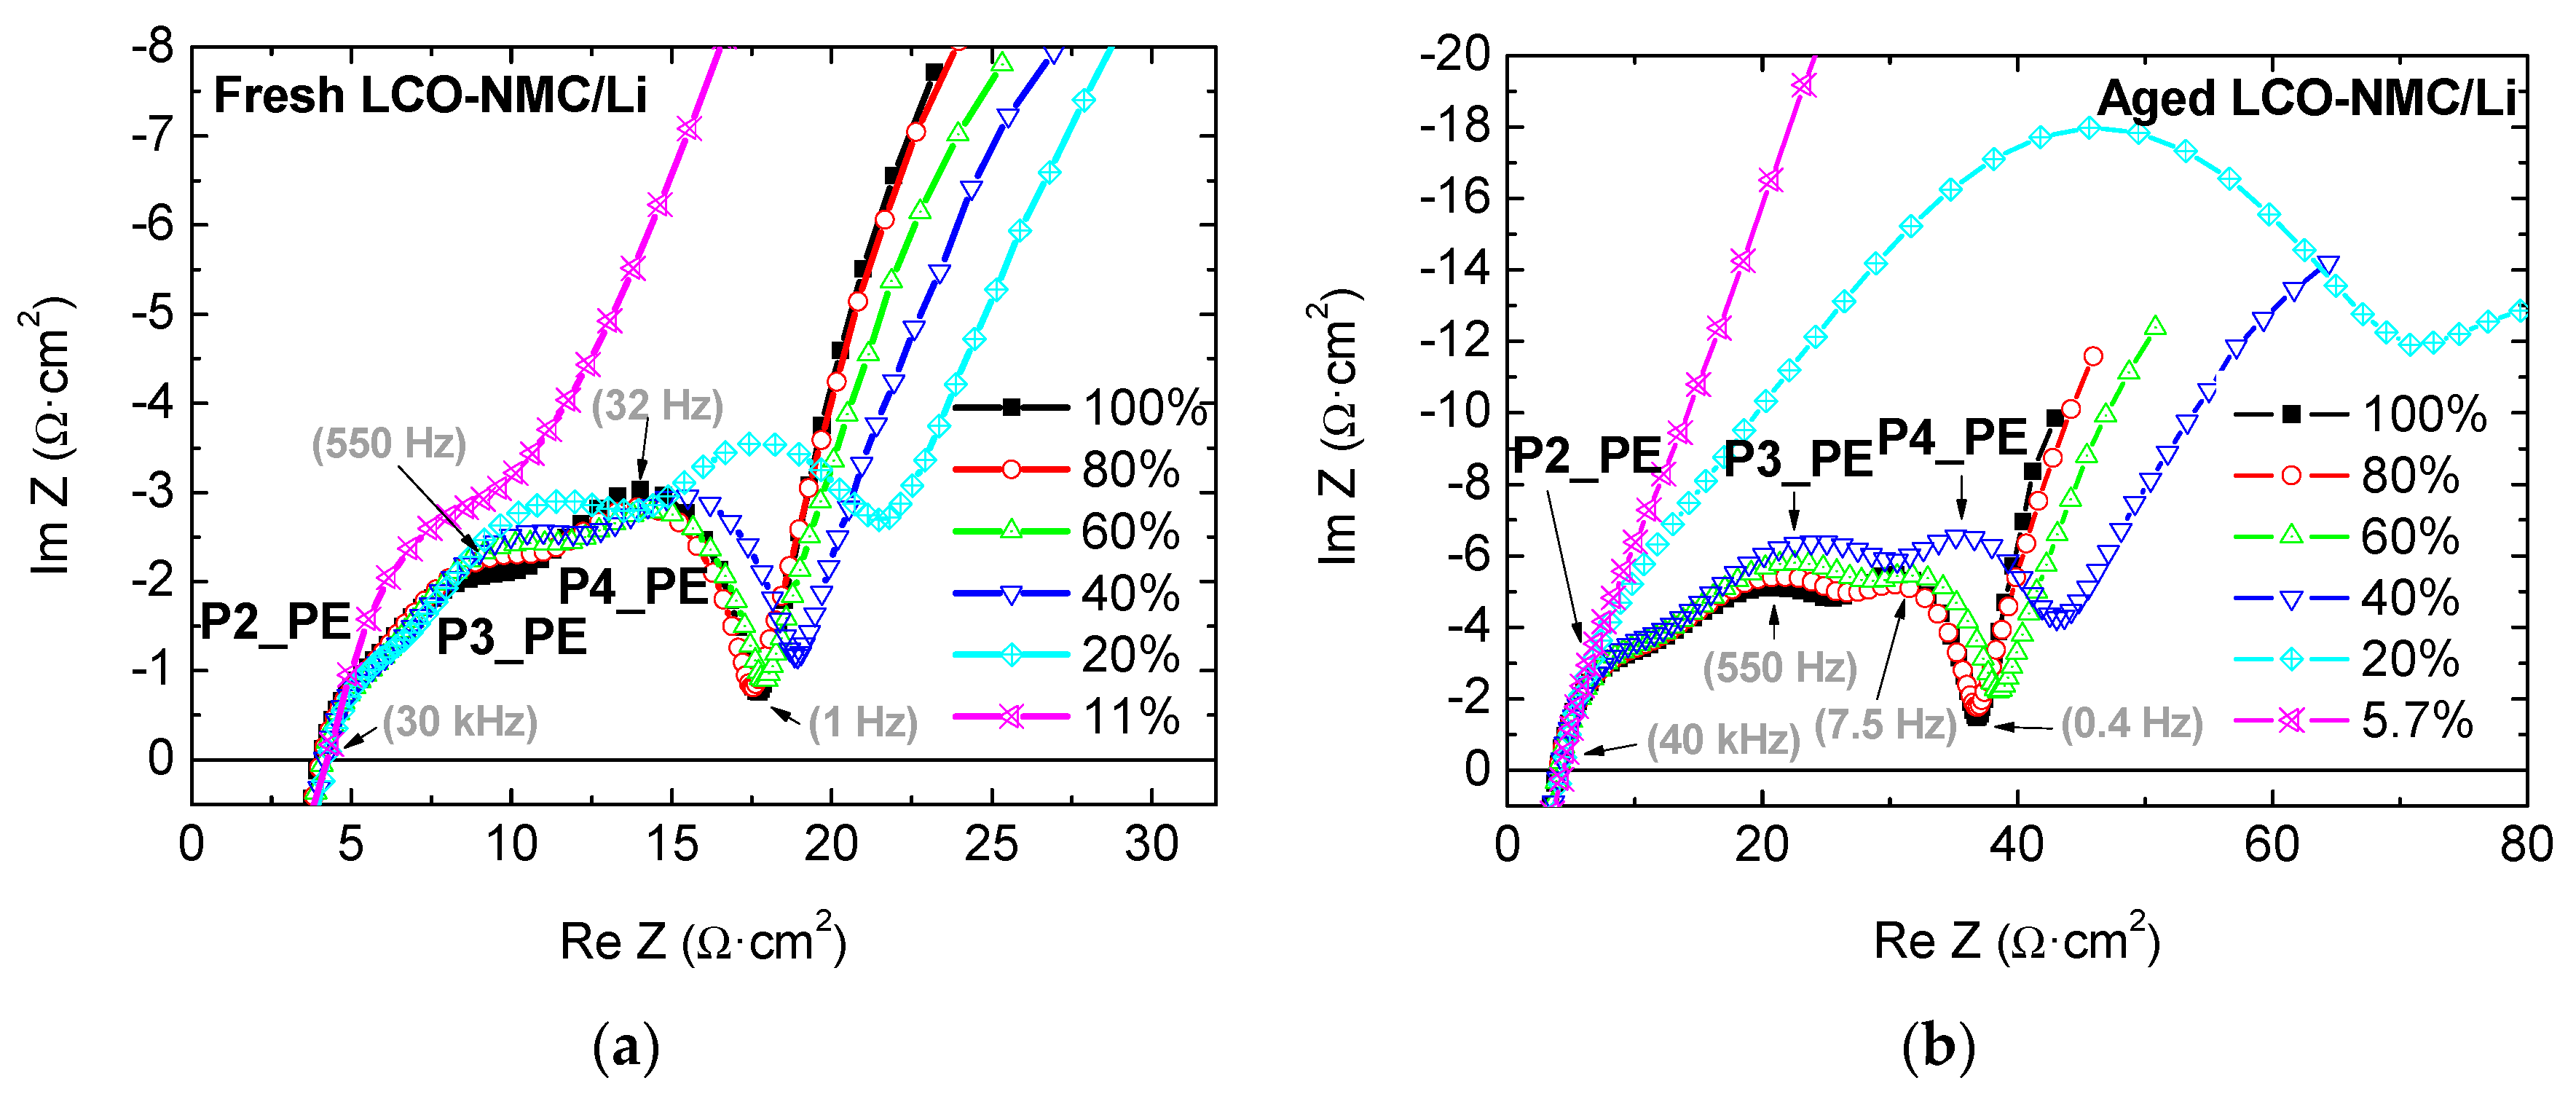
The impedance spectrum corresponding to the positive electrode half-cell is composed of three semi-arcs at different frequencies (P2_PE, P3_PE, and P4_PE) (Figure 4). Thus, a model with three RQ networks is selected as the most suitable for this particular case and temperature (Figure 5).
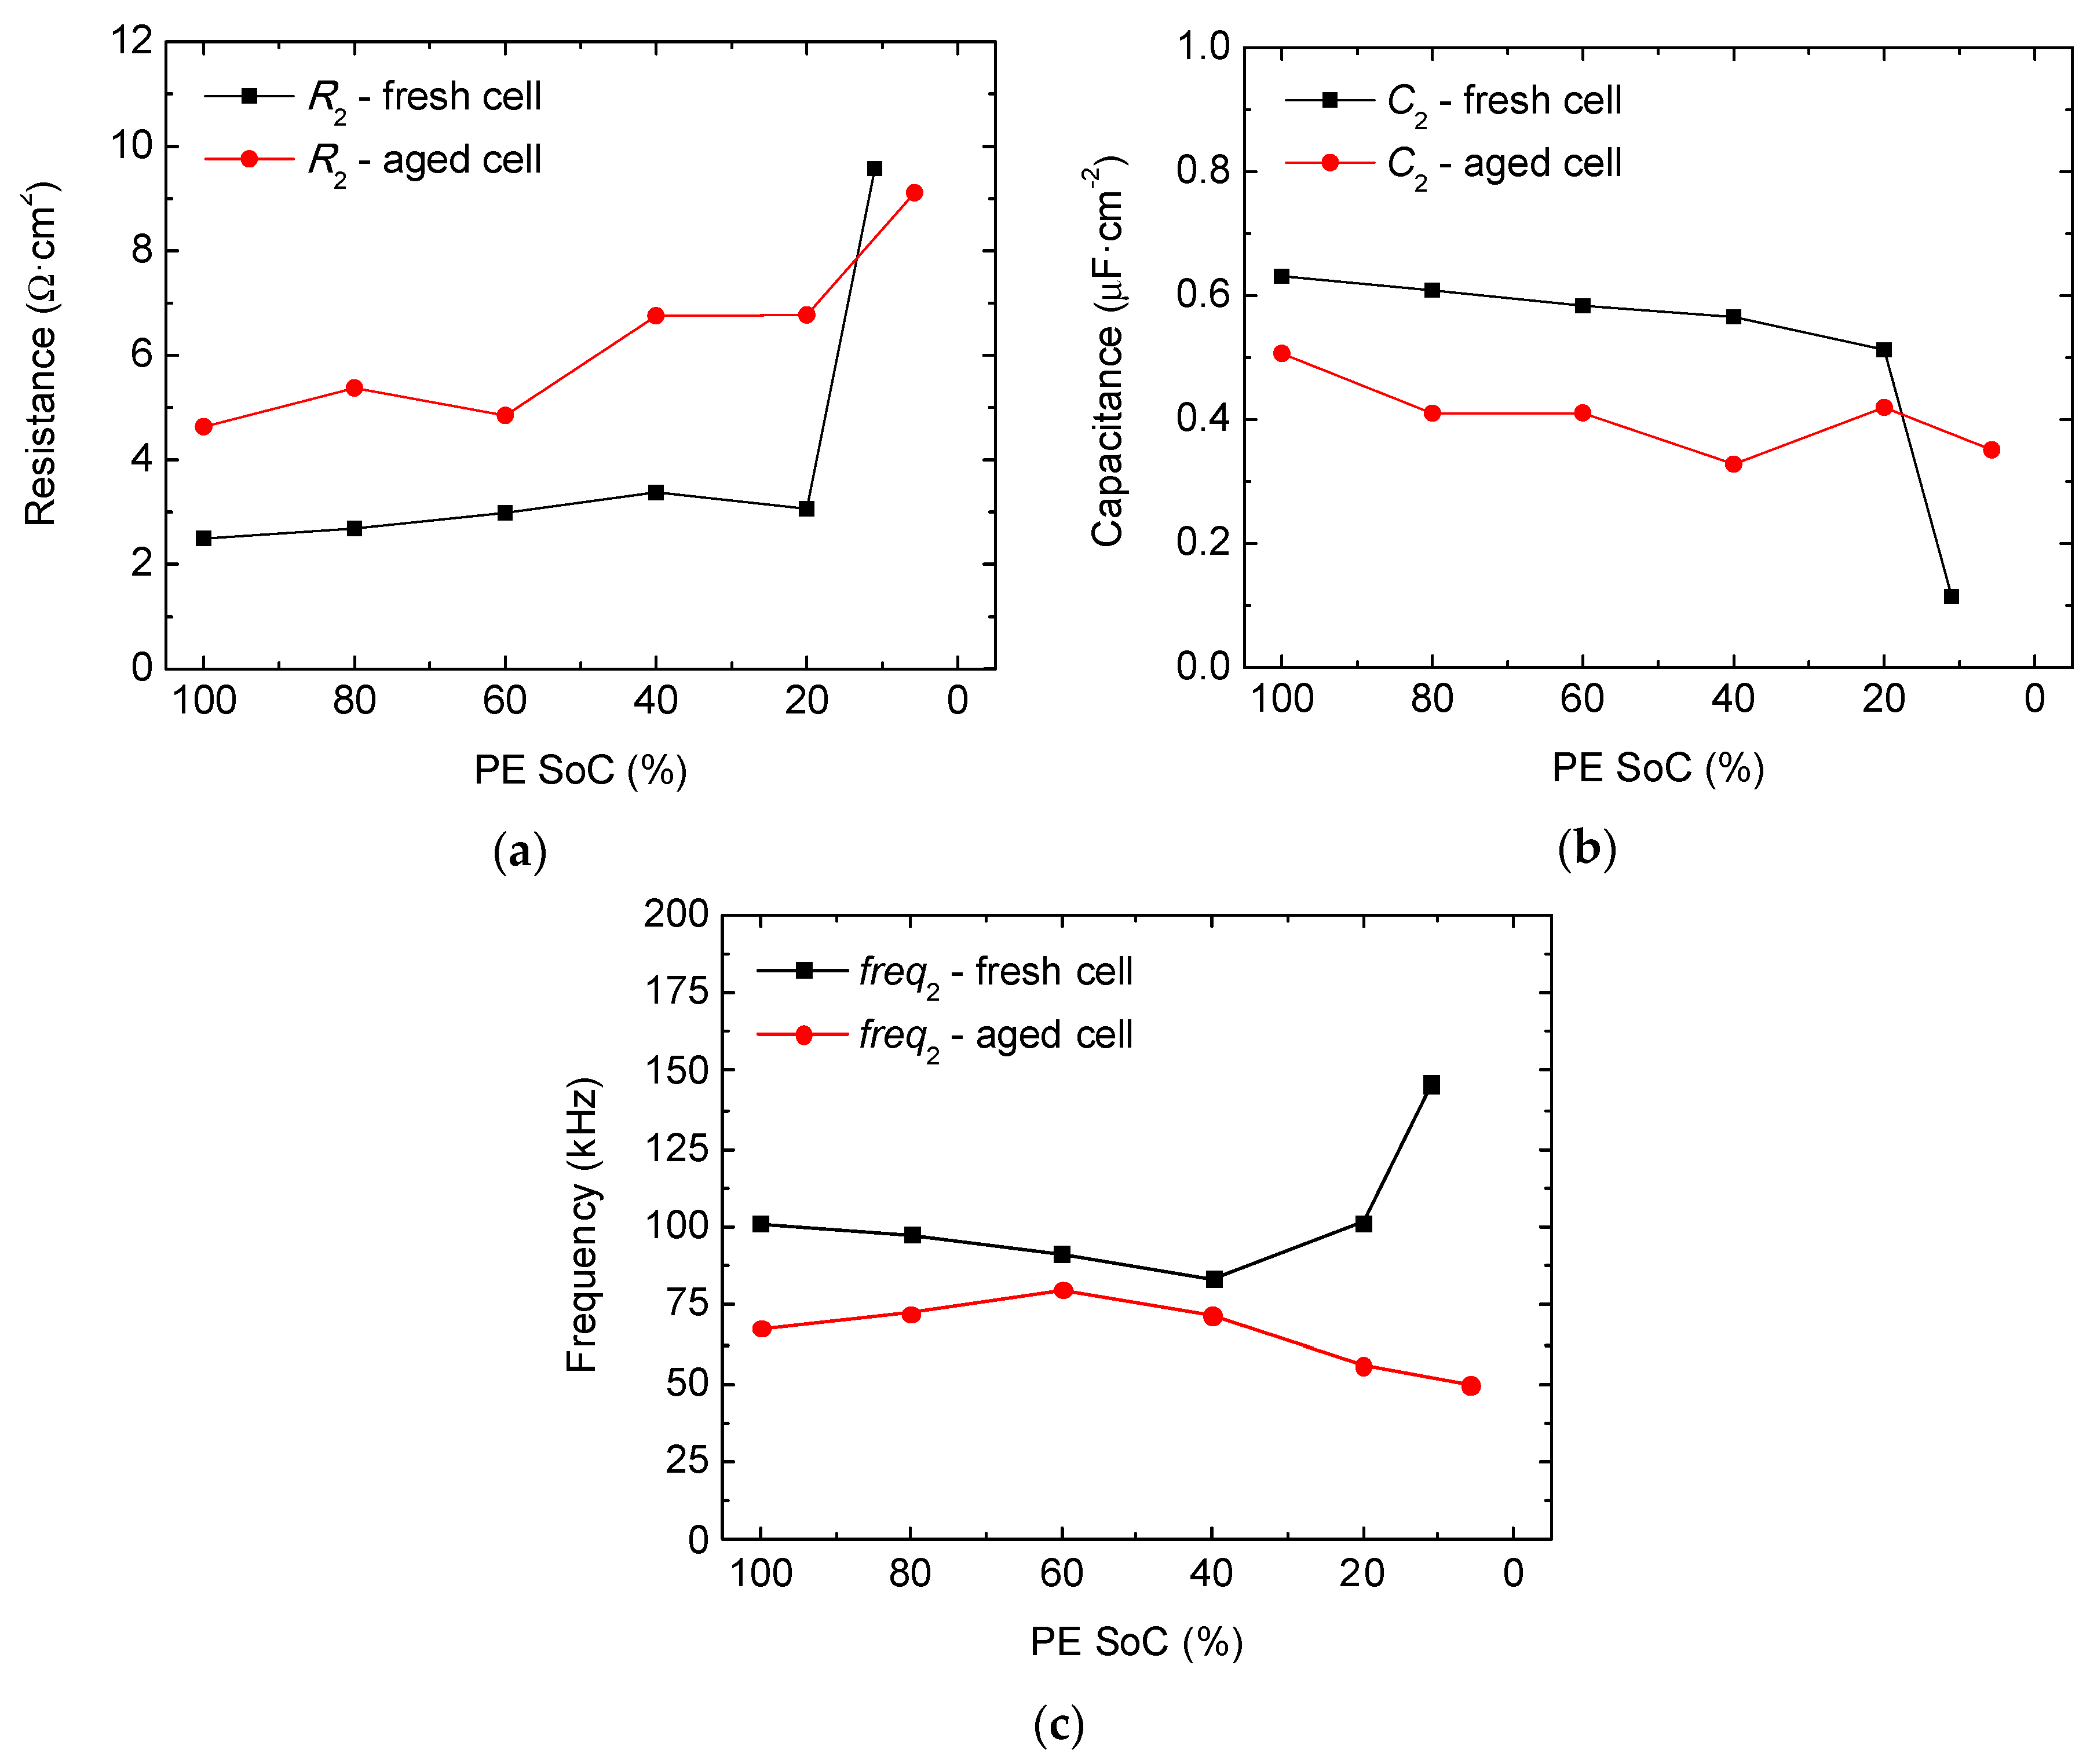
The characteristic frequency of the semicircle appearing at higher frequencies (P2_PE in Figure 4) is located between 60 kHz and 100 kHz (Figure 6c). On the one hand, we find that the resistance slightly increases in the entire SoC range but increases faster at very low SoCs, especially when the cell is fresh (Figure 6a). On the other hand, the capacitance of P2_PE decreases as the SoC decreases (Figure 6b). In general, P2_PE does not show a strong dependence on the SoC, except at the very end of discharge. Illig et al. also find a process exhibiting a small variation with the SoC, which has been assigned to the interface between the active material and the current collector due to the low activation energy they obtained [25]. Moreover, some other studies that relate the processes occurring at such high frequencies to the current collector interfaces [28,29,32,36,39] also indicate that, in general, those processes show a low variability with the SoC [29,32,39]. Thus, because of the high characteristic frequency and the low variability with the SoC, we determine that P2_PE has to correspond to the interface between the LCO-NMC active material particles and the aluminum current collector.
If we observe P2_PE at the positive electrode (Figure 6) and compare it to P2_NE at the negative electrode (Figure 3), we find similar orders of magnitude in resistance, capacitance, and frequency. Those results may suggest a shared physical origin. Thus, we infer that both P2_NE and P2_PE have to represent the interfaces between current collectors and active material particles at negative and positive electrodes.
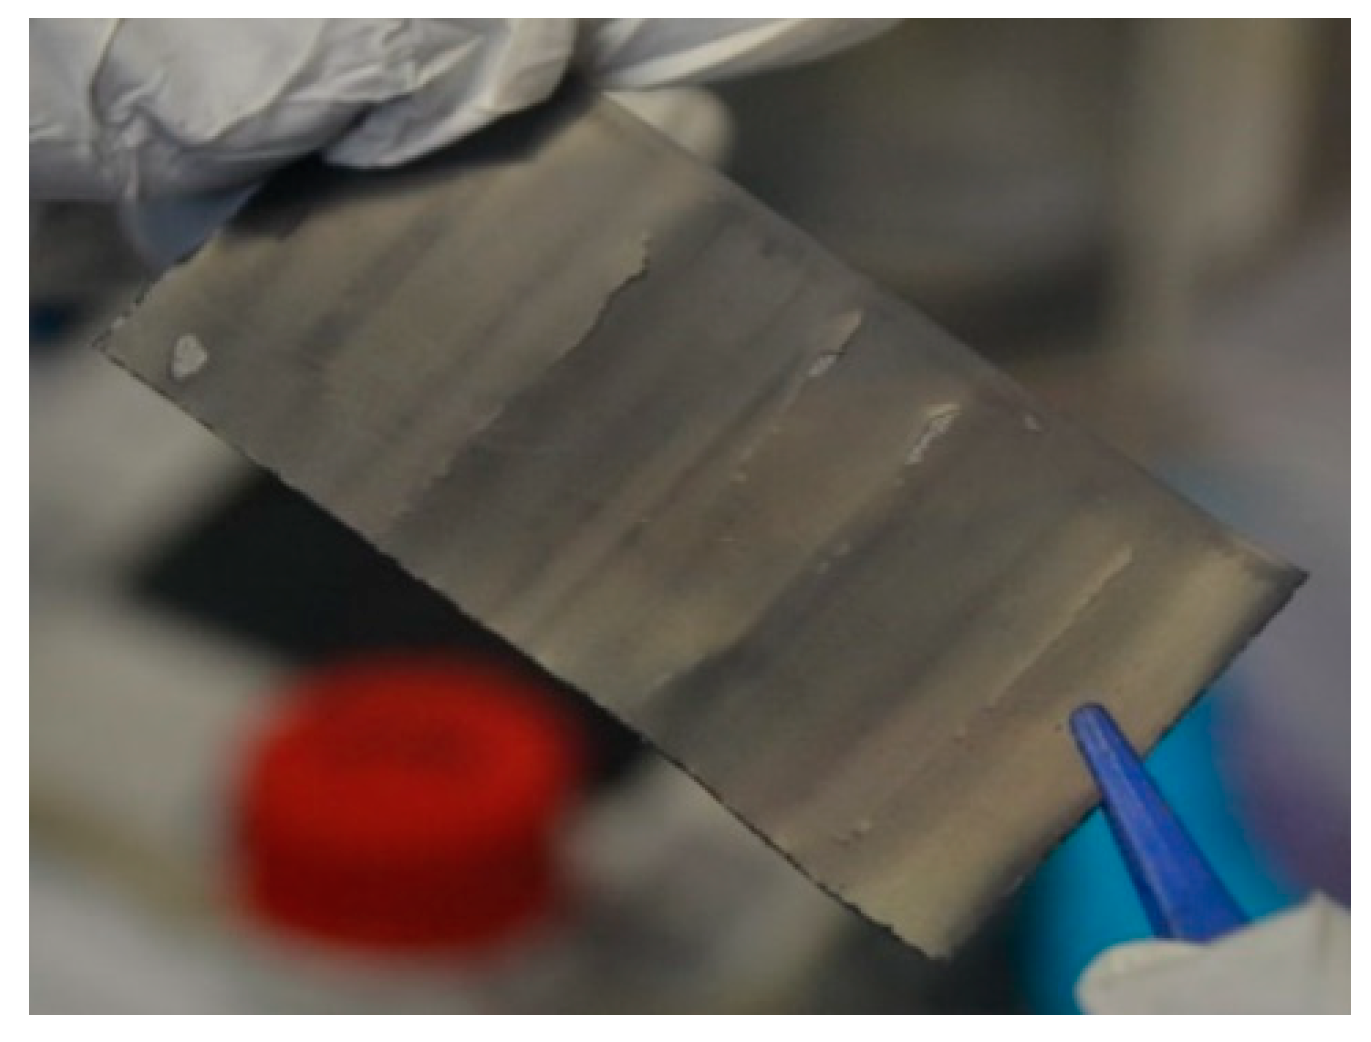
During the aging process, we find that the resistance associated to P2_PE increases (Figure 6a) whereas both capacitance and frequency decrease (Figure 6b,c). In fact, one consequence of prolonged cycling is a poorer contact between the active material particles and current collectors [7]. In a previous study [40], during the post-mortem analysis we observed that the active material of both electrodes was detached from the current collectors (Figure A2). If the active material detaches from the current collector, the contact surface area A (refer to Equation (4)) is reduced, which, at the same time, increases the resistance. Consequently, the capacitance has to decrease because of this loss of contact and the subsequent reduction of the surface area. However, an artifact could have been introduced during the manufacturing process of the half-cells because current collectors can easily be detached from the electrodes, which would alter the results [12]. Nonetheless, we have obtained similar trends at both current collector interfaces (Figure 3 and Figure 6). This validates the repeatability of the results and the consistency of the half-cell manufacturing process (as illustrated in Figure A2) [40].
The results corresponding to P3_PE (Figure 4) are represented in Appendix A (Figure A3) because P3_PE takes place in a frequency range that is highly affected by the response of the lithium counter electrode [17,25], which does not contribute to the full-cell impedance response. We observe an increase in resistance along with a decrease in SoC (Figure A3), which has also been described in the literature [17,25].
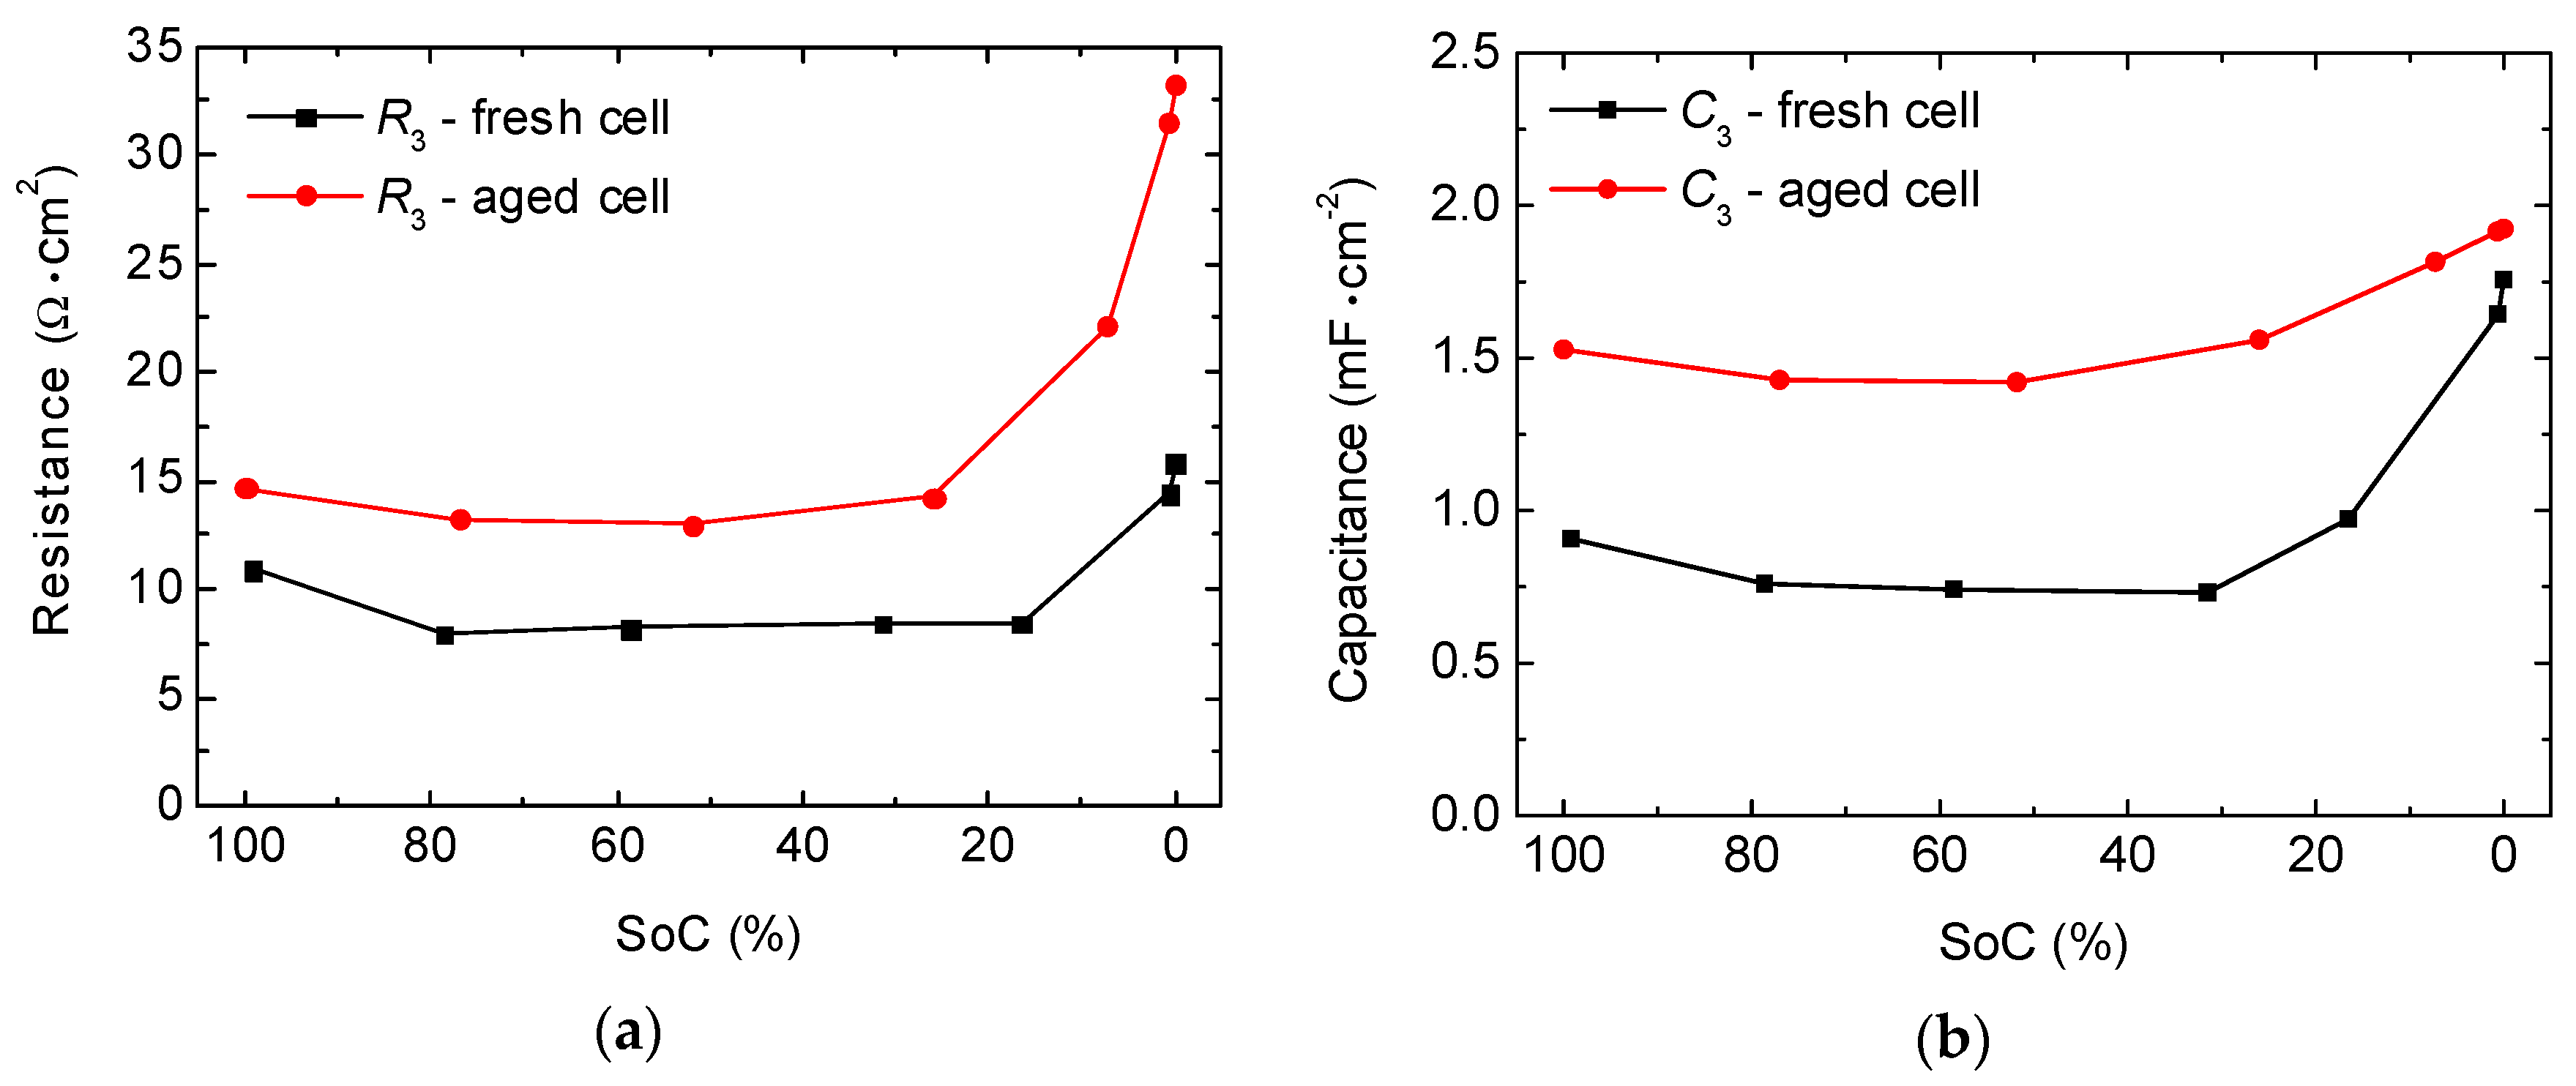
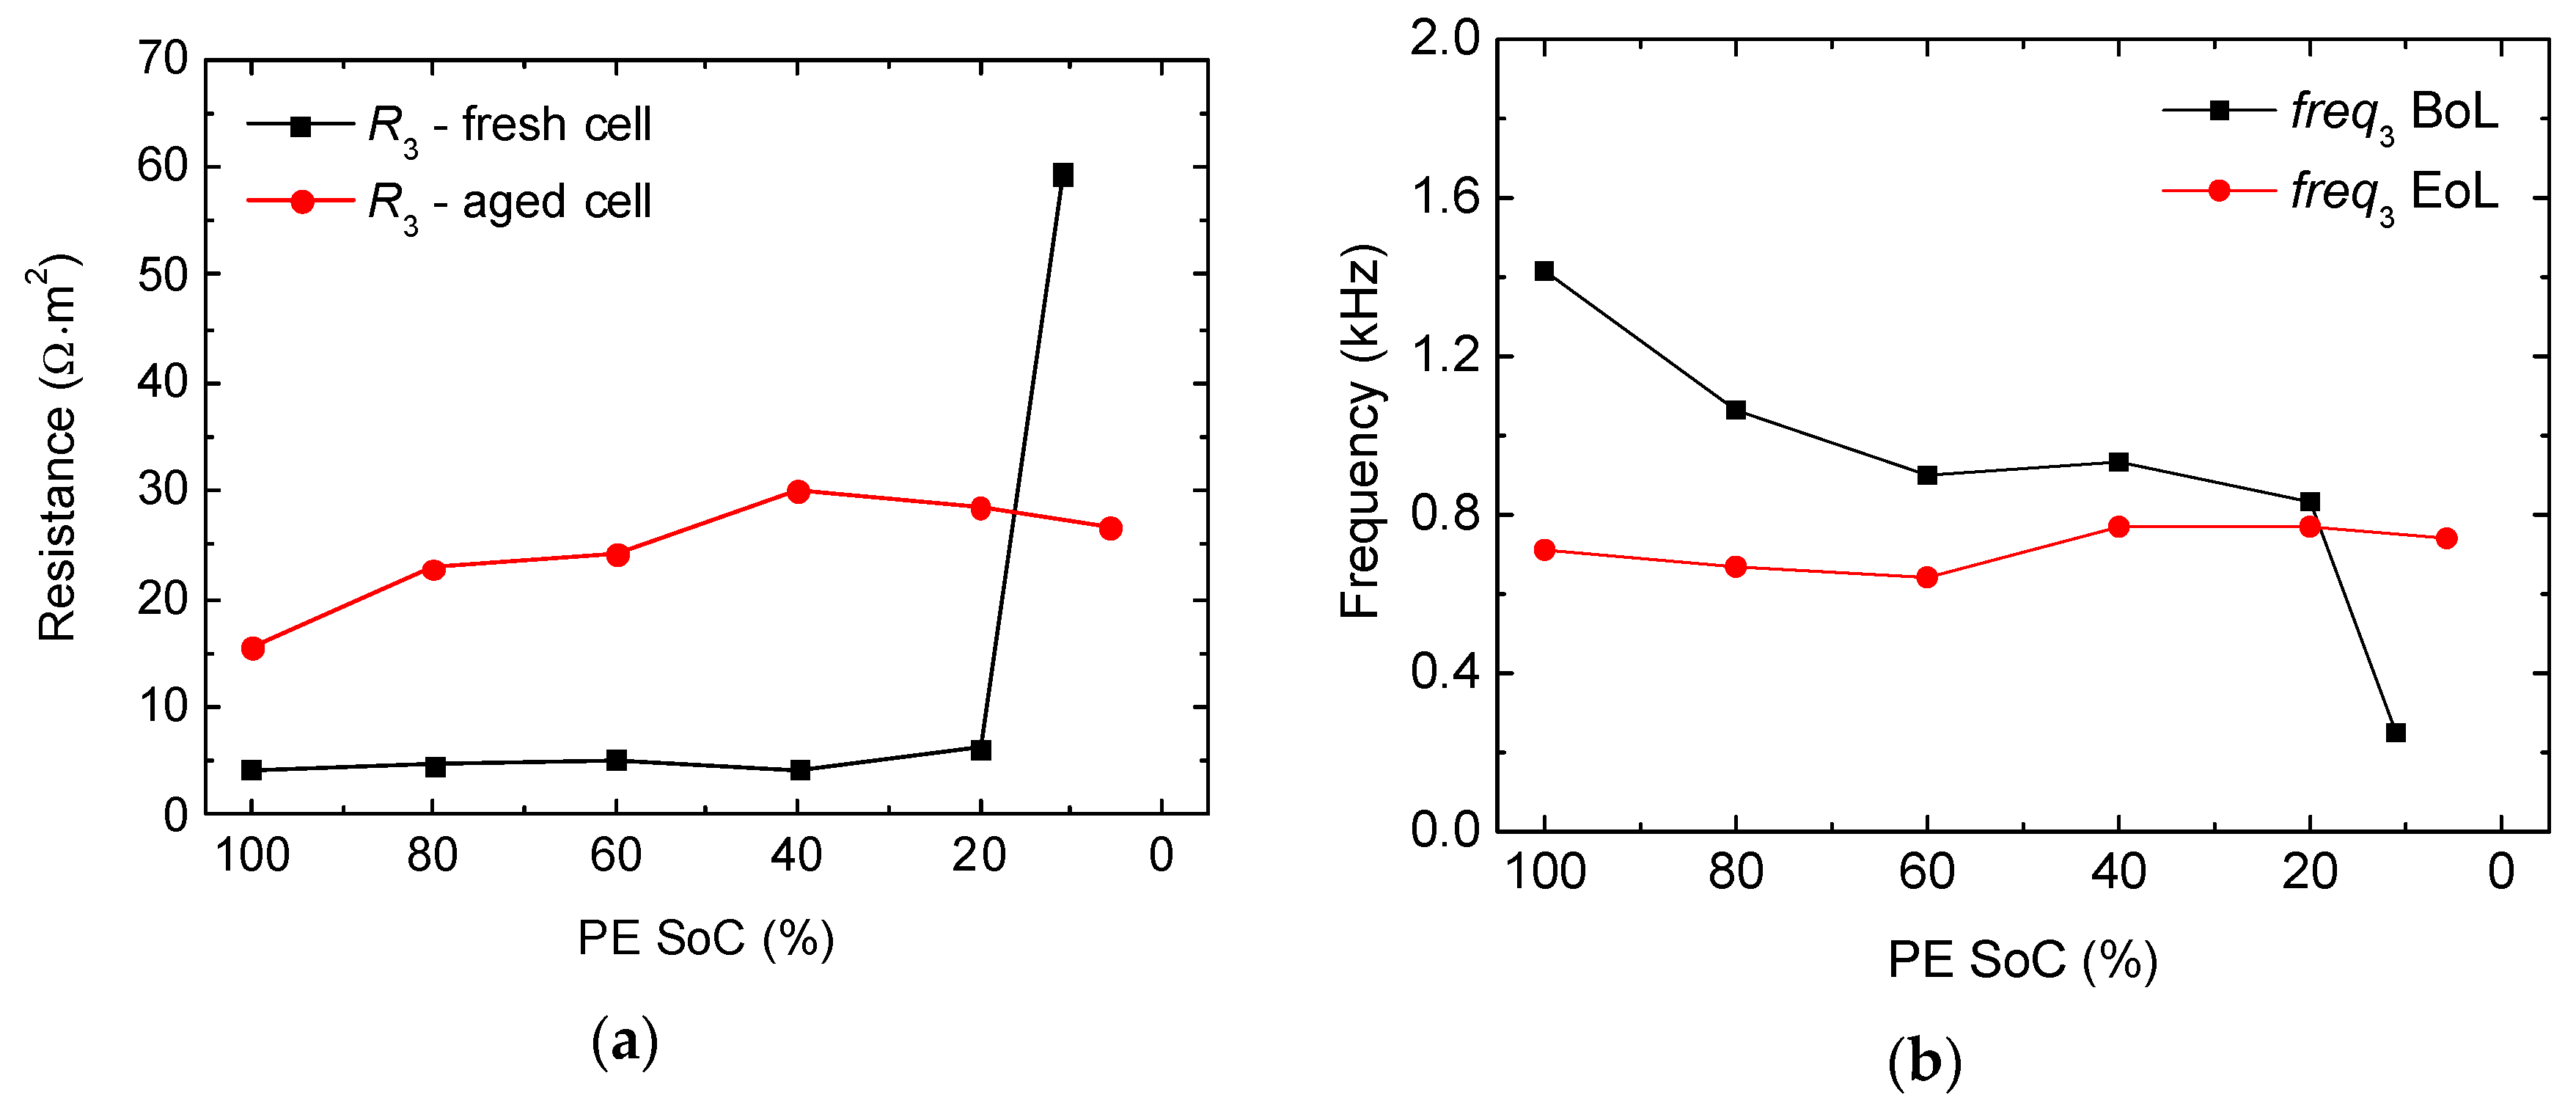
The resistance related to P4_PE (Figure 4), which corresponds to the lowest frequency effect (located below 30 Hz), slightly decreases in the first stages of discharge, then remains almost constant at intermediate SoCs, and finally increases drastically at the lowest SoCs (Figure 7a). Capacitance follows the same trend (Figure 7b). Illig et al. related this trend to a charge-transfer process in which the large increase in resistance towards the end of discharge is caused by a deterioration of the charge-transfer process, when many lithium ions are present in the host electrode [25].
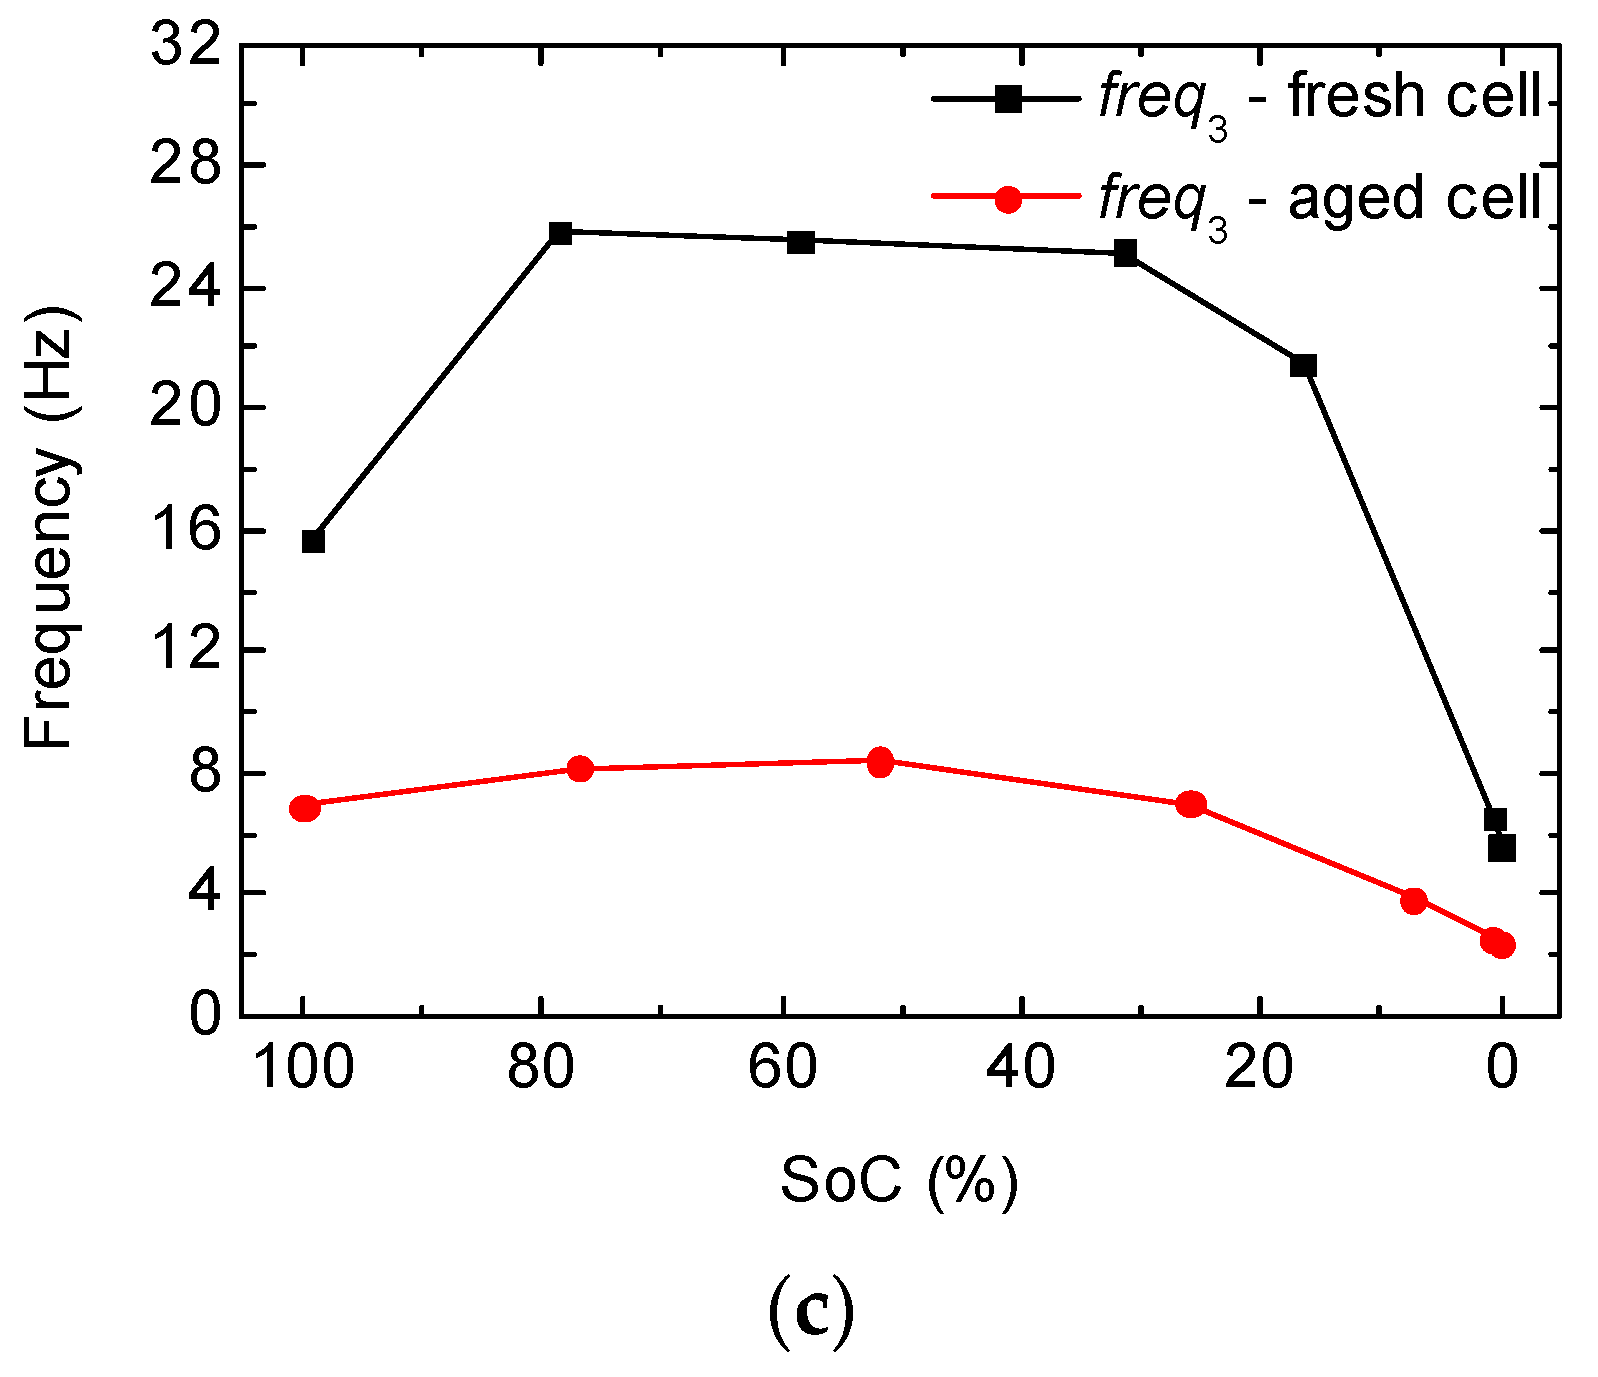
During the aging test, we find that the characteristic frequency of P4_PE is drastically reduced—by a factor of four—changing from around 28 Hz to 6.5 Hz at intermediate SoCs (Figure 7c). Waag et al. have reported similar values for an NMC cell (36 Hz for a fresh cell, 9 Hz at intermediate aging and 1.1 Hz at the end of their aging test) [41]. They have related this effect to a charge-transfer process as performed in other studies in which charge-transfer processes take place around 10 Hz [14,22,32,34]. In addition, we find that P4_PE shows a strong SoC dependency (Figure 7), which is also commonly attributed to the electrochemical reaction [18,25,42,43,44,45]. Thus, it is clear that P4_PE corresponds to a charge transfer process that takes place at the surface of the positive electrode.
As the cell degrades, we find that charge-transfer resistance and double-layer capacitance increase (Figure 7a,b), as has also been stated in Reference [41]. Actually, the increase in charge-transfer resistance was expected because cycling might produce cracks in the active material particles, and might isolate the particles as well, because of the formation of surface layers. As a result, the available surface area for the reaction to take place would be reduced, producing an increase in the associated resistance. Similar results for charge-transfer resistance [28,29] and double-layer capacitance [21,28,41] after prolonged cycling are found in the literature. In fact, the width of the electrical double layer, which is represented as d in Equation (4), depends on the concentrations of salts in the electrolyte [46]. Specifically, d decreases as the concentration of the electrolyte increases [46,47,48]. Thus, a possible explanation for the increase of the double-layer capacitance could be that more ions and salts accumulate at the active material surface because the charge-transfer reaction slows down as the cell ages. In that situation, the electrical double layer would be compressed, which would increase its capacitance. As a consequence of this increase in capacitance, less energy is going to be available for the electrochemical reaction (i.e., the effective capacity of the cell is going to be reduced) because more energy is going to be stored electrostatically at this double layer.
2.2. Full-Cell Impedance
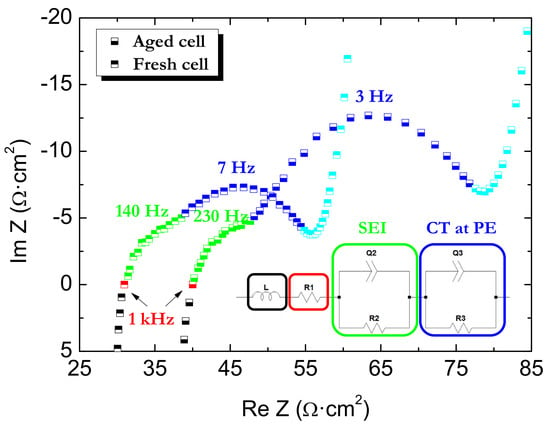
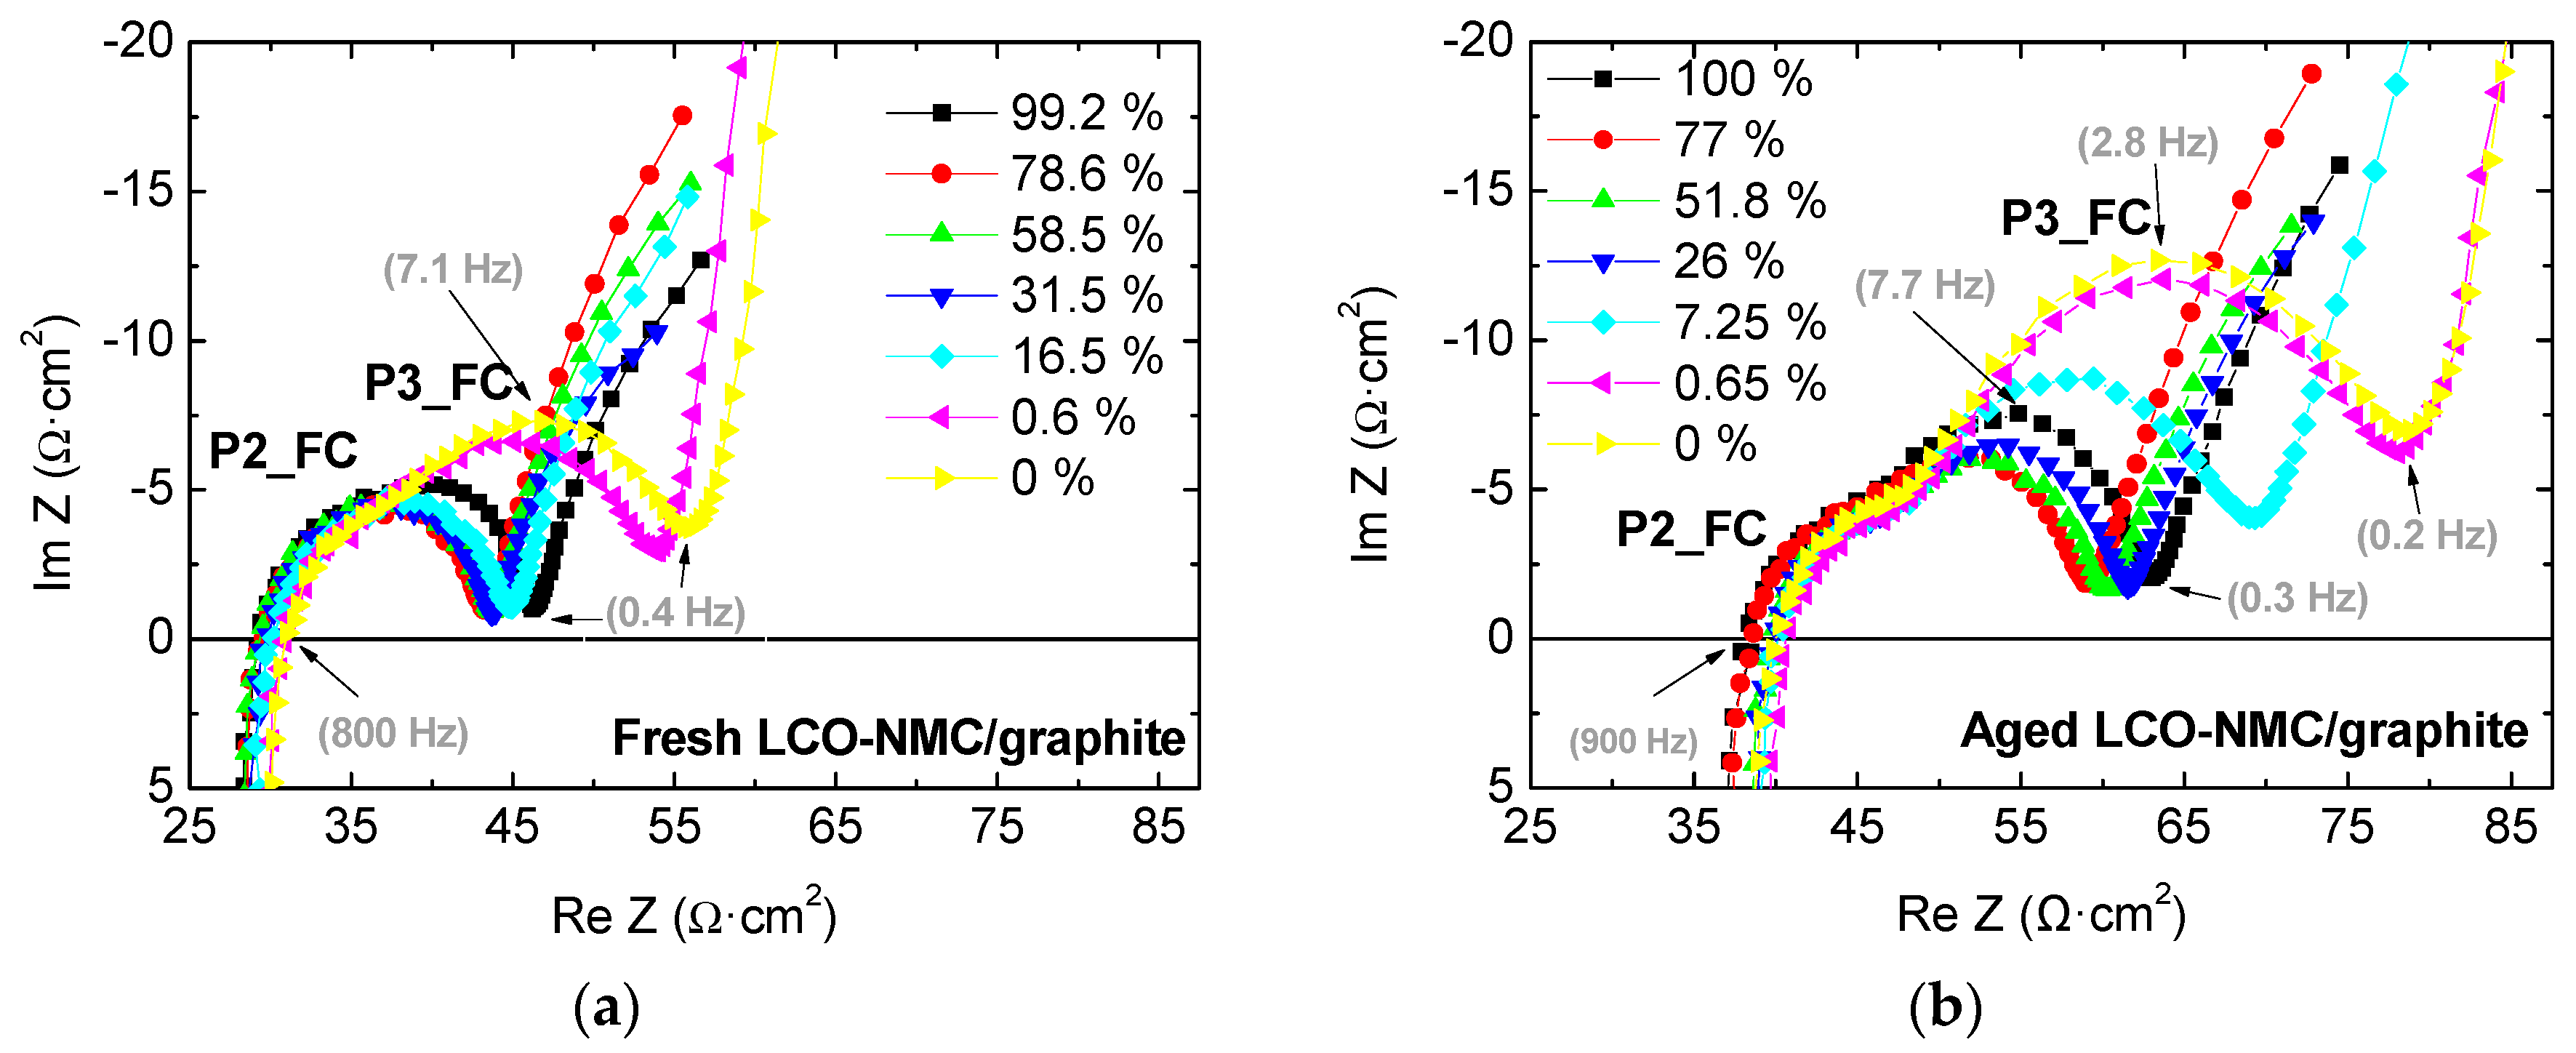
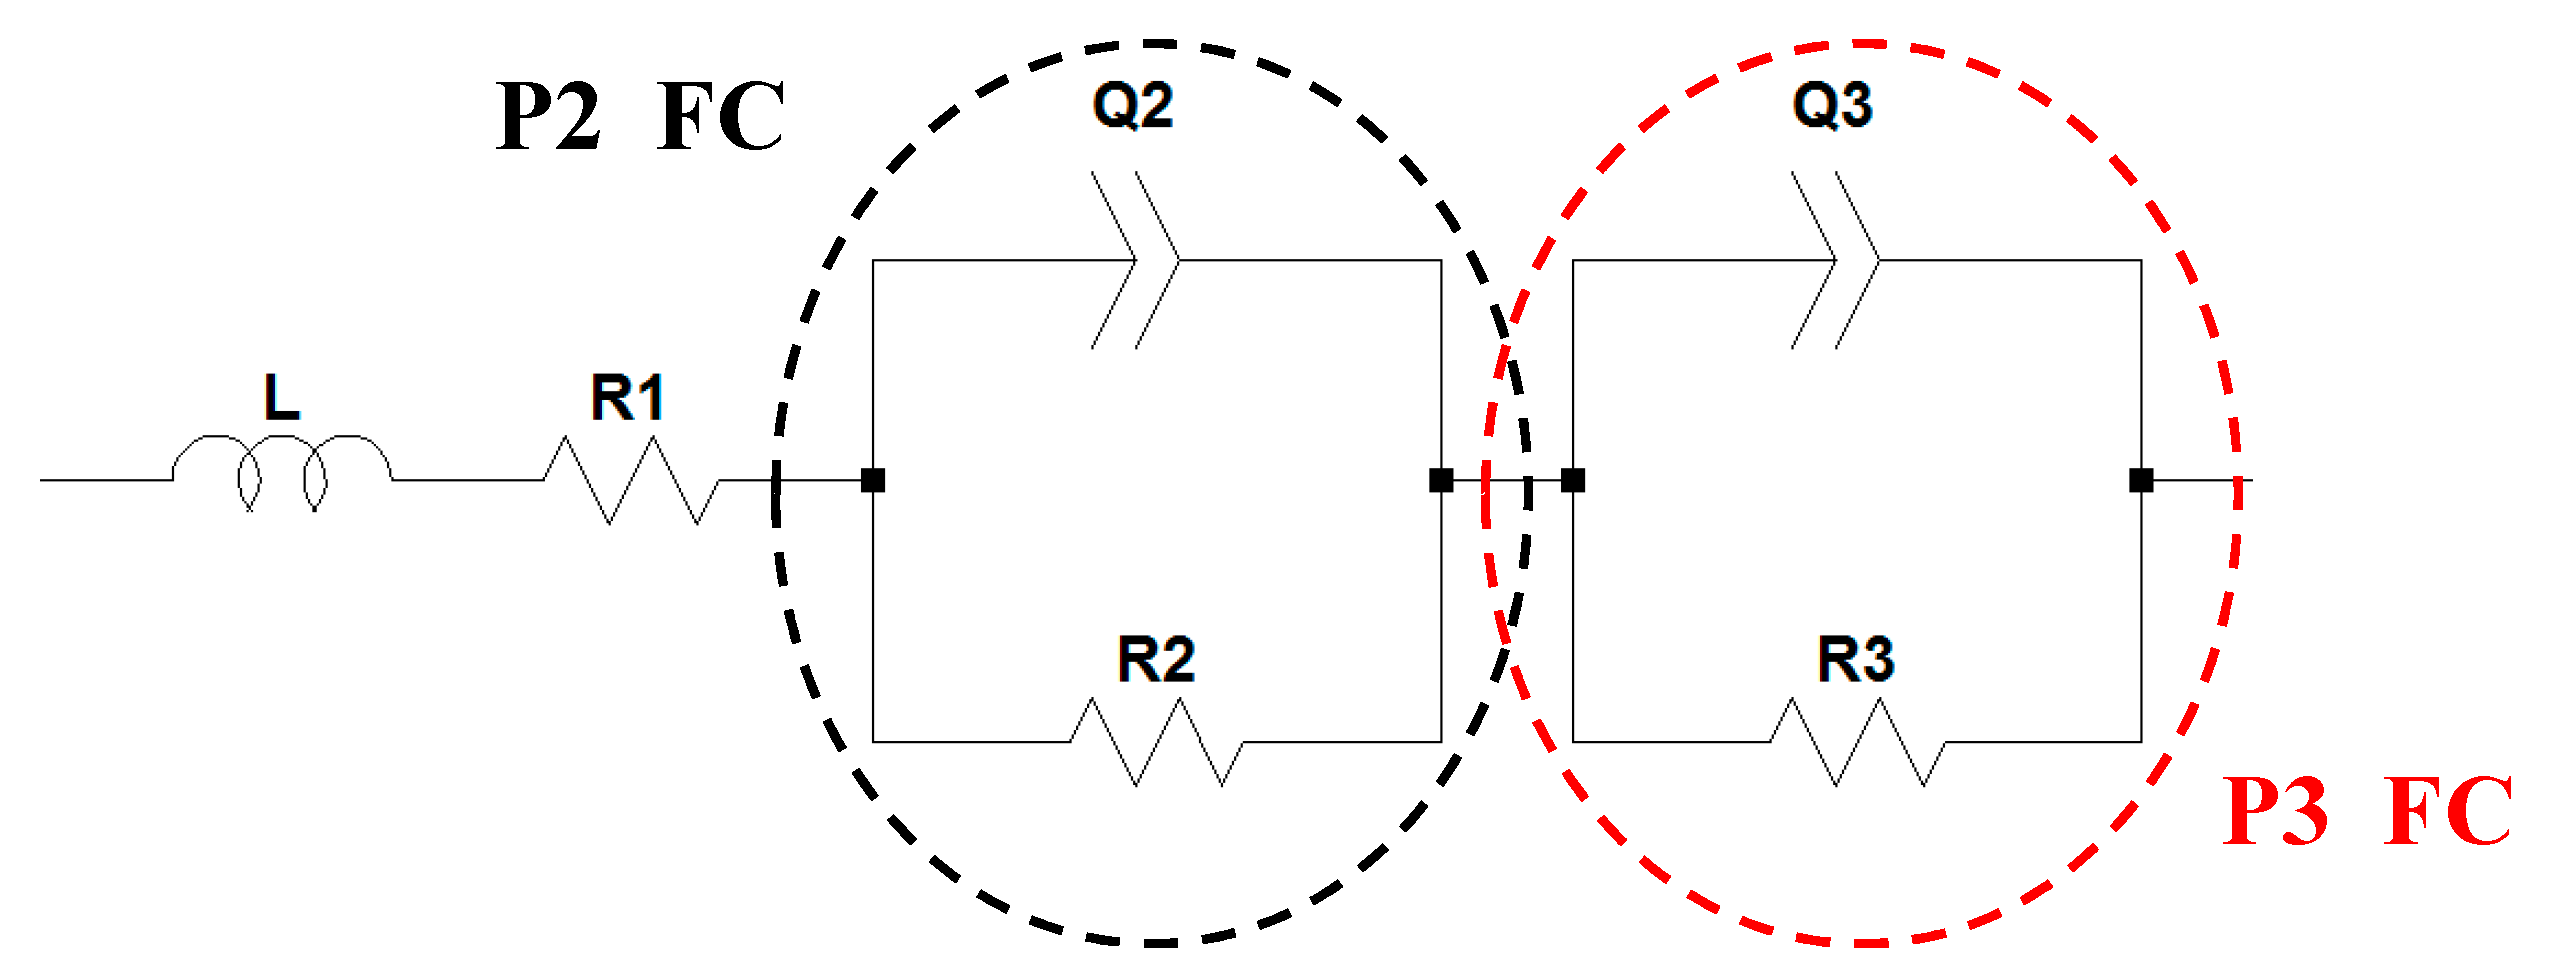
The evolution of impedance with the SoC of the commercial full-cell is composed of two semicircles at intermediate frequencies (P2_FC and P3_FC), a pure ohmic effect, and an inductive tail at high frequencies (above 800 Hz) (Figure 8a,b). In particular, the impedance spectrum of the fresh cell is composed of one semicircle, except at very low SoCs, in which two semicircles can be appreciated (Figure 8a). As the battery ages, the two effects are clearly distinguishable even when the cell is fully charged (Figure 8b). In general, the impedances of both fresh and aged cells increase as the SoC decreases, especially the impedance related to the lowest frequency semicircle (P3_FC) (Figure 8). Similar trends can be found in other studies [41,44,49,50]. In order to be more accurate in tracking the evolution of impedance with the SoC, the electrical model depicted in Figure 9 is fitted to the impedance spectra of the full cells under these particular conditions.
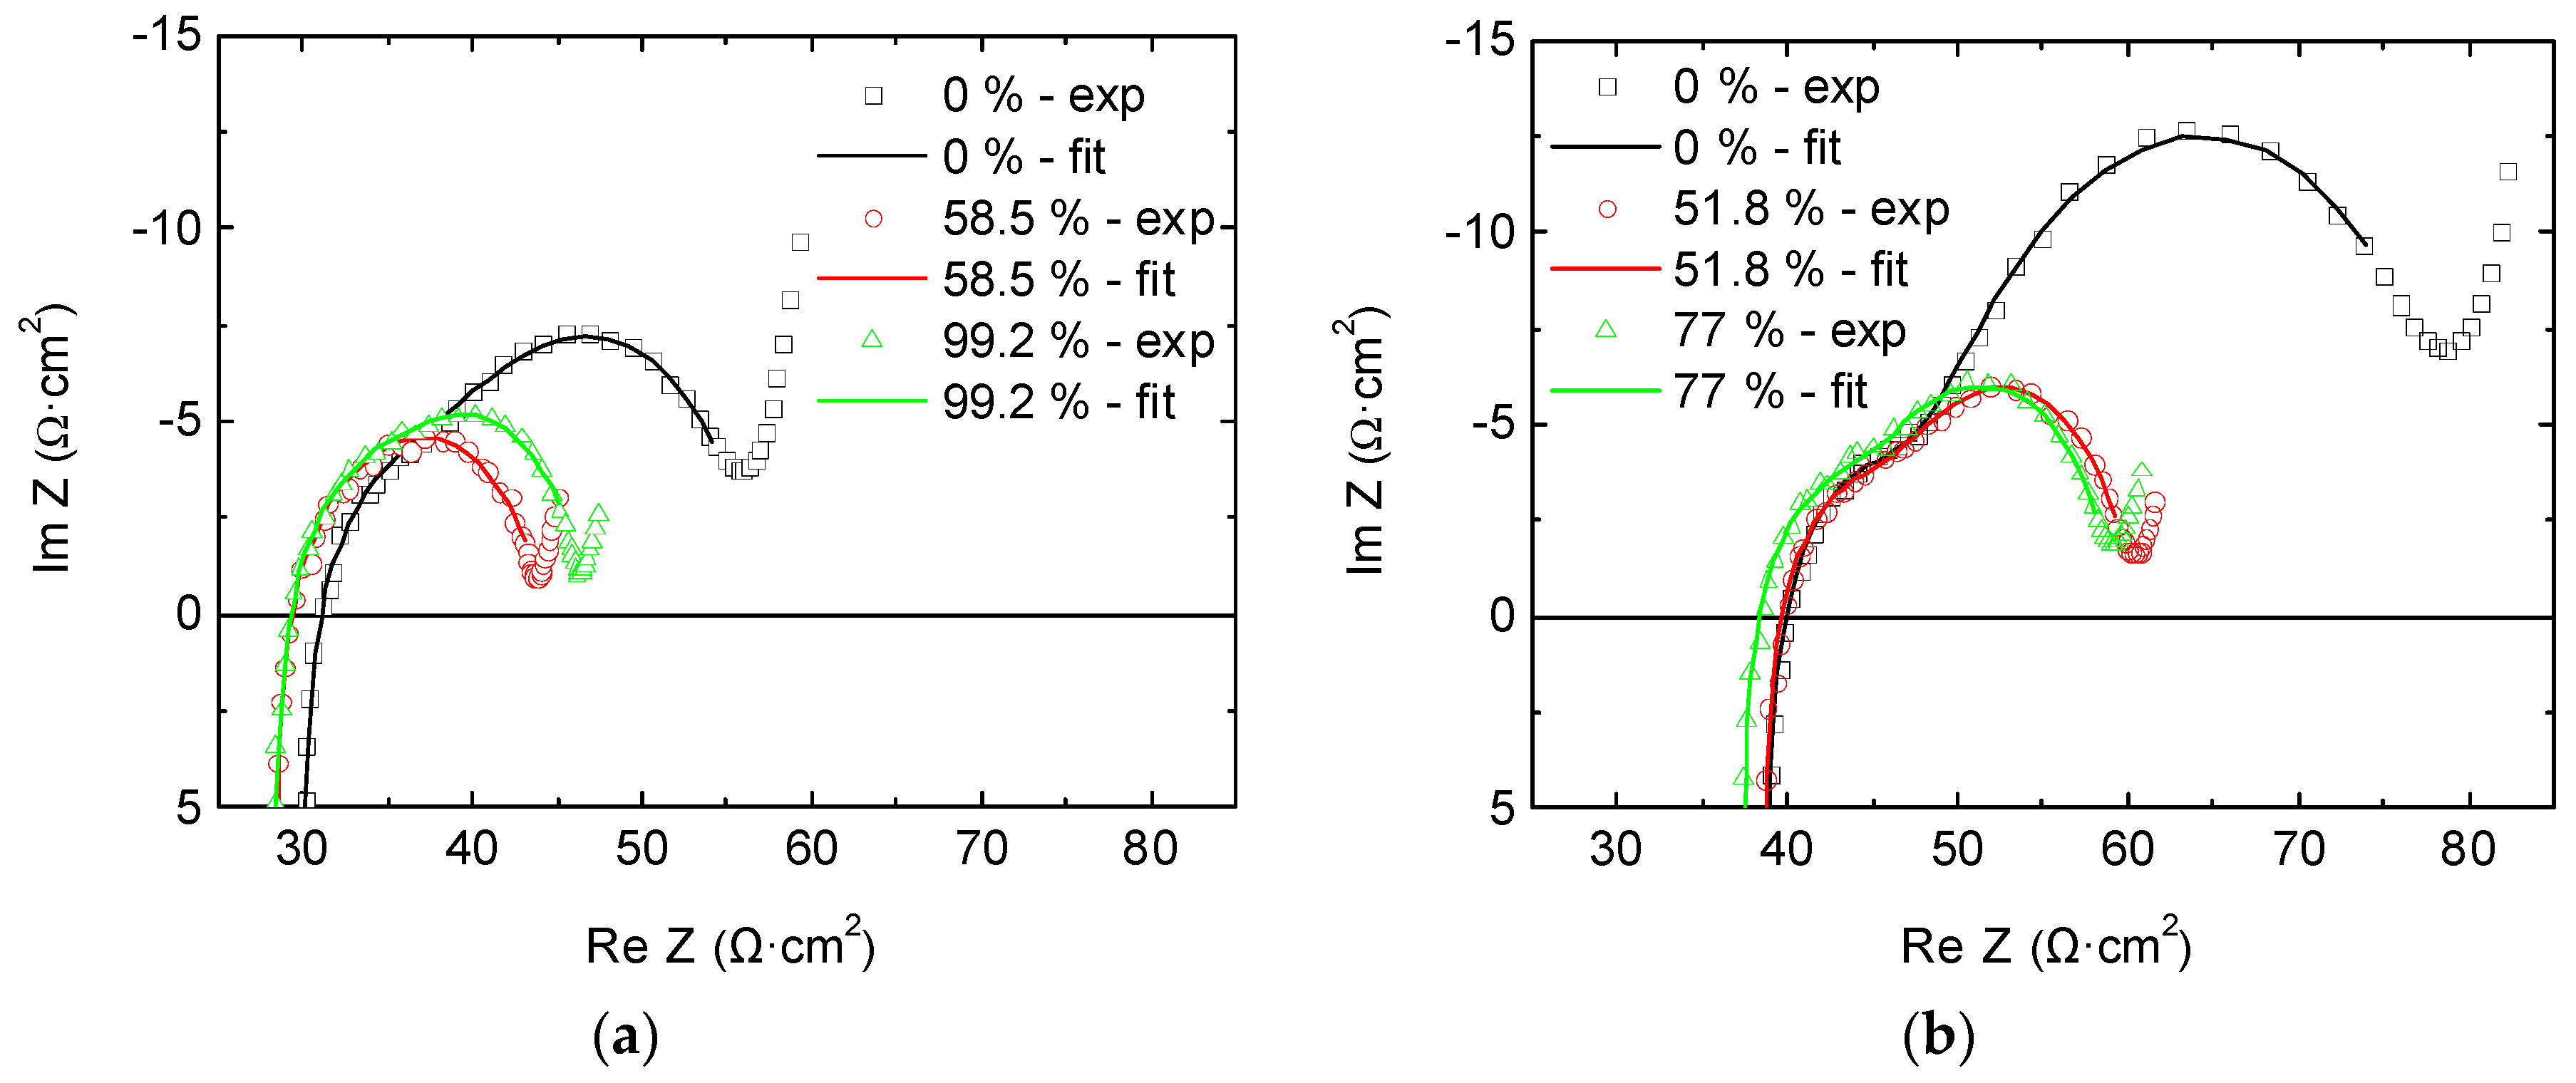
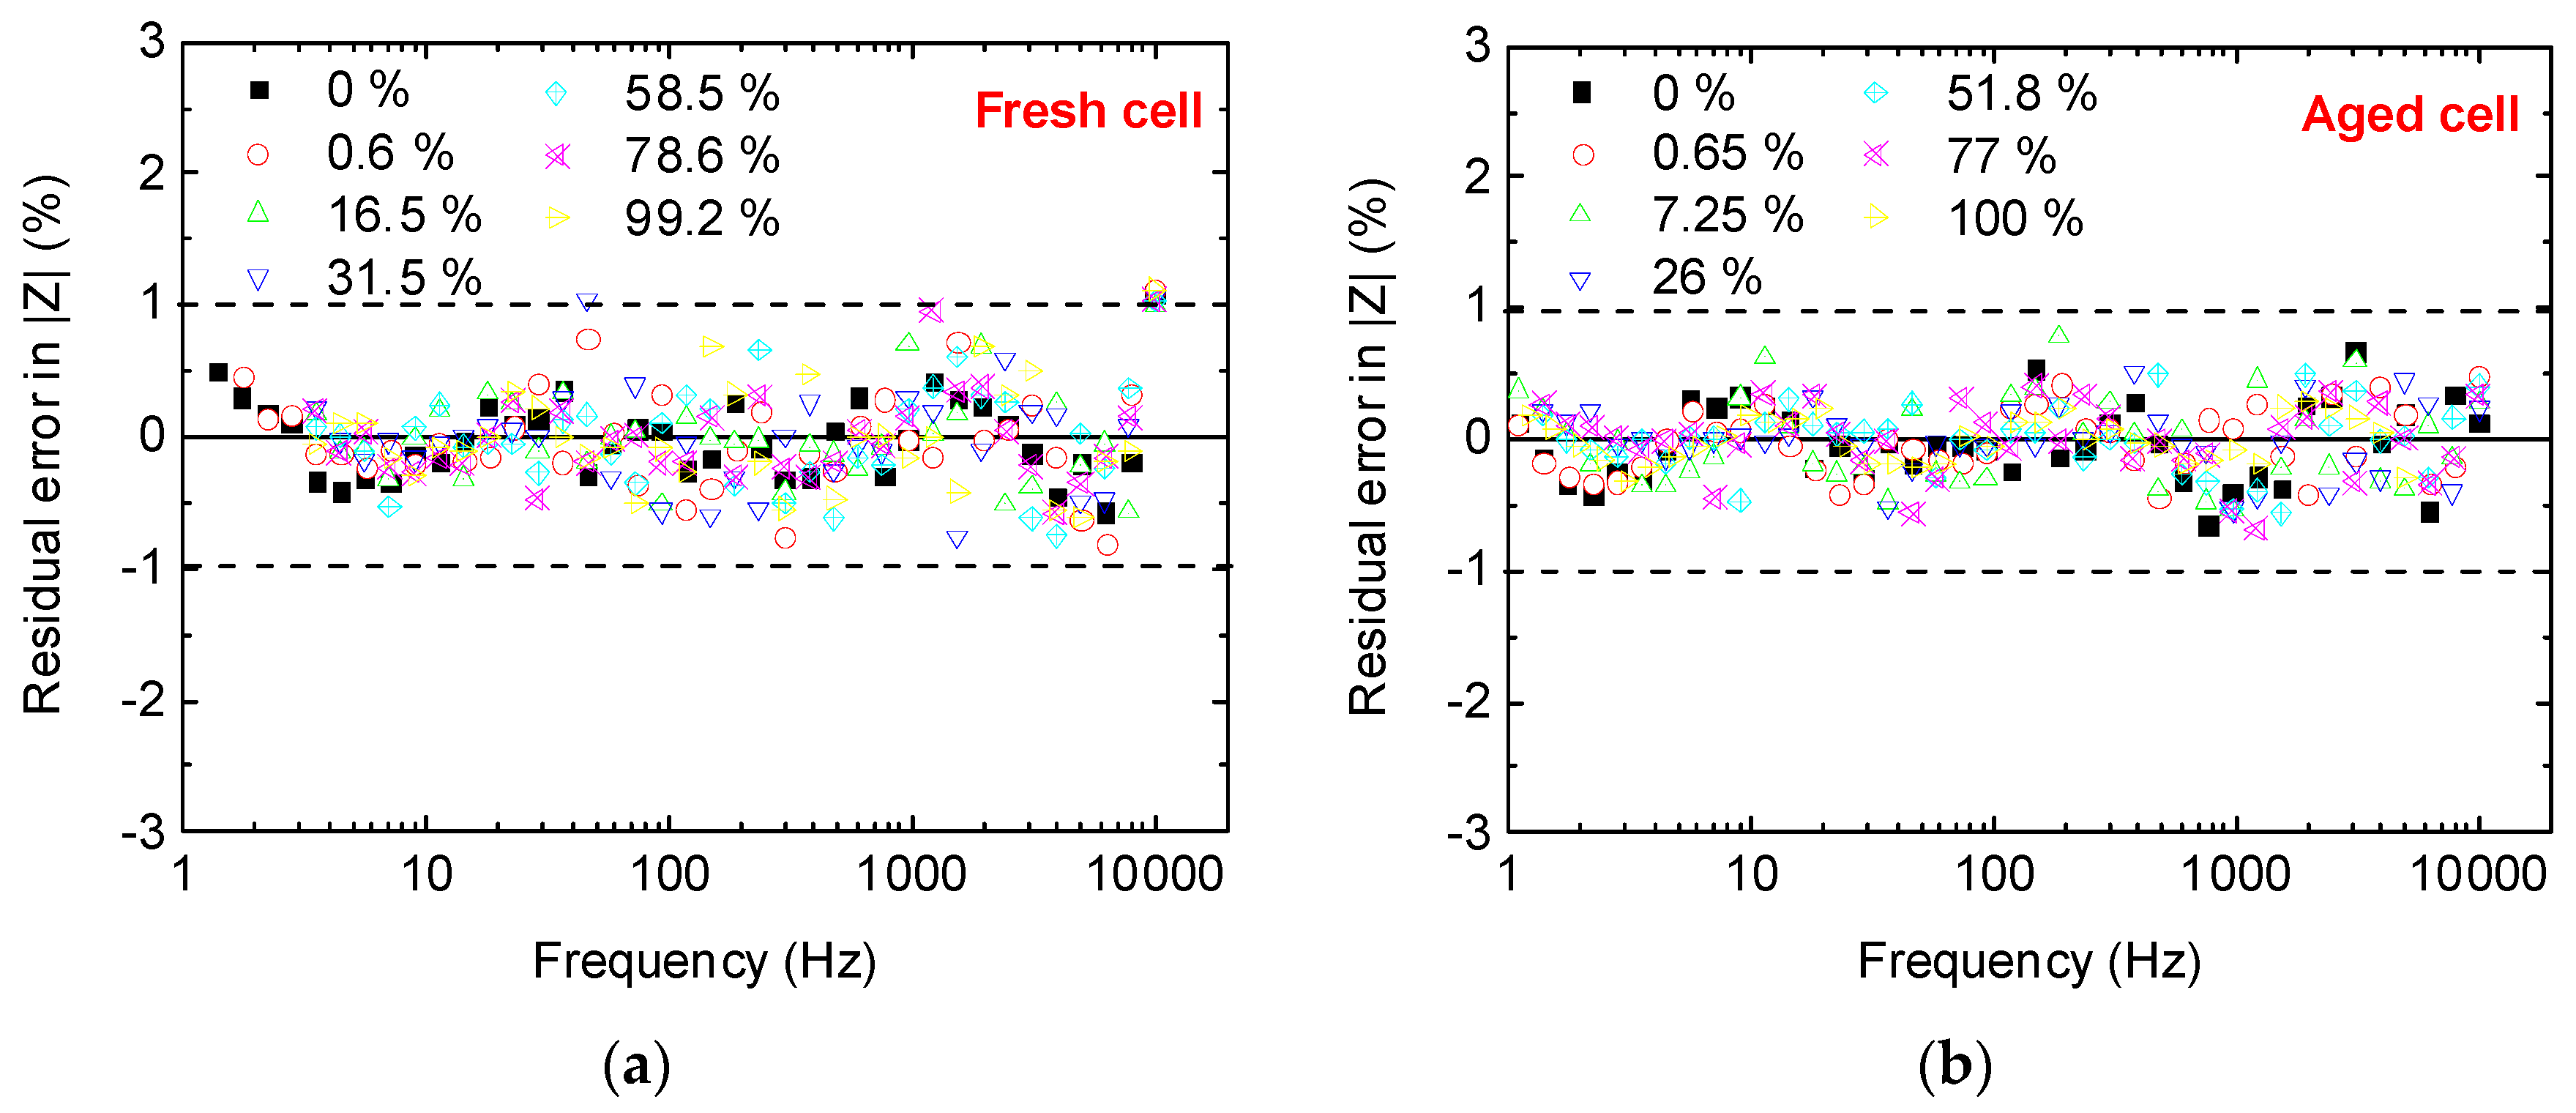
The resulting impedance spectra after fitting the electrical model (Figure 9) to the full-cell impedance spectra (Figure 8) are depicted in Figure 10. The residual error in the modulus of impedance, which is obtained as the difference between experimental and estimated values, stayed mostly below 1% (Figure A4), thus indicating that the fitting process was accurate in the evaluated frequency range (1 Hz to 10 kHz) [20].
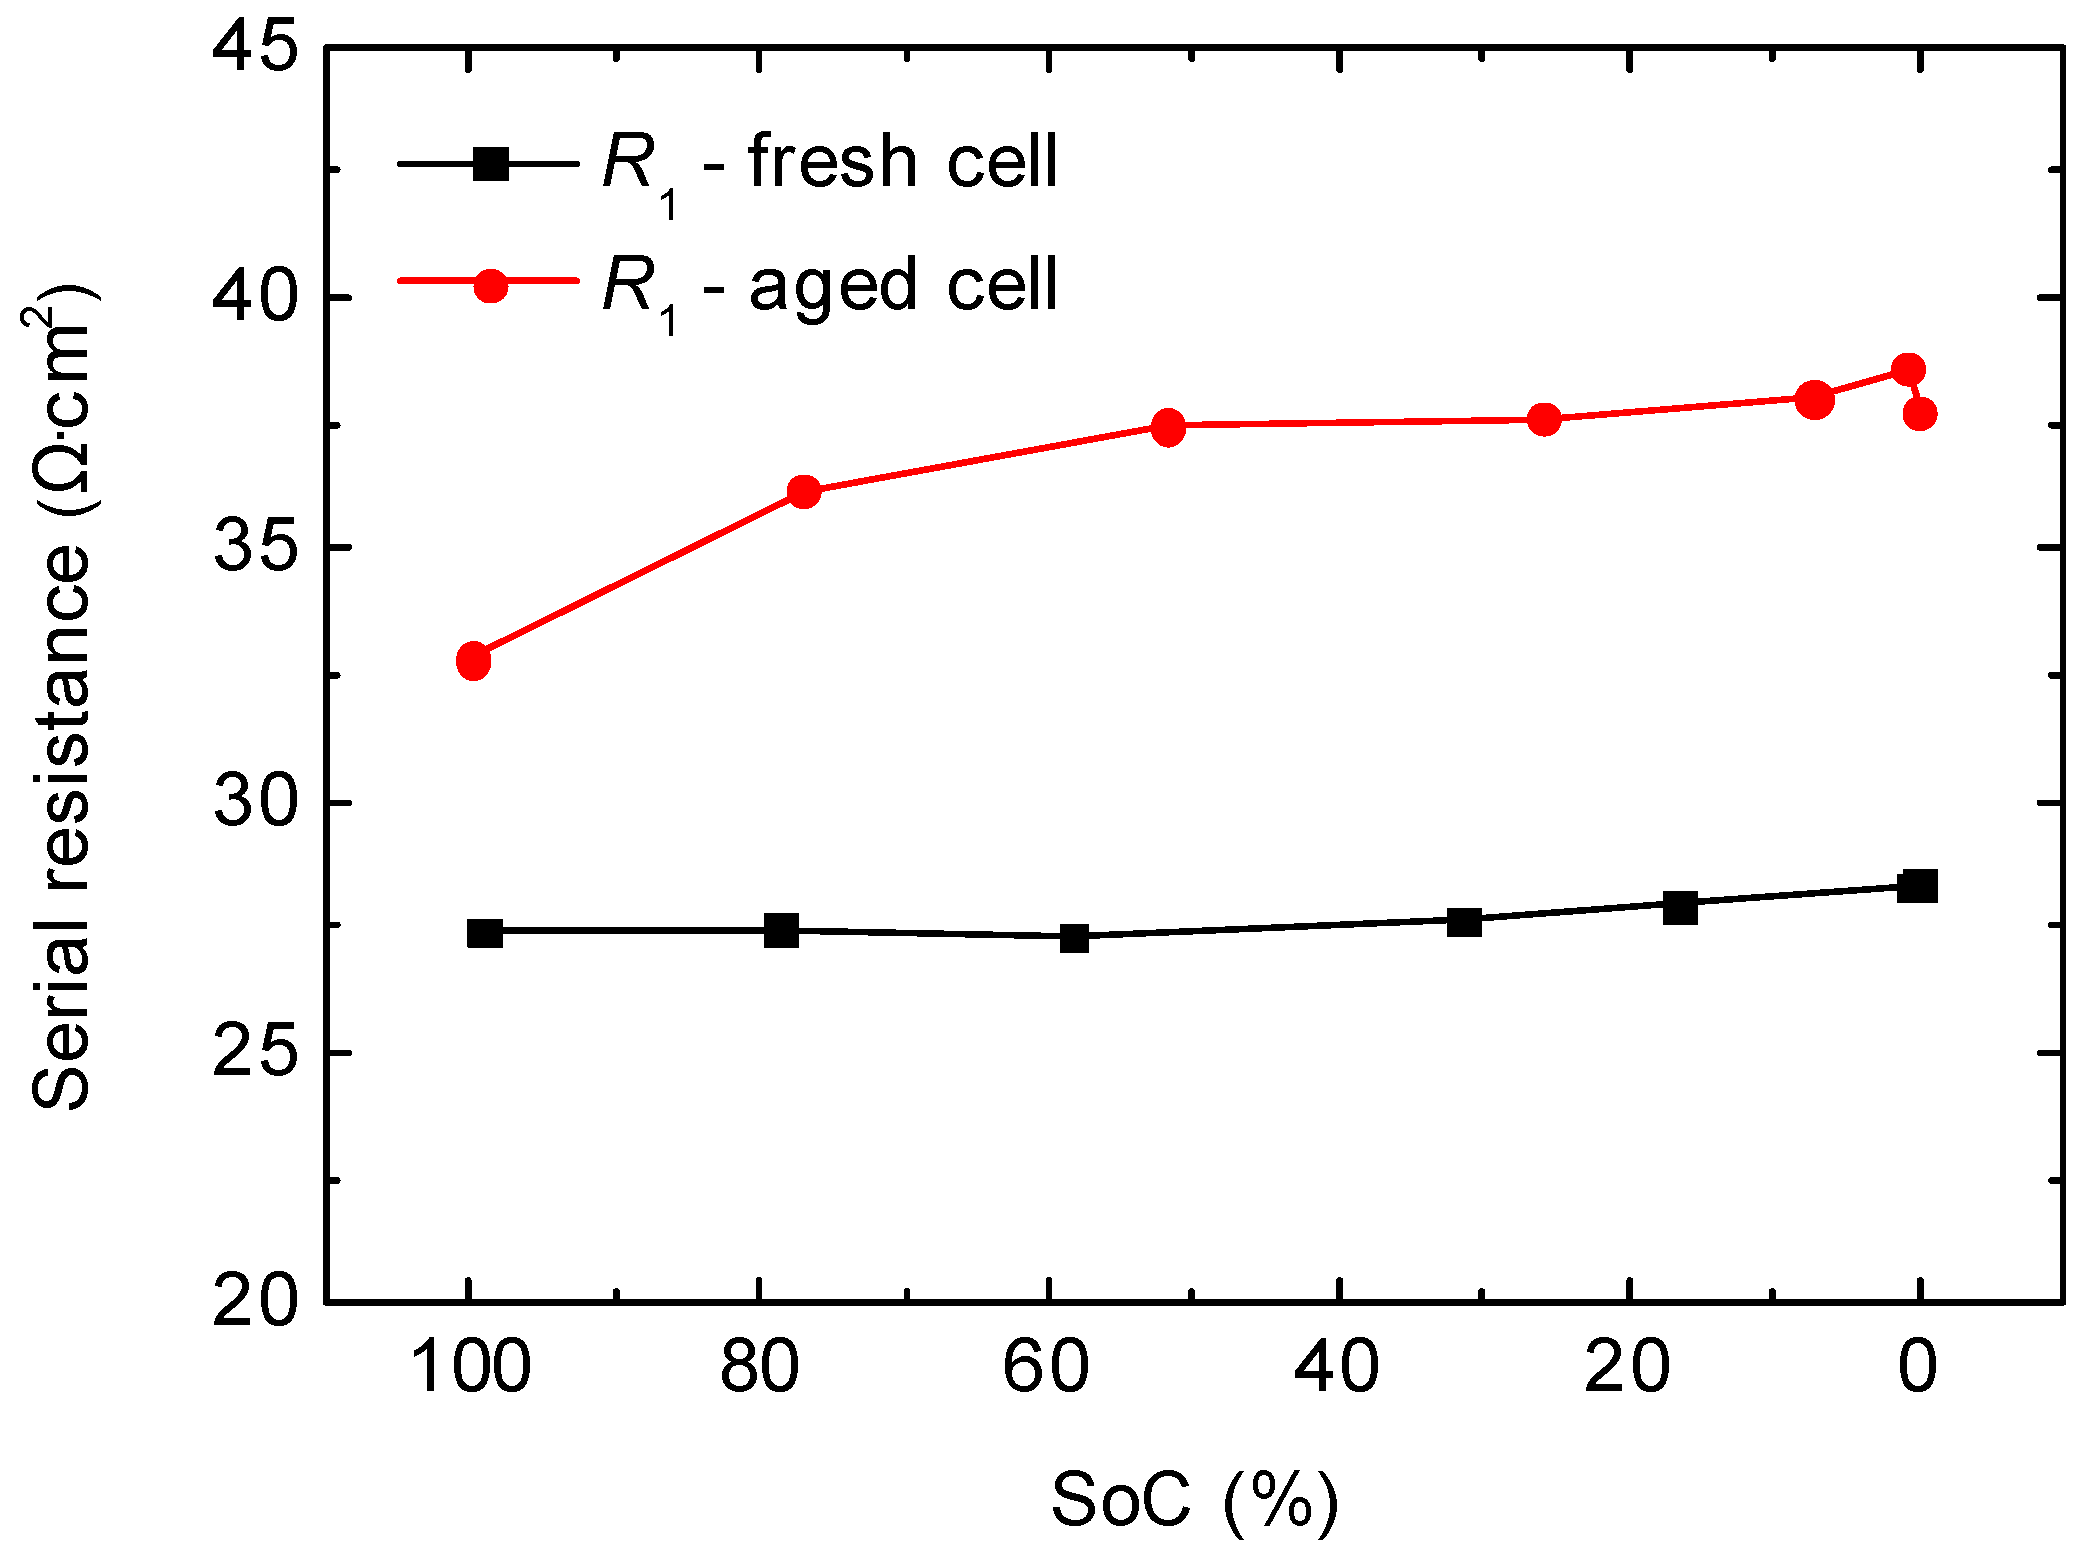
We find that serial resistance (R in Figure 9) slightly increases as the SoC decreases (Figure 11), as it has already been stated in other studies [28,41,51]. The SoC dependency of this resistance cannot come from the electronic conduction but comes from the ionic conductivity of the electrolyte because it depends on the concentration of ions [52]. Moreover, we find that serial resistance increases by a factor of 1.35 because of the cycle-aging process, which could be reasonably attributed to the decomposition of the electrolyte [28].
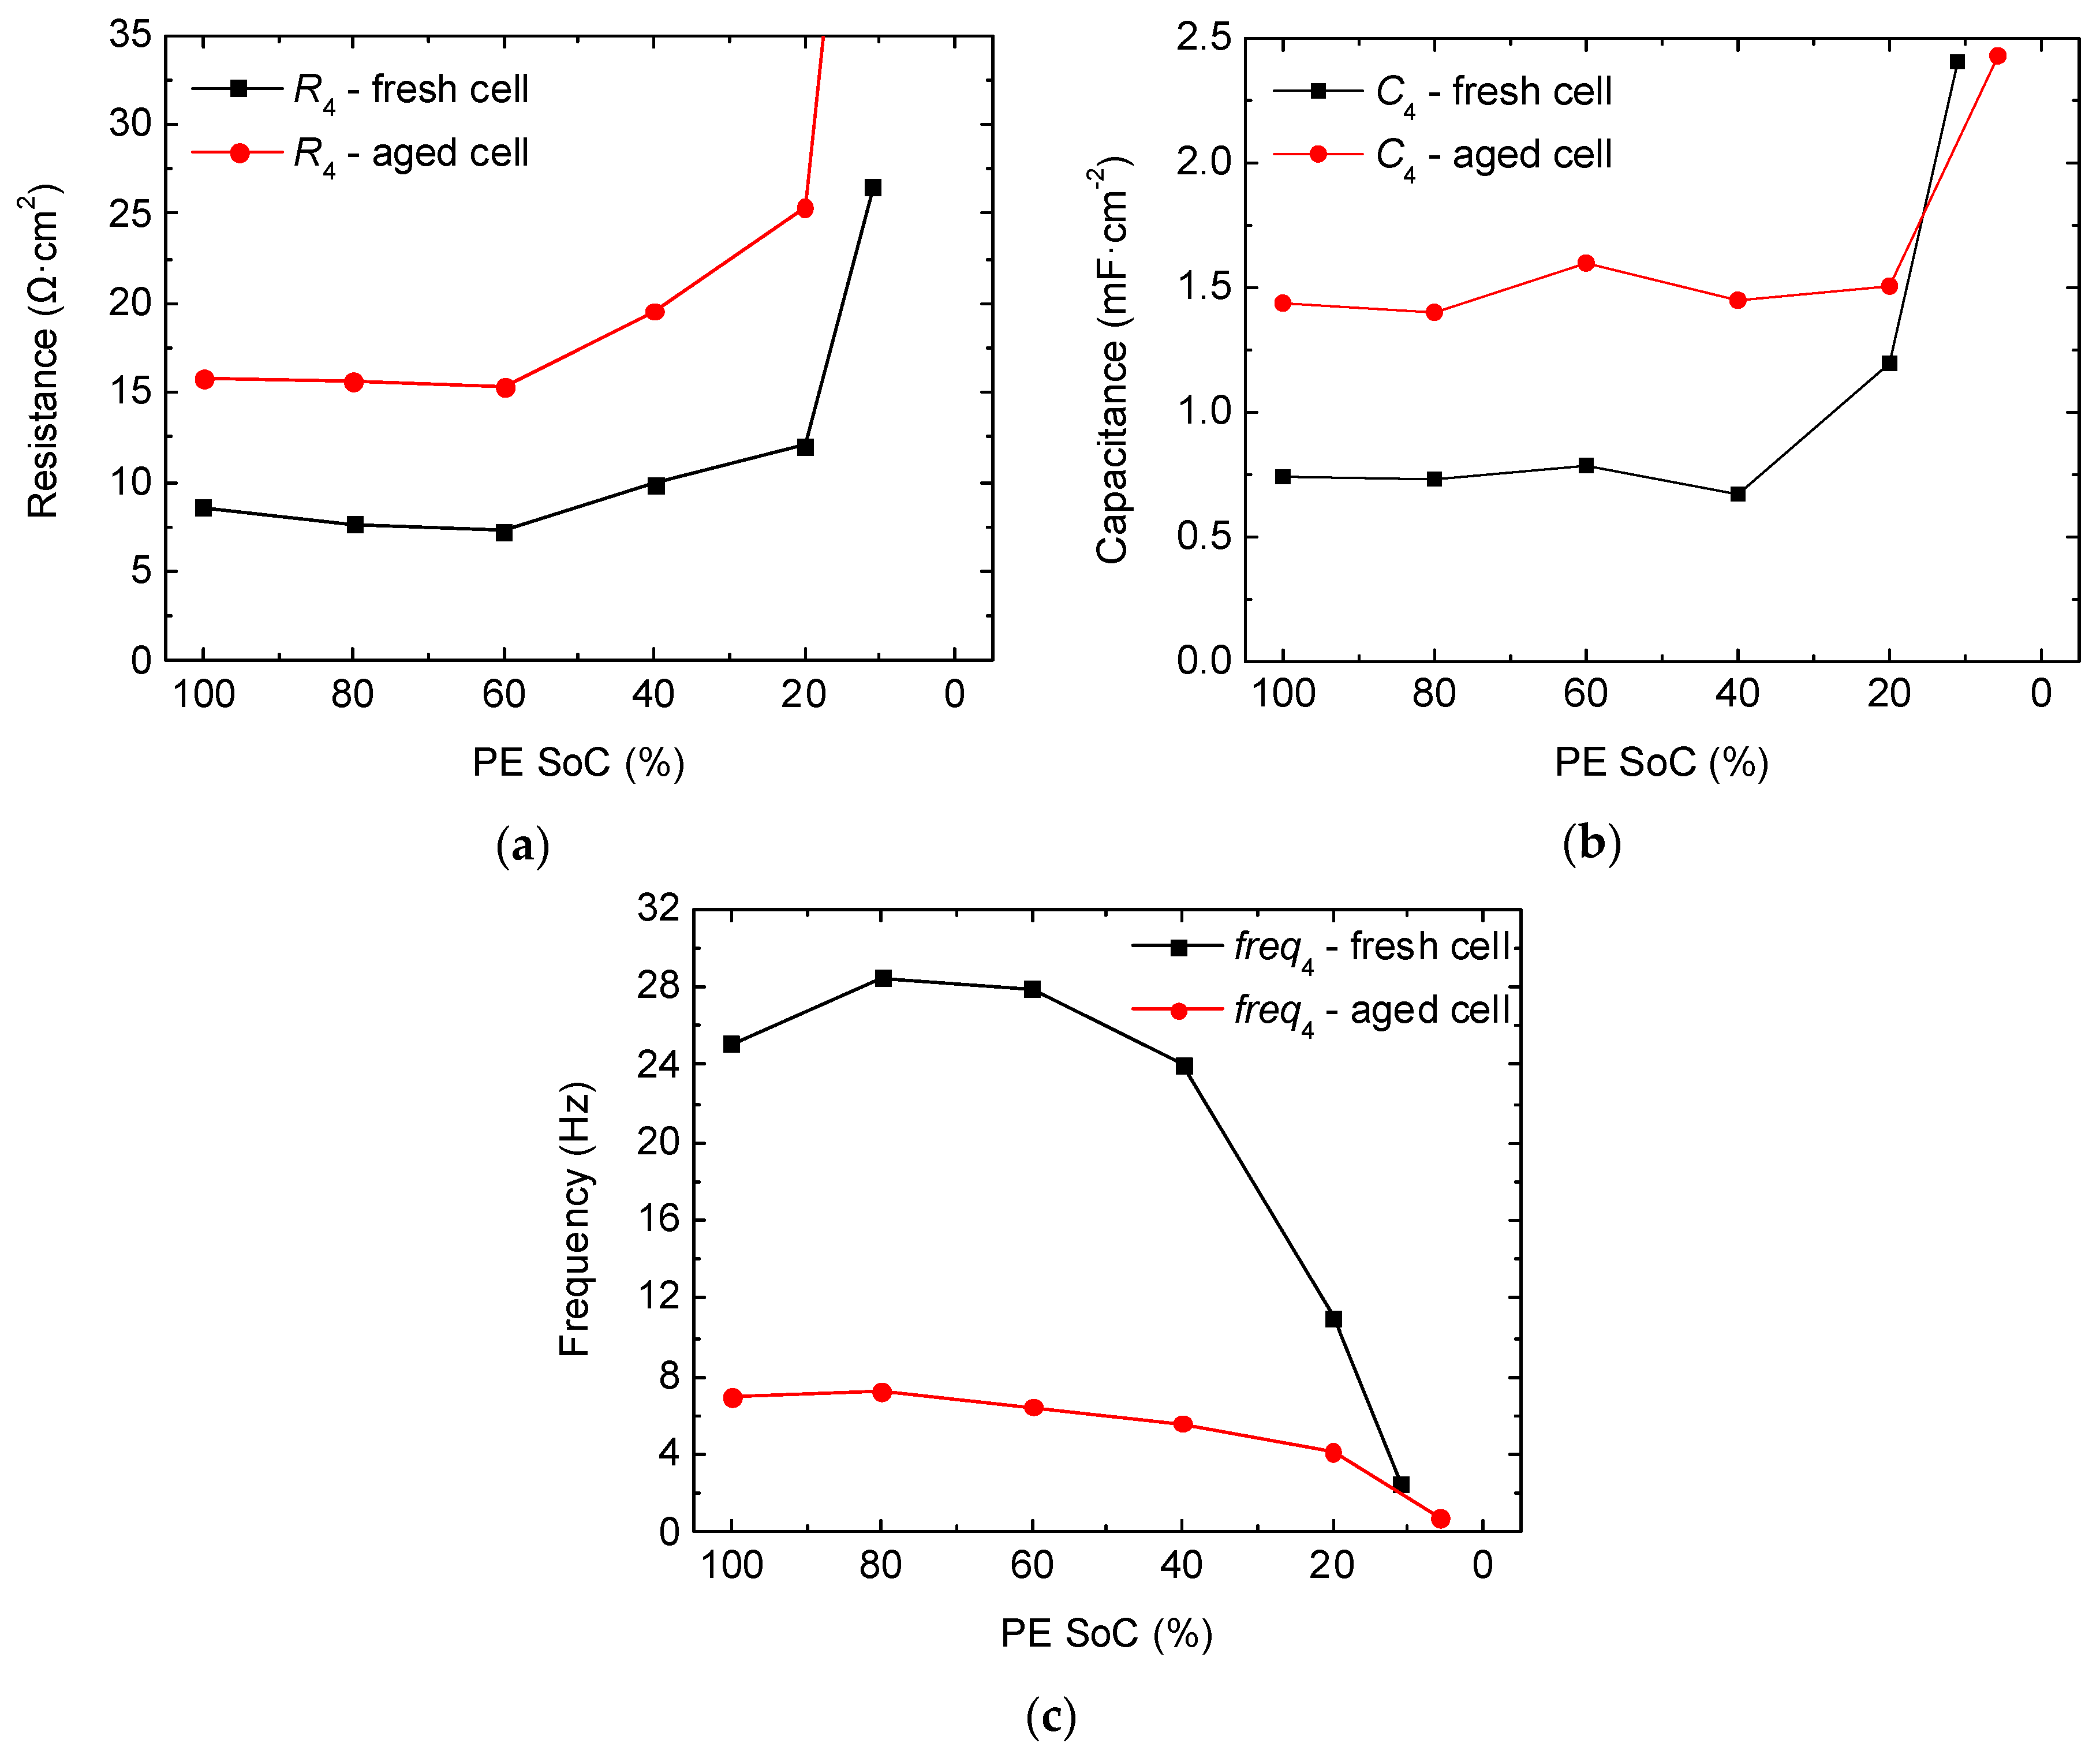
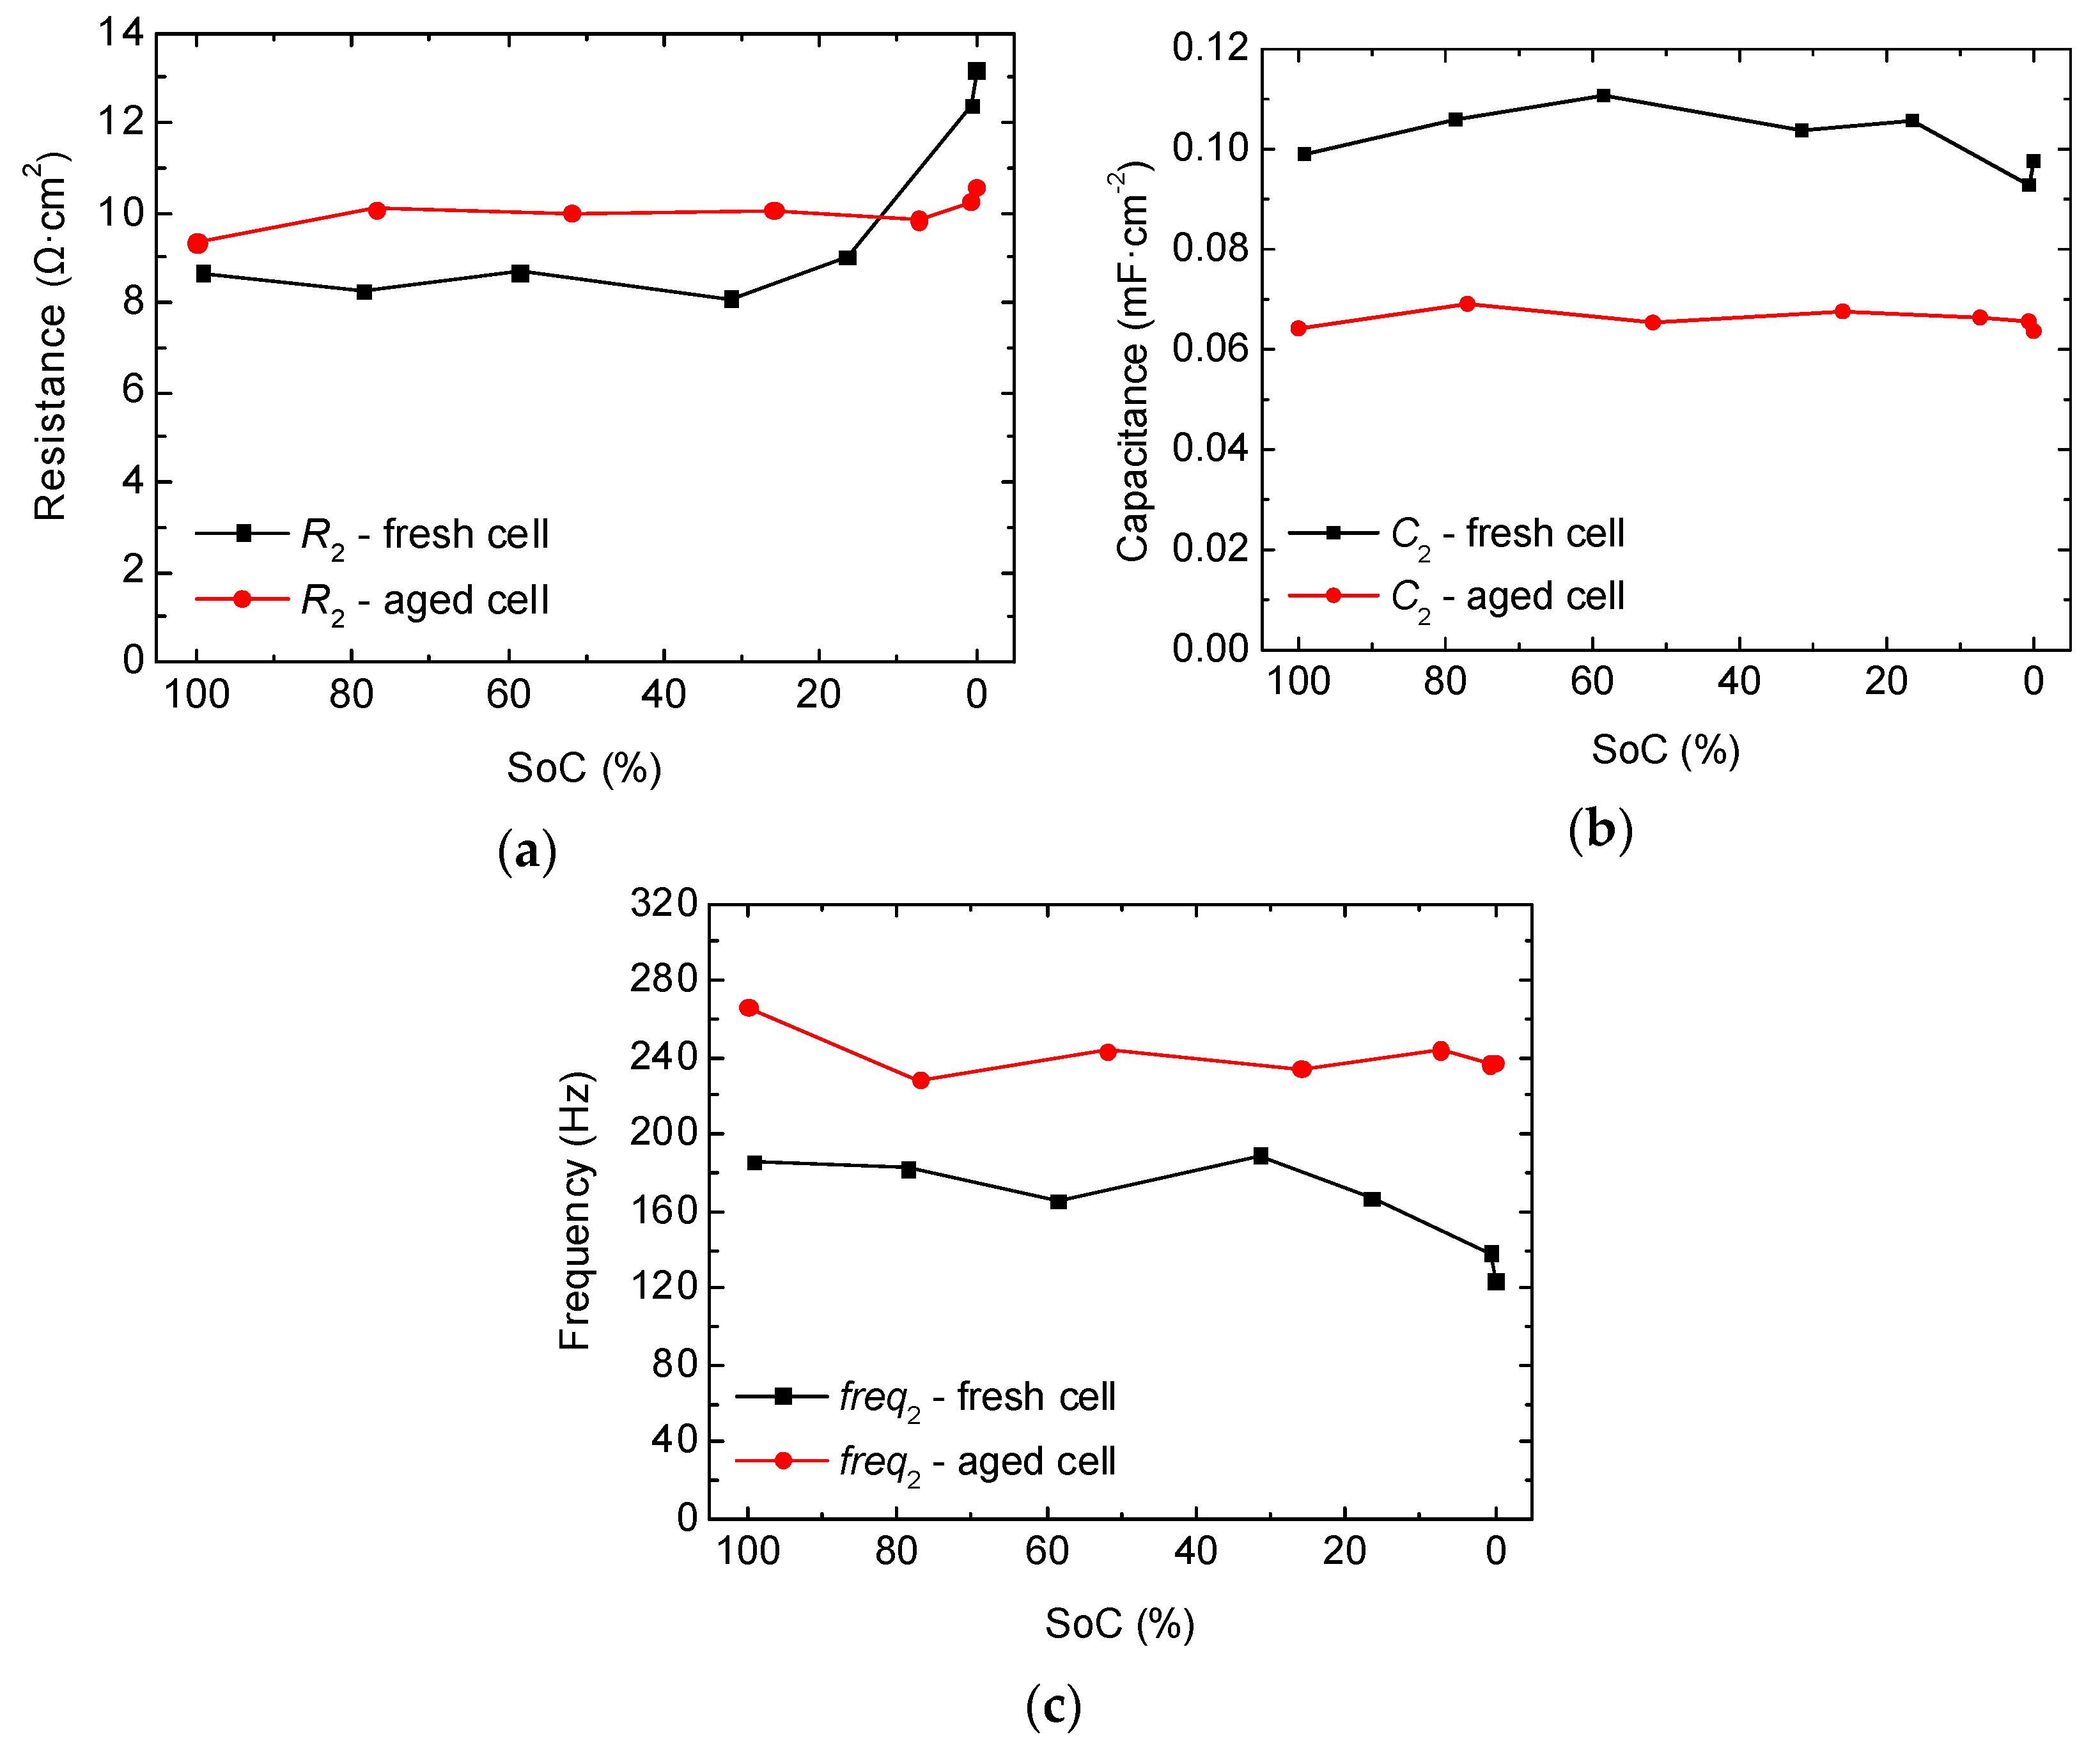
We now focus on the semicircle labeled as P2_FC (Figure 8), which corresponds to the highest frequency semicircle. The resistance associated to this effect remains constant in almost the entire SoC range, except at very low SoCs, in which it increases (Figure 12a). In contrast, C2 first increases from a SoC of 100% to intermediate SoCs, and then decreases until the end of discharge (Figure 12b). The characteristic frequency of P2_FC stays between 180 Hz and 240 Hz (depending on the aging level) but does not show a strong dependence on the SoC.
After subjecting the cells to the aging test, we find that the resistance corresponding to P2_FC increases. However, the fresh cell suffers a higher increase of resistance towards low SoCs, surpassing the contribution of the aged cell (Figure 12a). Concerning the characteristic frequency of this effect, it goes from around 180 Hz at the fresh state to 240 Hz at the aged state (Figure 12c). An effect in this frequency range has already been measured in other published studies [36,38,41,53] and has been attributed either to the charge-transfer process at the negative electrode [38] or to transport across the SEI layer [36,41,53]. In general, SEI resistance is found to vary slightly with the SoC compared to charge-transfer resistance, although, in many cases, they follow the same tendency [20,37,53,54]. In our case, the resistance increases towards the end of discharge, but capacitance and frequency do not show a strong variability with the SoC, as could be expected from a charge-transfer process. If we evaluate the results obtained from the half-cells, we observe that all the processes taking place at the positive electrode are already identified, and not one coincides with the characteristic frequency of P2_FC. Thus, this indicates that P2_FC has to represent an effect that takes place at the negative electrode. In fact, according to the literature, in which transport across the SEI layer commonly takes place around 250 Hz [28,36,37,41], and to the decrease in capacitance of P2_FC which we associated with the increase in thickness of the SEI layer, we conclude that P2_FC has to correspond to the transport of ions in the SEI layer. In fact, the formation of a surface layer on the top of the negative electrode was clearly observed during the post-mortem analysis we carried out in Reference [40]. We present some of the results of this analysis in the Appendix. In particular, we show images of fresh and aged negative electrodes taken as with the naked eye and with a laser microscope (Figure A5). In fact, the formation of a surface layer on the top of the negative electrode was clearly observed during the post-mortem analysis we carried out in Reference [40]. We present some of the results of this analysis in the Appendix. In particular, we show images of fresh and aged negative electrodes taken at naked eye resolution and with a laser microscope (Figure A5).
Regarding the variability of these parameters with aging, the characteristic frequency increases, the resistance corresponding to P2_FC also increases except at the lowest SoCs, and C2 decreases (Figure 12). The increase in resistance corresponding to the SEI layer is expected because it is well-known that SEI increases in thickness during continued cycling [7,9,21,41]. Likewise, the increase in thickness (represented as d in Equation (4)) would reduce the capacitance. This coincides with the obtained results (Figure 12b). Concerning the increase in the characteristic frequency (Figure 12c), even though one would expect a decrease in frequency due to the slowdown in the transport of ions across the SEI layer, we find that a slight increase in the characteristic frequency has also been stated in Reference [55]. They demonstrated that Mn migration during cycling from the positive electrode to the negative electrode causes an increase in the characteristic frequency of the SEI layer. Furthermore, this Mn-contamination also produces a decrease in resistance, which can also be appreciated in our results at low SoCs (Figure 12a). In fact, in a previous work [40], we detected the presence of 0.1% of the total Mn at the negative electrode of these cells by inductively coupled plasma (ICP) measurements. Thus, this could be the cause for the increase in frequency with aging in the SEI layer. Regarding the decrease in resistance, Gordon et al. demonstrate that it is compensated by the increase in resistance due to cycling [55]. Thus, one possible explanation to the decrease in resistance that we only detected at low SoCs, might be that at medium and high SoCs, the effect of cycling predominates over the manganese.
Considering P3_FC, we find that both resistance and capacitance increase at extreme SoCs (Figure 13a,b). Similar results have already been reported in Reference [41], in which a minimum of resistance is also found at intermediate SoCs. During the aging test, the characteristic frequency at intermediate SoCs of P3_FC is located around 28 Hz in the case of the fresh cell and 8 Hz in the aged state. This evident decrease in frequency indicates a great slowing-down—by a factor of around 3.5—of the process due to the cycle-aging test (Figure 13c). Actually, if P3_FC (Figure 13) and P4_PE (Figure 7) are compared, tendencies and absolute values of resistance, capacitance, and characteristic frequencies completely match. Thus, P3_FC corresponds to P4_PE and represents a charge-transfer process that takes place at the surface of the positive electrode. For further validation of the results, we also determined in a previous work the charge-transfer resistance by measuring the overpotential generated at three different low discharge rates (in order to be at the linear regime of Butler–Volmer equation) [40]. Then, we obtained charge-transfer resistance by calculating the slope of the obtained V-I curve. As a result, we obtained comparable values by using these two approximations. The results can be found in Reference [40].
3. Materials and Methods
The evaluated cells were 2.8 Ah Li-ion cells provided by LG_Chem in a 18650 cylindrical format. The positive electrode (PE) and negative electrode (NE) were composed of LiCoO2-Li(NiMnCo)O2 (LCO-NMC) and graphite, respectively. The experimental procedure was studied in the following terms:
- (1)
- Cycle-aging processes: Charge and discharge are used to age the samples.
- (2)
- Postmortem analyses: Half-cells composed of cathode—Li and Li—anode.
- (3)
- Characterization: Impedance spectroscopy on a two-electrode configuration for both original cells and half-cells.
3.1. Cell Preparation and Cyclec-Aging Process
In order to evaluate the impedance at various aging levels, commercial cells were first subjected to six formation cycles to allow the initial formation of the SEI layer and stabilize the capacity of the cells. After these formation cycles, cells are referred to as fresh cells. They were subjected to a cycle-aging process between 3 V and 4.3 V in an HVBT 5560 Arbin Tester. Specifically, 322 charge and discharge cycles at C/2 and 3C/2 rates, which correspond to the recommended charging current and the maximum discharge current, were carried out, until the capacity fade was 24%. Cycling was carried out in a climatic chamber at 25 °C. The temperature of the cells under operation was measured externally by attaching thermocouples to the cell surfaces and recording the data by a personal DAQ/50 series. Thermal paste was employed to enhance thermal contact between the cells and the sensors. At that point, we refer to the cells as fresh cells and those after the cycle-aging test as aged cells.
3.2. Building Half-Cells
Fresh and aged cells were opened inside a glove box in an argon atmosphere at the Institute for Power Electronics and Electrical Drives (ISEA), located in Aachen (Germany). To build the half-cells, twelve round samples of 16 mm diameter were harvested from each one of the positive and negative electrodes of fresh and aged cells. Half-cells were built in a coin cell format introducing the harvested positive or negative electrode, a new separator, 90 μL of fresh electrolyte, and metallic lithium as the counter electrode. The collected samples were composed of a current collector foil, which was covered by active material on both sides. The active material of one side of the collector was removed with N-Methyl-2-pyrrolidone (NMP) solvent by hand until the active material detached from the current collector (CC) in order to ensure electrical contact in the coin cell.
Moreover, half of the samples were rinsed in dimethyl carbonate (DMC) for a few seconds and left to dry inside the globe box in order to eliminate the residual electrolyte and phosphates from the top of the electrode and to compare the results with non-rinsed samples. In the literature, the actual effects of rinsing the electrodes and considerations of the time they need to be immersed for and drying are not clear [32,39,56,57,58]. In our case, we measured impedance in both cases, and no relevant differences were found between washed and non-washed electrodes. Thus, no differentiation is made in the results section. Further information on the experimental details can be found elsewhere [40].
3.3. Impedance Measurements
Impedance measurements of the full cells were done in galvanostatic mode as recommended for Li-ion cells in which the voltage can change during testing [59,60]. Impedance measurements were performed to the full cell during a discharge process with a Bio-Logic VMP potentiostat/galvanostat. Concretely, cells were fully charged at a C/25 rate and discharged at the same rate in steps of approximately 20% SoC, at which impedance was measured. In order to allow the open circuit voltage (OCV) to stabilize, a resting period of 4 h was kept before measuring impedance. The current amplitude was set to 50 mA, which shows a good signal-to-noise ratio and stays in the linear region [61]. The frequency was shifted between 3 mHz and 10 kHz. All measurements were carried out at 25 °C and their repeatability was assessed for the different cells.
Impedance measurements of half-cells were performed with a Zennium electrochemical workstation provided by Zahner. The frequency was shifted from 10 mHz to 3 MHz. In order to have comparable data, all measurements were carried out by placing the cells in the same holder inside a climatic chamber at 25 °C. For the half-cells, we used the potentiostatic approach. In the particular case of Li-ion cells evaluated around the open circuit voltage, which have a linear or exponential voltage to current relation depending on the applied overvoltage, both methods are valid, as stated in Reference [59,62]. Before measuring impedance, half-cells were fully charged in galvanostatic mode at a rate of C/10. Then, partial discharges of approximately 20% SoC were carried out at the same rate, and a resting period of 2 h was employed at each step before measuring impedance. In order to validate the reproducibility and reliability of the half-cell building procedure, we compared the impedance results of various samples harvested in the same electrode region.
In this study, we evaluate the evolution of impedance with the state-of-charge, and we identify the electrode causing the impedance effects we measure. The same analysis is done for the particular cases of a fresh cell and an aged cell. However, it is outside of the scope of this paper to find a correlation between aging—or the number of cycles—and the various impedance effects (this will be performed in the future).
3.4. State-of-Charge Definition
The most accepted definition of SoC is the ratio of the remaining charge to the actual capacity of the cell [4,63]. At the same time, the capacity depends on the operating voltage window, on charge/discharge rate, and on the temperature of the cell. Regarding the current at which the capacity is determined, it has to be minimized in order to minimize the kinetic limitations. We have measured the capacity of the cells at C/25 at 25 °C (Table 1) with a battery tester provided by BasyTec in a laboratory with controlled temperature. Therefore, we defined independent SoCs depending on the evaluated voltage window.
3.5. Fitting Process
In order to track the evolution of impedance with the SoC, electrical models were fitted to the impedance responses of the full-cells and half-cells. Models were composed of an inductive part, a pure resistive part represented by a serial resistance, and a network of capacitors and resistors placed in parallel. The number of RC networks—a parallel combination of a resistor and a capacitor—varied depending on the evaluated cell. The inductive part is commonly related to the cables and connections but also to the internal number of windings of the electrodes in the particular case of cylindrical cells [64].
Serial resistance represents the ohmic losses related to the electronic conduction—including electrode particles, tabs, and current collectors—and the ionic conduction through the electrolyte [65]. RC networks represent interfaces that form inside the cells. Those interfaces show a capacitive behavior that corresponds to a semicircle in the Nyquist representation of impedance. Specifically, capacitive behaviors are generated at the interfaces between the active material and the electrolyte (double-layer capacitance), current collectors, and the active material or along the SEI layer [7,9,16,20,21,23,24]. In the particular case of the interface between the electrolyte and active material particles, when ions intercalate at the surface of the electrode, this results in a faradaic charge-transfer reaction. Therefore, electrical energy is stored electrochemically [66]. Charge-transfer resistance represents the speed at which this electrochemical reaction takes place [66] and double-layer capacitance is related to an electrical double layer that forms at this interface. It has been demonstrated that this layer behaves as a molecular dielectric and stores charge electrostatically [67].
Actually, CPEs are employed instead of capacitors because pure capacitive behaviors are only related to homogeneous surfaces, which is not commonly the case in batteries [68]. Equivalent capacitance, C, can be calculated from the CPE elements Q and n (1) [69]. n is an empirical constant that ranges from 0 to 1 and represents how close the behavior of the CPE to a pure capacitor (n = 1) or a resistor (n = 0) is. The characteristic frequency related to an RQ element is obtained from Equation (2). We fixed the value of n between 0.5 and 1 as a pre-condition for the fitting algorithm because it usually switches between those two values for experimental systems [70]. In general, the capacitance generated between two conducting plates insulated one from the other and placed sufficiently close is defined as the ratio between the charge of the plates (q) and the difference in voltage between them (ΔV) (3). In particular, when the two plates are parallel, capacitance is defined as Equation (4), in which A represents the area by which the two parallel plates overlap one another, d is the distance between the plates, and ε is the permittivity of the medium between the two plates [71].
In our impedance measurements, we identified a diffusive part, which was represented at the Nyquist plot by a diffusive branch at the lowest frequencies. However, this transport phenomenon was not considered in this study because we wanted to focus on ohmic and activation terms; diffusion is going to be analyzed separately in future work. Therefore, we fitted the model at frequencies above the diffusive branch, avoiding the overlapped part of the semicircle located next to that branch. Nevertheless, the avoided part of this semicircle was small compared to the total perimeter of the semicircle, which allowed the convergence of fitting. Concretely, fitting was performed with Z Fit software provided by Bio-Logic. The adjustments were performed following two minimization algorithms. Firstly, randomization was applied for 5000 iterations in order to initialize the variables, and then Simplex was applied for another 5000 iterations.
4. Conclusions
Charge-transfer processes and transport phenomena at the interfaces in an LCO-NMC cell are evaluated through impedance measurements. Simple electrical models are fitted to the impedance spectra in order to quantify the various physical processes. The evolution with aging of resistance, capacitance, and characteristic frequency are evaluated at various SoCs at 25 °C. From half-cell measurements, the two identified electrochemical processes at the full-cell impedance are assigned to the corresponding electrode, which causes them. In particular, one of the effects is clearly caused by charge transfer at the positive electrode whereas the other effect is presumably caused by the transport of Li+ across the SEI layer. The charge transfer at the interfaces between current collectors and active material particles are also identified from the half-cell measurements.
Finally, we found that the positive electrode charge transfer is more affected by the cycle-aging test at 25 °C than the SEI layer. Although the SEI layer increased in thickness, as could be seen from the decrease in capacitance and the increase in resistance, charge-transfer resistance suffered a larger increase. In fact, the slowing-down of the electrochemical reaction detected by the increase in charge-transfer resistance is also validated by the reduction of the characteristic frequency of this effect during the aging test, which was around 70%. Nonetheless, the highest contributor to total resistance is the serial resistance, independent of aging and SoC.
Author Contributions
V.J.O. designed and performed the experiments as well as the analysis of the data. A.C. participated in the conception, the discussion of the results, the reviewing of the document, and the funding acquisition.
Funding
This research was funded by the Spanish Ministry of Education, Culture and Sport FPU contract grant number FPU12/02603 and the MINECO/FEDER project TEC2015-63899-C3-1-R.
Acknowledgments
We are very grateful to the Electrochemical Energy Conversion and Storage Systems Group from the Institute for Power Electronics and Electrical Drives (ISEA) for sharing their knowledge about post-mortem analysis and for letting us carry out the tests at their Institution. In addition, we want to acknowledge the Hawaii Natural Energy Institute (HNEI) for giving us the possibility to use their facilities to cycle the cells and carry out the impedance measurements.
Conflicts of Interest
The authors declare no conflict of interest.
Appendix A
Figure A1.
(a) Resistance and (b) characteristic frequency related to P3_NE measured at the graphite/Li half-cell at 25 °C.
Figure A1.
(a) Resistance and (b) characteristic frequency related to P3_NE measured at the graphite/Li half-cell at 25 °C.

Figure A2.
Sample harvested from the positive electrode of an aged cell. Pressure lines are clearly observed and there is an evident detachment of the active material from the current collector, especially at the pressure lines. A methodology and complete post-mortem analysis can be found in [40].
Figure A2.
Sample harvested from the positive electrode of an aged cell. Pressure lines are clearly observed and there is an evident detachment of the active material from the current collector, especially at the pressure lines. A methodology and complete post-mortem analysis can be found in [40].

Figure A3.
(a) Resistance and (b) characteristic frequency related to P3_PE measured at the LCO-NMC/Li half-cell at 25 °C.
Figure A3.
(a) Resistance and (b) characteristic frequency related to P3_PE measured at the LCO-NMC/Li half-cell at 25 °C.

Figure A4.
Residual errors for (a) a fresh full-cell and (b) an aged full-cell at various SoCs. Residual errors are obtained as the difference between the experimental values and the estimated ones for each frequency.
Figure A4.
Residual errors for (a) a fresh full-cell and (b) an aged full-cell at various SoCs. Residual errors are obtained as the difference between the experimental values and the estimated ones for each frequency.

Figure A5.
Visual inspection of the negative electrode after disassembling (a) the fresh cell and (c) the aged cell. Images taken with the laser microscope of the (b) fresh negative electrode and (d) the aged negative electrode. Methodology and complete post-mortem analysis can be found in [40].
Figure A5.
Visual inspection of the negative electrode after disassembling (a) the fresh cell and (c) the aged cell. Images taken with the laser microscope of the (b) fresh negative electrode and (d) the aged negative electrode. Methodology and complete post-mortem analysis can be found in [40].

References
- Scrosati, B.; Garche, J. Lithium batteries: Status, prospects and future. J. Power Sources 2010, 195, 2419–2430. [Google Scholar] [CrossRef]
- Choi, N.S.; Chen, Z.; Freunberger, S.A.; Ji, X.; Sun, Y.K.; Amine, K.; Yushin, G.; Nazar, L.F.; Cho, J.; Bruce, P.G. Challenges facing lithium batteries and electrical double-layer capacitors. Angew. Chem. Int. Ed. 2012, 51, 9994–10024. [Google Scholar] [CrossRef] [PubMed]
- Goodenough, J.B.; Park, K.S. The Li-ion rechargeable battery: A perspective. J. Am. Chem. Soc. 2013, 135, 1167–1176. [Google Scholar] [CrossRef] [PubMed]
- Lu, L.; Han, X.; Li, J.; Hua, J.; Ouyang, M. A review on the key issues for lithium-ion battery management in electric vehicles. J. Power Sources 2013, 226, 272–288. [Google Scholar] [CrossRef]
- Marano, V.; Onori, S.; Guezennec, Y.; Rizzoni, G.; Madella, N. Lithium-ion batteries life estimation for plug-in hybrid electric vehicles. In Proceedings of the 2009 IEEE Vehicle Power and Propulsion Conference, Dearborn, MI, USA, 7–10 September 2009; IEEE: Piscataway, NJ, USA, 2009; pp. 536–543. [Google Scholar]
- Abraham, D.P.; Liu, J.; Chen, C.H.; Hyung, Y.E.; Stoll, M.; Elsen, N.; MacLaren, S.; Twesten, R.; Haasch, R.; Sammann, E.; et al. Diagnosis of power fade mechanisms in high-power lithium-ion cells. J. Power Sources 2003, 119–121, 511–516. [Google Scholar] [CrossRef]
- Zavalis, T.G.; Klett, M.; Kjell, M.H.; Behm, M.; Lindström, R.W.; Lindbergh, G. Aging in lithium-ion batteries: Model and experimental investigation of harvested LiFePO4 and mesocarbon microbead graphite electrodes. Electrochim. Acta 2013, 110, 335–348. [Google Scholar] [CrossRef]
- Gao, Y.; Jiang, J.; Zhang, C.; Zhang, W.; Ma, Z.; Jiang, Y. Lithium-ion battery aging mechanisms and life model under different charging stresses. J. Power Sources 2017, 356, 103–114. [Google Scholar] [CrossRef]
- Prada, E.; Domenico, D.; Creff, Y.; Bernard, J.; Sauvant-Moynot, V.; Huet, F. A Simplified Electrochemical and Thermal Aging Model of LiFePO4-Graphite Li-ion Batteries: Power and Capacity Fade Simulations. J. Electrochem. Soc. 2013, 160, A616–A628. [Google Scholar] [CrossRef]
- Bernard, P.; Martinez, H.; Tessier, C.; Garitte, E.; Franger, S.; Dedryvere, R. Role of Negative Electrode Porosity in Long-Term Aging of NMC//Graphite Li-Ion Batteries. J. Electrochem. Soc. 2015, 162, A7096–A7103. [Google Scholar] [CrossRef]
- Fu, R.; Choe, S.Y.; Agubra, V.; Fergus, J. Development of a physics-based degradation model for lithium ion polymer batteries considering side reactions. J. Power Sources 2015, 278, 506–521. [Google Scholar] [CrossRef]
- Klett, M.; Zavalis, T.G.; Kjell, M.H.; Lindström, R.W.; Behm, M.; Lindbergh, G. Altered electrode degradation with temperature in LiFePO4/mesocarbon microbead graphite cells diagnosed with impedance spectroscopy. Electrochim. Acta 2014, 141, 173–181. [Google Scholar] [CrossRef]
- Berecibar, M.; Gandiaga, I.; Villarreal, I.; Omar, N.; Van Mierlo, J.; Van Den Bossche, P. Critical review of state of health estimation methods of Li-ion batteries for real applications. Renew. Sustain. Energy Rev. 2016, 56, 572–587. [Google Scholar] [CrossRef]
- Vetter, J.; Novák, P.; Wagner, M.R.; Veit, C.; Möller, K.C.; Besenhard, J.O.; Winter, M.; Wohlfahrt-Mehrens, M.; Vogler, C.; Hammouche, A. Ageing mechanisms in lithium-ion batteries. J. Power Sources 2005, 147, 269–281. [Google Scholar] [CrossRef]
- Lewerenz, M.; Münnix, J.; Schmalstieg, J.; Käbitz, S.; Knips, M.; Sauer, D.U. Systematic aging of commercial LiFePO4|Graphite cylindrical cells including a theory explaining rise of capacity during aging. J. Power Sources 2017, 345, 254–263. [Google Scholar] [CrossRef]
- Dees, D.W.; Abraham, D.P.; Lu, W.; Gallagher, K.G.; Bettge, M.; Jansen, A.N. Electrochemical Modeling and Performance of a Lithium- and Manganese-Rich Layered Transition-Metal Oxide Positive Electrode. J. Electrochem. Soc. 2015, 162, 559–572. [Google Scholar] [CrossRef]
- Schmidt, J.P.; Chrobak, T.; Ender, M.; Illig, J.; Klotz, D.; Ivers-Tiffée, E. Studies on LiFePO4 as cathode material using impedance spectroscopy. J. Power Sources 2011, 196, 5342–5348. [Google Scholar] [CrossRef]
- Illig, J.; Ender, M.; Chrobak, T.; Schmidt, J.P.; Klotz, D.; Ivers-Tiffee, E. Separation of Charge Transfer and Contact Resistance in LiFePO4-Cathodes by Impedance Modeling. J. Electrochem. Soc. 2012, 159, A952–A960. [Google Scholar] [CrossRef]
- Abarbanel, D.W.; Nelson, K.J.; Dahn, J.R. Exploring Impedance Growth in High Voltage NMC/Graphite Li-Ion Cells Using a Transmission Line Model. J. Electrochem. Soc. 2016, 163, A522–A529. [Google Scholar] [CrossRef]
- Osaka, T.; Momma, T.; Mukoyama, D.; Nara, H. Proposal of novel equivalent circuit for electrochemical impedance analysis of commercially available lithium ion battery. J. Power Sources 2012, 205, 483–486. [Google Scholar] [CrossRef]
- Olofsson, Y.; Groot, J. Impedance spectroscopy characterisation of automotive NMC/graphite Li-ion cells aged with realistic PHEV load profile Quantification of cell properties vs. temperature at different stages of ageing. In Proceedings of the 2014 IEEE International Electric Vehicle Conference (IEVC), Florence, Italy, 17–19 December 2014; pp. 1–6. [Google Scholar] [CrossRef]
- Prada, E.; Di Domenico, D.; Creff, Y.; Bernard, J.; Sauvant-Moynot, V.; Huet, F. Physics-based modelling of LiFePO4-graphite Li-ion batteries for power and capacity fade predictions: Application to calendar aging of PHEV and EV. In Proceedings of the 2012 IEEE Vehicle Power and Propulsion Conference, Seoul, Korea, 9–12 October 2012; IEEE: Piscataway, NJ, USA, 2012; pp. 301–308. [Google Scholar]
- Heubner, C.; Schneider, M.; Michaelis, A. Investigation of charge transfer kinetics of Li-Intercalation in LiFePO4. J. Power Sources 2015, 288, 115–120. [Google Scholar] [CrossRef]
- Zheng, Y.; He, Y.B.; Qian, K.; Li, B.; Wang, X.; Li, J.; Chiang, S.W.; Miao, C.; Kang, F.; Zhang, J. Deterioration of lithium iron phosphate/graphite power batteries under high-rate discharge cycling. Electrochim. Acta 2015, 176, 270–279. [Google Scholar] [CrossRef]
- Illig, J.; Chrobak, T.; Klotz, D.; Ivers-Tiffée, E. Evaluation of the Rate Determining Processes for LiFePO4 as Cathode Material in Lithium-ION-Batteries. ECS Trans. 2011, 33, 3–15. [Google Scholar] [CrossRef]
- Lin, X.; Perez, H.E.; Mohan, S.; Siegel, J.B.; Stefanopoulou, A.G.; Ding, Y.; Castanier, M.P. A lumped-parameter electro-thermal model for cylindrical batteries. J. Power Sources 2014, 257, 1–11. [Google Scholar] [CrossRef]
- Zhuang, Q.-C.; Qiu, X.-Y.; Xu, S.-D.; Qiang, Y.-H.; Su, S.-G. Diagnosis of Electrochemical Impedance Spectroscopy in Lithium-Ion Batteries. In Lithium Ion Batteries—New Developments; ECS: Wembley, UK, 2012; pp. 189–226. ISBN 978-953-51-0077-5. [Google Scholar]
- Illig, J. Physically Based Impedance Modelling of Lithium-Ion Cells; KIT Scientific Publishing: Karlsruhe, Germany, 2014. [Google Scholar]
- Li, Y.; Bettge, M.; Polzin, B.; Zhu, Y.; Balasubramanian, M.; Abraham, D.P. Understanding Long-Term Cycling Performance of Li1.2Ni0.15Mn0.55Co0.1O2–Graphite Lithium-Ion Cells. J. Electrochem. Soc. 2013, 160, A3006–A3019. [Google Scholar] [CrossRef]
- Choi, Y.M.; Pyun, S.I.; Bae, J.S.; Moon, S.I. Effects of lithium content on the electrochemical lithium intercalation reaction into LiNiO2 and LiCoO2 electrodes. J. Power Sources 1995, 56, 25–30. [Google Scholar] [CrossRef]
- Kao, Y.H.; Tang, M.; Meethong, N.; Bai, J.; Carter, W.C.; Chiang, Y.M. Overpotential-dependent phase transformation pathways in lithium iron phosphate battery electrodes. Chem. Mater. 2010, 22, 5845–5855. [Google Scholar] [CrossRef]
- Klett, M.; Eriksson, R.; Groot, J.; Svens, P.; Ciosek Högström, K.; Lindström, R.W.; Berg, H.; Gustafson, T.; Lindbergh, G.; Edström, K. Non-uniform aging of cycled commercial LiFePO4//graphite cylindrical cells revealed by post-mortem analysis. J. Power Sources 2014, 257, 126–137. [Google Scholar] [CrossRef]
- Bach, T.C.; Schuster, S.F.; Fleder, E.; Müller, J.; Brand, M.J.; Lorrmann, H.; Jossen, A.; Sextl, G.; Müller, J.; Brand, M.J.; et al. Nonlinear aging of cylindrical lithium-ion cells linked to heterogeneous compression. J. Energy Storage 2016, 5, 212–223. [Google Scholar] [CrossRef]
- Costard, J.; Ender, M.; Weiss, M.; Ivers-Tiffée, E. Three-Electrode Setups for Lithium-Ion Batteries. J. Electrochem. Soc. 2017, 164, A80–A87. [Google Scholar] [CrossRef]
- Skoog, S.; David, S. Parameterization of linear equivalent circuit models over wide temperature and SOC spans for automotive lithium-ion cells using electrochemical impedance spectroscopy. J. Energy Storage 2017, 14, 39–48. [Google Scholar] [CrossRef]
- Heins, T.P.; Harms, N.; Schramm, L.-S.; Schröder, U. Development of a new Electrochemical Impedance Spectroscopy Approach for Monitoring the Solid Electrolyte Interphase Formation. Energy Technol. 2016, 4, 1509–1513. [Google Scholar] [CrossRef] [Green Version]
- Howey, D.A.; Mitcheson, P.D.; Yufit, V.; Offer, G.J.; Brandon, N.P. Online measurement of battery impedance using motor controller excitation. IEEE Trans. Veh. Technol. 2014, 63, 2557–2566. [Google Scholar] [CrossRef]
- Momma, T.; Matsunaga, M.; Mukoyama, D.; Osaka, T. AC impedance analysis of lithium ion battery under temperature control. J. Power Sources 2012, 216, 304–307. [Google Scholar] [CrossRef]
- Buchberger, I.H. Electrochemical and Structural Investigations on Lithium-Ion Battery Materials and Related Degradation Processes. Ph.D. Thesis, Technischen Universität München, München, Germany, 2016. [Google Scholar]
- Ovejas, V.J. Determination of the State of Health of Li-Ion Batteries: The Irreversible Entropy Production Approach. Ph.D. Thesis, Universitat Politècnica de Catalunya, Barcelona, Spain, 2017. [Google Scholar]
- Waag, W.; Käbitz, S.; Sauer, D.U. Experimental investigation of the Lithium-Ion battery impedance characteristic at various conditions and aging states and its influence on the application. Appl. Energy 2013, 102, 885–897. [Google Scholar] [CrossRef]
- Uhlmann, C.; Illig, J.; Ender, M.; Schuster, R.; Ivers-Tiffée, E. In situ detection of lithium metal plating on graphite in experimental cells. J. Power Sources 2015, 279, 428–438. [Google Scholar] [CrossRef]
- Illig, J.; Schmidt, J.P.; Weiss, M.; Weber, A.; Ivers-Tiffée, E. Understanding the impedance spectrum of 18650 LiFePO4-cells. J. Power Sources 2013, 239, 670–679. [Google Scholar] [CrossRef]
- Howey, D.A.; Yufit, V.; Mitcheson, P.D.; Offer, G.J.; Brandon, N.P. Impedance measurement for advanced battery management systems. In Proceedings of the 2013 World Electric Vehicle Symposium and Exhibition (EVS27), Barcelona, Spain, 17–20 November 2013; pp. 1–7. [Google Scholar] [CrossRef]
- Zhang, S.S.; Xu, K.; Jow, T.R. EIS study on the formation of solid electrolyte interface in Li-ion battery. Electrochim. Acta 2006, 51, 1636–1640. [Google Scholar] [CrossRef]
- Martino, F.A. Effect of Electrolyte Concentration on the Capacitance and Mobility of Graphene. Bachelor’s Thesis, Linfield College, McMinnville, OR, USA, 2016. [Google Scholar]
- Brown, M.A.; Goel, A.; Abbas, Z. Effect of Electrolyte Concentration on the Stern Layer Thickness at a Charged Interface. Angew. Chem. Int. Ed. 2016, 55, 3790–3794. [Google Scholar] [CrossRef] [PubMed]
- Zhang, G. Simulating the Electrical Double Layer Capacitance. In Proceedings of the 2010 Excerpt from Proceedings of the COMSOL Conference, Boston, MA, USA, 7–9 October 2010. [Google Scholar]
- Arunachala, R.; Makinejad, K.; Athlekar, S.; Jossen, A.; Garche, J. Cycle life characterisation of large format lithium-ion cells. In Proceedings of the 2013 World Electric Vehicle Symposium and Exhibition, Barcelona, Spain, 17–20 November 2013. [Google Scholar]
- Stiaszny, B.; Ziegler, J.C.; Krauß, E.E.; Schmidt, J.P.; Ivers-Tiffée, E. Electrochemical characterization and post-mortem analysis of aged LiMn2O4-Li(Ni0.5Mn0.3Co0.2)O2/graphite lithium ion batteries. Part I: Cycle aging. J. Power Sources 2014, 251, 439–450. [Google Scholar] [CrossRef]
- Lam, L. A Practical Circuit-Based Model for State of Health Estimation of Li-Ion Battery Cells in Electric Vehicles. Master’s Thesis, Delft University of Technology, Delft, The Netherlands, 2011. [Google Scholar]
- Franck, E.U.; Robinson, R.A.; Stokes, R.H. Electrolyte Solutions: The Measurement and Interpretation of Conductance, Chemical Potential and Diffusion in Solutions of Simple Electrolytes, 2nd ed.; Butterworths: London, UK, 1968; Volume 72, ISBN 048613878X. [Google Scholar]
- Balasundaram, M.; Ramar, V.; Yap, C.; Lu, L.; Tay, A.A.O.; Palani, B. Heat loss distribution: Impedance and thermal loss analyses in LiFePO4/graphite 18650 electrochemical cell. J. Power Sources 2016, 328, 413–421. [Google Scholar] [CrossRef]
- Zhang, S.S.; Xu, K.; Jow, T.R. Charge and discharge characteristics of a commercial LiCoO2-based 18650 Li-ion battery. J. Power Sources 2006, 160, 1403–1409. [Google Scholar] [CrossRef]
- Gordon, I.A.J.; Grugeon, S.; Takenouti, H.; Tribollet, B.; Armand, M.; Davoisne, C.; Débart, A.; Laruelle, S. Electrochemical Impedance Spectroscopy response study of a commercial graphite-based negative electrode for Li-ion batteries as function of the cell state of charge and ageing. Electrochim. Acta 2017, 223, 63–73. [Google Scholar] [CrossRef]
- Tang, M.H.-M. Side Reactions in Lithium-Ion Batteries. Ph.D. Thesis, UC Berkeley, Berkeley, CA, USA, 2012. [Google Scholar]
- Anderson, A. Surface Phenomena in Li-Ion Batteries. Ph.D. Thesis, Uppsala University, Uppsala, Sweden, 2001. [Google Scholar]
- Zheng, H.; Qu, Q.; Zhu, G.; Liu, G.; Battaglia, V.S.; Zheng, H. Quantitative Characterization of the Surface Evolution for LiNi0.5Co0.2Mn0.3O2/Graphite Cell during Long-Term Cycling. ACS Appl. Mater. Interfaces 2017, 9. [Google Scholar] [CrossRef] [PubMed]
- Bio-Logic. Application Note 49 “EIS measurements: Potentio (PEIS) or Galvano (GEIS) mode, that is the question”. 2013. Available online: http://www.bio-logic.net/wp-content/uploads/AN49-Potentio_vs_galvano_EIS.pdf (accessed on 1 July 2018).
- Gamry Instruments EIS-Potentiostatic or Galvanostatic Mode. Available online: https://www.gamry.com/application-notes/EIS/eis-potentiostatic-galvanostatic-mode/ (accessed on 12 July 2017).
- Song, J.Y.; Lee, H.H.; Wang, Y.Y.; Wan, C.C. Two- and three-electrode impedance spectroscopy of lithium-ion batteries. J. Power Sources 2002, 111, 255–267. [Google Scholar] [CrossRef]
- Cogger, N.D.; Evans, N.J. An Introduction to Electrochemical Impedance Measurement. Solartron Anal. Tech. Rep. 1999, 11. [Google Scholar] [CrossRef]
- Murnane, M.; Ghazel, A. A Closer Look at State of Charge (SOC) and State of Health (SOH) Estimation Techniques for Batteries; Analog Devices, Inc.: Norwood, MA, USA, 2017. [Google Scholar]
- Osswald, P.J.; Erhard, S.V.; Noel, A.; Keil, P.; Kindermann, F.M.; Hoster, H.; Jossen, A. Current density distribution in cylindrical Li-Ion cells during impedance measurements. J. Power Sources 2016, 314, 93–101. [Google Scholar] [CrossRef]
- Zheng, Y.; Qian, K.; Luo, D.; Li, Y.; Lu, Q.; Li, B.; He, Y.-B.; Wang, X.; Li, J.; Kang, F. Influence of over-discharge on the lifetime and performance of LiFePO4/graphite batteries. RSC Adv. 2016, 6, 30474–30483. [Google Scholar] [CrossRef]
- Gamry Instruments: “Physical Electrochemistry and Equivalent Circuit Elements part 2”. Available online: https://www.gamry.com/assets/Uploads/resources/The-Basics-of-EIS-Part-2.pdf (accessed on 1 July 2018).
- Feng, X. Nanocarbons for Advanced Energy Storage; Wiley-VCH: Weinheim, Germany, 2015; Volume 1, ISBN 3527336656. [Google Scholar]
- Metrohm Electrochemical Impedance Spectroscopy (EIS) Part 3—Data Analysis; Application Note EIS03; Metrophm: Blackheath, Switzerland, 2011; pp. 1–2.
- Bio-Logic Pseudo capacitance calculation. Sci. Instrum. 2010, 3, 68–70.
- Hirschorn, B.D. Distributed Time-Constant Impedance Responses Interpreted in Terms of Physically Meaningful Properties; University of Florida: Gainesville, FL, USA, 2010. [Google Scholar]
- Chen, W.-W. The Electrical Engineering Handbook; Elsevier Academic Press: San Diego, CA, USA, 2005; ISBN 978-0-12-170960-0. [Google Scholar]
Figure 1.
Impedance variation during lithium extraction from the negative electrode in the graphite/Li half-cell configuration in the (a) fresh state and (b) aged state. Percentages represent the negative electrode’s state-of-charge (SoC). Measurements are carried out at 25 °C. The P2_NE region is enlarged at the insets. Some selected frequencies are indicated by arrows.

Figure 2.
Electrical model employed to fit the impedance spectra of the negative electrode (NE) half-cell (graphite/Li).
Figure 2.
Electrical model employed to fit the impedance spectra of the negative electrode (NE) half-cell (graphite/Li).

Figure 3.
(a) Resistance, (b) capacitance, and (c) characteristic frequency related to P2_NE measured at the graphite/Li half-cell at 25 °C. This effect has been attributed to the current–collector interface.
Figure 3.
(a) Resistance, (b) capacitance, and (c) characteristic frequency related to P2_NE measured at the graphite/Li half-cell at 25 °C. This effect has been attributed to the current–collector interface.

Figure 4.
Impedance variation during lithium insertion to the positive electrode for different states of charge (SoC) in the LiCoO2-Li(NiMnCo)O2/Li (LCO-NMC/Li) half-cell configuration. Measurements are carried out at 25 °C. (a) Data are from the fresh cell and (b) from the aged cell. Please note the different scales. Some frequencies are indicated with an arrow, which corresponds to a 100% SoC.

Figure 5.
Electrical model employed for fitting the impedance spectra of the PE (positive electrode) half-cell (LCO-NMC/Li).
Figure 5.
Electrical model employed for fitting the impedance spectra of the PE (positive electrode) half-cell (LCO-NMC/Li).

Figure 6.
(a) Resistance, (b) capacitance, and (c) characteristic frequency related to P2_PE measured at the LCO-NMC/Li half-cell at 25 °C. This effect has been attributed to the current–collector interface.
Figure 6.
(a) Resistance, (b) capacitance, and (c) characteristic frequency related to P2_PE measured at the LCO-NMC/Li half-cell at 25 °C. This effect has been attributed to the current–collector interface.

Figure 7.
(a) Resistance, (b) capacitance, and (c) characteristic frequency related to P4_PE measured at the LCO-NMC/Li half-cell at 25 °C. P4_PE is related to charge transfer at the positive electrode.
Figure 7.
(a) Resistance, (b) capacitance, and (c) characteristic frequency related to P4_PE measured at the LCO-NMC/Li half-cell at 25 °C. P4_PE is related to charge transfer at the positive electrode.

Figure 8.
Nyquist representation of impedance evolution with the SoC of (a) a fresh LCO-NMC cell and (b) a cycle-aged LCO-NMC cell. Measurements are carried out at 25 °C. Some frequencies are indicated by arrows.
Figure 8.
Nyquist representation of impedance evolution with the SoC of (a) a fresh LCO-NMC cell and (b) a cycle-aged LCO-NMC cell. Measurements are carried out at 25 °C. Some frequencies are indicated by arrows.

Figure 9.
Electrical model employed to fit the impedance spectra of the full-cell (LCO-NMC/graphite).
Figure 9.
Electrical model employed to fit the impedance spectra of the full-cell (LCO-NMC/graphite).

Figure 10.
Experimental and fitted impedance spectra from 1 Hz to 10 kHz of (a) a fresh LCO-NMC/graphite cell at SoCs 0%, 58.5%, and 99.2% and (b) an aged LCO-NMC/graphite cell at SoCs 0%, 51.8%, and 77%. Open symbols represent experimental data and solid lines represent the data obtained from the fitted electrical model represented in Figure 9.

Figure 11.
Evolution with SoC of the serial resistance (R1) of an LCO-NMC/graphite full-cell when evaluated at 25 °C. The results are represented for a fresh cell and an aged cell.
Figure 11.
Evolution with SoC of the serial resistance (R1) of an LCO-NMC/graphite full-cell when evaluated at 25 °C. The results are represented for a fresh cell and an aged cell.

Figure 12.
(a) Resistance, (b) capacitance, and (c) characteristic frequency related to P2_FC measured at the LCO-NMC/graphite full-cell at 25 °C. This has been related to the transport of ions across the solid electrolyte interphase (SEI) layer.
Figure 12.
(a) Resistance, (b) capacitance, and (c) characteristic frequency related to P2_FC measured at the LCO-NMC/graphite full-cell at 25 °C. This has been related to the transport of ions across the solid electrolyte interphase (SEI) layer.

Figure 13.
(a) Resistance, (b) capacitance, and (c) characteristic frequency related to P3_FC measured at the LCO-NMC/graphite full-cell at 25 °C. This has been related to charge transfer at positive electrode.
Figure 13.
(a) Resistance, (b) capacitance, and (c) characteristic frequency related to P3_FC measured at the LCO-NMC/graphite full-cell at 25 °C. This has been related to charge transfer at positive electrode.


Table 1.
Voltage windows and C-rates at which the state-of-charge (SoC) was determined in the full cells and half-cells.
Table 1.
Voltage windows and C-rates at which the state-of-charge (SoC) was determined in the full cells and half-cells.
| Cell | Minimum Voltage (V) | Maximum Voltage (V) | C-Rate | Parameter |
|---|---|---|---|---|
| Full cell LCO-NMC/C6 | 3 | 4.3 | C/25 | SoC |
| Half-cell LCO-NMC/Li | 3 | 4.4 | C/25 | Positive electrode (PE) SoC |
| Half-cell C6/Li | 0.00075 | 2.5 | C/25 | Negative electrode (NE) SoC |
© 2018 by the authors. Licensee MDPI, Basel, Switzerland. This article is an open access article distributed under the terms and conditions of the Creative Commons Attribution (CC BY) license (http://creativecommons.org/licenses/by/4.0/).
Share and Cite
MDPI and ACS Style
Ovejas, V.J.; Cuadras, A. Impedance Characterization of an LCO-NMC/Graphite Cell: Ohmic Conduction, SEI Transport and Charge-Transfer Phenomenon. Batteries 2018, 4, 43. https://doi.org/10.3390/batteries4030043
AMA Style
Ovejas VJ, Cuadras A. Impedance Characterization of an LCO-NMC/Graphite Cell: Ohmic Conduction, SEI Transport and Charge-Transfer Phenomenon. Batteries. 2018; 4(3):43. https://doi.org/10.3390/batteries4030043
Chicago/Turabian StyleOvejas, Victoria Julia, and Angel Cuadras. 2018. "Impedance Characterization of an LCO-NMC/Graphite Cell: Ohmic Conduction, SEI Transport and Charge-Transfer Phenomenon" Batteries 4, no. 3: 43. https://doi.org/10.3390/batteries4030043
Note that from the first issue of 2016, this journal uses article numbers instead of page numbers. See further details here.