
Catalytic Acetone Oxidation over MnOx Catalysts: Regulating Their Crystal Structures and Surface Properties

Tianjin Key Lab of Biomass/Wastes Utilization, School of Environmental Science and Engineering, Tianjin University, Tianjin 300072, China
*
Author to whom correspondence should be addressed.
Processes 2024, 12(2), 326; https://doi.org/10.3390/pr12020326
Submission received: 7 January 2024
/
Revised: 25 January 2024
/
Accepted: 1 February 2024
/
Published: 2 February 2024
(This article belongs to the Special Issue Advanced Nanoparticles: New Perspective in Catalysis)
Abstract
:This study investigates the catalytic oxidation of acetone by different crystal phases of MnO2 prepared via different methods. Compared with β-MnO2 and γ-MnO2, α-MnO2 exhibited superior catalytic activity. Moreover, as replacements for traditional hydrothermal methods and air calcination, the use of microwave hydrothermal methods and N2 calcination significantly enhanced the catalytic performance of the MnO2 catalyst. The optimal catalyst, MnO2-WN (α-MnO2 synthesized via microwave hydrothermal method and N2 calcination), converted 100% of 100 ppm acetone below 150 °C, with the CO2 yields reaching 100%. Further, the stability of the catalyst and its potential for other volatile organic compounds (VOCs) were also determined. The experimental data demonstrated that its outstanding activity primarily stemmed from the improved preparation method, enhancing the specific surface area of the catalyst, optimizing the pore structure, improving the redox performance, and generating more acidic sites and active oxygen species, thereby creating a synergistic effect. Finally, the reaction pathway of acetone oxidation on the catalyst surface has been explored. This work provides a new perspective for developing economically efficient MnOx catalysts for removing VOCs.
1. Introduction
Amidst a myriad of atmospheric pollutants, volatile organic compounds (VOCs) have garnered considerable scholarly attention owing to their profound negative impact on the environment and human health [1]. Moreover, some VOCs exhibit potent toxicity and other carcinogenic properties. They also contribute to secondary pollution by serving as pivotal precursors to O3 and haze [2]. Within the realm of VOCs, oxygenated volatile organic compounds (OVOCs) demonstrate heightened reactivity and are predisposed to serve as precursors to ozone when juxtaposed with other VOCs by virtue of their inherent oxygen atoms [3]. Notably, acetone, a ubiquitous OVOC in the atmosphere, ranks among the most prevalent VOCs in confined indoor settings like laboratories and offices [4]. Acetone vapor emanates primarily from acetone solvents, which are extensively utilized in industries encompassing pharmaceuticals, printing, and plastics manufacturing [5].
Commonly used techniques for acetone elimination include condensation [6], absorption [7], combustion [8], biodegradation [9], low-temperature plasma [10], and catalytic oxidation [11]. In particular, catalytic oxidation has garnered widespread attention amongst researchers due to its cost-effectiveness and high efficiency, resulting in the complete conversion of acetone into benign byproducts. Consequently, the pursuit of developing a cost-effective and high-efficiency catalyst stands as the focal point of future research on the catalytic oxidation of acetone.
Catalysts employed for catalytic oxidation can be classified into two distinct kinds: supported noble metal catalysts and transition metal oxide-based catalysts [12]. Noble-metal catalysts typically exhibit superior catalytic activity at low temperatures [13]. The main drawback of utilizing precious metals lies in their exorbitant cost. Moreover, the propensity for these catalysts to undergo sintering at elevated temperatures represents an acute issue necessitating immediate attention [14]. Due to their exceptional oxygen mobility, transitional metal oxides (Ce, Mn, Co, Fe, Cu, etc.) with different valence states harbor considerable potential for catalytic oxidation [15]. Sun et al. synthesized a NiOOH-CuO nano-heterostructure anchored on a three-dimensional conducting copper foam. The performance of the prepared catalyst exceeded that of the noble metal catalysts, showing excellent ethanol oxidation activity [16]. Manganese oxide, in particular, stands out as a highly active oxide endowed with a plethora of coordination numbers and oxidation states. Moreover, its surface properties create a pronounced affinity for the adsorption and activation of VOCs. Because of these properties, MnOx can effectively remove acetone even at low temperatures [17]. Cheng et al. studied the catalytic oxidation of acetone over MnOx with divergent crystal structures. Among these, α-MnO2 in its α, β, γ, and δ phases showed the best performances [18]. The distinctive crystal phase of α-MnO2 resulted in a synergistic effect, which manifested in larger crystal tunnel dimensions. A higher proportion of Mn4+ cations and weaker Mn-O bond strengths enhanced oxygen mobility and redox properties. Lu et al. investigated the effect of calcination temperature on manganese oxide properties. Many unsaturated manganese vacancies and oxygen vacancies are produced on the α-MnO2 at the optimum calcination temperature (600 °C), especially the surface oxygen vacancy clusters [19]. Hence, the modulation of crystal phases, coupled with alterations in the preparation conditions, significantly modifies the properties of manganese oxide. However, previous studies have seldom investigated the impact of the calcination atmosphere.
Typically, the hydrothermal method is used to synthesize the manganese oxide catalysts. However, the conventional hydrothermal approach is time-consuming, and there are risks associated with the experimental conditions, which involve elevated pressure. In contrast, the microwave hydrothermal technique harnesses microwave energy to heat the sample, offering the advantages of a shortened preparation timeframe, homogeneous heating, and ease of temporal regulation [20]. Despite the burgeoning research into catalyst fabrication via the microwave hydrothermal method in recent years, there is a lack of reports concerning their application to the catalysis of VOCs.
This study evaluated the catalytic activity and CO2 yield of different crystal forms of MnO2 towards acetone oxidation. Additionally, the surface properties of MnO2 were modified by varying the hydrothermal method as well as the calcination atmosphere. This study was primarily aimed at screening the optimal MnOx catalyst and applying it to the catalytic oxidation of acetone. Notably, α-MnO2, calcined in an N2 atmosphere via the microwave hydrothermal method (MnO2-WN), exhibited the best catalytic performance. A 90% conversion as well as a mineralization rate could be achieved at 132 °C. Impressively, the prepared catalyst also had good stability and excellent removal effects on other VOCs. Finally, the structure-activity relationship between the catalytic activities and the surface properties of the catalysts was explored via comprehensive characterization tests, demonstrating that the excellent performance primarily stemmed from the improved preparation method, enhancing the specific surface area of the catalyst, optimizing the pore structure, improving the redox performance, and generating more acidic sites and active oxygen species, thereby creating a synergistic effect. Finally, the reaction pathway of acetone oxidation on the catalyst surface has been explored. This work provides a new perspective for developing economically efficient MnOx catalysts for removing VOCs.
2. Materials and Methods
2.1. Preparation of Catalysts
All reagents used for synthesis were analytical-grade and did not require further purification.
Synthesis of different crystal forms of MnO2.
α-MnO2: 1.58 g potassium permanganate (KMnO4) and 0.71 g ammonium oxalate monohydrate ((NH4)2C2O4·H2O) were dissolved in 30 mL and 20 mL deionized water, respectively. An ammonium oxalate solution was prepared, added dropwise to the potassium permanganate solution, and thoroughly mixed. The mixture was then transferred to a stainless-steel autoclave lined with 100 mL of Teflon (Guohua Electric Co., Changzhou, China), and heated at 180 °C for 24 h. Next, the solution was cooled to room temperature, centrifuged to collect precipitates, washed with deionized water 3–5 times, and dried overnight at 105 °C. Finally, the dried solid was calcinated in a static air atmosphere at 350 °C for 2 h.
β-MnO2: 3.38 g manganese sulfate monohydrate (MnSO4·H2O) and 4.56 g ammonium thiosulfate ((NH4)2S2O8) were completely dissolved in 80 mL deionized water. The solution was heated at 140 °C for 12 h.
γ-MnO2: 6.75 g manganese sulfate monohydrate (MnSO4·H2O) and 7.40 g ammonium thiosulfate ((NH4)2S2O8) were completely dissolved in 80 mL deionized water. The solution was heated at 90 °C for 24 h.
Synthesis of MnO2-WK (W: microwave; K: calcinating in the air atmosphere): MnO2-WK replaced the traditional hydrothermal with microwave hydrothermal (the reaction conditions for the microwave hydrothermal method are the following: 180 °C, 2 h, 700 w, 4 MPa). The other conditions were the same as those for the preparation of α-MnO2.
Synthesis of MnO2-WN (W: microwave; N: calcinating in an N2 atmosphere): The MnO2-WN catalyst was prepared using the same procedure as MnO2-WK, with the exception of changing the calcination atmosphere from air to N2.
2.2. Characterization
The specific surface area and pore structure of the catalysts were measured by Brunauer-Emmett-Teller (BET) and Barrett-Joyner-Halenda (BJH) methods from N2 adsorption-desorption isotherms tested on a Micromeritics ASAP 2460 nitrogen adsorption apparatus (USA). X-ray diffraction (XRD) was carried out to identify the crystal structure using an X’Pert Pro MPD instrument. The morphology of catalysts was examined by scanning electron microscopy (SEM) using a ZEISS Sigma (Oberkochen, Germany) 500. X-ray photoelectron spectroscopy (XPS) analysis was taken by a Thermo Scientific ESCALAB 250xi (Thermo Scientific, Waltham, MA, USA) K-alpha analyzer to analyze the valence distribution of different elements on the surface of the catalyst. The binding energies were calibrated by C 1 s of 284.8 eV.
The oxygen vacancies of the catalysts were determined by electron paramagnetic resonance (EPR), which was carried out on an EMXPlus instrument (Bruker, Billerica, MA, USA). Raman spectra were measured on the HORIBA LabRAM HR Evolution (Horiba, Kyoto, Japan) using an excitation wavelength of 514 nm. H2 temperature-programmed reduction (H2-TPR), NH3 temperature-programmed desorption (NH3-TPD), O2 temperature-programmed desorption (O2-TPD), and CO2 temperature-programmed desorption (CO2-TPD) were conducted on a chemical adsorption analyzer (PCA-1200) to analyze various surface chemical properties. Prior to the experiments, N2 was ventilated at room temperature for 10 min to remove the residual gas. Next, the tube loaded with the catalysts was heated to 573 K at a rate of 10 °C per minute in an N2 atmosphere for 10 min to dehydrate the catalysts. For H2-TPR, ~50 mg of the purged catalysts was heated up to 923 K (10 K/min) under 30 mL/min of 10 vol.% H2/He, and a TCD detector recorded the signal intensity of H2 residual. For the NH3-TPD, O2-TPD, and CO2-TPD analyses, ~100 mg of purged catalysts were treated with 30 mL/min of 5 vol.% NH3/N2, 5 vol.% O2/He, and pure CO2, respectively, to reach saturated adsorption. Subsequently, the mixtures were heated up to 1173 K (10 K/min) under 30 mL/min N2 to collect the desorbed NH3/O2/CO2 signals.
In situ diffuse reflection infrared Fourier transform spectroscopy (DRIFTS) analysis of acetone oxidation was performed using a Tensor II FTIR spectrometer (Bruker). Initially, the catalyst was loaded on the light absorption cell and purged in N2 for 30 min at 300 °C. After background collection, 300 ppm acetone was injected for 30 min to evaluate the single adsorption of acetone. Subsequently, catalytic oxidation of acetone began after the addition of 10% oxygen, and the data was recorded for another 30 min. The catalyst was successively heated to 125, 150, 175, and 200 °C and held at each temperature period for 30 min to investigate the surface variation of the catalyst during reactions at different temperatures.
The details of the characterization procedures have been reported in our previous work [21].
2.3. Performance Evaluation of Catalytic Oxidation
Catalytic oxidation of acetone was carried out in a fixed-bed reactor, as reported previously [22]. The mixed gases containing 100 ppm VOCs (acetone, dichloromethane, methyl mercaptan, and toluene), 10% O2, and N2 balanced with a total flow rate of 100 mL/min were injected into the reactor. Moreover, 100 mg catalysts (40–60 mesh) were loaded on the central section of the quartz tube, corresponding to a weight hourly space velocity (WHSV) of 60,000 mL gcat−1 h−1. A gas chromatogram (GC, GC9790II, Zhejiang Fuli Co., Ltd., Wenling, China) equipped with FID detectors at the outlet detected the concentration of acetone and CO/CO2. CO and CO2 were converted into CH4 in a catalytic reactor for measurement. The following equations calculate acetone conversion and CO2 yield:
where [VOC]initial and [VOC]outlet are the initial and outlet VOC concentrations (ppm), respectively, [CO2] outlet is the outlet CO2 concentration (ppm), and N is the number of carbon atoms contained in a VOC molecule.
3. Results and Discussion
3.1. Catalytic Performance
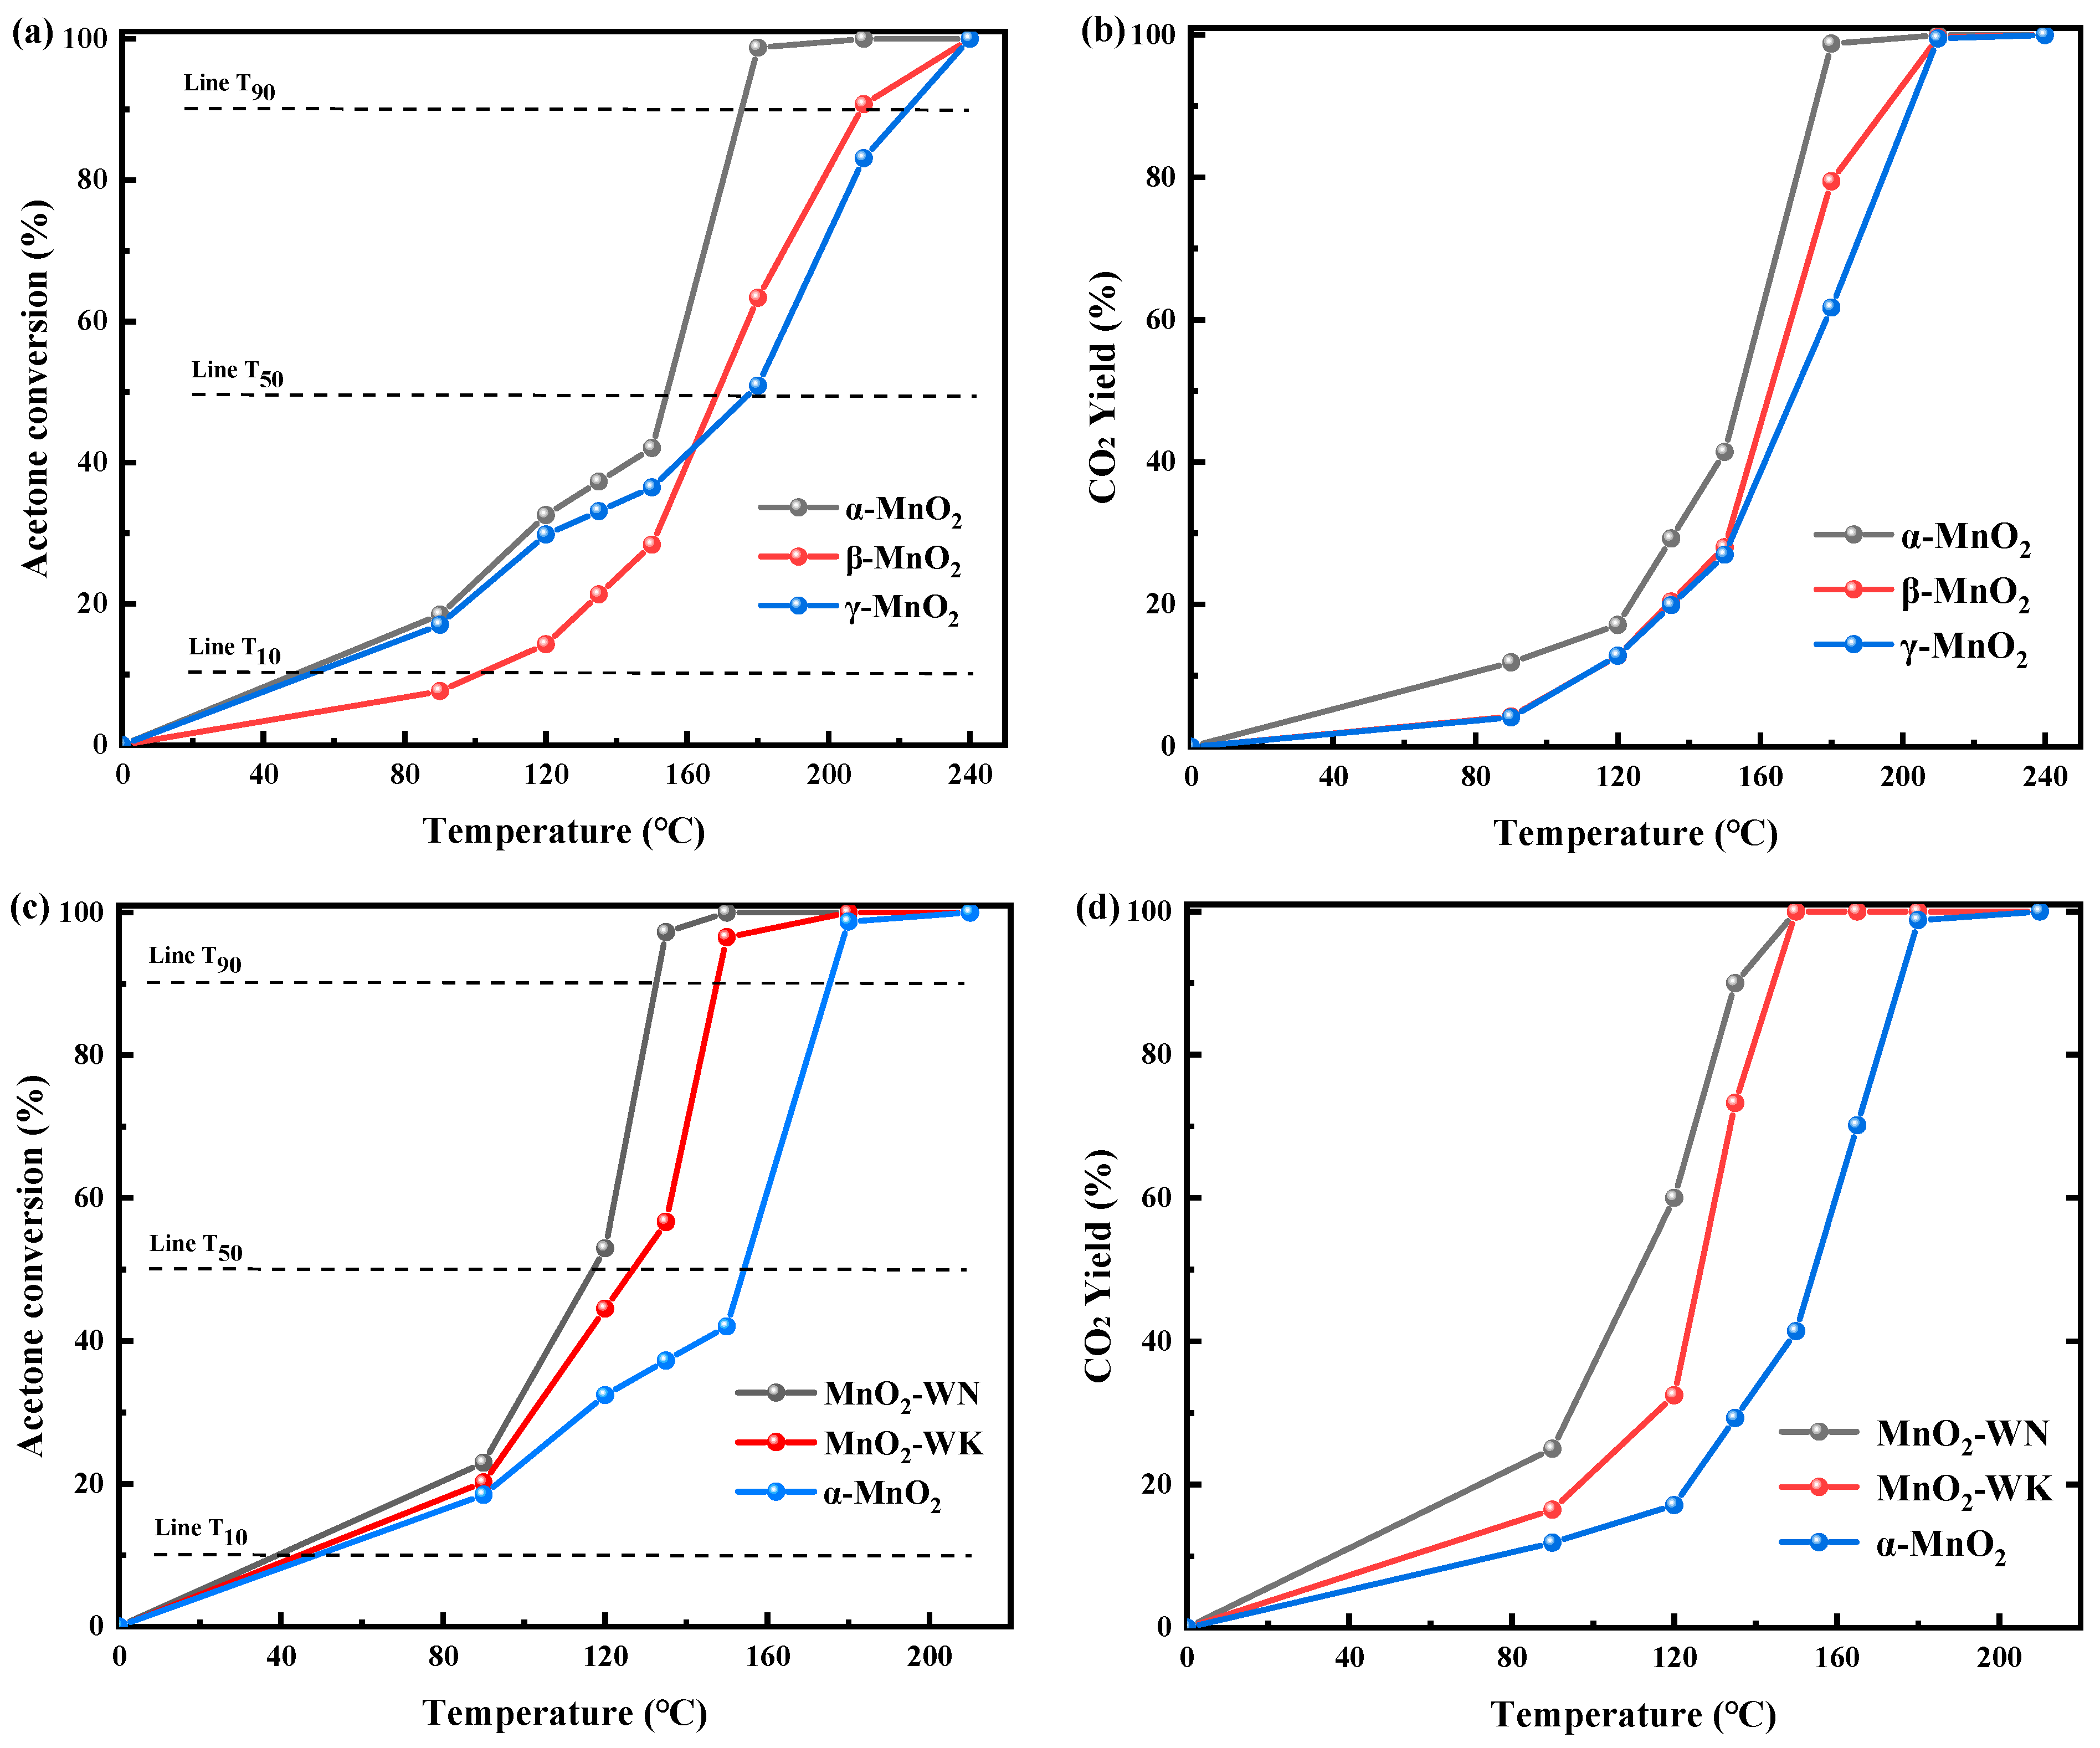
The differences in catalytic behaviors of acetone oxidation over the synthesized catalysts are shown in Figure 1 and Table 1. The control experiment confirmed that acetone did not undergo self-oxidation within the experimental temperature range. As depicted in Figure 1a, the acetone conversion rates of the three distinct crystal forms of the MnOx catalysts progressively increased with increasing temperatures, stabilizing at 100% conversion upon reaching a threshold temperature of 240 °C. A detailed comparative analysis revealed that α-MnO2 exhibited superior catalytic activity across low and high-temperature regimes, with a T90 (temperature corresponding to 90% acetone conversion) of approximately 175 °C (see Table 1). Although β-MnO2 displayed a lower acetone conversion relative to γ-MnO2 at low temperatures, its activity increased significantly at elevated temperatures, resulting in a complete conversion of acetone with a T90 of around 210 °C. The T90 of γ-MnO2 was approximately 220 °C, indicating the weakest catalytic activity at high temperatures. Figure 1b displays the CO2 yield rate as a function of temperature, exhibiting a trend similar to that displayed by the acetone conversion curve. The CO2 yield increased with rising temperature, ultimately reaching 100%, suggesting that acetone was completely converted to CO2 and H2O via catalytic oxidation. Notably, the CO2 yields for α-MnO2 were consistently higher than the other two crystal phases at all temperatures. Consequently, due to its enhanced activity and mineralization rate, α-MnO2 appeared to be particularly well-suited for removing acetone. Varying crystal phases resulted in disparate crystal pore structures and pore sizes, thereby altering the contact area and frequency between the acetone molecules and the catalyst, influencing the catalytic activity [18]. This result was also consistent with BET tests (vide infra).
The preparation methodology was refined to augment the catalytic activity further. Figure 1c shows the catalytic behaviors of acetone oxidation over α-MnO2 prepared via different methods. Compared with the α-MnO2 synthesized via conventional hydrothermal means, the catalytic efficacy of the MnO2 produced via microwave hydrothermal synthesis was markedly increased. The T90 of MnO2-WK was approximately 150 °C, substantially inferior to that of the standard α-MnO2. Subsequently, the calcined atmosphere was modulated, building upon the foundation of MnO2-WK. MnO2-WN was procured via calcination in a nitrogen atmosphere. The catalytic activity of MnO2-WN was higher than MnO2-WK, with T90 reaching 132 °C. In fact, MnO2-WN displayed higher activity than many other reported precious metal catalysts (Table S1). Figure 1d evaluates the mineralization rates of the three catalysts. The overall trend is consistent with the activity curve. Notably, MnO2-WN achieved an impressive mineralization rate at relatively low temperatures, a phenomenon rarely reported in previous studies. Given its low cost, high activity, and mineralization rate, MnO2-WN holds significant application potential. Subsequent characterization revealed the underlying rationale for its exceptional performance.
3.2. Stability and Catalytic Oxidation of Other Typical VOCs
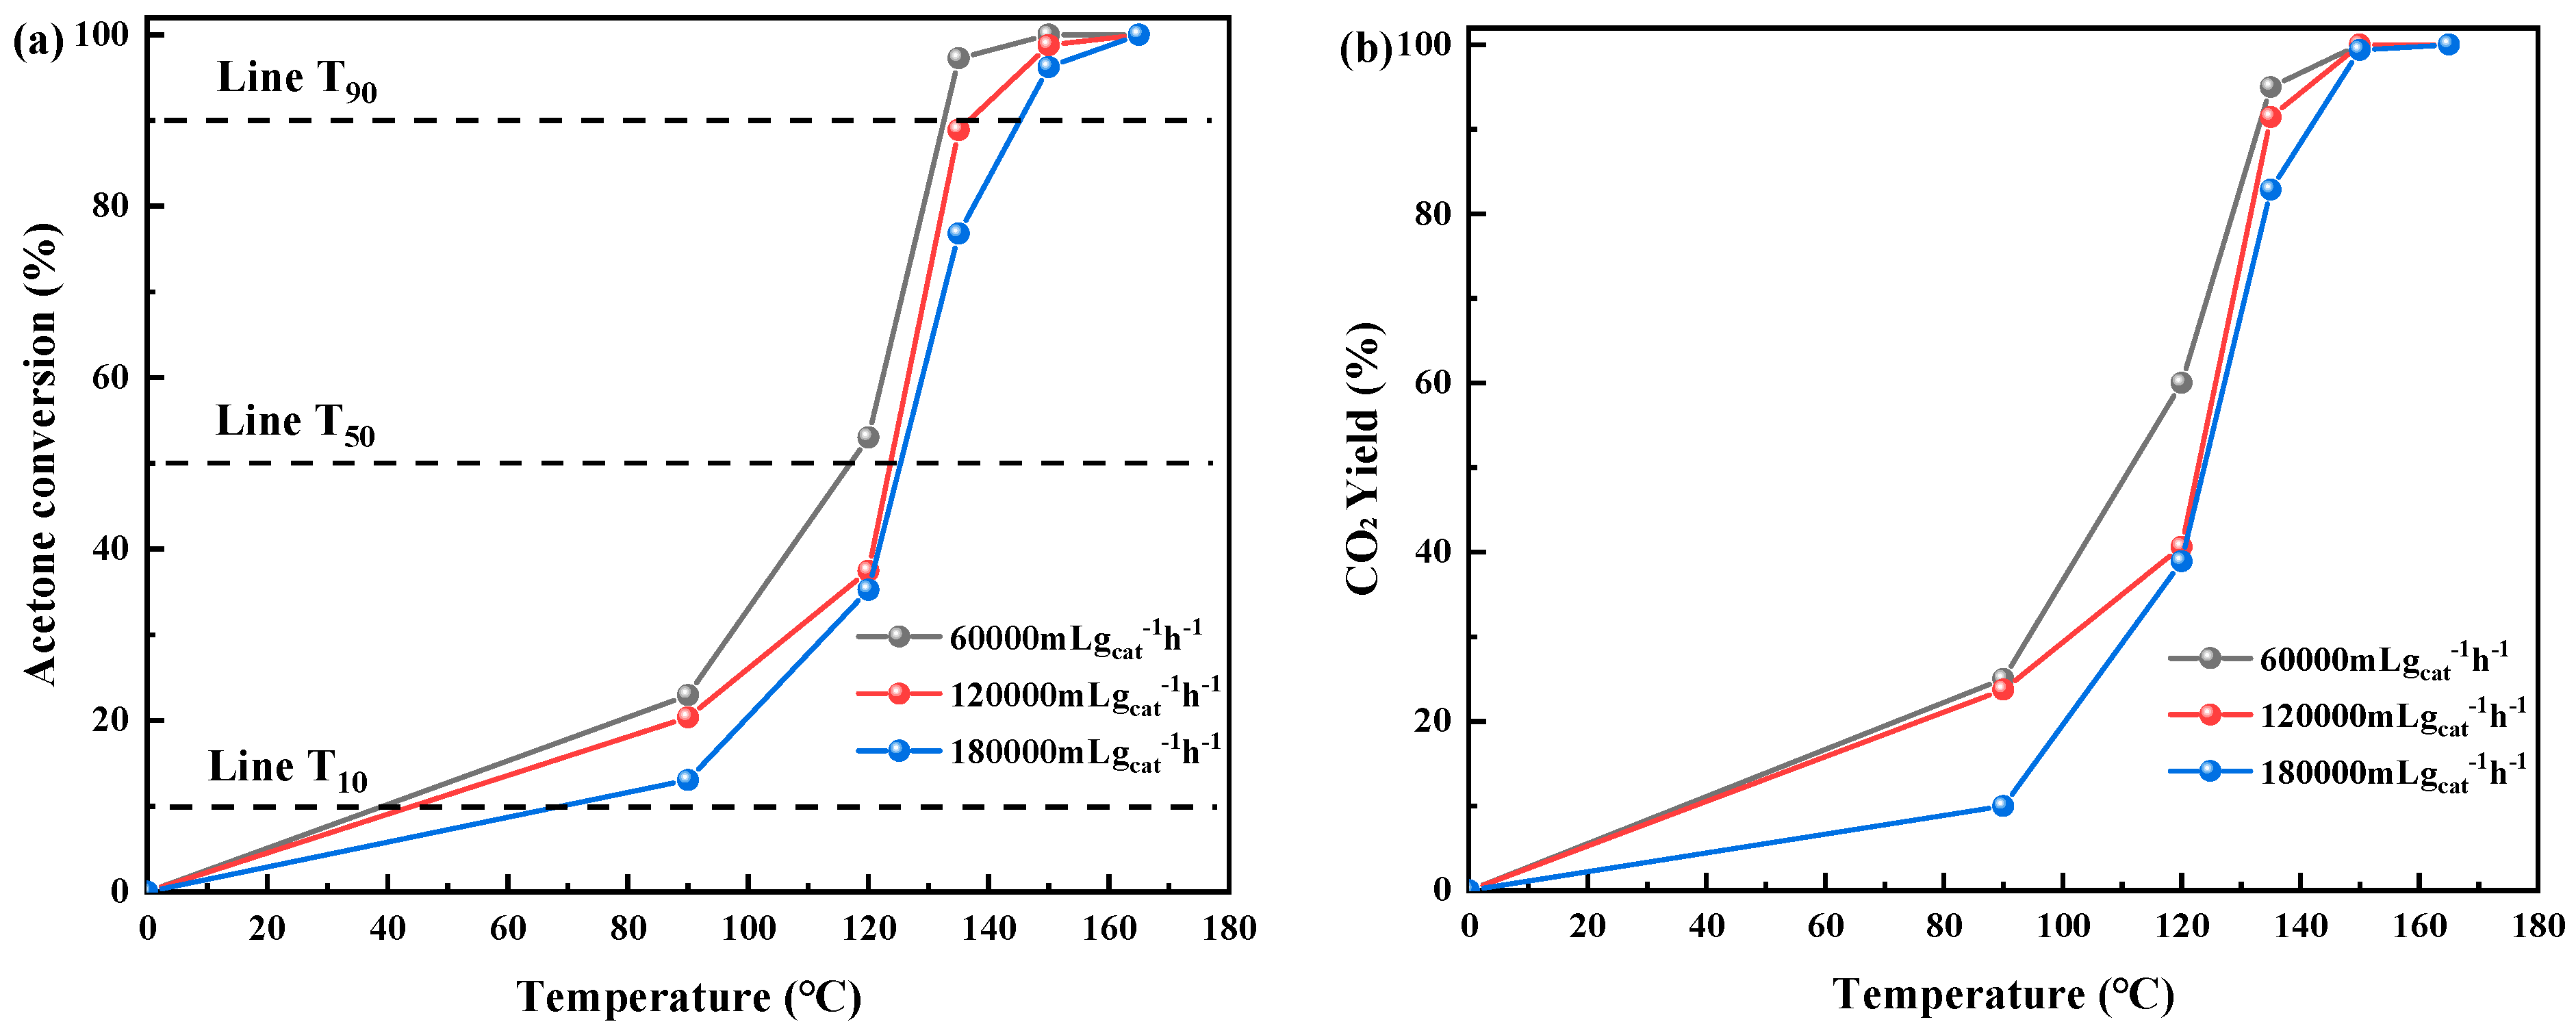
The deactivation of catalysts is an issue that must be considered for practical applications. Less robust catalysts are susceptible to deactivation over prolonged use, exhibiting subpar performance at high velocities. Thus, protracted stability assessments and high-velocity tests were conducted to assess the potential application of the optimal catalyst comprehensively. Figure 2a shows the influence of weight hourly space velocity on the catalytic prowess of MnO2-WN. Notably, MnO2-WN exhibited commendable catalytic efficacy, with 90% conversion attained at a temperature <140 °C even as the WHSV was elevated to 120,000 gcat−1 h−1. Nevertheless, there was a slight decline in activity at lower temperatures as WHSV was further augmented to 180,000 gcat−1 h−1. This was attributed to the decreased interaction time of acetone with the catalytic interface. However, with rising temperatures, there was less deactivation, enabling a 90% conversion rate at 140 °C. Figure 2b shows that MnO2-WN was still able to reach a mineralization rate of 100% even at high WHSV. Figure 2c, 24-h shows the stability trials for the catalytic oxidation of acetone were performed at 150 °C for α-MnO2 and MnO2-WN. Evidently, MnO2-WN remained admirably stabilized, with the conversion rate maintained at approximately 99%. In contrast, there was a gradual decline in the α-MnO2 conversion rate after 12 h, resulting in a significant difference in the conversion rate compared with MnO2-WN, with the difference increasing from an initial value of 48% to 52%. Hence, it can be concluded that MnO2-WN exhibits exceptional stability in the catalytic conversion of acetone.
Furthermore, the catalytic efficacy of MnO2-WN toward several other prototypical VOCs was investigated. Specifically, three emblematic gases comprising sulfur (methyl mercaptan), chlorine (dichloromethane), and aromatics (toluene) were chosen. Figure 2d showed that MnO2-WN exhibited commendable catalytic performance across all three VOCs, achieving complete conversion. The temperatures at which the three VOCs were completely transformed were among the lower temperatures in previous studies, indicating that MnO2-WN has the potential for the catalytic oxidation of diverse VOCs.
3.3. Structural Characterization
The catalysts were characterized in detail to explore the effects of microwave hydrothermal treatment and N2 calcination on the exceptional catalytic properties of MnOx. In particular, the textural properties, crystalline structures, morphologies, reducibility, acidity, elemental valence, oxygen species distribution, and oxygen defects of synthesized catalysts were studied.
3.3.1. Textural Properties, Crystalline Structures, and Morphologies of the Catalysts
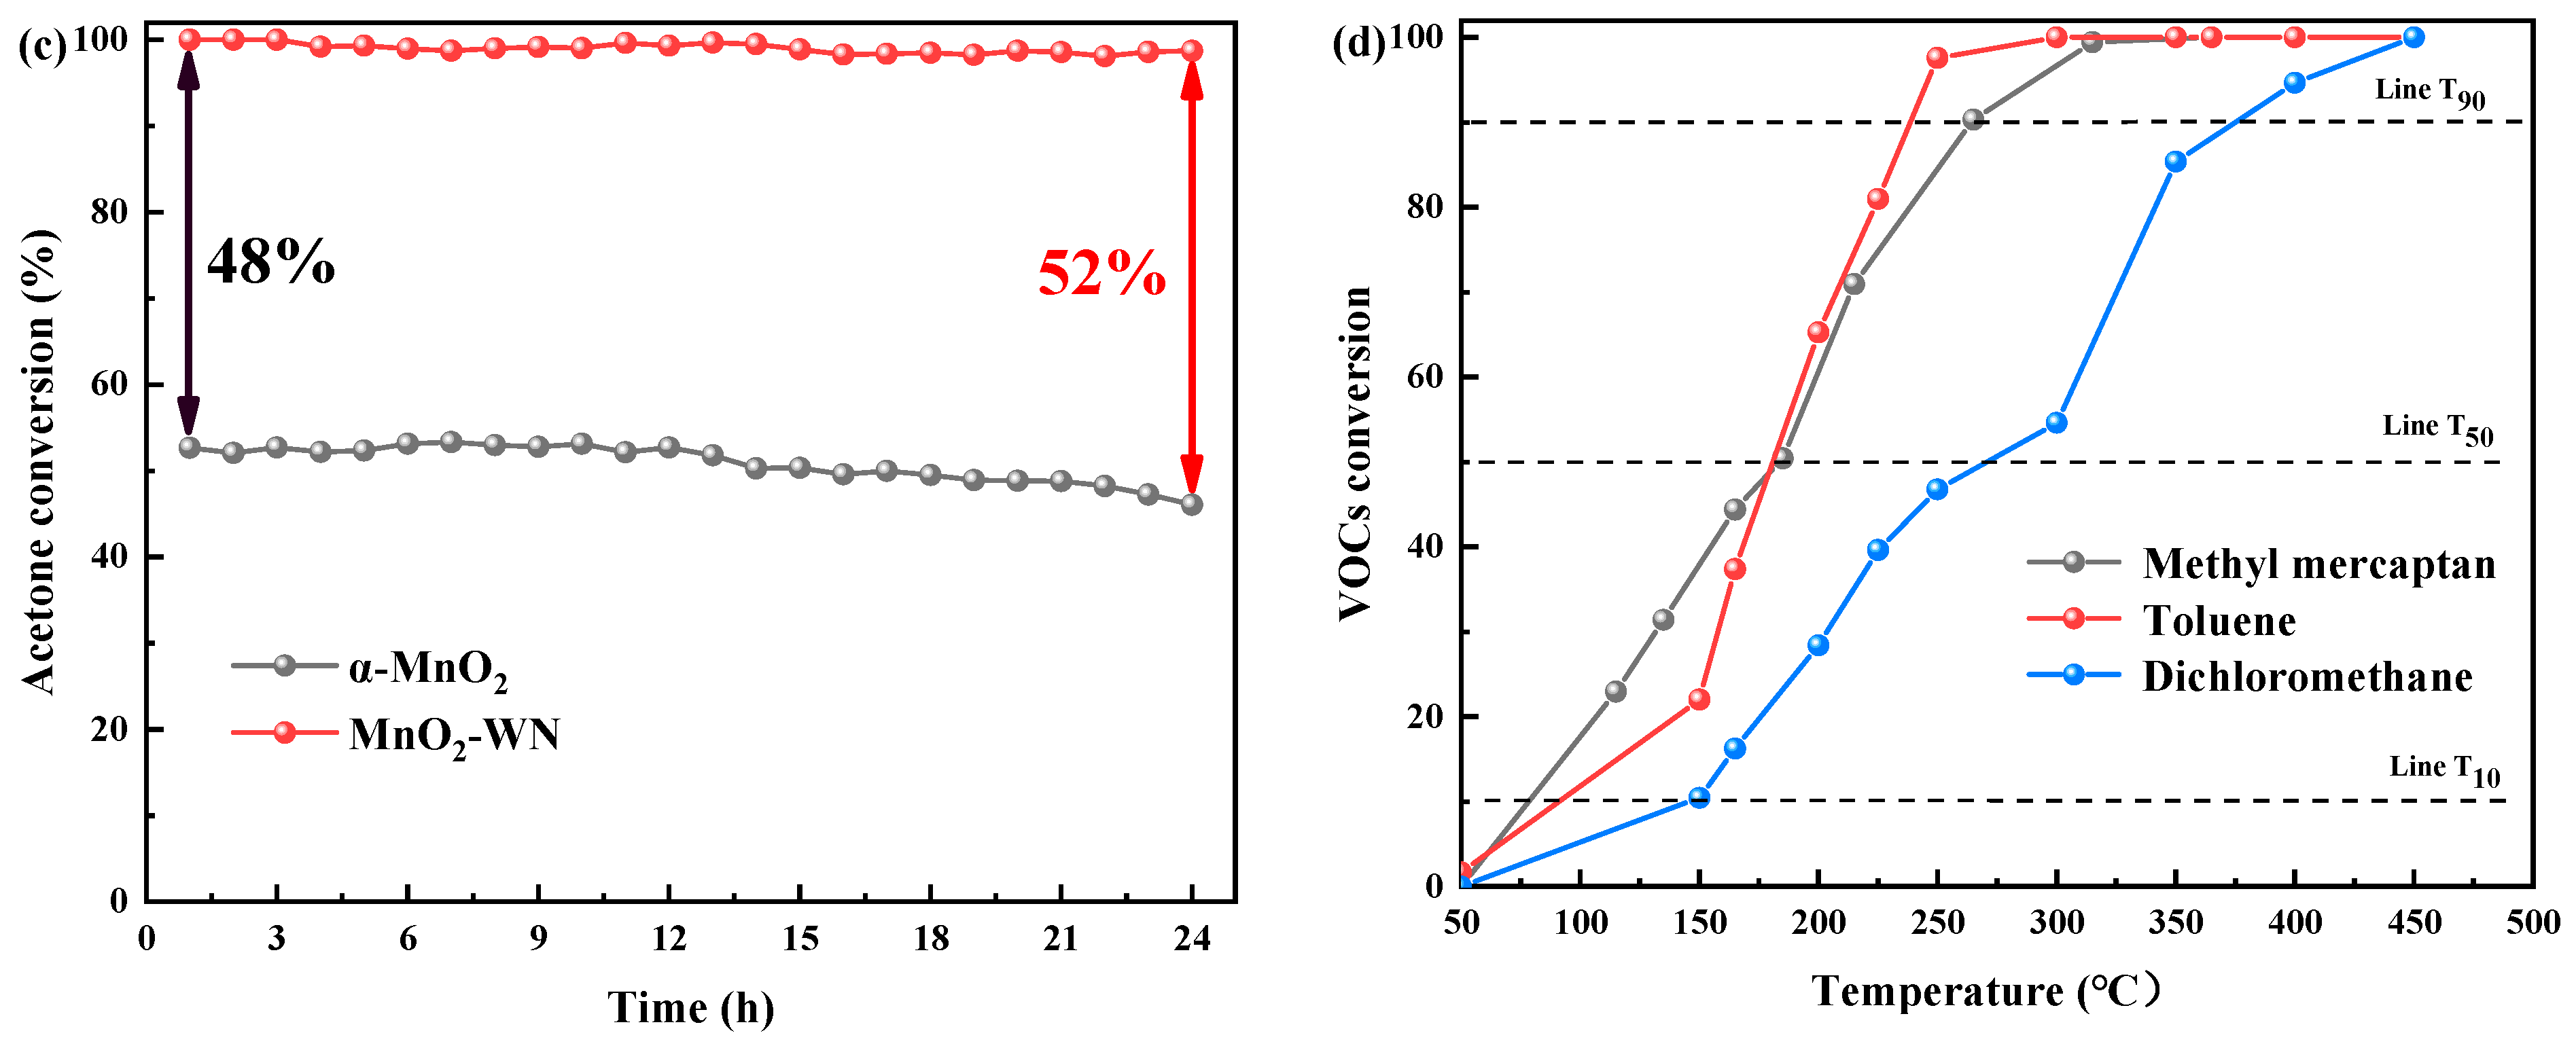
Nitrogen adsorption-desorption tests were performed to investigate the relationship between the textural properties of the catalysts and their catalytic activities. Figure 3a–e shows the nitrogen adsorption-desorption isotherms and pore size distribution curves for five catalysts: α-MnO2, β-MnO2, γ-MnO2, MnO2-WN, and MnO2-WK. All five catalysts exhibited typical Type IV isotherm characteristics, with an H3 hysteresis loop in the curves, indicating that they contained a significant number of mesopores [23]. Additionally, none of the five catalysts reached saturation adsorption up to p/p0 = 1, indicating the presence of a certain amount of macropores [24,25]. The pore size distribution curves further confirmed these results. Table 2 shows the specific surface area, pore volume, and average pore diameter of the catalysts. Clearly, α-MnO2 had a larger specific surface area and a smaller average pore diameter compared to the other two crystalline forms of MnO2. A larger specific surface area is beneficial for the increased interaction of gas molecules with the active sites on the catalyst surface, which is favorable for the catalytic reaction. Meanwhile, the adsorption and activation of gas molecules on the catalyst surface are facilitated by a smaller average pore diameter, which is closer to the kinetic diameter of gas molecules [26]. For these reasons, α-MnO2 exhibits superior catalytic oxidation activity. Notably, the specific surface area and pore volume of the two catalysts prepared by the microwave hydrothermal method, MnO2-WN and MnO2-WK, were significantly higher than those of MnOx prepared by the conventional hydrothermal method. However, the average pore diameter was smaller. Therefore, the microwave hydrothermal method could effectively improve the specific surface areas and pore structures of the MnOx, enhancing their catalytic activity [27].
Figure 3f illustrates the XRD patterns of all five catalysts. α-MnO2, β-MnO2, and γ-MnO2 corresponded respectively to standard PDF cards, PDF#44-0141, PDF#24-0735, and PDF#14-0644. Corresponding to the (310), (211), and (541) crystal planes, the diffraction peaks of α-MnO2 were at 28.8°, 37.5°, and 69.7°—with (211) being the predominant crystal plane. Further, corresponding to (110), (101), (111), (211), (220), and (301) crystal planes, the diffraction peaks of β-MnO2 primarily occurred at 28.7°, 37.3°, 42.8°, 56.7°, 59.4°, and 72.3°. Herein, (110) represents the principal crystal plane. In the case of γ-MnO2, the diffraction peaks of the (120), (131), (300), (160), (421), and (003) crystal planes were mainly located at 22.4°, 37.1°, 42.6°, 57.4°, 65.6°, and 68.9°. Among these, (131) was the predominant crystal plane [28,29]. No impurity peaks were observed in the XRD patterns of the three catalysts, indicating they were present in well-defined single phases. Utilizing Scherrer’s equation, we have computed the individual crystallite size of α-MnO2 based on its primary (211) peak, β-MnO2 according to the (110) peak, and γ-MnO2 from the (131) peak, which are detailed in Table 2. Evidently, the crystallite size of β-MnO2 surpassed that of the other two crystal phases, signifying its superior degree of crystallinity. Similarly, α-MnO2 exhibited the smallest crystallite size, suggesting a lower level of crystallinity. This phenomenon was attributed to the specific preparation conditions. The XRD patterns of MnO2-WN and MnO2-WK aligned with the standard PDF#44-0141 card, affirming their identity as α-MnO2. The diffraction peaks of these samples were located at 28.8°, 37.5°, 42.0°, 49.9°, 60.3°, 65.1°, and 69.7°, corresponding to (310), (211), (301), (411), (521), (002), and (541) crystal planes, with (310) representing the principal crystal plane. Notably, the diffraction peak intensities of MnO2-WN and MnO2-WK were distinctly greater than those of typical α-MnO2. Furthermore, in accordance with Table 2, their crystallite size (based on their primary (211) peak) exhibited a gradual augmentation in comparison to the conventional α-MnO2. In fact, MnO2-WN exhibited more intense and narrower diffraction peaks than MnO2-WK. The crystallite dimensions of MnO2-WN exhibited a slightly larger size than MnO2-WK. Thus, it could be safely concluded that the microwave hydrothermal synthesis method effectively enhanced the crystallinity of manganese oxide, while calcination under the N2 atmosphere similarly augmented the crystallinity of MnO2.
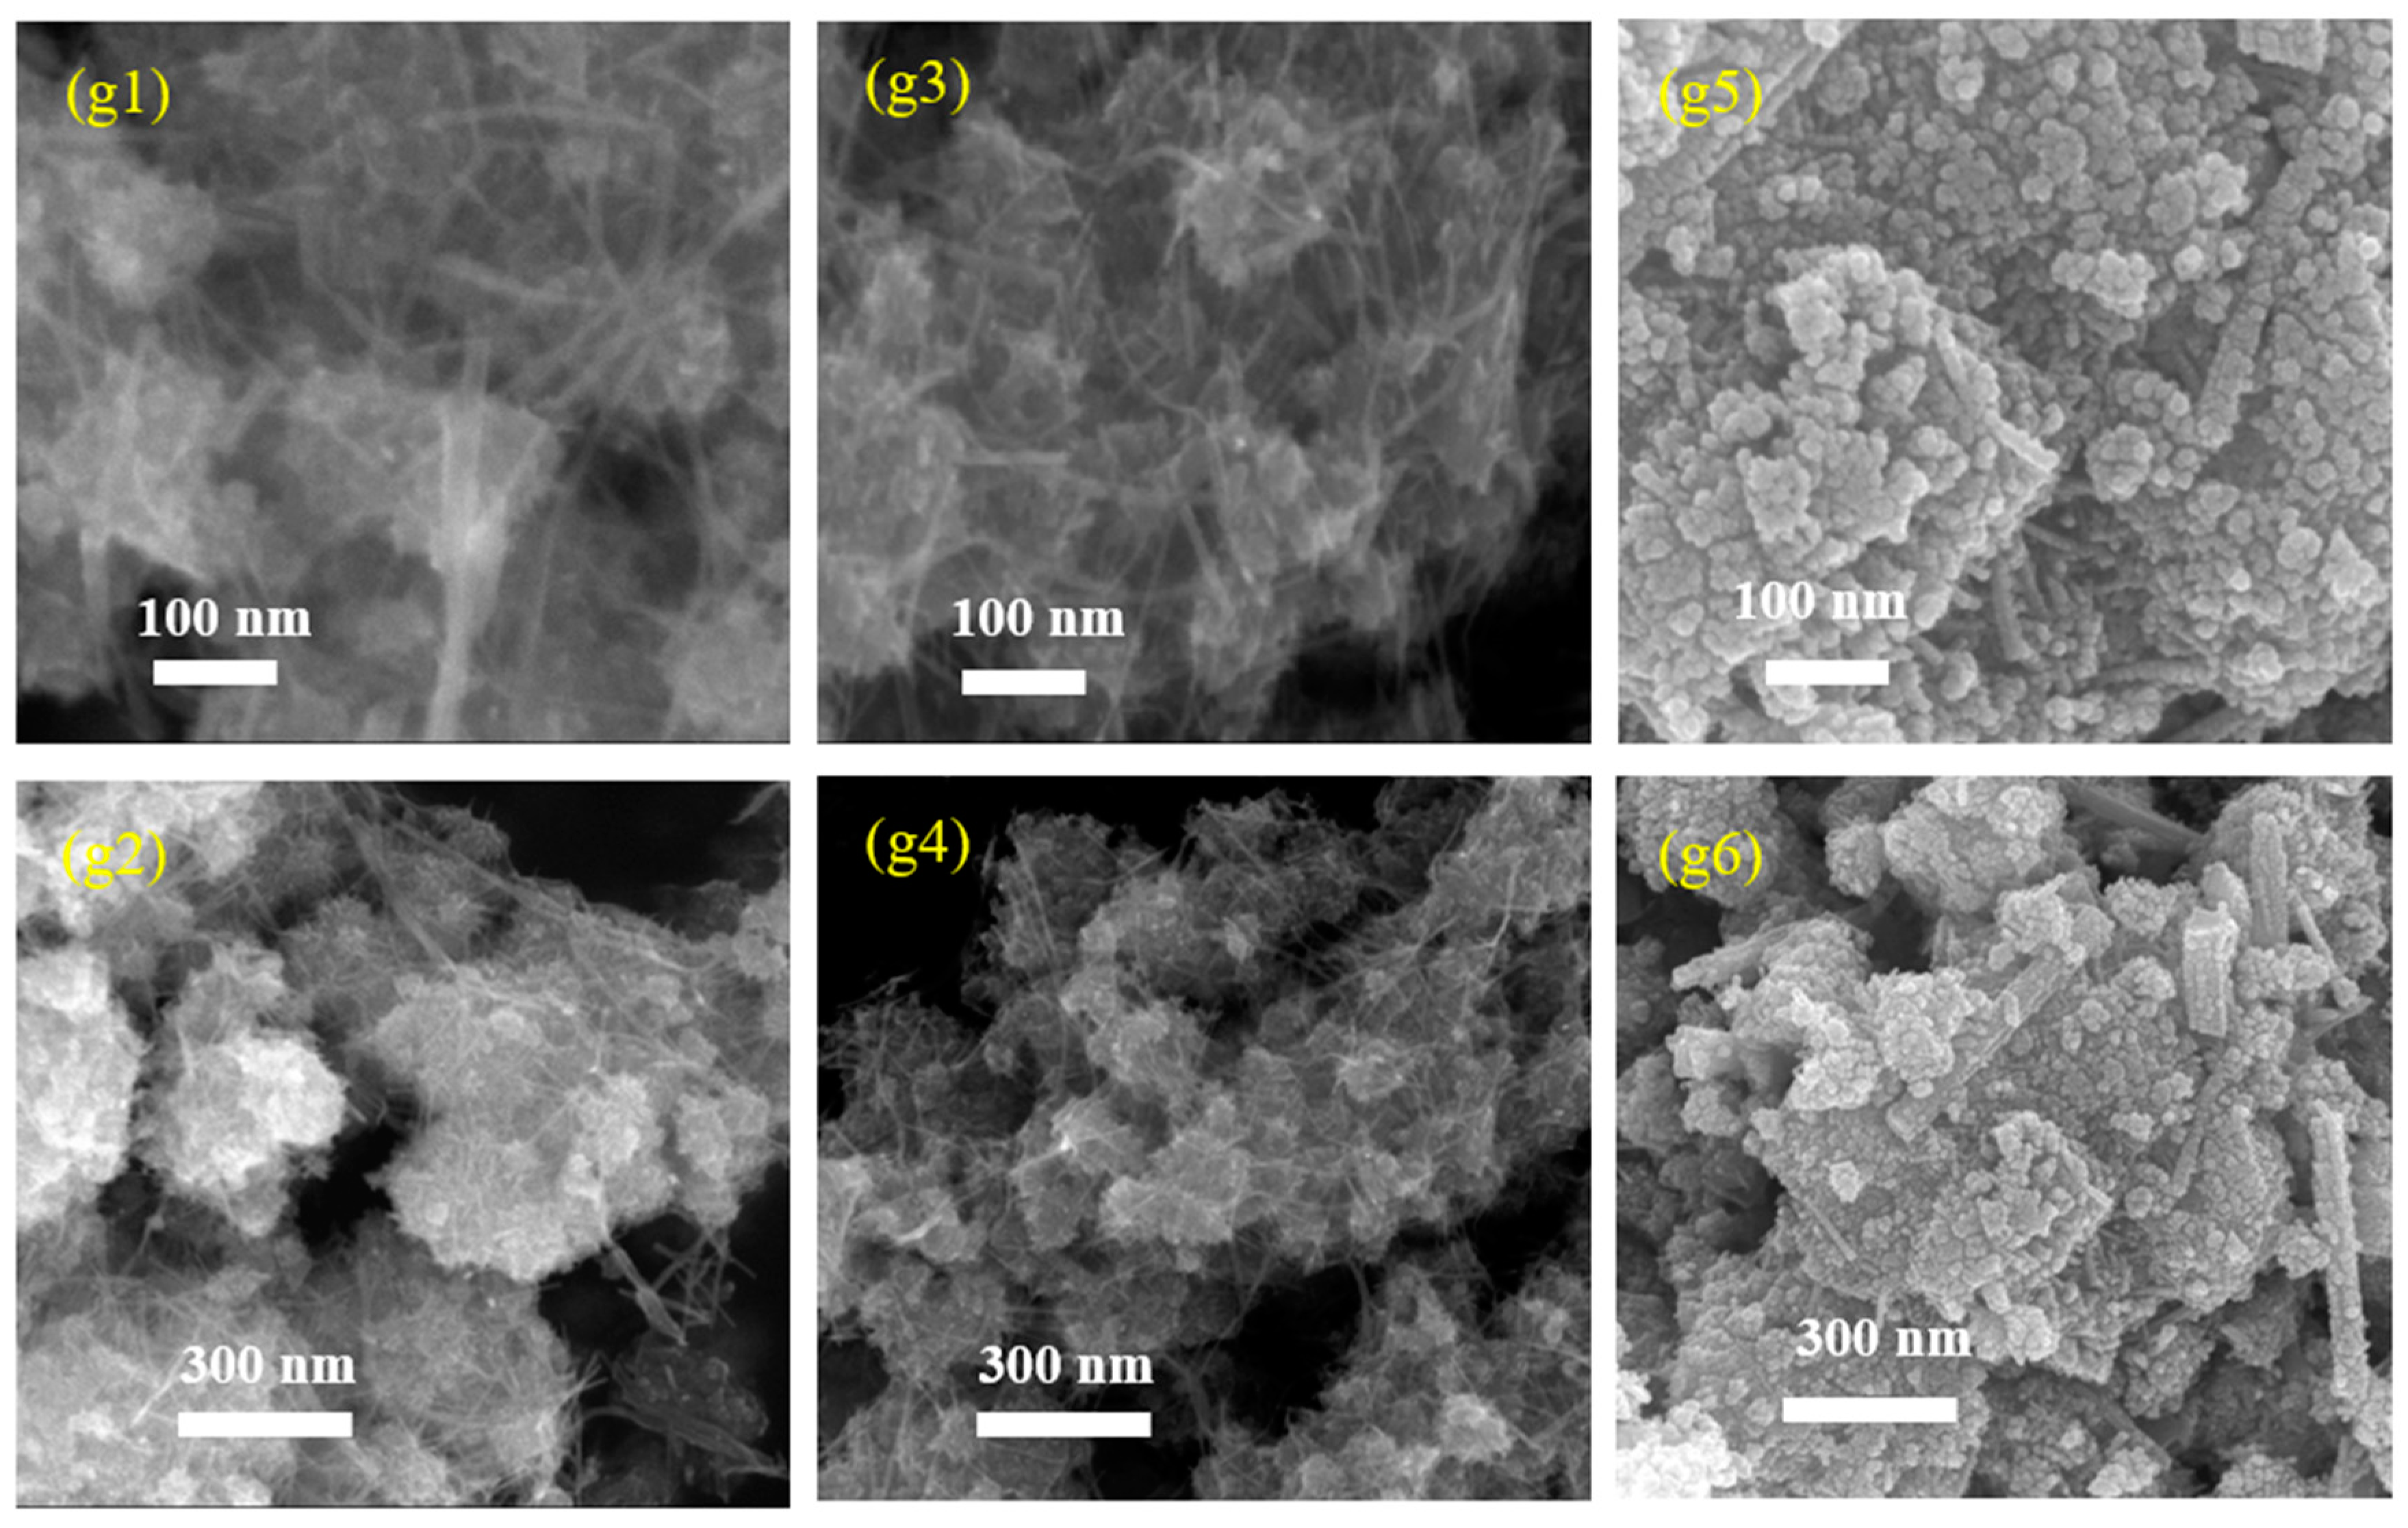
Figure 3g depicts the SEM images of three catalysts: MnO2-WN, MnO2-WK, and α-MnO2. Prepared by conventional hydrothermal synthesis, the α-MnO2 catalyst showcased a cauliflower-like morphology consisting of nanosphere clusters with diameters less than 50 nm, along with a small number of nanorods exceeding 200 nm in diameter. The closely aggregated nanospheres diminished the contact area between the catalyst and the gas, thereby reducing the reaction space and impeding reaction progression. In contrast, the MnO2-WN and MnO2-WK catalysts synthesized via microwave hydrothermal methods presented a morphology characterized by a flocculated skeleton structure, supplemented by a sheet-like structure. This structure implied a larger specific surface area and a higher degree of crystallinity, facilitating optimal contact between gas molecules and the active centers on the catalyst surface, thereby promoting reaction activity, in line with the findings of nitrogen adsorption-desorption experiments and XRD experiments. However, there were no significant differences in the structures of MnO2-WN and MnO2-WK, indicating that N2 calcination had a minimal impact on morphology.
3.3.2. Surface Properties of the Catalysts
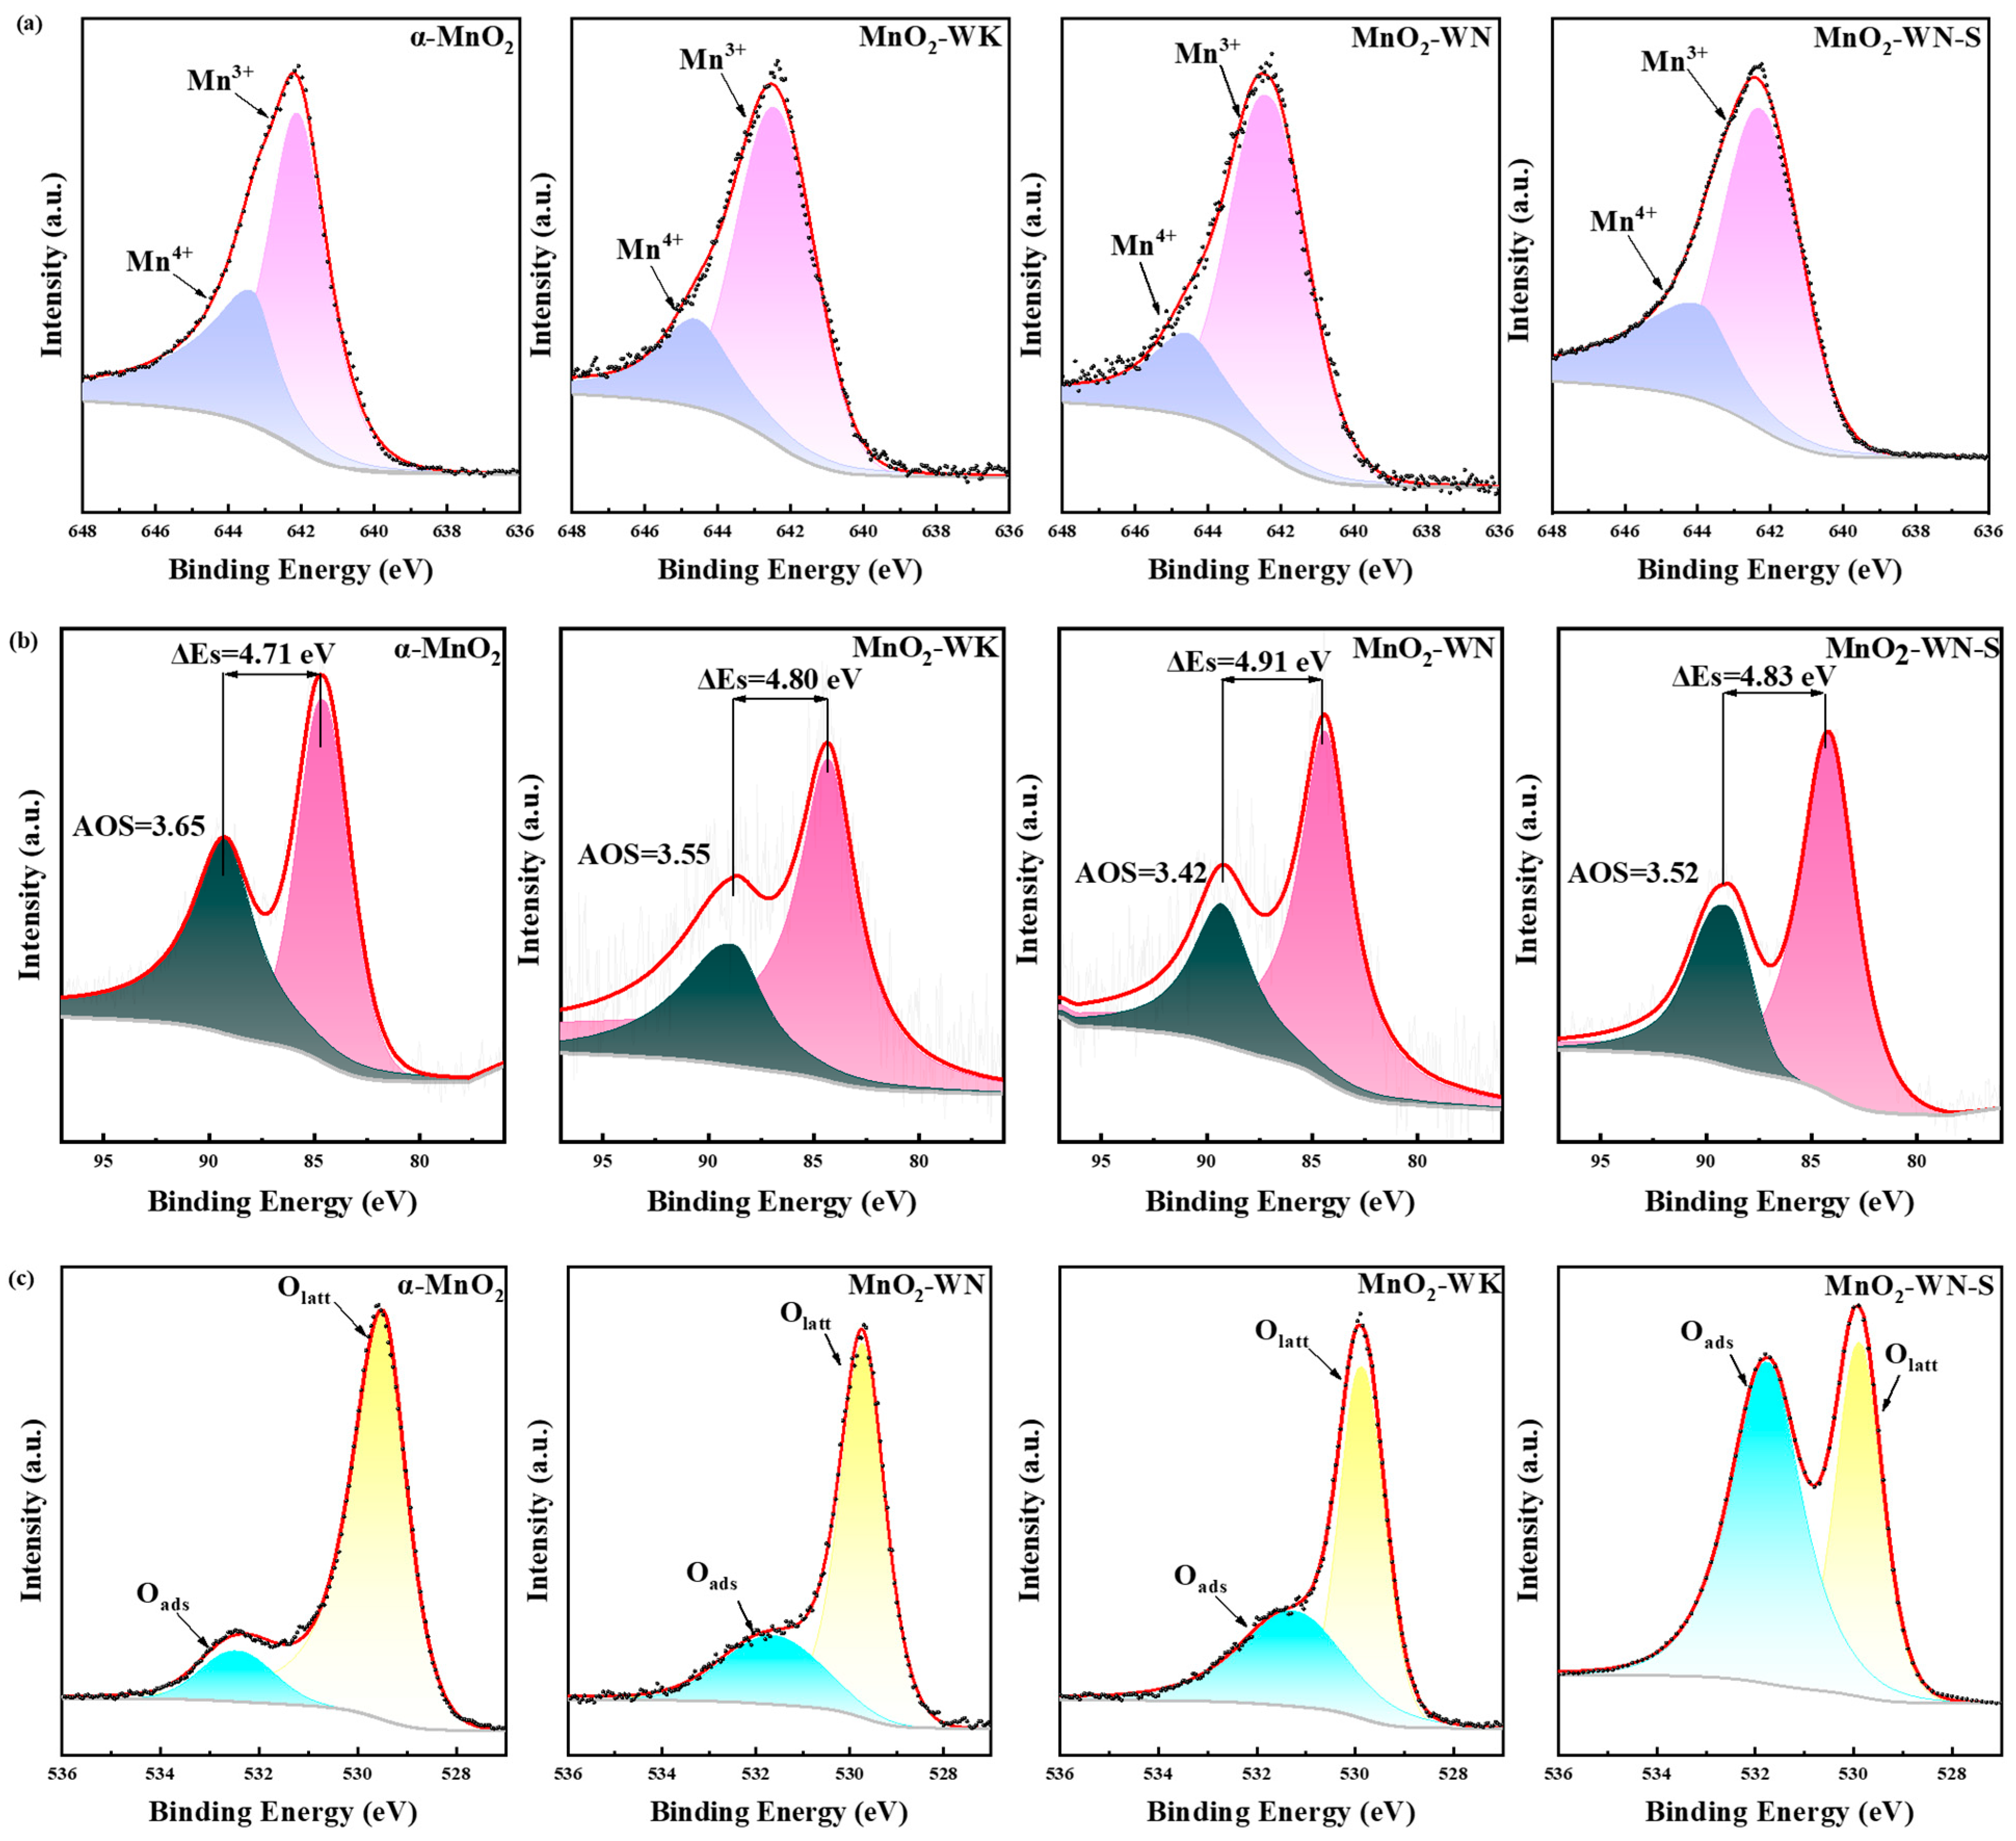
The chemical valence state of Mn and the distribution of oxygen species in the catalysts were determined by XPS measurements (see Figure 4). Using Gaussian functions, the XPS spectra of the samples were deconvoluted to discern the Mn and O species. Subsequently, the proportions were calculated by integrating the peak areas (see Table 3). Arranged in descending order of binding energy, Figure 4a shows the characteristic peaks at approximately 644.2 eV and 641.8 eV, corresponding to Mn4+ and Mn3+ species, respectively [30]. Table 3 indicated that MnO2-WN exhibited the highest proportion of Mn3+ at approximately 69.5%, followed by MnO2-WK at around 64.5% and α-MnO2 at the lowest level of 62.8%. Moreover, the spectra of Mn 3s (Figure 4b) showed two peaks at 83.7–84.4 eV and 88.2–89.1 eV. Further, the average oxidation state (AOS) of Mn can be calculated from these peaks according to the equation: AOS = 8.956–1.126 ΔEs, where ΔEs is the difference in the binding energy between the two peaks. Among these, MnO2-WN exhibited the lowest AOS value (3.42), indicating that MnO2-WN possessed a lower-valent Mn than the other catalysts. The order of increase in the AOS of the catalysts was consistent with that of the Mn4+ content. A higher proportion of Mn3+ is indicative of a greater propensity to induce Jahn-Teller distortion, thereby facilitating charge transfer and forming defect sites [31]. Defect sites typically promote the formation of active oxygen species. Consequently, a higher proportion of Mn3+ implies a higher concentration of active sites, which is advantageous for catalytic reactions [32]. For this reason, MnO2-WN displayed the best catalytic activity. However, the Mn valence distribution of the spent catalyst (MnO2-WN-S) for the catalytic oxidation of acetone did not change much compared to the fresh catalyst, implying a stable electron exchange, which favored a continuous and efficient reaction.
The O 1s spectra of all three catalysts revealed two characteristic peaks at approximately 531.7 eV and 529.9 eV, corresponding to adsorbed oxygen species (Oads) and lattice oxygen species (Olatt), respectively (see Figure 4c) [23]. As shown in Table 3, the proportion of chemisorbed oxygen species in MnO2-WN and MnO2-WK was significantly higher than that of α-MnO2. Typically, the chemisorbed oxygen included active oxygen species such as superoxide radicals and hydroxyl radicals, which improve their catalytic activity [33]. Moreover, it was also surprising to observe that the binding energy of chemisorbed oxygen in the MnO2-WN, MnO2-WK, and α-MnO2 catalysts increased successively, indicating that the methods of microwave hydrothermal and nitrogen annealing weaken the interaction between Mn and surface O atoms, reducing the escape energy of oxygen and eventually increasing oxygen mobility [34]. Therefore, the highest chemisorbed oxygen ratio and the lowest binding energy led to excellent catalytic activity of MnO2-WN. Notably, the MnO2-WN-S had a substantially higher content of Oads compared to the fresh catalyst, which might be related to the oxygen radicals generated during acetone decomposition. A high Oads content promotes the reaction, contributing to MnO2-WN maintaining high activity for a long time during the catalytic process.
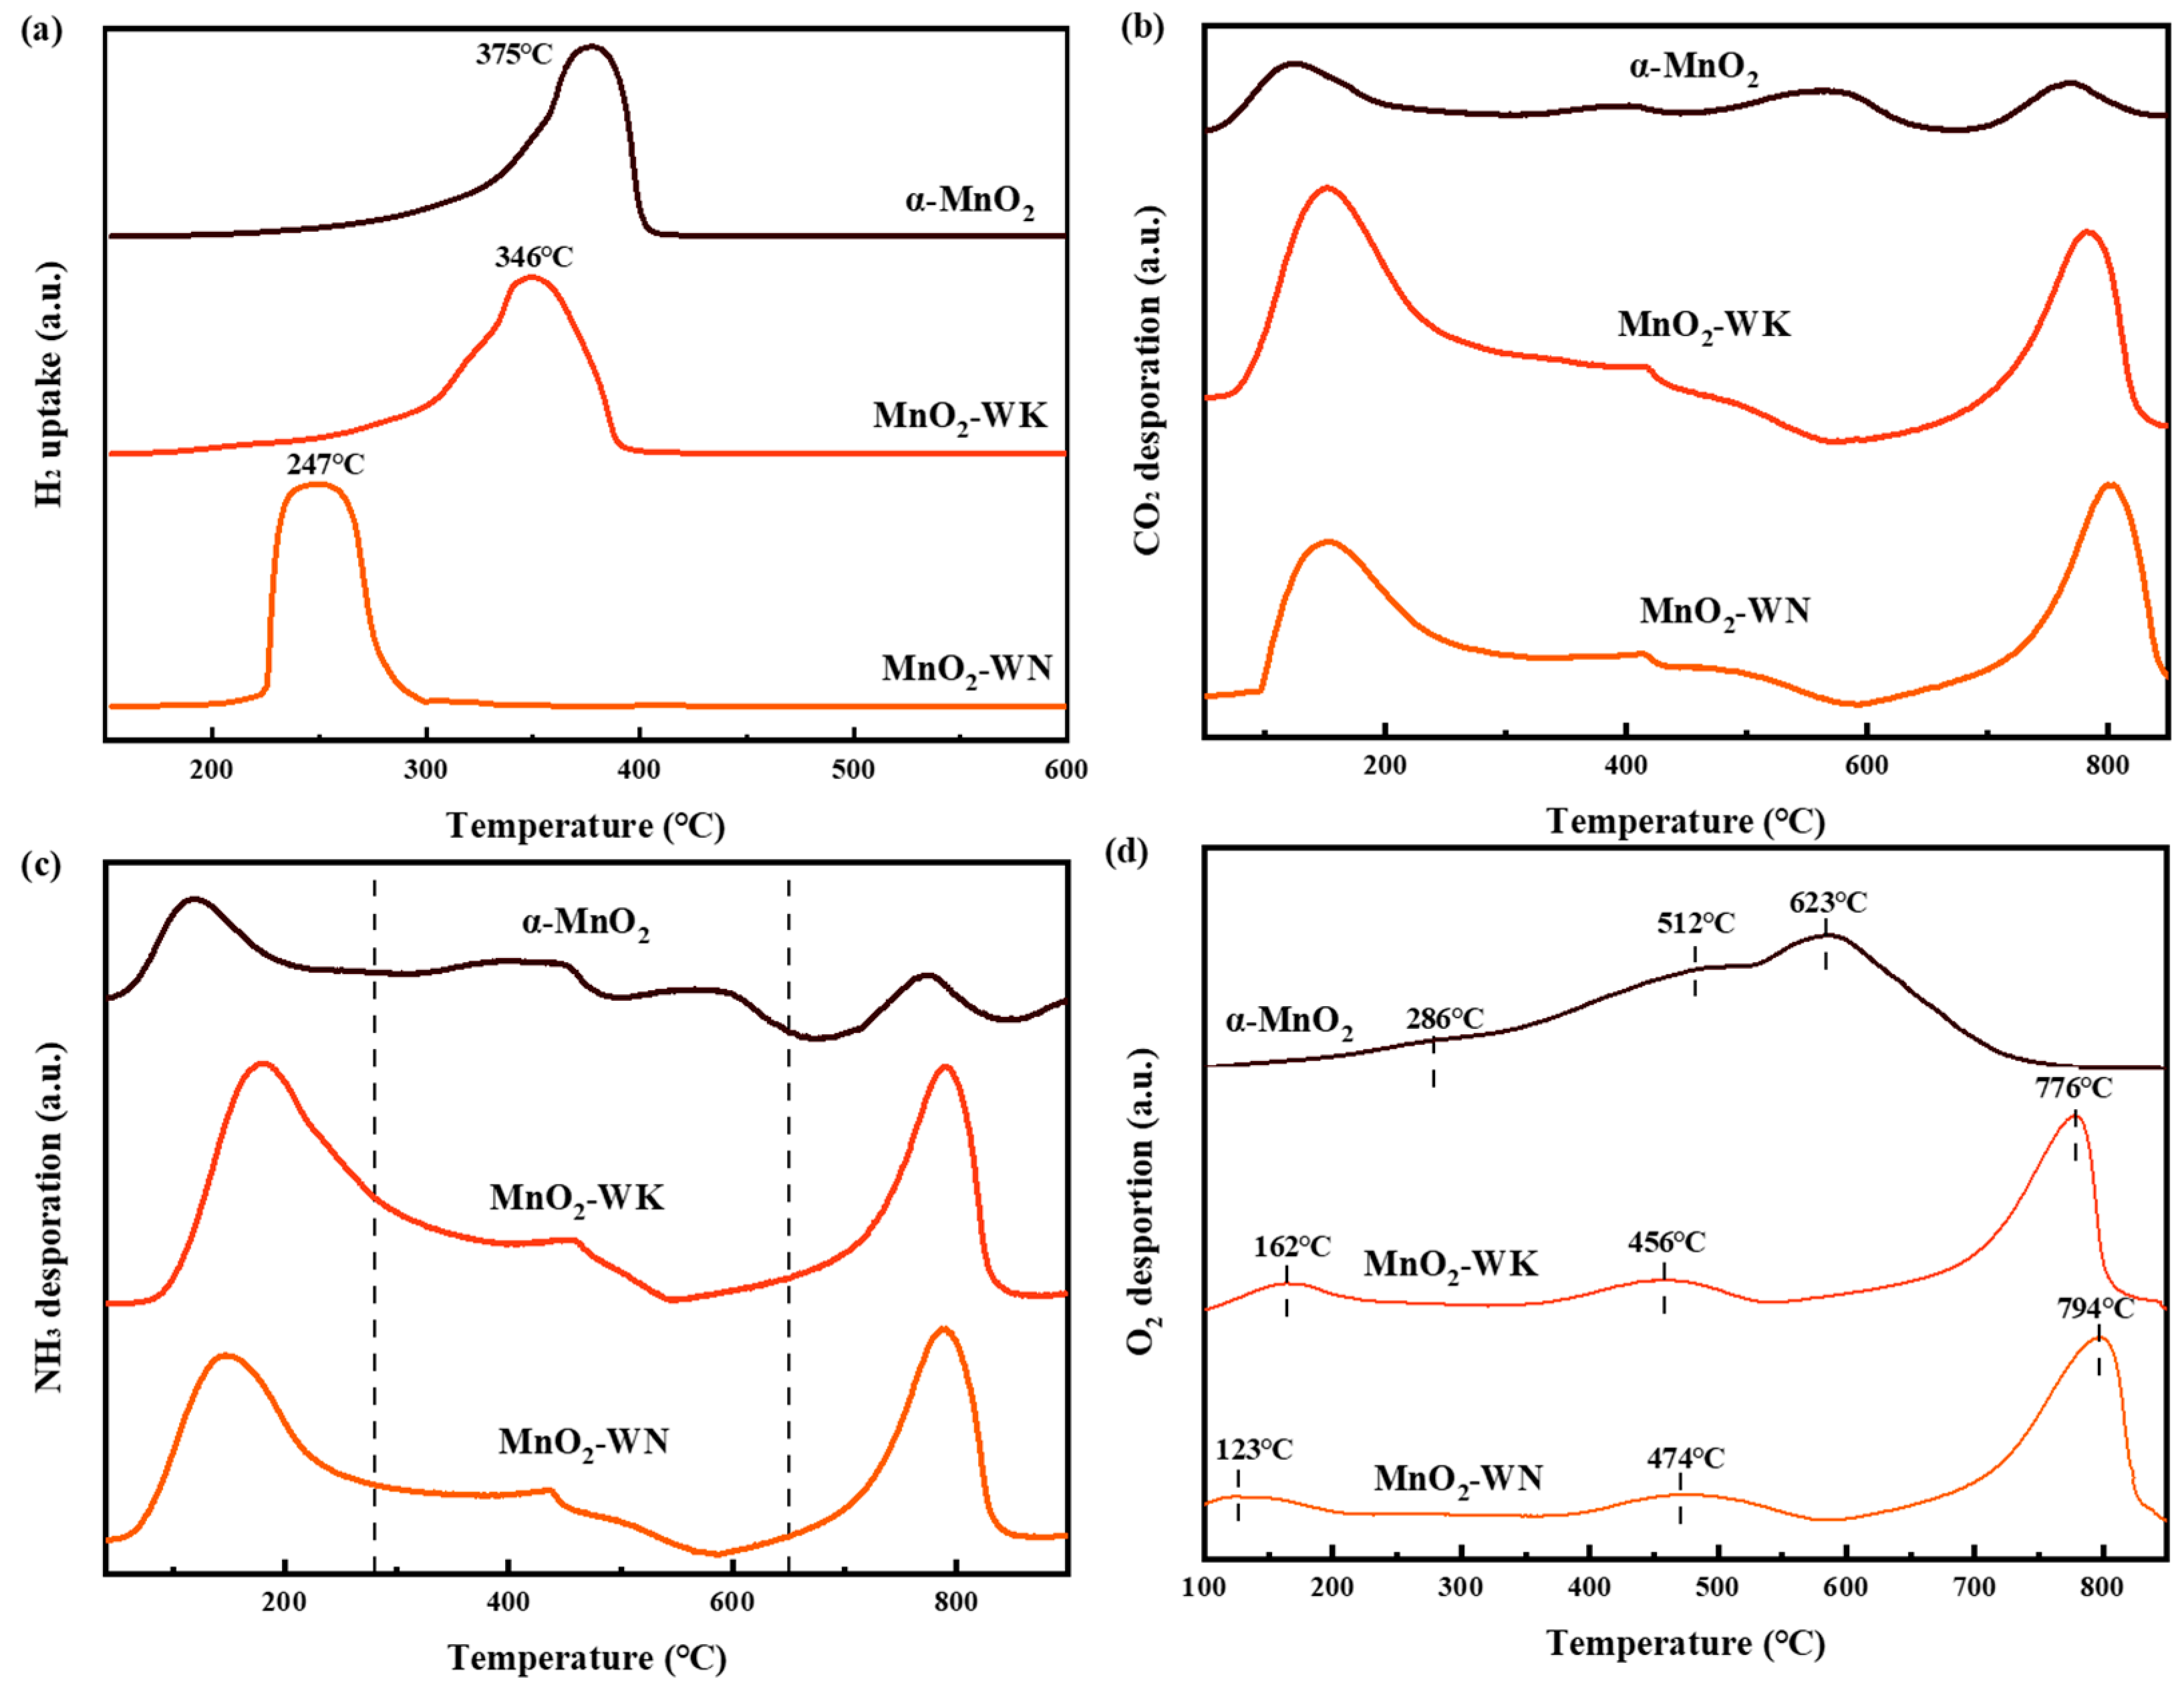
The H2-TPR test was performed to examine the reductive performance of the catalysts (see Figure 5a). All the catalysts exhibited only one reduction peak in the temperature range of 200–400 °C. The peak originated from two processes: the reduction from Mn4+ to Mn3+ and from Mn3+ to Mn2+ [35]. Notably, compared to α-MnO2, the adsorption peak of the MnO2-WN and MnO2-WK shifted significantly to the left, from 375 °C to 345 °C and 247 °C, respectively. The shift in the adsorption peak was accompanied by an increase in hydrogen consumption (see Table 4). Thus, while the microwave hydrothermal method enhanced the low-temperature reductive performance of the catalysts, calcination in the nitrogen atmosphere further strengthened this effect. Typically, excellent redox ability has been reported to lead to excellent catalytic performance, which was consistent with the activity test results. CO2 is the primary byproduct of the catalytic oxidation of most VOCs, and its desorption from the catalyst surface plays a pivotal role in advancing the reaction. Figure 5b shows the CO2 desorption abilities of the catalysts at different temperatures, as tested by CO2-TPD. At both low and high temperatures, MnO2-WN and MnO2-WK exhibited greater CO2 desorption peak areas than α-MnO2. Furthermore, MnO2-WN demonstrated the lowest initial desorption peak temperature, implying that it had the highest desorption capacity at low temperatures. Thus, the results suggest that the synergistic effect of microwave hydrothermal synthesis and N2 calcination bolstered the CO2 desorption capacity, fostering a positive feedback loop in the reaction and enhancing the catalytic activity.
The acidity on the catalyst surface was investigated by NH3-TPD experimentation (see Figure 5c). The NH3-TPD curve can be partitioned into three segments based on their acidity: 1. <280 °C signifies weak acid sites; 2. 280–650 °C denotes moderate acid sites; and 3. >650 °C represents strong acid sites [36]. The initial distinctive peak of all three catalysts was at approximately 160 °C. The peak strengths of the two catalysts synthesized via the microwave hydrothermal method markedly surpassed those of α-MnO2. Notably, the MnO2-WN peak in the weak acid region shifted toward lower temperatures, indicating a stronger weak acidity. Typically, weak acid sites participate in chemical bond cleavage during the reaction. Therefore, a weaker acidity would aid the deep oxidation of acetone [37]. There were no strong signals in the moderate acid range for the three catalysts, indicating a weaker moderate acidity. At temperatures close to 800 °C, all three catalysts exhibited conspicuous desorption peaks. Analogous to the weak acidity range, catalysts fabricated through the microwave hydrothermal method showed heightened peak intensities, suggesting more robust, strong acidity. Strong acid sites would also facilitate acetone elimination due to their significant stability. Subsequently, the distribution of oxygen species in the catalyst was examined via O2-TPD (see Figure 5d). Generally, the oxygen species depicted on the spectrum can be categorized as chemisorbed oxygen (Oads, temperature < 400 °C), surface lattice oxygen (Olatt, 400 °C < temperature < 600 °C), and bulk lattice oxygen (bulk Olatt, temperature > 600 °C) [38]. Evidently, MnO2 prepared by the microwave hydrothermal method exhibited a lower peak temperature and a larger peak area in the region below 400 °C. N2 calcination further reduced the peak temperature, indicating a higher abundance and easier desorption of Oads, consistent with the XPS data. Oads have been reported to be the primary active species involved in the catalytic oxidation of acetone. Furthermore, the peak temperatures of Olatt in the spectra of MnO2-WK and MnO2-WN were lower than those of α-MnO2, indicating an easier release of surface lattice oxygen, which generated more active species and promoted catalytic oxidation.
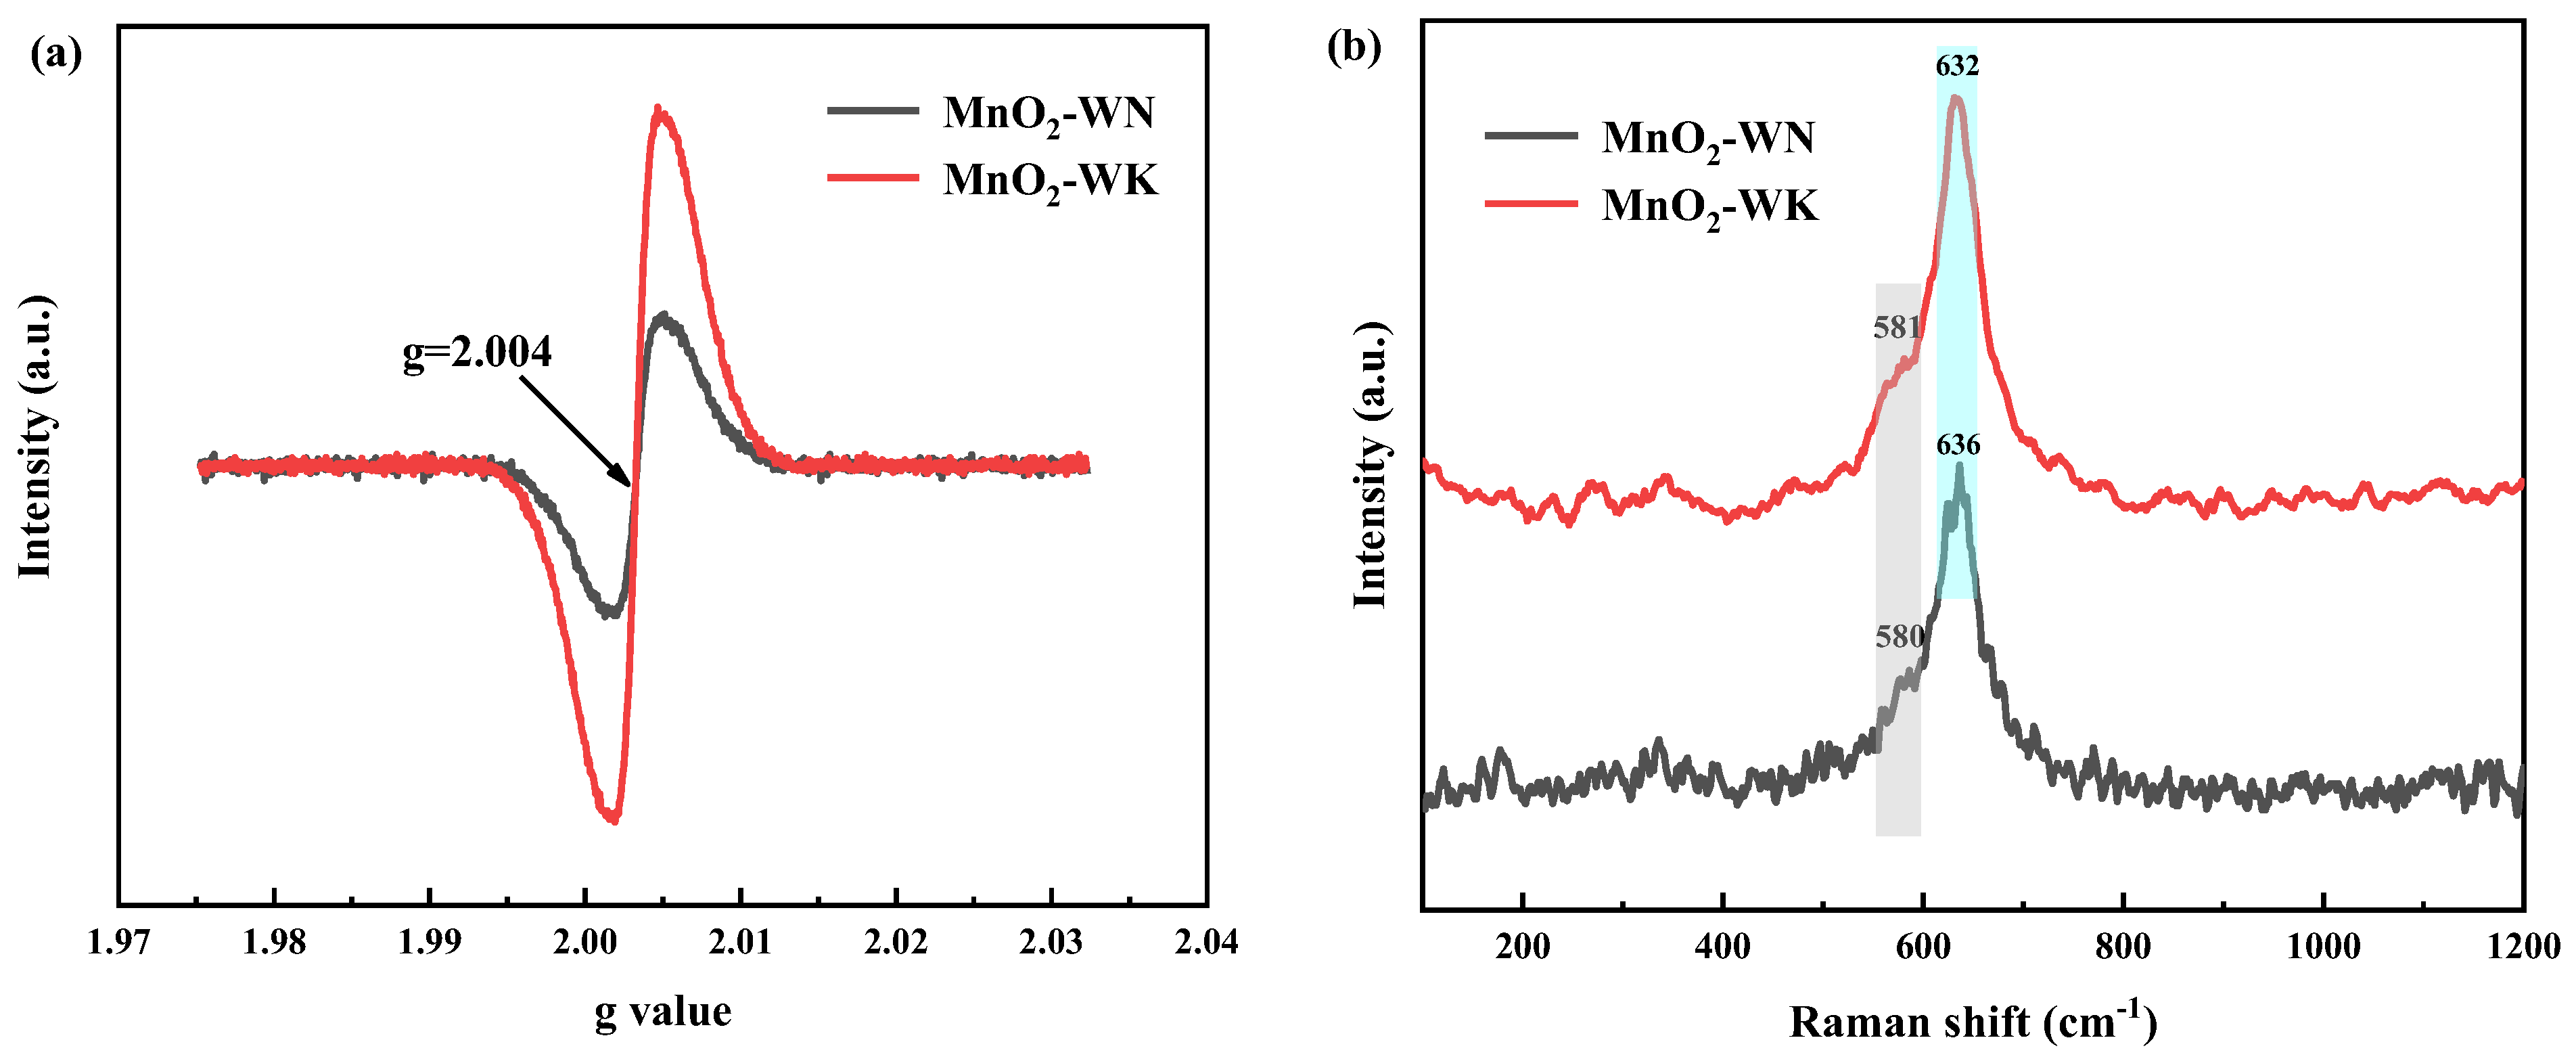
The surface defect sites of the catalysts were explored by collecting the EPR of MnO2-WN and MnO2-WK (see Figure 6a). The EPR spectra of the two catalysts exhibited similar profiles, with a sharp and robust EPR signal at g = 2.004, primarily associated with the Zeeman effect of unpaired electrons captured on oxygen vacancies [33]. Thus, the data indicated the presence of a certain quantity of oxygen vacancies in both catalysts [39]. However, because of a higher concentration of oxygen vacancies, the signal from MnO2-WK had a stronger intensity. Thus, MnO2-WK also contained the greatest amount of Oads since the abundance of oxygen vacancies is proportional to the content of Oads. Moreover, the reduced oxygen vacancies in MnO2-WN can be attributed to the enhanced crystallinity resulting from N2 calcination, which is consistent with the results of XRD.
Raman spectra were used to gain insights into the crystal structure of MnO2-WK and MnO2-WN (Figure 6b) [31]. Notably, the spectra of the two catalysts were very similar, both having an intense characteristic peak near 630 cm−1, which could be attributed to the Mn-O stretching vibration. Meanwhile, both catalysts showed a weak characteristic peak near 580 cm−1, corresponding to the deformation mode of the Mn-O-Mn chain. Both characteristic peaks were attributed to the stretching mode of the [MnO6] octahedron unit [40]. According to the previous studies, the stretching mode of Mn-O corresponded to a higher peak intensity, implying a higher degree of crystal ordering, consistent with the XRD results [41]. Meanwhile, the high similarity between the spectra confirmed that N2 calcination has little effect on the crystal structure.
3.4. Reaction Path
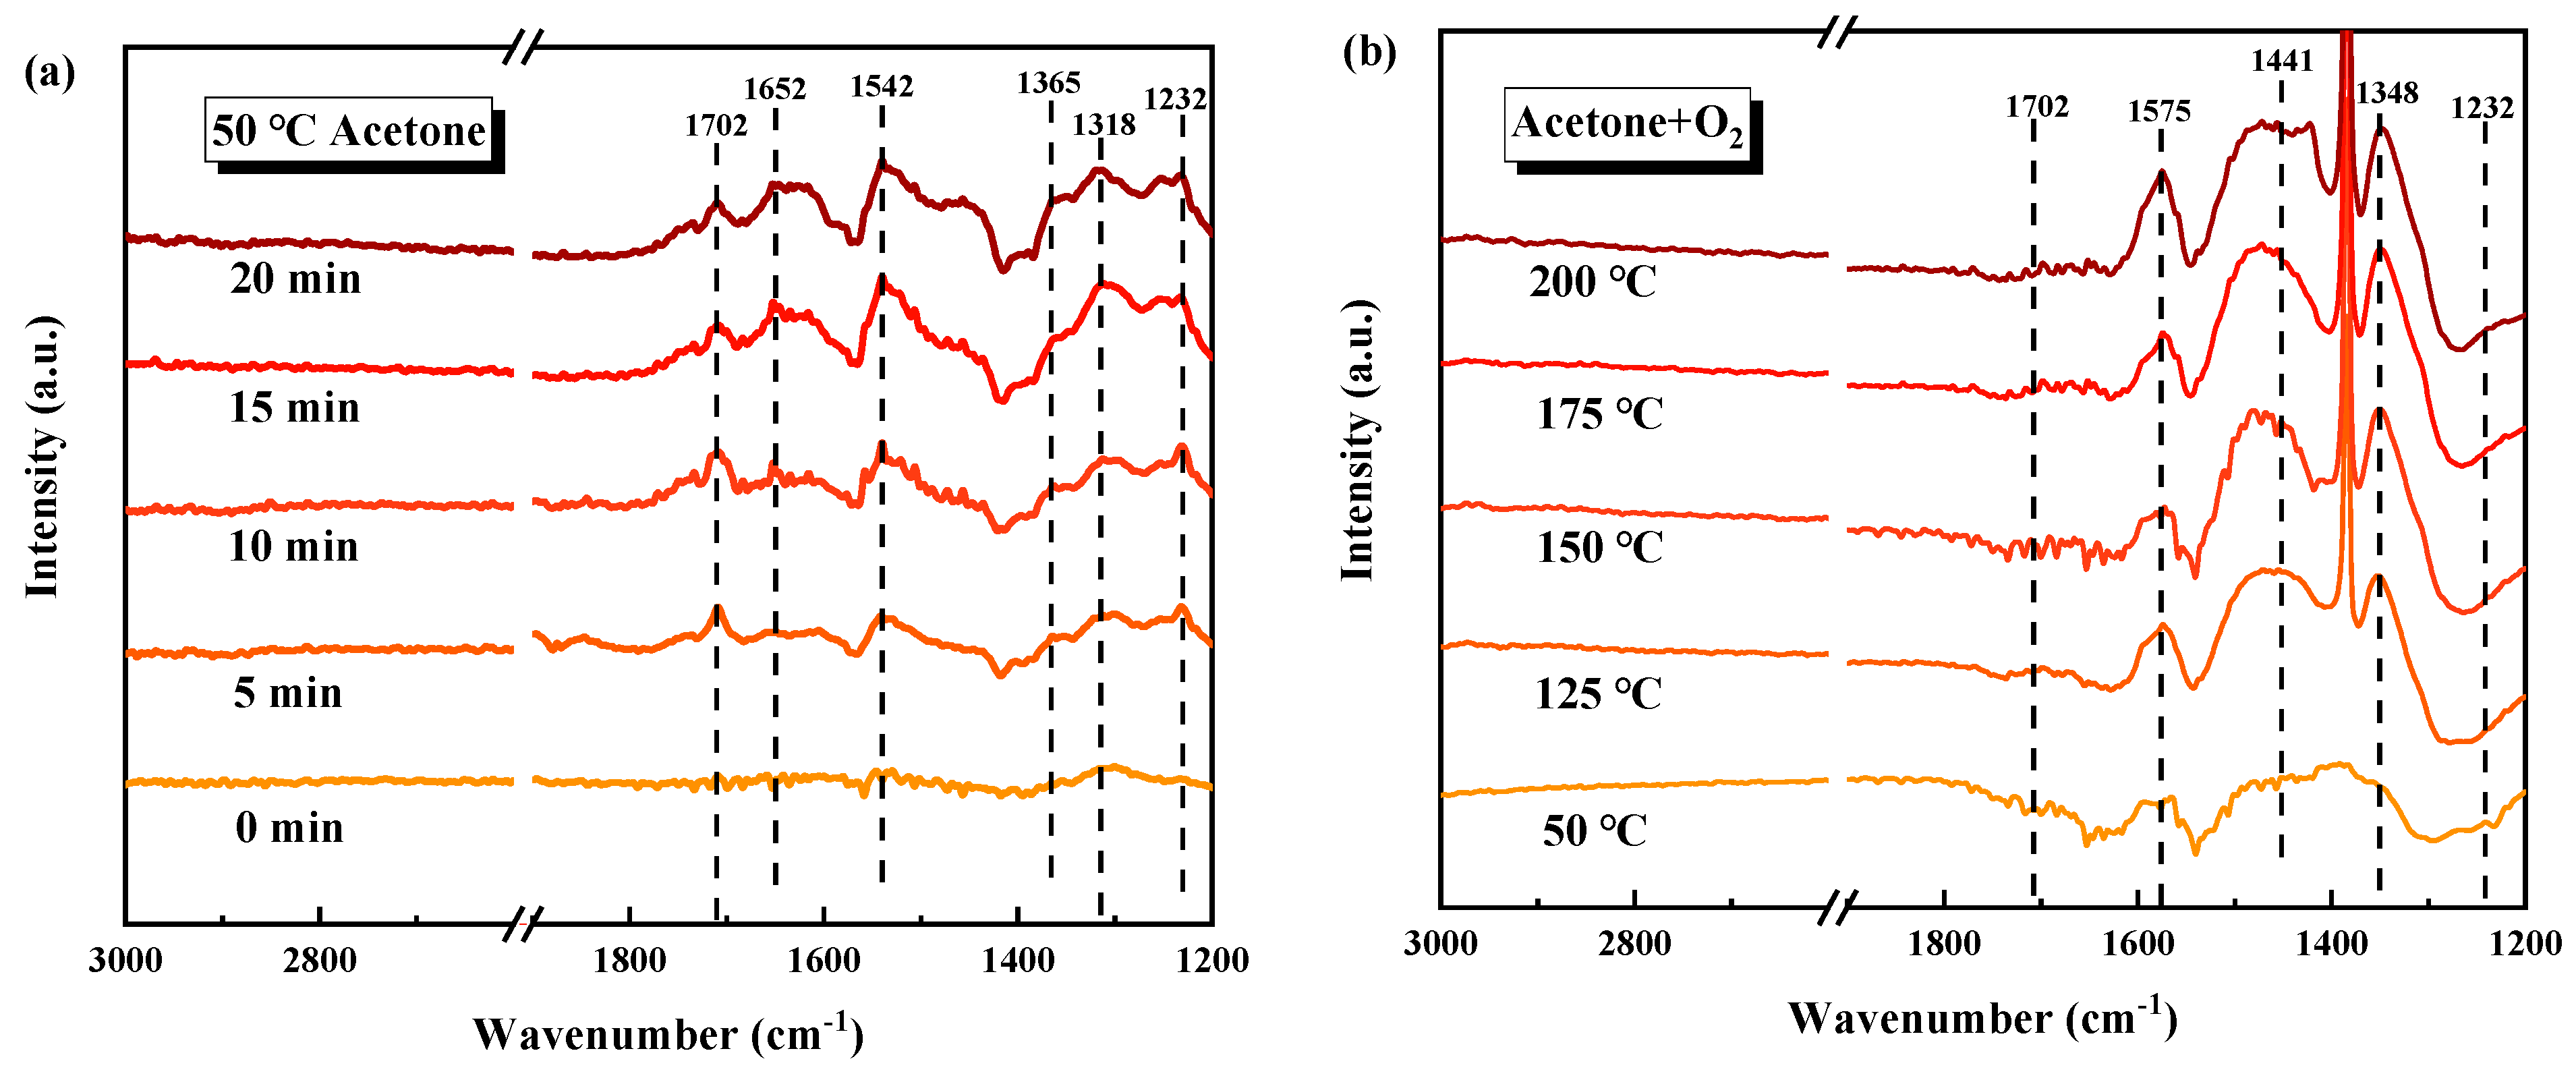
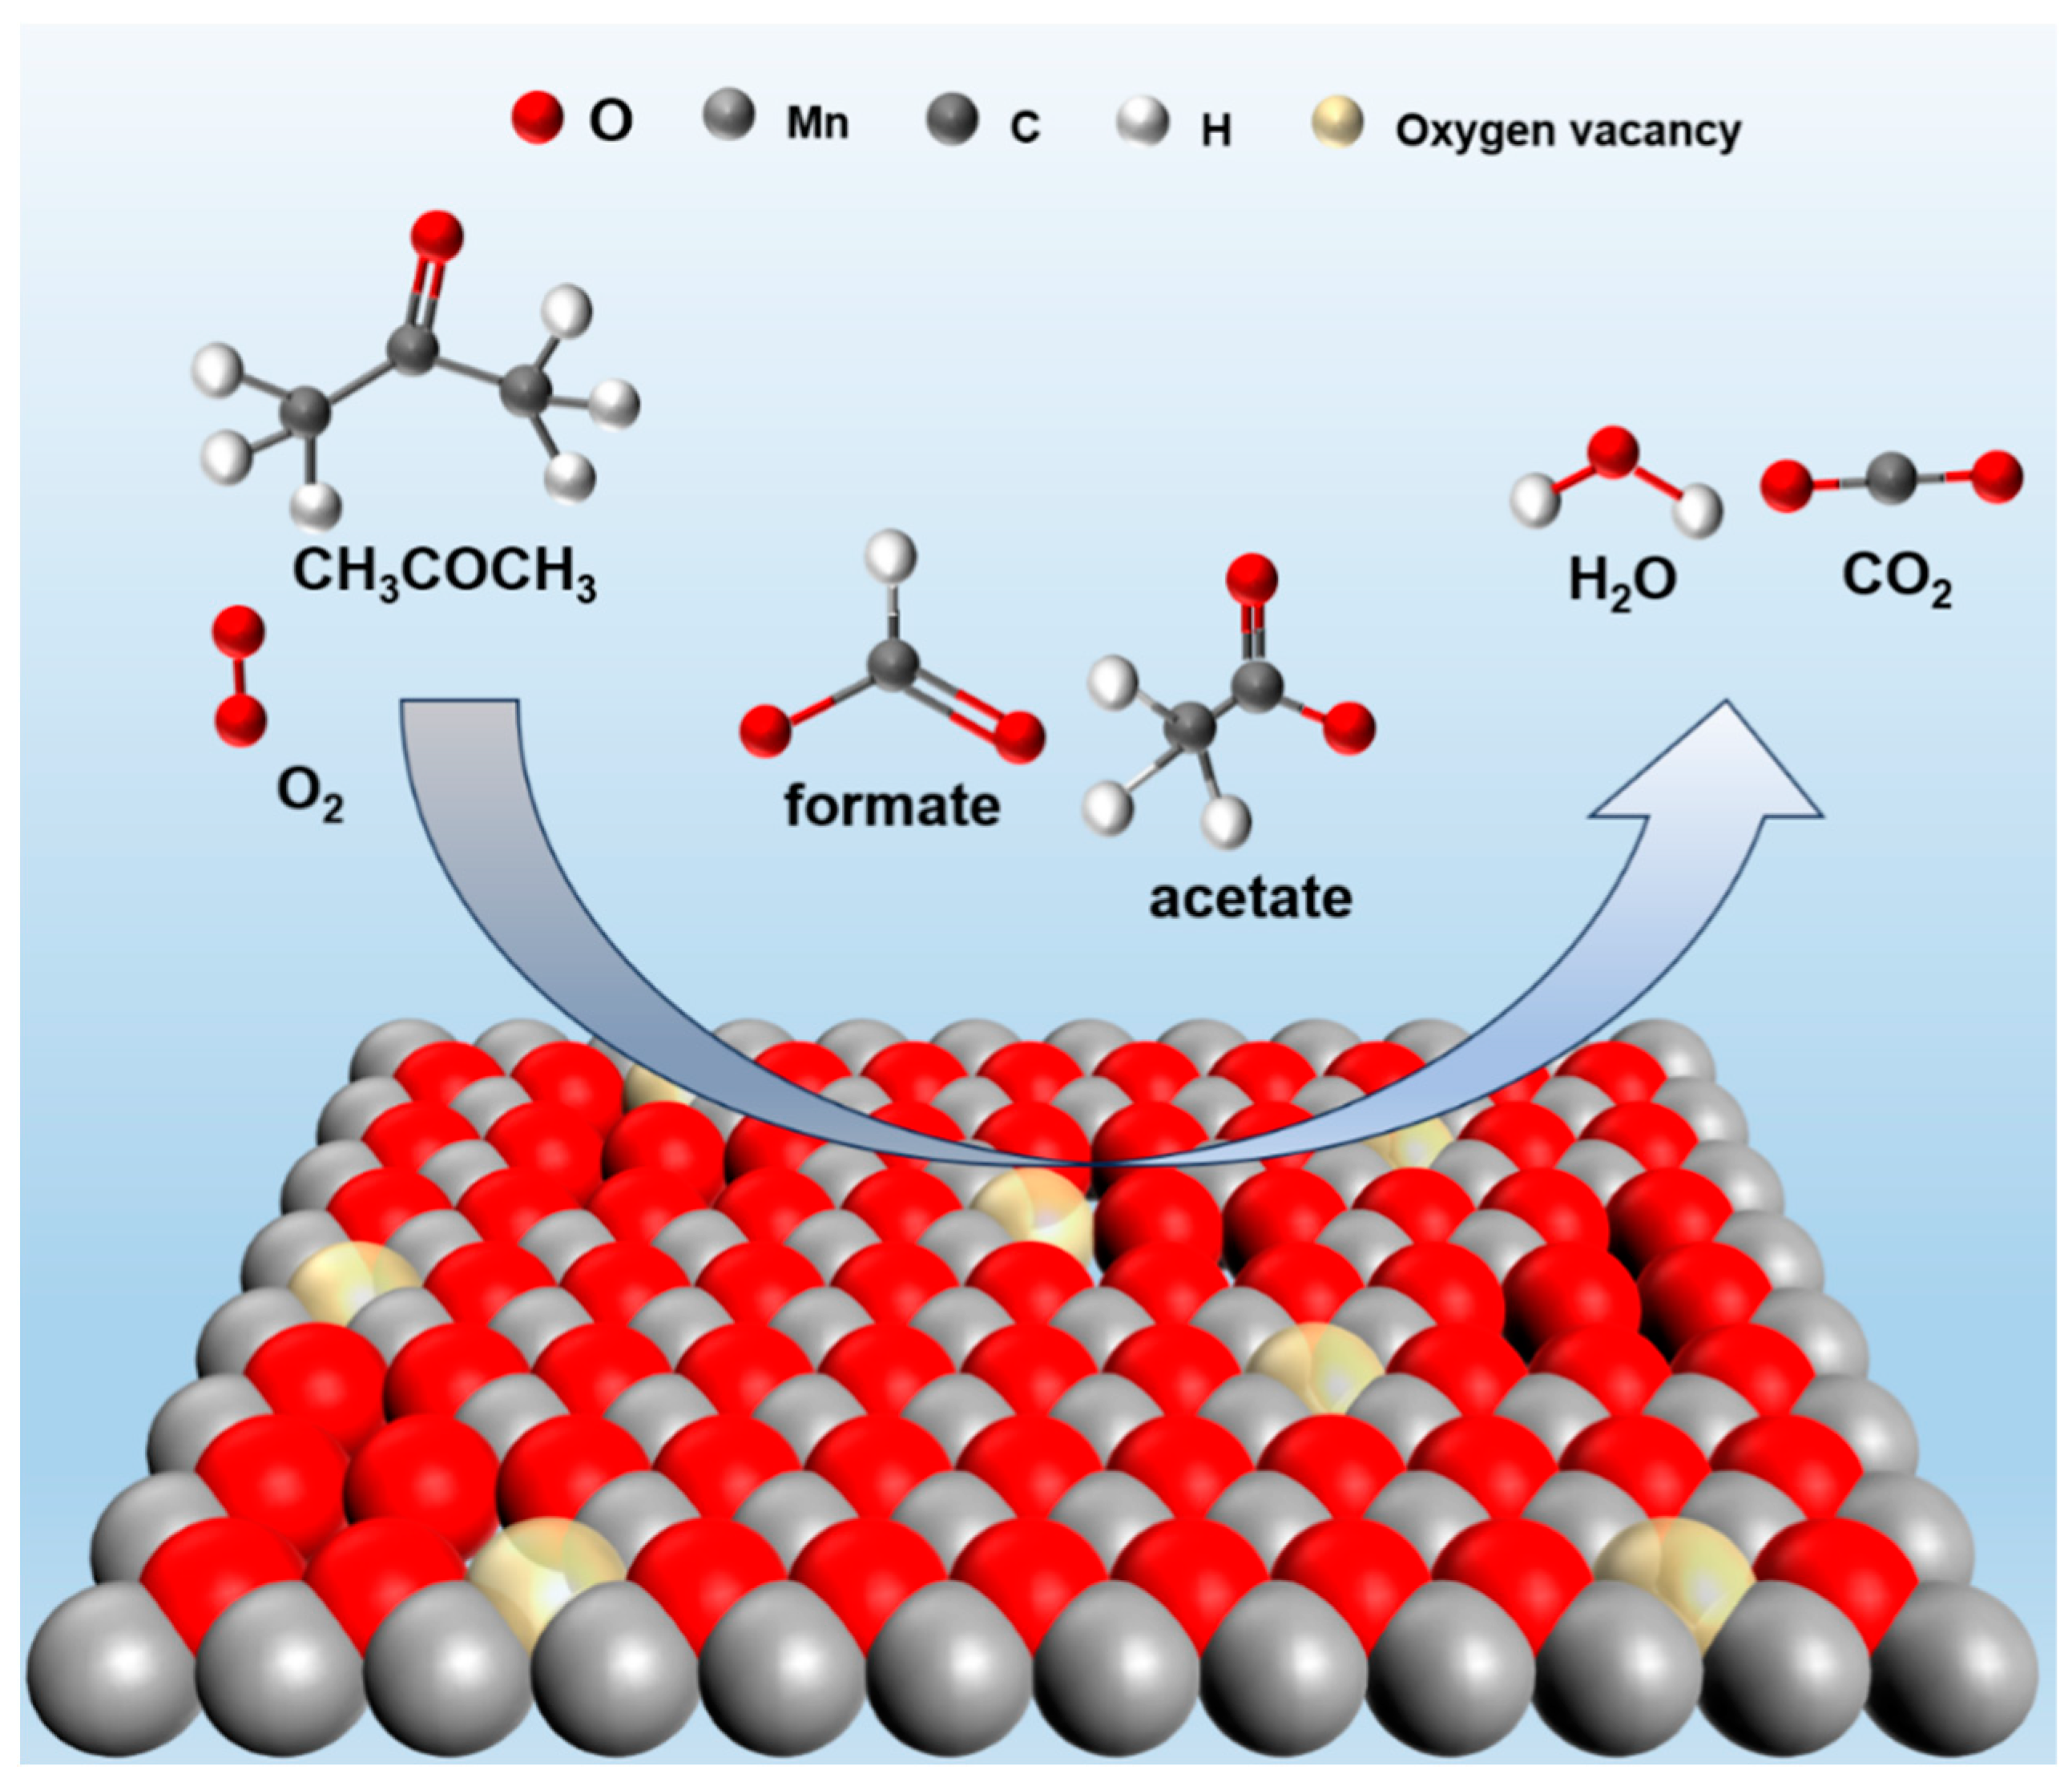
The intermediate products, as well as the acetone degradation pathway on MnO2-WN, were tested by in situ DRIFTS (Figure 7). The acetone adsorption at 50 °C in an anaerobic environment and the catalytic oxidation of acetone at different temperatures in an aerobic environment were tested. Figure 7a illustrates the vibrational characteristics of various species during acetone adsorption in an anaerobic environment. The vibrations at 1702, 1652, and 1542 cm−1 could be attributed to the stretching vibration of C=O, while the symmetric and asymmetric deformation vibrations of the methyl (-CH3) groups in acetone bands caused the bands at 1365 cm−1 and 1318 cm−1. Additionally, the band at 1232 cm−1 might be attributed to the stretching vibration of the carbon skeleton during acetone adsorption [42,43], confirming that acetone was well adsorbed on MnO2-WN. Moreover, the absence of bands corresponding to the vibrations of other species implied that there was no acetone oxidation in the anaerobic environment. This inference underlined the significance of surface-adsorbed oxygen as the principal oxygen species involved in the reaction. Upon the introduction of oxygen, the spectrum shifted from that of acetone adsorption to catalytic oxidation of acetone (see Figure 7b). With increasing temperature, the spectral bands generated from acetone adsorption gradually diminished, giving rise to numerous new bands, indicative of the production of new intermediate products from acetone oxidation. The bands at 1575 cm−1 and 1348 cm−1 could be attributed to the stretching vibrations of formate species, while the band at 1441 cm−1 could be ascribed to the accumulation of acetate species [43]. Thus, the data indicates that the intermediates engendered during the catalytic oxidation of acetone were formate and acetate species, ultimately transforming them into H2O and CO2. Figure 8 depicts the plausible reaction pathway.
4. Conclusions
This study evaluated the catalytic performance of different crystal forms of MnO2 towards acetone degradation. The α-MnO2 was regulated by different hydrothermal methods or different calcination atmospheres to further enhance the catalytic performance. Additionally, the relationship between surface properties, activity, and reaction pathways was thoroughly investigated. The primary findings are outlined as follows: Among the different MnOx crystal forms, α-MnO2 exhibited the most superior catalytic performance for acetone degradation. Through microwave hydrothermal synthesis and N2 calcination, the catalytic activity of α-MnO2 was significantly enhanced. Under the reaction conditions of 100 ppm acetone and 10% O2 balanced with N2, WHSV = 60,000 mLg−1 h−1—the T90 of MnO2-WN reached 132 °C. MnO2-WN also exhibited excellent stability and catalytic potential towards other common VOCs. The outstanding catalytic performance of α-MnO2 was attributed to a larger specific surface area, better pore structure, better redox ability, abundant acid sites, and generating reactive oxygen species. The reaction pathway of acetone on the surface of MnO2-WN involved the initial conversion of acetone to formate and acetate, which were further converted to H2O and CO2.
Supplementary Materials
The following supporting information can be downloaded at: https://www.mdpi.com/article/10.3390/pr12020326/s1. Table S1: Catalytic activity for acetone oxidation over various catalysts from previous research. References [21,42,43,44,45,46,47,48,49,50,51,52,53,54] are cited in Supplementary Materials.
Author Contributions
Conceptualization, B.C. and F.L.; methodology, B.C.; software, B.C.; validation, B.C., F.L. and X.G.; formal analysis, B.C. and X.G.; investigation, B.C. and Y.L.; resources, X.G. and Y.L.; writing—original draft preparation, B.C.; writing—review and editing, F.L. All authors have read and agreed to the published version of the manuscript.
Funding
This research received no external funding.
Data Availability Statement
The data discussed in this work are presented in the form of tables and figures in the article, and no data are withheld. All of the data can be accessed from the journal article.
Conflicts of Interest
The authors declare no conflict of interest.
References
- Kamal, M.S.; Razzak, S.A.; Hossain, M.M. Catalytic oxidation of volatile organic compounds (VOCs)—A review. Atmos. Environ. 2016, 140, 117–134. [Google Scholar] [CrossRef]
- Lerner, J.E.C.; Sanchez, E.Y.; Sambeth, J.E.; Porta, A.A. Characterization and health risk assessment of VOCs in occupational environments in Buenos Aires, Argentina. Atmos. Environ. 2012, 55, 440–447. [Google Scholar] [CrossRef]
- Mellouki, A.; Wallington, T.J.; Chen, J. Atmospheric chemistry of oxygenated volatile organic compounds: Impacts on air quality and climate. Chem. Rev. 2015, 115, 3984–4014. [Google Scholar] [CrossRef]
- Cavalcante, R.M.; Campelo, C.S.; Barbosa, M.J.; Silveira, E.R.; Carvalho, T.V.; Nascimento, R.F. Determination of carbonyl compounds in air and cancer risk assessment in an academic institute in Fortaleza, Brazil. Atmos. Environ. 2006, 40, 5701–5711. [Google Scholar] [CrossRef]
- Hu, C.Q.; Zhu, Q.S.; Jiang, Z.; Chen, L.; Wu, R.F. Catalytic combustion of dilute acetone over Cu-doped ceria catalysts. Chem. Eng. J. 2009, 152, 583–590. [Google Scholar] [CrossRef]
- Gupta, V.K.; Verma, N. Removal of volatile organic compounds by cryogenic condensation followed by adsorption. Chem. Eng. Sci. 2002, 57, 2679–2696. [Google Scholar] [CrossRef]
- Yang, K.; Sun, Q.; Xue, F.; Lin, D.H. Adsorption of volatile organic compounds by metal–organic frameworks MIL-101: Influence of molecular size and shape. J. Hazard. Mater. 2011, 195, 124–131. [Google Scholar] [CrossRef] [PubMed]
- Li, J.J.; Xu, X.Y.; Jiang, Z.; Hao, Z.P.; Hu, C. Nanoporous silica-supported nanometric palladium: Synthesis, characterization, and catalytic deep oxidation of benzene. Environ. Sci. Technol. 2005, 39, 1319–1323. [Google Scholar] [CrossRef] [PubMed]
- Muñoz, R.; Daugulis, A.J.; Hernández, M.; Quijano, G. Recent advances in two-phase partitioning bioreactors for the treatment of volatile organic compounds. Biotechnol. Adv. 2012, 30, 1707–1720. [Google Scholar] [CrossRef] [PubMed]
- Mustafa, M.F.; Fu, X.D.; Liu, Y.J.; Abbas, Y.; Wang, H.T.; Lu, W.J. Volatile organic compounds (VOCs) removal in non-thermal plasma double dielectric barrier discharge reactor. J. Hazard. Mater. 2018, 347, 317–324. [Google Scholar] [CrossRef] [PubMed]
- He, C.; Cheng, J.; Zhang, X.; Douthwaite, M.; Pattisson, S.; Hao, Z.P. Recent advances in the catalytic oxidation of volatile organic compounds: A review based on pollutant sorts and sources. Chem. Rev. 2019, 119, 4471–4568. [Google Scholar] [CrossRef] [PubMed]
- Huang, H.B.; Xu, Y.; Feng, Q.Y.; Leung, D.Y.C. Low temperature catalytic oxidation of volatile organic compounds: A review. Catal. Sci. Technol. 2015, 5, 2649–2669. [Google Scholar] [CrossRef]
- Liotta, L.F. Catalytic oxidation of volatile organic compounds on supported noble metals. Appl. Catal. B Environ. 2010, 100, 403–412. [Google Scholar] [CrossRef]
- Li, W.B.; Gong, H. Recent progress in the removal of volatile organic compounds by catalytic combustion. Acta Phys. Chim. Sin. 2010, 26, 885–894. (In Chinese) [Google Scholar] [CrossRef]
- Tang, W.X.; Liu, G.; Li, D.Y.; Liu, H.D.; Wu, X.F.; Han, N.; Chen, Y.F. Design and synthesis of porous non-noble metal oxides for catalytic removal of VOCs. Sci. China Chem. 2015, 58, 1359–1366. [Google Scholar] [CrossRef]
- Sun, H.; Li, L.; Chen, Y.; Kim, H.; Xu, X.; Guan, D.; Hu, Z.; Zhang, L.; Shao, Z.; Jung, W. Boosting ethanol oxidation by NiOOH-CuO nano-heterostructure for energy-saving hydrogen production and biomass upgrading. Appl. Catal. B Environ. 2023, 325, 122388. [Google Scholar] [CrossRef]
- Mu, X.T.; Ding, H.L.; Pan, W.G.; Zhou, Q.; Du, W.; Qiu, K.N.; Ma, J.C.; Zhang, K. Research progress in catalytic oxidation of volatile organic compound acetone. J. Environ. Chem. Eng. 2021, 9, 105650. [Google Scholar] [CrossRef]
- Cheng, L.; Wang, J.G.; Zhang, C.; Jin, B.; Men, Y. Boosting acetone oxidation efficiency over MnO2 nanorods by tailoring crystal phases. New J. Chem. 2019, 43, 19126–19136. [Google Scholar] [CrossRef]
- Lu, Y.Q.; Deng, H.; Pan, T.T.; Zhang, C.B.; He, H. Thermal annealing induced surface oxygen vacancy clusters in alpha-MnO2 nanowires for catalytic ozonation of VOCs at ambient temperature. ACS Appl. Mater. Interfaces 2023, 15, 9362–9372. [Google Scholar] [CrossRef]
- Nagaraju, P.; Alsalme, A.; Alswieleh, A.; Jayavel, R. Facile in-situ microwave irradiation synthesis of TiO2 graphene nanocomposite for high-performance supercapacitor applications. J. Electroanal. Chem. 2018, 808, 90–100. [Google Scholar] [CrossRef]
- Zhao, Q.; Zheng, Y.F.; Song, C.F.; Liu, Q.L.; Ji, N.; Ma, D.G.; Lu, X.B. Novel monolithic catalysts derived from in-situ decoration of Co3O4 and hierarchical Co3O4@MnOx on Ni foam for VOC oxidation. Appl. Catal. B Environ. 2020, 265, 118552. [Google Scholar] [CrossRef]
- Xiang, L.; Lin, F.W.; Cai, B.H.; Li, G.B.; Zhang, L.Y.; Wang, Z.H.; Yan, B.B.; Wang, Y.; Chen, G.Y. Catalytic ozonation of CH2Cl2 over hollow urchin-like MnO2 with regulation of active oxygen by catalyst modification and ozone promotion. J. Hazard. Mater. 2022, 436, 129217. [Google Scholar] [CrossRef] [PubMed]
- Li, G.B.; Shen, K.; Wu, P.; Zhang, Y.P.; Hu, Y.Q.; Xiao, R.; Wang, B.; Zhang, S.L. SO2 poisoning mechanism of the multi-active center catalyst for chlorobenzene and NOx synergistic degradation at dry and humid environments. Environ. Sci. Technol. 2021, 55, 13186–13197. [Google Scholar] [CrossRef] [PubMed]
- Zhai, G.J.; Wang, J.G.; Chen, Z.M.; Yang, S.F.; Men, Y. Highly enhanced soot oxidation activity over 3DOM Co3O4-CeO2 catalysts by synergistic promoting effect. J. Hazard. Mater. 2019, 363, 214–226. [Google Scholar] [CrossRef] [PubMed]
- Chen, Z.M.; Wang, J.G.; Zhai, G.J.; An, W.; Men, Y. Hierarchical yolk-shell WO3 microspheres with highly enhanced photoactivity for selective alcohol oxidations. Appl. Catal. B Environ. 2017, 218, 825–832. [Google Scholar] [CrossRef]
- Li, L.; Shi, J.W.; Tian, M.J.; Chen, C.W.; Wang, B.R.; Ma, M.D.; He, C. In situ fabrication of robust three dimensional ordered macroporous γ-MnO2/LaMnO3.15 catalyst for chlorobenzene efficient destruction. Appl. Catal. B Environ. 2021, 282, 119565. [Google Scholar] [CrossRef]
- Yi, H.H.; Xie, X.Z.; Song, L.L.; Zhao, S.Z.; Du, C.C.; Miao, L.L.; Tang, X.L. Promotion of rapid microwave-assisted synthesized porous manganese-cobalt catalyst on low-temperature toluene oxidation. J. Environ. Chem. Eng. 2022, 10, 107086. [Google Scholar] [CrossRef]
- Zhao, B.H.; Ran, R.; Wu, X.D.; Weng, D. Phase structures, morphologies, and NO catalytic oxidation activities of single-phase MnO2 catalysts. Appl. Catal. A Gen. 2016, 514, 24–34. [Google Scholar] [CrossRef]
- Luo, S.P.; Zhou, W.T.; Xie, A.J.; Wu, F.Q.; Yao, C.; Li, X.Z.; Zuo, S.X.; Liu, T.H. Effect of MnO2 polymorphs structure on the selective catalytic reduction of NOx with NH3 over TiO2–Palygorskite. Chem. Eng. J. 2016, 286, 291–299. [Google Scholar] [CrossRef]
- Lin, F.W.; Wang, Z.H.; Ma, Q.; Yang, Y.; Whiddon, R.; Zhu, Y.Q.; Cen, K.F. Catalytic deep oxidation of NO by ozone over MnOx loaded spherical alumina catalyst. Appl. Catal. B Environ. 2016, 198, 100–111. [Google Scholar] [CrossRef]
- He, C.; Wang, Y.C.; Li, Z.Y.; Huang, Y.J.; Liao, Y.H.; Xia, D.H.; Lee, S.C. Facet engineered alpha-MnO2 for efficient catalytic ozonation of odor CH3SH: Oxygen vacancy-induced active centers and catalytic mechanism. Environ. Sci. Technol. 2020, 54, 12771–12783. [Google Scholar] [CrossRef] [PubMed]
- Chen, G.Y.; Wang, Z.; Lin, F.W.; Zhang, Z.M.; Yu, H.D.; Yan, B.B.; Wang, Z.H. Comparative investigation on catalytic ozonation of VOCs in different types over supported MnOx catalysts. J. Hazard. Mater. 2020, 391, 122218. [Google Scholar] [CrossRef] [PubMed]
- Wang, J.G.; Liang, H.; Zhang, C.; Jin, B.; Men, Y. Bi2WO6−x nanosheets with tunable Bi quantum dots and oxygen vacancies for photocatalytic selective oxidation of alcohols. Appl. Catal. B Environ. 2019, 256, 117874. [Google Scholar] [CrossRef]
- Rong, S.P.; Zhang, P.Y.; Liu, F.; Yang, Y.J. Engineering crystal facet of α-MnO2 nanowire for highly efficient catalytic oxidation of carcinogenic airborne formaldehyde. ACS Catal. 2018, 8, 3435–3446. [Google Scholar] [CrossRef]
- Wang, T.; Chen, S.; Wang, H.Q.; Liu, Z.; Wu, Z.B. In-plasma catalytic degradation of toluene over different MnO2 polymorphs and study of reaction mechanism. Chin. J. Catal. 2017, 38, 793–803. [Google Scholar] [CrossRef]
- Weng, X.L.; Long, Y.; Wang, W.L.; Shao, M.; Wu, Z.B. Structural effect and reaction mechanism of MnO2 catalysts in the catalytic oxidation of chlorinated aromatics. Chin. J. Catal. 2019, 40, 638–646. [Google Scholar] [CrossRef]
- Weng, X.L.; Sun, P.F.; Long, Y.; Meng, Q.J.; Wu, Z.B. Catalytic oxidation of chlorobenzene over MnxCe1−xO2/HZSM-5 catalysts: A study with practical implications. Environ. Sci. Technol. 2018, 52, 8986. [Google Scholar] [CrossRef] [PubMed]
- Dong, L.H.; Tang, Y.X.; Li, B.; Zhou, L.Y.; Gong, F.Z.; He, H.X.; Sun, B.Z.; Tang, C.J.; Gao, F.; Dong, L. Influence of molar ratio and calcination temperature on the properties of TixSn1−xO2 supporting copper oxide for CO oxidation. Appl. Catal. B Environ. 2016, 180, 451–462. [Google Scholar] [CrossRef]
- Yang, L.; Jiao, Y.; Xu, X.; Pan, Y.; Su, C.; Duan, X.; Sun, H.; Liu, S.; Wang, S.; Shao, Z. Superstructures with Atomic-Level Arranged Perovskite and Oxide Layers for Advanced Oxidation with an Enhanced Non-Free Radical Pathway. Acs Sustain. Chem. Eng. 2022, 10, 1899–1909. [Google Scholar] [CrossRef]
- Piumetti, M.; Fino, D.; Russo, N. Mesoporous manganese oxides prepared by solution combustion synthesis as catalysts for the total oxidation of VOCs. Appl. Catal. B Environ. 2015, 163, 277–287. [Google Scholar] [CrossRef]
- Qu, Z.P.; Bu, Y.B.; Qin, Y.; Wang, Y.; Fu, Q. The improved reactivity of manganese catalysts by Ag in catalytic oxidation of toluene. Appl. Catal. B Environ. 2013, 132–133, 353–362. [Google Scholar] [CrossRef]
- Zheng, Y.F.; Su, Y.; Pang, C.H.; Yang, L.Z.; Song, C.F.; Ji, N.; Ma, D.G.; Lu, X.B.; Han, R.; Liu, Q.L. Interface-enhanced oxygen vacancies of CoCuOx catalysts in situ grown on monolithic Cu foam for VOC catalytic oxidation. Environ. Sci. Technol. 2022, 56, 1905–1916. [Google Scholar] [CrossRef]
- Dong, A.Q.; Gao, S.; Wan, X.; Wang, L.X.; Zhang, T.; Wang, L.; Lang, X.Y.; Wang, W.C. Labile oxygen promotion of the catalytic oxidation of acetone over a robust ternary Mn-based mullite GdMn2O5. Appl. Catal. B Environ. 2020, 271, 118932. [Google Scholar] [CrossRef]
- Zhang, C.; Wang, J.G.; Yang, S.F.; Liang, H.; Men, Y. Boosting total oxidation of acetone over spinel MCo2O4 (M = Co, Ni, Cu) hollow mesoporous spheres by cation-substituting effect. J. Colloid Interface Sci. 2019, 539, 65–75. [Google Scholar] [CrossRef]
- Qin, R.; Chen, J.H.; Gao, X.; Zhu, X.B.; Yu, X.N.; Cen, K.F. Catalytic oxidation of acetone over CuCeOx nanofibers prepared by an electrospinning method. RSC Adv. 2014, 4, 43874–43881. [Google Scholar] [CrossRef]
- Chen, J.H.; Yu, X.N.; Zhu, X.C.; Zheng, C.H.; Gao, X.; Cen, K.F. Electrospinning synthesis of vanadium-TiO2-carbon composite nanofibrous membranes as effective catalysts for the complete oxidation of low-concentration acetone. Appl. Catal. A 2015, 507, 99–108. [Google Scholar] [CrossRef]
- Song, R.Z.; Bai, Y.; Li, X.R.; Zhu, J.L.; Zhang, H.X.; Shi, Y.C.; Li, K.; Wang, B.; Zhang, H.S.; Yang, Y.F.; et al. Plasma Circular RNA DYM Related to Major Depressive Disorder and Rapid Antidepressant Effect Treated by Visual Cortical Repetitive Transcranial Magnetic Stimulation. J. Affect. Disord. 2020, 274, 486–493. [Google Scholar] [CrossRef] [PubMed]
- Wang, Z.W.; Li, S.; Xie, S.H.; Liu, Y.X.; Dai, H.X.; Guo, G.S.; Deng, J.G. Supported ultralow loading Pt catalysts with high H2O-, CO2-, and SO2-resistance for acetone removal. Appl. Catal. A Gen. 2019, 579, 106–115. [Google Scholar] [CrossRef]
- Xia, Y.S.; Xia, L.; Liu, Y.X.; Yang, T.; Deng, J.G.; Dai, H.X. Concurrent catalytic removal of typical volatile organic compound mixtures over Au-Pd/α-MnO nanotubes. J. Environ. Sci. 2018, 64, 276–288. [Google Scholar] [CrossRef]
- Zhao, Q.; Liu, Q.; Song, C.; Ji, N.; Ma, D.; Lu, X. Enhanced catalytic performance for VOCs oxidation on the CoAlO oxides by KMnO4 doped on facile synthesis. Chemosphere 2019, 218, 895–906. [Google Scholar] [CrossRef] [PubMed]
- Kondratowicz, T.; Drozdek, M.; Michalik, M.; Gac, W.; Gajewska, M.; Kustrowski, P. Catalytic activity of Pt species variously dispersed on hollow ZrO2 spheres in combustion of volatile organic compounds. Appl. Surf. Sci. 2020, 513, 145788. [Google Scholar] [CrossRef]
- Zhao, Q.; Ge, Y.L.; Fu, K.X.; Zheng, Y.F.; Liu, Q.L.; Song, C.F.; Ji, N.; Ma, D.G. Catalytic performance of the Pd/TiO2 modified with MnOx catalyst for acetone total oxidation. Appl. Surf. Sci. 2019, 496, 143579. [Google Scholar] [CrossRef]
- Zheng, Y.F.; Zhao, Q.; Shan, C.P.; Lu, S.C.; Su, Y.; Han, R.; Song, C.F.; Ji, N.; Ma, D.G.; Liu, Q.L. Enhanced Acetone Oxidation over the CeO2/Co3O4 Catalyst Derived from Metal-Organic Frameworks. ACS Appl. Mater. Interfaces 2020, 12, 28139–28147. [Google Scholar] [CrossRef] [PubMed]
- Wang, L.; Sun, Y.; Zhu, Y.; Zhang, J.; Ding, J.; Gao, J.; Ji, W.; Li, Y.; Wang, L.; Ma, Y. Revealing the mechanism of high water resistant and excellent active of CuMn oxide catalyst derived from Bimetal-Organic framework for acetone catalytic oxidation. J. Colloid Interface Sci. 2022, 622, 577–590. [Google Scholar] [CrossRef] [PubMed]
Figure 1.
Catalytic behaviors of α-MnO2, β-MnO2, and γ-MnO2 towards acetone oxidation. (a) Acetone conversion and (b) CO2 yield under dry conditions. (c) Acetone conversion curves and (d) CO2 yield curves of α-MnO2 with different preparation methods.
Figure 1.
Catalytic behaviors of α-MnO2, β-MnO2, and γ-MnO2 towards acetone oxidation. (a) Acetone conversion and (b) CO2 yield under dry conditions. (c) Acetone conversion curves and (d) CO2 yield curves of α-MnO2 with different preparation methods.

Figure 2.
Effect of WHSV on (a) the acetone conversion and (b) the CO2 yield over MnO2-WN. (c) Long-term stability tests of α-MnO2 and MnO2-WN at 150 °C. (d) Typical VOC conversion curves of MnO2-WN.
Figure 2.
Effect of WHSV on (a) the acetone conversion and (b) the CO2 yield over MnO2-WN. (c) Long-term stability tests of α-MnO2 and MnO2-WN at 150 °C. (d) Typical VOC conversion curves of MnO2-WN.


Figure 3.
The nitrogen adsorption-desorption isotherms (star: adsorption; ball: desorption) and pore size distribution curves of (a) α-MnO2, (b) β-MnO2, (c) γ-MnO2, (d) MnO2-WN, and (e) MnO2-WK. (f) XRD spectra of α-MnO2, β-MnO2, γ-MnO2, MnO2-WN, and MnO2-WK. (g) SEM images of MnO2-WN (g1,g2), MnO2-WK (g3,g4), and α-MnO2 (g5,g6).


Figure 4.
XPS spectra of (a) Mn 2p, (b) Mn 3s, and (c) O 1s for α-MnO2, MnO2-WK, MnO2-WN, and MnO2-WN-S.
Figure 4.
XPS spectra of (a) Mn 2p, (b) Mn 3s, and (c) O 1s for α-MnO2, MnO2-WK, MnO2-WN, and MnO2-WN-S.

Figure 5.
(a) H2-TPR, (b) CO2-TPD, (c) NH3-TPD, and (d) O2-TPD profiles of α-MnO2, MnO2-WK, and MnO2-WN.
Figure 5.
(a) H2-TPR, (b) CO2-TPD, (c) NH3-TPD, and (d) O2-TPD profiles of α-MnO2, MnO2-WK, and MnO2-WN.

Figure 6.
(a) EPR of the oxygen vacancies on MnO2-WK and MnO2-WN. (b) Raman spectra of the MnO2-WK and MnO2-WN.
Figure 6.
(a) EPR of the oxygen vacancies on MnO2-WK and MnO2-WN. (b) Raman spectra of the MnO2-WK and MnO2-WN.

Figure 7.
(a) In situ DRIFTS spectra of acetone adsorption over MnO2-WN at 50 °C at different times in the absence of O2. (b) In situ DRIFTS spectra of acetone catalytic oxidation over MnO2-WN at different temperatures in the presence of O2.
Figure 7.
(a) In situ DRIFTS spectra of acetone adsorption over MnO2-WN at 50 °C at different times in the absence of O2. (b) In situ DRIFTS spectra of acetone catalytic oxidation over MnO2-WN at different temperatures in the presence of O2.

Figure 8.
The plausible reaction path of acetone oxidation over MnO2-WN.


Table 1.
The conversion temperature of acetone oxidation over all catalysts.
| Catalyst | T10 (°C) | T50 (°C) | T90 (°C) |
|---|---|---|---|
| α-MnO2 | 44 | 154 | 175 |
| β-MnO2 | 101 | 169 | 209 |
| γ-MnO2 | 49 | 179 | 222 |
| MnO2-WK | 40 | 126 | 147 |
| MnO2-WN | 35 | 117 | 132 |
Table 2.
Textural properties of the synthesized catalysts.
| Catalyst | Crystallite Size (nm) | BET Surface Area a (m2/g) | Total Pore Volume b (cm3/g) | Avg. Pore Diameter b (nm) |
|---|---|---|---|---|
| α-MnO2 | 15 | 45.68 | 0.15 | 13.7 |
| β-MnO2, | 27 | 13.29 | 0.05 | 14.8 |
| γ-MnO2 | 21 | 36.11 | 0.25 | 18.1 |
| MnO2-WN | 19 | 90.03 | 0.22 | 10.1 |
| MnO2-WK | 17 | 126.37 | 0.25 | 8.0 |
a BJH desorption cumulative pore volume. b BJH desorption average pore diameter.
Table 3.
Distribution of Mn ions and O species of α-MnO2, MnO2-WK, MnO2-WN, and MnO2-WN-S based on XPS results.
Table 3.
Distribution of Mn ions and O species of α-MnO2, MnO2-WK, MnO2-WN, and MnO2-WN-S based on XPS results.
| Catalyst | Mn3+ (%) | Mn4+ (%) | AOS | Oads. (%) | Olatt. (%) |
|---|---|---|---|---|---|
| α-MnO2 | 62.8 | 37.2 | 3.65 | 20.7 | 79.3 |
| MnO2-WK | 64.5 | 35.5 | 3.55 | 44.1 | 55.9 |
| MnO2-WN | 69.5 | 30.5 | 3.42 | 36.0 | 64.0 |
| MnO2-WN-S | 65.9 | 34.1 | 3.52 | 58.5 | 41.5 |
Table 4.
Uptake of H2 and O2 by synthesized catalysts (semi-quantitative, expressed by peak area).
| Catalyst | H2 | O2 |
|---|---|---|
| α-MnO2 | 16674491 | 6596 |
| MnO2-WK | 17237837 | 8896 |
| MnO2-WN | 17549969 | 9119 |
Disclaimer/Publisher’s Note: The statements, opinions and data contained in all publications are solely those of the individual author(s) and contributor(s) and not of MDPI and/or the editor(s). MDPI and/or the editor(s) disclaim responsibility for any injury to people or property resulting from any ideas, methods, instructions or products referred to in the content. |
© 2024 by the authors. Licensee MDPI, Basel, Switzerland. This article is an open access article distributed under the terms and conditions of the Creative Commons Attribution (CC BY) license (https://creativecommons.org/licenses/by/4.0/).
Share and Cite
MDPI and ACS Style
Cai, B.; Lin, F.; Guo, X.; Li, Y. Catalytic Acetone Oxidation over MnOx Catalysts: Regulating Their Crystal Structures and Surface Properties. Processes 2024, 12, 326. https://doi.org/10.3390/pr12020326
AMA Style
Cai B, Lin F, Guo X, Li Y. Catalytic Acetone Oxidation over MnOx Catalysts: Regulating Their Crystal Structures and Surface Properties. Processes. 2024; 12(2):326. https://doi.org/10.3390/pr12020326
Chicago/Turabian StyleCai, Bohang, Fawei Lin, Xuan Guo, and Yongtao Li. 2024. "Catalytic Acetone Oxidation over MnOx Catalysts: Regulating Their Crystal Structures and Surface Properties" Processes 12, no. 2: 326. https://doi.org/10.3390/pr12020326
Note that from the first issue of 2016, this journal uses article numbers instead of page numbers. See further details here.