
Spatial and Temporal Dynamics of the Vegetation Cover from the Bijagual Massif, Boyacá, Colombia, during the 1986–2021 Period

 , ,
, ,  ,
,  , and
, and
Abstract
:1. Introduction
2. Results
2.1. Land Covers—Field Verification
2.2. Classification Accuracy
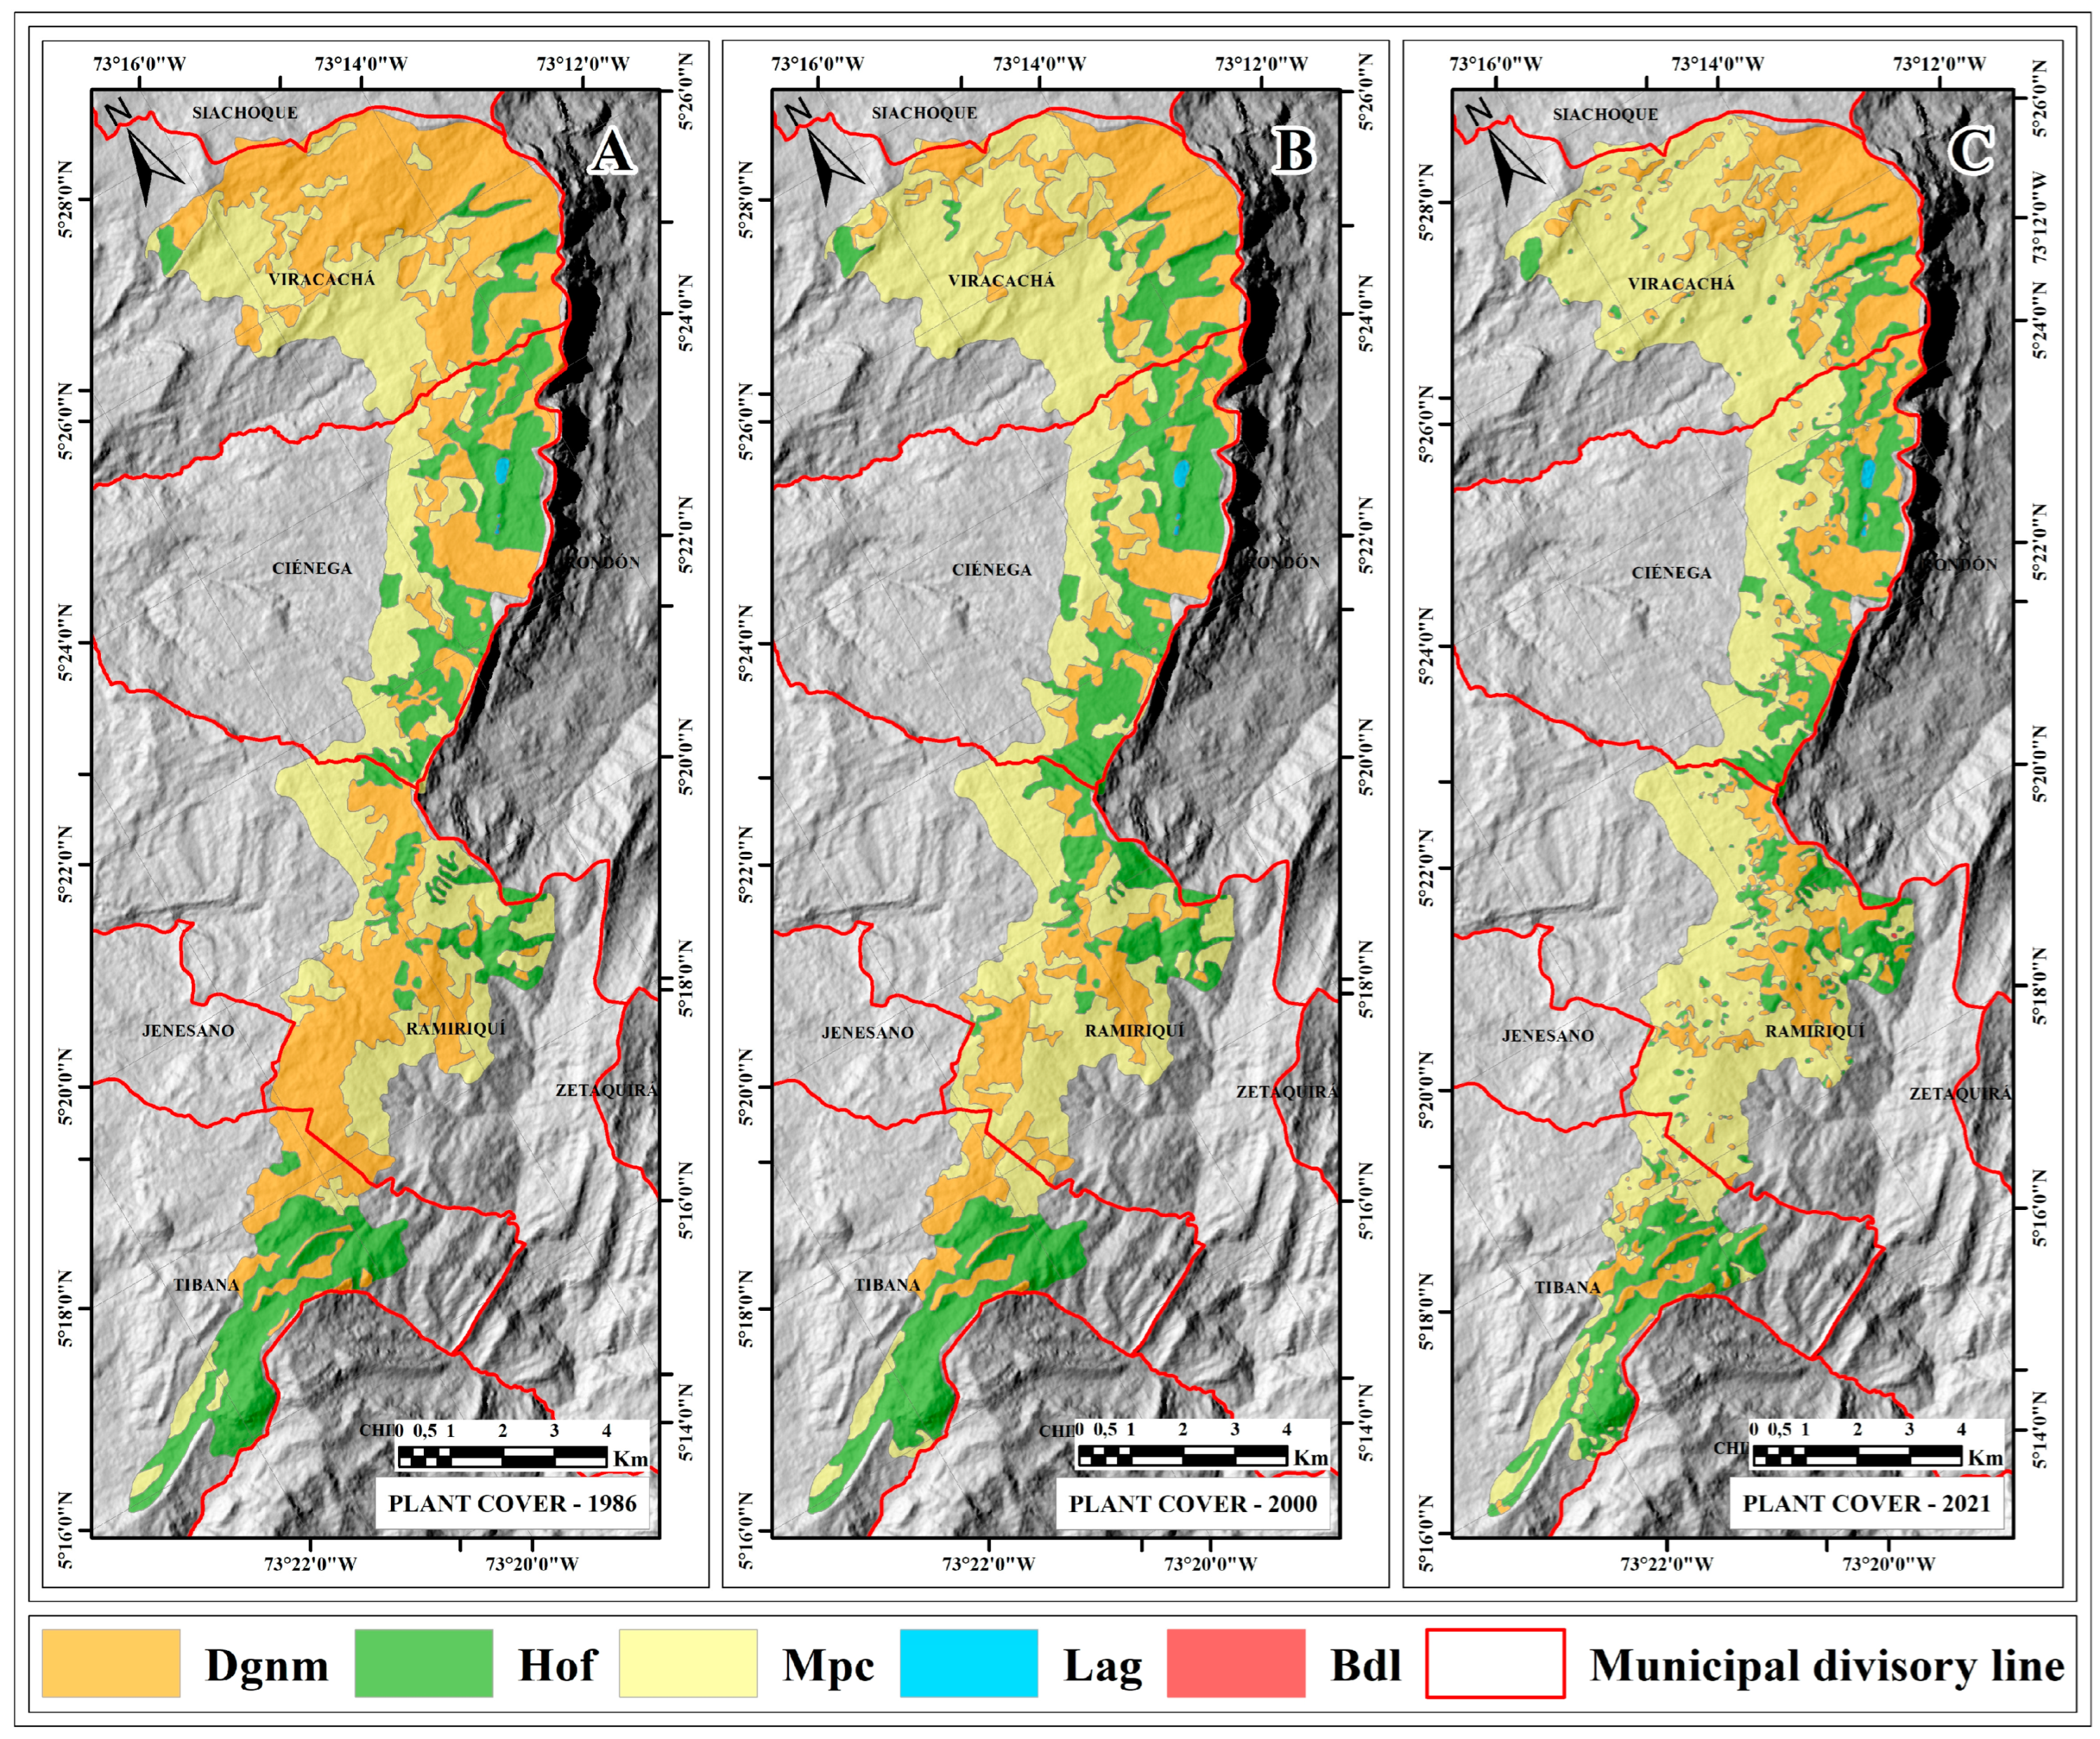
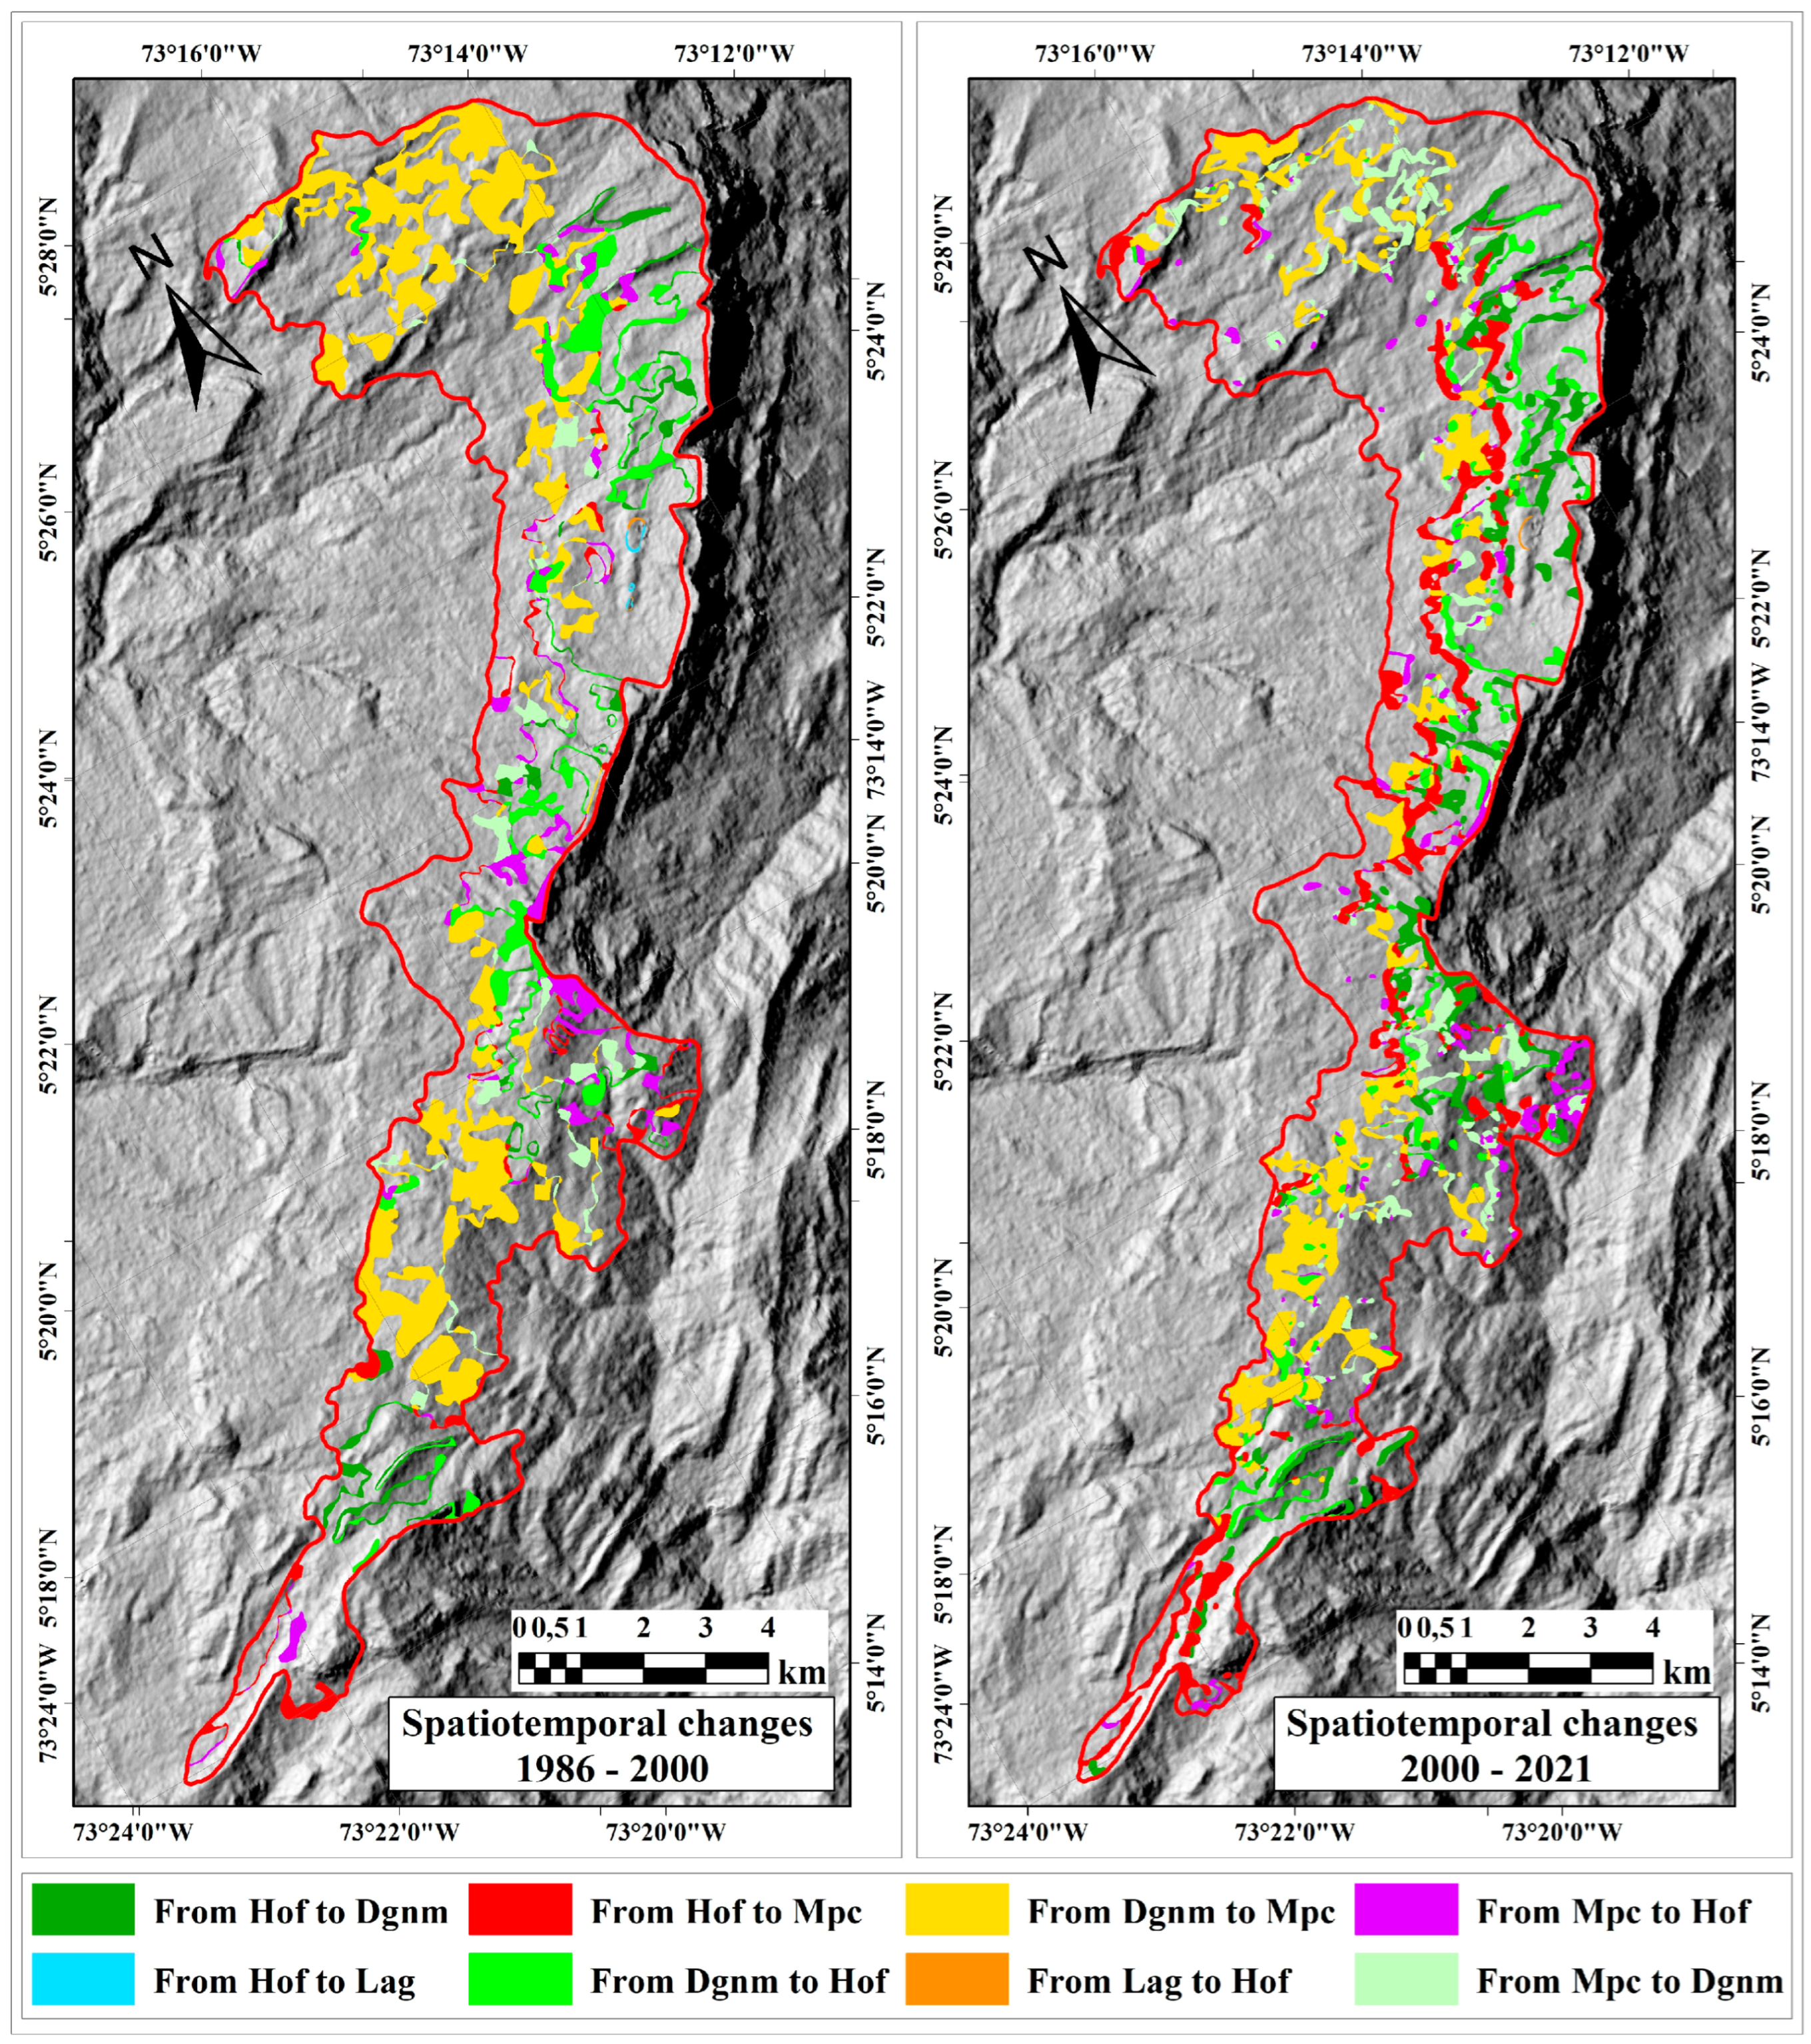
2.3. Multitemporal Dimension
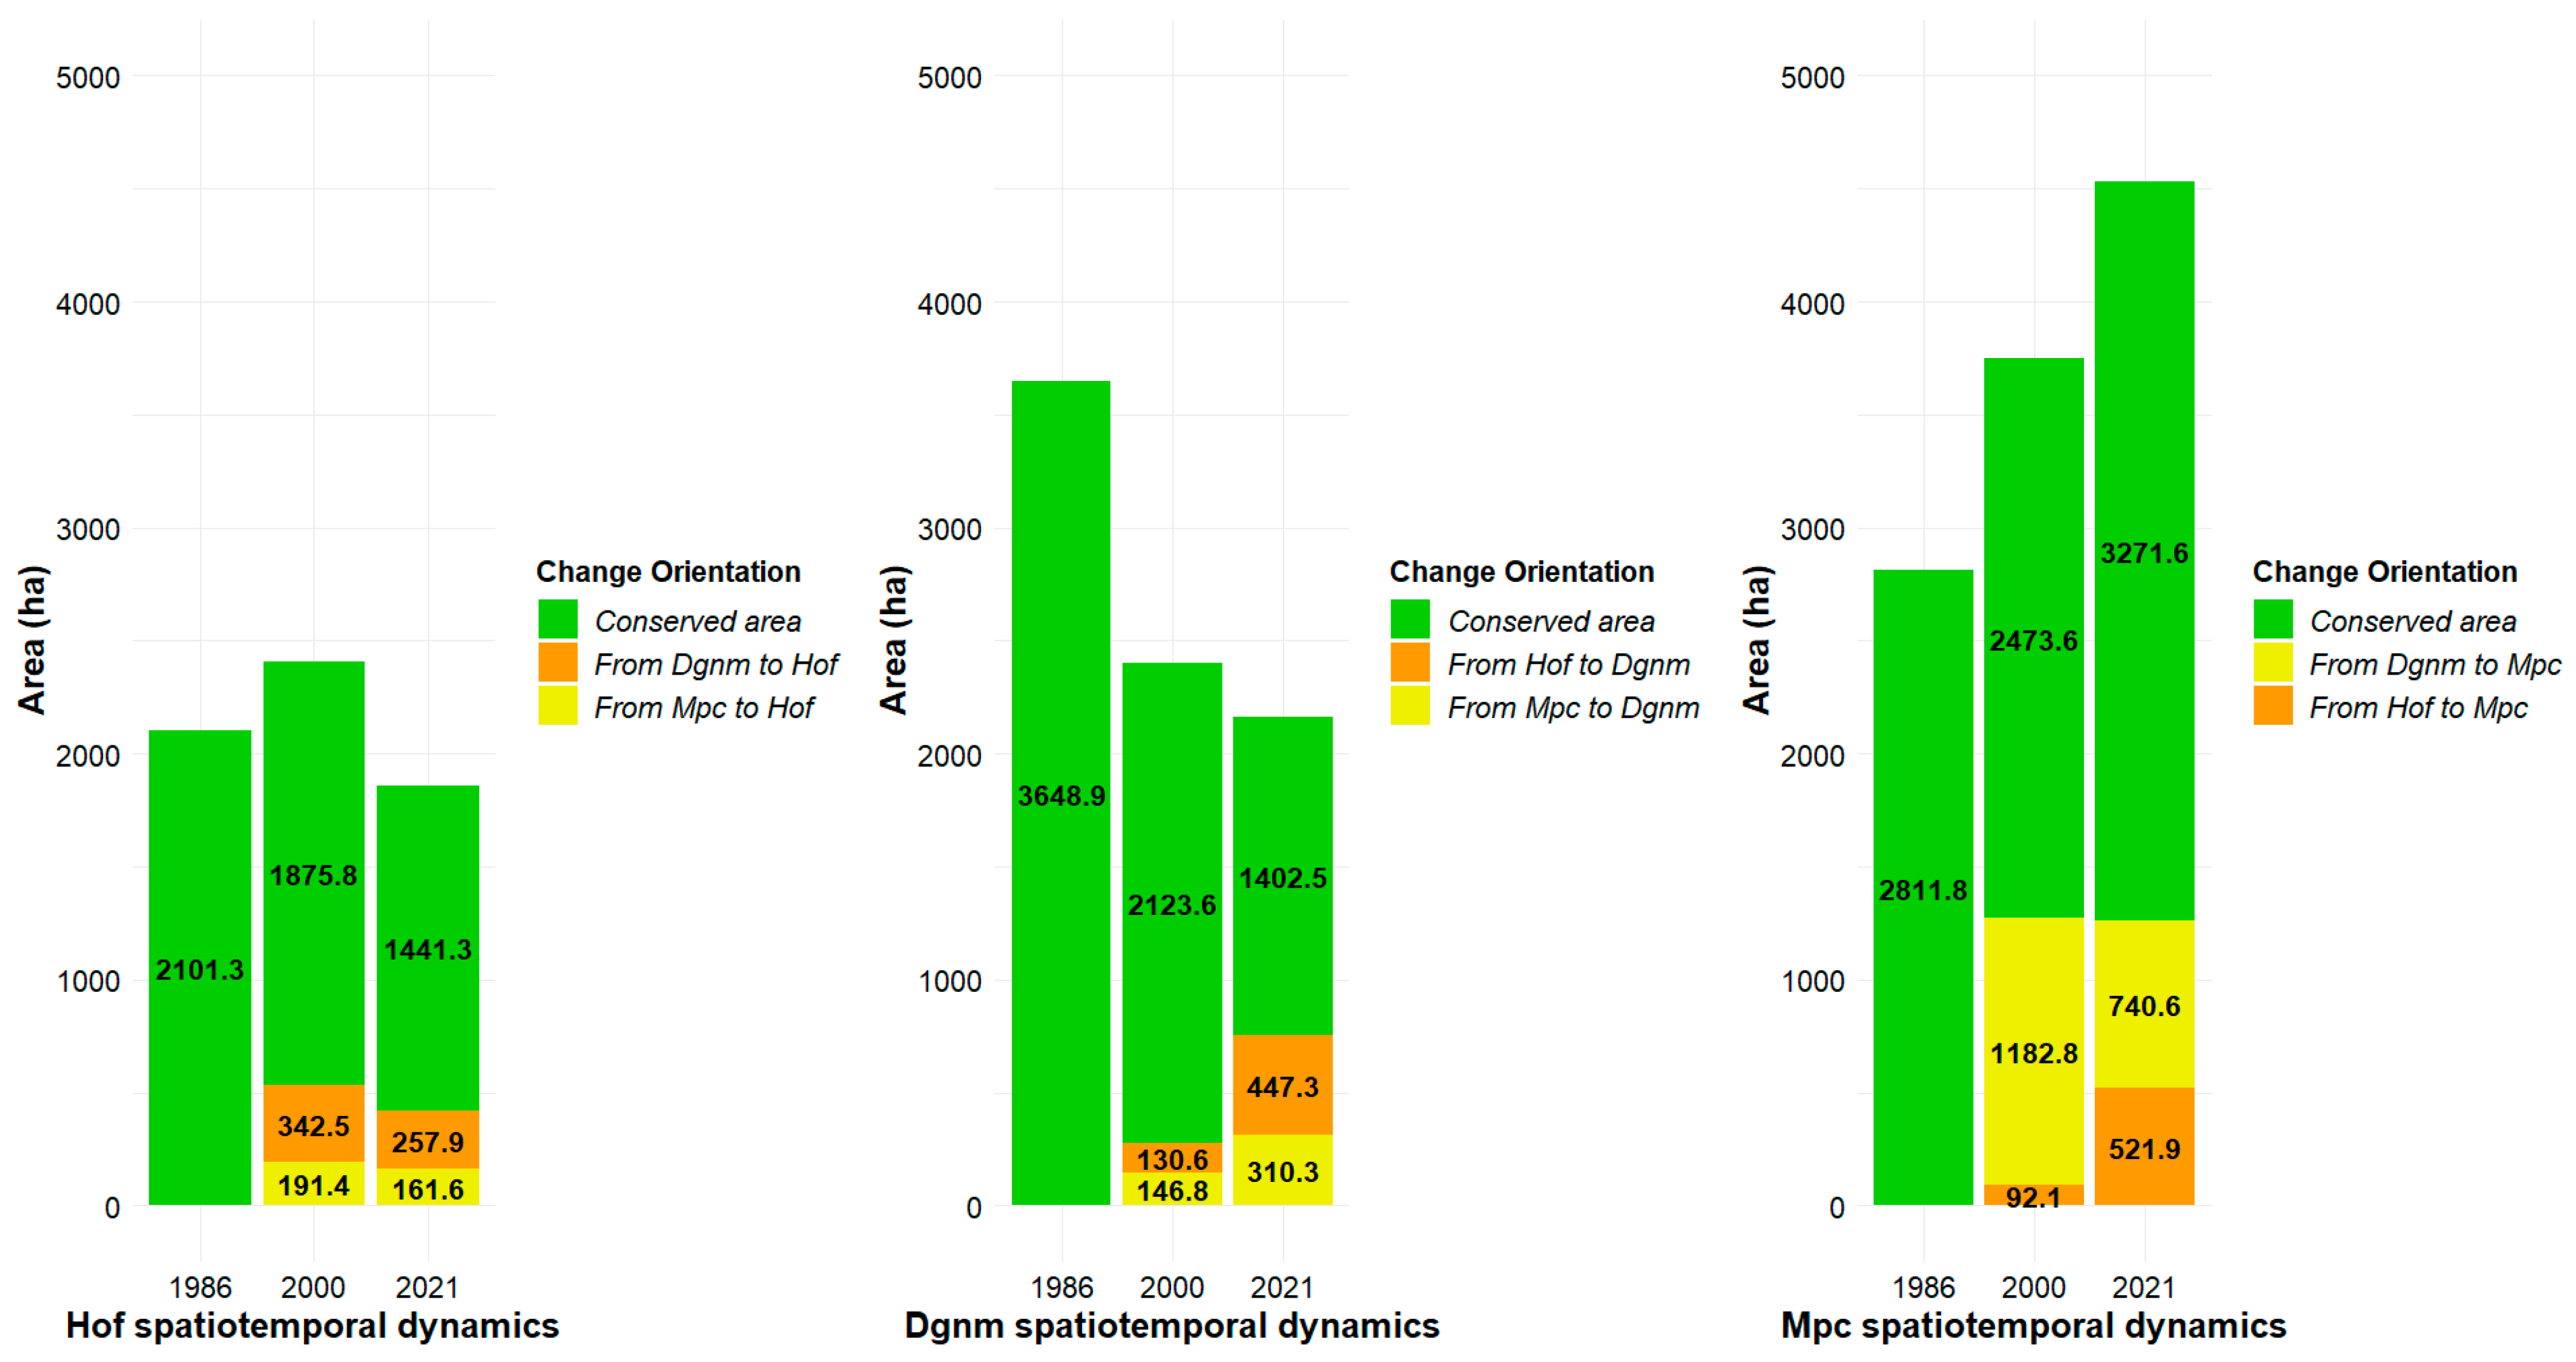
2.3.1. Space-Time Changes in High Open Forest (Hof) Coverage
2.3.2. Space-Time Changes in Dense Grassland of Non-Wooded Mainland (Dgnm) Coverage
2.3.3. Space-Time Changes in Mosaic of Pastures and Crops (Mpc) Coverage
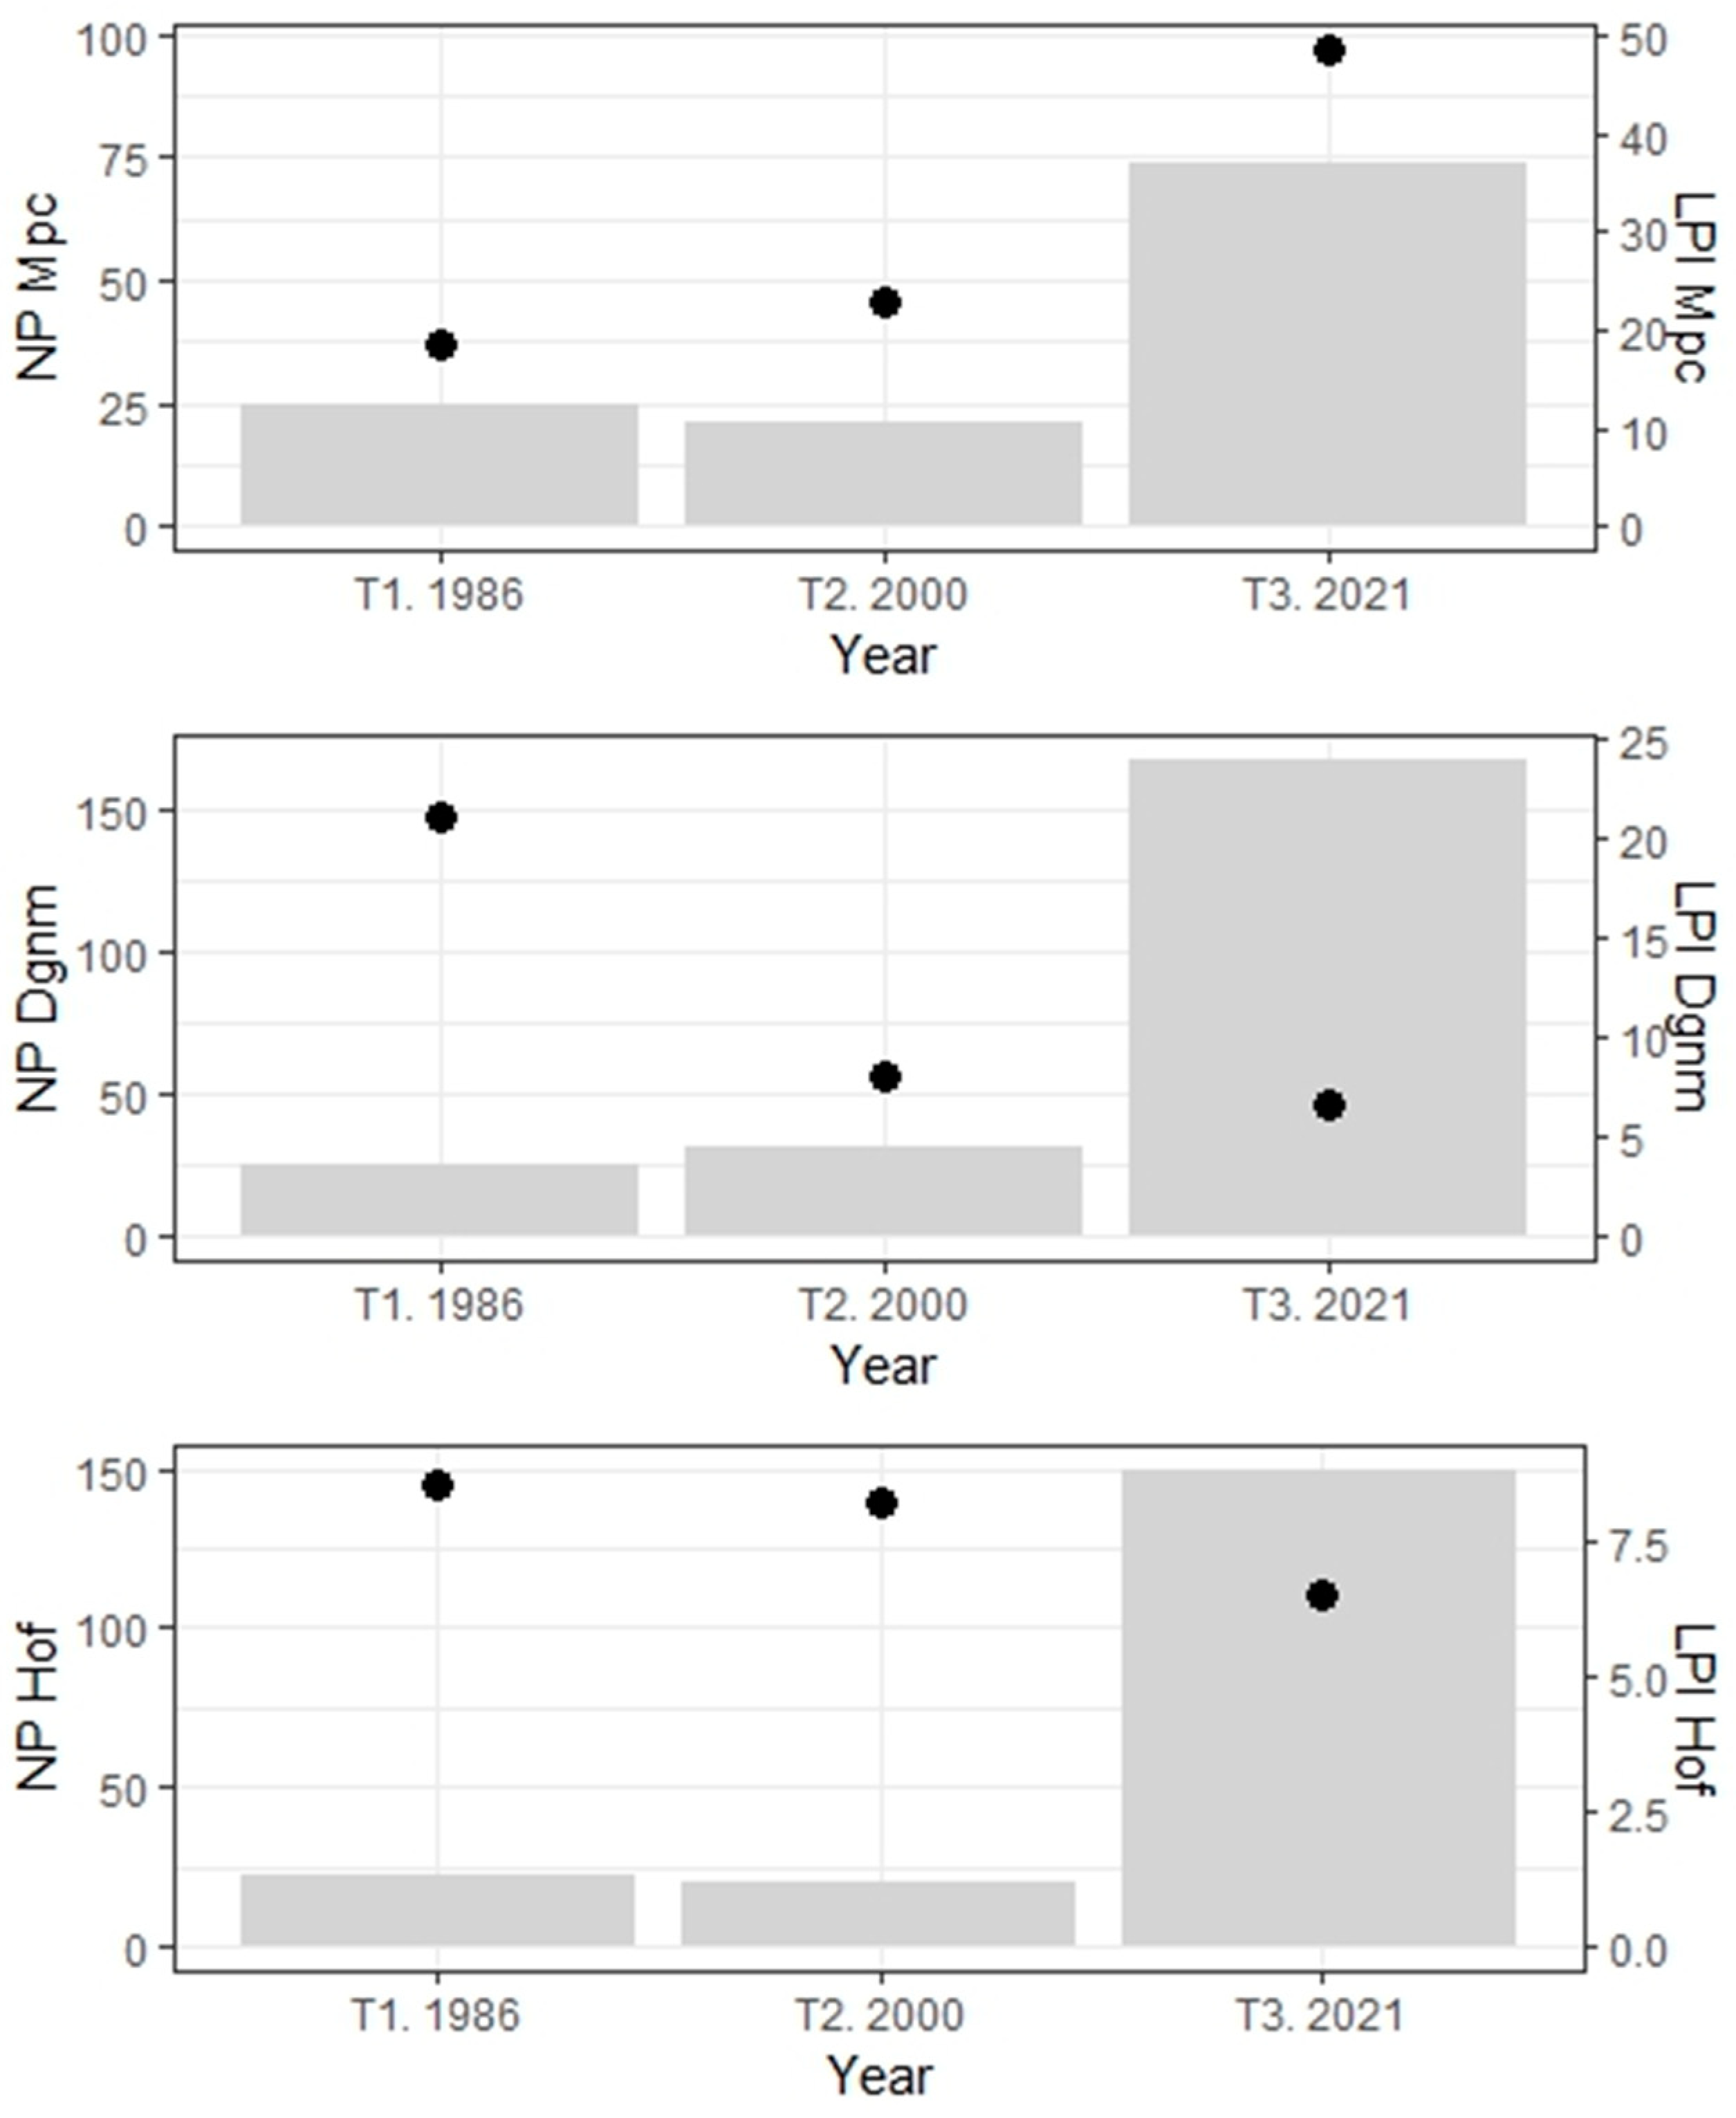
2.3.4. Diversity
2.3.5. Composition
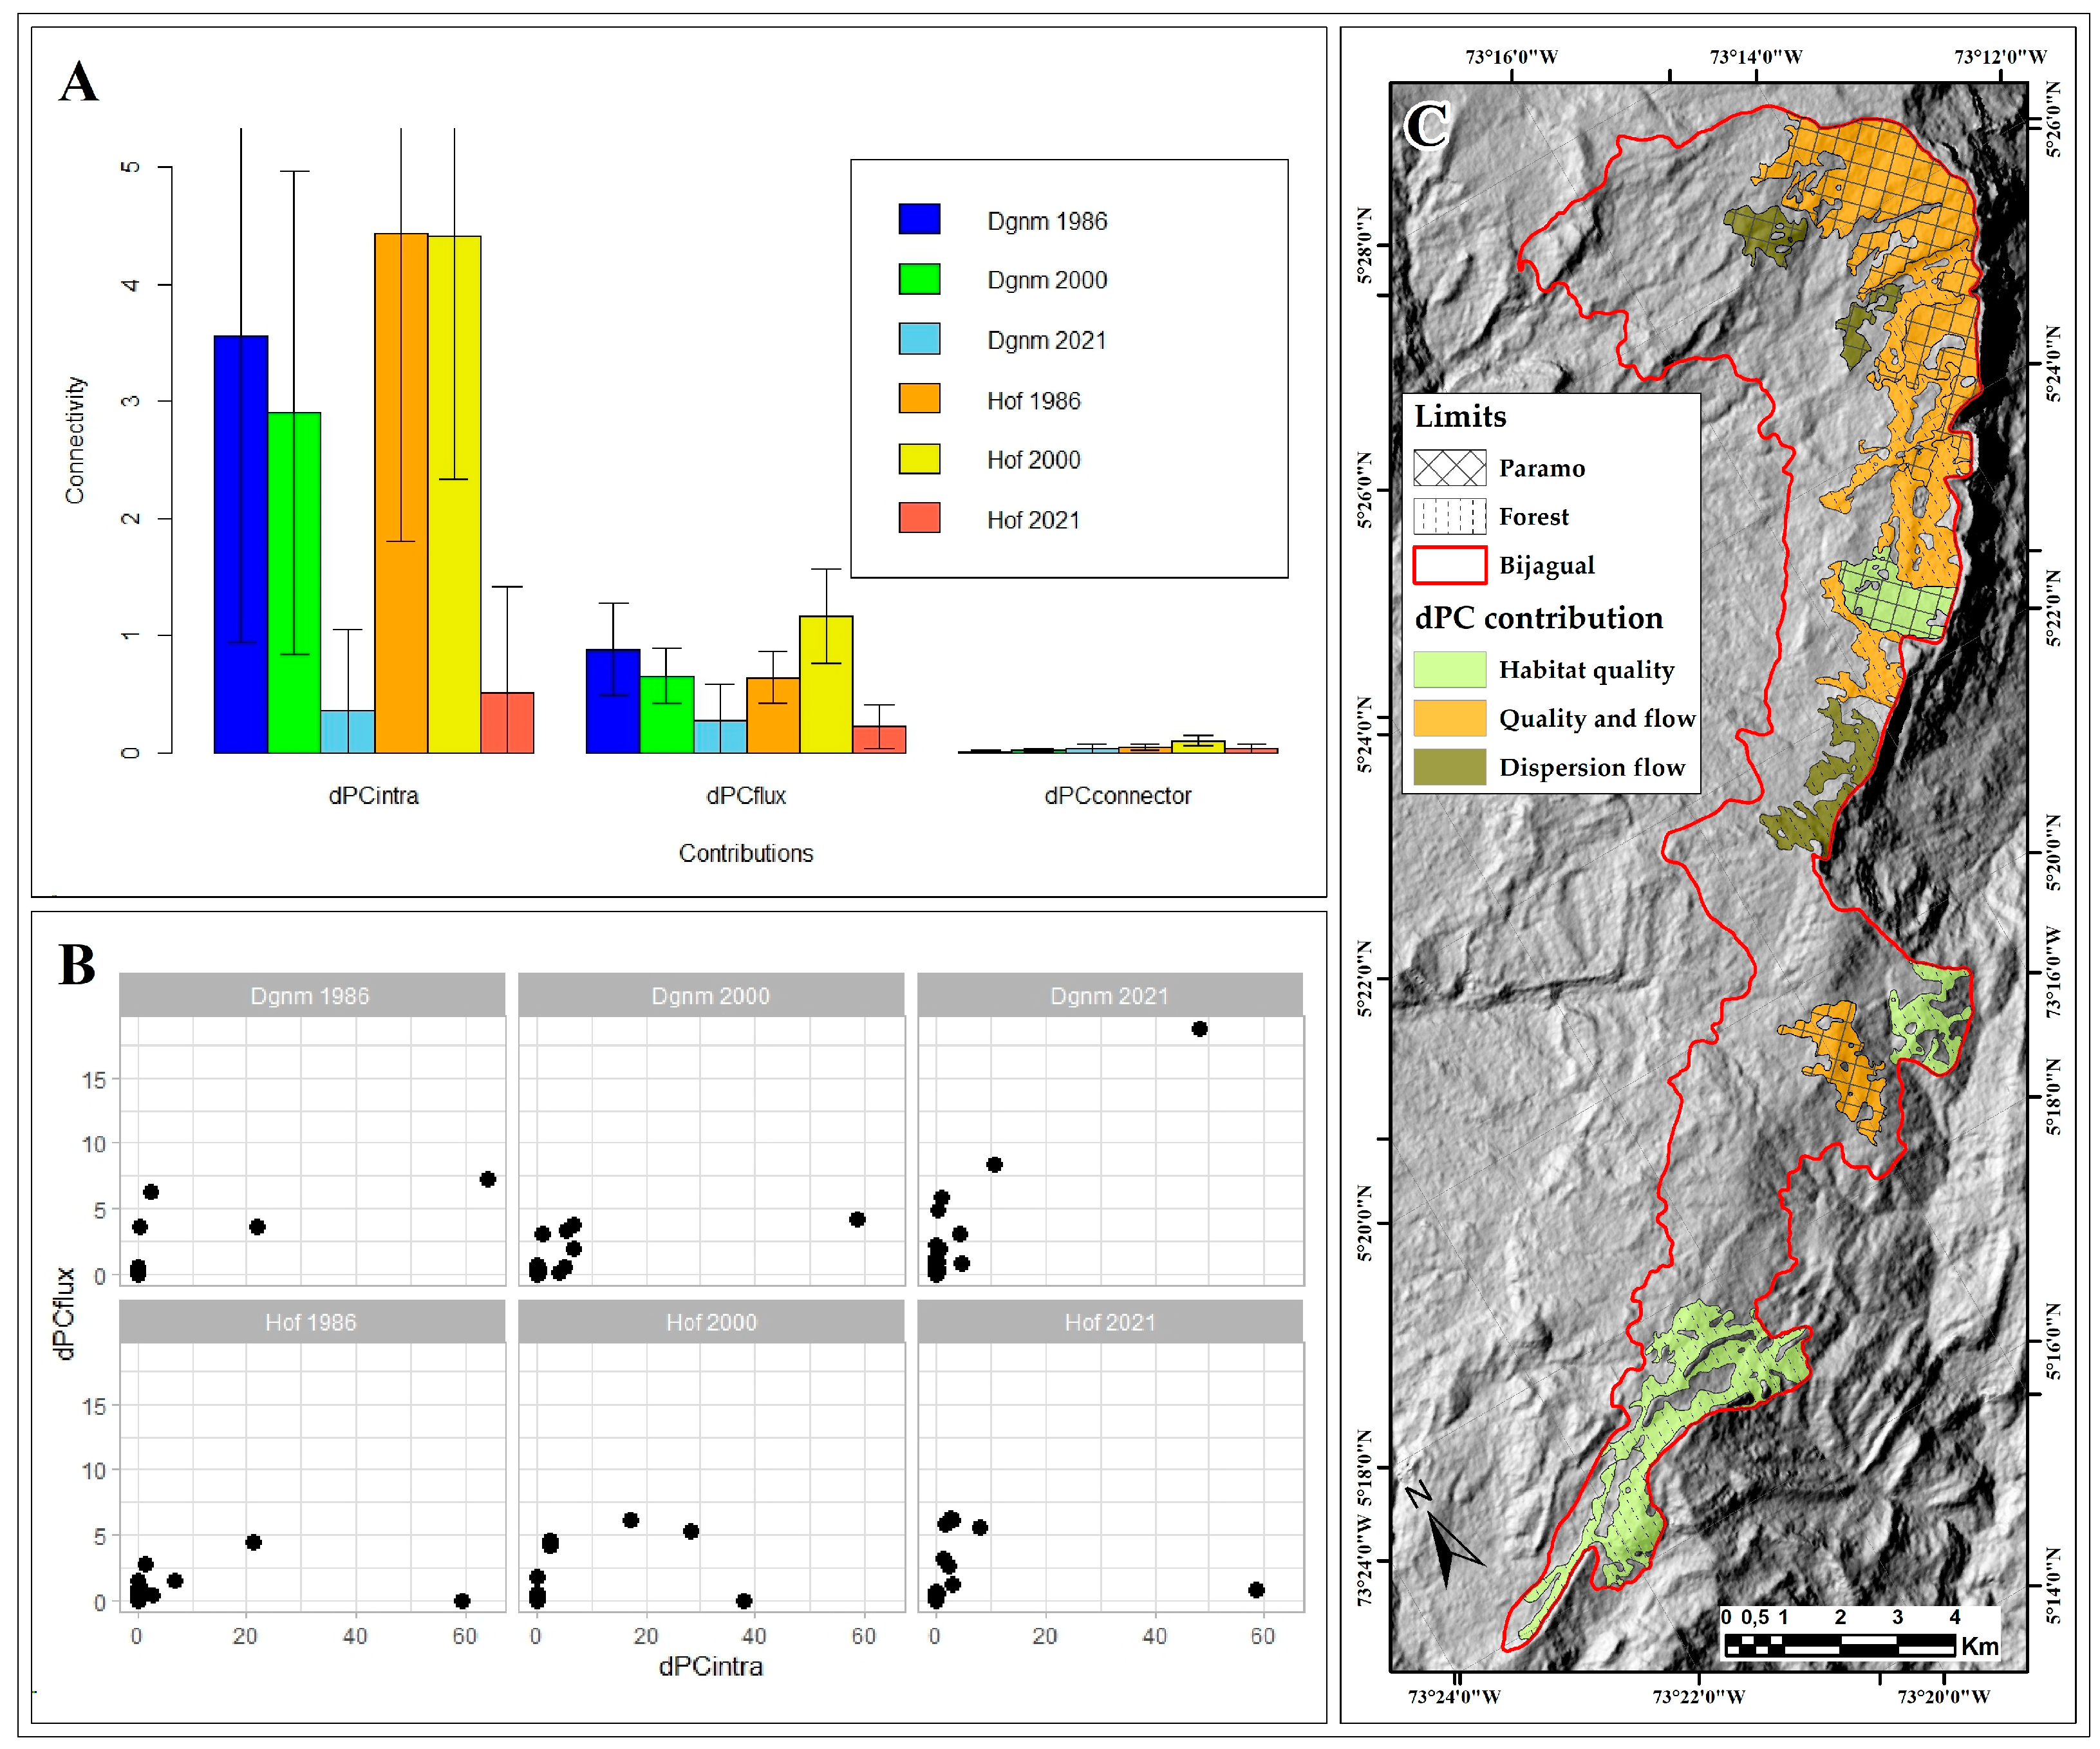
2.3.6. Connectivity
3. Discussion
3.1. Land Cover—Field Verification
3.2. Classification Accuracy
3.3. Multitemporal Dimension
4. Materials and Methods
4.1. Study Area
4.2. Data Source
4.3. Geometric Correction
4.4. General Contrasts (Spatial Enhancement)
4.5. Land Covers (Thematic Categorization)—Field Verification
4.6. Classification Accuracy
4.6.1. Producer Accuracy
4.6.2. User Accuracy
4.6.3. Kappa Coefficient
4.7. Multitemporal Dimension (Landscape Metrics)
4.7.1. Diversity
4.7.2. Composition
4.7.3. Connectivity
Author Contributions
Funding
Data Availability Statement
Acknowledgments
Conflicts of Interest
References
- Alzate, F.; Jiménez-Montoya, J.; Sarrazola, H. Sonsón, un nuevo complejo de paramos en Colombia. In Flora del Oriente Antioqueño. Biodiversidad, Ecología y Estrategias de Conservación; Quijano-Abril, M.A., Ed.; Fondo Editorial Universidad Católica de Oriente: Bogotá, Colombia, 2016; pp. 19–24. [Google Scholar]
- Jiménez-Rivillas, C.; García, J.J.; Quijano-Abril, M.A.; Daza, J.M.; Morrone, J.J. A new biogeographical regionalisation of the Paramo biogeographic province. Aust. Syst. Bot. 2018, 31, 296–310. [Google Scholar] [CrossRef]
- Cuesta, F.; Muriel, P.; Llambí, L.D.; Halloy, S.; Aguirre, N.; Beck, S.; Carilla, J.; Meneses, R.I.; Cuello, S.; Grau, A.; et al. Latitudinal and altitudinal patterns of plant community diversity on mountain summits across the tropical Andes. Ecography 2017, 40, 001–014. [Google Scholar] [CrossRef]
- Fadrique, B.; Báez, S.; Duque, Á.; Malizia, A.; Blundo, C.; Carilla, J.; Osinaga-Acosta, O.; Malizia, L.; Silman, M.; Farfán-Ríos, W.; et al. Widespread but heterogeneous responses of Andean forests to climate change. Nature 2018, 564, 207–212. [Google Scholar] [CrossRef]
- Llambí, L.D.; Cuesta, F. La diversidad de los páramos andinos en el espacio y en el tiempo. In Avances en Investigación Para la Conservación de los Páramos Andinos; Cuesta, F.J., Sevink, L., Llambí, B., Posner, J., Eds.; CONDESAN: Quito, Ecuador, 2014; pp. 8–39. [Google Scholar]
- Suárez Duque, D. Formación de un corredor de hábitat de un bosque montano alto en un mosaico de paramo en el norte del Ecuador. Ecol. Apl. 2008, 7, 9–15. [Google Scholar] [CrossRef]
- Rangel-Ch, J.O. La riqueza de las plantas con flores de Colombia. Caldasia 2015, 37, 279–307. [Google Scholar] [CrossRef]
- Abud, M.; Torres, A.M. Caracterización florística de un bosque alto andino en el Parque Nacional Natural Puracé, Cauca, Colombia. Boletín Científico Mus. Hist. Nat. 2016, 20, 27–39. [Google Scholar] [CrossRef]
- Llambí, L.D.; Soto, A.; Celleri, R.; De Bievre, B.; Ochoa, B.; Borja, P. Paramos Andinos: Ecología, Hidrología y Suelos de Paramos; Monsalve Moreno: Bogotá, Colombia, 2012; p. 283. [Google Scholar]
- Rincón-Ruíz, A.; Echeverry-Duque, M.; Piñeros, A.M.; Tapia, C.H.; David, A.; Arias-Arévalo, P.; Zuluaga, P.A. Valoración Integral de la Biodiversidad y los Servicios Ecosistémicos: Aspectos Conceptuales y Metodológicos; Instituto de Investigación de Recursos Biológicos Alexander von Humboldt (IAvH): Bogotá, Colombia, 2014; p. 151. [Google Scholar]
- Nieto, M.; Cardona, L.; Agudelo, C. Análisis de servicios ecosistémicos. Provisión y regulación hídrica. In Hojas de Ruta. Guías Para el Estudio Socioecológico de la Alta Montaña en COLOMBIA; Ungar, P., Ed.; Instituto de Investigación de Recursos Biológicos Alexander von Humboldt: Bogotá, Colombia, 2015; pp. 1–95. [Google Scholar]
- Salas-Zapata, W.; Ríos-Osorio, L.V.; Álvarez, J. Bases conceptuales para una clasificación de los sistemas socioecológicos de la investigación en sostenibilidad. Rev. Lasallista Investig. 2012, 8, 136–142. [Google Scholar]
- Uribe-Castro, H. De ecosistema a socioecosistema diseñado como territorio del capital agroindustrial y del Estado-nación moderno en el valle geográfico del río Cauca, Colombia. Rev. Colomb. Sociol. 2014, 37, 121–157. [Google Scholar]
- Gao, Q.; Guo, Y.; Xu, H.; Ganjurjav, H.; Li, Y.; Wan, Y.; Qin, X.; Ma, X.; Liu, S. Climate change and its impacts on vegetation distribution and net primary productivity of the alpine ecosystem in the Qinghai-Tibetan Plateau. Sci. Total Environ. 2016, 554–555, 34–41. [Google Scholar] [CrossRef]
- Ometto, J.P.; Kalaba, K.; Anshari, G.Z.; Chacón, N.; Farrell, A.; Halim, S.A.; Neufeldt, H.; Sukumar, R. Cross- Chapter Paper 7: Tropical Forests. In Climate Change 2022: Impacts, Adaptation, and Vulnerability. Contribution of Working Group II to the Sixth Assessment Report of the Intergovernmental Panel on Climate Change; Pörtner, H.O., Roberts, D.C., Tignor, M., Poloczanska, E.S., Mintenbeck, K., Alegría, A., Craig, M.S., Langsdorf, S., Löschke, V., Möller, A., et al., Eds.; Cambridge University Press: Cambridge, UK; New York, NY, USA, 2022; pp. 2369–2410. [Google Scholar]
- Reyes-Palomino, S.E.; Cano Ccoa, D.M. Efectos de la agricultura intensiva y el cambio climático sobre la biodiversidad. Rev. Investig. Altoandinas 2022, 24, 53–64. [Google Scholar] [CrossRef]
- López, E.I. El Cambio Climático y la Gestión de Páramos. CAMAREN. Available online: http://www.camaren.org/documents/cambioclimatico.pdf (accessed on 13 December 2019).
- Añarumba Ulloa, J.L.; Toapanta Grefa, F.M. Monitoreo e Identificación de Cambios de la Vegetación a lo Largo del Gradiente Altitudinal en la Zona Baja del Páramo de la Reserva Ecológica los Ilinizas. Bachelor’s Thesis, Universidad Técnica de Cotopaxi (UTC), Latacunga, Ecuador, 2023. [Google Scholar]
- Porter-Bolland, L.; Ellis, E.A.; Guariguata, M.R.; Ruiz-Mallén, I.; Negrete-Yankelevich, S.; Reyes-García, V. Community managed forest and forest protected areas: An assessment of their conservation effectiveness across the tropics. For. Ecol. Manag. 2012, 268, 6–17. [Google Scholar] [CrossRef]
- Arellano, P.H.; Rangel-Ch, J.O. Fragmentación y estado de conservación en algunos paramos de Colombia. In Colombia, Diversidad Biótica X, Cambio Global (Natural) y Climático (antrópico) en el Páramo Colombiano; Rangel, J.O., Ed.; Universidad Nacional de Colombia: Bogotá, Colombia, 2010; pp. 479–542. [Google Scholar]
- Moncada-Rasmussen, D. Análisis espacio-temporal del cambio en los bosques de roble (Quercus humboldtii Bonpl.) y su relación con la alfarería en Aguabuena (Ráquirá–Boyacá). Colomb. For. 2010, 13, 275–298. [Google Scholar] [CrossRef]
- Chuvieco, E. Teledetección Ambiental, la Observación de la Tierra Desde el Espacio; Editorial Ariel, S.A.: Barcelona, Spain, 2002; p. 586. [Google Scholar]
- Chapin, F.S.; Matson, P.A.; Vitousek, P.M. Principles of Terrestrial Ecosystem Ecology, 2nd ed.; Springer Science+Business Media: New York, NY, USA, 2011; p. 392. [Google Scholar]
- McDonald, A.J.; Gemmell, F.M.; Lewis, P.E. Investigation of the utility of spectral vegetation indices for determining Information on Coniferous Forests. Remote Sens. Environ. 1998, 66, 250–272. [Google Scholar] [CrossRef]
- Hantson, S.; Chuvieco, E.; Pons, X.; Domingo, C.; Cea, C.; More, G.; Cristobal, J.; Peces, J.; Tejeiro, J. Cadena de pre-procesamiento estándar para las imágenes Landsat del Plan Nacional de Teledetección. Rev. Teledetección 2011, 36, 51–61. [Google Scholar]
- Coops, N.C.; Tooke, T.R. Introduction to remote sensing. In Learning Landscape Ecology. A Practical Guide to Concepts and Techniques; Gergel, S.E., Turner, M.G., Eds.; Springer: New York, NY, USA, 2017; pp. 3–20. [Google Scholar]
- Morales, M.; Otero, J.; van der Hammen, T.; Torres, A.; Cadena, C.; Pedraza, C.; Cárdenas, L. Atlas de Paramos de Colombia; Instituto de Investigación de Recursos Biológicos Alexander von Humboldt: Bogotá, Colombia, 2007; p. 208. [Google Scholar]
- Etter, A.; McAlpine, C.; Wilson, K.; Phinn, S.; Possingham, H. Regional patterns of agricultural land use and deforestation in Colombia. Agric. Ecosyst. Environ. 2006, 114, 369–386. [Google Scholar] [CrossRef]
- Sánchez-Cuervo, A.M.; Aide, M.; Clark, M.; Etter, A. Land Cover Change in Colombia: Surprising Forest Recovery Trends between 2001 and 2010. PLoS ONE 2012, 7, e43943. [Google Scholar] [CrossRef]
- López, A.; Caicedo, E.; Mojica, J.A.; López Bermúdez, D.A. Paramos. Altas Temperaturas y Depredación Aceleran su Muerte. Available online: https://www.eltiempo.com/vida/medio-ambiente/paramos-asi-los-afecta-el-cambio-climatico-mineria-agricultura-y-conflicto-791673 (accessed on 13 September 2023).
- Pérez, M.E.; García, M. Aplicaciones de la teledetección en degradación de suelos. Boletín Asoc. Geógrafos Españoles 2013, 61, 285–308. [Google Scholar]
- Saura, S. Métodos y herramientas para el análisis de la conectividad del paisaje y su integración en los planes de conservación. In Avances en el Análisis Espacial de datos Ecológicos: Aspectos Metodológicos y Aplicados; De la Cruz, M., Maestre, F.M., Eds.; ECESPA-Asociación Española de Ecología Terrestre: Móstoles, Spain; España: Móstoles, Spain, 2013; pp. 2–46. [Google Scholar]
- IDEAM. Leyenda Nacional de Coberturas de la Tierra Corine Land Cover Adaptada para Colombia, Escala 1:100.000; Instituto de Hidrología, Meteorología y Estudios Ambientales. Editorial Scripto Ltda.: Bogotá, Colombia, 2010; p. 72. [Google Scholar]
- Gil-Leguizamón, P.A.; Morales-Puentes, M.E.; Jácome, J. Estructura del bosque altoandino y paramo en el Macizo de Bijagual, Boyacá, Colombia. Rev. Biol. Trop. 2020, 68, 765–776. [Google Scholar] [CrossRef]
- Gil-Leguizamón, P.A.; Morales-Puentes, M.E.; Carrillo-Fajardo, M.Y. Species richness of the vascular plants of the Bijagual high Andean forest, Colombia. Acta Botánica Mex. 2021, 128, e1869. [Google Scholar]
- Pinto Zárate, J. La Vegetación de la Región de Vida Paramuna Colombiana: Con Énfasis en la Cordillera Oriental y los Andes Centrales. Ph.D. Thesis, Universidad Nacional de Colombia, Bogotá, Colombia, 2023. [Google Scholar]
- Carrillo, M.Y.; Morales-Puentes, M.E.; Gil-Leguizamón, P.A. Catálogo de la flora (angiospermas) del paramo de Bijagual, Boyacá, Colombia. Boletín Científico Cent. Mus. 2017, 21, 15–29. [Google Scholar] [CrossRef]
- Olaya-Angarita, J.A.; Díaz-Pérez, C.N.; Morales-Puentes, M.E. Composición y estructura de la transición bosque-paramo en el corredor Guantiva-La Rusia (Colombia). Rev. Biol. Trop. 2019, 67, 755–768. [Google Scholar] [CrossRef]
- Prado-Castillo, L.F.; Cárdenas-Tamayo, T.A.; Carrillo-Fajardo, M.Y. Aproximación conceptual para la restauración de ecosistemas andinos. In Restauración de Ecosistemas de Montaña: Cultura y Ecología Desde el Páramo y el Piedemonte Llanero; Prado-Castillo, L.F., Gil-Leguizamón, P.A., Sabogal-González, A., Morales-Puentes, M.E., Eds.; Editorial: Tunja, Colombia, 2018; pp. 17–30. [Google Scholar]
- Caicedo, E. Donde Había Frailejones, Bromelias y Mortiños, Hoy Hay Cebolla, Papa y Vacas. El Tiempo. Available online: https://www.eltiempo.com/vida/medio-ambiente/paramos-asi-es-como-agricultura-y-ganaderia-han-transformado-los-ecosistemas-792130 (accessed on 8 September 2023).
- Cuatrecasas, J. Aspectos de la vegetación natural de Colombia. Rev. Acad. Colomb. Cienc. 1958, 10, 221–268. [Google Scholar]
- Gil-Novoa, J.E.; Morales-Puentes, M.E.; Mercado-Gómez, J.D. Biogeographic origins and floristic affinities of the bryophytes of the Tota-Bijagual-Mamapacha complex in the Páramos of Boyacá, Colombia. Phytotaxa 2020, 477, 171–193. [Google Scholar] [CrossRef]
- Gil-Leguizamón, P.A.; Bravo-Pedraza, W.J.; Hernández-Velandia, D.R.; Moreno-Mancilla, O.F.; Morales-Alba, A.F.; Reyes Camargo, J.E.; Ovalle-Pacheco, A.L.; Muños-Avila, J.A.; Vergara, P.; Ortiz, L.; et al. Restauración ecológica del bosque altoandino en la vereda Montaya (Ventaquemada, Boyacá): Avances. In Restauración de Ecosistemas de Montaña: Cultura y Ecología Desde el Páramo y el Piedemonte Llanero; Prado-Castillo, L.F., Gil-Leguizamón, P.A., Sabogal-González, A., Morales-Puentes, M.E., Eds.; Editorial: Tunja, Colombia, 2018; pp. 139–178. [Google Scholar]
- Posada, E. Manual de Prácticas de Percepción Remota. Centro de Investigación y Desarrollo en Información Geográfica (CIAF); Instituto Geográfico Agustín Codazzi (IGAC): Bogotá, Colombia, 2012; p. 154. [Google Scholar]
- Lambin, E.; Turner, B.; Geist, H.; Agbola, S.; Angelsen, A.; Bruce, J.W.; Coomes, O.T.; Dirzo, R.; Fischer, G.; Folke, C.; et al. The causes of Land-use and Land-cover change: Moving beyond the myths. Glob. Environ. Chang. 2001, 11, 261–269. [Google Scholar] [CrossRef]
- Hansen, M.; Stehman, S.; Potatov, P.; Loveland, T.; Townshend, J.; Defries, R.; Pittman, K.; Arunarwati, B.; Stolle, F.; Steininger, M.; et al. Humid tropical forest clearing from 2000 to 2005 quantified by using multitemporal and multiresolution remotely sensed data. Proc. Natl. Acad. Sci. USA 2008, 105, 9439–9444. [Google Scholar] [CrossRef]
- Etter, A.; McAlpine, C.; Possingham, H. Historical patterns and drivers of landscape change in Colombia since 1500: A regionalized spatial approach. Ann. Assoc. Am. Geogr. 2008, 98, 2–23. [Google Scholar] [CrossRef]
- Cortés-Duque, J.; Sarmiento, C. Visión Socioecosistémica de los Páramos y la alta Montaña Colombiana: Memorias del Proceso de Definición de Criterios para la Delimitación de Paramos; Instituto de Investigación de Recursos Biológicos Alexander von Humboldt: Bogotá, Colombia, 2013; p. 235. [Google Scholar]
- Bogaert, J.; Ceulemans, R.; Salvador-Van Eysenrode, D. Decision Tree Algorithm for Detection of Spatial Processes in Landscape Transformation. Environ. Manag. 2004, 33, 62–73. [Google Scholar] [CrossRef]
- Armenteras, D.; Gast, F.; Villarreal, H. Andean Forest fragmentation and the representativeness of protected natural areas in the eastern Andes, Colombia. Biol. Conserv. 2003, 113, 245–256. [Google Scholar] [CrossRef]
- Fazey, L.; Fischer, J.; Lindenmayer, D. What do conservation biologists publish? Biol. Conserv. 2005, 124, 63–73. [Google Scholar] [CrossRef]
- Rodríguez-Eraso, N.; Armenteras-Pascual, D.; Alumbreros, J. Land use and land cover change in the Colombian Andes: Dynamics and future scenarios. J. Land Use Sci. 2013, 8, 154–174. [Google Scholar] [CrossRef]
- Buytaert, W.; Sevink, J.; Cuesta, F.; Cuesta, F.; LLambi, L.; Posner, J. Cambio Climático: La Nueva Amenaza para los Páramos. Avances en Investigación para la Conservación de los Páramos Andinos; CONDESAN: Lima, Perú, 2014; p. 525. [Google Scholar]
- Morocho, C.C.; Chuncho, G. Paramos del Ecuador, importancia y afectaciones: Una revisión. Bosques Latid. Cero 2019, 9, 71–83. [Google Scholar]
- Esquivel, J.L.M.; Marrero-Gómez, M.V.; Mancebo, J.M.G. Efectos del cambio climático en la vegetación de la alta montaña de Tenerife. Ecosistemas 2021, 30, 2189. [Google Scholar] [CrossRef]
- Biringer, J.; Guariguata, M.R.; Locatelli, B.; Pfund, J.-L.; Spanger-Siegfried, E.; Suarez, A.G.; Yeaman, S.; Jarvis, A. Biodiversity in a changing climate: A framework for assessing. Vulnerability and evaluating practical responses. In Tropical Forest and Adaptation to Climate Change: In Search of Synergies; Robledo, C., Kanninen, M., Pedroni, L., Eds.; CIFOR: Bogor, Indonesia, 2005; pp. 154–183. [Google Scholar]
- Yates, D.N.; Kittel, T.G.F.; Cannon, R.F. Comparing the correlative Holdridge model to mechanistic biogeographical models for assessing vegetation distribution response to Climatic Change. Clim. Chang. 2000, 44, 59–87. [Google Scholar] [CrossRef]
- Lugo, A.E.; Brown, S.L.; Dodson, R.; Smith, T.S.; Shugart, H.H. The Holdridge life zones of the conterminous United States in relation to ecosystem mapping. J. Biogeogr. 1999, 26, 1025–1038. [Google Scholar] [CrossRef]
- Alarcón, H.J.C.; Pabón, C.J.D. El cambio climático y la distribución espacial de las formaciones vegetales en Colombia. Colomb. For. 2013, 16, 171–185. [Google Scholar]
- Mendoza, F.; Chévez, M.; González, B. Sensibilidad de las zonas de vida de Holdridge en Nicaragua en función del cambio climático. Rev. For. Centroam. 2001, 33, 17–22. [Google Scholar]
- Villers-Ruiz, L.; Trejo-Vázquez, I. El Cambio Climático y la Vegetación en México. México: Una visión Hacia el Siglo XXI. El Cambio Climático en México. Instituto Nacional de Ecología. Universidad Nacional Autónoma de México, US Country Studies Program. 2000, pp. 57–66. Available online: https://www.uv.mx/personal/tcarmona/files/2010/08/Villers-y-Trejo-.pdf (accessed on 15 February 2024).
- Arroyo-Rodríguez, V.; Melo, F.P.L.; Martínez-Ramos, M.; Bongers, F.; Chazdon, R.L.; Meave, J.A.; Norden, N.; Santos, B.A.; Leal, I.R.; Tabarelli, M. Multiple successional pathways in human-modified tropical landscapes: New insights from forest succession, forest fragmentation and landscape ecology research. Biol. Rev. Camb. Philos. Soc. 2015, 92, 326–340. [Google Scholar] [CrossRef]
- McDonald, T.; Jonson, J.; Dixon, K.W. National standards for the practice of ecological restoration in Australia. Restor. Ecol. 2016, 24, S6–S32. [Google Scholar] [CrossRef]
- Lequerica, M.; Bernal, M.; Stevenson, P. Evidencia de direccionalidad del proceso de sucesión temprana del bosque altoandino. Colomb. For. 2017, 20, 63–84. [Google Scholar] [CrossRef]
- Van Andel, J.; Aronson, J. Restoration Ecology: The New Frontier; Wiley Blackwell: Oxford, UK, 2012; p. 400. [Google Scholar]
- Pascual-Hortal, L.; Saura, S. Comparison and development of new graph-based landscape connectivity indices: Towards the priorization of habitat patches and corridors for conservation. Landsc. Ecol. 2006, 21, 959–967. [Google Scholar] [CrossRef]
- Saura, S.; Rubio, L. A common currency for the different ways in which patches and links can contribute to habitat availability and connectivity in the landscape. Ecography 2010, 33, 523–537. [Google Scholar] [CrossRef]
- Forero-Gómez, Y.K.; Gil-Leguizamón, P.A.; Morales-Puentes, M.E. Structural connectivity between the Páramos of Guacheneque and Los Cristales, Rabanal-Río Bogotá complex, Colombia. Rev. Teledetección 2020, 57, 65–77. [Google Scholar] [CrossRef]
- Anzoategui, L.A.; Gil-Leguizamón, P.A.; Sanabria-Marin, R. Agricultural frontier and multi-temporality of vegetation cover in moorland of the Cortadera Regional Natural Park (Boyacá, Colombia). BOSQUE 2023, 44, 159–170. [Google Scholar] [CrossRef]
- Valdés, A. Modelos de paisaje y análisis de fragmentación: De la biogeografía de islas a la aproximación de paisaje continuo. Ecosistemas 2011, 20, 11–20. [Google Scholar]
- The Nature Conservancy. Estudio Multitemporal del Nor-Oriente del Ecuador. Memoria Técnica Estudio Multitemporal de la Cobertura Vegetal y Uso del Suelo en los Años 1990-2008 y Proyección 2030; Geoplades: Quito, Ecuador, 2009; p. 31. [Google Scholar]
- Neigh, C.; Taylor, M.P. Landsat Science, SATELLITES. Available online: https://landsat.gsfc.nasa.gov/satellites/ (accessed on 7 February 2024).
- Rangel, J.O.; Velásquez, A. Métodos de estudio de la vegetación. In Colombia Diversidad Biótica II: Tipos de Vegetación en Colombia; Rangel, J.O., Lowy, C., Aguilar, M., Eds.; Editorial Unibiblos: Bogotá, Colombia, 1997; pp. 59–87. [Google Scholar]
- Gentry, A. A Field Guide to the Families and Genera of Woody Plants of Northwest South America (Colombia, Ecuador, and Peru) with Supplementary Notes on Herbaceous Taxa; Conservation International: Washington, DC, USA, 1993. [Google Scholar]
- McGarigal, K.; Cushman, S.; Neel, M.; Ene, E. FRAGSTATS: Spatial Pattern Analysis Program for Categorical Maps. Computer Software Program Produced by the Authors at the University of Massachusetts, Amherst. Available online: https://www.umass.edu/landeco/research/fragstats/fragstats.html (accessed on 31 January 2012).
- Magle, S.; Theobald, D.; Crooks, K.A. Comparison of metrics predicting landscape connectivity for a highly interactive species along an urban gradient in Colorado, USA. Landsc. Ecol. 2009, 24, 267–280. [Google Scholar] [CrossRef]
- Saura, S.; Pascual-Hortal, L. A new habitat availability index to integrate connectivity in landscape conservation planning: Comparison with existing indices and application to a case study. Landsc. Urban Plan. 2007, 83, 91–103. [Google Scholar] [CrossRef]
- Pascual-Hortal, L.; Saura, S. Integrating landscape connectivity in broad-scale forest planning through a new graph-based habitat availability methodology: Application to capercaillie (Tetrao urogallus) in Catalonia (NE Spain). Eur. J. For. Res. Vol. 2008, 127, 23–31. [Google Scholar] [CrossRef]
- Wickham, H.; Chang, W.; Henry, L.; Lin Pedersen, T.; Takahashi, K.; Wilke, C.; Woo, K.; Yutani, H.; Dunnington, D. ggplot2. Available online: https://ggplot2.tidyverse.org/ (accessed on 5 October 2023).


| Classification | Dgnm | Hof | Mpc | Lag | Bdl | Total Row | User Accuracy (%) | Commission Error (%) |
|---|---|---|---|---|---|---|---|---|
| Dgnm | 49 | 4 | 0 | 0 | 0 | 53 | 98.55 | 1.45 |
| Hof | 1 | 140 | 0 | 2 | 0 | 143 | 98.91 | 1.09 |
| Mpc | 0 | 2 | 71 | 0 | 0 | 73 | 99.28 | 0.72 |
| Lag | 0 | 0 | 0 | 6 | 0 | 6 | 100 | 0 |
| Bdl | 0 | 0 | 0 | 0 | 1 | 1 | 100 | 0 |
| Total column | 50 | 146 | 71 | 8 | 1 | 276 | ||
| Producer accuracy (%) | 99.64 | 97.83 | 100 | 99.28 | 100 | Overall classification accuracy (Kappa) = 0.95 | ||
| Error of omission (%) | 0.36 | 2.17 | 0 | 0.72 | 0 | |||
| Cover | Area (ha) | Change from 1986 to 2000 (ha) | Change from 2000 to 2021 (ha) | Change from 1986 to 2021 (ha) | |||||
|---|---|---|---|---|---|---|---|---|---|
| 1986 | % | 2000 | % | 2021 | % | ||||
| Mpc | 2811.8 | 32.8 | 3748.5 | 43.7 | 4534.1 | 52.9 | 936.6 | 785.6 | 1722.2 |
| Dgnm | 3648.9 | 42.6 | 2400.9 | 28.0 | 2160.0 | 25.2 | −1248.0 | −241.0 | −1489.0 |
| Hof | 2101.3 | 24.5 | 2410.5 | 28.1 | 1861.8 | 21.7 | 309.2 | −548.7 | −239.5 |
| Lag | 12.1 | 0.1 | 14.1 | 0.2 | 13.1 | 0.2 | 2.0 | −1.0 | 1.0 |
| Bdl | 0.0 | 0.0 | 0.0 | 0.0 | 5.1 | 0.1 | 0.0 | 0.9 | 0.9 |
| Total | 8574.1 | 100.0 | 8574.1 | 100.0 | 8574.1 | 100.0 | |||
| Satellite Sensor (Image) | Resolution | ||
|---|---|---|---|
| Spatial | Spectral | Radiometric | |
| Landsat 5 TM (LT50070561986013) | 30 m (visible, NIR, SWIR) 120 m (thermal) | Number of bands: 7 | 8 bits, 28: 256 DL |
| Band 3: 0.63–0.69 µm | |||
| Band 4: 0.76–0.90 µm | |||
| Band 5: 1.55–1.75 µm | |||
| Landsat 7 ETM+ (LT700705620001213) | 30 m (visible, NIR, SWIR) 60 m (thermal) 15 m (panchromatic) | Number of bands: 8 | 8 bits, 28: 256 DL |
| Band 3: 0.63–0.69 µm | |||
| Band 4: 0.775–0.90 µm | |||
| Band 5: 1.55–1.75 µm | |||
| Landsat 8 OLI (LC08L2SP00705620211113-25) | 30 m (visible, NIR, SWIR) 100 m (thermal) 15 m (panchromatic). | Number of bands: 11 | 16 bits, 216: 65,536 DL |
| Band 2: 0.452–0.512 µm | |||
| Band 5: 0.851–0.879 µm | |||
| Band 6: 1.566–1.651 µm | |||
Disclaimer/Publisher’s Note: The statements, opinions and data contained in all publications are solely those of the individual author(s) and contributor(s) and not of MDPI and/or the editor(s). MDPI and/or the editor(s) disclaim responsibility for any injury to people or property resulting from any ideas, methods, instructions or products referred to in the content. |
© 2024 by the authors. Licensee MDPI, Basel, Switzerland. This article is an open access article distributed under the terms and conditions of the Creative Commons Attribution (CC BY) license (https://creativecommons.org/licenses/by/4.0/).
Share and Cite
Gil-Leguizamón, P.A.; Pereña-Ortiz, J.F.; Sánchez-Mata, D.; Salvo-Tierra, Á.E.; Mercado-Gómez, J.D.; Morales-Puentes, M.E. Spatial and Temporal Dynamics of the Vegetation Cover from the Bijagual Massif, Boyacá, Colombia, during the 1986–2021 Period. Plants 2024, 13, 948. https://doi.org/10.3390/plants13070948
Gil-Leguizamón PA, Pereña-Ortiz JF, Sánchez-Mata D, Salvo-Tierra ÁE, Mercado-Gómez JD, Morales-Puentes ME. Spatial and Temporal Dynamics of the Vegetation Cover from the Bijagual Massif, Boyacá, Colombia, during the 1986–2021 Period. Plants. 2024; 13(7):948. https://doi.org/10.3390/plants13070948
Chicago/Turabian StyleGil-Leguizamón, Pablo Andrés, Jaime Francisco Pereña-Ortiz, Daniel Sánchez-Mata, Ángel Enrique Salvo-Tierra, Jorge David Mercado-Gómez, and María Eugenia Morales-Puentes. 2024. "Spatial and Temporal Dynamics of the Vegetation Cover from the Bijagual Massif, Boyacá, Colombia, during the 1986–2021 Period" Plants 13, no. 7: 948. https://doi.org/10.3390/plants13070948