Article

Metabolic Profile and Metabolite Analyses in Extreme Weight Responders to Gastric Bypass Surgery

1
Department of Endocrinology, Diabetes and Metabolism, University Hospital Bonn, Venusberg-Campus 1, 53127 Bonn, Germany
2
Department of Molecular Systems Biology, Helmholtz Centre for Environmental Research GmbH-UFZ, Permoserstraße 15, 04318 Leipzig, Germany
3
Department of Neurology, Max Planck Institute for Human Cognitive and Brain Sciences, Stephanstraße 1a, 04103 Leipzig, Germany
4
Department of Visceral and Metabolic Surgery, University Hospital Leipzig, Liebigstraße 18, 04103 Leipzig, Germany
5
Department of Psychology and Logopedics, Faculty of Medicine, University of Helsinki, Haartmaninkatu 3, 00290 Helsinki, Finland
6
German Centre for Integrative Biodiversity Research (iDiv) Halle-Jena-Leipzig, Puschstraße 4, 04103 Leipzig, Germany
7
Faculty of Life Sciences, Institute of Biochemistry, University of Leipzig, Brüderstraße 34, 04103 Leipzig, Germany
*
Author to whom correspondence should be addressed.
Metabolites 2022, 12(5), 417; https://doi.org/10.3390/metabo12050417
Submission received: 31 March 2022 / Revised: 26 April 2022 / Accepted: 29 April 2022 / Published: 6 May 2022
(This article belongs to the Special Issue Bile Acid Metabolism and Gut Microbiota)

Abstract

:
Background: Roux-en-Y gastric bypass (RYGB) surgery belongs to the most frequently performed surgical therapeutic strategies against adiposity and its comorbidities. However, outcome is limited in a substantial cohort of patients with inadequate primary weight loss or considerable weight regain. In this study, gut microbiota composition and systemically released metabolites were analyzed in a cohort of extreme weight responders after RYGB. Methods: Patients (n = 23) were categorized based on excess weight loss (EWL) at a minimum of two years after RYGB in a good responder (EWL 93 ± 4.3%) or a bad responder group (EWL 19.5 ± 13.3%) for evaluation of differences in metabolic outcome, eating behavior and gut microbiota taxonomy and metabolic activity. Results: Mean BMI was 47.2 ± 6.4 kg/m2 in the bad vs. 26.6 ± 1.2 kg/m2 in the good responder group (p = 0.0001). We found no difference in hunger and satiety sensation, in fasting or postprandial gut hormone release, or in gut microbiota composition between both groups. Differences in weight loss did not reflect in metabolic outcome after RYGB. While fecal and circulating metabolite analyses showed higher levels of propionate (p = 0.0001) in good and valerate (p = 0.04) in bad responders, respectively, conjugated primary and secondary bile acids were higher in good responders in the fasted (p = 0.03) and postprandial state (GCA, p = 0.02; GCDCA, p = 0.02; TCA, p = 0.01; TCDCA, p = 0.02; GDCA, p = 0.05; GUDCA, p = 0.04; TLCA, p = 0.04). Conclusions: Heterogenous weight loss response to RYGB surgery separates from patients’ metabolic outcome, and is linked to unique serum metabolite signatures post intervention. These findings suggest that the level of adiposity reduction alone is insufficient to assess the metabolic success of RYGB surgery, and that longitudinal metabolite profiling may eventually help us to identify markers that could predict individual adiposity response to surgery and guide patient selection and counseling.

1. Introduction

Management of obesity and its extensive disease burden is one of the greatest challenges of modern medicine. Bariatric surgery remains the most effective therapeutic approach for morbid obesity, as well as for several associated co-morbidities, including type 2 diabetes mellitus (T2D), dyslipidemia, hypertension, non-alcoholic fatty liver disease (NAFLD) and cardiovascular diseases [1,2,3,4,5,6,7]. Roux-en-Y gastric bypass (RYGB) and vertical sleeve gastrectomy (VSG) are the two most frequently performed surgical interventions worldwide for sustained weight loss and improved glucose metabolism [8]. While both procedures stand out amongst currently available weight loss strategies by their short- and long-term effectiveness to reduce adiposity and improve obesity-related systemic metabolic disorders, the individual patient response to surgery varies widely and a sizeable proportion of patients struggles with a relatively poor achievement of primary weight loss or even a pronounced weight regain after initial adiposity reduction [3,8,9,10,11,12]. As the magnitude of weight loss is closely related to the improvement of obesity-related comorbidities and patient satisfaction with the intervention [13,14,15,16], insufficient weight loss is the most common reason for revisional bariatric surgery today [17].
Although a universally acknowledged definition for “insufficiency” of weight loss or “weight regain” is lacking [18,19], it is estimated that prevalence varies between 15–30% after RYGB [10,20,21,22,23] and may be the result of a complex interaction between multiple genetic traits [24,25], as well as psychological, behavioral, nutritional, environmental and surgery-related factors [26,27].
It is of note that the mechanisms by which the weight loss surgical procedures achieve sustained weight reduction and metabolic improvements beyond adiposity reduction remain incompletely understood [28,29,30]. Latest insights from others [31] and our own studies [32,33,34] indicate that the altered intestinal environment after RYGB-like gut reconfiguration induces remarkable top-down effects on the composition, diversity and metabolic activity of the gut microbiota, which may play an important role in the beneficial effects of the surgery. While several lines of evidence point to a decisive role for the altered gut microbiome [35] and increased bile acid abundance [36,37,38,39] in supporting the effects of bariatric surgery on sustained adiposity reduction and metabolic improvements, the parallel dramatic changes in body weight and eating behavior essentially limit this interpretation. Moreover, the specific role of the gut microbiome and bacteria-derived metabolites in variable weight loss response to bariatric surgical intervention, as well as its consequences on sustained metabolic control, remain poorly understood.
The current study was designed to profile the composition of the gut microbiota and the circulating metabolomic signature in patients with variable weight loss response to RYGB surgery and to determine associations with weight loss-independent beneficial metabolic outcomes after surgery.

2. Results

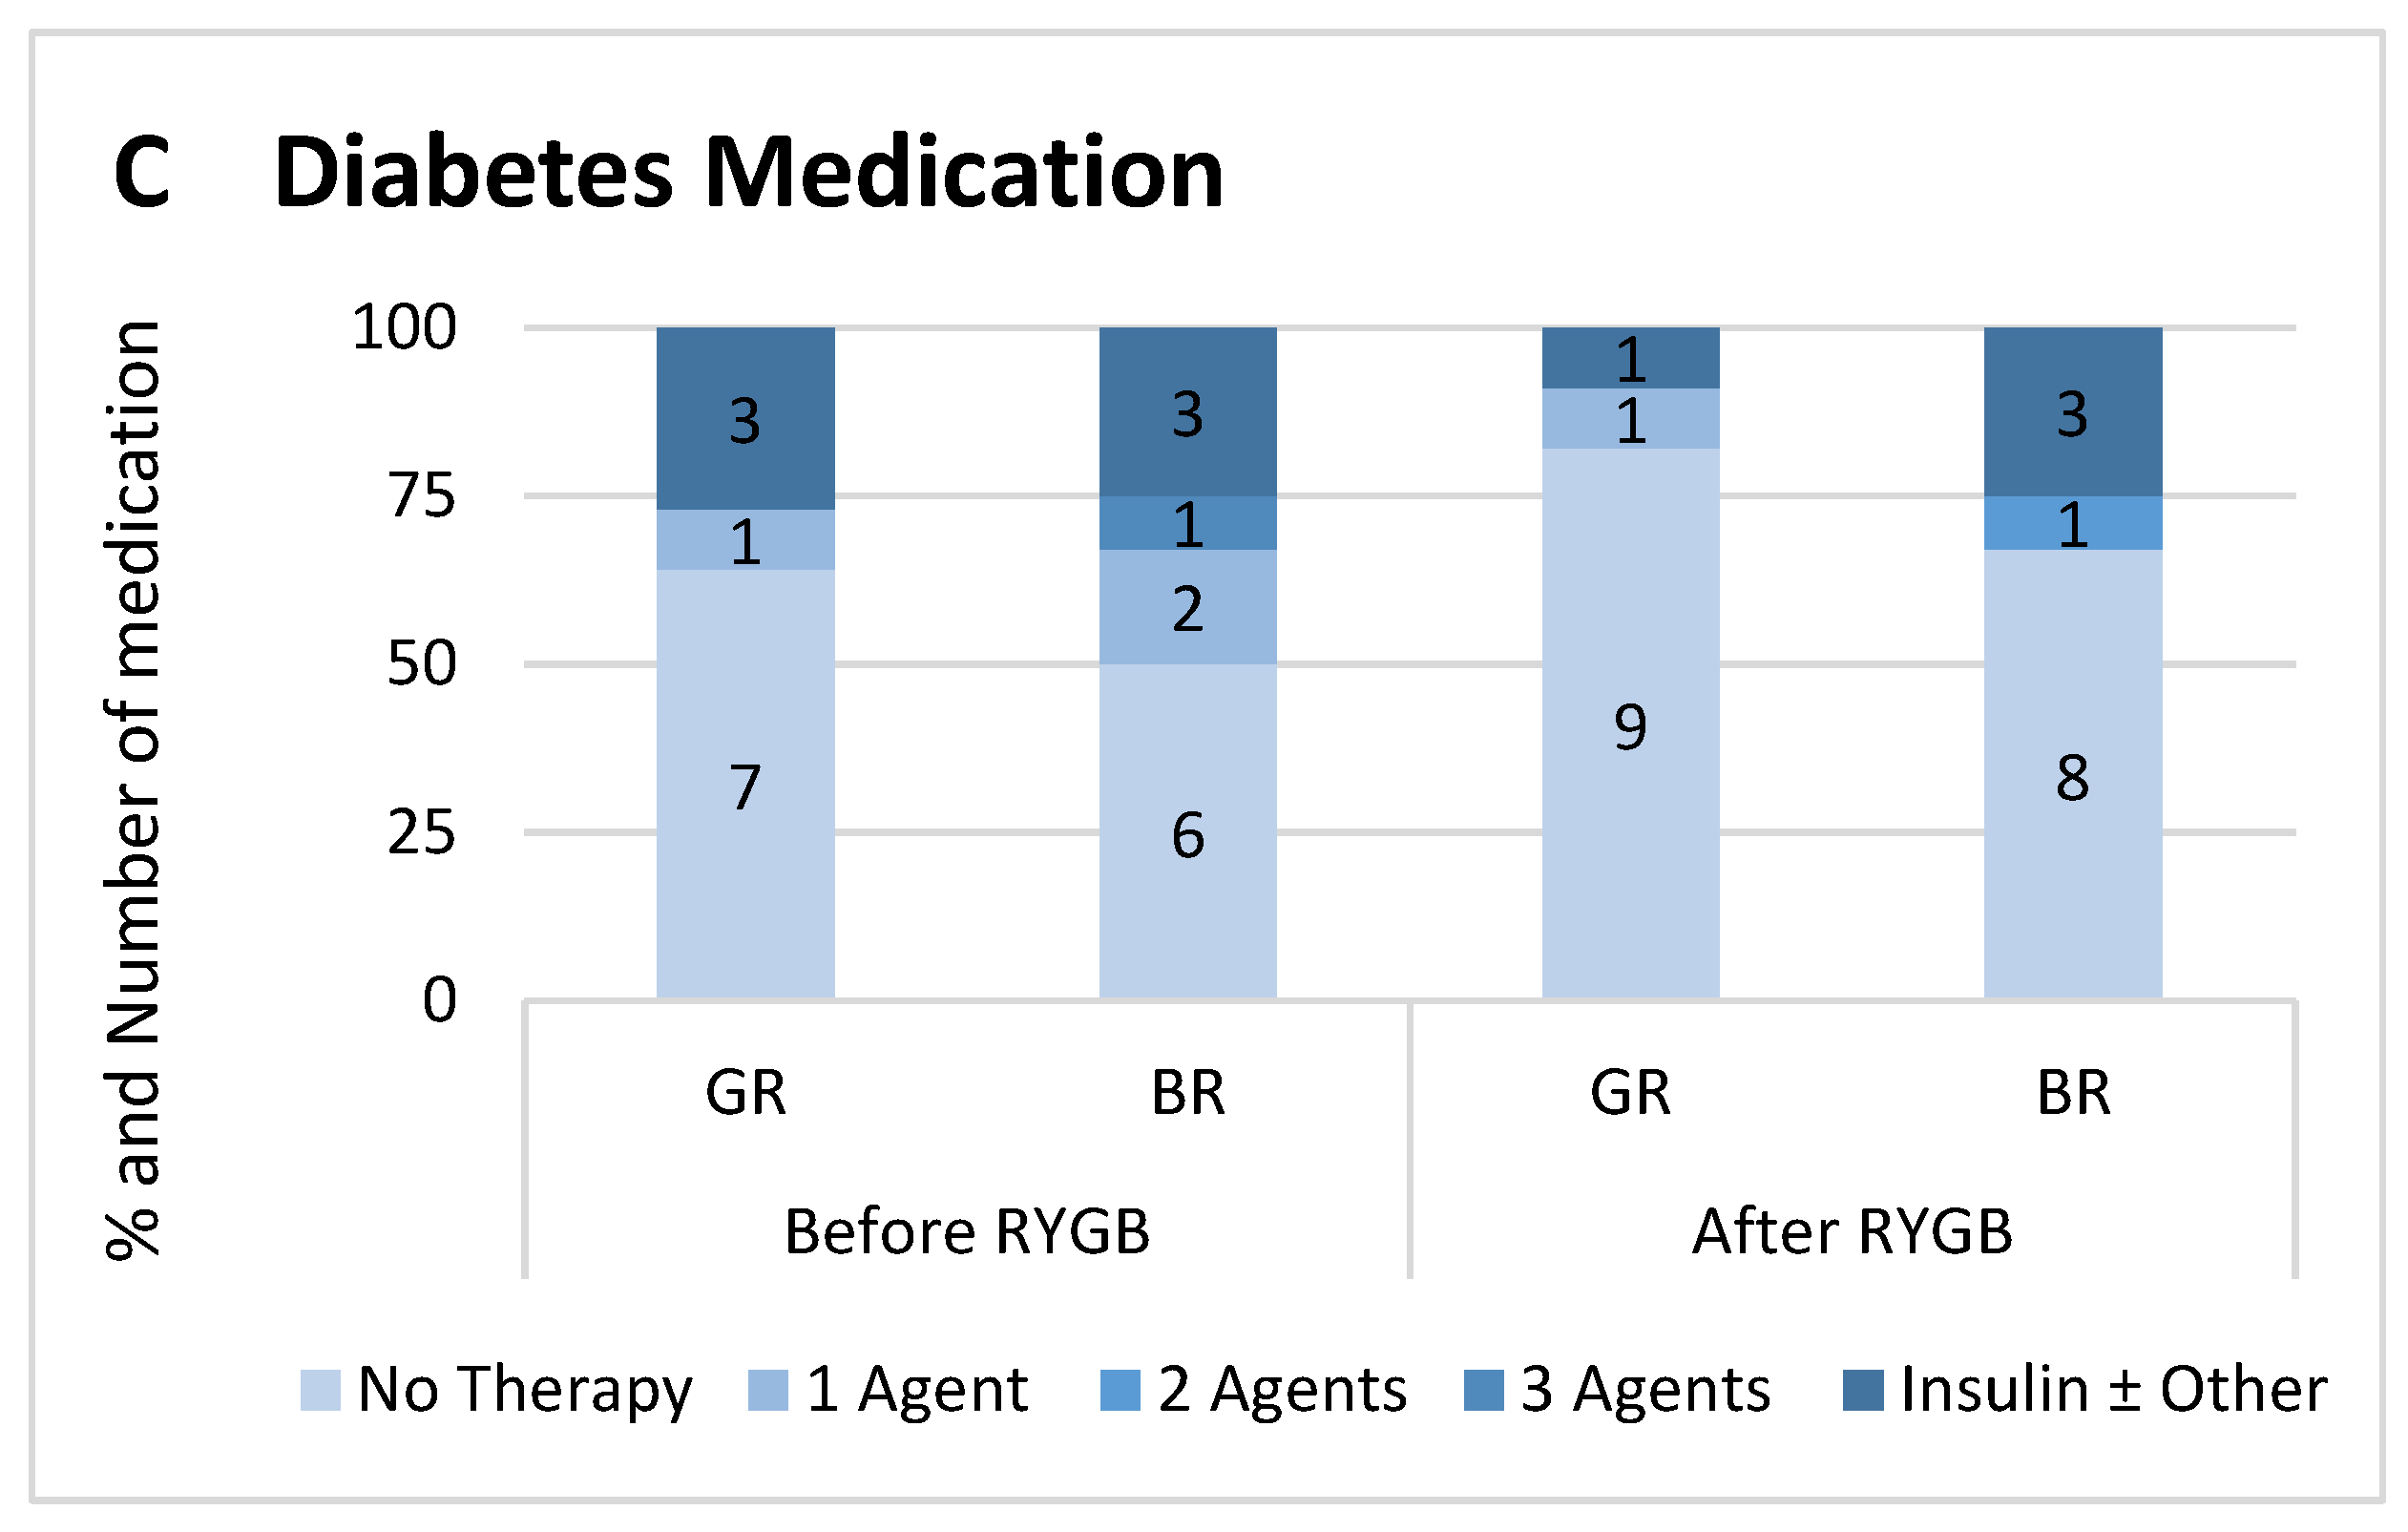
2.1. Study Cohort and Metabolic Profile

Patients after RYGB surgery were identified via the local Adiposity Research database by screening for the 5% best and worst weight loss responders (defined by excess weight loss (EWL)) with comprehensive metabolic characterization and available follow-up data for at least 24 months after bariatric surgery. Inclusion criteria were a body mass index (BMI) between 40–60 kg/m2 before RYGB and a minimum time span of two years since bariatric surgery. Exclusion criteria were acute neurological or psychiatric disorders, alcohol or drug abuse, prior neurosurgical procedures or head trauma. After study enrolment, patients were invited for follow up visit where they received a standardized test meal after an overnight fasting period, answered questionnaires addressing amongst others eating behavior and diet preferences (see Section 4.1) and underwent anthropometric measurements. Blood samples were collected before and at several time points after the test meal, and patients donated feces for microbiota and metabolome analysis.
Table 1 shows the anthropometric data and metabolic profile of the study cohort (n = 23 subjects) before surgery and at follow up. Patients were predominantly female in both groups (64% in good and 75% in bad responders). Mean age (± SD) at test date (52.9 ± 9.5 years in good and 54.1 ± 10.6 years in bad responders) and time after surgery (4.3 ± 1.2 in good and 4.6 ± 1.5 years in bad responders) did not differ between groups.
Mean body mass index (BMI ± SD) before surgery was higher in the bad responder group (52.7 ± 6.6 vs. 46.5 ± 7.5 kg/m2; p = 0.04). BMI at follow up was 47.2 ± 6.4 kg/m2 in the bad vs. 26.6 ± 1.2 kg/m2 in the good responder group with a corresponding change in BMI points of −5.5 ± 3.9 vs. −19.8 ± 6.7 and excess weight loss of 19.5 ± 13.3% and 93 ± 4.3%, respectively.
As we previously described [34], bad responders showed higher eating restraint scores as well as eating, weight and shape concerns, whereas self-reported sugar and fat intake was similar (Table 1). The vast majority of patients in both groups reported reduced food intake after bariatric surgery, which were 10 patients (91%) in the good and 10 patients (83%) in the bad responder group. Two subjects (17%) in the bad responder group, but only one subject (9%) in the good responder group reported binge eating. Questionnaires evaluating emotional eating and chronic stress exposed no inter-group differences.
Metabolic measures included serum liver enzyme levels, lipid levels and glucose homeostatic parameters, which showed no differences at baseline. At follow up, good responders had lower median (IQR) fasting glucose levels (5 (4.6–5.3) vs. 5.4 (5.2–8.5) mmol/L; p = 0.02), hemoglobin A1c concentration (5 (4.8–5.6) vs. 5.7 (5.2–6.6)%, p = 0.03), γ-glutamyl transferase (γGT) (0.21 (0.13–0.42) vs. 0.41 (0.25–1.20) μkat/L; p = 0.05) and triglyceride levels (0.94 (0.63–1.2) vs. 1.3 (1.2–1.3) mmol/L; p = 0.02).
However, both groups showed marked improvement of metabolic profiles and group differences were lost for all parameters except for high density lipoprotein (HDL) (0.6 ± 0.27 in good vs. 0.28 ±0.3 mmol/L in bad responders; p = 0.02) when absolute changes from baseline were compared. Pre-surgery elevated C-reactive protein (CRP) levels were markedly lowered in both responder groups at follow up, while levels were lower in good responders (0.3 (0.3–0.3) vs. 2.0 (1.3–13) mg/L, p < 0.01) and suppressed below detection limit in all but one patient.
Figure 1 shows the proportion of patients with T2D and hemoglobin A1c categories of both groups before and after RYGB. Four patients (36%) in the good responder group were diabetic before intervention and all experienced remission (n = 2) or improvement (n = 2) of their glycemic control at follow up [40]. In the bad responder group, six patients (50%) were diabetic, of which two patients were in remission at follow up, with one patient experiencing improvement, and three patients experienced no change or worsening of their glycemic control.

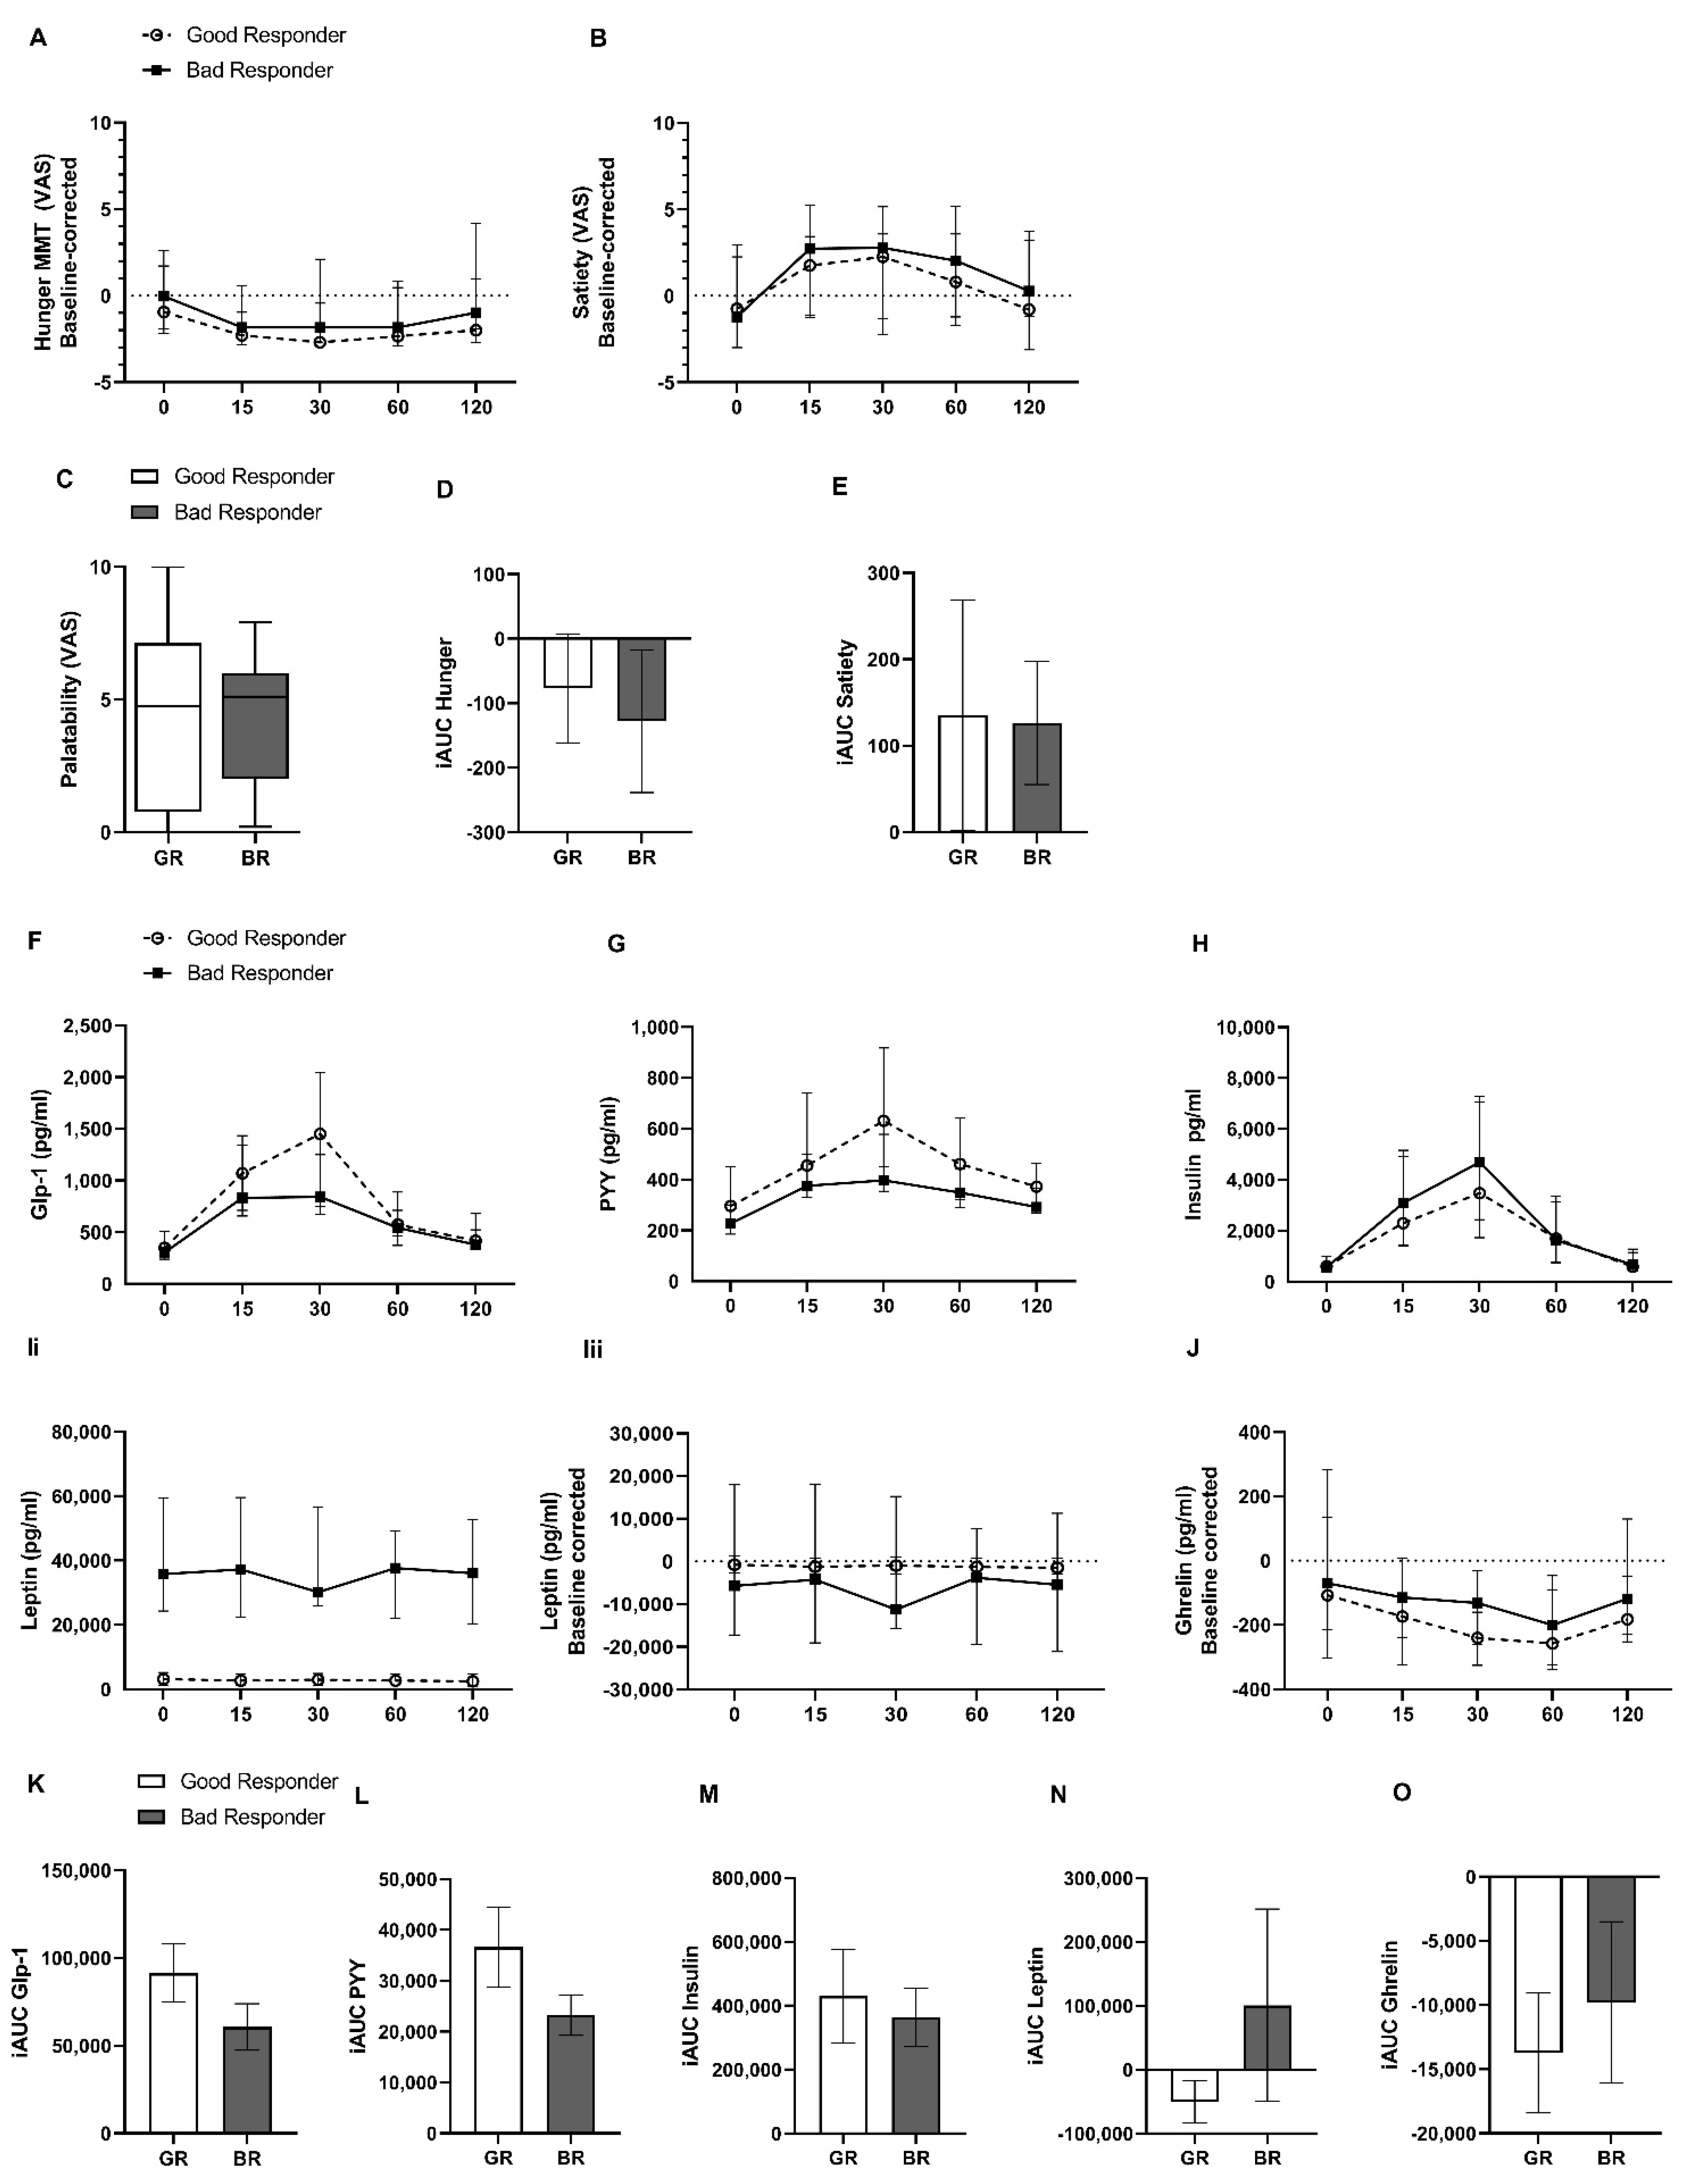
2.2. Hunger and Satiety Rating and Gut Hormone Release during Standardized Mixed-Meal Test

Extreme responders to RYGB surgery received at follow up a mixed-meal test by ingesting a 125 mL liquid meal containing 300 kilocalories (see Section 4.1 for detailed nutrient specifications). Figure 2 shows ratings for hunger, satiety and palatability of the meal (Figure 2A–E) as quantified by visual analogue scale (VAS), as well as corresponding concentrations of gut hormone release (Figure 2D–J) during the mixed-meal test. Notably, both responder groups ranked hunger, satiety and palatability levels similarly during the standard test meal. Furthermore, gut hormone levels did not differ significantly between both groups in the fasted state. Only leptin levels were higher in the bad responder group (35,739 (24,287–59,467) vs. 3167 (1321–5242) pg/mL; p < 0.0001).
Moreover, although good responders showed a trend towards higher stimulated glucagon-like peptide−1 (GLP-1) and peptide YY (PYY) release and a reduced insulin release (Figure 2K–M) after the test meal compared to bad weight loss responders, differences were not statistically significant. Plasma ghrelin and leptin levels were further baseline corrected to account for weight differences and showed a statistically not-significant trend towards a more pronounced ghrelin suppression in good responders, and no discernable secretion profile for leptin after the test meal in both responder groups (Figure 2N,O).

2.3. Fecal Microbiota Composition and Metabolomics

2.3.1. Fecal Microbiota Composition and Bacterial Metabolites

To investigate possible differences in the long-term effects of RYGB surgery on the gut microbiota in extreme weight loss responders, fecal samples of both weight loss responder groups were profiled for microbiota composition and bacteria-linked metabolites as pivotal mediators of host–microbiota communication. Microbiome taxonomic structure of good responders and bad responders showed no differences in richness or alpha-diversity based on Shannon index calculation (Supplemental Figure S1). In addition, beta-diversity, distribution of microbial families in each sample and abundance of single genera did not differ (Supplemental Figure S1) between both responder groups. Additionally, despite obviously clear differences in adiposity development between the two groups, targeted metabolomics in feces yielded no differences in amino acids, biogenic amines, acyl carnitines and hexose (Supplemental Figure S2A,B,E). Out of ten short chain fatty acids (SCFA), valerate was the only metabolite found to be more abundant in bad responders compared to good weight loss responders (Supplemental Figure S2C,D; p = 0.04).

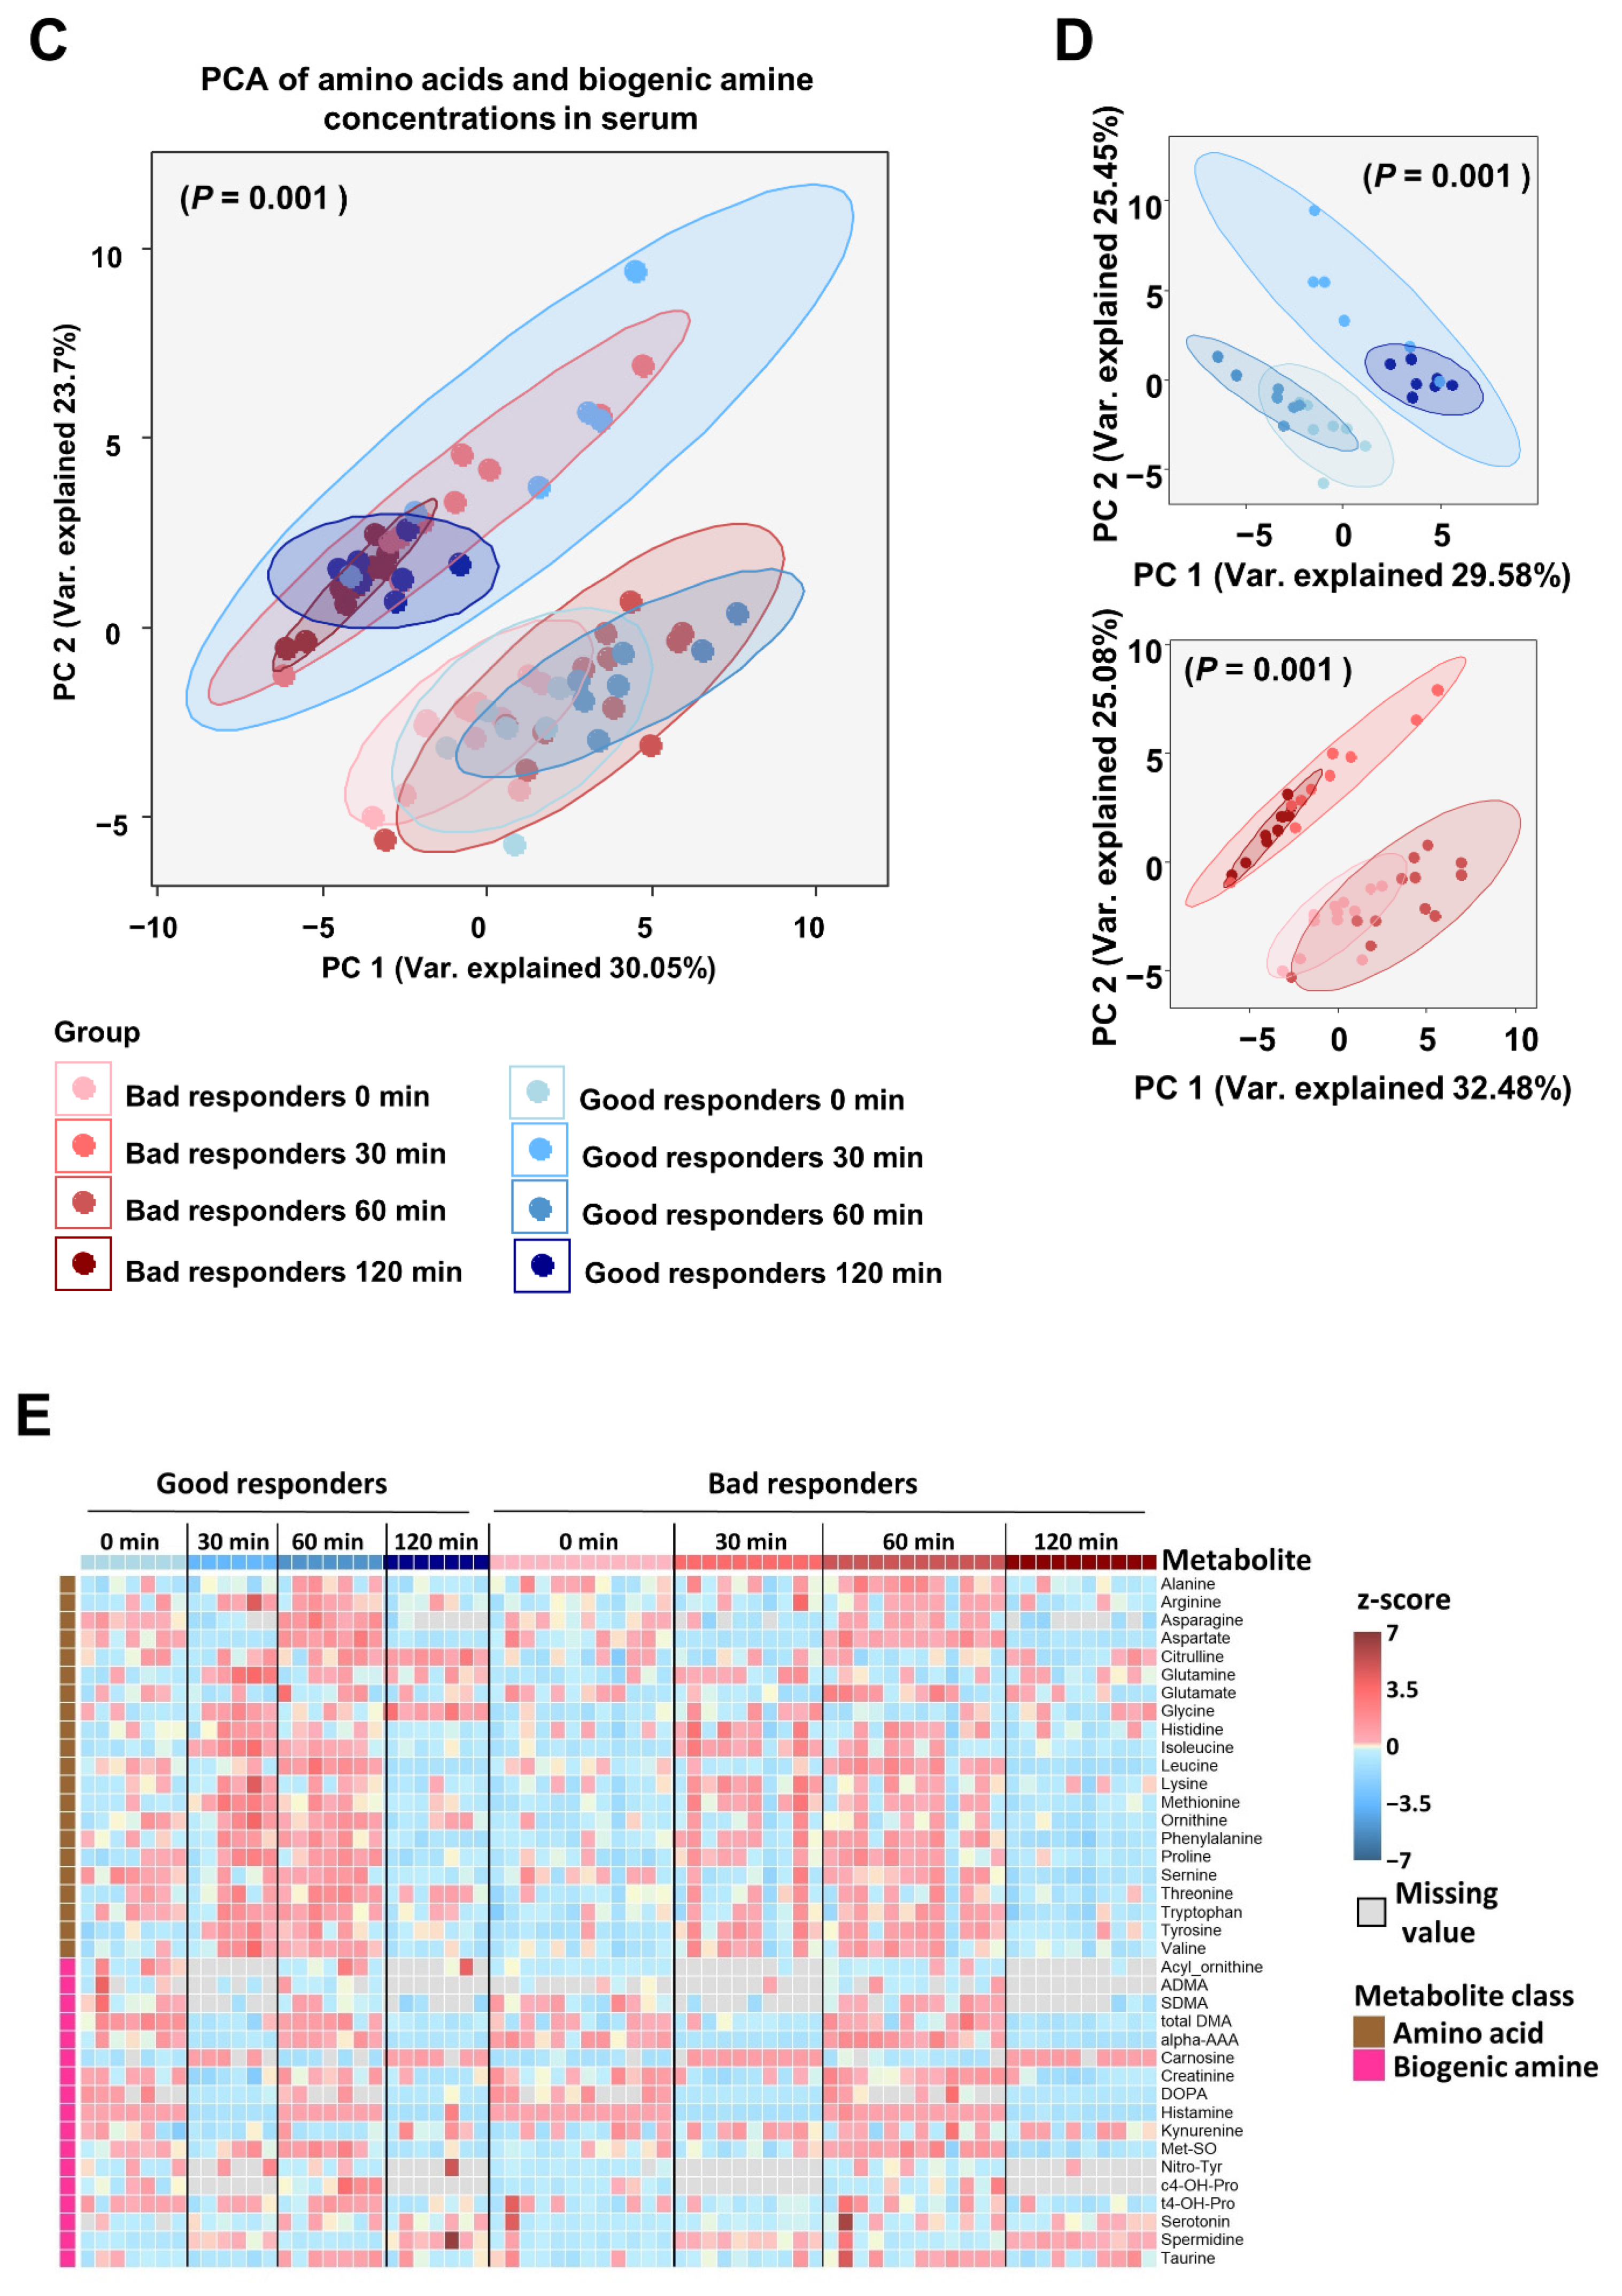
2.3.2. Circulating Metabolites and Bile Acids

Circulating metabolites and bile acid species were quantified at follow up both in the fasted and postprandial state at 0, 30, 60 and 120 min during the mixed-meal test.
Fasting serum SCFA concentration and postprandial release in response to the standardized test meal were quantifiable for propionate, valerate and acetate. Propionate showed higher abundance at fasted and stimulated state in good responders (p = 0.0001), whereas postprandial valerate response was higher (p = 0.04) in bad responders (Figure 3A,B). Acetate levels did not differ at either time point. Additionally, serum amino acids (AA) and biogenic amines showed no differences between groups neither at fasted state nor under test meal-stimulated conditions (Figure 3C–E). SCFA and AA levels were present in comparable proportions, indicating that intestinal fermentation, and thereby energy harvest, did not differ between both responder groups.
Interestingly, we found different modulation of bile acid concentration in extreme responders to RYGB surgery both at the fasted and stimulated states. Fasting serum bile acid concentration showed higher abundance of both conjugated primary and secondary bile acids in good responders (Figure 4A,B; p = 0.03 for cumulative conjugated bile acids and primary and secondary conjugated bile acids independently in good vs. bad responders). Individual analyses of bile acid species showed significantly higher concentrations, particularly of glycochenodeoxycholic acid (GCDCA; Figure 4D; p = 0.03) and glycochenodeoxycholate acid (GCDA; Figure 4D; p = 0.02), in the good responder group.
After ingestion of the test meal, good responders showed a clearly higher serum concentration for the conjugated primary bile acids (glycocholic acid, GCA; glycochenodeoxycholic acid, GCDCA; taurocholic acid, TCA; and taurochenodeoxycholic acid, TCDCA) and the conjugated secondary bile acids (glycochenodeoxycholate acid, GCDA; glycoursodeoxycholic acid, GUDCA; and taurolithocholic acid, TLCA). Figure 5 depicts concentrations for the statistically significant bile acids at time points 0, 30, 60 and 120 min during the mixed-meal test. Group differences were most evident at time point 30 min for most bile acids and for the four conjugated primary bile acids GCA (Figure 5A; p = 0.02), GCDCA (Figure 5B; p = 0.02), TCA (Figure 5E; p = 0.01) and TCDCA (Figure 5F; p = 0.02).

3. Discussion

In the management of obesity and related diseases, physicians face significant heterogeneity in response to weight loss surgery. Indeed, one of the most challenging clinical issues in personalized obesity medicine is to predict how an individual will respond to weight loss surgical intervention, and to what extent the level of weight loss contributes to metabolic reprogramming and improvement of obesity-related metabolic and cardiovascular co-morbidities.
The present study aimed to characterize a cohort of extreme weight responders to RYGB surgery as to differences in metabolic outcome, hunger and satiety sensation, as well as to metabolite profiles in the energetically stabilized postoperative state. Interestingly, patients in both groups did not significantly differ as to age, education or glycemic control before intervention. However, bad responders had higher preoperative BMI (52.7 ± 6.6 vs. 46.5 ± 7.5 kg/m2; p = 0.04) which was previously found to be predictive for poorer post-surgery weight loss [41].
Unfavorable dietary habits, and poor diet quality, have amongst other factors been associated with poor weight loss response to bariatric surgery [42,43,44]. In our cohort, self-reported food and dietary fat and sugar intake did not differ between groups nor did emotional eating or chronic stress sensation. Two subjects of the bad responder group reported binge eating compared to one in the good responder group. As previously reported [34], bad responders in our analysis did show higher scores in all four subscales (restraint, eating concern, shape concern and weight concern) of the EDE-questionnaire. While this has been associated with poorer weight loss after bariatric surgery before [38], the higher scoring could also be attributed to higher BMI itself in the poor responder group [45].
Here, our data reveal several important novel implications. First, our results indicate that postoperative adaptions of energy homeostasis largely dissociate from metabolic control after RGYB. While weight loss and caloric restriction may probably play a critical role in improved glycemic control after RYGB [28,46], our findings indicate that weight loss-independent mechanisms also appear to be involved in systemic metabolic improvements. Patients of both groups showed marked and comparable improvement in glycemic control, dyslipidemia and liver enzymes despite divergent weight loss responses. This observation is in line with previous studies which reported favorable metabolic outcomes in patients after RYGB despite “failed” weight loss [47], or rather cardiometabolic improvements across the entire spectrum on post-bariatric weight loss [48]. The controversy remains whether these improvements are indeed independent of the loss in excess weight, or the result of a minor or moderate adiposity reduction, proving sufficient to beneficially modulate metabolic outcomes [49,50]. A very elegant study has recently shown, that in a controlled weight loss intervention in obese patients 5% weight loss was sufficient to improve organ tissue insulin sensitivity and ß-cell function, while further weight loss of up to 10 to 15% is required to cause dose-dependent alterations in key adipose tissue biological pathways [50]. In view of these data, even a poor weight loss response to surgery compared to the surgical benchmark may mediate valuable and sustained metabolic benefits.
Secondly, despite clearly divergent weight loss responses to surgery, notably subjects reported no differences in hunger and satiety sensation. This is remarkable since a major part of the weight loss success of RYGB is generally attributed to sustainably lower caloric intake [33,51,52], resulting from multifaceted alterations in nutrient sensation [51]. It has been shown in rodent models that for progressive weight loss development, sensory information from the gut must reach hindbrain nucleus tractus solitarius (NTS) neurons through the celiac branch of the vagus nerve [52]. Surprisingly, it remains largely unclear which gut-derived signals precisely promote the structural and functional brain modifications after RYGB surgery. Although augmented GLP-1 release from enteroendocrine L-cells acting on peripheral and/or central GLP-1 receptors was initially considered as a major contributor of caloric restriction and post-RYGB weight loss, it has been difficult to prove the role of GLP-1 experimentally [53,54]. In line with this uncertainty and no discernible difference in hunger and appetite sensation during the test meal, we notably found a very similar fasting, as well as postprandial GLP-1 and PYY release, between both patient groups despite opposed weight loss responses. Even though a trend towards a more pronounced postprandial PYY and GLP-1 release together with a more pronounced ghrelin suppression was found in the good responder group, differences were subtle and might rather be attributed to absolute differences in glycemic control at test date [23]. While significance might have been lost due to the small sample size, our results argue against a dominant functional role of incretin hormones in sustained weight reduction after RYGB surgery. While our data argue against an elemental role of GLP-1 and PYY in long-term adiposity reduction, they do not exclude a possible and even likely functional asset for improvement in post-RYGB glycemic control [55,56,57].
Thirdly, although no differences were observed in microbial composition between good and bad weight loss responders as previously reported by others [58], metabolomics analyses revealed circumscribed intergroup differences in metabolite profiles. To our knowledge, this is the first study analyzing circulating metabolite release in relation to weight loss response to RYGB surgery. In the analyzed fecal and serum SCFAs, serum propionate was more abundant in good responders, and fecal and serum valerate levels conversely more so in bad responders. An increase of colonic propionate stimulates GLP-1 and PYY release in mice and rats [57], and reduces weight [59] and obesity-related fatty liver disease [60] in diet-induced obese mice. In overweight human individuals, propionate supplementation also showed anti-obesity effects by increasing postprandial GLP-1 and PYY release and reducing energy intake [61]. Our data support that SCFA and especially altered propionate concentrations might also play a role in more pronounced weight loss after RYGB.
In addition, we found significant differences in circulating bile acids between both groups, with increased levels of primary and secondary conjugated bile acid species in the good responder group. Interestingly, particularly the postprandial release of bile acid species was clearly increased in good responders, which was most significant for the primary conjugated bile acids species.
These cholesterol-derived molecules produced by the liver are meanwhile known for their hormone-like effects on energy and glucose metabolism [62,63] through activation of the bile acid nuclear receptor farnesoid X receptor (FXR) and the membrane-bound Takeda G protein-coupled receptor 5 (TGR5) [64,65]. A growing body of evidence has shown that bariatric surgery induces a pronounced shift in bile acid metabolism and subsequent receptor signaling, which appears to be important and necessary for the weight loss effects and glycemic control of VSG [36,66] and bile diversion to the ileum [38,67] in mice. However, human data, and especially those from RYGB intervention, are rather limited, even though increased circulating levels of bile acid species have been observed after RYGB as well [68,69], and have been linked to increased GLP-1 and reduced glucose and triglyceride levels [70,71,72]. Our data complement this picture by identifying important differences in bile acid metabolism and postprandial release of the signaling molecules. As these differences were not attributable to self-reported appetite and hunger sensation nor to strong differences in incretin hormone responses, other mechanisms of anti-obesity actions beyond GLP-1 mediated appetite suppression have to be suspected. In this context, direct effects of altered gut-derived bile acid signaling to the central nervous system might be highly relevant, and even more so as bile acids are found in the brain where their levels correlate with circulating ones [73]. Interestingly, Castellanos-Jankiewicz et al. recently demonstrated in obese mice that activation of hypothalamic TGR5 achieved a negative energy balance via modulation of food intake and energy expenditure through stimulation of the sympathetic nervous system [74]. Although circulating bile acid levels correlate with energy expenditure in healthy humans [75] and with changes in energy and substrate metabolism in obese subjects undergoing RYGB [72,76], a correlation between changes in bile acid levels with weight loss response to RYGB has never been reported and never been linked to outcome-specific differences in energy and substrate metabolism and metabolic rate. Together with the difference we found in circulating propionate levels in extreme responders, which has been shown to affect resting energy expenditure and lipid oxidation in healthy volunteers [77], our data may indicate a critical role of gut-derived metabolites in metabolic adaption and heterogeneous weight loss outcome after RYGB.
There are several limitations of our work. Firstly, the sample size is very small, which limits application of results to a broader set of patients. Secondly, the missing longitudinal design and baseline characterization of microbiota and circulating metabolites are limiting factors of this study, especially as baseline microbiota composition might be a factor influencing the outcome of bariatric surgery itself [78,79]. In addition, inter- and intraindividual variances in gut microbiota composition essentially limit interpretation of cross-sectional analyses vs. analyses that include longitudinal repeat sampling [80,81]. Lastly, the assessment of eating behavior, diet and exercise was done by self-reporting measures which might favor a social desirability bias.
Overall, our findings indicate a potential role of circulating bile acids on long term energy control. Therefore, it will be interesting for future studies to delineate the role of basal metabolic rate and individual metabolic adaption to post-surgery weight loss maintenance as a possibly powerful mediator or even an early predictor of sustained weight loss success [82,83].

4. Materials and Methods

4.1. Study Cohort and Test Date

This study was conducted at the Integrated Research and Treatment Centre for Adiposity Diseases (IFB), Department of Medicine of the University of Leipzig, Germany, and the Max Planck Institute for Human Cognitive and Brain Sciences (MPI CBS), Leipzig, Germany. The Ethical Committee of the University of Leipzig (027/17-ek) approved this study. Written informed consent was acquired prior to study participation. Subjects were identified and contacted via the IFB Adiposity Research database after screening for the 5% best and worst weight loss responders categorized by EWL at a minimum time span of 2 years after bariatric surgery. Definitions of good and bad response were based on criterion EWL that was calculated as 100 − {[(BMIafter-25)/(BMIbefore-25)] × 100} with ideal body weight set at BMI 25 kg/m2. Mixed-meal tests were performed after a fasting period of 12 h using 125 mL bottles of Nutricia Fortimel Compact, Nutricia Milupa GmbH, Hamburg, Germany. Nutrient content is 300 kilocalories containing 12 g of protein, 12 g of fat and 37 g of carbohydrates. Blood samples were collected before and at 15, 30, 60 and 120 min after ingestion of the liquid meal replacement. Eating behavior, eating traits and dietary preferences were evaluated by self-reporting via the Dutch Eating Behavior Questionnaire–Emotional Eating subscale (DEBQ-EE), the Dietary Fat and Free Sugar Questionnaire (DFS), and stress sensation via the Trier Inventory for Chronic Stress Screening Scale (TICS). Additionally, patients were asked to categorize their overall food intake after RYGB subjectively. Hunger, satiety and meal pleasantness were assessed via digital VAS. Extreme responders after RYGB donated stool sample for microbiota and metabolome. Pre-surgery clinical data were collected from the IFB Adiposity database and medical reports. See [34] for further descriptions of the study cohort.

4.2. Bariatric Surgery

Patients (n = 23) were operated at the certified section for bariatric surgery, department of Visceral, Transplant, Thoracic und Vascular Surgery at the University Hospital Leipzig between 2010 and 2015. The same bariatric surgeon performed all operations laparoscopically. Biliopancreatic limb length was 50 cm and Roux (alimentary) limb length was 150 cm, except in one patient from the bad responder group (80 cm and 170 cm, respectively). Moreover, in one patient (good responder) biliopancreatic limb length was unknown, and in another patient (good responder) esophagojejunostomy was performed instead of a gastric pouch due to incidentally discovered Barrett’s carcinoma. All patients received multi-disciplinary team assessment before surgery and were offered a structured four-year follow-up program with routine dietician, physician, surgeon and psychologist visits.

4.3. Microbiome Analyses

Bacterial DNA content was isolated with QIAamp Stool Mini Kit (Qiagen) and V3-V4 variable regions of the 16S rRNA amplified by PCR. Next, paired-end 2 × 250 bp Illumina sequencing was used. Analyses were done by GENEWIZ Germany GmbH, Leipzig. Raw sequencing data were processed in fastq format using the DADA2 R software package [84]. Low-quality reads and noise were removed, paired ends joined, forward reads trimmed at base pair position 280, reverse reads trimmed at base pair position 200 and amplicon sequence variants (ASVs) constructed. The Ribosomal Database Project (RDP) database [85] and DADA2 were then used to assign taxonomy to ASVs. Normalization of ASV read counts and calculation of relative abundance for each taxonomic level was executed with R script Rhea. Further bioinformatics and visualization were done with in-house written R-scripts. Alpha-diversity indices and Beta-diversity were calculated using the vegan R-package [86]. Non-metric multidimensional scaling (NMDS) was used to analyze beta-diversity of samples and group differences calculated by PERMANOVA. Significant differences in alpha-diversity and relative abundance of taxa between groups were calculated using the Kruskal–Wallis test, followed by post-hoc pairwise statistical analysis using the Dunn’s test. p-values were corrected for multiple testing using the Benjamini–Hochberg method where appropriate (number of independent tests > 20) [87]. Figures were constructed using the ggplot2 R-package [88].

4.4. Mass Spectrometric Measurements

The AbsoluteIDQ Bile Acid Kit (Biocrates Life Sciences AG) was used for bile acid analyses. Liquid chromatography-mass spectrometry (LC-MS/MS) measurements were carried out by MRM acquisition on a Waters Acquity UPLC System and a QTRAP 5500 (AB Sciex). Data were processed with Analyst Software (1.6.2) and MetIDQ Software (Biocrates Life Sciences AG). For measurements of amino acids and amines, the AbsoluteIDQ p180 Kit (Biocrates Life Sciences AG) was used on a QTRAP mass spectrometer (MS) applying electrospray ionization (ESI) (ABI Sciex API5500Q-TRAP). After separation through a precolumn (Security Guard, Phenomenex, C18, 4 × 3 mm; Phenomenex) and hyphenated reverse phase column (Agilent, Zorbax Eclipse XDB C18, 3.0 × 100 mm, 3.5 µm), analytes were quantified by multi reaction monitoring (MRM) which was standardized by applying spiked-in isotopically labelled standards in positive and negative mode. For data processing, MetIQ software (Biocrates Life Sciences AG) was used. The isotope-labeled chemical derivatization method described by Han et al. [89] was modified for quantification of SCFA. SCFA were chromatographically separated on an Acquity UPLC BEH C18 column (1.7 μm) (Waters) using H2O (0.01% FA) and acetonitrile (0.01% FA). Analytes were quantified and identified by the scheduled MRM method.

4.5. Statistical Analyses

Statistical analyses were performed using GraphPad Prism 9, IBM SPSS Statistics 24, and Microsoft Excel (Microsoft Office Profession Plus 2016). Data are expressed as mean ± standard deviation (SD), or median and interquartile range (IQR) for parameters that are not normally distributed. VAS data are presented as median with IQR. Non-normally distributed group comparisons were performed with the Mann–Whitney U test. Normally distributed group comparisons were performed with the unpaired Student’s t-test. Significance of difference of principal component analyses (PCA) of metabolite profiles was calculated by PERMANOVA and group comparisons of single metabolites calculated by the Kruskal–Wallis test with pairwise post-hoc Dunn’s test. p-values were corrected for multiple testing using the Benjamini–Hochberg method where appropriate (number of independent tests > 20) [87].

Supplementary Materials

The following are available online at https://www.mdpi.com/article/10.3390/metabo12050417/s1, Figure S1: Analysis of the microbiome taxonomic community structure of good responders and bad responders to RYGB surgery. In panel (A), richness (i.e., number of amplicon sequencing variants/ASV) and alpha-diversity based on the Shannon index calculated using the distribution of ASVs is depicted, with significance calculated by Kruskal-Wallis test. (B) depicts the beta-diversity or diversity between samples using principal component with PERMANOVA to calculate significance of difference between the two groups. (C) reveals the distribution of microbial families in each sample and (D) depicts the relative abundance based on z-scores of microbial genera in each sample., Figure S2: Analysis of fecal metabolites. Beta-diversity analysis based on principal component analysis (PCA) of acyl carnitines (A), amino acids and biogenic amines (B), as well as short chain fatty acid (C) concentrations, with statistics calculated by PERMANOVA. (D) depicts valerate, the sole significantly different SCFA in the fecal samples between good and bad responders to RYGB, as calculated by Kruskal-Wallis test. (E) depicts relative abundance (z-scores) of metabolites measured.

Author Contributions

Conceptualization, W.K.F. and A.H.; methodology, W.K.F. and A.H.; validation, C.M.F. and W.K.F.; formal analysis, C.M.F., E.M., M.L. and S.-B.H.; investigation, M.L., L.G., A.D. and C.M.F.; resources, W.K.F., A.H., M.v.B., A.D., S.-B.H. and U.R.-K.; data curation, C.M.F., M.L. and S.-B.H.; writing—original draft preparation, C.M.F. and W.K.F.; writing—review and editing, C.M.F., W.K.F., S.-B.H., E.M. and A.T.; visualization, C.M.F. and S.-B.H.; supervision, W.K.F.; project administration, W.K.F.; funding acquisition, W.K.F., A.H. and M.v.B. All authors have read and agreed to the published version of the manuscript.

Funding

This work was supported by the German Federal Ministry of Education and Research (BMBF), Germany, IFB Adiposity Diseases, grant number FKZ: 01EO1501 (to W.K.F. and A.H.), and by the Deutsche Forschungsgemeinschaft (DFG, German Research Foundation) via the following grants: TRR333/1, AOBJ: 450149205 (to (W.K.F.), AOBJ: 624808 (to W.K.F.), AOBJ: 667675 (to W.K.F.), AOBJ: 676866 (to W.K.F.), and the Collaborative Research Center (CRC) 1052 (to A.H., M.v.B.). W.K.F. is additionally supported by grants from the Else Kroener Fresenius Foundation and the IFB Adiposity Disease supported by the German Federal Ministry of Education and Research (BMBF). M.v.B is grateful for funding by the DFG–Project-ID 403224013–SFB 1382- A05, and the work presented in this article is supported by Novo Nordisk Foundation, grant NNF21OC0066551. S.H., U.R.-K. and M.v.B. are grateful for the funding of the UFZ for the Pro-Metheus platform for proteomics and metabolomics.

Data Availability Statement

The authors confirm that the data supporting the findings of this study are available within the article and its Supplementary Materials.

Acknowledgments

We thank Tatjana Schütz and Cristina Göbbel for their contribution.

Conflicts of Interest

The authors declare no conflict of interest. The funders had no role in the design of the study; in the collection, analyses, or interpretation of data; in the writing of the manuscript, or in the decision to publish the results.

References

  1. Wing, R.R.; Bolin, P.; Brancati, F.L.; Bray, G.A.; Clark, J.M.; Coday, M.; Crow, R.S.; Curtis, J.M.; Egan, C.M.; Espeland, M.A.; et al. Cardiovascular effects of intensive lifestyle intervention in type 2 diabetes. N. Engl. J. Med. 2013, 369, 145–154. [Google Scholar] [CrossRef] [PubMed] [Green Version]
  2. Schauer, P.R.; Mingrone, G.; Ikramuddin, S.; Wolfe, B. Clinical Outcomes of Metabolic Surgery: Efficacy of Glycemic Control, Weight Loss, and Remission of Diabetes. Diabetes Care 2016, 39, 902–911. [Google Scholar] [CrossRef] [PubMed] [Green Version]
  3. Sjöström, L.; Peltonen, M.; Jacobson, P.; Ahlin, S.; Andersson-Assarsson, J.; Anveden, Å.; Bouchard, C.; Carlsson, B.; Karason, K.; Lönroth, H.; et al. Association of bariatric surgery with long-term remission of type 2 diabetes and with microvascular and macrovascular complications. JAMA 2014, 311, 2297–2304. [Google Scholar] [CrossRef] [PubMed] [Green Version]
  4. Gloy, V.L.; Briel, M.; Bhatt, D.L.; Kashyap, S.R.; Schauer, P.R.; Mingrone, G.; Bucher, H.C.; Nordmann, A.J. Bariatric surgery versus non-surgical treatment for obesity: A systematic review and meta-analysis of randomised controlled trials. BMJ 2013, 347, f5934. [Google Scholar] [CrossRef] [Green Version]
  5. Schauer, P.R.; Bhatt, D.L.; Kirwan, J.P.; Wolski, K.; Aminian, A.; Brethauer, S.A.; Navaneethan, S.D.; Singh, R.P.; Pothier, C.E.; Nissen, S.E.; et al. Bariatric Surgery versus Intensive Medical Therapy for Diabetes—5-Year Outcomes. N. Engl. J. Med. 2017, 376, 641–651. [Google Scholar] [CrossRef] [Green Version]
  6. Fakhry, T.K.; Mhaskar, R.; Schwitalla, T.; Muradova, E.; Gonzalvo, J.P.; Murr, M.M. Bariatric surgery improves nonalcoholic fatty liver disease: A contemporary systematic review and meta-analysis. Surg. Obes. Relat. Dis. 2019, 15, 502–511. [Google Scholar] [CrossRef]
  7. Dogan, K.; Betzel, B.; Homan, J.; Aarts, E.O.; Ploeger, N.; de Boer, H.; Aufenacker, T.J.; van Laarhoven, C.J.H.M.; Janssen, I.M.C.; Berends, F.J. Long-term effects of laparoscopic Roux-en-Y gastric bypass on diabetes mellitus, hypertension and dyslipidaemia in morbidly obese patients. Obes. Surg. 2014, 24, 1835–1842. [Google Scholar] [CrossRef]
  8. Welbourn, R.; Hollyman, M.; Kinsman, R.; Dixon, J.; Liem, R.; Ottosson, J.; Ramos, A.; Våge, V.; Al-Sabah, S.; Brown, W.; et al. Bariatric Surgery Worldwide: Baseline Demographic Description and One-Year Outcomes from the Fourth IFSO Global Registry Report 2018. Obes. Surg. 2019, 29, 782–795. [Google Scholar] [CrossRef] [Green Version]
  9. Adams, T.D.; Davidson, L.E.; Litwin, S.E.; Kim, J.; Kolotkin, R.L.; Nanjee, M.N.; Gutierrez, J.M.; Frogley, S.J.; Ibele, A.R.; Brinton, E.A.; et al. Weight and Metabolic Outcomes 12 Years after Gastric Bypass. N. Engl. J. Med. 2017, 377, 1143–1155. [Google Scholar] [CrossRef]
  10. El Ansari, W.; Elhag, W. Weight Regain and Insufficient Weight Loss After Bariatric Surgery: Definitions, Prevalence, Mechanisms, Predictors, Prevention and Management Strategies, and Knowledge Gaps-a Scoping Review. Obes. Surg. 2021, 31, 1755–1766. [Google Scholar] [CrossRef]
  11. Magro, D.O.; Geloneze, B.; Delfini, R.; Pareja, B.C.; Callejas, F.; Pareja, J.C. Long-term Weight Regain after Gastric Bypass: A 5-year Prospective Study. Obes. Surg. 2008, 18, 648–651. [Google Scholar] [CrossRef]
  12. Robinson, A.H.; Adler, S.; Stevens, H.B.; Darcy, A.M.; Morton, J.M.; Safer, D.L. What variables are associated with successful weight loss outcomes for bariatric surgery after 1 year? Surg. Obes. Relat. Dis. 2014, 10, 697–704. [Google Scholar] [CrossRef] [Green Version]
  13. Courcoulas, A.P.; King, W.C.; Belle, S.H.; Berk, P.; Flum, D.R.; Garcia, L.; Gourash, W.; Horlick, M.; Mitchell, J.E.; Pomp, A.; et al. Seven-Year Weight Trajectories and Health Outcomes in the Longitudinal Assessment of Bariatric Surgery (LABS) Study. JAMA Surg. 2018, 153, 427–434. [Google Scholar] [CrossRef]
  14. Monpellier, V.M.; Antoniou, E.E.; Aarts, E.O.; Janssen, I.M.C.; Jansen, A.T.M. Improvement of Health-Related Quality of Life After Roux-en-Y Gastric Bypass Related to Weight Loss. Obes. Surg. 2017, 27, 1168–1173. [Google Scholar] [CrossRef] [Green Version]
  15. Sundbom, M.; Hedberg, J.; Marsk, R.; Boman, L.; Bylund, A.; Hedenbro, J.; Laurenius, A.; Lundegårdh, G.; Möller, P.; Olbers, T.; et al. Substantial Decrease in Comorbidity 5 Years After Gastric Bypass: A Population-based Study from the Scandinavian Obesity Surgery Registry. Ann. Surg. 2017, 265, 1166–1171. [Google Scholar] [CrossRef] [Green Version]
  16. Kolotkin, R.L.; Andersen, J.R. A systematic review of reviews: Exploring the relationship between obesity, weight loss and health-related quality of life. Clin. Obes. 2017, 7, 273–289. [Google Scholar] [CrossRef] [Green Version]
  17. Andalib, A.; Alamri, H.; Almuhanna, Y.; Bouchard, P.; Demyttenaere, S.; Court, O. Short-term outcomes of revisional surgery after sleeve gastrectomy: A comparative analysis of re-sleeve, Roux en-Y gastric bypass, duodenal switch (Roux en-Y and single-anastomosis). Surg. Endosc. 2021, 35, 4644–4652. [Google Scholar] [CrossRef]
  18. Bonouvrie, D.S.; Uittenbogaart, M.; Luijten, A.A.P.M.; van Dielen, F.M.H.; Leclercq, W.K.G. Lack of Standard Definitions of Primary and Secondary (Non)responders After Primary Gastric Bypass and Gastric Sleeve: A Systematic Review. Obes. Surg. 2019, 29, 691–697. [Google Scholar] [CrossRef]
  19. Mann, J.P.; Jakes, A.D.; Hayden, J.D.; Barth, J.H. Systematic Review of Definitions of Failure in Revisional Bariatric Surgery. Obes. Surg. 2015, 25, 571–574. [Google Scholar] [CrossRef]
  20. Bittner, J.G.; Clingempeel, N.L.; Wolf, L.G. Weight Loss Failure and Reoperation After Laparoscopic Adjustable Gastric Banding and Gastric Bypass: A Case-Matched Cohort Study. Obes. Surg. 2017, 27, 2885–2889. [Google Scholar] [CrossRef]
  21. Melton, G.B.; Steele, K.E.; Schweitzer, M.A.; Lidor, A.O.; Magnuson, T.H. Suboptimal Weight Loss after Gastric Bypass Surgery: Correlation of Demographics, Comorbidities, and Insurance Status with Outcomes. J. Gastrointest. Surg. 2008, 12, 250–255. [Google Scholar] [CrossRef]
  22. Pinto-Bastos, A.; Conceição, E.M.; Machado, P.P.P. Reoperative Bariatric Surgery: A Systematic Review of the Reasons for Surgery, Medical and Weight Loss Outcomes, Relevant Behavioral Factors. Obes. Surg. 2017, 27, 2707–2715. [Google Scholar] [CrossRef]
  23. Sima, E.; Webb, D.-L.; Hellström, P.M.; Sundbom, M. Non-responders After Gastric Bypass Surgery for Morbid Obesity: Peptide Hormones and Glucose Homeostasis. Obes. Surg. 2019, 29, 4008–4017. [Google Scholar] [CrossRef] [PubMed] [Green Version]
  24. Vitolo, E.; Santini, E.; Seghieri, M.; Giannini, L.; Coppedè, F.; Rossi, C.; Dardano, A.; Solini, A. Heterozygosity for the rs696217 SNP in the Preproghrelin Gene Predicts Weight Loss After Bariatric Surgery in Severely Obese Individuals. Obes. Surg. 2017, 27, 961–967. [Google Scholar] [CrossRef] [PubMed]
  25. Bandstein, M.; Voisin, S.; Nilsson, E.K.; Schultes, B.; Ernst, B.; Thurnheer, M.; Benedict, C.; Mwinyi, J.; Schiöth, H.B. A Genetic Risk Score Is Associated with Weight Loss Following Roux-en Y Gastric Bypass Surgery. Obes. Surg. 2016, 26, 2183–2189. [Google Scholar] [CrossRef] [Green Version]
  26. Kaouk, L.; Hsu, A.T.; Tanuseputro, P.; Jessri, M. Modifiable factors associated with weight regain after bariatric surgery: A scoping review. F1000Research 2019, 8, 615. [Google Scholar] [CrossRef]
  27. Karmali, S.; Brar, B.; Shi, X.; Sharma, A.M.; De Gara, C.; Birch, D.W. Weight Recidivism Post-Bariatric Surgery: A Systematic Review. Obes. Surg. 2013, 23, 1922–1933. [Google Scholar] [CrossRef]
  28. Herzog, K.; Berggren, J.; Al Majdoub, M.; Arroyo, C.B.; Lindqvist, A.; Hedenbro, J.; Groop, L.; Wierup, N.; Spégel, P. Metabolic Effects of Gastric Bypass Surgery: Is It All About Calories? Diabetes 2020, 69, 2027–2035. [Google Scholar] [CrossRef]
  29. Schlottmann, F.; Galvarini, M.M.; Dreifuss, N.H.; Laxague, F.; Buxhoeveden, R.; Gorodner, V. Metabolic Effects of Bariatric Surgery. J. Laparoendosc. Adv. Surg. Tech. 2018, 28, 944–948. [Google Scholar] [CrossRef]
  30. Xu, G.; Song, M. Recent advances in the mechanisms underlying the beneficial effects of bariatric and metabolic surgery. Surg. Obes. Relat. Dis. 2021, 17, 231–238. [Google Scholar] [CrossRef]
  31. Liu, R.; Hong, J.; Xu, X.; Feng, Q.; Zhang, D.; Gu, Y.; Shi, J.; Zhao, S.; Liu, W.; Wang, X.; et al. Gut microbiome and serum metabolome alterations in obesity and after weight-loss intervention. Nat. Med. 2017, 23, 859–868. [Google Scholar] [CrossRef]
  32. Haange, S.-B.; Jehmlich, N.; Krügel, U.; Hintschich, C.; Wehrmann, D.; Hankir, M.; Seyfried, F.; Froment, J.; Hübschmann, T.; Müller, S.; et al. Gastric bypass surgery in a rat model alters the community structure and functional composition of the intestinal microbiota independently of weight loss. Microbiome 2020, 8, 13. [Google Scholar] [CrossRef] [PubMed]
  33. Chen, J.; Haase, N.; Haange, S.-B.; Sucher, R.; Münzker, J.; Jäger, E.; Schischke, K.; Seyfried, F.; von Bergen, M.; Hankir, M.K.; et al. Roux-en-Y gastric bypass contributes to weight loss-independent improvement in hypothalamic inflammation and leptin sensitivity through gut-microglia-neuron-crosstalk. Mol. Metab. 2021, 48, 101214. [Google Scholar] [CrossRef] [PubMed]
  34. Medawar, E.; Haange, S.-B.; Rolle-Kampczyk, U.; Engelmann, B.; Dietrich, A.; Thieleking, R.; Wiegank, C.; Fries, C.; Horstmann, A.; Villringer, A.; et al. Gut microbiota link dietary fiber intake and short-chain fatty acid metabolism with eating behavior. Transl. Psychiatry 2021, 11, 500. [Google Scholar] [CrossRef] [PubMed]
  35. Liou, A.P.; Paziuk, M.; Luevano, J.-M.; Machineni, S.; Turnbaugh, P.J.; Kaplan, L.M. Conserved shifts in the gut microbiota due to gastric bypass reduce host weight and adiposity. Sci. Transl. Med. 2013, 5, 178ra41. [Google Scholar] [CrossRef] [PubMed] [Green Version]
  36. Ryan, K.K.; Tremaroli, V.; Clemmensen, C.; Kovatcheva-Datchary, P.; Myronovych, A.; Karns, R.; Wilson-Pérez, H.E.; Sandoval, D.A.; Kohli, R.; Bäckhed, F.; et al. FXR is a molecular target for the effects of vertical sleeve gastrectomy. Nature 2014, 509, 183–188. [Google Scholar] [CrossRef] [Green Version]
  37. Albaugh, V.L.; Banan, B.; Antoun, J.; Xiong, Y.; Guo, Y.; Ping, J.; Alikhan, M.; Clements, B.A.; Abumrad, N.N.; Flynn, C.R. Role of Bile Acids and GLP-1 in Mediating the Metabolic Improvements of Bariatric Surgery. Gastroenterology 2019, 156, 1041–1051.e4. [Google Scholar] [CrossRef] [Green Version]
  38. Flynn, C.R.; Albaugh, V.L.; Abumrad, N.N. Metabolic Effects of Bile Acids: Potential Role in Bariatric Surgery. Cell. Mol. Gastroenterol. Hepatol. 2019, 8, 235–246. [Google Scholar] [CrossRef] [Green Version]
  39. Flynn, C.R.; Albaugh, V.L.; Cai, S.; Cheung-Flynn, J.; Williams, P.E.; Brucker, R.M.; Bordenstein, S.R.; Guo, Y.; Wasserman, D.H.; Abumrad, N.N. Bile diversion to the distal small intestine has comparable metabolic benefits to bariatric surgery. Nat. Commun. 2015, 6, 7715. [Google Scholar] [CrossRef]
  40. Riddle, M.C.; Cefalu, W.T.; Evans, P.H.; Gerstein, H.C.; Nauck, M.A.; Oh, W.K.; Rothberg, A.E.; Le Roux, C.W.; Rubino, F.; Schauer, P.; et al. Consensus Report: Definition and Interpretation of Remission in Type 2 Diabetes. J. Clin. Endocrinol. Metab. 2022, 107, 1–9. [Google Scholar] [CrossRef]
  41. Al-Khyatt, W.; Ryall, R.; Leeder, P.; Ahmed, J.; Awad, S. Predictors of Inadequate Weight Loss After Laparoscopic Gastric Bypass for Morbid Obesity. Obes. Surg. 2017, 27, 1446–1452. [Google Scholar] [CrossRef]
  42. Colles, S.L.; Dixon, J.B.; O’Brien, P.E. Grazing and loss of control related to eating: Two high-risk factors following bariatric surgery. Obesity 2008, 16, 615–622. [Google Scholar] [CrossRef]
  43. Freire, R.H.; Borges, M.C.; Alvarez-Leite, J.I.; Correia, M.I.T.D. Food quality, physical activity, and nutritional follow-up as determinant of weight regain after Roux-en-Y gastric bypass. Nutrition 2012, 28, 53–58. [Google Scholar] [CrossRef]
  44. Kalarchian, M.A.; Marcus, M.D.; Wilson, G.T.; Labouvie, E.W.; Brolin, R.E.; LaMarca, L.B. Binge eating among gastric bypass patients at long-term follow-up. Obes. Surg. 2002, 12, 270–275. [Google Scholar] [CrossRef]
  45. Hilbert, A.; de Zwaan, M.; Braehler, E. How frequent are eating disturbances in the population? Norms of the eating disorder examination-questionnaire. PLoS ONE 2012, 7, e29125. [Google Scholar] [CrossRef] [Green Version]
  46. Yoshino, M.; Kayser, B.D.; Yoshino, J.; Stein, R.I.; Reeds, D.; Eagon, J.C.; Eckhouse, S.R.; Watrous, J.D.; Jain, M.; Knight, R.; et al. Effects of Diet versus Gastric Bypass on Metabolic Function in Diabetes. N. Engl. J. Med. 2020, 383, 721–732. [Google Scholar] [CrossRef]
  47. Haskins, I.N.; Corcelles, R.; Froylich, D.; Boules, M.; Hag, A.; Burguera, B.; Schauer, P.R.; Kroh, M.; Brethauer, S.A. Primary Inadequate Weight Loss After Roux-en-Y Gastric Bypass Is not Associated with Poor Cardiovascular or Metabolic Outcomes: Experience from a Single Institution. Obes. Surg. 2017, 27, 676–680. [Google Scholar] [CrossRef]
  48. Gil, S.; Goessler, K.; Dantas, W.S.; Murai, I.H.; Merege-Filho, C.A.A.; Pereira, R.M.R.; de Cleva, R.; Santo, M.A.; Kirwan, J.P.; Roschel, H.; et al. Constraints of Weight Loss as a Marker of Bariatric Surgery Success: An Exploratory Study. Front. Physiol. 2021, 12, 640191. [Google Scholar] [CrossRef]
  49. Ryan, D.H.; Yockey, S.R. Weight Loss and Improvement in Comorbidity: Differences at 5%, 10%, 15%, and over. Curr. Obes. Rep. 2017, 6, 187–194. [Google Scholar] [CrossRef]
  50. Magkos, F.; Fraterrigo, G.; Yoshino, J.; Luecking, C.; Kirbach, K.; Kelly, S.C.; de Las Fuentes, L.; He, S.; Okunade, A.L.; Patterson, B.W.; et al. Effects of Moderate and Subsequent Progressive Weight Loss on Metabolic Function and Adipose Tissue Biology in Humans with Obesity. Cell Metab. 2016, 23, 591–601. [Google Scholar] [CrossRef] [Green Version]
  51. Hankir, M.K.; Seyfried, F.; Miras, A.D.; Cowley, M.A. Brain Feeding Circuits after Roux-en-Y Gastric Bypass. Trends Endocrinol. Metab. 2018, 29, 218–237. [Google Scholar] [CrossRef] [Green Version]
  52. Hao, Z.; Townsend, R.L.; Mumphrey, M.B.; Patterson, L.M.; Ye, J.; Berthoud, H.-R. Vagal innervation of intestine contributes to weight loss After Roux-en-Y gastric bypass surgery in rats. Obes. Surg. 2014, 24, 2145–2151. [Google Scholar] [CrossRef] [Green Version]
  53. Mokadem, M.; Zechner, J.F.; Margolskee, R.F.; Drucker, D.J.; Aguirre, V. Effects of Roux-en-Y gastric bypass on energy and glucose homeostasis are preserved in two mouse models of functional glucagon-like peptide-1 deficiency. Mol. Metab. 2014, 3, 191–201. [Google Scholar] [CrossRef]
  54. Ye, J.; Hao, Z.; Mumphrey, M.B.; Townsend, R.L.; Patterson, L.M.; Stylopoulos, N.; Münzberg, H.; Morrison, C.D.; Drucker, D.J.; Berthoud, H.-R. GLP-1 receptor signaling is not required for reduced body weight after RYGB in rodents. Am. J. Physiol. Regul. Integr. Comp. Physiol. 2014, 306, R352–R362. [Google Scholar] [CrossRef] [Green Version]
  55. Salehi, M.; Gastaldelli, A.; D’Alessio, D.A. Blockade of glucagon-like peptide 1 receptor corrects postprandial hypoglycemia after gastric bypass. Gastroenterology 2014, 146, 669–680.e2. [Google Scholar] [CrossRef] [Green Version]
  56. Shah, M.; Law, J.H.; Micheletto, F.; Sathananthan, M.; Man, C.D.; Cobelli, C.; Rizza, R.A.; Camilleri, M.; Zinsmeister, A.R.; Vella, A. Contribution of endogenous glucagon-like peptide 1 to glucose metabolism after Roux-en-Y gastric bypass. Diabetes 2014, 63, 483–493. [Google Scholar] [CrossRef] [Green Version]
  57. Psichas, A.; Sleeth, M.L.; Murphy, K.G.; Brooks, L.; Bewick, G.A.; Hanyaloglu, A.C.; Ghatei, M.A.; Bloom, S.R.; Frost, G. The short chain fatty acid propionate stimulates GLP-1 and PYY secretion via free fatty acid receptor 2 in rodents. Int. J. Obes. 2015, 39, 424–429. [Google Scholar] [CrossRef] [Green Version]
  58. Fouladi, F.; Brooks, A.E.; Fodor, A.A.; Carroll, I.M.; Bulik-Sullivan, E.C.; Tsilimigras, M.C.B.; Sioda, M.; Steffen, K.J. The Role of the Gut Microbiota in Sustained Weight Loss Following Roux-en-Y Gastric Bypass Surgery. Obes. Surg. 2019, 29, 1259–1267. [Google Scholar] [CrossRef] [Green Version]
  59. Lu, Y.; Fan, C.; Li, P.; Lu, Y.; Chang, X.; Qi, K. Short Chain Fatty Acids Prevent High-fat-diet-induced Obesity in Mice by Regulating G Protein-coupled Receptors and Gut Microbiota. Sci. Rep. 2016, 6, 37589. [Google Scholar] [CrossRef] [PubMed] [Green Version]
  60. Zhu, X.; Zhang, X.; Gao, X.; Yi, Y.; Hou, Y.; Meng, X.; Jia, C.; Chao, B.; Fan, W.; Li, X.; et al. Effects of Inulin Propionate Ester on Obesity-Related Metabolic Syndrome and Intestinal Microbial Homeostasis in Diet-Induced Obese Mice. ACS Omega 2020, 5, 12865–12876. [Google Scholar] [CrossRef]
  61. Chambers, E.S.; Viardot, A.; Psichas, A.; Morrison, D.J.; Murphy, K.G.; Zac-Varghese, S.E.K.; MacDougall, K.; Preston, T.; Tedford, C.; Finlayson, G.S.; et al. Effects of targeted delivery of propionate to the human colon on appetite regulation, body weight maintenance and adiposity in overweight adults. Gut 2015, 64, 1744–1754. [Google Scholar] [CrossRef] [PubMed] [Green Version]
  62. Kuipers, F.; Bloks, V.W.; Groen, A.K. Beyond intestinal soap--bile acids in metabolic control. Nat. Rev. Endocrinol. 2014, 10, 488–498. [Google Scholar] [CrossRef] [PubMed]
  63. Thomas, C.; Gioiello, A.; Noriega, L.; Strehle, A.; Oury, J.; Rizzo, G.; Macchiarulo, A.; Yamamoto, H.; Mataki, C.; Pruzanski, M.; et al. TGR5-mediated bile acid sensing controls glucose homeostasis. Cell Metab. 2009, 10, 167–177. [Google Scholar] [CrossRef] [PubMed] [Green Version]
  64. Lefebvre, P.; Cariou, B.; Lien, F.; Kuipers, F.; Staels, B. Role of bile acids and bile acid receptors in metabolic regulation. Physiol. Rev. 2009, 89, 147–191. [Google Scholar] [CrossRef] [Green Version]
  65. Hylemon, P.B.; Zhou, H.; Pandak, W.M.; Ren, S.; Gil, G.; Dent, P. Bile acids as regulatory molecules. J. Lipid Res. 2009, 50, 1509–1520. [Google Scholar] [CrossRef] [Green Version]
  66. McGavigan, A.K.; Garibay, D.; Henseler, Z.M.; Chen, J.; Bettaieb, A.; Haj, F.G.; Ley, R.E.; Chouinard, M.L.; Cummings, B.P. TGR5 contributes to glucoregulatory improvements after vertical sleeve gastrectomy in mice. Gut 2017, 66, 226–234. [Google Scholar] [CrossRef] [Green Version]
  67. Browning, M.G.; Pessoa, B.M.; Khoraki, J.; Campos, G.M. Changes in Bile Acid Metabolism, Transport, and Signaling as Central Drivers for Metabolic Improvements After Bariatric Surgery. Curr. Obes. Rep. 2019, 8, 175–184. [Google Scholar] [CrossRef]
  68. Ahmad, N.N.; Pfalzer, A.; Kaplan, L.M. Roux-en-Y gastric bypass normalizes the blunted postprandial bile acid excursion associated with obesity. Int. J. Obes. 2013, 37, 1553–1559. [Google Scholar] [CrossRef] [Green Version]
  69. Tremaroli, V.; Karlsson, F.; Werling, M.; Ståhlman, M.; Kovatcheva-Datchary, P.; Olbers, T.; Fändriks, L.; Le Roux, C.W.; Nielsen, J.; Bäckhed, F. Roux-en-Y Gastric Bypass and Vertical Banded Gastroplasty Induce Long-Term Changes on the Human Gut Microbiome Contributing to Fat Mass Regulation. Cell Metab. 2015, 22, 228–238. [Google Scholar] [CrossRef] [Green Version]
  70. Nakatani, H.; Kasama, K.; Oshiro, T.; Watanabe, M.; Hirose, H.; Itoh, H. Serum bile acid along with plasma incretins and serum high-molecular weight adiponectin levels are increased after bariatric surgery. Metabolism 2009, 58, 1400–1407. [Google Scholar] [CrossRef]
  71. Pournaras, D.J.; Glicksman, C.; Vincent, R.P.; Kuganolipava, S.; Alaghband-Zadeh, J.; Mahon, D.; Bekker, J.H.R.; Ghatei, M.A.; Bloom, S.R.; Walters, J.R.F.; et al. The role of bile after Roux-en-Y gastric bypass in promoting weight loss and improving glycaemic control. Endocrinology 2012, 153, 3613–3619. [Google Scholar] [CrossRef] [Green Version]
  72. Simonen, M.; Dali-Youcef, N.; Kaminska, D.; Venesmaa, S.; Käkelä, P.; Pääkkönen, M.; Hallikainen, M.; Kolehmainen, M.; Uusitupa, M.; Moilanen, L.; et al. Conjugated bile acids associate with altered rates of glucose and lipid oxidation after Roux-en-Y gastric bypass. Obes. Surg. 2012, 22, 1473–1480. [Google Scholar] [CrossRef] [Green Version]
  73. Higashi, T.; Watanabe, S.; Tomaru, K.; Yamazaki, W.; Yoshizawa, K.; Ogawa, S.; Nagao, H.; Minato, K.; Maekawa, M.; Mano, N. Unconjugated bile acids in rat brain: Analytical method based on LC/ESI-MS/MS with chemical derivatization and estimation of their origin by comparison to serum levels. Steroids 2017, 125, 107–113. [Google Scholar] [CrossRef]
  74. Castellanos-Jankiewicz, A.; Guzmán-Quevedo, O.; Fénelon, V.S.; Zizzari, P.; Quarta, C.; Bellocchio, L.; Tailleux, A.; Charton, J.; Fernandois, D.; Henricsson, M.; et al. Hypothalamic bile acid-TGR5 signaling protects from obesity. Cell Metab. 2021, 33, 1483–1492.e10. [Google Scholar] [CrossRef]
  75. Ockenga, J.; Valentini, L.; Schuetz, T.; Wohlgemuth, F.; Glaeser, S.; Omar, A.; Kasim, E.; duPlessis, D.; Featherstone, K.; Davis, J.R.; et al. Plasma bile acids are associated with energy expenditure and thyroid function in humans. J. Clin. Endocrinol. Metab. 2012, 97, 535–542. [Google Scholar] [CrossRef] [Green Version]
  76. Patti, M.-E.; Houten, S.M.; Bianco, A.C.; Bernier, R.; Larsen, P.R.; Holst, J.J.; Badman, M.K.; Maratos-Flier, E.; Mun, E.C.; Pihlajamaki, J.; et al. Serum bile acids are higher in humans with prior gastric bypass: Potential contribution to improved glucose and lipid metabolism. Obesity 2009, 17, 1671–1677. [Google Scholar] [CrossRef] [Green Version]
  77. Chambers, E.S.; Byrne, C.S.; Aspey, K.; Chen, Y.; Khan, S.; Morrison, D.J.; Frost, G. Acute oral sodium propionate supplementation raises resting energy expenditure and lipid oxidation in fasted humans. Diabetes Obes. Metab. 2018, 20, 1034–1039. [Google Scholar] [CrossRef]
  78. Ben Izhak, M.; Eshel, A.; Cohen, R.; Madar-Shapiro, L.; Meiri, H.; Wachtel, C.; Leung, C.; Messick, E.; Jongkam, N.; Mavor, E.; et al. Projection of Gut Microbiome Pre- and Post-Bariatric Surgery to Predict Surgery Outcome. mSystems 2021, 6, e0136720. [Google Scholar] [CrossRef]
  79. Kootte, R.S.; Levin, E.; Salojärvi, J.; Smits, L.P.; Hartstra, A.V.; Udayappan, S.D.; Hermes, G.; Bouter, K.E.; Koopen, A.M.; Holst, J.J.; et al. Improvement of Insulin Sensitivity after Lean Donor Feces in Metabolic Syndrome Is Driven by Baseline Intestinal Microbiota Composition. Cell Metab. 2017, 26, 611–619.e6. [Google Scholar] [CrossRef] [Green Version]
  80. Olsson, L.M.; Boulund, F.; Nilsson, S.; Khan, M.T.; Gummesson, A.; Fagerberg, L.; Engstrand, L.; Perkins, R.; Uhlén, M.; Bergström, G.; et al. Dynamics of the normal gut microbiota: A longitudinal one-year population study in Sweden. Cell Host Microbe 2022, in press. [Google Scholar] [CrossRef]
  81. Larsen, O.F.A.; Claassen, E.; Brummer, R.J. On the importance of intraindividual variation in nutritional research. Benef. Microbes 2020, 11, 511–517. [Google Scholar] [CrossRef] [PubMed]
  82. de Cleva, R.; Mota, F.C.; Gadducci, A.V.; Cardia, L.; D’Andréa Greve, J.M.; Santo, M.A. Resting metabolic rate and weight loss after bariatric surgery. Surg. Obes. Relat. Dis. 2018, 14, 803–807. [Google Scholar] [CrossRef] [PubMed]
  83. Faria, S.L.; Kelly, E.; Faria, O.P. Energy expenditure and weight regain in patients submitted to Roux-en-Y gastric bypass. Obes. Surg. 2009, 19, 856–859. [Google Scholar] [CrossRef] [PubMed]
  84. Callahan, B.J.; McMurdie, P.J.; Rosen, M.J.; Han, A.W.; Johnson, A.J.A.; Holmes, S.P. DADA2: High-resolution sample inference from Illumina amplicon data. Nat. Methods 2016, 13, 581–583. [Google Scholar] [CrossRef] [Green Version]
  85. Cole, J.R.; Wang, Q.; Fish, J.A.; Chai, B.; McGarrell, D.M.; Sun, Y.; Brown, C.T.; Porras-Alfaro, A.; Kuske, C.R.; Tiedje, J.M. Ribosomal Database Project: Data and tools for high throughput rRNA analysis. Nucleic Acids Res. 2014, 42, D633–D642. [Google Scholar] [CrossRef] [Green Version]
  86. Dixon, P. VEGAN, a package of R functions for community ecology. J. Veg. Sci. 2003, 14, 927–930. [Google Scholar] [CrossRef]
  87. Benjamini, Y.; Hochberg, Y. Controlling the False Discovery Rate: A Practical and Powerful Approach to Multiple Testing. J. R. Stat. Soc. Ser. B 1995, 57, 289–300. [Google Scholar] [CrossRef]
  88. Wickham, H. ggplot2. WIREs Comp. Stat. 2011, 3, 180–185. [Google Scholar] [CrossRef]
  89. Han, J.; Lin, K.; Sequeira, C.; Borchers, C.H. An isotope-labeled chemical derivatization method for the quantitation of short-chain fatty acids in human feces by liquid chromatography-tandem mass spectrometry. Anal. Chim. Acta 2015, 854, 86–94. [Google Scholar] [CrossRef]
Figure 1. Relative and absolute proportion of patients in our cohort with and without (pre)diabetes. (A) Type 2 diabetes prevalence and remission status of both responder groups at follow up. (B) Hemoglobin A1c level independent of diabetes medication before RYGB intervention and at follow up. (C) Antidiabetic medication before RYGB intervention and at follow up. BR, bad responder group; GR, good responder group; HbA1c, hemoglobin A1c; RYGB, Roux-en-Y gastric bypass.
Metabolites 12 00417 g001aMetabolites 12 00417 g001b
Figure 2. Visual analogue scale (VAS) data of hunger, satiety and palatability ratings (AC) and gut hormone concentration (FJ) during standardized mixed-meal test at time points 15, 30, 60 and 120 min after ingestion of a test meal in the good and bad responder groups. Leptin and ghrelin levels (G,H) shown after baseline correction to account for weight-dependent effects. Data presented as median ± IQR (A,B,DH); Boxplot of Palatability (whiskers 1.5 × IQR). Incremental areas under the curve (iAUC) ± S.E.M. for hunger and satiety and gut hormones (KO).
Metabolites 12 00417 g002
Figure 3. Circulating metabolites at fasted state and in response to a standardized meal test in patients with extreme weight loss response to RYGB. Three short chain fatty acids were quantifiable (propionate, valerate and acetate). Concentration of propionate (A) and valerate (B) are illustrated before (0 min) and 30, 60 and 120 min after ingestion of the liquid test meal with significance values calculated by Kruskal–Wallis test with pairwise post-hoc Dunn’s test. Values with different letters (a, b, c) are significant to each other. Beta-diversity based on principal component analysis of amino acid and biogenic amine pool in good and bad responders (C,D) after RYGB. Significance calculated by PERMANOVA. (E) depicts relative abundance (z-scores) of amino acids and biogenic amines measured before (0 min) and 30, 60 and 120 min after ingestion of the liquid test meal.
Metabolites 12 00417 g003aMetabolites 12 00417 g003b
Figure 4. Serum bile acid concentrations in extreme weight loss responders to RYGB surgery. Principal component analyses of serum bile acid levels in good and bad responders (A,B) after RYGB surgery. Significance calculated by PERMANOVA (C) shows total unconjugated and conjugated fasting bile acid concentrations in good and bad responder groups which were further divided into primary and secondary bile acid species (D). Individual fasting bile acid concentrations shown in (E,F). Data shown as mean ± SEM. Group comparisons were performed with Student’s t-test. The symbol * indicates a p-value ≤ 0.05. CBA, conjugated bile acids; CpBA, conjugated primary bile acids; CsBA, conjugated secondary bile acids; UBA, unconjugated bile acids; UpBA, unconjugated primary bile acids; UsBA, unconjugated secondary bile acids; CA, cholic acid; CDCA, chenodeoxycholic acid; α-MCA, α-Muricholic acid; β-MCA, beta-Muricholic acid; DCA, Deoxycholic acid; HDCA, Hyodeoxycholic acid; LCA, Lithocholic acid; ω-MCA, ω-Muricholic acid; UDCA, Ursodeoxycholic acid; GCA, glycocholic acid; GCDCA, glycochenodeoxycholic acid; TCA, Taurocholic acid; TCDCA, Taurochenodeoxycholic Acid; TMCA (α+β), Tauro-muricholic acid; GLCA, glycolithocholic acid; GUDCA, Glycoursodeoxycholic acid; TDCA, Taurodeoxycholic acid; TLCA, Taurolithocholic acid; TUDCA, Tauroursodeoxycholic acid.
Metabolites 12 00417 g004aMetabolites 12 00417 g004b
Figure 5. Serum bile acid levels in response to a standardized meal test after 0, 30, 60 and 120 min of ingestion in good and bad responders. (AH) depicts concentrations of individual bile acid species measured in serum. Significance calculated by Kruskal–Wallis test with pairwise post-hoc Dunn’s test. Significance calculated by Kruskal–Wallis set with post-hoc pairwise Dunn’s test. Different letters (a–d) between values signify significant differences. GCA, glycocholic acid; GCDCA, glycochenodeoxycholic acid; GDCA, Glycodeoxycholic acid; GUDCA, Glycoursodeoxycholic acid; TCA, Taurocholic acid; TCDCA, Taurochenodeoxycholic Acid; TLCA, Taurolithocholic acid; TMCA (α+β), Tauro-muricholic acid.
Metabolites 12 00417 g005
Table 1. Anthropometric data, eating behavior and metabolic profile of the study cohort (n = 23).
Good Responder
n = 11
Bad Responder
n = 12
Good Responder vs.
Bad Responder
Clinical Characteristics
Sex (female/male)—n (%)7 (64)/4 (36)9 (75)/3 (25)
Smokers—n (%)4 (36)2 (17)
Diabetic—n (%)
 Before surgery (reported/A1c > 6.5%)
 After surgery (reported/A1c > 6.5%)
4 (36)/4 (36)
2 (18)/1 (9)
6 (50)/3 (25)
4 (33)/(3 (25)
mean/median *SD/IQR *mean/medianSD/IQRp-value
Education Years—yr 1313–15.5 1313––13 0.26
Age at test date—yr 52.9± 9.554.1± 10.60.78
Time after surgery—yr 4.3± 1.24.6± 1.50.60
Excess Weight Loss (EWL) at test date—% 93.0± 4.319.5± 13.3 <0.0001
Body weight—kg
 Before surgery
 Nadir
 At test date
 Change from baseline

133.4
69.9
76.6
−56.8

± 22.4
± 5.8
± 7.6
± 18.6

145.7
110.4
130.3
−15.5

± 19.5
± 15.9
± 17.6
± 10.9

0.17
<0.0001
<0.0001
<0.0001
BMI—kg/m2
 Before surgery
 Nadir
 At test date
 Change from baseline

46.5
24.4
26.6
−19.8

± 7.5
± 1.8
± 1.2
± 6.7

52.7
39.9
47.2
−5.5

± 6.6
± 4.4
± 6.4
± 3.9

0.04
<0.0001
<0.0001
<0.0001
Questionnaire Scores at test date
Fat and Sugar Intake (DFS-Q All)
 Fat
 Sugar
 Fat and Sugar
50
23
9.8
16.3
± 10
± 3.9
± 3.4
± 4.7
47
24
10.7
12.8
± 6.1
± 4.6
± 4.0
± 4.3
0.43
0.71
0.59
0.09
Emotional Eating (DEB-Q-EE)1.51.0–2.22.01.1–2.9 0.54
Chronic Stress (TICS)1410–19 157.3–18 0.91
Metabolic Profile
Alanine transaminase—μkat/L
 Before surgery
 At test date
 Change from baseline

0.42
0.40
−0.05

0.33–0.92
0.29–0.47
−0.49 to 0.03

0.56
0.34
−0.2

0.38–1.1
0.31–0.66
−0.64 to −0.02

0.48
0.76
0.28
γ-glutamyl transferase—μkat/L
 Before surgery
 At test date
 Change from baseline

0.40
0.21
−0.17

0.28–0.70
0.13–0.42
−0.33 to −0.1

0.53
0.41
−0.12

0.360.79
0.25–1.20
−0.20 to 0.32

0.52
0.05
0.16
Fasting Glucose—mmol/L
 Before surgery
 At test date
 Change from baseline

5.7
5.0
−0.62

4.9–7.3
4.6–5.3
−2.3 to −0.1

6.5
5.4
−0.31

5.2–11
5.2–8.5
−2.5 to 0.03

0.24
0.02
0.69
Hemoglobin A1c—%
 Before surgery
 At test date
 Change from baseline

5.6
5.0
−0.32

5.0–7.0
4.8–5.6
−1.56 to −0.07

5.6
5.7
−0.4

5.3–8.5
5.2–6.6
−1.79 to 0.32

0.55
0.03
0.99
Insulin Resistance (HOMA-IR)
 Before surgery
 At test date
 Change from baseline

4.9
1.6
−2.6

2.4–18
1.1–2.5
−13.5 to −0.7

6.3
2.7
−3.3

3.9–11
1.8–3.1
−6.2 to −1.2

0.56
0.09
0.99
Triglycerides—mmol/L
 Before surgery
 At test date
 Change from baseline

1.3
0.94
−0.4

0.97–1.7
0.63–1.2
−0.64 to −0.08

1.4
1.3
−0.17

0.95–3.3
1.2–1.3
−1.78 to 0.15

0.85
0.02
0.69
Low Density Lipoprotein—mmol/L
 Before surgery
 At test date
 Change from baseline

2.5
2.2
−0.29

± 0.57
± 0.54
± 0.62

2.9
2.5
−0.48

± 1.3
± 0.57
± 0.93

0.37
0.28
0.58
High Density Lipoprotein—mmol/L
 Before surgery
 At test date
 Change from baseline

0.93
1.5
0.6

± 0.23
± 0.33
± 0.27

1.1
1.5
0.28

0.26
± 0.33
±0.3

0.09
0.70
0.02
C-reactive Protein—mg/L
 Before surgery
 At test date
 Change from baseline

5.0
0.3
−3.5

1.6–7.9
0.3–0.3
−7.6 to −1.3

9.7
2.0
−5.0

4.9–20
1.3–13
−9.9 to 2.0

0.10
<0.0001
0.79
* Data are presented as median and interquartile range (IQR) for non-normally distributed parameters and mean ± standard deviation (SD) for normally distributed parameters. Values with range are median and IQR, plus–minus values are means ± SD. Significant values p < 0.05 are printed in bold. Laboratory values are expressed in SI-values. Questionnaires: Dutch Eating Behaviour Questionnaire–Emotional Eating subscale (DEBQ-EE); Dietary Fat and Free Sugar Questionnaire ((DFS); Trier Inventory for Chronic Stress Screening Scale (TICS). BMI, body mass index; CRP, C-reactive protein; excess weight loss; HOMA-IR, homeostasis model assessment for insulin resistance; kg, kilograms; yr, years.
Publisher’s Note: MDPI stays neutral with regard to jurisdictional claims in published maps and institutional affiliations.

