A Comprehensive IoT Node Proposal Using Open Hardware. A Smart Farming Use Case to Monitor Vineyards


Institute of New Imaging Technologies, Universitat Jaume I, Av. Vicente Sos Baynat s/n, 12071 Castellón de la Plana, Spain
*
Author to whom correspondence should be addressed.
Electronics 2018, 7(12), 419; https://doi.org/10.3390/electronics7120419
Submission received: 17 November 2018
/
Revised: 29 November 2018
/
Accepted: 4 December 2018
/
Published: 10 December 2018
(This article belongs to the Special Issue Open-Source Electronics Platforms: Development and Applications)
Abstract
:The last decade has witnessed a significant reduction in prices and an increased performance of electronic components, coupled with the influence of the shift towards the generation of open resources, both in terms of knowledge (open access), programs (open-source software), and components (open hardware). This situation has produced different effects in today’s society, among which is the empowerment of citizens, called makers, who are themselves able to generate citizen science or build assembly developments. Situated in the context described above, the current study follows a Do-It-Yourself (DIY) approach. In this way, it attempts to define a conceptual design of an Internet of Things (IoT) node, which is reproducible at both physical and behavioral levels, to build IoT nodes which can cover any scenario. To test this conceptual design, this study proposes a sensorization node to monitor meteorological phenomena. The node is called SEnviro (node) and features different improvements such as: the possibility of remote updates using Over-the-Air (OTA) updates; autonomy, using 3G connectivity, a solar panel, and applied energy strategies to prolong its life; and replicability, because it is made up of open hardware and other elements such as 3D-printed pieces. The node is validated in the field of smart agriculture, with the aim of monitoring different meteorological phenomena, which will be used as input to disease detection models to detect possible diseases within vineyards.
1. Introduction
More than 15 years ago, initiatives such as Arduino [1] constituted the first project to enable citizens to make their own prototypes. Subsequently numerous initiatives appeared, such as Raspberry PI [2], Beaglebone [3] and PCduino [4], among others. Similar to Arduino, all these projects were characterized by making their schematics available; this is known as open hardware [5]. In addition to the open-hardware movement, there has also been a significant drop in the price of these types of hardware platforms [6], thanks to advances in semiconductor manufacturing technology. These platforms have become more affordable and have been distributed efficiently, due to the open-source distribution policy.
All of this means that these open-hardware platforms are very well known in our day-to-day activities [5]. A large number of projects have been developed, which bring end users closer to electronics in a fast and straightforward way [7,8]. This approach is summarized in the Do-It-Yourself (DIY) initiative, where the end user becomes the consumer and creator of these technologies and projects, thus eliminating structural, technological, and economic obstacles [9]. In recent years, initiatives such as Instructables [10], Make Magazine [11], OpenMaterials [12], Adafruit [13] and Sparkfun [14] have appeared, offering tutorials and instructions on how to use these open-hardware components.
The spread of this movement has aided the proliferation of devices which are always connected to the Internet, either directly or through a gateway, called Internet of Things (IoT) devices [15,16]. This proliferation has led to a real revolution, within environments such as industry, which has generated a new industrial model, called Industry 4.0 [17], where everything is connected to everything. Many projects with open-hardware devices have been used in the industrial domain and in others, such as smart cities [18], healthcare [19], agriculture [20] and the domotics [21], among others.
To connect these IoT devices to a server to manage them and handle all their functionalities, wire or wireless communication is required. For this purpose, all open-hardware platforms have been adapted to support technologies such as Bluetooth, Zigbee, Wi-Fi and 3-5G, among others [22]. To establish these communications, protocols are required. Although HTTP through RESTful interfaces is commonly used, other protocols such as Constraint Application Protocol (CoAP) and Message Queuing Telemetry Transport (MQTT) are suggested to replace HTTP [23]. The most widely used connectivity protocol in IoT and Machine-to-Machine (M2M) applications is MQTT [24]. MQTT is a lightweight protocol designed to connect physical devices [25] to IoT middleware due to it offering better energy performance. This last consideration is significant because IoT solutions are usually installed in harsh environments without an electrical connection.
This study focuses on providing a solution to design an IoT node using open-hardware components. More specifically, the main goals are (a) to propose an IoT node architecture design, both at physical and logical levels; (b) to guide a step-by-step example of how to build an IoT node with open-hardware components and provide a replicable research; and (c) to validate the proposal within smart farming by proposing effective M2M communication.
The balance of this paper is organized as follows. Section 2 presents the background which positions the current study. Section 3 details the agnostic-technology IoT node. Section 4 presents a technological solution to develop the agnostic IoT node approach and reveals some energy tests. Section 5 validates the solution in a smart farming scenario. Section 6 enumerates and compares similar related work. The paper ends in Section 7 with conclusions and future work.
2. Background
In this section, we first present some different open-hardware microcontrollers. Then, to locate the IoT node approach, we define the IoT architecture. Finally, we detail the IoT protocols used to establish an Internet connection.
2.1. Open Hardware
As already mentioned, the cost reduction and the increase of open-hardware popularity have triggered different options for open-hardware microcontroller-based platforms [26]. In this study, the selected IoT scenario requires 3G connectivity, following this requirement this subsection presents some different platforms that support this kind of connectivity. The most notable platforms are: Particle Electron, Adafruit Feather 32u4 FONA, Hologram Dash, Arduino GPRS shield, LinkIt ONE and GOBLIN 2. All these options are completely or partially open hardware. Below, we provide a short description of each of them. Table 1 shows a more specific comparison.
- Particle Electron uses the STM32F205 microcontroller. It presents 36 total pins, such as UART, SPI, I2C, and CAN bus. Electron provides 1 MB of Flash and 128 k of RAM. If we compare Electron with Arduino, the first one is a competent board. The hardware design for the Electron is open source. It includes a SIM card, with a global cellular network for connectivity in 100+ countries, and cloud services. All Electron family products can be set up in minutes using the Particle mobile app or browser-based setup tools.
- Adafruit Feather 32u4 Fona is created by Adafruit and is an Arduino-compatible microcontroller plus audio/SMS/data capable cellular board. It is powered by a Li-Po battery for mobile use and micro-USB port when stationary. Feather is a flexible, portable, and light microcontroller. The SIM800 is the heart of this board and supports GSM cellular connectivity.
- Hologram Dash allows for interaction with devices by easily routing incoming and outgoing messages via a secure and scalable API. Hologram offers the Hologram Dash, compatible with Arduino IDE. The board is pre-certified for end-use and equipped with the Hologram’s networking firmware and OTA code updates. It offers a cloud-friendly cellular connection, a SIM is included to connect and send messages for free (up to 1 MB) for life.
- Arduino GPRS shield connects an Arduino to the Internet using the GPRS wireless network. The Shield is compatible with all boards which have the same form factor (and pin-out) as a standard Arduino Board. This shield is configured and controlled via its UART using simple AT commands and is based on the SIM900 module from SIMCOM. It has 12 GPIOs, 2 PWMs, and an ADC. Moreover, as always with Arduino, every element of the platform (hardware & software) makes it easy to get started.
- LinkIt ONE includes a development board, Wi-Fi and Bluetooth antenna, GSM (2G) antenna, and a GPS/GLONASS antenna, all powered by a Li-battery. LinkIt ONE uses hardware and an API that is similar to Arduino boards. It uses MediaTek MT2502A SoC to get some features such as communications and media options, with support for GSM, GPRS, Bluetooth 2.1 and 4.0, SD Cards, and MP3/AAC Audio, Wi-Fi and GNSS.
- GOBLIN2 uses a high-performance ATmega328P microcontroller to develop IoT projects. It is compatible with Arduino. GOBLIN2 is built with a module to control the charge of a Li-Po battery from 3.7V to 4.2V. The GOBLIN2 charges using a solar cell or a Micro-USB.
All the cellular microcontrollers listed work similarly, they use a mobile network to transmit data to and from the cloud. All of them work correctly; the characteristics are shown in Table 1 can be used to select the microcontroller for a specific use case.
For the use case presented (Section 4), we have chosen the Particle Electron microcontroller. When compared with other platforms, Particle Electron is more appropriate for autonomous work, since it features different sleep mode functionalities. Currently, Particle has a vast user community [27] that can help to resolve specific issues. All Particle microcontrollers are easier to use and have lower prices than the others presented above. It offers a complete solution concerning hardware, network, and cloud management.
2.2. IoT Architecture
IoT devices establish any communication network using a set of rules (protocols) for data transmissions. The TCP/IP architecture is the framework that underpins the communication rules within the Internet. More specifically, this architecture describes four layers: the Perception layer, the Network layer, the Middleware layer, and the Application and Business layer [28].
- Perception layer: in the same level as the physical layer in the TCP/IP model. Perception layer known as the “Device Layer” contains sensor devices and physical objects belong in it. Its role is to Capture information from each sensor device (state, temperature, and location, among others).
- Network layer: transfers the information from the sensors to the upper layer. It can use 2G/3G, Wi-Fi, Bluetooth, Zigbee, infrared technology, and so on. It corresponds with the Communication stage.
- Middleware layer: receives data from the network layer, stores and analyzes data from a sensor and sends it for its visualization.
- Application layer: manages all the processed information from the Middleware layer in a particular IoT application,
- Business layer: responsible for the management of the whole IoT system and applies a business model to a smart scenario, such as smart health, smart home, smart mobility, and smart agriculture, among others.
This study is focused on the first two layers (Perception and Network). Both layers are implemented at the IoT node itself. In what follows, both layers are defined in depth.
The Perception layer is the origin of the information and the first layer of the IoT model. It contains the components themselves and how they operate at a logical level to meet a required functionality. The main goal of this layer is to observe and act. It can obtain any type of information from the physical world through sensors, such as Quick Response (QR) or tags (RFID), pictures (camera) and location (GPS), among others. It also enables the ability to act on some type of actuator, such as switches, motors, etc.
This layer is defined by the following: (1) that it is composed of devices at the hardware level. It must adapt to the final application where the node will be integrated; (2) that it can be deployed in a huge range of environments (wireless/wire, power supply with batteries, and so on); (3) that heterogeneity is one of the main virtues of this layer, since it offers a vast variety of hardware; (4) that it must offer a hardware component to establish a communication connection (Bluetooth, ZigBee, 3G, and so on); and (5) that it is organized following a strategy such as star, cluster tree or mesh, among others.
The network layer is responsible for transmitting data in a transparent way to a neighboring node or to a gateway with Internet access. The layer performs an important role in the secure transfer and keeps information going from the sensor devices to the central server confidential. Depending on the type of connectivity technology included in the previous layer, it establishes a connection to the Internet using 3G, 4G, UMTS, Wi-Fi, WiMAX, RFTD, infrared or satellite, among others. The capabilities of this layer are: (1) network management technologies (wire, wireless and mobile networks); (2) energy efficiency of the network; (3) Quality of Service (QoS) requirements; (4) processing of data and signals; and (5) security and privacy.
2.3. IoT Protocols
Due to the proliferation of IoT devices, different protocols to manage these IoT nodes have been developed to meet their features [29]. These protocols define a set of rules that both endpoints in each part of the communication must use and know to make a successful connection. These are used by the network layer and are called M2M protocols. The main M2M protocols are MQTT and CoAP, which are defined below:
- MQTT follows a client-server paradigm, where each part publishes or subscribes a messaging transport agreement. It is agile, open, simple, and designed to be easy to deploy. The program can run over the TCP/IP network or another. The main features are: (1) use of the publish/subscribe message pattern that provides one-to-many message distribution; (2) an agnostic messaging transport to payload content; and (3) the offer of three quality services for message delivery: “At most once”, “At least once” and “Exactly one time”;
- CoAP is a dedicated web-streaming Protocol for use with limited nodes and a limited network. The protocol provides a request-response interaction model between nodes endpoints, embedded support services, and discovery resources, and includes key Web concepts such as Uniform Resource Identifiers (URIs) and Internet media types. CoAP is designed to be an HTML-friendly interface for integration with the Web while at the same time addressing specific requirements, such as support for multicast with small overhead.
Both MQTT and CoAP are designed to meet the requirements of M2M applications in restricted environments. The CoAP communication model is similar to the HTTP client/server model and is based on the REST architecture. This requires the client to have prior knowledge of the server preferences to establish a connection. To avoid the intensive resources required by HTTP [30], it is preferable to use CoAP in edge-based devices. As already mentioned, CoAP runs on UDP with support for multicast addressing. Similar to HTTP, CoAP provides secure communications based on the security of the datagram transport layer (DTLS).
Unlike CoAP, MQTT runs through TCP/IP [24]. This protocol has been recognized as particularly suitable for devices with IoT restrictions and unreliable mesh networks. Due to its lightweight realization, MQTT has been used in a variety of sensor network scenarios: smart homes, telemetry, remote monitoring, warning systems and health care, among others. Unlike CoAP, MQTT uses a publish/subscribe architecture. The MQTT interface differs from the REST architecture in the sense that there is an intermediary between the publisher and the subscriber, called Broker. MQTT uses SSL/TLS protocols for secure communications. This last protocol has been selected to establish a M2M connection in the current study, due to lower traffic generation and reduction in energy consumption [31].
3. A Generic IoT Node Architecture
The current IoT node architecture proposal aims to follow a modular design at all levels, both at the hardware components and at the behavioral level. In this way, it is intended to design a transversal architecture over any proprietary or specific solution of particular hardware or application. At the hardware level, blocks with a specific functionality are defined. These blocks will be materialized by any open-hardware component that exists in the market. Regarding these blocks, they are classified into four different groups to define the IoT node concerning physical components.
At the behavioral level, general modules are also defined, so that they abstract the technology that will be used after their development. Seven different modules are defined that include all the IoT applications in any IoT scenario.
In this way, this section presents a conceptual design of an IoT node. The section is divided into two sections. The first one shows all conceptual physical parts and how they are structured and connected. The second subsection exhibits the different logic modules needed to meet all IoT abilities.
3.1. Physical Conceptual Parts
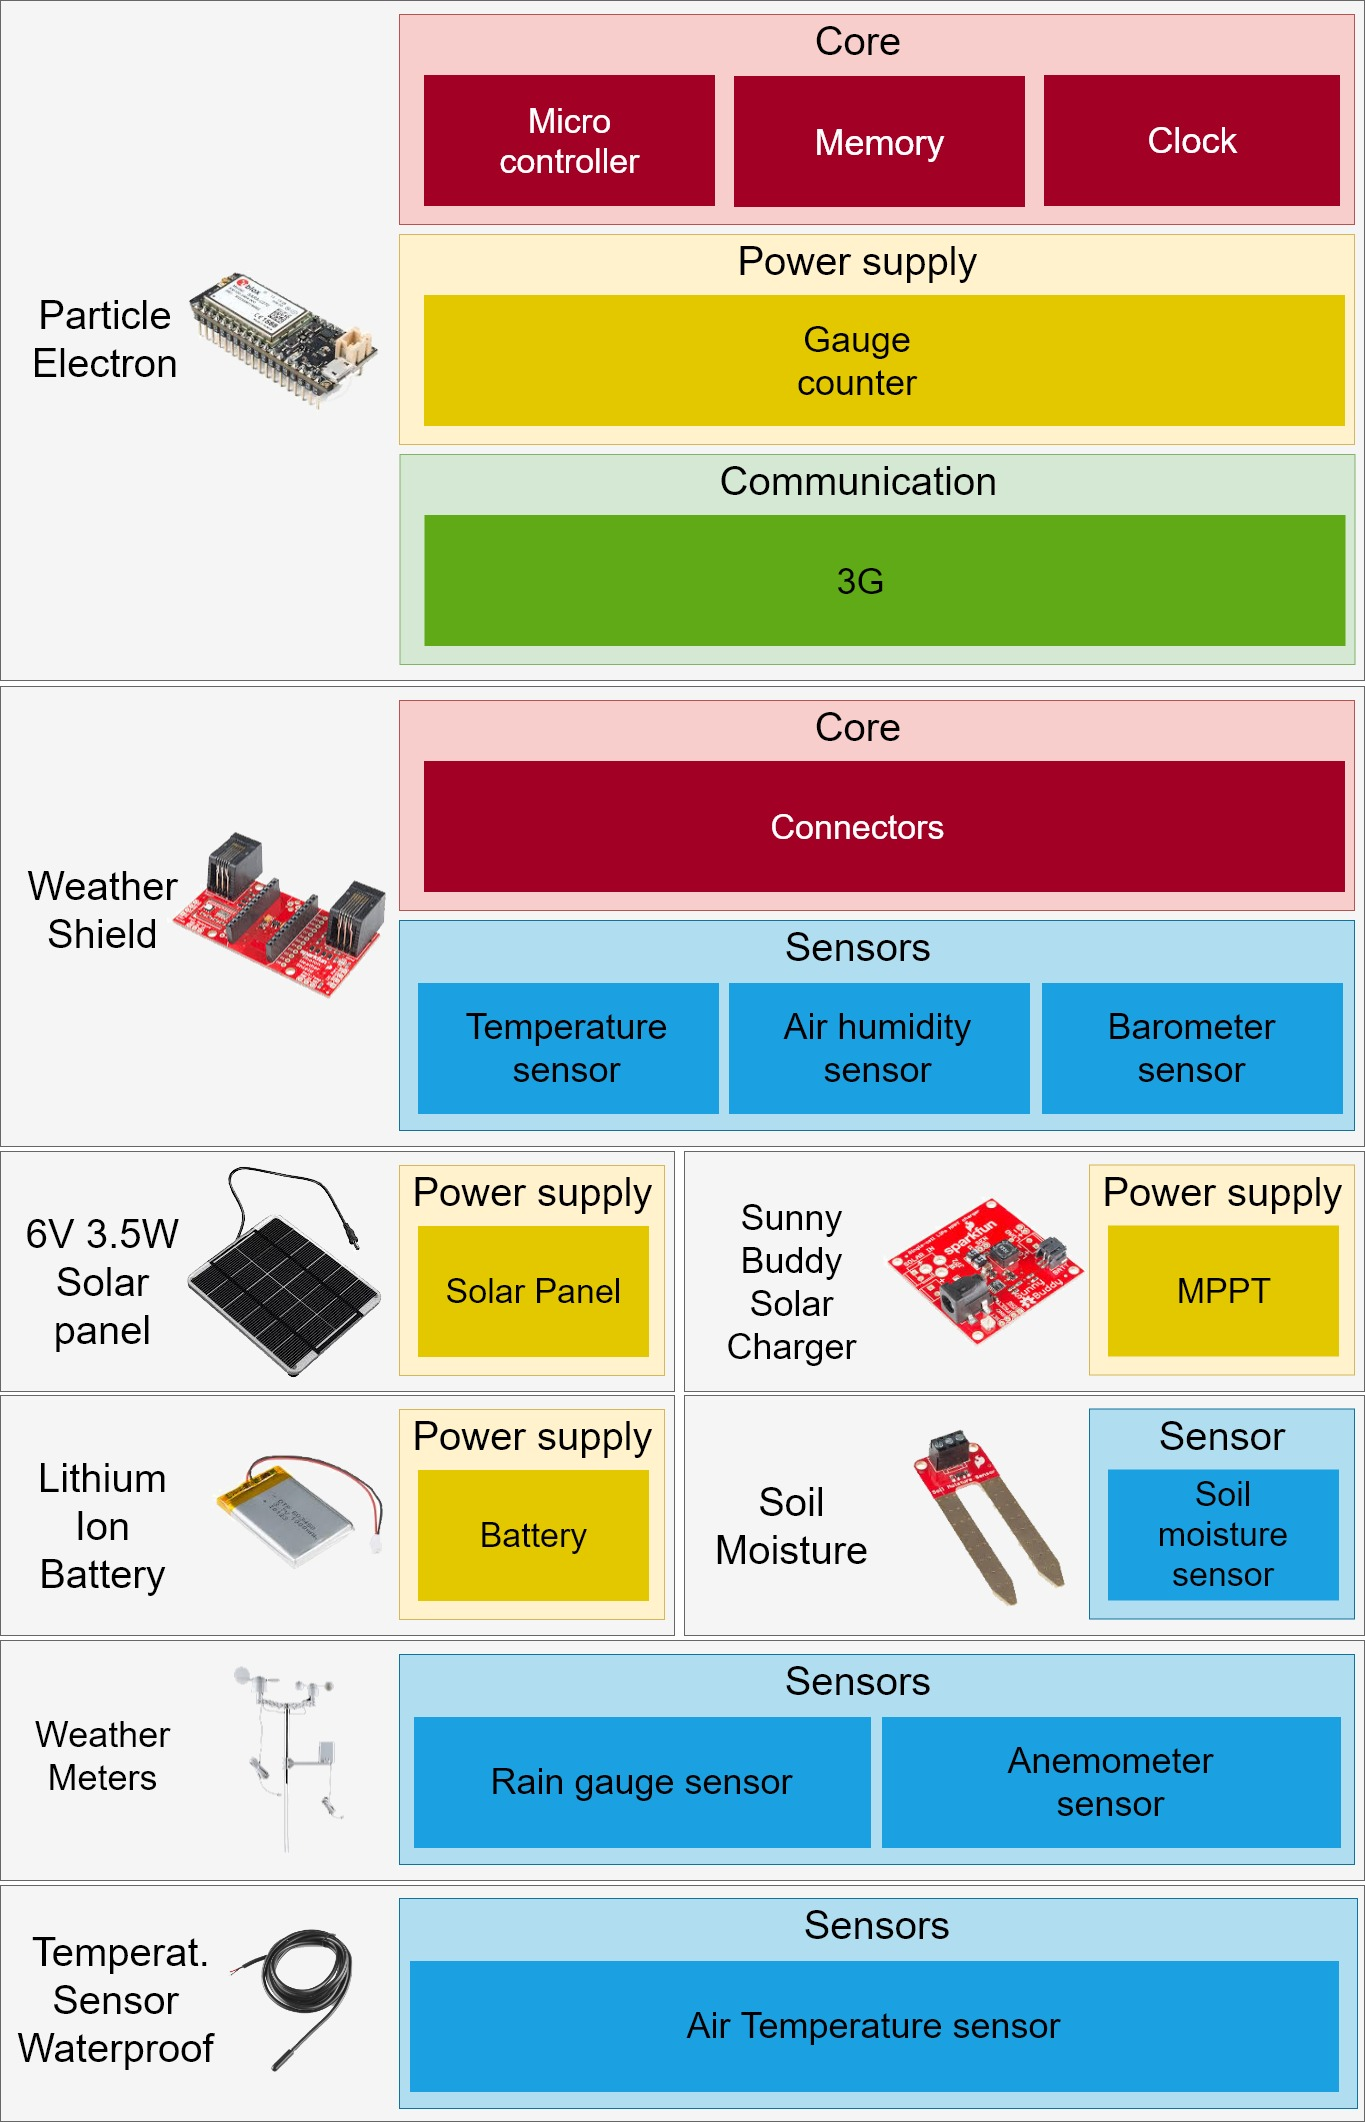
At the level of physical components (or functionalities), the node follows the same detailed composition in [7], although, in this new version, some modifications are added to increase the possibilities. The new composition is shown in Figure 1. Similar to [7], the current approach is also composed of four well-differentiated groups depending on their function. These are Core, Sensors/Actuators, Power supply, and Communication. This approach constitutes an extension of [7] in that it features the coalescence of actuators within the Sensors category. Consequently, the group has been renamed as Sensors/Actuators. Below, each category is described in the form in which it will be distributed in the current study.
The first group, Core, does not present physical modifications from the previous one presented in [7]. It is divided into four subgroups (Microcontroller, Connectors, Memory, and Clock) and its functionality remains the same as that presented in the cited work.
One of the main changes is focused on the Power supply. That is because the new design proposal puts more emphasis on offering an energy-autonomous solution. In this way, the Power Supply group has been divided into four elements. They are detailed below:
- Battery offers energetic autonomy to keep the IoT node power up. The capacity will vary depending on the consumption of the node.
- Solar panel functions to generate energy to recharge the battery and maintain its charge.
- Gauge counter provides the current status of the battery, which will be used to establish an energy strategy that will favor energy saving and the life cycle of the node.
- MPPT optimizes the match between the solar panel and the battery. MPPT can convert the higher voltage DC output from the solar panels down to the lower voltage needed to charge the batteries.
Sensors and Actuators compose the third group. The former can observe a physical phenomenon, such as temperature, particulate, gas, or humidity, and take and transform a signal produced by the sensor into a quantitative or qualitative value. Actuators allow interaction with an IoT node environment to produce a change, such as turning off a light or deactivating a watering function. Each node can be composed with different configurations of sensors and/or actuators.
The last group (Communication) centralizes all telecommunication technologies to connect devices with other nodes, a gateway, or a central server. Different (wired or wireless) network technologies are used to establish a connection (see Section 2.2).
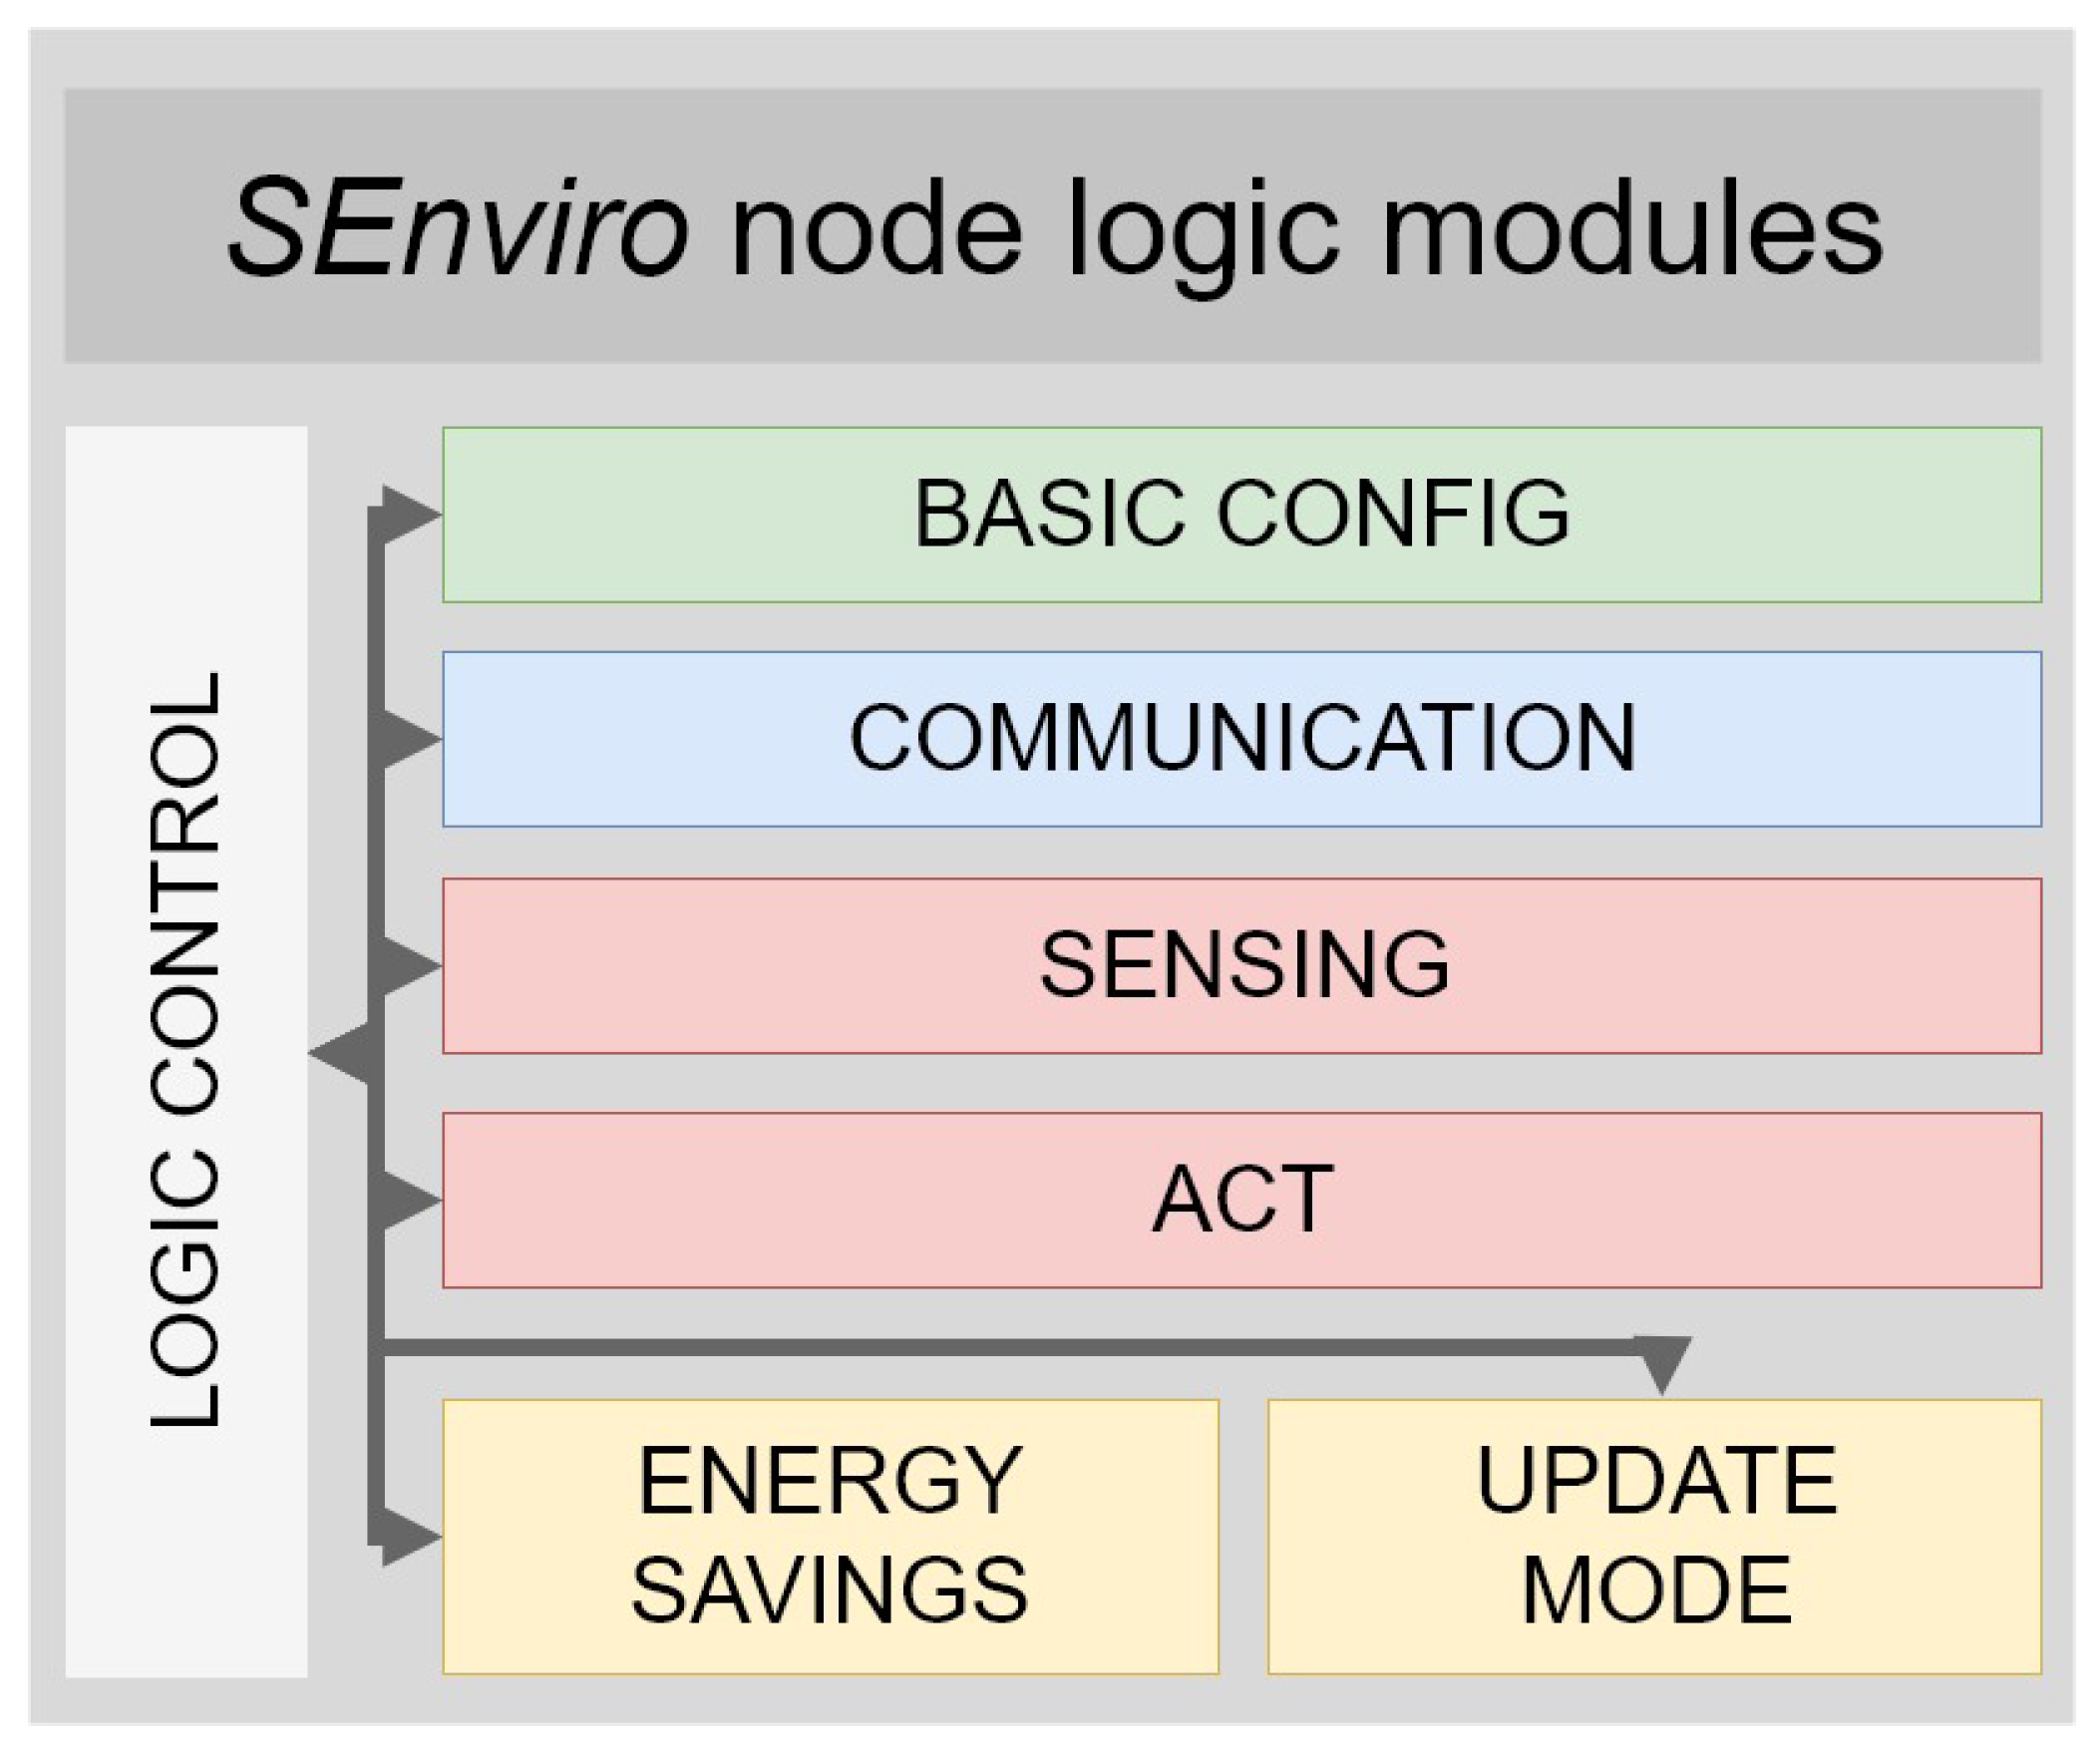
3.2. Behavior Conceptual Parts
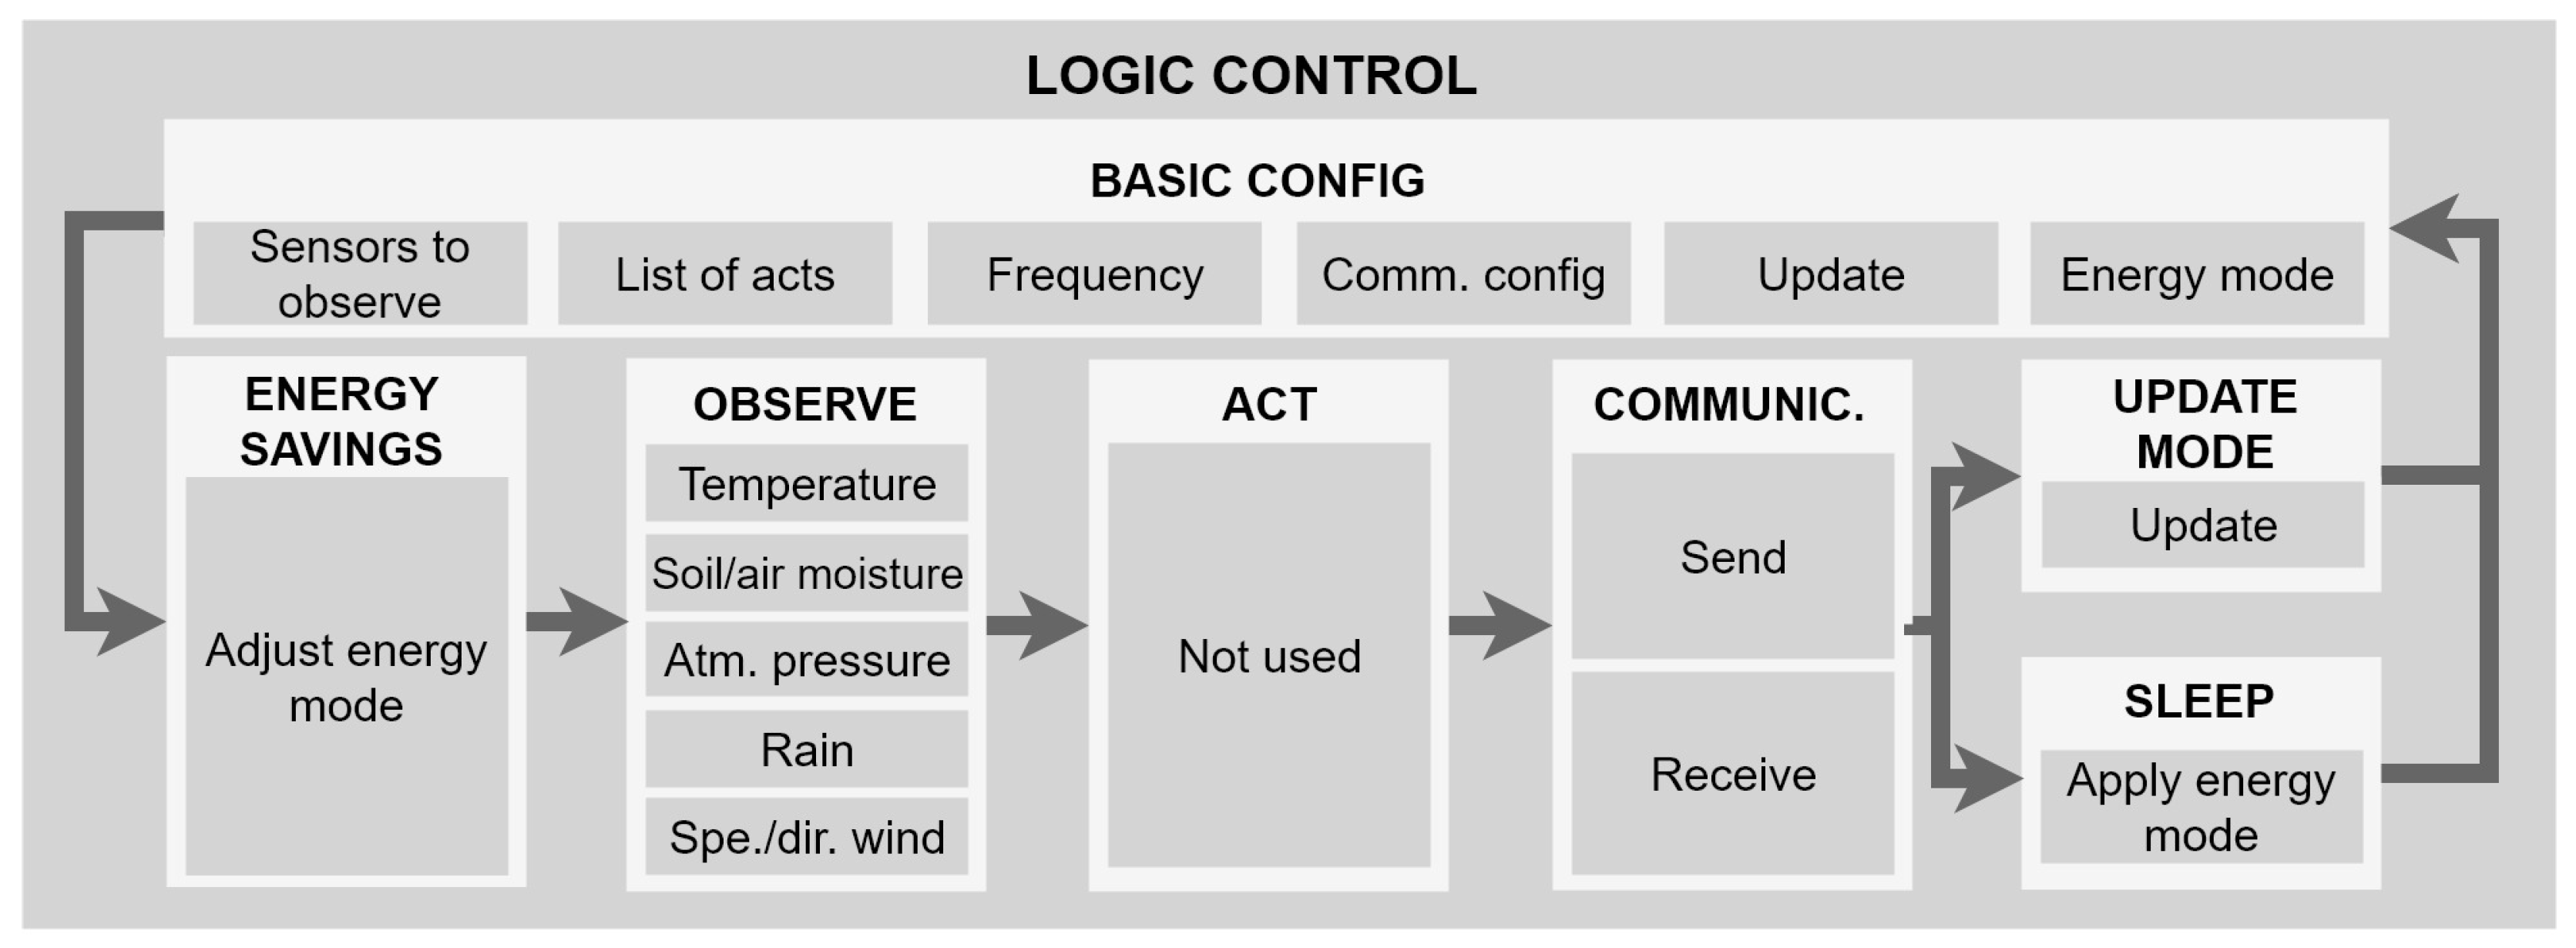
After detailing how the IoT node is built at the physical level, this section describes the modules that are included for its functionality at the logical level. Just as it is defined at the physical level, IoT node also follows a modular design at behavioral level. In this way, seven modules are defined (Figure 2). These modules are Logic control, Basic config, Communication, Sensing, Acting, Energy savings, and Update mode. Below, each module is detailed.
- Logical control is in charge of defining all the IoT node logic and connects with the other six logical modules.
- Basic configuration is responsible for saving the configuration of settings in the node, such as how it can establish a connection, what sensors it should observe and if the node has an update, among others.
- Communication establishes the connection to other nodes or a server. It knows the features of the hardware component to connect to, as well as the M2M communication protocols.
- Sensing collects all data from the available sensors. Some transformations will be required to transform a sensor signal to a useful value.
- Acting will be responsible for carrying out the management of the available actuators and the actions that are taken.
- Energy saving defines strategies for energy saving and prolongs the battery life to its maximum.
- Update mode updates the node when an update is pending.
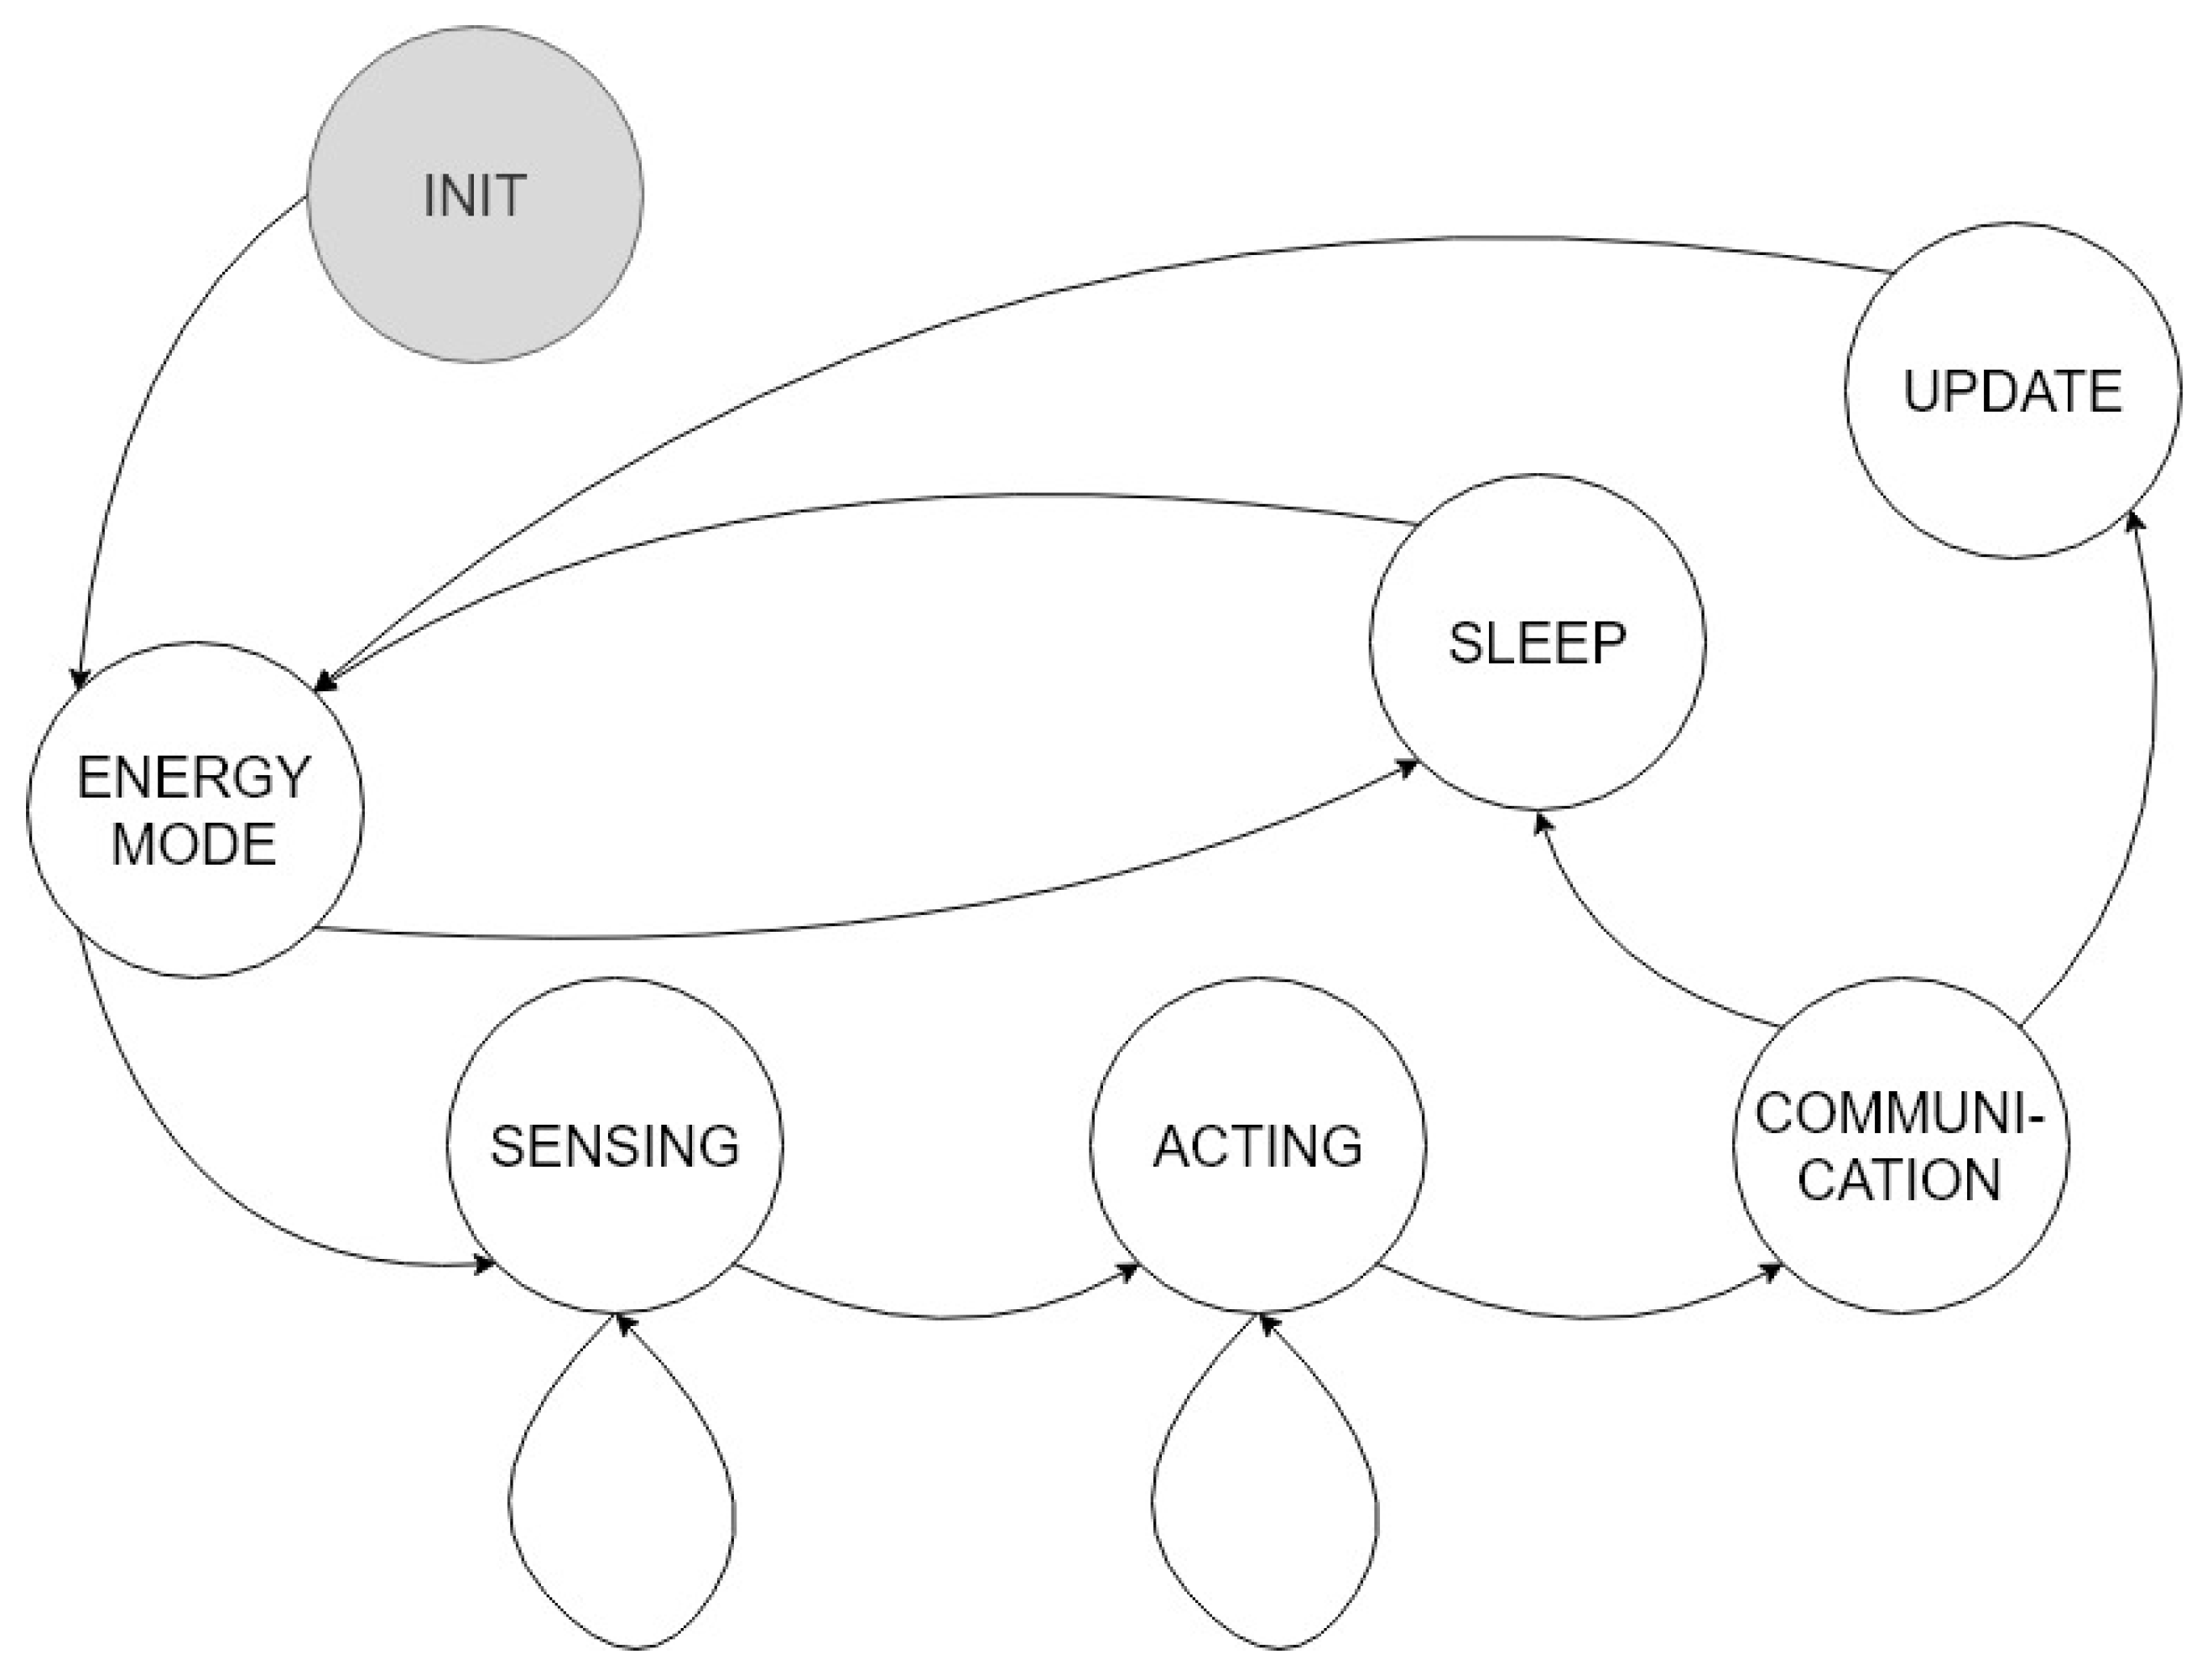
Figure 3 reveals a state machine that IoT node arises to fulfil with its functionality. A state machine can be a theoretical mechanism, or a digital device in our case, that defines a set of states, and movements between states which are performed according to specific criteria [32].
The two main components of a state machine are states and transitions. The states are points on the machine where it performs some action, in our case the defined logical modules. Transitions are a set of conditions that must be met for a machine to pass from the current state to another, these transitions will depend on the input of sensors, battery, or elapsed time, for instance.
It is important to note that the state machine can only be in one status position at a time. That means that the machine only must check the conditions of the current state (depending on the IoT node state, battery, sensing values, and so on) and verify the new state to which it will subsequently move. The state machines require a persistent memory (provided by the IoT node) and the ability to perform logical operations. The logical operations are those that determine the actions of a state and calculate the conditions that must be met to move to the next state.
More specifically, the defined state machine is adapted to the previous behavior shown in Figure 2, although some differences appear that are detailed below. The Logic control module corresponds to the state machine itself. The state machine connects and determinants the different states depending on the transitions.
The first difference is the Basic Configuration module, which does not appear directly, but does so through the INIT state. The INIT state is where the configuration variables will be defined, and the first values will be set. These variables will be updated throughout the procedure of the state machine and will be used to discern between states.
The states energy mode, sensing, acting, communication, and update correspond to the modules that bear the same name and perform the same function. The sensing and acting states may return to their own state depending on the number of sensors and actuators.
The Sleep state supposes another difference from the previous version. It is responsible for putting the machine into rest mode and for applying the energy strategies determined in the energy mode state.
The energy mode state is the first to be activated after initialization; this is because the first step will be to determine the amount of battery, and thereby adapt to the best possible energy strategy to ensure the IoT node life cycle.
4. A Technological Solution to Develop IoT Nodes Using Open Hardware: SEnviro Node
In this section, an example of the IoT node (called SEnviro node) which follows the proposed architecture is presented. The section is divided into three subsections. The first subsection shows how the IoT node is built at the hardware level. The second subsection details how the IoT node works at the software level. Finally, the last subsection analyses the energy consumption both theoretically and practically.
4.1. Building a SEnviro Node
The main objective of the current work is to propose an example of IoT node which follows the architecture made using open-hardware components, as detailed in the previous section. In this way, the development below is composed intimately of these types of elements.
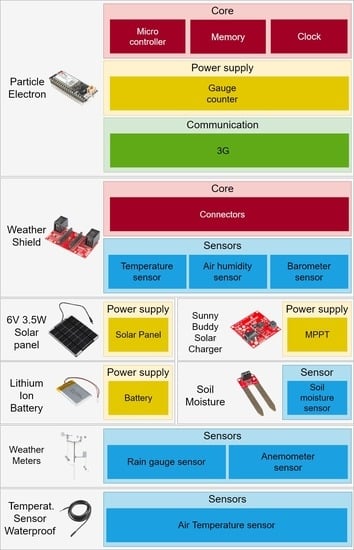
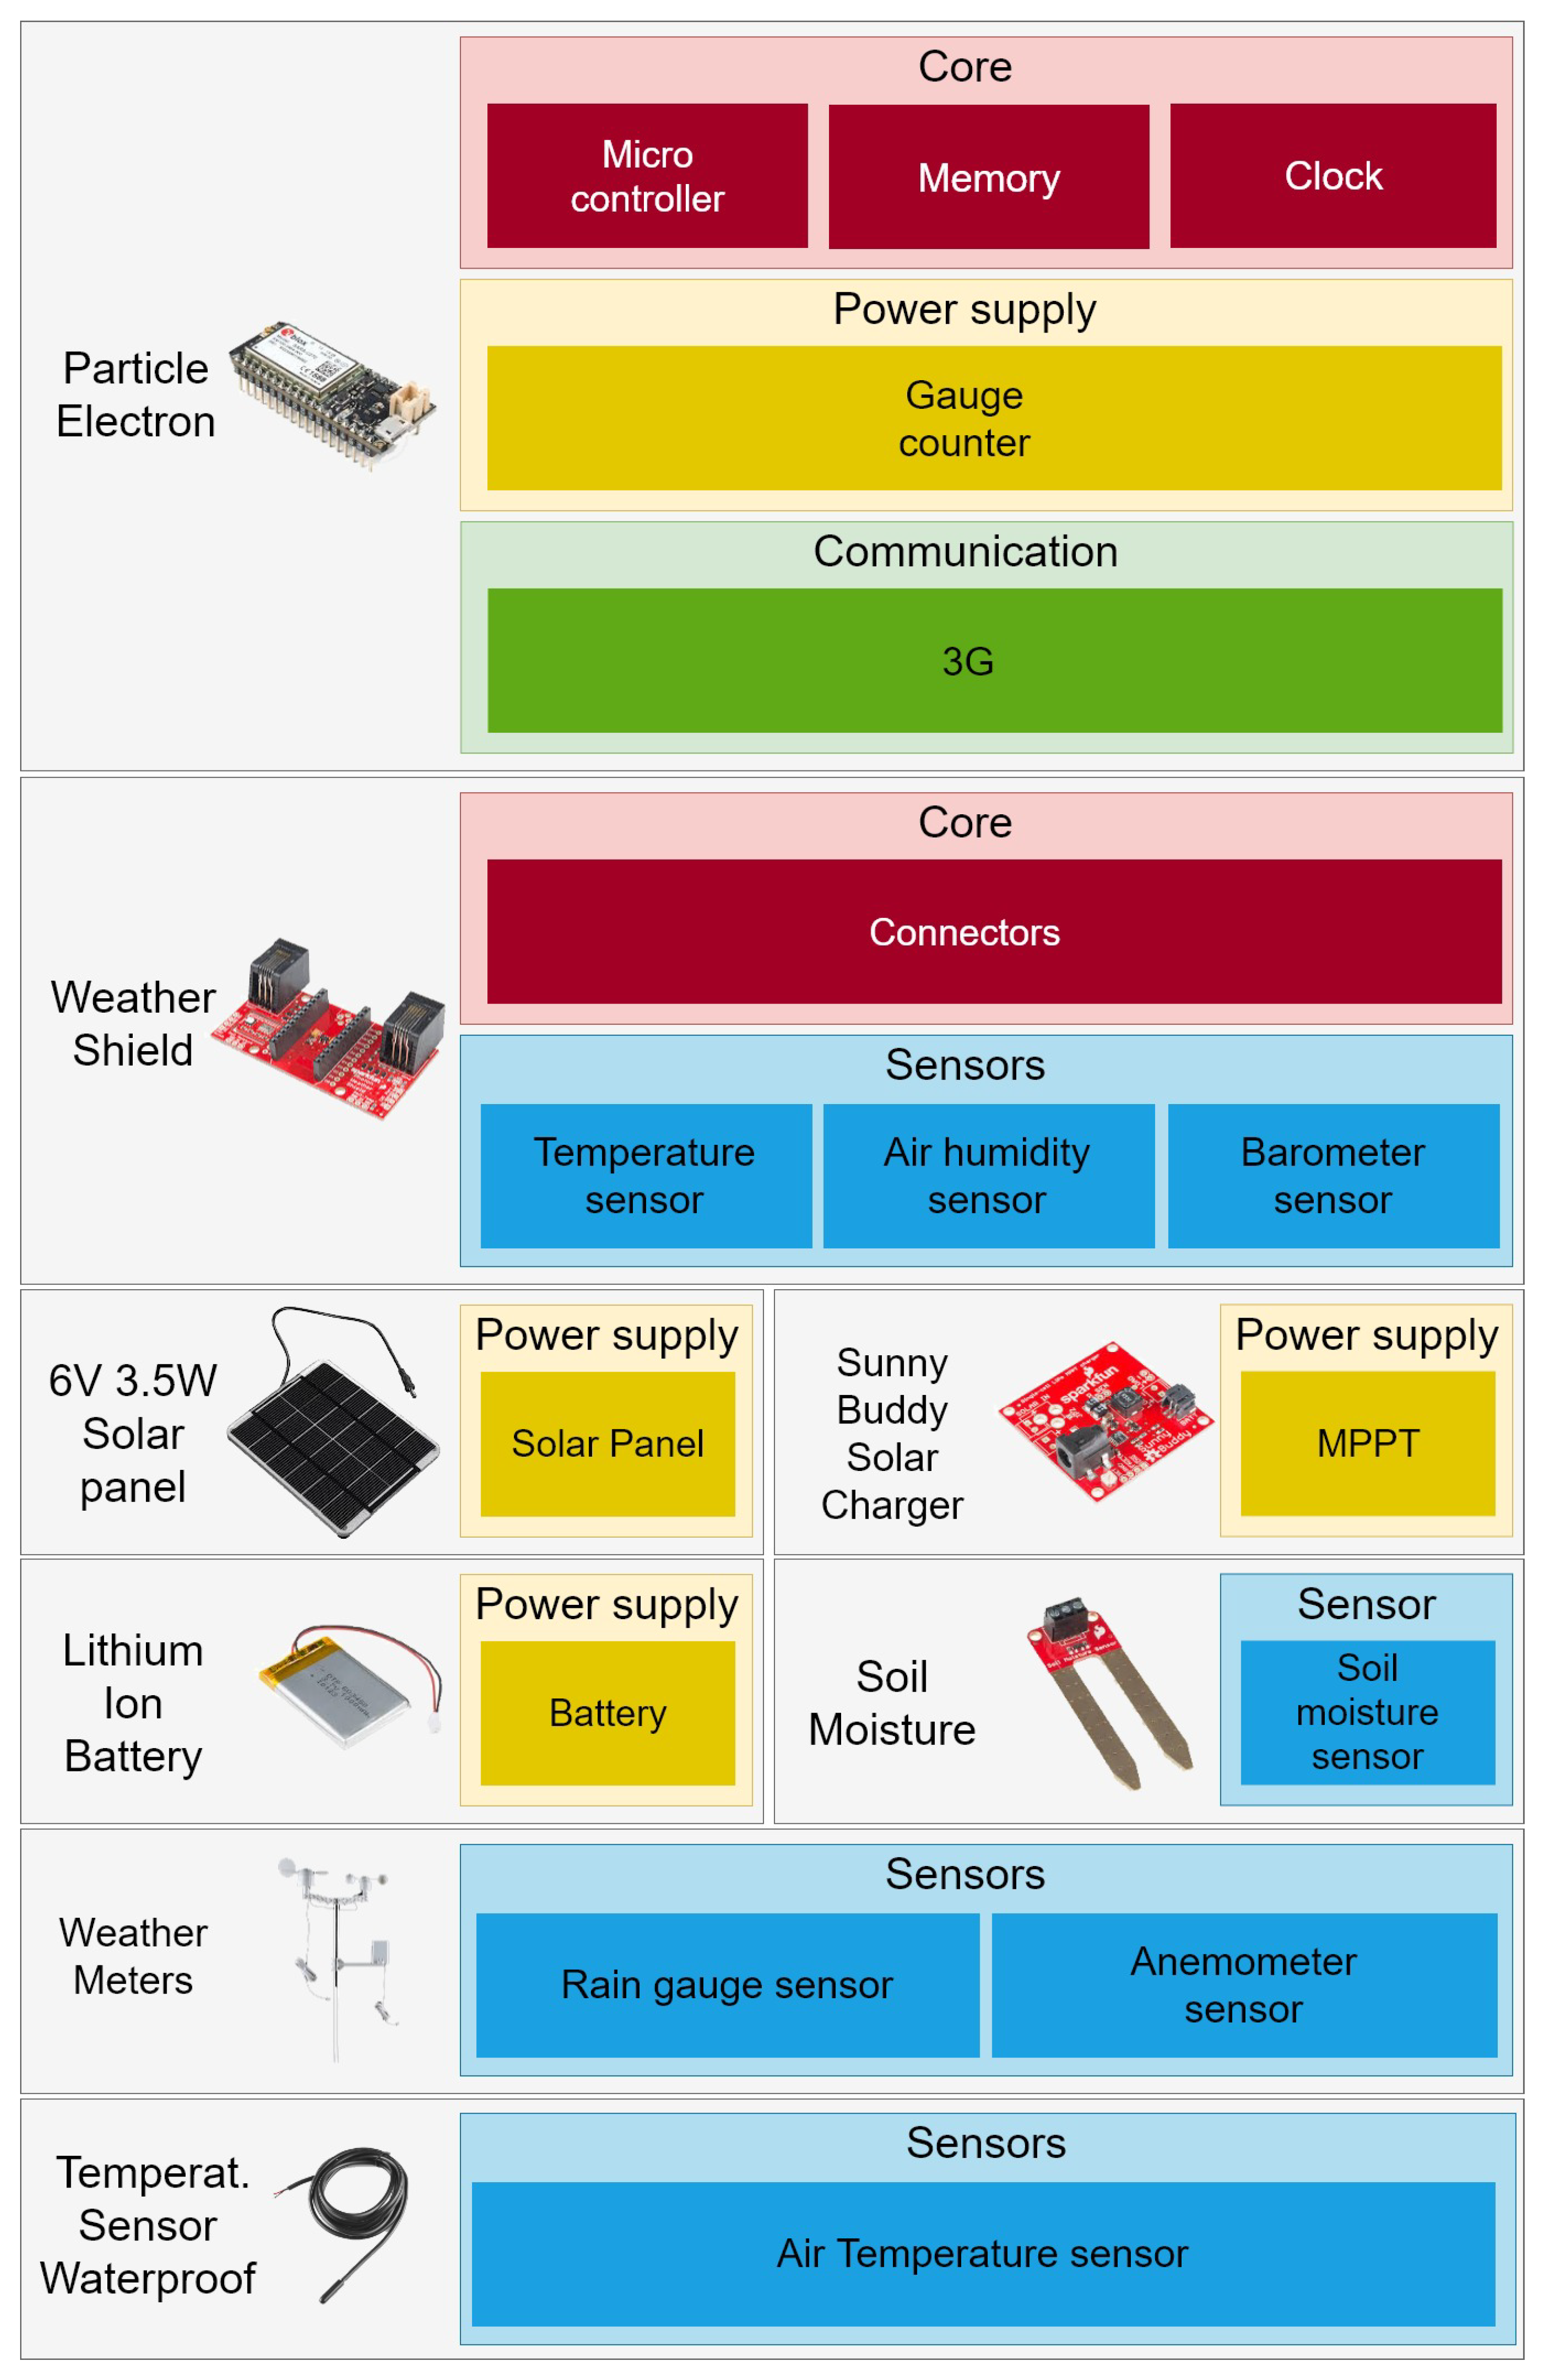
Following the physical components defined in Section 3, the IoT node is composed as shown in Figure 4. We now detail how each defined group (Core, Sensing/Acting, Power Supply and Communication) is developed. The same categorization is used to describe each component in Table 2. The total price per SEnviro node is €256.45. In what follows, each component is detailed and classified in each fixed group.
- Particle (Figure 5): This component has been chosen to be part of the core of the IoT node. As introduced in Section 2, the Particle Electron microcontroller follows an open-source design. As shown in Figure 5, this microcontroller is present in different blocks defined in Figure 1, such as Core, Power Supply and Communication. In the first group, Core, the Electron acts as a microcontroller and is responsible for bringing the node to life and implementing all business models so that the node functions correctly. Unlike a conventional PC, Electron can only run one program, which will be detailed in the next subsection. It incorporates a STM32F205RGT6 ARM Cortex M3 chip which works at a frequency of 120 MHz. It can be updated using OTA updates. This functionality adds a considerable expansion regarding keeping each node updated and supporting new functionalities or behaviors in the future without the need to physically go to where the IoT node is deployed. The Electron will also be responsible for storing all the variables to support a normal operation by using RAM (128 KB RAM) and ROM (1 MB Flash). Within the Core group, it will also function to keep the current time; this is possible because Electron offers a Real-Time Operating System (RTOS) module.The second group in which the Electron microcontroller is present is the Power supply. The Electron provides a chip called MAX17043, which can measure the energy consumed by the microcontroller (and all IoT node components). This microchip has an ultra-compact design, and its cost is meagre.Finally, in the last group, Communication, the announced microcontroller provides 2G and 3G (or any new technology such as 5–6 G) connectivity. The cellular module, U-blox SARA-U270, allows an Internet connection. To do this, it has a cellular antenna, which is essential for the microcontroller to establish a connection to a cellular tower. One difference from the version presented in [7] can be found in the communication group. This new version provides 2G and 3G connectivity instead of Wi-Fi. This feature increases the possibility of installing a node anywhere with mobile data coverage.
- Weather shield: This component is an easy-to-use circuit compatible with the Particle microcontrollers (Photon and Electron). The Electron can interact with the world through pins (30 Mixed-Signal GPIO), which will be used to connect this shield. The weather shield has built-in barometric pressure sensors (MPL3115A2), relative humidity and temperature (Si7021). Besides, the shield contains some RJ11 connectors to plug external sensors such as an anemometer and a rain gauge. Table 3 describes all the features of the sensors. The weather shield is present in the Core (Connectors) and Sensors groups.
- Solar panel: This component is waterproof, scratch resistant, and UV resistant. It uses a high-efficiency monocrystalline cell. The output is 6 V at 530 mA via 3.5 mm × 1.1 mm DC jack connector. The solar panel will be used to charge the battery and offers an uninterrupted IoT node operation. The solar panel is included in the Power supply.
- Lithium ion battery: This component has a 2000 mA capacity and has been used to offer an energetically autonomous platform. It supplies an output voltage of 3.7 V and is charged using the power generated by the solar panel. The battery is included in the Power supply.
- Sunny Buddy solar charger: This component is a MPPT solar charger and is included in the Power supply. It is responsible for monitoring current flow and is limited to a specific value to prevent damage to the battery. It is also an open-hardware component.
- Soil Moisture: This component also has an open-hardware design, and through a simple breakout it can measure the humidity of the soil. The two pads act as a variable resistor; the more water there is in the soil, the better the conductivity between them. This results in less resistance and higher output. It is considered to be a part of the Sensor group.
- Weather meters provide the three components of weather measurement: wind speed, wind direction, and rainfall. It offers RJ11 connectors, which facilitates installation with the above-mentioned weather shield. The weather meters are included in the Sensor group.
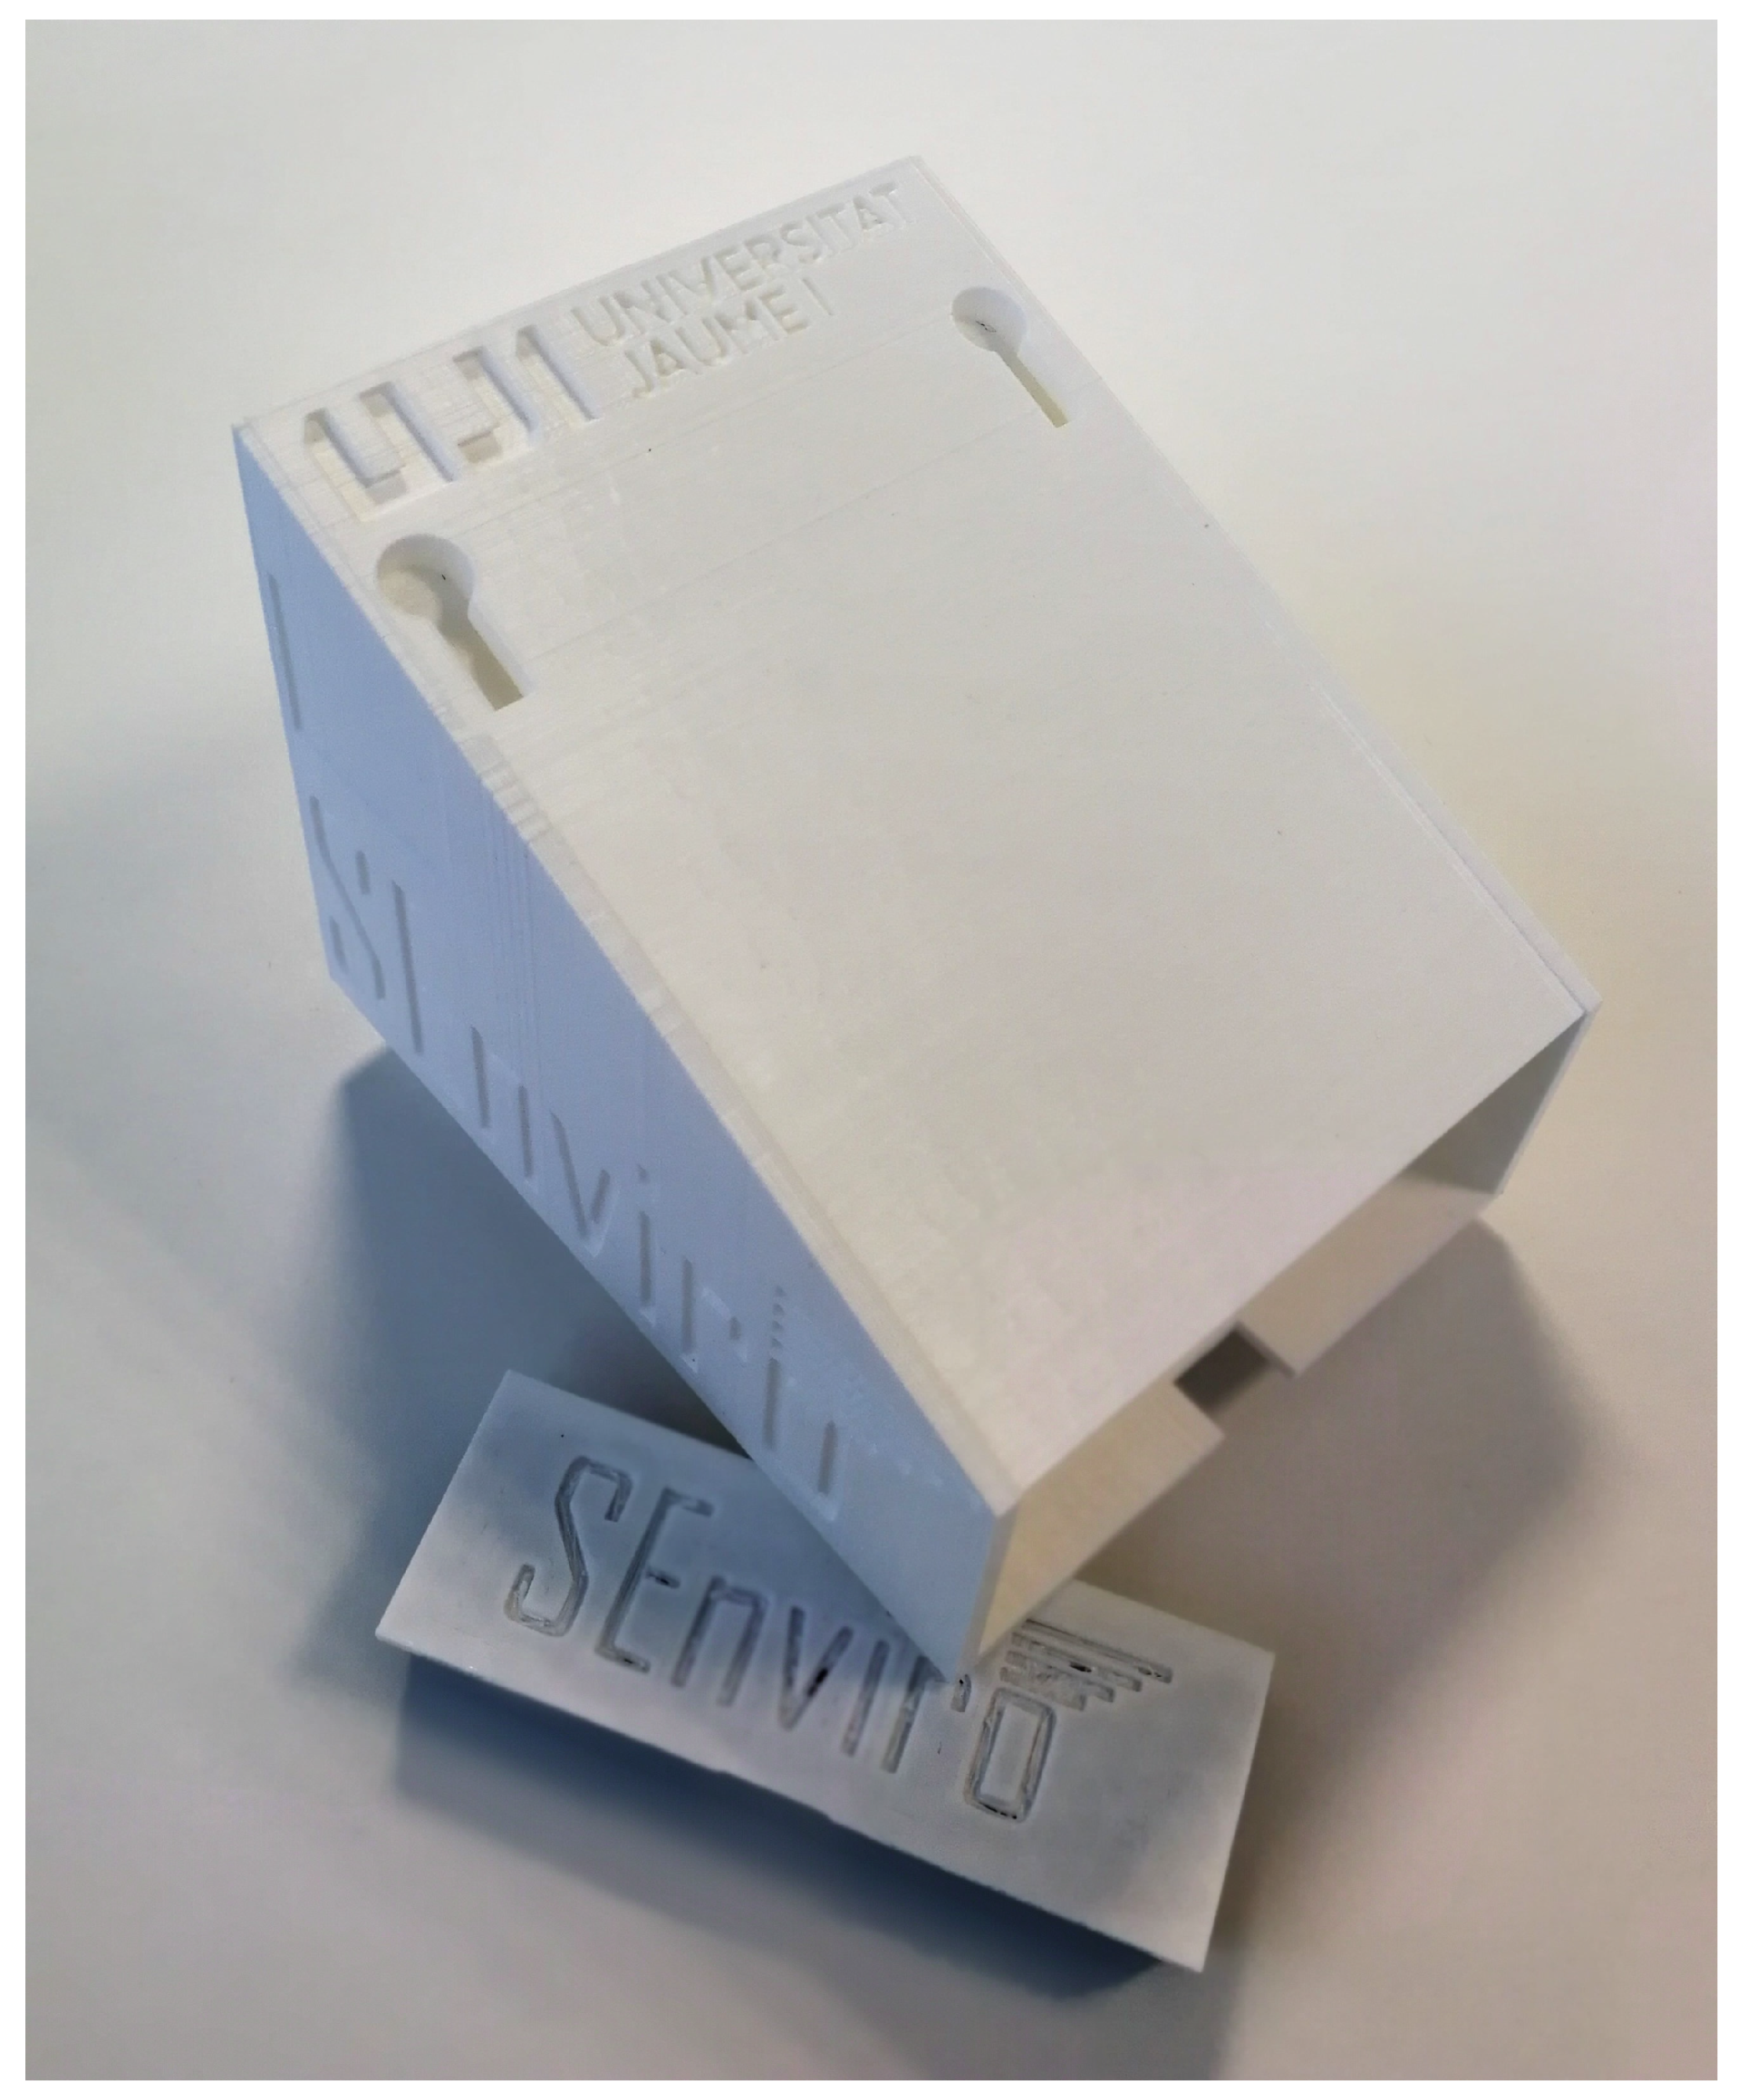
An enclosure has been designed to house all the components and to protect the electronic components. The box has been purposely designed to meet this end (Figure 6), it has been printed using a 3D printer, and is valid for printing using polylactic acid (PLA) filament. Each node is identified by a QR code. This code is used to claim a device and start to collect data from the node.
Table 3 summarizes all the information about the Sensors used in this proposal. All the Sensors that have been chosen are open hardware and low cost. Despite their low price, most of the sensors used in industrial environments obtain reliable measurements.
4.2. Details of the Behavior
As indicated above, the microcontroller will be in charge of orchestrating the general operation of the node. That will be possible through a program, or sketch, that is responsible for giving functionality to each of the hardware components that make up the node. In this way, following the logic modules and state machine defined in the previous section, a sketch is developed. The Figure 7 shows at a global level how each module has been used. We will now go on to detail each of them and how they work.
The first module is Logic control, which does not have a specific functionality. It is responsible for joining the different modules in a coherent way. As in [7], two modes are defined, initial (INIT in states machine) and loop modes. The initial mode is executed as an initializer when the node boots. When the initial mode is complete, the loop method is executed repeatedly while the node is on.
The Basic config module is responsible for storing and managing the basic configuration/settings. Part of its configuration is defined in the initial mode and updated during the loop mode. The basic configuration is responsible for defining aspects such as which sensors will be consulted, the list of actions to be performed on the actuators, the observation frequency, the configuration to establish an M2M communication and checking whether the IoT node has a new update.
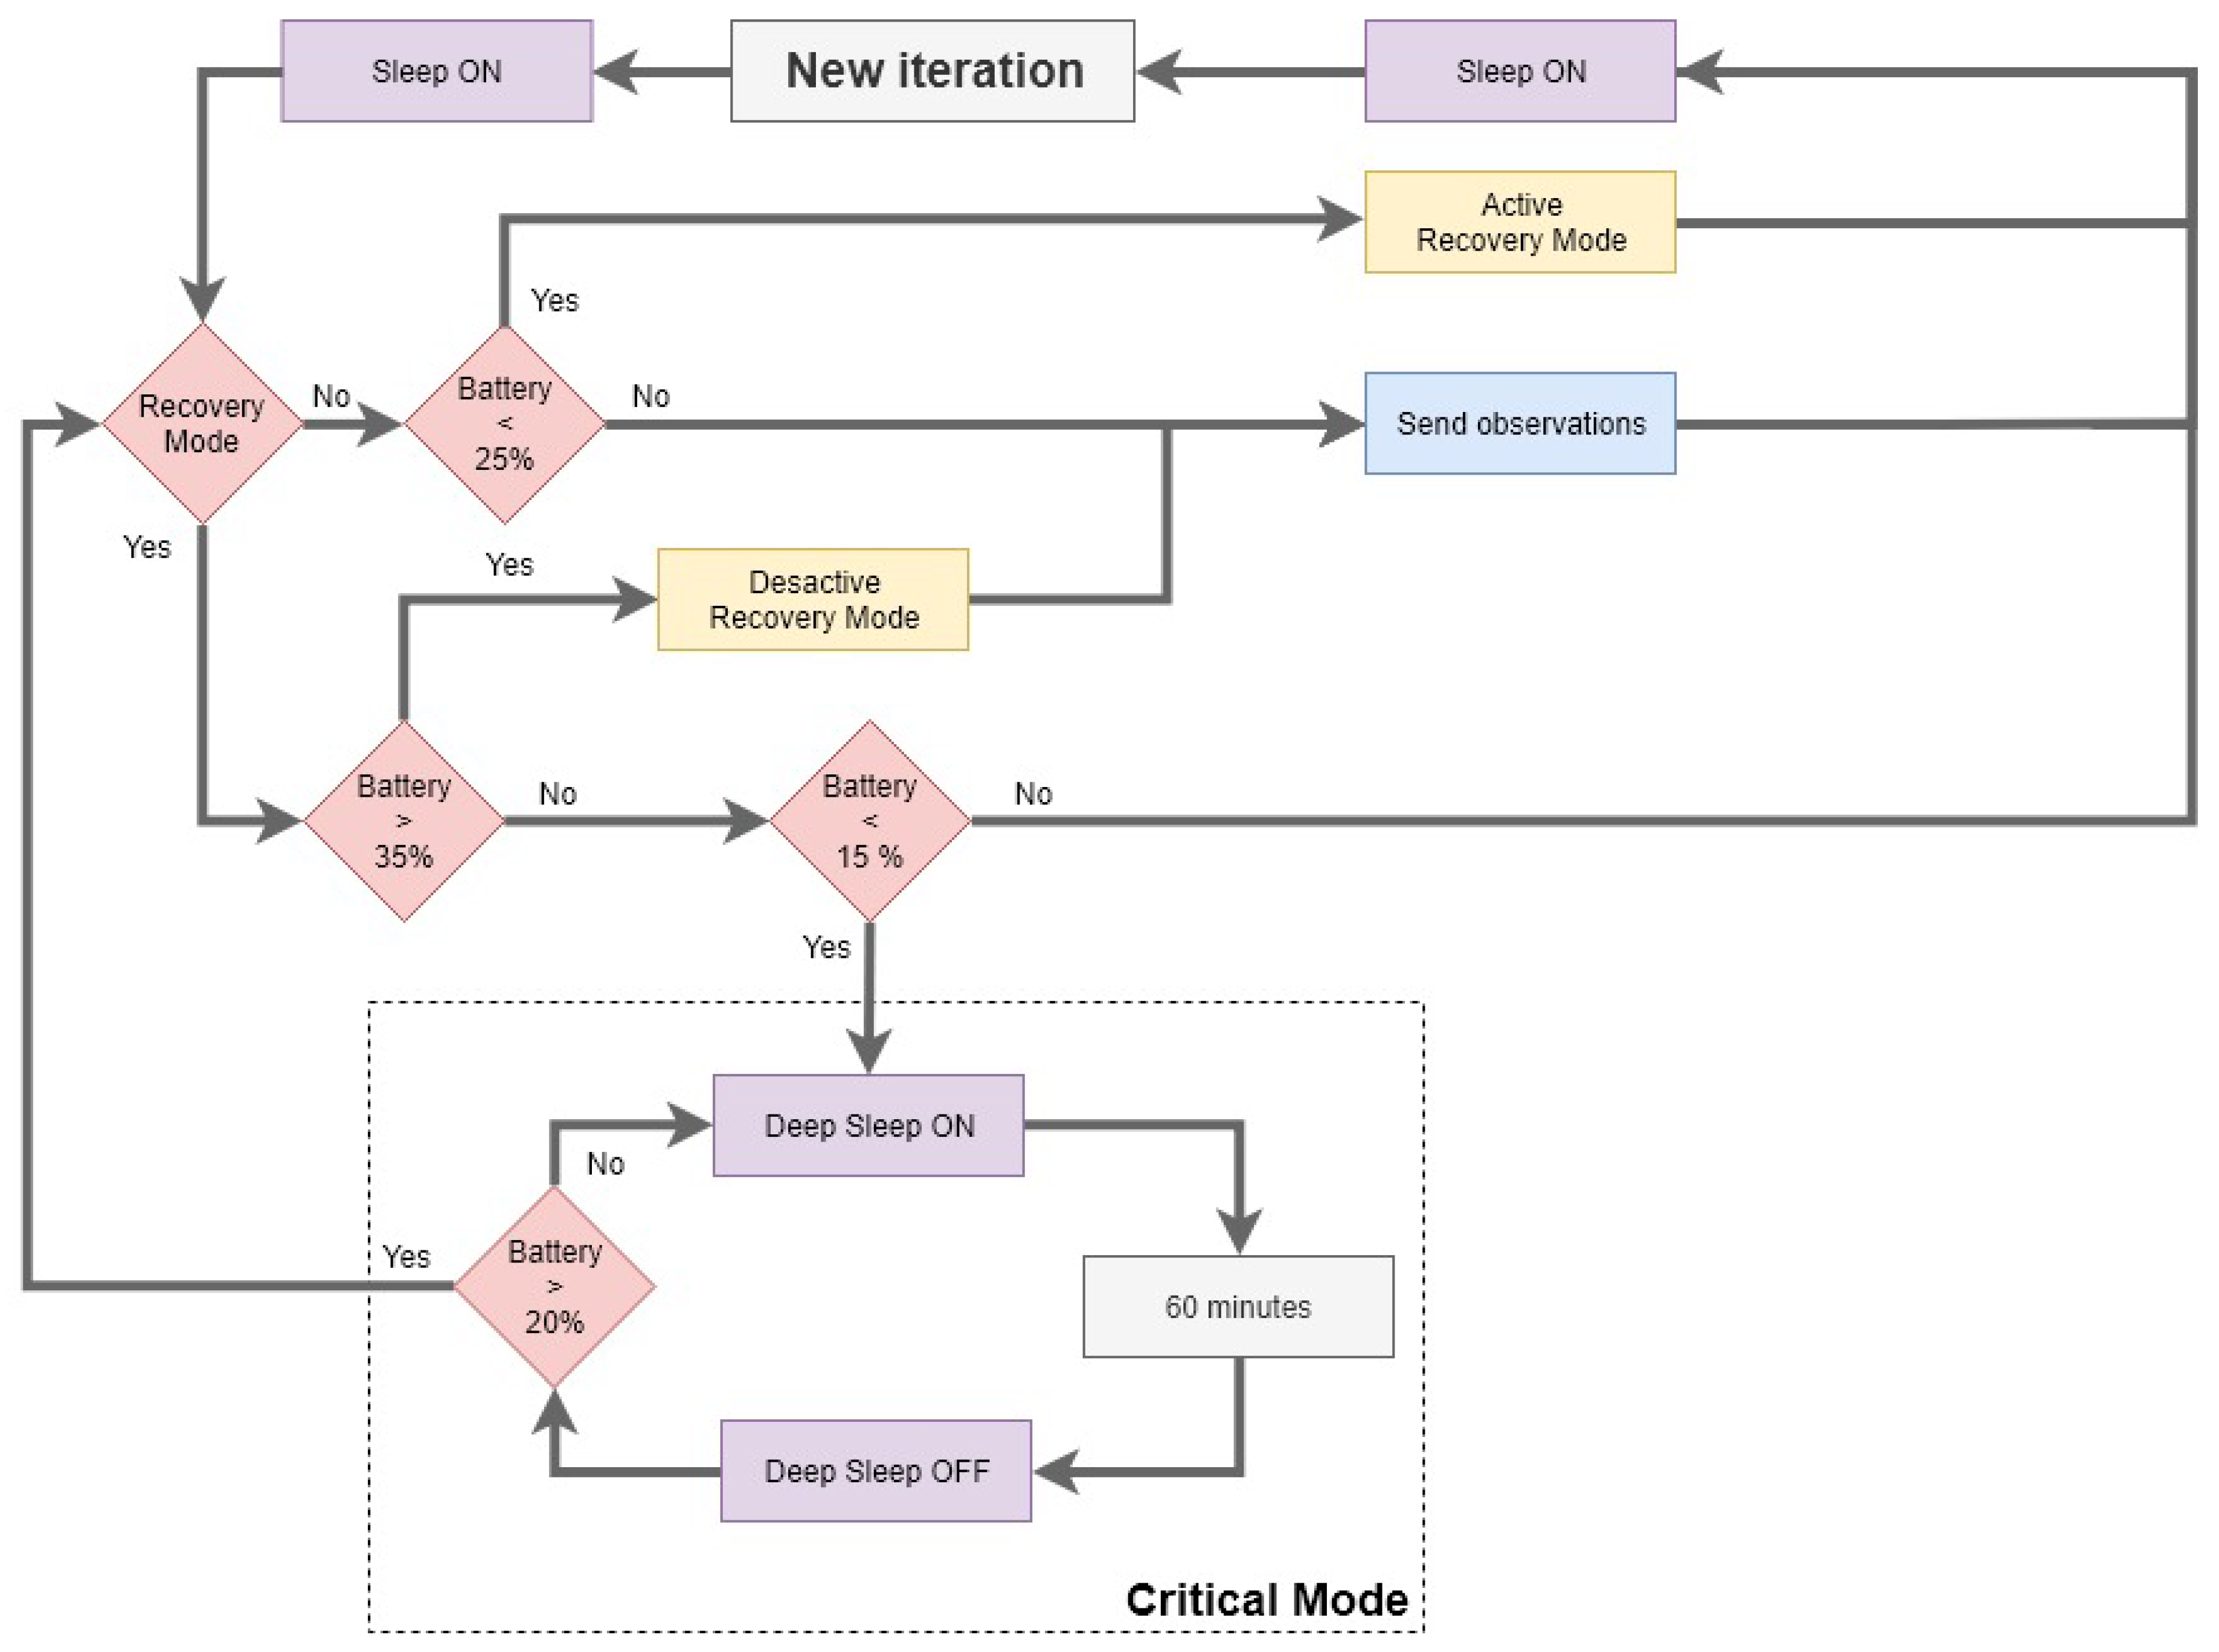
Within the loop mode, which is executed depending on the frequency of the Basic config module, the first module is the Energy savings. This module determines the energetic strategy depending on the battery charge. Three different modes are defined, each of which are detailed below.
- Normal mode: the most usual operating mode. The node works with the defined observation frequency (10 min).
- Recovery mode: the observation frequency is maintained, but the observations will not be sent to the server, instead they are stored in the microcontroller EEPROM memory. The stored observations are sent when the IoT node has better battery conditions.
- Critical mode: the IoT node does not collect new observations and goes into the most in-depth sleep mode.
The second module, Observe, consults from among the available sensors those that are indicated in the configuration. Among them, it includes the temperature, soil and air humidity, atmospheric pressure, rain, and wind speed/direction sensors. This module is responsible for transforming the signals from the sensors to obtain the correct values and adapt the values to the correct units for each phenomenon. For example, it treats the electric pluviometer pulsations and transforms them into the corresponding milliliters.
The next module is Act, which carries out actions on the available actuators. Although the current IoT node does not have an actuator due to the use case in which it has been applied, it is considered to define a general solution which is transferable to other scenarios with different requirements.
The next module is the Communication module. It has two differentiated functionalities: sending and receiving. To achieve this, the module establishes a connection using the 3G module included in the Electron microcontroller. Each node uses the MQTT protocol to set up M2M communication. They define an MQTT client that can send and receiving data. To do so, the node takes on the role of publisher to send sensor observations. Each observation is published on a different topic. In this way, a hierarchical organization is defined; that is, the sensor ID plus the phenomenon type name, for example /current/4e0022000251353337353037/Temperature or /current/4e0022000251353337353037/Humidity. The first hierarchical level (current) determines that the topic is in real-time. Another topic at the same level, called lost, is defined to send lost observations (due to in connection issues or the energy mode).
Moreover, MQTT is used to establish a dual communication between nodes. Each node is subscribed in different topics to trigger updates (OTA), or note which sensors should be consulted. The JSON format is established to code both incoming and outgoing data.
The last two modules are in parallel; this implies that they cannot be executed at the same time in the same iteration. The first one, the Update module, is responsible for enabling the deployment of a new update. Through the Communication module, when a new update message arrives in the update topic for a particular node, the update mode is activated and, to receive the update, the sleep state is not applied.
Finally, the last module, and one of the most important regarding energy consumption, is the sleep module. On the one hand, the Electron microcontroller offers different sleep modes, depending on which functionalities are active. The microcontroller provides a sleep operation, which is characterized by various parameters to determine which features are restricted to reduce power consumption. The sleep operation can be accompanied by seconds, which is used to define the sleep period. Also, the Electron supports the possibility to awaken using some external interruption in one of its pins.
In addition to the possibility of awakening the microcontroller, the sleep mode is also required. All the available modes are detailed below:
- Without any argument. This option does not stop the execution of the sketch. The node continues running normally, while the 3G module remains in standby mode. The energy consumption is from 30 mA to 38 mA.
- SLEEP_MODE_DEEP: this mode turns off the network module and puts the microcontroller in standby mode. When the device wakes up from the deep suspension, it restarts and executes all the user code from the beginning without maintaining the memory values. Its consumption is about 0.0032 mA.
- SLEEP_MODE_SOFT_POWER_OFF: this mode is like SLEEP_MODE_DEEP with the added benefit that the fuel gauge chip also sleeps.
- SLEEP_NETWORK_STANDBY: this mode is like SLEEP_MODE_DEEP but it does not turn off the 3G module. It reduces the amount of energy needed to reconnect with the operator when the Electron reboots from SLEEP_MODE_DEEP.
The Figure 8 shows at a generalization of how the node works at the energy level and how it applies the sleep operations previously listed. In this way, three different modes are defined depending on the battery level at any given time. These modes are listed below.
- Normal mode. When the battery is higher than 25% the node performs shipments depending on the observed frequency. The basic sleep mode is applied as detailed in the definition above. In addition to using the seconds to wake up, it can also use the rain gauge pin to wake up, and in this way accumulate the quantity of rainwater during the period in which the microcontroller is sleeping. The connectivity module is running while the cellular module is in standby mode.
- Recovery Mode. When the battery is at less than 25%, the recovery mode is activated, and no new deliveries are made until the battery exceeds 35%. The observations are saved in the EEPROM memory and are labelled with a timestamp at the moment of capture.
- Critical Mode. If the battery is at less than 15%, the critical mode is activated. In this mode, new observations are not produced or stored in EEPROM memory. The node goes into deep sleep and wakes up every 60 min to monitor the battery level. The critical mode is stopped when the remaining battery level is greater than 20%, and the node continues in recovery mode until it exceeds the threshold of 35%.
All the values defined above to categorize each mode have been fixed empirically. Depending on the different energy modes, we have tried to balance the behavior of the normal mode without compromising the total loss of battery, which this last would produce the loss of autonomy.
4.3. Autonomous Power Supply
This section details some aspects regarding energy consumption. The first subsection shows the theoretical energy consumption. The second subsection offers the energy consumption tests in a unit of the SEnviro node.
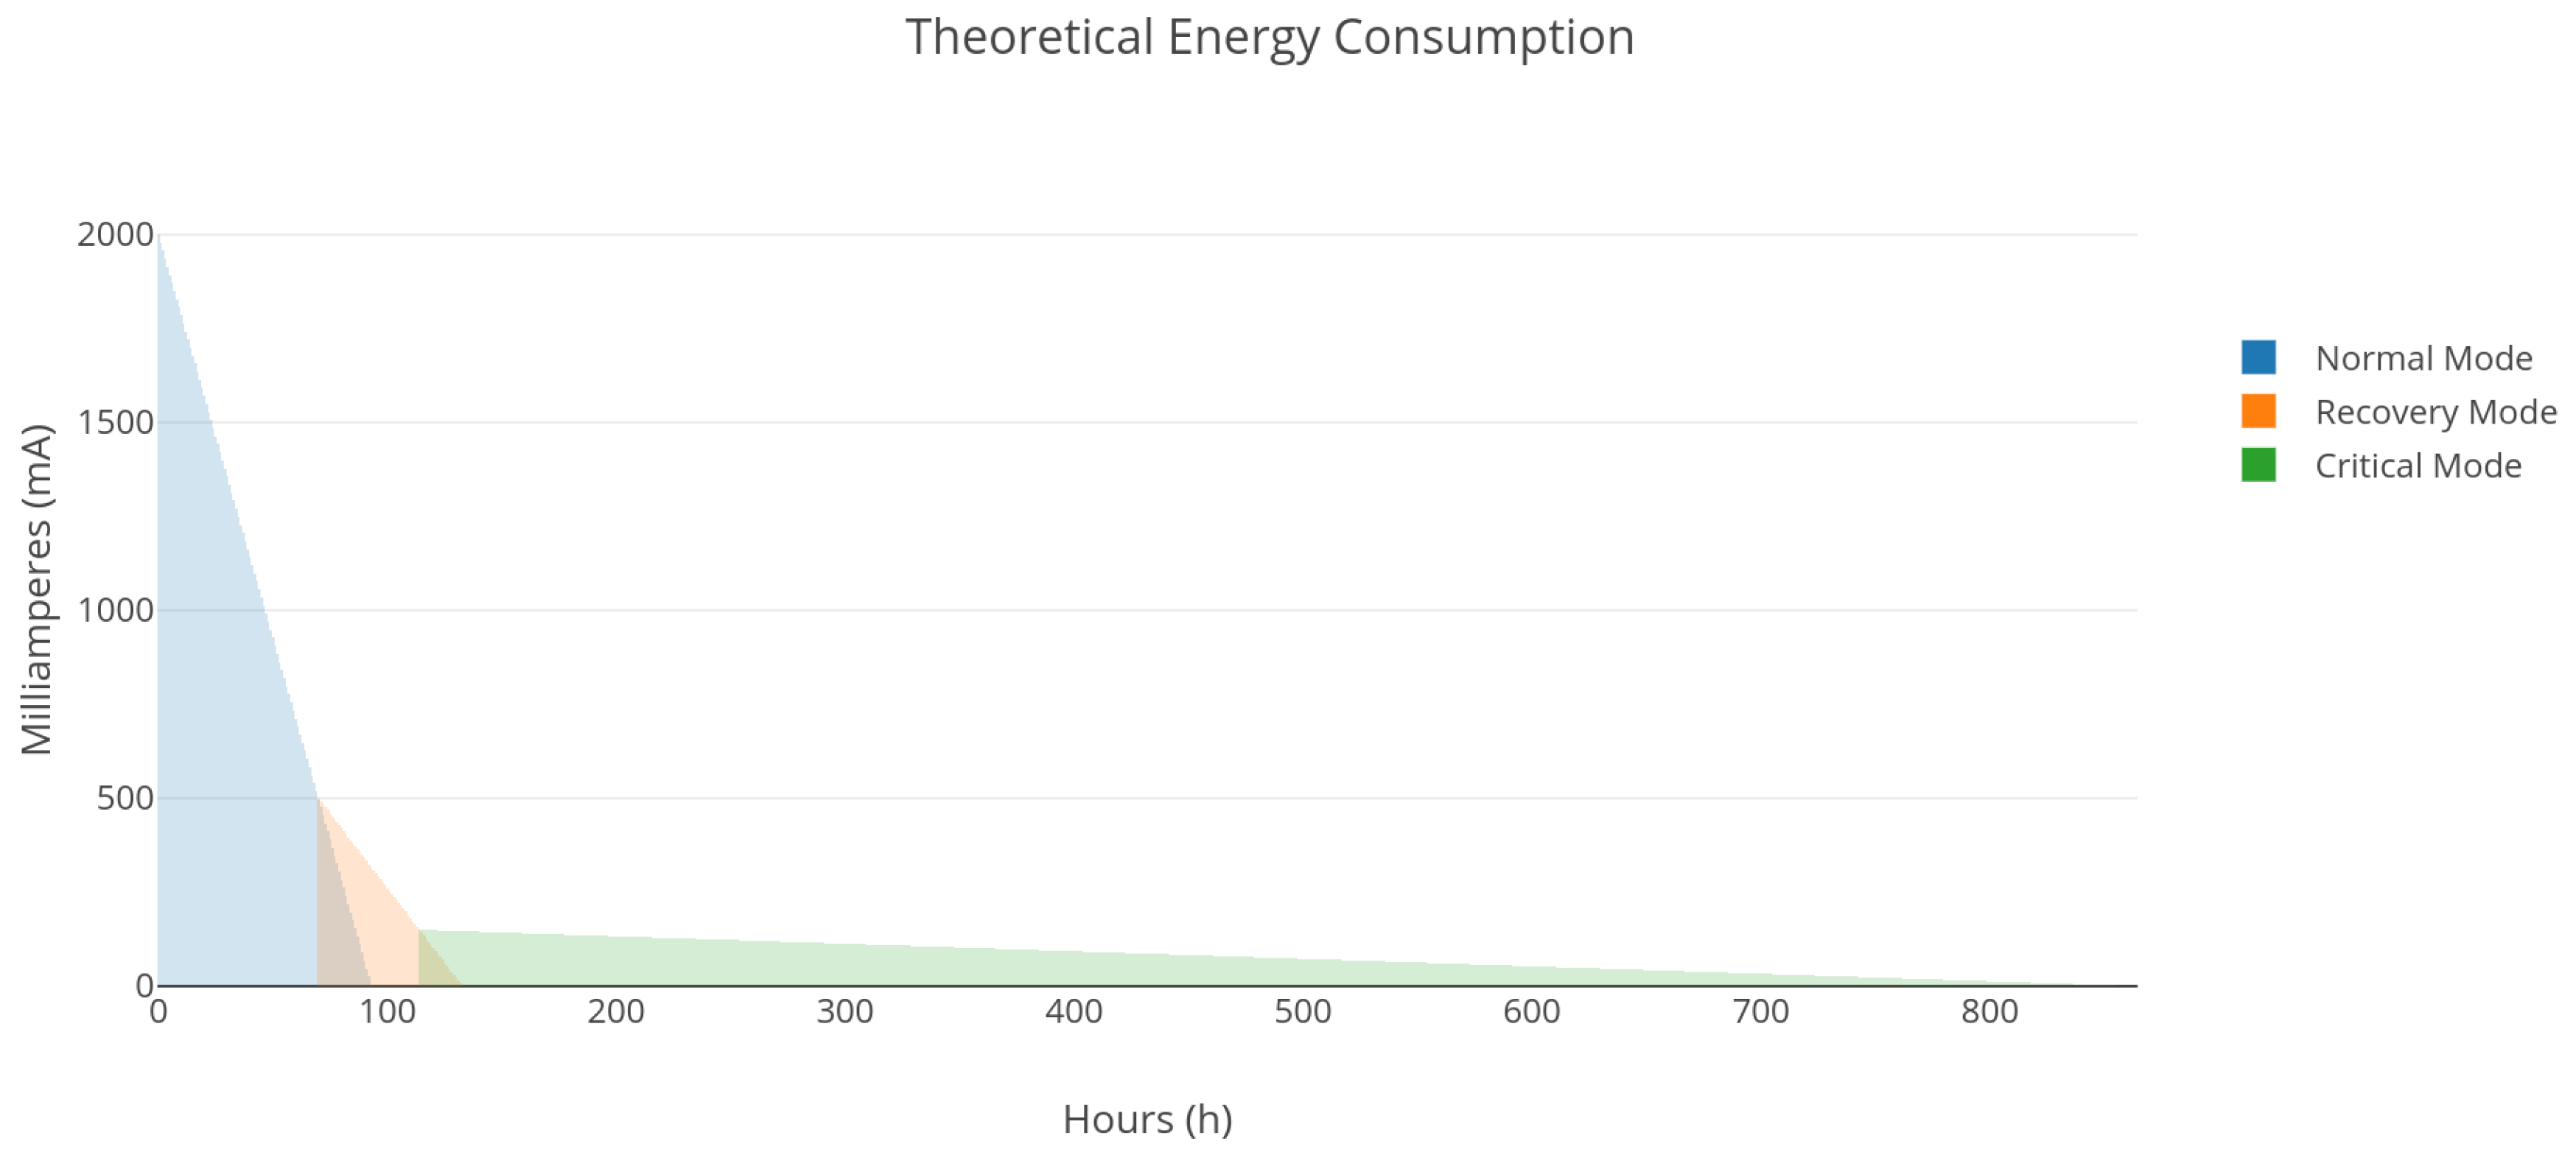
4.3.1. Theoretical Energy Consumption
Table 4 shows the energy consumption of the Electron microcontroller in the different modes (normal, sleep and deep sleep).
Consumption can vary considerably depending on the peripherals connected to the board. The different components along with their energy consumption are shown in Table 5.
To obtain the theoretical consumption, we consider the IoT node operating in the normal energy mode defined in the previous section. The other modes have a secondary role, and the normal mode is executed throughout the majority of its life assuming a proper operation.
In what follows, the Table 6 shows the seconds of each hour in which the node is applying energy-saving techniques, sending data or in the normal mode. The microcontroller consumes 19.3 mA every hour.
The consumptions of all sensors included in the SEnviro node version are shown below. We consider that all sensors are active for 60 seconds during each iteration, which corresponds to the period in which the microcontroller is active. Table 7 shows the consumptions of the components per hour, in total it needs 2.1625 mA.
Regarding the MPPT, it has a consumption of 3.5 mA every hour when it is active (when it charges the solar panel) and 0.085 mA in standby. The number of solar hours in Spain has been taken into consideration, considering an average of 12 solar hours (minimum 9.5 solar hours and maximum 14.9 solar hours). The consumption of the rain gauge and anemometer is negligible since they are passive circuits.
In this way, the total consumption of the node (microcontroller, sensors, and components) is 21.4625 mA in the normal energy mode. Thus, with the indicated battery (2000 mA), the node can work continuously for 93.19 h, which corresponds to 3 days, 21 h and 11 min until the battery is exhausted.
As detailed above, two modes have been added (Recovery and Critical) to prolong the life of the node, with which it is expected to extend the life of the node to so that it can function in long cloudy periods with little presence of the sun.
The recovery mode starts up when the battery is at less than 25%, that is when it reaches approximately a battery load of 500 mA. Table 8 shows the energy consumption of the different states within the recovery mode. Unlike the normal mode, the recovery does not realize deliveries; otherwise, the node saves the observations in EPROM, to be sent later, when it goes into normal mode.
The energy consumption of the microcontroller in Recovery mode is around 6.80 mA per hour, to which should be added the consumption of the components (2.1625 mA) shown in Table 7. In total on consumption of 8.9625 mA, and with the remaining battery of 500 mA, the node could extend its life to 55.788 h (2 days, 7 h, 18 min) until the entire battery was discharged.
The last and most severe mode is the critical mode, which is activated when the battery is at less than 15%, that is when it reaches approximately a load of 300 mA. Table 9 shows the consumption of the different states within the critical mode. Unlike the other modes, the critical mode keeps the node in a deep sleep and only wakes up to check the battery status, it does not consult the sensors, so any observations are lost.
In this case, the sensors are not being consulted, despite this a consumption of 0.02916 mA is generated during the period in which the battery level would be consulted, since the sensors are in a standby mode. To this the consumption of the microcontroller of 0.1998 mA per hour should be added, so that the total energy consumption of the critical mode would be 0.22896 mA per hour. With this consumption and with the remaining 300 mAh, the node could extend its life to 1310.27 h (54 days, 14 h and 16 min).
Figure 9 shows the theoretical energy consumption of the node. The chart indicates when changes in energy modes occur. These changes would occur: from the normal mode to the recovery on the 3rd day; from the recovery mode to the critical the 5th day; and through the critical mode, the node would be without a battery after 37 days (864 h).
4.3.2. Real Energy Consumption
The first test without a solar panel and using only the normal mode with a 2000 mAh battery reveals 73.5 h of autonomy. Nonetheless, the real test suggests that under such conditions the energy consumption is 27.25 mA per hour, instead of the 19.3 mA defined in the theoretical consumption. If we compare the results obtained with the solution presented in the previous version of SEnviro, we obtain a substantial improvement, tripling the energy autonomy.
This result seems satisfactory in terms of being able to deploy the nodes and keep them permanently active. The developed IoT node could keep the sensor alive for three days, one hour and 30 minutes without any charge through the solar panel. The first energy problems could appear after three cloudy days without any sun. However, even on a cloudy day, according to the tests made, the solar panel can charge with a low frequency or maintain the battery. Besides, the solar panel presents very satisfactory results; it can charge the battery with an approximate rate of 200 mA per hour.
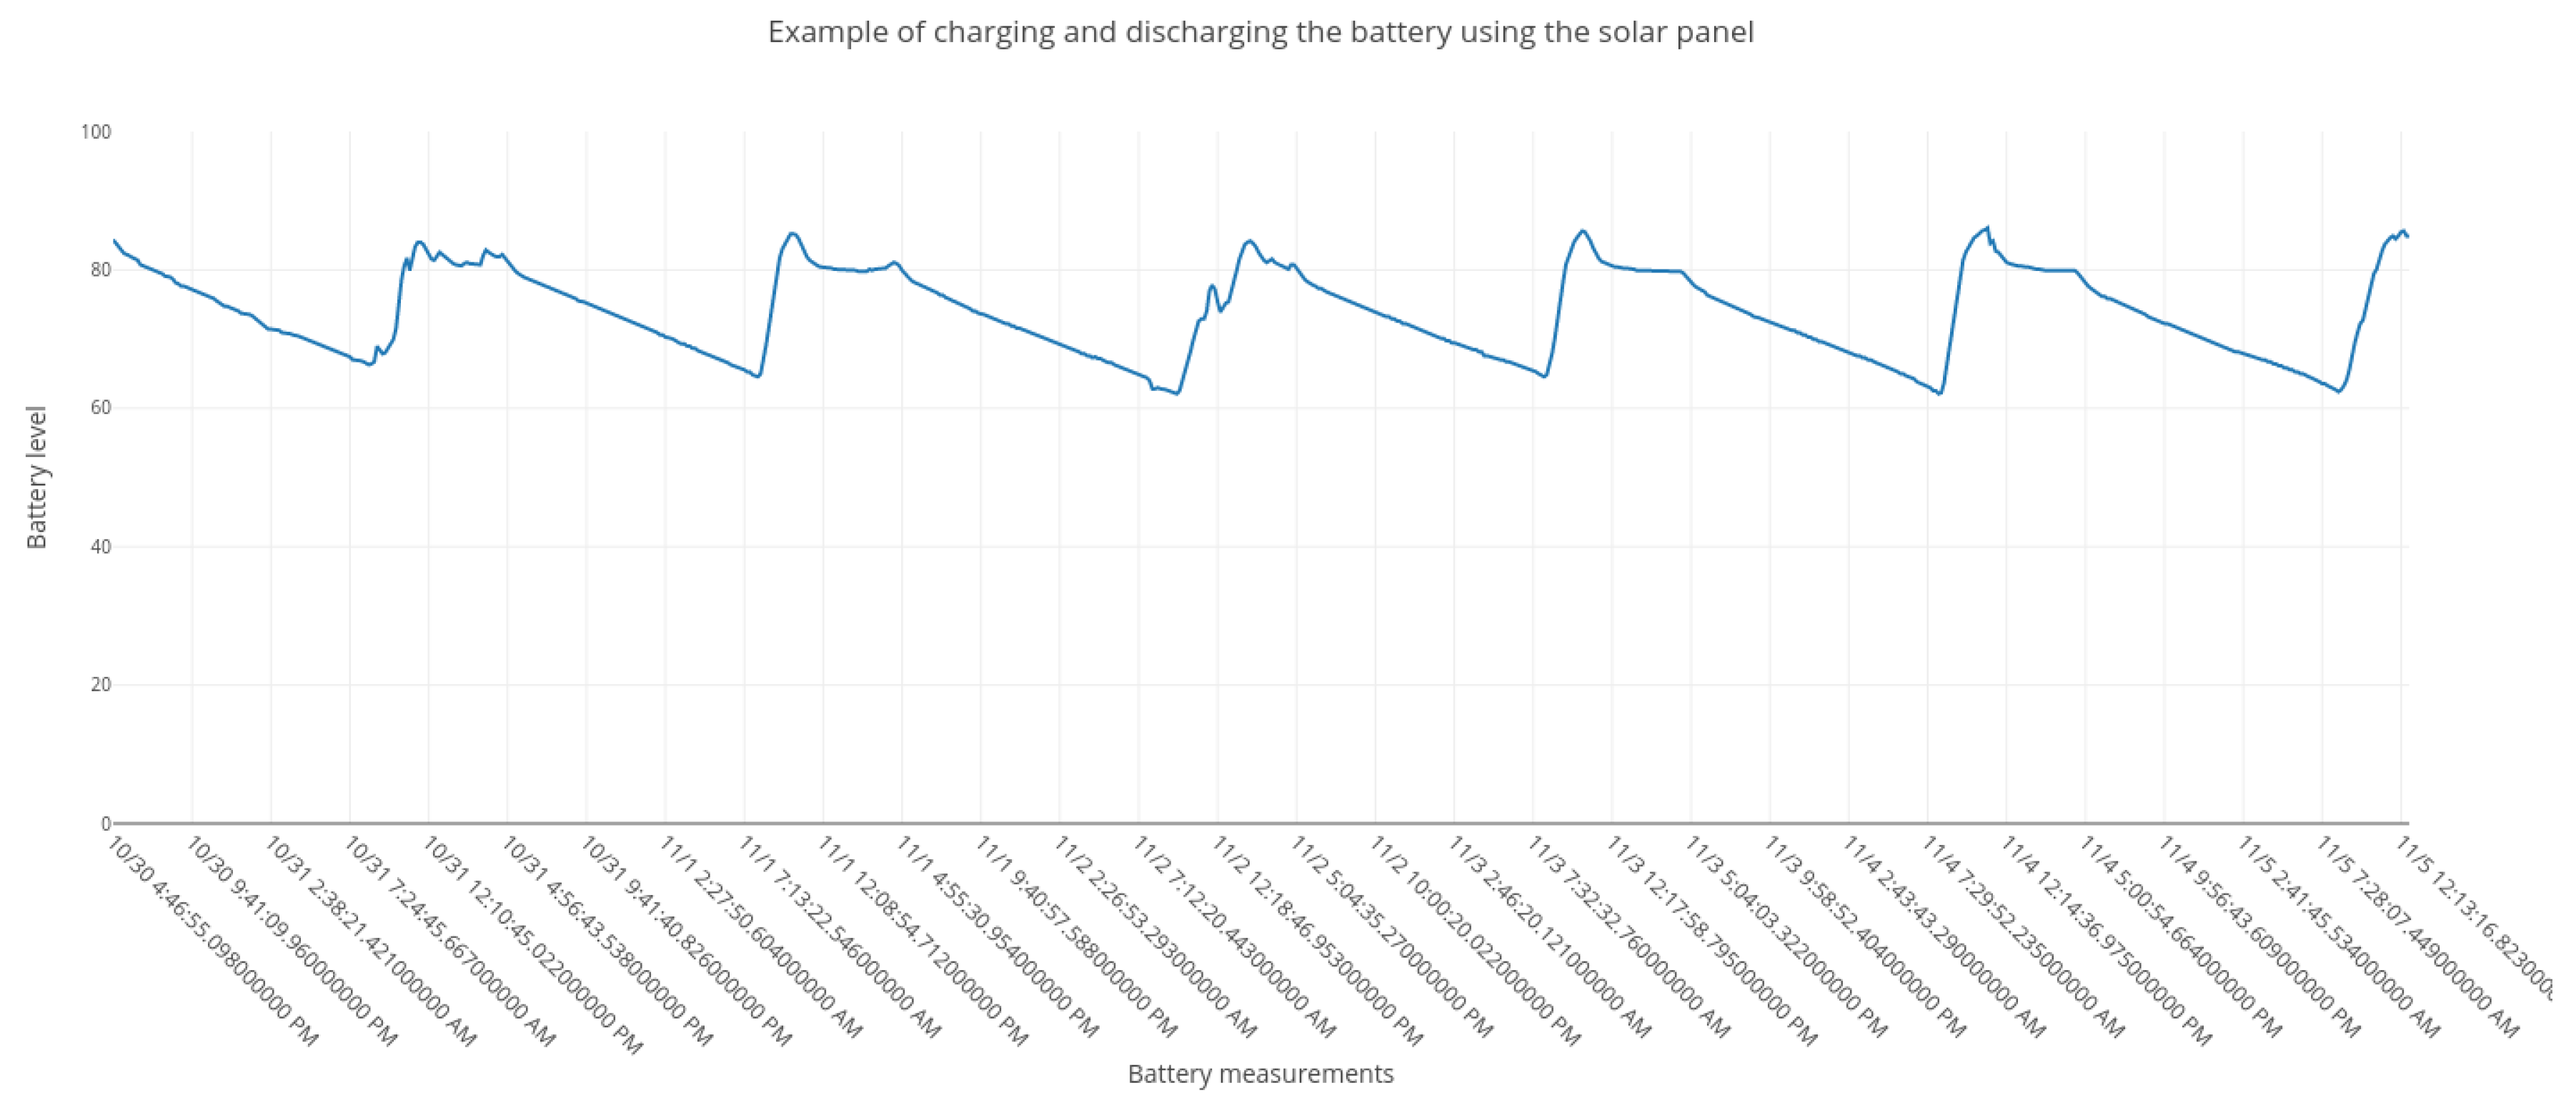
As will be shown in the next section, five SEnviro nodes were deployed for 140 days, and none of them presented energy problems. During this period there were several consecutive cloudy days, which did not affect node operation. The solar panel also managed to charge during some of those days, although at a lower rate.
The chart below (Figure 10) shows the time series of the battery level of one of the nodes. It shows the recharge capacity of the solar panel, which manages to reach the highest battery charge possible in a few hours. The maximum level has been 87.4% of battery. We can assert that, on sunny days, at the end of the night, the battery never drops below 60.77% and manages to recover its charge in 3 h of sunshine. On cloudy days (like the 2nd of November) the battery can maintain the level and increase with a low rate. During the period indicated period no node entered into recovery mode.
5. Use Case: SEnviro Node for Agriculture
This section presents a use case to test and validate the platform presented in the previous sections. First, the context where the SEnviro node has been deployed is described. In the second subsection, a sensor network deployment in vineyards is described. Finally, an IoT platform (SEnviro connect) developed to manage SEnviro nodes, and show sensor data and detected alerts is detailed.
5.1. Viticulture Context
One of the areas which has experienced the greatest adaptation of IoT platforms is viticulture. Viticulture has historically been characterized by obtaining a high-quality product. This has been made possible by many factors: the selection of suitable soil and climatic zones, as well as the varietal wines and the work of the winegrower in managing vineyards [33].
SEnviro for agriculture is used for monitoring and detecting vineyard diseases. The two components (SEnviro connect and Node) shown in Section 4 are applied to work together to achieve this goal. The main objective is to adapt both platforms to follow the models of diseases on vineyard crops. Based on previous studies about different models to predict vineyards diseases [34,35,36,37], we have defined four different diseases to predict. These are Downy mildew, Powdery mildew, Black rot or Botrytis. In what follows, these vineyard diseases are briefly summarized.
- Downy mildew: it looks like yellow to white spots on the upper surfaces of the leaves. The infection can start after rain or heavy dew. As the disease progresses, the leaves turn brown and fall off.
- Powdery mildew: initial symptoms appear as spots on the upper leaf surface that soon become whitish lesions. It grows in environments with high humidity and moderate temperatures.
- Black rot: a fungal disease that attacks grape vines during hot and humid weather. It causes complete crop loss in warm or humid climates but is unseen in regions with arid summers. This disease also attacks the shoots, leaf and fruit stems, tendrils, and fruit.
- Botrytis: a fungal disease that can occur anytime during the growing season, but most commonly occurs near the harvest time. At that time, birds and hail damage can encourage infection. Usually, Botrytis infects ripe berries.
All these diseases are based on meteorological conditions. For that reason, the SEnviro node is adapted to collect information on eight meteorological phenomena, which are directly related with these disease models. To do so, the node includes sensors to measure soil and air temperature, soil and air humidity, atmospheric pressure, rainfall, wind direction, and wind speed.
5.2. SEnviro Nodes Deployment
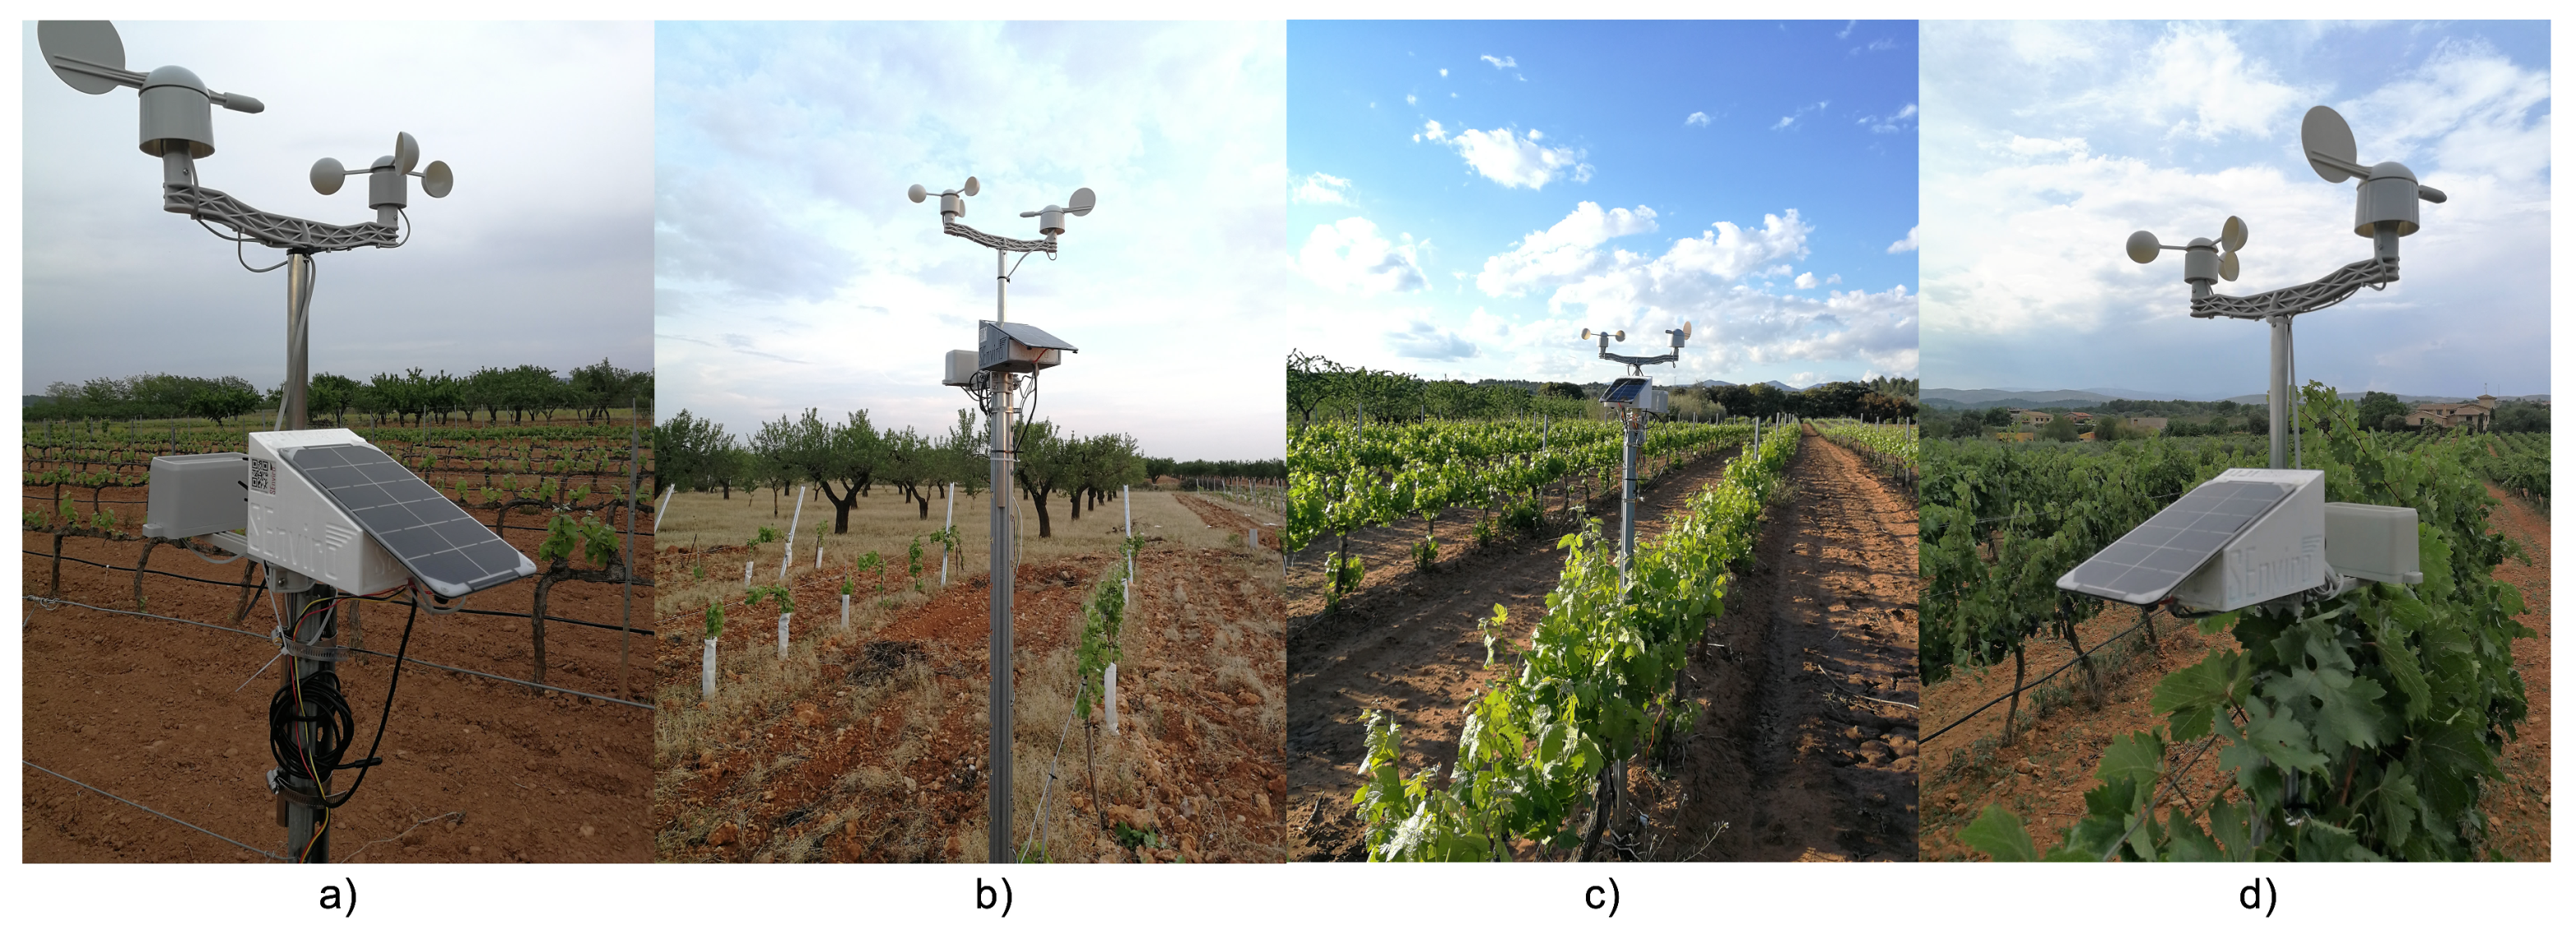
Five units of the SEnviro node have been deployed; four nodes have been installed in vineyard fields in the province of Castelló (Spain) Figure 11, and one unit has been reserved for testing in a more accessible location, closer to the laboratory (Table 10). At the time of writing this study, the nodes have run continuously and uninterruptedly for 140 days. Each node sent an observation every ten minutes during the vine season 2018.
Table 10 summarizes the success of all observations during this period. The unit with the best success ratio is number five, which showed a 98.75% rate of success (this unit was only deployed for 69 days). The worst performing unit is number four, the one which had its battery changed.
Some alerts were launched during this period, related to both vineyard diseases and the node itself. The objective of this study is not to evaluate or validate the different models applied to predict vineyard diseases, because there are various studies in the bibliography which have already done so. Our study only presents a validation to test the IoT architecture and how it can be used to monitor and predict disease in vineyard fields.
5.3. SEnviro Connect
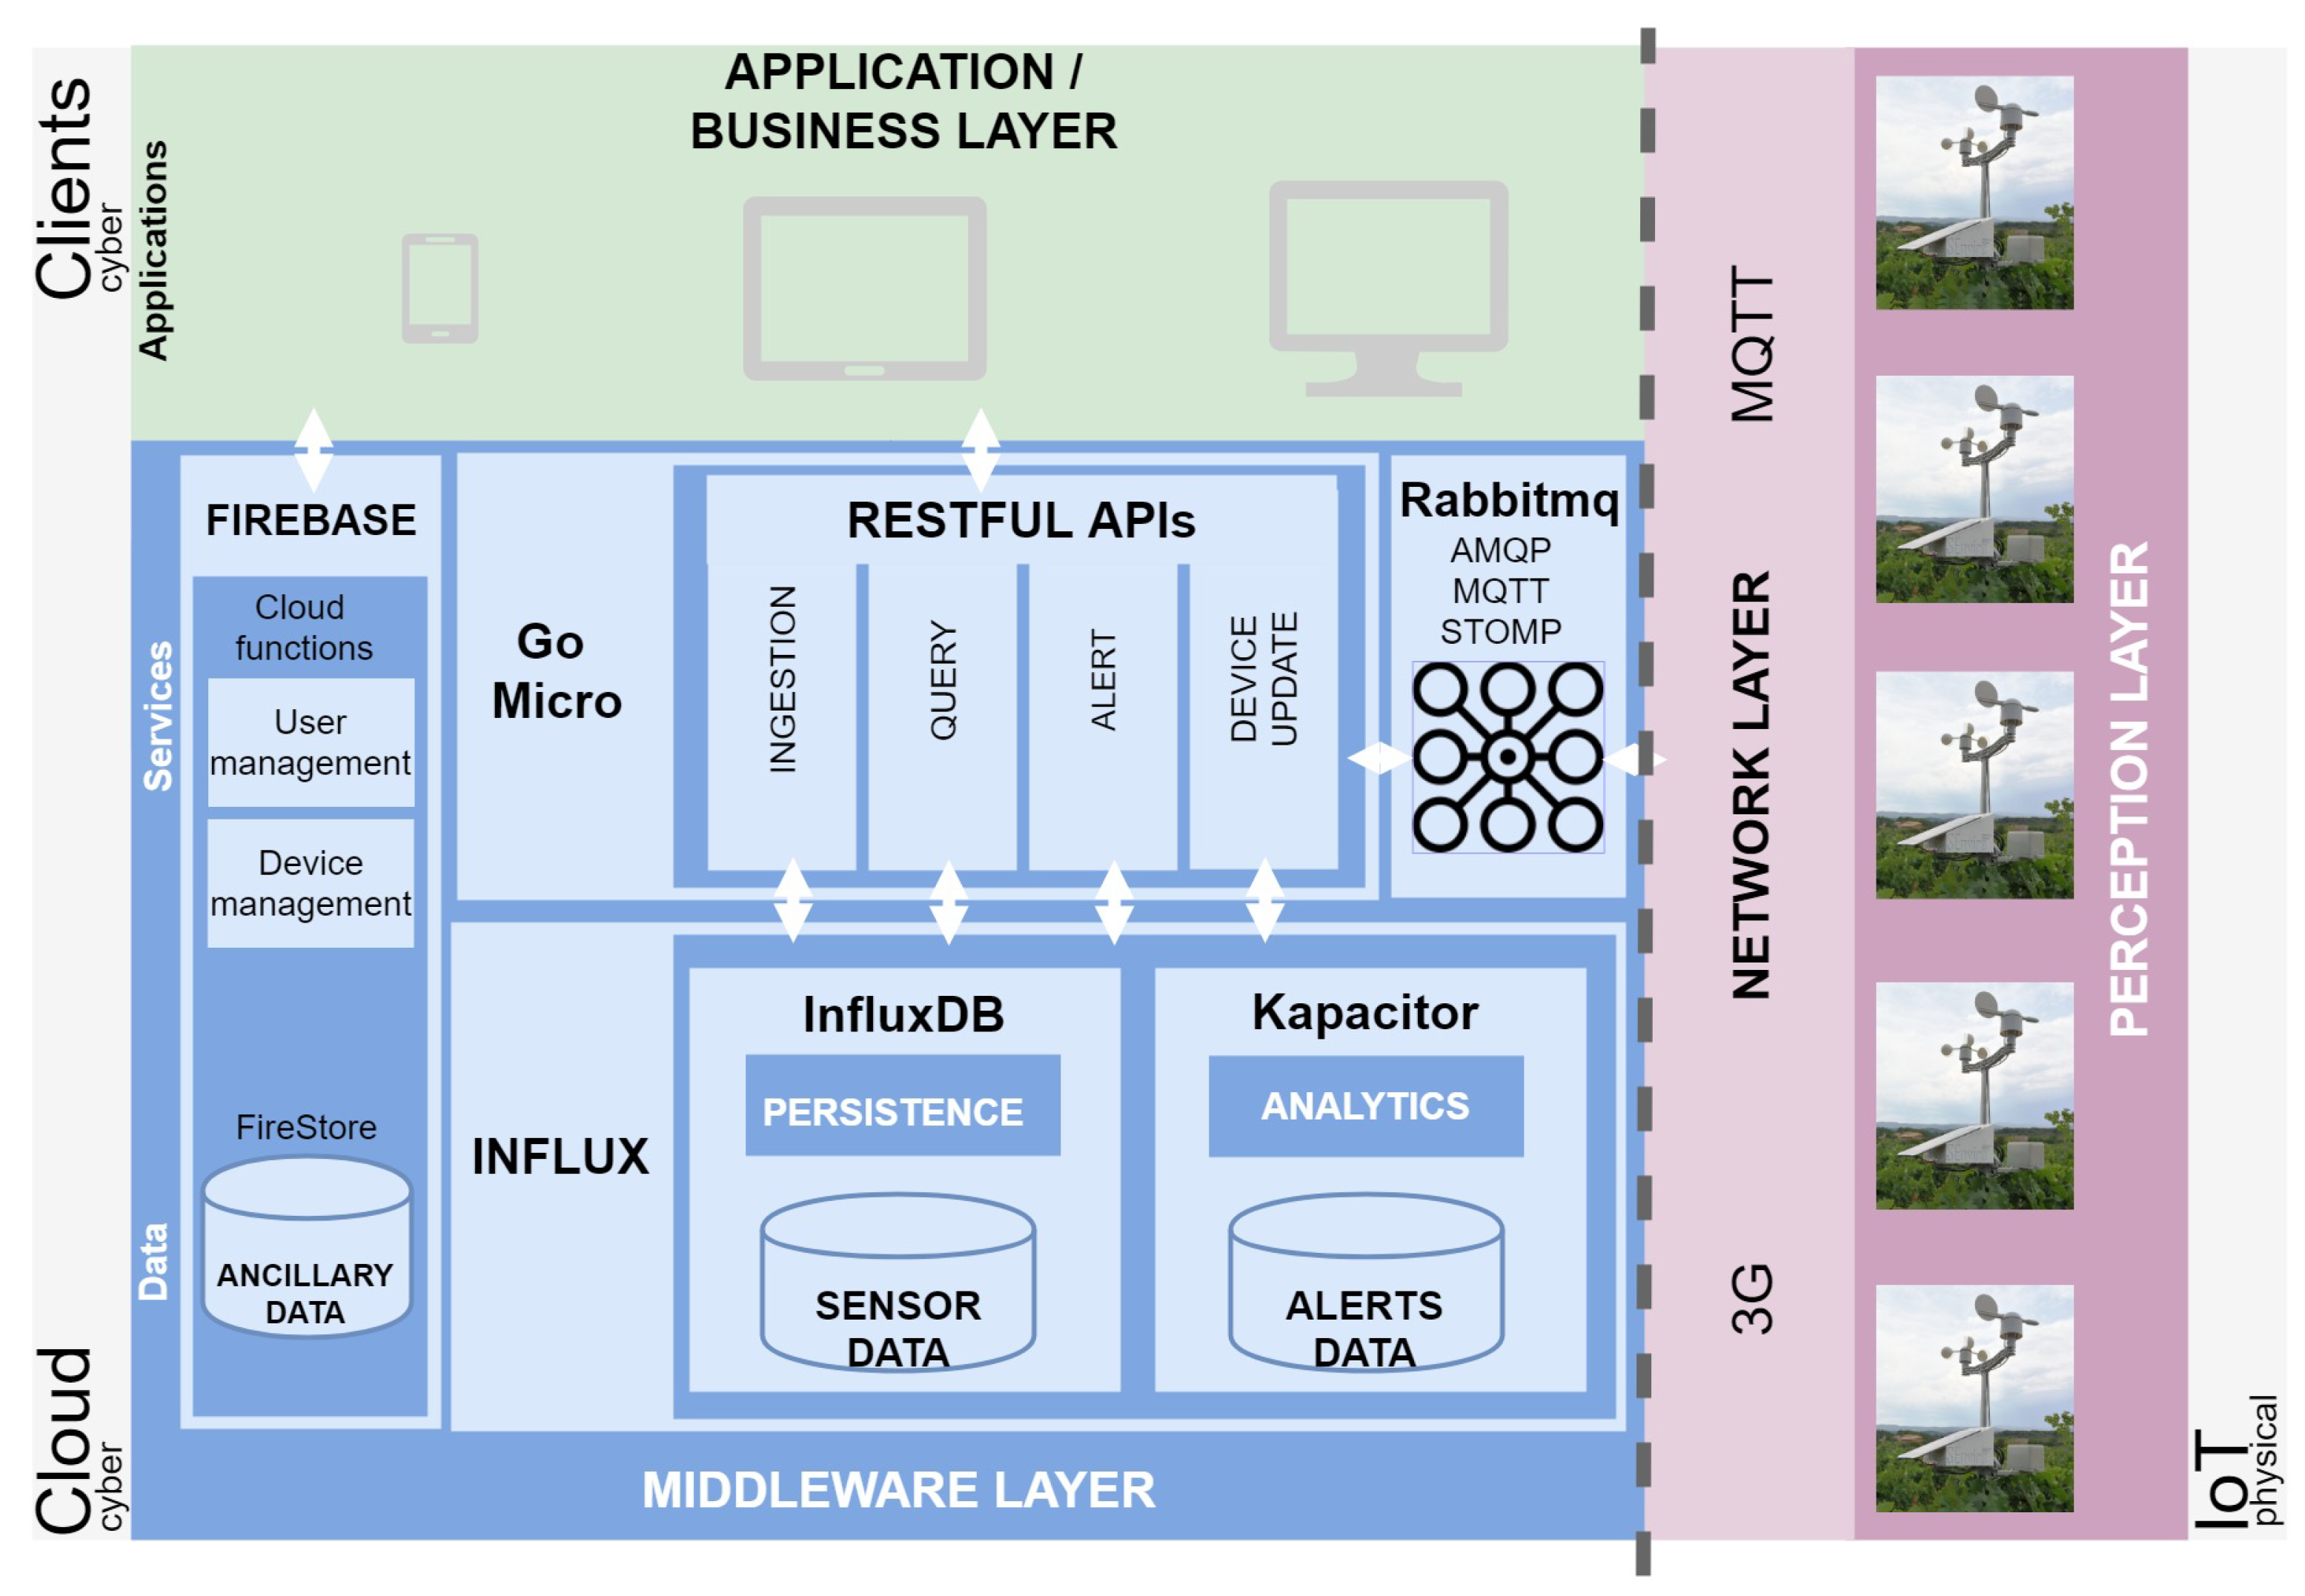
The IoT node defined in the previous sections forms part of a complete IoT project called SEnviro for agriculture. Figure 12 summarizes all elements of the annotated project.
At the hardware level (the purple part in Figure 12), we can locate the presented IoT node. If we look at SEnviro at the software level (the blue part in Figure 12), we find the SEnviro connect [38]. It provides a technological solution to manage and analyze IoT data. There are two layers covered by SEnviro connect, the Middleware layer, and the Application/Business layer.
One of the most important components to establish a bridge connecting IoT nodes with SEnviro connect is the broker. The broker offers a publish-subscribe base messaging protocol, called MQTT. It is designed for connections with remote locations where the SEnviro nodes are located; usually, the network bandwidth is limited. This component is based on a RabbitMQ instance. All components listed in the Figure 12 are detailed in [38].
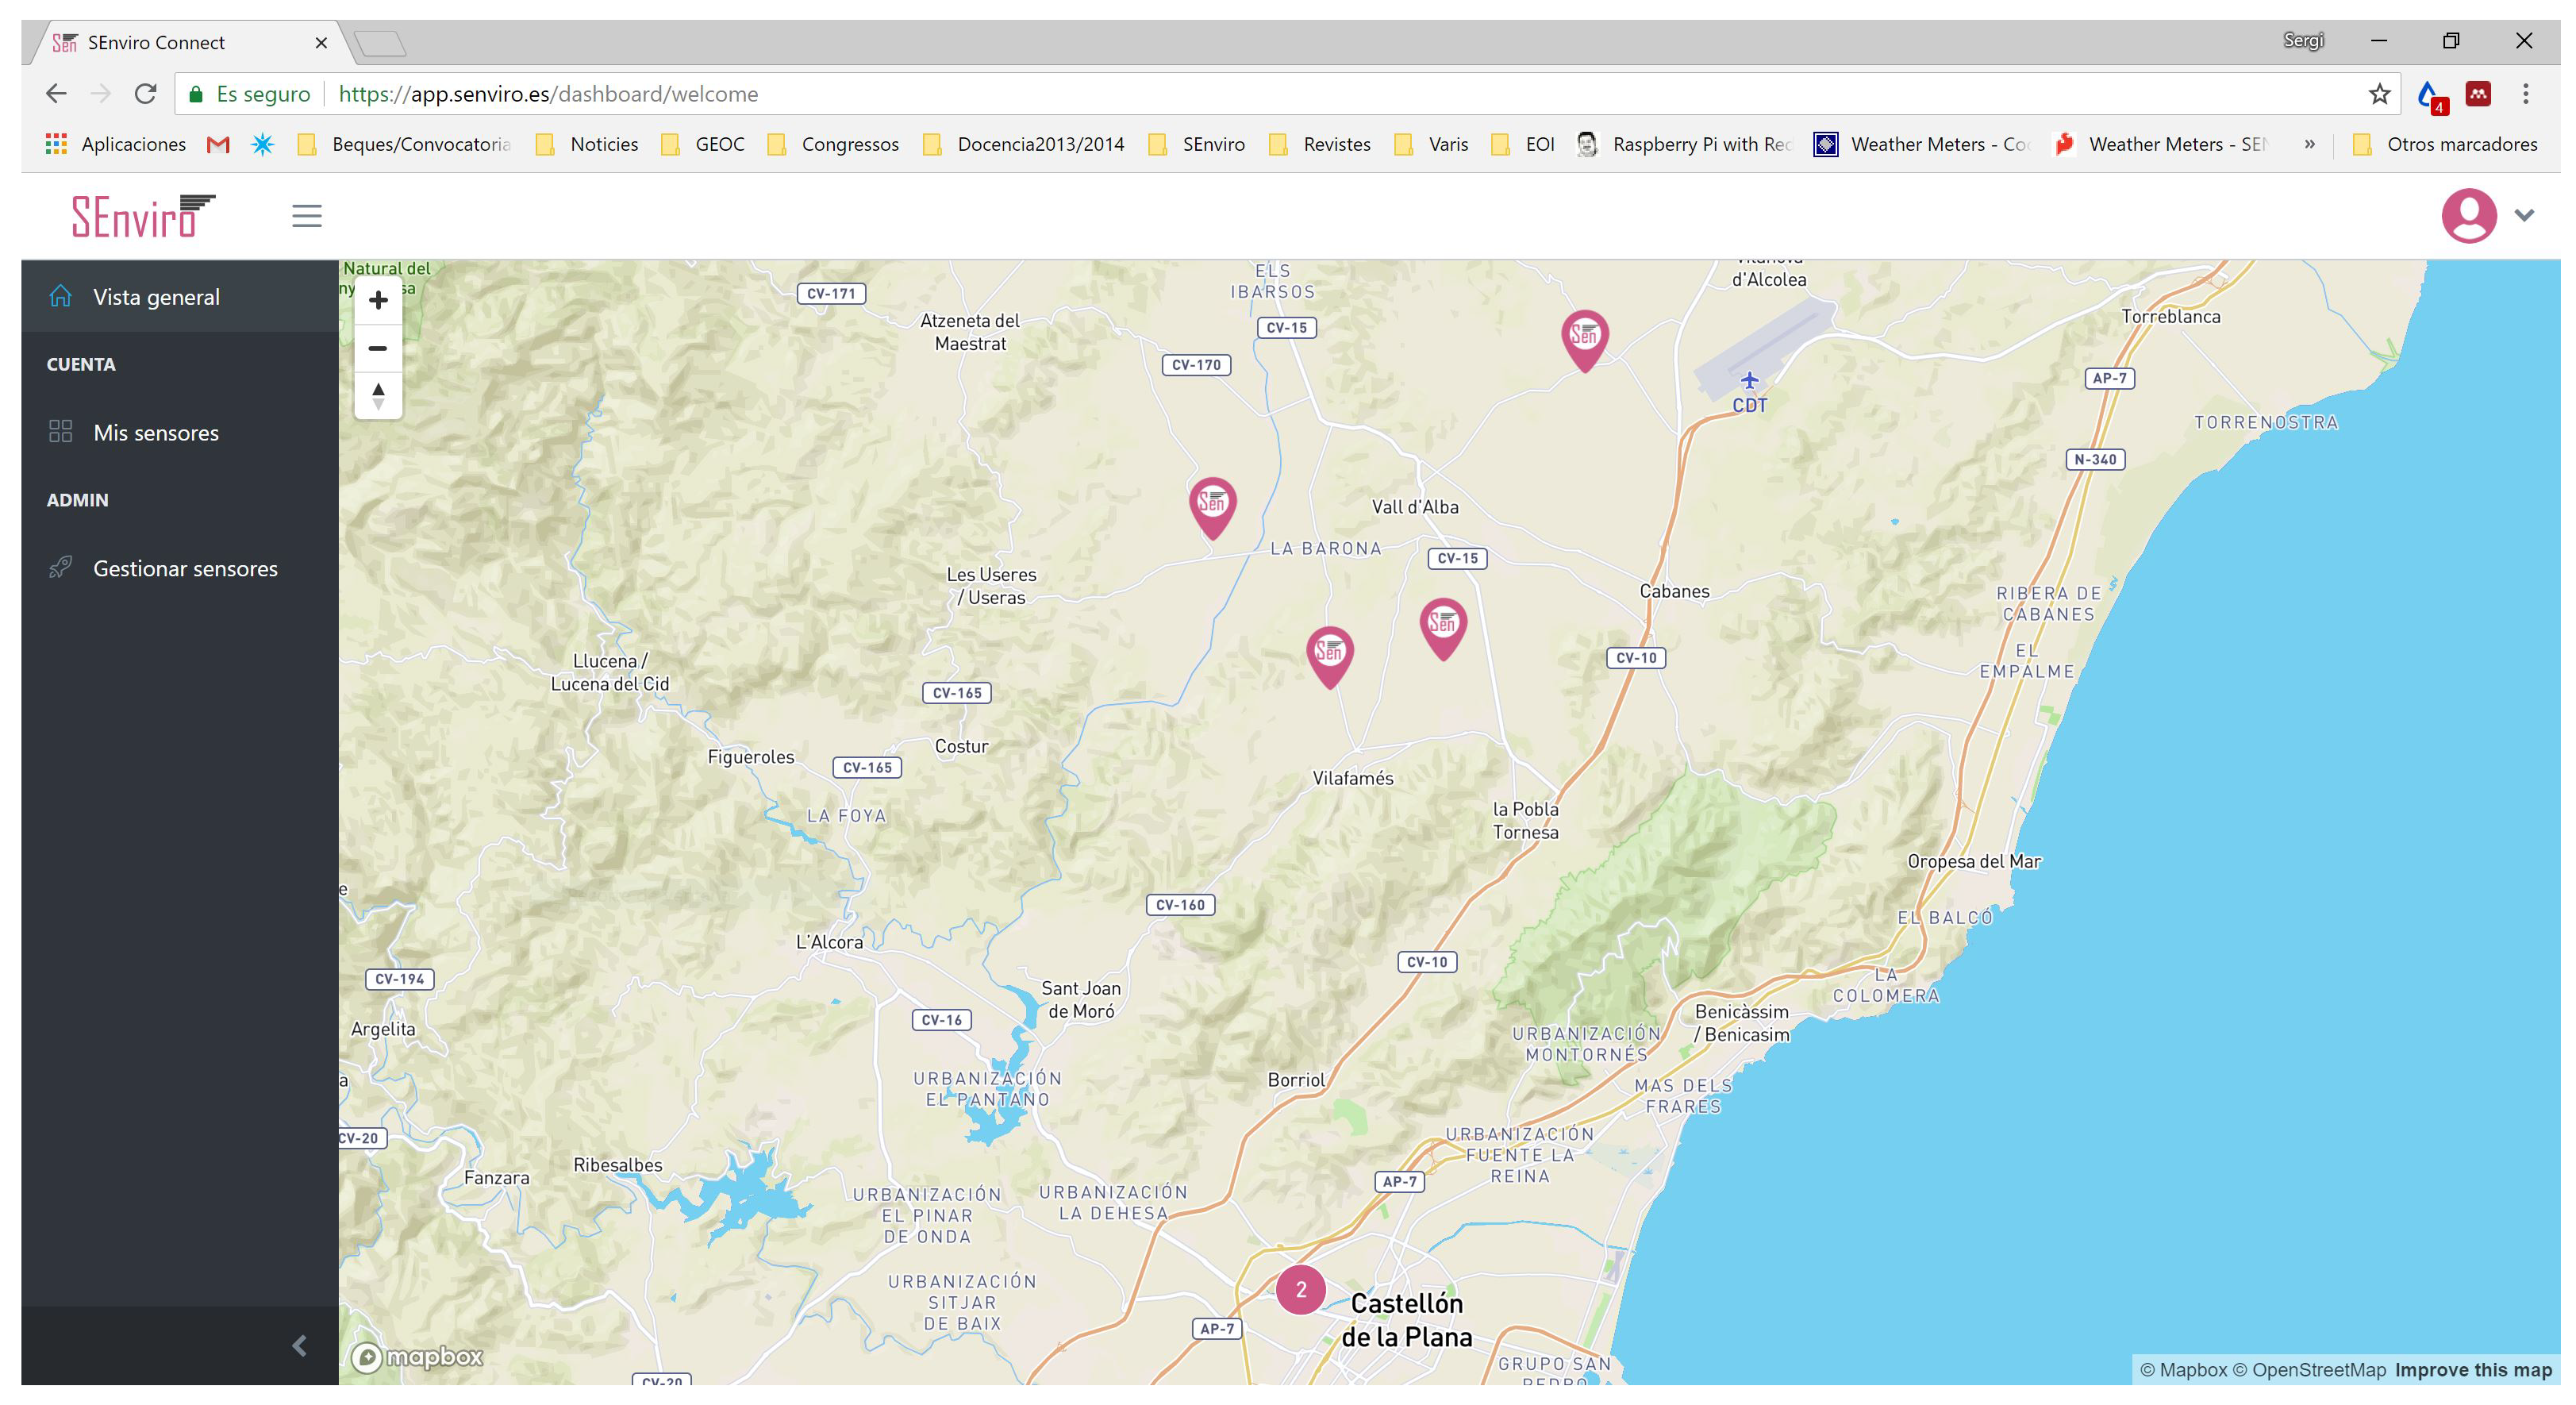
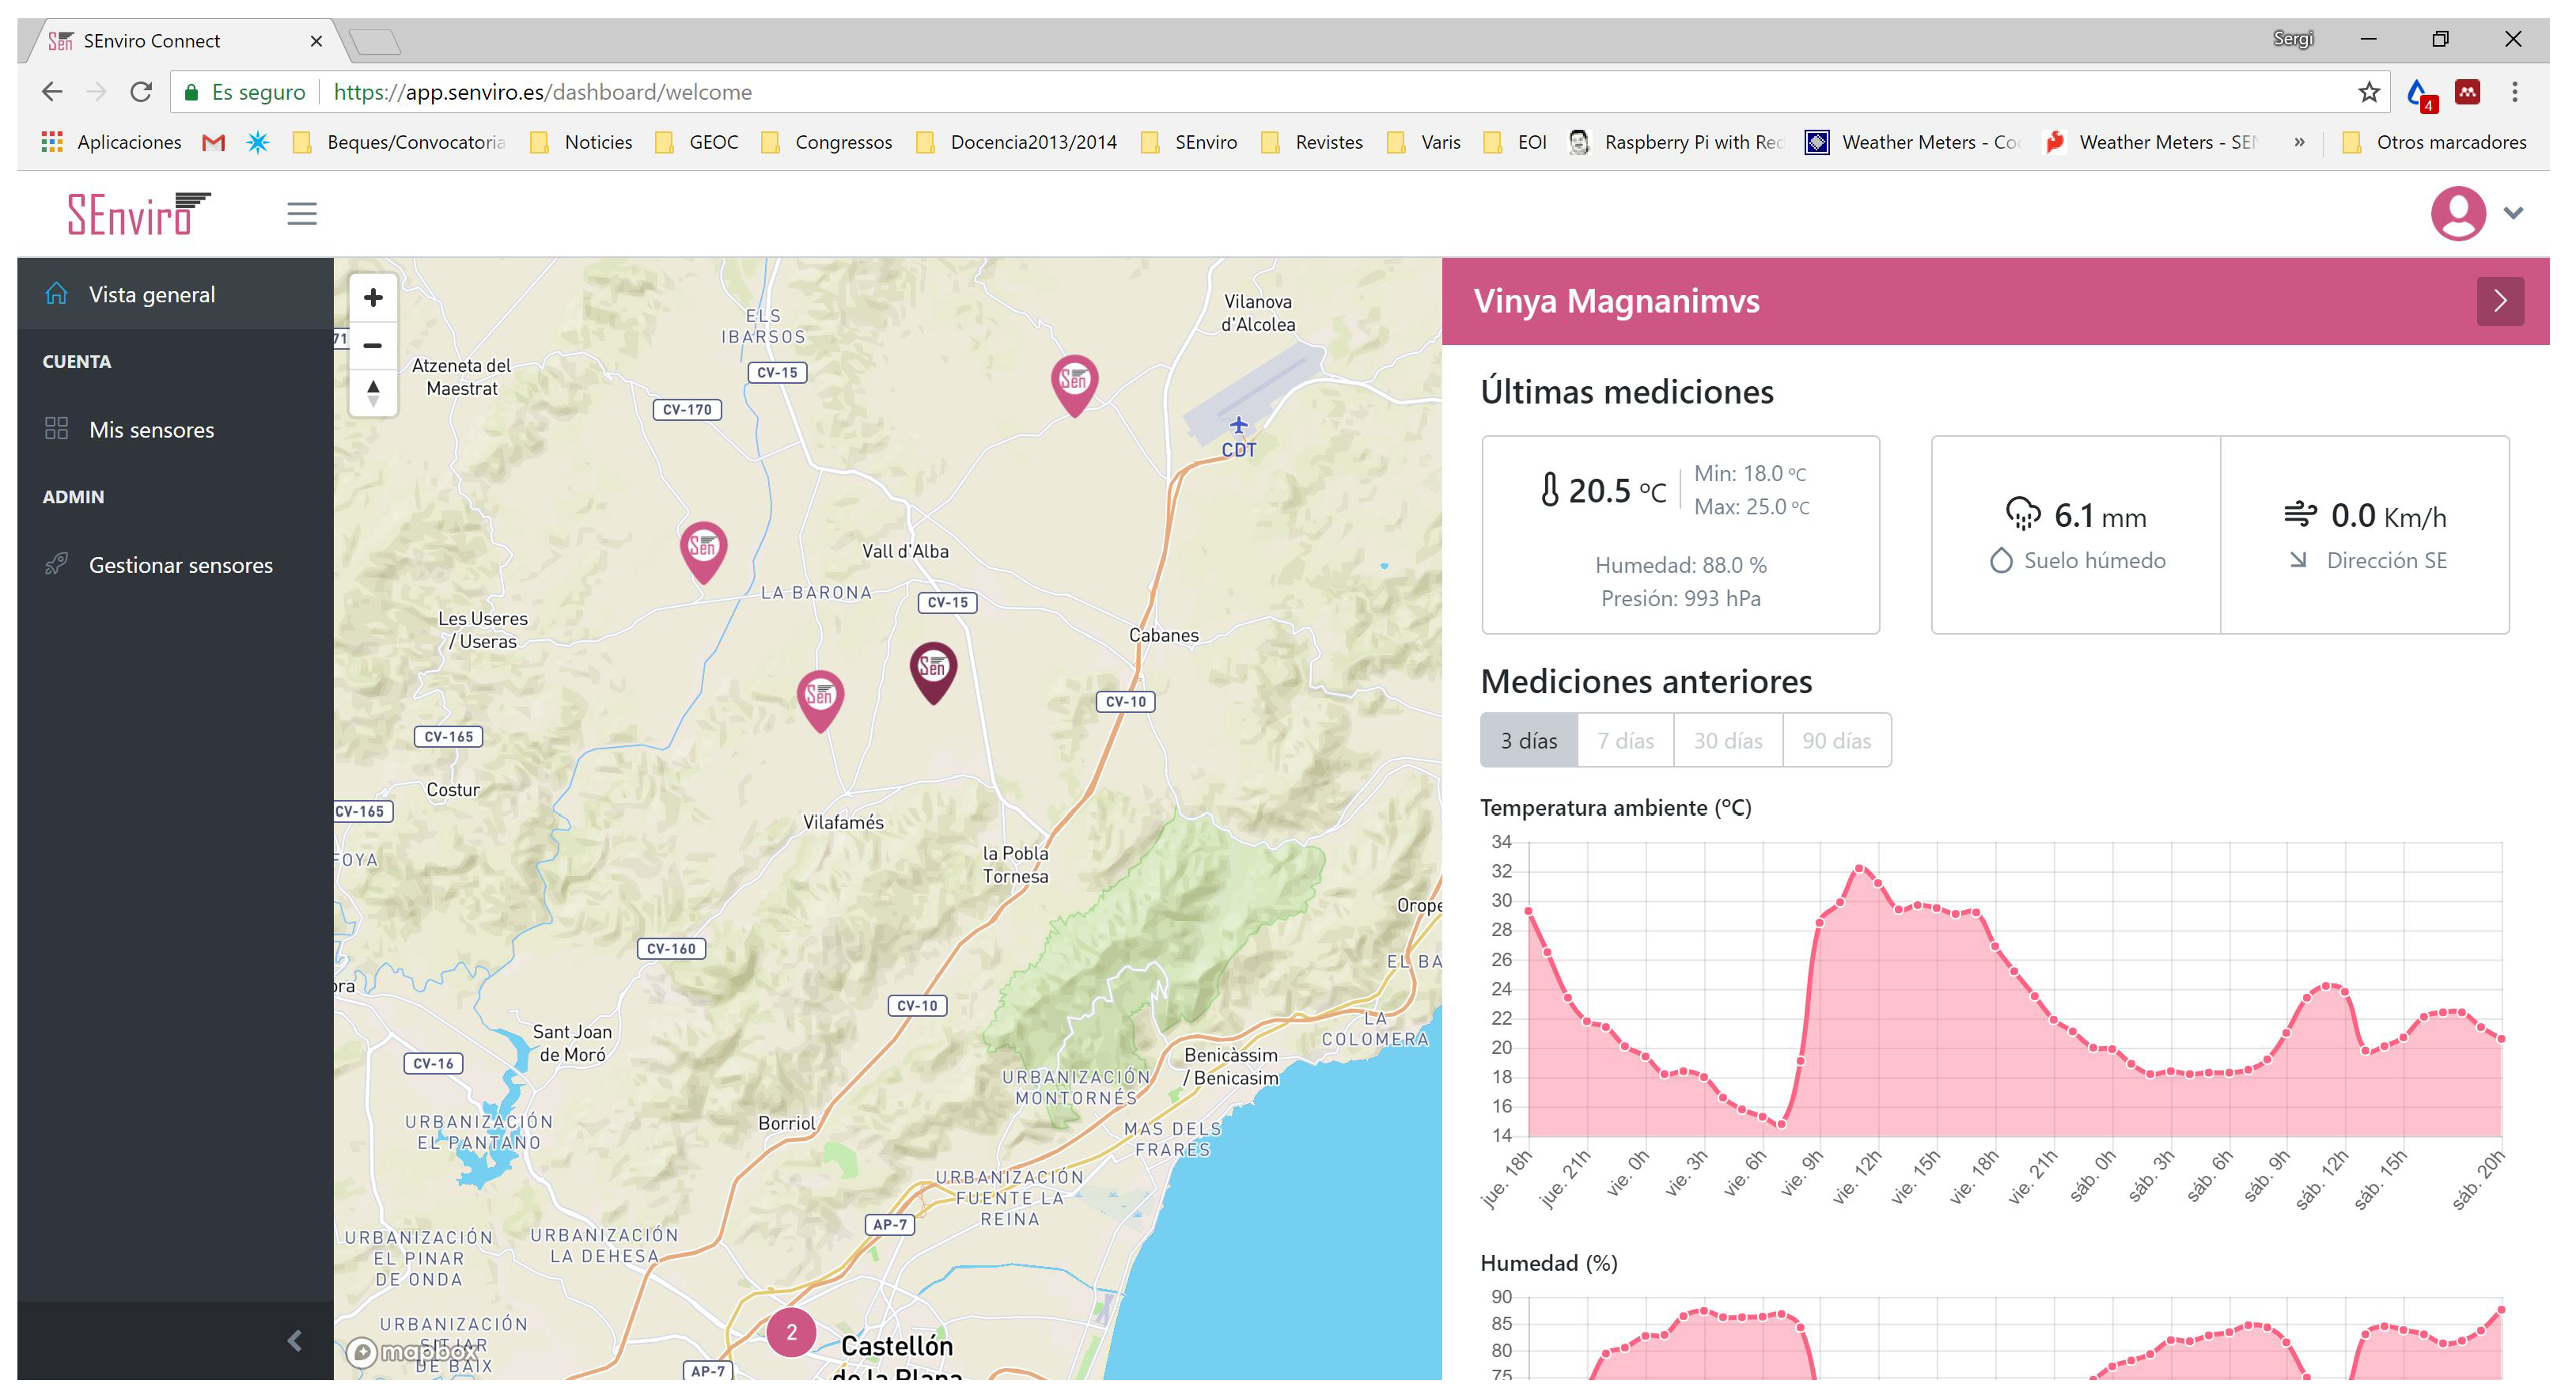
Moving from cloud to client, as a first prototype (Figure 13), a client based on HTML5, JavaScript and Cascading Style Sheets (CSS) has been developed. This client has been developed using Angular framework and follows a responsive design. The client is divided into two basic views, one view shows the SEnviro node state (battery, location, last connection, and node alerts); and the second one is focused on the vineyard use case.
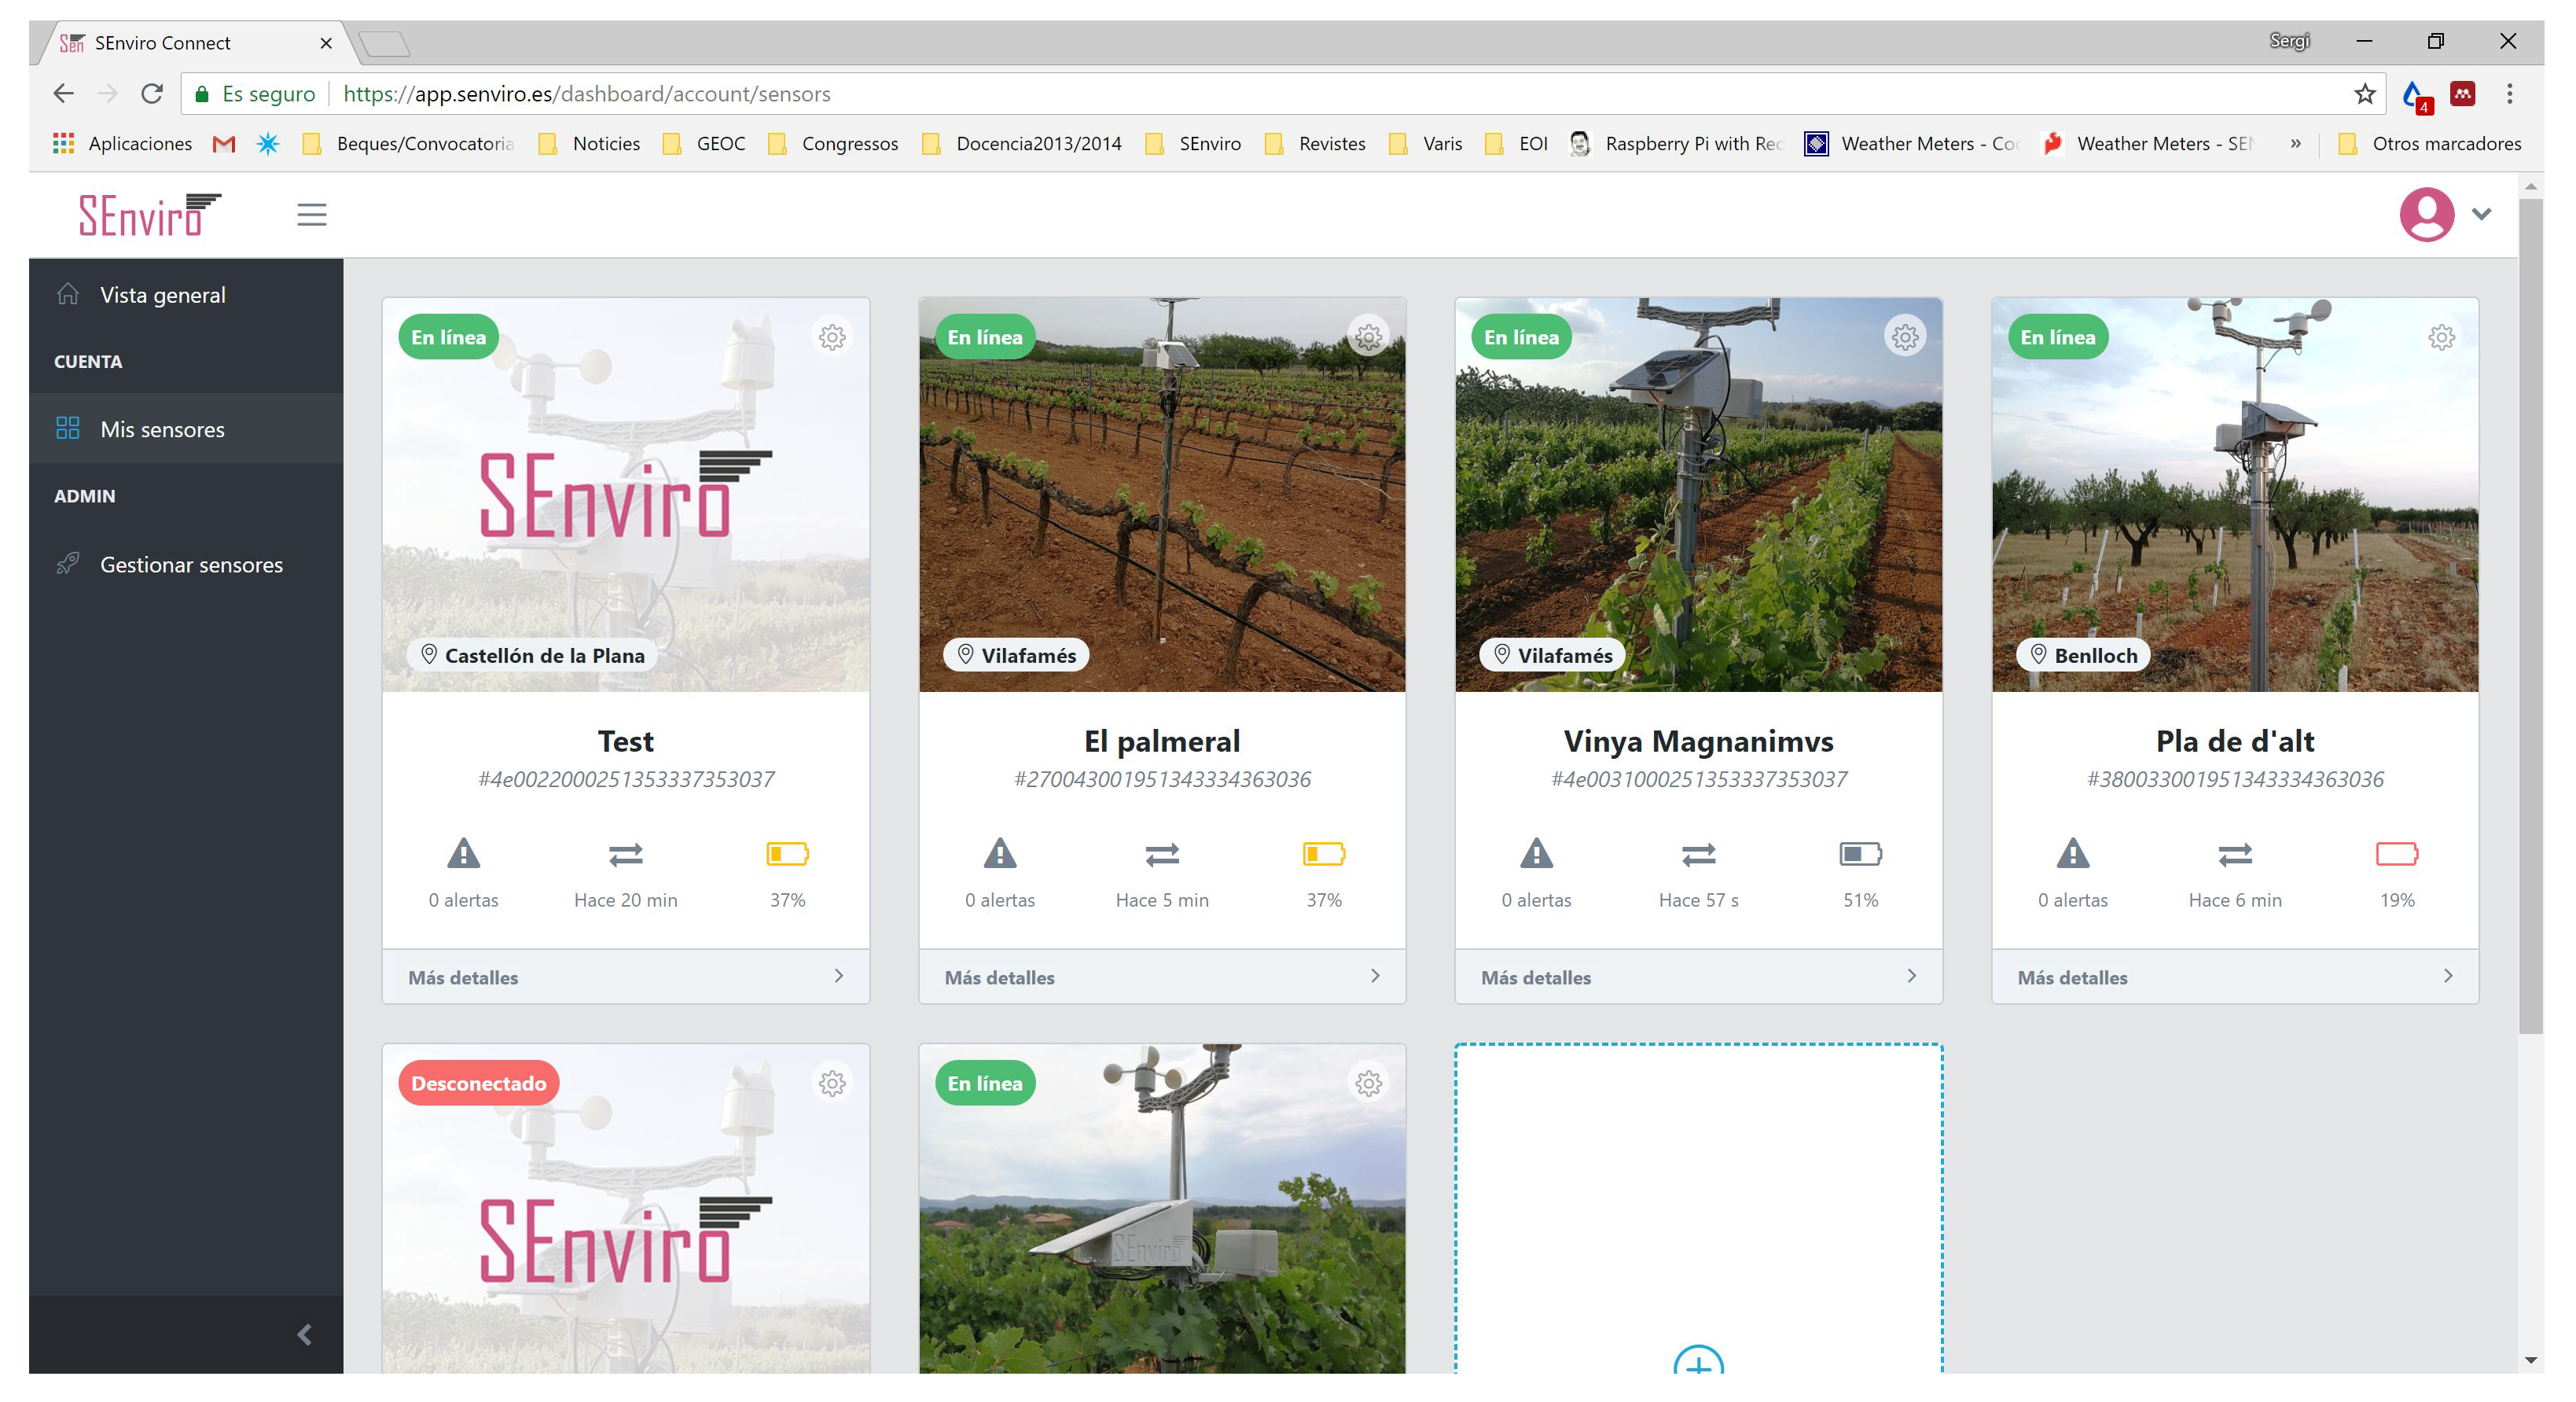
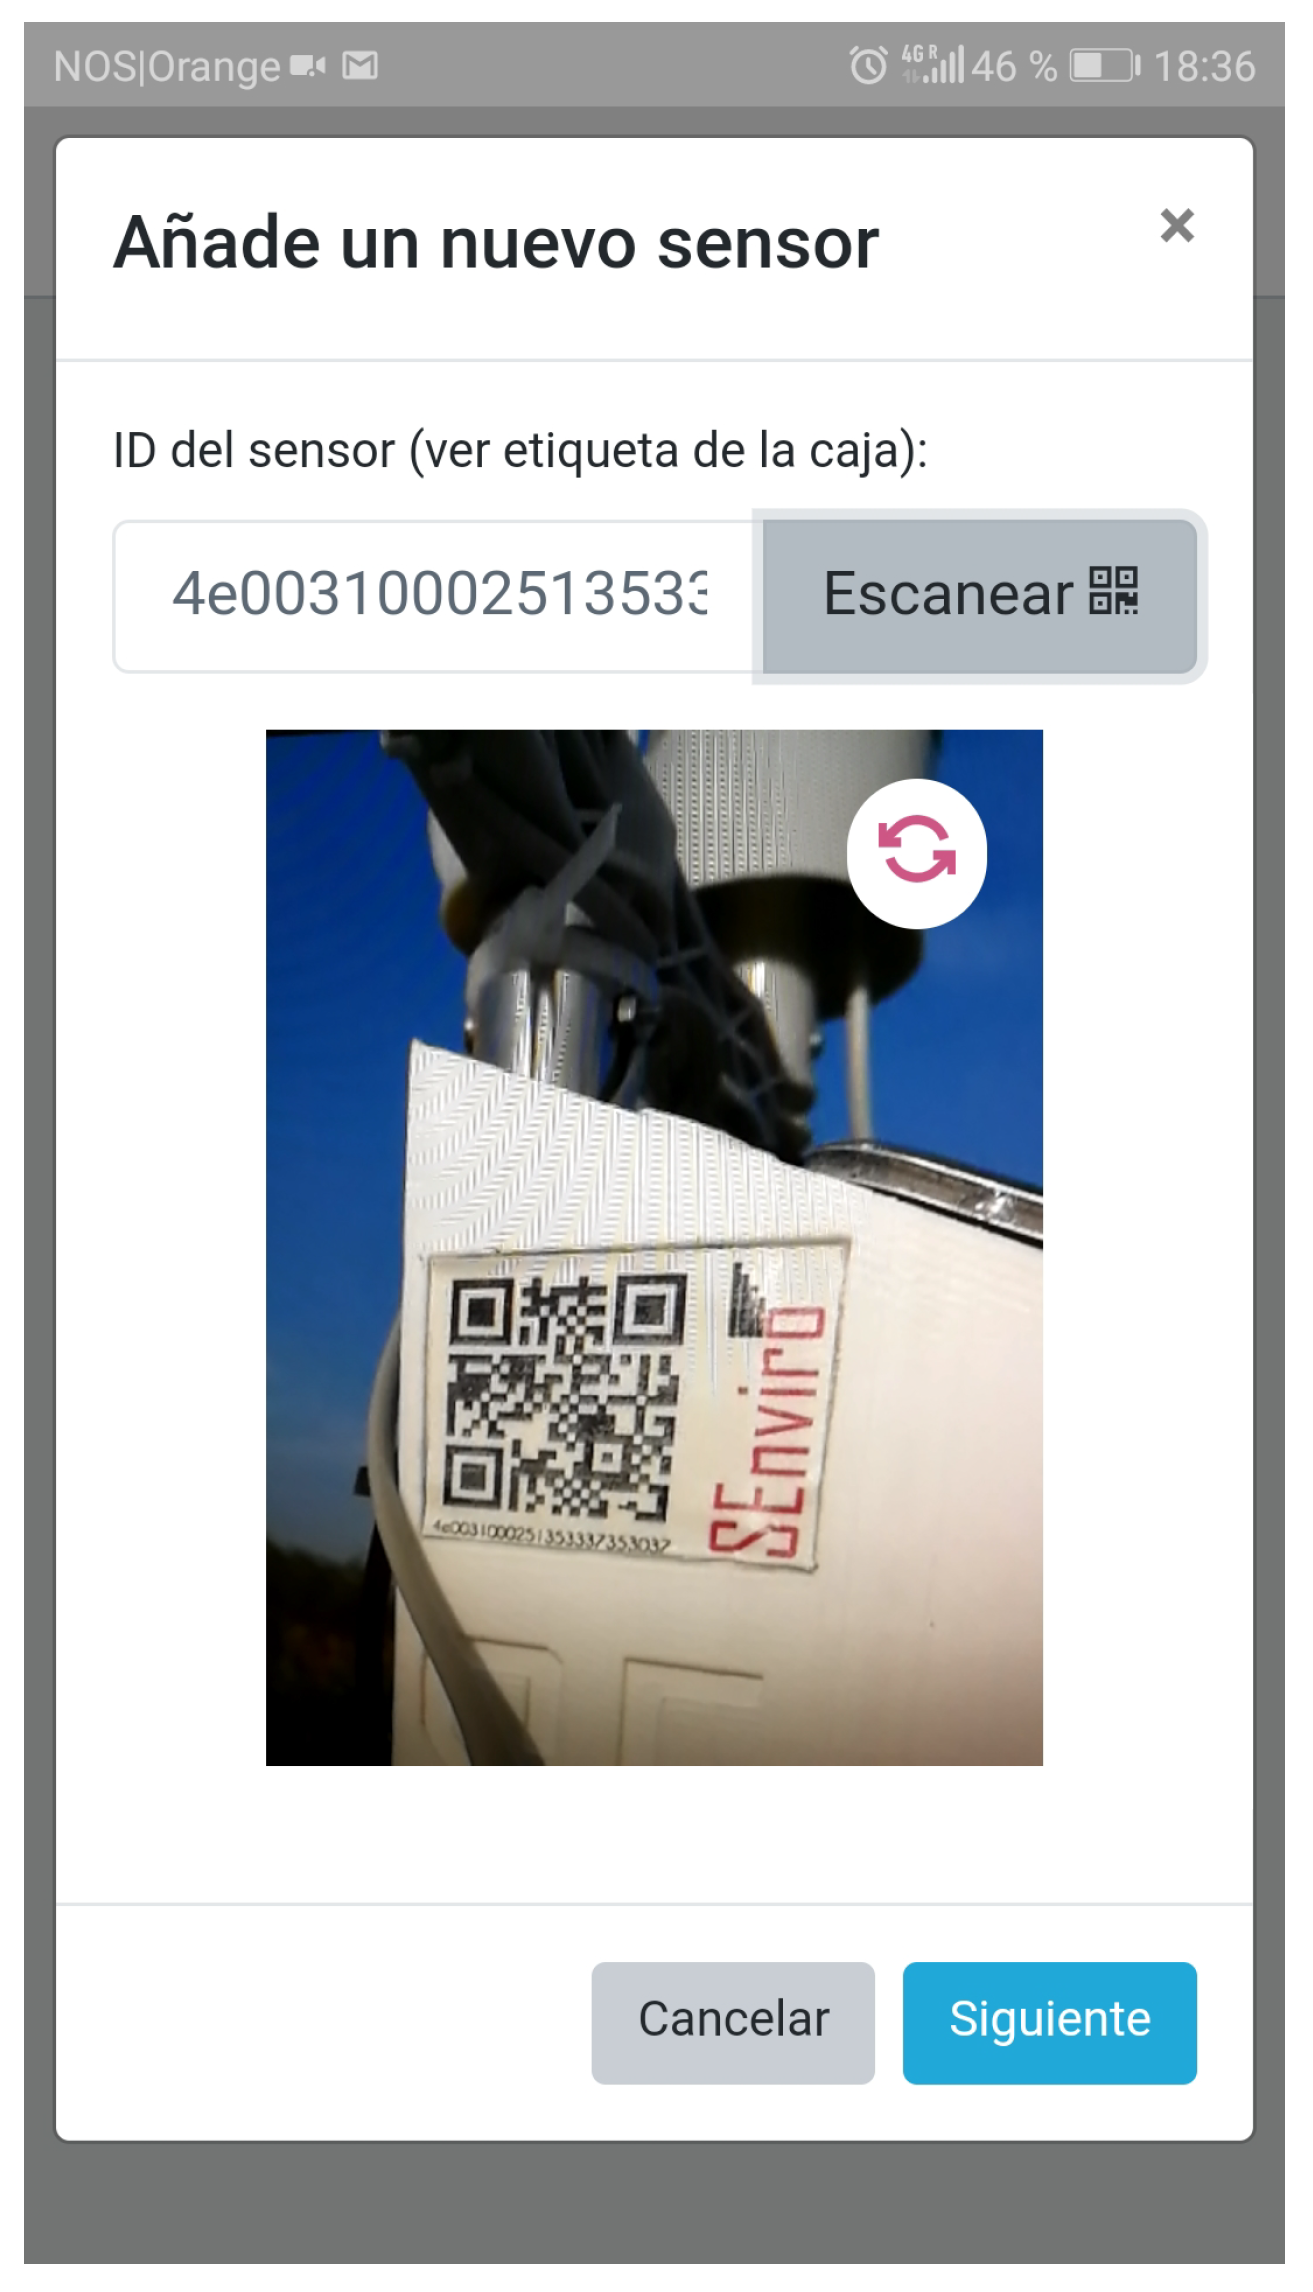
The first view (Figure 14) is more focused on managing the SEnviro nodes. In this way, new nodes can be claimed or edited. As stated above, each node has a QR code, the node can be claimed by recognizing the QR or adding its ID (Figure 15). A wizard has been developed to provide information about the location in which the sensor is installed, such as location (using GPS), smallholding name, and a picture of the deployment. When a SEnviro node is claimed it is listed and some information about it, such as battery percentage, state alerts (low battery or off-line node), and location, is shown.
The second view is developed to visualize sensor observations and alerts in a way which is adapted to the stakeholder (Figure 16), in this case, vineyard farmers. The proprietary sensors are listed on a map using markers. When a user clicks on one of them, the client displays a new lateral window to show each phenomenon in a different chart (with different levels of aggregation). This view is used to show the latest detected alerts from each supported disease model.
Four vineyard farmers have tested the web app during the 140-day period in which the SEnviro nodes were deployed in their smallholdings. Their opinions have been used to reorient some design aspects relating to the visualization of the information.
6. Related Works
Related research on IoT nodes is reviewed in this section. In the literature, there are different approaches which are similar to SEnviro. All selected studies use open-hardware components. Some of these studies are analyzed in detail, and a comparison is provided in Table 11. To compare the previously reviewed studies, we propose using the following features to characterize each one.
- Platform: refers to the microcontroller model that the system uses.
- Connection: wireless connections available for the system. Scale: Wi-Fi, Bluetooth, ZigBee, and others.
- Phenomena: that the system can measure. Scale: Temp., Hum., Dust, Bar., Noise, and others.
- Cost: in terms of money to deploy the system. Scale: Euros.
- Energy savings: indicates if the IoT node applies energy strategies. Scale: Yes/No.
- OTA: symbolizes if the IoT node supports OTA updates. Scale: Yes/No.
- M2M: shows if the system follows M2M communication. Scale: Yes/No.
- Client: means if the system provides a client for visualizing the sensors and observations. Scale: Yes (what kind) /No.
- Energy autonomous: indicates if the system can be considered as a client to visualize the sensors and observations Scale: Yes (what kind) /No.
Subsequently, we describe all analyzed studies, and include only those in which open hardware has been used.
- In the previous SEnviro version [7], the authors show a full open-hardware solution to monitor environmental phenomena. An Arduino microcontroller with a Wi-Fi module is used to connect with a TCP/IP stack. They use a RESTful interface to enable M2M connectivity. The proposal is validated in a smart campus scenario, where five units were deployed.
- The paper [39] presents a smart lamp design to optimize the indoor thermal comfort and energy savings, two important workplace issues in which the comfort of the workers and the consumption of the building strongly affect the economic equilibrium of a company. An Arduino mega with a Bluetooth wireless shield is used to control different included sensors to monitor environmental conditions.
- The authors in [40] design a wearable healthcare sensors platform to monitor pervasive healthcare phenomena. The work uses an Arduino-based microcontroller called Lilypad. This platform offers a Bluetooth interface to connect with an Android app.
- Ref [41] present a low-cost environmental node to monitor Carbon Monoxide (CO), temperature, relative humidity, particulate matter 2.5, noise and UV radiation sensors. In this case, a Stalker microcontroller is selected to build the proposed solution. The solution is presented as an autonomous energy platform, it has two solar panels and a battery to support this last feature.
- The paper [42] shows a weather station with temperature, barometer, atmospheric pressure, pluviometer, and anemometer sensors. An Arduino is used as a microcontroller to collect and send data to a Raspberry. This Raspberry acts as a gateway to connect to the Internet using an Ethernet connection.
- Ref [43] proposes a node development using an Arduino microcontroller with RFID connectivity to monitor air pollution on roads and track vehicles which cause pollution over a specified limit. The proposed node has various gas sensors, such as CO, sulfur dioxide, nitrogen dioxide and methane.
- The authors in [44] present an intelligent multisensor framework based on the BeagleBone Black platform. The designed node can become an instrument for monitoring, preservation, and protection of several environments. To test the proposed framework, they conducted the prototype in an art gallery.
- Lastly, in [45], the authors combine hardware sensors with a Raspberry 3 and demonstrate an automatic telephone log device capable of capturing environmental events both automatically and through user-input. An MQTT broker is used as a data publisher.
In what follows, we will analyze the different features of the studies mentioned above. As shown in Table 11, most of the studies analyzed use the Arduino platform. Although Arduino is the most widely used platform, it is not the microcontroller that provides the best performance and features. Its popularity is based on its price and ease of purchase. Despite this, Arduino is not the best option for scenarios where connectivity (3G) and power autonomy are required, since, as we have detailed in Section 2, there are better options such as Particle Electron or Hologram Dash.
Our approach, unlike all the studies analyzed, offers a 3G connection. This kind of connectivity is the most autonomous solution among all the analyzed studies, because it does not need any installation where there is coverage.
The selected phenomena used for each study depend on the final IoT scenario in which the solution will be deployed. In our case, our validation scenario requires the monitoring of meteorological phenomena. Other projects are focused on other scenarios and require environmental or presence sensors.
Only four studies detail the final price of their solution. The total price depends on the number of sensors included and the features and functionalities that each microcontroller can perform. Our system is more expensive than [41,42], but our solution includes more sensors and adds energy components such as a solar panel, MPPT and a battery. The new SEnviro version is cheaper than the previous one, the difference being €29.83.
Another analyzed feature is the IoT node energy consumption, but it is only the two SEnviro approaches that apply energy savings and show consumption. The improvement between both versions is substantial; the first version consumes 90 mA per hour, and the second version, despite having a 3G module, which leads to higher consumption, has a power consumption of 21.46 mA, resulting in a reduction of 68.54 mA per hour.
Only one of the analyzed projects [44], similar to our approach, follows the MQTT protocol. Five analyzed projects (including SEnviro) follow RESTFul communication. This kind of protocol is not appropriate for IoT solutions when considering the resource, bandwidth, and energy restrictions of IoT devices [46].
7. Conclusions
The proposed IoT node presented throughout this paper follows the DIY philosophy and is based wholly on open hardware, using low-cost components. Another main objective of the study is to detail and describe, step by step, how to form IoT nodes and present a replicable study to empower citizens to make their own creations, thus fostering citizen science developments [47,48].
First, a generic IoT node architecture is introduced, defining the physical and logical aspects intended to cover any IoT application. This architecture follows a modular design at both hardware and software levels. Section 4 proposed how to build an IoT node and fulfils all the requirements presented in Section 3, using open-hardware components. Providing a full open-hardware solution provides several benefits [7], including access to a large community of developers or makers, which increases its impact. Additionally, it facilitates the possible improvement of the platform by leaving it in the hands of the community.
Some improvements have been added concerning the preliminary SEnviro version; as shown in [7]. The most relevant is the 3G connectivity, which offers greater freedom when the node is set up and supports adaptation to a wide range of different IoT scenarios. Another improvement is the possibility to change the behavior of the IoT node using OTA updates, and be an energetically autonomous solution. The energy tests carried out reveal that the device can be kept alive for more than 3 days, following the normal energy mode defined. The recovery and critical modes would allow a longer duration of the life of the node without sending observations, thus providing more than 800 h of life without any power charge.
A full validation of the proposed architecture has been accomplished. It has been used in the IoT field of smart agriculture [49], more specifically to monitor small vineyards. The IoT node is integrated into an IoT management platform to analyze sensor data, called SEnviro connect. SEnviro connect can launch alerts about possible diseases in the vine.
Concerning related studies, SEnviro node offers a completely autonomous solution in terms of energy and connectivity. Our proposal is the only one that presents the possibility of being updated remotely. Moreover, it follows M2M connectivity (MQTT), suitable for these types of devices. SEnviro node applies energy saving, and the cost is adjusted to the components used.
Regarding future research, our objective is to perform a large-scale analysis of the different IoT standards and adopt one of them to increase the IoT node interoperability. Also, sensor meshes are planned to react depending on the context in which the node is located. These meshes will be used to establish strategies for energy and connection savings, and they will be deployed in the same smallholding to ascertain a more in-depth understanding of the real state of the overall area. The last improvement is to consider the particular features for each meteorological phenomenon [50] and take into account where the nodes are deployed, or if a new sensor box is designed. For example, considering a ventilated case (which we are already working on), or defining rules for when a new unit is installed (distance from the ground) to take more precise measurements, among others.
Author Contributions
All authors contributed equally to achieve the proposed work and the writing of this paper, as well. All authors read and approved the final manuscript.
Funding
This research received no external funding.
Acknowledgments
Sergio Trilles has been funded by the postdoctoral programme Vali+d (GVA) (grant number APOSTD/2016/058) and GVA doctoral stays programme (grant number BEST/2018/053). The project is funded by the Universitat Jaume I - PINV 2017 (UJI-A2017-14) and the European Commission through the GEO-C project (H2020-MSCA-ITN-2014, Grant Agreement number 642332, http://www.geo-c.eu/).
Conflicts of Interest
The authors declare no conflict of interest.
References
- Official Arduino Website. Available online: http://www.arduino.cc (accessed on 15 October 2018).
- Official RaspBerry Pi Website. Available online: http://www.raspberrypi.org (accessed on 15 October 2018).
- Official BeagleBoard Website. Available online: http://beagleboard.org (accessed on 15 October 2018).
- pcDuino. Available online: http://www.linksprite.com/linksprite-pcduino/ (accessed on 15 October 2018).
- Fisher, R.; Ledwaba, L.; Hancke, G.; Kruger, C. Open hardware: A role to play in wireless sensor networks? Sensors 2015, 15, 6818–6844. [Google Scholar] [CrossRef] [PubMed]
- Barroso, L.A. The price of performance. Queue 2005, 3, 48–53. [Google Scholar] [CrossRef]
- Trilles, S.; Luján, A.; Belmonte, Ó.; Montoliu, R.; Torres-Sospedra, J.; Huerta, J. SEnviro: a sensorized platform proposal using open hardware and open standards. Sensors 2015, 15, 5555–5582. [Google Scholar] [CrossRef] [PubMed]
- Salamone, F.; Belussi, L.; Danza, L.; Ghellere, M.; Meroni, I. Design and development of nEMoS, an all-in-one, low-cost, web-connected and 3D-printed device for environmental analysis. Sensors 2015, 15, 13012–13027. [Google Scholar] [CrossRef]
- Fox, S. Third Wave Do-It-Yourself (DIY): Potential for prosumption, innovation, and entrepreneurship by local populations in regions without industrial manufacturing infrastructure. Technol. Soc. 2014, 39, 18–30. [Google Scholar] [CrossRef]
- Instructables. Available online: https://www.instructables.com/ (accessed on 15 October 2018).
- Make Magazine. Available online: https://makezine.com/ (accessed on 15 October 2018).
- openMaterials. Available online: http://openmaterials.org/ (accessed on 15 October 2018).
- Industries, A. Adafruit. Available online: https://www.adafruit.com/ (accessed on 15 October 2018).
- Pearce; Sensor. SparkFun Electronics. Available online: https://www.sparkfun.com/ (accessed on 15 October 2018).
- Gubbi, J.; Buyya, R.; Marusic, S.; Palaniswami, M. Internet of Things (IoT): A vision, architectural elements, and future directions. Future Gener. Comput. Syst. 2013, 29, 1645–1660. [Google Scholar] [CrossRef] [Green Version]
- Savaglio, C.; Fortino, G.; Zhou, M. Towards interoperable, cognitive and autonomic IoT systems: An agent-based approach. In Proceedings of the 2016 IEEE 3rd World Forum on Internet of Things (WF-IoT), Reston, VA, USA, 12–14 December 2016; pp. 58–63. [Google Scholar]
- Lasi, H.; Fettke, P.; Kemper, H.G.; Feld, T.; Hoffmann, M. Industry 4.0. Bus. Inf. Syst. Eng. 2014, 6, 239–242. [Google Scholar] [CrossRef]
- Trilles, S.; Calia, A.; Belmonte, Ó.; Torres-Sospedra, J.; Montoliu, R.; Huerta, J. Deployment of an open sensorized platform in a smart city context. Future Gener. Comput. Syst. 2017, 76, 221–233. [Google Scholar] [CrossRef]
- Belmonte-Fernández, Ó.; Puertas-Cabedo, A.; Torres-Sospedra, J.; Montoliu-Colás, R.; Trilles-Oliver, S. An indoor positioning system based on wearables for ambient-assisted living. Sensors 2016, 17, 36. [Google Scholar] [CrossRef] [PubMed]
- Trilles Oliver, S.; González-Pérez, A.; Huerta Guijarro, J. An IoT proposal for monitoring vineyards called SEnviro for agriculture. In Proceedings of the 8th International Conference on the Internet of Things, Santa Barbara, CA, USA, 15–18 October 2018; p. 20. [Google Scholar]
- Chan, M.; Estève, D.; Escriba, C.; Campo, E. A review of smart homes—Present state and future challenges. Comput. Methods Programs Biomed. 2008, 91, 55–81. [Google Scholar] [CrossRef] [PubMed]
- Palattella, M.R.; Dohler, M.; Grieco, A.; Rizzo, G.; Torsner, J.; Engel, T.; Ladid, L. Internet of things in the 5G era: Enablers, architecture, and business models. IEEE J. Sel. Areas Commun. 2016, 34, 510–527. [Google Scholar] [CrossRef]
- Naik, N. Choice of effective messaging protocols for IoT systems: MQTT, CoAP, AMQP and HTTP. In Proceedings of the 2017 IEEE International Systems Engineering Symposium (ISSE), Vienna, Austria, 11–13 October 2017; pp. 1–7. [Google Scholar]
- Hunkeler, U.; Truong, H.L.; Stanford-Clark, A. MQTT-S—A publish/subscribe protocol for Wireless Sensor Networks. In Proceedings of the 3rd International Conference on Communication Systems Software and Middleware and Workshops, Bangalore, India, 6–10 January 2008; pp. 791–798. [Google Scholar]
- Bandyopadhyay, S.; Bhattacharyya, A. Lightweight Internet protocols for web enablement of sensors using constrained gateway devices. In Proceedings of the 2013 International Conference on Computing, Networking and Communications (ICNC), San Diego, CA, USA, 28–31 January 2013; pp. 334–340. [Google Scholar]
- Pearce, J.M. Building Research Equipment with Free, Open-Source Hardware. Science 2012, 337, 1303–1304. [Google Scholar] [CrossRef] [PubMed]
- Particle Community. Available online: https://community.particle.io/ (accessed on 15 October 2018).
- Abdmeziem, M.R.; Tandjaoui, D.; Romdhani, I. Architecting the internet of things: state of the art. In Robots and Sensor Clouds; Springer: Berlin, Germany, 2016; pp. 55–75. [Google Scholar]
- Fortino, G.; Savaglio, C.; Palau, C.E.; de Puga, J.S.; Ganzha, M.; Paprzycki, M.; Montesinos, M.; Liotta, A.; Llop, M. Towards multi-layer interoperability of heterogeneous IoT platforms: the INTER-IoT approach. In Integration, Interconnection, and Interoperability of IoT Systems; Springer: Berlin, Germany, 2018; pp. 199–232. [Google Scholar]
- Bormann, C.; Castellani, A.P.; Shelby, Z. Coap: An application protocol for billions of tiny internet nodes. IEEE Internet Comput. 2012, 16, 62–67. [Google Scholar] [CrossRef]
- Thangavel, D.; Ma, X.; Valera, A.; Tan, H.X.; Tan, C.K.Y. Performance evaluation of MQTT and CoAP via a common middleware. In Proceedings of the 2014 IEEE Ninth International Conference on Intelligent Sensors, Sensor Networks and Information Processing (ISSNIP), Singapore, 21–24 April 2014; pp. 1–6. [Google Scholar]
- Cheng, K.T.; Krishnakumar, A.S. Automatic functional test generation using the extended finite state machine model. In Proceedings of the 30th Conference on Design Automation, Dallas, TX, USA, 14–18 June 1993; pp. 86–91. [Google Scholar]
- Bramley, R. Precision Viticulture: Managing vineyard variability for improved quality outcomes. In Managing Wine Quality: Viticulture and Wine Quality; Elsevier: Amsterdam, The Netherlands, 2010; pp. 445–480. [Google Scholar]
- Goidànich, G. Manuale di Patologia Vegetale; Edagricole: Bologna, Italy, 1964; Volume 2. [Google Scholar]
- Carroll, J.; Wilcox, W. Effects of humidity on the development of grapevine powdery mildew. Phytopathology 2003, 93, 1137–1144. [Google Scholar] [CrossRef] [PubMed]
- Molitor, D.; Berkelmann-Loehnertz, B. Simulating the susceptibility of clusters to grape black rot infections depending on their phenological development. Crop Prot. 2011, 30, 1649–1654. [Google Scholar] [CrossRef]
- Broome, J.; English, J.; Marois, J.; Latorre, B.; Aviles, J. Development of an infection model for Botrytis bunch rot of grapes based on wetness duration and temperature. Phytopathology 1995, 85, 97–102. [Google Scholar] [CrossRef]
- Trilles, S.; Gonzalez, A.; Huerta, J. An IoT middleware based on microservices and serverless paradigms. A smart farming use case to detect diseases in vineyard fields. 2018; manuscript submitted for publication. [Google Scholar]
- Salamone, F.; Belussi, L.; Danza, L.; Ghellere, M.; Meroni, I. An open source “smart lamp” for the optimization of plant systems and thermal comfort of offices. Sensors 2016, 16, 338. [Google Scholar] [CrossRef] [PubMed]
- Doukas, C.; Maglogiannis, I. Bringing IoT and cloud computing towards pervasive healthcare. In Proceedings of the 2012 Sixth International Conference on Innovative Mobile and Internet Services in Ubiquitous Computing (IMIS), Palermo, Italy, 4–6 July 2012; pp. 922–926. [Google Scholar]
- Velásquez, P.; Vásquez, L.; Correa, C.; Rivera, D. A low-cost IoT based environmental monitoring system. A citizen approach to pollution awareness. In Proceedings of the 2017 CHILEAN Conference on Electrical, Electronics Engineering, Information and Communication Technologies (CHILECON), Pucon, Chile, 18–20 October 2017; pp. 1–6. [Google Scholar]
- Brito, R.C.; Favarim, F.; Calin, G.; Todt, E. Development of a low cost weather station using free hardware and software. In Proceedings of the 2017 Latin American Robotics Symposium (LARS) and 2017 Brazilian Symposium on Robotics (SBR), Curitiba, Brazil, 8–11 November 2017; pp. 1–6. [Google Scholar]
- Manna, S.; Bhunia, S.S.; Mukherjee, N. Vehicular pollution monitoring using IoT. In Proceedings of the Recent Advances and Innovations in Engineering (ICRAIE), Jaipur, India, 9–11 May 2014; pp. 1–5. [Google Scholar]
- Chianese, A.; Piccialli, F.; Riccio, G. Designing a smart multisensor framework based on beaglebone black board. In Computer Science and its Applications; Springer: Berlin, Germany, 2015; pp. 391–397. [Google Scholar]
- Chen, P.H.; Cross, N. IoT in Radiology: Using Raspberry Pi to Automatically Log Telephone Calls in the Reading Room. J. Digital Imaging 2018, 31, 371–378. [Google Scholar] [CrossRef] [PubMed] [Green Version]
- Fysarakis, K.; Askoxylakis, I.; Soultatos, O.; Papaefstathiou, I.; Manifavas, C.; Katos, V. Which IoT protocol? Comparing standardized approaches over a common M2M application. In Proceedings of the Global Communications Conference (GLOBECOM), Washington, DC, USA, 4–8 December 2016; pp. 1–7. [Google Scholar]
- Kera, D. Hackerspaces and DIYbio in Asia: connecting science and community with open data, kits and protocols. J. Peer Prod. 2012, 2, 1–8. [Google Scholar]
- Fortino, G.; Rovella, A.; Russo, W.; Savaglio, C. Towards cyberphysical digital libraries: Integrating IoT smart objects into digital libraries. In Management of Cyber Physical Objects in the Future Internet of Things; Springer: Berlin, Germany, 2016; pp. 135–156. [Google Scholar]
- Zhao, J.C.; Zhang, J.F.; Feng, Y.; Guo, J.X. The study and application of the IOT technology in agriculture. In Proceedings of the 2010 3rd IEEE International Conference on Computer Science and Information Technology (ICCSIT), Chengdu, China, 9–11 July 2010; Volume 2, pp. 462–465. [Google Scholar]
- Bell, S.; Cornford, D.; Bastin, L. The state of automated amateur weather observations. Weather 2013, 68, 36–41. [Google Scholar] [CrossRef] [Green Version]
Figure 1.
Different hardware concepts that compose the IoT node.

Figure 2.
Different behavior conceptual parts.

Figure 3.
A state machine defined using the logic modules defined.

Figure 4.
A list of open-hardware components to build a SEnviro node.

Figure 5.
The different components used to build the Core Power supply and Communication groups.

Figure 6.
3D printed enclosure.

Figure 7.
A workflow of the behavior modules.

Figure 8.
Energy modes diagram.

Figure 9.
Theoretical energy consumption without solar panel.

Figure 10.
Example of charging and discharging the battery using the solar panel.

Figure 11.
Some pictures about all SEnviro node deployments on vineyards.

Figure 12.
A general overview of the full IoT environment.

Figure 13.
A screenshot of the SEnviro connect showing all SEnviro nodes deployed.

Figure 14.
A screenshot of the SEnviro connect showing the node management view.

Figure 15.
A screenshot of the SEnviro connect showing the wizard to claim nodes.

Figure 16.
A screenshot of the SEnviro connect showing the data and alerts for each node.


Table 1.
Comparison between different open-hardware microcontroller-based platforms with 3G connectivity.
Table 1.
Comparison between different open-hardware microcontroller-based platforms with 3G connectivity.
| Particle Electron | Adafruit Feather 32u4 FONA | Hologram Dash | Arduino GPRS Shield | LinkIt ONE | GOBLIN 2 | |
|---|---|---|---|---|---|---|
| Microprocessor | ARM Cortex M3 | ATmega32u4 | ARM Cortex M4 | - | MT2502A, ARM7EJ-S | ATmega328P |
| Architecture | 32 Bits | 32 Bits | 32 Bits | - | 32 Bits | 32 Bits |
| Clock speed | 120 MHz | 120 MHz | 120 MHz | - | 260 MHz | 16 MHz |
| RAM | 128 KB | 2 KB | 128 KB | - | 4 MB | 2 KB |
| Flash | 32 KB | 32 KB | 1 MB | - | 16 MB | 32 KB |
| Min. power | 42 mA | 500 mA | 700 mA | - | 3 mA | 300 mA |
| Cellular modem | 3G/2G | 2G | 3G/2G | 2G | 2G | 3G/2G |
| PINS | 36 Pins (28 GPIOs) | 28 pins (20 GPIO) | 25 GPIO | 12 GPIO | Arduino pin-out | 36 Pins (25 GPIOs) |
| Fuel Guauge | Yes | No | No | No | No | No |
| Over-the-air (OTA) | Yes | No | Yes | No | No | No |
| Cost | $69.00 | $44.95 | $59.00 | $4.30 | $59.00 | $89.99 |
| Measures (mm) | 8 × 6.5 × 20.5 | 61 × 23 × 7 | 20.32 × 56.68 × 16.53 | 68.33 × 53.09 | 83.82 × 53.34 | 65.5 × 82.2 |
| Open hardware | Completely | Completely | Completely | Completely | Completely | Completely |
Table 2.
Components list included in the SEnviro node.
| Category | Component | Description | Cost |
|---|---|---|---|
| Core | Microcontroller board | Particle Electron | €63.41 |
| Shield Weather | Base Shield V2 | €27.02 | |
| Box for sensors | 3D printed box | €10.00 | |
| Some connectors and cables | €5.00 | ||
| Communication | 3G module | Included in Particle Electron | €- |
| Sensors | Temperature and humidity sensor | €12.60 | |
| Rainfall, wind speed and direction sensors | €65.41 | ||
| Soil temperature | €8.46 | ||
| Soil humidity | €4.21 | ||
| Power supply | Battery | Included in Lithium Battery 2200 mAh 3.7 V | €- |
| Solar panel | 3W Solar Panel 138X160 | €38.79 | |
| Sunny Buddy | MPPT Solar Charger | €21.55 | |
| Gauge counter | Included in Particle Electron | €- |
Table 3.
Details of the included Sensors.
| Sensor | Phenomena | Manufacturer | Model | Data Interface | Units | Range | Accuracy |
|---|---|---|---|---|---|---|---|
| Temperature and humidity sensors | Temperature | SparkFun | Si7021 | Analog | Centigrade | [−10, 85] | Degrees (C) |
| Humidity | Rate | [0%, 80%] | RH | ||||
| Barometric pressure | Pressure | SparkFun | MPL3115A2 | I2C | Hectopascal | [500, 1100] | hPa |
| Temperature Sensor Waterproof | Temperature | SparkFun | DS18B20 | Analog | Centigrade | [−55, 125] | Degrees (C) |
| Weather meters | Wind speed | Sparkfun | SEN08942 | Analog (RJ11) | km/h | Not specified | Not specified |
| Wind direction | Direction (degrees) | [0, 360] | Not specified | ||||
| Rain meter | mm | Not specified | Not specified |
Table 4.
Particle electron energy consumption.
| Mode | Energy Consumption (mA) |
|---|---|
| Operating Current (uC on, Cellular ON) | 180–250 |
| Peak Current (uC on, Cellular ON) | 800 (3 G), 1800 (2 G) |
| Operating Current (uC on, Cellular OFF) | 47–50 |
| Sleep Current (4.2V Li-Po, Cellular OFF) | 0.8–2 |
| Deep Sleep Current (4.2V Li-Po, Cellular OFF) | 0.11–0.13 |
Table 5.
Sensors energy consumption.
| Component | Energy Active (mA) | Energy Standby (mA) |
|---|---|---|
| Temperature and humidity sensor | 0.15 | 0.00006 |
| Barometer | 2 | 0.002 |
| Temperature (sonda) | 1–1.5 | 0.00075–0.001 |
| Rainfall, wind speed and direc. sensors (passive) | - | - |
| MPPT | 2.5–3.5 | 0.085 |
Table 6.
Particle electron energy consumption in the normal mode.
| Mode | Seconds | Energy Consumption (mA) |
|---|---|---|
| Peak Current | 60 | 13.33 (3 G) |
| Operating Current (uC on, Cellular OFF) | 300 | 4.17 (worst condition) |
| Sleep Current | 3240 | 1.80 (worst condition) |
Table 7.
Component energy consumption per iteration.
| Component | Active Seconds | Energy Standby (mA) | Standby Seconds | Energy Standby (mA) | Total (mA) |
|---|---|---|---|---|---|
| Temperature and humidity sensor | 360 | 0.02 | 3240 | 0.00005 | 0.02005 |
| Barometer | 360 | 0.20 | 3240 | 0.0018 | 0.2018 |
| Temperature (waterproof) | 360 | 0.15 | 3240 | 0.0009 | 0.1509 |
| Rainfall, wind speed and direc. sensors | 3600 | - | - | - | - |
| MPPT | 1800 | 1.75 | 1800 | 0.0425 | 1.7925 |
Table 8.
Particle electron energy consumption in recovery mode.
| Mode | Seconds | Energy Consumption (mA) |
|---|---|---|
| Operating Current (uC on, Cellular OFF) | 360 | 5.00 (worst condition) |
| Sleep Current | 3240 | 1.80 (worst condition) |
Table 9.
Particle electron energy consumption in critical mode.
| Mode | Seconds | Energy Consumption (mA) |
|---|---|---|
| Operating Current (uC on, Cellular OFF) | 5 | 0.07 (worst condition) |
| Deep Sleep Current (4.2V Li-Po, Cellular OFF) | 3595 | 0.1298 (worst condition) |
Table 10.
List of SEnviro nodes deployed.
| S. Num. | Location (Lat, Lon) | Succes. Obser. | Lost Obser. | Success Rate |
|---|---|---|---|---|
| 1 | 39.993934, −0.073863 | 18,354 | 1230 | 97.86% |
| 2 (Figure 11a) | 40.133098, −0.061000 | 19,055 | 109 | 98.00% |
| 3 (Figure 11b) | 40.206870, 0.015536 | 18,152 | 161 | 97.05% |
| 4 (Figure 11c) | 40.141384, −0.026397 | 18,729 | 440 | 91.96% |
| 5 (Figure 11d) | 40.167529, −0.097165 | 9626 | 68 | 98.75% |
Table 11.
Comparison between different sensorized platforms.
| Reference | Platform | Connection | Phenomena | Cost | Energy Savings | OTA | M2M | Client | Energy Autonomous |
|---|---|---|---|---|---|---|---|---|---|
| [7] | Arduino Uno | Wi-Fi | Temp., Hum., Dust, Bar., Noise, Gases, Light, Rain and Anem. | €286.28 | Yes | No | RESTFul | Web APP | Yes |
| [39] | Arduino Mega | Bluetooth | Temp., Hum., | Not specified | No | No | Serial port | Mobile APP | Yes |
| [40] | Lilypad | Bluetooth | Motion sensor | Not specified | No | No | Serial port | Web App | No |
| [41] | Stalker v3 | Wi-Fi | CO, Temp., Hum, PPM2.5, Noise and UV | 94US$ | No | No | RESTFul | Web App | Yes |
| [42] | Arduino UNO and Raspberry | Ethernet | Temp., Press., Rain and Anem. | 165$ | No | No | RESTFul | Web App | No |
| [43] | Arduino Uno | RFID Wi-Fi (gateway) | Methan, NOx, sOx, LPG, CNG, CO and Alc. | Not specified | No | No | Not specified | No | No |
| [44] | Beaglebone Black | Bluetooth Wi-Fi | PIR | Not specified | No | No | RESTFul | No | |
| [45] | Raspberry 3 | Ethernet | General events | Not specified | No | No | MQTT | No | No |
| Our | Particle Electron | 3G | Temp., Soil and Air Hum., Barom., Rain and Anem. | €256.45 | Yes | Yes | MQTT | Web APP | Yes |
© 2018 by the authors. Licensee MDPI, Basel, Switzerland. This article is an open access article distributed under the terms and conditions of the Creative Commons Attribution (CC BY) license (http://creativecommons.org/licenses/by/4.0/).
Share and Cite
MDPI and ACS Style
Trilles, S.; González-Pérez, A.; Huerta, J. A Comprehensive IoT Node Proposal Using Open Hardware. A Smart Farming Use Case to Monitor Vineyards. Electronics 2018, 7, 419. https://doi.org/10.3390/electronics7120419
AMA Style
Trilles S, González-Pérez A, Huerta J. A Comprehensive IoT Node Proposal Using Open Hardware. A Smart Farming Use Case to Monitor Vineyards. Electronics. 2018; 7(12):419. https://doi.org/10.3390/electronics7120419
Chicago/Turabian StyleTrilles, Sergio, Alberto González-Pérez, and Joaquín Huerta. 2018. "A Comprehensive IoT Node Proposal Using Open Hardware. A Smart Farming Use Case to Monitor Vineyards" Electronics 7, no. 12: 419. https://doi.org/10.3390/electronics7120419
Note that from the first issue of 2016, this journal uses article numbers instead of page numbers. See further details here.