Article

A Miniaturized Quartz Crystal Microbalance (QCM) Measurement Instrument Based on a Phase-Locked Loop Circuit

1
School of Electrical Engineering and Computer Science, Louisiana State University, Baton Rouge, LA 70803, USA
2
Department of Chemistry, Louisiana State University, Baton Rouge, LA 70803, USA
3
Center for Advanced Microstructures and Devices, Louisiana State University, Baton Rouge, LA 70803, USA
*
Author to whom correspondence should be addressed.
Currently at Department of Chemistry and Biochemistry, Georgia Southern University, Statesboro, GA 30460, USA.
Currently at Naval Research Laboratory, Washington, DC 20375, USA.
Electronics 2022, 11(3), 358; https://doi.org/10.3390/electronics11030358
Submission received: 8 November 2021 / Revised: 25 December 2021 / Accepted: 17 January 2022 / Published: 25 January 2022
(This article belongs to the Special Issue 10th Anniversary of Electronics: Hot Topics in Bioelectronics)

Abstract

:
The quartz crystal microbalance (QCM) has been widely used in laboratory settings as an analytical tool for recognizing and discriminating biological and chemical molecules of interest. As a result, recent studies have shown there to be considerable attention in practical applications of the QCM technique beyond the laboratory. However, most commercial QCM instruments are not suitable for off-laboratory usage. For field-deployable applications and in situ detection, the development of a portable QCM measurement system achieving comparable performance to benchtop instruments is highly desired. In this paper, we describe the development of a fully customizable, miniaturized, battery-powered, and cost-efficient QCM system employing a phase-locked loop (PLL) electronic circuit-based QCM measurement system. The performance of this developed system showed a minimum frequency resolution of approximately 0.22 Hz at 0.1 s measurement time. This novel, miniaturized system successfully demonstrated an ability to detect two common volatile organic compounds (VOCs), methanol and dichloromethane (DCM), and the obtained results were comparable to responses from a commercially available benchtop instrument.

1. Introduction

Quartz crystal microbalance (QCM) has become one of the most common mass sensing techniques and has seen a wide variety of industrial applications, such as electronic noses [1,2] and electronic tongues [3,4]. These applications include food quality control [5,6,7,8], various forms of chemical detection [9,10], and biomolecular recognition [6,7,8]. Recently, QCM techniques with specialized sensor coatings have been widely applied for multiple analyte detections through the construction of multi-sensor arrays. With growing interest in the on-site air quality monitoring of various environments and point-of-care testing (POCT) in clinical settings, it is increasingly important to develop a suitable QCM instrument that is readily portable, low-powered, and cost-efficient [11,12,13].
In general, sensing a target analyte is possible via functionalization of the surface of a quartz crystal resonator (QCR) within a QCM system. The functionalized QCR fundamentally works as a mass sensor enabled by the piezoelectric effect, where mechanical stress drives the electrical potential changes of QCR surfaces. Once analyte molecules are attached to or come in contact with the functionalized surface, the overall mass of the QCR is changed, which results in a resonance frequency shift. The resonance and subsequent shift of frequency of the QCR are detected by a QCM measurement system.
Three types of electronic techniques are usually employed to detect these changes in frequency, namely impedance measurements, quartz crystal microbalance with dissipation (QCM-D), and oscillator-based measurements [14]. The impedance measurement technique is the most fundamental method, and it provides a more accurate result to determine the resonance frequency of QCR than the other two methods [15]. During impedance measurements, a sweeping frequency signal is applied to a QCR, and an impedance (or admittance) spectrum is collected to record the resonance frequency and dissipation outputs. Although some impedance-based systems having a compact form factor for QCM devices have been proposed, these systems heavily rely on software for impedance spectrum and non-linear curve fitting, which inevitably sacrifices the measurement time [16,17]. Since the interface electronics are designed in a compact form, the aid of a computer is necessary for post-processing. Recently, a QCM-D system incorporating relatively small interface electronics has also been developed [18]. In QCM-D measurements, a QCR is excited by an external oscillating signal in a very short time frame, then the decaying signal from the QCR is monitored to obtain the resonance frequency and dissipation factor. This recent development also heavily relies on the computing necessary for post-processing. Furthermore, the system’s performance was not sufficiently elucidated in its report. Although impedance measurement and QCM-D systems are commercially available, they are usually expensive and bulky benchtop instruments, which are not suitable for on-site detection.
Oscillator-based electronic systems consist of a QCR oscillator and frequency measurement circuitry. The QCR oscillator generates an oscillation at its resonance frequency that is dependent on the mass of the resonator. A change in mass causes a shift in the resonance frequency that is monitored by a frequency measurement circuit. The frequency measurement circuitry, typically referred to as a frequency counter and comprised of digital counters and timers, gives an advantage in design simplification compared to impedance measurement and QCM-D systems [14]. The most basic form of the frequency counter, or simplest frequency counter, counts the number of input pulses for a predefined time. The simplest counter calculates the resonance frequency of a QCR based on Equation (1) below [19].
f = N t
where f is the measured resonance frequency, N is the measured number of input pulses, and t is the time gate (measurement time). The frequency resolution (Δf) can be then obtained by dividing the difference in the number of input pulses (ΔN) by the measurement time (t). In effect, the highest frequency resolution of 1 Hz can be achieved with a measurement time of one second [20]. However, since both a higher frequency resolution and shorter measurement time are desirable in QCM measurement systems, a reciprocal counter is usually implemented as an alternative [19]. The reciprocal counter uses a high-frequency reference signal typically in the several hundred MHz range, and calculates the frequency based on a periodic measurement of the input signal. In this method, both frequency resolution and measurement time can be optimized with a high reference clock frequency. The frequency resolution of the reciprocal counter is expressed by Equation (2) [19].
Δ f = f f ref × t
where Δf is the frequency resolution, f is the resonance frequency, fref is the frequency of the reference signal, and t is the measurement time. Most reciprocal counters were designed with a field-programmable gate array (FPGA) that yields a frequency resolution between 0.1 Hz and 0.01 Hz with a measurement time of 1 s [21,22]. However, the reported frequency resolution was based on theoretical calculation, which did not consider noise. In practice, the resolution of these reciprocal frequency counter is affected by various noise sources and is expected to be not as high as the calculated values.
Another measurement system was recently proposed to measure the frequency shift in an oscillator-based system for QCM [23] and film-bulk acoustic resonator (FBAR) [24] applications. The reported systems employed a phase-locked loop (PLL) as a frequency-to-voltage converter (FVC), generating an output voltage commensurate to a specific input frequency. The PLL output voltage was then monitored to compute a shift in the input frequency, and it was demonstrated that this measurement system can achieve a measurement time of 1 ms for electrochemical QCM (EQCM) applications. This resolution is difficult to achieve even when reciprocal counters are employed [23]. Moreover, the achievable frequency resolution in a QCM measurement system is generally related to the measurement time [25]. However, this proposed system was not designed for portable applications, and the performance factors of the system such as frequency resolution and measurement time were not clearly discussed. Thus, the frequency resolution within the measurement time need to be investigated for clear evaluation of system performance.
In this study, we report the development and characterization of a miniaturized PLL-based QCM measurement system that is cost-efficient and battery-operated. The output voltage of PLL circuit is measured by an inexpensive and generic microcontroller system operating at a relatively low frequency (e.g., 8 MHz and 16 MHz), and the entire circuit system is built in a handheld form factor. We also demonstrate the operation of the presented system by detecting sample volatile organic compound (VOC) samples and by comparing the frequency responses to those obtained from a commercial benchtop QCM system (Q-sense Analyzer, Biolin Scientific, Gothenburg, Sweden). Since the goal of this work is to validate the electronic function of a miniaturized PLL-based QCM measurement system, sample VOCs and their corresponding chemosensitive QCR coating materials were used as reported in our previous work [9,10] in order to compare the frequency sensing performance of the development system to the commercial benchtop system.

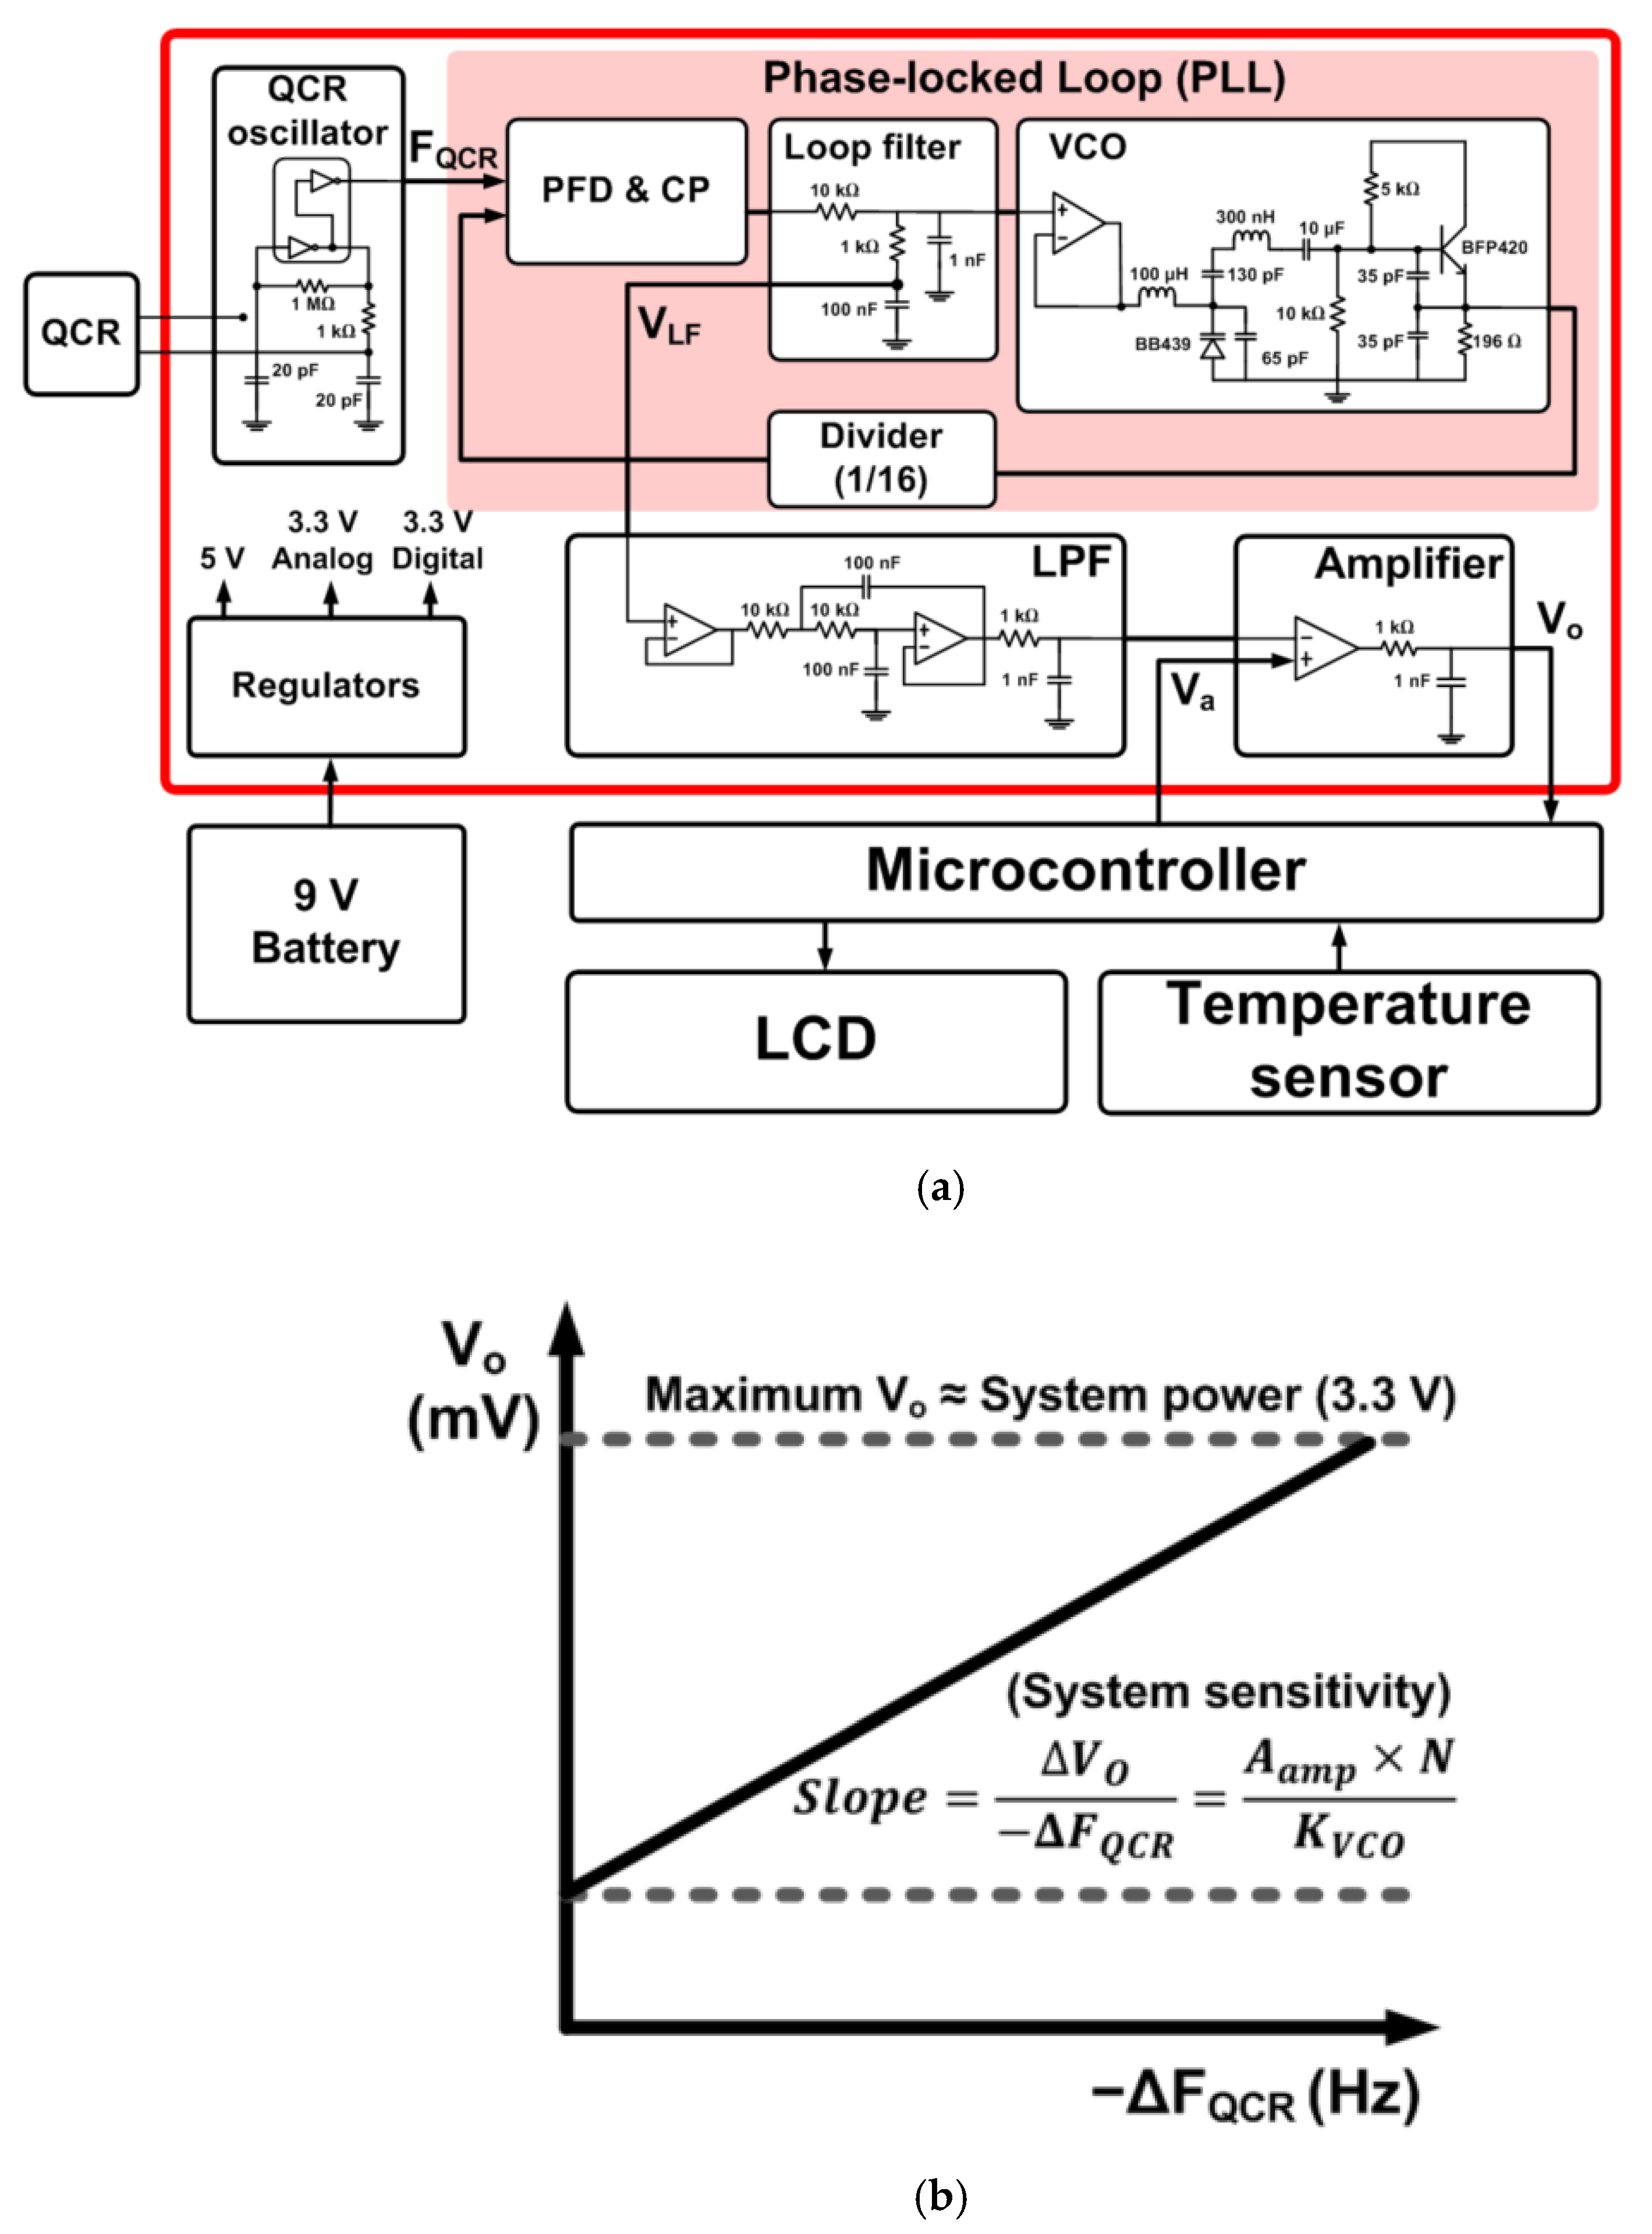
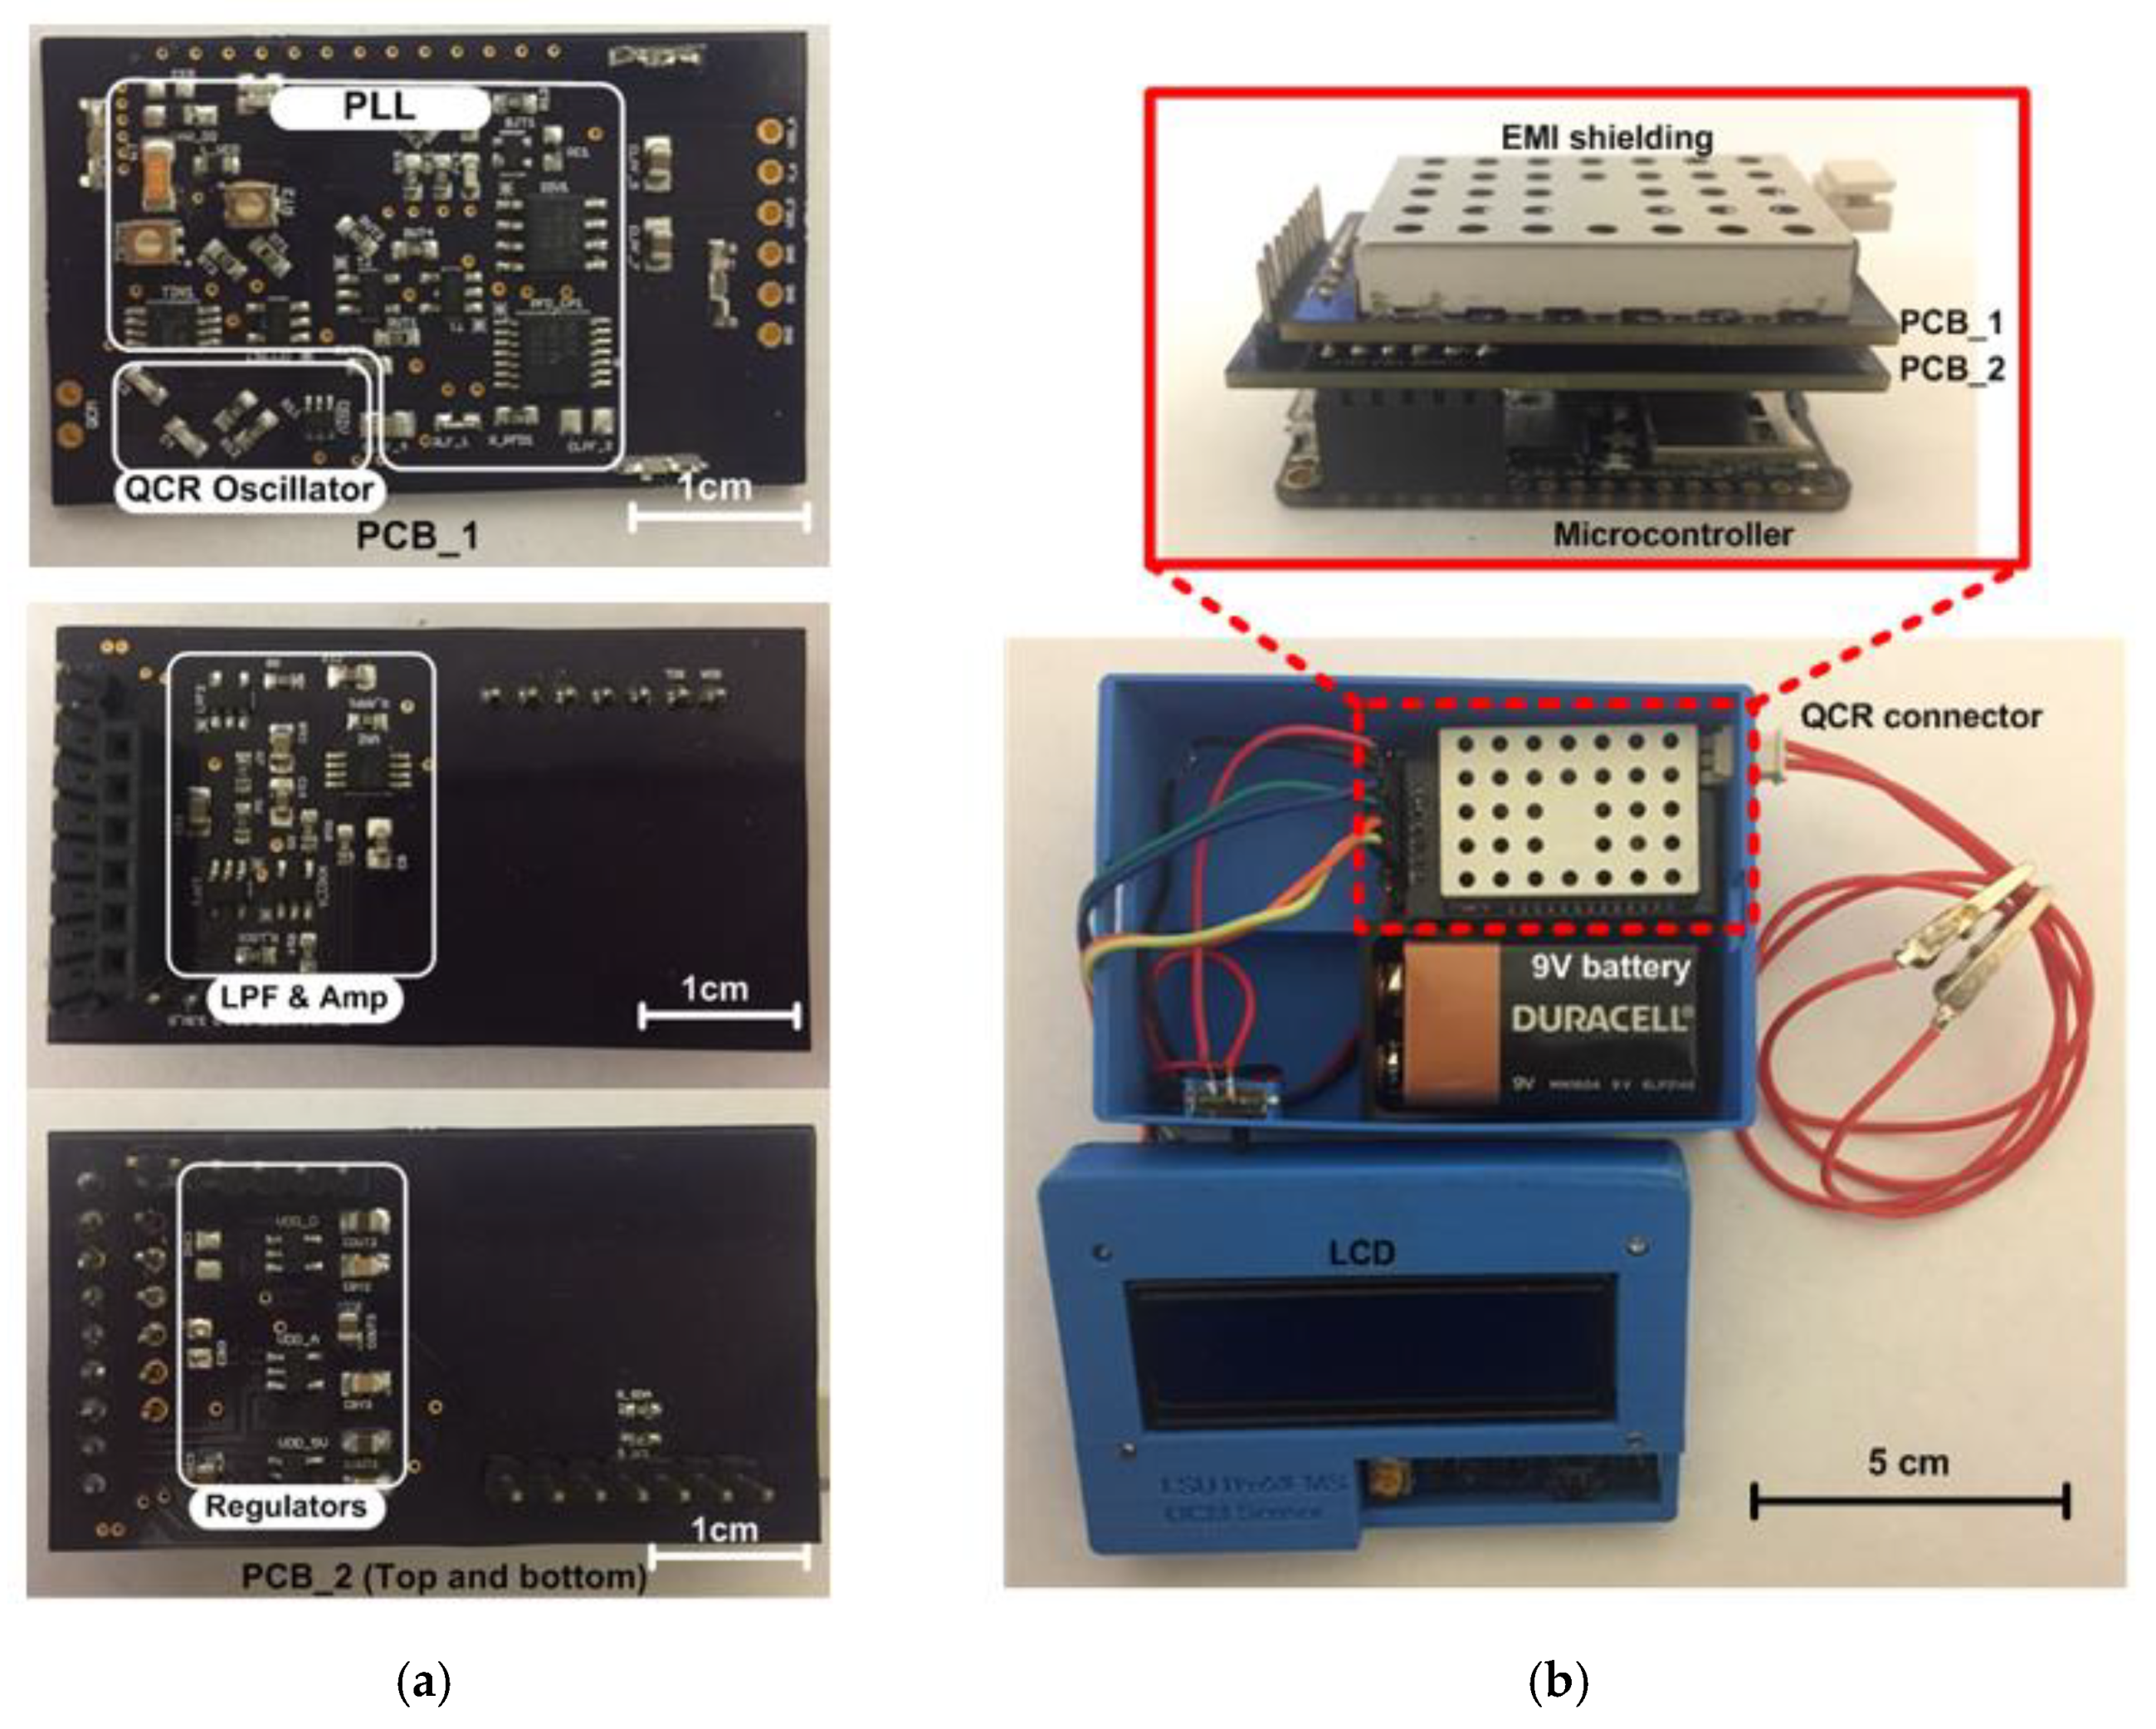
2. Measurement Circuit Design
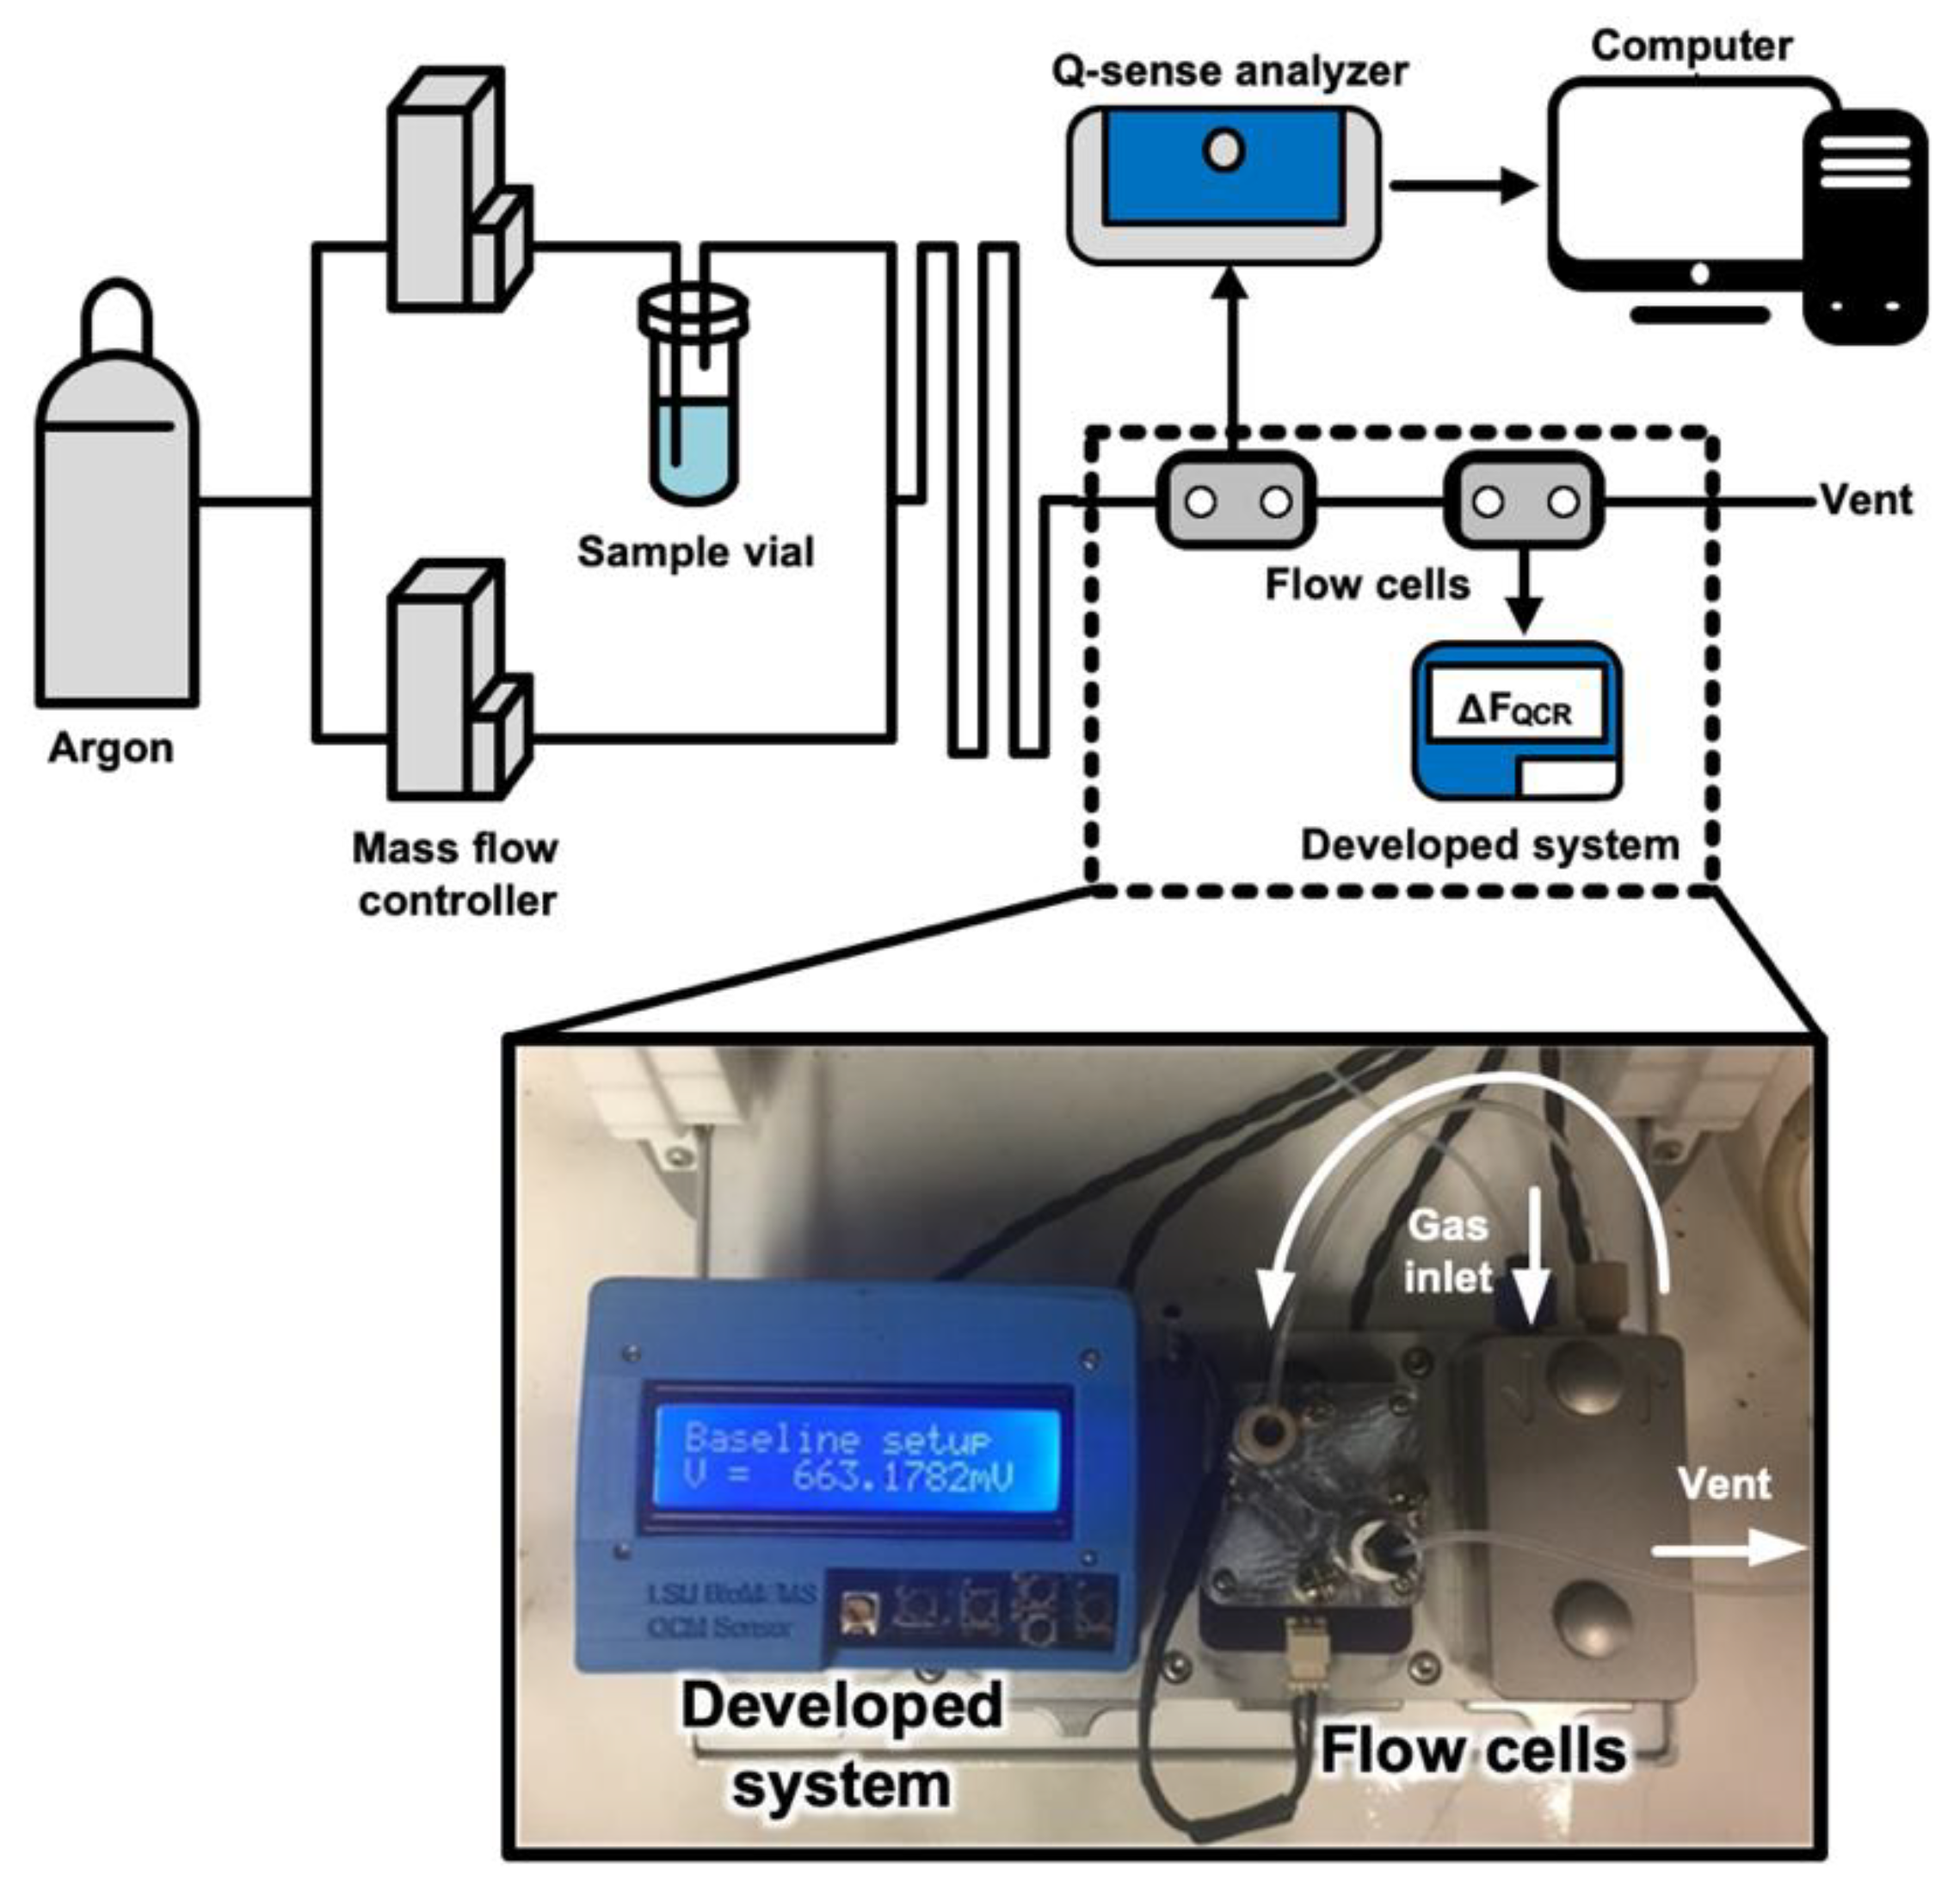
The measurement system designed for this work consisted of a QCR oscillator, a phase-look locked (PLL) circuit, a low-pass filter (LPF), and an amplifier circuit. The entire system was powered by a 9 V battery, and regulators (LP2992, Texas Instruments, Dallas, TX, USA) were used to generate supply voltages at 3.3 V and 5 V. A gold QCR QSX 301 obtained from Biolin Scientific was actuated by a complementary metal-oxide-semiconductor (CMOS) pierce oscillator (SN74LVC1GX04, Texas Instruments). To reduce the form factor of the system, a PLL chip (TLC2933, Texas Instruments) was used as a phase-frequency detector (PFD) and a charge pump (CP). A voltage-controlled oscillator (VCO) was designed as a common Colpitts oscillator topology with a varactor diode (BB439, Infineon, Neubiberg, Germany) and a bipolar junction transistor (BFP420, Infineon). A voltage follower at the input of the VCO prevented the oscillating signal of the VCO from influencing the loop filter voltage.
A low-pass filter (LPF) was designed with a second-order Sallen-key filter with a resistor-capacitor (RC) filter, which suppressed any systematic and random fluctuations of the loop filter voltage (VLF). The LPF had a cutoff frequency of around 160 Hz and a damping ratio of 1 (critically damped filter), which could provide an accurate estimation of the temporal responses of the system without overshooting or undershooting the system output [26]. After the LPF, an instrumental amplifier (INA333, Texas Instruments) was connected to increase loop filter voltage changes and enhance the system sensitivity. A microcontroller (Feather M0 Adalogger, Adafruit, New York, NY, USA) read the output voltage (VO) of the amplifier. A liquid crystal display (LCD) and a temperature sensor (MCP9808, Adafruit) were controlled by the microcontroller. A block diagram of the developed measurement system is illustrated in Figure 1a.
The operating principle of this system followed a basic PLL operation. When the PLL is locked, the loop filter generates a DC voltage dependent on the frequency of the QCR oscillator. As the frequency of the QCR oscillator decreases, the loop filter voltage also decreases. A change in loop filter voltage corresponds to a frequency change of the QCR oscillator, as expressed in Equation (3).
Δ V LF = N K VCO × Δ F QCR
where ΔVLF is the change in the loop filter voltage, ΔFQCR is the QCR’s resonance frequency change, and N and KVCO are a division ratio of the divider and the VCO gain, respectively.
The change to the loop filter voltage was amplified by the instrumental amplifier. A digital to analog converter (DAC) embedded in the microcontroller initially produced a constant voltage that as slightly higher than the initial loop filter voltage. The DAC output (Va) was adjusted to generate an output voltage of the amplifier between 500 mV and 1000 mV, which was used as a baseline voltage (Vbaseline). When the resonance frequency of QCR decreases, the system output voltage increases, which is a trend depicted in Figure 1b. Thus, Equation (4) describes the sensitivity of the developed system.
| Δ V O Δ F QCR | = A amp × N K VCO
where ΔVO is the system output change and Aamp is the amplifier gain. The system sensitivity can be enhanced by increasing Aamp and decreasing VCO gain (KVCO). However, the acceptable input frequency range of the PLL is expected to be narrower as the VCO gain becomes smaller. In this study, the VCO gain was designed to be 0.38 MHz/V, which had an input frequency range of 80 kHz. Thus, the span of the acceptable input frequency was from 4.9 MHz to 4.98 MHz, and the resonance frequency of the QCR used in the study was 4.95 MHz. Since the maximum output voltage was limited by the supply voltage of 3.3 V, the measurable frequency shift became smaller as system sensitivity increased. System sensitivity can be adjusted depending on overall demands or applications by modifying the gain of the amplifier. In our developed system, we used an amplifier gain of 34, which gave a calculated system sensitivity of approximately 1.43 mV/Hz. The measurable frequency shift range was approximately from 0 Hz to 1400 Hz with that sensitivity, which was a suitable frequency range for detecting most VOCs of interest [5,6,7,8,9,10].
The custom-designed circuitry was fabricated on printed circuit boards (PCBs) as shown in Figure 2a. The PLL and the QCR oscillator were built on the first PCB (PCB_1), and the other circuits, including the LPF, the amplifier, and the regulators, were built on the second PCB (PCB_2). An electromagnetic interference (EMI) shielding gasket was equipped to reduce ambient noise. A housing was printed using a three-dimensional (3-D) printer with polylactic acid (PLA). The developed system with 3D-printed housing is shown in Figure 2b. The dimensions of the entire system with the housing were 9 cm × 6.2 cm × 4.8 cm.

3. Experiments

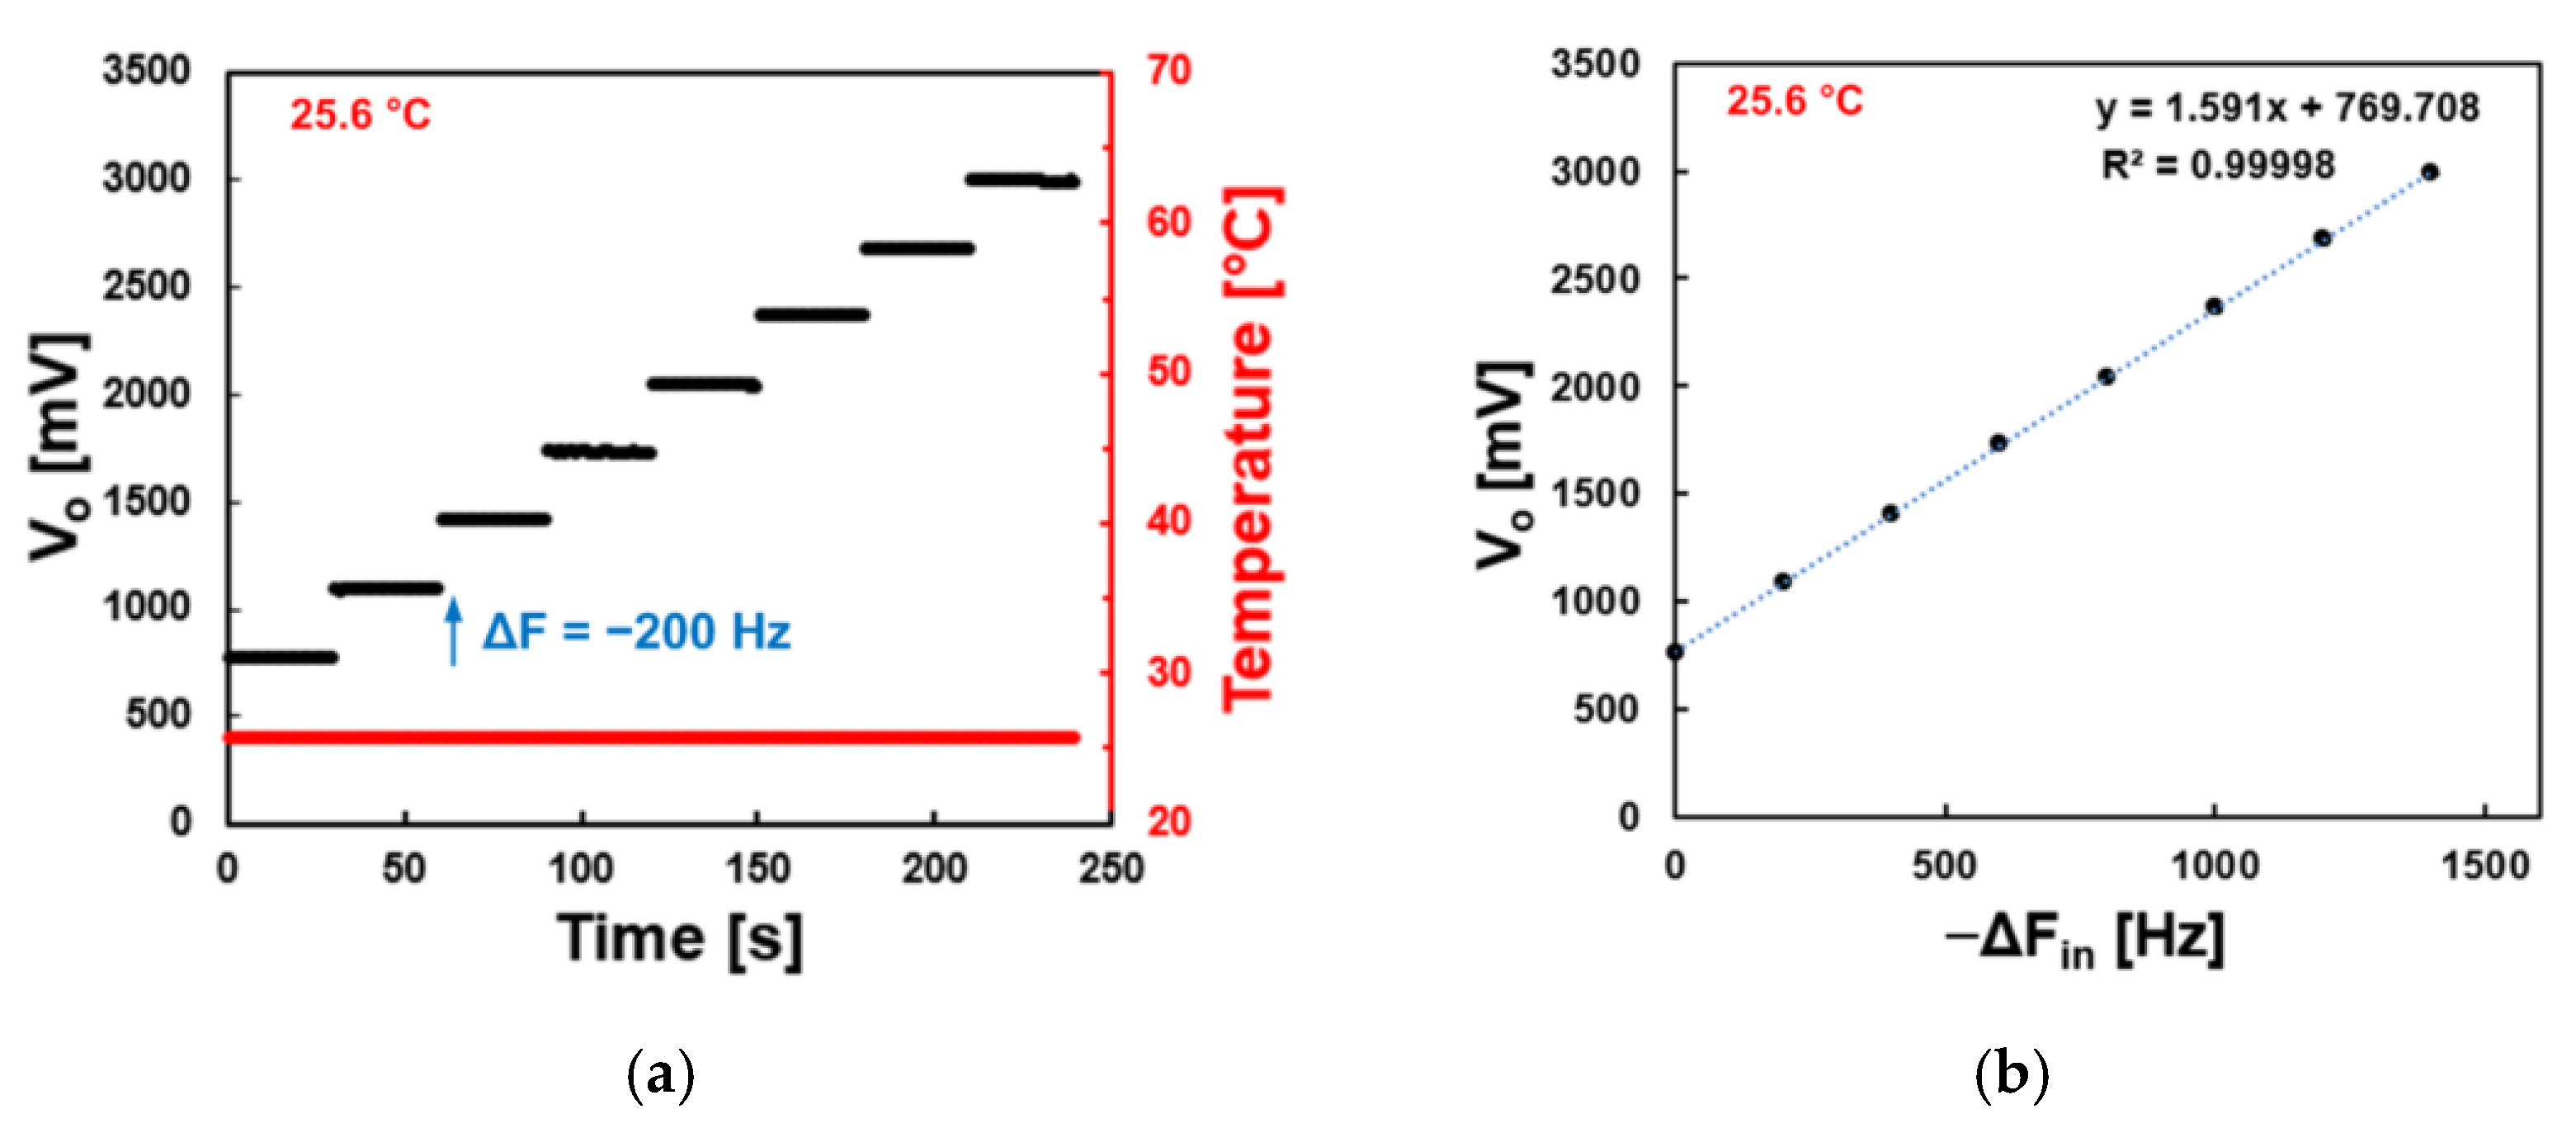
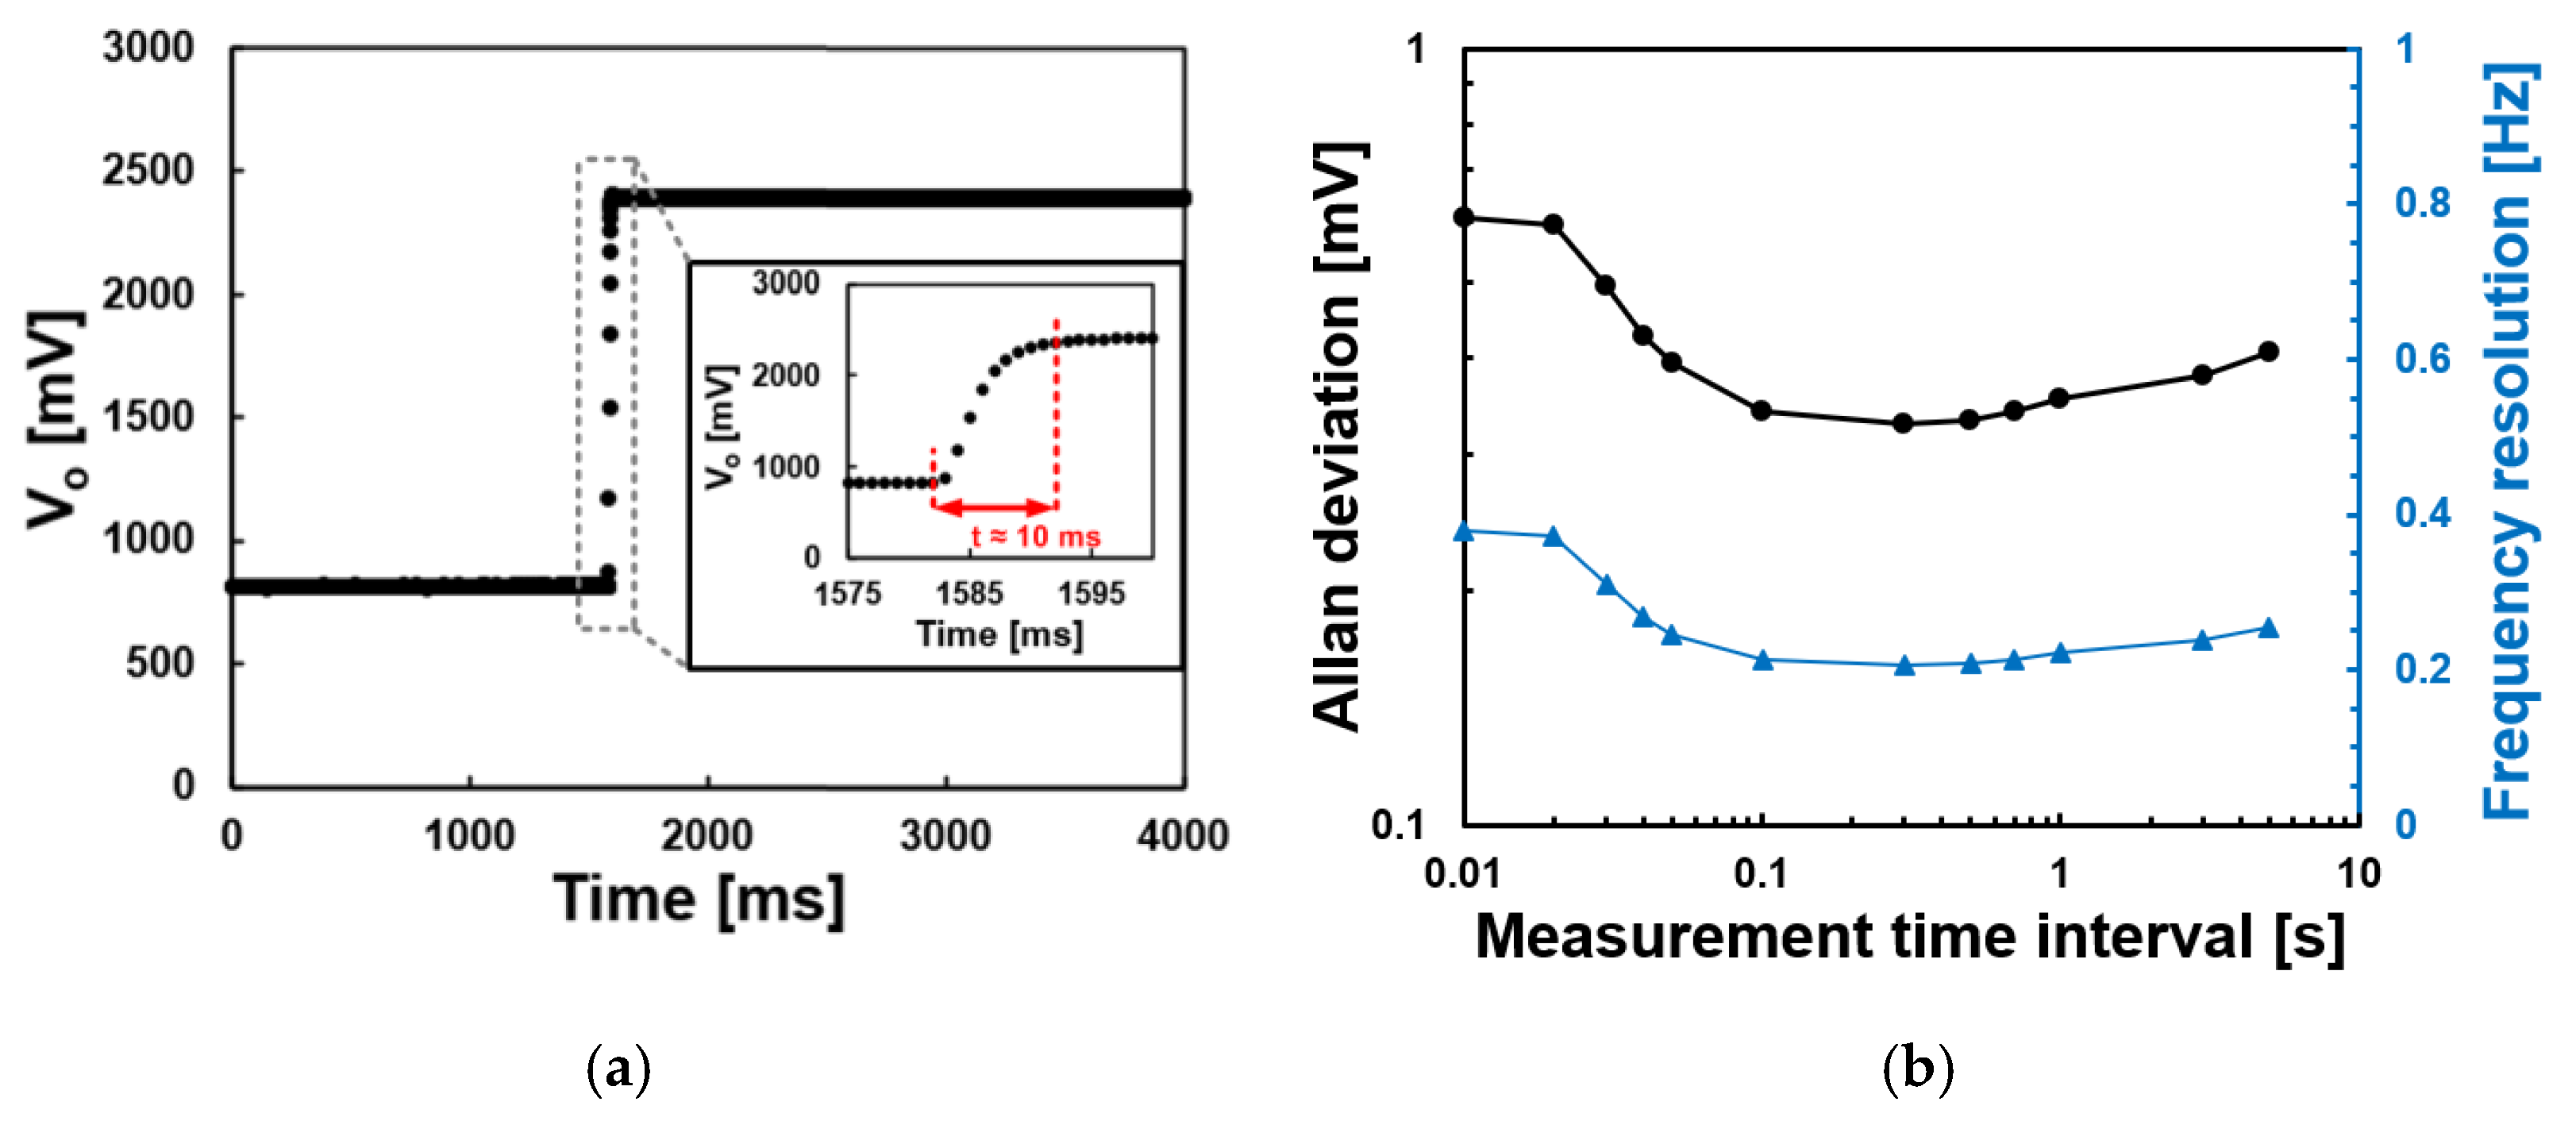
3.1. System Characterization

A function generator (AFG-2225, GW Instek) was employed to produce an oscillating sine signal near 5 MHz for determining system sensitivity, and an incremental step input frequency change of −200 Hz was applied to the measurement system. The value of a digital-to-analog converter (DAC) was first set to provide a system output between 500 mV and 1000 mV, and the input frequency was controlled to −200 Hz increments held at 30 s intervals. The raw data of the system output voltage and temperature were collected and recorded by the microcontroller every second. The measured system output voltages at each frequency were averaged, and system sensitivity was obtained through linear regression.
The temperature dependence of the system sensitivity was investigated as well. The developed system was placed on a hot plate (PC-420D, Corning) and covered with a styrofoam box to control and maintain the system temperature. Temperatures from 15 °C to 55 °C were maintained and the corresponding system output voltages were recorded. The system sensitivity was calculated as described above, at each temperature.
Because data collected from any electronic system will have a certain degree of random variations that will limit a practical measurement resolution, it is necessary to investigate the noise level of any measurement system [27]. In an electronic system, different types of noise, such as thermal and flicker noise, are usually inherent and included in measured data at a given time. While the calculated standard deviation is commonly used to determine the noise level, it does not provide an accurate estimate of the noise level when a measured signal contains frequency dependence noise components, such as flicker noise [28]. Flicker noise is frequency dependent and predominantly appears at low frequencies. In contrast, thermal noise is caused by thermal fluctuation in conductive materials and is regarded as broadband white noise that does not have frequency dependency. Flicker noise has frequency dependency and dominantly appears at low frequencies. In semiconductor devices, frequency-dependent flicker noise is typically explained by two models: one is mobile carrier number fluctuation due to the random trapping and detrapping of mobile carriers at the Si-SiO2 interface, and the other is carrier mobility fluctuation due to scattering mechanisms such as impurity scattering and surface scattering [29,30]. In order to analyze these different types of noise in tandem, the Allan deviation calculation was introduced in 1966 [31] and has been widely used as a method to analyze noise levels and to determine detection limits of electronic circuitry [32,33,34]. In this work, we also apply the Allan deviation to investigate the practical frequency resolution of the developed system as shown in Equation (5).
σ y ( τ ) = 1 2 P 0 k = 1 P 0 ( y ¯ k + 1 y ¯ k ) 2
where τ is an averaging time, y ¯ k is the mean value of the measured quantity, y(t), during the kth time interval, and P0 is the number of y ¯ k + 1 y ¯ k . In practice, the measurement is performed at a certain sampling rate that determines the minimum time interval, τ0. Then, the averaging time, τ, can be 0 (n = 1, 2, 3, …) and the value of the Allan deviation varies depending on the averaging time. Since the developed system in this work determines the input frequency shift based on changes to the measured system output voltage, the frequency resolution of the developed system can be obtained by dividing the Allan deviation of the measured system output voltages by the measured system sensitivity. The frequency resolution of the system is expressed as
Δ f ( τ ) = σ o ( τ ) S
where Δf(τ) and σo(τ) are the frequency resolution and the Allan deviation of the system output during the measurement time interval (averaging time) interval of τ, and S is the system sensitivity, which is obtained from a system calibration curve.
In order to determine the frequency resolution and an optimized measurement time interval, the minimum time interval, τ0, was determined. Measuring the output voltages of the developed system requires a time interval to have the system to respond to a temporal input frequency change, in which this response time sets a minimum measurement time during actual QCM experiments. A response of output voltages to a step input frequency change determines the minimum measurement time. The transition time of output voltages was monitored by applying a step frequency change of −1000 Hz to the system input signal. In addition, the output voltages of the system were recorded for 1 h with a constant system input frequency of 4.95 MHz and at a sampling rate of 1 kHz, having a minimum time interval (τ0) of 1 ms for the Allan deviation analysis.

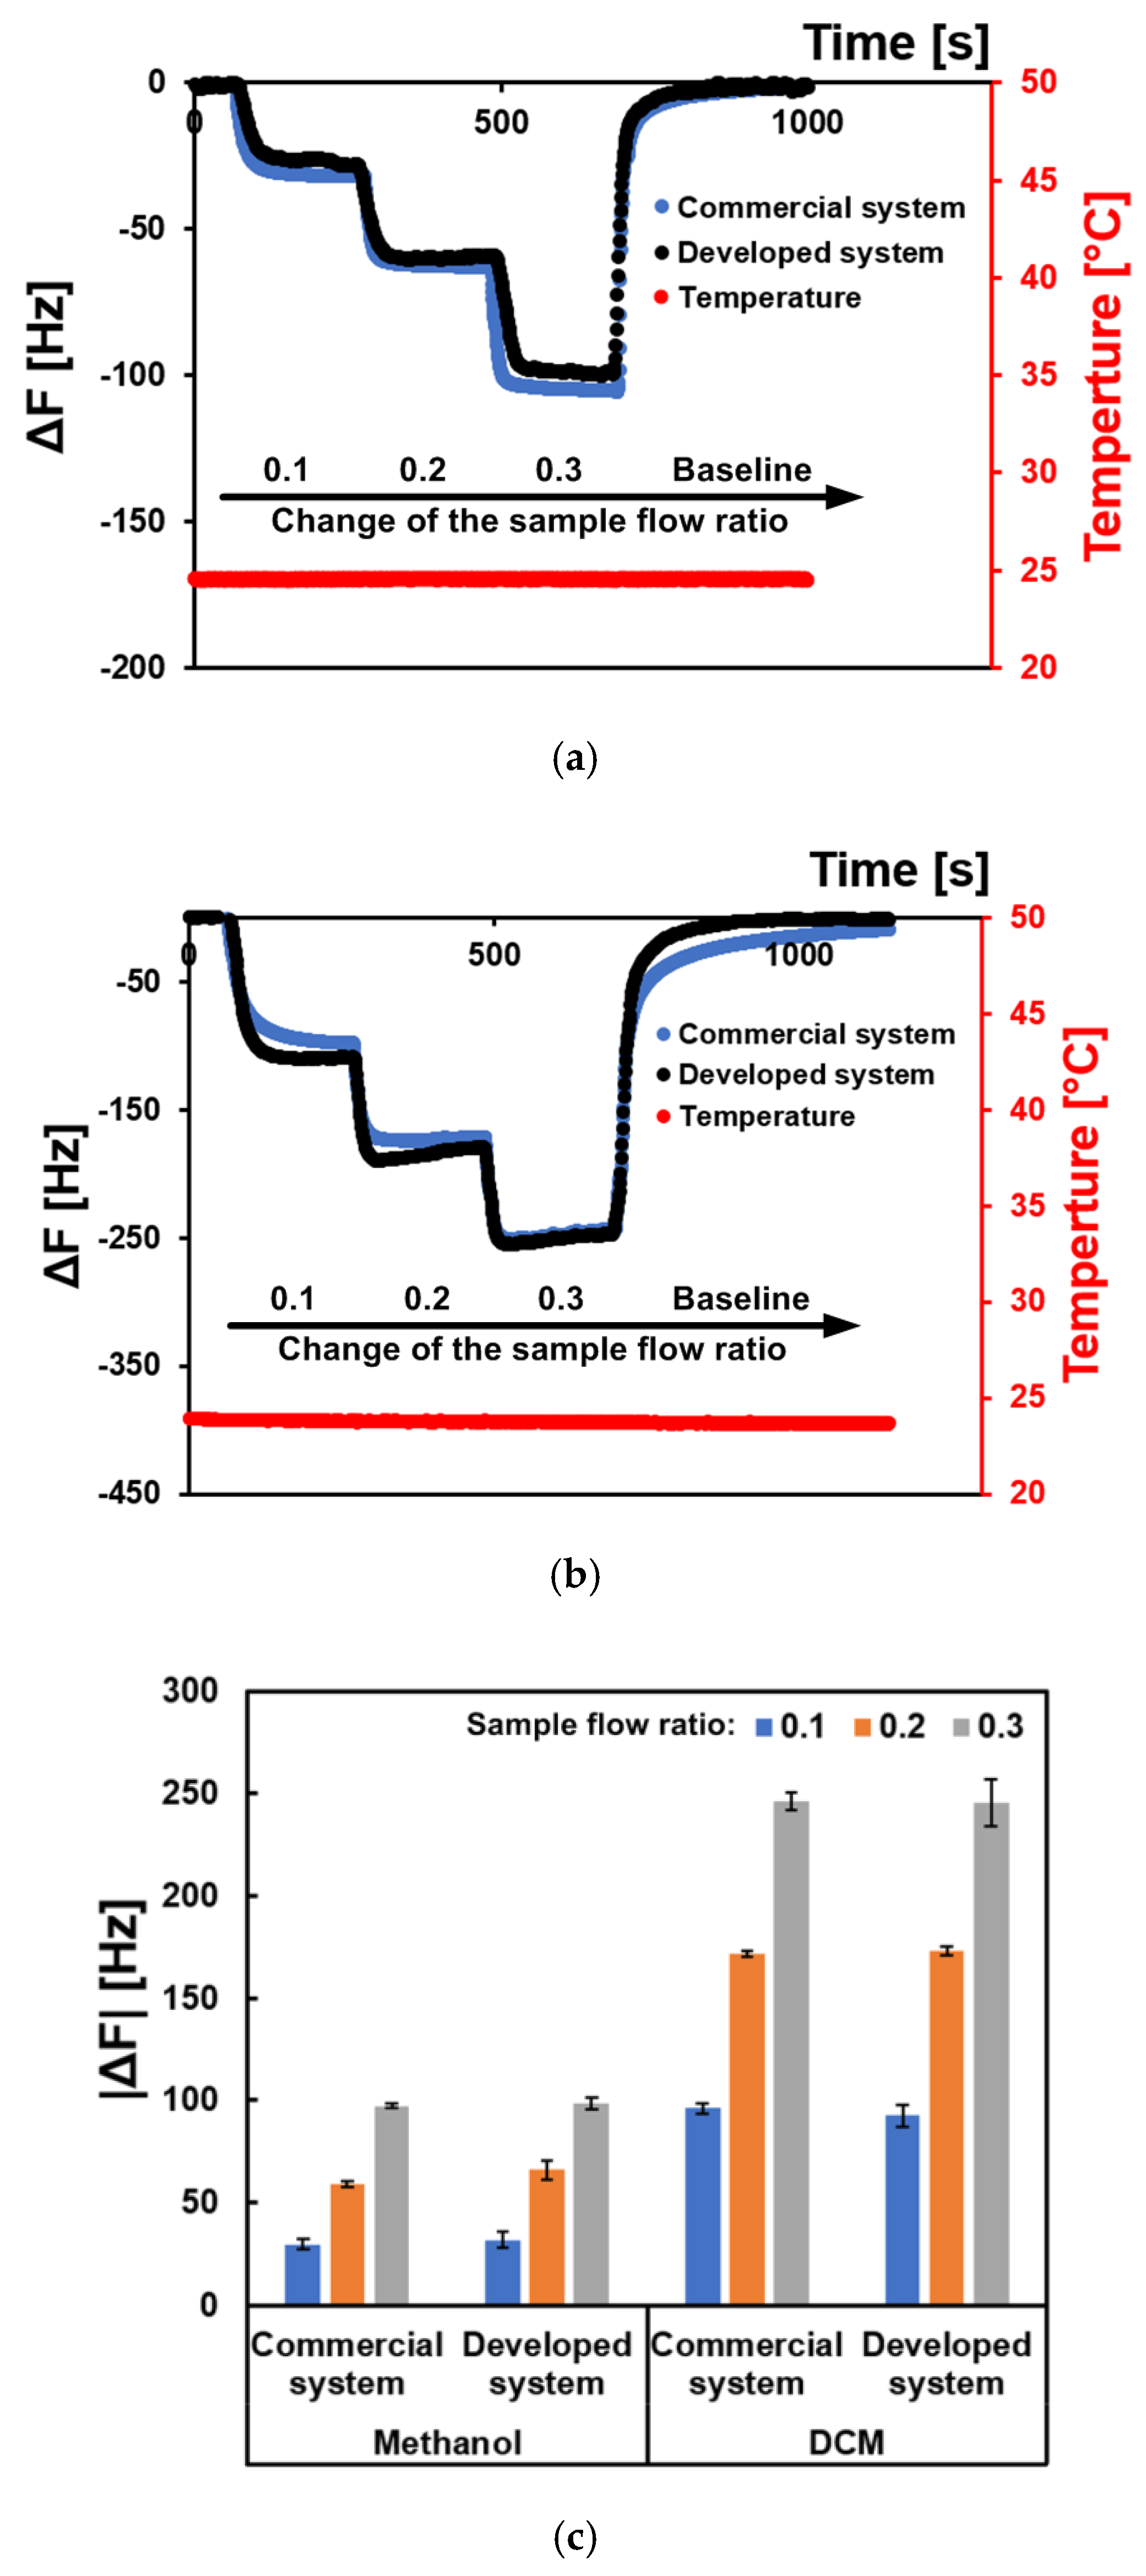
3.2. System Validation

In this study, a Group of Uniform Materials based on Organic Salts (GUMBOS) [35,36,37] were employed as a chemosensitive QCR coating material same as reported in [10]. A gold quartz crystal resonator (QCR) was cleaned using a cleaning solution (1:1:5 of hydrogen peroxide (30%), concentrated ammonium hydroxide and deionized water) prior to the coating procedure. A 1 mg/mL stock solution of tetrabutylammonium copper (II) phthalocyanine-tetra sulfonic acid GUMBOS ([TBA][CuPcS4]) in dichloromethane (DCM) was prepared and employed to coat the QCR through a drop-casting procedure. Aliquots of 50 µL were dropped onto the QCR, then allowed to dry, and the resonance frequency was measured. These steps were repeated until the change to the resonance frequency was approximately 2000 Hz. Finally, the QCR was placed in a desiccator for 24 h before use.
In the system validation studies, the responses of the developed system were compared to the responses of the commercial system, Q-sense Analyzer (Biolin Scientific). QCR flow cells coupled to each measurement system were connected in series to the flow system consisting of two gas channels for the carrier gas (argon) and the VOC samples (Methanol and DCM). Before starting the measurement procedure, a stable baseline was firstly achieved with pure argon. Then, VOC sample vapor was generated by bubbling argon gas in a vial that contained a liquid VOC sample. As the two flow channels merge, the sample flow can be diluted with argon as desired.
The carrier flow rate (Fc) and the sample flow rate (Fs) were independently controlled by a digital mass flow controller. A total flow rate (Ftotal) of 100 sccm was maintained during the entire experiments and sample flow ratios (Fs/Ftotal) of 0.1, 0.2, and 0.3 were applied with 3-min intervals. Once a set of experiments was complete, the VOC sample vapor was removed from the QCR surface by purging with pure argon gas until the system response recovered to the baseline. A representative schematic of the experimental setup is depicted in Figure 3.

4. Results and Discussions

System sensitivity is the key parameter to estimate input frequency shifts in the PLL-based QCM measurement systems [21,22]. In our work, DAC values were determined to produce the baseline voltage between 500 mV to 1000 mV. The system output voltage was measured by applying incremental input frequency changes, and the resultant system output at each interval was averaged to obtain the system sensitivity, as shown in Figure 4. From the analysis of the linear regression data presented in Figure 4, the system sensitivity was calculated to be 1.60 mV/Hz at 25.6 °C.
Because the objective of this work was to develop a miniaturized system that can be employed in the field, it was important to evaluate the system performance at different temperatures. For this reason, the system sensitivity was studied at different temperatures (14.9 °C, 25.6 °C, 35.7 °C, 44.4 °C and 55.3 °C), and the results are shown in Figure 5 and Table 1. The sensitivity measurements were obtained from five replicates at each temperature. Percent relative errors respective the system sensitivity at 25.6 °C were calculated and depicted in Table 1. The largest error (0.401%) was observed at 55.3 °C. This indicates that when the input frequency shift was 100 Hz at 55.3 °C, a deviation of around 0.4 Hz is expected in the measurement.
Allan deviation analysis was performed to investigate the frequency resolution of the developed system. Firstly, the minimum measurement time was tested by measuring the transition time of the output voltage as shown in Figure 6a. A step frequency change of −1000 Hz was applied, and the output voltage was measured by a microcontroller at the sampling rate of 1 kHz. The measured transition time of 10 ms means that it takes a time delay of 10 ms to represent accurate temporal frequency changes. A plot of the Allan deviation is shown in Figure 6b, as obtained based on continuous collection of the system output voltage for one hour.
At the measurement time intervals between 0.02 s and 0.1 s, the plot followed the region of the white noise where the Allan deviation decreases as the averaging time increases. A relatively flat noise floor was observed after the measurement time interval of 0.1 s, which was also representative of a region with minimal noise deviation. Accordingly, the frequency resolution at different measurement time intervals was obtained by dividing the Allan deviation with the system sensitivity of 1.6 mV/Hz as described in Equation (6). The developed system showed a frequency resolution of 0.38 Hz at a measurement time interval of 0.01 s and the highest resolution of 0.22 Hz at time intervals between 0.1 s and 1 s. The frequency resolution corresponding to 0.22 Hz at 0.1 s was significantly improved when compared to the limits of the resolution obtainable by the simplest frequency counter (1 Hz at 1 s) [19].
A single GUMBOS-coated QCR sensor was then inserted into the QCM flow cell as described in Section 3.2 and previous reports [9,10]. The fundamental resonance frequency of the QCR sensor was determined by the commercial instrument when was exposed to 100% pure argon flow. The measured resonance frequency of the sensor was 4.953 MHz, which was within the acceptable input frequency range of the developed electronic system. Two common VOCs, methanol and DCM, were employed for validation purposes. The GUMBOS QCR sensor was exposed to three different sample flow ratios (0.1, 0.2, and 0.3) of each VOC during 3-min intervals. An argon flow of one hundred percent was then applied to allow the fundamental frequency to recover to the baseline. Three replicate measurements were performed for the respective VOCs. The measurement time was set to 1 s for the developed system to minimize the number of data while achieving the highest frequency resolution. Notably, the measurement time could be adjusted to 0.01 s for applications where the rate of the frequency change is more important than the resolution of the system. The ambient temperature was maintained at around 24.5 °C during the validation experiments.
Figure 7 shows the change of frequency responses over the experimental time for the developed electronic system (black points) and for the commercial system (Q-sense Analyzer, Biolin Scientific) (blue points). The results shown in Figure 7a,b demonstrate that the developed electronic system showed similar response patterns to the patterns obtained with the commercial system. As the sample flow ratio increases from 0.1 to 0.3, the concentration of the analyte also increases, resulting in larger frequency shifts. Previous reports demonstrated that sensor frequency responses can vary upon exposure to different VOCs as a result of inherent differences in chemical properties [9,10]. The sensor employed in this work displayed reversible sorption of both VOC samples, which also exemplifies the reusability of the GUMBOS sensor in this miniaturized QCM setup. Three replicate measurements were performed for the analysis. Figure 7c shows more stable responses with methanol than with DCM in both measurement systems due to the higher volatility of DCM than methanol. With the commercial instrument, the standard deviations of the measurements ranged from 0.82 Hz to 2.45 Hz with methanol and from 1.38 Hz to 4.63 Hz with DCM, respectively. With the miniaturized system, the standard deviations of the measurements were calculated to be 2.69 Hz to 4.64 Hz with methanol and 1.86 Hz to 11.45 Hz with DCM, respectively. Although the developed system was determined to have larger deviations, the responses of the sensor at each flow ratio were sufficient to measure relative concentrations of each VOC tested.
Since the goal was to validate the electronic performance of the developed miniaturized system for QCM detection in this study, the cross reactivity of sample VOCs was not studied separately. Moreover, we only demonstrated a system with a single QCR sensor designed for one VOC at a time. Chemosensitive QCR coating materials determine a unit’s reactivity to VOCs. If the detection of multiple VOCs is desired, an array of QCRs with different chemosensitive coating materials, as reported in [10], can be used, along with algorithm-based discrimination methods. Additionally, the developed system can further be improved for multiplexed measurements with multiple QCR sensors, which is currently underway. Due to the small form factor of the developed system, it is envisaged to be applicable as a portable and standalone QCM measurement system.

5. Conclusions

We have designed and successfully characterized a miniaturized QCM measurement system based on a PLL circuit. The developed system was optimized for a commercial 5 MHz QCR sensor for VOC detection. The obtained system sensitivity was 1.6 mV/Hz for a wide ambient temperature range from approximately 15 °C to 55 °C, which is applicable for portable and potentially outdoor applications. Notably, the developed system was also determined to have a stable frequency resolution of 0.22 Hz at short measurement time intervals between 0.1 to 1 s, thus providing more reliable resolution in this electronic configuration than a traditional simple frequency counter. Additionally, the developed system was subjected to validation via the detection of two common VOCs, methanol and DCM, as sample analytes, with a GUMBOS-coated QCR sensor, based on previously reported protocols [9,10]. The obtained results from the developed system were in good agreement with the results of the commercial system. The miniaturized QCM measurement system developed in this work also has a small form factor and is battery-powered, making it useable as a fully portable QCM measurement system.

Author Contributions

Conceptualization, J.-Y.P., R.L.P., C.E.A., S.R.V., I.M.W. and J.-W.C.; methodology, J.-Y.P. and S.R.V.; software, J.-Y.P.; fabrication, J.-Y.P.; validation, J.-Y.P., R.L.P. and C.E.A.; formal analysis, J.-Y.P., R.L.P. and C.E.A.; investigation, J.-Y.P., R.L.P., C.E.A. and J.-W.C.; resources, I.M.W. and J.-W.C.; data curation, J.-Y.P., R.L.P. and C.E.A.; writing—original draft preparation, J.-Y.P. and J.-W.C.; writing—review and editing, R.L.P., C.E.A., I.M.W. and J.-W.C. All authors have read and agreed to the published version of the manuscript.

Funding

This research was funded by the National Science Foundation (CHE-1905105).

Conflicts of Interest

The authors declare no conflict of interest.

References

  1. Sharma, P.; Ghosh, A.; Tudu, B.; Sabhapondit, S.; Baruah, B.D.; Tamuly, P.; Bhattacharyya, N.; Bandyopadhyay, R. Monitoring the fermentation process of black tea using QCM sensor based electronic nose. Sens. Actuators B Chem. 2015, 219, 146–157. [Google Scholar] [CrossRef]
  2. Li, Q.; Gu, Y.; Wang, N. Application of random forest classifier by means of a QCM-based e-nose in the identification of Chinese liquor flavors. IEEE Sens. J. 2017, 17, 1788–1794. [Google Scholar] [CrossRef]
  3. Aydemir, F.; Ebeoglu, M.A. A QCM sensor array-based electronic tongue with the optimized oscillator circuit using FPGA. IEEE Trans. Instrum. Meas. 2018, 67, 431–438. [Google Scholar] [CrossRef]
  4. Deisingh, A.K.; Stone, D.C.; Thompson, M. Applications of electronic noses and tongues in food analysis. Int. J. Food Sci. Technol. 2004, 39, 587–604. [Google Scholar] [CrossRef]
  5. Toniolo, R.; Pizzariello, A.; Dossi, N.; Lorenzon, S.; Abollino, O.; Bontempelli, G. Room temperature ionic liquids as useful overlayers for estimating food quality from their odor analysis by quartz crystal microbalance measurements. Anal. Chem. 2013, 85, 7241–7247. [Google Scholar] [CrossRef]
  6. Sankaran, S.; Panigrahi, S.; Mallik, S. Odorant binding protein based biomimetic sensors for detection of alcohols associated with Salmonella contamination in packaged beef. Biosens. Bioelectron. 2011, 26, 3103–3109. [Google Scholar] [CrossRef]
  7. Selig, M.J.; Gamaleldin, S.; Celli, G.B.; Marchuk, M.A.; Smilgies, D.-M.; Abbaspourrad, A. The stabilization of food grade copper-chlorophyllin in low pH solutions through association with anionic polysaccharides. Food Hydrocoll. 2020, 98, 105255. [Google Scholar] [CrossRef]
  8. Bwambok, D.; Siraj, N.; Macchi, S.; Larm, N.; Baker, G.; Pérez, R.; Ayala, C.; Walgama, C.; Pollard, D.; Rodriguez, J.; et al. QCM sensor arrays, electroanalytical techniques and NIR spectroscopy coupled to multivariate analysis for quality assessment of food products, raw materials, ingredients and foodborne pathogen detection: Challenges and breakthroughs. Sensors 2020, 20, 6982. [Google Scholar] [CrossRef]
  9. Speller, N.C.; Siraj, N.; Vaughan, S.; Speller, L.N.; Warner, I.M. QCM virtual multisensor array for fuel discrimination and detection of gasoline adulteration. Fuel 2017, 199, 38–46. [Google Scholar] [CrossRef]
  10. Vaughan, S.R.; Speller, N.C.; Chhotaray, P.; Mccarter, K.S.; Siraj, N.; Pérez, R.L.; Li, Y.; Warner, I.M. Class specific discrimination of volatile organic compounds using a quartz crystal microbalance based multisensor array. Talanta 2018, 188, 423–428. [Google Scholar] [CrossRef]
  11. Yang, M.; He, J. A copper–manganese composite oxide as QCM sensing layers for detection of formaldehyde gas. RSC Adv. 2018, 8, 22–27. [Google Scholar] [CrossRef] [Green Version]
  12. Bearzotti, A.; Macagnano, A.; Papa, P.; Venditti, I.; Zampetti, E. A study of a QCM sensor based on pentacene for the detection of BTX vapors in air. Sens. Actuators B Chem. 2017, 240, 1160–1164. [Google Scholar] [CrossRef]
  13. Wilson, A.D. Recent progress in the design and clinical development of electronic-nose technologies. Nanobiosensors Dis. Diagn. 2016, 5, 15–27. [Google Scholar] [CrossRef] [Green Version]
  14. Park, J.-Y.; Choi, J.-W. Electronic circuit systems for piezoelectric resonance sensors. J. Electrochem. Soc. 2020, 167, 037560. [Google Scholar] [CrossRef]
  15. Arnau, A. A review of interface electronic systems for AT-cut quartz crystal microbalance applications in liquids. Sensors 2008, 8, 370–411. [Google Scholar] [CrossRef] [PubMed] [Green Version]
  16. Mills, C.; Chai, K.; Milgrew, M.; Glidle, A.; Cooper, J.; Cumming, D. A multiplexed impedance analyzer for characterizing polymer-coated QCM sensor arrays. IEEE Sens. J. 2006, 6, 996–1002. [Google Scholar] [CrossRef] [Green Version]
  17. Wudy, F.; Multerer, M.; Stock, C.; Schmeer, G.; Gores, H. Rapid impedance scanning QCM for electrochemical applications based on miniaturized hardware and high-performance curve fitting. Electrochim. Acta 2008, 53, 6568–6574. [Google Scholar] [CrossRef]
  18. Tumurbaatar, B.; Kim, M.-J.; Park, C.-H.; Kim, C.S. A portable and computer-simulation analysis for the real-time measurement of the QCMD systems for the biomedical application. Sens. Bio-Sens. Res. 2018, 21, 75–81. [Google Scholar] [CrossRef]
  19. Johansson, S. New frequency counting principle improves resolution. In Proceedings of the 2005 IEEE International Frequency Control Symposium and Exposition, Vancouver, BC, Canada, 29–31 August 2005; pp. 628–635. [Google Scholar]
  20. Karapınar, M.; Gürkan, S.; Öner, P.A.; Doğan, S. Design of a multi-channel quartz crystal microbalance data acquisition system. Meas. Sci. Technol. 2018, 29, 075009. [Google Scholar] [CrossRef]
  21. Syahbana, M.A.; Santjojo, D.J.H.D.; Sakti, S.P. High-resolution multiple channel frequency counter using spartan-3E FPGA. In Proceedings of the 2016 International Seminar on Sensors, Instrumentation, Measurement and Metrology (ISSIMM), Malang, Indonesia, 10–11 August 2016; pp. 111–114. [Google Scholar]
  22. Molanes, R.F.; Farina, J.; Rodriguez-Andina, J.J. Field-programmable system-on-chip for high-accuracy frequency measurements in QCM sensors. In Proceedings of the 39th Annual Conference of the IEEE Industrial Electronics Society (IECON 2013), Vienna, Austria, 10–13 November 2013; pp. 2267–2272. [Google Scholar]
  23. Torres, R.; Arnau, A.; Perrot, H. Electronic system for experimentation in AC electrogravimetry II: Implemented design. Revista EIA 2007, 7, 63–73. [Google Scholar]
  24. Wang, L.; Lin, A.; Kim, E.S. Miniature sensing system with FBAR-based oscillators and frequency shift detector. IEEE Sens. J. 2018, 18, 7633–7637. [Google Scholar] [CrossRef]
  25. Guha, A.; Sandström, N.; Ostanin, V.P.; Wijngaart, W.V.D.; Klenerman, D.; Ghosh, S.K. Simple and ultrafast resonance frequency and dissipation shift measurements using a fixed frequency drive. Sens. Actuators B Chem. 2019, 281, 960–970. [Google Scholar] [CrossRef]
  26. Robertson, D.G.E.; Dowling, J.J. Design and responses of butterworth and critically damped digital filters. J. Electromyogr. Kinesiol. 2003, 13, 569–573. [Google Scholar] [CrossRef]
  27. Land, D.V.; Levick, A.P.; Hand, J.W. The use of the Allan deviation for the measurement of the noise and drift performance of microwave radiometers. Meas. Sci. Technol. 2007, 18, 1917–1928. [Google Scholar] [CrossRef] [Green Version]
  28. Allan, D.W. Should the classical variance be used as a basic measure in standards metrology? IEEE Trans. Instrum. Meas. 1987, 36, 646–654. [Google Scholar] [CrossRef]
  29. Hung, K.K.; Ko, P.K.; Hu, C.; Cheng, Y.C. A unified model for the flicker noise in metal-oxide-semiconductor field-effect transistors. IEEE Trans. Electron Devices 1990, 37, 654–665. [Google Scholar] [CrossRef]
  30. Christensson, S.; Lundström, I.; Svensson, C. Low frequency noise in MOS transistors-I Theory. Solid-State Electron. 1968, 11, 797–812. [Google Scholar] [CrossRef]
  31. Allan, D.W. Statistics of atomic frequency standards. Proc. IEEE 1966, 54, 221–230. [Google Scholar] [CrossRef] [Green Version]
  32. Witt, T.J. Using the Allan variance and power spectral density to characterize DC nanovoltmeters. IEEE Trans. Instrum. Meas. 2001, 50, 445–448. [Google Scholar] [CrossRef]
  33. Witt, T.J.; Reymann, D. Using power spectra and Allan variances to characterise the noise of Zener-diode voltage standards. IEEE Proc.-Sci. Meas. Technol. 2000, 147, 177–182. [Google Scholar] [CrossRef]
  34. Lee, J.; Shen, W.; Payer, K.; Burg, T.P.; Manalis, S.R. Toward attogram mass measurements in solution with suspended nanochannel resonators. Nano Lett. 2010, 10, 2537–2542. [Google Scholar] [CrossRef] [Green Version]
  35. Bwambok, D.K.; El-Zahab, B.; Challa, S.K.; Li, M.; Chandler, L.; Baker, G.A.; Warner, I.M. Near-infrared fluorescent nanoGUMBOS for biomedical imaging. ACS Nano 2009, 3, 3854–3860. [Google Scholar] [CrossRef] [PubMed] [Green Version]
  36. Warner, I.M.; El-Zahab, B.; Siraj, N. Perspectives on moving ionic liquid chemistry into the solid phase. Anal. Chem. 2014, 86, 7184–7191. [Google Scholar] [CrossRef]
  37. Azevedo, A.M.O.; Santos, J.L.M.; Warner, I.M.; Saraiva, M.L.M.F.S. GUMBOS and nanoGUMBOS in chemical and biological analysis: A review. Anal. Chim. Acta 2020, 1133, 180–198. [Google Scholar] [CrossRef] [PubMed]
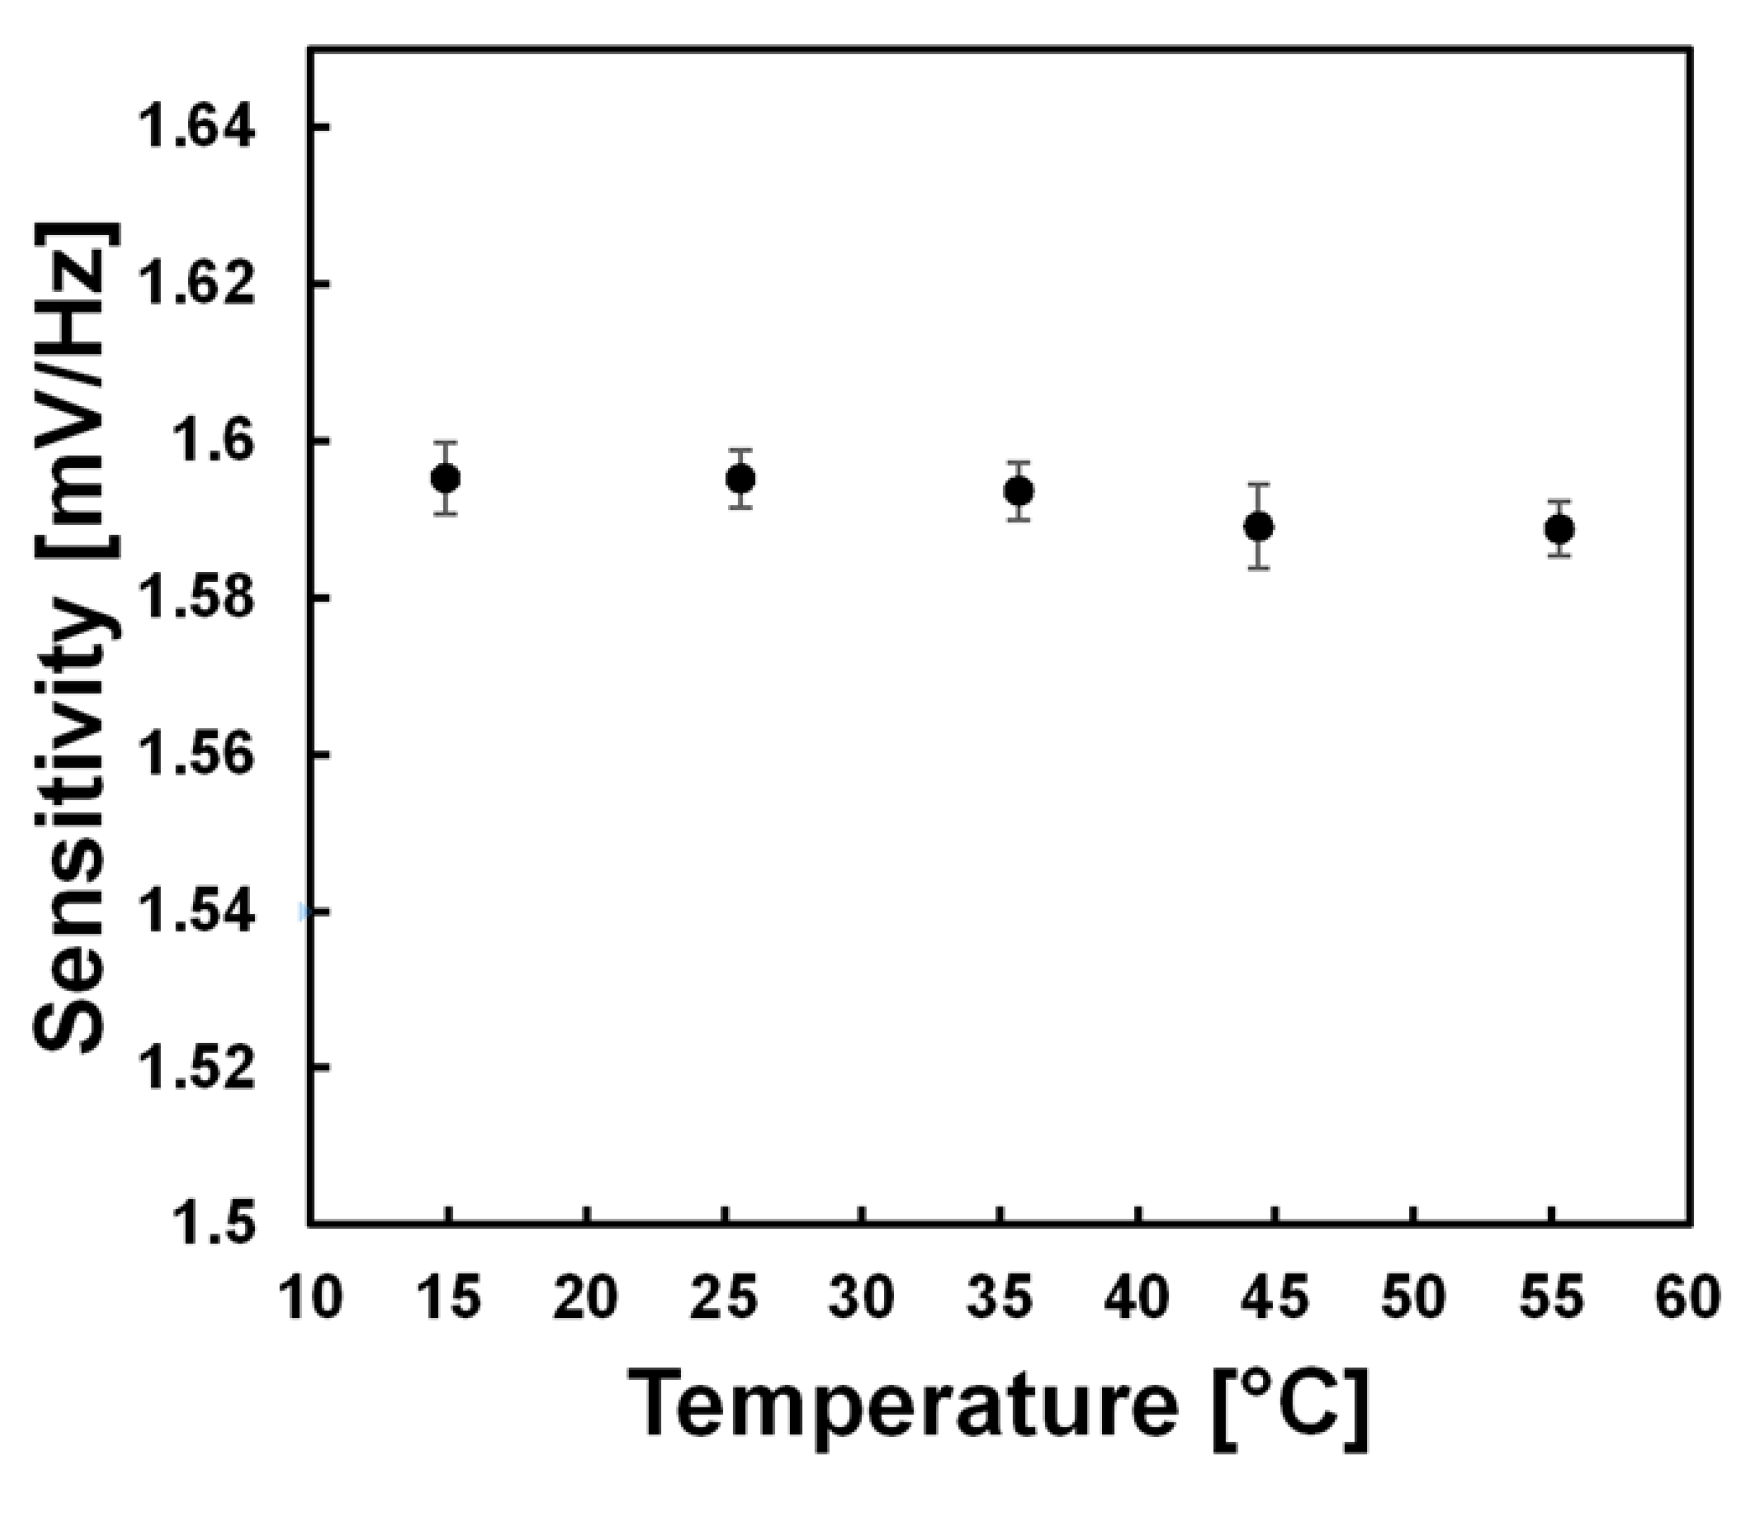
Figure 1. Designed QCM measurement system: (a) a block diagram of the PLL-based measurement system and (b) system output voltage to input frequency shift.
Electronics 11 00358 g001
Figure 2. Developed miniaturized QCM measurement system including custom-designed PCBs: (a) designed PCBs (PCB_1 and PCB_2) and (b) developed system inside a 3-D printed housing.
Electronics 11 00358 g002
Figure 3. The experimental setup to validate the developed handheld instrument with the conventional benchtop instrument.
Electronics 11 00358 g003
Figure 4. Experiment results for system sensitivity at 25.6 °C: (a) measured system output voltages to input frequency changes and (b) obtained system sensitivity and linearity.
Electronics 11 00358 g004
Figure 5. Temperature dependence of system sensitivity. Error bars represent standard deviations of five replicate measurements.
Electronics 11 00358 g005
Figure 6. Frequency resolution of the developed miniaturized QCM system: (a) step response to determine the minimum measurement time, and (b) Allan deviation plot.
Electronics 11 00358 g006
Figure 7. Direct comparison of the measurement results between the developed system and the commercial QCM system, Q-sense Analyzer (Biolin Scientific): frequency responses during the experimental time in the presence of (a) methanol and (b) DCM, and (c) comparison of average changes in frequency in presence of evaluated VOCs. Error bars indicate the standard deviation for three replicate measurements.
Electronics 11 00358 g007
Table 1. System sensitivity at evaluated temperatures. Averages and standard deviations were calculated by five replicate experiments at different temperatures. Percent relative errors were calculated based on the sensitivity at 25.6 °C.
Temperature (°C)Sensitivity (mV/Hz)Error (%)
AverageStandard Deviation
14.91.604.54 × 10−30.006
25.61.603.74 × 10−3NA
35.71.593.59 × 10−30.100
44.41.595.37 × 10−30.382
55.31.593.39 × 10−30.401
Publisher’s Note: MDPI stays neutral with regard to jurisdictional claims in published maps and institutional affiliations.

