
Energy Harvesting Strategies for Wireless Sensor Networks and Mobile Devices: A Review


Department of Electrical Energy and Information Engineering “Guglielmo Marconi” (DEI), University of Bologna, 40132 Bologna, Italy
Electronics 2021, 10(6), 661; https://doi.org/10.3390/electronics10060661
Submission received: 29 December 2020
/
Revised: 2 February 2021
/
Accepted: 9 February 2021
/
Published: 12 March 2021
(This article belongs to the Special Issue Emerging Technologies for Computer, Electrical and Systems Engineering)
Abstract
:Wireless sensor network nodes and mobile devices are normally powered by batteries that, when depleted, must be recharged or replaced. This poses important problems, in particular for sensor nodes that are placed in inaccessible areas or biomedical sensors implanted in the human body where the battery replacement is very impractical. Moreover, the depleted battery must be properly disposed of in accordance with national and international regulations to prevent environmental pollution. A very interesting alternative to power mobile devices is energy harvesting where energy sources naturally present in the environment (such as sunlight, thermal gradients and vibrations) are scavenged to provide the power supply for sensor nodes and mobile systems. Since the presence of these energy sources is discontinuous in nature, electronic systems powered by energy harvesting must include a power management system and a storage device to store the scavenged energy. In this paper, the main strategies to design a wireless mobile sensor system powered by energy harvesting are reviewed and different sensor systems powered by such energy sources are presented.
1. Introduction
The continuous increase in the number of wireless sensor networks (WSNs) and mobile devices poses important problems in terms of supplying adequate energy to power such devices [1,2]. In the case of WSNs, in particular, where a large number of sensor nodes are deployed in a relatively vast area, the constraint of supplying enough energy for the proper function of the device is very critical [3].
In recent years a strong increase in the adoption of mobile sensor systems was reported in different fields of application, such as: quality assessment of olive oil [4,5,6], electronic noses for food quality determination [7], characterization of tomato paste [8], determination of solid fat content in vegetable oils and fats [9], characterization and production control of ice-creams [10,11], environmental monitoring [12,13,14], particulate concentration measurement [15], toxic volatile organic compound detection [16], microbial analysis [17,18,19,20], corrosion detection in metal structures [21,22,23], control of industrial processes [24,25,26], characterization of saline solutions [27] and forensic analysis [28]. Moreover, the large diffusion of smart mobile phones (smartphones) that integrate powerful microprocessors with high processing capability, wireless communication protocols and a rich sensor set, makes the smartphone an optimal platform for sensing applications [29,30,31]. In general, mobile devices are powered by battery. In many of these systems, such as WSNs deployed in inaccessible areas or medical devices implanted in the human body, the replacement or recharge of depleted batteries is not feasible, so the device must be designed to ensure that the energy provided by battery is enough for the system’s entire anticipated lifecycle [32,33]. Of course, a possibility is to use higher capacity batteries to ensure the required energy constraints are met, but this results in increased size for the device that is often not acceptable. Thus, in the end, the design of such systems must be carried out with the aim of power consumption minimization [34].
The structure of a mobile device or a sensor node in WSNs is usually system-dependent but generally comprises the following four elements: a power supply unit, a set of sensors and/or actuators, a processing unit (usually realized with a microcontroller) and a wireless communication system. Different sensors are characterized by different values of power consumption: for example, temperature and humidity sensors are usually characterized by low power consumption while cameras and CMOS gas sensors are much more power-hungry devices [35,36,37,38]. The same is true for the processing unit since on the market there are high end microcontrollers with high computing capability but also high power consumption as well as low end devices with extremely low power consumption: for example, the Intel StrongARM microprocessor features a 360 mW power consumption in active mode while, in the case of ATmega103L AVR microcontroller the power consumption is only 16.5 mW [39]. Moreover, microprocessors and microcontrollers feature different operating modes beside the standard active mode (where all the chip functionalities are activated): power saving modes include idle and sleep modes where different peripherals and/or even the main CPU are powered off to reduce the power consumption to a minimum level [40]. Power saving techniques include, for example, switching of the microprocessor from active to sleep mode and vice-versa to use the active mode only during small periods when data acquisition and processing is needed. Other power saving techniques include the choice of a suitable acquisition frequency as well as the accuracy in the analog to digital conversion [41]. The wireless communication system is usually expensive in terms of power consumption with different communication protocols (Bluetooth, Bluetooth low energy, Zig-bee, Wi-fi, LoRa) that are characterized by different performance in terms of transmitting/receiving distance, data throughput and power consumption [42,43]. For example, Wi-fi operates in the frequency range from 2.4 GHz to 5 GHz, features a range of about 150 m with an high data throughput (up to 3.46 Gbps) but is characterized by moderate to high power consumption. Bluetooth and, in particular, Bluetooth low energy (BLE) consume much less power while maintaining a high data throughput (24 Mbps) but the operative range is limited to tens of meters. ZigBee increases the operative range to 1500 m in line of sight while maintaining a low power consumption, but the data throughput is reduced to 1 Mbps. LoRa, on the other hand, combines low power consumption with very high operative range (up to 10 Km in rural areas) but the data throughput is very low (50 kbps).
Although many techniques exist to limit the system power consumption, the energy provided by battery is limited and thus there is a limit on the system lifetime before battery replacement or recharging is needed.
An interesting technique that allows a mobile system or WSN node to operate for a potential infinite time without the need of battery replacement or recharge is energy harvesting [44,45,46,47]. In energy harvesting the energy needed to power the system is scavenged from natural sources (sunlight, wind, thermal differences) or external sources (mechanical actions of humans or animals, vibrations of industrial machines) and converted to electrical power. Energy scavenged from different sources is characterized by different power levels for the generated electrical power. A list of the main energy sources used to power mobile systems and WSNs as well as the average value of the generated power are presented in Table 1.
One important characteristic common to most natural energy sources used for energy harvesting is that they are discontinuous: for example, the energy scavenged from sunlight provides different power levels at different hours of the day as well as different periods of the year and is completely absent during night. Thus, electronic systems powered by energy harvesting must be designed taking this important characteristic in consideration and must store the scavenged energy when the natural source is present for later use.
Energy harvesting based systems can be clustered in two different groups: the so- called Harvest-Use (HU) systems and the Harvest-Store-Use (HSU) systems [48]. HU systems scavenge energy from the environmental or external energy sources and use it immediately without storing the energy. Thus, since most energy sources are discontinuous in nature, the HU systems can not provide continuous operation but must work in a discontinuous way only when the energy source is present and its level is high enough to allow the system to be powered. HSU systems, on the other hand, use some form of energy storage (batteries or supercapacitors) to store the scavenged energy to allow a continuous operation of the sensor system. HU systems, due to the lack of energy storage, are very interesting but, at the moment, most of the developed sensor systems powered by energy harvesting belong to the HSU type. Examples of HU systems are for example those exploiting the energy generated by heel strike or push of a button to send a code.
The paper is organized as follows: in Section 2 the power management techniques used for energy harvesting are reviewed, in Section 3 different transduction principles for energy harvesting and related applications for mobile systems and WSNs are presented, in Section 4 a discussion on open areas of research and challenges associated with energy harvesting for wireless sensor networks and mobile devices is presented. Finally, conclusions are drawn in Section 5.
2. Power Management Techniques
In the case of electronic sensor systems powered by energy harvesting, a power management circuit is needed to interface the energy harvester with the electronic circuits devoted to sensing, processing and transmitting the processed data. In fact, the electrical energy provided by the energy harvester is often characterized by voltage, current and power levels that are not suitable to directly supply the electronic system. Moreover, due to the discontinuous nature of scavenged energy sources, the power management circuit must sense the harvested power level and eventually switch to an idle state when such power level is not high enough (i.e., for example when the power consumed by the management circuit is higher than the scavenged power).
The schematic of a typical mobile sensor system powered by energy harvesting is presented in Figure 1. The energy source is scavenged by the energy harvesting transducer and converted to electrical energy that, however, can not be used in the current form to power the electronic system. The power management circuit provides the functionality to charge the storage device (rectification, DC/DC conversion, charging circuit) as well as to optimize the harvesting operation to maximize the harvested power (maximum power point tracking circuit). The energy in the storage device (battery or supercapacitor) is then fed to a voltage regulator that provides a stable DC voltage to be used to operate the processing unit (microcontroller), the analog to digital (ADC) converters (often integrated inside the microcontroller), the sensors as well as the wireless communication system.
Different energy sources provide different electrical signals, thus the power management circuit must be designed for the considered energy source. For example, piezoelectric and RF energy sources generate an AC voltage that must be rectified, while this is not needed in the case of solar, thermoelectric or biofuel energy sources that generate a DC voltage. The simplest circuit that can be used for the rectification of the AC voltage generated by a piezoelectric transducer is a diode bridge rectifier (shown in Figure 2). Schottky diodes are usually used due to their low voltage drop. To further reduce the voltage drop and thus increase the converter efficiency, diodes can be replaced by CMOS switches.
While for piezoelectric transducers the frequency of the generated voltage is in the range of few Hz in the case of human motion and in the range of kHz for vibrations of industrial machines, in the case of RF transducers the generated AC voltage features a frequency ranging from hundreds of kHz to GHz. Thus, in the case of RF energy harvesting, the rectification diode bridge circuit strongly degrades the conversion efficiency. A better solution for the rectification of AC signals generated by RF transducers has been proposed by Umeda et al. [49].
The generated DC voltage (after the eventual rectification) is unregulated since the power level scavenged from the energy source is variable with time. Thus a DC/DC converter is needed to generate a regulated DC voltage that can be stored in the storage device. The voltage level obtained with different energy sources is different: for example, solar panels provide decent voltage levels, piezoelectric transducers generate AC signals with high voltage and low current, while thermoelectric transducers generate DC voltages of very low levels. Thus different configurations for the DC/DC converter (buck, boost or buck-boost) must be used for different energy sources: buck regulators are characterized by high efficiency but the generated output voltage can not be higher than the input voltage; boost regulators, on the other hand, are not as efficient as buck regulators but the generated output voltage can be higher than the input voltage, thus are used in the case of energy harvesters that generate a low DC voltage (such as solar and thermoelectric transducers). Different topologies of DC/DC converters exist that are characterized by different performance [50]. In Figure 3 the schematics of three DC/DC converters are shown: a buck converter (a), a boost converter (b) and a buck-boost converter (c). In the case of the minimum phase boost converter shown in Figure 3b, the circuit works as follows: during the first phase the switch S is closed and the inductance is charged, while in the second phase the switch is open and the energy stored in the inductor is transferred to the load. The diode D is used to avoid the energy backflow to the input source. In Figure 4 the waveforms for the output voltage VOUT and the inductor current IL for the boost converter of Figure 3b are shown as function of time. The waveforms have been obtained by simulating the circuit with Spice under the following conditions: VIN = 1.5 V, L = 10 µH, C1 = 200 nF, resistive load of 50 kΩ and switching frequency of 200 kHz. Charge pump circuits based on switching capacitors can also be used to generate a stable DC output voltage from very low input voltage levels. This is for example the case of thermoelectric generators, where the generated DC voltage is usually characterized by very low voltage levels that are often not suitable as input signal to a DC/DC converter. Charge pumps based on switching capacitors are also very attractive in the case of low-power mobile systems since do not use bulky components such as inductors and can be designed using a CMOS process with benefits in terms of occupation area. The working principle of switching capacitors-based charge pumps is the charge distribution between different capacitors by means of a set of switches that are driven by digital signals. A review of different switching capacitors-based charge pump topologies is presented in [51]. A simple example of such type of circuit, capable to generate an output voltage VOUT that is two times higher than the input voltage VIN, presented in [52] is shown in Figure 5. The voltage conversion is performed in two different phases. In the first phase the switches S1 and S2 are set as in the figure and the capacitor C1 is charged with the voltage VIN. In the second phase the switches S1 and S2 change position with the capacitor C1 in series with the input power source and sharing its charge with the capacitor C2. The waveforms of the voltage signals in the circuit are presented in Figure 6 in the case of VIN = 1.5 V, C1 = C2 = 200 nF, resistive load of 50 kΩ and switching frequency of 200 kHz.
For the energy storage unit two different devices are normally used: batteries and supercapacitors. Batteries can be produced using different technologies: sealed lead acid (SLA), nickel cadmium (NiCd), nickel metal hydride (NiMH) and lithium ion (Li-ion). As discussed by Sudevalayam and Kulkarni [53], NiMH and Li-ion batteries are the best choice for energy harvesting-based mobile systems. These battery technologies have both advantages and disadvantages. Li-ion batteries have high energy density and moderate self-discharge rate, do not suffer from memory effects due to repeated partial recharge after discharging but need complex circuits to handle the battery recharge. NiMH batteries, on the other hand, suffer from memory effects and their charging efficiency is lower than Li-ion batteries, however they can be directly connected to the harvesting source without the need of complex charging circuits. Supercapacitors are another option for the energy storage element. Supercapacitors are double-layer capacitors featuring very high value for the capacitance but low voltage limit. Supercapacitors have the advantage of almost infinite charge-recharge cycles and high power density (thus are suitable for applications where high current must be provided in a very limited time) but feature low energy density and are characterized by high leakage current (thus are affected by fast discharge rate). Sometimes, energy harvesting systems are designed to integrate two different storage elements, such as the system presented by Jiang et al. in 2005 [54], where two supercapacitors in series are used as primary buffer and a Li-ion battery as secondary buffer, thus exploiting the advantages of both types of storage elements.
The scavenged energy is also function of the operating conditions (voltage, current, impedance) of the energy harvester. Thus, the power management often includes circuits to maximize the scavenged power. These circuits are referred as maximum power point trackers (MPPTs) and are devoted to continuously set the transducer operative conditions to maximize the extracted power. Not all embedded systems powered by energy harvesting use a MPPT to maximize the extracted power since, even if this can increase the power conversion efficiency, MPPT circuits power consumption can be non-negligible in the case of low power systems. Such circuits have been developed in particular for harvesters with a DC output voltage (in particular for solar energy) but, recently, MPPT circuits have been also proposed for mechanical transducers [55,56] and RF energy harvesters [57]. MPPT can be implemented in hardware by dedicated circuits or in software [58]. In the case of large solar panels that scavenge many Watts of power, MPPT is generally implemented by dedicated DSP processors that are in charge of the estimation of the optimum operative conditions. In the case of small energy harvesters devoted to supply low-power electronics, however, this solution is not feasible since the high power consumption of the DSP is not acceptable for the low levels of scavenged energy in these cases. Alternative solutions have been proposed for MPPT circuits that require low power levels for operation. The most popular MPPT strategies for energy harvesting systems belong to three different groups: Hill Climbing methods [59], Fractional Short Circuit Current (FSCC) methods [60] and Fractional Open Circuit Voltage (FOCV) methods [61]. Hill climbing MPPT methods continuously track the transducer voltage and current and control the DC/DC converter to keep the harvester at its MPP. These methods are accurate and do not require knowledge of the harvester characteristics. Hill climbing MPPT methods are very popular in case of high-power harvesting systems but are very demanding in terms of power consumption thus degrading the system efficiency in the case of low power systems. In the case of low power systems, MPPT based on FSCC and FOCV methods are much more suitable since they are less demanding in terms of power consumption and can also be implemented using analog circuits without the need of a dedicated microcontroller. MPPT methods based on FSCC and FOCV normally disconnect the harvester from the system for a short time to measure the short circuit current or open circuit voltage, respectively, since these values are known to be proportional to the transducer current and voltage at MPP. As discussed in [62], the open circuit voltage changes much less than the short circuit current with variations of light intensity, thus MPPT methods based on FOCV are the most popular in the case of harvesting systems in the mW range. The standard way to implement MPPT in an energy harvesting system is using a low-power microcontroller as shown in Figure 7. The photovoltaic cell voltage and current are monitored by the microcontroller and the duty-cycle of the DC-DC converter is controlled to guarantee that the photovoltaic cell operates at MPP. For example, Everlast is a solar energy harvesting system that stores the harvested power on supercapacitor and optimize the scavenged power with a MPPT algorithm based on FOCV that is run on a microcontroller [62]. The main drawback of such system is that as long as the MPPT algorithm is run, the microcontroller must be in active state and this results in high power consumption. A better solution was implemented in Ambimax, a system that harvests energy from multiple sources and stores the scavenged energy on supercapacitor [63]. It does not need a microcontroller since the MPPT strategy is implemented by analog circuits that use a photodiode to sense the current light level and estimate the optimal working conditions. A further improvement of this strategy was proposed by Brunelli et al. in 2008 who presented a solar based energy harvesting system with MPPT for low power applications [64]. In this case the optimal operative conditions are determined using a pilot solar cell and its open circuit voltage used to modulate the duty cycle of the buck power converter. The conceptual diagram of this MPPT circuit is presented in Figure 8. The main advantages of such implementation are the low power consumption due to the use of analog circuitry (i.e., it does not need a microcontroller for MPPT) and the use of a secondary pilot cell that results in lower power consumption if compared with the photodiode used in Ambimax. Moreover, this solution does not need the solar cell disconnection from the system during the determination of the cell open circuit voltage.
Commercial devices for power management of harvested energy are also available from different companies. The S6AE101A by Cypress Semiconductor (San Jose, CA, USA), for example, is a power management integrated circuit for solar energy: the device embeds a multiplexer to switch the energy source between a primary battery and the solar harvester, features a current consumption of only 250 nA and a start-up power of only 1.2 µW and stores the generated power on capacitors. The LTC3588-2 by Linear Technology (Milpitas, CA, USA) integrates a low-loss full-wave bridge rectifier with a high efficiency buck converter to harvest energy from piezoelectric sources. The device provides four output voltages (3.45 V, 4.1 V, 4.5 V and 5.0 V) with up to 100 mA output current and stores the scavenged energy on Li-ion and LiFePO4 batteries as well as supercapacitors. The LTC3107 by Linear Technology (Milpitas, CA, USA) is a power management circuit for thermal energy sources that, using a compact step-up transformer, allows the system to work from input voltages as low as 20 mV. The integrated circuit provides an input for a primary battery and the output voltage (from 2 V to 4 V) is adapted to the battery voltage. The ADP5091 and ADP5092 by Analog Devices (Norwood, MA, USA) are power management circuits to scavenge energy from solar and thermal sources, feature an input voltage range from 80 mV to 3.3 V, a 150 mA regulated output in the range from 1.5 V to 3.6 V and integrate a MPPT control circuit to maximize the scavenged power.
3. Energy Harvesting Sources and Applications to Mobile Systems
In this section different energy sources that can be scavenged to power mobile sensor systems and wireless sensor network nodes will be discussed. Such energy sources are: photovoltaic energy that can be harvested by photovoltaic cells exploiting indoor or outdoor light sources; mechanical energy that can be scavenged by electromagnetic, electrostatic or piezoelectric transducers; thermal energy that can be scavenged from thermal gradients using thermoelectric transducers; radio frequency (RF) energy that can be exploited with two different working principles (RFID, where RF energy source is provided by a dedicated device and the case where the source power is scavenged from RF sources naturally present in the environment); biochemical energy where biofuel cells are used to transform the chemical energy associated with living functions to electrical energy. For all energy sources, the related applications will be presented. Finally, examples of mobile electronic systems powered by multiple energy sources will also be discussed.
3.1. Photovoltaic Energy
Photovoltaic energy is the natural energy most used in electronic systems powered by energy harvesting, since it features higher power levels if compared with other energy sources, in particular in the case of outdoor applications. The transducer used to scavenge energy is the photovoltaic cell, a device that can generate electrical power from the incident light. The level of scavenged power is function of the operative conditions, such as light intensity, temperature, angle of incidence but also the particular source of light. Different light sources (sunlight, incandescent light bulb, fluorescent light, LED) are in fact characterized by differences in the electromagnetic spectrum. Sunlight features a significant component in the infrared region, while light sources used for indoor lighting feature a spectrum mostly confined in the visible region. Thus, photovoltaic cells designed for outdoor applications are in general characterized by low efficiency conversion if used for indoor applications. As discussed by De Rossi et al. in 2015, photovoltaic cells built with polycrystalline silicon are characterized by high efficiency only for outdoor applications, while amorphous silicon devices and dye solar cells can be efficiently used, depending on the device technology, for outdoor or indoor applications [65].
From an electrical point of view, the photovoltaic cell behaves as a current source with a voltage limiter and can be modeled with the equivalent circuit of Figure 9, where I1 is the generated current that is function of the incident light level, D is a diode modeling the pn junction of the cell while Rs and Rp are resistances characteristic of the device that account for losses and leakage currents [66]. The current (IPV) and voltage (VPV) of the photovoltaic cell can be determined from the analysis of the equivalent circuit and are described by the following equation:
where Is is the diode dark saturation current, q the electron charge (1.60217657∙10−19 C), k the Boltzmann constant (1.380648813∙10−23 J/K), T the temperature in Kelvin scale and n is the diode emission coefficient that is equal to 1 for an ideal diode. A photovoltaic cell is characterized by two important parameters: the open circuit voltage (VOC), that is the voltage VPV when IPV = 0, and the short circuit current (ISC), that is the current IPV when VPV = 0. The voltage VOC is almost independent of operative conditions, while the current ISC is function of such conditions and, in particular, of the incident radiation level. In Figure 10 the characteristics of a photovoltaic cell (IPV vs. VPV and generated power vs. VPV) have been determined by simulating the equivalent circuit of Figure 9 for different values of the incident radiation with the following conditions: Is = 10−15 A, VOC = 651 mV, Rs = 15 Ω, Rp = 250 Ω, T = 25 °C. As can be seen, the short circuit current ISC and the maximum generated power both increase with the level of the incident radiation. However, the voltage VPV at which the maximum power can be scavenged is also function of the light level (as well as other operative conditions) and this is the reason why MPPT circuits are used to optimize the photovoltaic cell operative conditions to maximize the extracted power.
3.2. Photovoltaic Energy Applications
Many commercial products exist that exploit light energy to power the electronic circuits, such as wristwatches [67] and PC keyboards [68]. Many mobile sensor systems powered by photovoltaic cells have been also discussed in the literature. In 2005 Raghunathan et al. presented Heliomote, an off-the-shelf sensor node that scavenges energy from solar cells and can be interfaced with Berkeley/Crossbow sensor nodes [69]. The system uses solar panels from Solar World Inc. (Bonn, Germany, EU) 4-4.0-100 with a rated open circuit voltage of 4 V and a short circuit current of 100 mA. No MPPT control circuit was integrated, but the energy harvester was directly connected to two NiMH batteries and since the battery voltage varies between 2.2 V and 2.8 V, such voltage was close to the optimal voltage of 3 V, thus achieving good performances. A DC-DC step-up converter was used to generate the 3 V voltage to power the sensor node. The Heliomote board efficiency was reported between 80% and 84% with a harvested power of 198 mW. Musiani et al. proposed a wireless structural health monitoring system powered by solar panels in 2007 [70]. The system uses PZT transducers as actuators to generate vibrations on the structure to be monitored and as sensors to measure the transmitted vibrations. A low power microcontroller (ATMega128L, Atmel, San Jose, CA, USA) coordinates all the activities and an high performance DSP (TMS320C2811, Texas Instruments, Dallas, TX, USA) is used for the measurements analysis. The power supply is provided by an array of solar cells that can provide a maximum power of 360 mW in sunny conditions. The scavenged energy is stored in supercapacitors (total capacity 250 F). The reported average scavenged energy in a single day is 780 J. Solar energy has been also widely used to power wireless electronic systems for wild animals tracking. One of these systems (ZebraNet) was presented by Zhang et al. in 2004 [71]. ZebraNet was used to track the migration paths of zebras at the Mpala Research Center in Kenya. The system is integrated inside a collar to be applied to the animals. On the surface of the collar there are 14 solar modules, connected in series in sets of three cells, each providing a maximum of 7 mA at 5 V. The scavenged energy is used to charge a 2 Ah Li-ion battery that provides the power supply for the system. Overall, the reported harvested power is 0.4 W in full sunny conditions. The system integrates a GPS unit (GPS-MS1E, U-Blox, Thalwil, Switzerland) to track the animals position and a radio transmitter/receiver (9XStream, Digi International, Hopkins, MN, USA) covering a maximum range of 5 miles to transmit the measured data. A similar system (TurtleNet) was proposed by Sorber et al. to track the position of Gopher Tortoises [72]. The energy is scavenged using a solar cell that provides 90 mW at 4.2 V and stored on a 250 mAh Li-ion rechargeable battery. The reported scavenged energy in a 10 day period ranges from 0.1 kJ to more than 1.7 kJ. Loreti et al. in 2019 presented an electronic system powered by solar modules to track the position of pink iguanas (Conolophus marthae) [73]. The system integrates a CC1310 chip (that embeds a microcontroller and a wireless communication system), a set of sensors (ADXL345 accelerometer, Analog Devices, Norwood, MA, USA, temperature and humidity sensor, HDC1008, Texas Instruments, Dallas, TX, USA and VEML6070 UV light sensor, Vishay, Malvern, PA, USA), a GPS module for position tracking, a 1GB flash memory to store the acquired data and a SE2435L RF front-end module (Skyworks, Irvine, CA, USA) to improve the range of communication. The harvested energy is stored on two supercapacitors in series (1.2 F 5.5 V CAPX HS230) and the whole system is inserted in a protective box and glued to the animal by synthetic resin. A solar energy harvesting system to power nodes of a wireless sensor network for studies of hydrological cycles in forest watersheds was proposed by Teneja et al. in 2008 [74]. The sensor node embeds sensors to measure total solar radiation, photosyntetically active radiation, temperature and relative humidity. The harvester is a 4 V 100 mA solar panel from Silicon Solar Inc. (Bainbridge, NY, USA) that is capable to generate 139 mWh of energy in 30 min of sunlight. The scavenged energy is stored in two 2500 mAh NiMH batteries that are trickle charged without any MPPT circuit. Minani et al. presented in 2007 the Solar Biscuit, a wireless sensor network powered by solar panels that makes measurements of temperature and humidity for environmental monitoring [75]. The system is based on the PIC 18LF452 microcontroller (Microchip Technology, Chandler, AZ, USA) and makes wireless transmissions using the CC1000 RF module (Texas Instruments, Dallas, TX, USA). The sensor node is powered by a 5 cm × 5 cm solar cell by Shell Solar, (Hamburg, Germany, EU) that is capable to provide a power of 70 mW in sunny conditions. The system uses the harvest-use principle and does not embed any battery. Instead, the solar cell charges a double layer 5 V 1 F supercapacitor and, when the stored energy is sufficient (voltage level 3.675 V), the system makes a measurement and transmits the data. The system features different operative modes such as ordinary mode, where data measurement and transmission can be delayed depending on the stored energy level, and emergency mode that is activated when anomalous data are measured and allows quick transfer of the information. In 2007 Stanley-Marbell and Marculescu presented a mobile system powered by solar energy [76]. The system is designed on a six layers PCB board that integrates the energy scavenging system, the sensors and all the electronics. It is based on the low-power microcontroller MSP430F1232 (Texas Instruments) and integrates four different sensors: a programmable color detector, a microphone, a two-axis accelerometer and a temperature sensor. The default communication is a multi-channel wired interface implemented on a XC2C32A complex programmable logic device (Xilinx, San Jose, CA, USA) but a wireless communication interface can also be added. The energy harvesting system is based on an array of PIN photodiodes and charges a 3.4 V 0.2 F supercapacitor through a switching boost converter (TI TPS61070). The supercapacitor storage can also be remotely charged using a 850 nm infrared laser. The reported charging times of the supercapacitor are 5 h in sunny conditions and 5 min using the laser. The Prometheus energy harvesting system was presented in 2005 by Jiang et al. [54]. The system uses a 37 × 82 mm solar panel to scavenge energy and power a Berkeley’s Telos mote. The harvested energy is stored using two different energy buffers: two 5V 22F supercapacitors in series as primary buffer and a 200 mAh Li-ion battery as secondary buffer. The system features an advanced power management system where the primary buffer is normally used and the secondary buffer is used only when the supercapacitor is discharged with no possibility to scavenge energy from solar radiation. In this way the battery charge/discharge cycles are limited, thus increasing the system lifetime. According to the authors, the solar panel can generate 40 mA at 4.8 V under direct sunlight and the expected system lifetime is 43 years at duty-cycle 1%, 4 years at duty-cycle 10% and 1 year at duty-cycle 100%. A solar panel- based energy harvesting system was also proposed by Brunelli et al. in 2009 [77]. The solar panel is a 112 cm2 photovoltaic module that can generate a power of about 50 mW. The integrated DC-DC converter is a LTC3401 (Analog Devices, Norwood, MA, USA) and the scavenged energy is stored on a 50 F supercapacitor. The system uses the MPPT circuit discussed in [64], that allows a global efficiency of 80%. The scavenged energy is used to power a commercial platform for WSNs called Tmotesky, that integrates up to seven sensors, a wireless communication system and is characterized by a peak power consumption of 90 mW. A solar energy harvester to power a Tyndall sensor node in indoor environments was proposed by Wang et al. in 2010 [78]. The selected transducer is a commercial amorphous silicon solar cell (AM1815 by Sanyo, Osaka, Japan). The power management circuit, whose power consumption is less than 50 µW, consists of a Schmitt trigger-based MPPT circuit that maintains the cell voltage in the range 2.6–3 V (close to the maximum power point voltage of 2.81 V) and a DC/DC converter (TPS61220) that stores the scavenged power in a 10 F supercapacitor. The load is a Tyndall sensor node that integrates different sensors (including temperature and humidity sensor, accelerometer and light sensor) and transmits the measured data via 2.4 GHz ZigBee channel. In 2012 Yu and Yue presented an energy harvesting system based on solar cell that is suited to scavenge solar energy in indoor conditions [79]. The system integrates a solar cell of few cm2 capable to provide a power of 72.74 µW and a sensor node embedding a temperature and humidity sensor that consumes 105 mW for each operative cycle of about 620 ms. The scavenged power is optimized thanks to the integrated MPPT circuit that works on the fractional open circuit voltage principle. Mabon et al. in 2019 presented a solar energy harvester to power an outdoor sensor node [80]. The developed system integrates a 7.4 cm × 5.5 cm (40.7 cm2) solar panel that scavenges energy from sunlight and stores the harvested power in two different storage elements, a 35 mAh LiPo battery and a 220 mF supercapacitor. The power management circuit is realized with the commercial device SPV1050 that implements a MPPT algorithm and allows input voltage levels between 150 mV and 18 V. The processing section of the system is based on the CMWX1ZZABZ-078 chip (Murata Electronics, Kyoto, Japan) that integrates a STM32 microcontroller (ST Microelectronics, Geneva, Switzerland), a Lo-Ra wireless communication module and an impedance matching line. The system microcontroller is also interfaced with a temperature and humidity sensor and a pluviometer. In-the-field experiments have shown that the proposed system can operate more than two days without harvesting any energy. Mathews et al. in 2019 proposed a solar energy harvesting system to power a wireless temperature sensor [81]. The authors used a 1.84 eV perovskite photovoltaic cell to build the solar transducer. By connecting three cells in series, an output power of 14.5 µW with an efficiency of 13.2% was reported. The solar harvesting system was successfully used to power a temperature sensor with RF-backscatter wireless communication. The solar power source allows the system to make temperature measurements at time intervals of 1.24 s and a communication range of 5.1 m. Batista et al. in 2019 presented an energy harvesting system using organic photovoltaic cells to power indoor wireless sensor nodes [82]. A power management circuit was designed using 0.13 µm CMOS technology that features a DC-DC boost voltage converter based on switching capacitors. The harvesting system was tested using a solar simulator (Sol 3A, Oriel, Cairo, Egypt) as well as different indoor light sources (35 W halogen, 3.5 W LED, 5 W LED, 7 W LED) positioned at different heights (0.45 m, 0.26 m and 0.11 m). The results have shown that a maximum output power of 0.14 mW can be generated with efficiencies in the range from 45% to 70% depending on the particular light source. Moon et al. in 2019 developed an energy harvesting system based on GaAs photovoltaic cells to power a wireless temperature sensor node [83]. A photovoltaic module with eight cells in series was built (255 µm × 595 µm) that features an efficiency greater than 26% in presence of near-infrared light source (850 nm at 1 µW/mm2). The photovoltaic module provides an output voltage of about 5 V that allows the transducer to directly charge a battery without the need of boost DC-DC conversion. The photovoltaic module was integrated inside a wireless temperature sensor node that features a 16 µAh thin-film lithium ion battery that can be fully charged in 2 h under indoor light source at 110 lux. The photovoltaic module generates an output power of 70.8 nW under illumination at 200 lux that is enough for temperature measurements every 30 min (28.4 nW).
A summary of the mobile systems powered by photovoltaic modules is presented in Table 2.
3.3. Electromagnetic Transducers
Electromagnetic transducers exploit the principle of electromagnetic induction to generate electrical power, that is a voltage in the circuit is generated when the linked flux of the magnetic field changes with time. A schematic representation of an electromagnetic transducer is shown in Figure 11.
A permanent magnet is connected to the housing with a spring. When the transducer housing is subjected to mechanical vibrations, the magnet starts to vibrate at a resonant frequency that is characteristic of the mass-spring-damper system. The magnetic field flux linked to the electrical coil changes with time at the resonant frequency and thus an AC voltage is generated at the terminals of the electrical coil. Given VH is the AC voltage generated at the terminals of the coil, N is the number of coil turns and Φ is the magnetic field flux linked to the coil, it is:
Electromagnetic transducers are robust and feature high output currents but low output voltages.
3.4. Electromagnetic Transducers Applications
Many examples of electromagnetic transducers to power mobile electronic systems have been reported in literature. An electromagnetic energy harvester integrated inside a backpack to power wearable sensors was presented by Saha et al. in 2008 [84]. The transducer is made with two fixed magnets at the ends of a tube and a moving magnet in the middle of the tube. A coil is present near the middle of the tube. The vibrations produce movement of the moving magnet, thus inducing a voltage inside the coil. The system was tested in conditions of walking and slow running and the generated power was between 300 µW and 2.5 mW. A similar device was proposed by Rome et al. in 2005 [85]. The system exploits the fact that a walking person moves with vertical oscillatory motion with a displacement of about 5 cm. The backpack is provided with springs that allow the load inside to oscillate and thus generates electricity by electromagnetic induction. According to the authors, a maximum power of 7.4 W can be extracted when the backpack has a load of 38 kg. Litwhiler and Gavigan in 2014 presented an electromechanical energy harvester integrated in a door that scavenges the mechanical energy of door opening/closing to power a card based electronic padlock [86]. The transducer consists in a gear motor installed in the door axis. When the user opens and closes the door the transducer generates an AC voltage that is rectified and fed to a boost DC-DC converter to generate the 9 V DC voltage needed to operate the electronic padlock. The scavenged energy is stored in four 2.7 V 10 F supercapacitors. According to the authors, a single door opening/closing action can generate an energy of 3.9 J that is sufficient to operate a single unlock operation of the electronic lock system (0.8 J). An electromagnetic energy harvester that scavenges power from the suspension vibration in a car due to road surface roughness was presented by Li et al. in 2013 [87]. A prototype of the transducer has been built and tested both in a laboratory environment and on the road. Road tests have shown that, when the car speed is 48 Km/h, a peak power of 68 W and an average power of 19 W can be generated. An electromagnetic energy harvester was proposed by Trapanese in 2008 that scavenges power from sea waves [88]. The proposed system rectifies the obtained AC voltage to store it in a storage element, then a DC-AC converter makes a further conversion to use it in power grids. The generated power has been estimated by the author in the range of kWs. Another electromagnetic energy harvester was discussed by Cassidy et al. in 2011 [89]. The transducer consists of a backdriven precision ballscrew, which is coupled to the shaft of a three-phase, permanent-magnet synchronous machine. It is used to scavenge energy from vibrations of large structures such as buildings and bridges that feature frequencies in the order of 1 Hz or below. According to the authors, the estimated scavenged power can be over 100 W. Halim et al. in 2015 presented an electromagnetic energy harvester that scavenges power from human hand shaking to power portable and wearable devices [90]. The transducer consists of a tube with a non-magnetic ball in the middle and two cylindrical magnets connected to helical springs at the ends. The hand shaking produces a low-frequency (2.5–6 Hz) oscillation of the ball that transfers its kinetic energy by impact to the magnets producing vibrations at higher frequency. This higher frequency vibrations are used to generate the electrical voltage to power the wearable devices. According to the authors, the average power generated by hand shaking at a frequency of 5.17 Hz and acceleration 20.2 m∙s−2 is 2.15 mW. A similar approach was exploited by Halim et al. in 2017, who proposed an electromagnetic energy harvester that scavenges power from human arm swing during walking [91]. The transducer consists of a dual eccentric rotor structure (containing magnet pole-pairs) and an array of coils in the middle. A prototype of the harvester was built and tests have shown that an average power of 55 µW can be scavenged from arm swings of frequency 1.25 Hz and rotational amplitude ± 25°. Zorlu et al. in 2011 presented an electromagnetic transducer to scavenge power from external low-frequency vibrations [92]. Since the harvesting efficiency is proportional to the vibration frequency, the authors have designed a frequency-up conversion method that transforms the external low frequency vibrations (10 Hz) to higher frequency (394 Hz). The system is made of a permanent magnet on a diaphragm and a cantilever with an attached coil. The magnet vibrates at the external frequency of 10 Hz and, when it collides with the cantilever, induces a vibration at higher frequency (394 Hz). According to the authors, the system can scavenge an output power of 544.7 µW at a voltage of 88.6 mV.
A summary of the mobile systems powered by electromagnetic transducers is presented in Table 3.
3.5. Electrostatic Transducers
Another possibility to transform mechanical energy in electrical energy is with an electrostatic harvester. An electrostatic transducer is essentially a variable capacitor whose plates are isolated by air, vacuum or another type of insulator. The conversion of mechanical to electrical energy is carried out with changes in the transducer capacitance. The capacitance CH of a parallel plate capacitor can be expressed as:
where ε0 is the free space permittivity, εr is the relative permittivity of the insulator, S is the plates area and l is the distance between plates. Thus, changes in the transducer capacitance can be induced by changes in the insulator permittivity, overlap plates area or distance between capacitor plates.
An electrostatic transducer can work in two different ways: charge constrained transduction (where the charge on the capacitor plates is fixed) or voltage constrained transduction (where the voltage difference across the capacitor is fixed). In Figure 12 a simplified schematic of the circuit used for charge constrained electrostatic transduction is presented [94]. At the start of the conversion, the capacitor C0 is charged with the charge Q0 (for example using an external power supply) while the transducer capacitance CH is fully discharged. During this phase the switches S1 and S2 are open and the transducer capacitance is maximum (CH,max). In the second phase the switch S1 closes while S2 remains open. During this phase there is a charge redistribution between C0 and CH,max. Given that the voltage difference across both capacitors is the same, it is:
where Q′0 and Q′H are the charges stored on the two capacitors after the charge redistribution. From Equations (4) and (5) the charge Q′H can be calculated as:
If the two capacitances are chosen so that C0 >> CH,max, almost all charge Q0 is transferred to the transducer at the end of the charge redistribution. In the third phase both switches S1 and S2 are open and the mechanical energy is used to change the transducer capacitance value from CH,max to CH,min. Since the energy stored in a capacitor can be expressed as:
The decrease of the transducer capacitance (from CH,max to CH,min) with the capacitor charge being constant results in an increase of the stored energy. During the fourth and last phase of the conversion, switch S2 closes with switch S1 open and the energy stored in the transducer capacitance is discharged to the load.
The main drawback of electrostatic transducers is the need of an external power supply (for example a battery) to provide the initial charge for the capacitor C0. To make electrostatic energy harvesting more practical, an electret can be coated to one of the transducer plates. An electret is a quasi-permanent charged dielectric material that can provide charge due to electrostatic induction when there is a relative displacement between the electret and the capacitor plate. Common materials used for electrets are Teflon, CYTOP and SiO2. Electrostatic transducers are characterized by low cost materials and can provide high output voltages.
3.6. Electrostatic Transducers Applications
Different examples of electrostatic transducers used to power mobile devices have been presented in literature. Tashiro et al. in 2002 developed an electrostatic generator to power a cardiac pacemaker that scavenges power from the ventricular wall motion [95]. The transducer was built using a honeycomb-type variable capacitor whose capacitance is minimum (100 nF) when expanded and maximum when compressed (300 nF). The system was stimulated with a vibration simulator that simulates the ventricular wall motion. The scavenged power was found to be 36 µW and was successfully used to power a pacemaker implanted inside a canine heart for more than 2 h. An electrostatic energy harvesting device that scavenges power from blood pressure has been proposed by Deterre et al. in 2013 [96]. The transducer was investigated to power intra-cardiac implants and thus its dimensions were set to 6 mm diameter and 1 mm thickness. COMSOL simulations were carried out to investigate the optimal design to maximize the capacitance change and thus the scavenged power. The results have shown how an output power of more than 20 mJ per heart beat can be obtained. Ahmed and Kakkar in 2017 presented an electrostatic energy harvester for battery-less power of cardiac and neural implants [97]. The transducer has an active surface area of 2.5 × 3.5 mm2 and a volume of 0.4375 mm3. It features an angular electrode structure coupled with a SiO2 electret to maximize the capacitance variations and thus the generated power. The results have shown how an output power of 9.6 µW can be generated, corresponding to a power per unit area of 109.71 µW/cm2. Naito and Uenishi in 2019 presented an electrostatic energy harvesting system to power a tire pressure monitoring system [98]. The designed electrostatic transducer integrates a stacked film of SiO2/Si3N4 as electret material to provide the initial energy and scavenges the power from the vibrations of the tire in contact with the road surface. The harvester has been initially evaluated with the generation of sinusoidal vibrations at frequency 1.2 kHz and using a load resistance of 5 MΩ, resulting in a generated output power of 495 µW. Then, the transducer has been mounted inside a car tire to power a three-axis accelerometer. The results have shown how, in the case of car speed of 60 Km/h, the output power is 60 µW. An electrostatic energy harvester for wireless sensors node applications was designed by Torres et al. in 2008 [99]. The transducer scavenges energy from ambient vibrations by changing the capacitance of a variable capacitor. A battery is used to provide the initial energy for the variable capacitor (when the capacitance is maximum) and, after the transduction, the increased energy is given back to the battery. Experiments have shown that, during a single cycle of capacitance variation of 200 pF, the harvested energy is 9.7 nJ while the initial energy provided by the battery is 1.7 nJ, thus generating a net energy gain of 8 nJ. In the case of vibrations with frequency 200 Hz, this results in an average output power of 1.6 µW. Perez et al. in 2015 presented an electrostatic energy harvester that scavenges power from wind energy [100]. The airflow energy is first converted to mechanical energy using a wind turbine and then to electrical energy by means of an electret-based electrostatic energy converter coupled to the turbine. The turbine has a diameter of 40 mm and a depth of 10 mm while the system has a total volume of 12.5 cm3. The results have shown how a maximum output power of 200 µW can be achieved at wind speed of 10 m/s. An electrostatic energy harvester characterized by broad bandwidth and high normalized power density was proposed by Zhang et al. in 2018 [101]. The transducer has been fabricated from silicon wafers using advanced MEMS technology. It is composed of a top movable plate and a bottom fixed plate with a CYTOP polymer electret that provides the initial bias for the transduction. In a vacuum chamber (3 Pa pressure) the generated output power is 4.95 µW in the case of vibrations amplitude of 0.09 g. When subjected to random vibrations of frequencies 160 ± 12.5 Hz and acceleration 10.5 m/s2, the reported output power is 2.22 µW. The transducer has been successfully tested to power a wireless temperature sensing system that stores the scavenged energy on two 100 µF capacitors. Koga et al. in 2017 developed an electrostatic energy harvester to power wireless sensor nodes for health monitoring of civil infrastructures [102]. The transducer has been built using advanced MEMS technology on a silicon-on-insulator (SOI) wafer and features a potassium ions electret for internal biasing. Laboratory experiments have found a generated output power of 115 µW with a conversion efficiency of 80.7%. The transducer has been also tested with environmental vibrations on a viaduct of a highway: in this case a 44 µF capacitor has been charged to 14.7 V in 90 min, corresponding to a stored energy of 4.8 mJ that is sufficient to operate data transmissions using ZigBee technology.
A summary of the mobile systems powered by electrostatic transducers is presented in Table 4.
3.7. Piezoelectric Transducers
Mechanical to electrical energy conversion can also be achieved with piezoelectric transducers [103]. Piezoelectric materials are characterized by a non-symmetrical structure and, when a mechanical stress is applied, the structure of atoms deforms, thus generating electrical energy. The piezoelectric effect consists of two different phenomena: the direct piezoelectric effect, where an electric field is generated due to the application of a mechanical stress and the converse piezoelectric effect, where the crystal structure expands and contracts when electrical energy is applied to the crystal. Energy harvesting from mechanical energy exploits the direct piezoelectric effect.
The behaviour of a piezoelectric material can be described using the Hooke’s law [103]:
where D is the displacement of charge density, ε is the permittivity, E the electric field, S the strain, s the compliance and T the stress.
A simple model that accounts for both the direct and converse piezoelectric effect is:
where d is the piezoelectric coefficient.
Piezoelectric materials naturally present in the environment include quartz, Rochelle salt, topaz and tourmaline. Synthetic piezoelectric materials have been also developed with improved characteristics and can be divided in two different groups, piezoceramics and piezopolymers. Piezoceramics are polycrystalline materials with perovskite crystal structure that can be fabricated with a simple process that is compatible with MEMS fabrication. The most used piezoceramic material is lead-zirconate-titanate (PZT) that, however, is highly toxic due to the presence of lead. More recently, lead free piezoceramics have been developed, such as barium titanate (BaTiO3), that do not contain toxic compounds. Piezopolymers, on the other hand, are biocompatible electroactive polymers that are characterized by low manufacturing costs. One of the most used piezopolymer material is polyvinylidene fluoride (PVDF). Differently from piezoceramics, that are stiff, piezopolymers are flexible and light-weighted and thus are very interesting for wearable energy harvesting applications where power is scavenged from human motion. Piezoelectric transducers generate an AC output voltage with high voltage levels and low current levels. The scavenged power can be maximized by proper impedance matching with the load, that is the source impedance of the piezoelectric transducer must be the complex conjugate of the load impedance. While the conjugate impedance matching allows to maximize the extracted power, this is usually impractical since it requires an inductor of very large value. A sub-optimal but more practical alternative is the so-called resistive impedance matching where the controller tries to match the source impedance with a resistive load. The schematic of a cantilever piezoelectric transducer is presented in Figure 13.
3.8. Piezoelectric Transducers Applications
Different applications of piezoelectric energy harvesting systems have been presented in literature. A self-powered pushbutton controller was developed by Paradiso and Feldmeier in 2001 [104]. A piezoelectric pushbutton, featuring a maximum force of 15 N, a total activation energy of 30 mJ at the mechanical resonance of 50 kHz, was used to power a radio frequency transmitter (RFM HX1003, RF Monolithics, Dallas, TX, USA, operating at 418 Mhz) to send a 12 bits identification code when the button is pressed. The amplitude of the scavenged voltage is reduced with a 90:1 transformer and stored on a 4.4 µF capacitor after rectification. The energy stored on the capacitor is used to generate the 3 V regulated DC power supply for digital electronics. The scavenged energy for a single push is 0.5 mJ at 3 V after regulation. A widely investigated technique to scavenge energy using piezoelectric transducers is to exploit foot mechanical energy during walking. In 2001 Shenck and Paradiso at the MIT Media Laboratory integrated piezo transducers in the sole shoe in two different position: a PVDF stave under the foot ball and a PZT transducer coupled with a metal mid-plate under the heel [105]. Tests on the system at 0.9 Hz walking pace have shown how the scavenged power is 1.3 mW in the case of PVDF stave with a resistive load of 250 kΩ and 8.4 mW for the PZT transducer with a resistive load of 500 kΩ. The system has been used to power a radio frequency tag that transmits a 12 bits identification code during walking. The same research group also tested an electromagnetic generator integrated inside running shoes [93]. The electromagnetic transducer was realized by means of a lever pushed by the heel strike that activates a rotary magnetic generator. The generated output power was found much higher than the piezoelectric transducers (230 mW) but the transducer integration inside the shoe is also much more intrusive. A similar approach was proposed by Zhao and You in 2014 [106]. A multilayer PVDF film was integrated in the shoe using two different configurations. In the first configuration the PVDF film is between two plates made of engineered plastics and placed under the heel to scavenge the power from heel strike. In the second configuration three different PVDF films, sandwiched between plates made of silicon rubber, are placed in the shoe sole. The scavenged AC voltage is rectified and a DC stable voltage of 3.6 V is generated using a DC/DC converter (LTC 3588-1, Analog Devices, Norwood, MA, USA). The results have shown how, under step frequency of 1 Hz, the first configuration can generate higher output power (1 mW average with peaks of 4 mW), while the second configuration, even if it generates lower output power (about 120 µW), is more comfortable to the wearer. In 2010 Rocha et al. proposed an energy scavenging system embedded in the shoe sole to power sensor nodes [107]. The system exploits the combination of a piezoelectric β-PVDF polymer placed in two different points in the shoe sole and an electrostatic generator (with steady state capacitance of 20 pF) placed under the sole. The piezoelectric polymer output voltage is rectified using a Schottky diode bridge and used to charge the electrostatic generator that charges a Li-ion battery used to store the scavenged energy. Experimental results have shown how this system can generate 0.050 J of energy in 1 h when a load of resistance 180 kΩ is used. Oh et al. in 2010 presented a tree shaped system that scavenges power from wind [108]. The designed system resembles the form of a tree with the leaves made with flexible piezopolymer PVDF (LDT4-028K/L) and the trunk made with piezoceramic PZT (Q220-A4-503YB). The system has been investigated under different wind speed and the results have shown how an average power of 4 µW can be extracted from the PVDF leaves and 2.24 µW from the PZT trunk. The scavenged power is stored in a NiCd battery placed at the bottom of the structure. Granstrom et al. in 2007 presented a backpack instrumented with piezoelectric shoulder straps to power wearable sensors [109]. The authors replaced the standard shoulder straps of the backpack with PVDF polymer straps. Under a load of 444 N the harvesting system can generate AC voltages with peak of 100 V and an average output power of 45.6 mW. A piezoelectric energy harvesting system to scavenge power from the mechanical stress of car tires during driving was presented by Lee and Choi in 2014 [110]. The transducer is used to power a sensor system integrated in the car tires that measures different parameters, such as acceleration, temperature, pressure and strain, and transmits the measured data to a remote host via Bluetooth communication. The results have shown how the harvester can produce output voltages of 300 V peak and generates an average energy of 380 µJ for each rotation cycle in the case of an applied load of 450 kgf and a velocity of 60 km/h and an average energy of 200 µJ in the case of 300 kgf load and a velocity of 30 km/h. Under the assumption of matched load condition, the produced output power is 1.37 µW/mm3. Pisharody Harikrishnan in 2011 presented an energy harvesting application to integrate piezoelectric transducers in the floor to scavenge power from human walking [111]. The designed transducer was built from 96 PZT diaphragms connected in parallel and integrated inside a floor mat in 8 × 12 configuration. The power management system used two energy buffers to store the scavenged power: a 2.2 mF capacitor as primary storage element and two 1.2 V NiCd batteries in parallel as secondary storage element. The results have shown how the extracted power vs. applied force presents a logarithmic relation and tends to saturate for applied forces higher than 65 N. An output power of 10 mW was reported in the case of applied force of 60 N. A study on the feasibility to scavenge power from the kinetic energy of rainwater drops was presented by Viola in 2018 [112]. Three different piezoelectric transducers were considered (piezoelectric cantilever, piezoelectric bridge cantilever and piezoelectric transducer with floating circle) and their performance investigated under the same artificial rain conditions with variable raindrop heights (0.5, 1 and 2 m). Different rectifying circuits to transform the generated AC voltage in a DC voltage for electronic sensor supply were also considered and their efficiency compared. Doria et al. in 2020 discussed the feasibility of energy generation from the bicycle vibrations using a piezoelectric harvester [113]. The idea was to exploit the vibrations generated by the rolling motion of bicycle wheels on the rough road surface and experiments were carried out with piezoelectric transducers placed on the steerer tube and the seatpost. Since the results have shown how the vibrations power spectral density is concentrated in the frequency range <30 Hz, the piezoelectric transducers have been tuned using an auxiliary oscillator and a lumped mass to have their resonance frequency around 20 Hz. The results have shown that the generated power is function of the bicycle speed, with 0.531 mW at 10 km/h, 0.891 mW at 15 km/h and 1.977 mW at 20 km/h.
A summary of the mobile systems powered by piezoelectric transducers is presented in Table 5.
3.9. Thermal Energy
Temperature gradients can be exploited to scavenge energy to power embedded electronic systems. The working principle is based on the Seebeck effect, stating that a voltage is generated when a thermal difference is present between two different metals or semiconductors. The fundamental element of a thermoelectric generator (TEG) is the thermocouple, a junction of two different semiconductors, one doped with acceptors (p-type) and the other with donors (n-type), subjected to different temperatures (TH and TC, respectively the hot and cold temperatures). Since the voltage generated by a single thermocouple is very low, TEGs are built by connecting different thermocouples electrically in series and thermally in parallel. An example of thermocouple and its equivalent electrical circuit are presented in Figure 14. The generated voltage (VTEG) can be expressed with the following equation:
where n is the number of thermocouples in the TEG and αp and αn are the Seebeck coefficients for the p-type and n-type semiconductors of the thermocouple, respectively. The efficiency of a TEG is related to a dimensionless parameter called figure of merit:
where σ is the electrical conductivity, α is the Seebeck coefficient, κ the thermal conductivity and T the absolute temperature. To maximize the efficiency, TEG materials must be chosen to feature a good Seebeck coefficient, high electrical conductivity (to avoid power losses due to Joule effect) and low thermal conductivity (to reduce thermal losses in the thermoelectric material). This is, however, not easy since the parameters σ, α and κ are all coupled to each other. A lot of research on advanced materials for thermoelectric applications has been carried out [114,115]. One of the most popular thermoelectric material is bismuth telluride (Bi2Te3) but its major drawback is the relatively low maximum temperature at the hot side of the TEG. Better solutions have been obtained with alloys of Bi2Te3, Sb2Te3 and Bi2Se3. More recently, much interest has been attracted by organic polymers such as polyacetylene, polypyrrole and PEDOT, since these materials are characterized by low thermal conductivity, can reach high electrical conductivity if properly doped and have the advantage of being flexible and printable, thus making them good candidates for wearable TEGs to scavenge power from human heat [116,117]. Recent researches have also proposed hybrid organic-inorganic materials [118] as well as other complex thermoelectric materials [119].
The power generated by TEG is dependent on the operative conditions, thus MPPT circuits can be used to maximize the scavenged power. As can be seen in Figure 14, the TEG equivalent circuit can be modelled, as a first approximation, with an ideal voltage generator VTEG in series with the TEG internal resistance RG. When the TEG is connected to a resistive load RLOAD, the current in the circuit can be expressed as:
Thus the power transferred to the load is:
The derivative of the power PLOAD is:
Equation (15) shows how the power transferred to the load is maximum when the load resistance RLOAD is equal to the TEG internal resistance RG. This is shown in Figure 15, where a TEG with internal resistance RG = 902 Ω, composed of 12 thermocouples built with Bi0.5Sb1.5Te3 (p-type, αp = 0.53 mV∙K−1) and Bi2Se0.3Te2.7 (n-type, αn = −0.19 mV∙K−1) is simulated for a temperature difference TH−TC = 10 °C and plotted vs. the load resistance. As can be seen the generated power initially increases, reaches a maximum for the impedance matching conditions RLOAD = RG and then decreases. In Figure 16 the same TEG is simulated in the condition of impedance matching for different values of the temperature difference across the junction. As expected by Equation (14), the generated power increases with the square of the temperature difference. This quadratic relation is responsible for the fact that the generated power is non negligible when a temperature difference of tens of °C is present, while is very low in the case of temperature differences of only few °C.
3.10. Thermal Energy Applications
Different thermoelectric energy harvesting systems have been presented in literature. In 2010 Lu and Yang presented an automatic radiator valve based on ZigBee powered by a thermoelectric generator [121]. The energy is scavenged using a 30 × 34 × 3.2 mm TEG module composed of 127 thermocouples that allows a maximum temperature gradient of 77 °C. The TEG module was applied to the low part of a radiator and used to power a sensor node featuring a ZigBee communication system to control the radiator valve. The harvested energy was stored using two different storage buffers: two 2.3 V 10 F supercapacitors (primary buffer) and two NiCd batteries (secondary buffer). The power management system features a charge pump (S-882Z, Seiko Instruments, Tokyo, Japan) to generate 2.5 V from a TEG voltage of only 250 mV and a DC-DC converter (MAX757 by Maxim, San Jose, CA, USA). A harvested power of 150 mW was reported with a temperature difference of 34 °C between the hot and cold junctions of the TEG. A similar application was proposed by Nesarajah and Frey in 2017 [122]. In this case the thermoelectric generator was used to scavenge power from the thermal gradient that exists between the inside and the outside of pipes of an oil-fired heating system. The results have shown how peak thermal differences of about 90 °C can generate peak output power of 2 W. A thermoelectric generator exploiting the temperature gradients during an aircraft flight was presented by Samson et al. in 2011 [123]. A TEG was connected to the inner fuselage, close to the heat storage unit filled with 10 g of water. The temperature difference during flight (42.2 °C) was exploited to generate the energy, stored in a 2 F supercapacitor, to power a Texas Instruments MSP430 microcontroller and an IEEE 802.15.4 RF transceiver to acquire data from a sensor node in the aircraft. A DC-DC converter was used to generate the 3.3 V power supply of the digital electronics from the low DC voltage of the TEG. The harvested power was reported as 26.5 J in a 60 min short range flight. In 2016 Dias et al. proposed an autonomous soil moisture sensor powered by an integrated thermoelectric generator [124]. The TEG junctions were connected to the soil (cold junction) and to an aluminum panel exposed to the sun (hot junction). The sensor, integrated on the TEG, is a single heat pulse strobe (SHPS) that estimates the water content from the measured temperature variation induced by a heat pulse of known intensity and duration. The power scavenged from the TEG is fed to a DC-DC converter to generate a stable 1.8 V DC voltage and a TPS60140 charge pump is used to generate the 5 V DC for the heat pulse. The scavenged energy (reported as 34.1 J during a sunny day) is stored on a 3 F supercapacitor. Tests on the system reported an autonomy of 5 days if a single moisture measurement is made every day. Yun et al. in 2016 presented a thermoelectric energy harvester that scavenges energy from thermal gradients developed across insulation panels in buildings [125]. Vacuum insulation panels installed in buildings can increase thermal efficiency but absolute pressure must be monitored to detect possible leaks that strongly reduce the efficiency. The authors proposed to scavenge power from the thermal gradient across vacuum insulation panels by using a commercial TEG (OT08,32,F0T,0707, Laird Technologies, Chesterfield, MO, USA) to power a microcontroller (PIC12LF1840 by Microchip, Chandler, AZ, USA) based sensor system to measure the absolute pressure. The system embeds a commercial power management circuit device (LTC3108) that stores the scavenged energy on a 2 mF ceramic capacitor. The results have shown that the scavenged power is strongly dependent on the period of the year (in the winter season the thermal gradient is higher and thus is the scavenged power) and the system can generate an output power of 109 µW when a temperature difference of 15 °C is present. A thermoelectric energy harvesting system to power a sensor node for axle bearing degradation in railroad vehicles was presented by Ahn and Choi in 2018 [126]. The idea was to exploit the thermal gradient developing between the axle bearing housing and the environmental air to generate the energy to power the sensor node. A commercial TEG (TK-1-3-S, HTRD, Anyang, Korea) was used and field tests were carried out on a Korean railroad vehicle (HEMU-430X, Hyundai Rotem, Uiwang, Korea). The results have shown how the developed temperature difference (and thus the scavenged power) is time dependent with an average 19.3 mW of output power that can be generated when a temperature difference of about 15 °C is present. Mongia and Abdelmoneum in 2010 presented a study on the feasibility to scavenge power from the heat generated by mobile computing devices [127]. The investigation considered an average source power of 20 W, temperature differences of 50–75 °C, a 25–50% of the Carnot efficiency and concluded that about 300–600 mW can be the expected amount of power. Considering the typical power consumption of mobile devices (either powered by batteries or recharged by AC line), the extracted power has a relatively small impact (1%) on the total power consumption of the devices. In 2014 Shi et al. presented a self-powered wireless temperature sensor powered by thermoelectric module [128]. The system is composed of a commercial TEG (TEC12706, Hebei IT, Shanghai, China), built from 127 thermocouples, and a digital temperature sensor (DS18B20 by Dallas Semiconductor, Dallas, TX, USA). Since the voltage generated by TEG is proportional to the temperature difference, the hot junction temperature can be estimated by measuring the cold junction temperature by the digital temperature sensor. All the signal acquisitions, processing and transmissions are carried out by the ultra-low power wireless chip nRF24LE1 (Nordic Semiconductor, Trondheim, Norway) which integrates a microcontroller with A/D converter and wireless transceiver. The estimated generated power is 13–15 kW/m2. Much research has been carried out to exploit the warmth of human body to power wearable electronic systems. A wristwatch powered by thermoelectric module was commercialized by Seiko in 1998 [129]. The micro thermoelectric module has a size of 2 × 2 × 1.3 mm and is built from more than 50 thermocouples, each having a size 120 × 120 × 600 µm and realized with Bi-Te compounds. The thermoelectric module is capable to generate a power of 22.5 µW, much higher than the power requirements for the wristwatch (about 1 µW). The harvested voltage is fed to a DC-DC step up converter that generates the 1.5 V needed by the wristwatch and stores the generated energy in a 4.5 mAhr Li-ion battery. In 2014 Kim et al. presented a wearable thermoelectric generator that exploits human body temperature gradients to power wearable sensors [130]. The TEG was realized as a composite of fabric and thermocouples to be integrated in clothes. The thermocouples were realized with Bi0.5Sb1.5Te3 (p-type) and Bi2Se0.3Te2.7 (n-type). When tested in laboratory with a measurement setup an harvested power of 224 nW for a temperature difference of 15 °C was achieved. In the case of application on human body the harvested power was lower: 8.1 nW for a temperature difference of 7 °C and 146.9 nW for a temperature difference of 27 °C. Moreover, the harvested power was found to be affected by walking, producing an increase of the skin temperature due to convection that, in turn, increases the harvested power. Carmo et al. in 2010 proposed a thermoelectric micro-converter to power a mobile system composed of an electroencephalogram (EEG), the supporting electronics and a wireless communication system whose power consumption was estimated from hundreds of µW to few mW [131]. The thermoelectric module was built with more than 4000 thermocouples, each realized with Bi2Te3 (n-type) and Sb2Te3 (p-type), characterized by a thermal conductivity of 1.3 and 1.8 W∙m−1∙K−1, a Seebeck coefficient in the range 150–250 µV∙K−1 and an electrical resistivity in the range 7–15 µΩ∙m. Wang et al. in 2009 presented a wearable miniaturized thermoelectric generator for human body applications [132]. The authors developed a thermoelectric generator, integrated inside a wristwatch strap, composed of about 2000 thermocouples, each built using surface micromachined poly-SiGe technology and featuring a footprint area of 30 µm × 16 µm. Assuming the human body temperature of 37 °C and the ambient temperature of 22 °C, the resulting output voltage was 150 mV and the scavenged power 0.3 nW. Hoang et al. in 2009 presented a thermoelectric energy harvesting system to power a wireless sensor node to detect fall events [133]. The wearable thermoelectric generator, built using aluminium for the junctions and Teflon as insulator, can generate a power in the range 40–520 µW when thermal gradients in the range 3–15 °C are present. The sensor node is composed of a three-axis accelerometer (H34C by Hitachi), a power management circuit and a wireless communication system to transfer the fall event information to a remote host. Since the whole system power consumption is greater than 10 mW, the scavenged energy is stored in a capacitor and when the capacitor voltage exceeds 4.9 V a measurement is carried out and a wireless transmission is made in the case of event detection. A study on the energy generation from body heat to power wearable electronics was presented by Proto et al. in 2018 [134]. A commercial TEG (TESI-12704, Hebei IT, Shanghai, China) built from 127 Bi2Te3 thermocouples and having an area of 9 cm2 was placed in contact with human skin using a fabric band made of PVC and gauze. The thermoelectric generator was applied to four parts of the human body (two on the arms and two on the legs) and the generated power evaluated for four male volunteers performing different activities such as sitting, walking and jogging. The results have shown that the generated power depends on the performed activity and is in the range 5–50 µW with TEG placement on the legs providing better results, in particular when the subject performs locomotion activities. Xia et al. in 2019 developed a thermoelectric energy harvesting system for battery-less power of wearable wireless sensor nodes [120]. The selected transducer is a commercial TEG (GM200-71-14-16, European, Thermodynamics, Leicestershire, UK) and three of these TEGs were connected electrically in series and thermally in parallel and coupled to a heat sink using a thermal compound adhesive. The power management system was built using two commercial devices: a LTC3108 (Analog Devices Norwood, MA, USA) that is efficient at low voltage input levels (<150 mV) but lacks a MPPT control and a BQ25504 (Texas Instruments, Dallas, TX, USA) that is efficient at higher input levels (>150 mV) but features an integrated MPPT control. Through a set of switches the authors developed a power management circuit that is characterized by good efficiency and can work with input voltage levels as low as 20 mV. The scavenging system has been used to power a digital temperature and humidity sensor (SHT20, Sensirion, Stafa, Switzerland) and a ZigBee module (CC2530, Texas Instruments, Dallas, TX, USA) for wireless communication. The scavenged output power is function of the thermal gradient between the skin and the environment and, in the case of input voltage of 180 mV, the TEG generates 1.62 mW of power and 336.9 µW are stored in the rechargeable battery.
A summary of the thermoelectric energy harvesting systems is presented in Table 6.
3.11. RFID Tags
In this case a dedicated device (RFID reader) generates the RF energy source that is harvested by the RFID tag. RFID tags can be designed to work in different frequency ranges such as low frequency band (120–150 kHz), high frequency band (13.56 MHz), ultra-high frequency band (433 MHz, 865–868 MHz in Europe, 917–922 MHz in China, 902–928 MHz in the US) and microwave band (2.45–5.8 GHz and 3.1–10 GHz) [135]. The power transmission from the reader to the tag exploits two different approaches depending on the frequency range: in the case of near field RFID (<100 MHz) the power transmission is based on magnetic induction while in the case of far field RFID (>100 MHz) is based on electromagnetic wave capture [136]. The high frequency band is of particular interest since high-end mobile phones are often equipped with a Near Field Communication (NFC) transceiver operating at 13.56 MHz to allow smartphones to be used as reader devices for passive sensor tags. RFID tags have been initially used as an alternative to barcodes to identify objects and animals since they can store much more data and enable the identification from distance without the need of line of sight. However, the price per unit is significantly higher than standard barcodes and this has somewhat slowed their adoption in many market areas. More recently, RFID technology has attracted attention for its use as a means for business and transactions [137], mobile payments [138], as a virtual coupon system [139] and in tourism applications [140]. Another important field of application is to provide power to wireless sensor nodes. From the power point of view, an RFID tag can be classified in three different groups: active tags, passive tags and semi-passive tags. The schematics of the three tags are shown in Figure 17. Active tags integrate a battery and are characterized by longer range of transmission and higher processing power but are more expensive and have limited lifetime due to the presence of the battery. In active tags the radio communication from the tag to the reader device is powered by the battery. Passive tags, on the other hand, are battery-less and scavenge the power from the reader device. These tags are much less expensive, have much longer lifetime but can only operate when the reader device is in close proximity of the tag (from tens of cm to several meters depending on the device). In passive tags the radio communication from the tag to the reader device is achieved by load modulation for near field RFID and back scattering for far field RFID. The semi-passive tags are a sort of trade-off between the characteristics of the active and passive tags. Like the passive tags, they scavenge the power received from the reader device for data transmission, however they also integrate a battery to perform operations when the reader is not in proximity. An example of semi-passive sensor tags are the ones used to monitor some product parameters during its market life: measurements are carried out at regular time intervals thanks to the integrated battery and stored in a non-volatile memory. The stored data are then transmitted to the reader device when this is in proximity.
RFID-based sensor systems can be realized in three different ways. The most common, easy and quick development principle is to build the system by designing a printed circuit board (PCB) using commercial devices. In this case a microcontroller is usually interfaced with the sensors as well as with the wireless transmission system, while the DC power supply for all the electronic components is provided by a commercial RFID transponder chip that harvests the RF source from the reader and generates the DC voltage. Different commercial RFID transponders exist on the market. The SL13A by Ams (Premstatten, Austria, EU), for example, is a RFID transponder that works at the NFC frequency of 13.56 MHz. The device can work both in passive and semi-passive mode since it can harvest power both from an external reader (up to 4 mA at 3.4 V) or a battery (1.5 V or 3 V). It integrates an on-chip 8 kbit EEPROM for data storage, a temperature sensor with nonlinearity of ± 0.5 °C, a real time clock, an analog input to directly connect resistive sensors without the need of a microcontroller and a serial pheripheral interface (SPI) port to communicate with a microcontroller. The same company also markets the SL900A chip that has similar characteristics to the SL13A but works in the RFID frequency range from 860 to 960 MHz. Si4464 by Silicon Labs (Austin, TX, USA) scavenges power from the RF signal generated by the reader in the frequency range from 119 to 960 MHz and generates an output DC voltage in the range 1.8–3.6 V. It integrates an internal temperature sensor, a SPI port to interface with a microcontroller and four general purpose input output (GPIO) pins. TRF7970A by Texas Instruments is an NFC transponder that works at the 13.56 MHz frequency. It supports data rate up to 848 kbps and allows programmable I/O voltage levels from 1.8 to 5.5 V and programmable output power of 20 dBm and 23 dBm. It also integrates both a parallel and a SPI port to interface with a microcontroller. A RFID-based sensor system can also be produced by designing a circuit that integrates all the logic of power generation, sensor acquisition and wireless data communication on a single chip. This option is of course more expensive and requires longer time for the design but has the advantage of much lower power consumption. Finally, there are the so called chipless RFID sensor tags, where the antenna is modified so that its properties (such as the resonance frequency) are function of the parameter of interest. These sensor tags lack a control logic and thus have not the processing capability of the other two types of tags, but the cost is very low.
3.12. RFID Applications
Different sensor systems based on RFID tags have been reported in literature in the last years. Marindra and Tian in 2018 presented a chipless RFID sensor to detect and characterize metal cracks for health monitoring of civil infrastructures [141]. The proposed sensor tag operates in the ultra-wideband frequency (UWB) and integrates a circular microstrip patch antenna (CMPA) resonator to characterize the cracks on metal surface. According to the results, the CMPA resonance frequency is affected by the presence of cracks with the crack orientation modulating the frequency value while the crack depth modulating the amplitude. The ID resonators positioned on the sides of the CMPA are used to transfer information with the RFID reader. Vena et al. in 2015 presented a chipless RFID tag for humidity measurements [142]. Silicon nanowires were placed on the RFID tag to allow the resonance frequency to be function of humidity with a reported sensitivity of 1.5 MHz frequency shift per 1% of relative humidity. The RFID tag was designed to work in the ultra-wideband (UWB) frequency range between 3 and 7.5 GHz. In the case of a single resonator the reported tag area is 3.5 × 1.5 cm2 with the possibility to integrate multiple resonators on the same tag using an anti-collision technique based on spectral separation for reliable data transmission. A chipless RFID sensor was also reported by Genovesi et al. in 2018 for the measurement of angular rotations [143]. The RFID tag operates at the frequencies of 5.25 GHz and 7.35 GHz and can measure a maximum rotation angle of 180 degree with resolution of 3 degree. Liu et al. in 2017 presented a RFID sensor tag for temperature monitoring inside concrete [144]. The RFID tag chip fabricated with the TSMC 0.18 µm 1P6M mixed-signal CMOS process, features an approximate area of 13 × 15 cm2 and scavenges the power from a reader transmitting at 915 MHz. The reported maximum distance between the reader and the tag is 7 m. The designed RFID tag integrates a matching network, an RF/Analog front end and a temperature sensor implemented using a temperature-controlled oscillator that generates a frequency that is function of temperature. Measurements have been carried out using a thermocouple as temperature reference and a maximum error lower than 0.5 °C is reported. Rivadeneyra et al. in 2020 presented a chipless RFID tag for pressure detection [145]. The transducer works in the ultra-high-frequency (UHF) band at 860 MHz and was built with PDMS and silver on a flexible substrate. The application of a pressure on the sensor tag produces a shift in the resonance frequency (868 MHz) as well as a decrease in magnitude that can be detected by the reader. Hillier et al. in 2019 presented a passive UHF RFID sensor tag to measure the salt concentration in liquid electrolytes [146]. The sensor is based on the RFM2100-AER RFID tag by RF-Micron (Austin, TX, USA) that is used as wireless battery-free moisture sensor. The authors modified such tag by deposition of 500 µm PDMS film to isolate the interdigitated capacitor sensing electrode from the electrolyte sample. Solutions with different salt concentrations were tested and a correlation between sensor output value and salt concentration was found in the range 0–2 M. A similar UHF RFID sensor tag was proposed by Saggin et al. in 2019 for food quality monitoring [147]. In this case the commercial RFID tag NXP G2XM by NXP Semiconductors (Eindhoven, Netherlands, EU) was modified with the deposition of a layer of vegetal biopolymer. The sensor tag modified this way was subjected to an environment with variable concentrations of O2 and CO2 and the results have shown how it can be reliably used to monitor the maturation of food products. An UHF RFID sensor tag for wireless environmental monitoring was proposed by Cho et al. in 2005 [148]. The sensor tag was designed with 0.25 µm CMOS process and features an occupation area of 0.42 mm2. The sensor tag integrates all the circuits to generate the DC power supply from the AC RF power provided by the RFID reader, a clock generator, an ASK demodulator, a temperature sensor and a light sensor. The results have shown how the sensor tag dissipates a maximum of 5.1 µW at 1.5 V when is in active state and the generated clock has a maximum variation of 7% under 1.5 V voltage sweep and 90 °C temperature variation. Dondi et al. in 2012 presented a RF energy harvesting system to power a vehicle stability control system [149]. The energy harvesting system scavenges power from the dedicated RF source at 868 MHz (unlicensed RFID band) and provides an output power that is function of the distance from the RFID transmitter: 500 µW at 1 m, 50 µ at 3 m and 10 µW at 4 m. The sensor system is based on the microcontroller MSP430 by Texas Instruments and integrates a 3-axis accelerometer (LIS3DH by STMicroelectronics, Geneva, Switzerland) and a 2.4 GHz RF transceiver (CC2500, Texas Instruments, Dallas, TX, USA) for wireless communication. It features a power consumption of only 4.73 µW when in sleep state and a power consumption of 144 µW when measurement and transmission are carried out at time intervals of 1 s. Boada et al. in 2019 presented a color sensor for pH monitoring that harvests power from a smartphone using NFC at 13.56 MHz [150]. The system uses the commercial M24LR04E (ST Microelectronics, Geneva, Switzerland) NFC chip to scavenge the energy from the smartphone reader to power an electronic system based on the microcontroller Tiny85 by Atmel and composed of a white LED and a color light sensor (TCS3472 by TAOS, Plano, TX, USA). The whole system consumes about 3 mA (most due to the LED, 2 mA) when in active state and the smartphone reader can provide up to 5 mA at 3.3 V. The system is used to detect the color of pH-sensitive paper strips and thus to estimate the pH value. The color is measured by the TCS3472 sensor and then converted in the HSV (hue-saturation-value) color state. The authors have found that a correlation exists between the pH and the hue value measured by the sensor that can be estimated once the system is properly calibrated. Carvajal et al. in 2017 developed a compact system based on a passive NFC tag that measures the dose of an ionizing radiation [151]. The power for the system is provided by a smartphone that generates the electromagnetic radiation at 13.56 MHz and the RF source is used to generate the DC power supply by a SL13A (AMS, Premstatten, Austria, EU) commercial NFC transponder. The reported sensitivity is 4.75 ± 0.15 mV/Gy. A chipless NFC sensor system was presented by Xu et al. in 2017 and tested for the measurement of ethanol concentration [152]. Such system is created from the RLC circuit of a standard NFC tag by placing the sensing element in series with the tag resistance. Depending on the ethanol concentration, the sensing element resistance changes thus discriminating the ability of the smartphone to read the tag. The developed system provides a binary output, thus it measures if the ethanol concentration is higher or lower than a certain threshold. However, by using different replicas of the tag with different values of the resistance, the measurement resolution can be increased.
A summary of RFID applications is presented in Table 7.
3.13. Environmental Radiofrequency Sources
Differently from RFID sensor systems, where the power is scavenged from the RF source generated by the reader device, other RF-based energy harvesting systems scavenge the power from RF sources present in the environment, indoor (such as Wi-Fi signal) and outdoor (digital TV and cellular stations). Examples of RF sources present in the environment are: DTV (470–610 MHz), GSM900 (880–915 Mhz), GSM1800 (1710–1785 MHz), 3G (1710–1785 MHz), Wi-Fi (2.4–2.5 GHz) [153]. RF sources present in the environment are limited to the non-ionizing frequency band between 30 kHz and 300 GHz due to safety concern and the maximum power density is also limited by normatives and regulations. The advantages of energy harvesting from RF sources present in the environment are that it is not necessary a dedicated reader device and the energy source density presents much smaller fluctuations over time than other energy sources (such as solar energy that is completely absent during night). However, the energy level presents a strong spatial distribution with higher power density in the nearby of digital TV or cellular base stations and lower power density in rural areas. Moreover, the weather has an impact on the attenuation of RF sources with lower levels in the case of fog, rain or high humidity and also the presence of obstacles (such as mountains and buildings) contributes to attenuate the signal.
The schematic of an RF energy harvesting system that scavenges power from sources present in the environment is shown in Figure 18. An impedance matching network allows to maximize the power collected from the receiving antenna. The AC input voltage signal is rectified and the power management circuit generates the stable DC voltage used to power the sensor system.
3.14. Environmental Radiofrequency Sources Applications
Different sensor systems that scavenge power from RF sources present in the environment have been reported in literature. Bito et al. in 2015 designed a RF energy harvester to power a microcontroller based wireless wearable sensor system [154]. The transducer scavenges power from a RDU2020 two-channel two-way talk radio (Motorola, Chicago, IL, USA) generating a RF signal of 2 W at frequency 464.55 MHz. The wearable sensor node was designed to be placed around the wrist of the user and is realized with a eZ430-RF2500 by Texas Instruments that integrates a MSP430 microcontroller and a wireless communication system at 2.45 GHz. The results have shown how the harvester can generate an output power of 146.9 mW and 43.2 mW in the case of scavenging from the magnetic field and electric field, respectively. In 2013 Sample et al. presented an RF energy harvesting system that is used to power a microcontroller-based sensor system (TI MSP430) interfaced with temperature and light sensors and featuring a wireless transmission system to transfer the measured data to a remote host [155]. The harvester scavenges power from a TV broadcast transmitter (539 MHz) emitting up to 1 MW of RF power and a cellular base station operating at 738 MHz. Experiments carried out in a real-world scenario have shown how the scavenged energy is high enough to provide the minimum power for sensor node operation (15.8 µW). Nintanavongsa et al. in 2012 presented a RF energy harvesting circuit tuned to extract energy from the 915 MHz band [156]. The harvester features two stages for low power RF input (−20 dBm) and high-power RF input (20 dBm). In the case of a RF input of −6 dBm a scavenged power of 37 µW is reported. The harvester was employed to power the Mica2 sensor mote. Nishimoto et al. in 2010 presented a RF energy harvester that scavenges power from the Digital TV UHF band (500–600 MHz) to power a microcontroller based sensor node [157]. A prototype of the system was built using a MSP430F2274 microcontroller from Texas Instruments, a CC2500 low power 2.4 GHz transceiver (Texas Instruments, Dallas, TX, USA) and storing the scavenged energy in a 100 µF aluminum electrolytic capacitor. A low-power wireless telemetry system for sensor nodes aimed at targeted muscle reinnervation applications was presented by Kim et al. in 2015 [158]. The system, featuring a 7 mm × 8 mm area, scavenges power from an external base station emitting signals at 915 MHz and transmits data to a central hub using a 457.5 MHz transmitter. The reported power consumption is 110 µW. Baranov et al. in 2018 developed an energy harvesting system that scavenges power from RF sources at 900 MHz [159]. The developed system is based on the ATxmega32A4 microcontroller and integrates two gas sensors, a methane CH4 catalytic sensor (NTC-IGD), an electrochemical CO sensor (NAP-505, Nemoto, Tokyo, Japan) and a wireless ZigBee transceiver (ETRX357, Silicon Labs, Austin, TX, USA) to transfer the measured data to a remote host. The scavenged energy is stored on a 25 mF supercapacitor. The CH4 gas sensor is characterized by high power consumption (147 mJ for a single measurement), thus the energy storage device is charged to 5 V before sensors measurement and data transmission can be carried out. In the case of RF input power of 1 mW, a charging time of 1200 s is reported. Bouchouicha et al. in 2010 presented a study on the feasibility of RF energy harvesting to power wireless sensor nodes [160]. The authors investigated the feasibility of scavenging from the broadband 1–3.5 GHz as well as from the narrowband 1.8–1.9 GHz. In the first case the developed harvesting system connected the antenna to the rectifier circuit without any impedance matching circuit and this resulted in a very low output power of 12.5 pW. In the case of harvesting from the 1.8–1.9 GHz narrowband, an impedance matching circuit was implemented to increase the harvester efficiency and the resulted output power was 400 pW. Pinuela et al. in 2013 presented different RF energy harvesting systems based on single source narrowband as well as broadband [161]. The authors made a set of measurements in different places in London and found that the RF sources providing the highest power level were Digital TV (470–610 MHz), GSM900 (880–915 MHz), GSM1800 (1710–1785 MHz), 3G (1920–1980 MHz) and WiFi (2400–2500 MHz). Thus, the authors designed four different harvesting systems scavenging power from the narrowband of Digital TV, GSM900, GSM1800 and 3G as well as a broadband harvesting system that scavenges power from all the available frequencies. The results have shown how the maximum output power density of 7.4 µW/cm3 was achieved in the case of GSM900 and GSM1800 sources. A RF energy harvesting system for the charging of mobile devices was presented by Jabbar et al. in 2010 [162]. The system features different helical antennas to scavenge power from four different RF frequencies: 315 MHz, 400 MHz, 915 MHz and 2.4 GHz. The scavenged AC voltage is rectified and then fed to a 3-stage Villard multiplier circuit to generate a DC voltage of appropriate level. The transducer has been tested for input power range from −10 dBm to 5 dBm and the generated output power is 743.63 µW in the case of input power of 3.16 mW.
A summary of the energy harvesting systems that scavenge power from RF sources present in the environment is presented in Table 8.
3.15. Biofuel Energy
Many medical implants, such as cardio-stimulators, implantable prosthetic devices, cochlear implants, insulin pumps and gastric stimulators are powered by battery since classic energy sources, such as sunlight, temperature gradients and kinetic energy have the major drawback of being discontinuous in nature [163]. Thus, the possibility to power these implantable devices using methods based on internal physical activity of living beings (i.e., transforming the chemical energy associated with living functions to electrical energy) has recently attracted much interest. This is the basis of the glucose biofuel cell, whose schematic is presented in [164] and shown in Figure 19. A biofuel cell is composed of a couple of electrodes (anode and cathode) and an electrolyte that separates the two electrodes. The chemical reactions that take place at the anode and cathode are presented in Equations (16) and (17) respectively:
At the anode the glucose fuel source (C6H12O6) is oxidized to gluconolactone (C6H12O7), while at the cathode the oxygen (O2) is reduced to water (H2O). The chemical reactions result in the generation of electrons and protons: the electrons flow to the cathode through the external load while the protons flow through the electrolyte. To improve the biofuel cell efficiency, suitable enzymes and mediators are immobilized on the electrodes where mediators help the electrons flow between enzymes and electrode. While other fuel sources are available, sugar is the most used since is present in plants and fruits as well as in the blood vessels of vertebrate animals and in the hemolymph of invertebrates.
3.16. Biofuel Energy Applications
Many glucose biofuel cells have been reported in literature to power electronic devices and sensors, with investigations both in-vitro (with the electrodes immersed in a solution of known glucose concentration) and in-vivo (with the electrodes implanted in living organisms). Miyake et al. in 2011 realized a biofuel cell to scavenge power from living organisms [165]. The system was made of a needle bio-anode functionalized with glucose dehydrogenase and a gas-diffusion bio-cathode that can access the abundant oxygen in the air. The system has been tested by extracting energy from the fructose present in raw grape and, in the case of four needle anodes connected in parallel, an output power of 26.5 µW at a voltage level of 340 mV was achieved. The system was also tested to scavenge power from the glucose present in a rabbit ear vein and in this case an output power of 0.42 µW at a voltage level of 0.56 V was achieved. Flexer and Mano in 2010 presented an energy harvesting system to scavenge power from living plants [166]. The system has been developed for two different purposes: to generate electrical energy to power mobile electronic systems and to investigate and understand the kinetics of living plants photosynthesis. Glassy carbon electrodes of diameter 3 mm were modified with glucose oxidase (anode) and bilirubin oxidase (cathode) and implanted inside a cactus leaf. Five different types of cacti were investigated and the results have shown how the current through the electrodes increases when the plant is exposed to light as a result of glucose concentration increase due to photosynthesis. The biofuel cell produces a power density of 9 µW∙cm−2 at 0.4 V when exposed to illumination while the generated power is only 30% under darkness. An energy harvesting system to scavenge power from oranges was designed by MacVittie et al. in 2015 [167]. Electrodes made of compressed multi-walled carbon nanotubes (buckypaper) were used. The bio-anode was modified with PQQ-dependent glucose dehydrogenase and FAD-dependent fructose dehydrogenase while the bio-cathode was functionalized with laccase. The system was tested both with oranges with the peel removed as well as with oranges growing on a tree. The maximum output power is 670 µW for a resistive load of 200 Ω and the open circuit voltage is 600 mV. The output voltage is increased to 2.3 V using a charge pump and the energy stored on a 6.8 mF supercapacitor. The scavenged energy was used to power an electronic system based on the ATTiny 85 microcontroller (Atmel, San Jose, CA, USA) with an integrated radio transmission module. In 2019 Huang et al. reported a self-powered biosensor to monitor the glucose level in free-swimming fish [168]. The system was in-vitro calibrated with solutions of different glucose concentrations and tested in-vivo on fish Nile tilapia placed in a 25 L fish tank. The power is harvested using two electrodes: a platinum-iridium wire bio-anode inserted in the caudal area of the fish and a gas diffusion bio-chatode placed in an airtight bag (along with the other parts of the circuit) on the water surface. The electrodes are connected to a charge pump circuit (S-8823A24-M5T1U, Ablic Inc., Tokyo, Japan) that is devoted to charge a 10 µF capacitor to 2.4 V and then discharge it to a LED. The LED blinking frequency, that was found to be correlated with the glucose concentration, was measured with a smartphone running an ad-hoc developed app. The reported scavenged power is 6.3 µW/cm2 at 0.25 V for a temperature of 25 °C and 8.6 µW/cm2 at 0.27 V for a temperature of 15 °C. Cinquin et al. in 2010 presented a glucose biofuel cell implanted in the abdomen of a rat that can provide a maximum output power of 6.5 µW at a potential of 0.13 V [169]. The two electrodes of the biofuel cell (each with a 0.133 mL volume) are made of compacted graphite disc: the anode contains ubiquinone, glucose oxidase (GOX) and catalase while the cathode contains quinhydrone and polyphenol oxidase (PPO). The cathode is inserted in a dialysis bag and both electrodes in an external dialysis bag. The system was tested in-vivo during 40 days. The same research group in 2013 proposed a modified glucose biofuel cell that can significantly increase the scavenged power (38.7 µW) [170]. In this case the biofuel cell is based on carbon nanotube/enzyme electrodes, which utilize glucose oxidase for glucose oxidation and laccase for dioxygen reduction. The system was implanted in a rat abdomen and monitored for 110 days. The results have shown how the scavenged power is enough to power a light emitting diode (LED) or a digital thermometer. Szczupak et al. in 2012 presented an investigation on the use of biofuel energy in clams [171]. Electrodes made of compressed multi-walled carbon nanotubes were used. PQQ-dependent glucose dehydrogenase was used as a biocatalyst on the anode and Oxygen reducing laccase was selected for the cathodic reaction. The implantable electrodes were inserted into the clams through holes cut in a dorso-posterior part of their shells and connected to an external variable resistor simulating a resistive load. The clams were maintained at a low temperature of 4–5 °C and exposed to ambient temperature (23 °C) only during the measurements. The results showed how an open circuit voltage of 300–400 mV and a short circuit current of 30–100 µA can be achieved with a maximum output power of 10 µW obtained for a load resistance of 3 kΩ. The researchers also investigated the possibility to connect three different clams in series and parallel. The results showed how the maximum output power (37 µW) was obtained with the parallel configuration and an optimal load resistance of 900 Ω. The series configuration provided lower power (5.2 µW) but the load resistance range was broader than the parallel case (10–50 kΩ). The parallel configuration of three clams was connected to a 1 F capacitor that was charged to 240 mV in 1 h and was used to rotate a DC electrical motor of a quarter of full turn. Schwefel et al. in 2014 presented a biofuel cell that was tested as an implant in a cockroach (Blaberus discoidalis) and a moth (Manduca sexta) [172]. The cell was built with enzyme modified graphite rods electrodes and achieved a maximum power of 0.12 µW at 100 mV. The cell was tested to power a RC oscillator built with low-threshold MOSFETs (ALD110802 from Advanced Linear Devices, Sunnyvale, CA, USA) and featuring a frequency of 4.2 kHz. The oscillator was connected to an LC circuit that served as an antenna and produced an alternating magnetic field to be transmitted to a nearby receiver. A biofuel cell that scavenges power from trehalose present in the hemolymph of cockroaches was investigated by Shoji et al. in 2016 [173]. The biofuel cell consists of two chambers separated by a dialysis membrane and two electrodes, a bio-anode functionalized with glucose dehydrogenase and a bio-cathode functionalized with bilirubin oxidase. Differently from other biofuel cells presented in literature, in this case the electrodes are not implanted in the insect but the bottom chamber was glued to the cockroach exoskeleton with only two holes made to access the hemolymph. This procedure is much less invasive for the insect and allows larger area for the electrodes, thus increasing the level of scavenged power. According to the authors, a maximum output power of 333 µW was achieved at a voltage level of 0.5 V. The scavenged power was used to provide the power to a LED and a wireless sensor device for temperature and humidity measurements. MacVittie et al. in 2013 presented a biofuel cell that scavenges power from the glucose present in the hemolymph of lobsters [174]. The biofuel cell consists of a bio-anode modified with PQQ-dependent glucose dehydrogenase and a bio-cathode functionalized with laccase for oxygen reduction. The electrodes were implanted in the lobsters and, in the case of two lobsters connected in series, a power output higher than 0.16 mW at a voltage of 1.2 V was achieved. The scavenged power was enough to successfully power a digital watch. The same biofuel cell was also tested to scavenge power from the glucose present in human blood. The authors designed a fluidic system that works as a human capillary blood vessel and, in the case of five fluidic systems connected in series, an open circuit voltage of 2.8 V was obtained and the system was capable to power a pacemaker (power consumption 90 µW) for over five hours. Halamkova et al. in 2012 presented an energy harvesting system that scavenges power from living snails [175]. The electrodes of geometrical area 0.25 cm2 were made of compressed multi-walled carbon nanotubes (buckypaper) and were functionalized with PQQ-dependent glucose dehydrogenase (anode) and laccase (cathode). The electrodes were implanted in a living snail and the obtained output power was 7.45 µW in the case of a resistive load of 20 kΩ, while the open circuit voltage was 530 mV. The generated output power decreased with time due to the consumption of glucose in the close vicinity of the electrodes. However, the output power was restored after 30–60 min if the snail was allowed to rest. Ghoreishizadeh et al. in 2018 presented a glucose sensor patch that integrates a biofuel cell for self-powering and the electronics for wireless data transmission of the measured data [176]. The biofuel cell was made with enzyme modified gold plated copper electrodes and can scavenge a power of 14 µW when a glucose concentration of 100 mM is present. The powered system is composed of a microcontroller (CC2640, Texas Instruments, Dallas, TX, USA) with integrated Bluetooth Low Energy transmission protocol, a nano-power management chip (bq25570) that can harvest power from voltage levels as low as 100 mV and can store the scavenged energy on a 0.2 F capacitor, an ad hoc developed glucose sensor with an average sensitivity of 150 nA/mM and an impedance analyser on chip (AD5933) capable to make impedance spectroscopy measurements (used for the glucose sensor self-calibration). The system makes glucose concentration measurements at timed intervals and transmits the measured data to a smartphone by Bluetooth communication. A self-powered glucose sensor was also proposed by Slaughter and Kulkarni in 2016 [177]. The biofuel cell was realized with enzyme modified multi-walled carbon nanotube electrodes and was able to provide a power density of 67.86 µW/cm2 at 335 mV in presence of a glucose concentration of 45 mM and a power density of 15.98 µW/cm2 at 166.3 mV in presence of a glucose concentration of 5 mM. The scavenged energy was used in conjunction with a charge pump to charge a 0.1 F capacitor to power a LED. The LED dimming frequency was found to be correlated with the glucose concentration in the range 0.5–35 mM. Southcott et al. in 2013 designed a biofuel cell that harvests energy from the glucose of human blood [178]. The biofuel cell electrodes were made of buckypaper composed of compressed multi-walled carbon nanotubes (area of 6 cm2) functionalized with PQQ-dependent glucose dehydrogenase (bio-anode) and laccase (bio-cathode). A flow cell was designed using a peristaltic pump to allow the human serum solution spiked with glucose concentration at 6.4 mM to move at a flow rate of 58.9 µL∙min−1. The biofuel cell provided an open circuit voltage of 470 mV and a short circuit current of 5 mA. The output voltage level was increased to 3 V using a charge pump (S-882z, Seiko, Tokyo, Japan) and a DC-DC converter (Seiko S-8353). The scavenged energy was used to power a commercial pacemaker (DR 5330L, St. Jude Medical, Saint Paul, MN, USA) that features a maximum power consumption of 300 µW. A summary of the biofuel cell based energy harvesting systems is presented in Table 9.
3.17. Energy Harvesting from Multiple Energy Sources
Most of the electronic systems scavenge energy from a single energy source. This often results in non-optimal performances due to the fact that natural energy sources are not continuously present and thus the energy storage buffer must be oversized to store enough energy to allow the system to work also when the energy source is absent. A more efficient design is to scavenge energy from multiple sources. This allows a more efficient use of the available energy but also poses problems for the design of the power management circuit that, to maximize the scavenged energy, must be designed for a particular type of energy source and storage element. A detailed discussion on the different types of power management circuits for multi sources energy harvesting systems has been presented by Estrada-Lopez et al. in 2018 [179]. The simplest architecture for energy harvesting from multiple energy sources is the Power ORing architecture, shown in Figure 20, that is implemented in different commercial power management circuits such as LTC3331 from Linear Technology and MB39C811 from Cypress Semiconductor (San Jose, CA, USA). The main advantages of such architecture are its simplicity, the possibility to integrate an arbitrary number of energy sources due to its modularity and the possibility to feature a MPPT circuit for each energy source. Nevertheless, the overall performance is quite poor, principally due to the diodes’ voltage drops and the fact that the generated voltages are not added up but only the largest voltage is delivered to the output.
Different systems powered by multi sources energy harvesting have been discussed in the literature. In 2009 Dalola et al. proposed an autonomous sensor system with power harvesting to measure the temperature along a walled-in pipe of a heating plant [180]. The system uses a TEG module (40 × 40 × 3.6 mm3 with 254 thermocouples) to scavenge power from the temperature gradient along the pipe and generates a 2.1 V DC voltage to supply a low-power microcontroller (9S08QE128, Freescale Semiconductor, Austin, TX, USA) and a temperature sensor (LM94022, Texas Instruments, Dallas, TX, USA). The system also integrates a 125 kHz RFID transponder (U3280M, Microchip Technology, Chandler, AZ, USA) to transmit the measured data to an external readout unit. In this way the microcontroller and temperature sensor are active (powered by TEG) only during the measurements, while during the data transfer are idle and the power supply for the RFID transponder is provided by the readout unit by magnetic inductive coupling. The system can work reliably with temperature gradients higher than 9 °C and a maximum readout distance of 8 cm providing a power of more than 20 mW. A similar concept was exploited by Magno et al. who developed an autonomous smartwatch for continuous measurement of skin temperature [181]. The system is produced in the form of a bracelet that integrates 8 amorphous silicon solar cells (AM-1471CA from Sanyo Energy) to power a microcontroller (MSP430FR5969 from Texas Instruments), 16 NTC thermistors fabricated on a Kapton foil and a 16 kbit EEPROM with NFC interface (M24LR16E-R by STMicroelectronics). Also in this case, the solar cells power the system during the temperature measurements while during the wireless data transfer the system is powered by an external smartphone with NFC capability. The integrated solar cells provide an average power of 502 µW for indoor use and 4 mW for outdoor use. The same research group developed a similar smart bracelet that scavenges energy from eight amorphous solar cells and uses NFC to transfer data to a smartphone or tablet [182]. In this case three different sensors were integrated in the system: a 3-axis accelerometer (ADXL362 from Analog Devices), an analog microphone (ADMP404 from Analog Devices) and a 112 × 112 pixels grayscale camera (Stonyman from Centeye, Washington, DC, USA). The system also features a 1.44″ TFT display based on e-ink technology. The power management is handled by the commercial chip bq25570 by Texas Instruments that stores the scavenged energy in a 40 mAh 3.7 V Li-ion battery. The reported harvested power is 100 µA at 1.9 V for indoor use and 15 mA at 1.6 V for outdoor use. Georgiadis et al. in 2011 presented an energy harvesting system that scavenges power from solar and RF sources [183]. The transducer is built on a flexible polyester substrate that combines a rectenna for RF harvesting and a solar module for photovoltaic harvesting. The RF transducer can scavenge power from the GSM-850 and GSM-1900 frequency bands while the photovoltaic transducer is built with amorphous silicon solar cells (SP3-37, Powerfilm Solar Inc., Ames, IA, USA) featuring an open circuit voltage of 4.1 V and a short circuit current of 30 mA. Yu et al. in 2014 presented an energy harvesting system to power indoor wireless sensor nodes that scavenges power from ambient light and vibrations [184]. The photovoltaic transducer was realized with an amorphous silicon solar panel of area 4.8 × 2.0 cm2 featuring an open circuit voltage of 5.33 V and a short circuit current of 14.6 µA. The piezoelectric transducer of area 11 × 12.4 mm2 was realized with five PZT cantilevers connected in series that can provide a maximum output power of 66.75 µW under 5 m/s2 acceleration for a resistive load of 220 kΩ. A power management circuit was ad hoc designed with a MPPT circuit for the solar harvester and a rectifier with impedance matching for the piezoelectric transducer. A DC/DC voltage regulator generates the DC voltage to power the wireless sensor node. By scavenging from both sources an output power of 85.94 µW and an efficiency of 76.7% are reported. An energy harvesting system that scavenges power from three different sources (mechanical vibrations, temperature gradients and light) was designed by Wang et al. in 2013 [185]. The transducers provide power for an acoustic emissions monitoring system to detect faults in industrial rotating machines. The embedded system is based on an ARM Cortex-M4 microcontroller (ARM, Cambridge, UK), and an NXP JN5148 ZigBee module (NXP Semiconductors, Eindhoven, Netherlands, EU) for wireless transmissions. The acquired acoustic data are processed using fractional Fourier transform and the results compared with reference fault patterns. The system power requirements are 80–180 mW in active mode and 50 µW in standby mode. Mechanical vibrations power is scavenged by means of the commercial transducer module PMG SHF by Perpetuum (Southampton, UK), the temperature gradients by a Bi2Te3 TEG composed of 255 thermo-elements and the light by commercial solar panels. The scavenged energy is stored in two 5 F supercapacitors. The results have shown how the thermoelectric module can harvest 3.37 mW in presence of hot junction temperature of 62 °C and cold junction temperature of 15 °C, while the machine vibrations can provide a power of 1.56 mW. Suzuki et al. in 2010 presented an energy harvesting module to scavenge power from photovoltaic and thermoelectric sources [186]. Differently from other multi sources energy harvesting systems, in this case the transducer can operate selectively in photovoltaic or thermoelectric mode but can not scavenge power from both sources at the same time. The transducer is based on stacks of P/N semiconductor materials that are connected in series (thermoelectric mode) or parallel (photovoltaic mode) by a set of integrated switches. A prototype of the transducer has been built in the form of a bracelet to power a wireless sensor node for health care applications. Colomer-Farrarons et al. in 2011 developed a multi sources energy harvesting system for battery-less power of a wireless sensor node [187]. The system scavenges power from three different sources: photovoltaic using six solar cells (XOB17 from IXYS, Milpitas, CA, USA) that can be connected in different series/parallel configurations, vibrational using two piezoelectrical modules (QP20W and QP40W by Mide Tech, Woburn, MA, USA) and radiofrequency using a magnetic induction link (30 mm × 15 mm antenna) that was tuned to work at the frequency of 13.56 MHz. The results have shown how 2.76 mW can be scavenged from indoor illumination, 4.5 mW from the RF module and 360 µW from the vibration source, while an output power of 6.2 mW can be generated when all the three sources are scavenged at the same time. The authors have also included a thermoelectric module in the system conception, that however has not been still integrated in the system. An hybrid energy harvesting system that scavenges power from photovoltaic and thermoelectric sources to power indoor wireless sensor nodes was presented by Tan and Panda in 2011 [188]. The system integrates an amorphous silicon solar panel (SC-01 by Images SI Inc., Staten Island, NY, USA) for photovoltaic energy harvesting and a 20 mm × 20 mm × 20 mm TEG built from 5200 thermocouples each featuring a Seebeck coefficient of 0.21 mV/K and internal resistance of 82 kΩ for thermoelectric energy harvesting. The system has a unique power management circuit that provides MPPT for both the photovoltaic and thermoelectric energy harvesting. The reported output power is 621 µW in the case of light irradiance of 1010 lux and a thermal gradient of 10 °K. Zhang et al. in 2013 presented a battery-less body sensor node that scavenges power from thermoelectric and RF sources and is capable of acquiring, processing and transmitting electrocardiogram, electromyogram and electroencephalogram data [189]. The primary harvesting transducer is a 4 × 4 cm2 TEG that can harvest an average power of 60 µW from human body heat at room temperature. A secondary RF harvesting transducer is used to provide the kick-start power for the internal oscillator and control logic with a short RF burst provided by a dedicated RF transmitter. The system has been tested with a commercial electrocardiogram (Kendall Meditrace 535, Kendall, Minneapolis, MN, USA) that has a power consumption of 397 µW in active mode and, in the case of measurements every 5 s, the device can be powered by the harvesting system without any battery (average power consumption of 19 µW). An energy harvesting system that scavenges power from RF and thermal sources was also proposed by Saraereh et al. in 2020 [190]. The objective was to use the scavenging system to power a wireless sensor network for health monitoring applications where each sensor node integrates a three-axis accelerometer to implement a fall detection system. The proposed TEG is built using aluminium plates and Teflon as insulator, while the RF transducer is designed with a rectenna that scavenges power from the Wi-fi signal at 2.4 GHz. The scavenged energy is stored in a supercapacitor and a NiMH battery is also present to power the system when the environmental sources are absent or do not provide sufficient power. The designed system has been simulated using the Green Castalia simulator and the results have shown how the scavenging system can extend the sensor network lifetime of 24% if compared with the case of no energy harvesting. Hamid and Rasit Yuce in 2017 proposed a hybrid piezoelectric-electromagnetic energy harvester to power a wireless wearable sensor node [191]. The wearable transducer features a magnet that, when subjected to vibrations due to human motion, can freely slide inside its housing thus generating energy due to electromagnetic induction. At the two ends of the housing four PZT diaphragms are placed so that, when hit by the magnet, vibrations are generated and the power scavenged by the piezoelectric transducers. A power management circuit has been designed composed of a two stage Dickson multiplier, used to increase the scavenged voltage from the electromagnetic signal, and a commercial LTC3588-1 chip used to rectify and regulate the generated AC voltage. The designed harvester has been tested during different activities such as walking, jogging and riding a bicycle. The results have shown how up to 61.71 mJ can be scavenged in 298 s during walking at 4–6 km/h and up to 75.60 mJ in 270 s when riding a bicycle at 35–38 km/h. A piezoelectric/electromagnetic hybrid energy harvesting system to power wearable wireless sensor nodes was also proposed by Chamanian et al. in 2019 [192]. The system, worn on the user wrist, is made of a commercial piezoelectric transducer (V22BL by MIDE Technology, Woburn, MA, USA) and a custom-made electromagnetic transducer. The electromagnetic transducer scavenges power at low frequency of 2–3 Hz while the piezoelectric transducer exploits the frequency-up conversion phenomenon to increase its natural frequency to 20 Hz. A power management circuit was ad hoc designed to maximize the scavenged power from both sources. The results show how an output power in the range 1–100 µW can be obtained with up to 20 µW during walking. A similar approach was proposed by Iqbal and Khan in 2018 to power a wireless sensor node for bridges health monitoring applications [193]. In this case the transducer was built using two cantilever beams. On the top cantilever a PZT plate and a permanent magnet are placed while on the bottom cantilever a coil is present. The PZT plate and the couple magnet/coil are characterized by multi-resonant frequencies in the range 11–43 Hz and are used to scavenge power using the piezoelectric and electromagnetic conversion, respectively. The system has been tested to extract power from wind speed and vibrations using a laboratory setup. The results show how an output power of 155.7 µW and a maximum voltage of 6.279 V can be obtained in the case of acceleration of 0.4 g. Deng et al. in 2019 designed a multisource energy harvesting system to power an outdoor wireless sensor node [194]. The system scavenges power from three different sources, solar radiation, temperature gradients and wind. The integrated transducers are a vertical axis wind turbine (10 cm × 10 cm), five flexible solar cells connected in parallel (MD-HSM10058, Solar System, San Jose, CA, USA) and a custom designed thermoelectric generator. The harvesting system powers a wireless sensor node composed of a controller module (CC2530, Texas Instruments, Dallas, TX, USA) that integrates the circuitry for wireless communication using ZigBee and a sound sensor (ADMP401, Analog Devices, Norwood, MA, USA). The results show how the photovoltaic module can generate 900 mW in sunny conditions and 235 mW with a light intensity of 500 W/m2. The wind harvester can generate 23 mW when the wind speed is 7 m/s while the thermoelectric generator can only generate an output power of 3 mW. Overall, the transducers can provide a daily output energy of 7805.09 J that is sufficient for the daily energy consumption of the system (2972.88 J).
A summary of the energy harvesting systems powered by multiple energy sources is presented in Table 10.
4. Recent Advances and Challenges
The main research topics in the field of mobile electronic systems and wireless sensor networks powered by energy harvesting are aimed to increase the energy efficiency of both the harvesting transducers and the sensor systems to guarantee a teoretically infinite lifetime.
Research on novel materials for the design of energy harvesting transducers is aimed to the increase of the transducer efficiency, thus maximizing the scavenged output [195]. In the case of energy harvesting from heat, much effort is devoted to the development of new thermoelectric materials with very high figure of merit, thus minimizing the thermal conductivity while maximizing the electrical conductivity. In this field, the development of nano-microstructured materials with phonon selective scattering has produced a significant increase in the transducer figure of merit [196]. In the case of energy harvesting from mechanical vibrations, magnetoelectric composite materials have been developed by coupling together piezoelectric and magnetostrictive materials that can convert a magnetic field to an electric field and vice-versa [197]. Shape memory polymers have been used in the development of triboelectric nanogenerators (TENG), whose working principle successfully comes from the coupling of the triboelectrification effect and the electrostatic induction effect [198]. TENG transducers are very promising for the development of self-powered sensors, nanoelectronic systems and wearable electronics.
Another research topic related to the maximization of the transducer energy efficiency is due to the discontinuous nature of many sources such as solar, wind and radiofrequency. In the case of a sensor system powered by solar panels, for example, light energy can be scavenged only during daytime and the light energy level is strongly affected by the meteoreological conditions. Thus, much research is carried out in the developement of models to forecast the availability of such energy sources. For example, Kansal et al. developed a forecasting model for solar energy that is based on the exponentially weighted moving average (EWMA) and assumes that the energy source level in a particular day is not very different from the level in the previous days [199]. This model achieves a good accuracy in normal conditions but results less accurate when frequent changes in the weather conditions occur. More advanced models also based on EWMA were also proposed byPiorno et al. [200] and Moser et al. [201]. Forecasting models for sunlight availability have been also proposed by Lu et al., where the prediction is made using regression analysis [202] and Cammarano et al. who proposed a model to predict the availability of solar and wind sources [203]. More recently, investigations have been carried out for the application of machine learning algorithms to predict the availability of sunlight. Sharma et al., for example, presented a study on the prediction of solar energy by comparing different machine learning techniques [204]. A similar problem is the forecasting of RF energy availability. Also in this case, different models for the prediction of the quality of RF link were presented in literature, such as the work of Araujo et al. who proposed two different models to forecast the RF connectivity time in mobile environments, one based on genetic machine learning approach [205] and the other on a Markov model [206]. Ye et al. in 2021 presented a study where the availability of RF sources in the frequency range 1805–1880 MHz is predicted using four different machine learning algorithms [207].
To improve the power efficiency of a mobile sensor system, the efficiency increase of the energy harvesting transducer must be coupled with the reduction of power consumption of the sensor system. From this point of view, the most power-hungry element of a mobile sensor system is represented by the wireless transceiver. While low power communication protocols are deeply investigated (such as Bluetooth Low Energy and LoRa), the main gap in the power consumption reduction is the so-called idle listening, indicating the need for the wireless transceiver to stay active and listen for incoming signals. The problem of idle listening can be mitigated by duty-cycling scheduling, where the wireless transceiver is kept in deep sleep mode for a time interval and then waken-up to check if data packets are sent [208]. While duty cycling is effective in reducing the power consumption, a better solution is to asynchronoulsy wake-up the transceiver only when data packets are sent. This is the working principle of wake-up radio receivers, where the wireless transceiver is normally in deep sleep mode and is activated by the wake-up receiver when a certain RF signal is received [209,210]. Wake up radio receivers can be divided in active and passive radio receivers: active radio receivers integrate a battery while passive radio receivers harvest the power from the RF wake-up signal. In a passive wake up radio receiver the wake-up signal is received by the rectenna and converted to DC power. The harvested power is then used to activate the microcontroller that sends an interrupt signal to the main radio transceiver to wake it up from deep sleep mode. Passive wake up radio receivers are more energy efficient than active radio receivers but are also characterized by higher latency and shorter range of communication.
Modern mobile sensor systems and wireless sensor network nodes are characterized by a continous trend in size reduction, in particular in the case of wearable electronics and sensors to be implanted in the human body. The storage device (battery or supercapacitor) is a critical element in the system size reduction. At this regard, miniaturized energy storage devices with the electrode size in the range of micrometers and a volume in the range 1–10 mm3 are deeply investigated [211]. Miniaturized energy storage devices belong to three different categories: microbatteries, microsupercapacitors and microhybrid metal ion capacitors. Similar to traditional batteries, microbatteries are characterized by high energy density, stable voltage and durable operating lifetime and are considered the most promising candidate for miniaturized energy sources in microsystem applications. Microsupercapacitors, on the other hand, feature high power density, high frequency response and long cycling capability. Microhybrid metal ion capacitors are developed to combine the advantages of both batteries and supercapacitors and feature small footprint area, high energy density and high power density.
5. Conclusions
In this review paper, the feasibility of power generation for sensor network nodes and mobile systems by harvesting the energy from available natural sources has been discussed.
The exploitation of available energy sources has many advantages over battery usage since it avoids the problem of battery recharge or replacement that is often impractical in particular for systems deployed in inaccessible areas or implanted in the human body. In particular, power from available energy sources can be scavenged and stored in rechargeable batteries and/or supercapacitors to extend the lifetime of mobile sensor systems and wireless sensor network nodes. Thus, energy harvesting systems must integrate a power management circuit devoted to the extraction of energy and its conversion to a DC power supply suitable to power the electronic circuits.
Different energy sources are available for energy harvesting in low-power electronic systems. Photovoltaic energy is one of the most used energy source, available in the case of outdoor applications (sunlight) as well as indoor applications (incandescent light bulb, fluorescent light, LEDs). It can be scavenged using photovoltaic cells that provide a DC output voltage. Mechanical energy can be converted to electrical energy using three types of transducers (electromagnetic, electrostatic and piezoelectric). All three types of transducers generate an AC output voltage that must be rectified to be used in an electronic system. Thermal energy can be harvested by thermoelectric generators (TEGs) that generate a DC output voltage proportional to the thermal gradient across the transducer. The generated DC voltage is usually very low and must be amplified using a charge pump or DC/DC boost converter. The use of TEG generators in mobile electronic systems is particularly interesting in the case of wearable sensor systems, where the power is scavenged from human body heat. Radiofrequency (RF) energy can be exploited with two different working principles: RFID sensor tags scavenge the power from a dedicated reader device that generates the RF signal needed for the tag to work, while other energy harvesting systems scavenge RF energy sources present in the environment (such as Wi-Fi, digital TV and cellular signals). All RF energy transducers generate an AC output voltage that must be rectified before use. The chemical energy associated with living functions of plants and animals can be scavenged using the glucose biofuel cell, that uses the energy of glucose present in plants and fruits as well as in the blood vessels of vertebrate animals and in the hemolymph of invertebrates. A biofuel cell generates a DC output voltage and is very promising for providing the power to different medical implants. To improve the energy efficiency, many electronic systems scavenge the power from different energy sources. This gives an advantage in terms of scavenged power but also poses problems for the design of the power management circuit that must be optimized for different transducers.
While mobile sensor systems powered by energy harvesting have been widely discussed in academic literature as well as released as commercial products, research gaps still persist and are investigated to further improve the system power efficiency. First of all, new materials are investigated to design transducers that can maximize the generated output power. Then, since most energy sources are discontinuous in nature, much effort is put in the development of algorithms to predict the availability of these energy sources and, at this regard, machine learning algorithms are playing a main role. Another issue is the optimization of the system power consumption, in particular the wireless transceiver that is a power-hungry component of the sensor system. At this regard, it is very promising the use of wake-up radio receivers that allow the main wireless transceiver to stay in deep sleep mode most of the time and to be asynchronously waken up only when data packets are sent. The continuous miniaturization of mobile sensor systems, in particular in the case of wearable and implantable sensor systems, has also pushed the research to investigate more efficient energy storage devices featuring smaller volume and increased capacity. Miniaturized energy storage devices such as microbatteries, microsupercapacitors and microhybrid metal ion capacitors are very promising candidates for the developement of micro/nano systems.
In the end, the use of energy harvesting to power mobile electronics is expected to have a great prospect in the next years, in particular for wireless sensor networks where a multitude of sensor nodes are deployed in the environment in the paradigm of Internet of Things and must be energy independent during the entire life cycle.
Funding
This research received no external funding.
Conflicts of Interest
The author declares no conflict of interest.
References
- Schurgers, C.; Srivastava, M.B. Energy efficient routing in wireless sensor networks. In Proceedings of the 2001 MILCOM Proceedings Communications for Network-Centric Operations: Creating the Information Force (Cat. No.01CH37277), McLean, VA, USA, 28–31 October 2001; Volume 1, pp. 357–361. [Google Scholar]
- Wang, J.; Gao, Y.; Liu, W.; Sangaiah, A.K.; Kim, H.J. Energy efficient routing algorithm with mobile sink support for wireless sensor networks. Sensors 2019, 19, 1494. [Google Scholar] [CrossRef] [Green Version]
- Chamam, A.; Pierre, S. On the planning of wireless sensor networks: Energy-efficient clustering under the joint routing and coverage constraint. IEEE Trans. Mob. Comput. 2009, 8, 1077–1086. [Google Scholar] [CrossRef] [Green Version]
- Grossi, M.; Di Lecce, G.; Toschi, T.G.; Riccò, B. A novel electrochemical method for olive oil acidity determination. Microelectron. J. 2014, 45, 1701–1707. [Google Scholar] [CrossRef]
- Grossi, M.; Di Lecce, G.; Arru, M.; Toschi, T.G.; Riccò, B. An opto-electronic system for in-situ determination of peroxide value and total phenol content in olive oil. J. Food Eng. 2015, 146, 1–7. [Google Scholar] [CrossRef]
- Grossi, M.; Palagano, R.; Bendini, A.; Riccò, B.; Servili, M.; García-González, D.L.; Toschi, T.G. Design and in-house validation of a portable system for the determination of free acidity in virgin olive oil. Food Control 2019, 104, 208–216. [Google Scholar] [CrossRef] [Green Version]
- Wojnowski, W.; Majchrzak, T.; Dymerski, T.; Gębicki, J.; Namieśnik, J. Portable electronic nose based on electrochemical sensors for food quality assessment. Sensors 2017, 17, 2715. [Google Scholar] [CrossRef] [PubMed] [Green Version]
- Aykas, D.P.; Rodrigues Borba, K.; Rodriguez-Saona, L.E. Non-Destructive Quality Assessment of Tomato Paste by Using Portable Mid-Infrared Spectroscopy and Multivariate Analysis. Foods 2020, 9, 1300. [Google Scholar] [CrossRef]
- Grossi, M.; Valli, E.; Glicerina, V.T.; Rocculi, P.; Toschi, T.G.; Riccò, B. Practical determination of solid fat content in fats and oils by single-wavelength near-infrared analysis. IEEE Trans. Instrum. Meas. 2020, 69, 585–592. [Google Scholar] [CrossRef]
- Grossi, M.; Lanzoni, M.; Lazzarini, R.; Riccò, B. Automatic ice-cream characterization by impedance measurements for optimal machine setting. Measurement 2012, 45, 1747–1754. [Google Scholar] [CrossRef]
- Grossi, M.; Lazzarini, R.; Lanzoni, M.; Riccò, B. A novel technique to control ice cream freezing by electrical characteristics analysis. J. Food Eng. 2011, 106, 347–354. [Google Scholar] [CrossRef]
- Velasco, A.; Ferrero, R.; Gandino, F.; Montrucchio, B.; Rebaudengo, M. A mobile and low-cost system for environmental monitoring: A case study. Sensors 2016, 16, 710. [Google Scholar] [CrossRef]
- Jimenez-Jorquera, C.; Orozco, J.; Baldi, A. ISFET based microsensors for environmental monitoring. Sensors 2010, 10, 61–83. [Google Scholar] [CrossRef] [Green Version]
- Barile, G.; Leoni, A.; Pantoli, L.; Stornelli, V. Real-time autonomous system for structural and environmental monitoring of dynamic events. Electronics 2018, 7, 420. [Google Scholar] [CrossRef] [Green Version]
- Hall, J.; Loo, S.M.; Stephenson, D.; Butler, R.; Pook, M.; Kiepert, J.; Terrell, N. A portable wireless particulate sensor system for continuous real-time environmental monitoring. In Proceedings of the 42nd International Conference on Environmental Systems, San Diego, CA, USA, 15–19 July 2012; p. 3441. [Google Scholar]
- Tsow, F.; Forzani, E.; Rai, A.; Wang, R.; Tsui, R.; Mastroianni, S.; Tao, N.J. A wearable and wireless sensor system for real-time monitoring of toxic environmental volatile organic compounds. IEEE Sens. J. 2009, 9, 1734–1740. [Google Scholar] [CrossRef]
- Grossi, M.; Parolin, C.; Vitali, B.; Riccò, B. A portable sensor system for bacterial concentration monitoring in metalworking fluids. J. Sens. Sens. Syst. 2018, 7, 349–357. [Google Scholar] [CrossRef] [Green Version]
- Grossi, M.; Parolin, C.; Vitali, B.; Riccò, B. Measurement of bacterial concentration using a portable sensor system with a combined electrical-optical approach. IEEE Sens. J. 2019, 19, 10693–10700. [Google Scholar] [CrossRef]
- Grossi, M.; Parolin, C.; Vitali, B.; Riccò, B. Computer Vision Approach for the Determination of Microbial Concentration and Growth Kinetics Using a Low Cost Sensor System. Sensors 2019, 19, 5367. [Google Scholar] [CrossRef] [PubMed] [Green Version]
- Phaneuf, C.R.; Mangadu, B.; Piccini, M.E.; Singh, A.K.; Koh, C.Y. Rapid, portable, multiplexed detection of bacterial pathogens directly from clinical sample matrices. Biosensors 2016, 6, 49. [Google Scholar] [CrossRef] [Green Version]
- Arellano-Pérez, J.H.; Negrón, O.R.; Escobar-Jiménez, R.F.; Gómez-Aguilar, J.F.; Uruchurtu-Chavarín, J. Development of a portable device for measuring the corrosion rates of metals based on electrochemical noise signals. Measurement 2018, 122, 73–81. [Google Scholar] [CrossRef]
- Yin Yee Chin, P.; Cheok, Q.; Glowacz, A.; Caesarendra, W. A Review of In-Vivo and In-Vitro Real-Time Corrosion Monitoring Systems of Biodegradable Metal Implants. Appl. Sci. 2020, 10, 3141. [Google Scholar] [CrossRef]
- Grassini, S.; Corbellini, S.; Parvis, M.; Angelini, E.; Zucchi, F. A simple Arduino-based EIS system for in situ corrosion monitoring of metallic works of art. Measurement 2018, 114, 508–514. [Google Scholar] [CrossRef]
- Grossi, M.; Riccò, B. A portable electronic system for in-situ measurements of oil concentration in MetalWorking fluids. Sens. Actuators A Phys. 2016, 243, 7–14. [Google Scholar] [CrossRef] [Green Version]
- Grossi, M.; Riccò, B. An automatic titration system for oil concentration measurement in metalworking fluids. Measurement 2017, 97, 8–14. [Google Scholar] [CrossRef]
- Aponte-Luis, J.; Gómez-Galán, J.A.; Gómez-Bravo, F.; Sánchez-Raya, M.; Alcina-Espigado, J.; Teixido-Rovira, P.M. An efficient wireless sensor network for industrial monitoring and control. Sensors 2018, 18, 182. [Google Scholar] [CrossRef] [PubMed] [Green Version]
- Grossi, M.; Parolin, C.; Vitali, B.; Riccò, B. Electrical Impedance Spectroscopy (EIS) characterization of saline solutions with a low-cost portable measurement system. Eng. Sci. Technol. Int. J. 2019, 22, 102–108. [Google Scholar] [CrossRef]
- De Araujo, W.R.; Cardoso, T.M.; da Rocha, R.G.; Santana, M.H.; Munoz, R.A.; Richter, E.M.; Coltro, W.K. Portable analytical platforms for forensic chemistry: A review. Anal. Chim. Acta 2018, 1034, 1–21. [Google Scholar] [CrossRef]
- Grossi, M. A sensor-centric survey on the development of smartphone measurement and sensing systems. Measurement 2019, 135, 572–592. [Google Scholar] [CrossRef]
- Rateni, G.; Dario, P.; Cavallo, F. Smartphone-based food diagnostic technologies: A review. Sensors 2017, 17, 1453. [Google Scholar] [CrossRef]
- Kanchi, S.; Sabela, M.I.; Mdluli, P.S.; Bisetty, K. Smartphone based bioanalytical and diagnosis applications: A review. Biosens. Bioelectron. 2018, 102, 136–149. [Google Scholar] [CrossRef]
- Abd Aziz, A.; Sekercioglu, Y.A.; Fitzpatrick, P.; Ivanovich, M. A survey on distributed topology control techniques for extending the lifetime of battery powered wireless sensor networks. IEEE Commun. Surv. Tutor. 2012, 15, 121–144. [Google Scholar] [CrossRef]
- Sichitiu, M.L.; Dutta, R. Benefits of multiple battery levels for the lifetime of large wireless sensor networks. In Proceedings of the International Conference on Research in Networking; Springer: Berlin/Heidelberg, Germany, 2005; pp. 1440–1444. [Google Scholar]
- Galkin, P. Model of Reducing the Power Consumption for Node of Wireless Sensor Network in Embedded Control Systems. In Proceedings of the 2018 International Scientific-Practical Conference Problems of Infocommunications, Science and Technology (PIC S&T), Kharkiv, Ukraine, 9–12 October 2018; pp. 252–256. [Google Scholar]
- Bakker, A.; Huijsing, J.H. Micropower CMOS temperature sensor with digital output. IEEE J. Solid-State Circuits 1996, 31, 933–937. [Google Scholar] [CrossRef] [Green Version]
- Chen, W.P.; Zhao, Z.G.; Liu, X.W.; Zhang, Z.X.; Suo, C.G. A capacitive humidity sensor based on multi-wall carbon nanotubes (MWCNTs). Sensors 2009, 9, 7431–7444. [Google Scholar] [CrossRef]
- Iwaki, T.; Covington, J.A.; Udrea, F.; Ali, S.Z.; Guha, P.K.; Gardner, J.W. Design and simulation of resistive SOI CMOS micro-heaters for high temperature gas sensors. J. Phys. Conf. Ser. 2005, 15, 27–32. [Google Scholar] [CrossRef]
- Adam, G.K.; Kontaxis, P.A.; Doulos, L.T.; Madias, E.N.D.; Bouroussis, C.A.; Topalis, F.V. Embedded microcontroller with a CCD camera as a digital lighting control system. Electronics 2019, 8, 33. [Google Scholar] [CrossRef] [Green Version]
- Raghunathan, V.; Schurgers, C.; Park, S.; Srivastava, M.B. Energy-aware wireless microsensor networks. IEEE Signal Process. Mag. 2002, 3, 40–50. [Google Scholar] [CrossRef]
- Szewczyk, R.; Levis, P.; Turon, M.; Nachman, L.; Buonadonna, P.; Handziski, V. Microcontroller power management. TinyOS Enhanc. Propos. 2007, 112–119. Available online: https://www.researchgate.net/profile/Martin-Turon/publication/228605711_Microcontroller_Power_Management/links/00b495249e0bbbe320000000/Microcontroller-Power-Management.pdf (accessed on 14 January 2021).
- Aragonés, R.; Álvarez, P.; Oliver, J.; Ferrer, C. Comparison of readout circuitry techniques for data acquisition in raw sensor systems. In Proceedings of the IECON 2010—36th Annual Conference on IEEE Industrial Electronics Society, Glendale, AZ, USA, 7–10 November 2010; pp. 1252–1257. [Google Scholar]
- Lee, J.S.; Su, Y.W.; Shen, C.C. A comparative study of wireless protocols: Bluetooth, UWB, ZigBee, and Wi-Fi. In Proceedings of the IECON 2007—33rd Annual Conference of the IEEE Industrial Electronics Society, Taipei, Taiwan, 5–8 November 2007; pp. 46–51. [Google Scholar]
- Noreen, U.; Bounceur, A.; Clavier, L. A study of LoRa low power and wide area network technology. In Proceedings of the 2017 International Conference on Advanced Technologies for Signal and Image Processing (ATSIP), Fez, Morocco, 22–24 May 2017; pp. 1–6. [Google Scholar]
- Prauzek, M.; Konecny, J.; Borova, M.; Janosova, K.; Hlavica, J.; Musilek, P. Energy harvesting sources, storage devices and system topologies for environmental wireless sensor networks: A review. Sensors 2018, 18, 2446. [Google Scholar] [CrossRef] [Green Version]
- Zahid Kausar, A.S.M.; Wasif Reza, A.; Uddin Saleh, M.; Ramiah, H. Energizing wireless sensor networks by energy harvesting systems: Scopes, challenges and approaches. Renew. Sustain. Energy Rev. 2014, 38, 973–989. [Google Scholar] [CrossRef]
- Wan, Z.G.; Tan, Y.K.; Yuen, C. Review on energy harvesting and energy management for sustainable wireless sensor networks. In Proceedings of the 2011 IEEE 13th International Conference on Communication Technology, Jinan, China, 25–28 September 2011; pp. 362–367. [Google Scholar]
- Shaikh, F.K.; Zeadally, S. Energy harvesting in wireless sensor networks: A comprehensive review. Renew. Sustain. Energy Rev. 2016, 55, 1041–1054. [Google Scholar] [CrossRef]
- Yuan, F.; Zhang, Q.T.; Jin, S.; Zhu, H. Optimal harvest-use-store strategy for energy harvesting wireless systems. IEEE Trans. Wirel. Commun. 2014, 14, 698–710. [Google Scholar] [CrossRef]
- Umeda, T.; Yoshida, H.; Sekine, S.; Fujita, Y.; Suzuki, T.; Otaka, S. A 950-MHz rectifier circuit for sensor network tags with 10-m distance. IEEE J. Solid State Circuits 2006, 41, 35–41. [Google Scholar] [CrossRef]
- DC/DC Voltage Converter. Available online: http://en.wikipedia.org/wiki/DC-to-DC_converter (accessed on 21 January 2021).
- Ballo, A.; Grasso, A.D.; Palumbo, G. A review of charge pump topologies for the power management of IoT nodes. Electronics 2019, 8, 480. [Google Scholar] [CrossRef] [Green Version]
- Switched Capacitor Voltage Converter. Available online: http://en.wikipedia.org/wiki/Voltage_doubler (accessed on 12 January 2021).
- Sudevalayam, S.; Kulkarni, P. Energy harvesting sensor nodes: Survey and implications. IEEE Commun. Surv. Tutor. 2011, 13, 443–461. [Google Scholar] [CrossRef] [Green Version]
- Jiang, X.; Polastre, J.; Culler, D. Perpetual environmentally powered sensor networks. In Proceedings of the IPSN 2005, Fourth International Symposium on Information Processing in Sensor Networks, Boise, ID, USA, 15 April 2005; pp. 463–468. [Google Scholar]
- Yi, J.; Su, F.; Lam, Y.H.; Ki, W.H.; Tsui, C.Y. An energy-adaptive MPPT power management unit for micro-power vibration energy harvesting. In Proceedings of the 2008 IEEE International Symposium on Circuits and Systems, Seattle, WA, USA, 18–21 May 2008; pp. 2570–2573. [Google Scholar]
- Chew, Z.J.; Zhu, M. Microwatt power consumption maximum power point tracking circuit using an analogue differentiator for piezoelectric energy harvesting. J. Phys. Conf. Ser. 2015, 660, 012022. [Google Scholar] [CrossRef] [Green Version]
- Martins, G.C.; Serdijn, W.A. An RF energy harvester with MPPT operating across a wide range of available input power. In Proceedings of the 2018 IEEE International Symposium on Circuits and Systems (ISCAS), Florence, Italy, 27–30 May 2018; pp. 1–5. [Google Scholar]
- Raghunathan, V.; Chou, P.H. Design and power management of energy harvesting embedded systems. In Proceedings of the ISLPED’06 2006 International Symposium on Low Power Electronics and Design, Tegernsee, Germany, 4–6 October 2006; pp. 369–374. [Google Scholar]
- Rawat, R.; Chandel, S.S. Hill climbing techniques for tracking maximum power point in solar photovoltaic systems—A review. Int. J. Sustain. Dev. Green Econ. 2013, 2, 90–95. [Google Scholar]
- Ankaiah, B.; Nageswararao, J. Enhancement of solar photovoltaic cell by using short-circuit current MPPT method. Int. J. Eng. Sci. Invent. 2013, 2, 45–50. [Google Scholar]
- Baimel, D.; Tapuchi, S.; Levron, Y.; Belikov, J. Improved fractional open circuit voltage MPPT methods for PV systems. Electronics 2019, 8, 321. [Google Scholar] [CrossRef] [Green Version]
- Simjee, F.; Chou, P.H. Everlast: Long-life, supercapacitor-operated wireless sensor node. In Proceedings of the ISLPED’06 Proceedings of the 2006 International Symposium on Low Power Electronics and Design, Tegernsee, Germany, 4–6 October 2006; pp. 197–202. [Google Scholar]
- Park, C.; Chou, P.H. Ambimax: Autonomous energy harvesting platform for multi-supply wireless sensor nodes. IEEE Commun. Soc. Sens. ad hoc Commun. Netw. 2006, 1, 168–177. [Google Scholar]
- Brunelli, D.; Benini, L.; Moser, C.; Thiele, L. An efficient solar energy harvester for wireless sensor nodes. In Proceedings of the 2008 Design, Automation and Test in Europe, Munich, Germany, 10–14 March 2008; pp. 104–109. [Google Scholar]
- De Rossi, F.; Pontecorvo, T.; Brown, T.M. Characterization of photovoltaic devices for indoor light harvesting and customization of flexible dye solar cells to deliver superior efficiency under artificial lighting. Appl. Energy 2015, 156, 413–422. [Google Scholar] [CrossRef]
- Mughal, M.A.; Ma, Q.; Xiao, C. Photovoltaic cell parameter estimation using hybrid particle swarm optimization and simulated annealing. Energies 2017, 10, 1213. [Google Scholar] [CrossRef] [Green Version]
- Casio A700 Wristwatch. Available online: http://www.casio-europe.com/euro/products/watches/vintage/a700weg-9aef/ (accessed on 14 January 2021).
- Logitech K750 Keyboard. Available online: https://www.logitech.com/assets/46513/5/wireless-solar-keyboard-k750.pdf (accessed on 14 January 2021).
- Raghunathan, V.; Kansal, A.; Hsu, J.; Friedman, J.; Srivastava, M. Design considerations for solar energy harvesting wireless embedded systems. In Proceedings of the IPSN 2005, Fourth International Symposium on Information Processing in Sensor Networks, Boise, ID, USA, 15 April 2005; pp. 457–462. [Google Scholar]
- Musiani, D.; Lin, K.; Rosing, T.S. Active sensing platform for wireless structural health monitoring. In Proceedings of the 6th International Conference on Information Processing in Sensor Networks, Cambridge, MA, USA, 25–27 April 2007; pp. 390–399. [Google Scholar]
- Zhang, P.; Sadler, C.M.; Lyon, S.A.; Martonosi, M. Hardware design experiences in ZebraNet. In Proceedings of the 2nd International Conference on Embedded Networked Sensor Systems, Baltimore, MD, USA, November 2004; pp. 227–238. [Google Scholar]
- Sorber, J.; Balasubramanian, A.; Corner, M.D.; Ennen, J.R.; Qualls, C. Tula: Balancing energy for sensing and communication in a perpetual mobile system. IEEE Trans. Mob. Comput. 2012, 12, 804–816. [Google Scholar] [CrossRef]
- Loreti, P.; Catini, A.; De Luca, M.; Bracciale, L.; Gentile, G.; Di Natale, C. The design of an energy harvesting wireless sensor node for tracking pink iguanas. Sensors 2019, 19, 985. [Google Scholar] [CrossRef] [Green Version]
- Taneja, J.; Jeong, J.; Culler, D. Design, modeling, and capacity planning for micro-solar power sensor networks. In Proceedings of the 2008 International Conference on Information Processing in Sensor Networks (ipsn 2008), St. Louis, MO, USA, 22–24 April 2008; pp. 407–418. [Google Scholar]
- Minami, M.; Morito, T.; Morikawa, H.; Aoyama, T. Solar biscuit: A battery-less wireless sensor network system for environmental monitoring applications. In Proceedings of the 2nd International Workshop on Networked Sensing Systems; Association for Computing Machinery: New York, NY, USA, 2005. [Google Scholar]
- Stanley-Marbell, P.; Marculescu, D. An 0.9 × 1.2″, low power, energy-harvesting system with custom multi-channel communication interface. In Proceedings of the 2007 Design, Automation & Test in Europe Conference & Exhibition, Nice, France, 16–20 April 2007; pp. 1–6. [Google Scholar]
- Brunelli, D.; Moser, C.; Thiele, L.; Benini, L. Design of a solar-harvesting circuit for batteryless embedded systems. IEEE Trans. Circuits Syst. I Regul. Pap. 2009, 56, 2519–2528. [Google Scholar] [CrossRef]
- Wang, W.; Wang, N.; Jafer, E.; Hayes, M.; O’Flynn, B.; O’Mathuna, C. Autonomous wireless sensor network based building energy and environment monitoring system design. In Proceedings of the 2010 the 2nd Conference on Environmental Science and Information Application Technology, Wuhan, China, 17–18 July 2010; Volume 3, pp. 367–372. [Google Scholar]
- Yu, H.; Yue, Q. Indoor light energy harvesting system for energy-aware wireless sensor node. Energy Procedia 2012, 16, 1027–1032. [Google Scholar] [CrossRef] [Green Version]
- Mabon, M.; Gautier, M.; Vrigneau, B.; Le Gentil, M.; Berder, O. The Smaller the Better: Designing Solar Energy Harvesting Sensor Nodes for Long-Range Monitoring. Wirel. Commun. Mob. Comput. 2019. [Google Scholar] [CrossRef] [Green Version]
- Mathews, I.; Kantareddy, S.N.R.; Sun, S.; Layurova, M.; Thapa, J.; Correa-Baena, J.P.; Peters, I.M. Self-Powered Sensors Enabled by Wide-Bandgap Perovskite Indoor Photovoltaic Cells. Adv. Funct. Mater. 2019, 29, 1904072. [Google Scholar] [CrossRef] [Green Version]
- Batista, D.; Oliveira, L.B.; Paulino, N.; Carvalho, C.; Oliveira, J.P.; Farinhas, J.; Dos Santos, P.M. Combined Organic Photovoltaic Cells and Ultra Low Power CMOS Circuit for Indoor Light Energy Harvesting. Sensors 2019, 19, 1803. [Google Scholar] [CrossRef] [Green Version]
- Moon, E.; Lee, I.; Blaauw, D.; Phillips, J.D. High-efficiency photovoltaic modules on a chip for millimeter-scale energy harvesting. Prog. Photovolt. Res. Appl. 2019, 27, 540–546. [Google Scholar] [CrossRef]
- Saha, C.R.; O’donnell, T.; Wang, N.; McCloskey, P. Electromagnetic generator for harvesting energy from human motion. Sens. Actuators A Phys. 2008, 147, 248–253. [Google Scholar] [CrossRef]
- Rome, L.C.; Flynn, L.; Goldman, E.M.; Yoo, T.D. Generating electricity while walking with loads. Science 2005, 309, 1725–1728. [Google Scholar] [CrossRef] [PubMed] [Green Version]
- Litwhiler, D.H.; Gavigan, T.H. A door motion energy harvesting system for powering an electronic door lock. Int. J. Mod. Eng. 2014, 15, 5–10. [Google Scholar]
- Li, Z.; Zuo, L.; Luhrs, G.; Lin, L.; Qin, Y.X. Electromagnetic energy-harvesting shock absorbers: Design, modeling, and road tests. IEEE Trans. Veh. Technol. 2012, 62, 1065–1074. [Google Scholar] [CrossRef]
- Trapanese, M. Optimization of a sea wave energy harvesting electromagnetic device. IEEE Trans. Magn. 2008, 44, 4365–4368. [Google Scholar] [CrossRef]
- Cassidy, I.L.; Scruggs, J.T.; Behrens, S.; Gavin, H.P. Design and experimental characterization of an electromagnetic transducer for large-scale vibratory energy harvesting applications. J. Intell. Mater. Syst. Struct. 2011, 22, 2009–2024. [Google Scholar] [CrossRef]
- Halim, M.A.; Cho, H.; Park, J.Y. Design and experiment of a human-limb driven, frequency up-converted electromagnetic energy harvester. Energy Convers. Manag. 2015, 106, 393–404. [Google Scholar] [CrossRef]
- Halim, M.A.; Rantz, R.; Zhang, Q.; Gu, L.; Yang, K.; Roundy, S. Electromagnetic energy harvesting from swing-arm motion using rotational eccentric mass structure. In Proceedings of the 2017 19th International Conference on Solid-State Sensors, Actuators and Microsystems (TRANSDUCERS), Kaohsiung, Taiwan, 18–22 June 2017; pp. 1863–1866. [Google Scholar]
- Zorlu, Ö.; Topal, E.T.; Külah, H. A vibration-based electromagnetic energy harvester using mechanical frequency up-conversion method. IEEE Sens. J. 2010, 11, 481–488. [Google Scholar] [CrossRef]
- Kymissis, J.; Kendall, C.; Paradiso, J.; Gershenfeld, N. Parasitic power harvesting in shoes. In Proceedings of the Digest of Papers, Second IEEE International Symposium on Wearable Computers (Cat. No. 98EX215), Pittsburgh, PA, USA, 19–20 October 1998; pp. 132–139. [Google Scholar]
- Yu, J. Ambient Energy Harvesting—An Electrostatic Approach. Ph.D. Thesis, University of Hawaiʻi at Mānoa, Honolulu, HI, USA, 2018. [Google Scholar]
- Tashiro, R.; Kabei, N.; Katayama, K.; Tsuboi, E.; Tsuchiya, K. Development of an electrostatic generator for a cardiac pacemaker that harnesses the ventricular wall motion. J. Artif. Organs 2002, 5, 0239–0245. [Google Scholar] [CrossRef]
- Deterre, M.; Risquez, S.; Bouthaud, B.; Dal Molin, R.; Woytasik, M.; Lefeuvre, E. Multilayer out-of-plane overlap electrostatic energy harvesting structure actuated by blood pressure for powering intra-cardiac implants. J. Phys. Conf. Ser. 2013, 476, 012039. [Google Scholar] [CrossRef] [Green Version]
- Ahmed, S.; Kakkar, V. An electret-based angular electrostatic energy harvester for battery-less cardiac and neural implants. IEEE Access 2017, 5, 19631–19643. [Google Scholar] [CrossRef]
- Naito, Y.; Uenishi, K. Electrostatic MEMS vibration energy harvesters inside of tire treads. Sensors 2019, 19, 890. [Google Scholar] [CrossRef] [Green Version]
- Torres, E.O.; Rincón-Mora, G.A. Electrostatic energy-harvesting and battery-charging CMOS system prototype. IEEE Trans. Circuits Syst. I Regul. Papers 2008, 56, 1938–1948. [Google Scholar] [CrossRef]
- Perez, M.; Boisseau, S.; Reboud, J.L. Design and performance of a small-scale wind turbine exploiting an electret-based electrostatic conversion. J. Phys. Conf. Ser. 2015, 646, 1–4. [Google Scholar] [CrossRef]
- Zhang, Y.; Wang, T.; Luo, A.; Hu, Y.; Li, X.; Wang, F. Micro electrostatic energy harvester with both broad bandwidth and high normalized power density. Appl. Energy 2018, 212, 362–371. [Google Scholar] [CrossRef]
- Koga, H.; Mitsuya, H.; Honma, H.; Fujita, H.; Toshiyoshi, H.; Hashiguchi, G. Development of a cantilever-type electrostatic energy harvester and its charging characteristics on a highway viaduct. Micromachines 2017, 8, 293. [Google Scholar] [CrossRef] [PubMed] [Green Version]
- Covaci, C.; Gontean, A. Piezoelectric energy harvesting solutions: A review. Sensors 2020, 20, 3512. [Google Scholar] [CrossRef]
- Paradiso, J.A.; Feldmeier, M. A compact, wireless, self-powered pushbutton controller. In International Conference on Ubiquitous Computing; Springer: Berlin/Heidelberg, Germany, 2001; pp. 299–304. [Google Scholar]
- Shenck, N.S.; Paradiso, J.A. Energy scavenging with shoe-mounted piezoelectrics. IEEE Micro 2001, 21, 30–42. [Google Scholar] [CrossRef]
- Zhao, J.; You, Z. A shoe-embedded piezoelectric energy harvester for wearable sensors. Sensors 2014, 14, 12497–12510. [Google Scholar] [CrossRef] [PubMed]
- Rocha, J.G.; Goncalves, L.M.; Rocha, P.F.; Silva, M.P.; Lanceros-Mendez, S. Energy harvesting from piezoelectric materials fully integrated in footwear. IEEE Trans. Ind. Electron. 2009, 57, 813–819. [Google Scholar] [CrossRef]
- Oh, S.J.; Han, H.J.; Han, S.B.; Lee, J.Y.; Chun, W.G. Development of a tree-shaped wind power system using piezoelectric materials. Int. J. Energy Res. 2010, 34, 431–437. [Google Scholar] [CrossRef]
- Granstrom, J.; Feenstra, J.; Sodano, H.A.; Farinholt, K. Energy harvesting from a backpack instrumented with piezoelectric shoulder straps. Smart Mater. Struct. 2007, 16, 1810. [Google Scholar] [CrossRef]
- Lee, J.; Choi, B. Development of a piezoelectric energy harvesting system for implementing wireless sensors on the tires. Energy Convers. Manag. 2014, 78, 32–38. [Google Scholar] [CrossRef]
- Pisharody, H.G. An optimal design for piezoelectric energy harvesting system. In Proceedings of the ISGT2011-India, Kollam, Kerala, India, 1–3 December 2011; pp. 244–247. [Google Scholar]
- Viola, F. Comparison among different rainfall energy harvesting structures. Appl. Sci. 2018, 8, 955. [Google Scholar] [CrossRef] [Green Version]
- Doria, A.; Marconi, E.; Moro, F. Energy Harvesting from Bicycle Vibrations by Means of Tuned Piezoelectric Generators. Electronics 2020, 9, 1377. [Google Scholar] [CrossRef]
- Gayner, C.; Kar, K.K. Recent advances in thermoelectric materials. Prog. Mater. Sci. 2016, 83, 330–382. [Google Scholar] [CrossRef]
- Petsagkourakis, I.; Tybrandt, K.; Crispin, X.; Ohkubo, I.; Satoh, N.; Mori, T. Thermoelectric materials and applications for energy harvesting power generation. Sci. Technol. Adv. Mater. 2018, 19, 836–862. [Google Scholar] [CrossRef]
- Culebras, M.; Gomez, C.M.; Cantanero, A. Review on polymers for thermoelectric applications. Materials 2014, 7, 6701–6732. [Google Scholar] [CrossRef] [Green Version]
- Dubey, N.; Leclerc, M. Conducting polymers: Efficient thermoelectric materials. J. Polym. Sci. Part B Polym. Phys. 2011, 49, 467–475. [Google Scholar] [CrossRef]
- Jin, H.; Li, J.; Iocozzia, J.; Zeng, X.; Wei, P.C.; Yang, C.; Li, N.; Liu, Z.; He, J.H.; Zhu, T.; et al. Hybrid organic-inorganic thermoelectric materials and devices. Angew. Chem. Int. Ed. 2019, 58, 15206–15226. [Google Scholar] [CrossRef]
- Snyder, G.J.; Toberer, E.S. Complex thermoelectric materials. Nat. Mater. 2008, 7, 105–114. [Google Scholar] [CrossRef]
- Xia, C.; Zhang, D.; Pedrycz, W.; Fan, K.; Guo, Y. Human Body Heat Based Thermoelectric Harvester with Ultra-Low Input Power Management System for Wireless Sensors Powering. Energies 2019, 12, 3942. [Google Scholar] [CrossRef] [Green Version]
- Lu, X.; Yang, S.H. Thermal energy harvesting for WSNs. In Proceedings of the 2010 IEEE International Conference on Systems, Man and Cybernetics, Istanbul, Turkey, 10–13 October 2010; pp. 3045–3052. [Google Scholar]
- Nesarajah, M.; Frey, G. Optimized design of thermoelectric energy harvesting systems for waste heat recovery from exhaust pipes. Appl. Sci. 2017, 7, 634. [Google Scholar] [CrossRef] [Green Version]
- Samson, D.; Kluge, M.; Becker, T.; Schmid, U. Wireless sensor node powered by aircraft specific thermoelectric energy harvesting. Sens. Actuators A Phys. 2011, 172, 240–244. [Google Scholar] [CrossRef]
- Dias, P.C.; Cadavid, D.; Ortega, S.; Ruiz, A.; França, M.B.M.; Morais, F.J.; Cabot, A. Autonomous soil moisture sensor based on nanostructured thermosensitive resistors powered by an integrated thermoelectric generator. Sens. Actuators A Phys. 2016, 239, 1–7. [Google Scholar] [CrossRef]
- Yun, M.; Ustun, E.; Nadeau, P.; Chandrakasan, A. Thermal energy harvesting for self-powered smart home sensors. In Proceedings of the 2016 IEEE MIT Undergraduate Research Technology Conference (URTC), Cambridge, MA, USA, 4–6 November 2016; pp. 1–4. [Google Scholar]
- Ahn, D.; Choi, K. Performance evaluation of thermoelectric energy harvesting system on operating rolling stock. Micromachines 2018, 9, 359. [Google Scholar] [CrossRef] [PubMed] [Green Version]
- Mongia, R.; Abdelmoneum, M. Prospective for thermal energy harvesting in mobile computing systems. In Proceedings of the 2010 International Conference on Energy Aware Computing, Cairo, Egypt, 16–18 December 2010; pp. 1–4. [Google Scholar]
- Shi, Y.; Wang, Y.; Deng, Y.; Gao, H.; Lin, Z.; Zhu, W.; Ye, H. A novel self-powered wireless temperature sensor based on thermoelectric generators. Energy Convers. Manag. 2014, 80, 110–116. [Google Scholar] [CrossRef]
- Kishi, M.; Nemoto, H.; Hamao, T.; Yamamoto, M.; Sudou, S.; Mandai, M.; Yamamoto, S. Micro thermoelectric modules and their application to wristwatches as an energy source. In Proceedings of the Eighteenth International Conference on Thermoelectrics. Proceedings, ICT’99 (Cat. No.99TH8407), Baltimore, MD, USA, 29 August–2 September 1999; pp. 301–307. [Google Scholar]
- Kim, M.K.; Kim, M.S.; Lee, S.; Kim, C.; Kim, Y.J. Wearable thermoelectric generator for harvesting human body heat energy. Smart Mater. Struct. 2014, 23, 105002. [Google Scholar] [CrossRef]
- Carmo, J.P.; Gonçalves, L.M.; Correia, J.H. Thermoelectric microconverter for energy harvesting systems. IEEE Trans. Ind. Electron 2009, 57, 861–867. [Google Scholar] [CrossRef] [Green Version]
- Wang, Z.; Leonov, V.; Fiorini, P.; Van Hoof, C. Realization of a wearable miniaturized thermoelectric generator for human body applications. Sens. Actuators A Phys. 2009, 156, 95–102. [Google Scholar] [CrossRef]
- Hoang, D.C.; Tan, Y.K.; Chng, H.B.; Panda, S.K. Thermal energy harvesting from human warmth for wireless body area network in medical healthcare system. In Proceedings of the 2009 International Conference on Power Electronics and Drive Systems (PEDS), Taipei, Taiwan, 2–5 November 2009; pp. 1277–1282. [Google Scholar]
- Proto, A.; Bibbo, D.; Cerny, M.; Vala, D.; Kasik, V.; Peter, L.; Penhaker, M. Thermal energy harvesting on the bodily surfaces of arms and legs through a wearable thermo-electric generator. Sensors 2018, 18, 1927. [Google Scholar] [CrossRef] [PubMed] [Green Version]
- Luo, C.; Gil, I.; Fernandez-Garcia, R. Wearable textile UHF-RFID sensors: A systematic review. Materials 2020, 13, 3292. [Google Scholar] [CrossRef] [PubMed]
- Want, R. An introduction to RFID technology. Pervasive Comput. 2006, 1, 25–33. [Google Scholar] [CrossRef]
- Du, H. NFC technology: Today and tomorrow. Int. J. Future Comput. Commun. 2013, 2, 351–354. [Google Scholar] [CrossRef]
- Leavitt, N. Are mobile payments ready to cash in yet? Computer 2012, 45, 15–18. [Google Scholar] [CrossRef]
- Chen, Y.Y.; Tsai, M.L.; Chang, F.J. The design of secure mobile coupon mechanism with the implementation for NFC smartphones. Comput. Electr. Eng. 2017, 59, 204–217. [Google Scholar] [CrossRef]
- Pesonen, J.; Horster, E. Near field communication technology in tourism. Tour. Manag. Perspect. 2012, 4, 11–18. [Google Scholar] [CrossRef]
- Marindra, A.M.J.; Tian, G.Y. Chipless RFID sensor tag for metal crack detection and characterization. IEEE Trans. Microw. Theory Tech. 2018, 66, 2452–2462. [Google Scholar] [CrossRef]
- Vena, A.; Perret, E.; Kaddour, D.; Baron, T. Toward a reliable chipless RFID humidity sensor tag based on silicon nanowires. IEEE Trans. Microw. Theory Tech. 2016, 64, 2977–2985. [Google Scholar] [CrossRef]
- Genovesi, S.; Costa, F.; Borgese, M.; Dicandia, F.A.; Manara, G. Chipless radio frequency identification (RFID) sensor for angular rotation monitoring. Technologies 2018, 6, 61. [Google Scholar] [CrossRef] [Green Version]
- Liu, Y.; Deng, F.; He, Y.; Li, B.; Liang, Z.; Zhou, S. Novel concrete temperature monitoring method based on an embedded passive RFID sensor tag. Sensors 2017, 17, 1463. [Google Scholar] [CrossRef] [PubMed] [Green Version]
- Rivadeneyra, A.; Albrecht, A.; Lugli, P.; Becherer, M.; Salmerón, J.F. UHF Printed Sensor for Force Detection. In Proceedings of the Fifth International Conference on Advances in Sensors, Actuators, Metering and Sensing, Valencia, Spain, 21–25 November 2020. [Google Scholar]
- Hillier, A.J.; Makarovaite, V.; Gourlay, C.W.; Holder, S.J.; Batchelor, J.C. A Passive UHF RFID Dielectric Sensor for Aqueous Electrolytes. IEEE Sens. J. 2019, 19, 5389–5395. [Google Scholar] [CrossRef] [Green Version]
- Saggin, B.; Belaizi, Y.; Vena, A.; Sorli, B.; Guillard, V.; Dedieu, I. A Flexible Biopolymer based UHF RFID-Sensor for food quality monitoring. In Proceedings of the 2019 IEEE International Conference on RFID Technology and Applications (RFID-TA), Pisa, Italy, 25–27 September 2019; pp. 484–487. [Google Scholar]
- Cho, N.; Song, S.J.; Kim, S.; Kim, S.; Yoo, H.J. A 5.1-µW uhf rfid tag chip integrated with sensors for wireless environmental monitoring. In Proceedings of the 31st European Solid-State Circuits Conference, 2005. ESSCIRC 2005, Grenoble, France, 12–16 September 2005; pp. 279–282. [Google Scholar]
- Dondi, D.; Scorcioni, S.; Bertacchini, A.; Larcher, L.; Pavan, P. An autonomous wireless sensor network device powered by a RF energy harvesting system. In Proceedings of the IECON 2012—38th Annual Conference on IEEE Industrial Electronics Society, Montreal, QC, Canada, 25–28 October 2012; pp. 2557–2562. [Google Scholar]
- Boada, M.; Lazaro, A.; Villarino, R.; Girbau, D. Battery-less NFC sensor for pH monitoring. IEEE Access 2019, 7, 33226–33239. [Google Scholar] [CrossRef]
- Carvajal, M.A.; Escobedo, P.; Jimenez-Melguizo, M.; Martinez-Garcia, M.S.; Martinez-Marti, F.; Martinez-Olmos, A.; Palma, A.J. A compact dosimetric system for MOSFETs based on passive NFC tag and smartphone. Sensors Actuators A Phys. 2017, 267, 82–89. [Google Scholar] [CrossRef]
- Xu, G.; Zhang, Q.; Lu, Y.; Liu, L.; Ji, D.; Li, S.; Liu, Q. Passive and wireless near field communication tag sensors for biochemical sensing with smartphone. Sens. Actuators B Chem. 2017, 246, 748–755. [Google Scholar] [CrossRef]
- Luo, Y.; Pu, L.; Wang, G.; Zhao, Y. RF energy harvesting wireless communications: RF environment, device hardware and practical issues. Sensors 2019, 19, 3010. [Google Scholar] [CrossRef] [PubMed] [Green Version]
- Bito, J.; Hester, J.G.; Tentzeris, M.M. Ambient RF energy harvesting from a two-way talk radio for flexible wearable wireless sensor devices utilizing inkjet printing technologies. IEEE Trans. Microw. Theory Tech. 2015, 63, 4533–4543. [Google Scholar] [CrossRef]
- Parks, A.N.; Sample, A.P.; Zhao, Y.; Smith, J.R. A wireless sensing platform utilizing ambient RF energy. In Proceedings of the 2013 IEEE Topical Conference on Biomedical Wireless Technologies, Networks, and Sensing Systems, Austin, TX, USA, 20–23 January 2013; pp. 154–156. [Google Scholar]
- Nintanavongsa, P.; Muncuk, U.; Lewis, D.R.; Chowdhury, K.R. Design optimization and implementation for RF energy harvesting circuits. IEEE J. Emerg. Sel. Top. Circuits Syst. 2012, 2, 24–33. [Google Scholar] [CrossRef]
- Nishimoto, H.; Kawahara, Y.; Asami, T. Prototype implementation of ambient RF energy harvesting wireless sensor networks. In Proceedings of the SENSORS, 2010 IEEE, Waikoloa, HI, USA, 1–4 November 2010; pp. 1282–1287. [Google Scholar]
- Kim, Y.J.; Bhamra, H.S.; Joseph, J.; Irazoqui, P.P. An ultra-low-power RF energy-harvesting transceiver for multiple-node sensor application. IEEE Trans. Circuits Syst. II Express Briefs 2015, 62, 1028–1032. [Google Scholar] [CrossRef]
- Baranov, A.M.; Akbari, S.; Spirjakin, D.; Bragar, A.; Karelin, A. Feasibility of RF energy harvesting for wireless gas sensor nodes. Sens. Actuators A Phys. 2018, 275, 37–43. [Google Scholar] [CrossRef]
- Bouchouicha, D.; Dupont, F.; Latrach, M.; Ventura, L. Ambient RF energy harvesting. Int. Conf. Renew. Energ. Power Qual. 2010, 13, 2–6. [Google Scholar] [CrossRef] [Green Version]
- Piñuela, M.; Mitcheson, P.D.; Lucyszyn, S. Ambient RF energy harvesting in urban and semi-urban environments. IEEE Trans. Microw. Theory Tech. 2013, 61, 2715–2726. [Google Scholar] [CrossRef]
- Jabbar, H.; Song, Y.S.; Jeong, T.T. RF energy harvesting system and circuits for charging of mobile devices. IEEE Trans. Consum. Electron. 2010, 56, 247–253. [Google Scholar] [CrossRef]
- Katz, E. Implantable Biofuel Cells Operating In Vivo—Potential Power Sources for Bioelectronic Devices. Bioelectron. Med. 2015, 2, 1–12. [Google Scholar] [CrossRef] [Green Version]
- An Overview of Bio-Battery—Working Principle, Types and Applications. Available online: http://www.elprocus.com/an-overview-of-bio-battery-working-principle-types-applications/ (accessed on 4 December 2020).
- Miyake, T.; Haneda, K.; Nagai, N.; Yatagawa, Y.; Onami, H.; Yoshino, S.; Nishizawa, M. Enzymatic biofuel cells designed for direct power generation from biofluids in living organisms. Energy Environ. Sci. 2011, 4, 5008–5012. [Google Scholar] [CrossRef]
- Flexer, V.; Mano, N. From dynamic measurements of photosynthesis in a living plant to sunlight transformation into electricity. Anal. Chem. 2010, 82, 1444–1449. [Google Scholar] [CrossRef]
- MacVittie, K.; Conlon, T.; Katz, E. A wireless transmission system powered by an enzyme biofuel cell implanted in an orange. Bioelectrochemistry 2015, 106, 28–33. [Google Scholar] [CrossRef] [Green Version]
- Huang, S.H.; Chen, W.H.; Lin, Y.C. A Self-Powered Glucose Biosensor Operated Underwater to Monitor Physiological Status of Free-Swimming Fish. Energies 2019, 12, 1827. [Google Scholar] [CrossRef] [Green Version]
- Cinquin, P.; Gondran, C.; Giroud, F.; Mazabrard, S.; Pellissier, A.; Boucher, F.; Porcu, P. A glucose biofuel cell implanted in rats. PLoS ONE 2010, 5, e10476. [Google Scholar] [CrossRef] [PubMed]
- Zebda, A.; Cosnier, S.; Alcaraz, J.P.; Holzinger, M.; Le Goff, A.; Gondran, C.; Cinquin, P. Single glucose biofuel cells implanted in rats power electronic devices. Sci. Rep. 2013, 3, 1–5. [Google Scholar] [CrossRef] [PubMed] [Green Version]
- Szczupak, A.; Halámek, J.; Halámková, L.; Bocharova, V.; Alfonta, L.; Katz, E. Living battery–biofuel cells operating in vivo in clams. Energy Environ. Sci. 2012, 5, 8891–8895. [Google Scholar] [CrossRef]
- Schwefel, J.; Ritzmann, R.E.; Lee, I.N.; Pollack, A.; Weeman, W.; Garverick, S.; Scherson, D. Wireless communication by an autonomous self-powered cyborg insect. J. Electrochem. Soc. 2014, 161, H3113. [Google Scholar] [CrossRef]
- Shoji, K.; Akiyama, Y.; Suzuki, M.; Nakamura, N.; Ohno, H.; Morishima, K. Biofuel cell backpacked insect and its application to wireless sensing. Biosens. Bioelectron. 2016, 78, 390–395. [Google Scholar] [CrossRef] [PubMed]
- MacVittie, K.; Halámek, J.; Halámková, L.; Southcott, M.; Jemison, W.D.; Lobel, R.; Katz, E. From “cyborg” lobsters to a pacemaker powered by implantable biofuel cells. Energy Environ. Sci. 2013, 6, 81–86. [Google Scholar] [CrossRef]
- Halámková, L.; Halámek, J.; Bocharova, V.; Szczupak, A.; Alfonta, L.; Katz, E. Implanted biofuel cell operating in a living snail. J. Am. Chem. Soc. 2012, 134, 5040–5043. [Google Scholar] [CrossRef]
- Ghoreishizadeh, S.S.; Moschou, D.; McBay, D.; Gonalez-Solino, C.; Dutta, G.; Di Lorenzo, M.; Soltan, A. Towards self-powered and autonomous wearable glucose sensor. In Proceedings of the 2018 25th IEEE International Conference on Electronics, Circuits and Systems (ICECS), Bordeaux, France, 9–12 December 2018; pp. 701–704. [Google Scholar]
- Slaughter, G.; Kulkarni, T. A self-powered glucose biosensing system. Biosens. Bioelectron. 2016, 78, 45–50. [Google Scholar] [CrossRef] [Green Version]
- Southcott, M.; MacVittie, K.; Halámek, J.; Halámková, L.; Jemison, W.D.; Lobel, R.; Katz, E. A pacemaker powered by an implantable biofuel cell operating under conditions mimicking the human blood circulatory system–battery not included. Phys. Chem. Chem. Phys. 2013, 15, 6278–6283. [Google Scholar] [CrossRef]
- Estrada-Lopez, J.J.; Abuellil, A.; Zeng, Z.; Sanchez-Sinencio, E. Multiple input energy harvesting systems for autonomous IoT end-nodes. J. Low Power Electron. Appl. 2018, 8, 6. [Google Scholar] [CrossRef] [Green Version]
- Dalola, S.; Ferrari, V.; Guizzetti, M.; Marioli, D.; Sardini, E.; Serpelloni, M.; Taroni, A. Autonomous sensor system with power harvesting for telemetric temperature measurements of pipes. IEEE Trans. Instrum. Meas. 2009, 58, 1471–1478. [Google Scholar] [CrossRef]
- Magno, M.; Salvatore, G.A.; Mutter, S.; Farrukh, W.; Troester, G.; Benini, L. Autonomous smartwatch with flexible sensors for accurate and continuous mapping of skin temperature. In Proceedings of the 2016 IEEE International Symposium on Circuits and Systems (ISCAS), Montreal, QC, Canada, 22–25 May 2016; pp. 337–340. [Google Scholar]
- Porcarelli, D.; Donati, I.; Nehani, J.; Brunelli, D.; Magno, M.; Benini, L. Design and implementation of a multi sensors self sustainable wearable device. In Proceedings of the 2014 6th European Embedded Design in Education and Research Conference (EDERC), Milano, Italy, 11–12 September 2014; pp. 16–20. [Google Scholar]
- Georgiadis, A.; Collado, A.; Via, S.; Meneses, C. Flexible hybrid solar/EM energy harvester for autonomous sensors. In Proceedings of the 2011 IEEE MTT-S International Microwave Symposium, Baltimore, MD, USA, 5–10 June 2011; pp. 1–4. [Google Scholar]
- Yu, H.; Yue, Q.; Zhou, J.; Wang, W. A hybrid indoor ambient light and vibration energy harvester for wireless sensor nodes. Sensors 2014, 14, 8740–8755. [Google Scholar] [CrossRef] [Green Version]
- Wang, W.; Vinco, A.; Pavlov, N.; Wang, N.; Hayes, M.; O’Mathuna, C. A rotating machine acoustic emission monitoring system powered by multi-source energy harvester. In Proceedings of the 1st International Workshop on Energy Neutral Sensing Systems; Association for Computing Machinery: Rome, Italy, 2013; pp. 1–6. [Google Scholar]
- Suzuki, T.; Yoshikawa, K.; Momose, S. Integration of organic photovoltaic and thermoelectric hybrid module for energy harvesting applications. In Proceedings of the 2010 International Electron Devices Meeting, San Francisco, CA, USA, 6–8 December 2010; pp. 31–36. [Google Scholar]
- Colomer-Farrarons, J.; Miribel-Catala, P.; Saiz-Vela, A.; Samitier, J. A multiharvested self-powered system in a low-voltage low-power technology. IEEE Trans. Ind. Electron. 2010, 58, 4250–4263. [Google Scholar] [CrossRef]
- Tan, Y.K.; Panda, S.K. Energy harvesting from hybrid indoor ambient light and thermal energy sources for enhanced performance of wireless sensor nodes. IEEE Trans. Ind. Electron. 2010, 58, 4424–4435. [Google Scholar] [CrossRef]
- Zhang, Y.; Zhang, F.; Shakhsheer, Y.; Silver, J.D.; Klinefelter, A.; Nagaraju, M.; Wood, A. A Batteryless 19 µW MICS/ISM-Band Energy Harvesting Body Sensor Node SoC for ExG Applications. IEEE J. Solid-State Circuits 2012, 48, 199–213. [Google Scholar] [CrossRef]
- Saraereh, O.A.; Alsaraira, A.; Khan, I.; Choi, B.J. A hybrid energy harvesting design for on-body Internet-of-Things (IoT) networks. Sensors 2020, 20, 407. [Google Scholar] [CrossRef] [PubMed] [Green Version]
- Hamid, R.; Yuce, M.R. A wearable energy harvester unit using piezoelectric–electromagnetic hybrid technique. Sens. Actuators A Phys. 2017, 257, 198–207. [Google Scholar] [CrossRef]
- Chamanian, S.; Çiftci, B.; Uluşan, H.; Muhtaroğlu, A.; Külah, H. Power-Efficient Hybrid Energy Harvesting System for Harnessing Ambient Vibrations. IEEE Trans. Circuits Syst. I Regul. Papers 2019, 66, 2784–2793. [Google Scholar] [CrossRef]
- Iqbal, M.; Khan, F.U. Hybrid vibration and wind energy harvesting using combined piezoelectric and electromagnetic conversion for bridge health monitoring applications. Energy Convers. Manag. 2018, 172, 611–618. [Google Scholar] [CrossRef]
- Deng, F.; Yue, X.; Fan, X.; Guan, S.; Xu, Y.; Chen, J. Multisource energy harvesting system for a wireless sensor network node in the field environment. IEEE Internet Things J. 2018, 6, 918–927. [Google Scholar] [CrossRef]
- Mori, T.; Priya, S. Materials for energy harvesting: At the forefront of a new wave. MRS Bull. 2018, 43, 176–180. [Google Scholar] [CrossRef] [Green Version]
- Liu, Z.; Mao, J.; Liu, T.H.; Chen, G.; Ren, Z. Nano-microstructural control of phonon engineering for thermoelectric energy harvesting. MRS Bull. 2018, 43, 181–186. [Google Scholar] [CrossRef] [Green Version]
- Cho, K.H.; Priya, S. Direct and converse effect in magnetoelectric laminate composites. Appl. Phys. Lett. 2011, 98, 232904. [Google Scholar] [CrossRef] [Green Version]
- Zhu, J.; Zhu, M.; Shi, Q.; Wen, F.; Liu, L.; Dong, B.; Lee, C. Progress in TENG technology—A journey from energy harvesting to nanoenergy and nanosystem. EcoMat 1205, 2, e12058. [Google Scholar]
- Kansal, A.; Hsu, J.; Zahedi, S.; Srivastava, M.B. Power management in energy harvesting sensor networks. ACM Trans. Embed. Comput. Syst. (TECS) 2007, 6, 32-es. [Google Scholar] [CrossRef]
- Piorno, J.R.; Bergonzini, C.; Atienza, D.; Rosing, T.S. Prediction and management in energy harvested wireless sensor nodes. In Proceedings of the 2009 1st International Conference on Wireless Communication, Vehicular Technology, Information Theory and Aerospace & Electronic Systems Technology, Aalborg, Denmark, 17–20 May 2009; pp. 6–10. [Google Scholar]
- Moser, C.; Thiele, L.; Brunelli, D.; Benini, L. Adaptive power management in energy harvesting systems. In Proceedings of the 2007 Design, Automation & Test in Europe Conference & Exhibition, Nice, France, 16–20 April 2007; pp. 1–6. [Google Scholar]
- Lu, J.; Whitehouse, K. SunCast: Fine-grained prediction of natural sunlight levels for improved daylight harvesting. In Proceedings of the 2012 ACM/IEEE 11th International Conference on Information Processing in Sensor Networks (IPSN), Beijing, China, 16–20 April 2012; pp. 245–256. [Google Scholar]
- Cammarano, A.; Petrioli, C.; Spenza, D. Pro-Energy: A novel energy prediction model for solar and wind energy-harvesting wireless sensor networks. In Proceedings of the 2012 IEEE 9th International Conference on Mobile Ad-Hoc and Sensor Systems (MASS 2012), Las Vegas, NV, USA, 8–11 October 2012; pp. 75–83. [Google Scholar]
- Sharma, N.; Sharma, P.; Irwin, D.; Shenoy, P. Predicting solar generation from weather forecasts using machine learning. In Proceedings of the 2011 IEEE International Conference on Smart Grid Communications (SmartGridComm), Brussels, Belgium, 17–20 October 2011; pp. 528–533. [Google Scholar]
- De Araújo, G.M.; Pinto, A.R.; Kaiser, J.; Becker, L.B. Genetic machine learning approach for link quality prediction in mobile wireless sensor networks. Coop. Robot. Sens. Netw. 2014, 507, 1–18. [Google Scholar]
- De Araújo, G.M.; Kaiser, J.; Becker, L.B. An optimized Markov model to predict link quality in mobile wireless sensor networks. In Proceedings of the 2012 IEEE Symposium on Computers and Communications (ISCC), Cappadocia, Turkey, 1–4 July 2012; pp. 000307–000312. [Google Scholar]
- Ye, Y.; Azmat, F.; Adenopo, I.; Chen, Y.; Shi, R. RF energy modelling using machine learning for energy harvesting communications systems. Int. J. Commun. Syst. 2021, 34, e4688. [Google Scholar] [CrossRef]
- Xiang, X.; Liu, W.; Liu, A.; Xiong, N.N.; Zeng, Z.; Cai, Z. Adaptive duty cycle control–based opportunistic routing scheme to reduce delay in cyber physical systems. Int. J. Distrib. Sens. Netw. 2019, 15, 1550147719841870. [Google Scholar] [CrossRef] [Green Version]
- Magno, M.; Marinkovic, S.; Srbinovski, B.; Popovici, E.M. Wake-up radio receiver based power minimization techniques for wireless sensor networks: A review. Microelectron. J. 2014, 45, 1627–1633. [Google Scholar] [CrossRef]
- Bello, H.; Xiaoping, Z.; Nordin, R.; Xin, J. Advances and opportunities in passive wake-up radios with wireless energy harvesting for the internet of things applications. Sensors 2019, 19, 3078. [Google Scholar] [CrossRef] [PubMed] [Green Version]
- Liu, H.; Zhang, G.; Zheng, X.; Chen, F.; Duan, H. Emerging miniaturized energy storage devices for microsystem applications: From design to integration. Int. J. Extrem. Manuf. 2020, 2, 042001. [Google Scholar] [CrossRef]
Figure 1.
Schematic of a mobile system powered by energy harvesting.

Figure 2.
Schematic of a diode bridge rectifier circuit.

Figure 3.
Schematic circuit of a buck converter (a), boost converter (b) and buck-boost converter (c) as presented in [50].
Figure 3.
Schematic circuit of a buck converter (a), boost converter (b) and buck-boost converter (c) as presented in [50].

Figure 4.
Waveforms of the output voltage VOUT and the inductor current IL for the minimum phase boost converter presented in Figure 3b shown as function of time.
Figure 4.
Waveforms of the output voltage VOUT and the inductor current IL for the minimum phase boost converter presented in Figure 3b shown as function of time.

Figure 5.
Schematic of the switching capacitor based charge pump circuit presented in [52] capable to generate an output voltage that is two times higher than the input voltage.
Figure 5.
Schematic of the switching capacitor based charge pump circuit presented in [52] capable to generate an output voltage that is two times higher than the input voltage.

Figure 6.
Waveforms voltages for the switching capacitor based charge pump circuit presented in Figure 5 shown as function of time.
Figure 6.
Waveforms voltages for the switching capacitor based charge pump circuit presented in Figure 5 shown as function of time.

Figure 7.
Schematic of a MPPT circuit designed using a microcontroller.

Figure 8.
Schematic of the MPPT circuit presented in [64].
Figure 8.
Schematic of the MPPT circuit presented in [64].

Figure 9.
Equivalent circuit model of a photovoltaic cell presented in [66].
Figure 9.
Equivalent circuit model of a photovoltaic cell presented in [66].

Figure 10.
Characteristic curves of a photovoltaic cell under the conditions: Is = 10−15 A, VOC = 651 mV, Rs = 15 Ω, Rp = 250 Ω, T = 25 °C. The curves have been calculated using the equivalent circuit model of a photovoltaic cell presented in Figure 9.
Figure 10.
Characteristic curves of a photovoltaic cell under the conditions: Is = 10−15 A, VOC = 651 mV, Rs = 15 Ω, Rp = 250 Ω, T = 25 °C. The curves have been calculated using the equivalent circuit model of a photovoltaic cell presented in Figure 9.

Figure 11.
Schematic representation of an electromagnetic transducer.

Figure 12.
Simplified schematic of the circuit used for charge constrained electrostatic transduction as presented in [93].
Figure 12.
Simplified schematic of the circuit used for charge constrained electrostatic transduction as presented in [93].

Figure 13.
Schematic of a cantilever piezoelectric transducer.

Figure 14.
Thermocouple schematic and its equivalent electrical circuit as presented in [120].
Figure 14.
Thermocouple schematic and its equivalent electrical circuit as presented in [120].

Figure 15.
Harvested power of a thermoelectric module plotted vs the load resistance. The simulation has been carried out for the circuit of Figure 14 under the following conditions: RG = 902 Ω, αp = 0.53 mV∙K−1, αn = −0.19 mV∙K−1, TH − TC = 10 °C.
Figure 15.
Harvested power of a thermoelectric module plotted vs the load resistance. The simulation has been carried out for the circuit of Figure 14 under the following conditions: RG = 902 Ω, αp = 0.53 mV∙K−1, αn = −0.19 mV∙K−1, TH − TC = 10 °C.

Figure 16.
Harvested power of a thermoelectric module plotted vs. the thermal difference in the condition of impedance matching. The simulation has been carried out for the circuit of Figure 14 under the following conditions: RLOAD = RG = 902 Ω, αp = 0.53 mV∙K−1, αn = −0.19 mV∙K−1.
Figure 16.
Harvested power of a thermoelectric module plotted vs. the thermal difference in the condition of impedance matching. The simulation has been carried out for the circuit of Figure 14 under the following conditions: RLOAD = RG = 902 Ω, αp = 0.53 mV∙K−1, αn = −0.19 mV∙K−1.

Figure 17.
Schematics of the working principle of an active tag (a), passive tag (b) and semi-passive tag (c).
Figure 17.
Schematics of the working principle of an active tag (a), passive tag (b) and semi-passive tag (c).

Figure 18.
Schematic of an RF energy harvesting system that scavenges power from sources present in the environment.
Figure 18.
Schematic of an RF energy harvesting system that scavenges power from sources present in the environment.

Figure 19.
Schematic of a glucose biofuel cell as presented in [164].
Figure 19.
Schematic of a glucose biofuel cell as presented in [164].

Figure 20.
Schematic of the Power ORing architecture for hybrid energy harvesting presented in [179].
Figure 20.
Schematic of the Power ORing architecture for hybrid energy harvesting presented in [179].


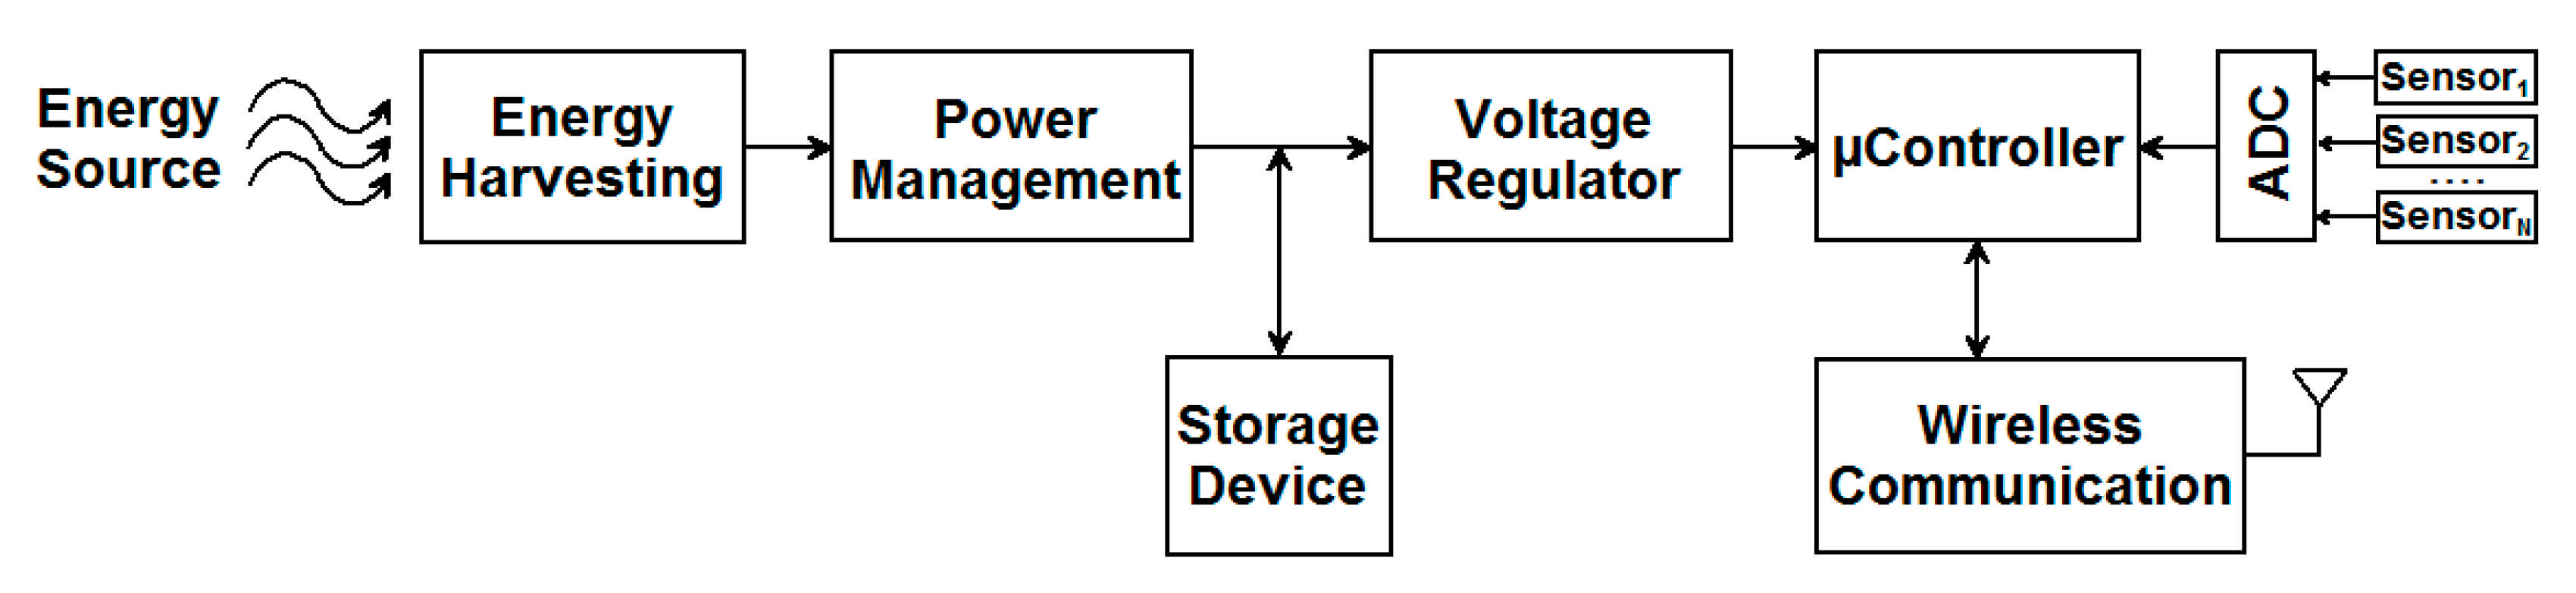
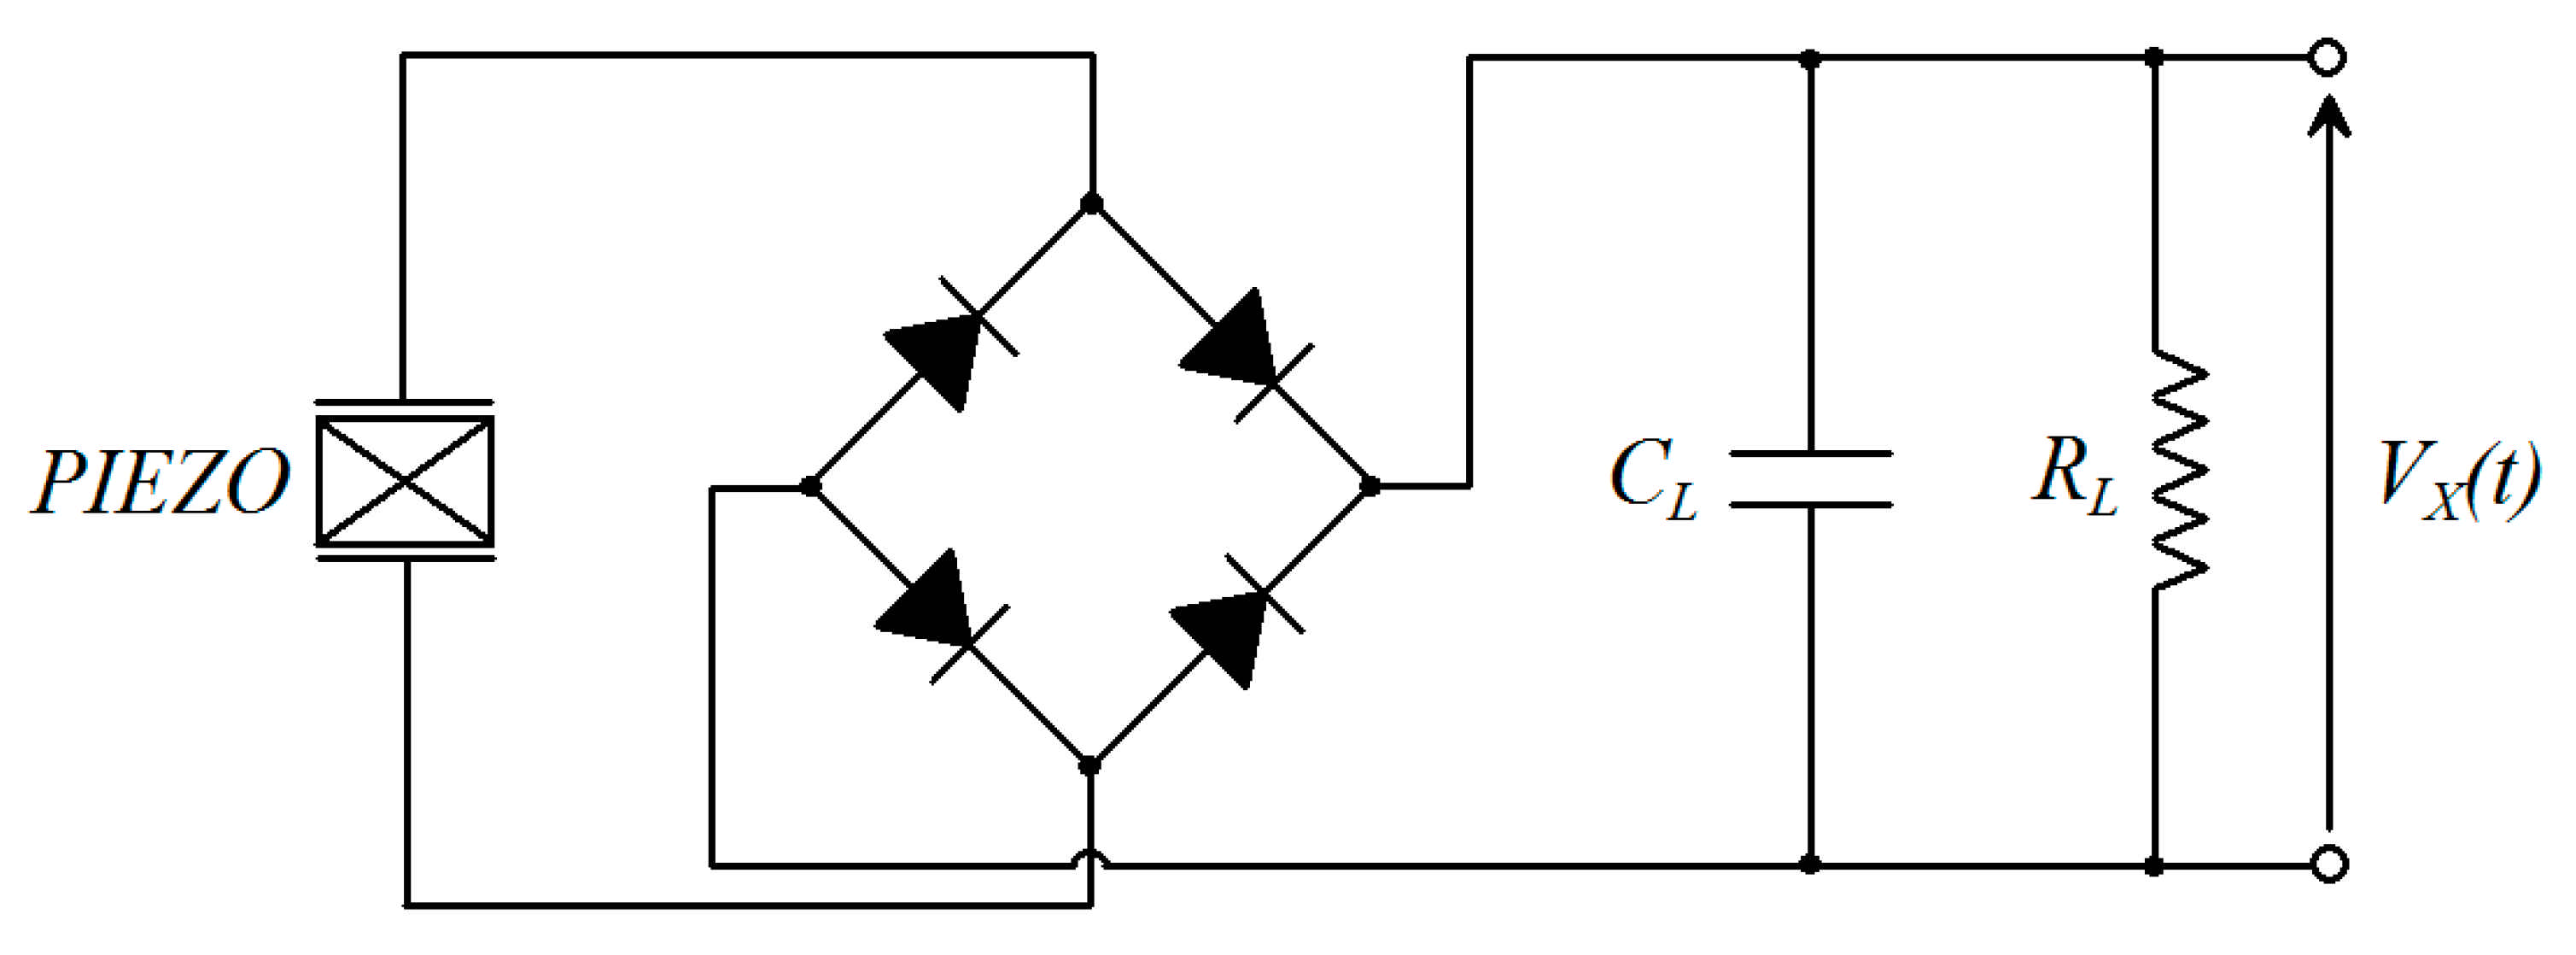
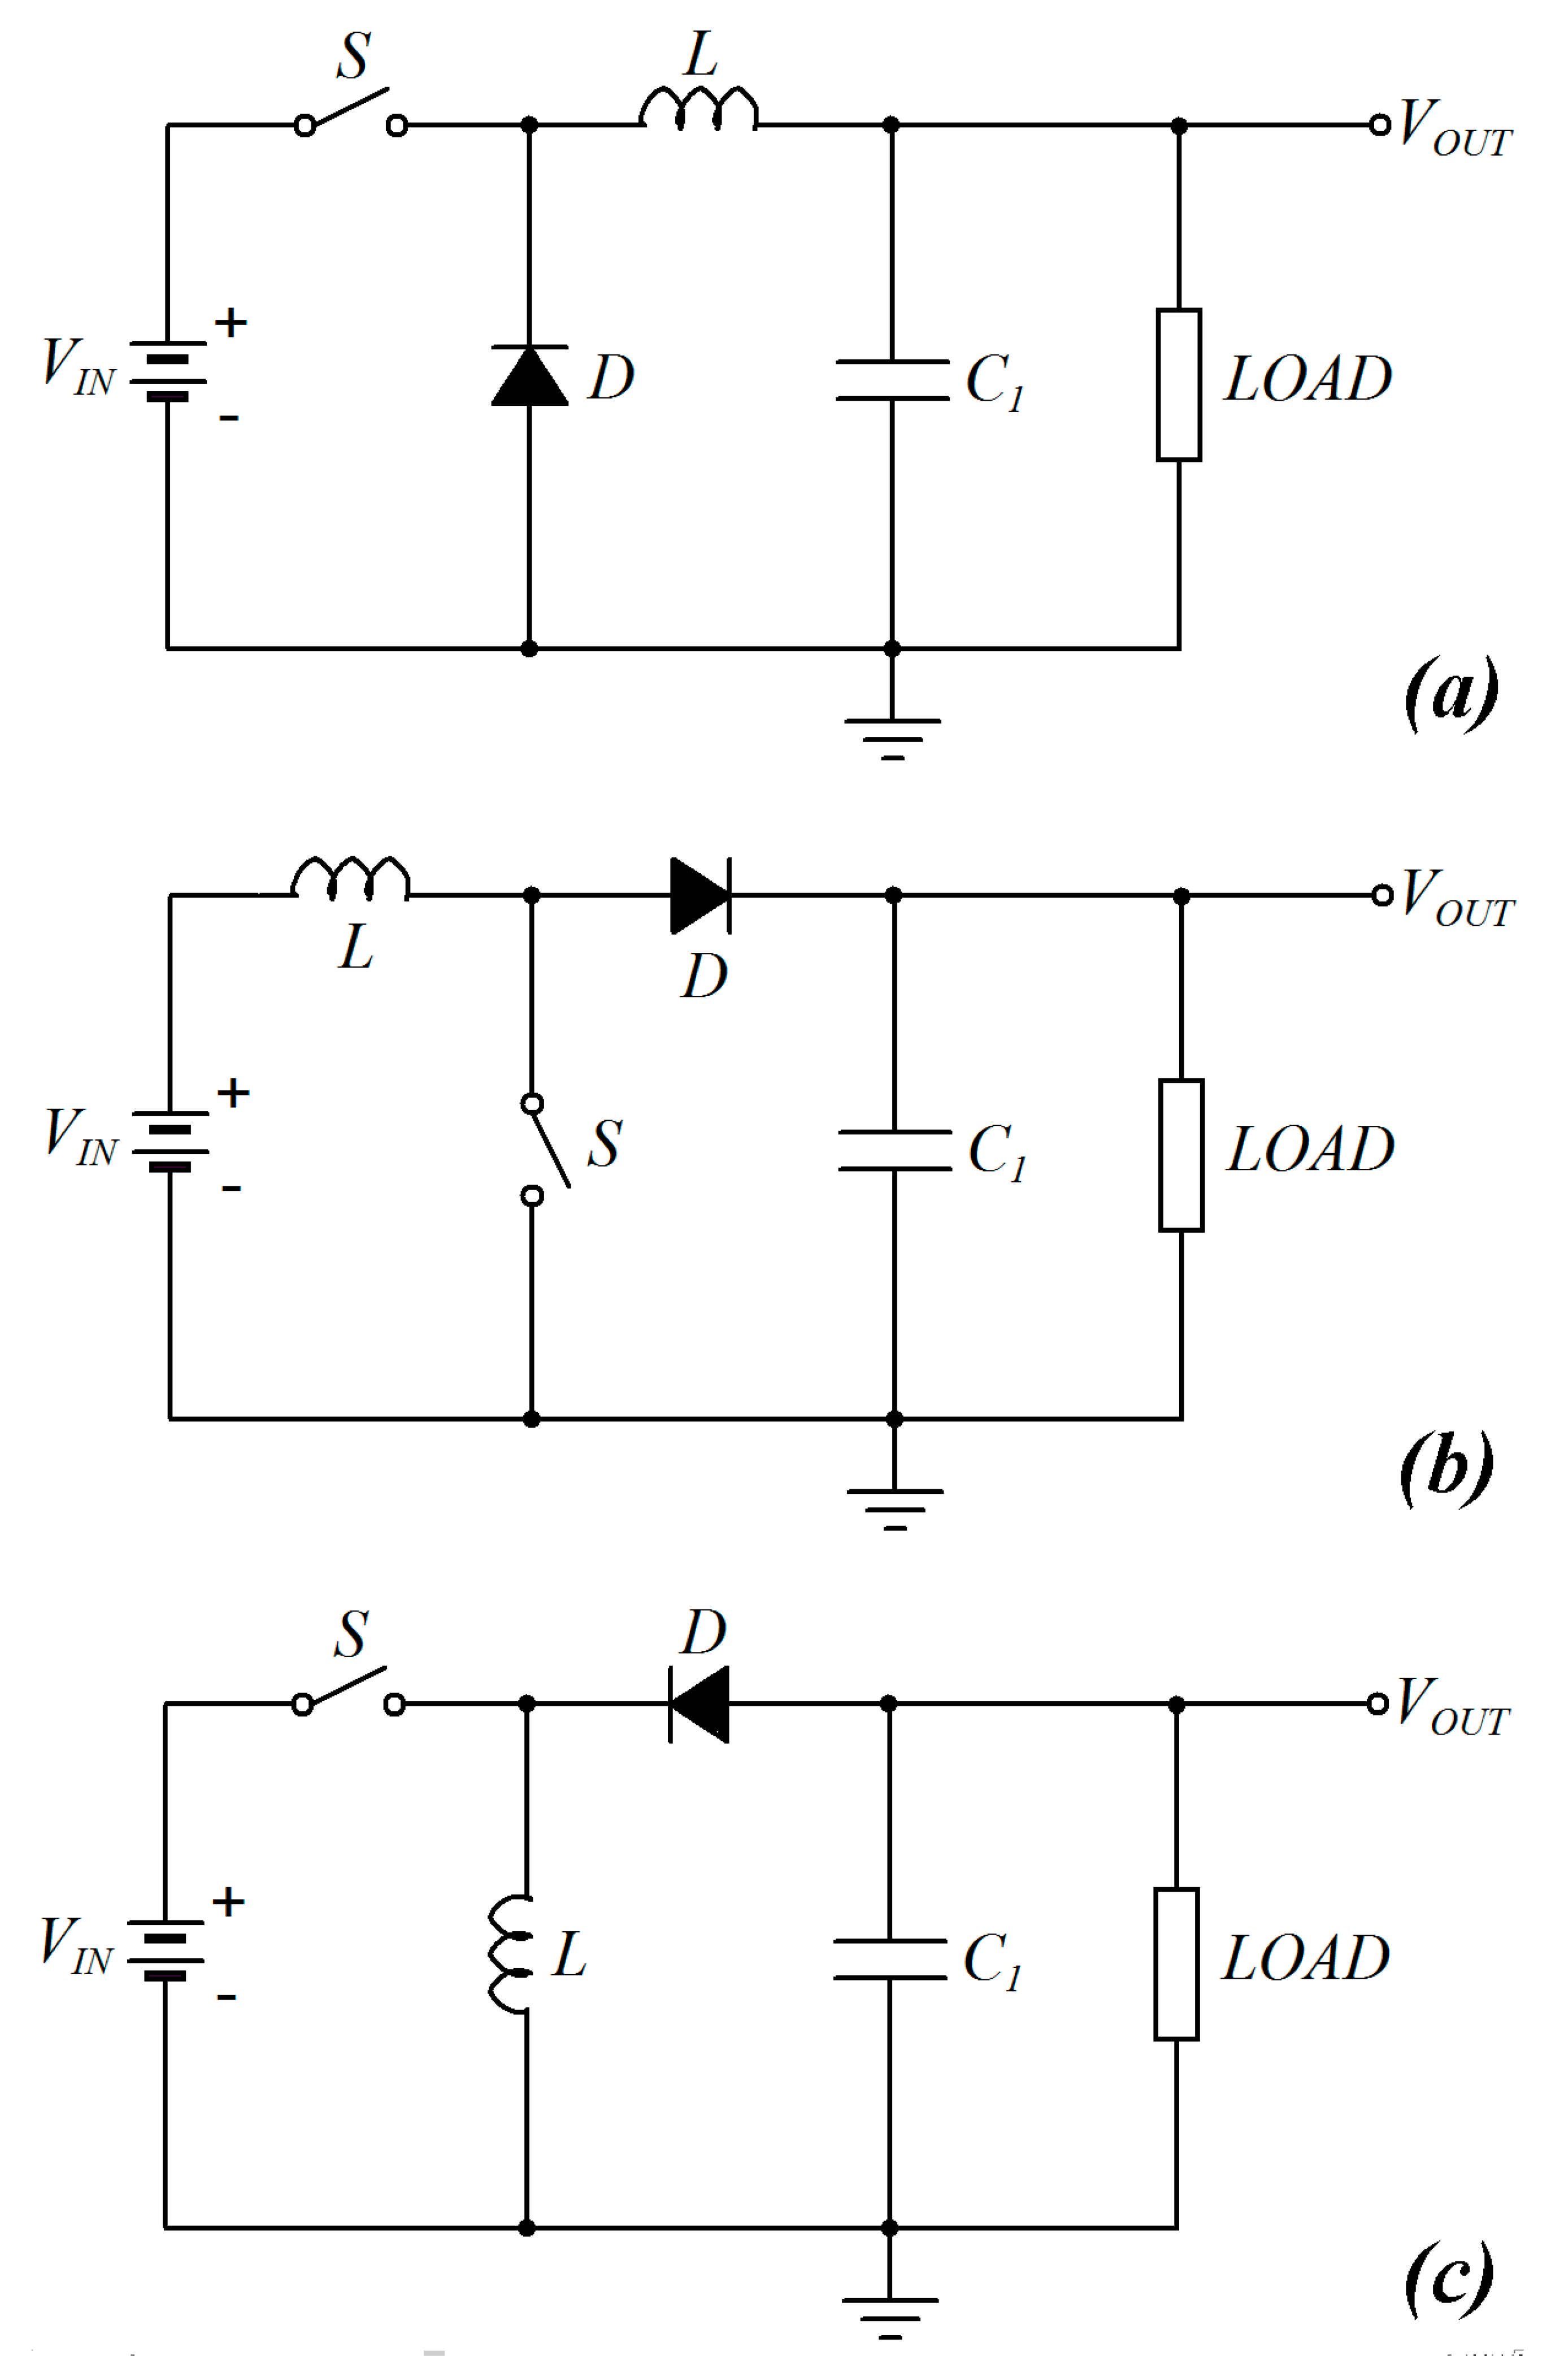
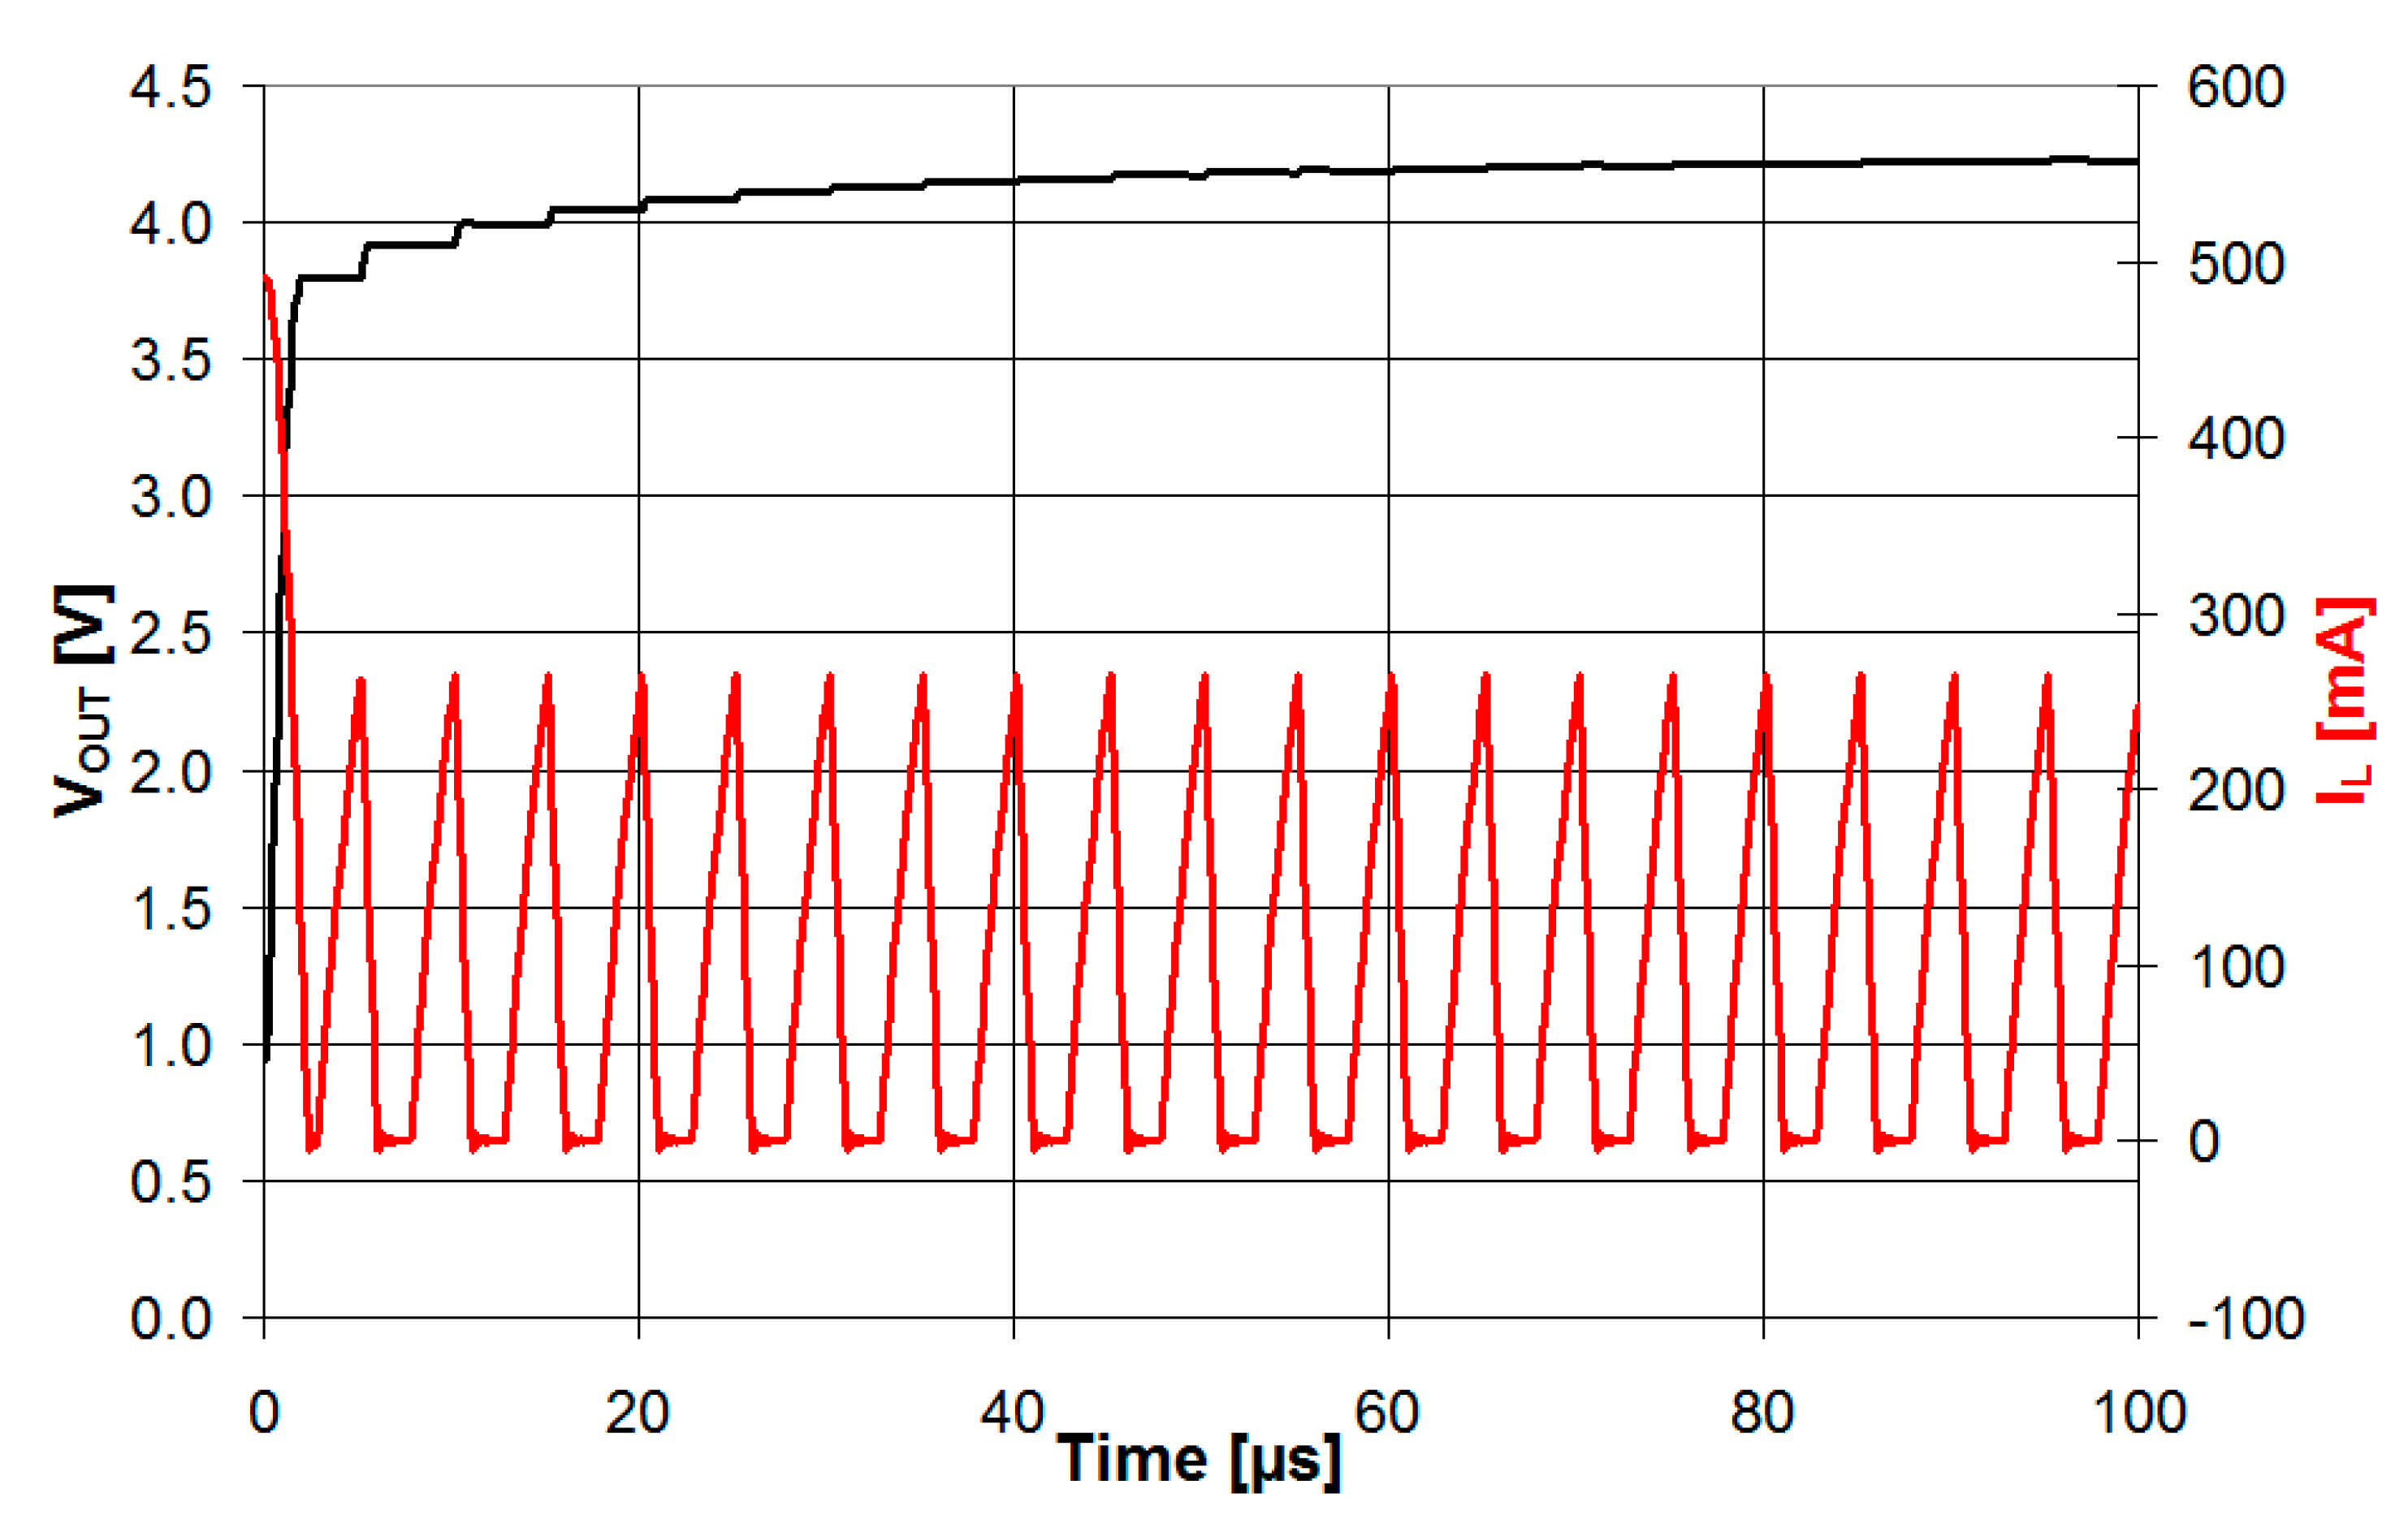
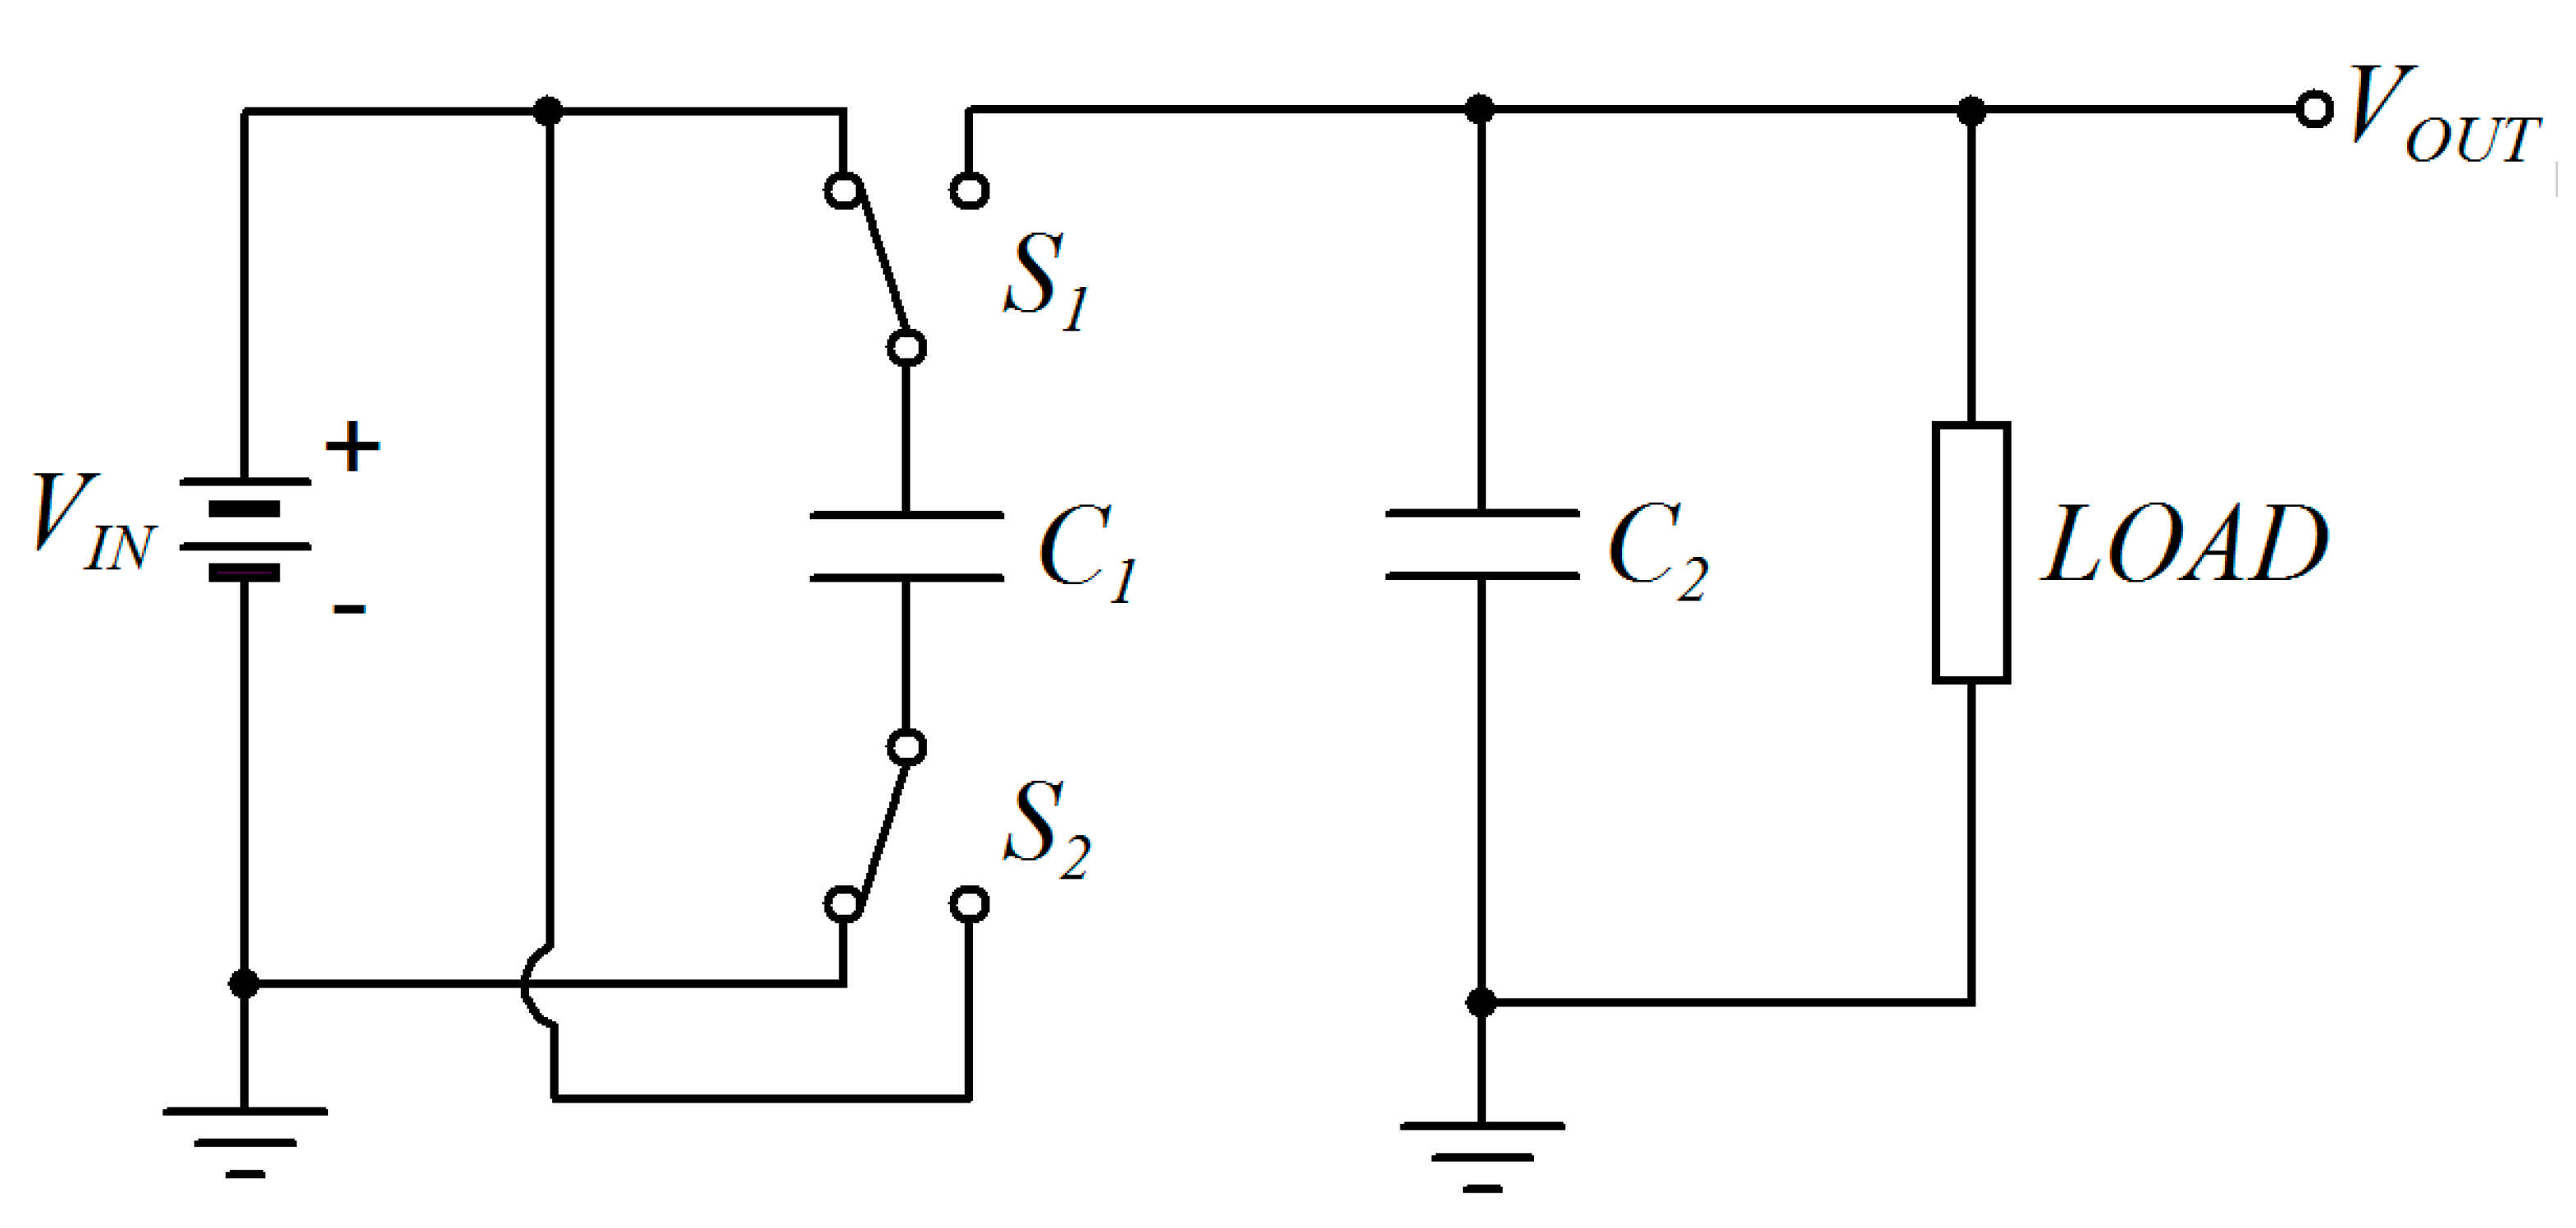
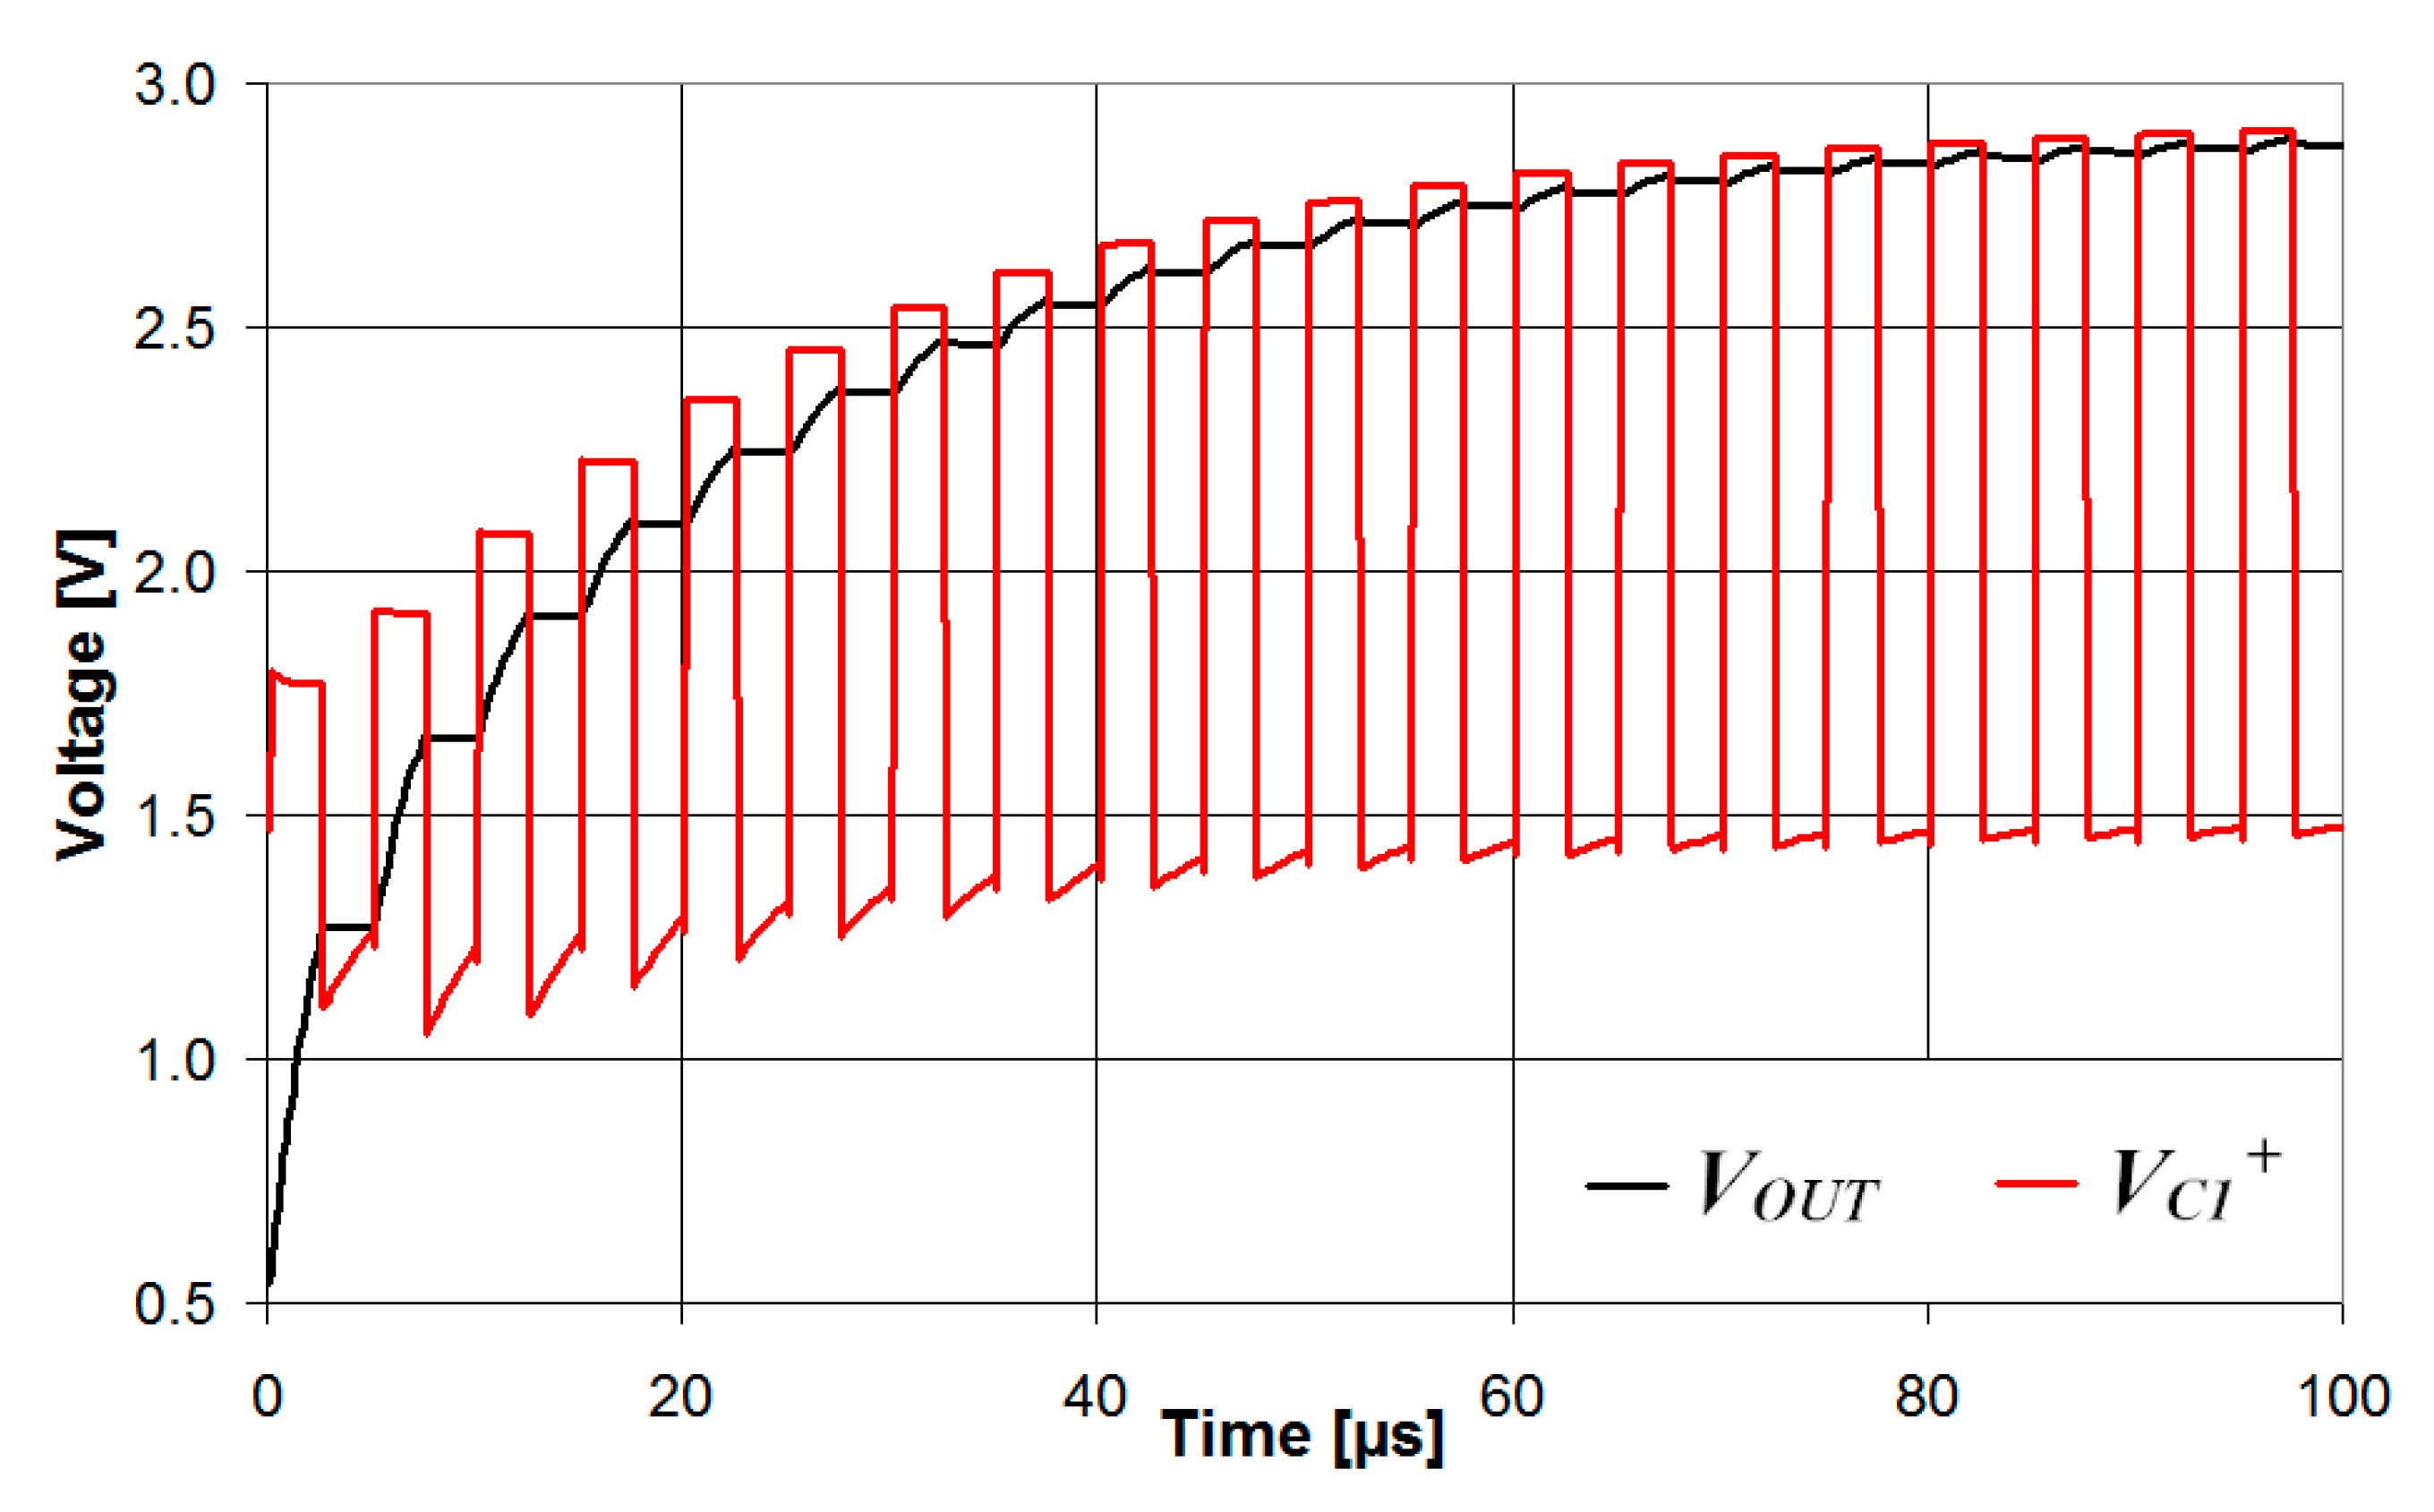
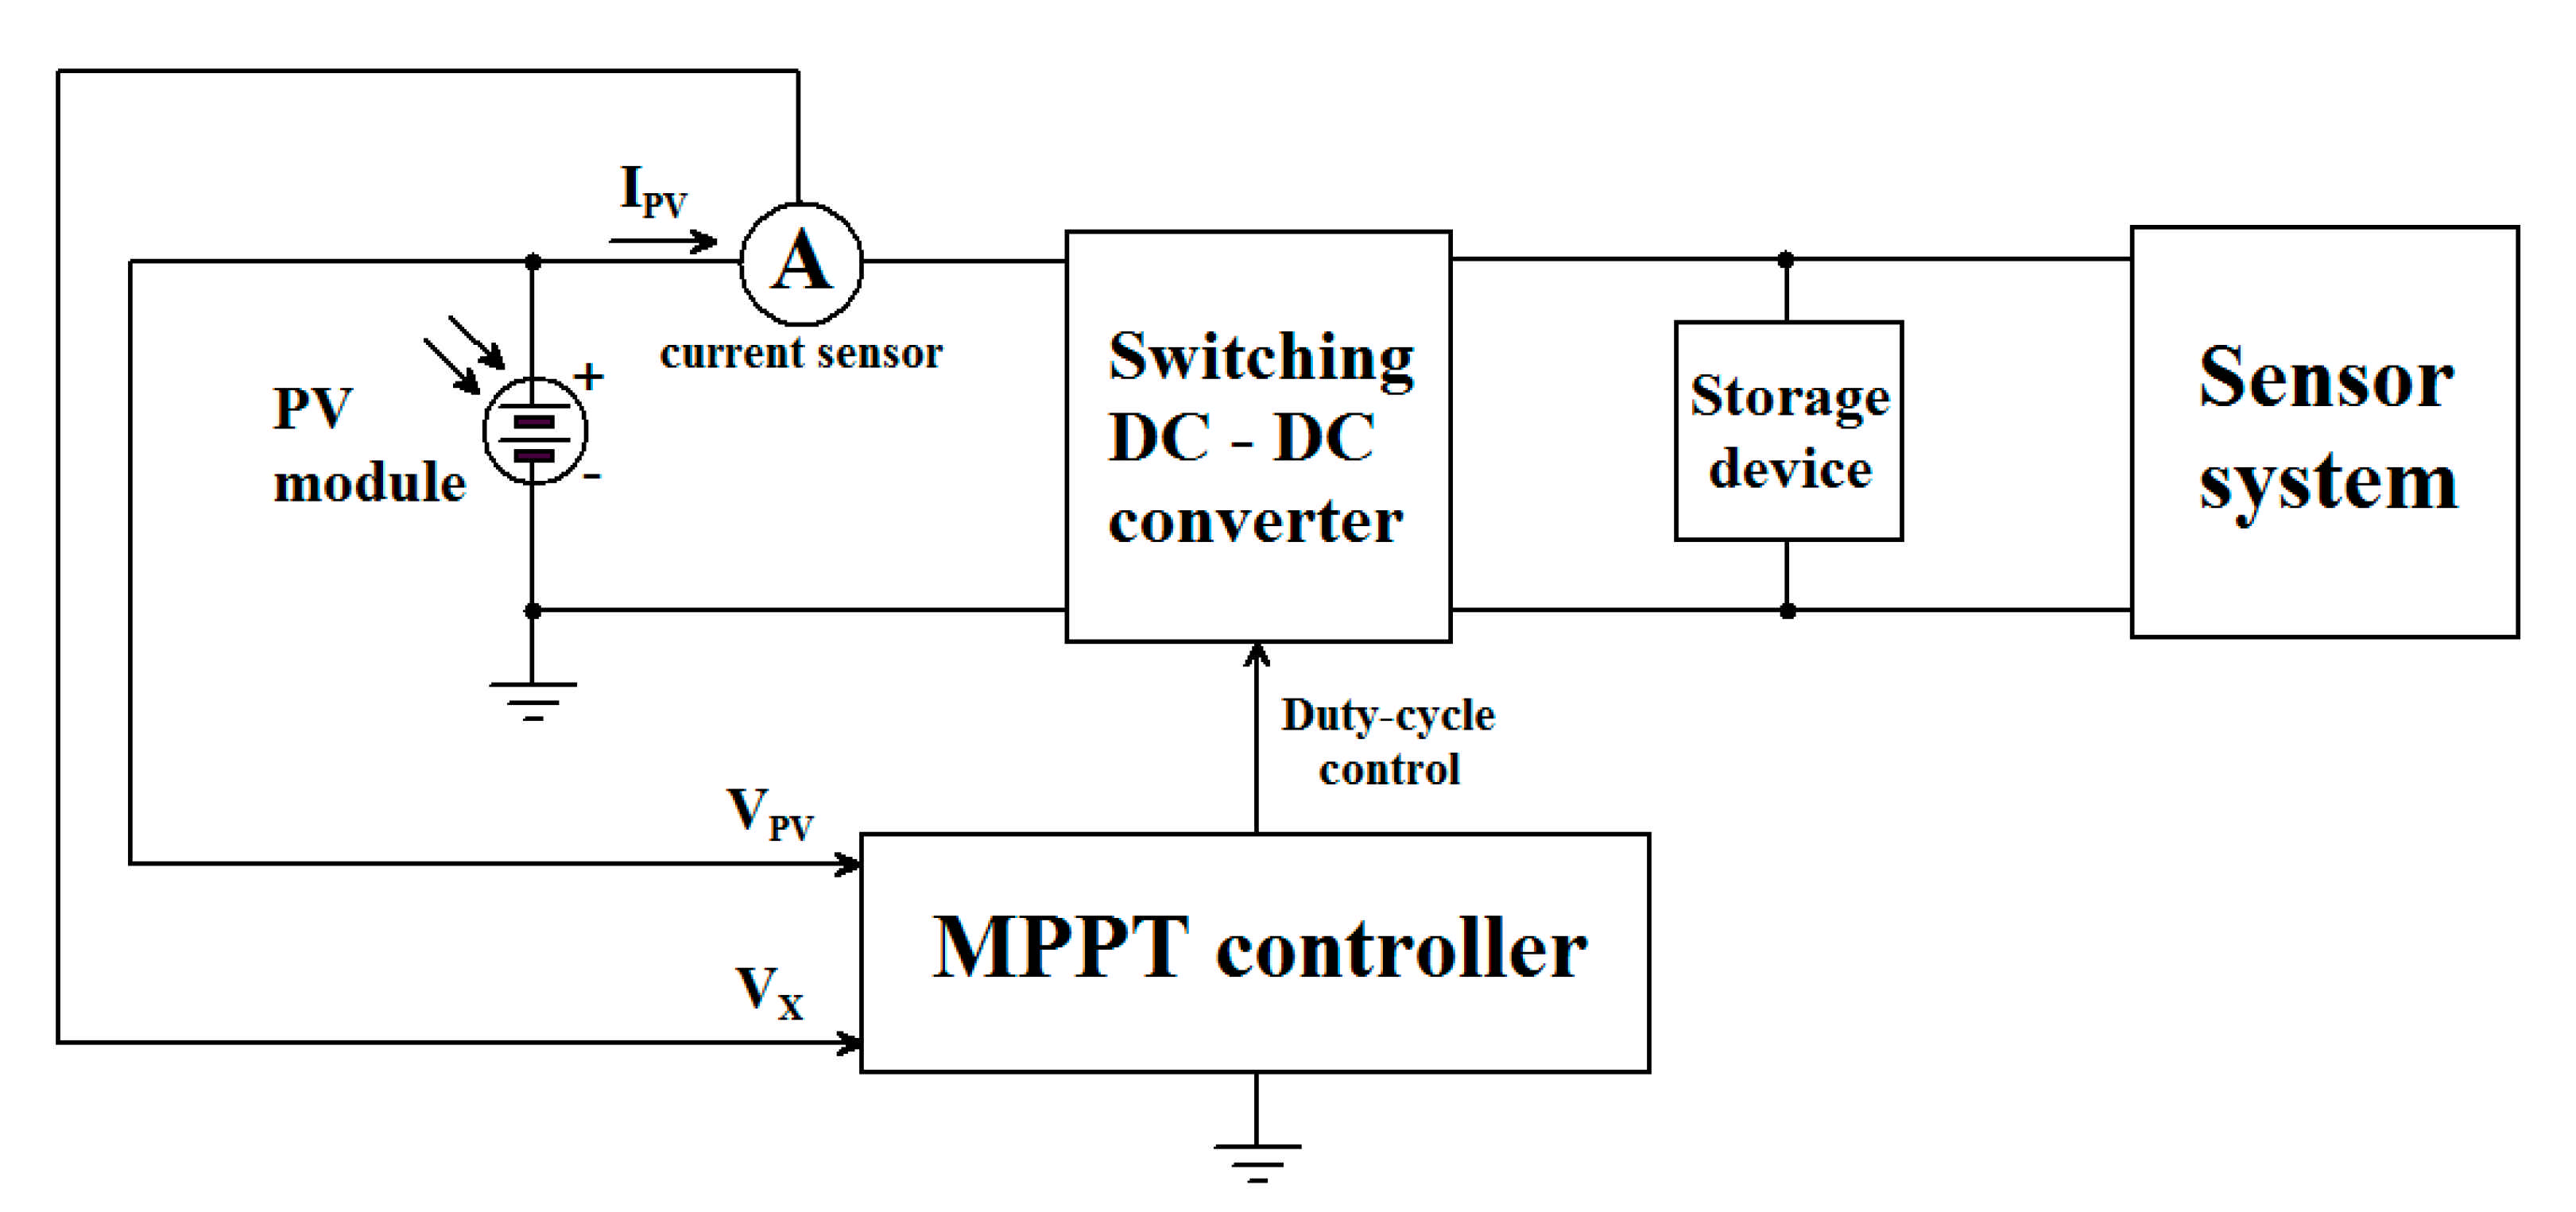
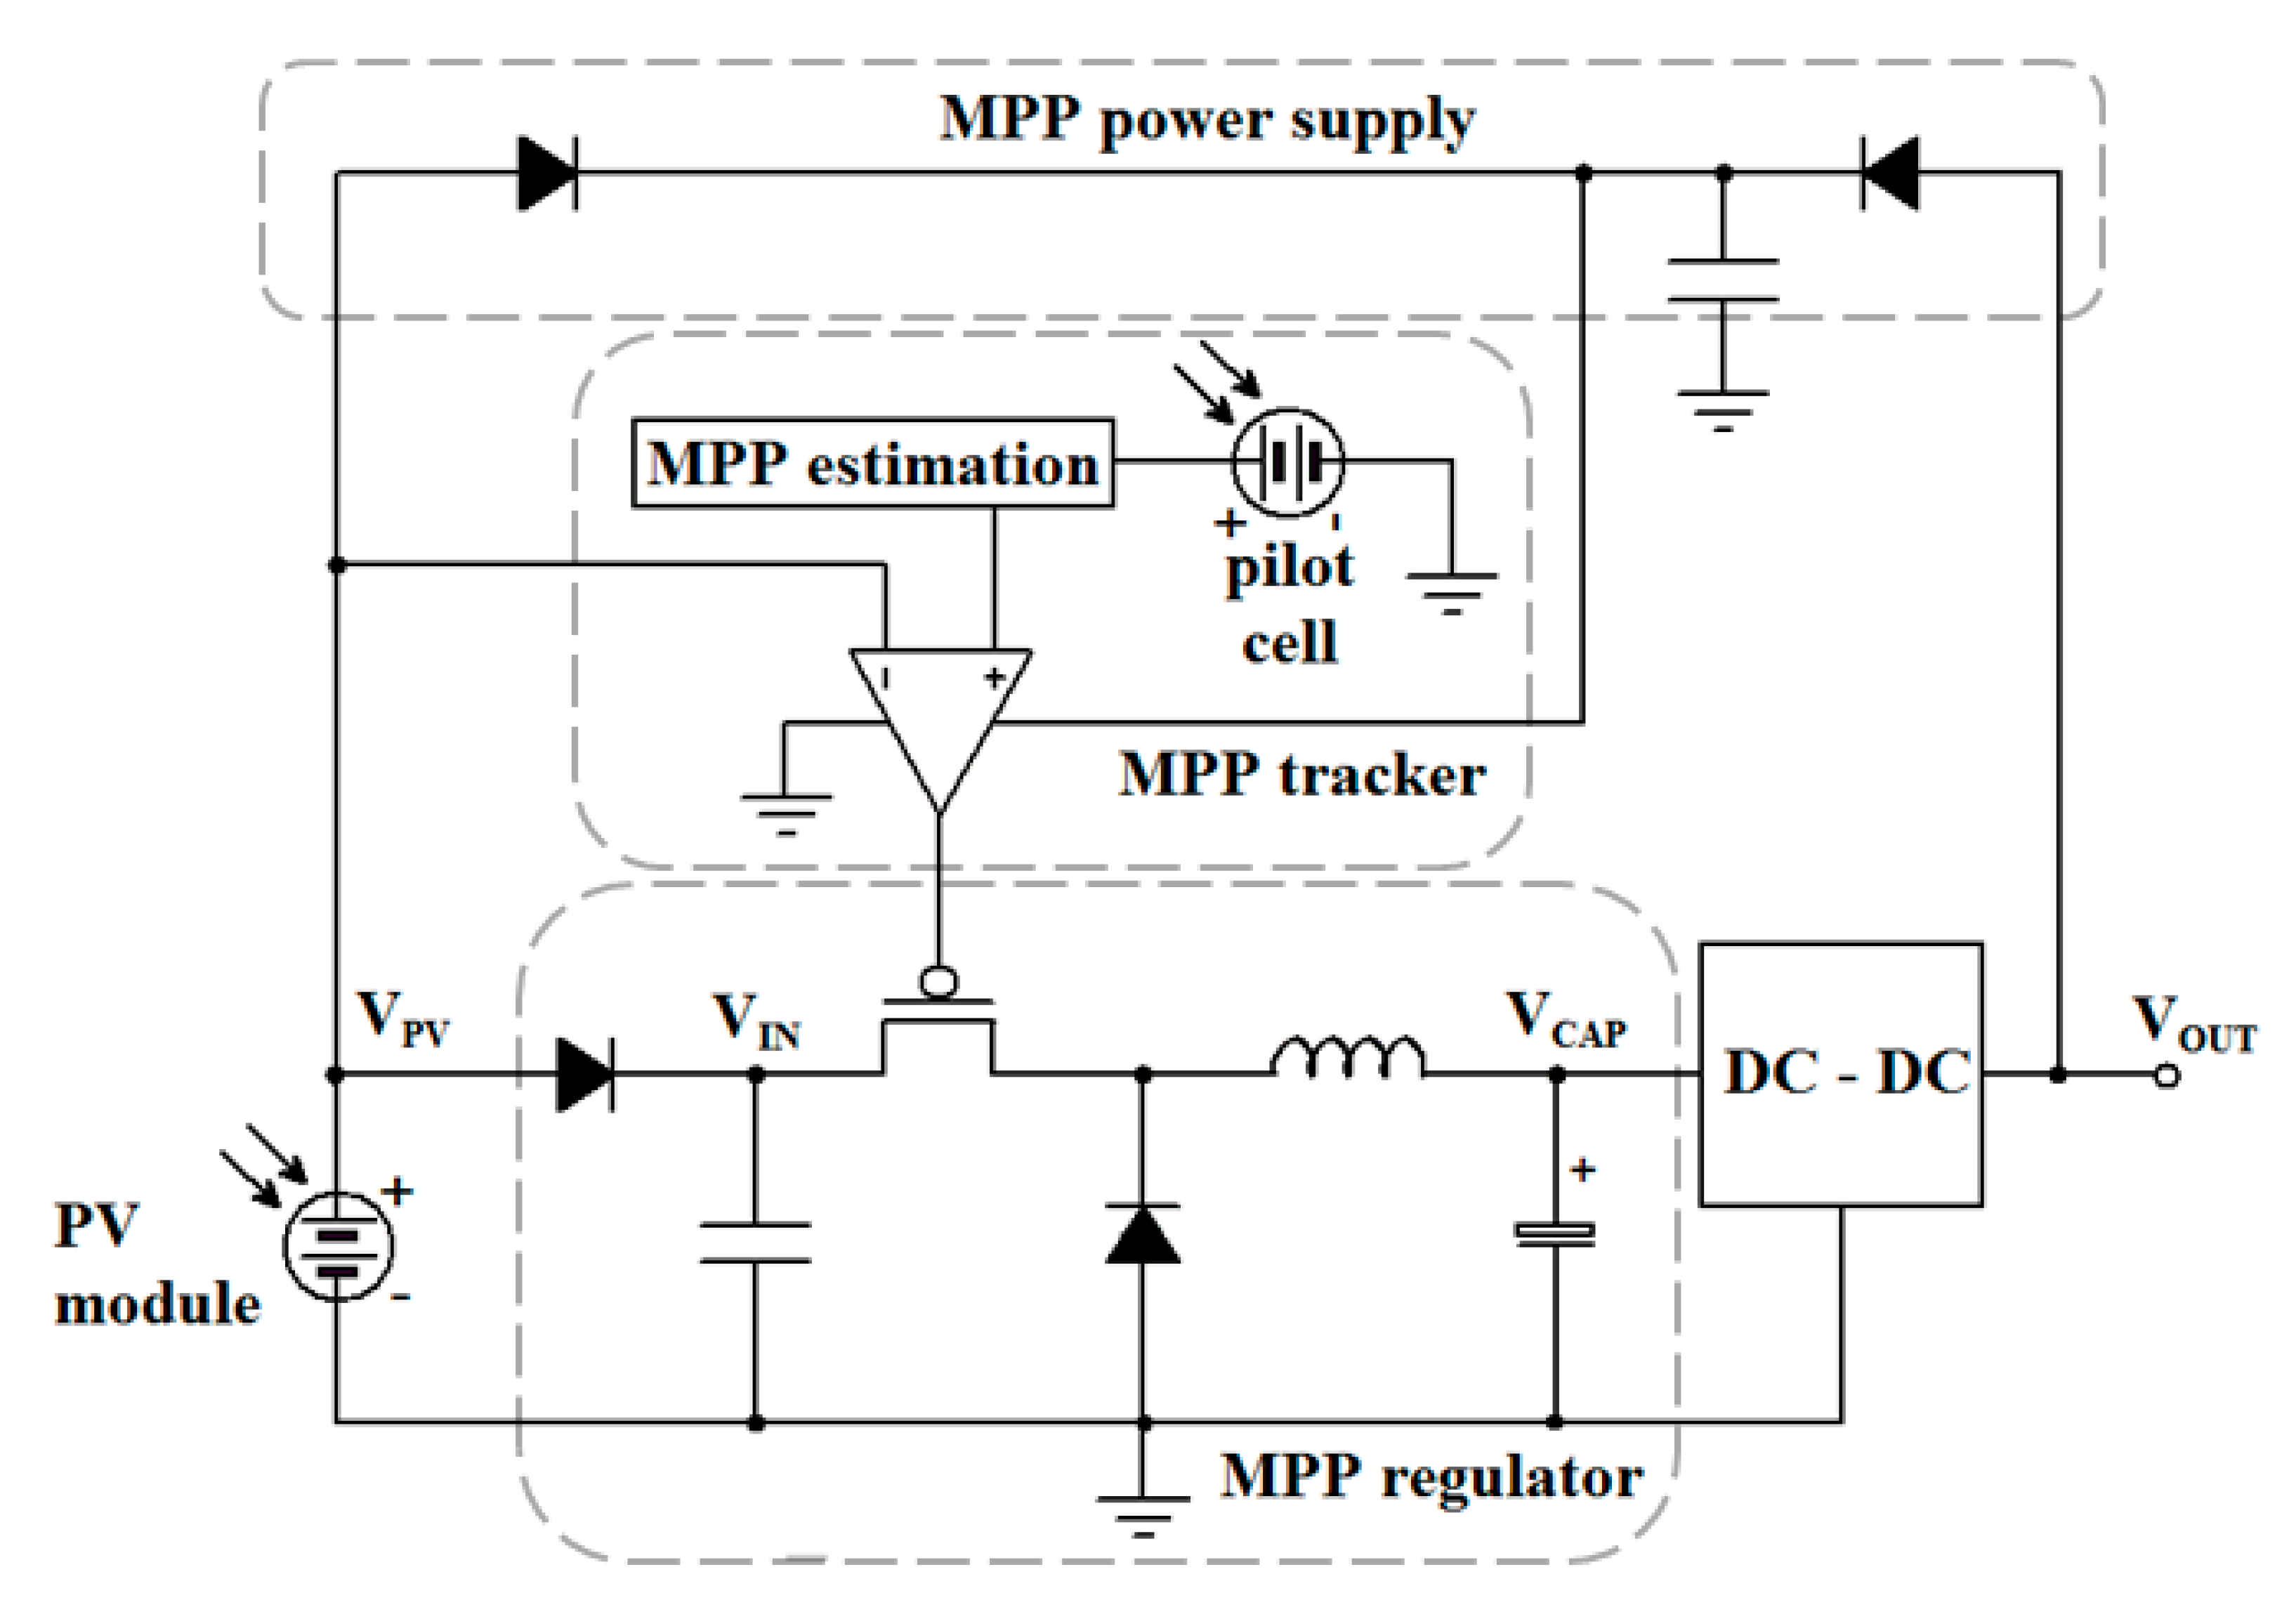
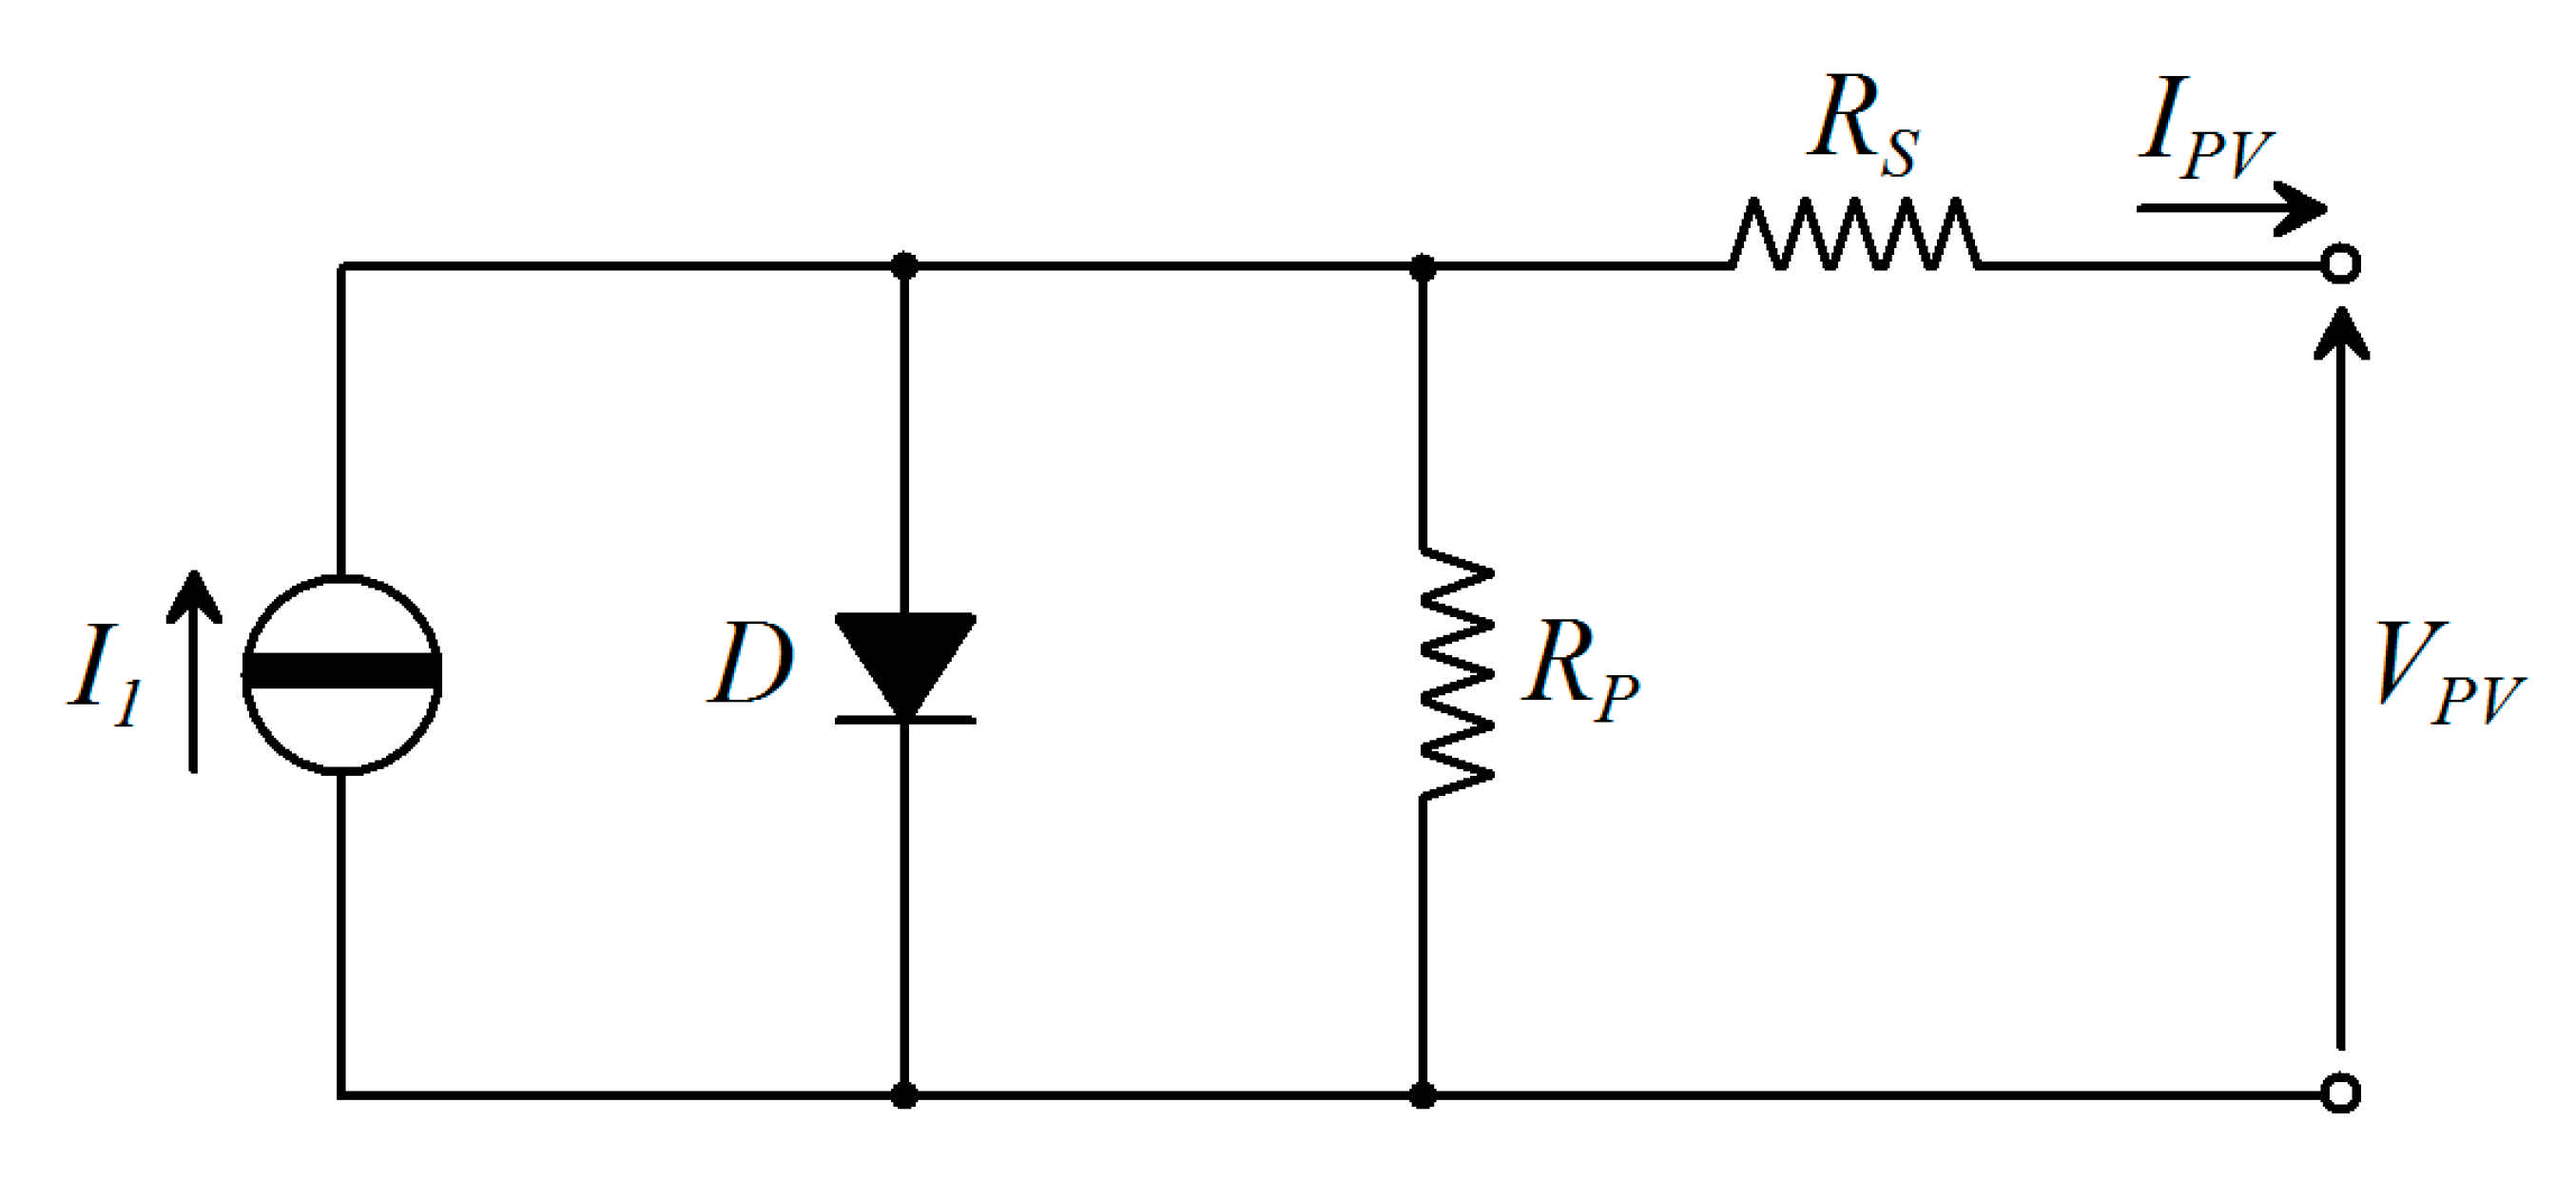
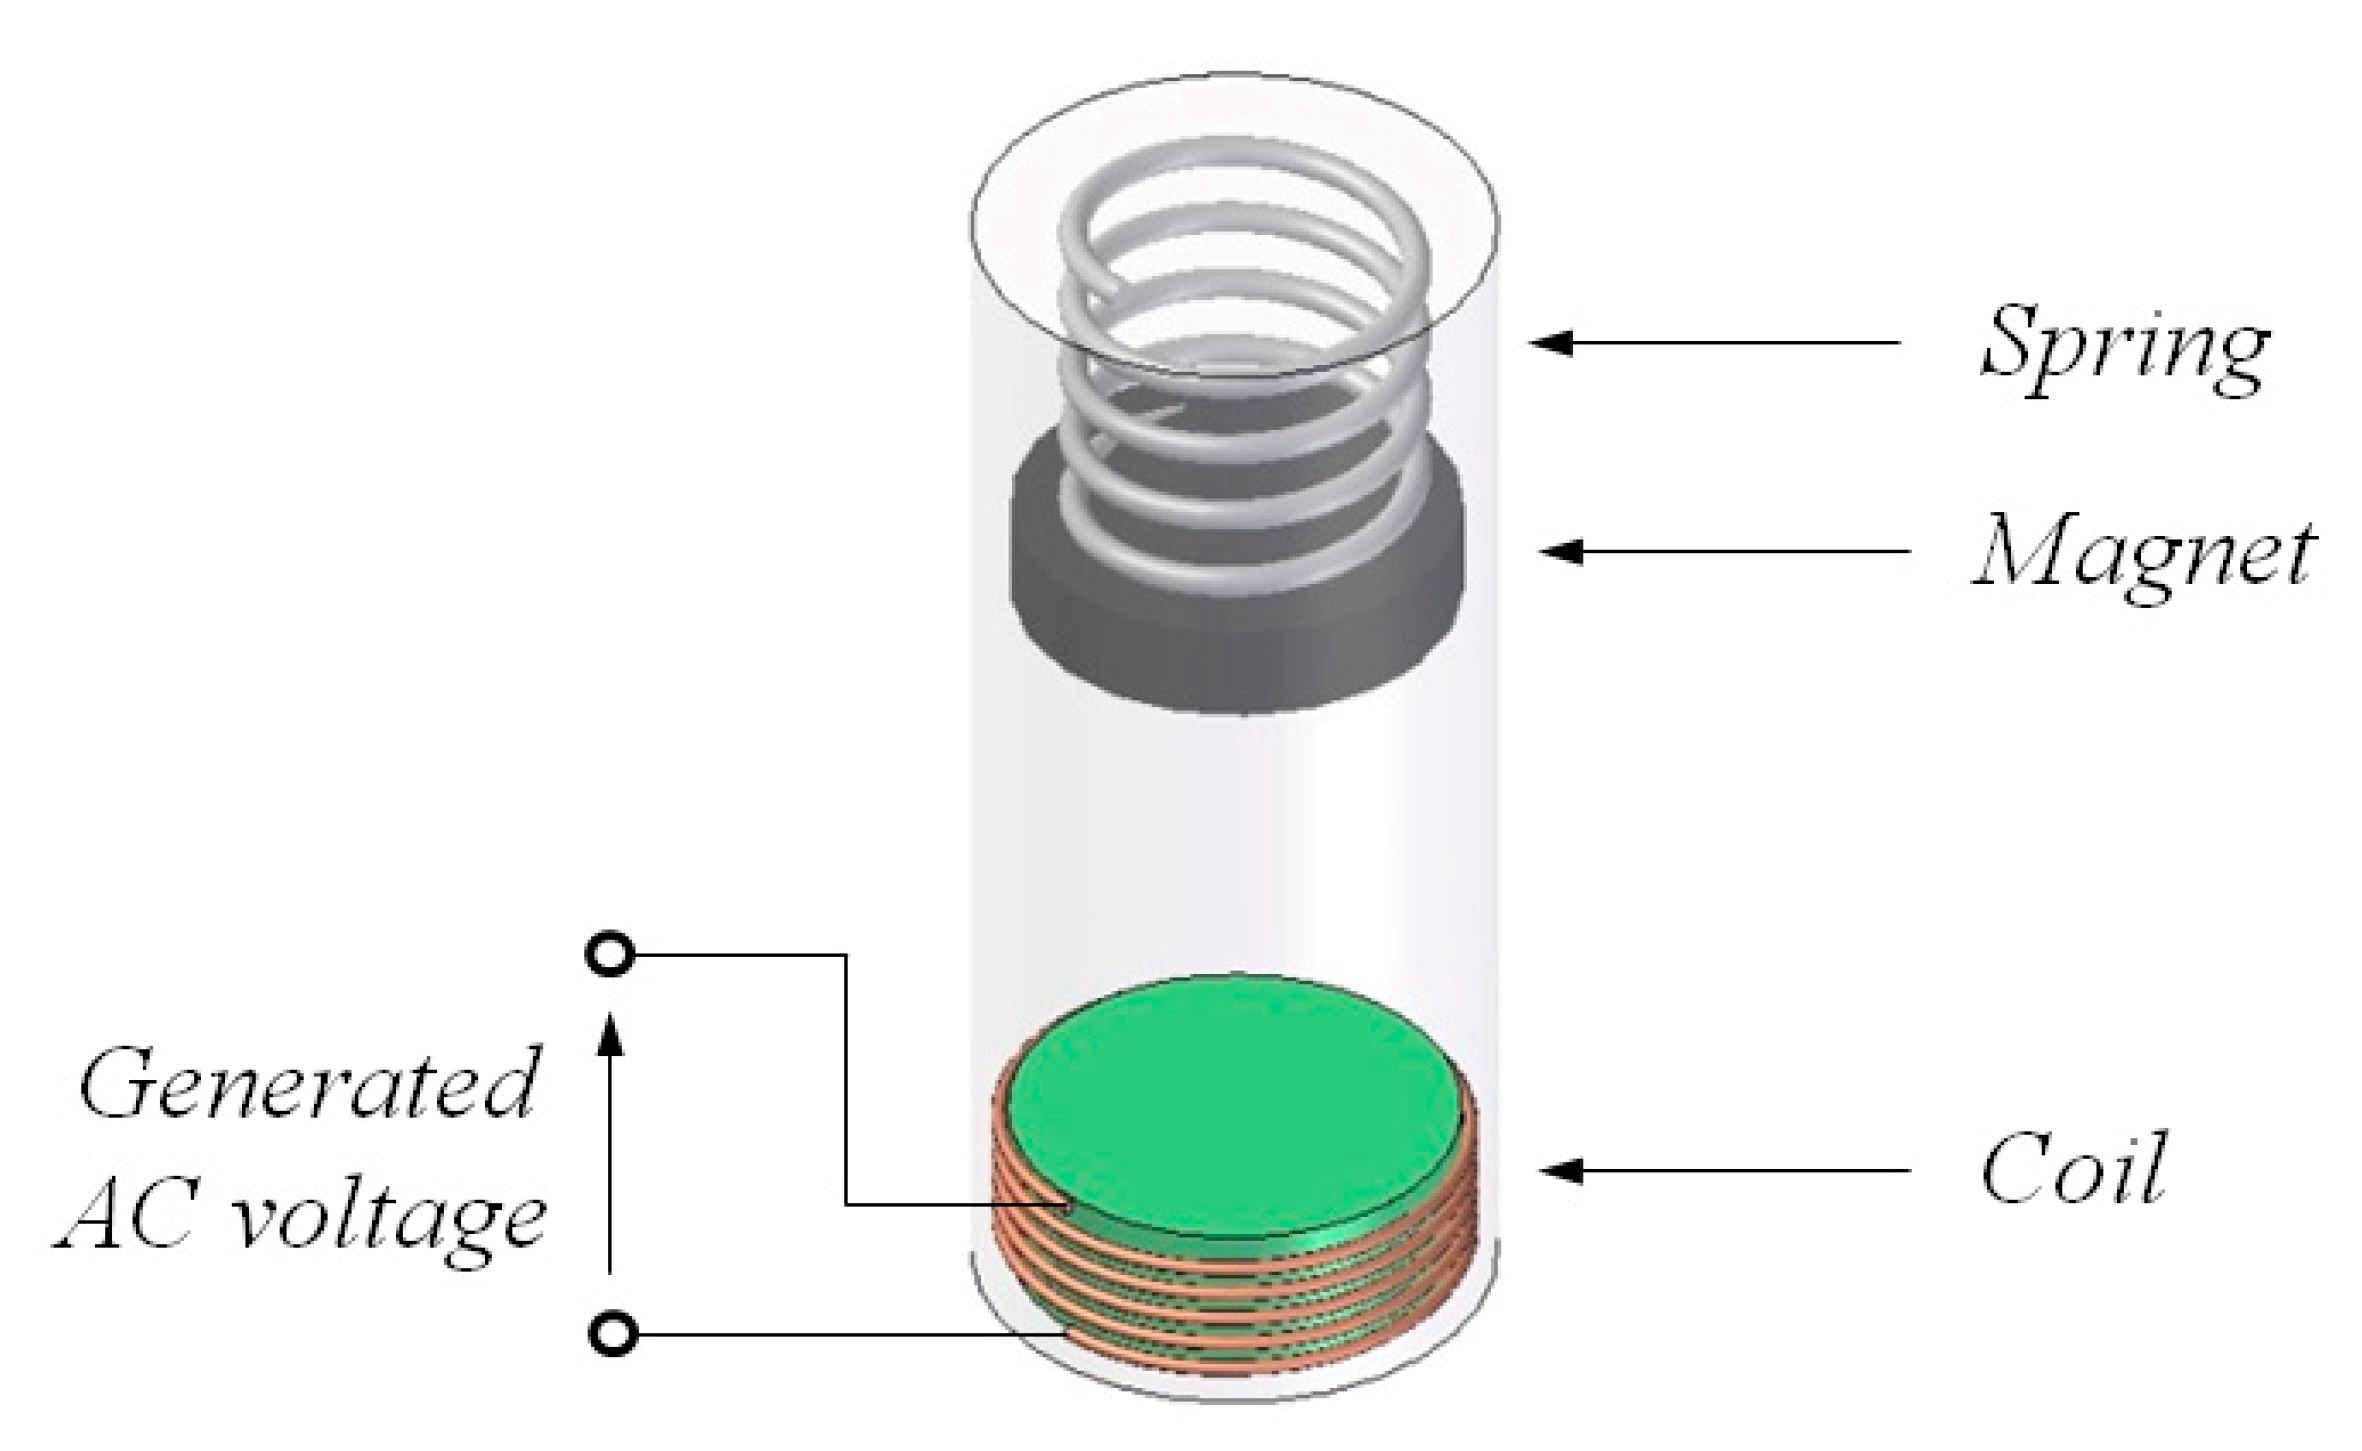
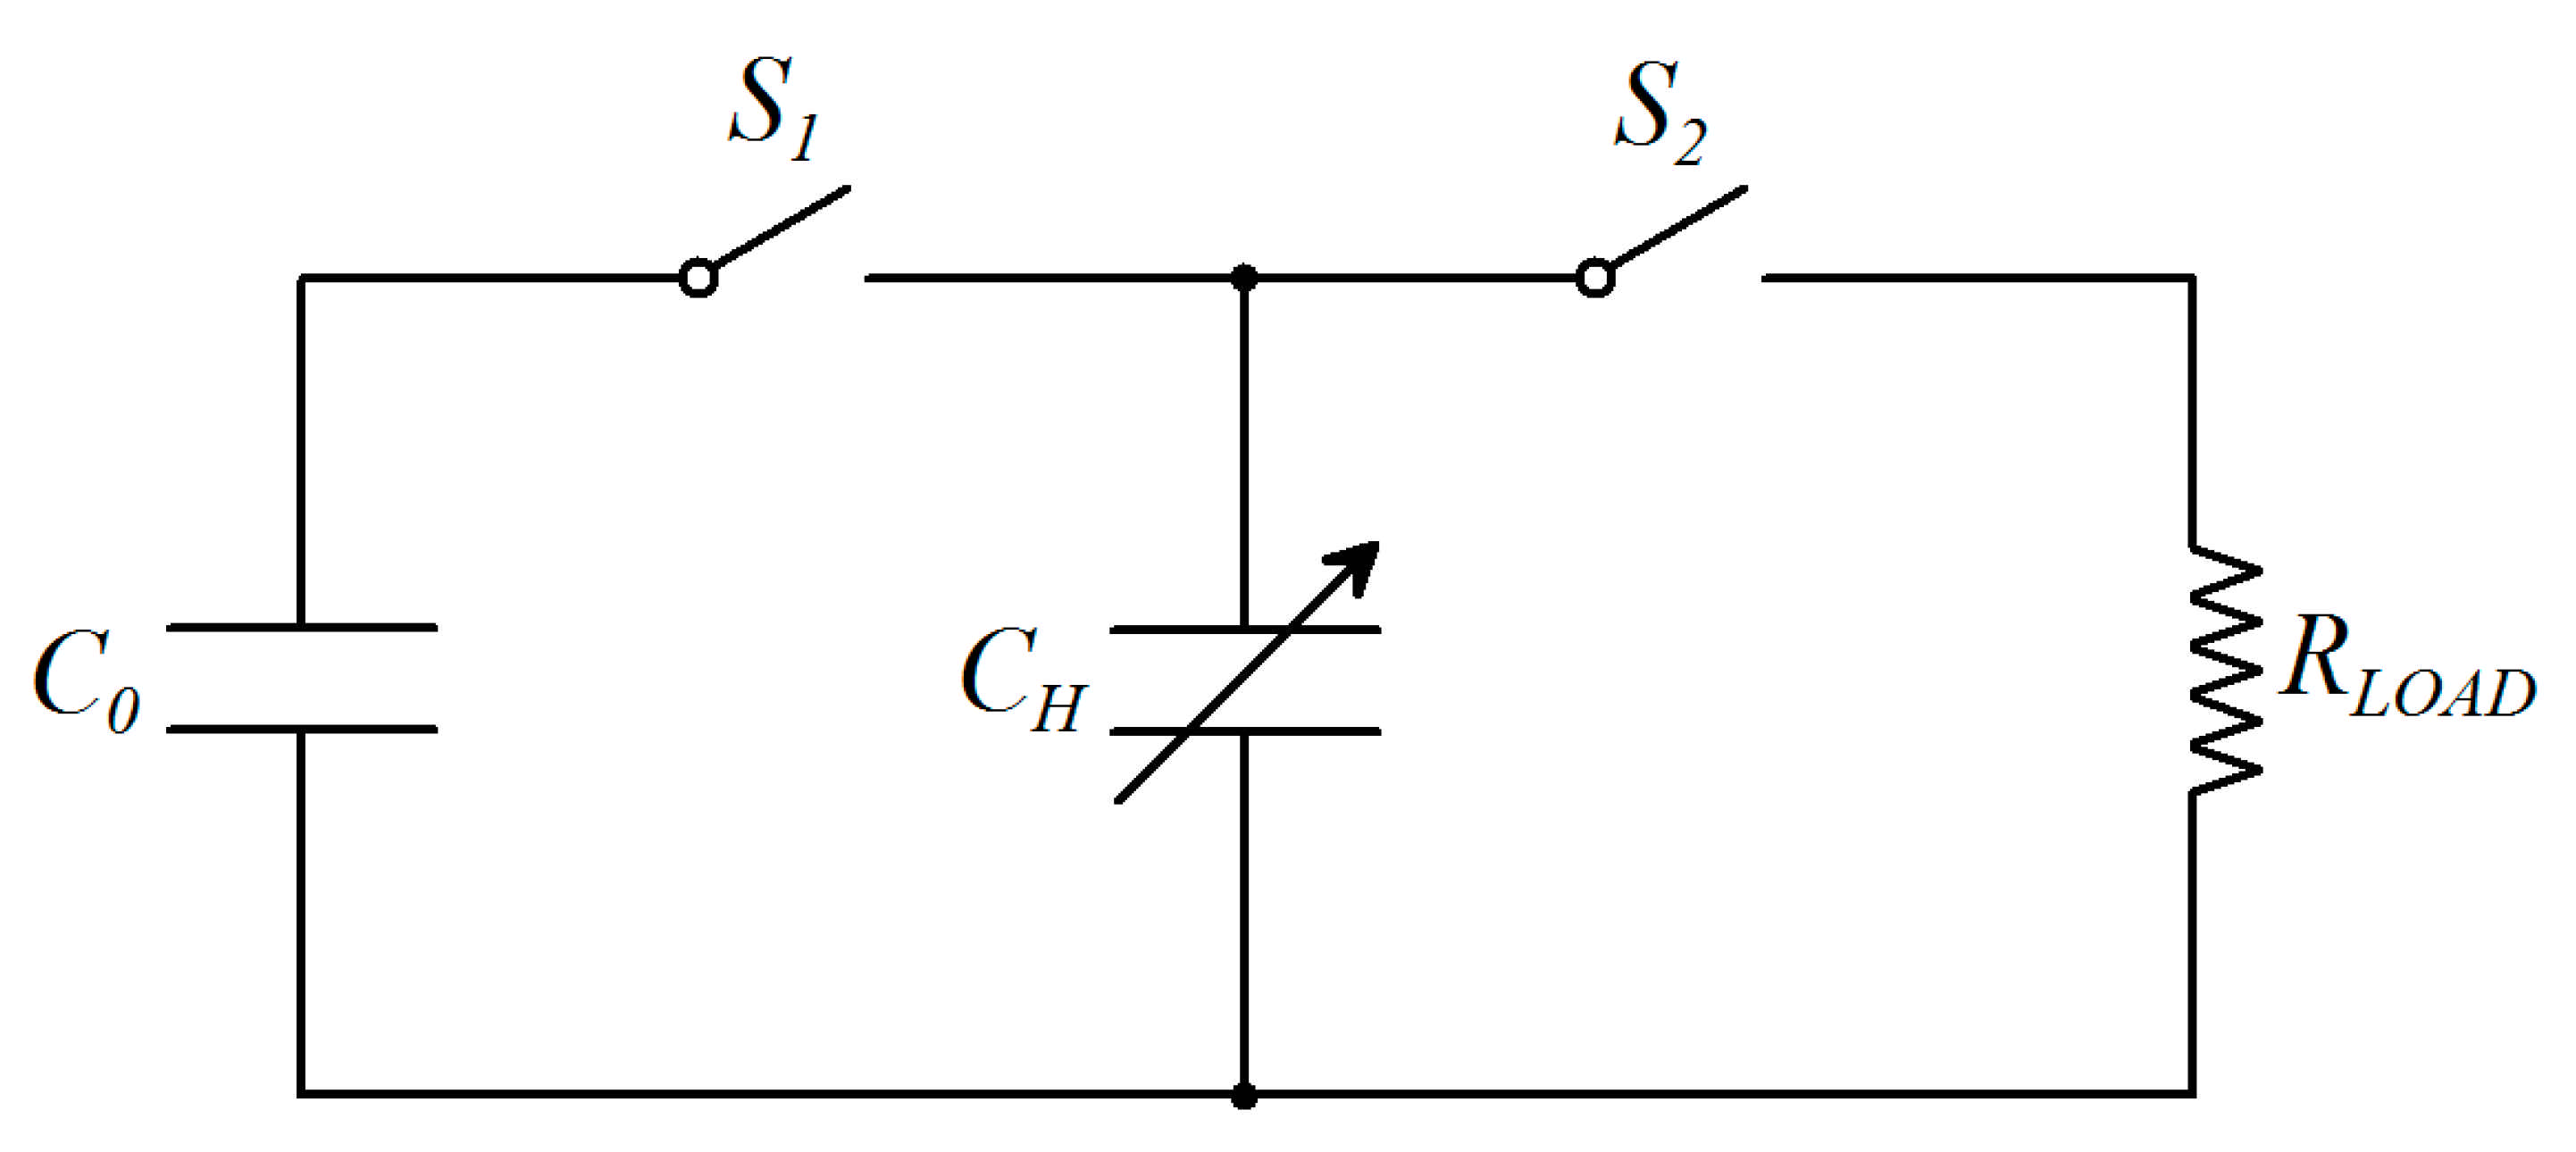
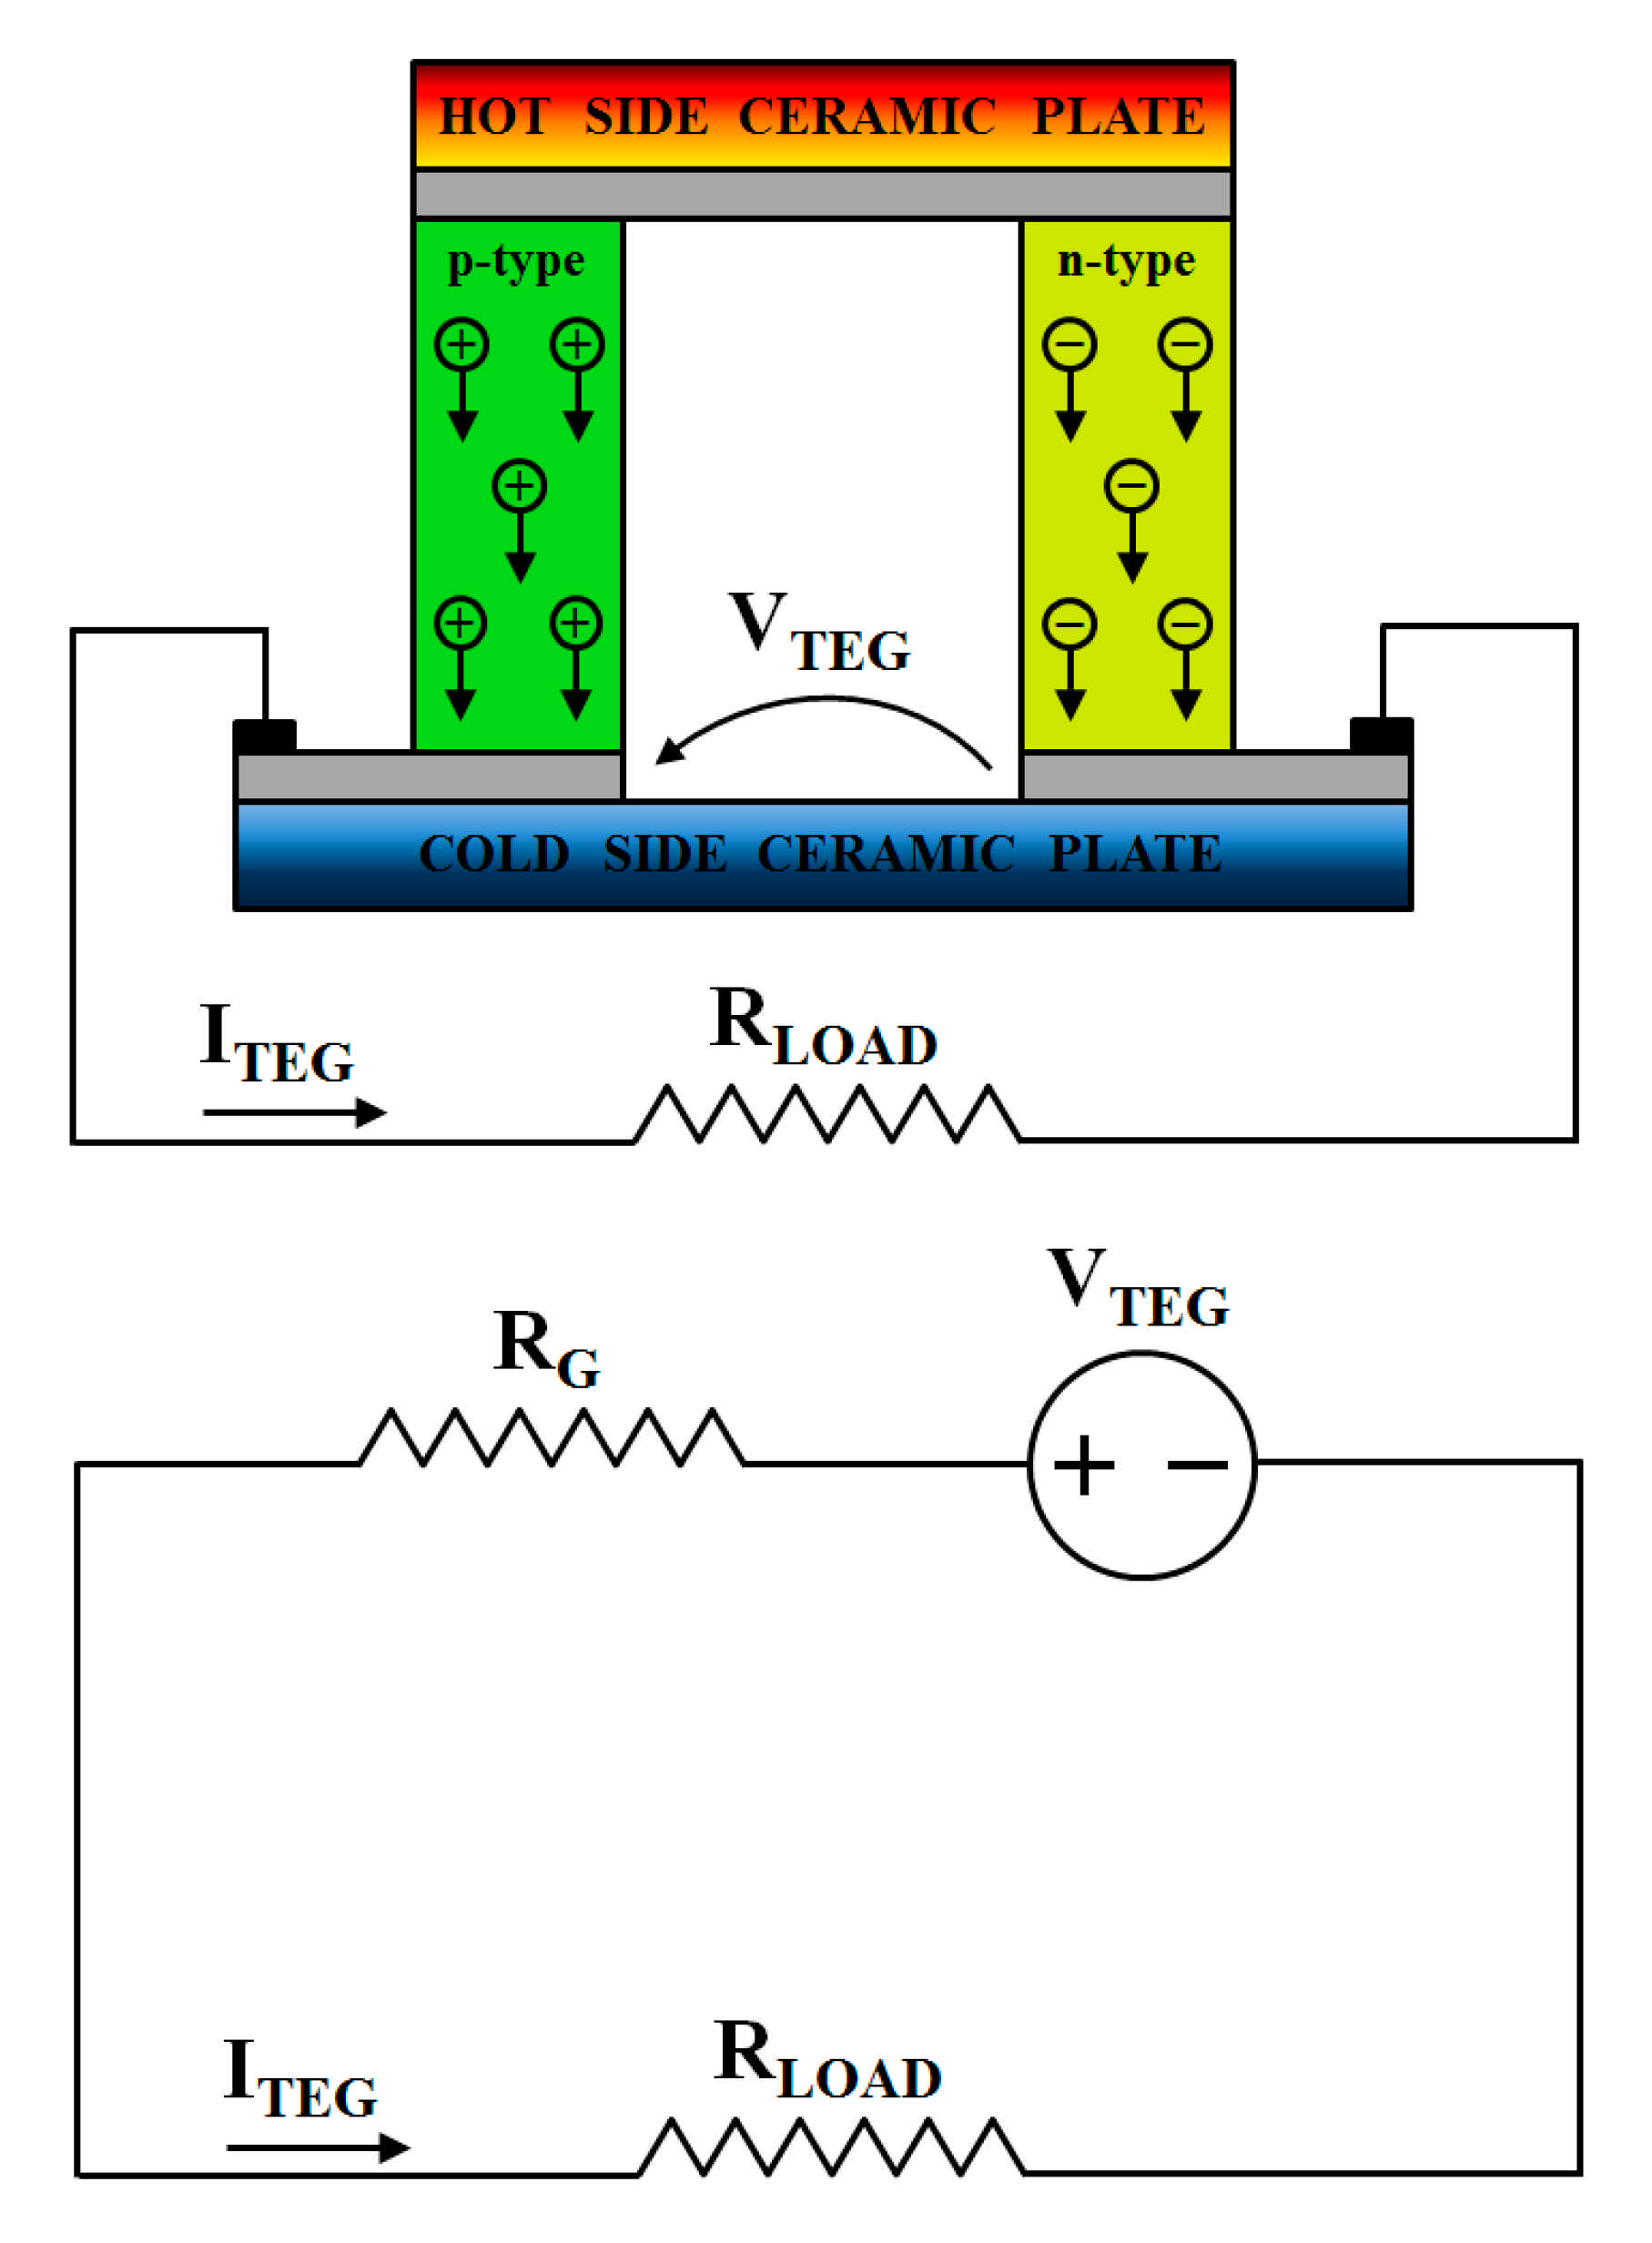
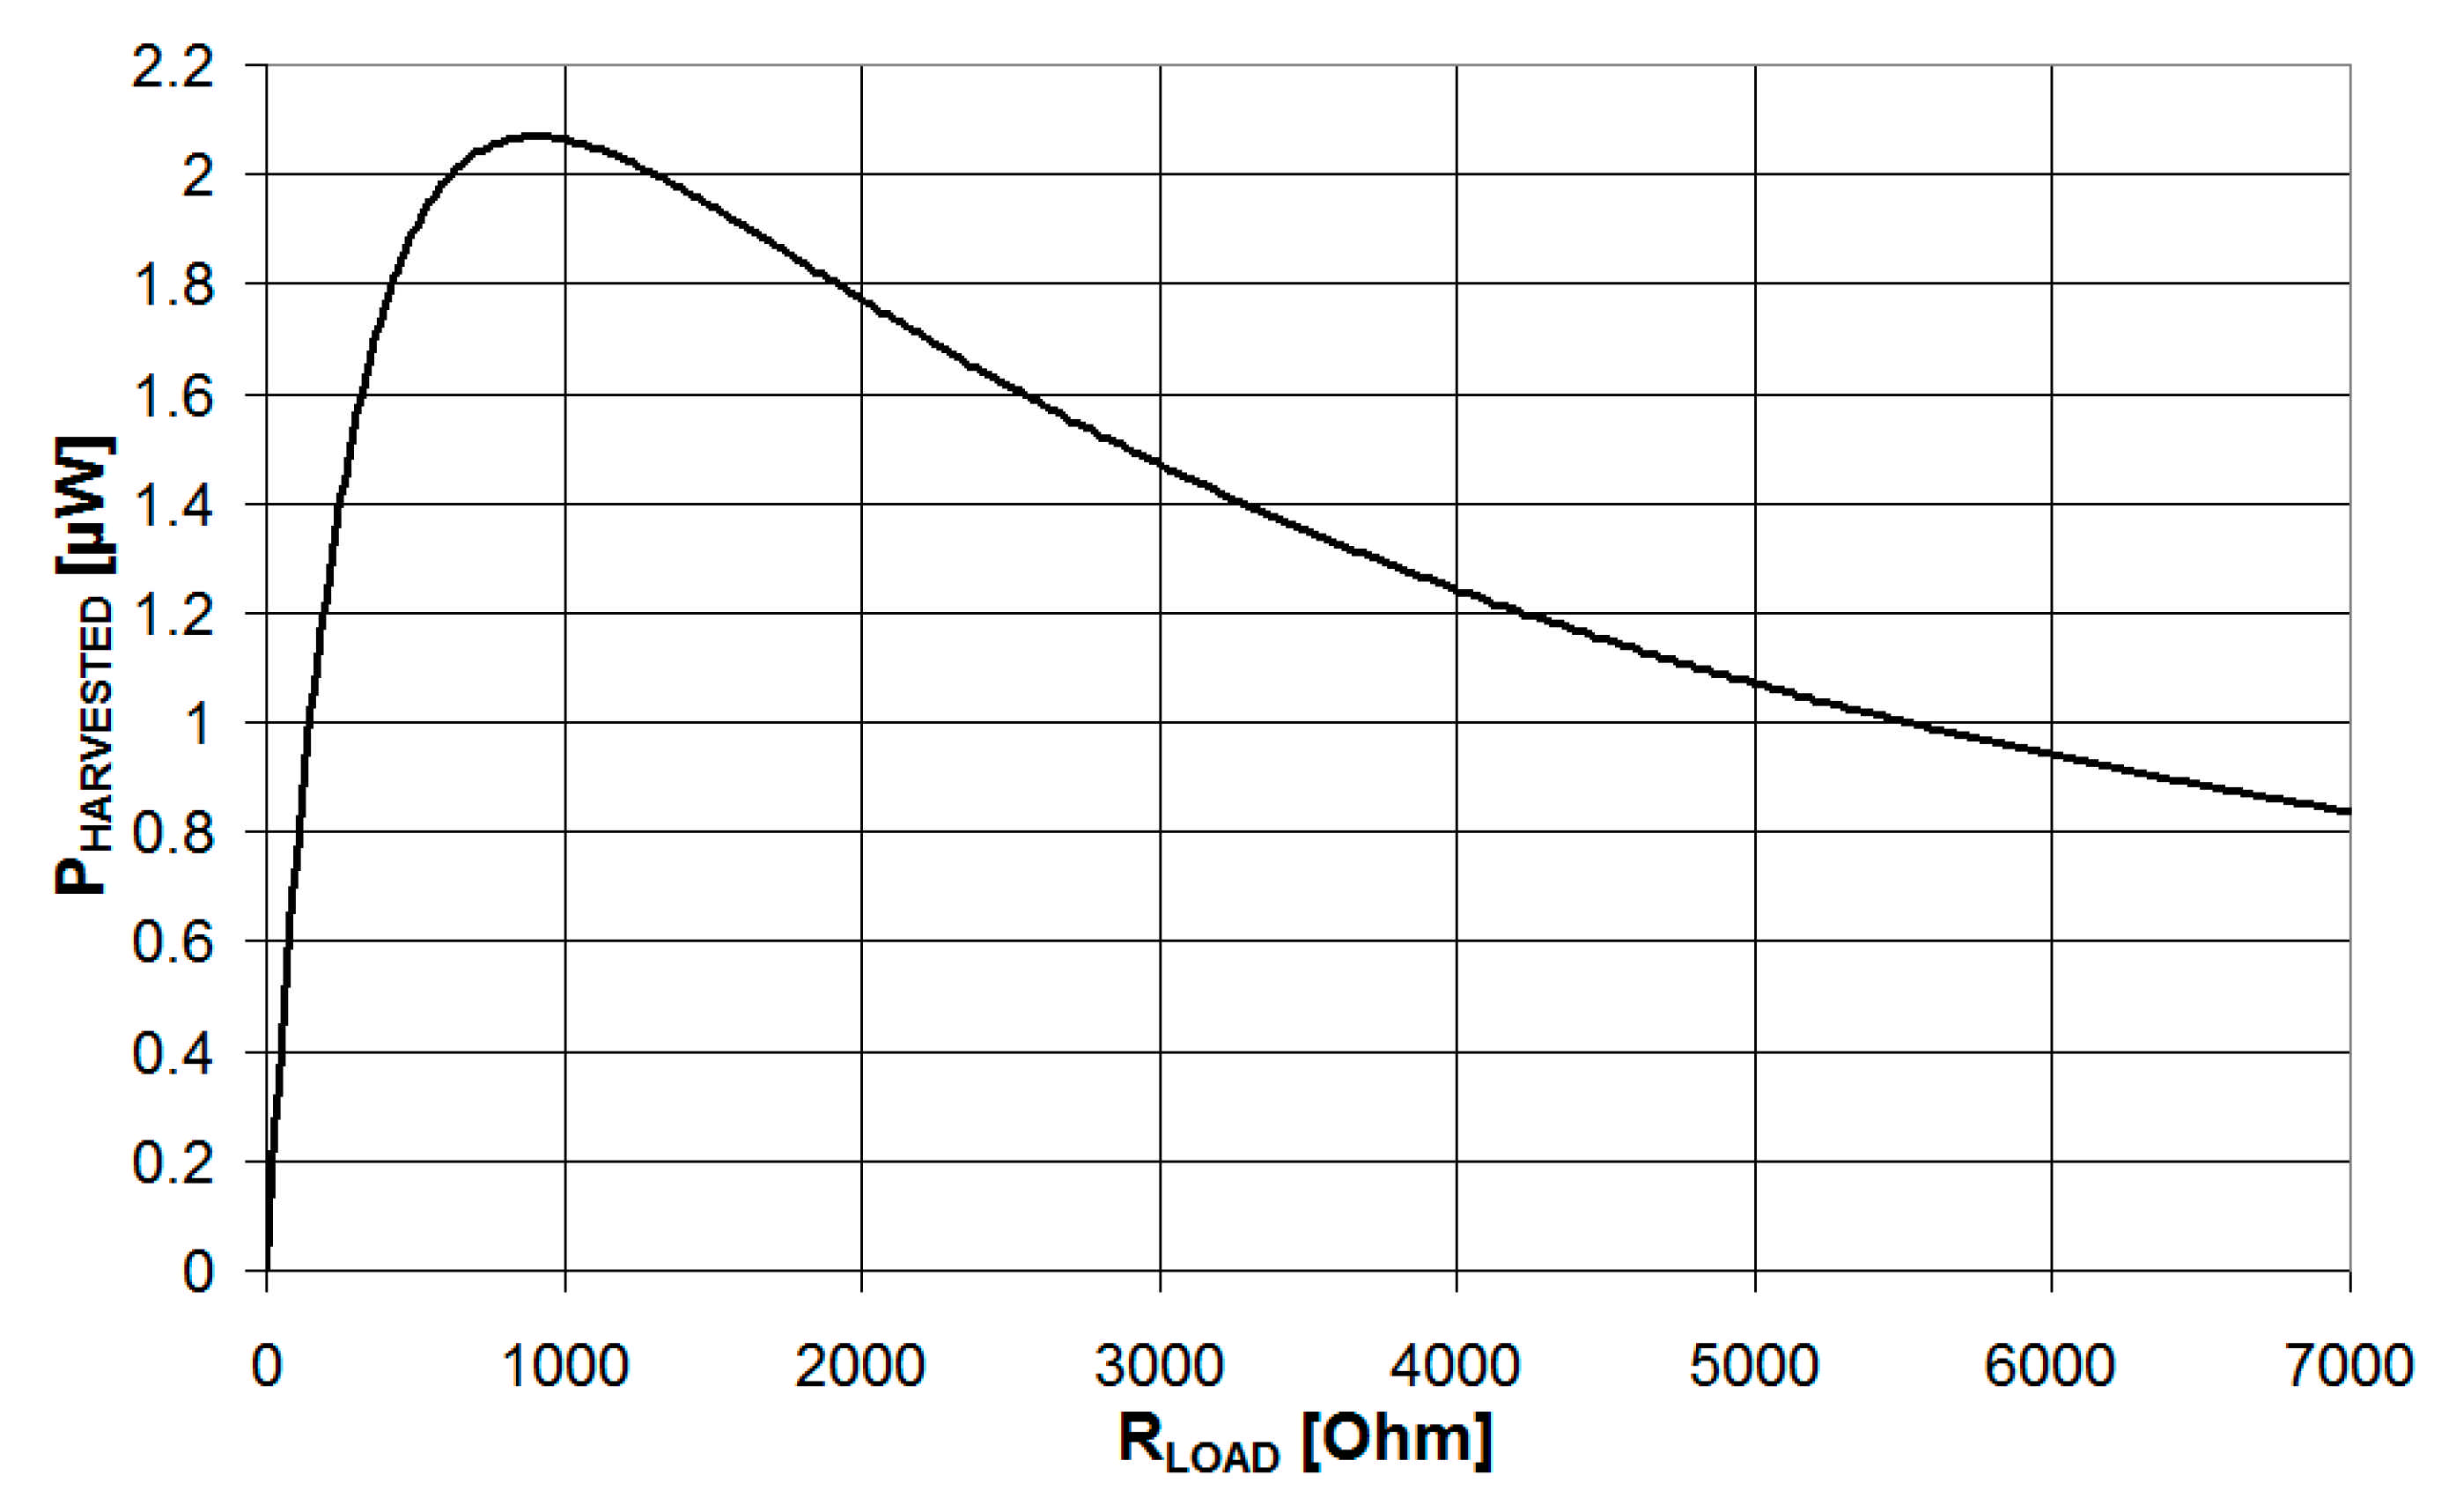
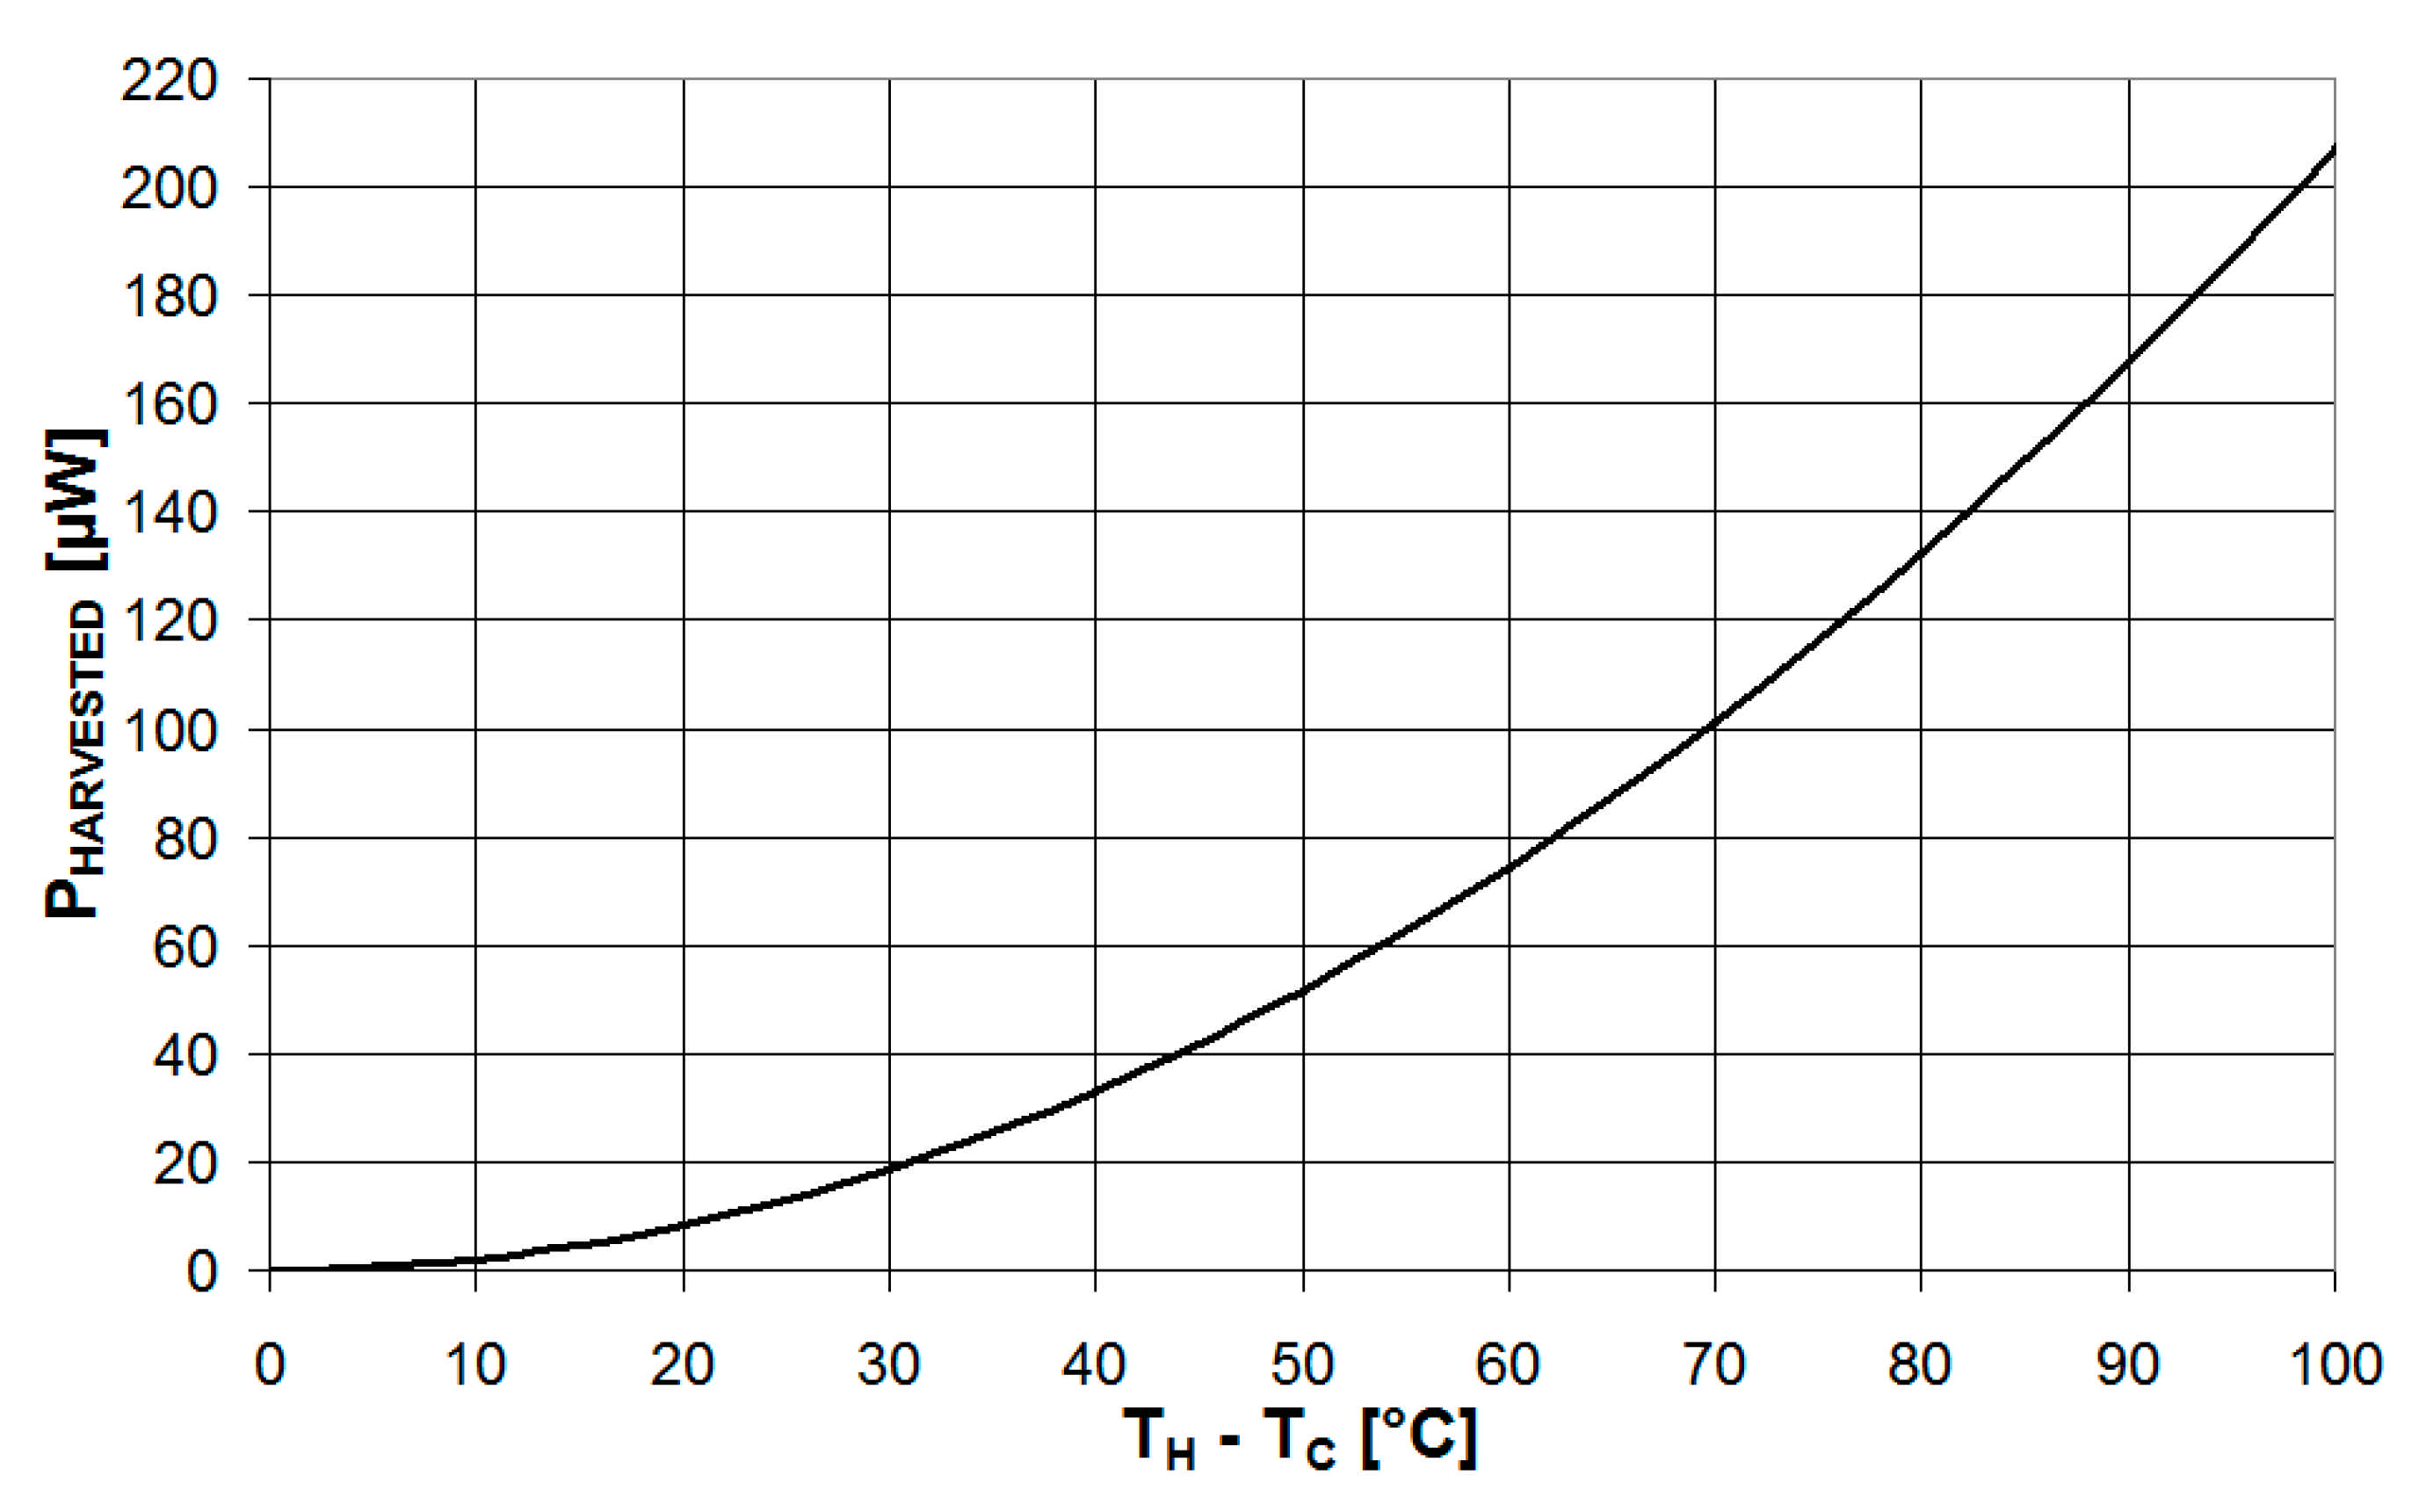
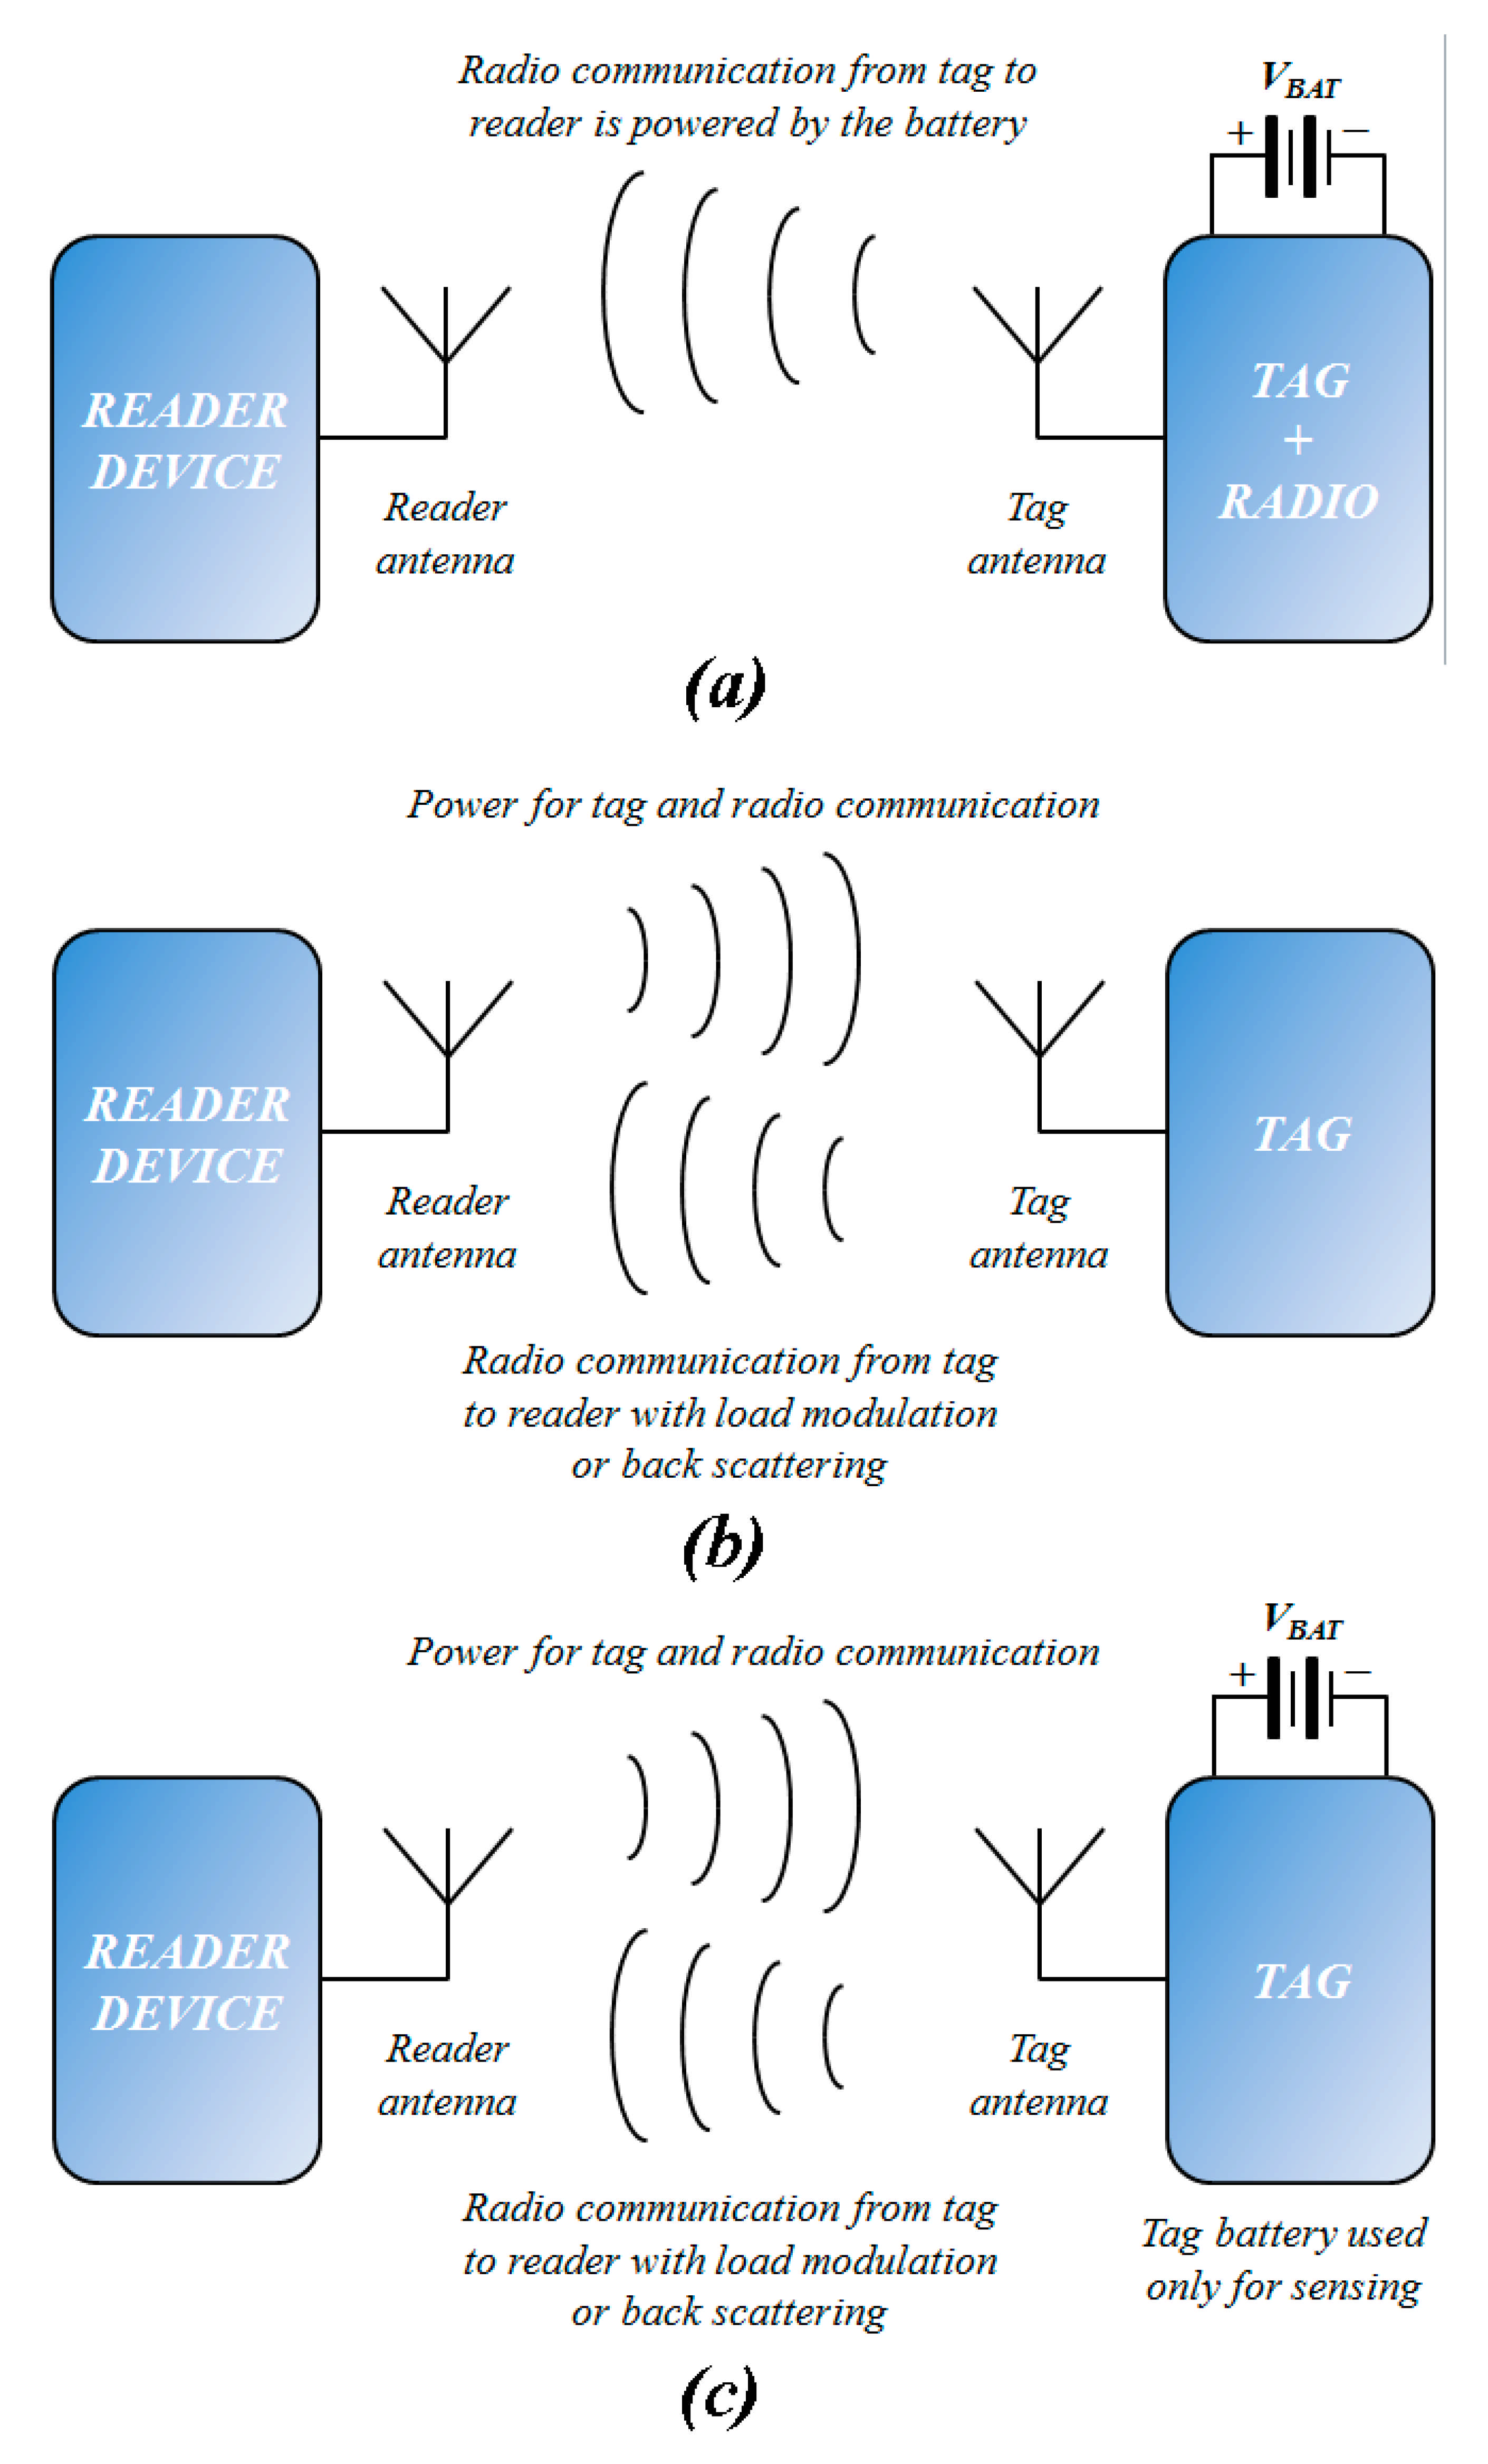
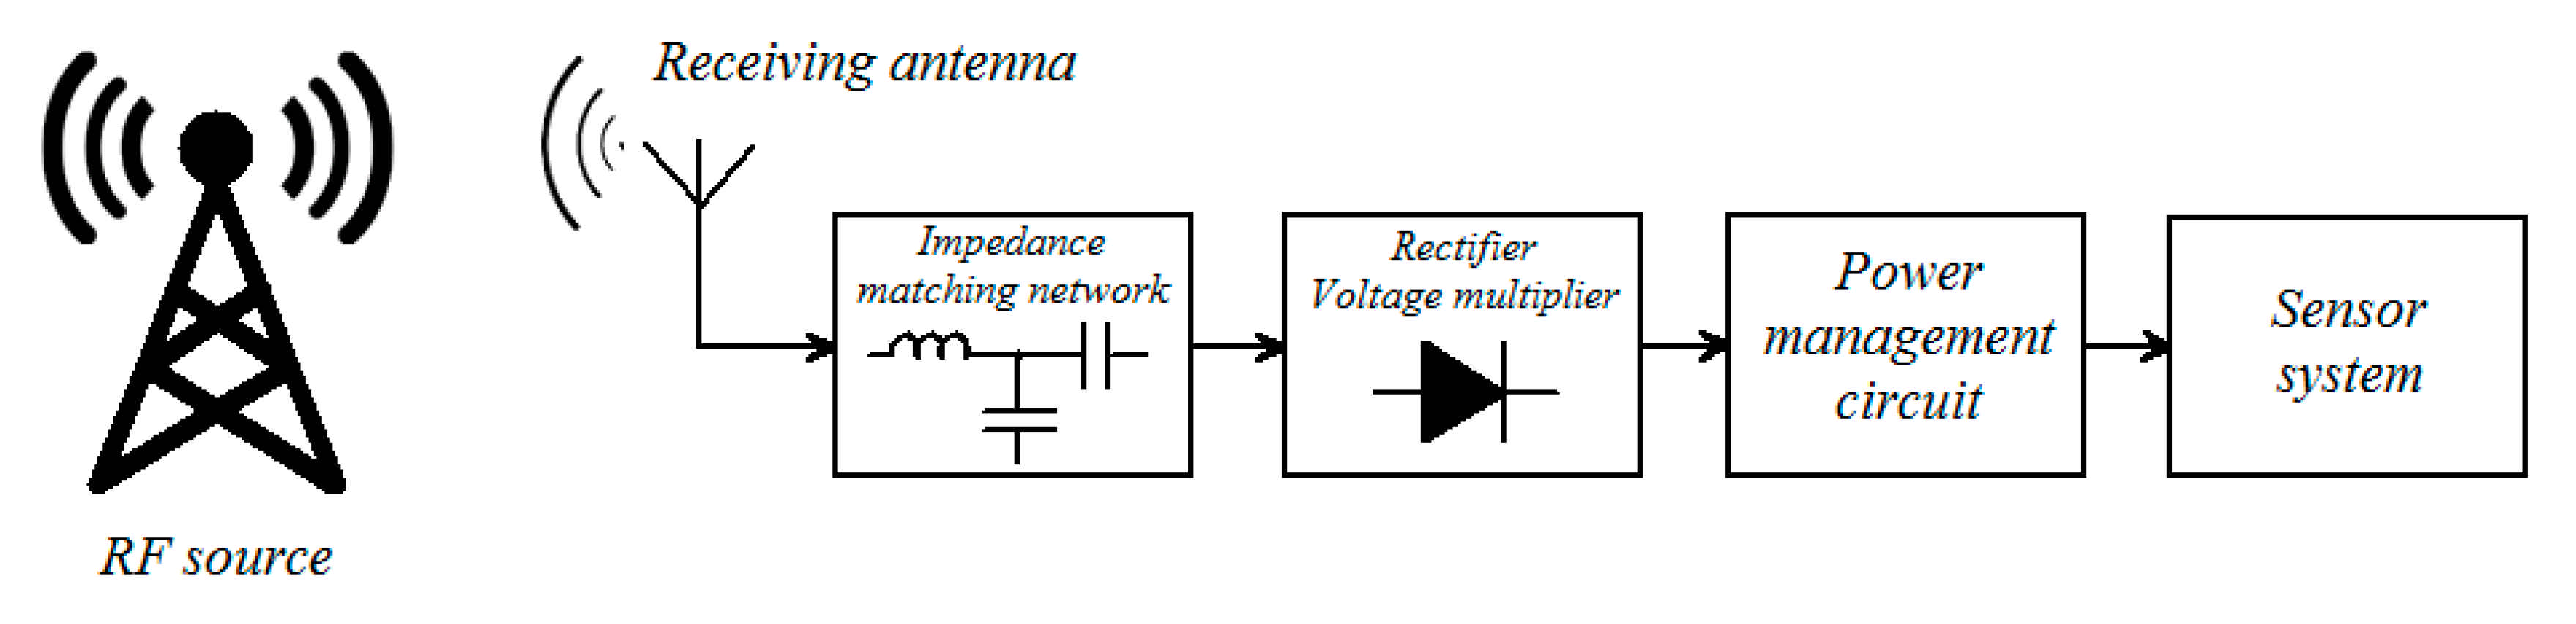
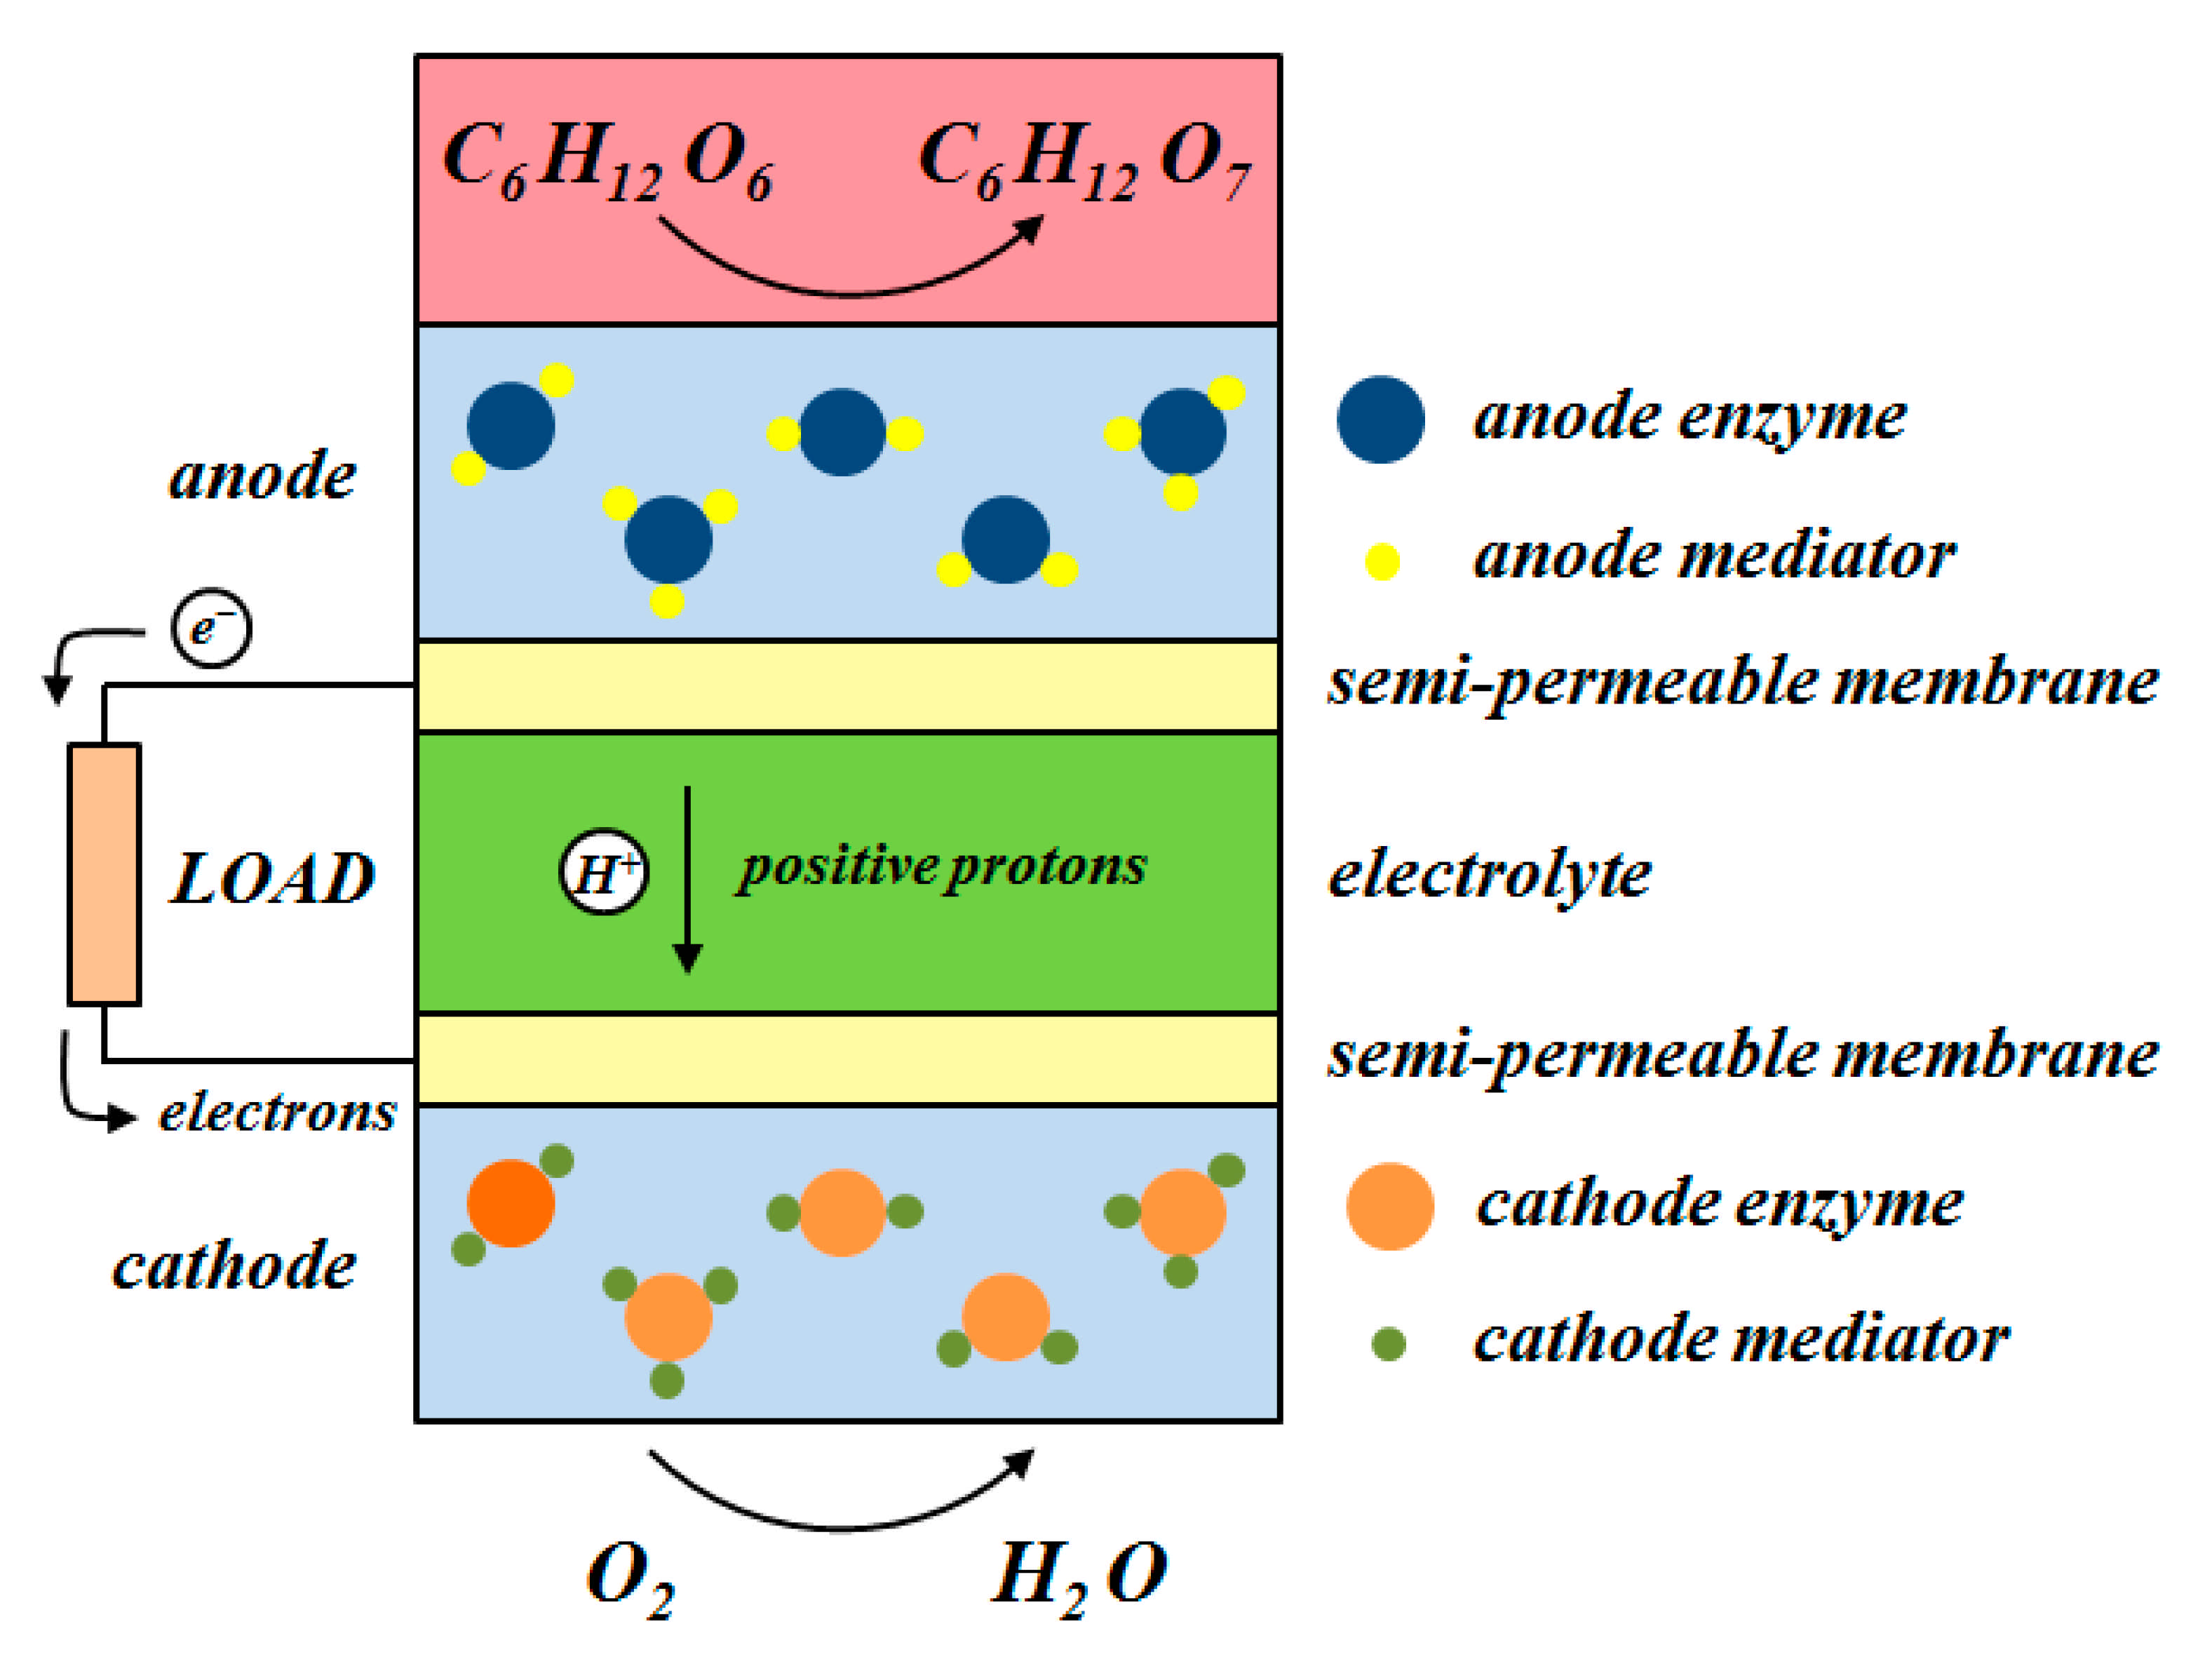
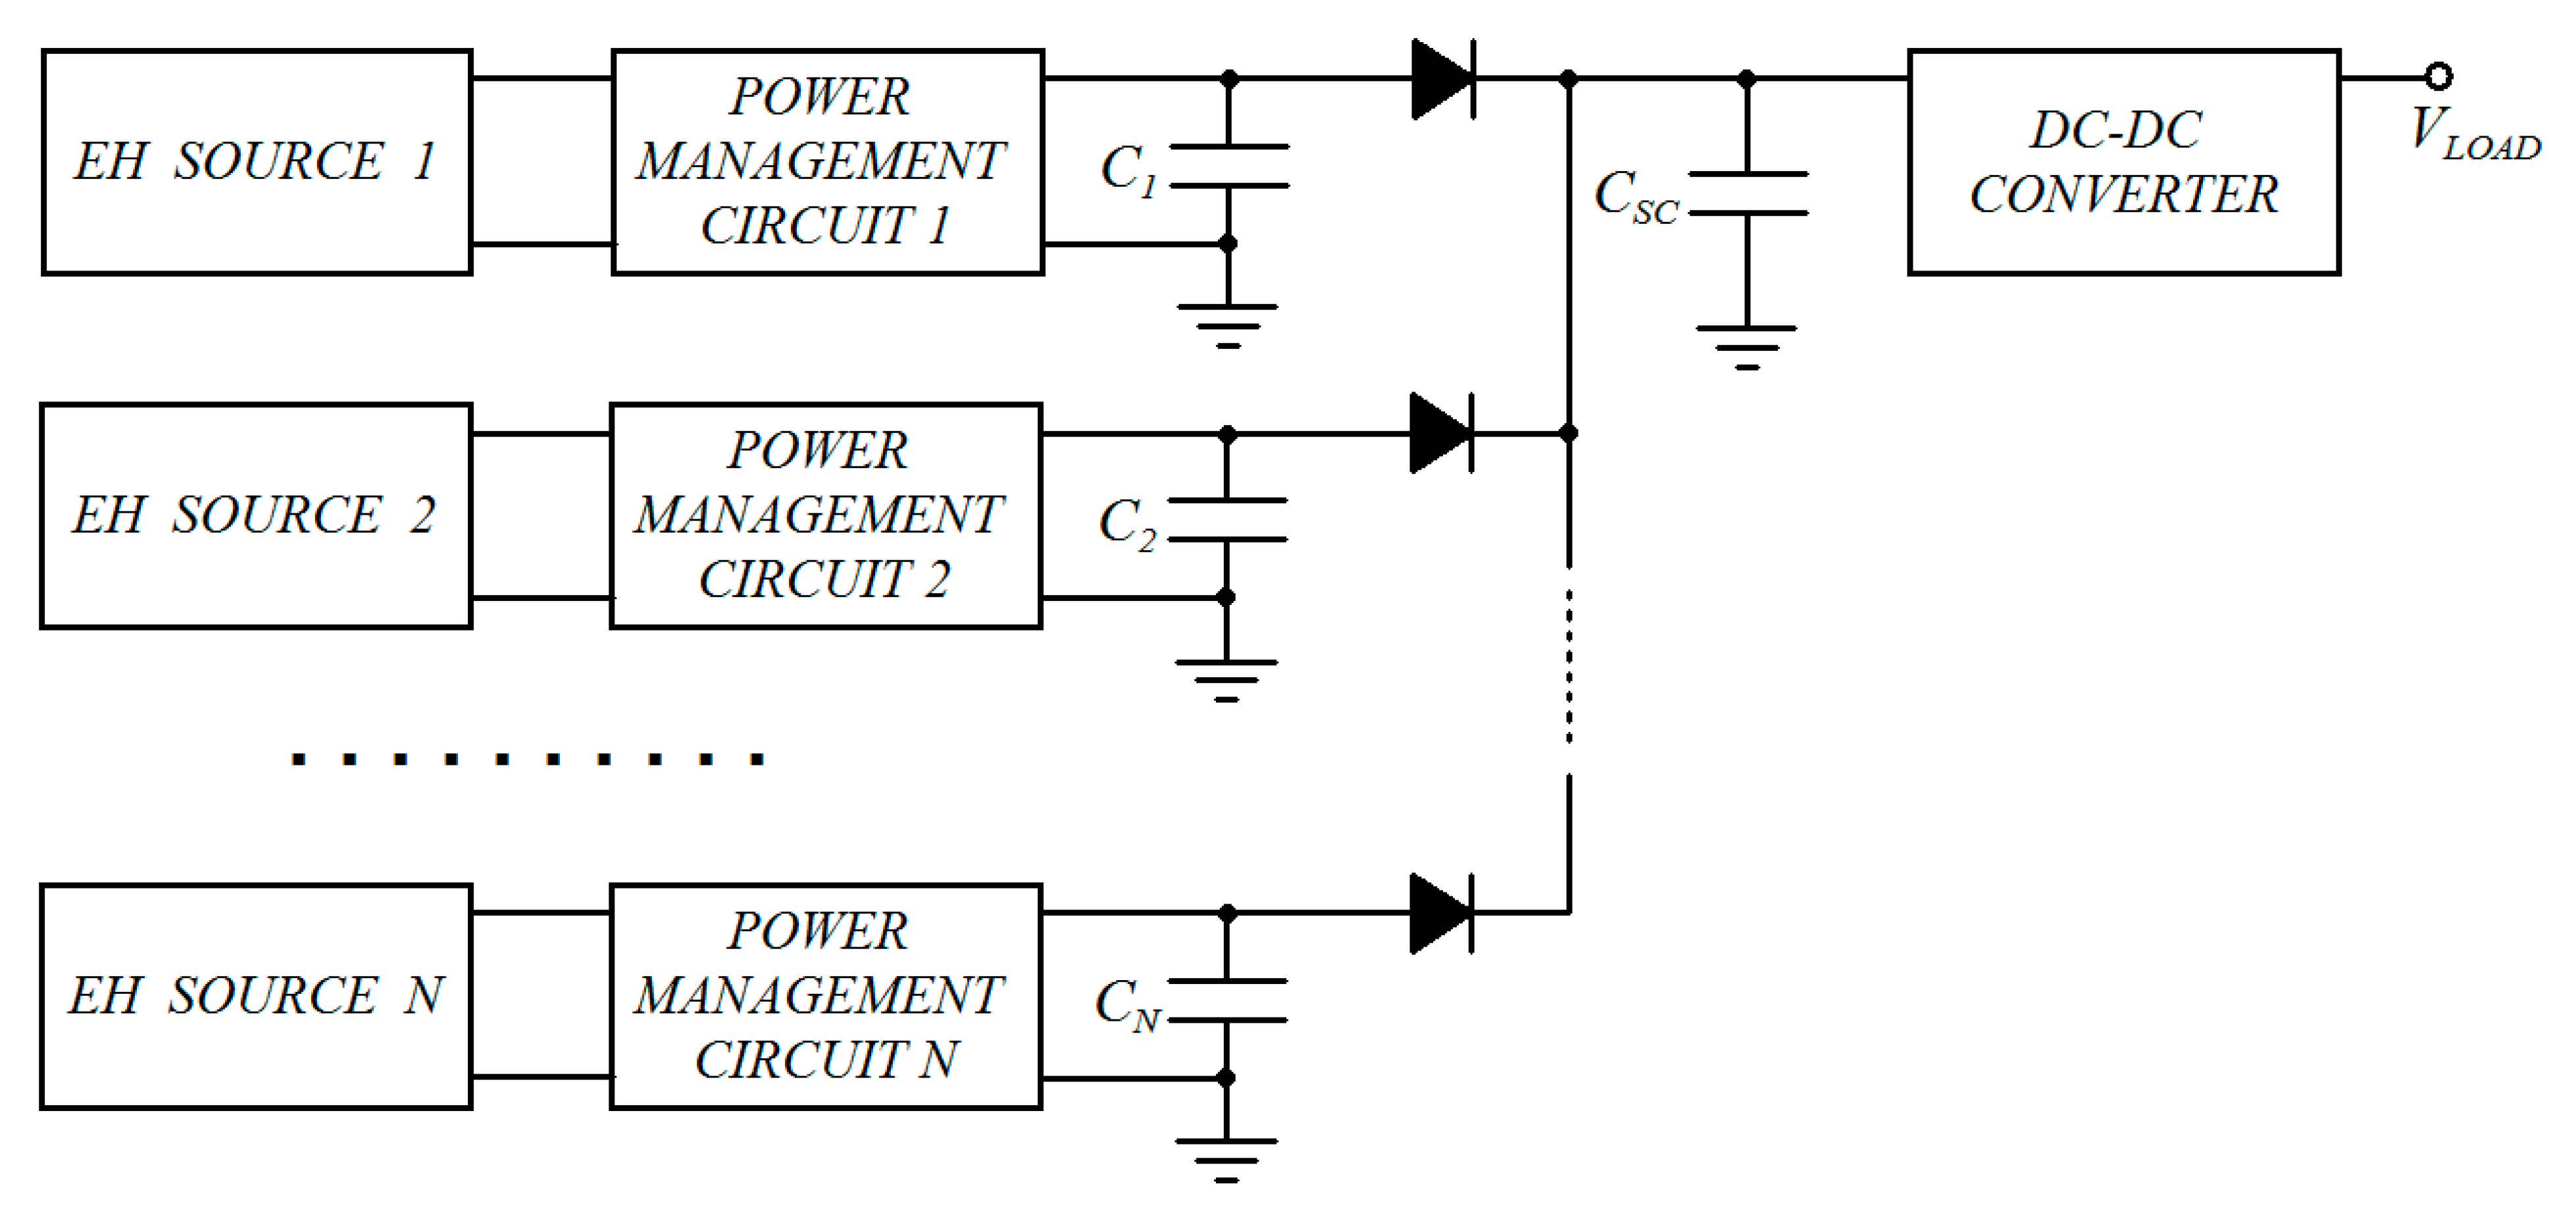
Table 1.
Main energy sources available for energy harvesting and corresponding harvested power.
| Energy Source | Harvested Power |
|---|---|
| Ambient light (direct sunlight) | 100 mW/cm2 |
| Ambient light (bright sunny day) | 15 mW/cm2 |
| Ambient light (cloudy day) | 150 µW/cm2 |
| Ambient light (indoors) | 10–100 µW/cm2 |
| Vibrational (human motion) | 4 µW/cm3 |
| Vibrational (machines) | 800 µW/cm3 |
| Thermoelectric | 60 µW/cm2 |
| Ambient airflow | 1 mW/cm2 |
| Acoustic noise (100 dB) | 960 nW/cm3 |
| Ambient radio frequency | <1 µW/cm2 |
| Biochemical energy | 10–100 µW/cm2 |
Table 2.
Energy harvesting systems powered by photovoltaic modules.
| Transducer Type | Application | Generated Power | Reference |
|---|---|---|---|
| Solar modules | Casio A700 solar wristwatch | - | [67] |
| Solar modules | Logitech K750 solar keyboard | - | [68] |
| 4-4.0-100 solar panels | Berkeley/Crossbow nodes | 198 mW | [69] |
| Solar panels in 100 cm2 area | Wireless structural health monitoring | 780 J in a single day | [70] |
| 14 solar modules | Tracking the position of zebras | 0.4 W in full sun | [71] |
| Solar modules | Tracking the position of turtles | 0.1–1.7 kJ in 10 days | [72] |
| Solar modules | Tracking the position of pink iguanas | - | [73] |
| 4 V 100 mA solar panel | Studies of hydrological cycles in forest | 139 mWh in 30 min | [74] |
| 5 cm × 5 cm solar cell | Measurement of temperature and humidity | 70 mW in full sun | [75] |
| Array of PIN photodiodes | Multi sensors mobile system | 1.29 J in 5 h | [76] |
| 37 mm × 82 mm solar panel | Berkeley’s Telos mote | 40 mA 4.8 V in full sun | [54] |
| 112 cm2 photovoltaic module | Tmotesky sensor platform | 50 mW | [77] |
| a-Si solar cell (AM1815) | Tyndall sensor node | >320 µW | [78] |
| Few cm2 solar cell | Temperature and humidity sensor node | 72.74 µW | [79] |
| 7.4 cm × 5.5 cm solar panel | Outdoor sensor node | - | [80] |
| Perovskite PV cells | Wireless temperature sensor | 14.5 µW | [81] |
| Organic PV cells | Indoor sensor nodes | 0.14 mW | [82] |
| GaAs PV cells | Wireless temperature sensor | 70.8 nW at 200 lux | [83] |
Table 3.
Energy harvesting systems powered by electromagnetic transducers.
| Transducer Type | Application | Generated Power | Reference |
|---|---|---|---|
| Magnetic spring generator | EM generator in a backpack | 300 µW–2.5 mW | [84] |
| Magnetic spring generator | EM generator in a backpack | 7.4 W | [85] |
| Gear motor in door axis | Power from door motion | 3.9 J for an open/close action | [86] |
| Regenerative shock absorber | Power from vibrations in a car | 19 W average power | [87] |
| Permanent magnet generator | Power from sea waves | kWs range | [88] |
| Electromechanical generator | Power from large structures vibrations | >100 W | [89] |
| EM frequency up-conversion | Power from human hand shaking | 2.15 mW | [90] |
| EM rotational transducer | Power from human hand swing | 55 µW | [91] |
| Magnet + cantilever + coil | EM generator with frequency-up conversion | 544.7 µ at 88.6 mV | [92] |
| EM rotational transducer | Rotary magnetic generator in shoe | 230 mW | [93] |
Table 4.
Energy harvesting systems powered by electrostatic transducers.
| Transducer Type | Application | Generated Power | Reference |
|---|---|---|---|
| Honeycomb-type variable capacitor | Power from ventricular wall motion | 36 µW | [95] |
| Multi-layer cylindrical capacitor | Power from blood pressure | 20 mJ per heart beat | [96] |
| Angular electrode + SiO2 electret | Power for cardiac and neural implants | 9.6 µW | [97] |
| ES transducer + SiO2/Si3N4 electret | Tire pressure monitoring system | 60 µW at 60 Km/h | [98] |
| Variable capacitor (60–250 pF) | Power from vibrations | 1.6 µW | [99] |
| ES transducer + electret + turbine | Power from wind energy | 200 µW | [100] |
| ES transducer + CYTOP electret | Power from vibrations | 4.95 µW | [101] |
| ES transducer + potassium ions electret | Power from vibrations of infrastructures | 115 µW | [102] |
Table 5.
Energy harvesting systems powered by piezoelectric transducers.
| Transducer Type | Application | Generated Power | Reference |
|---|---|---|---|
| Piezo-ceramic | Piezoelectric pushbutton | 0.5 mJ 3 V single push | [104] |
| PVDF + PZT | Footsteps mechanical energy | 1.3 mW–8.4 mW | [105] |
| PVDF | Footsteps mechanical energy | 1 mW | [106] |
| β-PVDF | Footsteps mechanical energy | 0.050 J in 1 h | [107] |
| PVDF + PZT | Tree-shaped wind power system | 4 µW (PVDF) + 2.24 µW (PZT) | [108] |
| PVDF | Backpack with piezoelectric straps | 45.6 mW under 444 N load | [109] |
| Interdigitated piezo-fiber | Power from mechanical stress of car tires | 1.37 µW/mm3 | [110] |
| PZT | Piezoelectric energy harvesting mat | 10 mW at 60 N | [111] |
| Different piezo-transducers | Power from rainwater drops | - | [112] |
| PZT | Power from bicycle vibrations | 1.977 mW at 20 km/h | [113] |
Table 6.
Energy harvesting systems powered by thermoelectric generators.
| Transducer Type | Application | Generated Power | Reference |
|---|---|---|---|
| GM200-71-14-16 TEG module | Wearable wireless sensor nodes | 336.9 µW | [120] |
| 30 × 34 × 3.2 mm TEG | Control of a ZigBee based radiator valve | 150 mW at ΔT = 34 °C | [121] |
| TEG | Power from waste heat in exhaust pipes | 2 W peak | [122] |
| TEG | Wireless sensor node in aircraft | 26.5 J in 60 min flight | [123] |
| TEG integrated with sensor | Soil moisture measurement | 34.1 J in a sunny day | [124] |
| Commercial TEG | Absolute pressure measurement | 109 µW at 15 °C | [125] |
| TK-1-3-S TEG module | Axle bearing degradation monitoring | 19.3 mW | [126] |
| TEG | Power from mobile devices heath | 300–600 mW | [127] |
| Commercial TEG (TEC12706) | Self-powered wireless temperature sensor | 13–15 kW/m2 | [128] |
| Bi-Te and Sb-Te TEG | Human heat-powered wristwatch | 22.5 µW | [129] |
| Fabric-TEG composite | Wearable sensor node | 146.9 nW at ΔT = 27 °C | [130] |
| Bi2Te3 and Sb2Te3 TEG | Mobile electroencephalogram system | Few mW | [131] |
| Poly SiGe TEG | Wireless human body applications | 0.3 nW at 150 mV | [132] |
| TEG | Wireless fall events detection | 40–520 µW | [133] |
| TES1-12704 TEG module | Wearable sensor system | 5–50 µW | [134] |
Table 7.
Energy harvesting systems powered by RFID tags.
| Source of Power | Application | Generated Power | Reference |
|---|---|---|---|
| RFID (UWB) | Metal crack detection and characterization | - | [141] |
| RFID (3–7.5 GHz) | Humidity measurement | - | [142] |
| RFID (5.25 Ghz + 7.35 Ghz) | Angular rotation monitoring | - | [143] |
| RFID (915 MHz) | Temperature measurement in concrete | - | [144] |
| RFID (860 MHz) | Pressure measurement | - | [145] |
| RFID (800–860 MHz) | Concentration measurement of solutions | - | [146] |
| RFID (860 MHz) | Food quality monitoring | - | [147] |
| RFID (860–960 MHz) | Environmental monitoring | >5.1 µW | [148] |
| RFID (868 MHz) | Vehicle stability control system | 50 µW at 3 m | [149] |
| NFC (13.56 MHz) | Color sensor for pH measurement | 5 mA at 3.3 V | [150] |
| NFC (13.56 MHz) | Compact dosimetry system | - | [151] |
| NFC (13.56 MHz) | Ethanol concentration measurement | - | [152] |
Table 8.
Energy harvesting systems powered by RF energy sources present in the environment.
| Source of Power | Application | Generated Power | Reference |
|---|---|---|---|
| 464.55 MHz at 2 W | Wireless wearable device | 146.9 mW | [154] |
| DTV (539 MHz) + cellular (738 MHz) | Temperature and light sensor node | >15.8 µW | [155] |
| 915 Mhz band | Mica2 sensor mote | 37 µW | [156] |
| Digital TV UHF (500–600 MHz) | Microcontroller based sensor node | - | [157] |
| Base station (915 MHz) | Wireless telemetry system | >110 µW | [158] |
| 900 MHz band | Wireless gas sensor node | >250 µW | [159] |
| 1.8–1.9 GHz band | Wireless sensor node | 400 pW | [160] |
| DTV + GSM900 + GSM1800 + 3G | Wireless sensor node | 7.4 µW/cm3 | [161] |
| 315 MHz + 400 MHz + 915 MHz + 2.4 GHz | Charging of mobile devices | 743.63 µW | [162] |
Table 9.
Energy harvesting systems powered by biofuel cells.
| Transducer Type | Application | Generated Power | Reference |
|---|---|---|---|
| Needle anode and gas-diffusion chatode | Power from fructose in raw grape | 26.5 µW at 340 mV | [165] |
| Enzyme modified glassy carbon electrodes | Power from living plants | 9 µW∙cm−2 at 0.4 V | [166] |
| Enzyme modified buckypaper electrodes | Power from glucose in oranges | 670 µW | [167] |
| Pt-Ir anode and gas diffusion chatode | Power from glucose in fish | 8.6 µW/cm2 at 15 °C | [168] |
| Compacted graphite disc electrodes | Power from glucose in rats blood | 6.5 µW at 0.13 V | [169] |
| Carbon nanotube/enzyme electrodes | Power from glucose in rats blood | 38.7 µW | [170] |
| Multiwalled carbon nanotubes electrodes | Power from clams hemolymph | 10 µW | [171] |
| Enzyme modified graphite rods electrodes | Power from insects hemolymph | 0.12 µW at 100 mV | [172] |
| Enzyme modified KB electrodes | Power from cockroaches hemolymph | 333 µW at 500 mV | [173] |
| Enzyme modified electrodes | Power from lobsters hemolymph | >160 µW at 1.2 V | [174] |
| Enzyme modified buckypaper electrodes | Power from snails hemolymph | 7.45 µW | [175] |
| Enzyme modified gold plated electrodes | Power for glucose sensor patch | 14 µW | [176] |
| Enzyme modified MWCN electrodes | Power for glucose sensor | 67.86 µW/cm2 | [177] |
| Enzyme modified buckypaper electrodes | Power from glucose in human blood | >300 µW | [178] |
Table 10.
Energy harvesting systems powered by multiple energy sources.
| Transducer Type | Application | Generated Power | Reference |
|---|---|---|---|
| TEG + 125 kHz RFID | Temperature measurement in pipes | >20 mW | [180] |
| Photovoltaic + NFC | Skin temperature measurement | 502 µW indoor, 4 mW outdoor | [181] |
| Photovoltaic + NFC | Multi sensors smart bracelet | 190 µ indoor, 24 mW outdoor | [182] |
| Photovoltaic + RF | Wireless sensor node | - | [183] |
| Photovoltaic + Piezoelectric | Wireless indoor sensor node | 85.94 µW | [184] |
| Photovoltaic + TEG + vibrations | Acoustic emissions measurement | >4.93 mW | [185] |
| Photovoltaic + TEG | Wearable sensor node for health care | 4.9∙10−4 mW/cm2 | [186] |
| Photovoltaic + piezoelectric + RF | Wireless sensor node | 6.2 mW | [187] |
| Photovoltaic + TEG | Indoor wireless sensor node | 621 µW | [188] |
| TEG + RF | Heart rate measurement | 60 µW | [189] |
| TEG + RF | Fall detection system | - | [190] |
| Piezoelectric + Electromagnetic | Wearable sensor node | 75.6 mJ in 270 s | [191] |
| Piezoelectric + Electromagnetic | Wearable sensor node | 1–100 µW | [192] |
| Piezoelectric + Electromagnetic | Bridges health monitoring sensor | 155.7 µW | [193] |
| Photovoltaic + TEG + Wind | Outdoor wireless sensor node | 7805.09 J in a day | [194] |
Publisher’s Note: MDPI stays neutral with regard to jurisdictional claims in published maps and institutional affiliations. |
© 2021 by the author. Licensee MDPI, Basel, Switzerland. This article is an open access article distributed under the terms and conditions of the Creative Commons Attribution (CC BY) license (http://creativecommons.org/licenses/by/4.0/).
Share and Cite
MDPI and ACS Style
Grossi, M. Energy Harvesting Strategies for Wireless Sensor Networks and Mobile Devices: A Review. Electronics 2021, 10, 661. https://doi.org/10.3390/electronics10060661
AMA Style
Grossi M. Energy Harvesting Strategies for Wireless Sensor Networks and Mobile Devices: A Review. Electronics. 2021; 10(6):661. https://doi.org/10.3390/electronics10060661
Chicago/Turabian StyleGrossi, Marco. 2021. "Energy Harvesting Strategies for Wireless Sensor Networks and Mobile Devices: A Review" Electronics 10, no. 6: 661. https://doi.org/10.3390/electronics10060661
Note that from the first issue of 2016, this journal uses article numbers instead of page numbers. See further details here.