Article

The SAVEMEDCOASTS-2 webGIS: The Online Platform for Relative Sea Level Rise and Storm Surge Scenarios up to 2100 for the Mediterranean Coasts

1
Center of Integrated Geomorphology for the Mediterranean Area (CGIAM), 85100 Potenza, Italy
2
Istituto Nazionale di Geofisica e Vulcanologia (INGV), 00143 Rome, Italy
3
School of Engineering, University of Basilicata (UNIBAS), 85100 Potenza, Italy
4
Regional Environmental Research Foundation of Basilicata (FARBAS), 85100 Potenza, Italy
5
Radboud Radio Lab, Department of Astrophysics/IMAPP, Radboud University-Nijmegen, 6500 GL Nijmegen, The Netherlands
6
LESIA, Observatoire de Paris, Université PSL, CNRS, Sorbonne Université, Université de Paris, 92195 Meudon, France
7
School of Civil Engineering, Aristotle University of Thessaloniki (AUTh), 54124 Thessaloniki, Greece
8
School of Rural and Surveying Engineering, Aristotle University of Thessaloniki (AUTh), 54124 Thessaloniki, Greece
9
Centre Tecnològic de Telecomunicacions de Catalunya (CTTC/CERCA), E-08860 Castelldefels, Barcelona, Spain
*
Author to whom correspondence should be addressed.
J. Mar. Sci. Eng. 2023, 11(11), 2071; https://doi.org/10.3390/jmse11112071
Submission received: 24 August 2023 / Revised: 18 October 2023 / Accepted: 25 October 2023 / Published: 30 October 2023
(This article belongs to the Special Issue Sea Level Rise and Related Hazards Assessment)

Abstract

:
Here we show the SAVEMEDCOASTS-2 web-based geographic information system (webGIS) that supports land planners and decision makers in considering the ongoing impacts of Relative Sea Level Rise (RSLR) when formulating and prioritizing climate-resilient adaptive pathways for the Mediterranean coasts. The webGIS was developed within the framework of the SAVEMEDCOASTS and SAVEMEDCOASTS-2 projects, funded by the European Union, which respond to the need to protect people and assets from natural disasters along the Mediterranean coasts that are vulnerable to the combined effects of Sea Level Rise (SLR) and Vertical Land Movements (VLM). The geospatial data include available or new high-resolution Digital Terrain Models (DTM), bathymetric data, rates of VLM, and multi-temporal coastal flooding scenarios for 2030, 2050, and 2100 with respect to 2021, as a consequence of RSLR. The scenarios are derived from the 5th Assessment Report (AR5) provided by the Intergovernmental Panel on Climate Change (IPCC) and encompass different Representative Concentration Pathways (RCP2.6 and RCP8.5) for climate projections. The webGIS reports RSLR scenarios that incorporate the temporary contribution of both the highest astronomical tides (HAT) and storm surges (SS), which intensify risks to the coastal infrastructure, local community, and environment.

1. Introduction

The recent rise in global temperatures since the beginning of the industrial era is causing the progressive melting of Earth’s ice, the thermal expansion of the oceans, and, as a consequence, sea level rise (SLR) [1,2]. These phenomena are causing significant impacts on the global coasts (e.g., coastal erosion, land flooding, water table salinization, etc.) and the marine environment (e.g., algal blooms, alien species invasion, etc.), as well as extreme meteorological effects affecting the coastal communities (e.g., heavy precipitation, strong winds, severe storms, etc.). According to the IPCC (Intergovernmental Panel on Climate Change), climate change may have an impact on the frequency, intensity, and duration of numerous severe events, including storms and floods [1,2,3,4].
SLR caused by global warming (GW) makes coastal flooding more frequent. In most coastal areas, the amount of SLR that happens over years or decades is significantly less than the regular fluctuations in ocean level caused by tides, waves, and storm surges. The frequency and magnitude of coastal flooding, however, can quickly increase even with a moderate SLR [5]. The variations in extreme sea levels driven by GW are a result of both SLR and modifications in storm surge activity [6,7,8,9]. The effectiveness of coastal adaptation measures depends on knowing how these two factors interact to change the frequency of extreme events. Current analyses of tide gauge data show that SLR has been a significant driver of trends in sea level extremes since at least 1960. The influence of changes in storminess, however, is still unclear due to the challenges in detecting this contribution from inadequate data and the resultant ineffective conclusions in the literature [10]. Storm surge is a complex phenomenon greatly influenced by the characteristics of tropical or extratropical cyclones (forward speed, central pressure, and angle of incidence of the storm relative to the coast), and local topographic and bathymetric conditions. The characteristics of tropical cyclones (TCs) may alter as a result of GW. In particular, it is anticipated that, despite a decline in the overall number of TCs, the fraction of intense TCs will rise from current values in the future [11]. The resulting increase in sea level becomes even more significant when the storm surge overlaps with high tides.
The Mediterranean Sea may become more susceptible to storm generation as a result of a warmer environment. However, certain low-pressure systems that arise in the region exhibit dynamic behavior similar to that of TCs under the current climate regime. Even though they typically have a smaller spatial range and a shorter life cycle than TCs, these storms severely affect the densely populated coastal regions that surround the Mediterranean Sea [3,12]. Storm surges fueled by air pressure and surface winds from extratropical storms are the principal culprits behind coastal extreme sea levels [13]. Due to tiny tidal amplitudes (a few tens of cm) and generally minimal tide–surge interactions, astronomical tides have a limited impact on coastal extreme sea levels [14]. There are many low-pressure systems over the Mediterranean Sea, some of which may evolve dynamically in a tropical-like cyclone (Medicane) [15,16,17,18]. Due to the local topography and the storm characteristics, storm surges may change significantly among the various Mediterranean regions [13,17,18,19]. The effects of GW in the Mediterranean basin are expected to be even worse than in other areas of the planet because its rate is 20% faster than the world average [20,21]. European countries facing the Mediterranean Sea will likely experience a mean SLR for 2100 between 20 and 110 cm higher than the 20th-century level, depending on the anthropogenic greenhouse gas concentration in the atmosphere [21].
Relative sea levels around the world’s coasts are changing due to climate-induced SLR and vertical land movements (VLM), including both natural and anthropogenic subsidence in sedimentary coastal lowlands [22,23,24]. The impact of subsidence on RSLR has expanded over the 21st century in conjunction with increasing coastal populations in vulnerable places, particularly on deltas and especially in major and expanding cities located on such deltas. The VLM due to tectonic effects is highly variable in the Mediterranean region and, depending on the geographical location, it can strongly amplify the effect of the SLR causing spatial variability in its pattern [25]. Improved measurements of natural and human-induced subsidence processes are emerging, such as those of the European Ground Motion Service (EGMS) [26,27]. Analyzing these measurements systematically will allow a deeper comprehension of the potential effects of RSLR on regional to global scales, as well as the formulation of appropriate responses [22].
As a result, in order to successfully reduce the effects of GW and SLR, it is required to model and comprehend the phenomenon on a global scale as well as identify local solutions to strengthen resilience and the most effective methods for mitigation [28]. In the EU, around one-third of the population lives within 50 km of the coast [29], and these areas generate over 30% of the Union’s total gross domestic product (GDP). SLR is already affecting the coasts of the Mediterranean Sea, and in the next decades, relevant impacts with dramatic effects on human activities are expected, especially in highly densely populated coastal zones. SLR will ultimately raise the risk of floods and erosion along the coasts when combined with other effects of GW, having a substantial impact on local communities, property, the local economy, and the ecosystem. The effects of GW on human and natural ecosystems are now occurring more quickly than can be mitigated, adapted to, and improved through the use of appropriate interventions. Therefore, it is necessary to increase our ability to adapt to climate change by implementing policies and strategies that will help us deal with the present and the coming decades.
This study shows and discusses a webGIS application specifically created for the SAVEMEDCOASTS and SAVEMEDCOASTS-2 projects (Sea Level Rise Scenarios along the Mediterranean Coasts, www.savemedcoasts.eu and www.savemedcoasts2.eu, respectively, both accessed on 7 August 2023), funded by the Directorate-General for European Civil Protection and Humanitarian Aid Operations (DG-ECHO). The projects aim to prevent the effects of the expected SLR by 2100 and support coastal populations exposed to this phenomenon. In particular, both projects focused on the Mediterranean basin’s main river deltas and lagoons or coastal areas of high environmental or touristic value, where natural and anthropogenic subsidence locally exacerbates the effects of SLR, with a consequent increased risk of submerging high natural and economic value coastal zones.
In the webGIS, we used the current rates of VLM obtained from the analysis of geodetic data from Global Navigation Satellite System (GNSS) networks operating in the Mediterranean area, Interferometric Synthetic Aperture Radar (InSAR) measurements, and tide gauge data, combined with high-resolution topography from Light Detection and Ranging (LiDAR). Climatic data and SLR projections from the 5th Assessment Report (AR5) and the Special Report on the Ocean and Cryosphere in a Changing Climate (SROCC) [2] released by IPCC were used to assess the expected RSLR and the coastal flooding scenarios up to 2100 in the targeted areas of the Mediterranean region, described in Section 2.1. The variable rates of land subsidence, up to several mm/yr in the investigated areas, represent a relevant driver for the local acceleration of SLR. These areas, with valuable anthropic and natural assets, are threatened by the combined effects of SLR, VLM, and storm surges, which are exacerbating coastal erosion and land flooding.

2. Materials and Methods
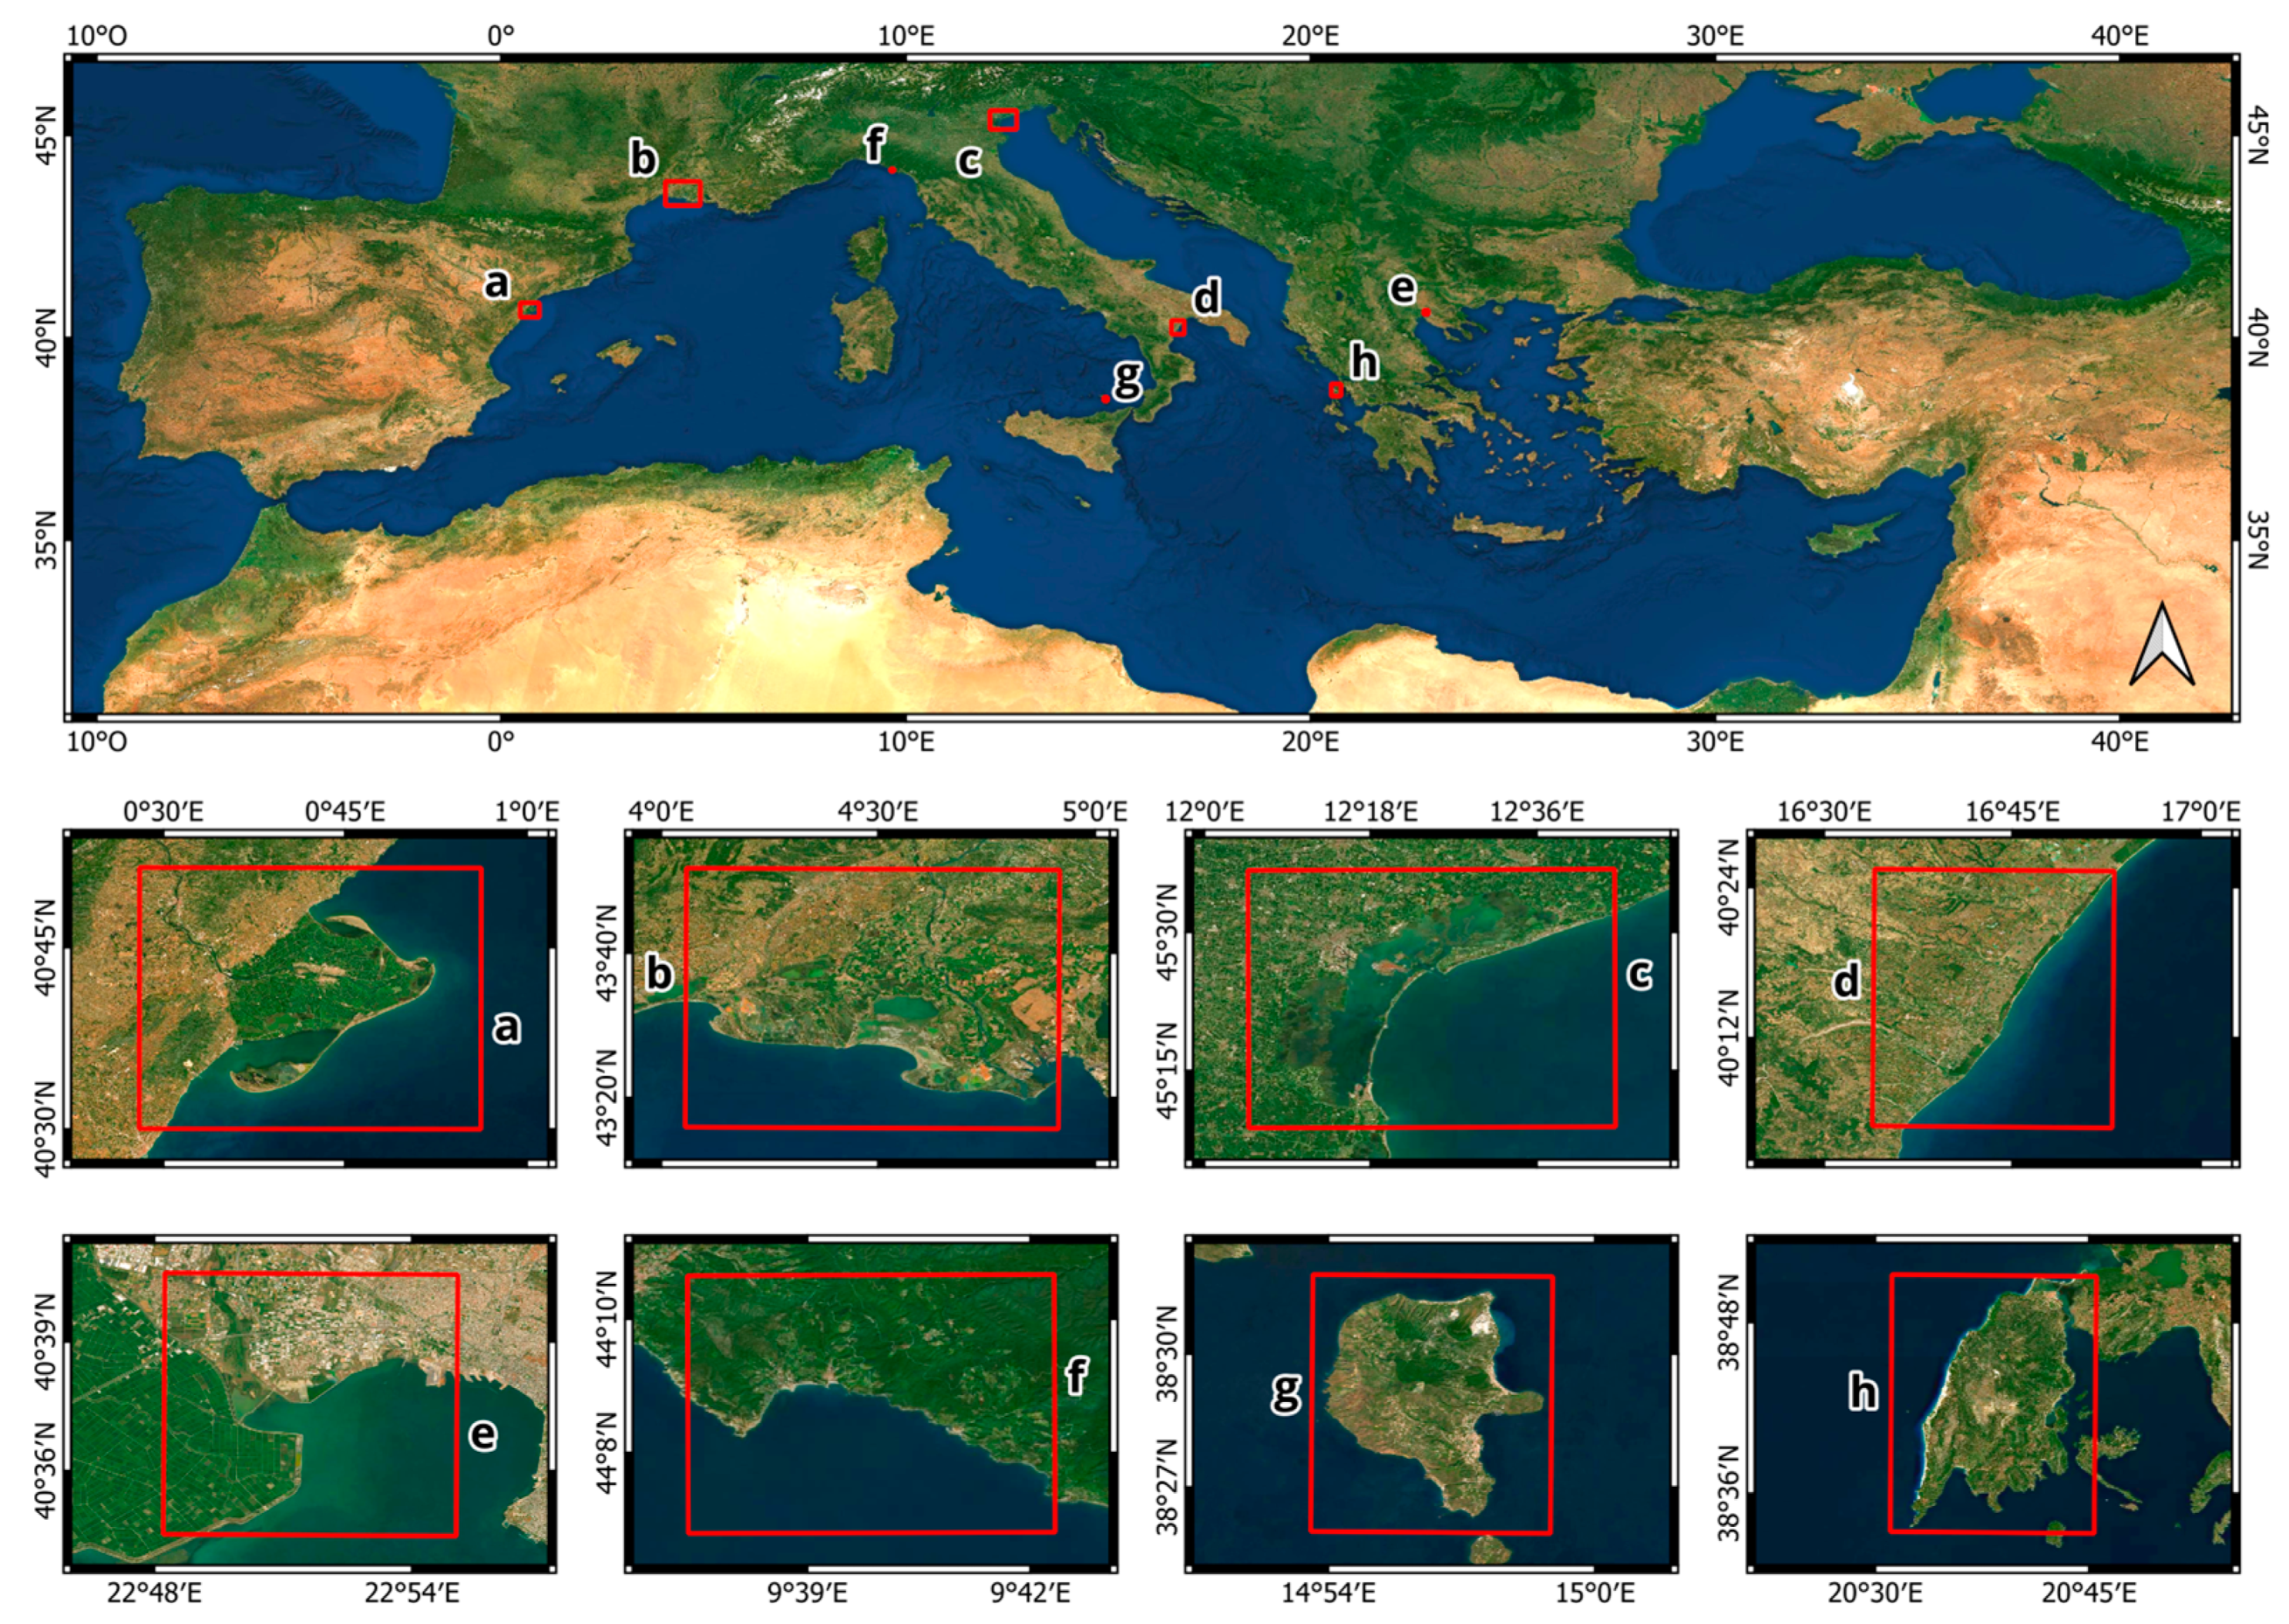
2.1. Study Areas

The study areas of the SAVEMEDCOASTS-2 project include (from west to east) the Ebro Delta (Spain), the Rhone Delta (France), the Venice Lagoon (Italy), the Metaponto Plain (Italy), and the Chalastra Plain (Greece) (Figure 1a–e). Instead, the pilot areas investigated in the former SAVEMEDCOASTS project are (from west to east): Cinque Terre (Italy), Lipari Island (Italy), and Lefkada Island (Greece) (Figure 1f–h).

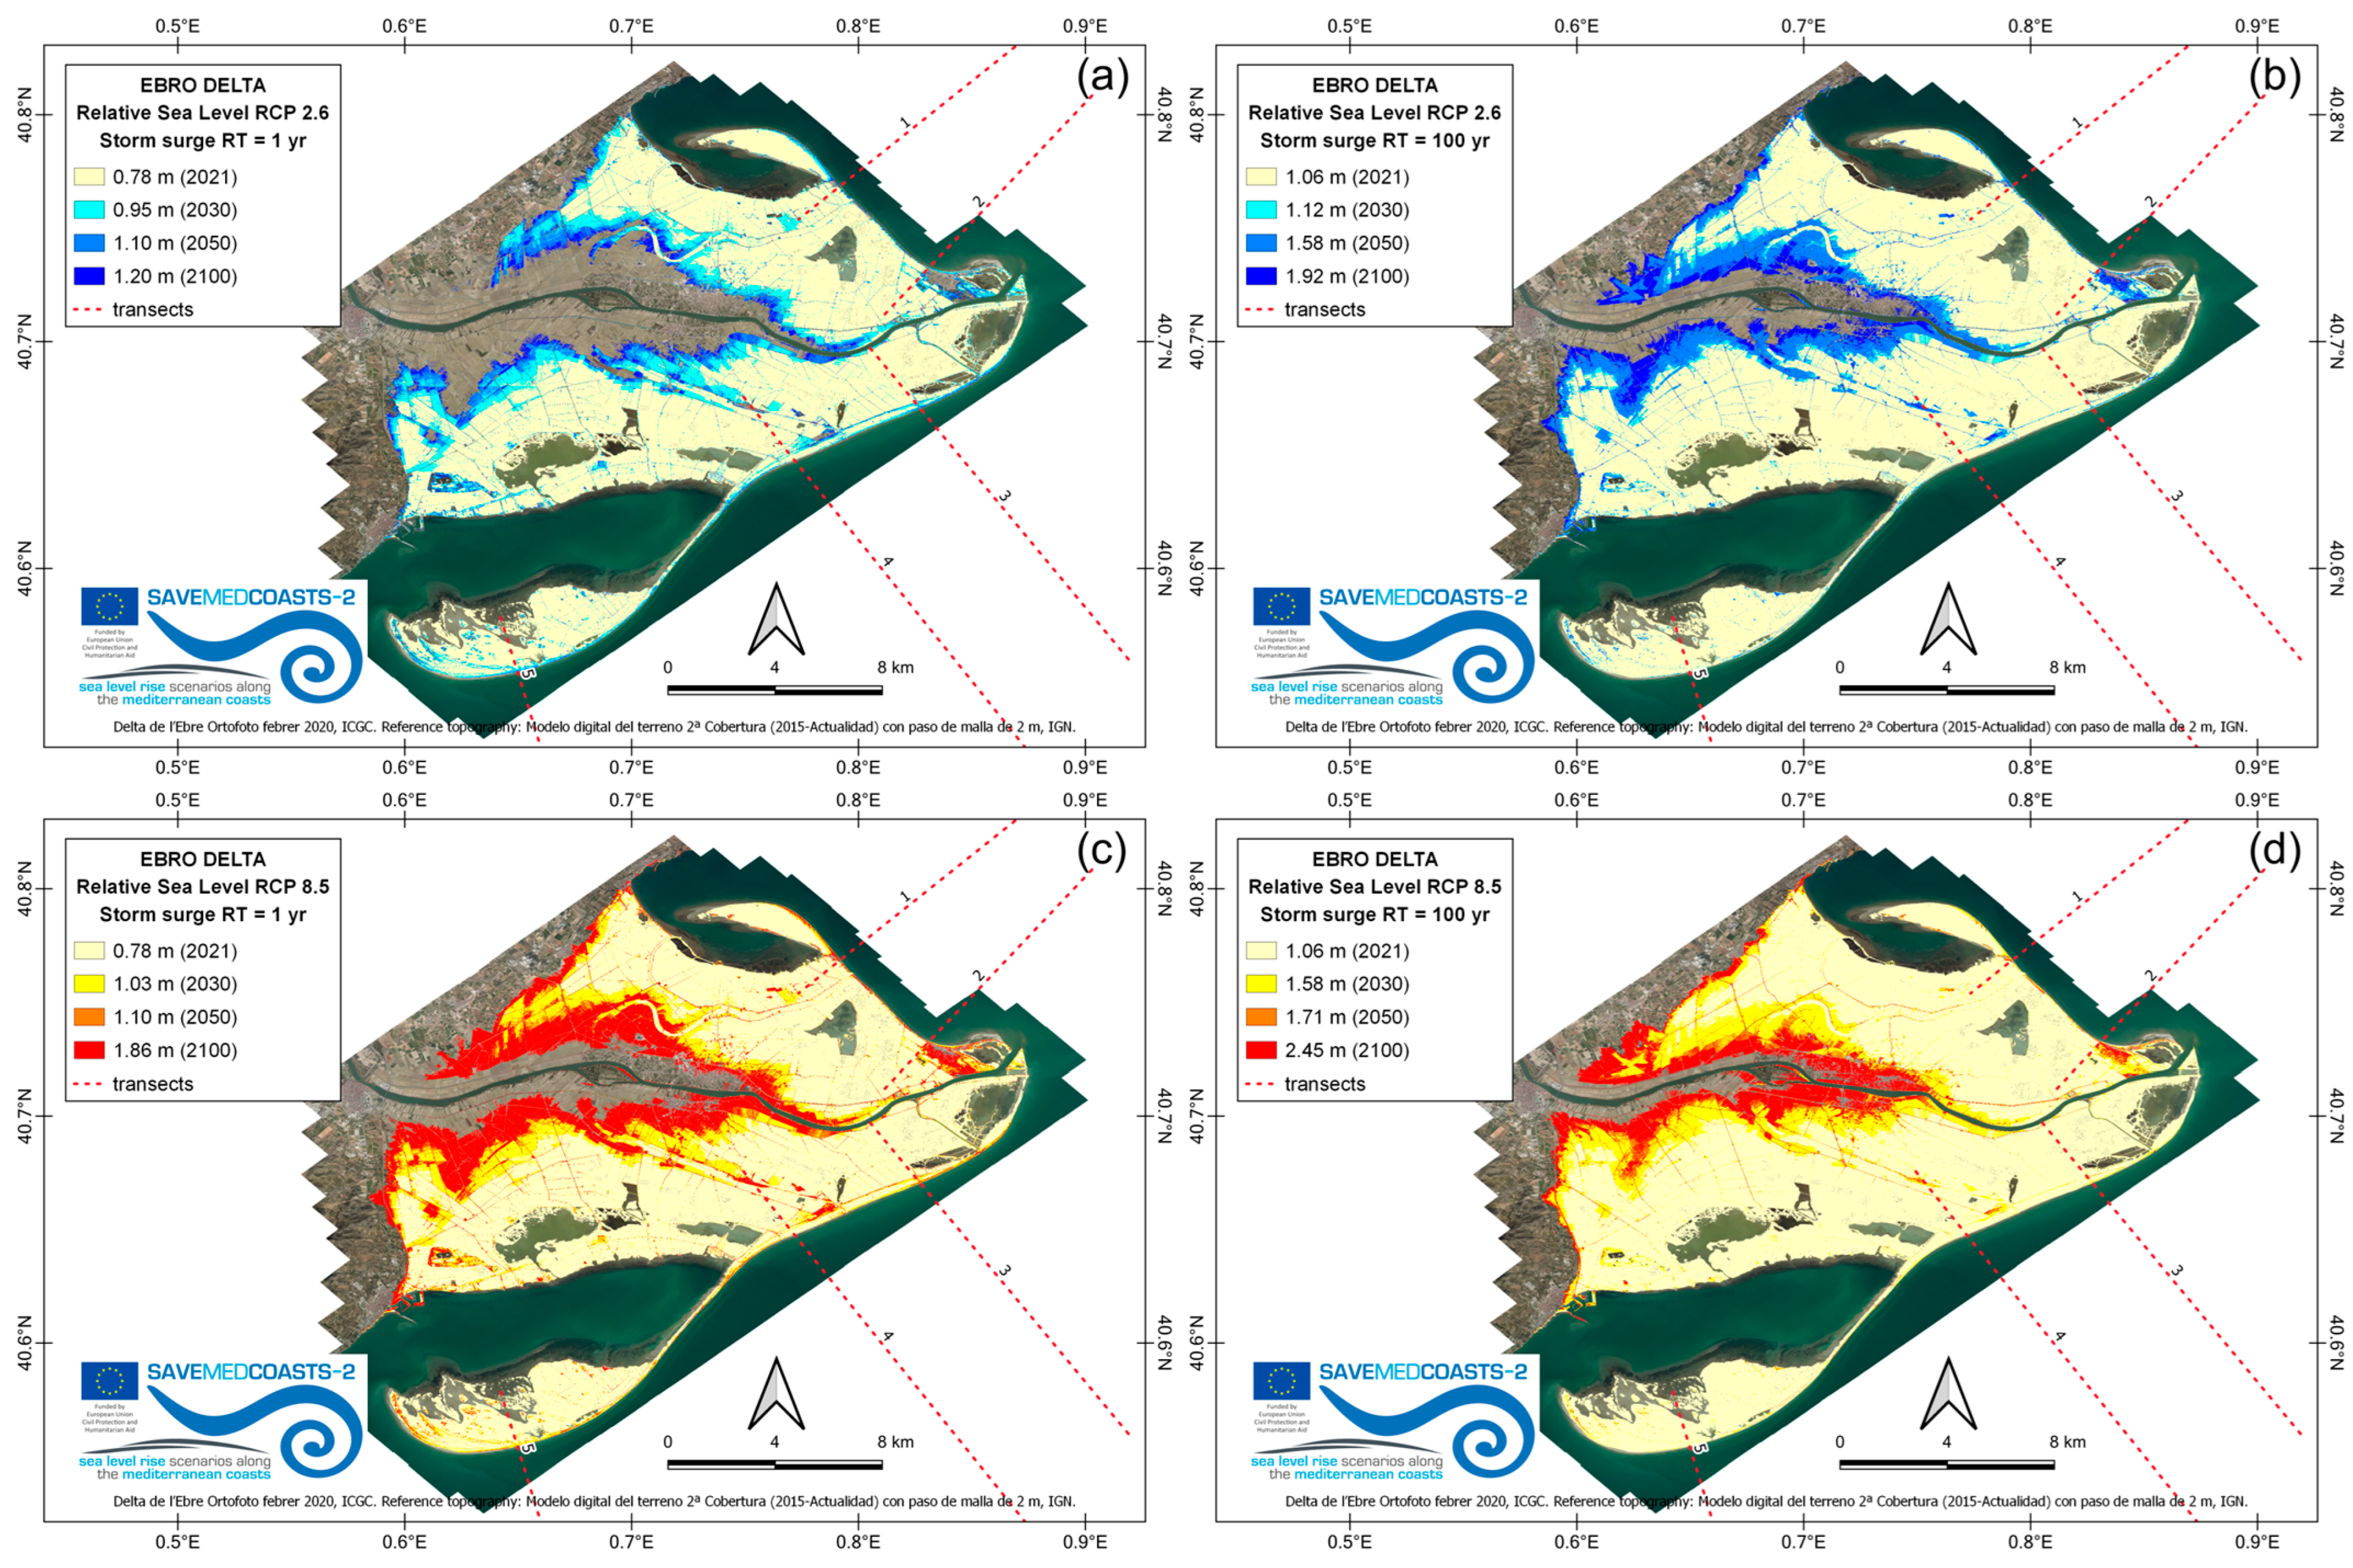
2.1.1. The Ebro Delta (Spain)

The Ebro Delta is a wide wetland area of 320 sq km located in the southwestern part of Catalonia, in the Gulf of Valencia (Spain), where the Ebro River flows into the Mediterranean Sea. The delta is formed by repeated layers of soft alluvial sediments, placed at less than 1 m above sea level. It is continuously shaped by sedimentary processes, which have contributed to the formation of various habitats, including marshes, lagoons, dunes, and beaches, hosting a unique ecosystem characterized by rich biodiversity. The delta hosts about 80 sq km of natural park, including salt marshes and wide beaches with dune systems.
The environmental pressures [30] in the Ebro Delta include coastal flooding and erosion [31], sea level rise [32], land subsidence [33], and the loss of wetland habitats, which threaten its long-term sustainability. Genua-Olmedo et al. [34] estimated that SLR-induced soil salinity will increase 3-fold by 2100, resulting in a decrease in rice production from 61% to 34% for the upper limit of the AR5 RCP8.5 SLR scenario (1.8 m). In January 2020, the Gloria storm hit the Ebro Delta with an exceptional storm surge that reached up to 3–4 km inland [35], resulting in widespread flooding and damage to both the natural and anthropic ecosystems. This also led to crop loss and damage to infrastructure and buildings in the area. This storm highlighted the vulnerability of the Ebro Delta to extreme weather events and the need for increased efforts to manage and protect this important ecosystem.

2.1.2. The Rhone Delta (France)

The Rhone Delta, also known as the Camargue, is the largest river delta (about 1400 sq km) in Western Europe. It is located in Southern France where the Petit Rhône and Grand Rhône, the two arms of the Rhone River, flow into the Mediterranean Sea. The morphology of the delta is characterized by a flat and low-lying landscape extending for tens of kilometers inland, with about 70 km of sandy beaches, dune systems, salt marshes, lagoons, and sandbars [36]. The Camargue is home to a regional natural park belonging to UNESCO’s Man and Biosphere Reserve. It is a Ramsar Site and a Special Protected Area (SPA) under the umbrella of the EU Birds Directive. The Rhone Delta’s regional economy is based on agriculture, fishing, and tourism. About two-thirds of the suitable agricultural area is used for rice production, which is the primary agricultural activity.
Climate change and anthropogenic pressure are the key issues the delta must address. Climate change is a significant threat to the fragile equilibrium of this area, as it can result in coastal erosion, saltwater intrusion [37,38], and flooding, because about 70% of the delta has an elevation of less than 1 m above the sea level. These conditions may potentially lead to detrimental effects on the ecosystem, human activities, and infrastructures.

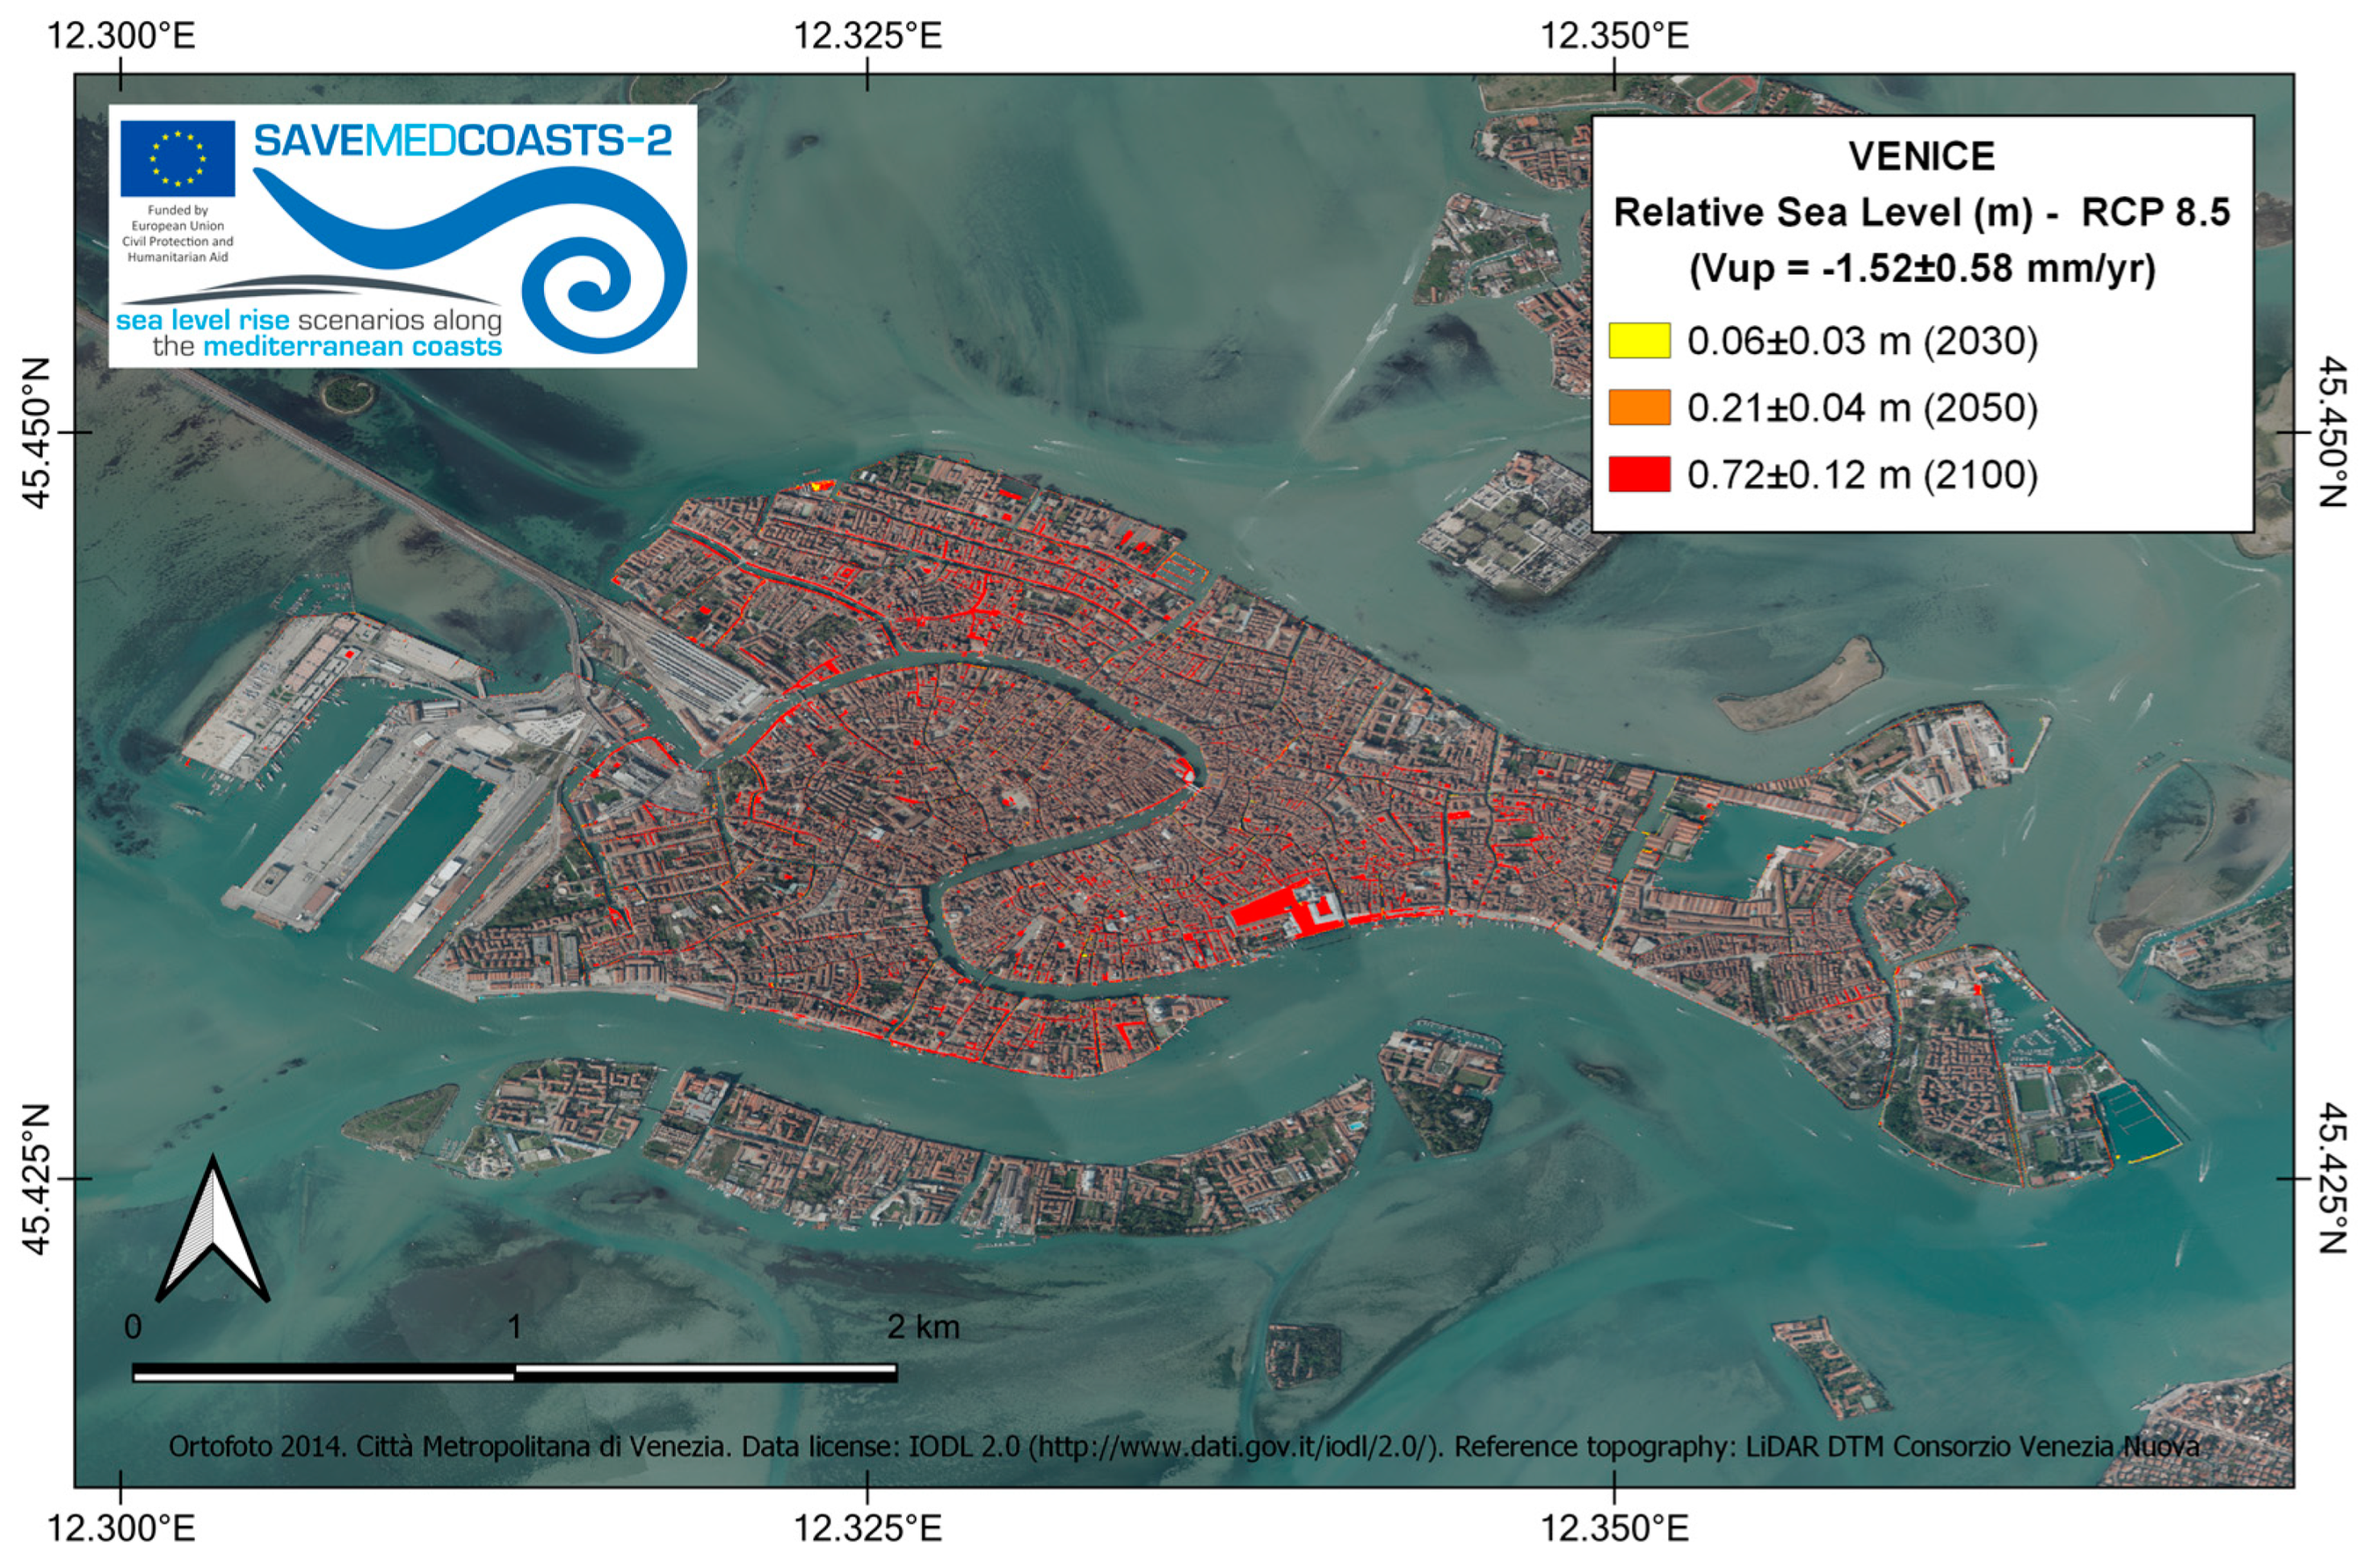
2.1.3. The Venice Lagoon (Italy)

The Venice Lagoon, covering about 550 sq km, connects to the Adriatic Sea through three inlets: Lido, Malamocco, and Chioggia. These inlets are placed between two thin barrier islands, Venice Lido and Pellestrina, and the mainland, with Chioggia located in the southwest and Cavallino Treporti in the northeast. The lagoon is characterized by a complex network of canals, islands, and salt marshes that make up its unique environment. The area has been settled since prehistoric times and is an important natural and cultural location recognized by UNESCO as a World Heritage Site since 1987. The local economy of the Venice Lagoon is heavily dependent on tourism, with millions of visitors every year. The lagoon is subjected to a variety of anthropogenic and environmental factors, including pollution, land subsidence, coastal erosion, and sea level rise [39,40,41], which jeopardize its environment. In particular, natural and anthropogenic land subsidence is a major threat since it worsens the city of Venice’s vulnerability to SLR. Vecchio et al. [25] determined that the projected RSLRs for the RCP2.6 and RCP8.5 scenarios in 2100 are expected to be 603 ± 217 mm and 818 ± 258 mm, respectively. Specifically, at the Venice Punta della Salute tidal station, VLM and sea level natural variability are responsible for more than 60% of the projected SLR.
During episodes of “acqua alta” (high water), the sea level rises above its usual level due to the conjunction of astronomical tides, seiches, and atmospheric forcings that can trigger extreme events, pushing the Adriatic Sea into the lagoon and resulting in critical flooding of the city of Venice. During “acqua alta” events, water levels can exceptionally rise over +140 cm above the local 1897 datum (the reference level is the tide gauge at Punta della Salute), seriously harming the safety of its inhabitants, human activities, and infrastructures. It is important to note that such events have continuously increased in frequency and amplitude in the last decades [41,42]. To mitigate these effects, Venice installed the Modulo Sperimentale Elettromeccanico (MoSE), a EUR 6.2 billion system consisting of a set of submerged mobile barriers [43,44] that can be raised above the sea level, to temporarily close the connection of the Venice Lagoon with the Adriatic Sea, protecting the city of Venice from flooding.

2.1.4. The Metaponto Plain (Italy)

The Metaponto Plain is a 30 km long and approximately 350 sq km flat coastal plain, extending along the Ionian coast of the Gulf of Taranto in the Basilicata region (Southern Italy). Its coast is characterized by low, sandy beaches affected by ongoing erosion [45]. The Metaponto Plain is an important agricultural area that includes two state reserves (Marinella Stornara and Metaponto), a regional one (Bosco Pantano of Policoro), and several Natura 2000 sites.
Environmental threats are soil erosion [46,47], groundwater depletion [48] and saltwater intrusion [49] due to groundwater overexploitation, rising sea levels, and increasingly intense storm surges [50] which are affecting the agricultural sector and the local economy.

2.1.5. The Chalastra Plain (Greece)

The Chalastra Plain is a low-lying coastal plain located near Thessaloniki in Central Macedonia (Greece), between the Axios River in the west and the Aegean Sea in the east. The coastal plain is well known for agricultural and fishing activities, and the natural area linked with the lagoon at the mouth of the Axios River.
Threats to the Chalastra Plain include habitat degradation, water pollution, and soil erosion. The plain is affected by land subsidence [51], primarily due to excessive groundwater exploitation and the compaction of the alluvial soil layers. Therefore, sea level rise is rising faster, while the coast becomes more prone to flooding and erosion.

2.1.6. Cinque Terre (Italy)

Cinque Terre is a jagged stretch of coast on the Ligurian Riviera di Levante in Northeastern Italy. It is well known for its five seaside villages (the so-called “terre”): Monterosso al Mare, Vernazza, Corniglia, Manarola, and Riomaggiore, which belong to part of the Cinque Terre National Park and a UNESCO World Heritage Site. Cinque Terre is a tourist destination famous for its rugged coastline, steep terraced vineyards, and multicolored buildings. Its coastlines are predominantly rocky and characterized by steep cliffs and narrow beaches.
Storm surges can lead to significant flooding and damage in Cinque Terre. Their impacts are exacerbated when they occur alongside heavy rainfall, which can cause landslides and threaten the terraces and villages. On 25 October 2011, a catastrophic rainstorm occurred, causing the loss of lives, landslides, and significant damages to structures and economic activities, especially in Monterosso al Mare and Vernazza [52].

2.1.7. Lipari Island (Italy)

Lipari is the largest (ab. 37 sq km) and most inhabited island of the Aeolian archipelago (Italy), which has belonged to UNESCO since 2000. It is placed in the southern Tyrrhenian Sea, in one of the most active volcanic areas of the Mediterranean basin. The island is characterized by the long beaches of Canneto, Acquacalda, and White Beach and sharp rocky cliffs. Its economy is mainly based on tourism and fishing. The main threat affecting Lipari is the combined effect of SLR and volcanic-tectonic land subsidence [53]. The island is also vulnerable to the impacts of storm surges, which, combined with high tides, can lead to significant flooding and damage to coastal infrastructure, as well as to beach erosion seriously threatening the already narrow beaches [54].

2.1.8. Lefkada Island (Greece)
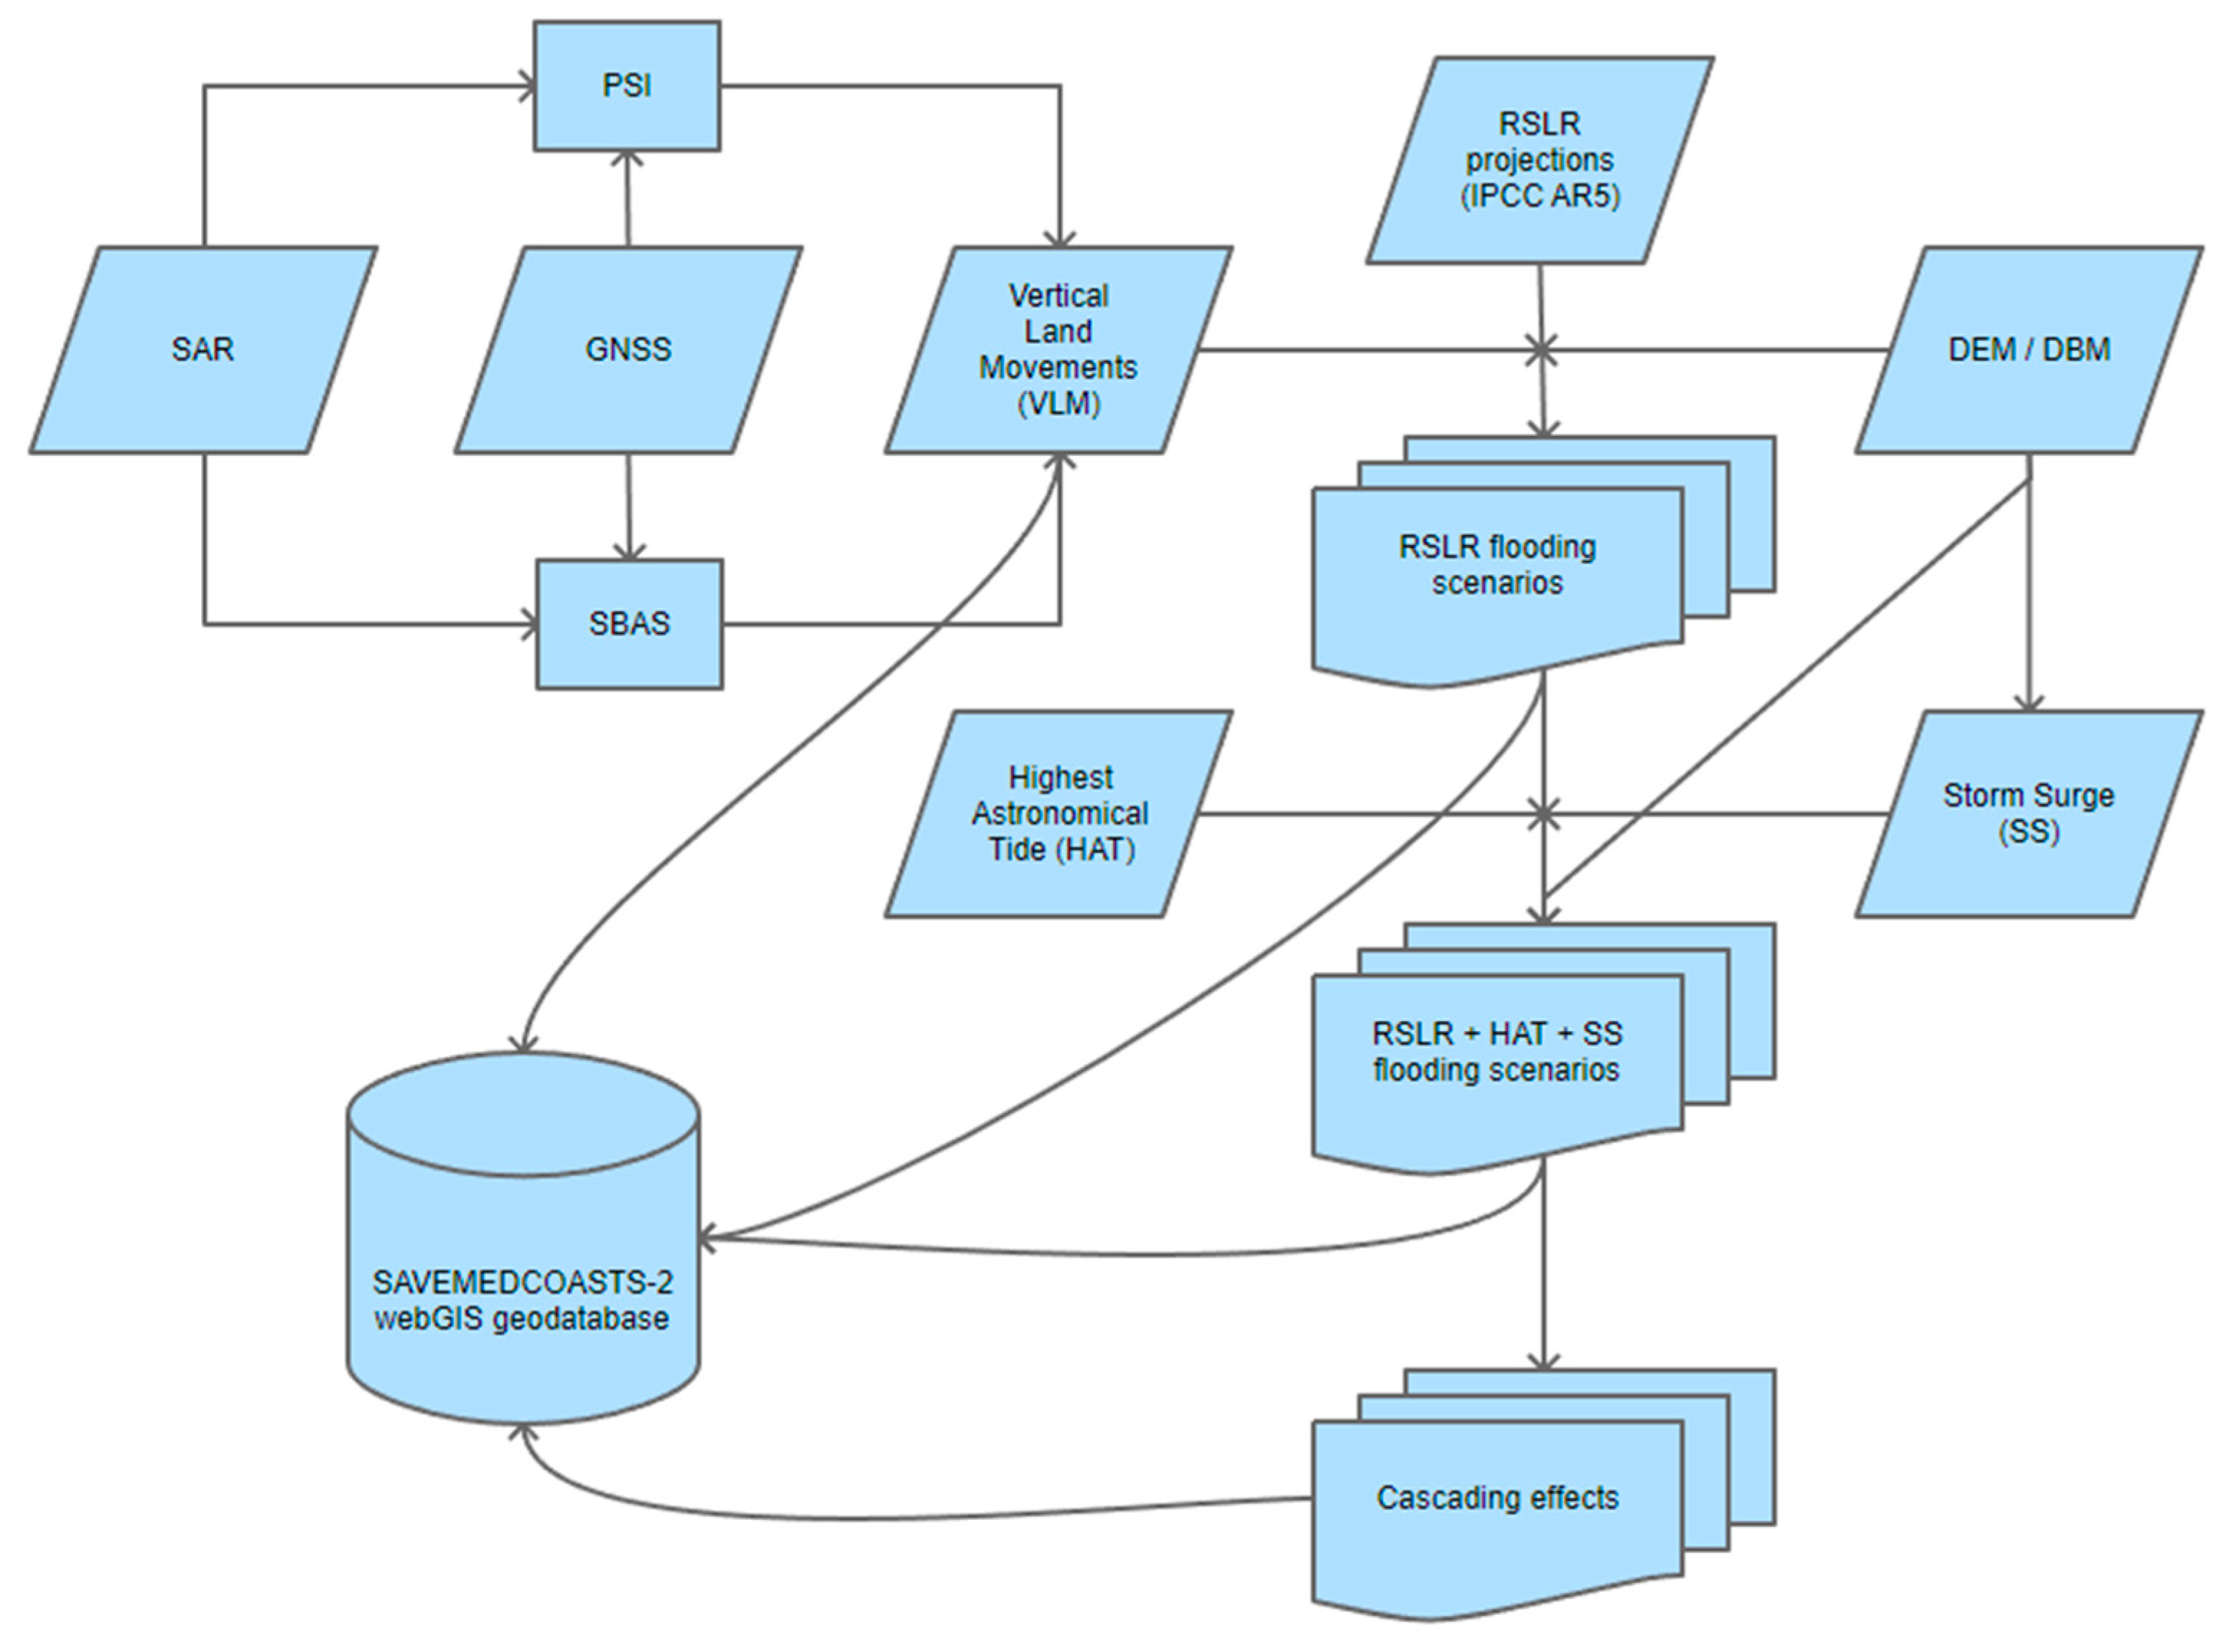
The island of Lefkada belongs to the archipelago of the Ionian Islands. It is located along the west coast of Greece, in the Ionian Sea. Its northern part is linked to the mainland by a short mobile bridge that crosses the Lefkada channel. It is about 302 sq km and characterized by a rough topography that reflects the active tectonics and seismicity of this region. Frequent earthquakes and episodic tsunamis have struck this area in the past centuries [55]. The northern sector of the island is characterized by a natural barrier, separating the shallow Lagoon of Lefkada (Natura 2000 and Ramsar Site) from the open sea. The erosion threatens its indented coastline, leading to the loss of beaches and coastal habitats. In addition, the combination of SLR and storm surges can exacerbate coastal erosion, saltwater intrusion, and more frequent and severe coastal flooding. The city of Lefkas, placed on the northern side of the island, is particularly exposed to SLR, being placed at less than 1 m above sea level. Wintertime high tides often flood the embankments and partially the city, with consequent impacts on human activities and coastal infrastructure, like harbor installations and roads.
In September 2020, the Medicane Ianos impacted the Ionian Islands, including Lefkada. The strong winds associated with Ianos amplified surface currents seven-fold above average, resulting in an SLR of 0.25 m with peaks of 0.30 m. The maximum significant wave height near the Ionian Islands reached 5.9 m, leading to the generation of a storm surge [56].

2.2. Method

The methodological approach adopted in the SAVEMEDCOASTS-2 webGIS includes results derived from several analyses carried out at the time of the project implementation (Figure 2):
  • Assessment of the present-day and projected RSLR up to 2100 along the Mediterranean coasts according to the IPCC AR5 projections for the “mitigation” (RCP2.6) and the “business as usual” (RCP8.5) extreme scenarios. Projections are locally updated for the current rates of vertical land movements. The latter were estimated through a combined geodetic analysis of InSAR and GNSS data.
  • Mapping the spatial extent of potential flooding areas derived from the combination of RSLR projections (RCP2.6 and RCP8.5), the highest astronomical tides (HAT), and the storm surge condition (ordinary or extreme) for all the considered epochs in 2021, 2030, 2050, and 2100.
  • Preliminary assessment of cascading effects on relevant targets (e.g., land, environment, and human assets) to effectively address policymakers and coastal planners in drafting climate change adaptation plans and measures against SLR. By overlapping the potentially flooded areas with human settlements and local infrastructures (buildings, transportation networks, drainage channels, valuable crops, etc.), along with environmental ecosystems (land use/land cover, protected areas, etc.), the measures to be taken can be evaluated in terms of percentage indicators of damage or integrity on specific anthropic or environmental components.

2.2.1. Digital Terrain Models

Translating RSLR into potential flooding scenarios for exposed coasts and assets is crucial for decision makers and coastal planners to evaluate eventual adaptation measures. The quality of such scenarios strongly depends on the vertical accuracy of the Digital Elevation Model (DEM) adopted. For instance, remotely sensed freely available DEMs, such as the Shuttle Radar Topography Mission (SRTM) model and the Copernicus DEM, obtained from satellite data [57], are characterized by low resolution and uncertainties with a positive bias that underestimates the terrain elevation, especially in densely vegetated or populated areas [58,59]. These global elevation models are not suitable to evaluate in detail the RSLR scenarios in coastal areas prone to SLR [60]. Therefore, we used high-resolution DEMs specifically acquired in the projects or available from local authorities (Table 1). The bathymetric data for storm surge modeling have been obtained from the European Observation and Data Network (EMODnet), except for the Rhone Delta, as the LITTO3D-PACA-2015 product provides a continuous land-sea digital terrain model on the coastal fringe of the territory.

2.2.2. Vertical Land Movements

The effects of SLR along the coasts are dependent on the current rates of VLM, which can be exacerbated by land subsidence due to natural (e.g., compaction of alluvial soils) or anthropogenic (e.g., groundwater exploitation) processes [2]. Because VLM plays a crucial role in RSLR scenarios, its rates have been evaluated for each study area using geodetic data from the Euro-Mediterranean Global Navigation Satellite System (GNSS) networks, synthetic aperture radar interferometric measurements (InSAR) from Copernicus Sentinel-1A (S1A) and Sentinel-1B (S1B) sensors, and sea level data from a set of tidal stations of the Permanent Service for Mean Sea Level (PSMSL) [61]. The methodology adopted for the assessment of the vertical land motion rates was a combination of the results of the Permanent Scatterers (PS) [62] and Small Baseline Subset (SBAS) [63] techniques, calibrated with GNSS data. The algorithm of interpolation applied to InSAR data is the SAGA GIS Multilevel B-Spline Interpolation (with B-spline refinement) [64]. Once the PS and SBAS velocities had been calibrated against the same reference GNSS station, the two datasets were considered congruent and complementary to each other. The mean value of the two datasets was then considered representative of the current land subsidence in the investigated area. The spatial average of the ground vertical velocities evaluated for each study area is reported in Table 2.

2.2.3. Relative Sea Level Rise Scenarios

The RSLR projections up to 2100 for the targeted coastal zones were evaluated against the expected end-century SLR and VLM. To estimate the RSLR for different epochs for each study area, the regional IPCC sea level projections discussed in the AR5 [2] have been considered as a reference. The modeled Glacial Isostatic Adjustment (GIA) contribution to the IPCC rates has been replaced with the GNSS vertical velocities, which contain both GIA and tectonic components, to include the contribution of VLM in the SL forecasts. To take into account the existing uncertainties for the SL evaluation, the lower and upper SL bounds from the IPCC projection and errors from GPS measurements were considered [65]. In this way, the best estimate of RSLR projections at specific points and along the transects required by the adopted storm surge model has been provided. Results support the evaluation of RSLR scenarios and storm surge scenarios in RSLR conditions up to 2100 with unprecedented details, assuming that the present-day vertical land motion estimated by the geodetic analysis will continue in the next decades at similar rates.
To deepen the characterization of the coastal zones prone to RSLR and the accuracy of the expected flooding area assessment, each investigated site has been further divided into different areas of interest (AOIs) for which the land subsidence rate was evaluated locally. In this way, the local RSLR projections and flooding scenarios are provided at high spatial resolution and are more representative of specific areas. Thus, multiple flooding scenarios were mapped for each AOI.
The potential RSLR flooding scenarios for AOIs were grouped by different RCPs to create a time series of RSLR projections (because of the large number of possible combinations of boundary conditions). As an example, the map of the RSLR for RCP8.5 climatic scenarios for the City of Venice is shown in Figure 3.

2.2.4. Wave Climate

Wave climate data were considered as a re-analysis of atmospheric and wave conditions by WAVEWATCH III (WWIII) hindcasting methods for the whole Mediterranean Sea, operated by the Department of Environmental, Chemistry, and Civil Engineering of the University of Genoa [66,67]. This model allows the climate wave analysis to refer to several case studies related to heavy storms observed in the Mediterranean basin in the last 25 years. When available, buoy data from multiple official sources were used to validate the simulation results. Wind forcing has been simulated using the WRF (Weather and Research Forecasting) model for all the case studies, while the wave simulations are carried out using the WWIII model. Where detailed local wave data are unavailable, the wave data for each study area and each return time (RT) have been derived through omnidirectional analysis as a first-order assessment. Extreme wave height analysis has been carried out for each investigated location following the Peak Over Threshold (POT) method. The analyses in terms of the omnidirectional storm have been performed in each location concerning the return periods of 1 and 100 years, respectively (Table 3).

2.2.5. Astronomical Tides

For each location, typical tidal data have been obtained from the Permanent Service for Mean Sea Level (PSMSL, www.psmsl.org, accessed on 7 August 2023) at the National Oceanography Centre (NOC-UK, www.noc.ac.uk, accessed on 7 August 2023) and the sea level station monitoring facility at UNESCO-IOC (Intergovernmental Oceanographic Commission, www.ioc.unesco.org, accessed on 7 August 2023). The highest astronomical tide (HAT) values for each study area considered are reported in Table 4.

2.2.6. Storm Surges

Storm surges (SSs), a rise in sea level induced by low air pressure and strong winds, are the primary cause of coastal flood disasters. Tropical cyclones are the most intense of these events, although extratropical storms can also cause high sea levels, especially when they coincide with high tide. In the Mediterranean Sea, cyclones with characteristics similar to tropical systems can form and are usually called TLCs (Tropical-Like Cyclones) or Medicanes (Mediterranean hurricanes). These low-pressure systems have a dynamic evolution comparable to that of tropical cyclones, although they are generally less extensive and of shorter duration. The Medicanes typically occur between September and January, with around one or two events per year when both cut-off lows and warm surface water combine. They bring strong winds and heavy rain, which can cause coastal flooding, and increasingly devastating effects, like in the cases of Gloria (January 2020) and Ianos (September 2020).
In this study, SSs (coastal temporary flooding) under ordinary (RT = 1 yr) and extreme conditions (RT = 100 yrs) combined with the projected RSLR (coastal permanent flooding) in 2030, 2050, and 2100 epochs have been modeled for each study area. The SS scenarios have been analyzed considering the expected RSLR contribution, which has been revised to account for the VLM (land subsidence or uplift), as estimated using geodetic analysis. Further, the contribution of the astronomical tides has been considered, while the meteorological tides (e.g., “acqua alta” in Venice) have been neglected. Such an approach has been assumed to be consistent with the possible noticeable scenarios due to the very low occurrence probability of cumulative effects of astronomical tides, meteorological tides, and storm surge events, both for RT = 1 yr and RT = 100 yrs.
It is important to outline the relevant differences that occurred for the storm surge scenario assessment implemented in the projects. SAVEMEDCOASTS-2 foresaw the application of the expeditive methodology for coastal flooding risk assessment adopted in the previous phase of the SAVEMEDCOASTS project. That is, the combination of sea level rise (SLR), land subsidence (LS), highest astronomical tide (HAT), and storm surge (SS) referred to different RTs, where the SS component was computed as a static uplift of the SL due to the maximum run-up occurring during the storm events. However, in SAVEMEDCOASTS-2, the sea-side morphology of the study areas (except for the Venice waterfront) was flat, and the expeditive storm surge flooding model adopted in SAVEMEDCOASTS was not applicable.
More specifically, the one-dimensional (1-D) XBeach routine of Delft3D open-source software has been used to model the space and time propagation of the storm wave, evaluate the maximum dynamic run-up, and simulate the overtopping of natural and artificial coastal protection whenever it occurs. XBeach is a complex numerical model designed to simulate the hydrodynamics and morpho-dynamics of the nearshore zone of beaches and coasts. It combines wave propagation, water level variations, sediment transport, and beach morphology changes in a single integrated and nested model. It is widely used for predicting beach erosion, wave run-up, coastal flooding, and other coastal hazards. The model is capable of simulating the effects of storms, tsunamis, SLR, and other coastal processes.
Hydrodynamic modeling for the assessment of storm surge propagation was implemented by analyzing a set of transects for each study site. Effective transect placement was adopted for 1-D simulation of the design storm surge. In detail, transects were chosen for relatively uniform areas of the coast in terms of bathymetry, topography, beach typology (e.g., sandy or rocky), land use and land cover, and the existence of natural or built coastal defensive systems. Transects were drawn from offshore to inland, potentially perpendicular to the coastline, to account for a more unfavorable angle of storm wave incidence. In particular, from two (Chalastra Plain) up to six (Venice Lagoon) transects were selected for each targeted area. The 1-D model for wave propagation was adopted to evaluate the maximum storm run-up or the maximum overwashing extension along each transect to be used in mapping the inundation area under selected storm conditions (ordinary or extreme) and HAT in 2021, as well as for the RCP2.6 and RCP8.5 scenarios concerning RSLR projections evaluated in 2030, 2050, and 2100 for each investigation site. As a result of the modeling, the most severe value between the maximum observed sea level or overtopping, if it occurs, was considered across all transects of each study area to estimate the potential furthest inland extent at risk of flooding due to the effects of a specific combination of a RSLR projection in a reference epoch, an ordinary or extreme sea storm event, and HAT.

2.2.7. Potential Coastal Flooding Scenarios

LiDAR data, IPCC AR5 projections of SLR for the RCP2.6 and RCP8.5 scenarios, and spatially variable VLM rates were used to assess the potential flooding scenarios up to 2100 for each investigated area. The results obtained are the multi-temporal flooding scenarios for 2021, 2030, 2050, and 2100 for the above-targeted areas for which the RSLR projections are based on the RCP2.6 and RCP8.5 IPCC climate change scenarios and the current rates of VLM as estimated by geodetic analysis. Similarly, the storm surge scenarios have been analyzed for the same reference epochs in ordinary or extreme conditions.
In more detail, the evaluation of the combined scenarios per study area included the following activities and steps:
  • Assessment of the wave climate and the probability distribution for the extreme condition evaluation referred to the ordinary (RT = 1 yr) and extreme SS (RT = 100 yrs);
  • Definition of the design storm wave by studying the propagation of the wave motion from the open sea towards the shore;
  • Definition of transects from offshore to the hinterland (possibly perpendicular to the coast) to consider in storm surge modeling;
  • Evaluation of the mean VLM rate derived from the geodetic analysis across a 200 m wide buffer of each transect, as well as calculation of updated RSLR values based on this mean VLM rate under different IPCC scenarios;
  • Setup of a 1-D model of storm surge for each transect and combination of SS condition (RT = 1 yr or 100 yrs), RSLR scenario (RCP2.6 or RCP8.5), plus the highest astronomical tide for 2021, 2030, 2050, and 2100;
  • Analysis of the model’s output in terms of Hs (significative offshore wave height), fp (peak frequency), z0 (sea level as a combination of RSLR, subsidence, and HAT), Rmax (maximum storm run-up), and overtop per each transect and for each combination of the above-mentioned parameters;
  • Mapping the potential Flooding Areas (FAs) grouped by each combination of RSLR scenario and storm surge condition (ordinary or extreme) for all the considered epochs (2021, 2030, 2050, and 2100). The analysis complies with the “bathtub” approach and the Maximum Water/Flood Elevation (MWE) defined according to the following criteria: (a) Maximum sea level observed among all the transects, whenever overtopping does not occur; (b) Maximum overtopping observed among all the transects, otherwise.
The method adopted to assess the spatial extent of the potential flooding areas is the standard passive “bathtub” approach with a zero-connectivity rule [68], in which areas that fall below a target water level and are not necessarily hydraulically connected to the sea are considered flooded. Furthermore, flooding scenarios do not take into account any adaptation or protection system (e.g., MoSE in the case of the Venice Lagoon).
Such an approach was deemed acceptable in light of the project objectives, despite the limitations [69,70] in terms of the concomitant phenomena to coastal flooding not considered in the scenario assessment [71], such as groundwater flooding, seawater intrusion, runoff due to intense rainfall, etc., and in terms of the computation time.
The main products of the previously described activities are the following:
  • the maps of potential land inundation scenarios for each study area, based on the RSLR projections estimated for 2030, 2050, and 2100;
  • the maps of potential flooding areas (see, for instance, Figure 4) grouped by each combination of RSLR scenario and storm surge condition for all the considered epochs (2021, 2030, 2050, and 2100).
Regarding the time horizons of RSLR projection and flooding scenarios, the proposed future epochs for 2030, 2050, and 2100 have a time distribution that is more suitable for stakeholders. In particular, policy-makers and urban or land planners need short, middle, and long-term reference scenarios (at the scale of the mean life duration of humans) to eventually prepare adaptation and risk plans in response to RSLR.

2.2.8. Preliminary Cascading Effects due to Flooding Scenarios

The preliminary assessment of cascading effects on territory, environment, and human systems concerning the SAVEMEDCOASTS-2 study areas is included in the webGIS to effectively address policymakers and urban or land planners in drafting climate change adaptation plans against SLR. The target areas of SAVEMEDCOASTS are excluded from this specific analysis and will be examined in the next webGIS updates.
The approach adopted to achieve this goal is a “flood-damage model”, overlapping the flooding scenarios (flooded areas) with human settlements and infrastructures (buildings, transportation networks, drainage channels, valuable crops, etc.), along with environmental ecosystems (land use/land cover, protected areas, etc.), to evaluate the measure to take in terms of percentage indicators of damage or integrity concerning the particular anthropic or environmental component taken into account.
Physical vulnerability/integrity assessment methodologies, generally developed as flood-damage models (stage–damage curves, multivariate models) and vulnerability/damage indicators, define the relationship between flood damage and corresponding damage-influencing variables [72,73]. Thus, damage indicator assessment provides relevant and basic knowledge for systemic and specific resilience assessment and mitigation planning [73], evaluating economic losses [74,75], and cost-benefit analysis, supporting resource allocation for hazard/risk protection [76,77]. Such efforts are generally considered important steps for disaster risk reduction and mitigation action [77]. Thus, in the present analysis, flood-damage models either show the relationship between damage induced by coastal inundation due to the combined effects of SLR, VLM, and storm surge (RT = 1 and 100 yrs) up to 2100 and water depth (referred to as stage–damage curves) or include other additional variables (referred to as multivariate models). Further, stage–damage curves use a continuous curve to relate water depth and damage stage [78,79], while multivariate models, generally based on empirical data, use different statistical approaches such as Bayesian network [80,81,82], regression, and ensembles of bagged decision trees [83] or logistic regression [84].
Different flood risk indicators, listed in Table 5, have been selected for each pilot area, based on their socio-economic or environmental significance in the territorial context being studied. The evaluation of the indicators was made by taking into account the extent of the flooded area, the human settlement and the ecosystems that may be affected, as well as the projected scenarios corresponding to the combined effects of SLR, VLM, and SS. We only analyzed the exposures’ current distribution because we lacked accurate information relevant in defining their future allocation in the considered epochs (2030, 2050, and 2100). As a result, the indicators were evaluated using the simplified assumption of invariance of the specific exposure considered in the epochs investigated. Because the research locations are often affected by anthropogenic pressure that varies even seasonally (e.g., seaside tourism), the population exposed to flood risk was not explicitly analyzed, except through proxies such as buildings or accommodation. With future insights into the methodology, it will be possible to define appropriate population projection scenarios as a result of dynamically changing boundary conditions, as well as potential planning alternatives or climate change adaptation interventions.

2.3. The webGIS Platform

The SAVEMEDCOASTS-2 web mapping application is a powerful tool for coastal planning and management through the analysis of flooding risk scenarios since it can effectively manage both spatial and temporal components within an integrated platform equipped with dedicated tools [85]. To achieve this goal, the design of the webGIS user interface considered two fundamental aspects [85,86]: (a) A user-friendly layout of the application, adherent to the conceptual model of the phenomenon analyzed. Adopting controls (e.g., sliders) makes it possible to interactively switch between or compare different risk scenarios, choosing among a plausible and realistic range of input parameters; (b) Balancing between the level of complexity of the model (and therefore of the user interface) and the speed of obtaining results to encourage the use of the tool in the analysis of the risk scenarios. Thus, overly complicated model setups for the average user and returning the results in real-time are avoided. In such a way, the webGIS maps and applications depicting SLR scenarios can be used by the scientific community, decision makers, and coastal planners. In addition, they can also serve as communication aids for raising awareness about coastal risks in schools and the general public [87].
The analysis of the functional and architectural requirements of the platform, following an in-depth analysis of the webGIS software solutions, has led to the adoption of a scalable, extensible, and open architecture able to be easily expanded and updated [88,89], represented by GeoNode.
GeoNode is an open-source web-based platform for creating and sharing geospatial data and maps, built on top of the Django web framework. It is designed to help organizations and communities easily create, share, and collaborate on geospatial data and maps, allowing them to build geospatial content management systems (GeoCMS) and spatial data infrastructure (SDI) nodes. GeoNode uses a variety of mature and robust open-source geospatial software such as PostGIS, GeoServer, and OpenLayers to provide powerful tools for managing and sharing geospatial data. It is an official project of the Open Source Geospatial Foundation (OSGeo) and is widely used by organizations in various sectors, including government, humanitarian aid, environmental management, and natural resource management. Its development was started by the Global Facility for Disaster Reduction and Recovery (GFDRR) in 2009 [90] and then adopted by several organizations, such as the World Bank and the United Nations. With GeoNode, users can search for, preview, and download data and maps, making it an essential tool for managing and sharing geospatial data thanks to its interoperability based on the Open Geospatial Consortium (OGC) standards. More extensive information about GeoNode can be found in [91].
The first experimental version of the SAVEMEDCOASTS-2 webGIS was launched during the SAVEMEDCOASTS project, and it has been publicly accessible online since October 2017 at http://webgis.savemedcoasts.eu/ (accessed on 7 August 2023). During the project implementation, already existing data and new acquisitions (e.g., ultra-high-resolution orthophotos and digital terrain models based on Unmanned Aerial Vehicle -UAV- surveys) have been collected for the Mediterranean region, two pilot sites in Italy (two sites at Cinque Terre and three sites at Lipari Island), and one in Greece (two sites in Lefkada Island).
The webGIS platform was used as a data catalog and for creating and sharing maps of case studies as a communication aid in the various local workshops held with stakeholders. Furthermore, several maps of coastal plains prone to marine flooding in the Mediterranean basin have been also uploaded in the webGIS Documents section. In detail, these maps were produced during the SAVEMEDCOASTS project implementation after careful identification and analysis of all Mediterranean low-lying coastal areas (elevation lower than 2 m above the mean sea level) and are organized by country, providing a useful overview of the most critical areas potentially subject to coastal flooding.
The webGIS of the SAVEMEDCOASTS-2 project is a technical review, update, and management of the former webGIS developed in the SAVEMEDCOASTS project. The platform has now increased its overall performance and effectiveness as a Decision Support System (DSS) for land planners, decision makers, and stakeholders through user-friendly mapping solutions. The main aim was to improve webGIS features to contribute to spreading project(s) results more effectively in terms of communication, raising the audience and interest among stakeholders (decision makers, land planners, the scientific community, etc.) and the general public.

3. Results

The most interesting functionalities designed and implemented in the SAVEMEDCOASTS-2 webGIS are specific web mapping applications (hereafter “apps” for brevity) on potential flooding scenarios and their cascading effects, which are accessible through the special menu “Apps”. More specifically, three apps have been designed and developed, as described in the following subsections.

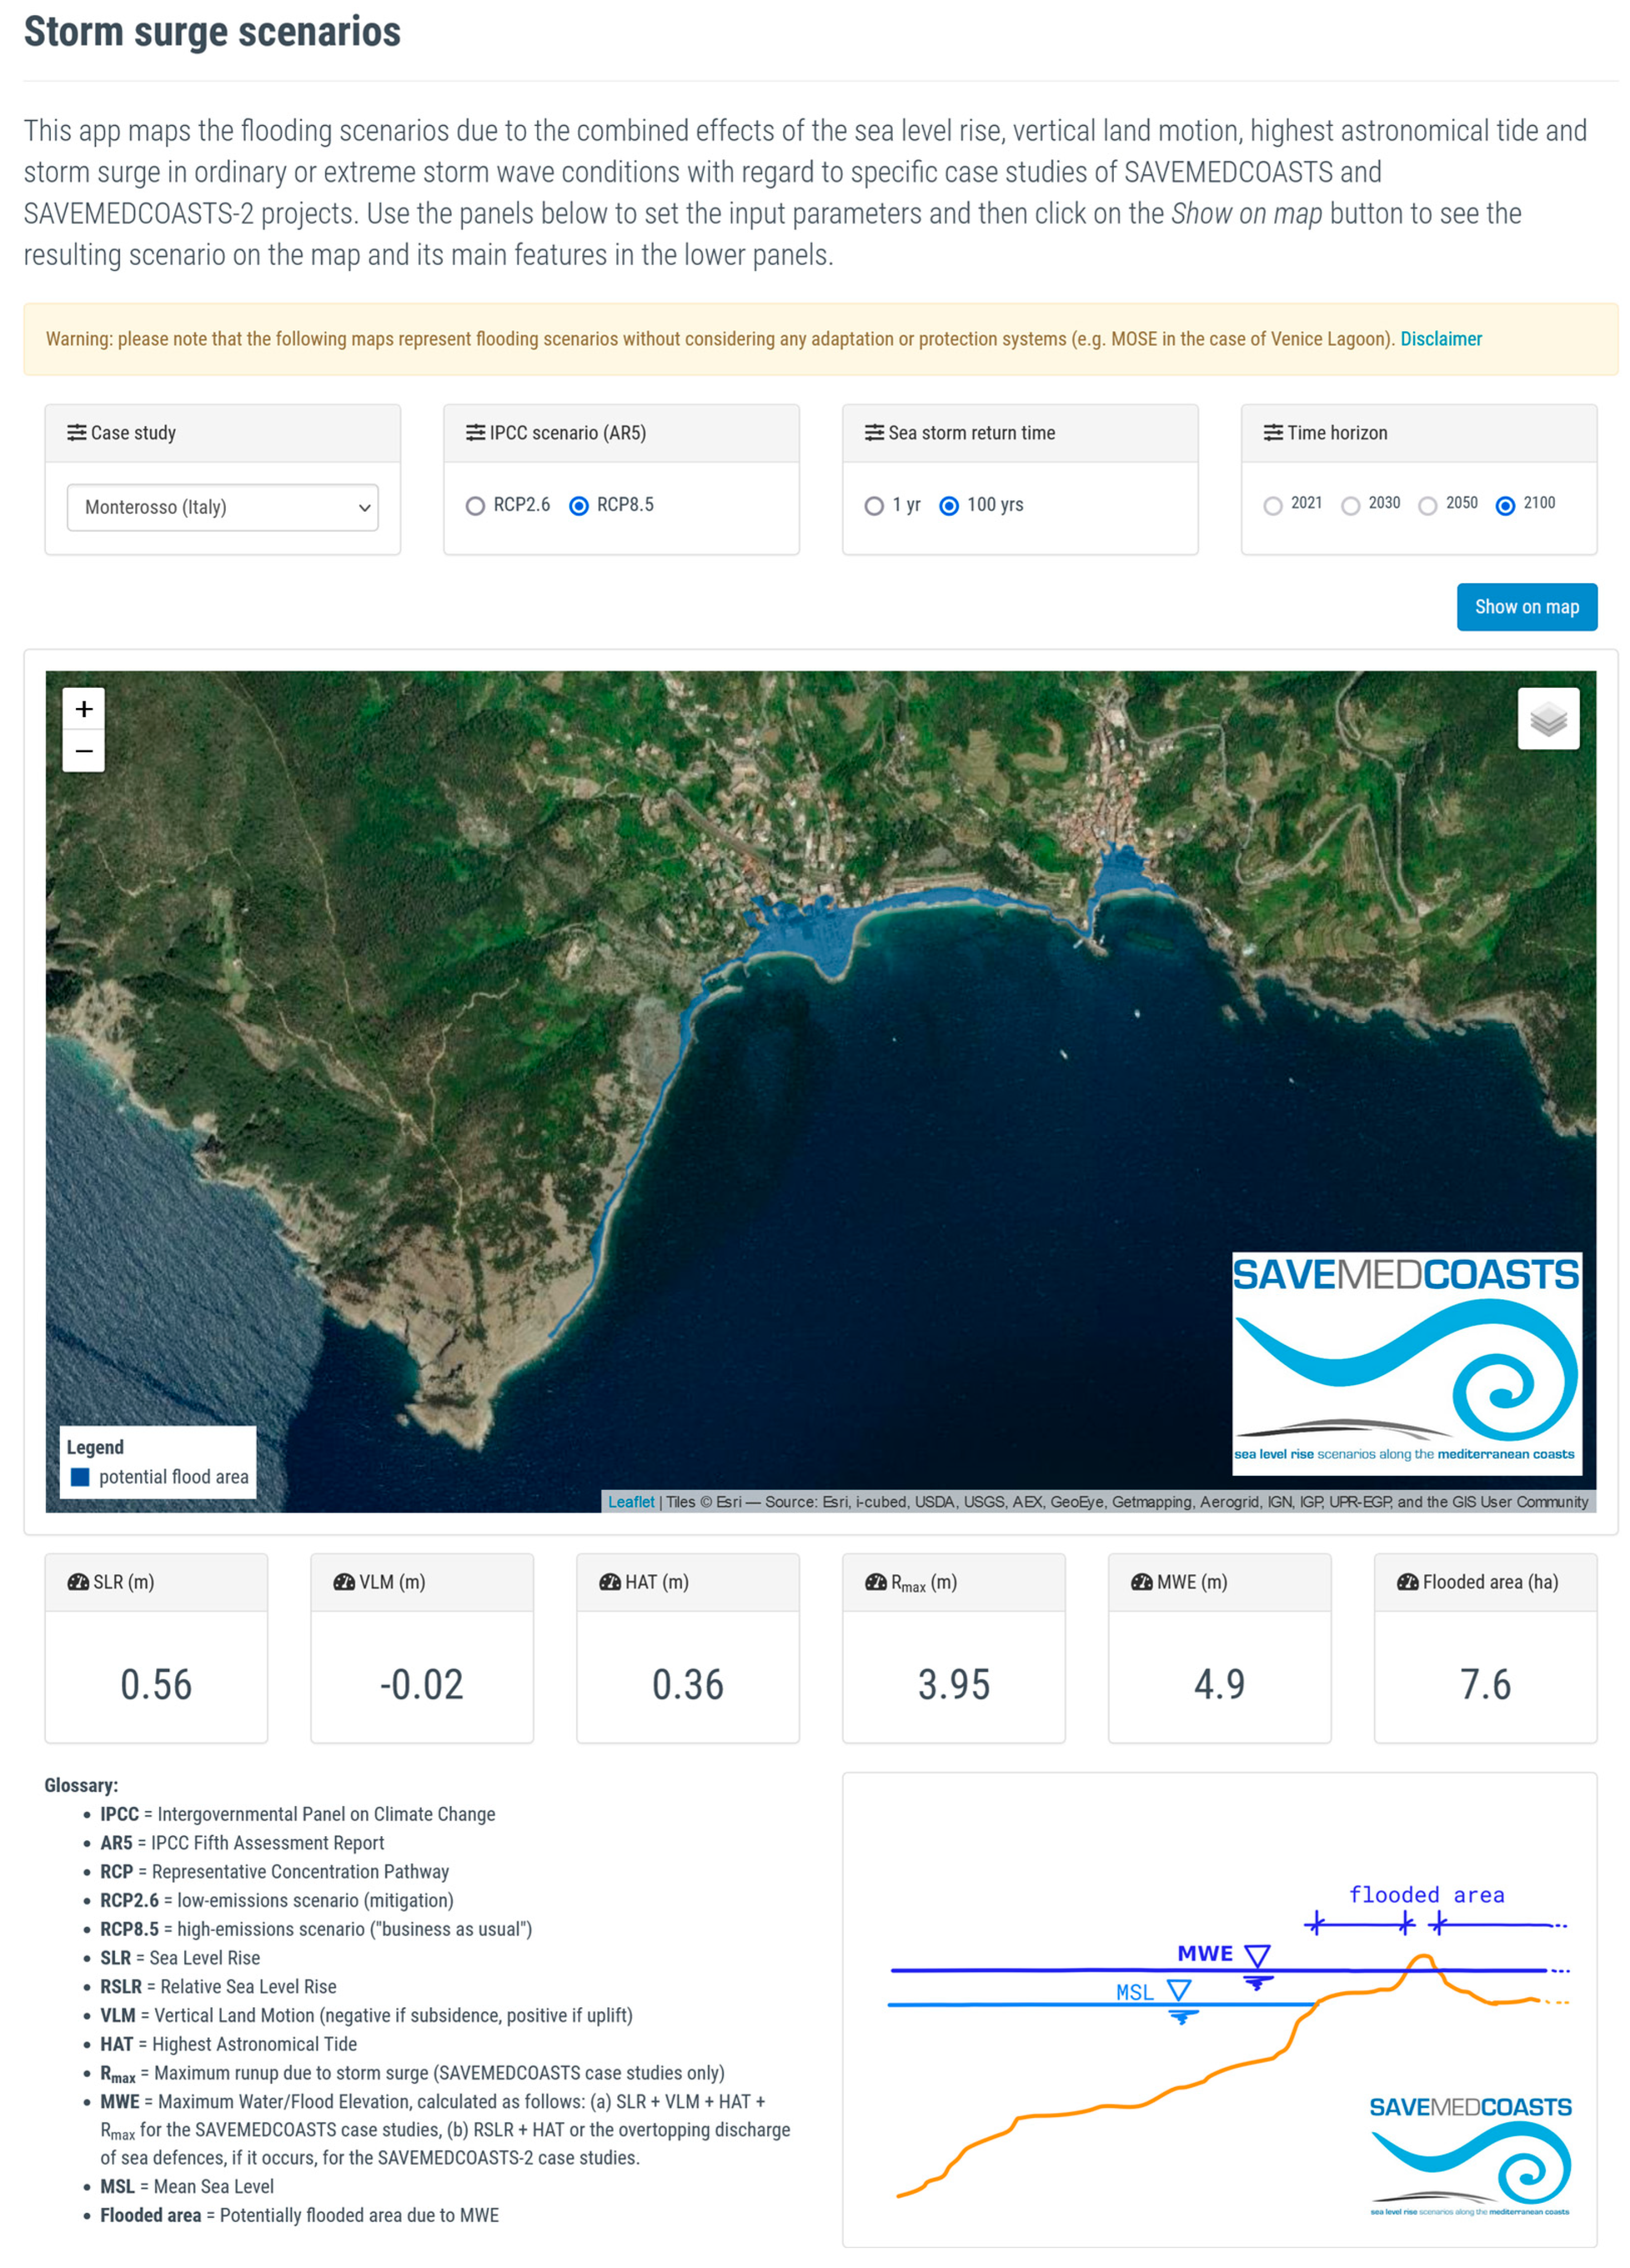
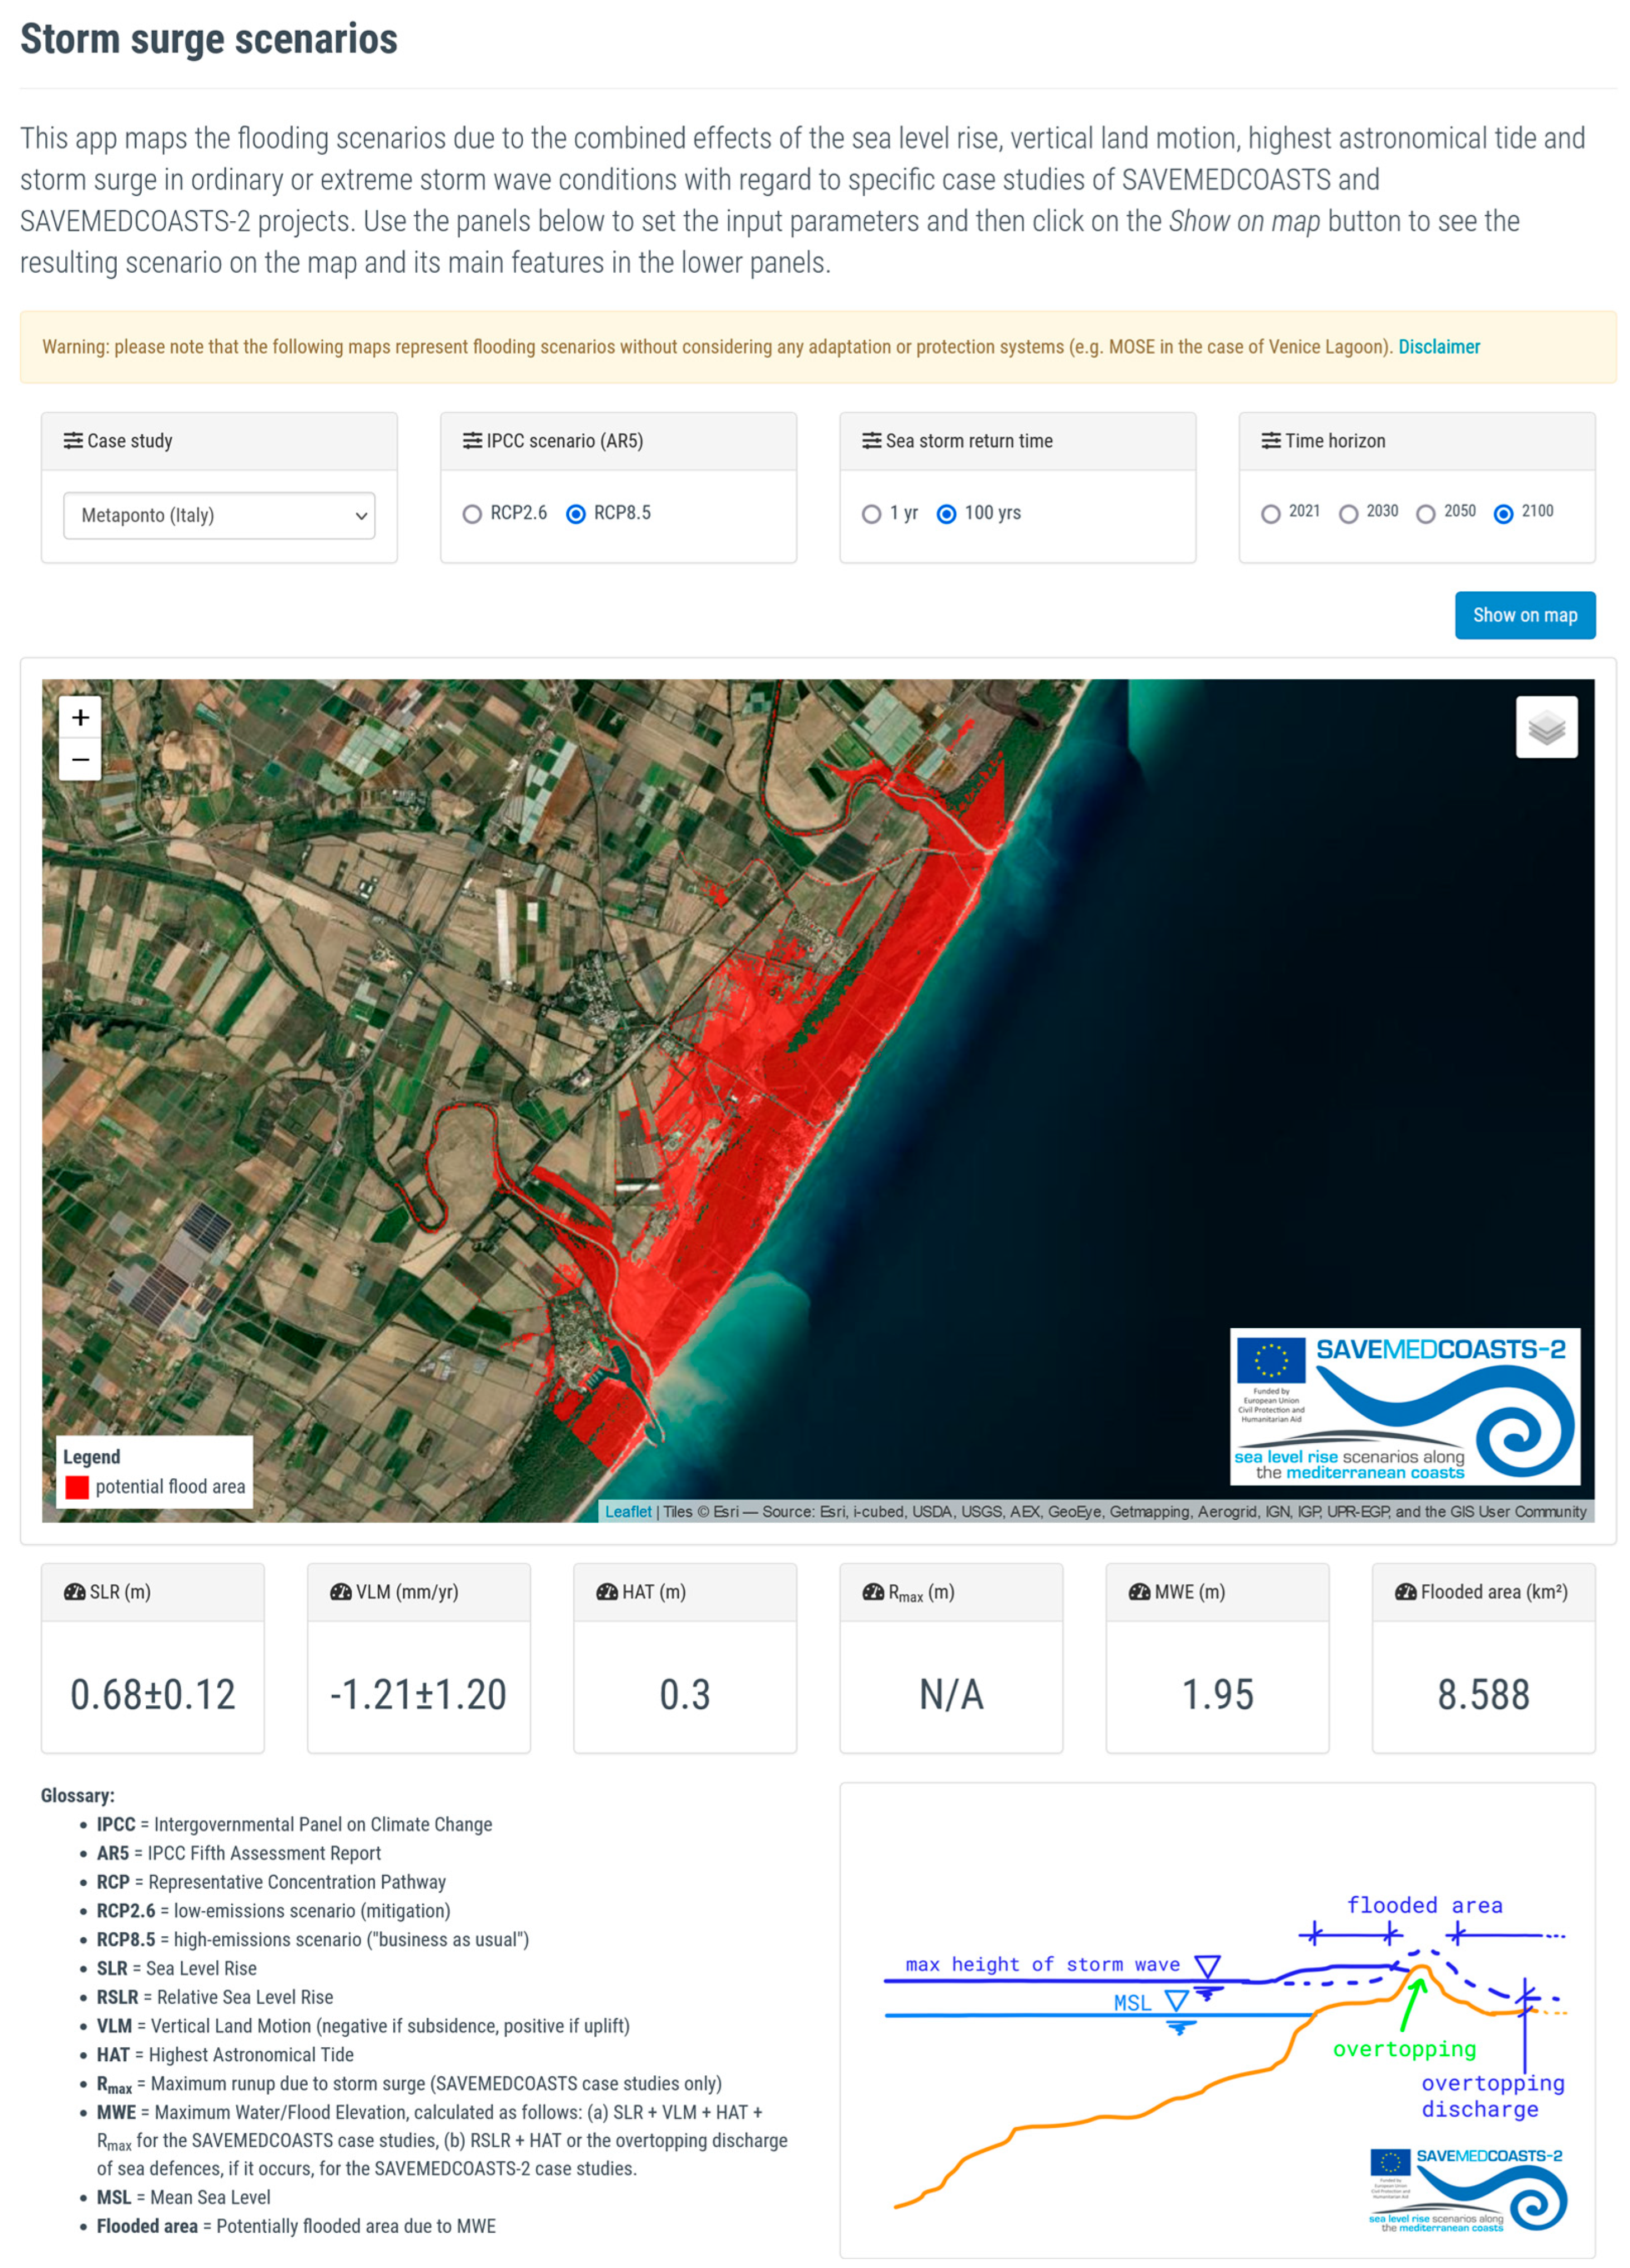
3.1. App 1: Storm Surge Scenarios

The app “Storm surge scenarios” arises from two basic needs: (i) To search and view flooding scenarios without having to untangle several different layers whose names or titles differ according to the abbreviations of the nomenclature adopted (e.g., rhone_delta_rt001_rcp85_2030); (ii) To associate the related numerical data with such scenarios. In detail, this app maps the flooding scenarios due to the combined effects of the SLR, VLM, highest astronomical tides, and storm surges in ordinary or extreme storm wave conditions concerning specific case studies of SAVEMEDCOASTS (Figure 5)—Acquacalda, Baia dei Portinenti, Canneto, Marina Corta, Marina Lunga, Monterosso, and Vernazza (Italy); and SAVEMEDCOASTS-2 projects (Figure 6)—Cavallino Treporti, Venice Lido, and Metaponto (Italy), Chalastra Plain (Greece), Ebro Delta (Spain), and Rhone Delta (France).
The app is straightforward and user-friendly. Firstly, the user needs to set the input parameters (case study, IPCC scenario, sea storm return time, and time horizon) using the panels created ad hoc and then click on the “Show on map” button. Then, a map containing the resulting scenario will appear together with its main numerically associated data (SLR, VLM, HAT, Rmax, MWE, and the potentially flooded area due to MWE) in lower panels. In addition, below the numerical results panels, a glossary of acronyms and terms used in the app will appear, together with a graphic scheme that illustrates how the MWE is evaluated. This scheme can differ depending on the selected case study and its project.
Regarding coastal planning, this app shows quickly the maps of potential (temporary) flooding scenarios for a storm surge corresponding to the particular input parameters selected. Therefore, the buffer zone to adopt in coastal land planning is quickly identified, thus avoiding the use of territory incompatible with the guidelines deriving from the project results.

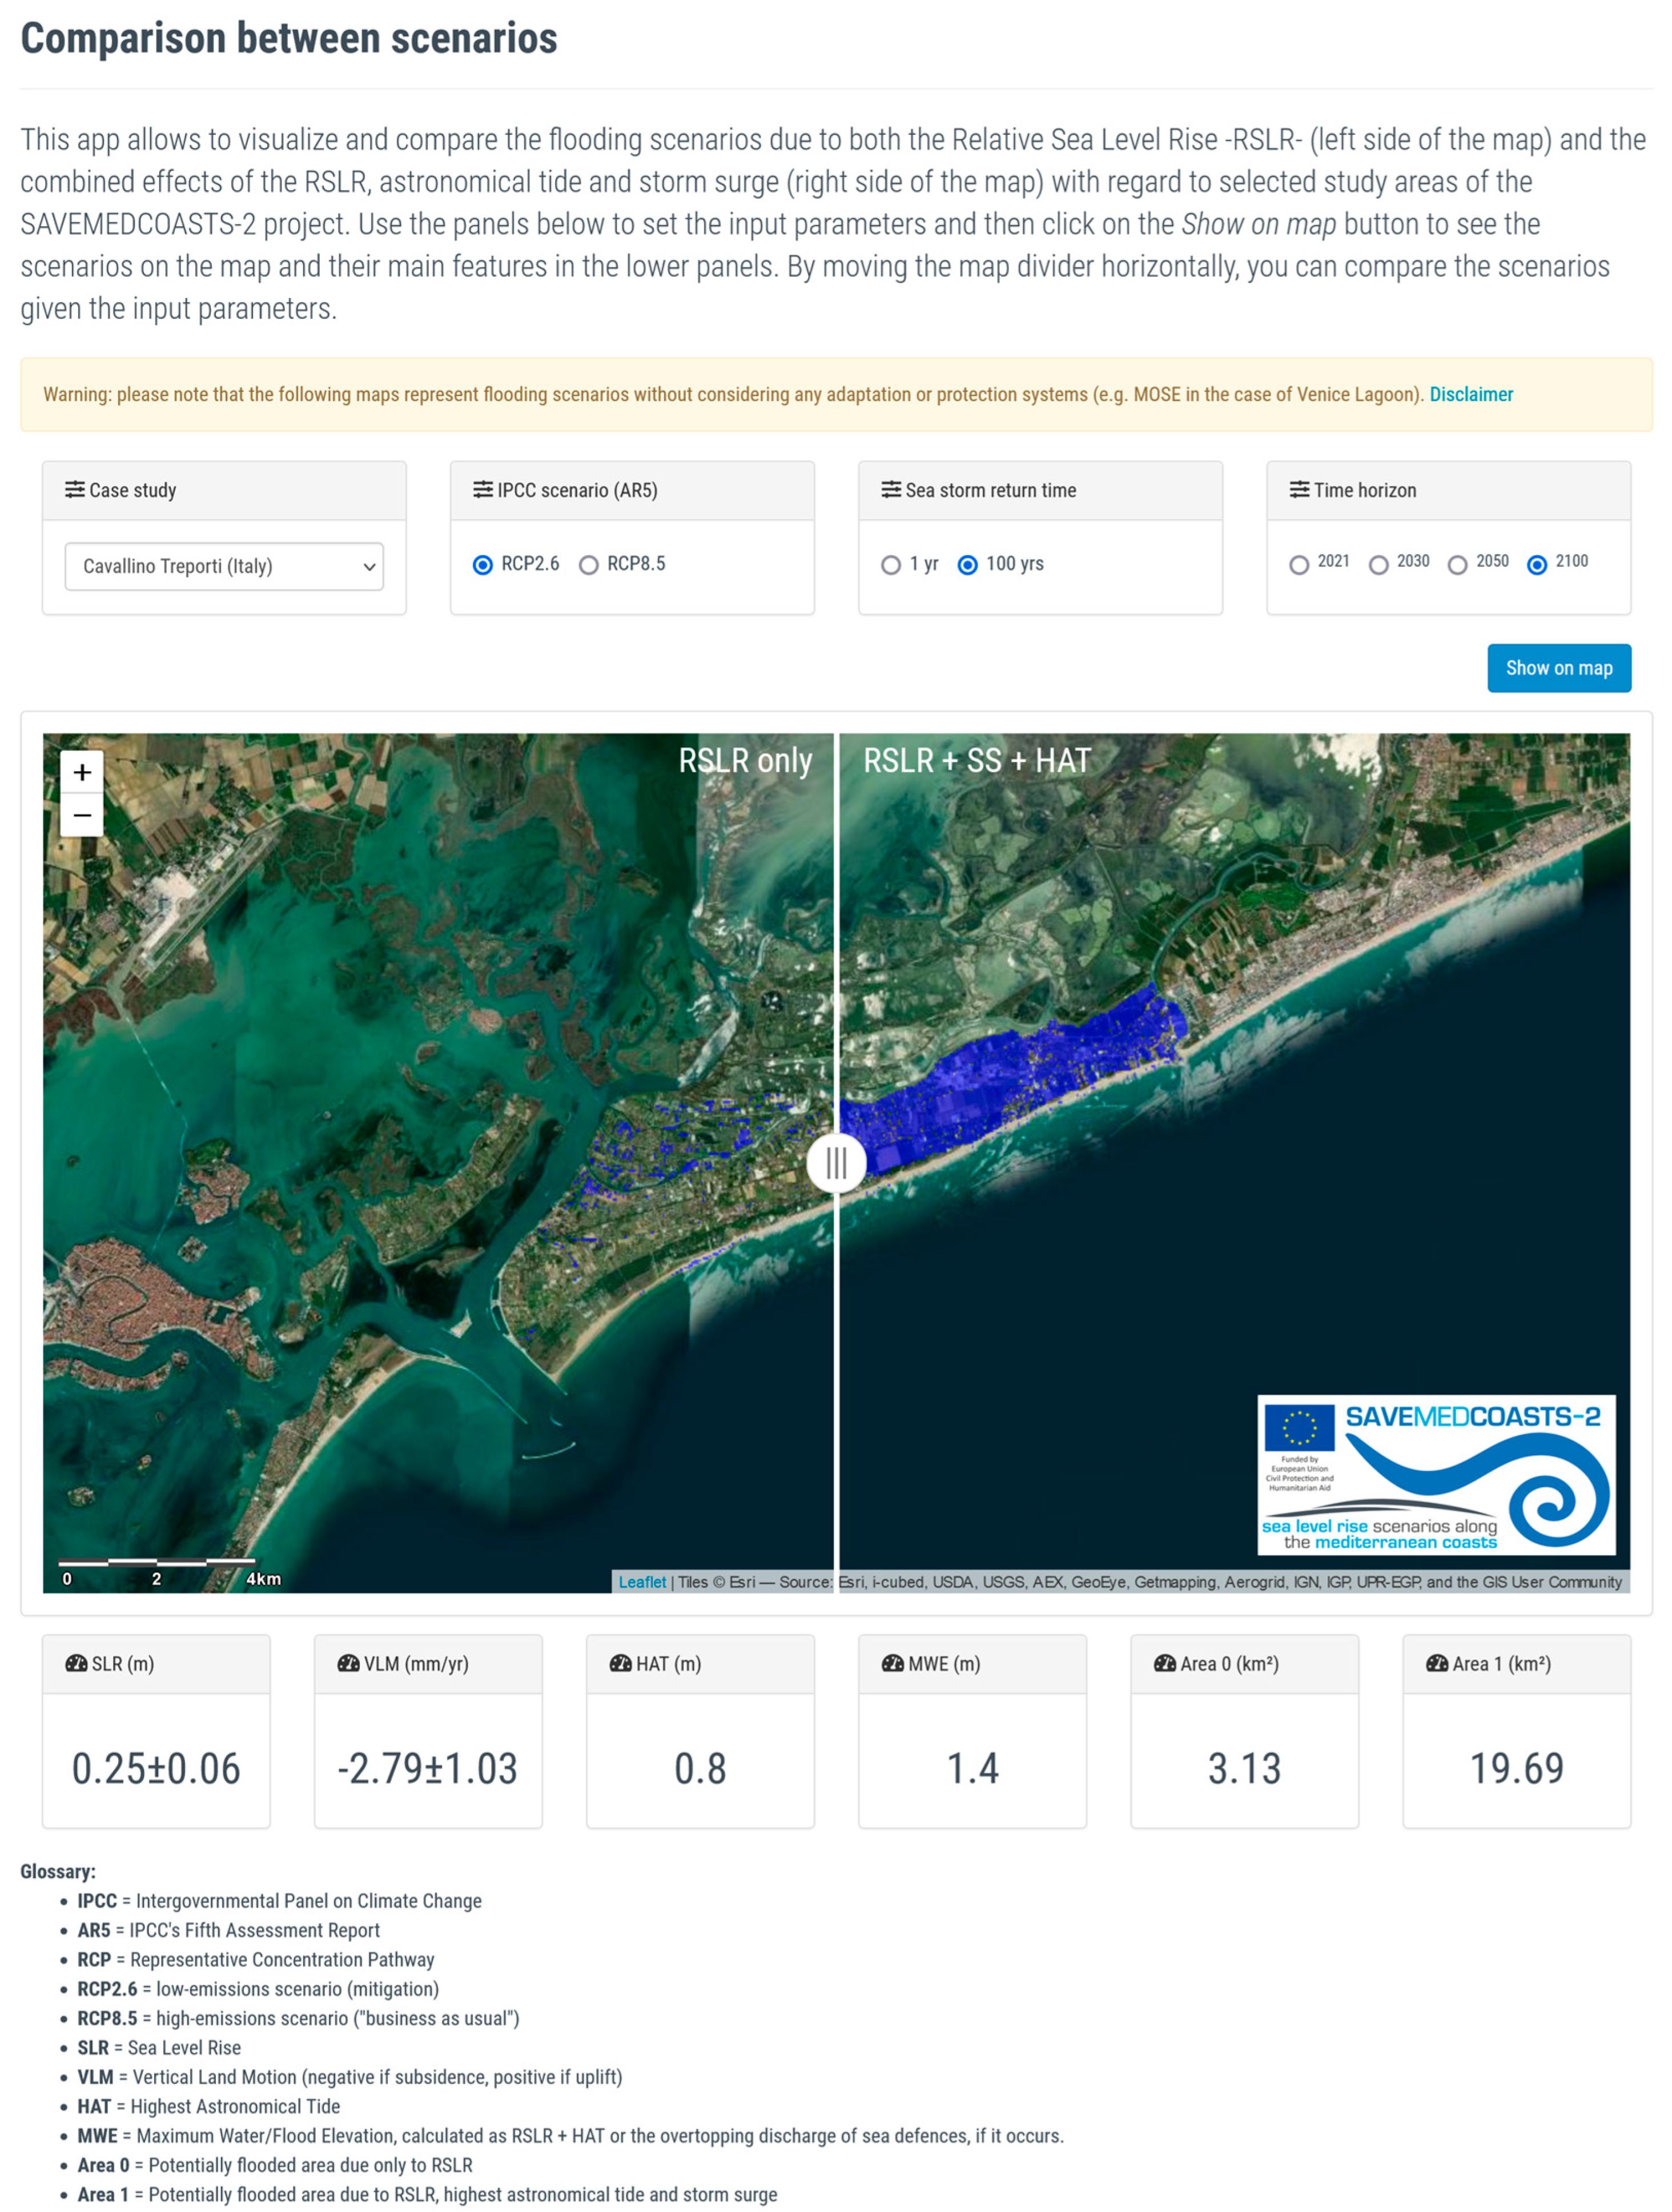
3.2. App 2: Comparison between Scenarios

The app “Comparison between scenarios” (Figure 7) allows users to visualize and compare the flooding scenarios due to the RSLR only (left side of the map) and the combined effects of the RSLR, highest astronomical tide, and storm surge (right side of the map) for selected study areas. The operating principles are the following: set the input parameters (case study, IPCC scenario, sea storm return time, and time horizon) using the available panels, and then click on the “Show on map” button to see the resulting scenarios on the maps. The RSLR flooding scenarios (permanent flooding) are shown on the left side, while the flooding scenarios due to the combination of RSLR, HAT, and SS conditions are shown on the right. The main numerically associated information is reported in the lower panels (SLR, VLM, HAT, MWE, Area 0, and Area 1, which are the potentially flooded areas in the case of permanent and temporary flooding conditions, respectively). Moving the map slider horizontally allows the user to compare the scenarios based on the input parameters. More specifically, “Comparison between scenarios” allows evaluating how the potential impact in terms of spatial extension due to the concomitant action of astronomical tides and storm surges, furthering the permanent flooding component, could be potentially wider than that due only to RSLR.
Concerning coastal spatial planning, given an IPCC climate scenario and a probabilistic storm surge condition and a time horizon, this app allows evaluating “on the fly” the minimum (permanent) and the maximum (temporary) spatial extension of the expected potential coastal flooding, and, in turn, the “buffer zones” to be possibly incorporated in coastal adaptation plans.

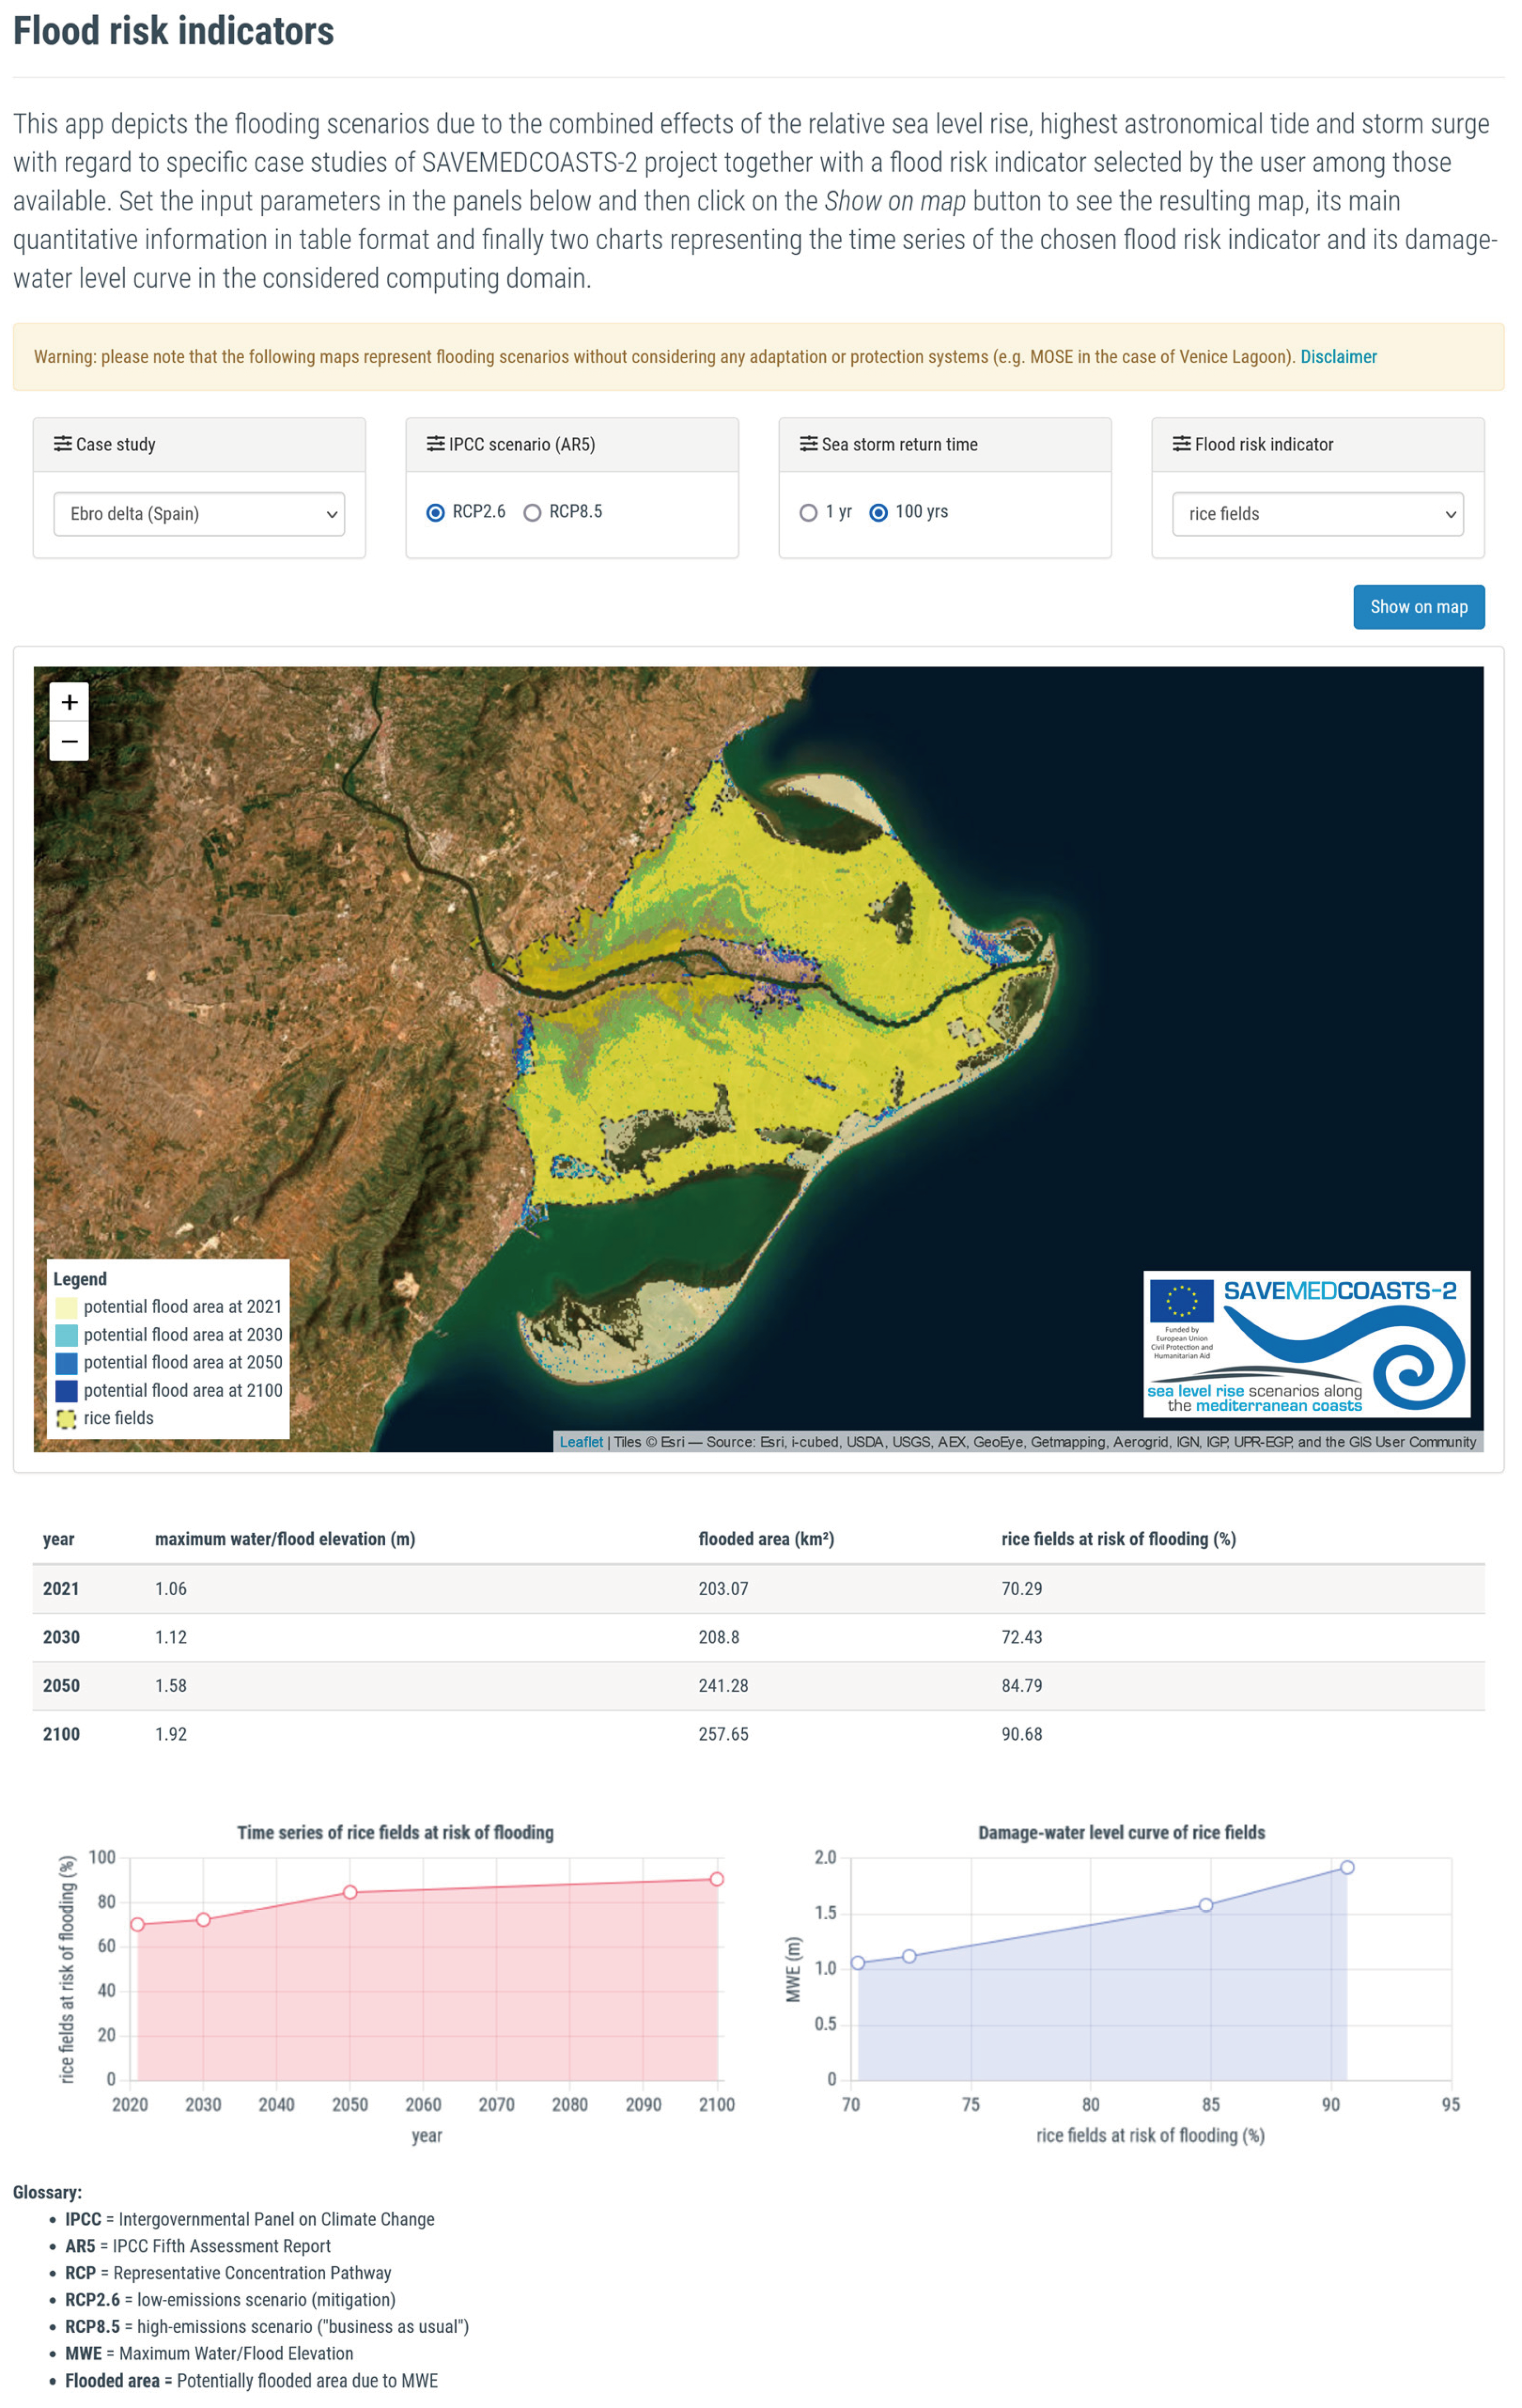
3.3. App 3: Flood Risk Indicators

The “Flood risk indicators” app (Figure 8) shows the potential flooding scenarios due to the combined effects of RSLR, the highest astronomical tides, and storm surges concerning the investigated areas, together with a flood risk indicator (Table 5) selected by the user among those available (accommodation, buildings, drainage network, irrigated areas, protected areas, rice fields, and road network). The risk indicator availability depends on layer one, so it changes from site to site. The user can choose the desired parameters in the input panels and then click on the “Show on map” button to see the resulting map, its main quantitative information in a table format, and finally, two charts representing the time series of the chosen flood risk indicator and its damage–water level curve in the considered computing domain. The summary of the flood risk indicators calculated for each potential coastal flooding scenario and case study considered are reported in Table 6. The percentage value of each flood risk indicator refers to the total extension of the domain considered in the case study.
The usefulness of such an app is very high in coastal planning because it allows the decision maker (e.g., land planner) to discover which flood risk indicator, and thus which ecosystem component (e.g., protected areas or road network), is more potentially vulnerable to coastal flooding in case of storm surge events, and plan the adaptation or mitigation measures accordingly.

4. Discussion

The main information derived from the above-mentioned methodology and the use of the apps built in the SAVEMEDCOASTS-2 webGIS is discussed in the subsections that follow, one for each study area.

4.1. The Ebro Delta (Spain)

The storm surge modeling results can be analyzed using the app “Flooding scenarios”. It shows the overtopping of levees may already occur at the baseline epoch (2021) in the case of storm surge in extreme conditions (RT = 100 yrs), as indeed has been demonstrated by the Gloria storm event in 2020. The potential wave overtopping of sea defenses needs further strengthening interventions, especially in the stretches of the coast most vulnerable to erosion dynamics and coastal flooding or where the value of the exposed assets requires greater protection.
Furthermore, analyzing the time series and damage–water level curves derived for the selected damage indicators for both cases of ordinary and extreme storm surges, using the app “Flood risk indicators” or through the data reported in Table 6, shows that the exposure and the consequent amount of damage are already close to 60% for both protected areas and rice fields (Figure 8) in 2021. Then, in the following years, it will be higher than 60%, while the values for the road network are close to 40% in the worst-case scenario in 2050. Then, the protected areas and rice fields are the most vulnerable assets of the delta, followed by the road network.
In conclusion, the Ebro Delta is highly vulnerable to extreme weather events and needs increased efforts to manage and protect this important ecosystem by adopting more robust climate change mitigation and adaptation measures.

4.2. The Rhone Delta (France)

The analysis of the damage indicators considered for the Rhone Delta (Table 6) shows the percentage values will increase in the next few years. A slight rise in the sea level in this low-lying zone corresponds to a gradual flooding of the most depressed lands and, consequently, to the increase in the indicator’s percentage in the absence or breakage of longitudinal defense works. The overtopping of levees may occur in 2050 for RCP8.5. However, in cases of storm surges and breakage of the levees, the indicator’s percentages in 2021 could be important, and about half of the protected areas, and about 20% of rice fields, could be impacted.

4.3. Venice Lido and Cavallino Treporti (Italy)

Flooding scenarios in this zone are mostly caused by the combination of RSLR and tide components. The inundated areas correspond to the water set-up observed in the lagoon and propagating from it to the coast (see, for instance, Figure 7). It is important to remark that the influence of the MoSE system has not been considered in the present approach for the flooding scenario definition, and thus the storm surge propagation has been proposed considering the straightforward connection between the lagoon and the offshore open seaside. This allows us to consider such an asset as a safe condition for the Venice waterfront, even with the limitations induced by the present analysis. In any case, observing the time series and damage–water level curves derived for the selected damage indicators (Table 6), the exposure and consequent amount of damage is higher than 50% for almost all indicators in 2050, and the distribution among indicators is almost uniform for the epochs 2021 and 2100 for both cases of ordinary and extreme storm surge.

4.4. Metaponto (Italy)

The time series of damage curves referring to accommodation, buildings, and protected areas for 2050 corresponds to a critical epoch from which the damage percentage sharply increases in time, with a steep gradient reaching values over 30–40%. Instead, for the irrigation areas and road network, the damage percentage results in less than 20%, even for extreme scenarios. On the other hand, the drainage network assumes a critical damage value (>25%) even for the simple scenarios of RSLR, for both cases RCP2.6 and RCP8.5, becoming severe for the further epochs. These criticalities are also well represented in terms of damage–water level curves, from which it is can immediately be observed that, already for a storm surge in ordinary conditions (RT = 1 yr), the scenario for RCP8.5 induces a relevant percentage of damage above and close to 40% for two-thirds of the damage indicators. Based on the storm surge modeling, such a result assumes further relevance considering that diffused dune overtopping occurs only in the worst climate scenario (Figure 6). That is, in this case except for the irrigation area, all the indicators assume a high damage percentage with a peak close to 80% (accommodation and protected areas).
Finally, for the Metaponto Plain pilot area, the severity of the storm surge events increases the damage percentage, but it does not sensitively alter the weight allocation among the indicators, both in cases of an ordinary and extreme event.

4.5. The Chalastra Plain (Greece)

The time series and damage–water level curves derived for the selected damage indicators show that the exposure and the consequent amount of damage is already close to 40% for both protected areas and rice fields indicators in 2021, while the values are close to 20% for the road network. All the indicators’ values present a rather stable trend that tends to increase only in the worst-case scenario (RCP8.5 + 100 yrs SS).
The distribution among the indicators depicts the protected areas and rice fields prevalent over the road network in all the epochs considered. However, the road network indicator also increases in 2100, both in cases of ordinary and extreme storm surges.

5. Conclusions

The webGIS of the SAVEMEDCOASTS and SAVEMEDCOASTS-2 projects allows us to show and manage detailed maps on the expected potential extension of the coastal flooding scenarios up to 2100 as a consequence of RSLR for the target sites of the projects. Flooding scenarios represented for the RCP2.6 and RCP8.5 climatic scenarios, and further combined with storm surge events in ordinary (RT = 1 yr) or extreme (RT = 100 yrs) conditions, are based on the AR5 SROCC Report [2]. Compared to previous flood maps, the ones we show are more realistic by including high-resolution topography and the contribution of subsidence analyzed by geodetic data to the total expected value of SLR. A preliminary assessment of cascading effects on the SAVEMEDCOASTS-2 pilot areas due to the combining effects of RSLR for ordinary and extreme storm surge events provides a quantitative evaluation of the considered effects along the coastal zone, the environment, and human settlements through a “flood-damage model” approach. The webGIS apps and maps show the relevance of each damage indicator versus the total impact for the considered flooding scenario. The quality of the presented results depends on the invariance assumptions of VLM rates or exposures in future epochs, the accuracy of the adopted DTMs, and the method adopted to assess the spatial extent of the potential flooding areas. Despite the current limitations, our webGIS may support policymakers and land planners in the drafting of climate change adaptation plans to deal with the SLR issue, which is exacerbated by VLM, and changes in storm surge activity.
The hazard implications for the population living along the shore should push land planners and decision makers to take into account scenarios similar to those reported in this study for responsible coastal management. RSLR scenarios for the coming decades are crucial for understanding the associated risks so that the population and decision makers can be prepared to face these changes through the SAVEMEDCOASTS-2 webGIS, which is an important tool for citizens and stakeholders.

Author Contributions

Conceptualization, A.F.; methodology, A.F., M.A. and M.G.; software, A.F., A.V., C.G., P.P., M.C., C.T., G.M. (Giovanni Martino), G.M. (Giuseppe Mancino), F.A., C.B. and F.D.; validation, A.F., M.A. and M.G.; formal analysis, A.F., M.A., A.V., M.C., J.N., C.T., G.M. (Giovanni Martino) and F.A.; investigation, A.F., M.A. and M.G.; resources, A.F., M.A. and M.G.; data curation, A.F., M.A., A.V., C.G., E.S., G.M. (Giovanni Martino) and F.A.; writing—original draft preparation, A.F.; writing—review and editing, A.F., M.A. and M.G.; supervision, M.A. and M.G.; project administration, M.A. and M.L.T.; funding acquisition, M.A. All authors have read and agreed to the published version of the manuscript.

Funding

This research was funded by SAVEMEDCOASTS (Agreement number ECHO/SUB/2016/742473/PREV16) and SAVEMEDCOASTS-2 (Project number 874398) EU Projects.

Institutional Review Board Statement

Not applicable.

Informed Consent Statement

Not applicable.

Data Availability Statement

Copernicus Sentinel-1 IW SLC data for PSI analysis were provided via the Copernicus Open Access Hub and processed by CTTC. Copernicus Sentinel-1 IW SAR data for SBAS analysis were provided via, and processed in, ESA’s Geohazards Thematic Exploitation Platform (Geohazards TEP, or GEP), in the framework of the GEP Early Adopters Program and the Geohazards Lab initiative, the latter developed under the CEOS Working Group on Disasters. SAR data processing was carried out using the P-SBAS on-demand service developed and integrated by CNR-IREA in GEP. LiDAR data were provided by Liguria Region, INGV, AUTh, IGN (Spain), Shom, MASE (Italy), MIT (Italy), and ESA. GNSS data are retrieved, processed, and archived by the INGV Geodetic Analysis Data Center. The analysis was performed by the GAMIT/GLOBK software at INGV-Bologna. Tidal data have been obtained from the PSMSL at NOC-UK and the sea level station monitoring facility at UNESCO-IOC.

Acknowledgments

The authors would like to thank Xenia Loizidou, Demetra Orthodoxou, Demetra Petsa, and Michael Loizides (ISOTECH, Cyprus); Silvia Torresan, Elisa Furlan, and Arthur Essenfelder (Centro Euro-Mediterraneo sui Cambiamenti Climatici, Italy); Claudia Ferrari, Chiara Tenderini, and Isabella Marangoni (City of Venice, Italy); Marco Favaro and Alvise Papa (Centro Maree del Comune di Venezia, Italy); Athanasios Petousis (PED-IN, Greece); Luca Natale (Parco Nazionale delle Cinque Terre, Italy); Alessandro Bosman (IGAG-CNR, Italy); Raffaele Giampietro, Pierpaolo Gruosso, and Enrico Santangelo (FARBAS, Italy); and Giovanna Forlenza, Gemma Musacchio, Maddalena De Lucia, Elena Eva, and Stefano Solarino (INGV, Italy) for their valuable contribution in the project’s activities. We acknowledge the Ministero delle Infrastrutture e dei Trasporti—“Provveditorato Interregionale per le Opere Pubbliche del Veneto già Magistrato alle Acque del Veneto—Trentino Alto Adige—Friuli Venezia Giulia” già Magistrato alle Acque di Venezia and the City of Venice for providing LiDAR data. The authors would also like to thank the reviewers for all useful and helpful comments on the manuscript.

Conflicts of Interest

The authors declare no conflict of interest.

References

  1. IPCC. Climate Change 2021: The Physical Science Basis. Contribution of Working Group I to the Sixth Assessment Report of the Intergovernmental Panel on Climate Change; Masson-Delmotte, V., Zhai, P., Pirani, A., Connors, S.L., Péan, C., Berger, S., Caud, N., Chen, Y., Goldfarb, L., Gomis, M.I., et al., Eds.; Cambridge University Press: Cambridge, UK; New York, NY, USA, 2021. [Google Scholar]
  2. Oppenheimer, M.; Glavovic, B.C.; Hinkel, J.; van de Wal, R.; Magnan, A.K.; Abd-EIgawad, A.; Cai, R.; Cifuentes-Jara, M.; DeConto, R.M.; Ghosh, T.; et al. Sea Level Rise and Implications for Low-Lying Islands, Coasts and Communities. In IPCC Special Report on the Ocean and Cryosphere in a Changing Climate; Pörtner, H.-O., Roberts, D.C., Masson-Delmotte, V., Zhai, P., Tignor, M., Poloczanska, E., Mintenbeck, K., Alegría, A., Nicolai, M., Okem, A., et al., Eds.; Cambridge University Press: Cambridge, UK; New York, NY, USA, 2019; pp. 321–445. [Google Scholar] [CrossRef]
  3. Cid, A.; Menéndez, M.; Castanedo, S.; Abascal, A.J.; Méndez, F.J.; Medina, R. Long-Term Changes in the Frequency, Intensity and Duration of Extreme Storm Surge Events in Southern Europe. Clim. Dyn. 2016, 46, 1503–1516. [Google Scholar] [CrossRef]
  4. Church, J.; Clark, P.; Cazenave, A.; Gregory, J.; Jevrejeva, S.; Levermann, A.; Merrifield, M.; Milne, G.; Nerem, R.; Nunn, P.; et al. “Chapter 13: Sea Level Change” in Climate Change 2013: The Physical Science Basis: Contribution of Working Group I to the Fifth Assessment Report of the Intergovernmental Panel on Climate Change; Intergovernmental Panel on Climate Change: Geneva, Switzerland, 2013. [Google Scholar]
  5. Vitousek, S.; Barnard, P.L.; Fletcher, C.H.; Frazer, N.; Erikson, L.; Storlazzi, C.D. Doubling of Coastal Flooding Frequency within Decades Due to Sea-Level Rise. Sci. Rep. 2017, 7, 1399. [Google Scholar] [CrossRef] [PubMed]
  6. Diodato, N.; Bellocchi, G. Storminess and Environmental Changes in the Mediterranean Central Area. Earth Interact. 2010, 14, 1–16. [Google Scholar] [CrossRef]
  7. Sainsbury, N.C.; Genner, M.J.; Saville, G.R.; Pinnegar, J.K.; O’Neill, C.K.; Simpson, S.D.; Turner, R.A. Changing Storminess and Global Capture Fisheries. Nat. Clim. Chang. 2018, 8, 655–659. [Google Scholar] [CrossRef]
  8. Pirazzoli, P.A.; Regnauld, H.; Lemasson, L. Changes in Storminess and Surges in Western France during the Last Century. Mar. Geol. 2004, 210, 307–323. [Google Scholar] [CrossRef]
  9. Wood, M.; Haigh, I.D.; Le, Q.Q.; Nguyen, H.N.; Tran, H.B.; Darby, S.E.; Marsh, R.; Skliris, N.; Hirschi, J.J.-M.; Nicholls, R.J.; et al. Climate-Induced Storminess Forces Major Increases in Future Storm Surge Hazard in the South China Sea Region. Nat. Hazards Earth Syst. Sci. 2023, 23, 2475–2504. [Google Scholar] [CrossRef]
  10. Calafat, F.M.; Wahl, T.; Tadesse, M.G.; Sparrow, S.N. Trends in Europe Storm Surge Extremes Match the Rate of Sea-Level Rise. Nature 2022, 603, 841–845. [Google Scholar] [CrossRef]
  11. Islam, M.R.; Duc, L.; Sawada, Y.; Satoh, M. Does Mean Sea Level Trend Mask Historical Storm Surge Trend: Evidence from Tropical Cyclones Affecting Japan since 1980. Environ. Res. Lett. 2023, 18, 085004. [Google Scholar] [CrossRef]
  12. Cavicchia, L.; von Storch, H.; Gualdi, S. Mediterranean Tropical-Like Cyclones in Present and Future Climate. J. Clim. 2014, 27, 7493–7501. [Google Scholar] [CrossRef]
  13. Toomey, T.; Amores, A.; Marcos, M.; Orfila, A. Coastal Sea Levels and Wind-Waves in the Mediterranean Sea since 1950 from a High-Resolution Ocean Reanalysis. Front. Mar. Sci. 2022, 9, 991504. [Google Scholar] [CrossRef]
  14. Marcos, M.; Tsimplis, M.N.; Shaw, A.G.P. Sea Level Extremes in Southern Europe. J. Geophys. Res. 2009, 114, C01007. [Google Scholar] [CrossRef]
  15. Miglietta, M.M. Mediterranean Tropical-Like Cyclones (Medicanes). Atmosphere 2019, 10, 206. [Google Scholar] [CrossRef]
  16. Diakakis, M.; Mavroulis, S.; Filis, C.; Lozios, S.; Vassilakis, E.; Naoum, G.; Soukis, K.; Konsolaki, A.; Kotsi, E.; Theodorakatou, D.; et al. Impacts of Medicanes on Geomorphology and Infrastructure in the Eastern Mediterranean, the Case of Medicane Ianos and the Ionian Islands in Western Greece. Water 2023, 15, 1026. [Google Scholar] [CrossRef]
  17. Androulidakis, Y.S.; Kombiadou, K.D.; Makris, C.V.; Baltikas, V.N.; Krestenitis, Y.N. Storm Surges in the Mediterranean Sea: Variability and Trends under Future Climatic Conditions. Dyn. Atmos. Ocean. 2015, 71, 56–82. [Google Scholar] [CrossRef]
  18. Androulidakis, Y.; Makris, C.; Mallios, Z.; Pytharoulis, I.; Baltikas, V.; Krestenitis, Y. Storm Surges and Coastal Inundation during Extreme Events in the Mediterranean Sea: The IANOS Medicane. Nat. Hazards 2023, 117, 939–978. [Google Scholar] [CrossRef]
  19. Conte, D.; Lionello, P. Storm Surge Distribution Along the Mediterranean Coast: Characteristics and Evolution. Procedia Soc. Behav. Sci. 2014, 120, 110–115. [Google Scholar] [CrossRef]
  20. Widlansky, M.J.; Long, X.; Schloesser, F. Increase in Sea Level Variability with Ocean Warming Associated with the Nonlinear Thermal Expansion of Seawater. Commun. Earth Environ. 2020, 1, 9. [Google Scholar] [CrossRef]
  21. MedECC. Climate and Environmental Change in the Mediterranean Basin—Current Situation and Risks for the Future. In First Mediterranean Assessment Report; Cramer, W., Guiot, J., Marini, K., Eds.; Union for the Mediterranean, Plan Bleu and UNEP/MAP: Marseille, France, 2020; ISBN 978-2-9577416-0-1. [Google Scholar] [CrossRef]
  22. Nicholls, R.J.; Lincke, D.; Hinkel, J.; Brown, S.; Vafeidis, A.T.; Meyssignac, B.; Hanson, S.E.; Merkens, J.-L.; Fang, J. A Global Analysis of Subsidence, Relative Sea-Level Change and Coastal Flood Exposure. Nat. Clim. Change 2021, 11, 338–342. [Google Scholar] [CrossRef]
  23. Anzidei, M.; Scicchitano, G.; Scardino, G.; Bignami, C.; Tolomei, C.; Vecchio, A.; Serpelloni, E.; De Santis, V.; Monaco, C.; Milella, M.; et al. Relative Sea-Level Rise Scenario for 2100 along the Coast of South Eastern Sicily (Italy) by InSAR Data, Satellite Images and High-Resolution Topography. Remote Sens. 2021, 13, 1108. [Google Scholar] [CrossRef]
  24. Scardino, G.; Anzidei, M.; Petio, P.; Serpelloni, E.; De Santis, V.; Rizzo, A.; Liso, S.I.; Zingaro, M.; Capolongo, D.; Vecchio, A.; et al. The Impact of Future Sea-Level Rise on Low-Lying Subsiding Coasts: A Case Study of Tavoliere Delle Puglie (Southern Italy). Remote Sens. 2022, 14, 4936. [Google Scholar] [CrossRef]
  25. Vecchio, A.; Anzidei, M.; Serpelloni, E.; Florindo, F. Natural Variability and Vertical Land Motion Contributions in the Mediterranean Sea-Level Records over the Last Two Centuries and Projections for 2100. Water 2019, 11, 1480. [Google Scholar] [CrossRef]
  26. Costantini, M.; Minati, F.; Trillo, F.; Ferretti, A.; Novali, F.; Passera, E.; Dehls, J.; Larsen, Y.; Marinkovic, P.; Eineder, M.; et al. European Ground Motion Service (EGMS). In Proceedings of the 2021 IEEE International Geoscience and Remote Sensing Symposium IGARSS, Brussels, Belgium, 11–16 July 2021; pp. 3293–3296. [Google Scholar]
  27. Crosetto, M.; Solari, L.; Mróz, M.; Balasis-Levinsen, J.; Casagli, N.; Frei, M.; Oyen, A.; Moldestad, D.A.; Bateson, L.; Guerrieri, L.; et al. The Evolution of Wide-Area DInSAR: From Regional and National Services to the European Ground Motion Service. Remote Sens. 2020, 12, 2043. [Google Scholar] [CrossRef]
  28. Loizidou, X.I.; Orthodoxou, D.L.; Loizides, M.I.; Petsa, D.; Anzidei, M. Adapting to Sea Level Rise: Participatory, Solution-Oriented Policy Tools in Vulnerable Mediterranean Areas. Environ. Syst. Decis. 2023, 1–19. [Google Scholar] [CrossRef] [PubMed]
  29. Vousdoukas, M.I.; Mentaschi, L.; Mongelli, I.; Ciscar, J.C.; Hinkel, J.; Ward, P.; Gosling, S.; Feyen, L. Adapting to Rising Coastal Flood Risk in the EU under Climate Change; Publications Office of the European Union: Luxembourg, 2020; ISBN 978-92-76-12990-5. [Google Scholar] [CrossRef]
  30. Rodríguez-Santalla, I.; Navarro, N. Main Threats in Mediterranean Coastal Wetlands. The Ebro Delta Case. J. Mar. Sci. Eng. 2021, 9, 1190. [Google Scholar] [CrossRef]
  31. Grases, A.; Gracia, V.; García-León, M.; Lin-Ye, J.; Sierra, J.P. Coastal Flooding and Erosion under a Changing Climate: Implications at a Low-Lying Coast (Ebro Delta). Water 2020, 12, 346. [Google Scholar] [CrossRef]
  32. López-Dóriga, U.; Jiménez, J.A. Impact of Relative Sea-Level Rise on Low-Lying Coastal Areas of Catalonia, NW Mediterranean, Spain. Water 2020, 12, 3252. [Google Scholar] [CrossRef]
  33. Rodriguez-Lloveras, X.; Vilà, M.; Mora, O.; Pérez, F.; Pi, R.; Marturià, J. Detection of Subsidence in the Ebro Delta Plain Using DInSAR: Analysis of the Measurements and the Factors That Control the Phenomenon. Proc. Int. Assoc. Hydrol. Sci. 2020, 382, 803–808. [Google Scholar] [CrossRef]
  34. Genua-Olmedo, A.; Alcaraz, C.; Caiola, N.; Ibáñez, C. Sea Level Rise Impacts on Rice Production: The Ebro Delta as an Example. Sci. Total Environ. 2016, 571, 1200–1210. [Google Scholar] [CrossRef]
  35. Amores, A.; Marcos, M.; Carrió, D.S.; Gómez-Pujol, L. Coastal Impacts of Storm Gloria (January 2020) over the North-Western Mediterranean. Nat. Hazards Earth Syst. Sci. 2020, 20, 1955–1968. [Google Scholar] [CrossRef]
  36. Arnaud-Fassetta, G.; Provansal, M. The Lower Valley and the Delta of the Rhône River: Water Landscapes of Nature and History. In Landscapes and Landforms of France; Fort, M., André, M.-F., Eds.; World Geomorphological Landscapes; Springer: Dordrecht, The Netherlands, 2014; pp. 207–218. ISBN 978-94-007-7021-8. [Google Scholar]
  37. de Montety, V.; Radakovitch, O.; Vallet-Coulomb, C.; Blavoux, B.; Hermitte, D.; Valles, V. Origin of Groundwater Salinity and Hydrogeochemical Processes in a Confined Coastal Aquifer: Case of the Rhône Delta (Southern France). Appl. Geochem. 2008, 23, 2337–2349. [Google Scholar] [CrossRef]
  38. Boutron, O.; Paugam, C.; Luna-Laurent, E.; Chauvelon, P.; Sous, D.; Rey, V.; Meulé, S.; Chérain, Y.; Cheiron, A.; Migne, E. Hydro-Saline Dynamics of a Shallow Mediterranean Coastal Lagoon: Complementary Information from Short and Long Term Monitoring. J. Mar. Sci. Eng. 2021, 9, 701. [Google Scholar] [CrossRef]
  39. Zanchettin, D.; Bruni, S.; Raicich, F.; Lionello, P.; Adloff, F.; Androsov, A.; Antonioli, F.; Artale, V.; Carminati, E.; Ferrarin, C.; et al. Sea-Level Rise in Venice: Historic and Future Trends (Review Article). Nat. Hazards Earth Syst. Sci. 2021, 21, 2643–2678. [Google Scholar] [CrossRef]
  40. Lionello, P.; Nicholls, R.J.; Umgiesser, G.; Zanchettin, D. Venice Flooding and Sea Level: Past Evolution, Present Issues, and Future Projections (Introduction to the Special Issue). Nat. Hazards Earth Syst. Sci. 2021, 21, 2633–2641. [Google Scholar] [CrossRef]
  41. Lionello, P.; Barriopedro, D.; Ferrarin, C.; Nicholls, R.J.; Orlić, M.; Raicich, F.; Reale, M.; Umgiesser, G.; Vousdoukas, M.; Zanchettin, D. Extreme Floods of Venice: Characteristics, Dynamics, Past and Future Evolution (Review Article). Nat. Hazards Earth Syst. Sci. 2021, 21, 2705–2731. [Google Scholar] [CrossRef]
  42. Alberti, T.; Anzidei, M.; Faranda, D.; Vecchio, A.; Favaro, M.; Papa, A. Dynamical Diagnostic of Extreme Events in Venice Lagoon and Their Mitigation with the MoSE. Sci. Rep. 2023, 13, 10475. [Google Scholar] [CrossRef]
  43. Mel, R.A.; Viero, D.P.; Carniello, L.; Defina, A.; D’Alpaos, L. The First Operations of Mo.S.E. System to Prevent the Flooding of Venice: Insights on the Hydrodynamics of a Regulated Lagoon. Estuar. Coast. Shelf Sci. 2021, 261, 107547. [Google Scholar] [CrossRef]
  44. Favaretto, C.; Manfè, G.; Volpato, M.; Scarpa, G.M. Effect of Mo.S.E. Closures on Wind Waves in the Venetian Lagoon: In Situ and Numerical Analyses. Water 2022, 14, 2579. [Google Scholar] [CrossRef]
  45. Pellicani, R.; Argentiero, I.; Fidelibus, M.D.; Zanin, G.M.; Parisi, A.; Spilotro, G. Dynamics of the Basilicata Ionian Coast: Human and Natural Drivers. Rend. Lincei. Sci. Fis. Nat. 2020, 31, 353–364. [Google Scholar] [CrossRef]
  46. Guariglia, A.; Buonamassa, A.; Losurdo, A.; Saladino, R.; Trivigno, M.L.; Zaccagnino, A.; Colangelo, A. A Multisource Approach for Coastline Mapping and Identification of Shoreline Changes. Ann. Geophys. 2006, 49. [Google Scholar] [CrossRef]
  47. Greco, M.; Martino, G. Vulnerability Assessment for Preliminary Flood Risk Mapping and Management in Coastal Areas. Nat. Hazards 2016, 82, 7–26. [Google Scholar] [CrossRef]
  48. Canora, F.; Muzzillo, R.; Sdao, F. Groundwater Vulnerability Assessment in the Metaponto Coastal Plain (Basilicata, Italy). Water 2022, 14, 1851. [Google Scholar] [CrossRef]
  49. Muzzillo, R.; Zuffianò, L.E.; Rizzo, E.; Canora, F.; Capozzoli, L.; Giampaolo, V.; De Giorgio, G.; Sdao, F.; Polemio, M. Seawater Intrusion Proneness and Geophysical Investigations in the Metaponto Coastal Plain (Basilicata, Italy). Water 2021, 13, 53. [Google Scholar] [CrossRef]
  50. Corbau, C.; Greco, M.; Martino, G.; Olivo, E.; Simeoni, U. Assessment of the Vulnerability of the Lucana Coastal Zones (South Italy) to Natural Hazards. J. Mar. Sci. Eng. 2022, 10, 888. [Google Scholar] [CrossRef]
  51. Elias, P.; Benekos, G.; Perrou, T.; Parcharidis, I. Spatio-Temporal Assessment of Land Deformation as a Factor Contributing to Relative Sea Level Rise in Coastal Urban and Natural Protected Areas Using Multi-Source Earth Observation Data. Remote Sens. 2020, 12, 2296. [Google Scholar] [CrossRef]
  52. Cevasco, A.; Brandolini, P.; Scospesi, C.; Rellini, I. Relationships between Geo-Hydrological Processes Induced by Heavy Rainfall and Land-Use: The Case of 25 October 2011 in the Vernazza Catchment (Cinque Terre, NW Italy). J. Maps 2013, 9, 289–298. [Google Scholar] [CrossRef]
  53. Anzidei, M.; Bosman, A.; Casalbore, D.; Tusa, S.; La Rocca, R. New Insights on the Subsidence of Lipari Island (Aeolian Islands, Southern Italy) from the Submerged Roman Age Pier at Marina Lunga. Quat. Int. 2016, 401, 162–173. [Google Scholar] [CrossRef]
  54. Romagnoli, C.; Bosman, A.; Casalbore, D.; Anzidei, M.; Doumaz, F.; Bonaventura, F.; Meli, M.; Verdirame, C. Coastal Erosion and Flooding Threaten Low-Lying Coastal Tracts at Lipari (Aeolian Islands, Italy). Remote Sens. 2022, 14, 2960. [Google Scholar] [CrossRef]
  55. May, S.M.; Vött, A.; Brückner, H.; Smedile, A. The Gyra Washover Fan in the Lefkada Lagoon, NW Greece—Possible Evidence of the 365 AD Crete Earthquake and Tsunami. Earth Planets Space 2012, 64, 6. [Google Scholar] [CrossRef]
  56. Zimbo, F.; Ingemi, D.; Guidi, G. The Tropical-like Cyclone “Ianos” in September 2020. Meteorology 2022, 1, 29–44. [Google Scholar] [CrossRef]
  57. Purinton, B.; Bookhagen, B. Validation of Digital Elevation Models (DEMs) and Comparison of Geomorphic Metrics on the Southern Central Andean Plateau. Earth Surf. Dyn. 2017, 5, 211–237. [Google Scholar] [CrossRef]
  58. Kulp, S.A.; Strauss, B.H. CoastalDEM: A Global Coastal Digital Elevation Model Improved from SRTM Using a Neural Network. Remote Sens. Environ. 2018, 206, 231–239. [Google Scholar] [CrossRef]
  59. Kulp, S.A.; Strauss, B.H. New Elevation Data Triple Estimates of Global Vulnerability to Sea-Level Rise and Coastal Flooding. Nat. Commun. 2019, 10, 4844. [Google Scholar] [CrossRef] [PubMed]
  60. Vernimmen, R.; Hooijer, A. New LiDAR-Based Elevation Model Shows Greatest Increase in Global Coastal Exposure to Flooding to Be Caused by Early-Stage Sea-Level Rise. Earths Future 2023, 11, e2022EF002880. [Google Scholar] [CrossRef]
  61. Anzidei, M.; Crosetto, M.; Navarro, J.; Tolomei, C.; Patias, P.; Georgiadis, C.; Vecchio, A.; Doumaz, F.; Trivigno, L.; Falciano, A.; et al. Relative Sea-Level Rise Scenarios for 2100 in the Venice Lagoon by Integrated Geodetic Data, High-Resolution Topography and Climate Projections. New Insights from the SAVEMEDCOASTS-2 Project. In Proceedings of the EGU General Assembly 2022, Vienna, Austria, 23–27 May 2022. [Google Scholar] [CrossRef]
  62. Crosetto, M.; Monserrat, O.; Cuevas-González, M.; Devanthéry, N.; Crippa, B. Persistent Scatterer Interferometry: A Review. ISPRS J. Photogramm. Remote Sens. 2016, 115, 78–89. [Google Scholar] [CrossRef]
  63. Lanari, R.; Casu, F.; Manzo, M.; Zeni, G.; Berardino, P.; Manunta, M.; Pepe, A. An Overview of the Small BAseline Subset Algorithm: A DInSAR Technique for Surface Deformation Analysis. Pure Appl. Geophys. 2007, 164, 637–661. [Google Scholar] [CrossRef]
  64. Lee, S.; Wolberg, G.; Shin, S.Y. Scattered Data Interpolation with Multilevel B-Splines. IEEE Trans. Vis. Comput. Graph. 1997, 3, 228–244. [Google Scholar] [CrossRef]
  65. Anzidei, M.; Doumaz, F.; Vecchio, A.; Serpelloni, E.; Pizzimenti, L.; Civico, R.; Greco, M.; Martino, G.; Enei, F. Sea Level Rise Scenario for 2100 A.D. in the Heritage Site of Pyrgi (Santa Severa, Italy). J. Mar. Sci. Eng. 2020, 8, 64. [Google Scholar] [CrossRef]
  66. Mentaschi, L.; Besio, G.; Cassola, F.; Mazzino, A. Developing and Validating a Forecast/Hindcast System for the Mediterranean Sea. J. Coast. Res. 2013, 65, 1551–1556. [Google Scholar] [CrossRef]
  67. Mentaschi, L.; Besio, G.; Cassola, F.; Mazzino, A. Performance Evaluation of Wavewatch III in the Mediterranean Sea. Ocean. Model. 2015, 90, 82–94. [Google Scholar] [CrossRef]
  68. Yunus, A.P.; Avtar, R.; Kraines, S.; Yamamuro, M.; Lindberg, F.; Grimmond, C.S.B. Uncertainties in Tidally Adjusted Estimates of Sea Level Rise Flooding (Bathtub Model) for the Greater London. Remote Sens. 2016, 8, 366. [Google Scholar] [CrossRef]
  69. Gallien, T.W.; Sanders, B.F.; Flick, R.E. Urban Coastal Flood Prediction: Integrating Wave Overtopping, Flood Defenses and Drainage. Coast. Eng. 2014, 91, 18–28. [Google Scholar] [CrossRef]
  70. Seenath, A.; Wilson, M.; Miller, K. Hydrodynamic versus GIS Modelling for Coastal Flood Vulnerability Assessment: Which Is Better for Guiding Coastal Management? Ocean Coast. Manag. 2016, 120, 99–109. [Google Scholar] [CrossRef]
  71. Anderson, T.R.; Fletcher, C.H.; Barbee, M.M.; Romine, B.M.; Lemmo, S.; Delevaux, J.M.S. Modeling Multiple Sea Level Rise Stresses Reveals up to Twice the Land at Risk Compared to Strictly Passive Flooding Methods. Sci. Rep. 2018, 8, 14484. [Google Scholar] [CrossRef] [PubMed]
  72. Malgwi, M.B.; Schlögl, M.; Keiler, M. Expert-Based versus Data-Driven Flood Damage Models: A Comparative Evaluation for Data-Scarce Regions. Int. J. Disaster Risk Reduct. 2021, 57, 102148. [Google Scholar] [CrossRef]
  73. Papathoma-Köhle, M.; Gems, B.; Sturm, M.; Fuchs, S. Matrices, Curves and Indicators: A Review of Approaches to Assess Physical Vulnerability to Debris Flows. Earth-Sci. Rev. 2017, 171, 272–288. [Google Scholar] [CrossRef]
  74. Merz, B.; Kreibich, H.; Schwarze, R.; Thieken, A. Review Article “Assessment of Economic Flood Damage”. Nat. Hazards Earth Syst. Sci. 2010, 10, 1697–1724. [Google Scholar] [CrossRef]
  75. Blanco-Vogt, A.; Schanze, J. Assessment of the Physical Flood Susceptibility of Buildings on a Large Scale—Conceptual and Methodological Frameworks. Nat. Hazards Earth Syst. Sci. 2014, 14, 2105–2117. [Google Scholar] [CrossRef]
  76. Fuchs, S. Susceptibility versus Resilience to Mountain Hazards in Austria—Paradigms of Vulnerability Revisited. Nat. Hazards Earth Syst. Sci. 2009, 9, 337–352. [Google Scholar] [CrossRef]
  77. UNISDR. Sendai Framework for Disaster Risk Reduction 2015–2030. UN World Conference on Disaster Risk Reduction, 14–18 March 2015, Sendai, Japan; United Nations Office for Disaster Risk Reduction: Geneva, 2015. Available online: http://www.wcdrr.org/uploads/Sendai_Framework_for_Disaster_Risk_Reduction_2015-2030.pdf (accessed on 20 July 2023).
  78. Smith, D.I. Flood Damage Estimation—A Review of Urban Stage-Damage Curves and Loss Functions. Water SA 1994, 20, 231–238. [Google Scholar]
  79. Romali, N.S.; Sulaiman, M.S.A.K.; Yusop, Z.; Ismail, Z. Flood Damage Assessment: A Review of Flood Stage–Damage Function Curve. In ISFRAM 2014: Proceedings of the International Symposium on Flood Research and Management; Abu Bakar, S.H., Tahir, W., Wahid, M.A.b., Mohd Nasir, S.R., Hassan, R., Eds.; Springer: Singapore, 2015; pp. 147–159. [Google Scholar] [CrossRef]
  80. Poelhekke, L.; Jäger, W.S.; van Dongeren, A.; Plomaritis, T.A.; McCall, R.; Ferreira, Ó. Predicting Coastal Hazards for Sandy Coasts with a Bayesian Network. Coast. Eng. 2016, 118, 21–34. [Google Scholar] [CrossRef]
  81. Jäger, W.S.; Christie, E.K.; Hanea, A.M.; den Heijer, C.; Spencer, T. A Bayesian Network Approach for Coastal Risk Analysis and Decision Making. Coast. Eng. 2018, 134, 48–61. [Google Scholar] [CrossRef]
  82. Bolle, A.; das Neves, L.; Smets, S.; Mollaert, J.; Buitrago, S. An Impact-Oriented Early Warning and Bayesian-Based Decision Support System for Flood Risks in Zeebrugge Harbour. Coast. Eng. 2018, 134, 191–202. [Google Scholar] [CrossRef]
  83. Merz, B.; Kreibich, H.; Lall, U. Multi-Variate Flood Damage Assessment: A Tree-Based Data-Mining Approach. Nat. Hazards Earth Syst. Sci. 2013, 13, 53–64. [Google Scholar] [CrossRef]
  84. Ettinger, S.; Mounaud, L.; Magill, C.; Yao-Lafourcade, A.-F.; Thouret, J.-C.; Manville, V.; Negulescu, C.; Zuccaro, G.; De Gregorio, D.; Nardone, S.; et al. Building Vulnerability to Hydro-Geomorphic Hazards: Estimating Damage Probability from Qualitative Vulnerability Assessment Using Logistic Regression. J. Hydrol. 2016, 541, 563–581. [Google Scholar] [CrossRef]
  85. Zanuttigh, B.; Simcic, D.; Bagli, S.; Bozzeda, F.; Pietrantoni, L.; Zagonari, F.; Hoggart, S.; Nicholls, R.J. THESEUS Decision Support System for Coastal Risk Management. Coast. Eng. 2014, 87, 218–239. [Google Scholar] [CrossRef]
  86. Holman, I.; Rounsevell, M.; Berry, P.; Nicholls, R. Development and Application of Participatory Integrated Assessment Software to Support Local/Regional Impact and Adaptation Assessment. Clim. Chang. 2008, 90, 1–4. [Google Scholar] [CrossRef]
  87. DeLorme, D.; Stephens, S.; Hagen, S.; Bilskie, M. Communicating with Coastal Decision-Makers and Environmental Educators via Sea Level Rise Decision-Support Tools. J. Sci. Commun. 2018, 17. [Google Scholar] [CrossRef]
  88. Pickle, E. GeoNode—A New Approach to Developing SDI. In Geospatial Crossroads @ GI_Forum ‘10, Proceedings of the Geoinformatics Forum, Salzburg, Austria, 6–9 July 2010; Car, A., Griesebner, G., Strobl, J., Eds.; Wichmann Herbert: Heidelberg, Germany, 2010. [Google Scholar]
  89. Greco, M.; Martino, G.; Guariglia, A.; Trivigno, M.L.; Sansanelli, V.; Losurdo, A. Development of an Integrated SDSS for Coastal Risks Monitoring and Assessment. J. Coast. Zone Manag. 2017, 20, 446. [Google Scholar] [CrossRef]
  90. GFDRR. Open Data for Resilience Initiative and GeoNode: A Case Study on Institutional Investments in Open Source. GFDRR: Washington, DC, USA, 2017. Available online: https://documents1.worldbank.org/curated/en/713861563520709009/pdf/Open-Data-for-Resilience-Initiative-and-GeoNode-A-Case-Study-on-Institutional-Investments-in-Open-Source.pdf (accessed on 5 July 2023).
  91. Corti, P.; Bartoli, F.; Fabiani, A.; Giovando, C.; Kralidis, A.T.; Tzotsos, A. GeoNode: An Open Source Framework to Build Spatial Data Infrastructures. PeerJ 2019. preprints. [Google Scholar] [CrossRef]
Figure 1. The SAVEMEDCOASTS-2 and SAVEMEDCOASTS case studies: (a) Ebro Delta (Spain); (b) Rhone Delta (France); (c) Venice Lagoon (Italy); (d) Metaponto Plain (Italy); (e) Chalastra Plain (Greece); (f) Cinque Terre (Italy); (g) Lipari Island (Italy); (h) Lefkada Island (Greece). Background layer: “Sentinel-2 cloudless—https://s2maps.eu (accessed on 7 August 2023) by EOX IT Services GmbH (Contains modified Copernicus Sentinel data 2020)”.
Jmse 11 02071 g001
Figure 2. Workflow of data analysis and results for the SAVEMEDCOASTS-2 webGIS geodatabase.
Jmse 11 02071 g002
Figure 3. The City of Venice (Italy). RSLR scenarios in 2030, 2050, and 2100 for the RCP8.5 climatic projections from the regional IPCC AR5 Report, integrated with the contribution of the mean VLM rate derived from the combined InSAR-GNSS analysis. Background layer: Ortofoto 2014. Città Metropolitana di Venezia. Reference topography: LiDAR DTM ex Consorzio Venezia Nuova.
Jmse 11 02071 g003
Figure 4. The Ebro Delta (Spain). Potential coastal flooding scenarios in 2021, 2030, 2050, and 2100 for: (a) RCP2.6 RSLR and 1 yr storm surge (SS); (b) RCP2.6 RSLR and 100 yrs SS; (c) RCP8.5 RSLR and 1 yr SS; (d) RCP8.5 RSLR and 100 yrs SS. Flooding areas are shown in pale yellow in 2021, in a blue color palette for RCP2.6, and a yellow–red color palette for RCP8.5 up to 2100, respectively. Background layer: Delta de l’Ebre Ortofoto febrer 2020, Institut Cartogràfic i Geològic de Catalunya (ICGC). Reference topography: Modelo digital del terreno 2a Cobertura (2015-Actualidad), Instituto Geográfico Nacional (IGN).
Jmse 11 02071 g004
Figure 5. Monterosso (Italy). Results of the “Storm surge scenarios” app for the RCP8.5 climate scenario, storm surge with RT = 100 yrs, and time horizon 2100.
Jmse 11 02071 g005
Figure 6. Metaponto (Italy). Results of the “Storm surge scenarios” app for the RCP8.5 climate scenario, storm surge with RT = 100 yrs, and time horizon 2100.
Jmse 11 02071 g006
Figure 7. Cavallino Treporti (Italy). Results of the “Comparison between scenarios” app for RCP2.6 climate scenario, storm surge with RT = 100 yrs, and time horizon 2100.
Jmse 11 02071 g007
Figure 8. The Ebro Delta (Spain). An example of using the “Flood risk indicators” app for the RCP2.6 IPCC scenario, a storm surge with RT = 100 yrs, and rice fields as a flood risk indicator.
Jmse 11 02071 g008
Table 1. DEMs adopted for each case study and their main characteristics.
Case StudyDEM ProductSourceYearCell Size
(m)
Horizontal
Accuracy (m)
Vertical
Accuracy (m)
Cinque Terre (Italy)SCANCOASTLiguria Region20140.020.020.02
Lipari Island (Italy)V3INGV20150.020.030.03
Lefkada Island (Greece)SAVEMEDCOASTSAUTh20170.040.020.03
Ebro Delta (Spain)IGN MDT02IGN 1201920.30.15
Rhone Delta (France)LITTO3D-PACA-2015Shom201510.5-20.2–0.5
Venice Lagoon * (Italy)LiDAR PSTMASE 2201120.30.15
Venice Lagoon ** (Italy)N/A 3CVN 420180.5N/AN/A
Metaponto (Italy)LiDAR PSTMASE20160.50.30.15
Chalastra Plain (Greece)SAVEMEDCOASTS-2AUTh20200.050.050.10
* Only the extralagunar coastal fringe. ** Only the intralagunar coastal fringe and islands. 1 Instituto Geográfico Nacional (Spain). 2 Ministero dell’Ambiente e della Sicurezza Energetica (Italy). 3 Not Available (missing metadata). 4 Ministero delle Infrastrutture e dei Trasporti —“Provveditorato Interregionale per le Opere Pubbliche del Veneto già Magistrato alle Acque del Veneto—Trentino Alto Adige—Friuli Venezia Giulia” già Magistrato alle Acque di Venezia, tramite il concessionario Consorzio Venezia Nuova (Italy).
Table 2. Spatial average of the ground vertical velocities Vup evaluated for selected study areas (Vup < 0 in the case of subsidence and Vup > 0 in the case of uplift). Due to the high fragmentation of the Venice Lagoon, only values for its specific pilot sites for which storm surges were modeled (see Section 2.2.6), namely Venice Lido and Cavallino Treporti, are reported.
Case StudyVup (mm/yr)
Cinque Terre (Italy)−0.29 ± 0.02
Lipari Island (Italy)−9.0 ± 2.0
Lefkada Island (Greece)−0.88 ± 0.08
Ebro Delta (Spain)−0.96 ± 1.55
Rhone Delta (France)−2.19 ± 1.38
Venice Lido (Italy)−2.15 ± 0.79
Cavallino Treporti (Italy)−2.79 ± 1.03
Metaponto (Italy)−1.21 ± 1.20
Chalastra Plain (Greece)−5.97 ± 1.69
Table 3. Significant wave height Hs for each study area and return time.
Hs (m)
LocationRT = 1 yrRT = 100 yrs
Cinque Terre (Italy)4.987.05
Lipari Island (Italy)4.536.73
Lefkada Island (Greece)4.226.60
Ebro Delta (Spain)4.248.09
Rhone Delta (France)4.308.35
Venice Lagoon (Italy)4.506.50
Metaponto (Italy)4.346.30
Chalastra Plain (Greece)2.634.63
Table 4. Typical highest astronomical tide (HAT) values for each study area.
LocationHAT (m)
Cinque Terre (Italy)0.36
Lipari Island (Italy)0.38
Lefkada Island (Greece)0.35
Ebro Delta (Spain)0.40
Rhone Delta (France)0.40
Venice Lagoon (Italy)0.80
Metaponto (Italy)0.30
Chalastra Plain (Greece)0.30
Table 5. Flood risk indicators adopted (black dots) for each SAVEMEDCOASTS-2 case study.
Flood Risk IndicatorEbro DeltaRhone DeltaVenice Lido
Cavallino Treporti
MetapontoChalastra Plain
Accommodation (i0)
Buildings (i1)
Drainage Network (i2)
Irrigation Areas (i3)
Protected Areas (i4)
Rice Fields (i5)
Road Network (i6)
Table 6. Flood risk indicators (%) for each potential coastal flooding scenario and SAVEMEDCOASTS-2 case study: i0 (Accommodation), i1 (Buildings), i2 (Drainage Network), i3 (Irrigation Areas), i4 (Protected Areas), i5 (Rice fields), and i6 (Road network).
Ebro Delta Rhone DeltaVenice Lido and
Cavallino Treporti
MetapontoChalastra Plain
Scenario 1i4i5i6i4i5i6i1i3i4i6i0i1i2i3i4i6i4i5i6
rt001_202158.9057.0416.5747.2418.203.1627.0540.4137.4521.6200.322.30.0054.71.537.3141.6713.77
rt001_rcp26_203062.6665.8222.8355.0124.995.5135.9354.2044.7529.7500.324.80.0059.33.739.1942.2214.60
rt001_rcp26_205064.6171.7227.7662.7033.989.9145.0064.8149.6637.6200.929.10.00516.35.340.5242.6315.60
rt001_rcp26_210065.4374.9130.5075.7853.725.0468.6881.1859.460.1728.511.029.10.0143.611.743.6343.3420.37
rt001_rcp85_203063.8369.1925.6055.0124.995.5135.0453.2444.2829.1100.724.80.0059.33.539.1142.2014.57
rt001_rcp85_205064.6171.7227.7664.5236.4811.2748.5168.0251.2240.942.11.529.30.00520.24.740.8542.7315.95
rt001_rcp85_210067.2789.8443.4784.3673.2448.8485.6388.4268.7876.2760.630.950.00.2170.021.445.6943.6324.11
rt100_202164.1870.2926.5447.2418.203.1627.0540.4137.4521.6200.322.50.0054.71.537.3141.6713.78
rt100_rcp26_203064.8272.4328.3955.0124.995.5135.9354.2044.7529.7500.324.80.0059.33.739.1942.2214.60
rt100_rcp26_205066.8884.7938.7662.7033.989.9145.0064.8149.6637.6200.929.10.0059.35.340.5242.6315.60
rt100_rcp26_210067.3390.6844.3983.4771.0145.5068.6881.1859.4060.1729.611.038.40.0143.611.743.6943.3520.56
rt100_rcp85_203066.8884.7938.7655.0124.995.5135.0453.2444.2829.1100.724.80.0059.33.539.1142.2014.57
rt100_rcp85_205067.1087.4141.0876.0054.1125.4948.5168.0251.2240.942.11.529.30.00520.24.740.8542.7315.95
rt100_rcp85_210067.5595.7852.5686.277.8756.2885.6388.4268.7876.2776.744.859.94.181.030.656.1043.9629.01
1 Scenarios are denominated as follows: return time (rt) of the SS (where “rt001” and “rt100” stand for RT = 1 yr and RT = 100 yrs, respectively) + IPCC climate projection (“_” + “rcp2.6” or “rcp8.5” for years other than 2021) + “_” + time epoch (among 2021, 2030, 2050, and 2100).
Disclaimer/Publisher’s Note: The statements, opinions and data contained in all publications are solely those of the individual author(s) and contributor(s) and not of MDPI and/or the editor(s). MDPI and/or the editor(s) disclaim responsibility for any injury to people or property resulting from any ideas, methods, instructions or products referred to in the content.

