Article

Energy and Environmental Assessment of Bacteria-Inoculated Mineral Fertilizer Used in Spring Barley Cultivation Technologies

by
Justinas Anušauskas
,
Andrius Grigas
,
Kristina Lekavičienė
*,
Ernestas Zaleckas
,
Simona Paulikienė
and
Dainius Steponavičius
Faculty of Engineering, Agriculture Academy, Vytautas Magnus University, Studentu Str. 15A, LT-53362 Akademija, Kaunas District, Lithuania
*
Author to whom correspondence should be addressed.
Agriculture 2024, 14(4), 569; https://doi.org/10.3390/agriculture14040569
Submission received: 4 March 2024 / Revised: 29 March 2024 / Accepted: 30 March 2024 / Published: 2 April 2024

Abstract

:
In the scientific literature there is a lack of information on the integrated effect of bioenriched complex mineral fertilizers in the energy and environmental aspects of spring barley production technology. The aim of this study was to validate the type of phosphorus-releasing bacteria and to carry out an energy and environmental assessment of the use of mineral fertilizers enriched with them for barley fertilization. The experimental field studies (2020–2022) were carried out in open ground on sandy loam soil in southern Lithuania. Four barley cultivation technologies (SC) were applied. Control (SC–1) did not use complex mineral fertilizers; in SC–2, 300 kg ha−1 of N5P20.5K36 fertilizer was applied. In SC–3, the same fertilizer was enriched with a bacterial inoculant (Paenibacillus azotofixans, Bacillus megaterium, Bacillus mucilaginosus, and Bacillus mycoides) at a rate of 150 kg ha−1, and in SC–4, 300 kg ha−1 of N5P20.5K36 fertilizer were applied and the same enrichment with the bacterial inoculant was carried out. The results confirmed the hypothesis that spring barley cultivation technologies using bacterial inoculants (SC–3 and SC–4) have higher mineral fertilizer efficiency than SC–2. In all three years, the bacterial inoculant had a positive effect on phosphorus fertilizer efficiency. In SC–4 (2020) it was 8%, in 2021—7%, and in 2022—even 17% higher compared to SC–2. In terms of energy balance, a significant influence of the bacterial inoculant was found. In 2020 and 2021, the energy balance of SC–4 was 10%, and in 2022, 22.8% higher compared to SC–2. The increase in fertilizer use efficiency resulted in a positive environmental impact, with greenhouse gas (GHG) emissions decreasing by 10% in 2020, 15% in 2021, and 19% in 2022 when comparing SC–4 and SC–2. The use of the tested bacterial formulations, without changing the mineral fertilizer rate, can lead to an average reduction in GHG emissions of about 15%. This study demonstrates that enriching mineral fertilizers with specific bacterial inoculants for spring barley cultivation significantly enhances phosphorus efficiency, improves energy balance, and reduces greenhouse gas emissions, underscoring the potential for bioaugmented fertilizers to optimize agricultural sustainability.

1. Introduction

Barley is one of the oldest and most important agricultural crops, ranking fifth in the world in terms of yield [1]. In Lithuania, barley production is also important for the agricultural sector. After wheat and rapeseed, the yield of this cereal in Lithuania ranks third, at around 0.587 thousand Mt [2]. Barley has a wide range of applications, both in human food production, particularly in bread baking, and as animal feed. Barley is also used to produce alcoholic beverages, is involved in the production of several food products where it is mixed with wheat flour [3], and is used to produce biofuels [4]. Their cultivation techniques vary according to region and climatic conditions. The end-use of barley highlights the need to optimize the quality of cultivation under field conditions, where fertilization has a significant impact on the technology, as the health of the crop depends on it. This has a direct impact on the quality of the final products [5,6].
Fertilization is an essential agricultural practice designed to improve the plant growing conditions and increase their yield. Barley production is no exception—as with other crops, it is necessary to understand the importance of fertilization, determine the optimum fertilization requirement, and consider various criteria and methods to assess fertilization efficiency [7]. Optimal provision of the soil with the necessary nutrients is essential to ensure a quality end product and a high yield [8]. Nitrogen, phosphorus, and potassium are particularly important for barley, and their levels have a direct effect on plant growth, development, and final yield, so the optimal provision of these nutrients is essential [9]. When assessing fertilizer efficiency, not only is the yield of the plant considered, but so too are the energy and environmental aspects [10]. Thus, an important challenge is to effectively manage crop fertilization to simultaneously ensure farm profitability and product quality, while minimizing nitrogen, potassium, and phosphorus losses through leaching to groundwater.
Fertilizer efficiency assessments are carried out to minimize the environmental impact of the technology. This is usually performed by assessing the greenhouse gas emissions (in terms of CO2 equivalent). Various criteria and methods are used to scientifically assess the efficiency of fertilizer application: life cycle analysis (LCA), which can assess the environmental impact of a fertilizer system, taking into account the whole cycle of the fertilization process [11];—the efficiency coefficient of the respective fertilizer (NUE or PUE), which shows how much of the applied fertilizer goes to plant production and how much is lost to the environment [7,9]; and economic criteria such as costs and profits [12].
Improving soil functions is essential to increase agricultural production. One approach is organic fertilizers, which positively affect the soil but have low nutrient concentrations [13]. Mineral fertilizers are important for uptake but can be evaporated or leached into groundwater under adverse climatic conditions [14]. They are often applied in excessive and disproportionate amounts, where such use can have long-term environmental impacts by disrupting or unbalancing the natural functioning of the soil, affecting the productivity of other ecosystem services, affecting crop quality, leaving a carbon footprint, and leading to eutrophication and accumulation of heavy metals in the soil, which is hazardous to the health of humans and animals [15,16]. The EU Green Deal strategy limits the use of inorganic fertilizers [17], but their total elimination in intensive farms is not yet feasible, as the nutrient uptake of organic fertilizers is very low and the desired yields are not achieved. Functional fertilizers are therefore needed that can be effectively integrated into plant nutrient management systems.
Various strategies and measures have been developed to reduce harmful soil acidification and improve and maintain soil fertility. One such approach is the use of microorganisms, which stimulate plant growth and are used as soil inoculants, and have already been applied in a variety of ways in plant production. This includes various seed treatments and fertilizer improvements. These microorganisms have been tested and evaluated in a wide range of crops and under different conditions. Concerning studies on the use of plant growth-promoting rhizobacteria (PGPR), it has been found that the bacteria have a potential role in the development of sustainable crop production systems and the mechanisms they use to promote plant growth by increasing yield include nonsymbiotic N fixation, P solubilization, production of phytohormones and antibiotics, and release of lysing enzymes [18,19,20,21]. Phosphate-solubilizing bacteria (PSB) are heterotrophic bacteria selected for their ability to solubilize low-soluble phosphate compounds in artificial media by releasing low-molecular-weight organic ions that acidify the medium [22]. The use of efficient phosphate-solubilizing bacteria (PSB) has been shown to increase soil P availability by almost 30% [23]. Ribaudo et al. [24] report that in presowing inoculation of barley seeds with P-dissolving bacteria, the addition of bacteria without fertilizer resulted in the same biological yield (3795 kg ha−1) and increase in 1000-seed weight, as well as the highest rate of chemical fertilizer application, while the addition of bacteria together with an intermediate rate of fertilizer resulted in a significant improvement in grain quality parameters. Studies using both single treatments with phosphorus-solubilizing bacteria (PSB) [25,26] and when used in combination with other beneficial microbial species [27,28] show that they can be beneficially integrated into the plant food system and can lead to successful interaction between microbes and phosphorus minerals.
The combined use of microorganisms and mineral fertilizers is a relatively new area of research, which aims to develop effective microbial compositions that are compatible with minerals and have a positive effect on crops and the environment and is poorly described. Only recently has the use of microenriched fertilizers been introduced, where synergies can lead to the development of a cost-effective fertilizer for direct application to the soil. Ahmad et al. [29] highlighted that microbial-based compositions have shown positive synergistic and complementary interactions with inorganic fertilizers, thus increasing fertilizer efficiency. Similar studies have been carried out using microorganism-enriched fertilizers under synergistic conditions in field barley production [30]. Studies have shown that using the same amount of fertilizer enriched with bacterial inoculants results in higher yields in spring barley production because the bacterial inoculants help turn phosphorus and potassium compounds that are insoluble into soluble ones, making it easier for the plants to access these nutrients.
Based on the above information, from an environmental point of view, many studies have highlighted the importance of reduced fertilizer consumption [13] or calculating increased phosphorus use efficiency (PUE) in plants [9], and the cycling of N or P through fertilizer applications [31]. In addition, the use of PSB in combination with compost has been shown to reduce negative environmental impacts [32].
In summary, in most cases, the positive effects of bioenriched complex mineral fertilizers have been identified in terms of key factors for better plant growth and increased soil capacity for yield. The literature review revealed a wealth of information on the enrichment of fertilizers with microorganisms and their use in the production of many agricultural crops. However, there is a particular lack of information on the integrated effect of bioenriched complex mineral fertilizers in the energy and environmental aspects of spring barley production technology.
Intensive tillage, heavy use of mineral fertilizers, and chemical plant protection products can hurt soil quality. This calls for the development of more effective fertilizers or fertilizer complexes to ensure farming productivity and soil conservation. Therefore, it can be hypothesized that the development of a new generation of more efficient fertilizers could be achieved by basing them on suitable bioactive substances that effectively release nutrients (e.g., phosphorus) contained in mineral fertilizer. Such bioenriched mineral fertilizers are likely to be more efficient and more environmentally friendly. The aim of this study is to substantiate the type of phosphorus-releasing bacteria and to carry out an energy and environmental assessment of the use of mineral fertilizers enriched with them for barley fertilization.

2. Materials and Methods

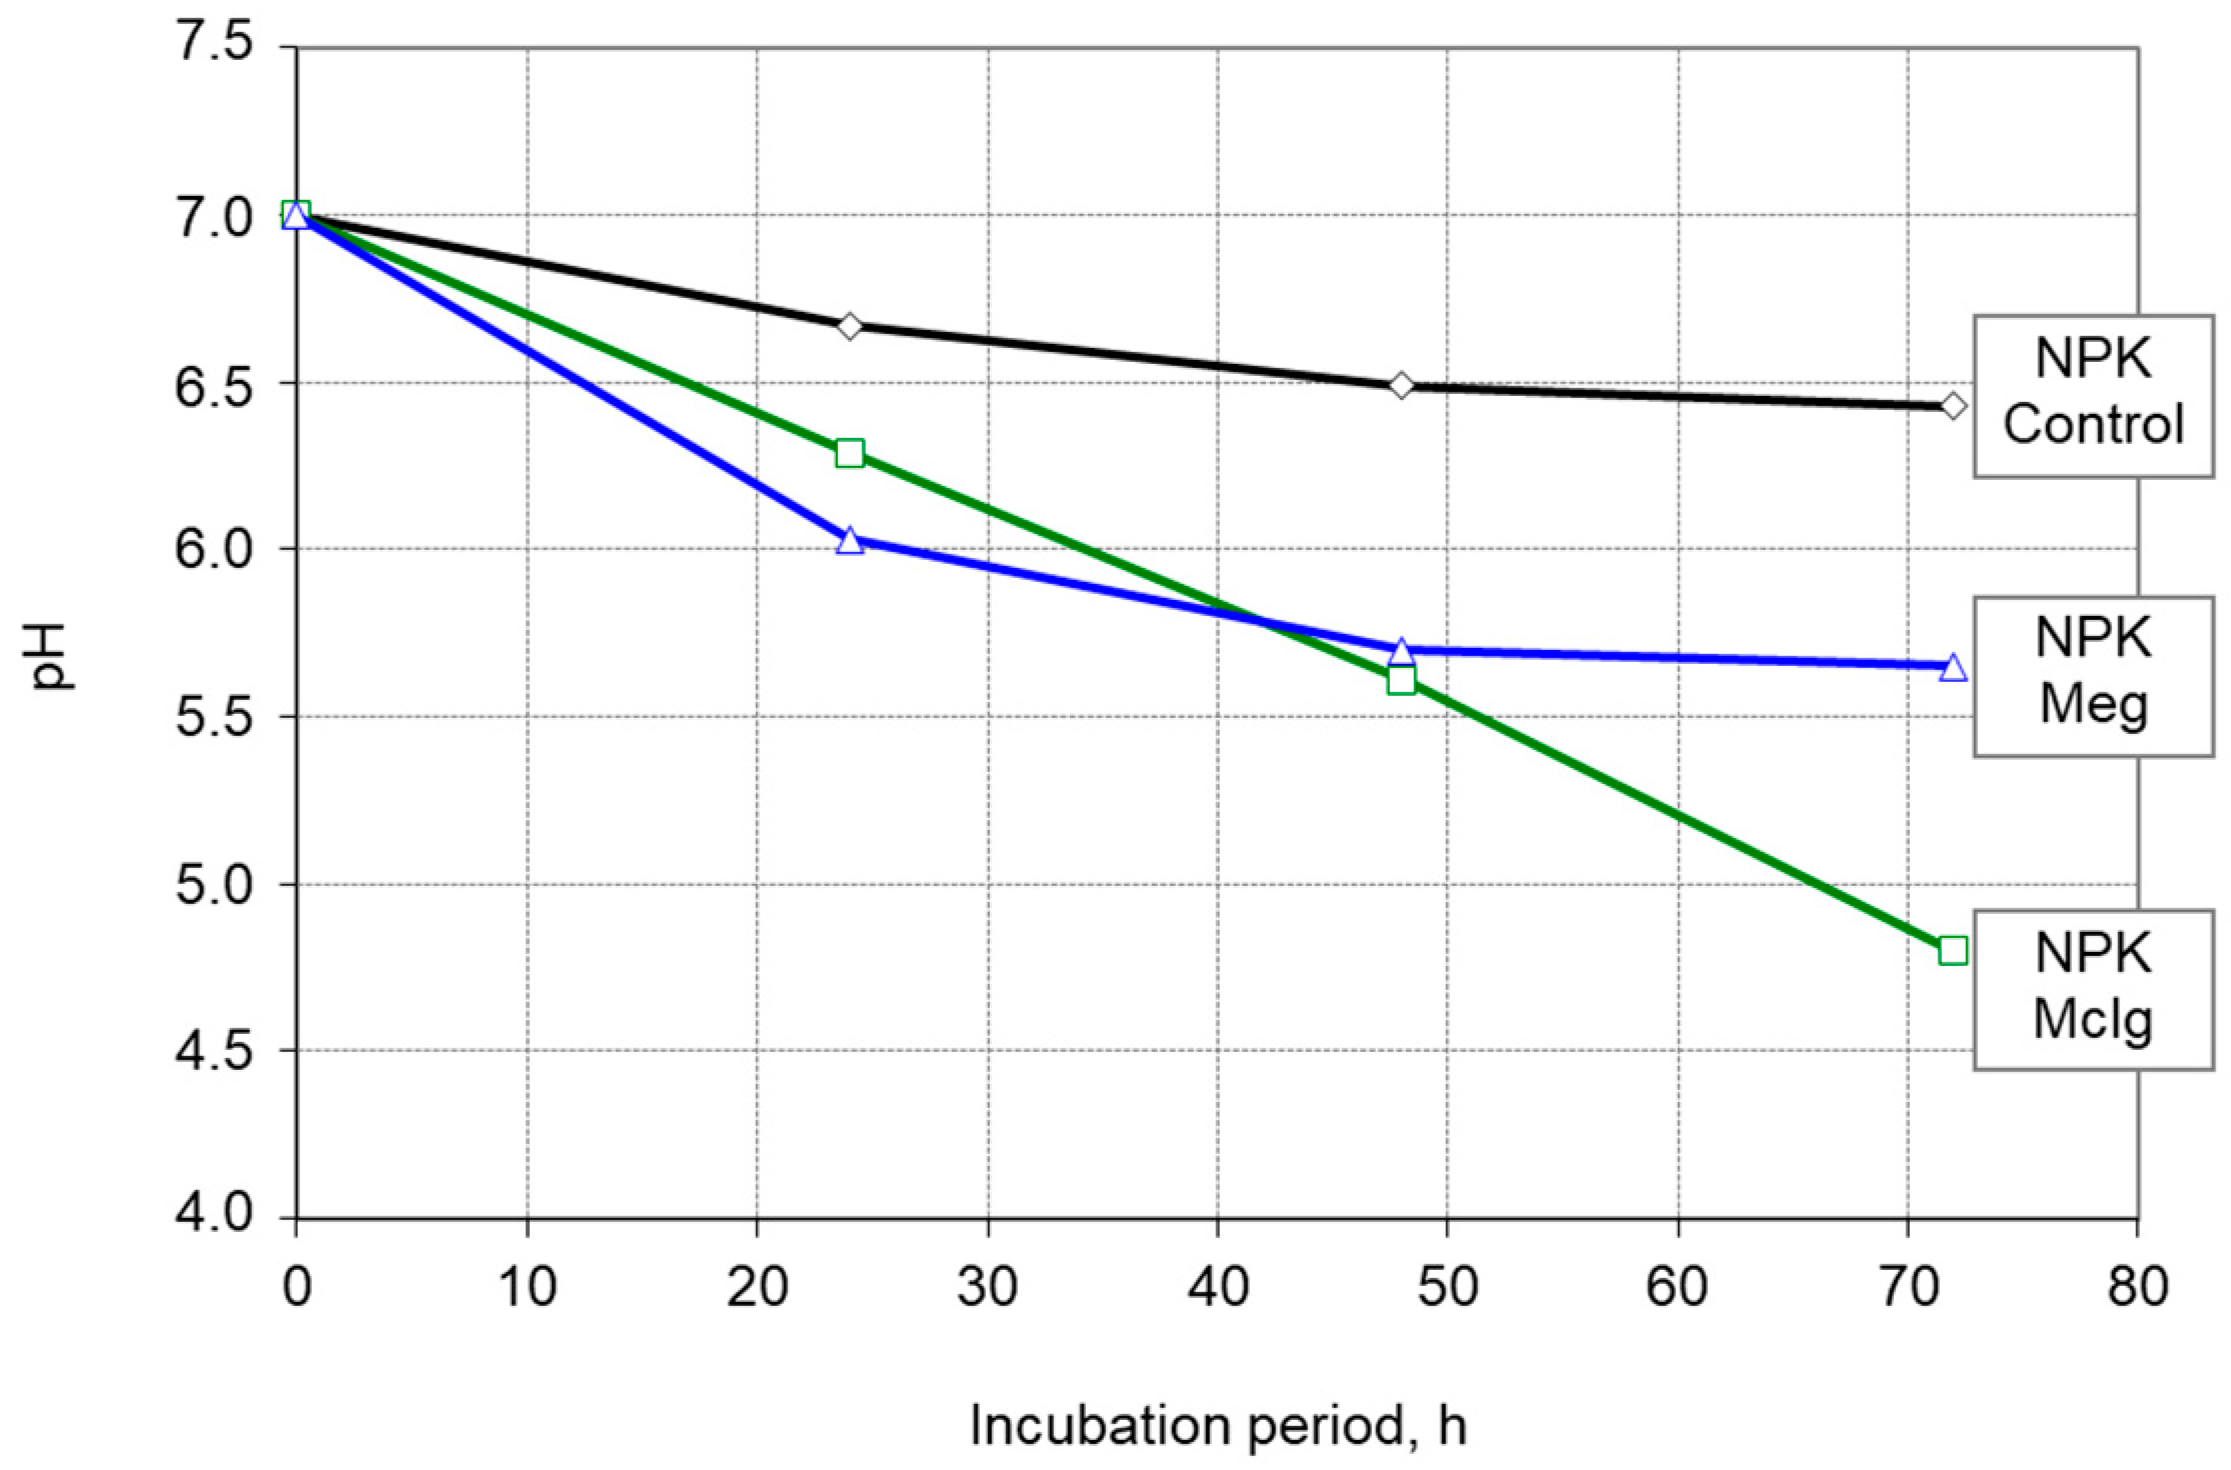
2.1. Determination of Phosphorus Solubility in the Laboratory

Phosphorus solubility studies were carried out in the laboratory of Vytautas Magnus University Agriculture Academy, using three variants. The source of phosphorus in the laboratory studies was the complex mineral fertilizer N5P20.5K36. This fertilizer is made of ammonium phosphate (NH4H2PO4) and potassium chloride (KCl), and has 5% total nitrogen (N) (ammonium nitrogen), 20.5% total phosphorus (P2O5) (20.5% water-soluble P2O5), and 36% water-soluble potassium (K2O) [33].
In separate studies, the fertilizer (N5P20.5K36) was exposed to two species of phosphorus-releasing bacteria, Bacillus megaterium (B. megaterium) and Bacillus mucilaginosus (B. mucilaginosus), in a nutrient medium favorable for their growth. The bacteria used in the study were grown in the laboratory of JSC “Nando” (Kaunas, Lithuania). The nutrient medium (l−1) consisted of glucose—10 g; N5P20.5K36—5 g; MgCl2 6H2O—5 g; MgSO4 7H2O—0.25 g; KCl—0.2 g; and (NH4)2SO4—0.1 g [34]).
The study was conducted in three variants: (1) control (fertilizer N5P20.5K36—hereafter NPK control): 10 mL of growth medium without phosphorus-releasing bacteria. (2) NPK Mclg: growth medium (10 mL) supplemented with Bacillus mucilaginosus (B. mucilaginosus) (100 uL, 1–2 × 10⁹ cfu mL−1). (3) NPK Meg: growing medium (10 mL) supplemented with Bacillus megaterium (B. megaterium) (100 uL, 1–2 × 10⁹ cfu mL−1). Flasks were incubated for 3 days at 30 °C in a shaker (Thermoshake Gerhardt, Königswinter, Germany) at 180 rpm. Samples were taken simultaneously at 24 h intervals 3 times (24 h, 48 h, and 72 h). Changes in the pH value of the growth media contained in the samples were determined using a pH meter. The amount of relaxed phosphorus (P2O5) (mg L−1) in the growth medium samples was determined using a PerkinElmer Optima 7000 DV inductively coupled plasma optical emission spectrometer (ICP-OES) (PerkinElmer, Inc., Waltham, MA, USA). Data were processed using Perkin Elmer WinLab32 software (PerkinElmer, Inc., Waltham, MA, USA). The rinsing and internal standard solutions were 2% HNO3 and P mg L−1 phosphorus, respectively. The experimental samples were filtered with a 0.45 μm filter to remove precipitates before analysis.

2.2. Experimental Field Studies on the Efficiency of Spring Barley Production Technologies

2.2.1. Site Description

Experimental field studies on spring barley production technologies were carried out on the farm of M. Anušauskas, located in Alytus district, Lithuania. The soil in the region where the farm is located is classified as Endoeutric Albeluvisol (Orthieutric Albeluvisol). The soil texture in the experimental field was sandy loam. To facilitate the observation of the influence of the bacterial inoculant, soil with low phosphorus and potassium content and low soil fertility (score~35) was chosen for the study. Anušauskas et al. [30] describe the experimental field in more detail.

2.2.2. Experimental Design and Agronomic Practice

To observe the long-term effect of the bacterial inoculant, the studies were carried out over three years (2020–2022) on a two-hectare area (longitude X 24.212825; latitude Y 54.481939). The layout and location of the experimental plots were the same throughout the study period. That is, the 12 plots were arranged systematically, using 4 cultivation technologies (SC), with 3 replicated plots for each technology (Figure 1). The plots were 12 m wide and 75 m long.
The first barley technology (SC–1; control) was applied in fields 3, 7, and 11 and it was chosen not to apply P and K fertilizer. Complex mineral fertilizer (N5P20.5K36) was applied in the next three cultivations at rates varying from 150 kg ha−1 to 300 kg ha−1. The second barley cultivation technology (SC–2) was carried out in plots 4, 8, and 12 and complex mineral fertilizer was applied at a rate of 300 kg ha−1. In the third cultivation technology (SC–3), complex mineral fertilizer (N5P20.5K36) was enriched with bacterial inoculant (Paenibacillus azotofixans, Bacillus megaterium, Bacillus mucilaginosus, and Bacillus mycoides) 500 g ha−1 in equal concentrations totaling 1 × 10⁹ cfu g−1) in the study fields 2, 6, and 10 at a rate of 150 kg ha−1, and the proportion of the bacterial inoculant was 0.33% of the total weight of the fertilizer. In fields 1, 5, and 9, a fourth cultivation technology was applied at a rate of 300 kg ha−1 of a complex mineral fertilizer (N5P20.5K36), enriched with an identical amount of bacterial inoculant as in technology SC–3, which accounted for 0.17% of the total weight of fertilizer. The complex mineral fertilizer was incorporated into the soil at the time of sowing. The nitrogen fertilization was performed at the end of tillering (BBCH 25–30) at a uniform rate of 68.8 kg N ha−1 for the entire field with ammonium nitrate (NH4NO3; N34.4) (Table 1). A two-disc fertilizer spreader (Bogballe A/S, Uldum, Denmark) was used to spread it on the soil. The total nitrogen content (Ntot) varied between technologies because of the different rates of the complex mineral fertilizer, even if the nitrogen fertilizer rate was the same for all technologies.
Studies on the cultivation technology of spring barley (Hordeum vulgare L.) were carried out on the barley cultivar Iron (cv. Iron). Soil preparation was the same for all technologies, with plowing in autumn and seedbed preparation in spring. Sowing was carried out using a 4 m wide hanging disc drill. The seed rate was chosen to be 4.0–4.5 million units ha−1 at a depth of 30–40 mm with a row spacing of 142 mm.

2.2.3. Meteorological Conditions

During the research, meteorological conditions in April–August were observed in 2020–2022. Data from the Lithuanian Hydrometeorological Service station were used (Table 2). The research field is located 12 km from the hydrometeorological station (Alytus). During the research, the amount of precipitation k (mm) and the average daily air temperature taverage (°C) were observed.

2.2.4. Determination of Barley Grain Yield

A frame measuring 50 × 50 cm was used for plant sampling. The frame was placed on the soil and all the plants in it were cut. In this way, 10 samples were randomly taken from each research plot, 30 samples for each cultivation technology. Thus, from 12 research plots (Figure 1), a total of 120 samples were taken. All collected samples were transported to the laboratory for further processing before being bagged and labeled.
Further analysis of plant samples was carried out in the laboratory of Vytautas Magnus University Agriculture Academy. Barley grains were separated from the stem with a laboratory threshing bench Wintersteiger LD 350 (Wintersteiger GmbH, Mettmach, Austria) and weighed (g). The weight of separated barley grains was recalculated to the weight per square meter g m−2 at 14% grain moisture content. The average yield of each barley-growing technology was obtained after analyzing 30 samples (Table 3).
The first year of the survey (2020) was the one with the highest yield compared to 2021 and 2022. Yields ranged from 520.9 g m−2 (SC–1) to 639.9 g m−2 (SC–4). The second year (2021) had the lowest yield across all fertilizers treatments, ranging from 229.4 g m−2 (SC–1) to 382.2 g m−2 (SC–4). The low yields in 2021 are attributed to the high average temperature in July (22.5 °C) and the lower June–July precipitation (88.7 mm) (Table 2). In the last year of the study, the lowest yield was in the SC–1 technology, with 230.5 g m−2, and the highest yield was in the SC–4 technology, with 542.7 g m−2.

2.2.5. Energy Input Indicators

Energy input flow EIF. The energy input flow of agricultural production is divided into two main groups, i.e., direct and indirect energy inputs. Direct inputs include human, fuel, and electricity inputs, while indirect inputs include energy used to produce fertilizers and pesticides and other chemicals, seeds, and machinery energy inputs [10,35]. The most used energy inputs in the assessment of agricultural production and milking technologies are calculated per unit area (hectare).
Energy input flow EIF [36]:
E I F = E D + E I N = E Z + E t + E 0 + T W ,   MJ ha 1 ,
  • ED—direct energy inputs, MJ ha−1;
  • EIN—indirect energy inputs, MJ ha−1;
  • Ez—human labor energy inputs, MJ ha−1;
  • Et—fuel energy inputs, MJ ha−1;
  • E0—fertilizer, seed, pesticide, and other chemicals’ energy inputs, MJ ha−1;
  • TW—machinery energy inputs, MJ ha−1.
To calculate energy inputs, energy equivalents (e.g., MJ ha−1 or MJ kg−1) are used. Energy equivalents reflect the energy consumption of living and materialized work (Table 4).

Direct Energy Inputs

Human labor energy inputs. The human labor energy inputs Ez for crop production are calculated by multiplying the total labor input (h ha−1) of the selected technology by its energy equivalent (MJ ha−1) [36]:
E Z = W k · α Z ,   MJ ha 1 ,
  • Wk—productivity of the agricultural implement, h ha−1;
  • α Z —corresponding energy equivalents of human labor inputs, MJ h−1.
The energy equivalent of 1.96 MJ h−1 was used to calculate the human labor inputs.
Fuel energy inputs. The fuel energy inputs Et are calculated based on the determined energy equivalents (MJ kg−1) of the different fuels and the fuel inputs by type of production (kg ha−1) [36]:
E t = G k · α d ,   MJ ha 1 ,
  • G k —fuel inputs, kg ha−1;
  • α d —fuel energy equivalent, MJ kg−1.

Indirect Energy Inputs

Total energy, embodied in fertilizers, seeds, and chemicals. For the energy inputs of fertilizers, seeds, pesticides, and other chemicals, E 0 is based on a general formula based on the amount of material used (kg ha−1), its energy equivalent (MJ kg−1), and its duration of action (years) [36]:
E 0 = γ · G p · T 0 1 ,   MJ ha 1 ,
  • Gp—the rate of fertilizers, seeds, and chemicals, kg ha−1;
  • γ —fertilizer, seed, and chemicals’ energy equivalent, MJ kg−1;
  • T0—duration of action, years.
Total energy embodied in machinery. When calculating the energy inputs of agricultural machinery based on the energy equivalent used, the extraction of raw materials required to produce the machinery is considered, and the energy inputs of the production, repair, and transportation of the machinery are also estimated [35]. To estimate as accurately as possible the energy inputs of agricultural machinery during the work performed, the calculations consider the weight of the tractor (kg), the time required to perform each operation (h ha−1), and the total operating time of the tractor or implement (h) [35]:
TW = γ t · G · W h · T 1 ,   MJ ha 1 ,
  • γ t —energy equivalent of the tractor or implement, MJ kg−1;
  • G—weight of the tractor or implement, kg;
  • Wh—working time, h ha−1;
  • T—the life of machinery as used in practice, h.
Energy output flow. After multiplying the obtained yield by the grain equivalent (14 MJ kg−1), the produced energy is calculated:
E O F = γ g · Y ,   MJ ha 1 ,
  • EOF—energy produced from the grain yield, MJ ha−1;
  • γ g —grain energy equivalent, MJ kg−1;
  • Y—grain yield, kg ha−1.
The energy obtained E O F shows how much energy is obtained from the grain crop grown (without deducting the energy inputs).
Energy use efficiency. According to the previous methods of scientists [35,43,44], the energy ratio between the consumed and received energy from the yield is calculated:
E R O I = E O F · E I F 1 ,
  • EROI—energy use efficiency;
  • EOF—energy obtained from the yield, MJ ha−1;
  • EIF—energy inputs to grow the yield, MJ ha−1.
This ratio shows how many times more energy is obtained from the crop than was used to grow it.
Energy productivity. Energy productivity is calculated, which is the energy ratio of grain yield and total energy inputs [35]:
E P R = Y · E I F 1 ,   kg MJ 1 ,
  • EPR—energy productivity, kg MJ−1;
  • Y—grain yield, kg ha−1;
  • EIF—energy inputs to grow the yield, MJ ha−1.
Energy productivity shows how many kilograms of wheat grains were grown with 1 MJ of energy.
Specific energy. The specific energy was also calculated, i.e., the ratio of total energy inputs to grain yield obtained per hectare [35]:
E S E = E I F · Y 1 ,   MJ kg 1 ,
  • ESE—specific energy, MJ kg−1;
  • EIF—energy inputs to grow the yield, MJ ha−1;
  • Y—grain yield, kg ha−1.
Specific energy shows how much MJ of energy is needed to grow one kilogram of wheat grain.
Energy balance. Energy balance is estimated by the difference between the energy obtained from wheat grain yield and the total energy inputs [35]:
E B = E O F E I F ,   MJ ha 1 ,
  • EB—energy balance, MJ ha−1;
  • EOF—energy obtained from the yield, MJ ha−1;
  • EIF—energy inputs to grow the yield, MJ ha−1.
The energy balance shows how much more MJ of energy is received than the amount of energy used.
Nitrogen use efficiency. To obtain the nitrogen use efficiency, the ratio between the weight of the obtained yield and the amount of nitrogen fertilizers used is calculated:
NUE = Y · m N 1 ,
  • NUE—nitrogen use efficiency;
  • m N —nitrogen fertilizer inputs, kg ha−1;
  • Y—grain yield, kg ha−1.
Nitrogen use efficiency shows how many kilograms of grain are grown with 1 kg of nitrogen fertilizer.
Phosphorus use efficiency. Phosphorus use efficiency is calculated as the ratio between the weight of the harvested crop and the amount of phosphorus fertilizers used:
PUE = Y · m P 1 ,
  • PUE—phosphorus use efficiency;
  • m P —phosphorus fertilizer inputs, kg ha−1;
  • Y—grain yield, kg ha−1.
Phosphorus use efficiency shows how many kilograms of grain are grown with 1 kg of phosphorus fertilizer.
Potassium use efficiency. To obtain potassium use efficiency, the ratio between the weight of the harvested crop and the amount of potassium fertilizers used is calculated:
KUE = Y · m K 1 ,
  • KUE—potassium use efficiency;
  • m K —potassium fertilizer inputs, kg ha−1;
  • Y—grain yield, kg ha−1.
Potassium use efficiency shows how many kg of grains are grown with 1 kg of potassium fertilizer.

2.2.6. Methodology for Evaluating the Efficiency of Bacterial Inoculant in Reducing Greenhouse Gas Emissions

All industrial sectors produce greenhouse gas emissions (GHGs). The agricultural sector is no exception. To control and reduce GHG emissions in agriculture, the fertilizer technologies used and their emissions in kg CO2eq (kilograms of carbon dioxide equivalent) should be assessed. To this end, an assessment of the energy efficiency and environmental impact of the use of bacteria-inoculated mineral fertilizers in spring barley cultivation technologies was carried out. The emissions from spring barley production technologies were calculated considering GHG emission factors recommended by other researchers [45,46,47,48,49,50,51] (Table 5). The following inputs were evaluated to determine the numerical values of GHG emissions for the different cultivation technologies (SC–1, SC–2, SC–3, SC–4): diesel fuel, agricultural machinery, mineral fertilizers, pesticides, seed, and bacterial inoculant. Human labor inputs were not included in the GHG emission assessment as they were the same for all cultivation technologies.
The following technological processes were evaluated for the assessment of GHG emissions from spring barley production technologies: tillage, soil preparation, sowing, fertilization, spraying of plant protection products, harvesting, and transport of grain to storage.

2.2.7. Statistical Analysis

We introduced the data points as mean values with their confidence levels (at a probability level p ≤ 0.05). We calculated the least significant difference LSD05 by applying a t-test at a probability p ≤ 0.05 with statistical software Statistica 10.0 (TIBCO Software, Inc., Palo Alto, CA, USA). Differences between the means of the tested variants were considered significant when they were equal to or greater than the calculated limit of the least significant difference LSD05 [52].

3. Results

3.1. Laboratory Tests for Phosphorus Solubility

The fertilizer variants selected for the study were N5P20.5K36—NPK Control, N5P20.5K36 + Bacillus mucilaginosus—NPK McIg, and N5P20.5K36 + Bacillus megaterium—NPK Meg. The results of the analyses showed that the lowest change in pH of the solution over 72 h was observed in the control sample (from pH 7.00 to pH 6.43), i.e., with the N5P20.5K36 fertilizer without microorganisms (Figure 2). The highest change was observed with Bacillus mucilaginosus NPK McIg (from pH 7.00 to 4.80). This supports the hypothesis that the acidification of the solution reflects the activity of the bacteria tested.
Monitoring the results of phosphorus solubility, the amount of soluble phosphorus released in the control varied from 0 to 1.32 mg L−1 during the 72 h incubation period (Figure 3). At the same incubation period, the soluble phosphorus content of N5P20.5K36 inoculated with Bacillus megaterium varied from 0 to 1.70 mg L−1. It should also be noted that, as in the pH tests, the best results were obtained with N5P20.5K36 inoculated with Bacillus mucilaginosus. Then, during the 72 h incubation period, between 0 and 2.26 mg L−1 of soluble phosphorus was released.

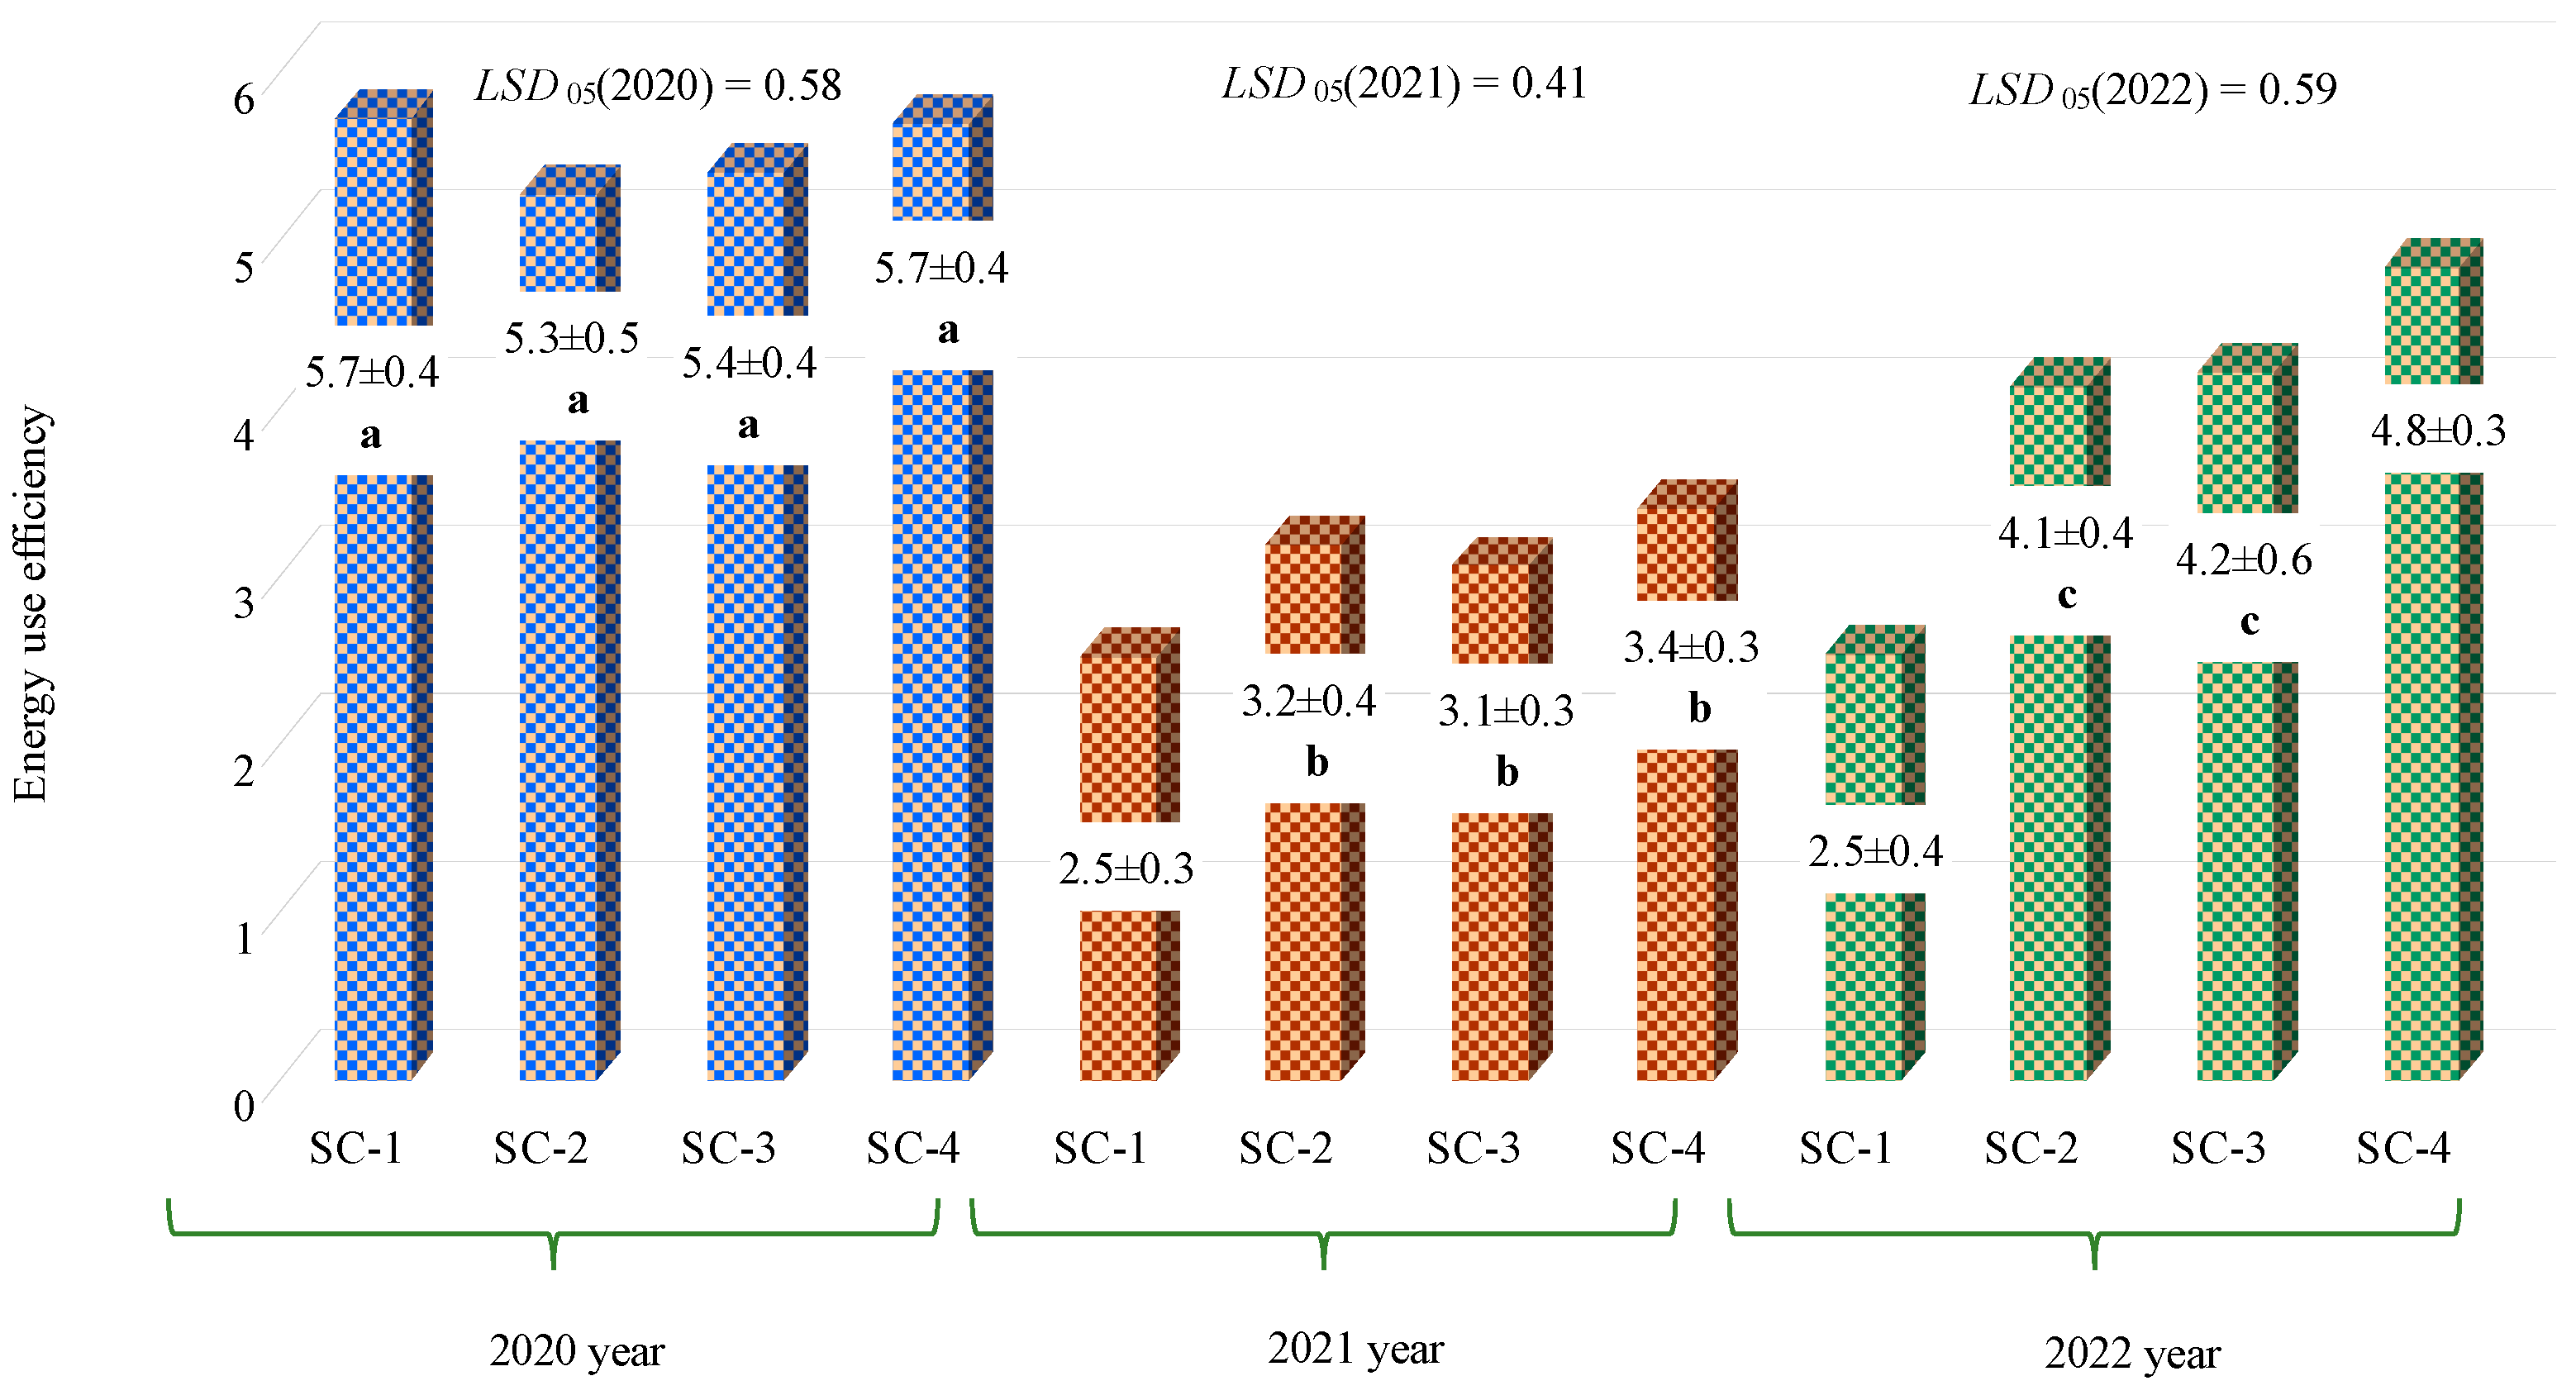
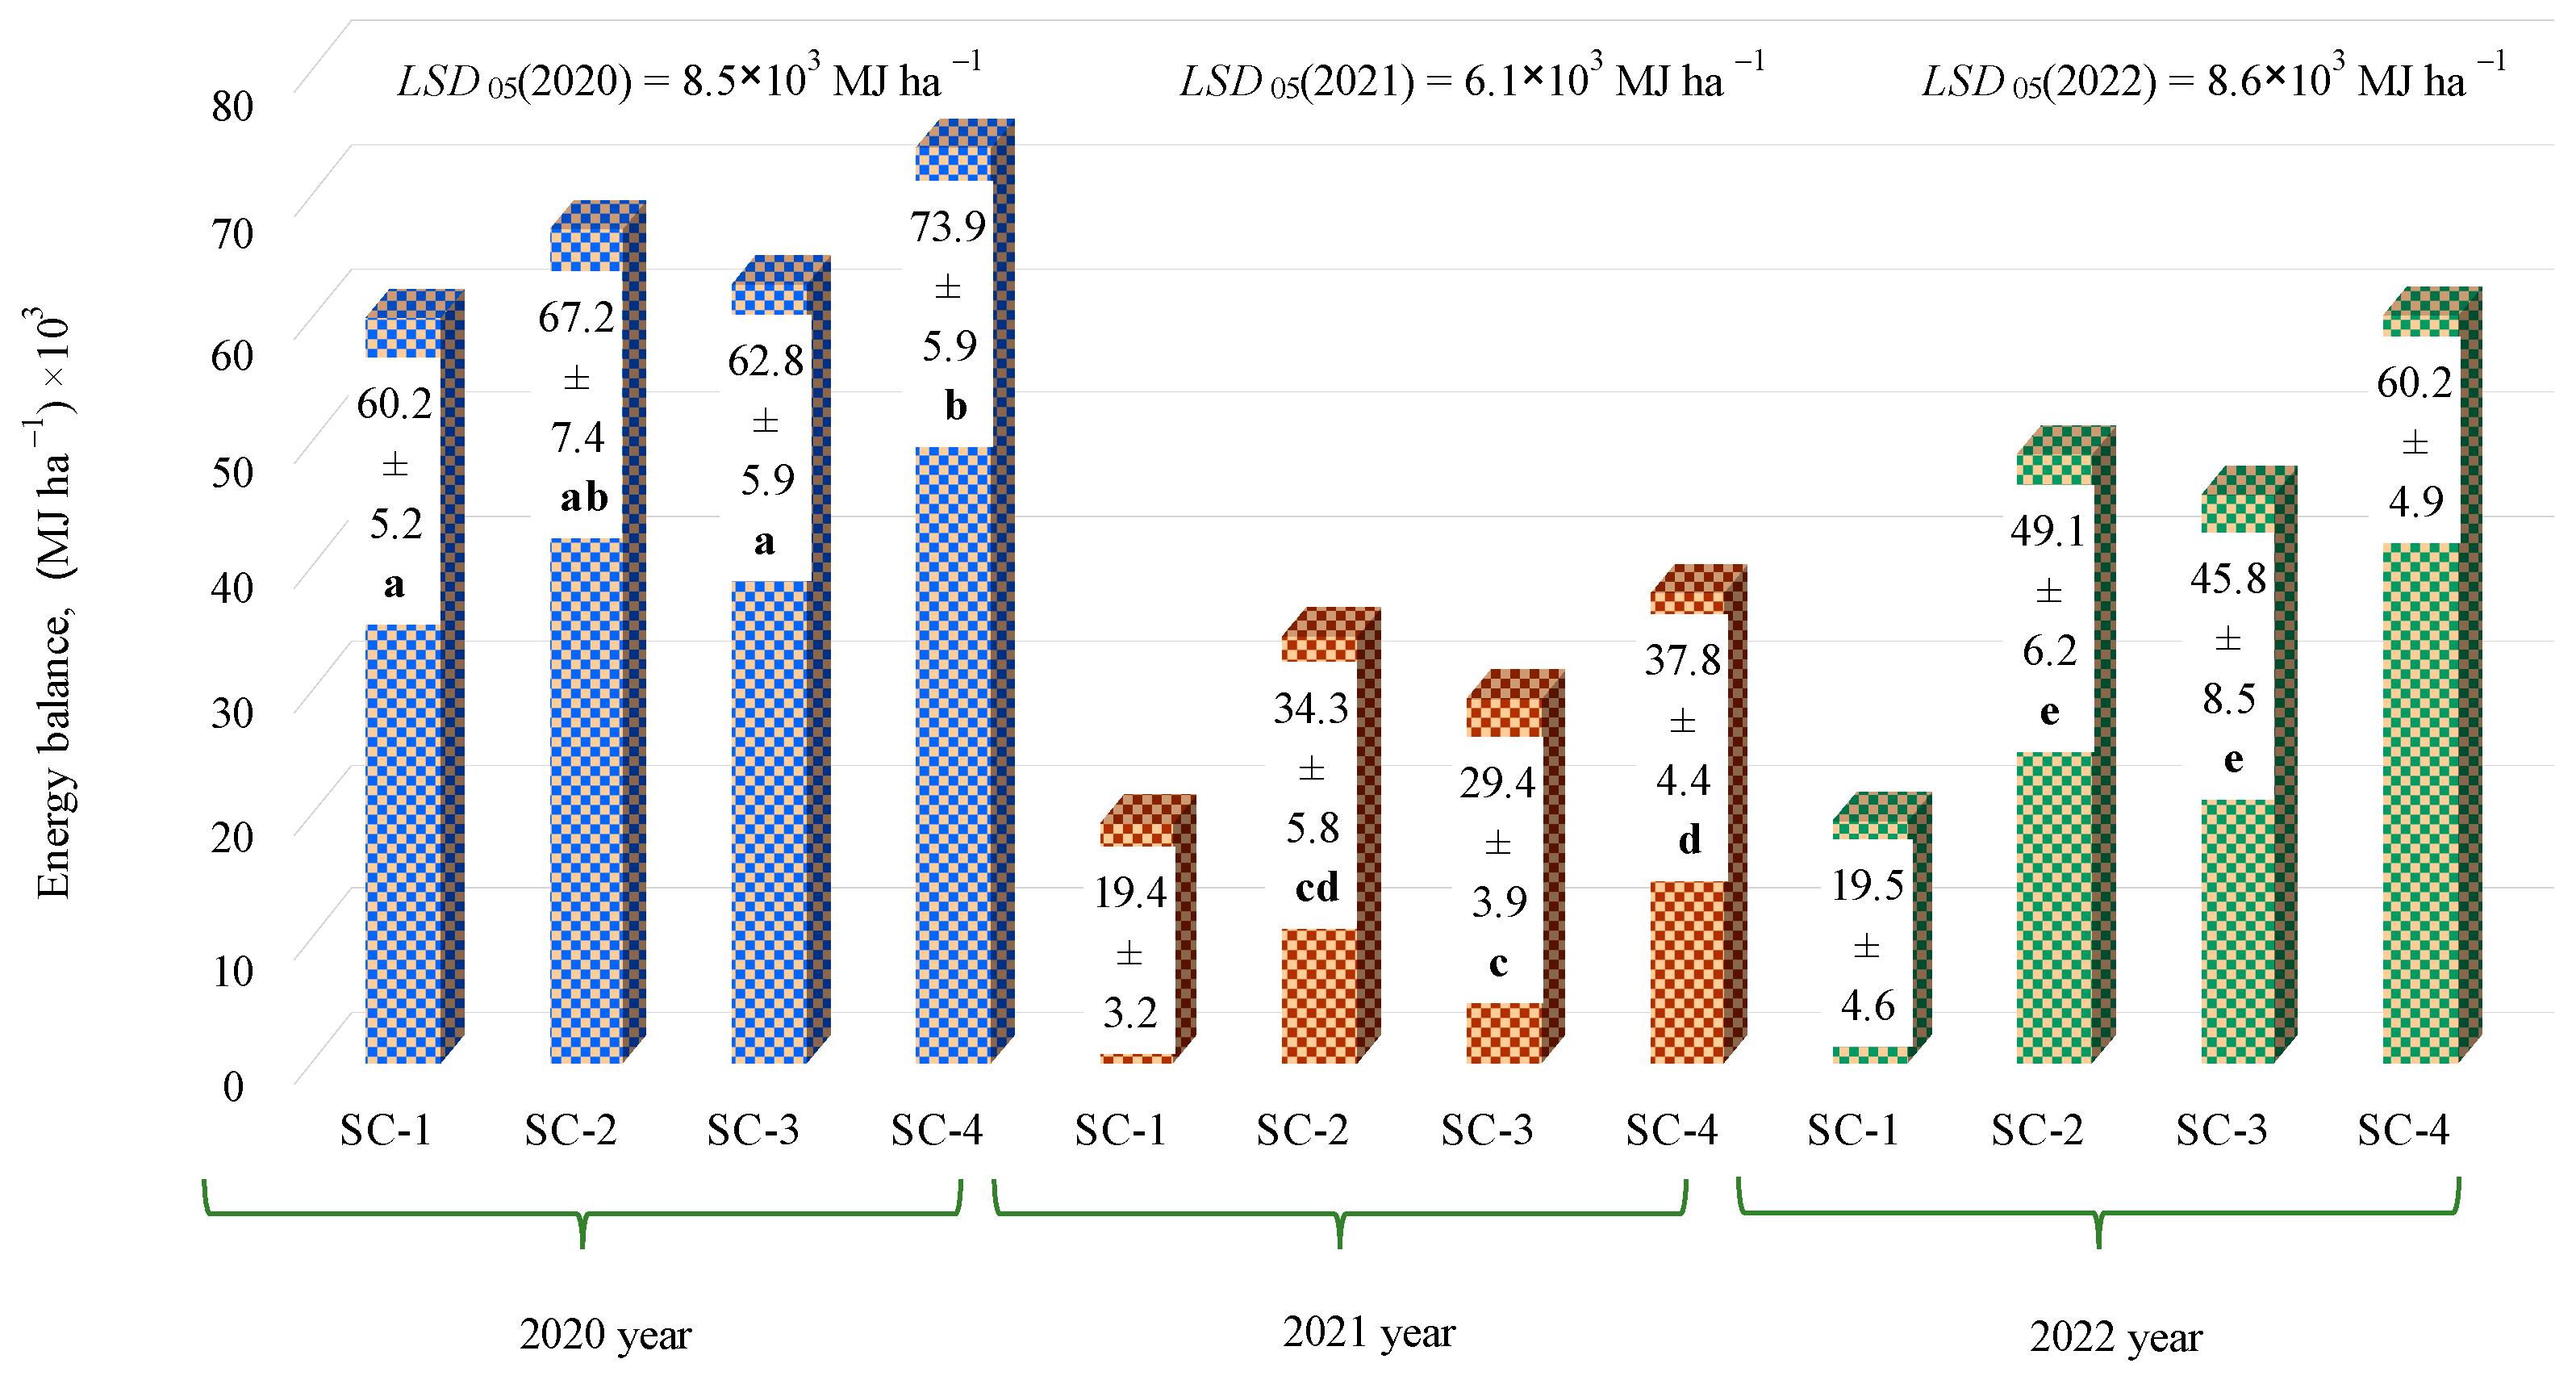
3.2. Energy Assessment

Assessment of the energy output flow, which reflects the results of the 2020–2022 grain harvest, for spring barley cultivation under different fertilization strategies showed the highest change in the energy output flow in the third year of the study, comparing the control (SC–1) with the other SC variants (Figure 4).
In the third year analyzed, the effect of bacterial inoculant on energy output flow was higher in SC–4 (300 kg ha−1 of N5P20.5K36 enriched with bacterial inoculant) than in SC–3 (150 kg ha−1 of N5P20.5K36 enriched with bacterial inoculant) compared to the control (SC–1). The energy output flow was significantly higher in SC–4 (135%) compared to the control and in SC–2 (300 kg ha−1 N5P20.5K36) and SC–3 (100% and 86%, respectively).
The assessment of energy efficiency, which indicates the number of times more energy is produced by harvesting the crop that is used to produce it, for spring barley grown under different fertilization strategies showed the highest increase in energy efficiency (64%, 68%, and 92%) in the third study year when comparing the control (SC–1) with the other SCs (Figure 5). In the last year of the study, significantly less energy was used in SC–4 compared to SC–1, SC–2, and SC–3. This implies that the effect of the bacterial inoculant on energy efficiency was highest in SC–4. In the second year of the study, SC–4 also showed a significantly higher energy efficiency (36%) compared to the control (SC–1), but no significant difference was observed compared to the other two SC variants.
In terms of energy productivity, the highest increase (94%) was observed in the third study year in SC–4 compared to the control (SC–1) (Figure 6). In that year, SC–4 (300 kg ha−1 N5P20.5K36 enriched with bacterial inoculant) showed a significant increase compared to both the control (SC–1) and the other two SC treatments (300 kg ha−1 N5P20.5K36 enriched with bacterial inoculant and 150 kg ha−1 N5P20.5K36 enriched with bacterial inoculant). Energy productivity is an important indicator of the weight of grain produced per MJ of energy consumed. A higher change in the energy productivity index in SC–4 indicates lower energy consumption and lower costs. In the second year of the study, the energy productivity was lower compared to the third and the first year, but a significant change in energy productivity was observed for the control (SC–1) compared to the other SC variants, while there was no significant change among the other SCs. In the first year analyzed, no significant differences between the variants were observed.
The specific energy, which is the amount of MJ of energy consumed by the different barley cultivation technologies to produce one kg of barley grain, had the best result in the third year of the study, SC–4, which showed the highest reduction (53%) in specific energy compared to the control (Figure 7). This means that without increasing the fertilizer rate and enriching the fertilizer with a bacterial inoculant, less energy is consumed to produce one kilogram of output. In the third year of the study, a 42% and 38% reduction in specific energy was observed in SC–2 and SC–3 compared to the control (SC–1). In the first year of the study, no significant difference was found between all the variants tested, whereas in the second year, no significant difference was found between SC–1 and SC–2 and between SC–2, SC–3, and SC–4. In the first and second years of the study, SC–1 had the highest specific energy due to low yields, although the energy input per hectare was the lowest compared to the other SCs.
When spring barley was grown with different fertilizer strategies, the best result was obtained in the third year of the study when the complex fertilizer was enriched with a biological inoculant, as the energy balance was found to be up to three times higher in the SC–4 (300 kg ha−1 of N5P20.5K36 enriched with a bacterial inoculant) compared to the control (SC–1). Then, in the first and second years of the study, it was 1.2 and 1.8 times higher, respectively (Figure 8). In the third year of the study, a significant difference was found in SC–4 compared to SC–2, indicating that maintaining the same fertilizer rate and enriching it with a bacterial inoculant resulted in a positive effect on soil nutrient content and yield in the long term at low energy inputs. In the second and third years of the study, the energy balance of SC–1 was significantly lower than in the first year, due to the lack of crop rotation and the resulting soil degradation (phosphorus and potassium fertilizer deficiency).
Moreover, in all three study years, no significant difference was found between SC–2 (300 kg ha−1 N5P20.5K36) and SC–3 (150 kg ha−1 N5P20.5K36 enriched with bacterial inoculant), which means that doubling the amount of fertilizer and enriching it with a bacterial inoculant (in SC–3) results in a similar energy balance to that of SC–2 (300 kg ha−1 N5P20.5K36).

3.3. Fertilizer Efficiency Studies

In the experimental studies (2020–2022) of different spring barley cultivation/fertilization technologies (Figure 9), the highest nitrogen fertilizer efficiency was found in the third year of the studies, comparing SC–2, SC–3, and SC–4 with the control SC–1 (Ntot 68.8 kg ha−1). About 65% higher efficiency was obtained for SC–2 (Ntot 83.8 kg ha−1), about 67% for SC–3 (Ntot 76.3 kg ha−1 enriched with bacterial inoculant) and about 93% for SC–4 (Ntot 83.8 kg ha−1 enriched with bacterial inoculant). In the third year analyzed, SC–4 showed significantly higher nitrogen fertilizer efficiency compared to the other technologies. In the first year analyzed, no significant differences between the variants were observed. In the second year analyzed, the control variant SC–1 was significantly less efficient compared to the three other variants. However, no significant differences were found between variants SC–2, SC–3, and SC–4. The three-year study showed a positive influence of the bacterial inoculant on the efficiency of nitrogen fertilizer in spring barley cultivation, as in 2022, SC–3 produced a yield of spring barley similar to that of SC–2, using a nitrogen fertilizer application rate of 7.5 kg ha−1 lower than that of SC–2 and enriched with the bacterial inoculant. In SC–4, maintaining the same nitrogen fertilizer rate as in SC–2, but enriching with a bacterial inoculant, significantly increased the fertilizer efficiency with a significantly higher yield (Table 1).
For the assessment of the effectiveness of phosphorus and potassium fertilizers, technology SC–1 (control) was not evaluated because it did not receive phosphorus and potassium fertilizers. The highest phosphorus fertilizer efficiency (Figure 10) was found in the first year analyzed in SC–3 (Ptot 30.8 kg ha−1 enriched with bacterial inoculant) compared to the other variants studied in the first, second, and third years analyzed. In the first year, the phosphorus fertilizer efficiency of SC–3 was significantly higher compared to SC–2 (Ptot 61.5 kg ha−1) and SC–4 (Ptot 61.5 kg ha−1 enriched with bacterial inoculant), with 86% and 72%, respectively. In the second and third years of the study, the phosphorus fertilizer efficiency of SC–3 was also significantly higher compared to SC–2 and SC–4. Comparing the efficiency of SC–3 phosphorus fertilizer in the first year of the study with SC–3 in the second and third years, the efficiency in the first year was found to be 77% and 28% higher, respectively.
For potassium fertilizer efficiency, a similar distribution of data was found (Figure 11) as for phosphorus fertilizer efficiency, and technology SC–1 (control) was not evaluated. The highest potassium fertilizer efficiency was found in the first year of the study in technology SC–3 (Ktot 54 kg ha−1 enriched with bacterial inoculant), which is significantly higher (86% and 72%, respectively) than in technologies SC–2 (Ktot 108 kg ha−1) and SC–4 (Ktot 108 kg ha−1 enriched with bacterial inoculant). In the second and third years analyzed, the potassium fertilizer efficiency of SC–3 was higher compared to SC–2 and SC–4 by 74% and 63% in the first year, respectively, and 85% and 56% in the second year, respectively.

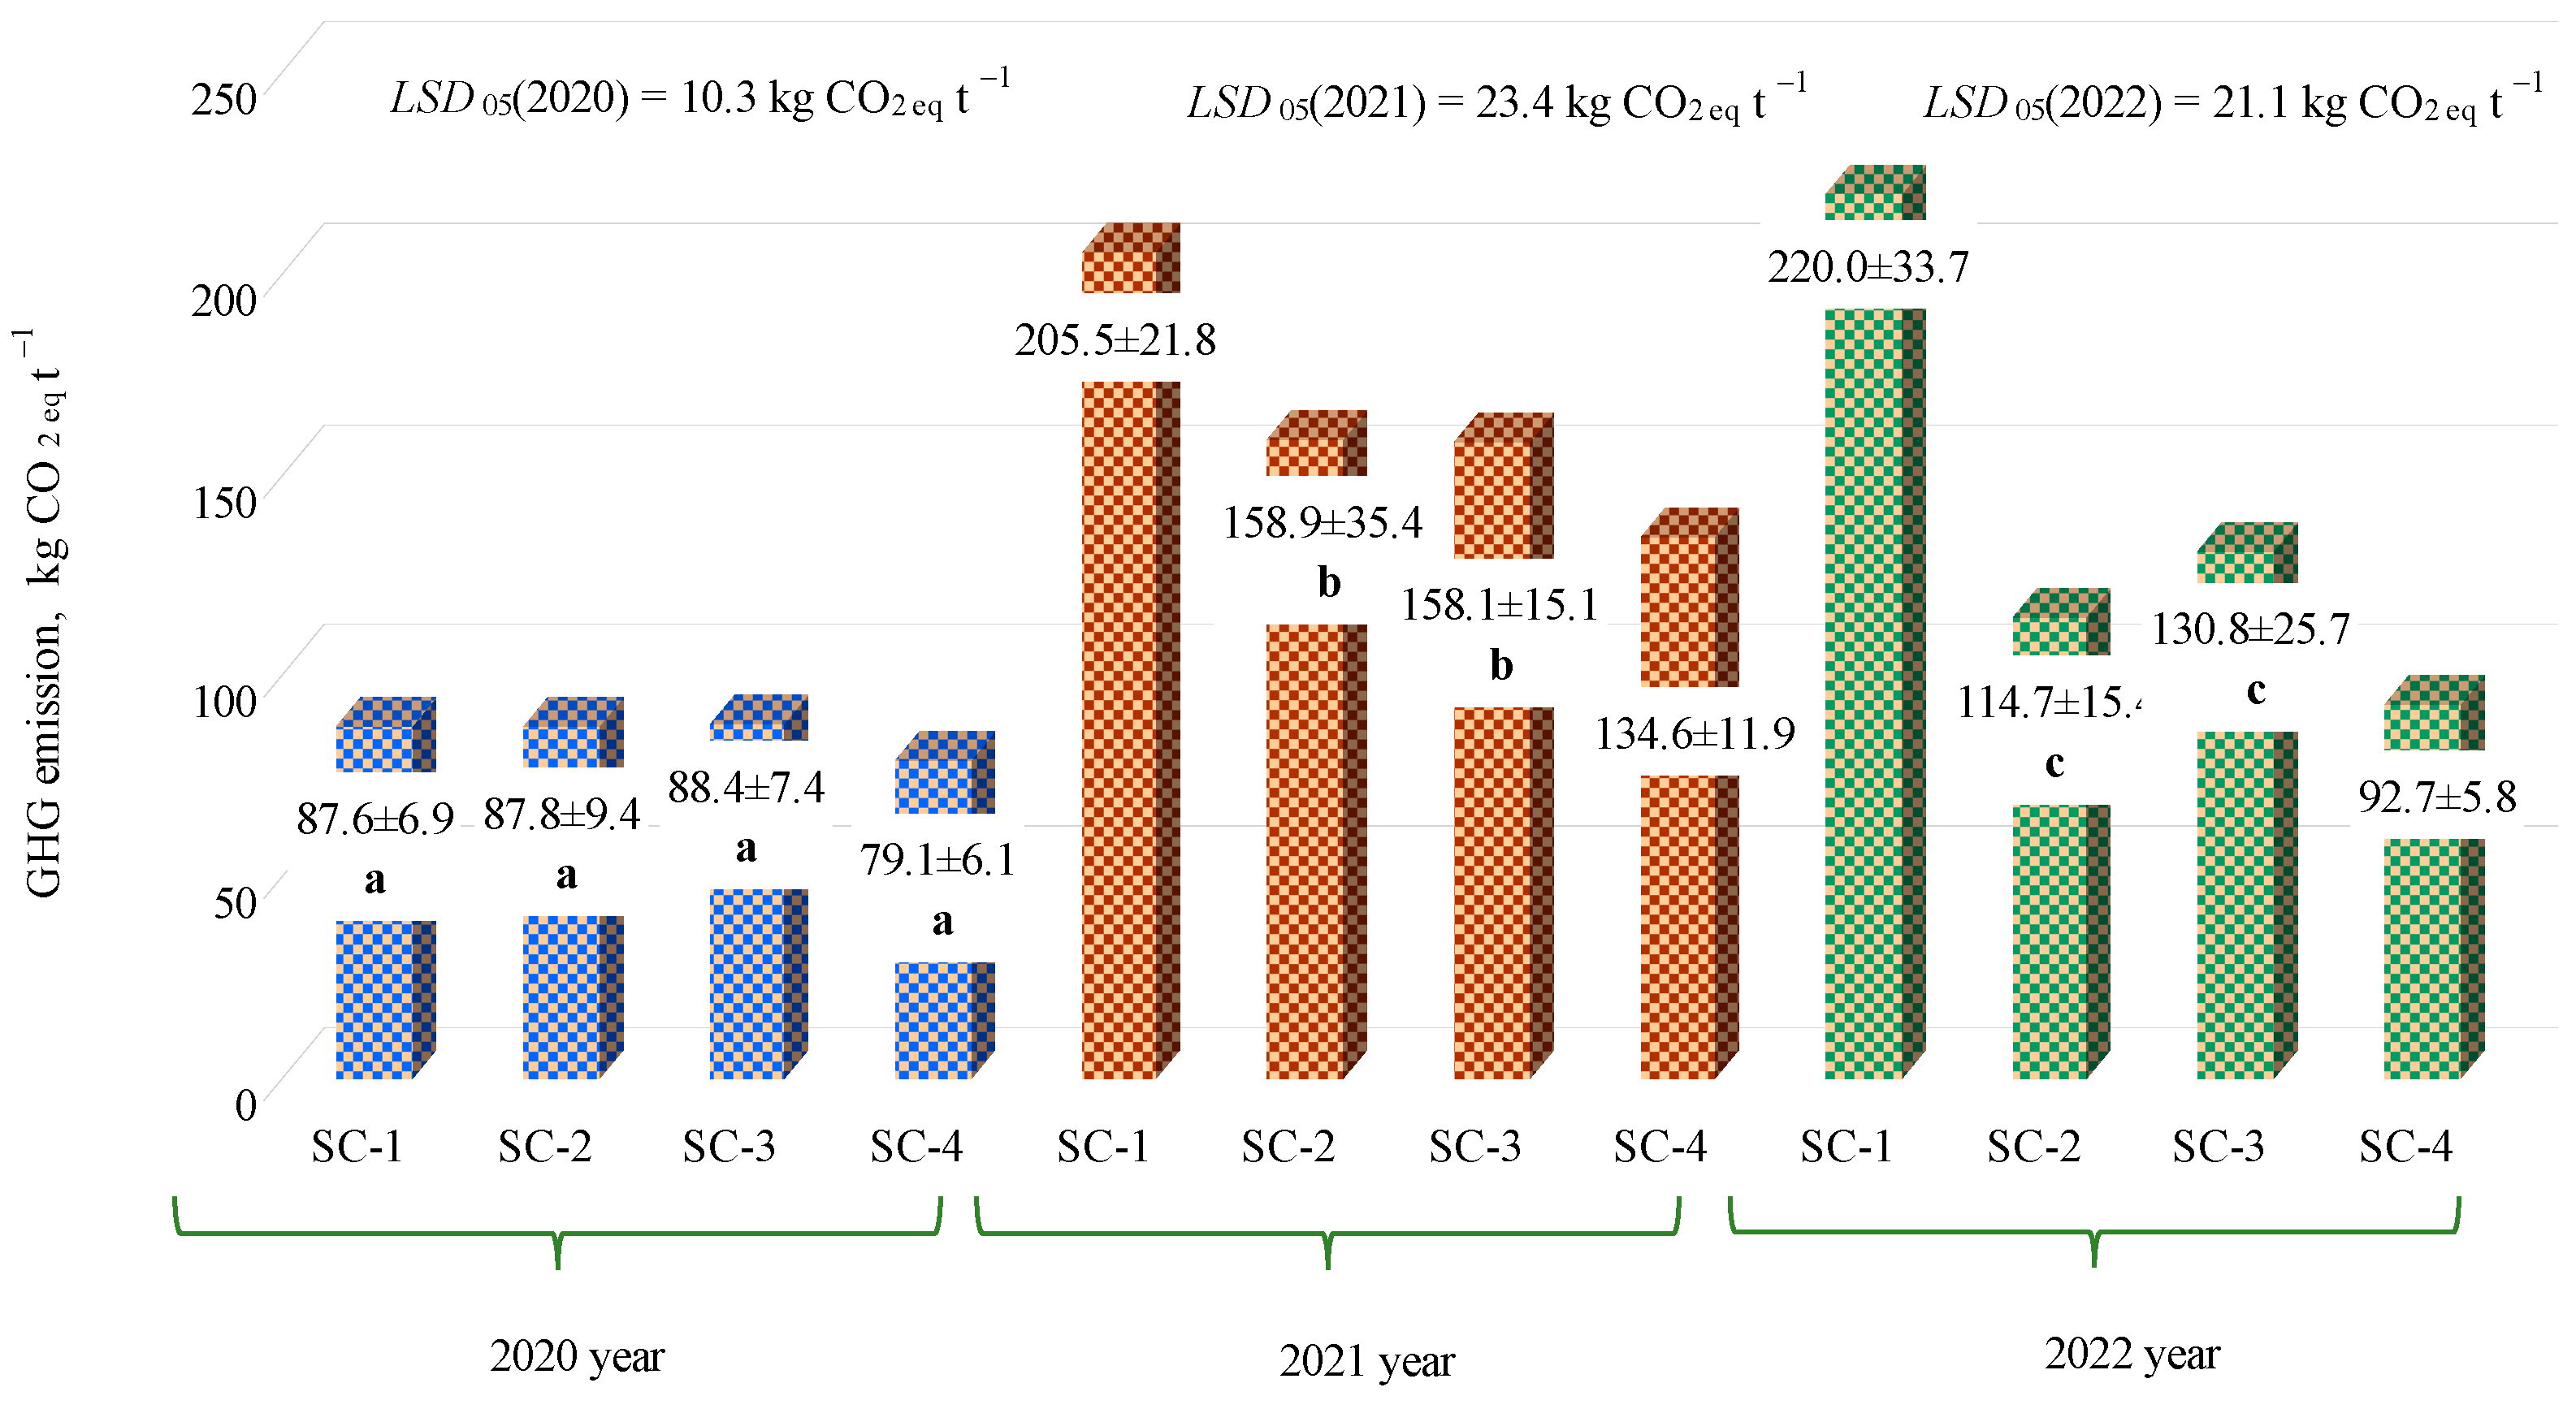
3.4. Environmental Assessment

GHG emissions (Figure 12) were lower in the first year of the study than in 2021 or 2022. In 2021 and 2022, the GHG emissions of the control (SC–1) were found to be significantly higher compared to the other three technologies (SC–2, SC–3, and SC–4). In 2021, the GHG emissions of the control (SC–1) were about 37% higher compared to SC–2 and SC–3. No significant difference was found when comparing SC–2 and SC–3 with each other. However, SC–4 had the significantly lowest GHG emissions (134.6 ± 11.9 kg CO2 eq t−1). The best result in 2022, compared to the other years analyzed, was the largest difference in GHG emissions between SC–2, SC–3, and SC–4 compared to the control. In the third year, the SC–1 technology showed the highest GHG emissions (220.0 ± 33.7 kg CO2 eq t−1) compared to 2020 and 2021. In the third year of the study, when comparing the SC variants, the GHG emissions of SC–4 (300 kg ha−1 N5P20.5K36 enriched with bacterial inoculant) were found to be significantly lower than those of SC–3 (150 kg ha−1 N5P20.5K36 enriched with bacterial inoculant) and SC–2 (300 kg ha−1 N5P20.5K36).

4. Discussion

Mineral fertilizers with phosphorus-releasing bacteria can play a key role in improving the efficiency of mineral fertilizers and reducing their environmental impact. It was, therefore, in this context that the aim was to consider how these bacteria can affect the growth of barley and what impact this can have on energy consumption and environmental protection.
Several research papers [24,29,53] have reported significant effects on the yield enhancement of different cereals. However, no large-scale data have been published on changes in energy output flow in barley or other cereal fertilization strategies using bacterial inoculants. Our results show that when spring barley was grown under different fertilization strategies, in the third year of the study, SC–4 (300 kg ha−1 N5P20.5K36 enriched with bacterial inoculant) had the highest positive effect of bacterial inoculant on energy output flow, which is reflected in yield results. Furthermore, when considering energy efficiency, which refers to the number of times more energy produced by the harvest than the energy used to produce it, the positive effect of the bacterial inoculant on the energy efficiency flow was also the highest in the third year of the study of SC–4. It was also found by the researchers in Ahmad et al. [29], who highlighted that impregnation of mineral fertilizers with plant-growth-promoting bacteria increased the subsequent fertilizer efficiency, which resulted in lower energy consumption in the later periods of wheat cultivation. Fertilizer use efficiency and a lower inorganic fertilizer (NPK) rate (10–26%) were also highlighted in a study by Phares et al. [13] when growing maize and incorporating mixed bacterial cultures with biochar (1500 kg ha−1). The research found a higher positive change in the energy productivity index in the third year of the study in SC–4 compared to the other SCs. This result shows that SC–4 has a lower energy consumption and lower costs than other SCs. The results of other researchers on energy productivity differ. Looking at the results of our study, Jat et al. [54] report a similar finding, with a much higher increase, but in this case, the efficiency of the technology is expressed in terms of net return or change in the input–output ratio, which ranged from a factor of 2.14 to a factor of 2.44, which is more than 100%. Concerning the energy cost of fertilizer use in agriculture, in a multicrop technology study, the research by Chamsing et al. [55] highlighted that the energy cost for the sugar cane cultivation process was 14.48–18.65 GJ ha−1, for irrigated rice—1.79–18.49 GJ ha−1, for rainfed rice—10.09–13.11 GJ ha−1, for maize—9.79–12.79 GJ ha−1, for wet season soybean—5.21–10.03 GJ ha−1, for cassava—4.95–9.13 GJ ha−1, and dry season soybean—5.31 and 7.86 GJ ha−1. Out of all these, the most energy was used for fertilizer, given that the energy equivalent of producing nitrogen (N), phosphorus (P), and potassium (K) is 78.1 MJ kg−1, 17.4 MJ kg−1, and 13.7 MJ kg−1, respectively. Thus, this factor increases costs. Studies by Egle and Mendoza [56] showed that 150 kg ha−1 and 300 kg ha−1 fertilized reeds increased energy consumption by 38–70%, which was mainly due to the high energy costs incurred in the production and transport of N fertilizer (2.15 l diesel oil equivalent kg−1 N). The highest energy efficiency was achieved with no N fertilizer and the lowest energy balance was achieved with N fertilizer 300 kg ha−1 (+Bio-N®). Therefore, Egle and Mendoza [56] argued that any increase in fertilizer prices will have a minimal impact on energy efficiency when N fertilizer is reduced.
The results of our research show that in the second and third years of the study, without increasing the fertilizer content and with the addition of a bacterial inoculant, less energy is used to grow one kilogram of production. The results of the energy balance in the third year show that maintaining the same fertilizer rate and enriching it with a bacterial inoculant has a positive effect on soil nutrient content and yield in the long term, with low energy input from its application. Phosphate-solubilizing bacteria improved plant nutrition by solubilizing insoluble phosphorus compounds in the soil, thus improving plant growth of barley and increasing the yield. There was a sufficient amount of available macronutrients for the plants. Plant-growth-promoting rhizobacteria improve the growth and yield of cereal crops, especially under nutrient-deficient conditions. However, the mechanisms underlying plant growth may vary not only between growing conditions and crop management but also between plant and bacterial species, and nutrient amounts in the soil. Other scientific studies state that the highest wheat grain yield was following the application of mineral fertilization and the three microbial preparations in combination (Paenibacillus azotofixans, Bacillus megaterium, and Bacillus subtilis) and were 19.6% higher compared to mineral fertilization alone [57]. Researchers Adnan et al. [58] and Hye et al. [59] confirmed our results that the use of fertilizer and bacterial inoculants in crop production technologies not only reduces the fertilizer rate but also improves the energy balance and the energy efficiency of the crop system. In the study by Sarkar et al. [42], energy yield (26,370 and 26,630 MJ ha−1), energy balance (13,643 and 13,903 MJ ha−1), maximum gross return (16,030 and 13,877 USD ha−1), and net return (15,966 and 13,813 USD ha−1) were significantly higher in fertilized plants with reduced fertilizer rates of 75% NPK + T. harzianum and P. fluorescens.
The three-year study showed a positive effect of the bacterial inoculant on the efficiency of nitrogen fertilizer in spring barley cultivation. Maintaining the same nitrogen fertilizer rate, but enriching with a bacterial inoculant, significantly increased the fertilizer efficiency with a significantly higher yield. Microorganisms produce growth-promoting substances like auxins, cytokinins, and gibberellins, which stimulate root growth and development. These compounds can enhance root branching, elongation, and overall root system architecture, thereby increasing the plant’s ability to explore and exploit soil, fertilizers resources. Emami et al. [60] showed that in a wheat crop with 73+ 82+ M3 bacterial treatments, as much as 69.3% N uptake efficiency and as much as 48.9% N application efficiency of chemical fertilizers were achieved. According to Çağlar and Bulut [61], studies show that the use of combined fertilization with beneficial bacteria can reduce the amount of N and P fertilizers by at least half. It is worth mentioning that the emphasis is not only on efficiency through reduced fertilizer consumption but also on improved yield quality parameters of barley grain [54,60]. The best phosphorus and potassium fertilizer efficiency were found in all years of the study in SC–3 (Ptot 30.8 kg ha−1 enriched with bacterial inoculant and Ktot 54 kg ha−1 enriched with bacterial inoculant) compared to SC–2 (Ptot 61.5 kg ha−1; Ktot 108 kg ha−1) and SC–4 (Ptot 61.5 kg ha−1 enriched with bacterial inoculant and Ktot 108 kg ha−1 enriched with bacterial inoculant). Phosphorus and potassium availability in soils is usually low due to its fixation in poorly soluble minerals and is unavailable for plant uptake. Our phosphorus solubility studies show that treatment of complex mineral fertilizer (N5P20.5K36) with Bacillus megaterium or Bacillus mucilaginosus can increase the soluble phosphorus content by 29–71% (in 72 h). Increased crop productivity under the current study is the reflection of phosphorus and potassium minerals solubility. Microorganisms help solubilize otherwise insoluble nutrients in the soil, such as phosphorus locked up in mineral complexes. These bacteria produce organic acids, such as gluconic acid, citric acid, and oxalic acid, as well as phosphatase enzymes. Microorganisms, through such metabolic activities, can lower the pH of the soil immediately surrounding plant roots, creating a more acidic environment known as the rhizosphere. These microbial activities increase the availability of essential nutrients for plant uptake. The acidic conditions enhance the solubility of phosphate minerals, making phosphorus more available for plant uptake. These organic acids and enzymes break down the chemical bonds in phosphate minerals, releasing soluble phosphate ions (H2PO4 and HPO42−) into the soil solution. Several studies [62,63,64] show that phosphate-solubilizing microorganisms and arbuscular mycorrhizal fungi have improved P uptake by plants and increased the yield of many crops. Gang et al. [65] reported that barley seeds coated with bacteria showed higher N-use efficiency compared to control plants. It mainly increased the available phosphorus in the soil by about 99.51% and in the cultivated wheat by about 96.4%. The rhizosphere (plant root zone) provides a favorable environment for the reproduction and establishment of microorganisms by increasing the organic carbon content of the rhizosphere as a result of the various root wastes (dying root hairs, cortical cells, the lysis of plant-root cells), and of the organic compounds produced by the roots. They secrete amino, fatty, and organic acids as well as sugars, phenolics, vitamins, nucleotides, sterols, and plant growth regulators. The symbiotic and associative interactions between plant roots and microorganisms help plants to provide the necessary soluble nutrients and to assimilate them, thus having a positive effect on plant growth performance [66,67]. Chen et al.’s [68] research found that the bacterial inoculant, the composition of which consisted of Pantoea dispersa, effectively dissolved Ca3(PO4)2, FePO4, and AlPO4 compounds by releasing salicylate, benzene-acetic, and other organic acids, thus promoting the release of plant-available P. Other scientists state that plant growth-promoting bacteria, which are an excellent ecological tool for phosphate solubilization, have good soil moisture regulation properties, thus improving plant growth [69].
Three years of research showed that bacterial inoculant has a positive influence on the reduction in GHG emissions because the GHG emissions were found to be significantly lower using bacterial inoculants. From an environmental perspective, previous studies have estimated that 100 kg of fertilizer application causes 0.5 kg of N-eq. eutrophication [70]. Results from Calvo et al. [71] show that microbial inoculants can reduce N2O emissions after fertilizer application, depending on the type of N fertilizer used. In conclusion, it can be said that mineral fertilizers enriched with biological substances have a higher efficiency in spring barley growing technologies, and at the same time contribute to agricultural sustainability and environmental protection, reducing the potential negative impact of agricultural activities on ecosystems.

5. Conclusions

Laboratory studies on phosphorus solubility have shown that the treatment of complex mineral fertilizer (N5P20.5K36) with Bacillus megaterium or Bacillus mucilaginosus can increase the soluble phosphorus content by 29% to 71% (in 72 h).
Enrichment of complex mineral fertilizers with a bacterial inoculant increased fertilizer efficiency. At the same fertilization rate, i.e., comparing the SC–4 and SC–2 technologies, a yield increase of 4.0–12.9 kg of barley grain was obtained with 1 kg of phosphorus fertilizer.
The increase in fertilizer efficiency also resulted in a 10–23% increase in the energy balance of the spring barley technology when comparing the SC–2 and SC–4 technologies.
The bacterial inoculant also had a positive impact on reducing greenhouse gas emissions. The three-year study showed an average reduction of 18.3 kg CO2eq in GHG emissions compared to SC–4 and SC–2 technologies.
When tested on more nutrient-rich soils, the benefits of bacterial inoculants are likely to be lower due to the already sufficient nutrient content for the plants.

Author Contributions

Conceptualization, D.S. and J.A.; methodology, D.S., J.A., A.G. and E.Z.; software, J.A. and A.G.; validation, J.A. and D.S.; formal analysis, K.L., S.P. and D.S.; investigation, J.A., E.Z., S.P. and K.L.; resources, J.A.; data curation, D.S., A.G. and J.A.; writing—original draft preparation, K.L., S.P. and J.A.; writing—review and editing, K.L. and S.P.; visualization, J.A.; supervision, D.S. and K.L.; project administration, J.A.; funding acquisition, E.Z. All authors have read and agreed to the published version of the manuscript.

Funding

This research received no external funding.

Institutional Review Board Statement

Not applicable.

Data Availability Statement

The data presented in this study are available in the article.

Conflicts of Interest

The authors declare no conflicts of interest.

References

  1. Nguyen, S.N.; Beta, T. Polyamines in Canadian barley grains: Determination of their content and relationship with protein level. J. Cereal Sci. 2023, 114, 103781. [Google Scholar] [CrossRef]
  2. Official Statistics Portal. Available online: https://osp.stat.gov.lt/statistiniu-rodikliu-analize?indicator=S9R034#/ (accessed on 15 December 2023).
  3. Hussein, H.A.A. Influence of radio-grain priming on growth, antioxidant capacity, and yield of barley plants. Biotechnol. Rep. 2022, 34, e00724. [Google Scholar] [CrossRef] [PubMed]
  4. Griffey, C.; Brooks, W.; Kurantz, M.; Thomason, W.; Taylor, F.; Obert, D.; Moreau, R.; Flores, R.; Sohn, M.; Hicks, K. Grain composition of Virginia winter barley and implications for use in feed, food, and biofuels production. J. Cereal Sci. 2010, 51, 41–49. [Google Scholar] [CrossRef]
  5. Izydorczyk, M.S.; Edney, M. Barley: Grain-Quality Characteristics and Management of Quality Requirements. In Cereal Grains, 2nd ed.; Wrigley, C., Batey, I., Miskelly, D., Eds.; Woodhead Publishing: Cambridge, UK, 2017; pp. 195–234. [Google Scholar] [CrossRef]
  6. Cammarano, D.; Basso, B.; Holland, J.; Gianinetti, A.; Baronchelli, M.; Ronga, D. Modeling spatial and temporal optimal N fertilizer rates to reduce nitrate leaching while improving grain yield and quality in malting barley. Comput. Electron. Agric. 2021, 182, 105997. [Google Scholar] [CrossRef]
  7. Barłóg, P.; Grzebisz, W.; Łukowiak, R. Fertilizers and Fertilization Strategies Mitigating Soil Factors Constraining Efficiency of Nitrogen in Plant Production. Plants 2022, 11, 1855. [Google Scholar] [CrossRef] [PubMed]
  8. Osman, K.T. Plant Nutrients and Soil Fertility Management. In Soils: Principles, Properties and Management; Springer: Dordrecht, The Netherlands, 2013; pp. 129–159. [Google Scholar]
  9. Rawat, P.; Sharma, A.; Shankhdhar, D.; Shankhdhar, S.C. Improvement of phosphorus uptake, phosphorus use efficiency, and grain yield of upland rice (Oryza sativa L.) in response to phosphate-solubilizing bacteria blended with phosphorus fertilizer. Pedosphere 2022, 32, 752–763. [Google Scholar] [CrossRef]
  10. Jovarauskas, D.; Steponavičius, D.; Kemzūraitė, A.; Zinkevičius, R.; Venslauskas, K. Comparative analysis of the environmental impact of conventional and precision spring wheat fertilization under various meteorological conditions. J. Environ. Manag. 2021, 296, 113150. [Google Scholar] [CrossRef]
  11. Rivera, X.C.S.; Bacenetti, J.; Fusi, A.; Niero, M. The influence of fertiliser and pesticide emissions model on life cycle assessment of agricultural products: The case of Danish and Italian barley. Sci. Total Environ. 2017, 592, 745–757. [Google Scholar] [CrossRef]
  12. Tricase, C.; Amicarelli, V.; Lamonaca, E.; Rana, R. Economic analysis of the barley market and related uses. In Grasses as Food and Feed, 2nd ed.; Tadele, Z., Ed.; IntechOpen: London, UK, 2018; Volume 10, pp. 25–46. [Google Scholar] [CrossRef]
  13. Phares, C.A.; Amoakwah, E.; Danquah, A.; Afrifa, A.; Beyaw, L.R.; Frimpong, K.A. Biochar and NPK fertilizer co-applied with plant growth promoting bacteria (PGPB) enhanced maize grain yield and nutrient use efficiency of inorganic fertilizer. J. Agric. Food Res. 2022, 10, 100434. [Google Scholar] [CrossRef]
  14. Khan, M.N.; Mobin, M.; Abbas, Z.K.; Alamri, S.A. Fertilizers and Their Contaminants in Soils, Surface and Groundwater. In Encyclopedia of the Anthropocene, 2nd ed.; DellaSala, D.A., Goldstein, M.I., Eds.; Elsevier Inc.: Oxford, UK, 2018; Volume 5, pp. 225–240. [Google Scholar]
  15. Amundson, R.; Berhe, A.A.; Hopmans, J.W.; Olson, C.; Sztein, A.E.; Sparks, D.L. Soil and human security in the 21st century. Science 2015, 348, 1261071. [Google Scholar] [CrossRef]
  16. Huang, J.; Xu, C.C.; Ridoutt, B.G.; Wang, X.C.; Ren, P.A. Nitrogen and phosphorus losses and eutrophication potential associated with fertilizer application to cropland in China. J. Clean. Prod. 2017, 159, 171–179. [Google Scholar] [CrossRef]
  17. Ministry of Agriculture of the Republic of Lithuania. Available online: https://zum.lrv.lt/lt/zaliasis-kursas (accessed on 15 December 2023).
  18. Compant, S.; Clément, C.; Sessitscha, A. Plant growth-promoting bacteria in the rhizo-and endosphere of plants: Role, colonization, mechanisms involved and prospects for utilization. Soil Biol. Biochem. 2010, 42, 669–678. [Google Scholar] [CrossRef]
  19. Santoyo, G.; Moreno-Hagelsiebb, G.; Orozco-Mosqueda, M.C.; Glick, B. Plant growth-promoting bacterial endophytes. Microbiol. Res. 2016, 183, 92–99. [Google Scholar] [CrossRef] [PubMed]
  20. Gouda, S.; Kerry, R.G.; Das, G.; Paramithiotis, S.; Shin, H.S.; Patra, J.K. Revitalization of plant growth promoting rhizobacteria for sustainable development in agriculture. Microbiol. Res. 2018, 206, 131–140. [Google Scholar] [CrossRef] [PubMed]
  21. Kumar, A.; Singh, V.K.; Tripathi, V.; Singh, P.P.; Singh, A.K. Plant growth-promoting rhizobacteria (PGPR): Perspective in agriculture under biotic and abiotic stress. In Crop Improvement through Microbial Biotechnology, 2nd ed.; Prasad, R., Gill, S.S., Tuteja, N., Eds.; Elsevier Inc.: Oxford, UK, 2018; pp. 333–342. [Google Scholar]
  22. Barrow, N.; Lambers, H. Phosphate-solubilising microorganisms mainly increase plant phosphate uptake by effects of pH on root physiology. Plant Soil 2022, 476, 397–402. [Google Scholar] [CrossRef]
  23. Alzoubi, M.M.; Gaibore, M. The effect of phosphate solubilizing bacteria and organic fertilization on availability of Syrian rock phosphate and increase of triple superphosphate efficiency. World J. Agric. Sci. 2012, 8, 473–478. [Google Scholar] [CrossRef]
  24. Ribaudo, C.; Zaballa, J.I.; Golluscio, R. Effect of the Phosphorus-Solubilizing Bacterium Enterobacter Ludwigii on Barley Growth Promotion. Am. Sci. Res. J. Eng. Technol. Sci. 2020, 63, 144–157. [Google Scholar]
  25. Bargaz, A.; Lyamlouli, K.; Chtouki, M.; Zeroual, Y.; Dhiba, D. Soil Microbial Resources for Improving Fertilizers Efficiency in an Integrated Plant Nutrient Management System. Front. Microbiol. 2018, 9, 1606. [Google Scholar] [CrossRef]
  26. Batool, S.; Iqbal, A. Phosphate solubilizing rhizobacteria as alternative of chemical fertilizer for growth and yield of Triticum aestivum (Var. Galaxy 2013). Saudi J. Biol. Sci. 2019, 26, 1400–1410. [Google Scholar] [CrossRef]
  27. Franco-Correa, M.; Quintana, A.; Duque, C.; Suarez, C.; Rodríguez, M.X.; Barea, J.M. Evaluation of actinomycete strains for key traits related with plant growth promotion and mycorrhiza helping activities. Appl. Soil Ecol. 2010, 45, 209–217. [Google Scholar] [CrossRef]
  28. Mahanta, D.; Rai, R.K.; Dhar, S.; Varghese, E.; Raja, A.; Purakayastha, T.J. Modification of root properties with phosphate solubilizing bacteria and arbuscular mycorrhiza to reduce rock phosphate application in soybean-wheat cropping system. Ecol. Eng. 2018, 111, 31–43. [Google Scholar] [CrossRef]
  29. Ahmad, A.; Imran, M.; Hussain, S.; Mahmood, S.; Houssein, S. Bacterial impregnation of mineral fertilizers improves yield and nutrient use efficiency of wheat. J. Sci. Food Agric. 2017, 97, 3685–3690. [Google Scholar] [CrossRef] [PubMed]
  30. Anušauskas, J.; Steponavičius, D.; Romaneckas, K.; Lekavičienė, K.; Zaleckas, E.; Sendžikienė, E. The Influence of Bacteria-Inoculated Mineral Fertilizer on the Productivity and Profitability of Spring Barley Cultivation. Plants 2023, 12, 1227. [Google Scholar] [CrossRef] [PubMed]
  31. Wang, L.; Zhang, H.; Xu, C.; Yuan, J.; Xu, X.; Jidong, J.; Zhang, Y. Long-term nitrogen fertilization and sweet potato cultivation in the wheat-sweet potato rotation system decrease alkaline phosphomonoesterase activity by regulating soil phoD-harboring bacteria communities. Sci. Total Environ. 2023, 900, 165916. [Google Scholar] [CrossRef] [PubMed]
  32. Estrada-Bonilla, G.A.; Durrer, A.; Cardoso, E.J. Use of compost and phosphate-solubilizing bacteria affect sugarcane mineral nutrition, phosphorus availability, and the soil bacterial community. Appl. Soil Ecol. 2021, 157, 103760. [Google Scholar] [CrossRef]
  33. Romaneckas, K.; Pilipavičius, V.; Trečiokas, K.; Šarauskis, E.; Liakas, V. Agronomy Basics; Aleksandras Stulginskis University: Akademija, Lithuania, 2017; pp. 403–405. [Google Scholar]
  34. Nautiyal, C.S. An efficient microbiological growth medium for screening phosphate solubilizing microorganisms. FEMS Microbiol. Lett. 1999, 170, 265–270. [Google Scholar] [CrossRef] [PubMed]
  35. Mousavi-Avval, S.H.; Mohammadi, A.; Rafiee, S.; Tabatabaeefar, A. Assessing the technical efficiency of energy use in different barberry production systems. J. Clean. Prod. 2012, 27, 126–132. [Google Scholar] [CrossRef]
  36. Šiaudinis, G.; Jasinskas, A.; Šarauskis, E.; Steponavičius, D.; Karčiauskienė, D.; Liaudanskienė, I. The assessment of Virginia mallow (Sida hermaphrodita Rusby) and cup plant (Silphium perfoliatum L.) productivity, physicoemechanical properties and energy expenses. Energy 2015, 93, 606–612. [Google Scholar] [CrossRef]
  37. Mohammadi, A.; Tabatabaeefar, A.; Shahin, S.; Rafiee, S.; Keyhani, A. Energy use and economical analysis of potato production in Iran a case study: Ardabil province. Energy Convers. Manag. 2008, 49, 3566–3570. [Google Scholar] [CrossRef]
  38. Ozkan, B.; Akcaoz, H.; Fert, C. Energy input-output analysis in Turkish agriculture. Renew. Energy 2004, 29, 39–51. [Google Scholar] [CrossRef]
  39. Šarauskis, E.; Buragienė, S.; Masilionytė, L.; Romaneckas, K.; Avižienytė, D.; Sakalauskas, A. Energy balance, costs and CO2 analysis of tillage technologies in maize cultivation. Energy 2014, 69, 227–235. [Google Scholar] [CrossRef]
  40. Yilmaz, I.; Akcaoz, H.; Ozkan, B. An analysis of energy use and input costs for cotton production in Turkey. Renew. Energy 2005, 30, 145–155. [Google Scholar] [CrossRef]
  41. Deike, S.; Pallutt, B.; Christen, O. Investigations on the energy efficiency of organic and integrated farming with specific emphasis on pesticide use intensity. Eur. J. Agron. 2008, 28, 461–470. [Google Scholar] [CrossRef]
  42. Sarkar, D.; Sankar, A.; Devika, O.S.; Singh, S.; Shikha; Parihar, M.; Rakshit, A.; Sayyed, R.Z.; Gafur, A.; Ansari, M.J.; et al. Optimizing nutrient use efficiency, productivity, energetics, and economics of red cabbage following mineral fertilization and biopriming with compatible rhizosphere microbes. Sci. Rep. 2021, 11, 15680. [Google Scholar] [CrossRef] [PubMed]
  43. Pellizzi, G. Use of energy and labour in Italian agriculture. J. Agric. Eng. Res. 1992, 52, 111–119. [Google Scholar] [CrossRef]
  44. Mandal, K.G.; Saha, K.P.; Ghosh, P.K.; Hati, K.M.; Bandyopadhyay, K.K. Bioenergy and economic analysis of soybean-based crop production systems in central India. Biomass Bioenergy 2002, 23, 337–345. [Google Scholar] [CrossRef]
  45. Lal, R. Carbon emission from farm operations. Environ. Int. 2004, 30, 981–990. [Google Scholar] [CrossRef]
  46. Khoshnevisan, B.; Rafiee, S.; Omid, M.; Mousazadeh, H. Reduction of CO2 emission by improving energy use efficiency of greenhouse cucumber production using DEA approach. Energy 2013, 55, 676–682. [Google Scholar] [CrossRef]
  47. Pishgar-Komleh, S.H.; Omid, M.; Heidari, M.D. On the study of energy use and GHG (greenhouse gas) emissions in greenhouse cucumber production in Yazd province. Energy 2013, 59, 63–71. [Google Scholar] [CrossRef]
  48. Moghimi, M.R.; Pooya, M.; Mohammadi, A. Study on energy balance, energy forms and greenhouse gas emission for wheat production in Gorve city, Kordestan province of Iran. Eur. J. Exp. Biol. 2014, 4, 234–239. [Google Scholar]
  49. Biograce. Available online: https://biograce.net/content/ghgcalculationtools/standardvalues (accessed on 20 December 2023).
  50. Gong, H.; Li, J.; Sun, M.; Xu, X.; Ouyang, Z. Lowering carbon footprint of wheat-maize cropping system in North China Plain: Through microbial fertilizer application with adaptive tillage. J. Clean. Prod. 2020, 268, 122255. [Google Scholar] [CrossRef]
  51. Soltani, A.; Maleki, M.H.M.; Zeinali, E. Optimal crop management can reduce energy use and greenhouse gases emissions in rainfed canola production. Int. J. Plant Prod. 2014, 8, 587–604. [Google Scholar]
  52. Olsson, U.; Engstrand, U.; Rupšys, P. Statistical Methods Using SAS and MINITAB; Lithuanian University of Agriculture: Akademija, Lithuania, 2000. [Google Scholar]
  53. Xiao, X.; Zhu, Y.; Gao, C.; Zhang, Y.; Gao, Y.; Zhao, Y. Microbial inoculations improved rice yields by altering the presence of soil rare bacteria. Microbiol. Res. 2022, 254, 126910. [Google Scholar] [CrossRef] [PubMed]
  54. Jat, M.L.; Chaplot, P.C.; Bairwa, D.D.; Meena, S.N.; Dhayal, B.C. Effects of integrated nutrient management on yield and economics of barley (Hordeum vulgare). Indian J. Agron. 2021, 66, 425–429. [Google Scholar] [CrossRef]
  55. Chamsing, A.; Salokhe, V.; Singh, G. Energy consumption analysis for selected crops in different regions of Thailand. Agric. Eng. Int. CIGR J. 2006, 8, 1–18. Available online: https://ecommons.cornell.edu/server/api/core/bitstreams/691025b4-51cf-4dc7-a499-4a0db060fa1e/content (accessed on 15 December 2023).
  56. Egle, R.B.; Mendoza, T.C. Energy Use of Sugarcane (Saccharum officinarum L.) Grown in Various Nutrient Supply Options. Philipp. J. Crop Sci. (PJCS) 2013, 38, 43–51. [Google Scholar]
  57. Stępień, A.; Wojtkowiak, K.; Kolankowska, E. Effect of Commercial Microbial Preparations Containing Paenibacillus azotofixans, Bacillus megaterium and Bacillus subtilis on the Yield and Photosynthesis of Winter Wheat and the Nitrogen and Phosphorus Content in the Soil. Appl. Sci. 2022, 12, 12541. [Google Scholar] [CrossRef]
  58. Adnan, M.; Fahad, S.; Zamin, M.; Shah, S.; Mian, I.A.; Danish, S.; Zafar-ul-Hye, M.; Battaglia, M.L.; Naz, R.M.M.; Saeed, B.; et al. Coupling Phosphate-Solubilizing Bacteria with Phosphorus Supplements Improve Maize Phosphorus Acquisition and Growth under Lime Induced Salinity Stress. Plants 2020, 9, 900. [Google Scholar] [CrossRef] [PubMed]
  59. Hye, M.Z.; Zahra, M.B.; Danish, S.; Abbas, M.; Rehim, A.; Akbar, M.N.; Iftikhar, A.; Gul, M.; Nazir, I.; Abid, M.; et al. Multi-strain inoculation with PGPR producing ACC deaminase is more effective than single-strain inoculation to improve wheat (Triticum aestivum) growth and yield. Phyton-Int. J. Exp. Bot. 2020, 89, 405–413. [Google Scholar] [CrossRef]
  60. Emami, S.; Alikhani, H.A.; Pourbabaei, A.A.; Etesami, H.; Zadeh, B.M.; Sarmadian, F. Improved growth and nutrient acquisition of wheat genotypes in phosphorus deficient soils by plant growth-promoting rhizospheric and endophytic bacteria. Soil Sci. Plant Nutr. 2018, 64, 719–727. [Google Scholar] [CrossRef]
  61. Çağlar, Ö.; Bulut, S. Determination of Efficiency Parameters of Barley Inoculated with Phosphorous-solubilizing and Nitrogen-fixing Bacteria. Gesunde Pflanz. 2023, 75, 1325–1333. [Google Scholar] [CrossRef]
  62. Khan, M.S.; Zaidi, A.; Ahemad, M.; Oves, M.; Wani, P.A. Plant growth promotion by phosphate solubilizing fungi—Current perspective. Arch. Agron. Soil Sci. 2010, 26, 73–98. [Google Scholar] [CrossRef]
  63. Wu, Y.; He, Y.; Yin, H.; Chen, W.; Wang, Z.; Xu, L.; Zhang, A. Isolation of phosphate-solubilizing fungus and its application in solubilization of rock phosphates. Pak. J. Biol. Sci. 2012, 15, 1144–1151. [Google Scholar] [CrossRef]
  64. Sawers, R.J.H.; Svane, S.F.; Quan, C.; Grønlund, M.; Wozniak, B.; Gebreselassie, M.N.; González-Muñoz, E.; Montes, R.A.C.; Baxter, I.; Goudet, J.; et al. Phosphorus acquisition efficiency in arbuscular mycorrhizal maize is correlated with the abundance of root-external hyphae and the accumulation of transcripts encoding PHT1 phosphate transporters. New Phytol. 2017, 214, 632–643. [Google Scholar] [CrossRef] [PubMed]
  65. Gang, S.; Sharma, S.; Saraf, M.; Buck, M.; Schumacher, J. Bacterial Indole-3-acetic acid influences soil nitrogen acquisition in barley and chickpea. Plants 2021, 10, 780. [Google Scholar] [CrossRef] [PubMed]
  66. Meena, V.S.; Meena, S.K.; Verma, J.P.; Kumar, A.; Aeron, A.; Mishra, P.K.; Dotaniya, M.L. Plant beneficial rhizospheric microorganism (PBRM) strategies to improve nutrients use efficiency: A review. Ecol. Eng. 2017, 107, 8–32. [Google Scholar] [CrossRef]
  67. Kumar, A.; Maurya, B.R.; Raghuwanshi, R.; Meena, V.S.; Tofazzal, I.M. Co-inoculation with Enterobacter and Rhizobacteria on yield and nutrient uptake by wheat (Triticum aestivum L.) in the alluvial soil under Indo-Gangetic Plain of India. J. Plant Growth Regul. 2017, 36, 608–617. [Google Scholar] [CrossRef]
  68. Chen, Y.; Fan, J.B.; Du, L.; Xu, H.; Zhang, Q.Y.; He, Y.Q. The application of phosphate solubilizing endophyte Pantoea dispersa triggers the microbial community in red acidic soil. Appl. Soil Ecol. 2014, 8, 235–244. [Google Scholar] [CrossRef]
  69. Zheng, B.X.; Zhang, D.P.; Wang, Y.; Hao, X.L.; Wadaan, M.A.; Hozzein, W.N.; Yang, X.R. Responses to soil pH gradients of inorganic phosphate solubilizing bacteria community. Sci. Rep. 2019, 9, 25. [Google Scholar] [CrossRef] [PubMed]
  70. Hasler, K.; Bröring, S.; Omta, S.W.F.; Olfs, H.W. Life cycle assessment (LCA) of different fertilizer product types. Eur. J. Agron. 2015, 69, 41–51. [Google Scholar] [CrossRef]
  71. Calvo, P.; Watts, D.B.; Kloepper, J.W.; Torbert, H.A. The influence of microbial-based inoculants on N2O emissions from soil planted with corn (Zea mays L.) under greenhouse conditions with different nitrogen fertilizer regimens. Can. J. Microbiol. 2016, 62, 1041–1056. [Google Scholar] [CrossRef]
Figure 1. Experimental plot arrangement.
Agriculture 14 00569 g001
Figure 2. The influence of the bacterial inoculant on the temporal variation of solution pH.
Agriculture 14 00569 g002
Figure 3. The influence of the bacterial inoculant application on the temporal variation of the released phosphorus concentration (mg L−1).
Agriculture 14 00569 g003
Figure 4. The influence of spring barley cultivation technology (SC) on energy obtained after grain harvest. The same letters (a, b, c, d, e) mean that there is no significant difference between scenarios in the same years. Error bars represent the 95% confidence interval of the mean. For statistical analysis, a t-test was used.
Agriculture 14 00569 g004
Figure 5. The influence of spring barley cultivation technology (SC) on energy use efficiency after grain harvest. The same letters (a, b, c) mean that there is no significant difference between scenarios in the same years. Error bars represent the 95% confidence interval of the mean. For statistical analysis, a t-test was used.
Agriculture 14 00569 g005
Figure 6. The influence of spring barley cultivation technology (SC) on energy use productivity after grain harvest. The same letters (a, b, c) mean that there is no significant difference between scenarios in the same years. Error bars represent the 95% confidence interval of the mean. For statistical analysis, a t-test was used.
Agriculture 14 00569 g006
Figure 7. The influence of spring barley cultivation technology (SC) on the specific energy produced after grain harvest. The same letters (a, b, c, d, e) mean that there is no significant difference between scenarios in the same years. Error bars represent the 95% confidence interval of the mean. For statistical analysis, a t-test was used.
Agriculture 14 00569 g007
Figure 8. The influence of spring barley cultivation technology (SC) on the balance of energy produced and consumed after grain harvest. The same letters (a, b, c, d, e) mean that there is no significant difference between scenarios in the same years. Error bars represent the 95% confidence interval of the mean. For statistical analysis, a t-test was used.
Agriculture 14 00569 g008
Figure 9. The influence of spring barley growing technology (SC) on the efficiency of nitrogen fertilizer use after grain harvest. The same letters (a, b, c) mean that there is no significant difference between scenarios in the same years. Error bars represent the 95% confidence interval of the mean. For statistical analysis, a t-test was used.
Agriculture 14 00569 g009
Figure 10. The influence of spring barley cultivation technology (SC) on the efficiency of phosphorus fertilizer use after grain harvest. The same letters (a, b, c) mean that there is no significant difference between scenarios in the same years. Error bars represent the 95% confidence interval of the mean. For statistical analysis, a t-test was used.
Agriculture 14 00569 g010
Figure 11. The influence of spring barley cultivation technology (SC) on the efficiency of potassium fertilizer application after grain harvest. The same letters (a, b, c) mean that there is no significant difference between scenarios in the same years. Error bars represent the 95% confidence interval of the mean. For statistical analysis, a t-test was used.
Agriculture 14 00569 g011
Figure 12. The influence of spring barley cultivation technology (SC) on greenhouse gas emissions after grain harvest. The same letters (a, b, c) mean that there is no significant difference between scenarios in the same years. Error bars represent the 95% confidence interval of the mean. For statistical analysis, a t-test was used.
Agriculture 14 00569 g012
Table 1. Different scenarios of spring barley cultivation technologies [30].
Cultivation TechnologiesFertilizer RateTotal Amount of Macroelement
At Sowing TimeAt BBCH 25–30Nitrogen
Ntot, kg ha−1
Phosphorus
Ptot, kg ha−1
Potassium
Ktot, kg ha−1
SC–1 (control)0.0200 kg ha−1 NH4NO3
N34.4
68.80.00.0
SC–2300 kg ha−1 N5P20.5K3683.861.5108.0
SC–3150 kg ha−1 N5P20.5K36 + 0.5 kg ha−1 bacteria76.330.854.0
SC–4300 kg ha−1 N5P20.5K36 + 0.5 kg ha−1 bacteria83.861.5108.0
Table 2. Meteorological conditions.
202020212022
k (mm)taverage (°C)k (mm)taverage (°C)k (mm)taverage (°C)
April46.933.76.238.46.2
May94.410.5121.711.48411.0
June99.319.040.319.577.617.7
July60.417.348.422.5100.518.0
August92.818.6122.216.438.720.9
Table 3. Dependence of barley grain yield weight on different spring barley cultivation technologies. The same letters (a, b, c) mean that there is no significant difference between scenarios in the same years [30].
Barley Grain Yield Weight g m−2
Cultivation Technology202020212022
SC–1 (control)520.9 ± 37.7 a229.4 ± 23.1230.5 ± 40.8
SC–2592.2 ± 53 bc357.8 ± 41.3 a462.85 ± 55.6 a
SC–3550.2 ± 42 ab311.4 ± 27.8428.5 ± 76.3 a
SC–4639.9 ± 42.2 c382.2 ± 31.8 a542.7 ± 44.5
t-testLSD05 (2020) = 60.4 g m−2LSD05 (2021) = 43.4 g m−2LSD05 (2022) = 61.4 g m−2
Table 4. Energy equivalents used for calculations.
InputsUnitsEnergy Equivalent (MJ per Unit)Source
1. Human laborh1.96[37,38,39,40]
2. Fuel inputsL47.8[35]
3. Machinerykg
(a) Tractors 93.61[35]
(b) Self-propelled machines, combine harvesters 87.63[35]
(c) Other machinery 62.7[35]
4. Chemicalskg
(a) Herbicides 151[36]
(b) Growth regulators 151[36]
(c) Fungicides 272.6[36]
(d) Insecticides 237[38,41]
5. Fertilizerskg
(a) Nitrogen 66.14[35,38]
(b) Phosphorus 12.44[35]
(c) Potassium 11.15[35,38]
6. Bacterial inoculantkg2.98[42]
7. Seedskg14[36]
Table 5. GHG emission factors for the inputs of spring barley production technology.
InputsEmission EquivalentUnitsSource
Fuel 2.76kg CO2eq L−1[46,51]
Machinery0.071kg CO2eq MJ−1[47,48]
Fertilizers:
N1.3kg CO2eq kg−1[45,46]
P0.2kg CO2eq kg−1[45,46]
K0.15kg CO2eq kg−1[45]
Pesticides
Herbicides6.3kg CO2eq L−1[45,46]
Insecticides5.1kg CO2eq L−1[45,46]
Fungicides3.9kg CO2eq L−1[45,46]
Seeds0.28kg CO2eq kg−1[49]
Bacterial inoculant4.3kg CO2eq kg−1[50]
Disclaimer/Publisher’s Note: The statements, opinions and data contained in all publications are solely those of the individual author(s) and contributor(s) and not of MDPI and/or the editor(s). MDPI and/or the editor(s) disclaim responsibility for any injury to people or property resulting from any ideas, methods, instructions or products referred to in the content.

