
Consumer Preferences in the Purchase of Agri-Food Products: Implications for the Development of Family Farms


1
Research Institute for Agriculture Economy and Rural Development, 010961 Bucharest, Romania
2
Biotechnology Department, National Institute of Research and Development for Biological Sciences, 060031 Bucharest, Romania
*
Author to whom correspondence should be addressed.
Agriculture 2023, 13(8), 1478; https://doi.org/10.3390/agriculture13081478
Submission received: 27 June 2023
/
Revised: 21 July 2023
/
Accepted: 21 July 2023
/
Published: 26 July 2023
(This article belongs to the Special Issue Sustainable Rural Development and Agri-Food Systems)
Abstract
:The purpose of this study was to investigate the preferences of Romanian consumers when purchasing agri-food products, with a focus on products from family farms, and to identify pathways for promoting family farms’ outputs for enhancing the development of rural areas and the local economy. For this, a survey was carried out using a questionnaire as the main tool. Firstly, the data collected were analysed from a descriptive point of view. Then, multiple linear regression and the chi-square test were used to determine the relationships between variables, and ANOVA was used to identify significant differences between groups. The results revealed that consumers with a higher level of education are more confident in certified products and are better informed, with a greater ability to distinguish certified from non-certified products through logos. Finally, the results indicate an opportunity for family farms to sell their products for a higher price within a secure market, mainly in urban areas. However, for this to happen, it is necessary to implement a quality scheme, highlighting the origin and originality of the product (product obtained from a family farm, including logo) coupled with awareness campaigns on the advantages that this product has, both for the consumer and the farmer or the region it comes from. These aspects could improve the development of rural areas from all points of view.
1. Introduction
In the history of agriculture, family farms have always been present and fundamental to the livelihood of rural communities. In the preindustrial period, a large proportion of farms were owned by families or rural communities, mostly subsistence farming was practiced, and food was for self-consumption. With the industrial revolution, family farms evolved towards commercialisation and specialised production was intended for markets [1,2]. This change was driven by the growing global demand for food and also by new technologies that increased productivity. During the Second World War, agriculture became increasingly industrialised, being characterised by mass production and advanced technologies. Family farms experienced a decline while rural populations migrated to the cities. Today, family farms play an important role in global agriculture and are a vital part of the economy for many countries. Products from family farms are known for their high quality, providing safe food for the consumer [3].
Worldwide, according to the FAO, family farms account for 90% of agricultural holdings and provide 80% of global food production [4]. Family farms are generally seen as more sustainable than larger farms, relying on natural fertilisers and crop rotation. They are more likely focused on quality, not quantity, of production but often depend on the farms’ direct-to-consumer sales for additional income as they typically have close ties to their local communities. Animal welfare is also a benefit of this type of farming, as animals are treated with respect and raised in open environments with natural food.
Environmentally friendly farming practices, animal welfare, and extensive farming are the main elements that consumers should take into account when they want to consume tasty and healthy products. Specialist knowledge and flexibility are two terms that characterise family farms. Flexibility makes it easier for farmers to adapt to the market needs and consumer requirements, leading to crop diversification [4]. Due to the hereditary model of family farms, specialised knowledge about crops, animals, and even the soil and climate specific to the rural area allows farmers to produce high-quality products and high yields [5].
Management of family farms is quite complex, involving the management of available resources, including land, animals, plants, machinery, and staff. To maintain the viability and sustainability of a farm, farmers need to consider a number of factors such as crop cycles, production methods, and socio-economic factors [6]. Another important management consideration is planning for succession from one generation to another [7,8]. This involves preparing the next generation to take over the business and developing a successful plan to ensure a smooth transition. The distribution of the farm from generation to generation can also be a sensitive process. Respecting values and traditions are essential issues, as the business must adapt to new farming technologies and market changes [9,10].
Family farms play a crucial role in generating regional opportunities such as job creation in rural areas, profitability of agriculture, and economic and social sustainability [11].
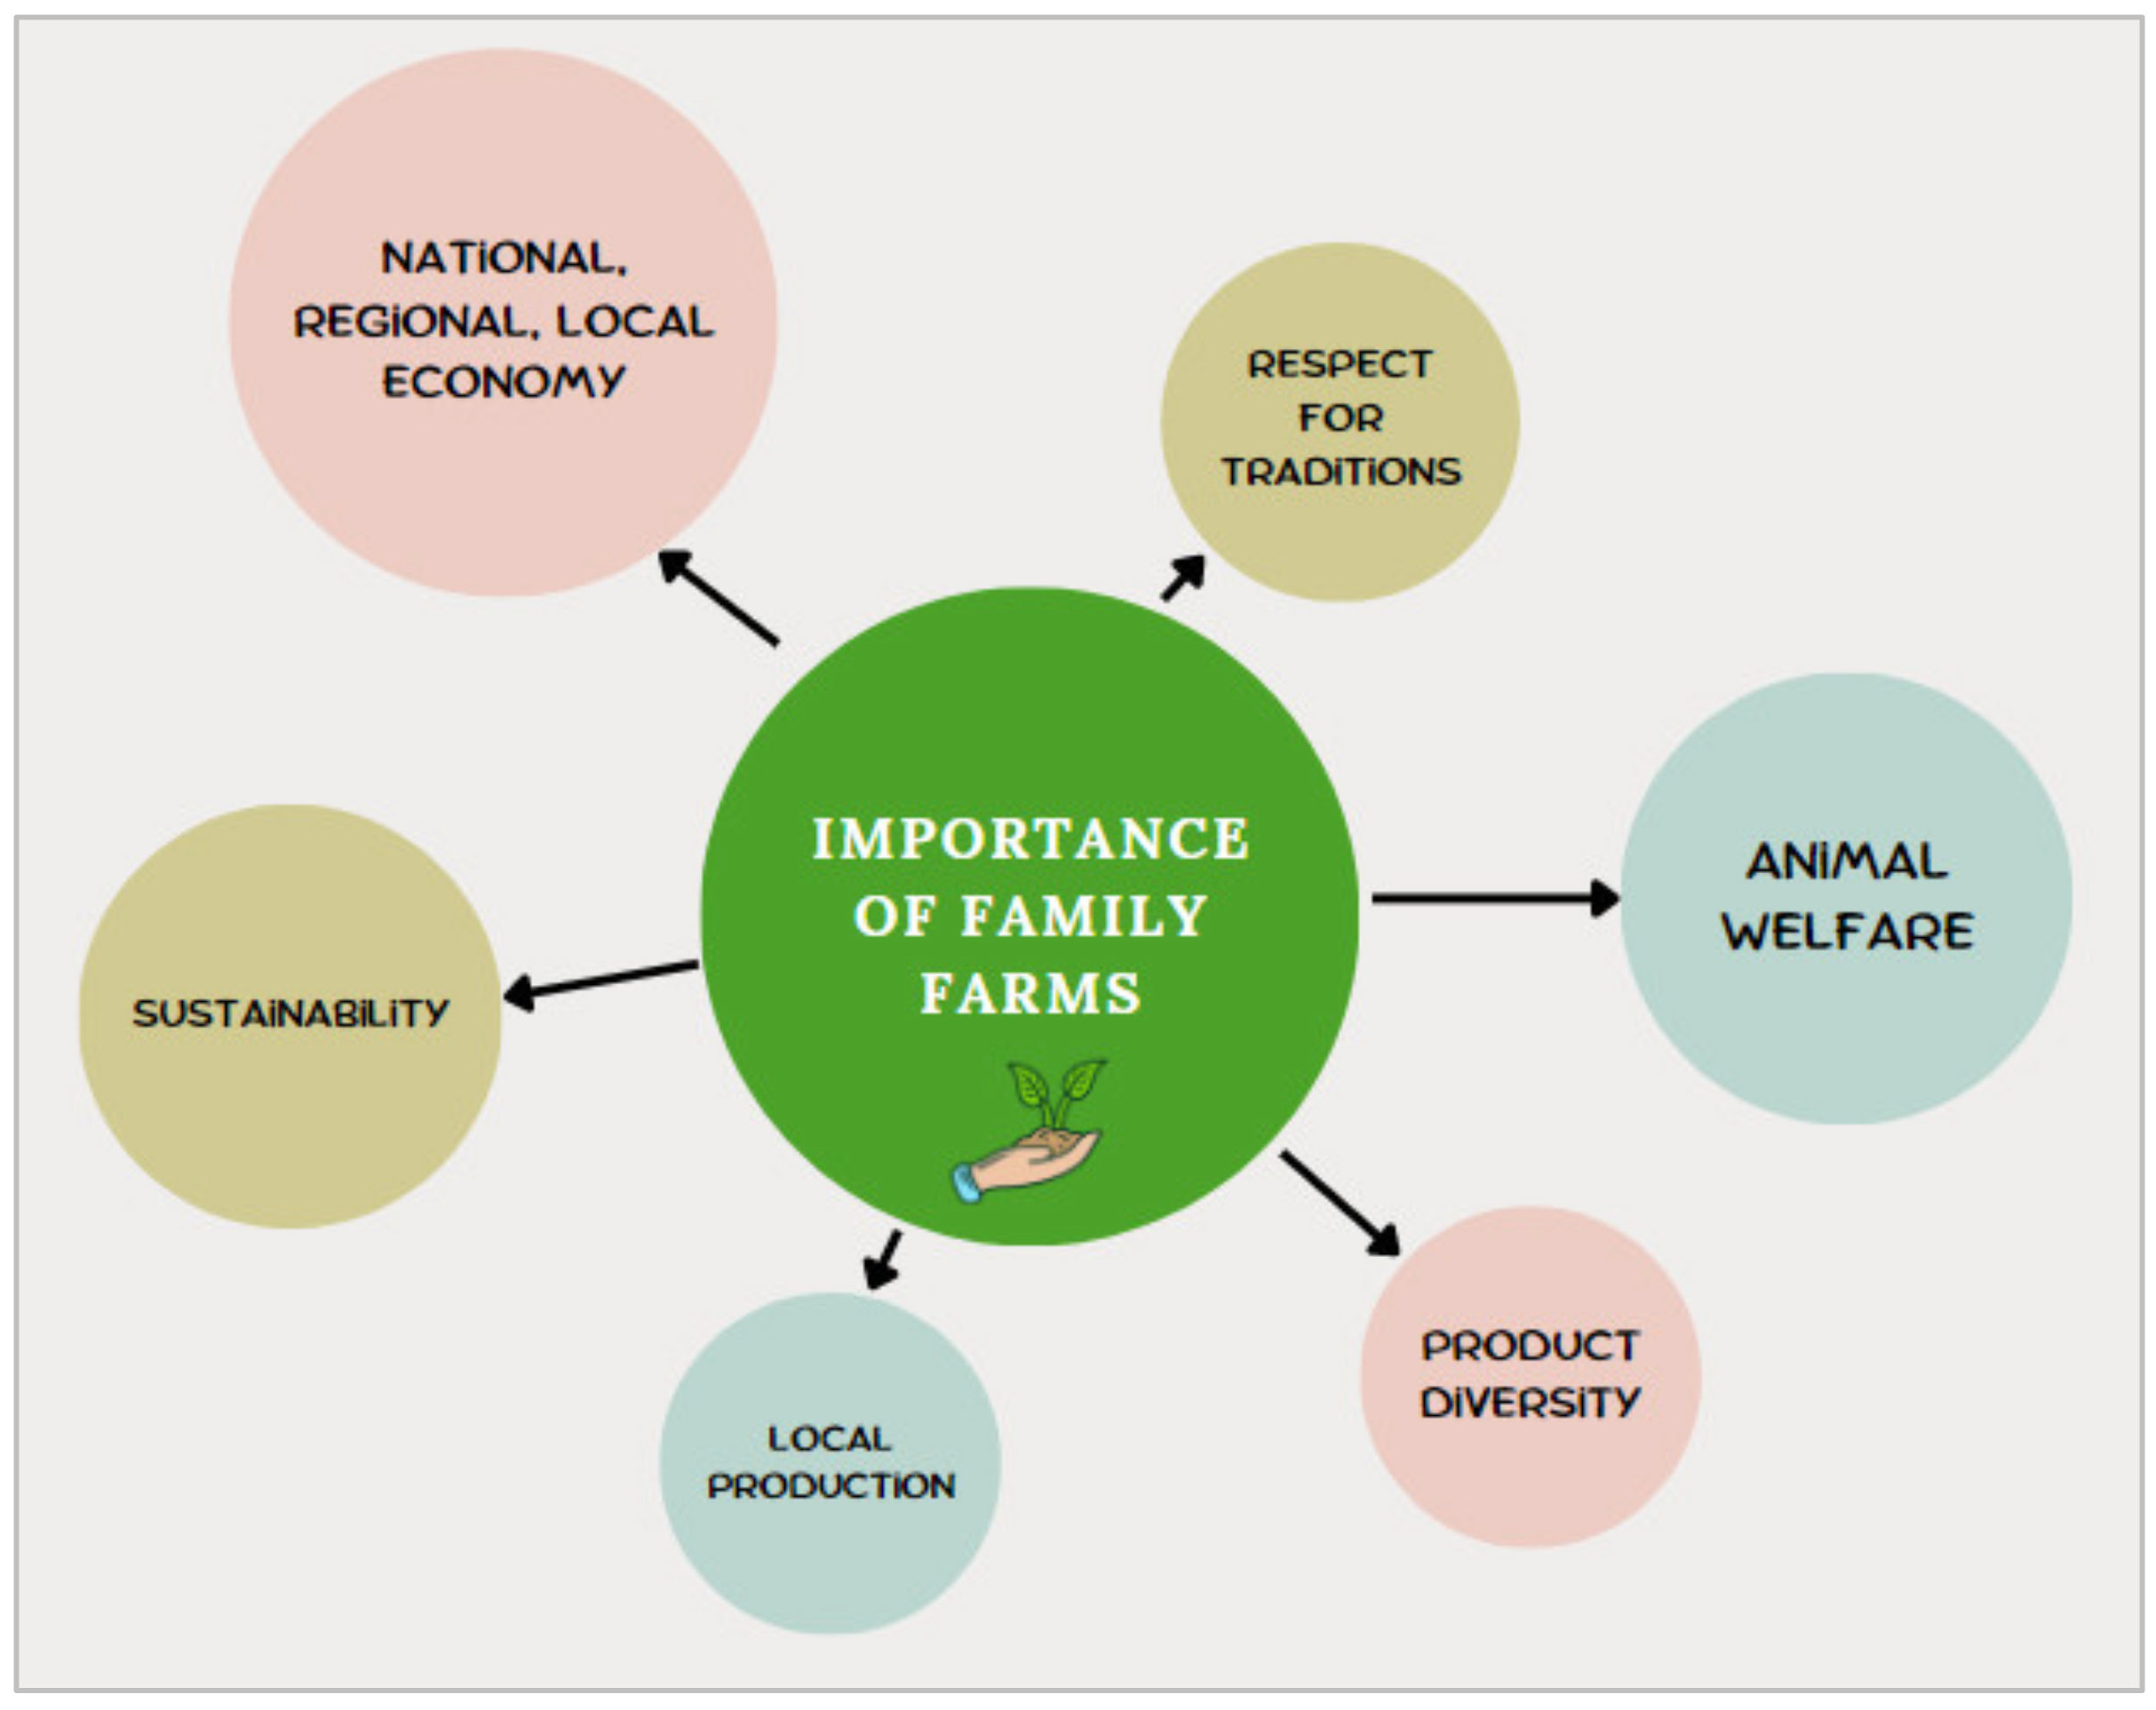
Clearly, family farms have many advantages, from the respect they give to traditions and animal welfare, to supporting the local, regional, and national economy and ensuring overall sustainability (Figure 1). At the level of integrated sectors belonging to certain regions, family farms are key to the regional economy, despite facing a number of challenges [12]. Economic insecurity and social vulnerability, a trend towards larger and more specialised farms in Europe, and limited access to finance, infrastructure, and markets are some of the challenges currently facing family farms [13,14,15]. The fight against poverty is another issue in which the family farm, through its traditional (stabilising) role, transforms into a model of European agriculture that reinforces traditions [16,17].
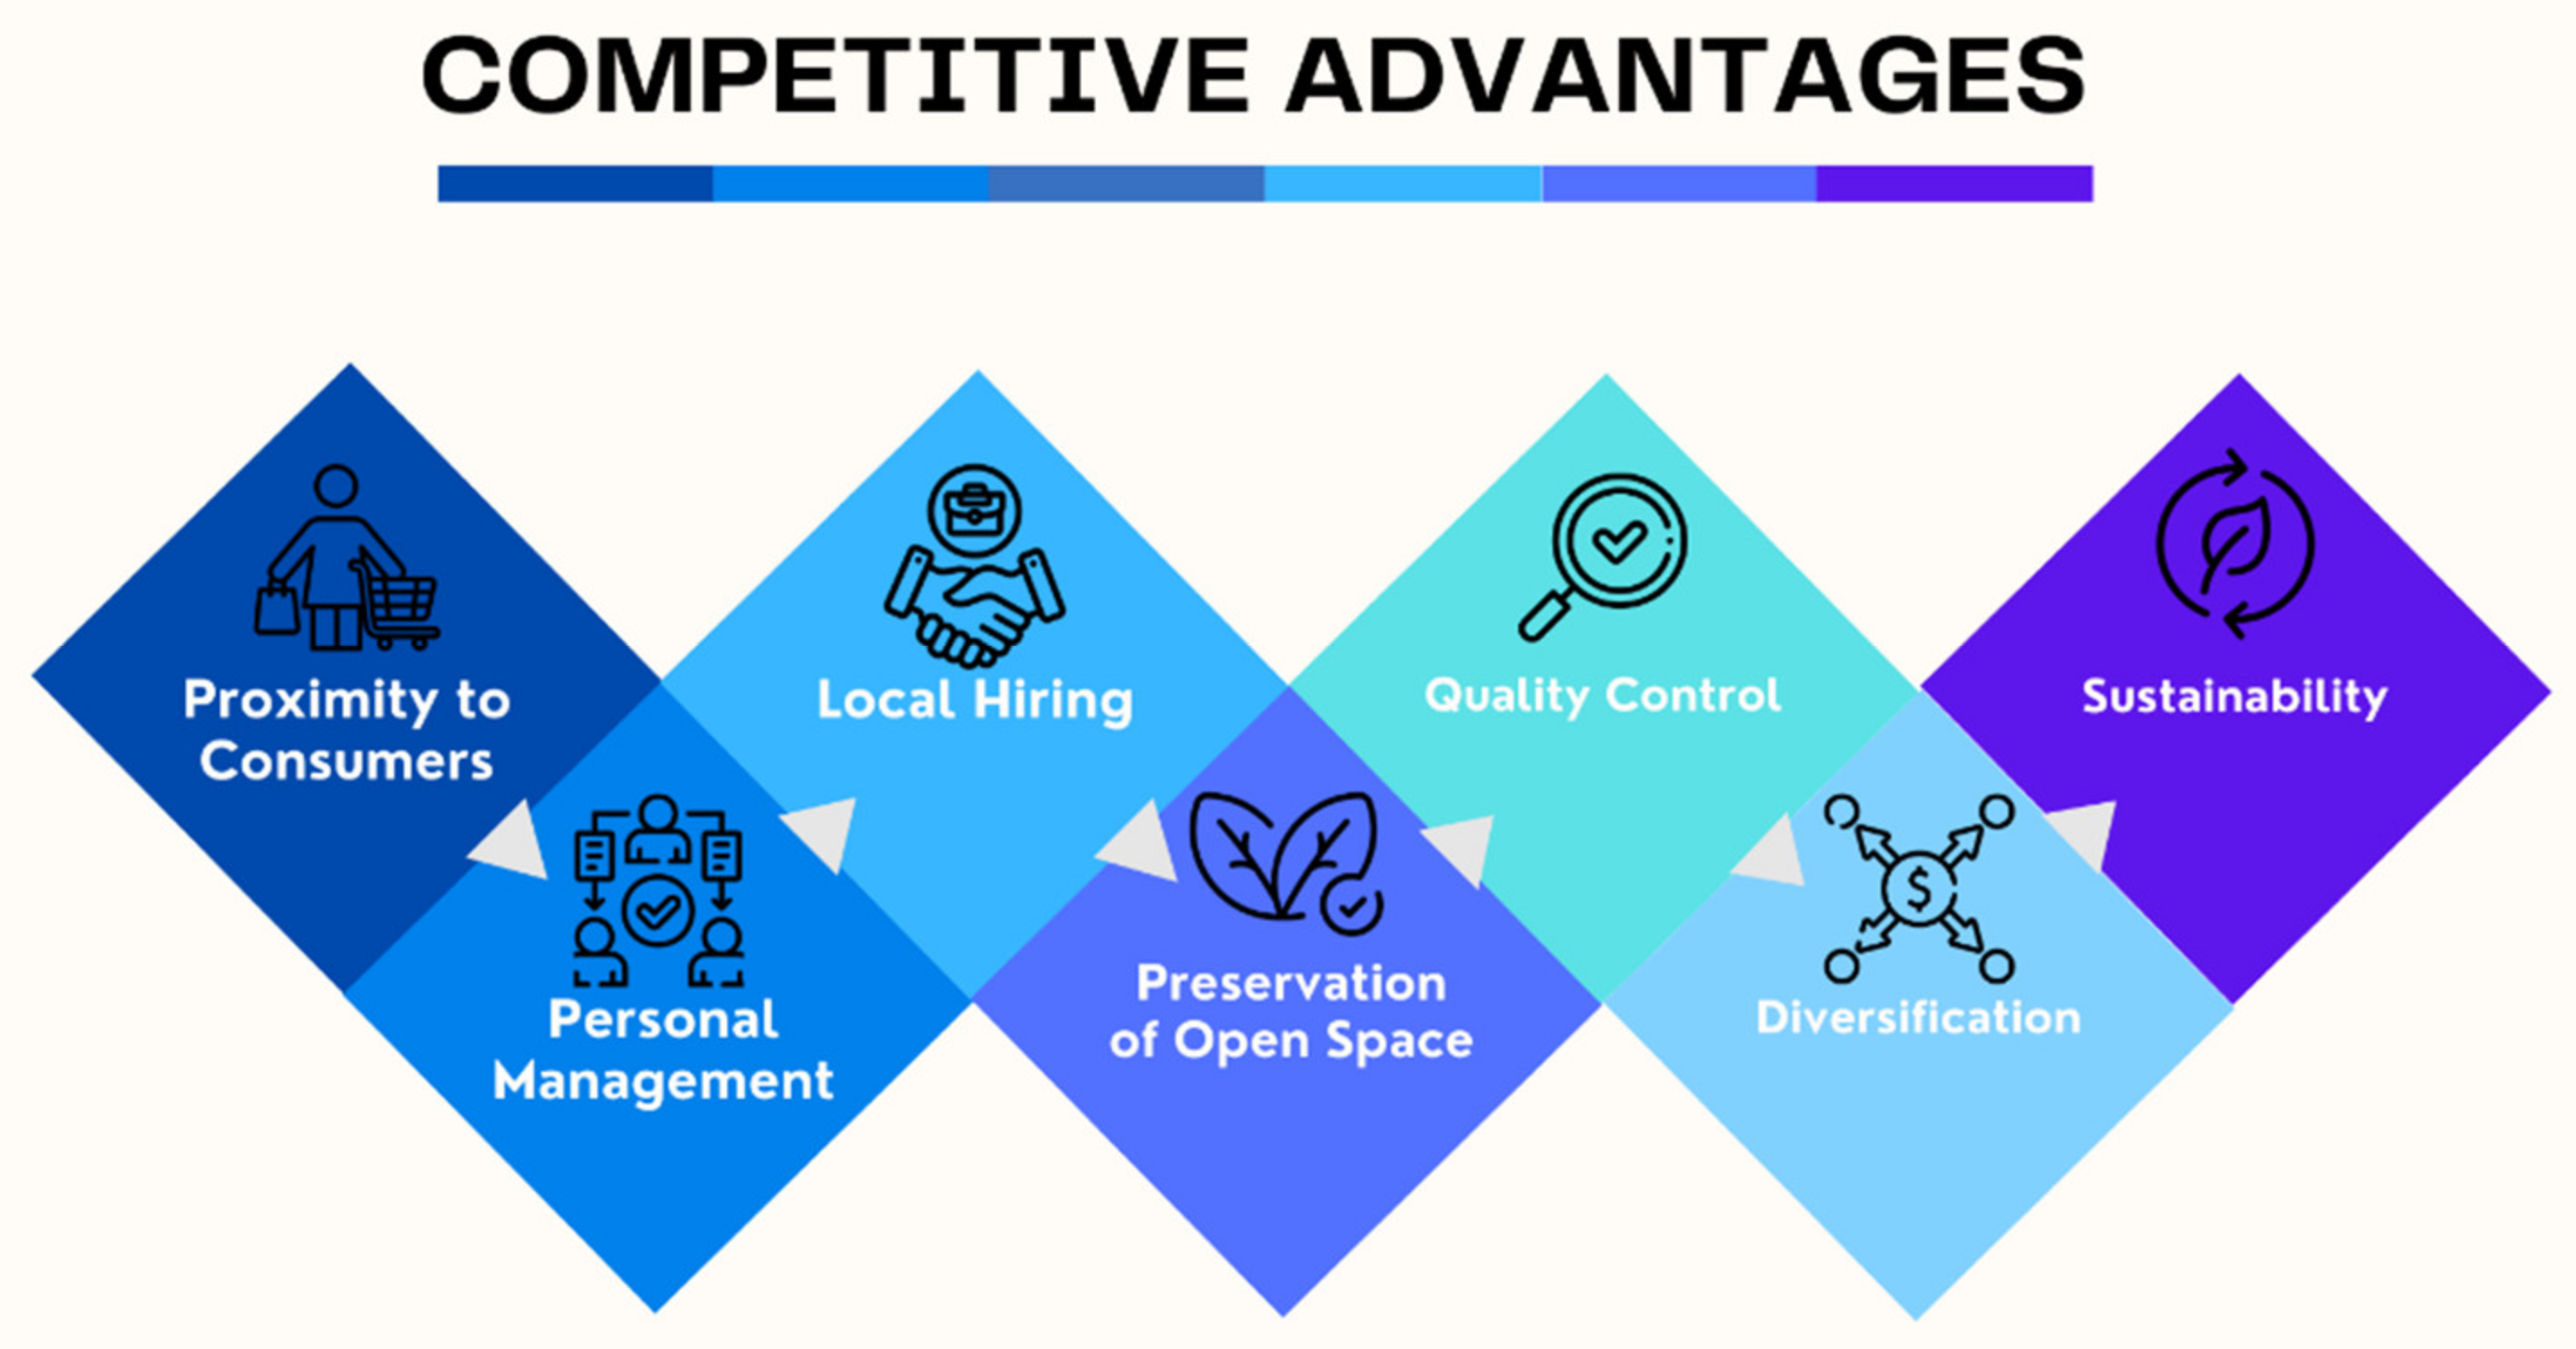
Altogether, family farms have several competitive advantages, as follows (Figure 2):
Proximity to Consumers: Small family farms often have the advantage of being closer to their consumer base, which means they have the opportunity to form relationships and make connections with customers in their communities [18].
- Personal Management: Small family farms are often managed by a single family, with members taking on different roles and responsibilities. This structure allows the family to be more flexible and involved in the day-to-day operations of their farm [19].
- Local Hiring: Small family farms are often able to hire locally and employ people from their communities, which allows them to build relationships with their employees and offer better wages and benefits [20].
- Preservation of Open Space: Small family farms help to preserve open space and provide a buffer between urban and rural areas [21].
- Quality Control: Small family farms are able to monitor the quality of their products more closely and can better manage the quality of their crops, livestock, and other products [22].
- Diversification: Small family farms have the ability to diversify their production, which can help to reduce risk in the event of weather-related losses or crop failures [23].
- Sustainability: Small family farms tend to use more sustainable practices and have a smaller environmental footprint than larger operations [23].
At the local level, family farms ensure local food security, which helps in fighting against the depopulation of rural areas [5]. Their role at the local level varies depending on political conditions and the local economy, so there are countries where family farms are predominant, such as Poland, while other countries are taken over by large farms, such as Ukraine [24,25].
At the EU level, family farms are supported through different programmes and policies [26]. The Common Agricultural Policy, created to support the agricultural sector, includes support for family farms, such as direct payments, rural development schemes, and risk management measures [27]. Family farms are also supported through the European Agricultural Fund for Rural Development (EAFRD) to improve the productivity, quality, and competitiveness of agricultural products [28].
Today, the demand for food is growing, while natural resources are more and more limited and less and less available, forcing farmers to produce far greater quantities. Promoting products from family farms among consumers is vital to raise awareness of the benefits on health, food security, local economy, and environmental impact [29]. Through good product promotion, family farms can be strengthened and encourage social, that is, organic, diversification oriented towards healthy habits and fresh food. Diversification of products and orientation towards sustainability are a plus for family farms, but also for local communities in the way that consumer and environmental health are the main pillars that farmers follow [30,31,32].
There are different ways in which EU countries promote products from family farms. For example, in Sweden, through the Matlandet movement, local products from family farms and small-scale farms have been promoted [33,34]. The aim of this movement was to make small-scale farmers visible on the market, promoting healthy food, sustainable rural development, and sustainable agriculture. To this end, a number of initiatives were taken, such as organising markets with only local products, developing a brand for these types of products, and developing distribution networks in different stores and restaurants [30,31]. Adapting to new technological assets can also help, so supply chains can become more sustainable through Industry 4.0 technologies [35].
In the European Union, a widely accepted definition of family farms refers to those farms where the family owns most of the farm capital, provides most of the labour, and where management is carried out by the family itself [36]. At the same time, in EU countries, which consistently support family farms, they are turning to organic farming as a means of economic diversification [37].
Lately, Romanian consumers have become more open to the new European trends, which are aimed at organic products, as well as those produced from local resources, to the detriment of imported products. The promotion of these issues has contributed decisively to changing consumer preferences among urban consumers. Romania has just under 3 million farms, and these are confused and classified as family farms. This is misguided, and because there is no clear definition of what a family farm or family holding is. The various studies with national applicability provide the authorities with a possible legislative justification by which they can delimit these categories of farms in order to be supported in their development. According to Dumitru and Petre [25], a possible definition of family farms is a means of organising agricultural activities, where the activities on the farm are mainly carried out by family members, and the income obtained from the marketing of agricultural production is the main source of family income. At the same time, the family farm is classified according to the number of family members and the economic size of the farm, where the minimum/average income in the economy and the minimum shopping basket (representing the farm’s own consumption) were taken into account in the calculation. However, the lack of promotion of the advantages of these products at the consumer level means that this segment of family farms is very underdeveloped and does not represent an interesting direction for policymakers. In addition to this, the small size of family farms and the lack of organisation and cooperation between them contribute to limiting market access. Various studies state that motivational factors, job satisfaction, and education level make it difficult for farms to cooperate [25,38].
The aim of this study is to investigate the preferences of Romanian consumers related to purchase of agri-food products originating from family farms. The objective was to identify pathways to promote family farms’ products towards supporting the development of rural areas and the local economy ecosystem. Several measures to promote these products are proposed. The study makes an important contribution to research in the field, as it not only analyses the preferences of Romanian consumers with reference to agri-food products obtained from family farms but also identifies ways of promotion. These aspects can improve the development of rural areas from all points of view, thus adding a new and significant aspect to the existing literature.
2. Materials and Methods
2.1. Research Design
To identify the key issues that could contribute to the development of family farms from the consumer demand side, an in-depth investigation was performed. A survey was carried out using a questionnaire as the main instrument and the data obtained and centralised were analysed in the first phase from a descriptive point of view. Subsequently, multiple linear regression and chi-square tests were used to determine the links between the variables, and finally, the ANOVA method was used to determine the existence of significant differences between the groups. The hypotheses underlying the survey were as follows:
Hypothesis 1 (H1).
Age, education level, and income significantly influence respondents who look for the logo of a recognised certification body that authenticates the product when purchasing agri-food products.
Previous studies have found that age can influence consumer purchasing behaviour and preferences for agri-food products. For example, young adults may be more open to new technologies and information available through certification logos, while older people may pay more attention to traditional values and product provenance. Education is an important factor in influencing consumer purchasing behaviour. People with a higher level of education may be more informed and aware of issues related to the safety, quality, and authenticity of agri-food products. They may have a better understanding of the meaning and importance of certification logos and be more willing to look for them in the purchasing process [39]. Income is also a key factor in their purchasing decisions. People with a higher income may be more willing to allocate additional resources to higher-quality and authentic products, including certified agri-food products. They may also have a greater financial incentive to seek out certification logos, as they want to ensure that they obtain the high-quality, authentic products they are paying for [40].
Hypothesis 2 (H2).
There is a significant relationship between respondents’ age, education, and income and the likelihood of buying imported products.
Previous studies have shown that age can influence consumer preferences and purchasing behaviour towards imported products. For example, young adults may be more open to imported products and attracted by innovation, cultural diversity, and international trends. Conversely, older people may show a preference for traditional or local products [41,42]. Education can play a significant role in influencing consumer purchasing behaviour towards imported products. People with higher levels of education may be more open to imported products because they are more exposed to different cultures and international influences. They may also have a greater understanding of the advantages and quality of imported products and a greater willingness to purchase them [43,44,45].
Hypothesis 3 (H3).
There is a significant relationship between people buying agri-food products in supermarkets and people looking for the logo of a recognised certification body that authenticates the product.
Consumers can look for certification logos for assurance that the products they buy are authentic, of high quality, and comply with specific standards and regulations. Buying agri-food products from supermarkets can be associated with a greater demand for and trust in certified products, as supermarkets can be seen as suppliers of safe and quality products. Supermarkets offer a wide range of agri-food products, including certified products, which are promoted and displayed in a way that is visible to consumers. As a result, people buying agri-food products in supermarkets may be more exposed to certification logos and more motivated to seek them out in the purchasing process. Supermarkets can be important sources of information about products and certification claims, providing details about origin, quality, and authenticity. This information can increase consumer awareness of the importance of certification logos and encourage consumers to look for them when purchasing agri-food products [29].
Hypothesis 4 (H4).
There is a significant relationship between people who purchase agri-food products on the basis of “price” and people who purchase imported products.
Price is one of the most important factors consumers consider when choosing to buy agri-food products. Consumers may be motivated to opt for imported products because of lower prices or better value for money. Thus, people who have “price” as their main criterion in choosing agri-food products may be more open to imported products. Imported products may offer a wider range of choice and may often be available at more competitive prices compared to local products. This diversity and price competitiveness may attract consumers who are looking for agri-food products at a more affordable price and so may be more likely to purchase imported products. Imported products may also be easier to find and purchase through different distribution channels, such as supermarkets and specialised shops. This increased availability may make it more difficult for consumers to access imported products and increase the likelihood of their purchase by price-conscious consumers.
Hypothesis 5 (H5).
There is a significant relationship between people buying imported products and people looking for the logo of a recognised certification body that authenticates the product.
Buying imported products can be associated with the desire to obtain authentic and high-quality products. Consumers looking for imported products may be more aware of the importance of authenticity and quality and may be more interested in identifying the logo of a recognised certification body that authenticates them. They want to be sure that the products they buy comply with specific standards and regulations and are authentic. Imported products may be associated with a certain reputation or positive image in terms of quality, innovation, or prestige. Individuals purchasing imported products may be more motivated to look for the logo of a recognised certification body to confirm the authenticity and conformity of products with international standards. People buying imported products may be more aware of the importance of certifications and international standards. The search for the logo of a recognised certification body can be a way to ensure that the products purchased comply with these requirements and standards and to have greater confidence in the imported products [6].
Hypothesis 6 (H6).
There is a significant difference between the groups in terms of knowledge about the advantages of family farm products over conventional products.
Products produced on family farms are often perceived as having a number of associated benefits and values [40]. These advantages can include freshness, high quality, traditional production methods, sustainability, and support for the local economy. People who are more informed and aware of these advantages may have a deeper and better knowledge about the products produced on family farms compared to conventional products. Consumers may have different levels of exposure to information about family farm products, depending on their background, interests, and access to information sources. People who are more interested in issues of healthy eating, sustainability, and community impact may seek additional information and develop deeper knowledge about the benefits of family farm products [42]. At the same time, consumer preferences and values differ when it comes to food choices. People who are more orientated towards natural, traditional, and local products may be more informed and aware of the benefits of family farm products, as they are more aligned with their values and preferences. Furthermore, all these aspects are influenced to a large extent by the way they are promoted to consumers [6].
2.2. Research Methods and Tools
The study is based on a survey for the consumers that are living in the most developed (economic) region in Romania, Bucharest-Ilfov. This region is the most developed in terms of both economy and infrastructure.
The instrument used was a questionnaire, which was distributed from 15 January to 15 February 2023, consisting of a sample of 312 respondents. The questionnaire was based on a set of 14 questions, consisting mostly of questions with a scale to assess certain aspects (Likert scale) but also questions with multiple-choice answers, and the data were collected online using the Google Forms platform (Appendix A).
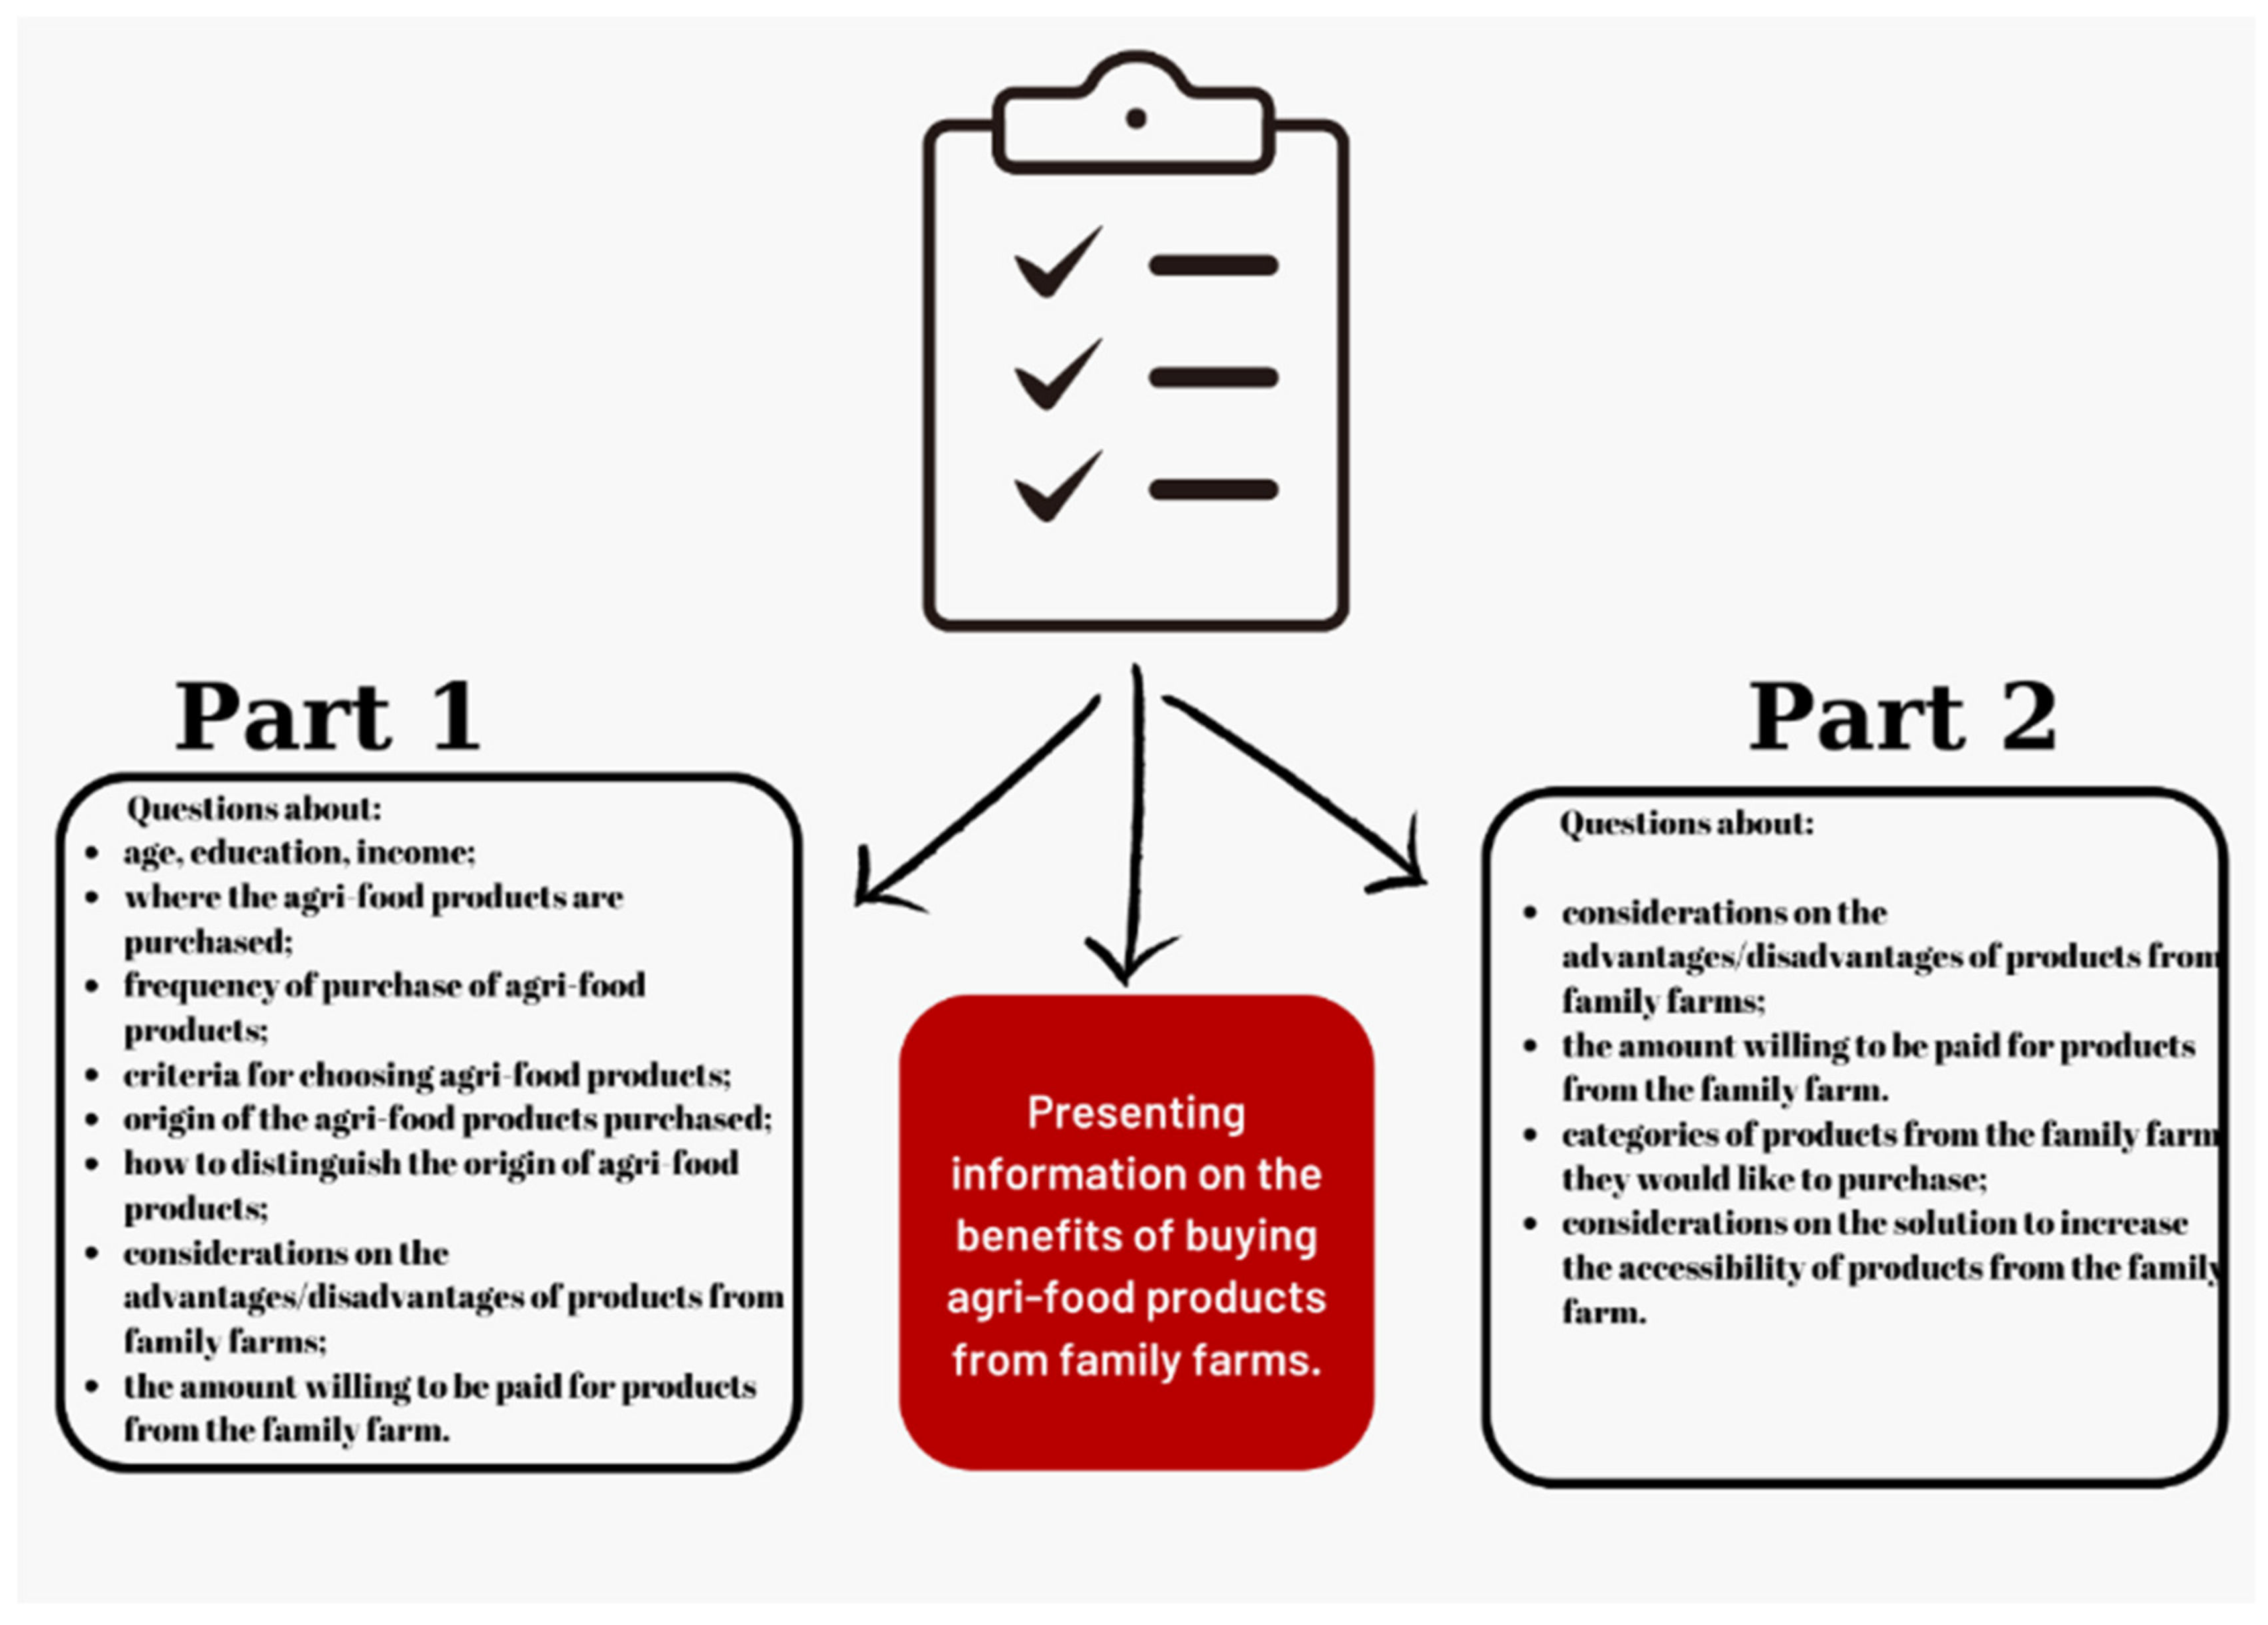
The questionnaire was structured in two parts. The first part covered general information about the respondents, where they buy agri-food products, and also information about the frequency with which they buy agri-food products. Specific questions were also asked in the first part focusing on products from family farms (Figure 3).
After applying the first set of questions, the respondents were presented with some information on the advantages of buying agri-food products from family farms, which focused on safety, quality, taste, and the support they offer to farms and rural areas, then some of the questions were repeated (Figure 3).
2.3. Research Participants and Data Sources
The general questions aimed to collect information related to age, education, and income. Thus, the structure of respondents shows the following values:
- Age: 18–40 years—45.19%; 41–65 years—40.06%; >65 years—14.74%;
- Education: secondary school—9.94%; high school—38.46%; university—51.60%;
- Income: less than RON 1100 (about EUR 220)—3.85%; RON 1100–1900 (about EUR 380); RON 1900–4000 (about EUR 800)—51.28%; RON > 4000 (more than EUR 800)—24.36%.
To establish the ranges for the income of the respondents, we took into account the current economic aspects of the country, where the minimum guaranteed income for seniors is RON 1100 (approximately EUR 220), but in this category people benefiting from social aid can also be included, so in this situation the income may be less than RON 1100. Also, the minimum net wage in the economy at the beginning of 2023 was set at RON 1900 (about EUR 380), while the average net wage in the economy is RON 4000 (about EUR 800).
2.4. Data Processing Procedures
In order to present and interpret the basic characteristics of the collected data, descriptive analysis of the data was carried out at this stage, using SPSS statistical software version 19 by determining: sum, mean, standard deviation, variance, skewness, and kurtosis index for each variable [46,47,48].
Then, multiple linear regression was used to analyse the relationship between a dependent variable and two or more independent variables. Therefore, it was determined how the independent variables contribute to the variation of the dependent variable [49,50].
The next step was to determine the associations between the variables using the chi-square test, determined using the SPSS 19 statistical software. At the same time, indicators such as phi, Cramer’s V, and contingency coefficient were determined to evaluate the association between two variables [51].
At the end of the study, the statistical method analysis of variance (ANOVA) was used to observe the differences between the group mean values for the same questions before and after the presentation of information on the benefits of purchasing products from family farms. It identifies whether there are significant differences between two or more means of different groups [1].
The last question of the questionnaire was designed to collect information (keywords) from respondents on how and how easily they could identify products from family farms through a logo (co-creation process). The collected and centralised data were fed into an artificial intelligence application (Bing Create application), which, based on keywords, generates logos. After a set of several logos had been created, all participants in the study were sent the resulting logo variants, from which the most suggestive variant was selected according to their opinion [52].
3. Results
Based on the statistics presented, it can be seen that the respondents’ favourite places to buy agri-food products are supermarkets, with an average response of 3.60, followed by farmers’ markets (3.32) and online stores (3.05). The least preferred places to buy agri-food products are convenience stores (2.97) and grocery stores (2.44) (Table 1).
In terms of the frequency of purchase of different types of agri-food products, respondents pointed that they most often buy fresh fruit and vegetables (4.31), followed by dairy and milk products (3.77) and meat and other meat products (3.73). The most important criteria for respondents in choosing agri-food products are price (3.58) and quality (3.49), followed by the brand of the products (3.47), origin (3.37), and method of cultivation/breeding (mean = 3.16) (Table 1).
Regarding buying habits according to the origin/category of agri-food products, the respondents stated that they most often buy imported products (3.97), followed by Romanian products (2.90) and local products (2.81). Short-chain products (direct from the producer) (2.71) and those from family farms (2.03) are purchased the least (Table 1).
A significant variation in the data analysed is also evident with the data being spread more around the mean. Overall, the value of the skewness index shows negative values (−0.41), indicating a distribution of the data string that tends more towards the left side. At the same time, the kurtosis index shows positive mean values (0.97), suggesting a distribution more concentrated around the mean (Table 1).
In terms of identifying the origin of agri-food products, it can be seen that the most used methods are: reading product labels (3.01), looking for information about the producer (2.76), looking for specific logos (2.86), and scanning the QR code for more information (2.43). These have relatively close mean values but their distribution is influenced by the recorded large variation in the minimum and maximum values (Table 2).
Regarding their opinion on the supposed advantages of products from family farms, these were taste (3.96), freshness (3.83), and health (3.82). These have quite high average values, while considerations of the product story (2.08), supporting the local economy (2.15), and being obtained from traditional farms (2.03) reveal a weak association between these characteristics and family farms (Table 2).
In terms of consumers’ appreciation of the disadvantages of family farm products compared to those commonly found, the centralised data show the poor promotion of these products (4.14) and the low degree of accessibility in purchasing products (4.04) (Table 2).
After the presentation of the information about the benefits of purchasing agri-food products from family farms, the results of the questions were centralised. The same questions asked prior to the presentation of the above-mentioned data reflect considerably higher average values than the initial ones. Therefore, the most representative increases in the average value of the answers were obtained by the statements about the story behind the product, which recorded an increase of 70.3% compared to the previous answer, the support offered to the local economy, which recorded an increase of 61.3% in the average value, and the statement concerning the type of cultivation of the traditional farms, which recorded an increase of 47% compared to the previous value (Table 3).
It should be noted that among the products they would buy from family farms, most of the respondents intend to buy vegetables (3.92) and fruits (3.86) and less frequently fish or other fish products (3.31) (Table 3).
From the resulting data, consumers consider that a possible solution to make products from family farms more accessible would be the opening of specialised stores (4.21), appropriate labelling (3.93), and intensive promotion of these products (3.89) (Table 3).
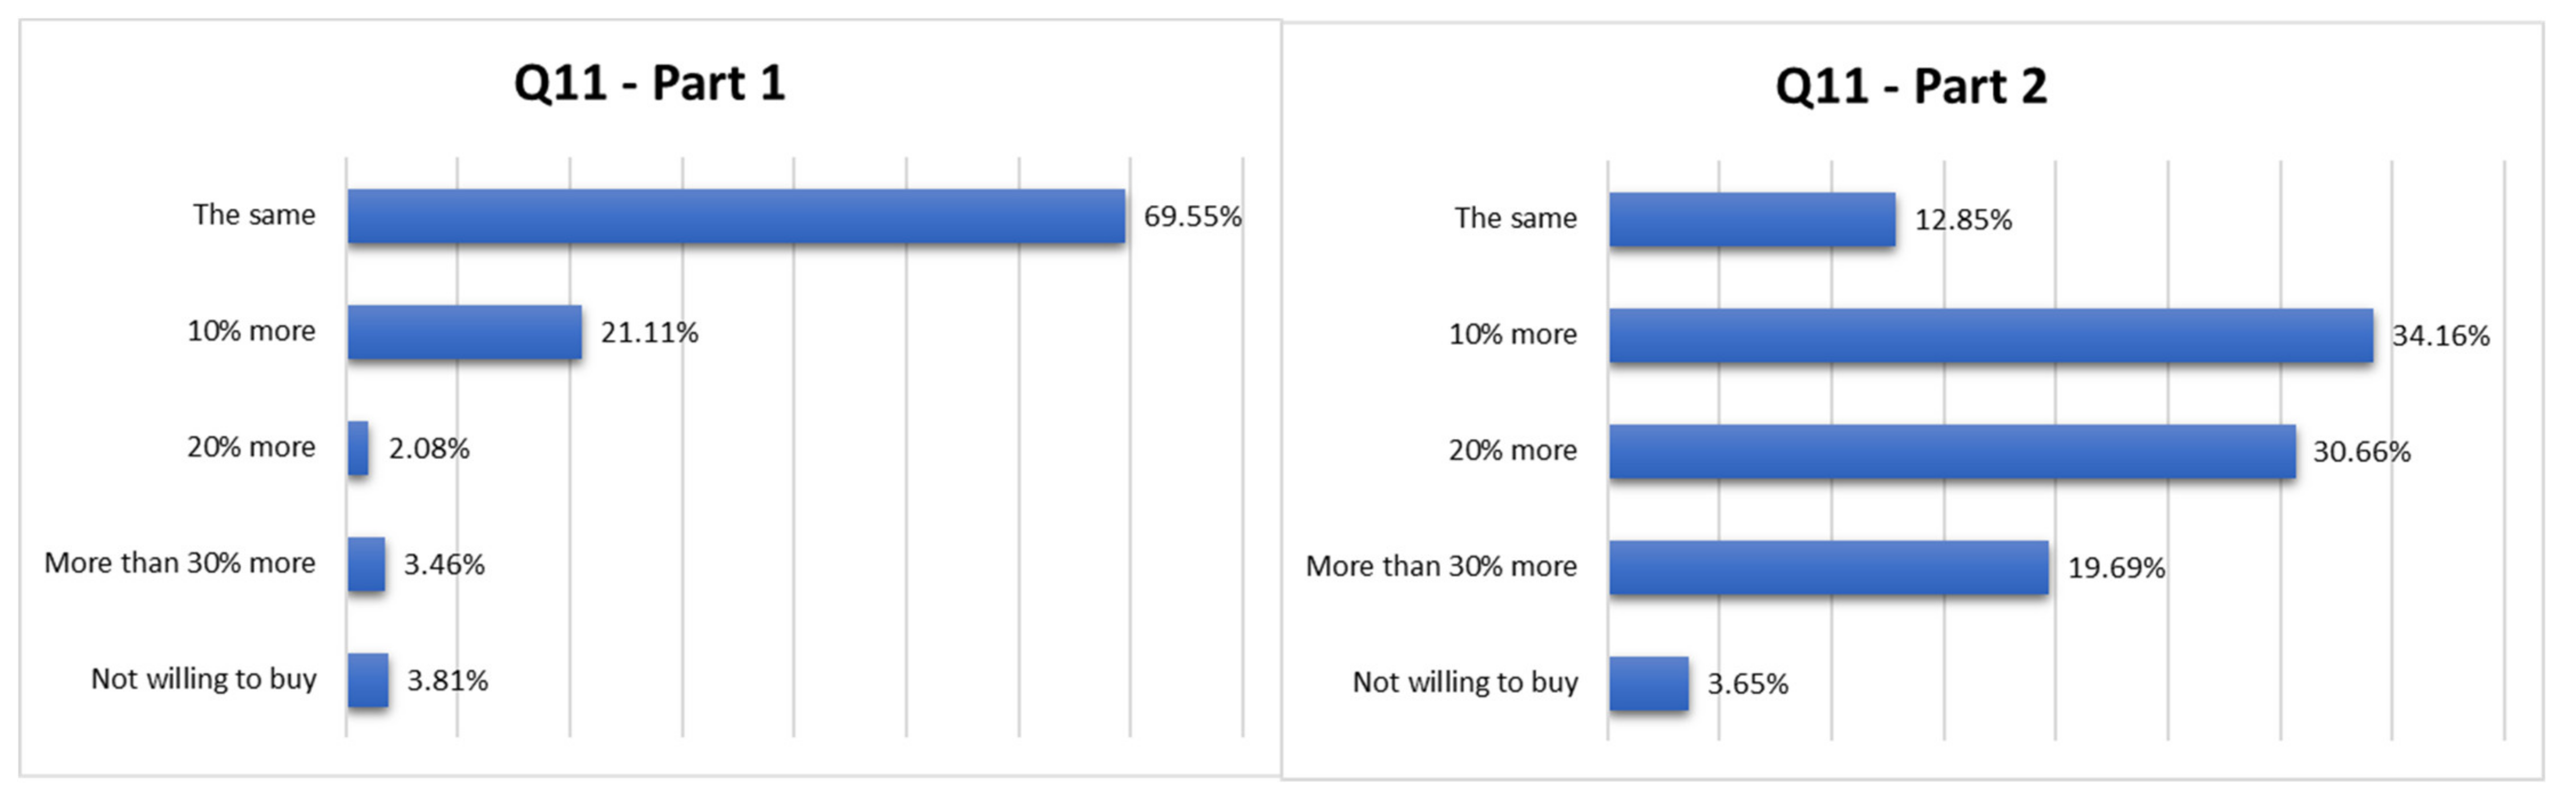
After the presentation of information on the advantages of and conferred by purchasing agri-food products from family farms, the perception of the respondents about the amount willing to be allocated for this category of products changed substantially, in the sense that most of the respondents said they were willing to pay even 10% more than for a conventional product (34.16% Q11.—Part 2 vs. 21.11% Q11.—Part 1) and those willing to pay more than 30% more than the price of a similar conventional product showed a significant increase from 3.46% to 18.69% (Figure 4).
Next, the multiple linear regression method was used to describe the relationship between the independent variables, consisting of the questions that profile the respondents and the variables that follow the purpose of the study.
The value of R is 0.924 and the value of R2 is 0.853, suggesting a strong relationship between the independent variables and the dependent variable. The standardised coefficients reflect the estimated change in the dependent variable associated with a standardisation of the corresponding independent variable. Thus, age and educational attainment have negative standardised coefficients, suggesting an inverse relationship with the dependent variable (the higher the age or educational attainment, the lower the dependent variable). Income has a positive standardised coefficient, suggesting a positive relationship with the dependent variable (the higher the income, the higher the dependent variable). At the same time. the values of t and Sig. for all independent variables show a significance threshold value of less than 0.05, suggesting a significant relationship between the independent and dependent variables (Table 4).
The coefficient of determination (R2) is 0.803, suggesting that about 80.3% of the variation in the dependent variable can be explained by the variation in the independent variables included in the model. Adjusted R square is 0.796, indicating that the addition of the independent variables further explains the variation of the dependent variable to a significant extent. Also, Durbin–Watson is 2.122, suggesting that there is no significant autocorrelation between errors. All coefficients have the expected signs and the independent variable with the largest influence on the dependent variable is “age”, followed by “education level” and “income”. The “Residual Statistics” section of the table shows the statistics for the model residuals. The mean of the residuals is 0 and the standard deviation is 0.980. These statistics suggest that the model fits the entered data as the distribution of residuals is almost normal (Table 5).
The results of the chi-square tests show that there is a significant association between the two variables due to the high chi-square test value (93.71) and the significant p-value (p < 0.05). To assess the degree of association between the two variables, symmetry measures were also used. In this analysis, the symmetry measures indicated that there is a moderate association between the two nominal variables (phi values, Cramer’s V, and contingency coefficient between 0.38 and 0.54). The results indicate that there is a significant association between the level of education and the perspective on the logo of a recognised certification unit that authenticates the product and this association is a moderate one (Table 6).
Chi-square analysis shows that there is a significant association between Q4.1. and Q8.5. (Pearson chi-square = 330.988. df = 16. p < 0.001). Symmetry tests show that there is a strong relationship between the two variables. The results suggest that there is a strong association between consumers of agri-food products who purchase products from supermarkets and the opinion on the logo of a recognised certification unit that authenticates the product and this association is statistically significant (Table 6).
The relationship between Q6.2. and Q7.1. indicates a significant association with a chi-square value of 239.028 and a p-value < 0.001. Symmetry tests also indicate moderate association of coefficients in strength. Also, in the case of the relationship between Q7.1. and Q8.5. a significant association between the two variables is indicated, recording a chi-square value of 259.253 with a p-value < 0.001, but the Pearson coefficient indicates a weak-intensity relationship between the two variables (Table 6).
Next, ANOVA was used to compare the means obtained between two similar questions but asked at two different times. i.e., after information on the importance of family farms was presented.
F values are all high and the significance threshold values are very low (p < 0.001), suggesting that differences between groups are significant and not due to chance. In addition, the between-group variation is much larger than the within-group variation for each statement, suggesting that positive evaluations are significantly different between subject groups for each of these statements (Table 7).
In the case of the statement “The story behind the product” (Q9.1.), the values in the table show that there are significant differences between the groups of subjects in terms of their positive evaluation of the product. The F value is large (14.157) and the significance value is very small (p < 0.001), suggesting that the differences between the groups are significant and not due to chance. Specifically, the between-group variation (81.802) is much larger than the within-group variation (443.477) and this suggests that the positive product evaluation differs significantly between question application times (Table 7).
In the case of statement Q9.2., the values in the table show that there are significant differences between the groups of subjects in their positive evaluation of the product. The value of F is large (15.233) and the significance value is very small (p < 0.001), suggesting that the differences between the groups are significant and not due to chance. Specifically, the between-group variation (96.192) is much larger than the within-group variation (484.651) and this suggests that the positive product evaluation differs significantly between different groups of subjects (Table 7).
At the same time, regarding the question concerning the amount allocated for the purchase of agri-food products, significant differences are identified between the groups of subjects. Thus, the F value is high (4.889) and the significance threshold value is 0.000, suggesting that there are significant differences between the groups. Also, the between-group variation (23.604) is much larger than the within-group variation (295.469), indicating that the allocation of a sum of money to agri-food products differs significantly between the times when the question was applied.
After collecting and centralising the keywords, which from the consumers’ perception would define the agri-food products obtained from family farms, they were entered into the Bing Create application in order to generate a logo associated with the products from family farms. The keywords highlighted by consumers were: tradition, Romania, nature, community, agriculture, pasture, and traditions. Subsequently, all participants in the study were sent the resulting logo variants, from which the most suggestive variant was selected. According to the results, the relevant logo is shown in Figure 5.
4. Discussion
By applying the appropriate statistical analysis, we have demonstrated that all our hypotheses have been validated and that there is a significant relationship between the variables of interest. Thus, the first hypothesis that respondents’ age, education, and income significantly influence the search for the logo of a recognised certification body that authenticates the product when purchasing agri-food products was confirmed. Our results suggest that these variables play an important role in the decision to search for a certification logo, and young people may be more open to new technologies and information available through certification logos, while older people may pay more attention to traditional values and product provenance. At the same time, people with a higher level of education may be more informed and aware of safety, quality, and authenticity aspects of agri-food products and more likely to look for them in the purchasing process [40].
We also found that there was a significant relationship between respondents’ age, education level, and income and the likelihood of buying imported products. These results confirm that these variables influence consumer preferences in choosing imported products given the advantages they offer, such as lower prices or higher quality. This suggests that older, less educated people with lower incomes are more likely to buy imported products [41,42]. These findings are consistent with existing literature suggesting that lower-income people are more interested in buying cheaper products and imported products are often cheaper than locally produced ones [43,44,45].
The results also suggest that people who prefer to shop in supermarkets are more open to looking for the certification logo, suggesting a link between the shopping experience and trust in certified products [53]. Certifications represented by logos on agri-food products in supermarkets play an important role in influencing consumer purchasing decisions. These logos provide assurance that products are authentic, of high quality, and comply with certain standards and regulations. Thus, consumers buying agri-food products in supermarkets may be more exposed to certification logos and may be more motivated to seek them out in the purchasing process [52]. Supermarkets can be important sources of information about products and certification claims, providing details about origin, quality, and authenticity [54].
The results of the study show a significant relationship between people who use “price” as a criterion for purchasing agri-food products and people who purchase imported products. This result suggests that price is an important factor in the decision to buy agri-food products and that people who place high importance on price are more likely to choose imported products, which may offer lower prices compared to local products [53].
Regarding the last hypothesis, we confirmed the significant difference between the groups in knowledge about the advantages of family farm products compared to regular products, which highlights the importance of promoting family farm products to consumers which encourages consumers to view family farm products positively [53,55]. People who are more informed and aware of these advantages may have a deeper and better knowledge of the products produced on family farms compared to conventional products. Consumers may have different levels of exposure to information about family farm products depending on their background, interests, and access to information sources. Individuals who are more interested in issues related to healthy eating, sustainability, and community impact may seek additional information and develop more in-depth knowledge about the benefits of family farm products [37]. At the same time, consumer preferences and values differ when it comes to food choices. Individuals who are more oriented towards natural, traditional, and local products may be more informed and aware of the benefits of family farm products because they are more aligned with their values and preferences [38].
5. Conclusions
The study aimed to identify the key issues that can contribute to the development of family farms, taking the consumer perception as the starting point. Consumers with a higher level of education have more confidence in certified products and are better informed and able to distinguish certified from non-certified products through logos.
At the same time, the results indicate a real opportunity for family farms, with a secure market, at least in urban areas, to market these products at more attractive prices for farmers than their competitors. However, for this to happen, a quality scheme needs to be implemented, highlighting the origin and originality of the products (products obtained from family farms) coupled with awareness-raising campaigns on the advantages of these products, both for the consumer and the farmer or the regions they come from. This would obviously contribute to a better development of rural regions in Romania.
Based on the results obtained, as well as the expert studies discussed above, a step-by-step approach to supporting family farms is presented below:
- Establish a procedure for the recognition and certification of products obtained from family farms in accordance with the above-mentioned publications;
- Establish a nationally recognised “Family Farm Product” quality scheme;
- Promote the advantages of family farm agri-food products, especially on social media channels, based on the results obtained in this study;
- Encourage farmers to join this quality scheme and promote the openness of consumers to purchase these family farm products.
Despite the significant results obtained, this study also has some limitations. Firstly, the research was conducted on a relatively small sample composed mainly of urban respondents. This may limit the generalisability of the results to the whole population as consumer perceptions and behaviours can vary significantly between urban and rural areas. In addition, the small sample size may limit the statistical power of the analyses and increase the risk of errors. The instrument used to collect the data (questionnaire) may have a certain degree of subjectivity. Responses to the questionnaire may be influenced by a number of factors, including respondents’ understanding of the questions, their mood when completing the questionnaire, and their tendency to give socially acceptable answers. In addition, the questionnaire does not provide the opportunity for detailed analysis of respondents’ opinions, thus limiting the depth and nuance of the information collected. The methodology used in this study did not include an analysis of the social and economic impact of family farm development nor an analysis of their sustainability in the context of climate change. These are important issues that could have a significant impact on the viability and attractiveness of family farms for both farmers and consumers. The study also did not take into account the cultural aspects, traditions, and customs of different regions. These can have a significant impact on consumer perceptions and behaviour and could significantly influence the demand for products from family farms. Ignoring these aspects may therefore limit understanding of the complexity and diversity of the market for family farm products.
In future research, it would be beneficial to expand the study sample to include a larger and more diverse number of respondents from both urban and rural areas. This approach could provide a more complete picture of consumers’ perceptions and allow extrapolation of the results to the whole population, thus increasing the validity and applicability of the results. An analysis of the social and economic impact of family farm development could also provide a deeper understanding of the benefits and challenges associated with this form of agriculture. This could include assessing the contribution of family farms to the local economy, job creation, and cultural heritage preservation. In addition, in the context of current climate change it would be useful to examine the extent to which family farms are sustainable and how they can be adapted to cope with these changes. Finally, once the proposed quality scheme has been implemented it would be useful to evaluate its effectiveness in improving consumer perceptions and increasing sales of products from family farms. This could involve collecting and analysing data on sales of certified products as well as conducting surveys to assess consumer perceptions of these products and the quality scheme itself.
Author Contributions
Conceptualisation, E.A.D. and S.R.; methodology, E.A.D. and M.B.; software, M.B.; validation, S.R., E.A.D. and C.M.S.; formal analysis, S.R.; writing—original draft preparation, E.A.D. and C.M.S.; writing—review and editing, E.A.D. and S.R. All authors have read and agreed to the published version of the manuscript.
Funding
This paper is part of the project: “Research on ways to develop family farms for rural development”—project code: 8571.5/27.12.2022—funded by internal projects carried out by the Research Institute for Agricultural Economics and Rural Development.
Institutional Review Board Statement
Not applicable.
Data Availability Statement
Not applicable.
Conflicts of Interest
The authors declare no conflict of interest.
Appendix A. Question Coding
| Coding | Question |
| Q1. | Age |
| Q2. | Education level |
| Q3. | Income |
| Q4. | Preferred place of purchase of agri-food products |
| Q4.1. | Supermarket |
| Q4.2. | The fly market |
| Q4.3. | Producer fair |
| Q4.4. | Small commercial unit for the sale of agri-food products |
| Q4.5. | Neighbourhood shop |
| Q4.6. | Producer shop/direct producer |
| Q4.7. | Online shop |
| Q5. | Frequency of purchase |
| Q5.1. | Fresh fruit and vegetables |
| Q5.2. | Dairy and milk products |
| Q5.3. | Meat and meat products |
| Q5.4. | Cereals and cereal products |
| Q5.5. | Other categories of food products |
| Q6. | Criteria for choosing an agri-food product |
| Q6.1. | Quality |
| Q6.2. | Price |
| Q6.3. | Provenance |
| Q6.4. | Method of cultivation/growing |
| Q6.5. | Brand of products |
| Q6.6. | Product certification |
| Q6.7. | Other aspects |
| Q7. | Frequency of purchase of agri-food products by origin/category |
| Q7.1. | Imported products |
| Q7.2. | Products in Romania |
| Q7.3. | Local products |
| Q7.4. | Short chain (direct from the producer) |
| Q7.5. | Certified products |
| Q7.6. | Produced on family farms |
| Q8. | How to distinguish agri-food products |
| Q8.1. | Read product labels carefully |
| Q8.2. | I look for information about the manufacturer |
| Q8.3. | Ask shop assistants or staff |
| Q8.4. | I look for the specific logo |
| Q8.5. | I look for the logo of a recognised certification unit that authenticates the product |
| Q8.6. | Scan the QR code for more information |
| Q9.a. | Advantages of family farm products compared to ordinary products (before information on the benefits of purchasing agri-food products from family farms) |
| Q9.1.a. | The story behind the product |
| Q9.2.a. | It is grown in traditional Romanian farms |
| Q9.3.a. | It is tastier |
| Q9.4.a. | It is fresher |
| Q9.5.a. | It is healthier |
| Q9.6.a. | Supporting the local economy |
| Q9.b. | Advantages of family farm products compared to ordinary products (after information on the benefits of purchasing agri-food products from family farms) |
| Q9.1.b. | The story behind the product |
| Q9.2.b. | It is grown in traditional Romanian farms |
| Q9.3.b. | It is tastier |
| Q9.4.b. | It is fresher |
| Q9.5.b. | It is healthier |
| Q9.6.b. | Supporting the local economy |
| Q10.1. | Less commercial aspect |
| Q10.2. | Hard to reach |
| Q10.3. | More expensive |
| Q10.4. | Not properly labelled |
| Q10.5. | Poor promotion of the quality of these products |
| Q11.a. | Price willing to be paid for family farm products (before information on the benefits of purchasing agri-food products from family farms) |
| Q11.1.a. | The same |
| Q11.2.a. | 10% more |
| Q11.3.a. | 20% more |
| Q11.4.a. | More than 30% more |
| Q11.5.a. | Not willing to buy |
| Q11.b. | Price willing to be paid for family farm products (after information on the benefits of purchasing agri-food products from family farms) |
| Q11.1.b. | The same |
| Q11.2.b. | 10% more |
| Q11.3.b. | 20% more |
| Q11.4.b. | More than 30% more |
| Q11.5.b. | Not willing to buy |
| Q12. | Agri-food products they would buy from the family farm |
| Q12.1. | Fruit |
| Q12.2. | Vegetable |
| Q12.3. | Meat and egg products |
| Q12.4. | Dairy products |
| Q12.5. | Fish and fish derivatives |
| Q13. | Accessibility of products from the family farm |
| Q13.1. | Association of family farms |
| Q13.2. | Appropriate labelling |
| Q13.3. | Specialist shops |
| Q13.4. | A platform dedicated to these types of products |
| Q13.5. | Intensive promotion of these products |
| Q13.6. | Dedicated section for products from these farms |
References
- Agresti, A. Categorical Data Analysis, 2nd ed.; Wiley-Interscience: Hoboken, NJ, USA, 2002; ISBN 978-0-471-45876-0. [Google Scholar]
- Liao, P.A.; Chang, H.H.; He, J.; Saeliw, K. Diversification of Marketing Strategies among Small Farms: Empirical Evidence from Family Farms in Taiwan. Agric. Econ. 2017, 63, 493–501. [Google Scholar] [CrossRef] [Green Version]
- Du, G.; Li, S.; Zheng, R.; Du, J. A Research Evaluating Family Farm Development in Guangdong. Adv. Soc. Sci. Educ. Humanit. Res. 2018, 291, 191–195. [Google Scholar] [CrossRef] [Green Version]
- FAO. The Future of Family Farming in the Context of the 2030 Agenda; Food and Agriculture Organization of the United Nations, Joint Secretariat FAO–IFAD: Rome, Italy, 2019. [Google Scholar]
- Micu, M.M.; Dumitru, E.A.; Vintu, C.R.; Tudor, V.C.; Fintineru, G. Models Underlying the Success Development of Family Farms in Romania. Sustainability 2022, 14, 2443. [Google Scholar] [CrossRef]
- Dumitru, E.A.; Micu, M.M.; Sterie, C.M. The Key to the Development of Agricultural Cooperatives in Romania from the Perspective of Those Who Run Them. Outlook Agric. 2022, 52, 89–100. [Google Scholar] [CrossRef]
- Henry, B.K.; Murphy, B.W.; Cowie, A. Sustainable Land Management for Environmental Benefits and Food Security; A Synthesis Report for the GEF; GEF: Washington, DC, USA, 2019. [Google Scholar]
- Roberts, A.M.; Pannell, D.J. Piloting a Systematic Framework for Public Investment in Regional Natural Resource Management: Dryland Salinity in Australia. Land Use Policy 2009, 26, 1001–1010. [Google Scholar] [CrossRef]
- Aronoff, C.E.; Ward, J.L. Family-Owned Businesses: A Thing of the Past or a Model for the Future? Fam. Bus. Rev. 1995, 8, 121–130. [Google Scholar] [CrossRef]
- Guth, M.; Stępień, S.; Smędzik-Ambroży, K.; Matuszczak, A. Is Small Beautiful? Techinical Efficiency and Environmental Sustainability of Small-Scale Family Farms under the Conditions of Agricultural Policy Support. J. Rural Stud. 2022, 89, 235–247. [Google Scholar] [CrossRef]
- Stevanović, A.T.; Ćalović, D.; Lalić, G.; Žuža, M.; Cvijanović, G. Comparative analysis of the economic potential of the small and family farms in the Republic of Serbia and Romania. Екoнoмика Пoљoпривреде 2020, 67, 667–681. [Google Scholar] [CrossRef]
- Yusuf, I.M. Analysis of Family Labour Utilization in the Production of Selected Crops in Dry-Lands: Evidence from Kahutu, Katsina State, Nigeria. Agrosearch 2019, 18, 15–27. [Google Scholar] [CrossRef]
- Mair, S.; Rombach, M. Taking the Helm at the Family Operation under the Watchful Eye of the Predecessor: Succession in European Horticulture and Agriculture. Eur. J. Hortic. Sci 2020, 85, 123–132. [Google Scholar] [CrossRef]
- Niederle, P.; Grisa, C.; Picolotto, E.L.; Soldera, D. Narrative Disputes over Family-Farming Public Policies in Brazil: Conservative Attacks and Restricted Countermovements. Lat. Am. Res. Rev. 2019, 54, 707–720. [Google Scholar] [CrossRef] [Green Version]
- Plana-Farran, M.; Gallizo, J.L. The Survival of Family Farms: Socioemotional Wealth (SEW) and Factors Affecting Intention to Continue the Business. Agriculture 2021, 11, 520. [Google Scholar] [CrossRef]
- Guina, J.; Ferrão, J.; Samamad, N.; Fernandes, T.; Guina, J.; Ferrão, J.; Samamade, N.; Fernandes, T. Outlook on Mozambique’s Agribusiness as a Driving Force for Family Farmers. Eur. J. Agric. Food Sci. 2023, 5, 85–96. [Google Scholar] [CrossRef]
- Iancu, T.; Petre, I.L.; Tudor, V.C.; Micu, M.M.; Ursu, A.; Teodorescu, F.R.; Dumitru, E.A. A Difficult Pattern to Change in Romania, the Perspective of Socio-Economic Development. Sustainability 2022, 14, 2350. [Google Scholar] [CrossRef]
- Fernández-Ferrín, P.; Bande, B.; Galán-Ladero, M.M.; Martín-Consuegra, D.; Díaz, E.; Castro-González, S. Geographical Indication Food Products and Ethnocentric Tendencies: The Importance of Proximity, Tradition, and Ethnicity. J. Clean. Prod. 2019, 241, 118210. [Google Scholar] [CrossRef]
- Wiatt, R.D.; Marshall, M.I.; Musselman, R. Management and Ownership Transfer in Small and Medium Family Farms. Agric. Financ. Rev. 2022, 82, 505–521. [Google Scholar] [CrossRef]
- Marchant Santiago, C.; Olivares, F.; Caviedes, J.; Santana, F.; Monterrubio-Solís, C.; Ibarra, J.T. Agrobiodiversity in Mountain Territories: Family Farming and the Challenges of Social-Environmental Changes. In Montology Palimpsest: A Primer of Mountain Geographies; Springer International Publishing: Cham, Switzerland, 2022; pp. 313–331. [Google Scholar] [CrossRef]
- Brown, S.A.; Rotman, R.M.; Powell, M.A.; Wilhelm Stanis, S.A. Conservation Easements: A Tool for Preserving Wildlife Habitat on Private Lands. Wildl. Soc. Bull. 2023, 47, e1415. [Google Scholar] [CrossRef]
- Chenglong, Z.; Zhaohui, Y.; Chenglong, Z.; Zhaohui, Y. The Impact Mechanism of Entrepreneurial Learning on Rural Entrepreneurial Well-Being: Based on the Survey Data of 743 Family Farmers. J. Yunnan Agric. Univ. 2023, 17, 1–9. [Google Scholar] [CrossRef]
- Marsden, A.R.; Zander, K.K.; Lassa, J.A. Smallholder Farming during COVID-19: A Systematic Review Concerning Impacts, Adaptations, Barriers, Policy, and Planning for Future Pandemics. Land 2023, 12, 404. [Google Scholar] [CrossRef]
- Pittman, R.; Jandová, M.; Król, M.; Nekrasenko, L.; Paleta, T. The Effectiveness of EC Policies to Move Freight from Road to Rail: Evidence from CEE Grain Markets. Res. Transp. Bus. Manag. 2020, 37, 100482. [Google Scholar] [CrossRef]
- Dumitru, E.A.; Petre, L.I. Family Farm: Solution for Sustainable Development of Rural Area. In Proceedings of the 12th International Symposium “Agricultural Economics and Rural Development—Realities and Perspectives for Romania", 12th ed.; The Research Institute for Agricultural Economy and Rural Development (ICEADR): Bucharest, Romania, 2021; pp. 200–208. [Google Scholar]
- Bernard de Raymond, A. Detaching from Agriculture? Field-Crop Specialization as a Challenge to Family Farming in Northern Côte d’Or, France. J. Rural Stud. 2013, 32, 283–294. [Google Scholar] [CrossRef]
- Qin, X.; Wang, X.; Xu, Y.; Wei, Y. Exploring Driving Forces of Green Growth: Empirical Analysis on China’s Iron and Steel Industry. Sustainability 2019, 11, 1122. [Google Scholar] [CrossRef] [Green Version]
- Liu, C.; Wang, T.; Guo, Q. Factors Aggregating Ability and the Regional Differences among China’s Urban Agglomerations. Sustainability 2018, 10, 4179. [Google Scholar] [CrossRef] [Green Version]
- Sterie, C.M.; Dumitru, E.A. Current situation of romanian certified products. Sci. Pap. Ser. Manag. Econ. Eng. Agric. Rural Dev. 2021, 21, 555–560. [Google Scholar]
- Dal Belo Leite, J.G.; Bijman, J.; Van Ittersum, M.K.; Slingerland, M. Producer Organizations, Family Farms and Market Connection. Outlook Agric. 2014, 43, 101–108. [Google Scholar] [CrossRef]
- Albicette, M.M.; Leoni, C.; Ruggia, A.; Scarlato, S.; Blumetto, O.; Albín, A.; Aguerre, V. Co-Innovation in Family-Farming Livestock Systems in Rocha, Uruguay: A 3-Year Learning Process. Outlook Agric. 2017, 46, 92–98. [Google Scholar] [CrossRef]
- Boncinelli, M. Campagna Amica: From Farm to Consumer. In Traditional Food Production and Rural Sustainable Development: A European Challenge; Marino, M., Caracciolo, F., Eds.; Springer International Publishing: Berlin/Heidelberg, Germany, 2018; pp. 235–246. [Google Scholar]
- Mungai, L.M.; Snapp, S.; Messina, J.P.; Chikowo, R.; Smith, A.; Anders, E.; Richardson, R.B.; Li, G. Smallholder Farms and the Potential for Sustainable Intensification. Front. Plant Sci. 2016, 7, 1720. [Google Scholar] [CrossRef] [Green Version]
- Chen, Y.; Fu, X.; Liu, Y. Effect of Farmland Scale on Farmers’ Application Behavior with Organic Fertilizer. Int. J. Environ. Res. Public Health 2022, 19, 4967. [Google Scholar] [CrossRef]
- Corallo, A.; De Giovanni, M.; Latino, M.E.; Menegoli, M. Leveraging on Technology and Sustainability to Innovate the Supply Chain: A Proposal of Agri-Food Value Chain Model. Supply Chain Manag. 2023. ahead-of-print. [Google Scholar] [CrossRef]
- Klikocka, H.; Zakrzewska, A.; Chojnacki, P. Characteristics of Models of Farms in the European Union. Sustainability 2021, 13, 4772. [Google Scholar] [CrossRef]
- Farrell, M.; Murtagh, A.; Weir, L.; Conway, S.F.; McDonagh, J.; Mahon, M. Irish Organics, Innovation and Farm Collaboration: A Pathway to Farm Viability and Generational Renewal. Sustainability 2022, 14, 93. [Google Scholar] [CrossRef]
- Maican, S.Ș.; Muntean, A.C.; Paștiu, C.A.; Stępień, S.; Polcyn, J.; Dobra, I.B.; Dârja, M.; Moisă, C.O. Motivational Factors, Job Satisfaction, and Economic Performance in Romanian Small Farms. Sustainability 2021, 13, 5832. [Google Scholar] [CrossRef]
- Corallo, A.; Latino, M.E.; Menegoli, M.; De Devitiis, B.; Viscecchia, R. Human Factor in Food Label Design to Support Consumer Healthcare and Safety: A Systematic Literature Review. Sustainability 2019, 11, 4019. [Google Scholar] [CrossRef] [Green Version]
- Wu, F. Adoption and Income Effects of New Agricultural Technology on Family Farms in China. PLoS ONE 2022, 17, e0267101. [Google Scholar] [CrossRef]
- Angulo, A.M.; Gil, J.M.; Tamburo, L. Food Safety and Consumers’ Willingness to Pay for Labelled Beef in Spain. J. Food Prod. Mark. 2008, 11, 89–105. [Google Scholar] [CrossRef]
- Paul, J.; Rana, J. Consumer Behavior and Purchase Intention for Organic Food. J. Consum. Mark. 2012, 29, 412–422. [Google Scholar] [CrossRef]
- Yu, Y.; Hu, Y.; Gu, B.; Reis, S.; Yang, L. Reforming Smallholder Farms to Mitigate Agricultural Pollution. Environ. Sci. Pollut. Res. 2022, 29, 13869–13880. [Google Scholar] [CrossRef]
- Lobb, A.E.; Mazzocchi, M.; Traill, W.B. Modelling Risk Perception and Trust in Food Safety Information within the Theory of Planned Behaviour. Food Qual. Prefer. 2007, 18, 384–395. [Google Scholar] [CrossRef]
- Angulo, A.M.; Gil, J.M. Risk Perception and Consumer Willingness to Pay for Certified Beef in Spain. Food Qual. Prefer. 2007, 18, 1106–1117. [Google Scholar] [CrossRef]
- Heiman, G. Basic Statistics for the Behavioral Sciences, 8th ed.; Cengage Learning: Boston, MA, USA, 2017; ISBN 9781285531779. [Google Scholar]
- Gravetter, F.J.; Wallnau, L.B. Statistics for the Behavioral Sciences; W. Ross MacDonald School Resource Services Library: Brantford, ON, Canada, 2016; ISBN 9789814844710. [Google Scholar]
- Field, A.P. Discovering Statistics Using IBM SPSS Statistics; SAGE Publications: Thousand Oaks, CA, USA, 2013; ISBN 9781446263914. [Google Scholar]
- Kutner, M.H.; Nachtsheim, C.; Neter, J. Simple Liniar Regression. In Applied Linear Regression Models; McGraw-Hill/Irwin: New York, NY, USA, 2004; pp. 1–40. ISBN 0072386916. [Google Scholar]
- Cohen, J.; Cohen, P.; West, S.G.; Aiken, L.S. Applied Multiple Regression/Correlation Analysis for the Behavioral Sciences, 3rd ed.; Routledge: New York, NY, USA, 2013; ISBN 9780203774441. [Google Scholar]
- Field, A.; Miles, J.; Field, Z. Discovering Statistics Using R; SAGE Publications: Thousand Oaks, CA, USA, 2012; ISBN 9781446200452. [Google Scholar]
- Foroudi, P.; Nazarian, A.; Ziyadin, S.; Kitchen, P.; Hafeez, K.; Priporas, C.; Pantano, E. Co-Creating Brand Image and Reputation through Stakeholder’s Social Network. J. Bus. Res. 2020, 114, 42–59. [Google Scholar] [CrossRef]
- Cha, J.M.; Borchgrevink, C.P. Customers’ Perceptions in Value and Food Safety on Customer Satisfaction and Loyalty in Restaurant Environments: Moderating Roles of Gender and Restaurant Types. J. Qual. Assur. Hosp. Tour. 2018, 20, 143–161. [Google Scholar] [CrossRef]
- Popescu, G.; Chirila, C.; Draghici, M. Exploring Consumer Preferences for Agri-Food Products: A Study in Romania. Agric. Econ. Rural Dev. Realities Perspect. Rom. 2017, 8, 57–64. [Google Scholar]
- Qiu, T.; Choy, S.T.B.; Luo, B. Is Small Beautiful? Links between Agricultural Mechanization Services and the Productivity of Different-Sized Farms. Appl. Econ. 2021, 54, 430–442. [Google Scholar] [CrossRef]
Figure 1.
The importance of family farms. (Source: processing according to FAO, accessed 10 February 2023).
Figure 1.
The importance of family farms. (Source: processing according to FAO, accessed 10 February 2023).

Figure 2.
Competitive advantages of the family farm. (Source: processing according to [18,19,20,21,22,23]).


Figure 4.
Comparative analysis of the price willing to be paid for family farm products (before and after information on the benefits of purchasing agri-food products from family farms). Source: in-house processing.
Figure 4.
Comparative analysis of the price willing to be paid for family farm products (before and after information on the benefits of purchasing agri-food products from family farms). Source: in-house processing.

Figure 5.
Logo made with the help of AI. Source: processing with Bing Create.


Table 1.
Descriptive statistics of responses on consumption habits. Source: in-house processing.
| N | Sum | Mean | Std. Deviation | Variance | Skewness | Kurtosis | |||
|---|---|---|---|---|---|---|---|---|---|
| Std. Error | Std. Error | ||||||||
| Preferred place of purchase of agri-food products (Q4.) | |||||||||
| Supermarket (Q4.1.) | 312 | 1123 | 3.60 | 1.225 | 1.501 | −0.622 | 0.138 | −0.574 | 0.275 |
| The fly market (Q4.2.) | 312 | 834 | 2.67 | 1.505 | 2.266 | 0.216 | 0.138 | −1.325 | 0.275 |
| Producer fair (Q4.3.) | 312 | 1037 | 3.32 | 1.037 | 1.075 | −0.192 | 0.138 | −0.444 | 0.275 |
| Small commercial unit for the sale of agri-food products (Q4.4.) | 312 | 762 | 2.44 | 1.163 | 1.354 | 0.091 | 0.138 | −1.195 | 0.275 |
| Neighbourhood shop (Q4.5.) | 312 | 927 | 2.97 | 1.152 | 1.327 | 0.158 | 0.138 | −0.998 | 0.275 |
| Producer shop/direct producer (Q4.6.) | 312 | 900 | 2.88 | 1.189 | 1.414 | 0.132 | 0.138 | −0.773 | 0.275 |
| Online shop (Q4.7.) | 312 | 952 | 3.05 | 1.226 | 1.502 | 0.144 | 0.138 | −0.868 | 0.275 |
| Frequency of purchase (Q5.) | |||||||||
| Fresh fruit and vegetables (Q5.1.) | 312 | 1346 | 4.31 | 0.792 | 0.628 | −1.286 | 0.138 | 0.2 | 0.275 |
| Dairy and milk products (Q5.2.) | 312 | 1175 | 3.77 | 1.151 | 1.325 | −0.692 | 0.138 | −0.608 | 0.275 |
| Meat and meat products (Q5.3.) | 312 | 1164 | 3.73 | 1.191 | 1.419 | −0.523 | 0.138 | −0.686 | 0.275 |
| Cereals and cereal products (Q5.4.) | 312 | 1152 | 3.69 | 0.966 | 0.934 | −0.727 | 0.138 | 0.213 | 0.275 |
| Other categories of food products (Q5.5.) | 312 | 984 | 3.15 | 1.233 | 1.520 | −0.047 | 0.138 | −0.921 | 0.275 |
| Criteria for choosing an agri-food product (Q6.) | |||||||||
| Quality (Q6.1.) | 312 | 1090 | 3.49 | 1.253 | 1.569 | −0.593 | 0.138 | −0.788 | 0.275 |
| Price (Q6.2.) | 312 | 1118 | 3.58 | 1.351 | 1.826 | −0.579 | 0.138 | −0.947 | 0.275 |
| Provenance (Q6.3.) | 312 | 1050 | 3.37 | 1.303 | 1.699 | −0.158 | 0.138 | −1.135 | 0.275 |
| Method of cultivation/growing (Q6.4.) | 312 | 986 | 3.16 | 1.192 | 1.421 | −0.152 | 0.138 | −0.652 | 0.275 |
| Brand of products (Q6.5.) | 312 | 1144 | 3.47 | 0.971 | 0.943 | −0.477 | 0.138 | −0.035 | 0.275 |
| Product certification (Q6.6.) | 312 | 1003 | 3.21 | 1.209 | 1.462 | −0.221 | 0.138 | −0.798 | 0.275 |
| Other aspects (Q6.6.) | 312 | 899 | 2.88 | 1.243 | 1.545 | 0.075 | 0.138 | −1.089 | 0.275 |
| Frequency of purchase of agri-food products by origin/category (Q7.) | |||||||||
| Imported products (Q7.1.) | 312 | 1239 | 3.97 | 1.174 | 1.379 | −1.203 | 0.138 | 0.589 | 0.275 |
| Products in Romania (Q7.2.) | 312 | 904 | 2.90 | 1.238 | 1.533 | 0.135 | 0.138 | −1.050 | 0.275 |
| Local products (Q7.3.) | 312 | 876 | 2.81 | 1.201 | 1.442 | 0.252 | 0.138 | −0.766 | 0.275 |
| Short chain (direct from the producer) (Q7.4.) | 312 | 846 | 2.71 | 1.123 | 1.261 | 0.162 | 0.138 | −0.550 | 0.275 |
| Certified products (Q7.5.) | 312 | 973 | 3.12 | 1.168 | 1.365 | −0.184 | 0.138 | −0.827 | 0.275 |
| Produced on family farms (Q7.6.) | 312 | 633 | 2.03 | 1.050 | 1.102 | 0.882 | 0.138 | 0.126 | 0.275 |
Table 2.
Descriptive statistics of specific responses. Source: in-house processing.
| N | Sum | Mean | Std. Deviation | Variance | Skewness | Kurtosis | |||
|---|---|---|---|---|---|---|---|---|---|
| Std. Error | Std. Error | ||||||||
| How to distinguish agri-food products (Q8.) | |||||||||
| Read product labels carefully (Q8.1.) | 312 | 938 | 3.01 | 1.224 | 1.498 | −0.044 | 0.138 | −0.894 | 0.275 |
| I look for information about the manufacturer (Q8.2.) | 312 | 861 | 2.76 | 1.231 | 1.514 | 0.217 | 0.138 | −0.884 | 0.275 |
| Ask shop assistants or staff (Q8.3.) | 312 | 993 | 3.18 | 1.190 | 1.417 | −0.346 | 0.138 | −0.595 | 0.275 |
| I look for the specific logo (traditional product, mountain product, etc.) (Q8.4.) | 312 | 891 | 2.86 | 1.230 | 1.513 | 0.037 | 0.138 | −0.917 | 0.275 |
| I look for the logo of a recognised certification unit that authenticates the product (Q8.5.) | 312 | 1015 | 3.25 | 1.183 | 1.399 | −0.302 | 0.138 | −0.739 | 0.275 |
| Scan the QR code for more information (Q8.6.) | 312 | 757 | 2.43 | 1.250 | 1.564 | 0.551 | 0.138 | −0.746 | 0.275 |
| Advantages of family farm products compared to ordinary products (Q9.a.) (Part 1) | |||||||||
| The story behind the product (Q9.1.a.) | 312 | 650 | 2.08 | 1.151 | 1.324 | 0.957 | 0.138 | 0.034 | 0.275 |
| It is grown in traditional Romanian farms (Q9.2.a.) | 312 | 632 | 2.03 | 1.058 | 1.118 | 0.802 | 0.138 | −0.123 | 0.275 |
| It is tastier (Q9.3.a.) | 312 | 1234 | 3.96 | 1.066 | 1.136 | −0.872 | 0.138 | 0.148 | 0.275 |
| It is fresher (Q9.4.a.) | 312 | 1195 | 3.83 | 1.162 | 1.350 | −0.704 | 0.138 | −0.434 | 0.275 |
| It is healthier (Q9.5.a.) | 312 | 1193 | 3.82 | 1.194 | 1.425 | −0.796 | 0.138 | −0.276 | 0.275 |
| Supporting the local economy (Q9.6.a.) | 312 | 671 | 2.15 | 1.195 | 1.427 | 0.891 | 0.138 | −0.153 | 0.275 |
| Disadvantages of family farm products compared to ordinary products (Q10.) | |||||||||
| Less commercial aspect (Q10.1.) | 312 | 1120 | 3.59 | 1.161 | 1.349 | −0.740 | 0.138 | −0.212 | 0.275 |
| Hard to reach (Q10.2.) | 312 | 1262 | 4.04 | 1.104 | 1.220 | −1.199 | 0.138 | 0.930 | 0.275 |
| More expensive (Q10.3.) | 312 | 1096 | 3.51 | 1.273 | 1.620 | −0.485 | 0.138 | −0.877 | 0.275 |
| Not properly labelled (Q10.4.) | 312 | 1223 | 3.92 | 1.083 | 1.174 | −1.062 | 0.138 | 0.805 | 0.275 |
| Poor promotion of the quality of these products (Q10.5.) | 312 | 1290 | 4.13 | 1.182 | 1.397 | −1.204 | 0.138 | 0.284 | 0.275 |
Table 3.
Descriptive statistics of specific responses applied in the second part of the survey. Source: in-house processing.
Table 3.
Descriptive statistics of specific responses applied in the second part of the survey. Source: in-house processing.
| N | Sum | Mean | Std. Deviation | Variance | Skewness | Kurtosis | |||
|---|---|---|---|---|---|---|---|---|---|
| Std. Error | Std. Error | ||||||||
| Advantages of family farm products compared to ordinary products (Q9.b.) (Part 2) | |||||||||
| The story behind the product (Q9.1.b.) | 312 | 1107 | 3.55 | 1.300 | 1.689 | −0.734 | 0.138 | −0.543 | 0.275 |
| It is grown in traditional Romanian farms (Q9.2.b.) | 312 | 929 | 2.98 | 1.367 | 1.868 | −0.104 | 0.138 | −1.240 | 0.275 |
| It is tastier (Q9.3.b.) | 312 | 1246 | 3.99 | 1.030 | 1.061 | −0.929 | 0.138 | 0.459 | 0.275 |
| It is fresher (Q9.4.b.) | 312 | 1213 | 3.89 | 1.107 | 1.225 | −0.750 | 0.138 | −0.201 | 0.275 |
| It is healthier (Q9.5.b.) | 312 | 1204 | 3.86 | 1.167 | 1.363 | −0.785 | 0.138 | −0.265 | 0.275 |
| Supporting the local economy (Q9.6.b.) | 312 | 1082 | 3.47 | 1.353 | 1.832 | −0.590 | 0.138 | −0.860 | 0.275 |
| Agri-food products they would buy from the family farm (Q12.) | |||||||||
| Fruit (Q12.1.) | 312 | 1205 | 3.86 | 0.854 | 0.730 | −0.852 | 0.138 | 0.933 | 0.275 |
| Vegetable (Q12.2.) | 312 | 1224 | 3.92 | 0.838 | 0.701 | −0.879 | 0.138 | 1.176 | 0.275 |
| Meat and egg products (Q12.3.) | 312 | 1158 | 3.71 | 1.011 | 1.023 | −0.824 | 0.138 | 0.354 | 0.275 |
| Dairy products (Q12.4.) | 312 | 1171 | 3.75 | 1.043 | 1.087 | −0.743 | 0.138 | 0.000 | 0.275 |
| Fish and fish derivatives (Q12.5.) | 312 | 1032 | 3.31 | 1.214 | 1.474 | −0.163 | 0.138 | −1.020 | 0.275 |
| Accessibility of products from the family farm (Q13.) | |||||||||
| Association of family farms (Q13.1.) | 312 | 873 | 2.80 | 1.120 | 1.255 | −0.355 | 0.138 | −0.826 | 0.275 |
| Appropriate labelling (Q13.2.) | 312 | 1225 | 3.93 | 1.063 | 1.130 | −1.049 | 0.138 | 0.821 | 0.275 |
| Specialist shops (Q13.3.) | 312 | 1314 | 4.21 | 1.154 | 1.331 | −1.432 | 0.138 | 1.061 | 0.275 |
| A platform dedicated to these types of products (Q13.4.) | 312 | 964 | 3.09 | 1.236 | 1.529 | 0.116 | 0.138 | −0.911 | 0.275 |
| Intensive promotion of these products (Q13.5.) | 312 | 1215 | 3.89 | 1.057 | 1.117 | −0.905 | 0.138 | 0.489 | 0.275 |
| Dedicated section for products from these farms (Q13.6.) | 312 | 1139 | 3.65 | 1.207 | 1.456 | −0.661 | 0.138 | −0.468 | 0.275 |
Table 4.
Multiple linear regression between the dependent variable (respondents looking for the logo of a recognised certification unit authenticating the product) and the independent variables (age, education, income). Source: in-house processing.
Table 4.
Multiple linear regression between the dependent variable (respondents looking for the logo of a recognised certification unit authenticating the product) and the independent variables (age, education, income). Source: in-house processing.
| Model Summary | ||||||||||
|---|---|---|---|---|---|---|---|---|---|---|
| R | R Square | Adjusted R Square | Std. Error of the Estimate | Change Statistics | Durbin–Watson | |||||
| R Square Change | F Change | df1 | df2 | Sig. F Change | ||||||
| 0.924 | 0.853 | 0.832 | 1.157 | 0.853 | 55.696 | 3 | 308 | 0.001 | 2.054 | |
| Coefficients | ||||||||||
| Unstandardised Coefficients | Standardised Coefficients | t | Sig. | 95.0% Confidence Interval for B | Correlations | |||||
| B | Std. Error | Beta | Lower Bound | Upper Bound | Zero-Order | Partial | Part | |||
| (Constant) | 2.786 | 0.521 | - | 5.349 | 0.000 | 1.761 | 3.811 | - | - | - |
| Q1. | −0.227 | 0.104 | −0.137 | −2.176 | 0.030 | −0.431 | −0.022 | −0.183 | −0.123 | −0.121 |
| Q2. | 0.253 | 0.102 | 0.143 | 2.474 | 0.014 | 0.052 | 0.455 | 0.160 | 0.140 | 0.137 |
| Q3. | 0.081 | 0.095 | 0.053 | 0.848 | 0.037 | −0.106 | 0.267 | 0.091 | 0.048 | 0.047 |
| Residual Statistics | ||||||||||
| Minimum | Maximum | Mean | Std. Deviation | N | ||||||
| Predicted Value | 2.52 | 3.64 | 3.25 | 0.271 | 312 | |||||
| Residual | −2.562 | 2.479 | 0.000 | 1.151 | 312 | |||||
| Std. Predicted Value | −2.700 | 1.435 | 0.000 | 1.000 | 312 | |||||
| Std. Residual | −2.215 | 2.143 | 0.000 | 0.995 | 312 | |||||
Table 5.
Multiple linear regression between dependent variable (respondents purchasing imported products) and the independent variables (age, education, income). Source: in-house processing.
Table 5.
Multiple linear regression between dependent variable (respondents purchasing imported products) and the independent variables (age, education, income). Source: in-house processing.
| Model Summary | ||||||||||
|---|---|---|---|---|---|---|---|---|---|---|
| R | R Square | Adjusted R Square | Std. Error of the Estimate | Change Statistics | Durbin–Watson | |||||
| R Square Change | F Change | df1 | df2 | Sig. F Change | ||||||
| 0.896 | 0.803 | 0.796 | 0.985 | 0.303 | 44.648 | 3 | 308 | 0.000 | 2.122 | |
| Coefficients | ||||||||||
| Unstandardised Coefficients | Standardised Coefficients | t | Sig. | 95.0% Confidence Interval for B | Correlations | |||||
| B | Std. Error | Beta | Lower Bound | Upper Bound | Zero-Order | Partial | Part | |||
| (Constant) | 4.798 | 0.444 | - | 10.817 | 0.000 | 3.925 | 5.671 | - | - | - |
| Q1. | −0.575 | 0.089 | −0.349 | −6.484 | 0.000 | −0.749 | −0.400 | −0.414 | −0.347 | −0.308 |
| Q2. | −0.414 | 0.087 | −0.235 | −4.748 | 0.000 | −0.586 | −0.243 | −0.207 | −0.261 | −0.226 |
| Q3. | 0.388 | 0.081 | 0.257 | 4.802 | 0.000 | 0.229 | 0.547 | 0.429 | 0.264 | 0.228 |
| Residual Statistics | ||||||||||
| Minimum | Maximum | Mean | Std. Deviation | N | ||||||
| Predicted Value | 2.22 | 4.97 | 3.97 | 0.646 | 312 | |||||
| Residual | −3.532 | 2.781 | 0.000 | 0.980 | 312 | |||||
| Std. Predicted Value | −2.711 | 1.549 | 0.000 | 1.000 | 312 | |||||
| Std. Residual | −3.586 | 2.824 | 0.000 | 0.995 | 312 | |||||
Table 6.
Determining associations between variables. Source: in-house processing.
| Crosstabulation | Chi-Square Tests | Symmetric Measures | ||||||||
|---|---|---|---|---|---|---|---|---|---|---|
| Q8.5. and Q2. | Value | df | Asymp. Sig. (2-Sided) | Nominal by Nominal | Value | Approx. Sig. | Interval by Interval | Value | Approx. Sig. | |
| Pearson Chi-Square | 93.71 | 8 | 0.000 | Phi | 0.548 | 0.000 | Pearson’s R | 0.160 | 0.005 | |
| Likelihood Ratio | 103.14 | 8 | 0.000 | Cramer’s V | 0.388 | 0.000 | ||||
| Linear-by-Linear Association | 7.92 | 1 | 0.005 | Contingency Coefficient | 0.481 | 0.000 | ||||
| Q4.1. and Q8.5. | Pearson Chi-Square | 330.988 | 16 | 0.000 | Phi | 1.030 | 0.000 | Pearson’s R | 0.279 | 0.000 |
| Likelihood Ratio | 362.695 | 16 | 0.000 | Cramer’s V | 0.515 | 0.000 | ||||
| Linear-by-Linear Association | 24.175 | 1 | 0.000 | Contingency Coefficient | 0.717 | 0.000 | ||||
| Q6.2. and Q7.1. | Pearson Chi-Square | 239.028 | 16 | 0.000 | Phi | 0.875 | 0.000 | Pearson’s R | −0.383 | 0.000 |
| Likelihood Ratio | 253.338 | 16 | 0.000 | Cramer’s V | 0.438 | 0.000 | ||||
| Linear-by-Linear Association | 45.511 | 1 | 0.000 | Contingency Coefficient | 0.659 | 0.000 | ||||
| Q7.1. and Q8.5. | Pearson Chi-Square | 259.253 | 16 | 0.000 | Phi | 0.912 | 0.000 | Pearson’s R | 0.179 | 0.000 |
| Likelihood Ratio | 287.313 | 16 | 0.000 | Cramer’s V | 0.456 | 0.000 | ||||
| Linear-by-Linear Association | 1.959 | 1 | 0.002 | Contingency Coefficient | 0.674 | 0.000 | ||||
Table 7.
Comparison of group means using ANOVA (Q9. Parts 1 and 2). Source: in-house processing.
| Answer | Sum of Squares | df | Mean Square | F | Sig. | |
|---|---|---|---|---|---|---|
| Q9.1. | Between Groups | 81.802 | 4 | 20.450 | 14.157 | 0.000 |
| Within Groups | 443.477 | 307 | 1.445 | |||
| Total | 525.279 | 311 | ||||
| Q9.2. | Between Groups | 96.192 | 4 | 24.048 | 15.233 | 0.000 |
| Within Groups | 484.651 | 307 | 1.579 | |||
| Total | 580.843 | 311 | ||||
| Q9.3. | Between Groups | 313.187 | 4 | 78.297 | 143.781 | 0.000 |
| Within Groups | 16.800 | 307 | 0.055 | |||
| Total | 329.987 | 311 | ||||
| Q9.4. | Between Groups | 352.429 | 4 | 88.107 | 94.308 | 0.000 |
| Within Groups | 28.644 | 307 | 0.093 | |||
| Total | 381.074 | 311 | ||||
| Q9.5. | Between Groups | 409.014 | 4 | 102.254 | 212.888 | 0.000 |
| Within Groups | 14.780 | 307 | 0.048 | |||
| Total | 423.795 | 311 | ||||
| Q9.6. | Between Groups | 102.591 | 4 | 25.648 | 16.857 | 0.000 |
| Within Groups | 467.089 | 307 | 1.521 | |||
| Total | 569.679 | 311 | ||||
| Q11. | Between Groups | 23.604 | 5 | 4.721 | 4.889 | 0.000 |
| Within Groups | 295.469 | 306 | 0.966 | |||
| Total | 319.074 | 311 |
Disclaimer/Publisher’s Note: The statements, opinions and data contained in all publications are solely those of the individual author(s) and contributor(s) and not of MDPI and/or the editor(s). MDPI and/or the editor(s) disclaim responsibility for any injury to people or property resulting from any ideas, methods, instructions or products referred to in the content. |
© 2023 by the authors. Licensee MDPI, Basel, Switzerland. This article is an open access article distributed under the terms and conditions of the Creative Commons Attribution (CC BY) license (https://creativecommons.org/licenses/by/4.0/).
Share and Cite
MDPI and ACS Style
Dumitru, E.A.; Sterie, C.M.; Rodino, S.; Butu, M. Consumer Preferences in the Purchase of Agri-Food Products: Implications for the Development of Family Farms. Agriculture 2023, 13, 1478. https://doi.org/10.3390/agriculture13081478
AMA Style
Dumitru EA, Sterie CM, Rodino S, Butu M. Consumer Preferences in the Purchase of Agri-Food Products: Implications for the Development of Family Farms. Agriculture. 2023; 13(8):1478. https://doi.org/10.3390/agriculture13081478
Chicago/Turabian StyleDumitru, Eduard Alexandru, Cristina Maria Sterie, Steliana Rodino, and Marian Butu. 2023. "Consumer Preferences in the Purchase of Agri-Food Products: Implications for the Development of Family Farms" Agriculture 13, no. 8: 1478. https://doi.org/10.3390/agriculture13081478
Note that from the first issue of 2016, this journal uses article numbers instead of page numbers. See further details here.