
Assessment of the Performance of Agricultural Tires Using a Mobile Test Bench
 ,
,
Abstract
:1. Introduction
2. Materials and Methods
2.1. Axle Gear Box Unit
2.2. Hydraulic Braking System
2.3. Cooling System
2.4. Ballast
2.5. Measurement Sensors and Electronic Control System
- Timer, measuring the test duration;
- Digital encoder (250 pulses rev−1) (Tekel TK510, Turin, Italy) on a reference free rotating wheel pulled by the MTB-tractor system, which measures the actual travel speed;
- Digital encoder (2500 pulses rev−1) (Tekel TK510, Turin, Italy) measuring the peripheral speed of the tires mounted on the MTB wheels;
- 100.00 kN load cell (AEP Transducers TC4, Modena, Italy) on the coupling device, which measures the traction force (if necessary, it can be replaced with a 200.00 kN load cell);
- 50.00 kN load cell (AEP Transducers TC4, Modena, Italy) which measures the vertical load on the tow-hook.
- Digital encoder (100 pulses rev−1) (Tekel TK510, Turin, Italy) measuring the pump speed;
- Pressure gauge, measuring the oil pressure into the pump (full scale: 30 MPa);
- Thermocouples, measuring the oil temperature into the tank and before the heat exchanger (type PT100, class A, full scale: −71 ÷ 250 °C).
- Instant peripheral speed of the reference wheel, corresponding to the travel speed;
- Instant peripheral speed of the tested tire;
- Instant slip, calculated from the comparison of the two instant velocities;
- Pump speed.
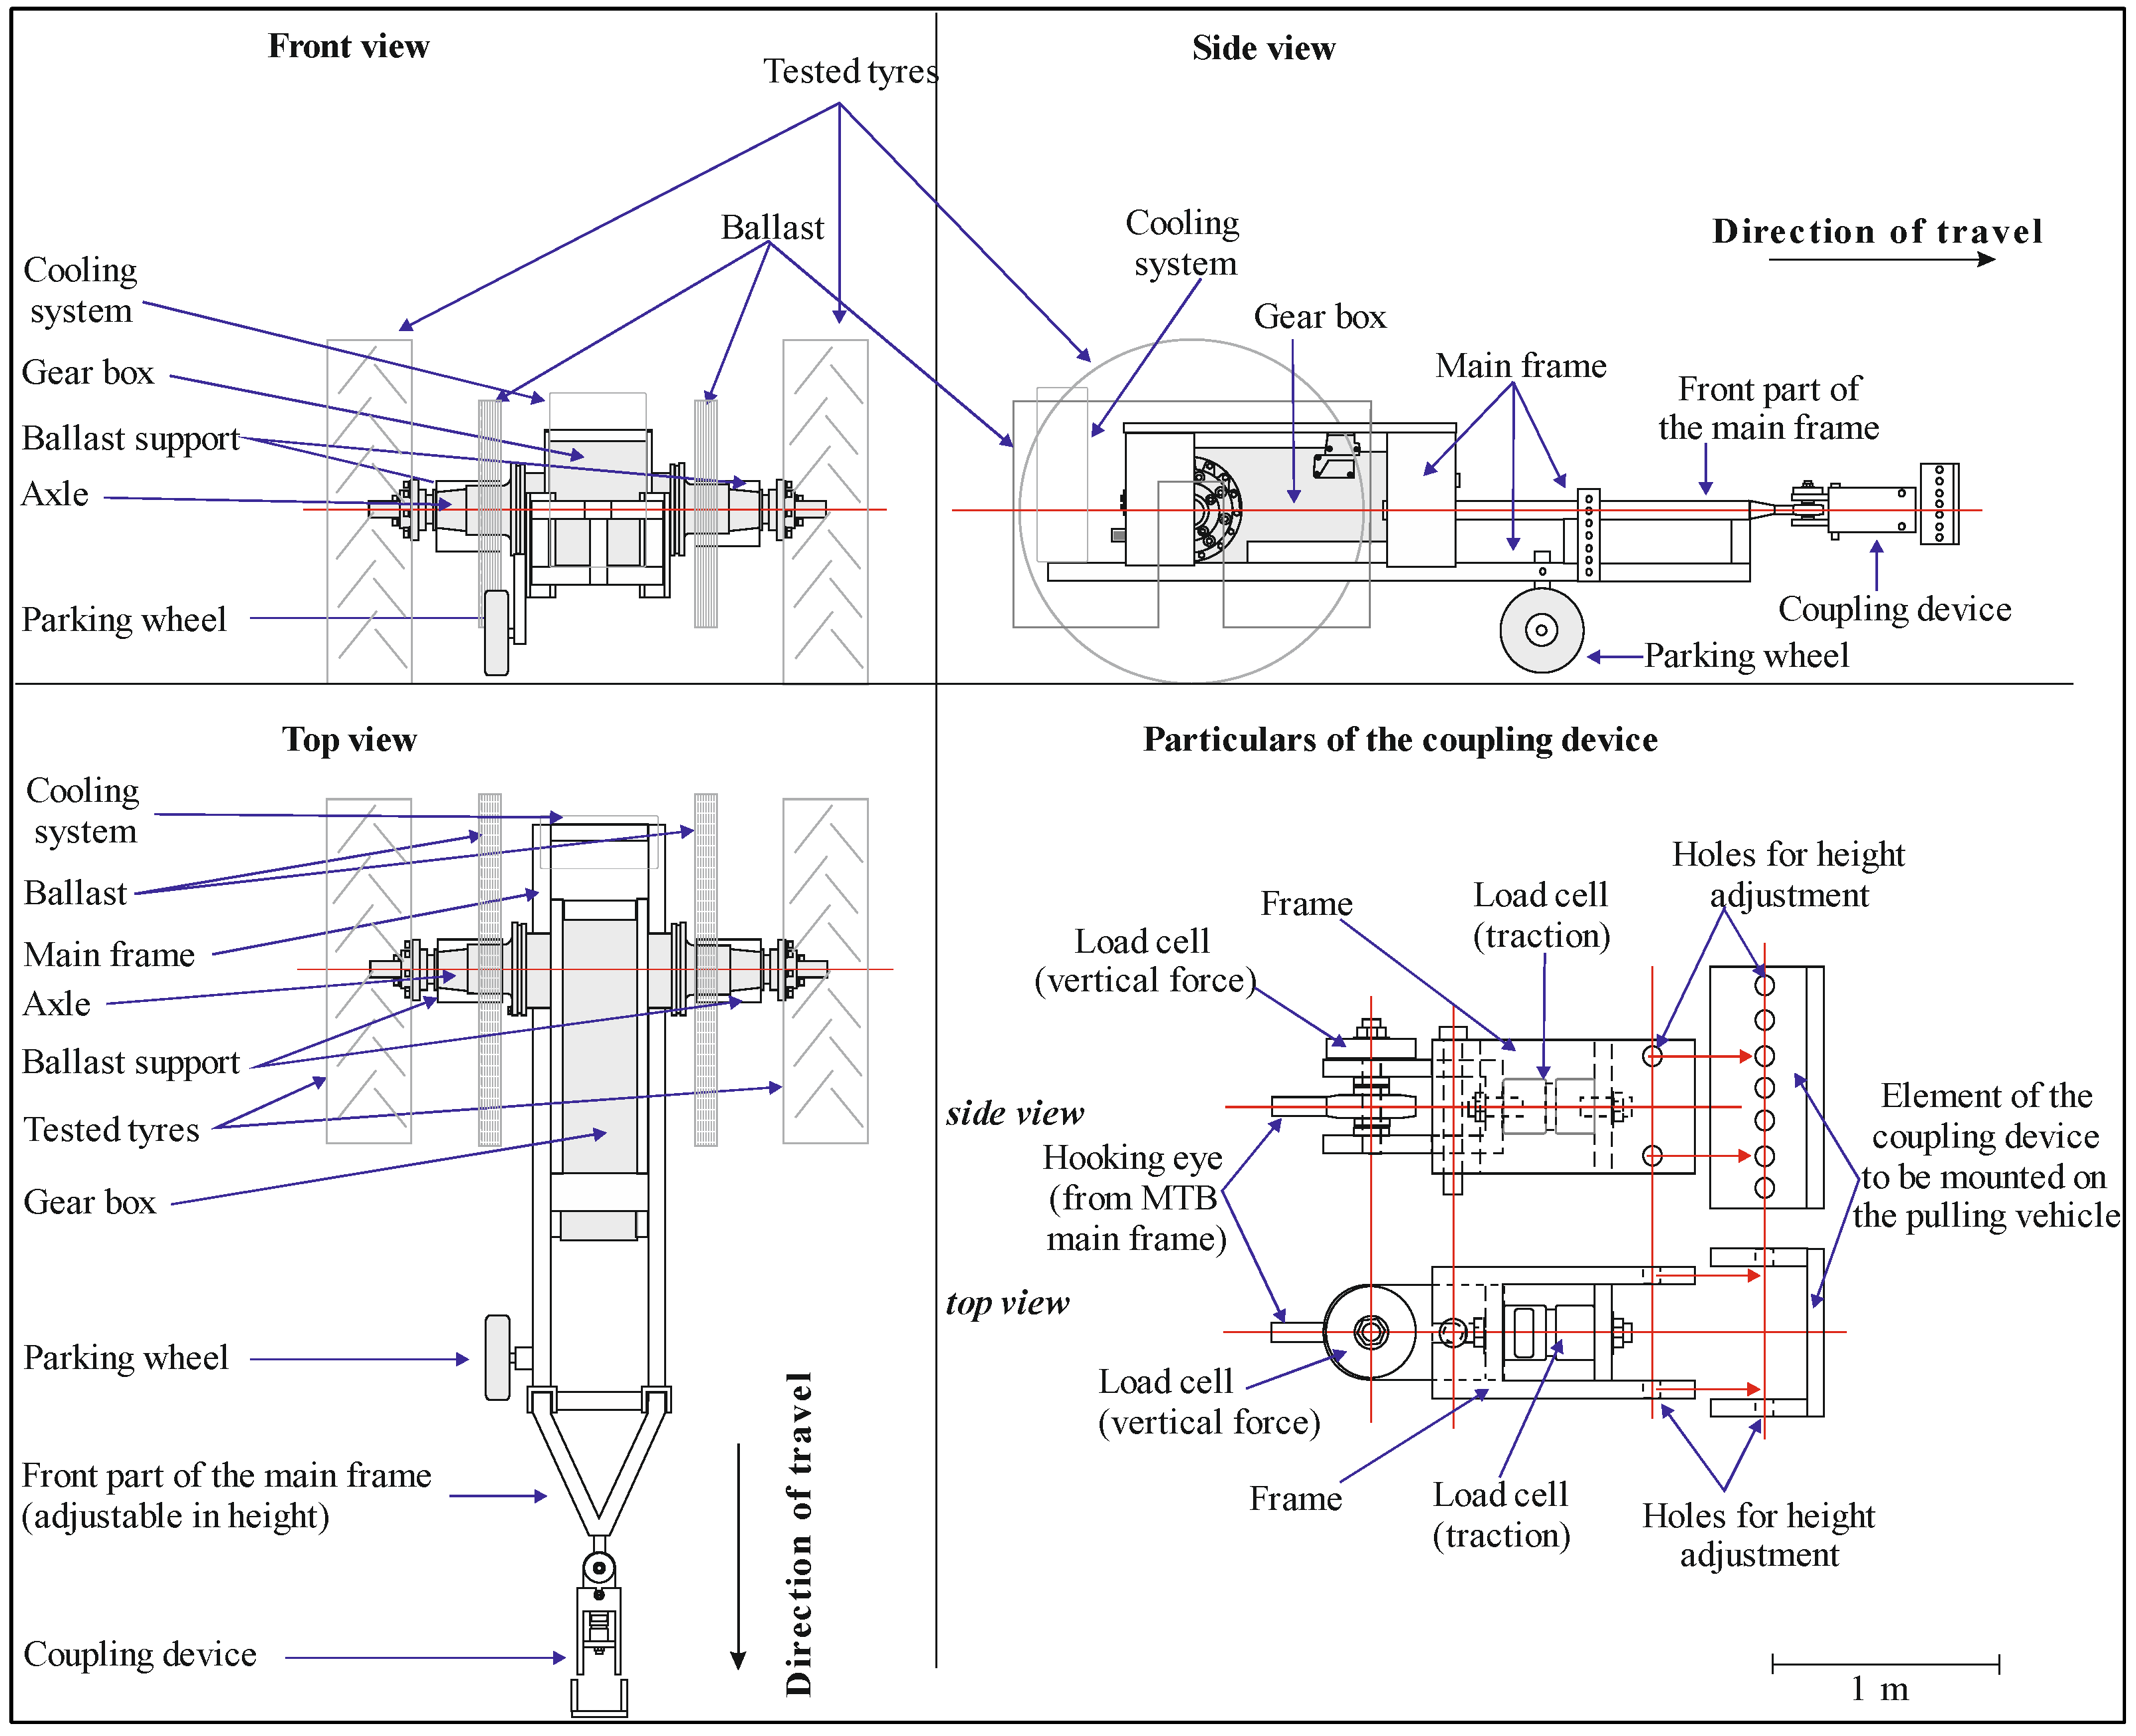
2.6. MTB Frame
- (1)
- The front section supports the pump-valve unit, the battery pack and the electronic control system and a parking wheel which is lifted during the tests. It terminates in a strong structure (whose height can be adjusted by means of a series of holes) supporting the towing eye. This is not connected to a common tow-hook which is instead inserted in a special coupling device sensorized by the two load cells mentioned in Section 2.5, protecting them from transversal shocks. The coupling device is adjustable in height and, despite being mounted in the rear part of the tractor, it is a conceptually integral part of the MTB. The described double height regulation allows us to set the line of action of the traction force on the same horizontal plane passing for the centre of the wheels of the MTB.
- (2)
- The central section is directly connected to the axle and has been dimensioned to support the mass of the oil in the tank and the ballast which rests on the wheel rotation axis.
- (3)
- The rear section supports the cooling system.
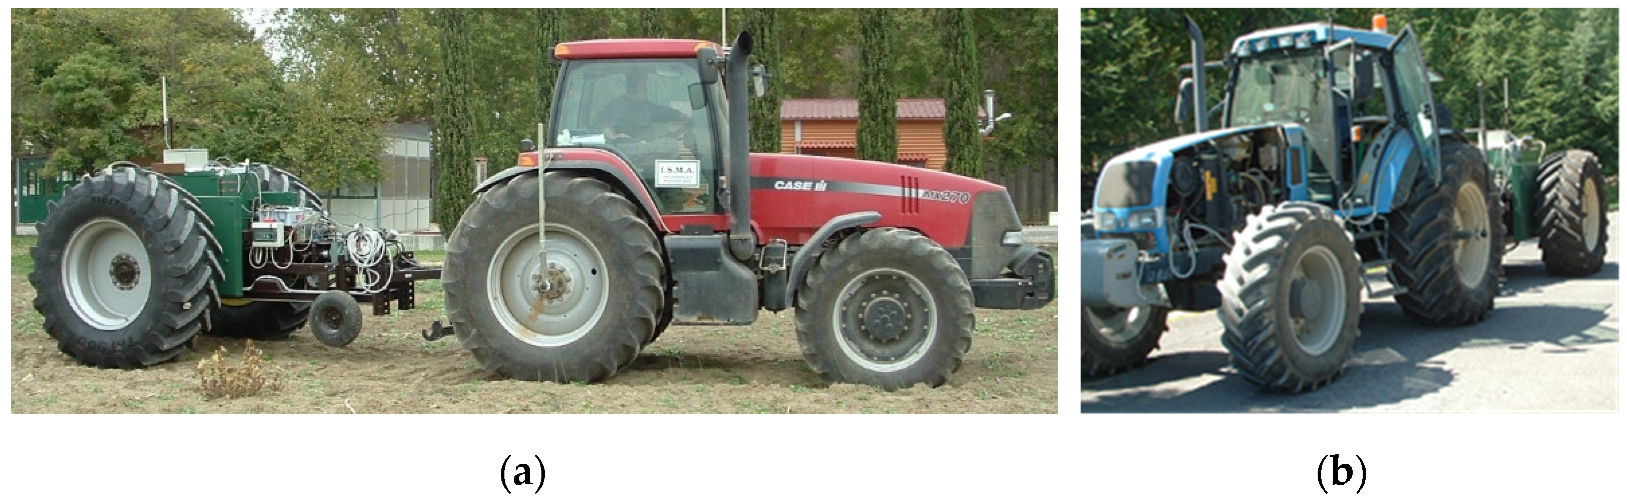
2.7. Traction Vehicles and MTB Functions
2.8. Theoretical Considerations
2.8.1. Travel Speed
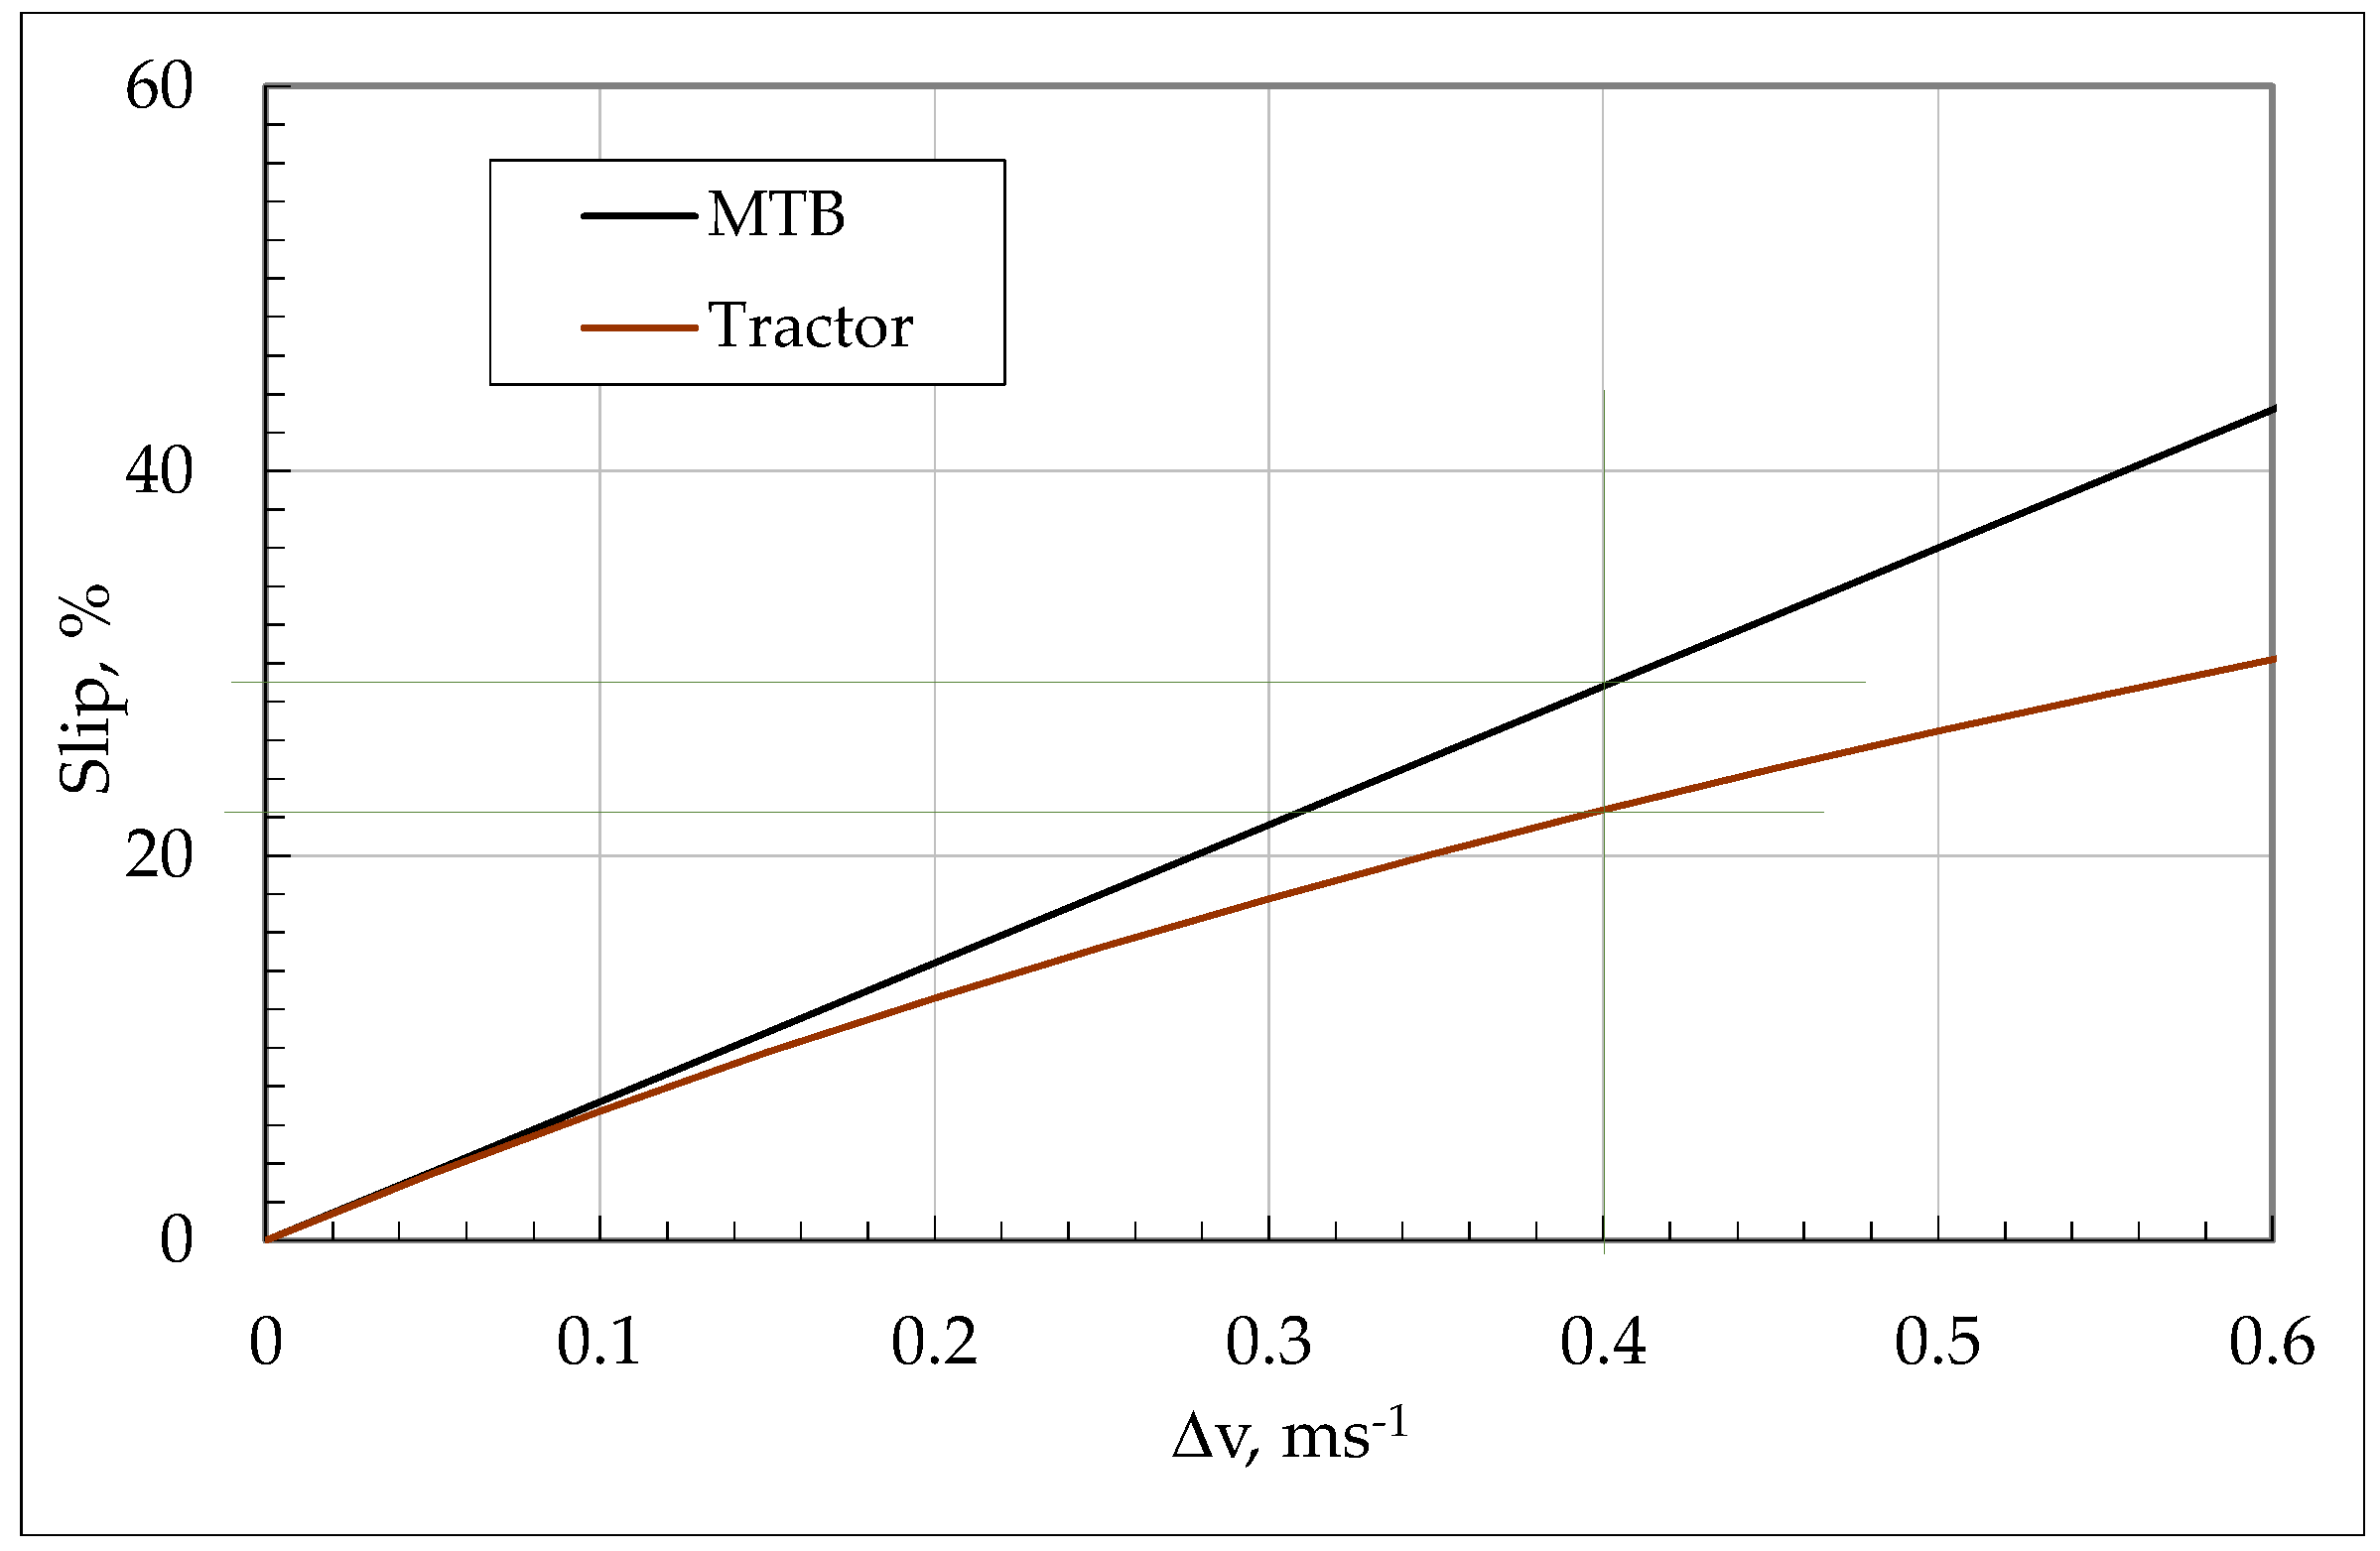
2.8.2. Slip and Tire Mounting Direction
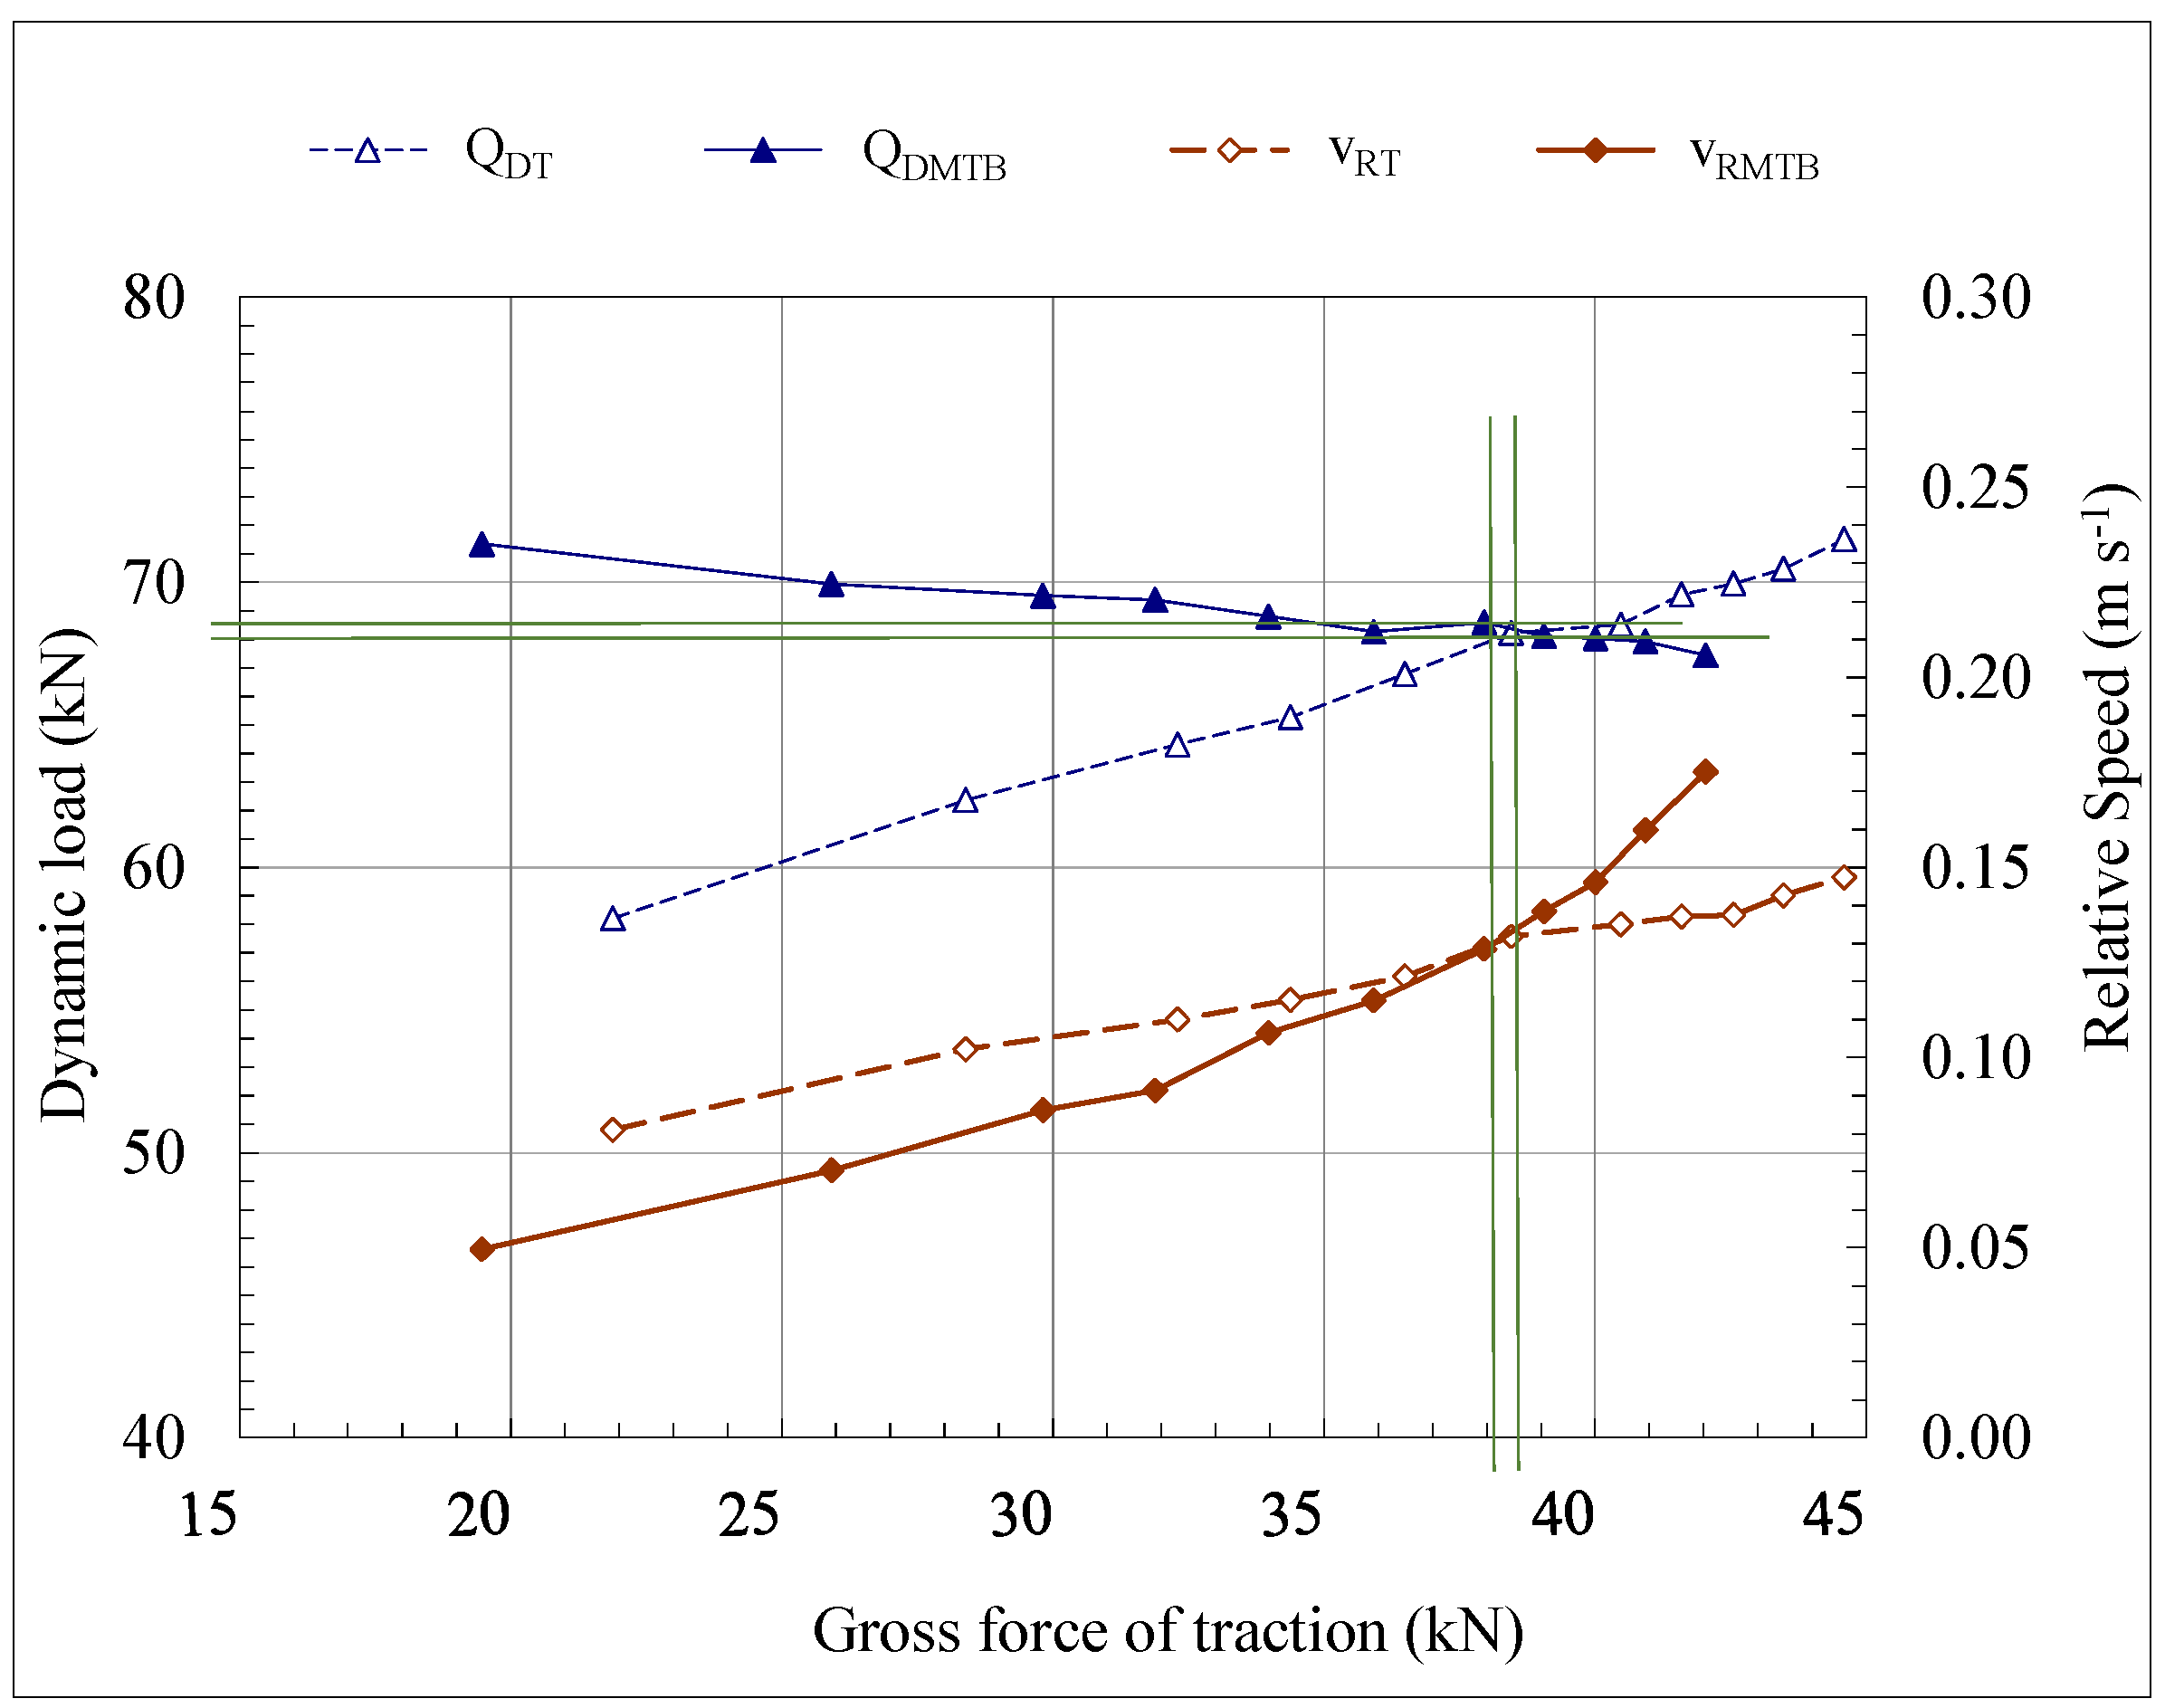
2.8.3. Dynamic Load
- A constant load, cd, determined on the tractor rear part, by applying the coupling device sensorized with the two load cells (0.54 kN). With respect to the rear axle, it is balanced by further a load transfer from the front axle, 1, resulting from Equation (8):where: p, pitch of the tractor (2750 mm); dTaRa, distance between tow-hook and rear axle (1000 mm). According to Equation (8), was equal to 0.16 kN and the resulting load increase on the rear axle caused by the MTB was cd + 1 = 0.704 kN.
- The vertical force, V, on the tow-hook, originated by the MTB load transfer during the tests. V varies during the test and is measured by the special load cell lodged in the coupling device. It is balanced by a load transfer, 2, from the front axle of the tractor, that is calculated, instant by instant, by means of Equation (9):where: p, pitch of the tractor (2750 mm); dTaRa, distance between tow-hook and rear axle (1000 mm). In this case, the dynamic load increase on the tractor rear axle results as V + 2.
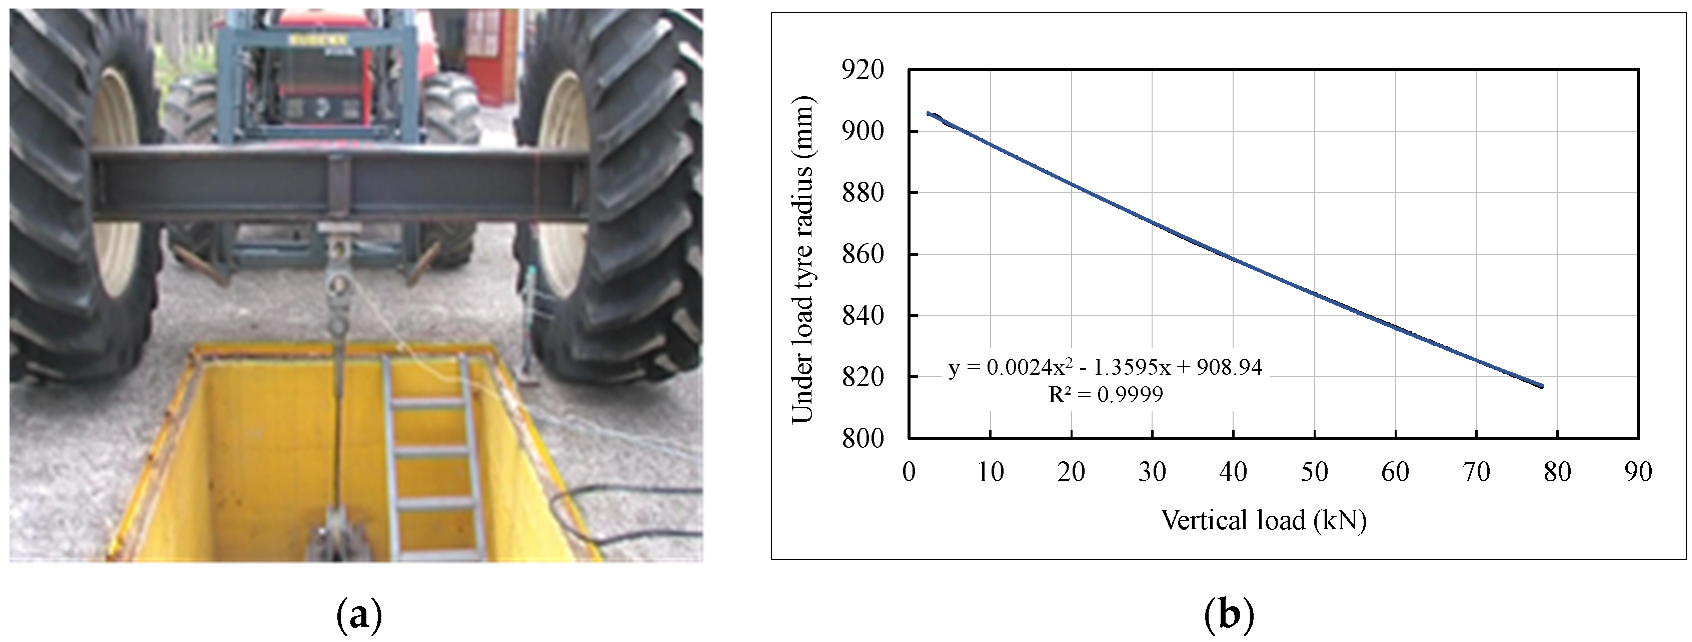
- The connection between the tow-hook and the main frame of the tractor is below the centre of rotation of the rear axle: the moment of the force of traction on it, is balanced by the moment of a load transfer, Q3, from the front axle, as follows:where: p, pitch of the tractor (2750 mm); dΔh (55 mm), difference between the height of the line of tra and the height of the rotation axis of the rear wheels, i.e., the under-load radius. In this case the load transfer is:
- The decrease of QDMTB and the increase of QDT during the traction determine a difference between the heights of the line of traction and of the centre of rotation of the rear wheels: the line of traction between the MTB and tractor is initially horizontal, then it slightly inclines forward due to the load transfers on both vehicles. The inclination has been measured to calculate the horizontal and vertical components of the force of traction. The vertical component, traZ, is directed upward, and the corresponding decrease on the tractor rear axle results from:where dTaRa is the horizontal distance between the tow-hook and rear axle. However, as 4 is applied on the tow-hook, its measurement is comprised in the value of 2 provided by Equation (10).
2.9. Preliminary Tests and Test Conditions
2.10. Data Processing
3. Results and Discussion
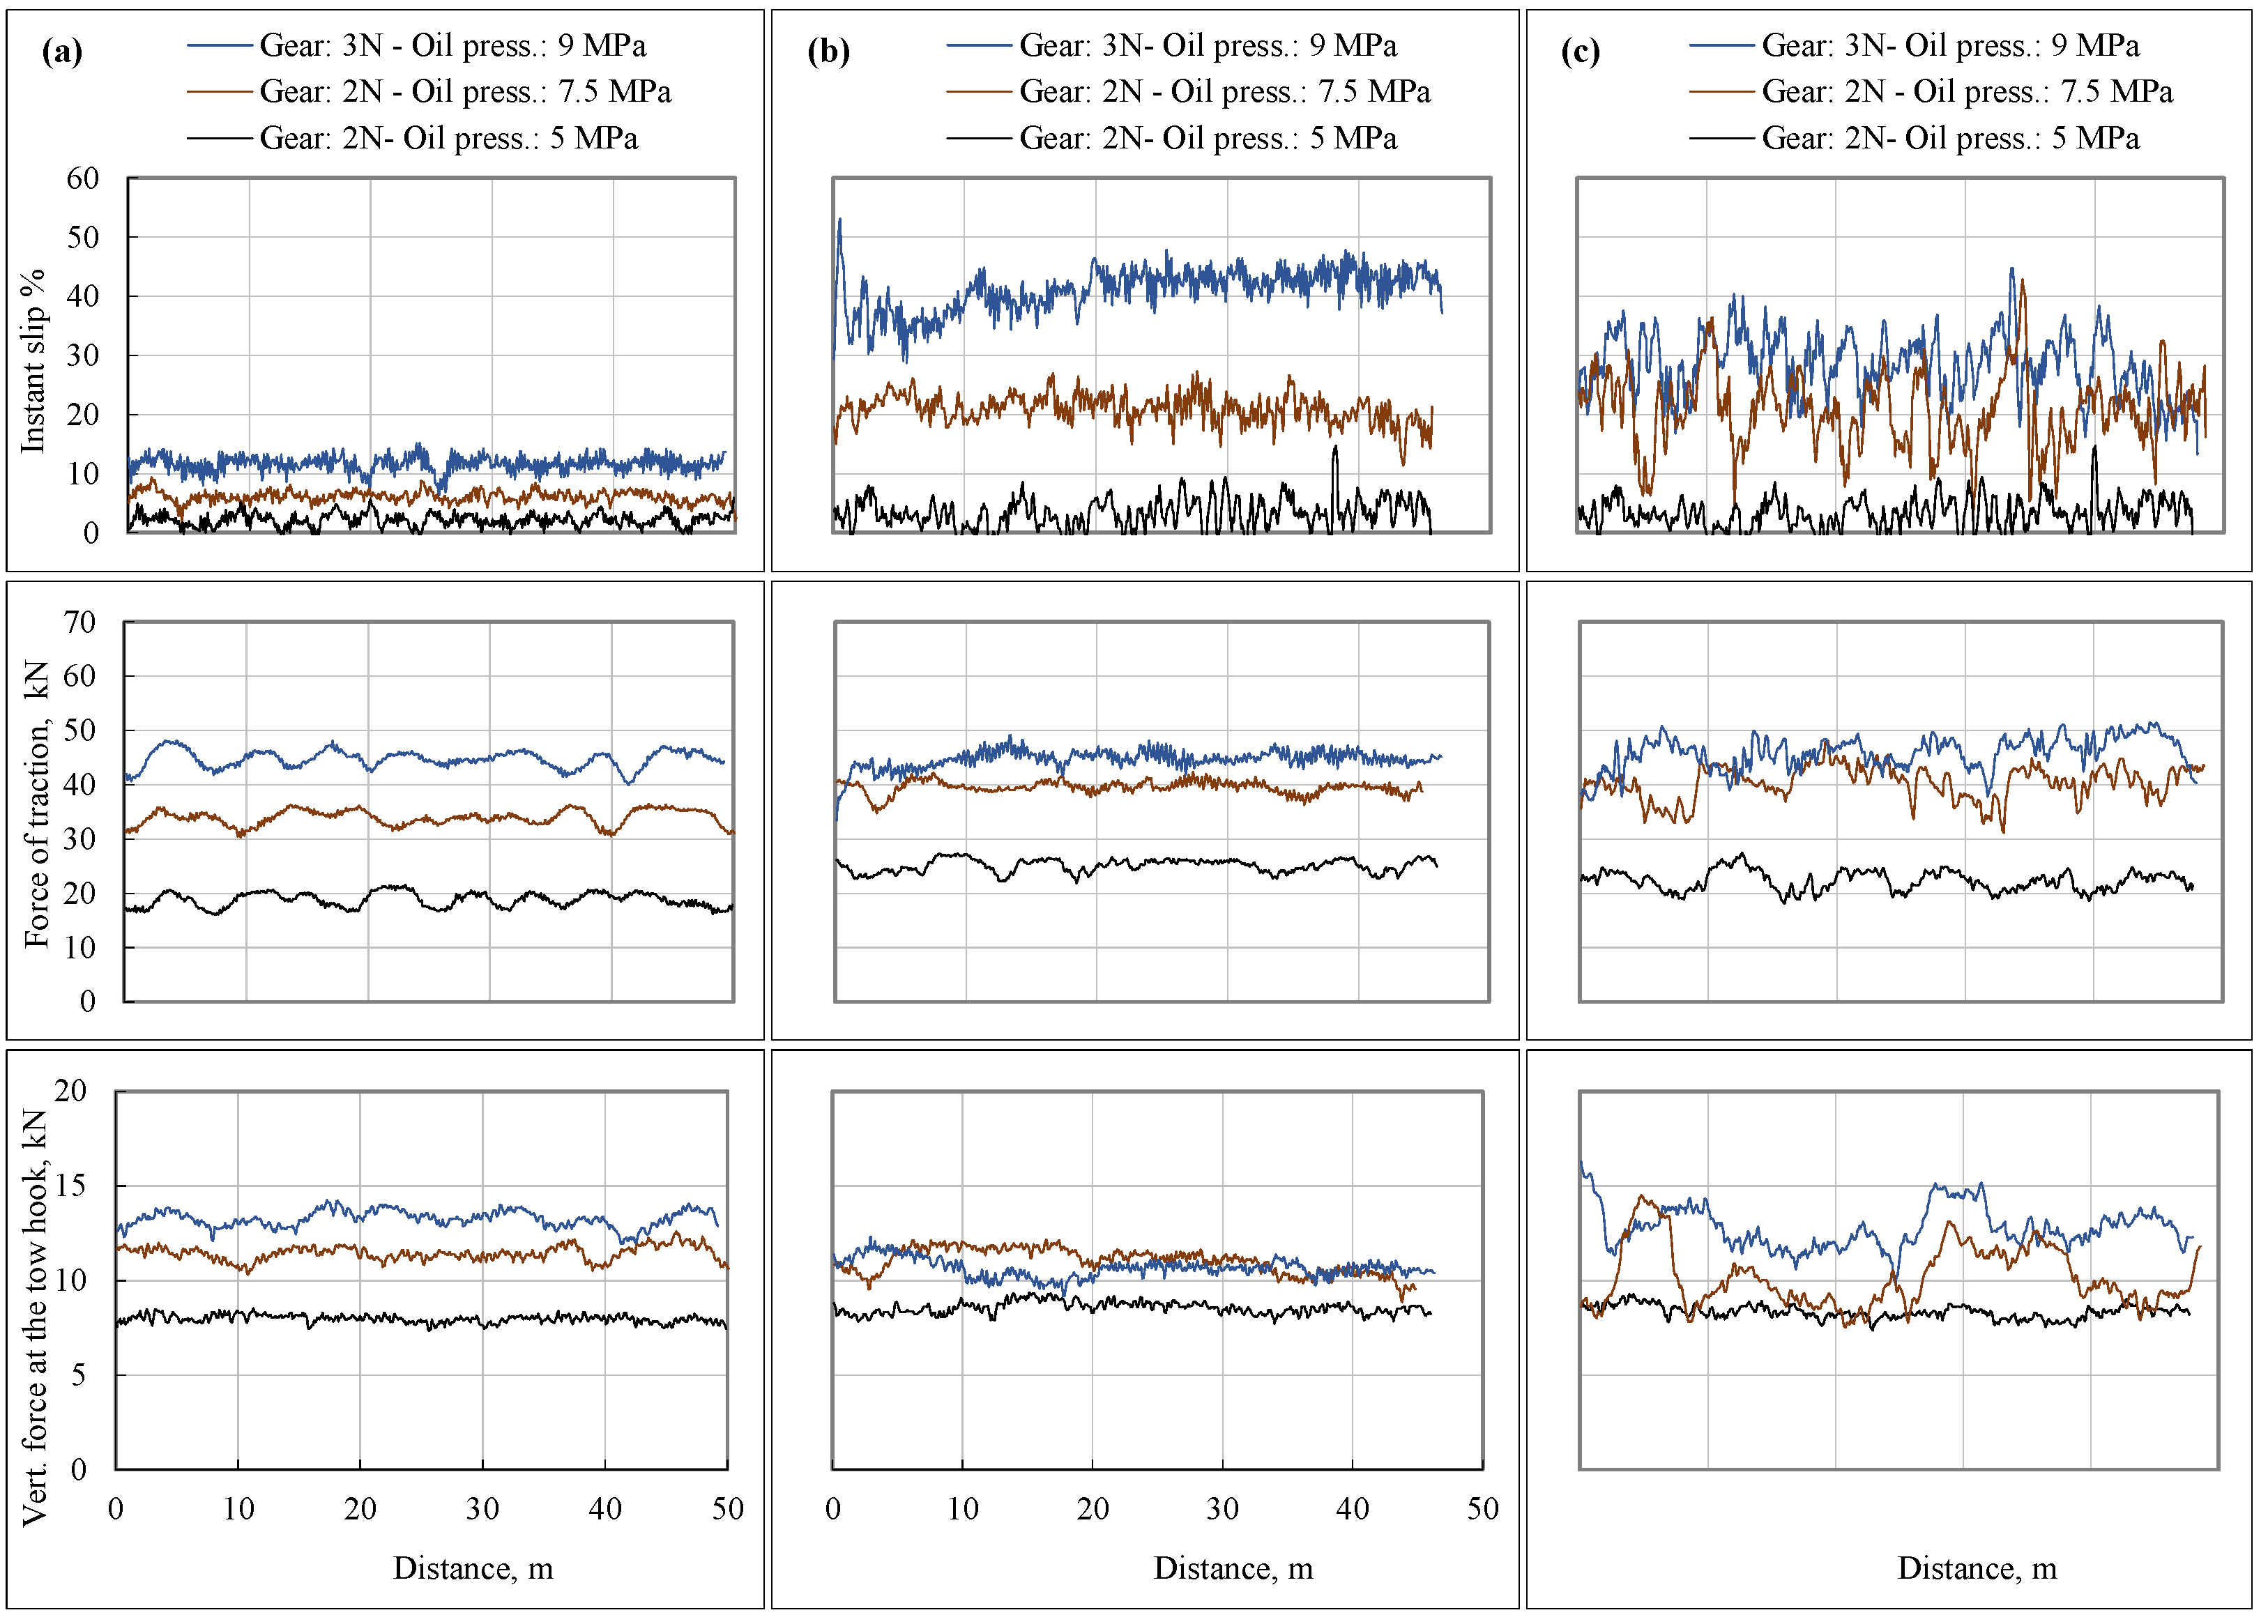
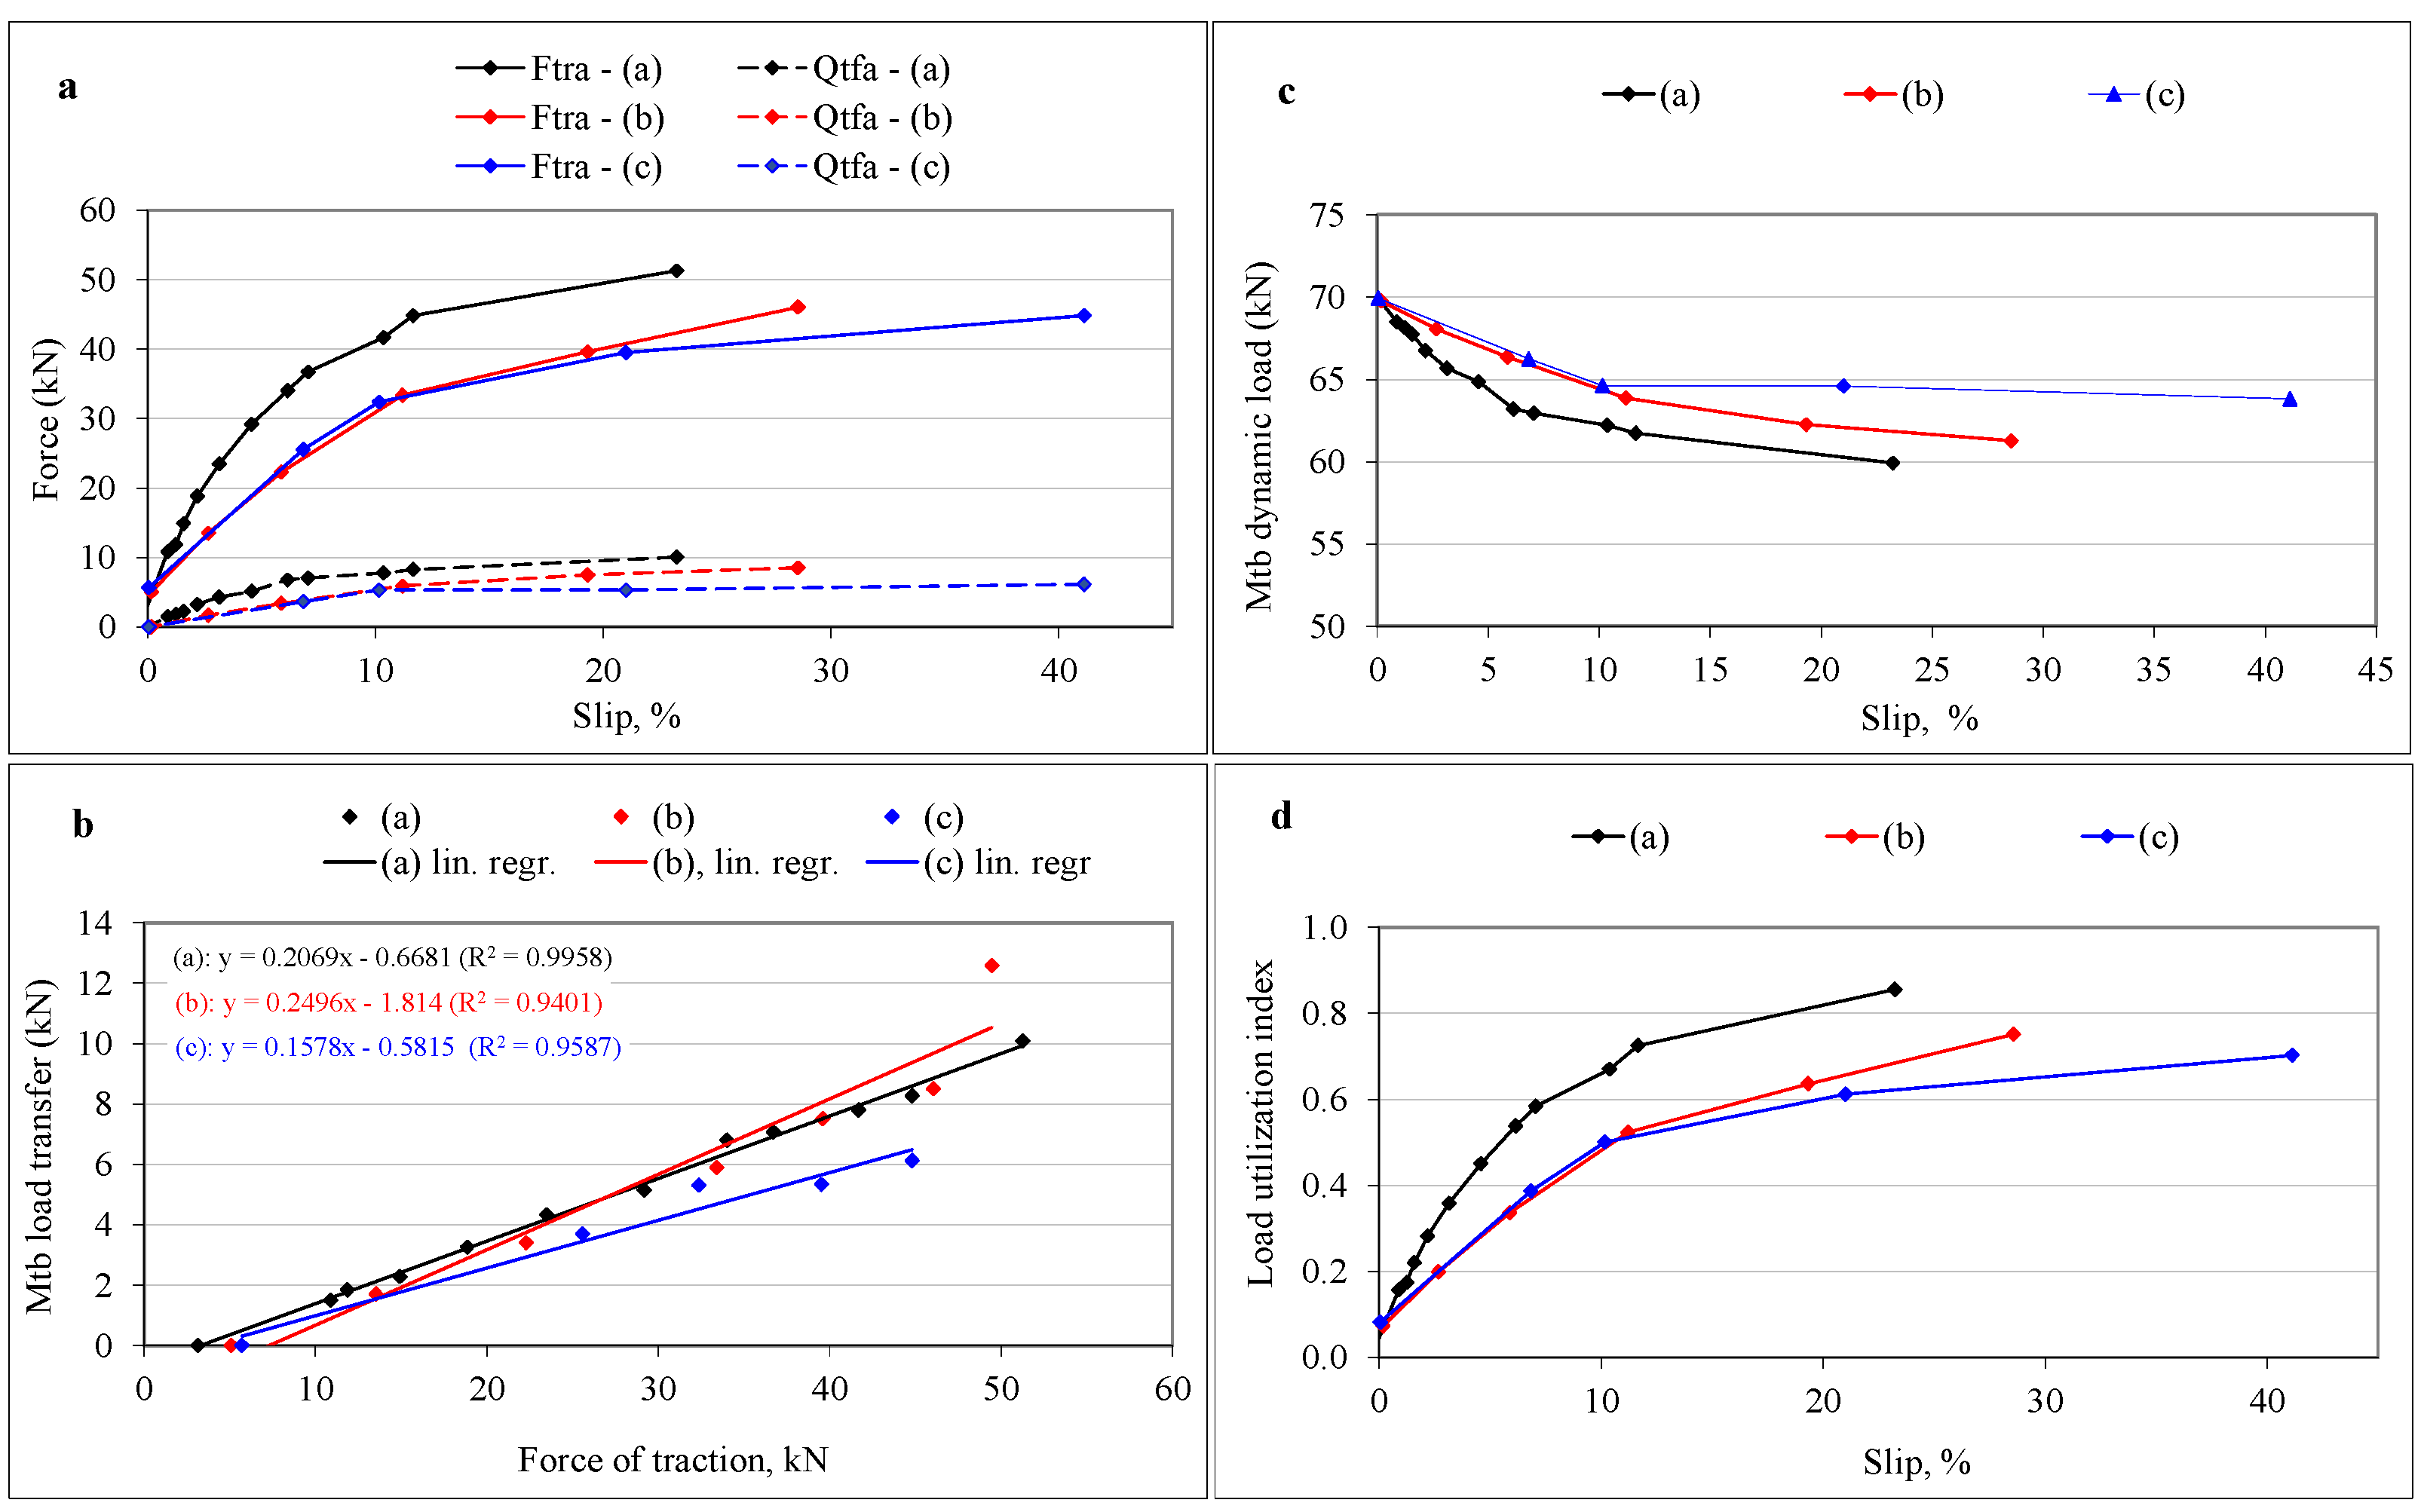
3.1. Test A
3.2. Test B
3.3. Test C
4. Conclusions
Author Contributions
Funding
Institutional Review Board Statement
Data Availability Statement
Acknowledgments
Conflicts of Interest
Abbreviations
| v | travel speed measured by means of a reference idle wheel trailed by the test system (m s−1). |
| vpT, vpMTB | peripheral speed of tractor (rear axle) and MTB wheels with slip (under-load radius) (m s−1). |
| vRT | relative speed of a generic point P on the surface of tractor rear tire, referred to the ground (m s−1). |
| vRMTB | relative speed of a generic point P on the surface of MTB tire, referred to the ground (m s−1). |
| sT | tractor slip (%). |
| sMTB | MTB slip (%). |
| siMTB | MTB instant slip (%). |
| MTB traction force at tow-hook (kN). | |
| gross traction force exerted by the tractor (kN). | |
| vertical component of the tra (when Ftra is not horizontal) (kN). | |
| V | vertical force measured at the tow-hook between tractor and MTB (kN). |
| mr | tractor motion resistance (kN). |
| ST | static load on tractor’s rear axle (kN). |
| DT | dynamic load on tractor’s rear axle under traction conditions (kN). |
| SMTB | static load on MTB axle (kN). |
| DMTB | dynamic load on MTB axle under traction conditions (kN). |
| cmr | coefficient of motion resistance. |
| IuQ | load utilization index. |
| tfa | load transfer from the front axle to the rear axle of the tractor (kN). |
| hth | height of the tow-hook (m). |
| p | pitch of the tractor (m). |
| cd | constant load due to the coupling device with load cells applied to the tractor rear part (kN). |
| 1, 2, 3, 4 | load transfer components from the front axle to the rear axle (kN). |
| dTaRa | horizontal component of the distance between the tow-hook and the rear axle (m). |
| dΔh | difference between the heights of the line of traction and the rotation axis of the rear wheels (m). |
| d | component of the driver’s weight burdening on the rear axle (kN). |
| dsra | distance of the rear axle from the vertical line of the centre of the seat (m). |
References
- European Tire and Rim Technical Organisation. Engineering Design Information-Agricultural tractor and implement tires Care and Maintenance; European Tire and Rim Technical Organisation: Brussels, Belgium, 2013. [Google Scholar]
- International Organization for Standardization. Agricultural Tractor Drive Wheel Tires-Explanation of Rolling Circumference Index (RCI) and Speed Radius Index (SRI) and Method of Measuring Tire Rolling Circumference; ISO 117952018; ISO: Geneva, Switzerland, 2018. [Google Scholar]
- United Nations Economic Commission for Europe. Uniform Provisions Concerning the Approval of Pneumatic Tires for Agricultural Vehicles and Their Trailers; UNECE Regulation no. 106; ECE: Geneva, Switzerland, 2018. [Google Scholar]
- Wang, G.; Kushwaha, R.L.; Zoerb, G.C. Traction performance of a model 4WD tractor. Can. Agric. Eng. 1989, 31, 125–129. [Google Scholar]
- Yu, G.; Kushwaha, R.L. Dynamic load distribution and tractive performance of a model tractor. J. Terramech. 1994, 31, 21–39. [Google Scholar]
- Osetinsky, A.; Shmulevich, I. Traction performance simulation of a pushed/pulled driven wheel. Trans. ASAE 2004, 47, 981–994. [Google Scholar] [CrossRef]
- Cutini, M.; Brambilla, M.; Bisaglia, C.; Pochi, D.; Fanigliulo, R. Efficiency of tractor drawbar power taking into account soil-tire slippage. In Innovative Biosystems Engineering for Sustainable Agriculture, Forestry and Food Production; “Lecture Notes in Civil Engineering” Book Series; Coppola, A., Di Renzo, G.C., Altieri, G., D’Antonio, P., Eds.; Springer Nature: Cham, Switzerland, 2020; Volume 67, pp. 409–417. [Google Scholar] [CrossRef]
- Cutini, M.; Brambilla, M.; Toscano, P.; Bisaglia, C.; Abbati, G.; Meloro, G. Evaluation of drawbar performance of winter tire for special purpose vehicles. J. Terramech. 2020, 87, 29–36. [Google Scholar] [CrossRef]
- Anifantis, A.S.; Cutini, M.; Bietresato, M. An experimental-numerical approach for modelling the mechanical behaviour of a pneumatic tire for agricultural machines. Appl. Sci. 2020, 10, 3481. [Google Scholar] [CrossRef]
- Burt, E.C.; Reaves, C.A.; Bailey, A.C.; Pickering, W.D. A machine for testing tractor tires in soil bins. Trans. ASAE 1980, 23, 546–547. [Google Scholar] [CrossRef]
- Upadhyaya, S.K.; Mehlschau, J.; Wulfsohn, D.; Glancey, J.L. Development of a unique mobile single wheel traction testing machine. Trans. ASAE 1986, 29, 1243–1246. [Google Scholar] [CrossRef]
- Ambruster, K.; Kutzbach, H.D. Development of a single wheel tester for measurement on driven angled wheel. In Proceedings of the 5th European Conference of the International Society for Terrain Vehicle Systems (ISTVS), Wageningen, The Netherlands, 21–23 March 1989. [Google Scholar]
- Tiwari, V.K.; Pandey, K.P.; Sharma, A.K. Development of a tire traction testing facility. J. Terramech. 2009, 46, 293–298. [Google Scholar] [CrossRef]
- Guarnieri, A. Un laboratorio mobile per prove di pneumatici. Macch. E Mot. Agric. 1993, 3, 92–94. [Google Scholar]
- Sandu, C.; Taylor, B.; Biggans, J.; Ahmadian, M. Building infrastructure for indoor terramechanics studies the development of a terramechanics rig at Virginia Tech. In Proceedings of the 16th International Conference of the International Society for Terrain Vehicle Systems (ISTVS), 2008, Turin, Italy, 25–28 November 2008. [Google Scholar]
- Naranjo, S.D.; Sandu, C.; Taheri, S.; Taheri, S. Experimental testing of an off-road instrumented tire on soft soil. J. Terramech. 2014, 56, 119–137. [Google Scholar] [CrossRef]
- Billington, W.P. The N.I.A.E. Mk II single wheel tester. J. Agric. Eng. Res. 1973, 18, 67–70. [Google Scholar] [CrossRef]
- Okello, J.A.; Dwyer, M.J.; Cottrell, F.B. The tractive performance of rubber tracks and a tractor driving wheel tire as influenced by design parameters. J. Agric. Eng. Res. 1994, 59, 33–43. [Google Scholar] [CrossRef]
- Szente, M. Traction characteristics of four-wheel drive tractor in different drive mode. In Proceedings of the International Conference on Agricultural Engineering (AgEng 2002), Budapest, Hungary, 30 June–5 July 2002. [Google Scholar]
- Taylor, J.H.; Burt, E.C. Track and tire performance in agricultural soils. Trans. ASAE 1975, 18, 3–6. [Google Scholar] [CrossRef]
- Firestone Farm Tire Test Center. Available online: http//commercial.firestone.com/en-us/agriculture/why-firestone-ag/research-and-innovation# (accessed on 10 December 2021).
- Czarnecki, J.; Brennensthul, M.; Białczyk, W.; Ptak, W.; Gil, Ł. Analysis of traction properties and power of wheels used on various agricultural soils. Agric. Eng. 2019, 23, 13–23. [Google Scholar] [CrossRef] [Green Version]
- Carman, K.; Aydin, C. Load and speed effects on tire. In Proceedings of the International Conference on Agricultural Engineering (AgEng 2002), Budapest, Hungary, 30 June–5 July 2002. [Google Scholar]
- Goli, H.; Minaee, S.; Jafari, A.; Keyhani, A.; Borghaee, A.; Hajiahmad, A. An instrumented drive axle to measure tire tractive performance. J. Terramech. 2012, 49, 309–314. [Google Scholar] [CrossRef]
- Cudzik, A.; Brennensthul, M.; Białczyk, W.; Czarnecki, J. Tractive Performance of Tires in Forest Conditions–Impact Assessment of Ground and Tires Parameters. Croat. J. For. Eng. 2018, 39, 85–96. [Google Scholar]
- Bachmann, T. The importance of the integration of road, tire and vehicle technologies. In Proceedings of the XXth World Congress on Federation of Societies of Automobile Engineering (FISITA 95), Montreal, Canada, 3–9 September 1995. [Google Scholar]
- ENAMA. Agricultural Machinery Functional and Safety Testing Service. In Test Protocol n. 41-Agricultural Tires; ENAMA Ente Nazionale per la Meccanizzazione Agricola: Rome, Italy, 2002. [Google Scholar]
- Fanigliulo, R.; Pochi, D.; Bondioli, P.; Grilli, R.; Fornaciari, L.; Folegatti, L.; Malaguti, L.; Matteo, R.; Ugolini, L.; Lazzeri, L. Semi-refined Crambe abyssinica (Hochst. EX R.E.Fr.) Oil as Biobased Hydraulic Fluid for Agricultural Applications. Biomass Conv. Bioref. 2021, in press. [Google Scholar] [CrossRef]
- Pochi, D.; Fanigliulo, R. Testing of soil tillage machinery. In Soil Engineering; “Soil Biology” Book Series; Dedousis, A., Bartzanas, T., Eds.; Springer: Berlin, Germany, 2010; Volume 20, pp. 147–168. [Google Scholar]
- Fanigliulo, R.; Pochi, D.; Volpi, C.; Santoro, G. A mobile system to evaluate the performances of agricultural machinery under field conditions. J. Agric. Eng. 2004, 4, 89–95. [Google Scholar]
- Pochi, D.; Fanigliulo, R.; Pagano, M.; Grilli, R.; Fedrizzi, M.; Fornaciari, L. Dynamic-energetic balance of agricultural tractors Active system for the measurement of the power requirements in static test and under field conditions. J. Agric. Eng. 2013, 44, 415–420. [Google Scholar] [CrossRef]
- Bietresato, M.; Caligiuri, C.; Bolla, A.; Renzi, M.; Mazzetto, F. Proposal of a predictive mixed experimental-numerical approach for assessing the performance of farm tractor engines fueled with diesel-biodiesel-bioethanol blends. Energies 2019, 12, 2287. [Google Scholar] [CrossRef] [Green Version]
- Bashford, L.L.; Al-Hamed, S.; Jenane, C. Effects of tire size and inflation pressure on tractive performance. Appl. Eng. Agric. 1993, 9, 343–348. [Google Scholar] [CrossRef]
- Cutini, M.; Brambilla, M.; Pochi, D.; Fanigliulo, R.; Bisaglia, C. A simplified approach to the evaluation of the influences of key factors on agricultural tractor fuel consumption during heavy drawbar tasks under field conditions. Agronomy 2022, 12, 1017. [Google Scholar] [CrossRef]
- Kumar, S.; Tabish Noori, M.; Pandey, K.P. Performance characteristics of mode of ballast on energy efficiency indices of agricultural tire in different terrain condition in controlled soil bin environment. Energy 2019, 182, 48–56. [Google Scholar] [CrossRef]
- Fanigliulo, R.; Pochi, D.; Biocca, M. Effects of six primary tillage implements on energy inputs and residue cover in central Italy. J. Agric. Eng. 2016, 47, 177–180. [Google Scholar] [CrossRef]
- Pochi, D.; Fornaciari, L.; Vassalini, G.; Grilli, R.; Fanigliulo, R. Levels of Whole-Body Vibrations Transmitted to the driver of a Tractor Equipped with Self-Levelling Cab during Soil Primary Tillage. AgriEngineering 2022, 4, 695–706. [Google Scholar] [CrossRef]
- Biondi, P. Meccanica Agraria, 1st ed.; UTET: Torino, Italy, 1999. [Google Scholar]
- Bodria, L.; Pellizzi, G.; Piccarolo, P. Meccanica Agraria; Edagricole: Bologna, Italy, 2006; Volume 1. [Google Scholar]
- Fanigliulo, R.; Antonucci, F.; Figorilli, S.; Pochi, D.; Pallottino, F.; Fornaciari, L.; Grilli, R.; Costa, C. Light drone-based application to assess soil tillage quality parameters. Sensors 2020, 20, 728. [Google Scholar] [CrossRef] [Green Version]
- Fanigliulo, R.; Pochi, D.; Servadio, P. Conventional and conservation seedbed preparation systems for wheat planting in silty-clay soil. Sustainability 2021, 13, 6506. [Google Scholar] [CrossRef]


| Parameters | Values |
|---|---|
| Mass without oil, kg | 1200 |
| Mass with oil, kg | 1350 |
| Minimum width, mm | 2195 1 |
| Maximum width, mm | 2575 1 |
| Length, mm | 1800 |
| Mounted tires | 20.8 R 38 2 |
| Minimum track, mm | 2245 3 |
| Maximum track, mm | 2625 3 |
| Power Take-Off, min−1 | 540–1000 |
| Parameters | Values | Type |
|---|---|---|
| Pump type | Gear | - |
| Pump displacement, L | 0.25 | - |
| Pump maximum speed, min−1 | 4200 | - |
| Pump minimum speed, min−1 | 800 | - |
| Pump diameter of the suction line, mm | 50.9 | - |
| Pump diameter of the delivery line, mm | 38.2 | - |
| Flow rate adjustment valve | - | Screw shaft |
| Flow rate control type | - | Electrical |
| Diameter of the shaft edge, mm | 38.1 | - |
| Gear Box Ratios | Rotation Speed | |||
|---|---|---|---|---|
| No. | Name | Main Shaft, Min−1 | Wheel, Min−1 | Ratio, τ |
| 1 | 1 SR | 2122.0 | 6.3 | 334.95 |
| 2 | 2 SR | 2126.4 | 7.9 | 270.52 |
| 3 | 3 SR | 2124.2 | 9.6 | 220.81 |
| 4 | 1 R | 2140.6 | 13.1 | 163.28 |
| 5 | 2 R | 2123.3 | 16.1 | 131.87 |
| 6 | 3 R | 2124.6 | 19.7 | 107.63 |
| 7 | 1 N | 2120.8 | 24.6 | 86.08 |
| 8 | 2 N | 2124.7 | 30.6 | 69.52 |
| 9 | 3 N | 2125.4 | 37.5 | 56.75 |
| 10 | 1 V | 2124.2 | 50.6 | 41.96 |
| 11 | 2 V | 2124.1 | 62.7 | 33.89 |
| 12 | 3 V | 2124.8 | 76.8 | 27.66 |
| Parameters | Test A | Test B | Test C |
|---|---|---|---|
| Aim of the tests | MTB regulations; effects on different surfaces | Repeatability test | Study of slip depending on tire mounting direction |
| Test surface | Asphalt—seedbed—headland | Asphalt | Asphalt |
| Used tractor | 4WD 205 kW | 4WD 205 kW | 2WD, 107 kW |
| Gear box ratio 1 | 7–8–9 | 7–8 | 7–8–9 |
| Oil pressure values 2, MPa | 0–2.5–5.0–7.5–9.5 | - | - |
| Hydraulic pump speed 3, min−1 | 2000 | 2000 | 2000 |
| Maximum temperature 4, °C | 60 | 60 | 60 |
| Test travel speed, m s−1 | 1.94 | 1.39 | 1.53 |
| Tested radial tires | 520/70 R 38 | 650/75 R38 7 | 650/75 R38 7 |
| Inflation pressure 5, MPa | 0.16 | 0.16 | 0.16 |
| MTB static load 5, kN | 66.83 | 66.83 | 73.58 |
| Tractor rear axle static load 6, kN | - | - | 32.37 |
| Gear | Oil Pressure MPa | (a) | (b) | (c) | ||||||||||||
|---|---|---|---|---|---|---|---|---|---|---|---|---|---|---|---|---|
| v m·s−1 | sMTB % | siMTB % | kN | kN | v m·s−1 | sMTB % | siMTB % | kN | kN | v m·s−1 | sMTB % | siMTB % | kN | kN | ||
| - | 0 | 0.8 | 0.0 | 0.0 | 3.1 | 4.7 | 0.8 | 0.0 | 0.0 | 6.3 | 4.7 | 0.7 | 0.0 | 0.2 | 5.1 | 4.9 |
| 3N | 2.5 | 0.8 | 0.9 | 0.9 | 10.9 | 6.1 | 0.7 | 0.9 | 0.9 | 14.4 | 6.7 | 0.7 | 2.6 | 2.7 | 13.5 | 6.6 |
| 3N | 5.0 | 0.8 | 2.2 | 2.2 | 18.8 | 7.9 | 0.7 | 3.4 | 3.5 | 25.1 | 8.6 | 0.7 | 5.9 | 5.9 | 22.3 | 8.3 |
| 3N | 7.5 | 0.7 | 4.6 | 4.6 | 27.4 | 9.8 | 0.7 | 10.2 | 10.2 | 32.4 | 10.0 | 0.7 | 11.1 | 11.2 | 39.9 | 10.8 |
| 3N | 9.5 | 0.8 | 7.0 | 7.1 | 36.7 | 11.7 | 0.7 | 20.0 | 20.0 | 40.1 | 12.6 | 0.7 | 19.3 | 19.3 | 39.6 | 12.4 |
| 2N | 2.5 | 0.8 | 1.2 | 1.2 | 11.8 | 6.5 | - | - | - | - | - | - | - | - | - | |
| 2N | 5.0 | 0.7 | 3.2 | 3.1 | 23.5 | 9.0 | 0.7 | 6.8 | 6.8 | 25.6 | 8.4 | 0.7 | 10.6 | 10.6 | 30.0 | 9.6 |
| 2N | 7.5 | 0.8 | 6.1 | 6.1 | 34.0 | 11.4 | 0.7 | 21.0 | 21.0 | 39.5 | 10.1 | 0.7 | 20.8 | 20.8 | 40.4 | 11.7 |
| 2N | 9.5 | 0.8 | 11.7 | 11.7 | 44.8 | 12.9 | 0.7 | 41.0 | 41.1 | 44.8 | 10.8 | 0.7 | 28.5 | 28.6 | 46.0 | 13.4 |
| 1N | 2.5 | 0.8 | 1.6 | 1.6 | 14.9 | 6.9 | - | - | - | - | - | - | - | - | - | - |
| 1N | 5.0 | 0.7 | 4.7 | 4.7 | 29.0 | 9.0 | - | - | - | - | - | - | - | - | - | - |
| 1N | 7.5 | 0.7 | 10.4 | 10.4 | 41.7 | 12.4 | - | - | - | - | - | 0.7 | 66.6 | 66.7 | 49.5 | 12.6 |
| 1N | 9.5 | 0.8 | 23.2 | 23.2 | 51.3 | 14.7 | - | - | - | - | - | - | - | - | - | - |
| Surface | Gear Pressure | r | p |
|---|---|---|---|
| (a) 1 | 3 V-5.0 MPa | 0.2921 | <0.001 |
| 2 V-7.5 MPa | 0.7215 | <0.001 | |
| 2 V-9.5 MPa | 0.6538 | <0.001 | |
| (b) 1 | 3 V-5.0 MPa | 0.3696 | <0.001 |
| 2 V-7.5 MPa | 0.5162 | <0.001 | |
| 2 V-9.5 MPa | −0.3112 | <0.001 | |
| (c) 1 | 3 V-5.0 MPa | 0.2225 | <0.001 |
| 2 V-7.5 MPa | −0.3701 | <0.001 | |
| 2 V-9.5 MPa | −0.0115 | 0.783 | |
| Correlation of means 2 | (a) | 0.9937 | <0.001 |
| (b) | 0.9446 | <0.001 | |
| (c) | 0.9817 | <0.001 |
| Parameters | Statistical Indicators | : 32 kN | : 36 kN | ||||||||||
|---|---|---|---|---|---|---|---|---|---|---|---|---|---|
| Replications | Average | St. | C.V. | Replications | Average | St. | C.V. | ||||||
| 1 | 2 | 3 | dev. | 1 | 2 | 3 | dev. | ||||||
| Traction force | Average, kN | 31.91 | 31.91 | 32.10 | 31.98 | 0.10 | 0.32 | 35.96 | 35.99 | 36.01 | 35.98 | 0.02 | 0.06 |
| St. dev., kN | 0.74 | 0.66 | 0.89 | 0.76 | - | - | 0.73 | 0.58 | 0.79 | 0.70 | - | - | |
| C.V. | 2.31 | 2.05 | 2.77 | 2.38 | - | - | 2.03 | 1.62 | 2.19 | 1.94 | - | - | |
| Load transfer | Average, kN | 13.38 | 13.90 | 11.73 | 13.00 | 1.13 | 8.69 | 14.04 | 14.05 | 14.37 | 14.15 | 0.19 | 1.35 |
| St. dev., kN | 0.37 | 0.28 | 0.33 | 0.33 | - | - | 0.26 | 0.26 | 0.28 | 0.27 | - | - | |
| C.V. | 2.78 | 2.04 | 2.84 | 2.55 | - | - | 1.85 | 1.86 | 1.95 | 1.89 | - | - | |
| Mean slip, (%) | 6.11 | 5.48 | 5.48 | 5.69 | 0.36 | 6.29 | 7.30 | 7.40 | 7.75 | 7.48 | 0.24 | 3.17 | |
| Instant slip | Average, % | 6.10 | 5.51 | 5.57 | 5.73 | 0.33 | 5.71 | 7.29 | 7.40 | 7.73 | 7.48 | 0.24 | 3.16 |
| St. dev, % | 0.64 | 0.61 | 0.54 | 0.59 | - | - | 0.60 | 0.65 | 0.69 | 0.69 | - | - | |
| C.V. | 10.47 | 10.99 | 9.67 | 10.38 | - | - | 8.19 | 8.84 | 8.85 | 8.63 | - | - | |
Disclaimer/Publisher’s Note: The statements, opinions and data contained in all publications are solely those of the individual author(s) and contributor(s) and not of MDPI and/or the editor(s). MDPI and/or the editor(s) disclaim responsibility for any injury to people or property resulting from any ideas, methods, instructions or products referred to in the content. |
© 2022 by the authors. Licensee MDPI, Basel, Switzerland. This article is an open access article distributed under the terms and conditions of the Creative Commons Attribution (CC BY) license (https://creativecommons.org/licenses/by/4.0/).
Share and Cite
Fanigliulo, R.; Biocca, M.; Grilli, R.; Fornaciari, L.; Gallo, P.; Benigni, S.; Mattei, P.; Pochi, D. Assessment of the Performance of Agricultural Tires Using a Mobile Test Bench. Agriculture 2023, 13, 87. https://doi.org/10.3390/agriculture13010087
Fanigliulo R, Biocca M, Grilli R, Fornaciari L, Gallo P, Benigni S, Mattei P, Pochi D. Assessment of the Performance of Agricultural Tires Using a Mobile Test Bench. Agriculture. 2023; 13(1):87. https://doi.org/10.3390/agriculture13010087
Chicago/Turabian StyleFanigliulo, Roberto, Marcello Biocca, Renato Grilli, Laura Fornaciari, Pietro Gallo, Stefano Benigni, Paolo Mattei, and Daniele Pochi. 2023. "Assessment of the Performance of Agricultural Tires Using a Mobile Test Bench" Agriculture 13, no. 1: 87. https://doi.org/10.3390/agriculture13010087