Article

Effect of Salmonella Typhimurium Colonization on Microbiota Maturation and Blood Leukocyte Populations in Broiler Chickens

1
Poultry Research Unit, ARS, USDA, Mississippi State, MS 39762, USA
2
Department of Poultry Science, University of Arkansas, Fayetteville, AR 72701, USA
3
Poultry Production and Product Safety Research Unit, ARS, USDA, 1260 W Maple St, Fayetteville, AR 72701, USA
*
Author to whom correspondence should be addressed.
Animals 2022, 12(20), 2867; https://doi.org/10.3390/ani12202867
Submission received: 30 September 2022 / Revised: 17 October 2022 / Accepted: 19 October 2022 / Published: 20 October 2022
(This article belongs to the Special Issue The Animal Microbiome in Health and Disease)

Abstract

:

Simple Summary

Reducing Salmonella levels in chickens is vital to reducing the number of human Salmonella infections resulting from contact with contaminated chickens and poultry products. The intestinal tract of chickens is home to a diverse population of bacteria that serve as one of the first lines of defense against pathogenic microbes. Therefore, we sought to understand changes in the intestinal bacterial populations following Salmonella infection. Our results showed a clear change in the intestinal bacterial structure after Salmonella colonization. An inverse relationship between Salmonella and Lactobacillus and Escherichia was observed as well as an increase in Bacteroides. Additionally, we provide insight into the timing of the host immune response with monocytes and thrombocytes acting early following colonization followed by heterophils. In total, this data demonstrates the ability of Salmonella to change intestinal microbiota composition and highlights genera that may be useful as probiotics to fight Salmonella colonization.

Abstract

Reducing Salmonella in commercial chickens is vital to decreasing human salmonellosis infections resulting from contact with contaminated poultry and poultry products. As the intestinal microbiota plays an important role in preventing pathogen colonization, we sought to understand the relationship between Salmonella infection and the cecal microbiota and the host immune system. Day-of-hatch broiler chicks were assigned to three treatments: control, artificial (SA), and natural (SN) Salmonella infection. At seven days of age, control and SA birds were inoculated with PBS or Salmonella Typhimurium, respectively. Five SA birds were transferred to SN cages to facilitate natural infection. Cecal content and blood samples were collected at 0, 8, 14, and 21 days of age for microbiota and leukocyte analysis, respectively. A significant change in microbiota composition was observed in both groups as noted by a decrease in Lactobacillus and Escherichia and an increase in Bacteroides. Leukocyte analysis revealed a decrease in the percentage of circulating monocytes at 7 days post-infection while a decrease in thrombocyte and an increase in heterophil percentages were seen at 14 days post-infection. Taken together, these results demonstrate the ability of Salmonella to modulate the intestinal microbiota to facilitate colonization. Additionally, results indicated an early role of monocytes and thrombocytes during colonization, followed by heterophils.

1. Introduction

Non-typhoidal Salmonella is a Gram-negative bacterium commonly transmitted to humans through direct contact with animals and contaminated food such as raw meat, poultry, raw eggs, raw milk, and other dairy products [1]. Salmonella has more than 2500 serovars, and most of the serovar-causing human foodborne illnesses fall under the subspecies, enterica (I) [2]. In the United States, the Centers for Disease Control found that 50 out of 186 Salmonella outbreaks from 2017 to 2020 were due to contact with backyard poultry resulting in 4411 illnesses and 870 hospitalizations outbreaks [3]. Most Salmonella serovars in the chicken gastrointestinal tract are asymptomatic to chickens but cause diarrheal disease in humans [4]. According to USDA-ERS (2021), the total estimated cost of human foodborne illness due to non-typhoidal Salmonella in 2018 was ~4.1 billion dollars [5]. The current approaches to reducing the non-typhoidal serovars in poultry have had limited success. The target of the US Department of Health and Human Services—Healthy People 2020 was to reduce the incidence of Salmonella from 15 per 100,000 cases to 11.1 per 100,000 cases by 2020, but the incidence increased to 17.1 in 2019 [6,7]. The non-typhoidal serovars remain a major foodborne pathogen globally. Despite strides to prevent Salmonella in poultry production, outbreaks continue to occur, necessitating the development of novel intervention tools for controlling them in chickens.
The chicken’s gastrointestinal tract comprises complex and diverse bacterial populations, which provide many beneficial functions to the host, including conferring colonization resistance against invading pathogenic microorganisms [8]. The first microbes in the chick gut are thought to be vertically transmitted from the hen through the yolk sac or absorbed through the shell from the environment [9]. Next-generation sequencing of embryos has revealed the presence of Gram-positive Micrococcus, Bacillus, and Enterococcus during the end stages of incubation [10], while Enterococcus [11] and members of the gram-negative family Enterobacteriaceae have been identified in the intestinal tract of newly hatched chicks [12,13,14]. However, the current practice of placing commercial eggs in a relatively sterile incubator and hatcher limits the number and type of bacteria capable of gaining access pre-hatch. This presents the chicks with an empty ecological niche increasing the opportunity for early colonization by pathogens [15]. Without exposure to the hen or nest environments, microbes from the eggshell and hatching and rearing environments serve as the first primary source of microbiota for colonization after hatching [15,16]. Following the stabilization of microbiota composition, the resident microbes prevent colonization by pathogenic microbes through mechanisms such as competitive exclusion and habitat filtering [17]. However, factors such as antibiotic supplementation [18,19,20], stress [21], and high pathogenic insult [17] can disrupt these mechanisms allowing pathogen colonization to occur.
While multiple studies have been undertaken to understand the relationship between the Salmonella serovar Enterica and the chicken intestinal microbiota [8,22,23,24], only a few have included Salmonella Typhimurium (ST) [25,26,27]. Furthermore, these studies have focused primarily on dietary interventions to reduce ST infection and are lacking meaningful investigations into the interaction of ST with the microbiota [25,26,27]. Therefore, we sought to fully characterize the microbiota’s role in ST-challenged and naturally colonized birds. We also determined the effect of Salmonella challenge on the immune status of broiler chickens to evaluate the birds’ natural methods to control Salmonella and prevent infection in humans.

2. Materials and Methods

2.1. Bacteria and Culture Conditions

Three nalidixic acid (NA) resistant field strains of ST were used for this study (ATCC 14028 NA resistant, ATCC 14028 WT NA resistant, and an NA-resistant field strain) (ATCC, Manassas, VA, USA). Bacterial strains were inoculated separately in tubes containing tryptic soy broth and incubated overnight at 37 °C. Overnight cultures were mixed in equal portions, centrifuged to remove spent media, and resuspended in phosphate-buffered saline at a concentration of ~1 × 10⁷ CFU/mL for chicken oral gavage.

2.2. Animals and Experimental Design

The live bird experiments and procedures were approved by the University of Arkansas’ institutional animal care and use committee under the approval number Ag-IACUC #21029.
To determine changes in the cecal microbiota and health status of broilers during Salmonella colonization, 120 1-day-of-hatch Cobb by-product breeder chicks (females) were obtained from a local hatchery and raised for 21 days in state-of-the-art environmental and temperature-controlled USDA colony houses. Chicks were vaccinated in ovo for Marek’s disease. Birds were provided floor space that equals or exceeds FASS guide recommendations at each stage of life (e.g., 135 in2 at 40–43 days of age). Chicks were placed on fresh pine shavings and kept in an environmentally controlled room and provided with age and species-appropriate conditions in accordance with the Cobb Broiler Management guide [28]. All birds were provided food and water ad libitum throughout the study.
Upon placement, birds were divided into three groups: (1) negative control (NC; 45 birds), (2) Salmonella challenge (SA; 35 birds), and (3) Salmonella natural colonization (SN; 35 birds). At 7 days of age, birds in the negative control and Salmonella challenge groups were orally gavaged with 0.25 mL of phosphate buffered saline or the 3-strain mixture of ~1 × 10⁷ CFU/mL ST, respectively. Following ST inoculation, five chicks from the SA group were moved to SN pens to act as seeder birds. Blood and cecal content samples were collected from the NC group on days 0 and 6 and from all groups on days 8, 14, and 21. Samples were collected from five birds per treatment at each time point, and samples were used for the determination of immune response, enumeration of Salmonella, and cecal microbiota evaluation.

2.3. Sample Collection

For sample collection, birds were euthanized by inhalation of carbon dioxide. Blood samples were collected for serum and plasma preparation in appropriate tubes, while EDTA-blood samples were used for flow cytometry analysis. Cecal contents were collected for microbiological and microbiota analysis. For microbiological analysis, cecal contents were plated on XLD agar plates to enumerate Salmonella. For microbiota analysis, cecal contents were collected in a DNA/RNA shield (Zymo Research, Irvine, CA, USA). DNA was isolated using the ZymoBIOMICS DNA Miniprep Kit (Zymo Research, Irvine, CA, USA) according to the manufacturer’s protocol. DNA quality and quantity were determined using Nanodrop. Two DNA samples from day 0 were found to be of low quality and were not used for sequencing leaving three samples for the day 0 timepoint.

2.4. Flow Cytometry Analysis

All antibodies were purchased from SouthernBiotech (SouthernBiotech, Birmingham, AL, USA) unless otherwise specified. Samples were prepared as described previously by Seliger, et al. [29]. Briefly, 20 μL of EDTA-blood was diluted in 980 μL of staining buffer (PBS pH 7.2, 1% bovine serum albumin, 0.1% NaN3). Diluted blood was mixed 1:1 with appropriate antibody mixtures (1:100) and incubated for 45 min at 4 °C protected from light. Four combinations of mouse-anti-chicken antibodies were used to identify (1) thrombocytes and leukocytes: SPRD-CD45 (LT40) and FITC-CD41/61 (11C3, Bio-Rad, Hercules, CA, USA), (2) T cells: PE-γδTCR (TCR1), FITC-CD4 (CT-4), and SPRD-D8α (CT-8), (3) αβ T-cells and γδ T-cells: PE-γδTCR (TCR1), FITC-αβTCR (αβ1 (TCR2) and αβ2 (TCR3)), and SPRD-CD45 (LT40), (4) B cells, monocytes, and heterophils: SPRD-CD45 (LT40), FITC-KUL01 (KUL01), and PE-Bu1 (AV20). Heterophils were identified based on forward and side scatter characteristics of CD45+ cells. After incubation, samples were further diluted in 150 μL of staining buffer and kept on ice protected from light until measurement. Samples were acquired using a BD C6-plus-Accuri flow cytometer (Beckton Dickinson, San Jose, CA, USA), and results were analyzed using FlowJo v10.8.1 software.

2.5. Microbiota Analysis

Purified DNA samples were shipped on dry ice to the core facility at the University of Texas Southwestern Medical Center (Dallas, TX, USA) for sequencing of the V3–V4 region of the 16S rRNA gene using the PE300 primer set (341f: CCTACGGGDGGCWGCAG, 806r: GACTACNVGGGTMTCTAATCC). Samples were prepped using the Zymo Quick-16s Plus NGS Library Prep Kit (Zymo Research, Irvine, CA, USA) and sequenced on an Illumina MiSeq machine. Following demultiplexing, raw reads were imported in QIIME2 [30] and processed using the deblur algorithm [31]. The deblur denoise-16S option was used with sequences truncated to 403 nucleotides based on quality scores. Denoised sequences referred to as amplicon sequence variants (ASVs) were classified using the SILVA 138 database [32].
Analysis and visualization of microbiota composition were accomplished using R version 4.2.1 [33]. All plots were made using ggplot2 version 3.3.6 [34]. For α-diversity analysis, data were normalized using cumulative sum scaling (CSS) in the metagenomeSeq package of R [35] and calculated using Observed ASVs and Shannon index in the phyloseq package 1.4.0 [36]. For β-diversity and differential abundance analysis, data were normalized using the centered log ratio (CLR) according to the methods of Gloor, et al. [37]. Principle component analysis (PCA) was used to visualize differences in microbiota composition.

2.6. Statistical Analysis

Statistical significance was measured using parametric and nonparametric methods depending on data normality and equality of group variances. Significant differences in α-diversity were determined using the Kruskal-Wallis test, while permutational multivariate ANOVA (permanova) in the vegan package of R [38] was used for β-diversity analysis. Significant differences in abundance between groups were determined using the ANOVA-like differential expression tool ALDEx2 [39]. For flow analysis, all statistical analyses were conducted using GraphPad Prism v9.4.1. The Student’s t-test was used to determine the statistical significance between negative control and Salmonella-challenged groups. p-values ≤ 0.05 were considered statistically significant.

3. Results

3.1. Variation in Cecal Microbial Populations and Leukocyte Sub-Populations with Age

Following sequencing, a total of 7,781,641 sequences were obtained, with an average of 123,518 sequences per sample (range of 95,149 to 188,969). To confirm the consistency of our data with what is known regarding the chicken intestinal microbiota, we first investigated microbial composition changes with age.

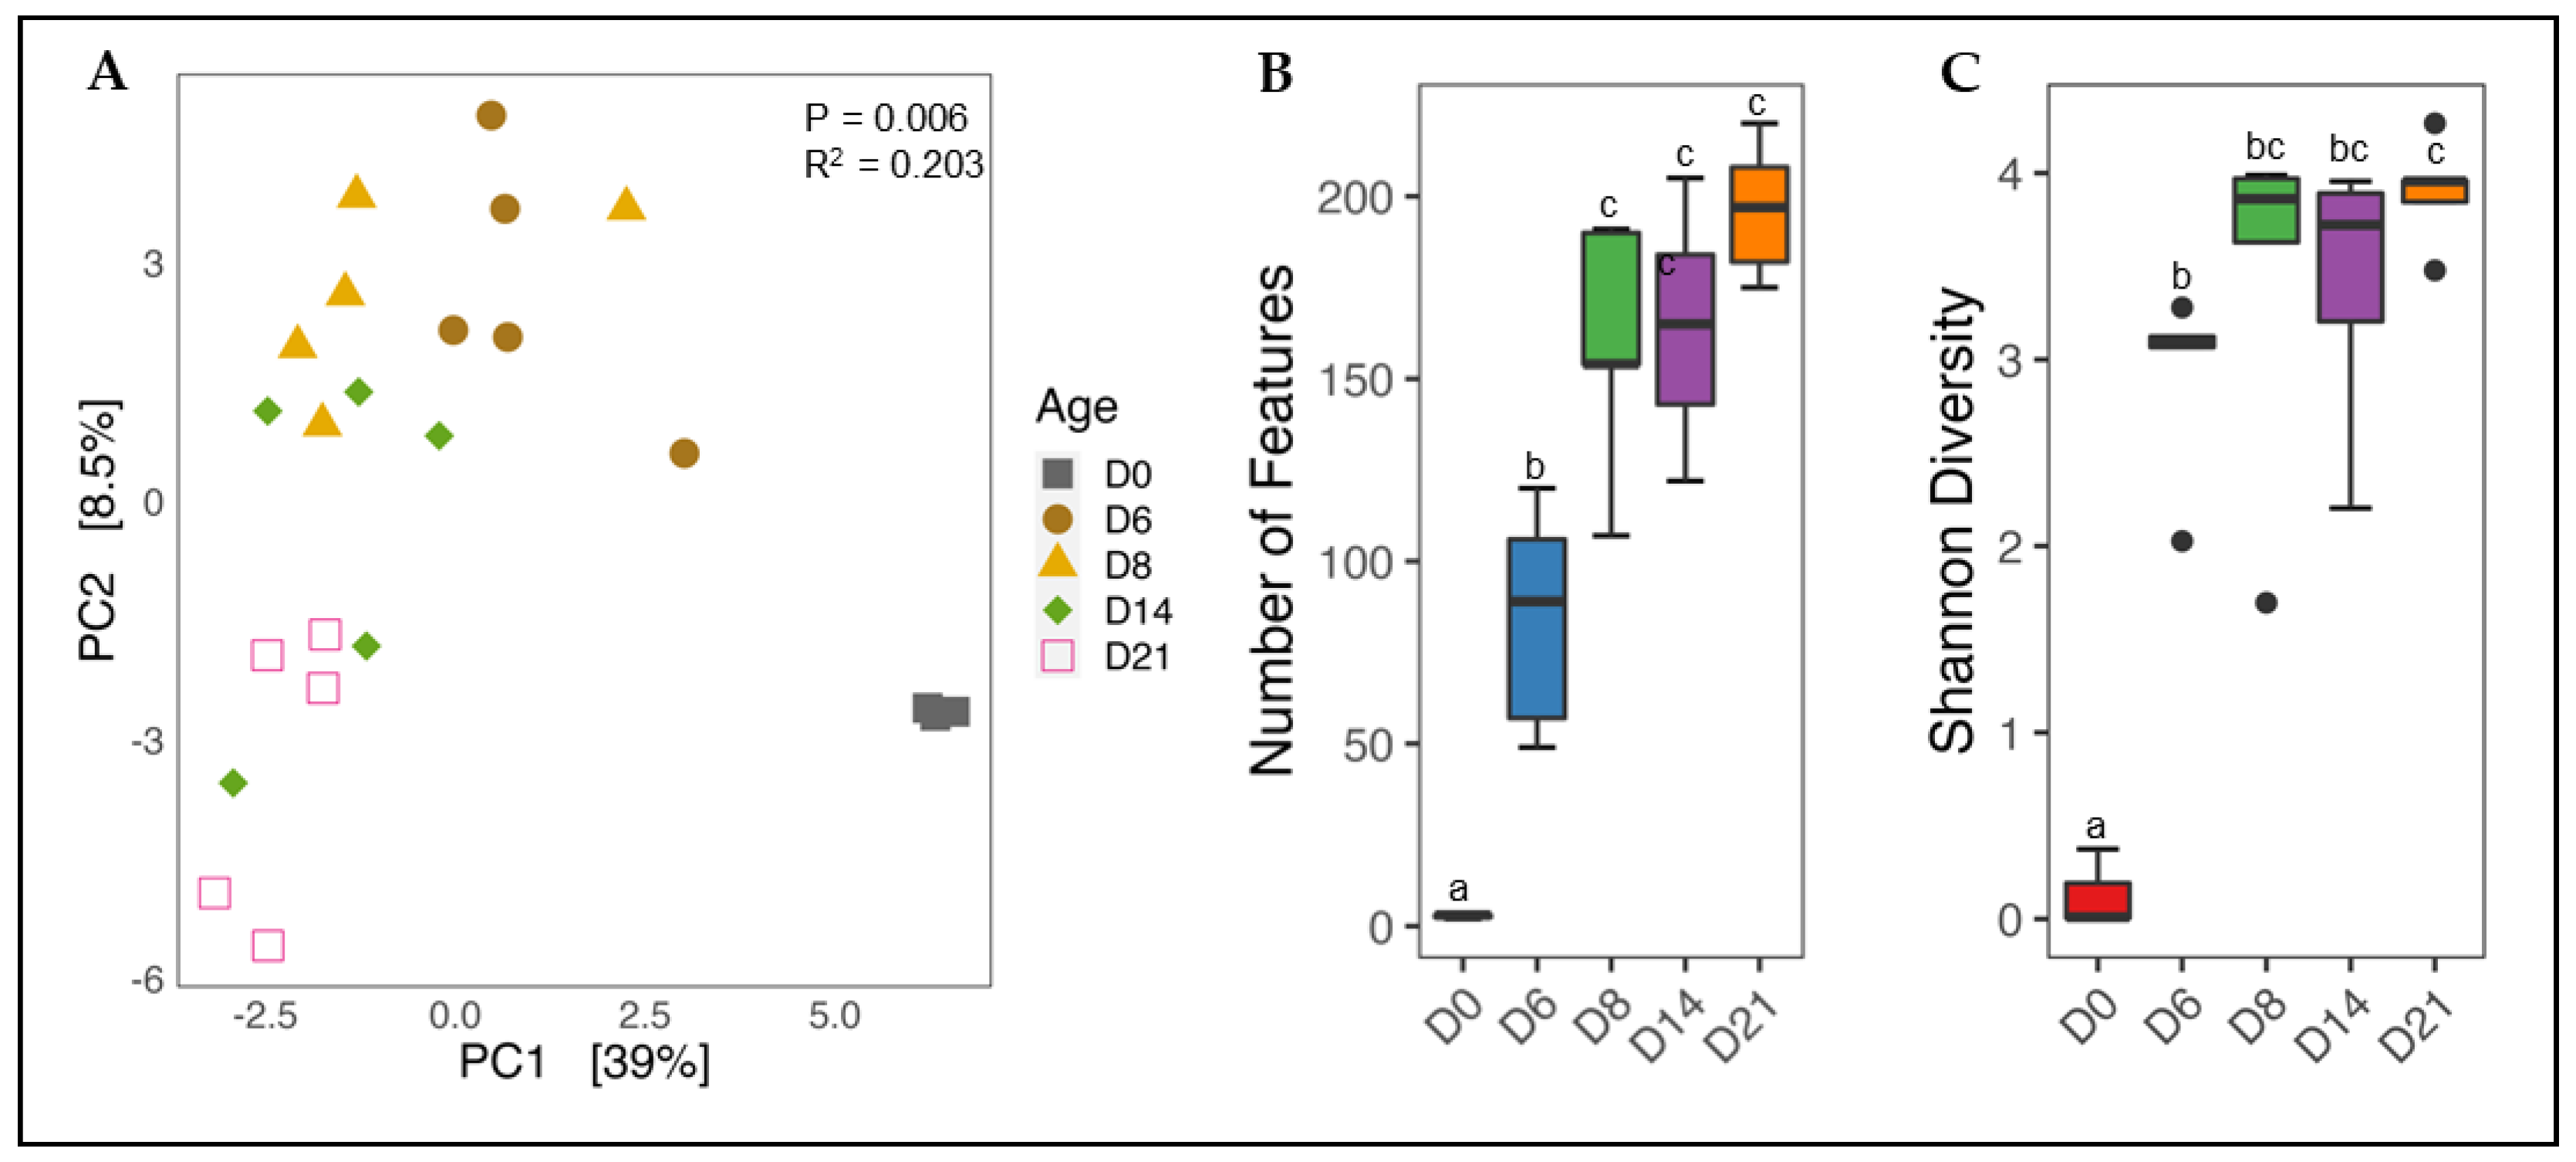
3.1.1. Effect of Age on Cecal Microbiota Diversity

To account for the compositionality of microbiota data [37], sequence counts were normalized using the CLR method, and differences in microbiota composition were visualized using a PCA plot (Figure 1A). A clear separation was observed between D0 and all other samples indicating the uniqueness of the hatch microbiota. Beginning on day 6, microbiota composition was shown to change gradually, with day 6 more similar to day 8 than day 21. Statistical evaluation using permanova revealed changes to be significant (p < 0.05). However, the R2 value was low (0.203), which is most likely an indication of the small sample size used in this study.
Changes in species richness and evenness with age were measured using the Observed Features (Figure 1B) and Shannon diversity (Figure 1C) calculators, respectively. Both indices increased with age, beginning with a sharp significant (p < 0.05) increase from day 0 to day 6. Interestingly, species richness further increased from day 6 to day 8 (p < 0.05) before beginning to plateau on days 14 and 21. A slight, but non-significant increase in evenness was observed between days 6 and 8 before reaching a plateau.

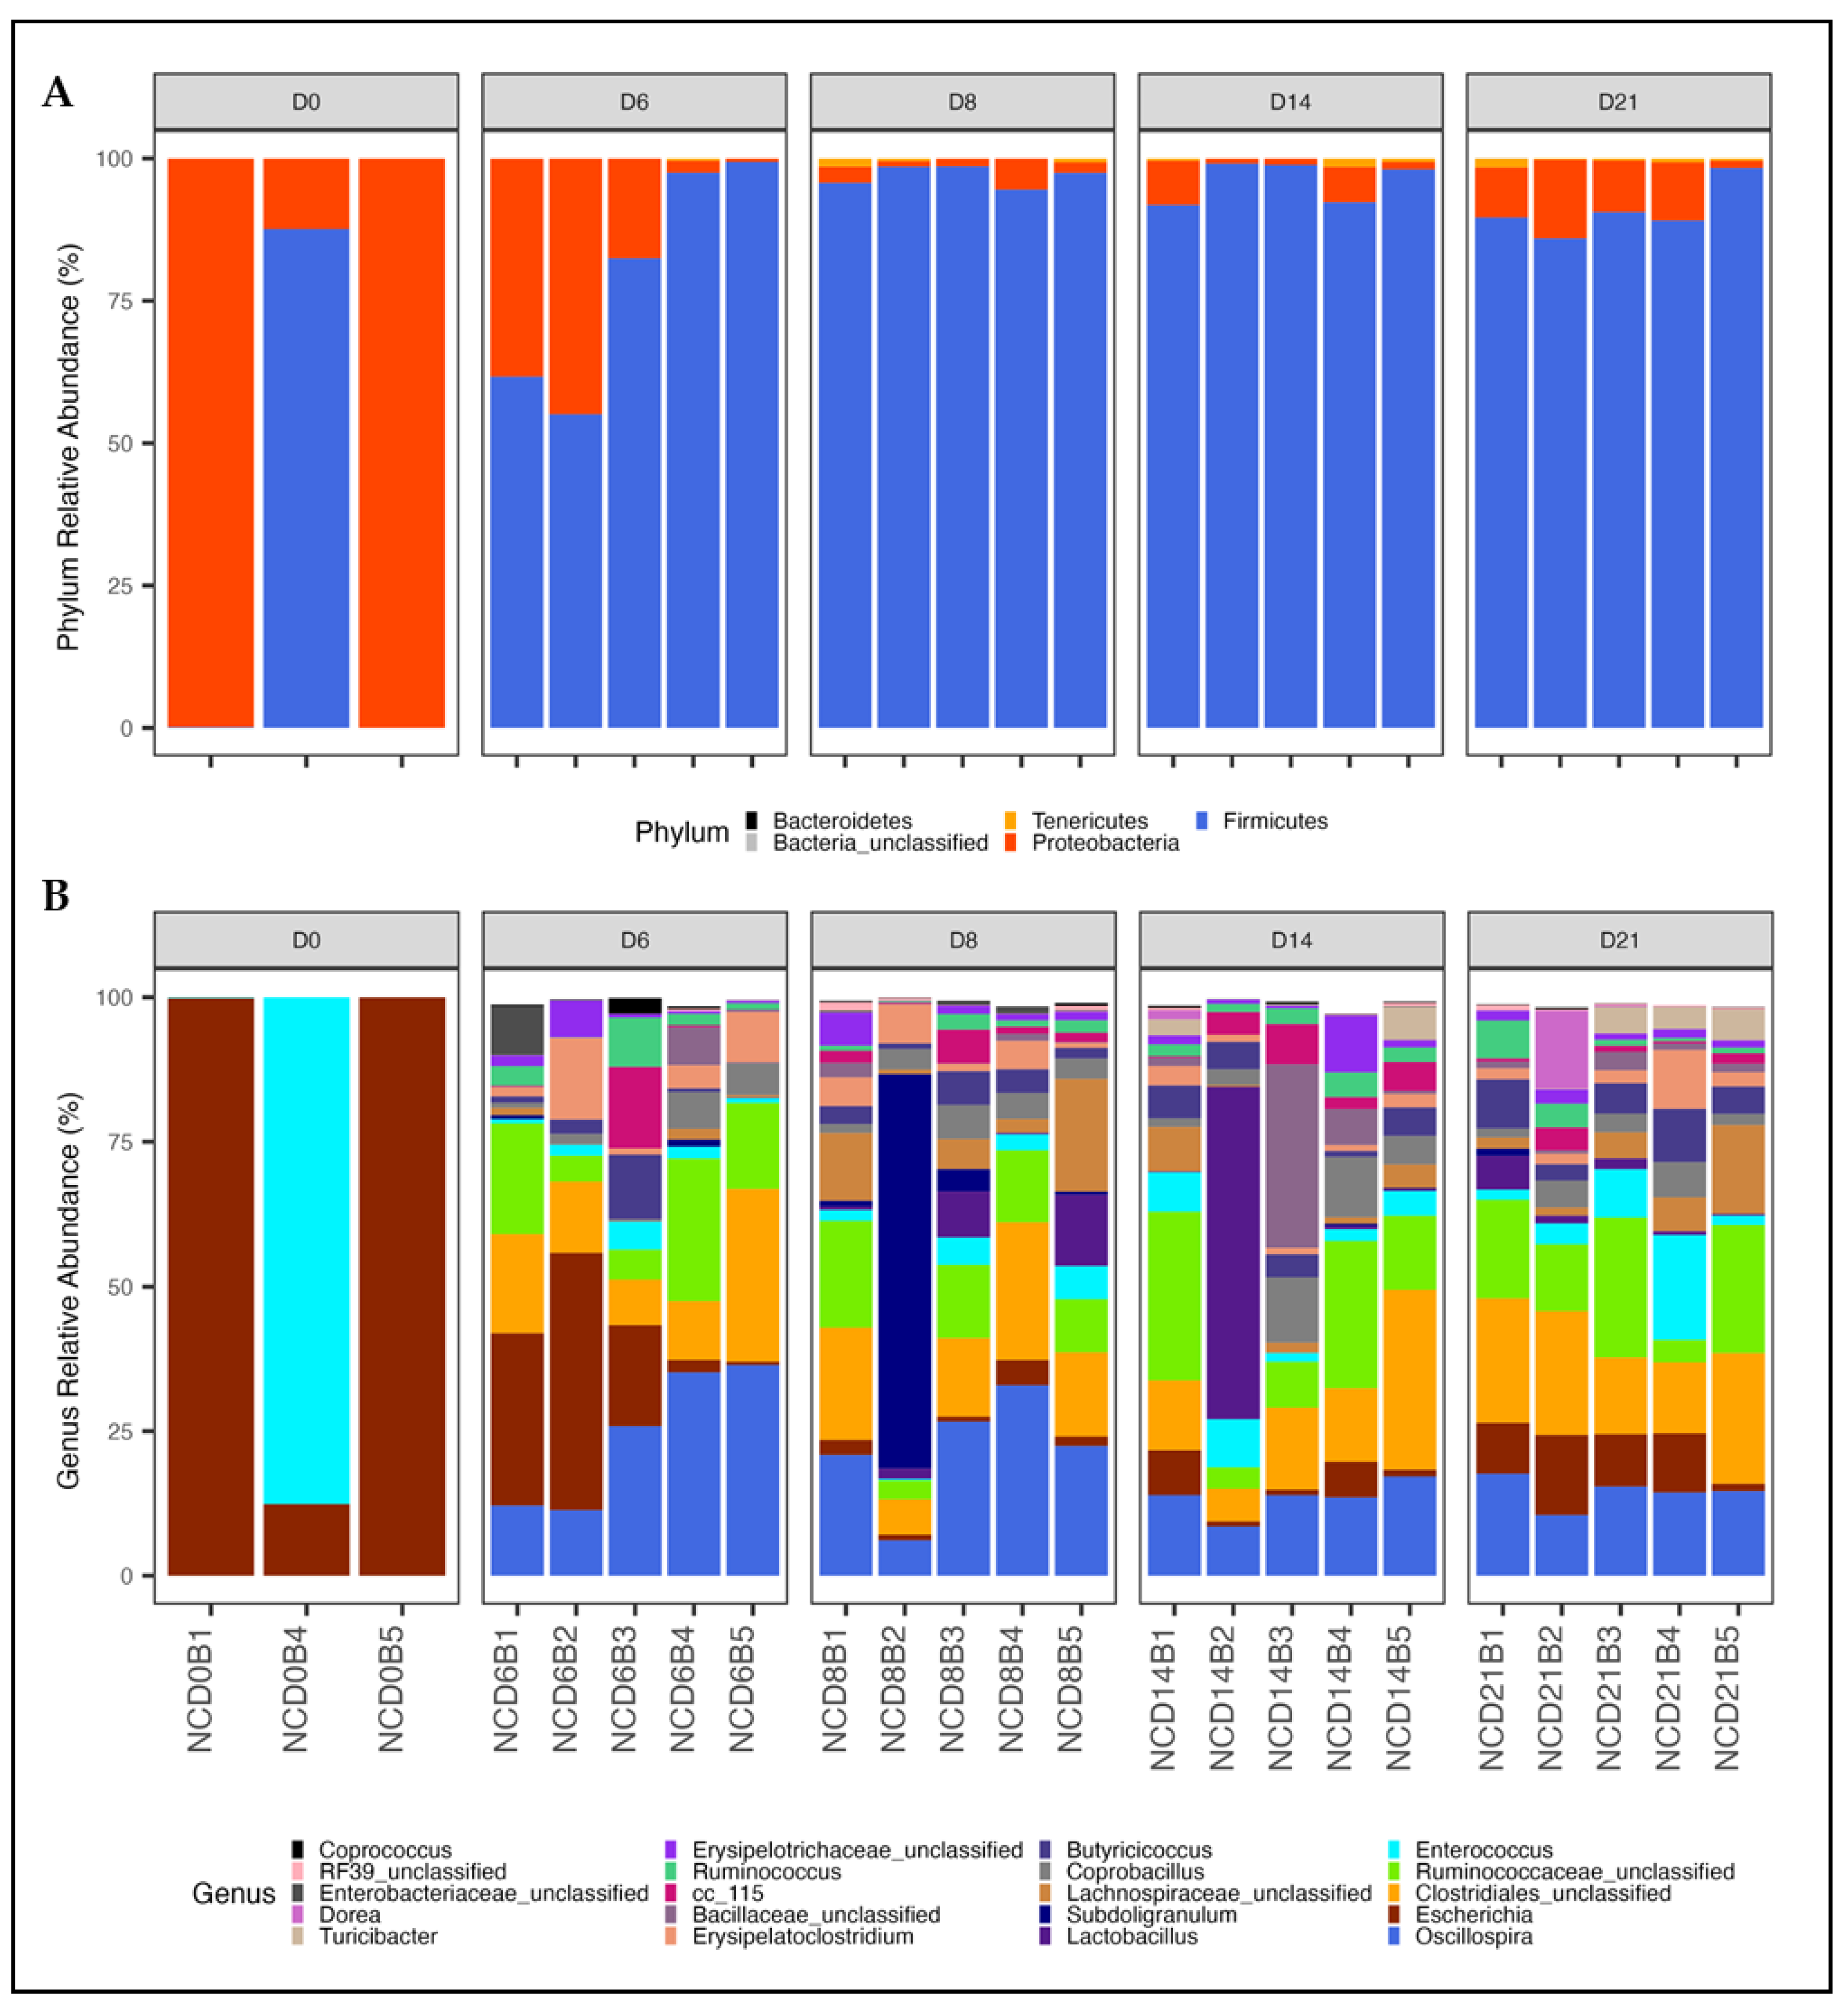
3.1.2. Shifts in Phylum and Genus Composition with Age

Bacterial composition was investigated by calculating the relative abundance of CSS normalized data at the phylum (Figure 2A) and genus (Figure 2B) levels. A notable switch in composition was observed at both levels. At the phylum level, the cecal microbiota at day-of-hatch was dominated by Proteobacteria in two of the three birds investigated (two samples were not sequenced due to low-quality DNA). Proteobacter was replaced by Firmicutes beginning on day 6 with the proportion of Firmicutes ranging from 55 to 99%. For days 8 through 21, Firmicutes were observed to dominate all samples representing greater than 86% of all sequences.
In agreement with the alpha diversity analysis, only two genera were detected on day 0. Escherichia was the primary genus detected in two of the three samples, while the third was predominantly Enterococcus with lower levels of Escherichia. The abundance of both genera decreased as cecal diversity increased with age. Beginning on day 6, members of the genera Oscillospira, unclassified Clostridiales, and unclassified Ruminococcaceae became the dominant cecal members, collectively representing over 50% of the microbiota. This composition remained relatively stable through day 21 with only slight variations in specific genera observed.

3.1.3. Alteration in Percentages among Leukocyte Populations with Age

To evaluate immune development with age, the percentage of various leukocyte subpopulations was investigated using flow cytometry of whole blood from 10 control birds per timepoint (Figure 3). Results revealed a significant shift in percentages of leukocyte populations between days 0 and 6, which then stabilized for the remainder of the study. Specifically, the percentage of heterophils decreased significantly (p < 0.0001) from greater than 75% on day 0 to less than 40% on day 6. This was associated with a significant (p < 0.001) increase in CD4+ T cells which remained significantly different from day 0 through day 21. A numerical increase in the percentage of monocytes began on day 6 and became significantly different from day 0 (p < 0.001) on days 14 and 21. The stability of leukocyte populations was confirmed by the lack of significant difference in cell percentages between other combinations of days, except for an increase in the percentage of monocytes between days 8 and 14. Additionally, no significant differences were observed for the B cell, CD8+ T cell, and λδ T cell percentages.

3.2. Effect of Salmonella Colonization on Microbiota and Leukocyte Populations

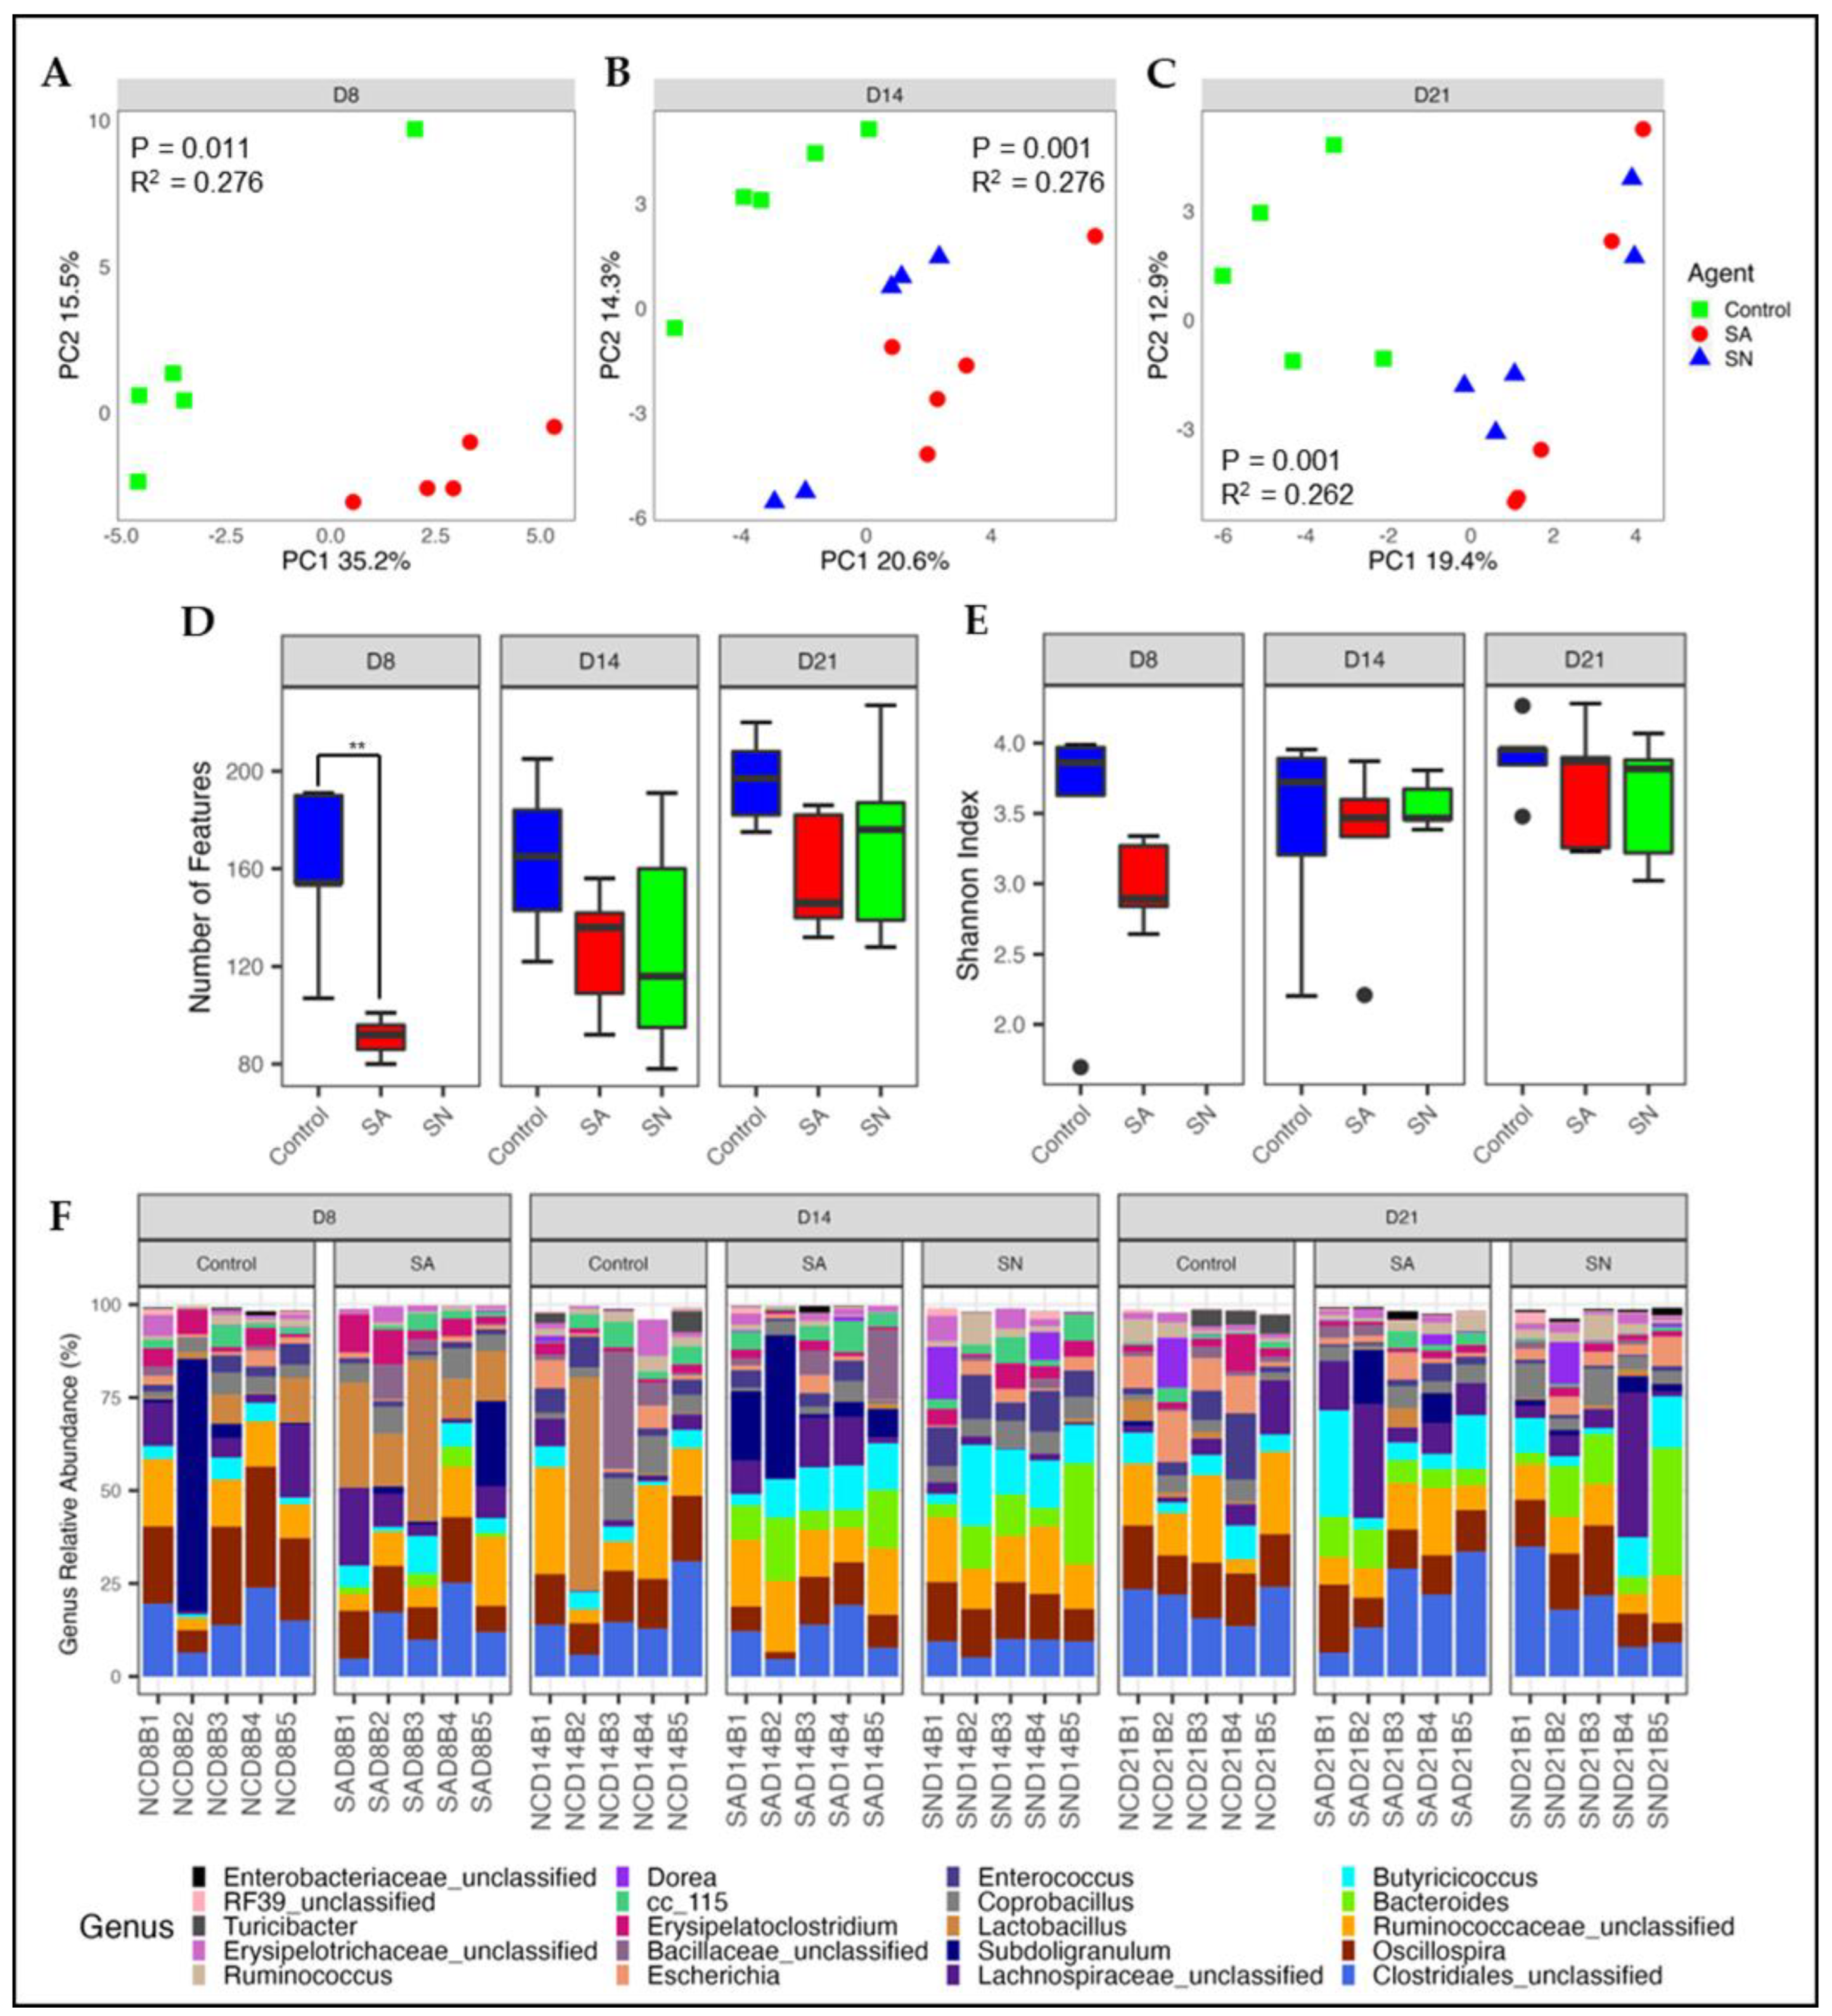
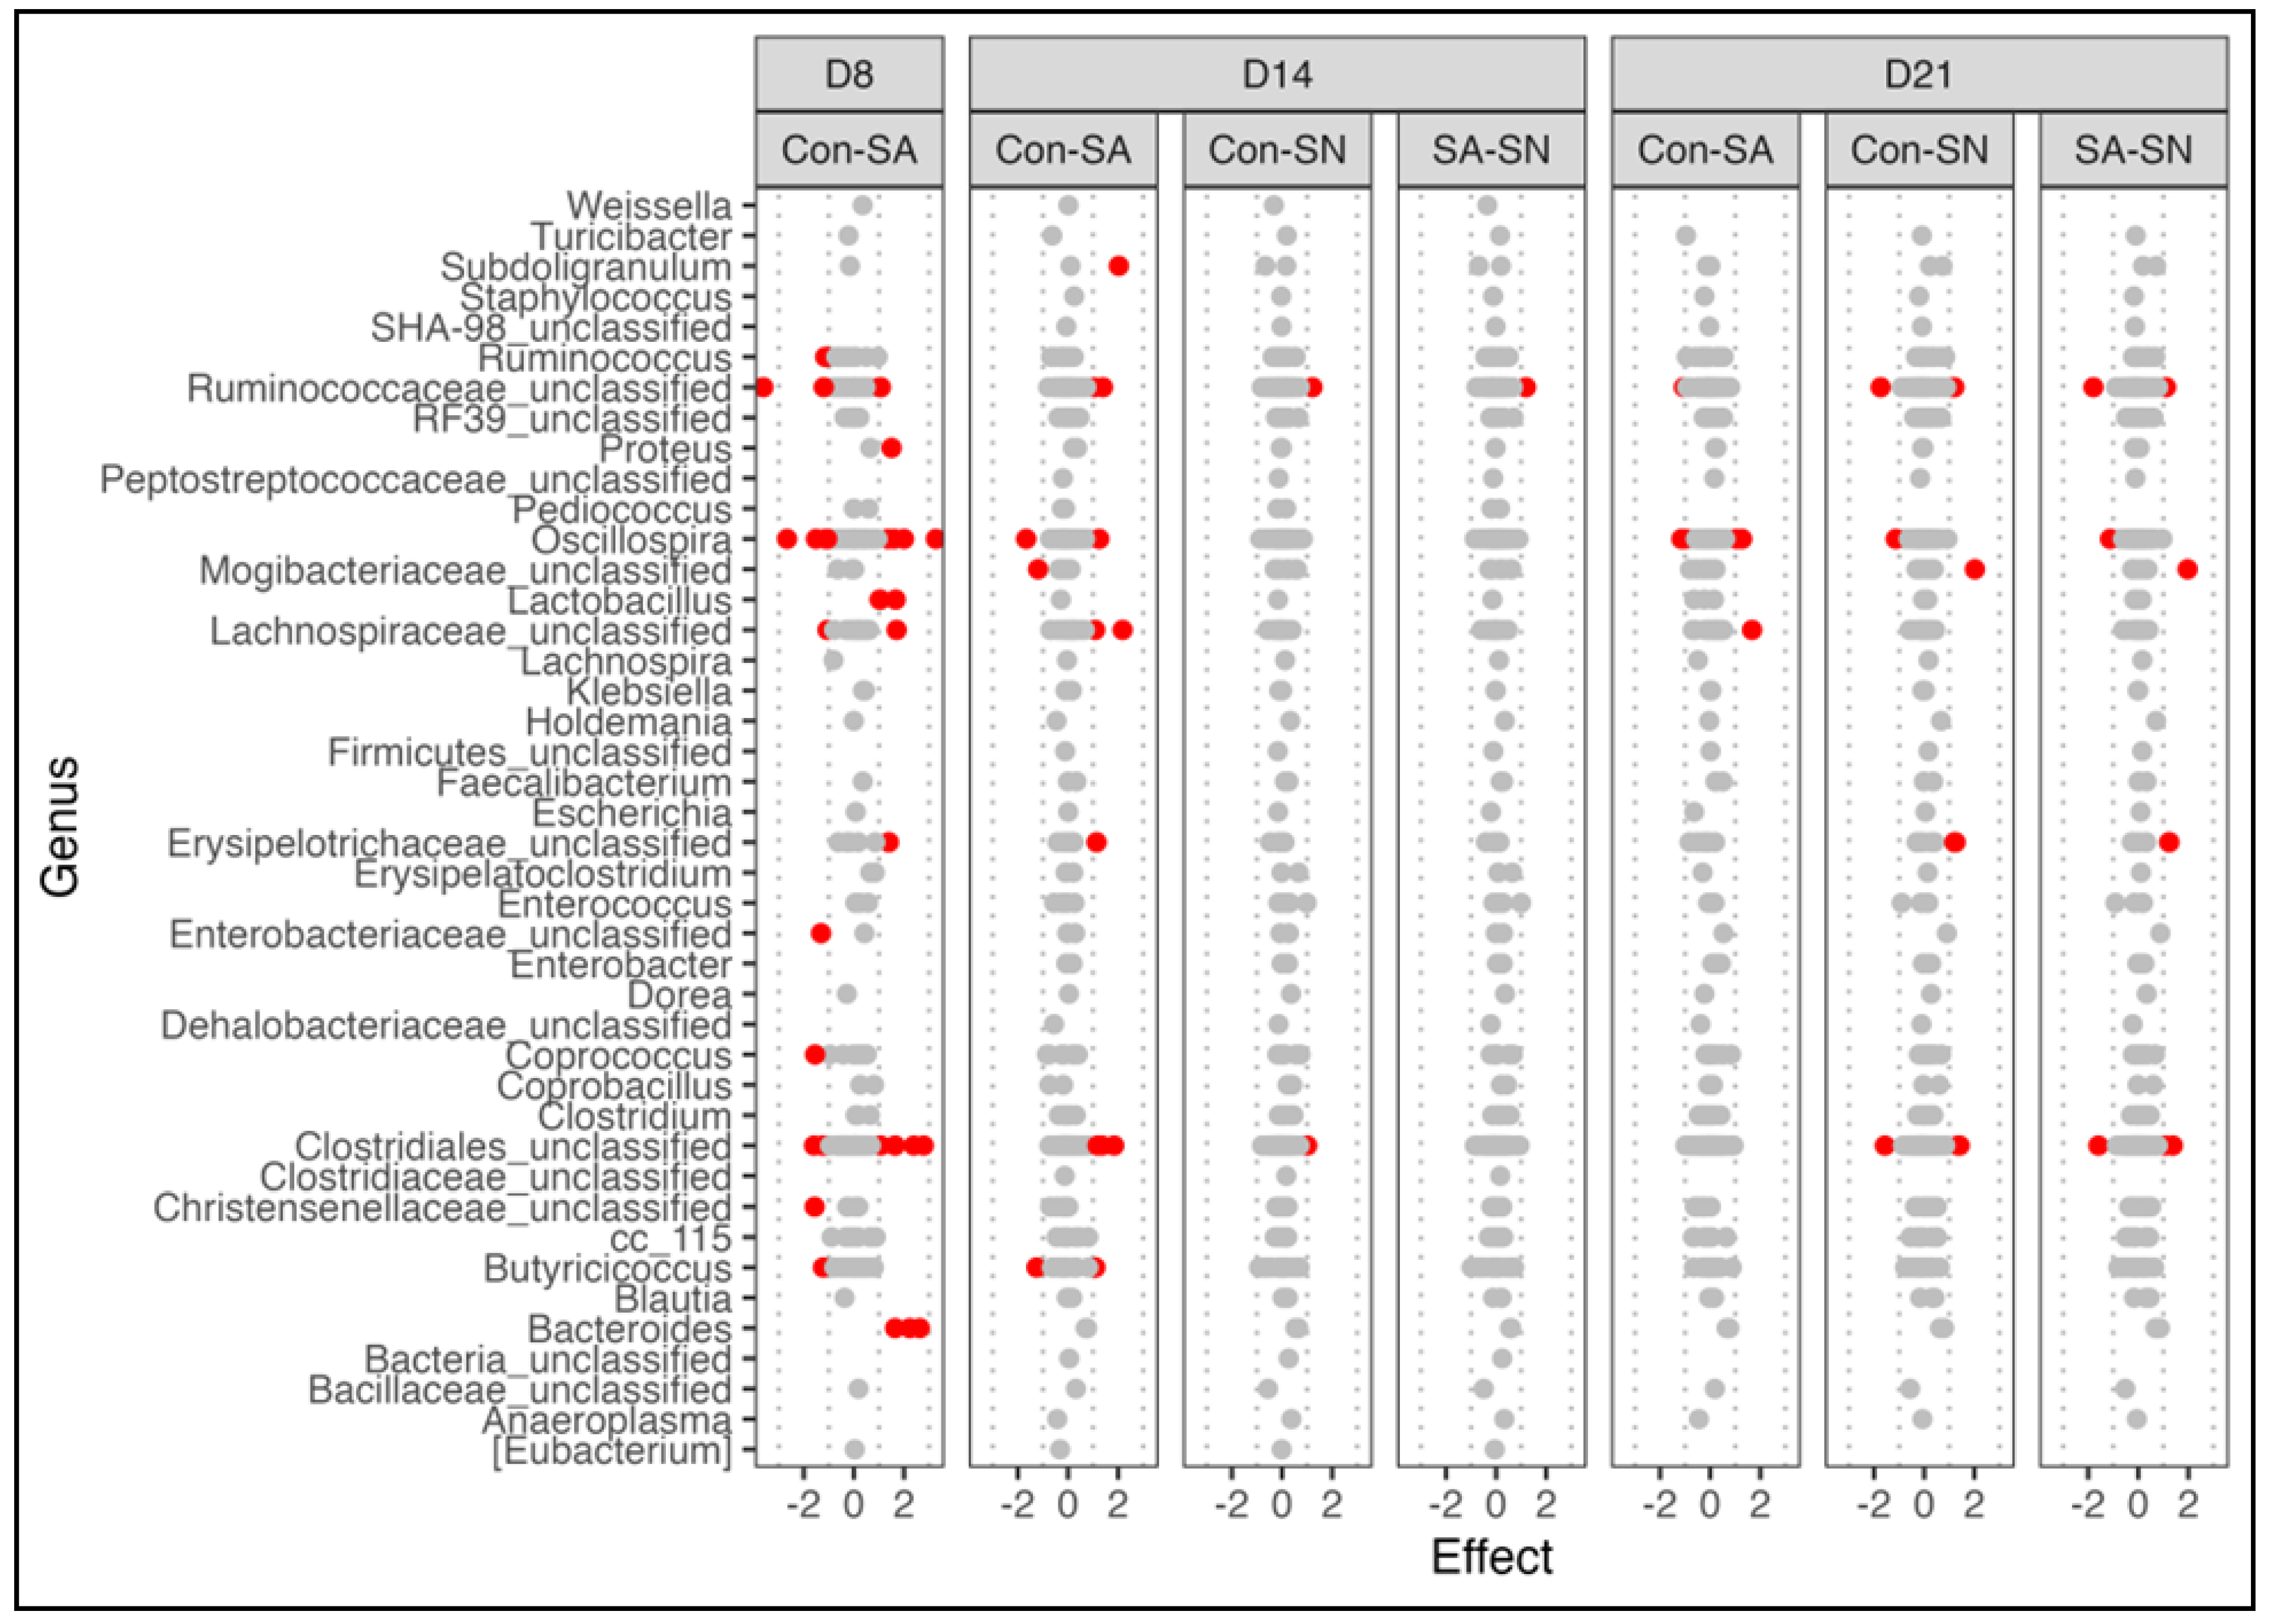
3.2.1. Microbial Diversity and Composition

To determine the interaction between the role of the microbiota in Salmonella colonization, birds were inoculated with a three-strain mixture of ST at 7 days of age via oral gavage. Following inoculation, five birds were transferred to a pen containing naïve birds to allow for horizontal transmission. Birds receiving the oral gavage were considered to be Salmonella challenged and are referred to as the SA group. Birds colonized via horizontal transmission were considered to be naturally colonized and are referred to as the SN group. Colonization was confirmed by plating cecal contents at 21 days of age which revealed a cecal Salmonella load of 3.89 and 3.78 log CFU/mL for the SA and SN groups, respectively. For microbiota analysis, birds were euthanized, and cecal contents were collected on days 8 (24 hpi), 14 (7 dpi), and 21 (14 dpi) of life. PCA analysis revealed a clear separation in microbial composition between control and Salmonella-infected birds at all three timepoints (Figure 4A–C). The separation was observed to be statistically significant (p = 0.001) at all three timepoints with R2 values of 0.276, 0.276, and 0.262 for days 8, 14, and 21, respectively. Alpha diversity analysis revealed a significant decrease in species richness on day 8 (p < 0.05) with only approximately 80 ASVs detected in the SA group compared to approximately 160 in the control birds (Figure 4D). ASV numbers began to recover by 7 dpi with only numerical decreases in ASVs detected in the Salmonella groups on days 14 and 21. The Shannon index did not reveal any significant differences in species evenness among treatments at any time point (Figure 4F).
Differences in microbiota composition were further investigated by determining changes in the relative abundance of bacterial genera (Figure 4F). The average relative abundance of the top 20 genera at each time point is also described in Supplementary Table S1. A two-phase change in the cecal microbiota was observed following artificial Salmonella inoculation. An initial disruption was observed at 24 hpi (day 8) and was marked by an increase in Lactobacillus, Bacteroides, and unclassified Bacillaceae in SA birds versus control. This was associated with a decrease in the genera Oscillospira, Subdoligranulum, Enterococcus, and Escherichia. At 7 dpi (14 days of age), a second shift in microbiota composition was observed in which the bloom of Lactobacillus and unclassified Bacillaceae was lost with the abundance of both classes being notably lower in SA birds than that of control. Concomitantly, a relative abundance of Subdoligranulum, unclassified Lachnospiraceae, and Butyricoccus in SA birds were observed to be greater than that of the control. Increases in Subdoligranulum, unclassified Lachnospiraceae, and Butyricoccus were still present at 21 days of age, while Lactobacillus and unclassified Bacillaceae returned to levels similar to that of control. Interestingly, the effect of SA on Oscillospira, Bacteroides, and Escherichia abundance remained consistent across time points.
Natural Salmonella infection via vertical transmission resulted in a shift in microbiota composition similar to that of phase two described above. Similar to the SA group, a decrease in the relative abundance of Lactobacillus, Escherichia, and unclassified Bacillaceae and a strong increase in Bacteroides were observed at 14 and 21 days of age, while no change in Oscillospiraceae or Subdoligranulum was observed at either time point. A temporary increase in members of the Butyricoccus and Enterococcus genera and a decrease in unclassified Lachnospiraceae occurred at 14 days of age. However, the abundance of Butyricoccus was similar to the control by 21 days of age, while Enterococcus and unclassified Lachnospiraceae levels switched, becoming less than and greater than controls, respectively.
Significant changes in specific bacterial taxa were determined using ALDEx2 on CLR-transformed data at the ASV level. Genera with significantly affected ASVs (p < 0.05 and effect <|1|) in at least one comparison are shown in Figure 5. In agreement with the relative abundance data above, the largest number of significantly affected ASVs was seen when comparing SA and control birds at 8 days of age with 28 ASVs belonging to 13 different genera significantly increased or decreased. The number of significantly different abundant ASVs in the SA group decreased to 13 and 4 at days 14 and 21 of age, respectively. In contrast to the SA group, the number of significantly affected ASVs in SN birds versus control increased from 14 (2 ASVs) to 21 days of age (7 ASVs). Interestingly, most of the ASVs in the SN group were also significantly different from SA birds at both time points, indicating a unique microbiota response to natural colonization.

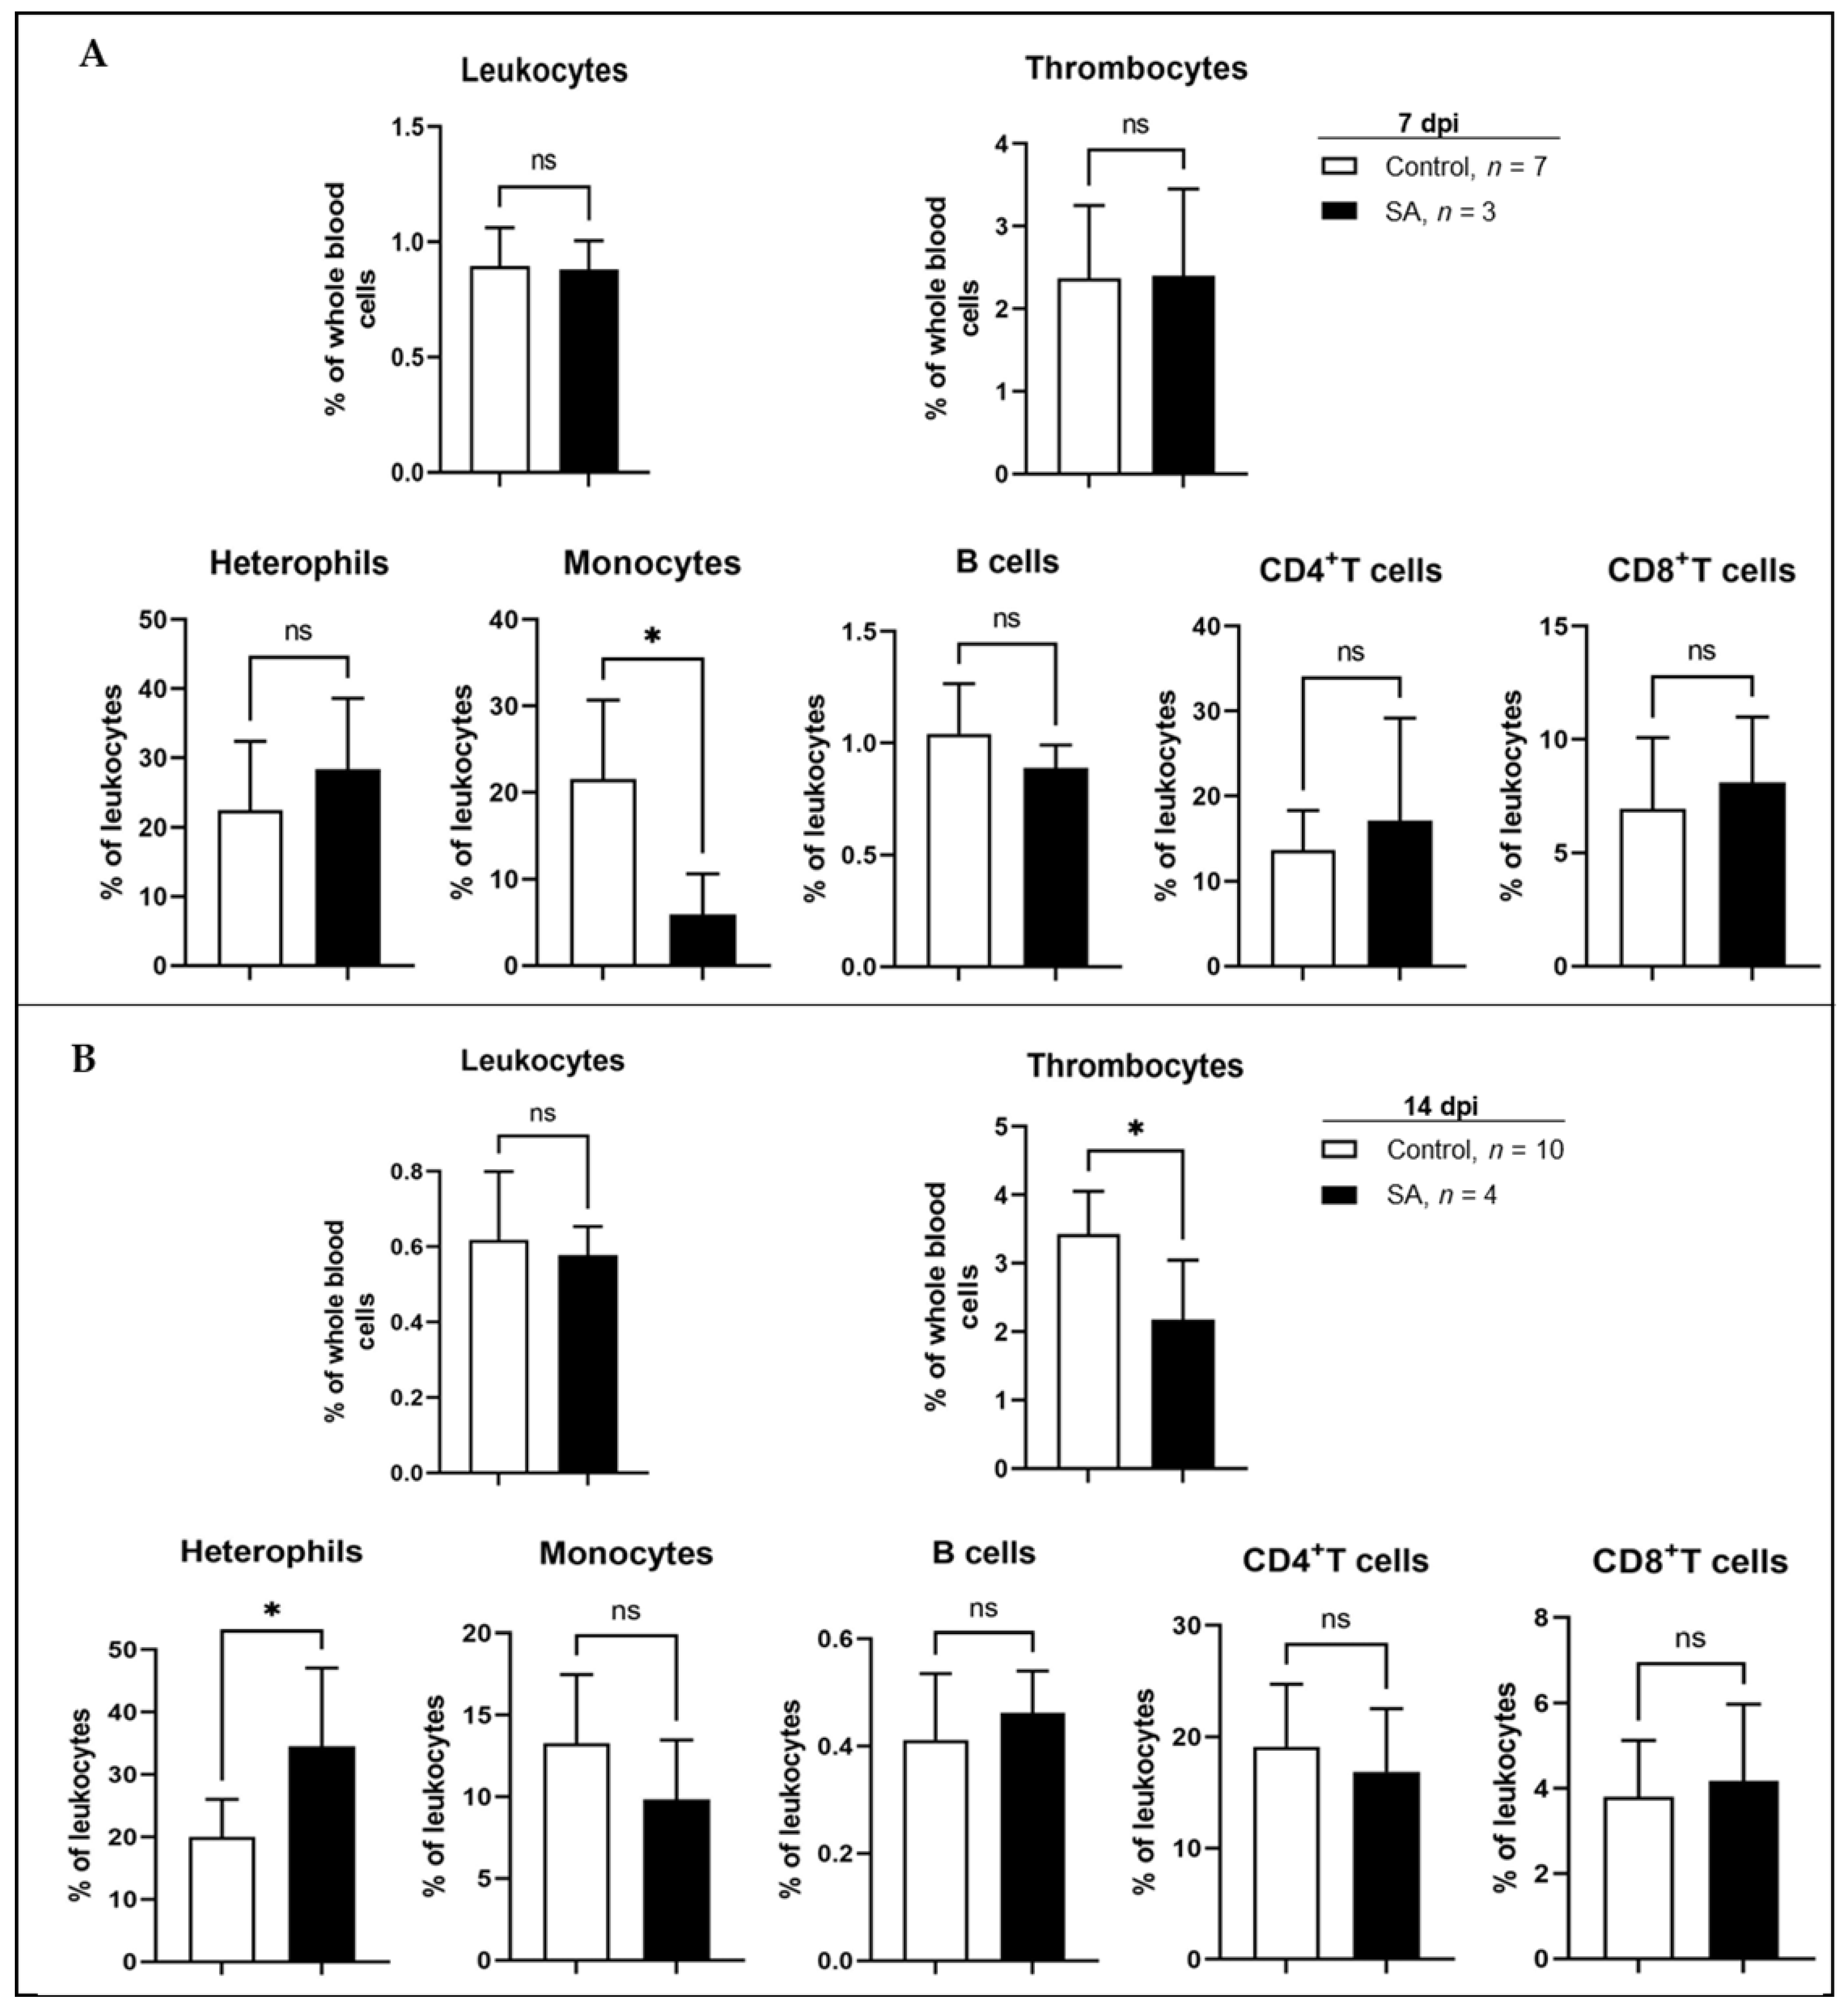
3.2.2. Time-Dependent Response of Leukocyte Subpopulations to Salmonella Inoculation

Host immune response to Salmonella inoculation was evaluated using flow cytometry of stained whole blood. Several samples were found to have begun the clotting process during transfer to the lab and were excluded from the analysis. Unequal sample numbers were taken into account during analysis and results revealed time-dependent changes in leukocyte populations. No significant difference in total leukocytes, thrombocytes, or various leukocyte populations was observed on day 8 (data not shown). By day 14 (7 days post-inoculation, Figure 6A), a significant decrease in the percentage of monocytes was observed (p < 0.05), while all other populations remained the same. Monocyte percentage levels then increased with no significant difference observed between control and SA on day 21 (14 days post-inoculation, Figure 6B). However, a significant decrease (p < 0.05) in the percentage of thrombocytes and an increase in the percentage of heterophils (p < 0.05) were observed on day 21.

4. Discussion

Human salmonellosis, caused by a non-typhoidal Salmonella infection, is responsible for approximately 26,500 hospitalizations and 420 deaths each year [40]. Of these infections, Salmonella serovar Typhimurium is one of the most prevalent causative agents [41]. As contact with poultry and contaminated poultry products is a common source of human Salmonella infections [1], controlling Salmonella colonization is important to decrease human illness. The intestinal microbiota confers multiple benefits to the host, including facilitation of nutrient breakdown and uptake, strengthening of the intestinal barrier, conferring colonization resistance against pathogenic bacteria, and modulation of immunity [42,43]. Therefore, we sought to understand the role of the intestinal microbiota during ST colonization as well as its effect on host immunity.
Numerous studies have been conducted to understand chicken intestinal microbiota and its relationship with health and disease. Microbiota composition is affected by numerous factors such as sex [44], genetic line [45], diet [46], environment [43], and host stress [47,48], yet age is consistently the primary driving factor with the microbiota undergoing successional changes during the life cycle of a bird [12,43,49]. Interestingly, only a few studies have investigated the bacterial populations of day-of-hatch chicks [12,13,14]. These studies have revealed the initial cecal microbiota to be dominated by Gram-negative Proteobacteria, primarily Enterobacteriaceae [12,13,14]. As the microbiota rapidly develop and become more diverse within the first week of life, Proteobacteria is replaced by Firmicutes, with Clostridia dominating the rest of life [14]. In concordance with this, successional changes in cecal microbiota diversity were observed in this study. Proteobacteria members Escherichia and Enterococcus were the only genera detected in day-of-hatch birds, and their abundance decreased significantly with age as Firmicutes members and overall diversity increased.
Both ST challenge and natural colonization of the chicken intestinal tract with ST affected microbiota composition. Oral gavage with Salmonella resulted in a two-phase shift in microbiota composition, which included a sharp initial disruption followed by a second, more stable change. The stress associated with handling young poultry causes an increase in cortisol, [50] which can directly affect microbiota composition [51]. Additionally, the sudden introduction of large numbers of pathogenic bacteria may overwhelm colonization resistance mechanisms within the established microbiota resulting in compositional changes [17]. Interestingly, microbial profiles of the naturally colonized group closely resembled that of the second phase in the artificial group, indicating that the dynamics of microbiota changes during infection are different with artificial being more abrupt. However, the similarities in the final composition indicate that the initial stress from oral gavage does not affect the long-term composition. Contrary to our results, Liu and others [52] did not find a dramatic shift in composition at 1 dpi Salmonella Enteritidis oral inoculation. This difference is most likely due to the difference in bacterial serovar (Typhimurium vs. Enteritidis) or chicken breed (Cobb vs. Jining Bairi chickens) used in each study.
Previous studies investigating Salmonella Enteritidis have found significant changes in microbiota composition following colonization [8,22,53]. These have included increases in Enterobacteriales [8,22,53] and decreases in the Clostridiales, Lactobacillales, and Bifidobacteriales orders [53] and the Enterococcaceae, Lachnospiraceae, Peptostreptococcaceae, Ruminococcaceae, and Erysipelotrichaceae families [8,22]. When comparing the mechanics of Salmonella low-, intermediate, and super-shedders, Kempf and colleagues [23] found a sharp decrease in fecal Enterococcus sp. following infection and considered Enterococcus abundance pre-infection to be a biomarker of Salmonella shedding. Consistent with this, we found a decrease in Enterococcus as well as Lactobacillus, Escherichia, and Bacillaceae following artificial and natural ST colonization. An increase in Lactobacillus was also observed in the ileum of ST-infected birds fed a highly nutritious diet when compared to a poor nutritious diet [54]. Interestingly, Zhang et al. [27] found ST colonization in the ileum to have no effect on Lactobacillus and to decrease Escherichia abundance versus control. Investigation of the effect of ST on the fecal microbiota of laying hens revealed an increase in genera such as Subdoligranulum, Shuttleworthia, Sellimonas, Ruminiclostridium_9, Intestinimonas, Faecalibacterium, Enorma, and Blautia [55]. A concomitant increase in Oscillibacter, Flavonifractor, Erysipelatoclostridium, Eisenbergiella, Caproiciproducens, and Butyricoccus was also observed [55].
Only the genus Bacteroides was found to be increased by ST in this study. Previous work has found propionate produced by Bacteroides to be involved in the microbiota’s colonization resistance to ST in mice [56]. Therefore, the increase in Bacteroides in this study may indicate the microbiota’s attempt to prevent lasting ST colonization. An inverse relationship between Salmonella and E. coli was also observed by Litvak and colleagues [57] who revealed the ability of E. coli, in the presence of butyrate-producing Clostridia, to prevent Salmonella infection by competing for oxygen. While no changes in Clostridia were observed in this study, the decrease in E. coli may still reflect competition for oxygen resources following Salmonella infection.
Finally, the investigation into the effect of ST colonization on host immune response revealed a significant decrease in the percentage of peripheral blood monocytes at 7 dpi. At 14 dpi, monocyte levels had recovered, and a significant decrease in the percentage of thrombocytes and an increase in the percentage of heterophils were observed. Monocytes, thrombocytes, and heterophils are all part of the innate immune system with the ability to kill microbes through phagocytosis, release of granule contents, and production of inflammatory cytokines [58]. An increase in blood monocytes following oral Salmonella infection has previously been seen in mice [59], while heterophils have been found to be an important factor in controlling Salmonella infections in poultry [60] via the release of the antimicrobial peptide Cathelicidin-2 [61]. A decrease in thrombocytes following Salmonella infection has been observed previously in humans and mice and may reflect the consumption of thrombocytes as they form aggregates around pathogenic cells [62].

5. Conclusions

Control of Salmonella colonization in commercial poultry is vital to reducing human cases of salmonellosis. The microbiota plays a key role in preventing bacterial infections through competitive exclusion and modulation of the host immune response. Here we found ST challenge and natural colonization to produce similar effects on the cecal microbiota of broiler chickens. Changes were characterized by a decrease in Enterococcus, Lactobacillus, Escherichia, and Bacillaceae and a concomitant increase in the propionate-producing genus Bacteroides. Additionally, we showed chicken blood leukocytes to have a two-phase response to ST infection with the percentage of monocytes, heterophils, and thrombocytes significantly affected. Taken together, these data provide further insight into the role of the cecal microbiota and host immunity in ST colonization.

Supplementary Materials

The following supporting information can be downloaded at: https://www.mdpi.com/article/10.3390/ani12202867/s1, Table S1: Relative abundance of the top 20 genera following ST colonization.

Author Contributions

P.R.R.J., A.L.F.V.A. and K.A. designed the study. A.L.F.V.A. and K.A. conducted the experiments. A.L.F.V.A. and G.F.E. analyzed flow cytometry data. K.R. analyzed the microbiota data and wrote the manuscript. A.D. and P.R.R.J. critically analyzed and revised the manuscript. All authors have read and agreed to the published version of the manuscript.

Funding

USDA-ARS innovation funds (Round 11) funded this research: 092-0142-020, 035.

Institutional Review Board Statement

All procedures were approved by the University of Arkansas Institutional Animal Care and Use Committee (Protocol #21029) before the study was initiated.

Informed Consent Statement

Not applicable.

Data Availability Statement

Sequencing data in this study are openly available in NCBI SRA at BioProject number PRJNA875154. Additional data are available upon request from the corresponding author.

Acknowledgments

We thank the microbiome research laboratory (MRL) at the University of Texas Southwestern Medical Center (Dallas, TX, USA) for providing 16S sequencing.

Conflicts of Interest

The authors declare no conflict of interest.

References

  1. Gal-Mor, O.; Boyle, E.C.; Grassl, G.A. Same species, different diseases: How and why typhoidal and non-typhoidal Salmonella enterica serovars differ. Front. Microbiol. 2014, 5, 391. [Google Scholar] [CrossRef] [PubMed] [Green Version]
  2. CDC. An Atlas of Salmonella in the United States, 1968–2011; Laboratory-Based Disease Surveillance: Atlanta, GA, USA, 2013.
  3. CDC. Summary of Possible Multistate Enteric (Intestinal) Disease Outbreaks in 2017–2020. Available online: https://www.cdc.gov/foodsafety/outbreaks/multistate-outbreaks/annual-summaries/annual-summaries-2017-2020.html (accessed on 6 September 2022).
  4. Awad, W.; Aschenbach, J.; Khayal, B.; Hess, C.; Hess, M. Intestinal epithelial responses to Salmonella enterica serovar Enteritidis: Effects on intestinal permeability and ion transport. Poult. Sci. 2012, 91, 2949–2957. [Google Scholar] [CrossRef]
  5. US Department of Agriculture (USDA) Economic Research Service. Cost Estimates of Foodborne Illnesses. Available online: https://www.ers.usda.gov/data-products/cost-estimates-of-foodborne-illnesses.aspx (accessed on 6 September 2022).
  6. Tack, D.M.; Marder, E.P.; Griffin, P.M.; Cieslak, P.R.; Dunn, J.; Hurd, S.; Scallan, E.; Lathrop, S.; Muse, A.; Ryan, P. Preliminary incidence and trends of infections with pathogens transmitted commonly through food—Foodborne Diseases Active Surveillance Network, 10 US Sites, 2015–2018. Morb. Mortal. Wkly. Rep. 2019, 68, 369. [Google Scholar] [CrossRef] [PubMed] [Green Version]
  7. People, H. Healthy People 2020 Objectives and Topics: Food Safety. Available online: https://www.healthypeople.gov/node/4478/data_details (accessed on 6 September 2022).
  8. Mon, K.K.; Saelao, P.; Halstead, M.M.; Chanthavixay, G.; Chang, H.-C.; Garas, L.; Maga, E.A.; Zhou, H. Salmonella enterica serovars Enteritidis infection alters the indigenous microbiota diversity in young layer chicks. Front. Vet. Sci. 2015, 2, 61. [Google Scholar] [CrossRef] [Green Version]
  9. Roto, S.M.; Kwon, Y.M.; Ricke, S.C. Applications of in ovo technique for the optimal development of the gastrointestinal tract and the potential influence on the establishment of its microbiome in poultry. Front. Vet. Sci. 2016, 3, 63. [Google Scholar] [CrossRef] [PubMed] [Green Version]
  10. Binek, M.; Borzemska, W.; Pisarski, R.; Kosowska, G.; Malec, H.; Karpińska, E. Evaluation of the efficacy of feed providing on development of gastrointestinal microflora of newly hatched broiler chickens. Arch. Geflugelkund. 2000, 64, 147–151. [Google Scholar]
  11. Kizerwetter-Świda, M.; Binek, M. Bacterial microflora of the chicken embryos and newly hatched chicken. J. Anim. Feed Sci. 2008, 17, 224–232. [Google Scholar] [CrossRef] [Green Version]
  12. Ballou, A.L.; Ali, R.A.; Mendoza, M.A.; Ellis, J.C.; Hassan, H.M.; Croom, W.J.; Koci, M.D. Development of the chick microbiome: How early exposure influences future microbial diversity. Front. Vet. Sci. 2016, 3, 2. [Google Scholar] [CrossRef] [Green Version]
  13. Ding, P.; Liu, H.; Tong, Y.; He, X.; Yin, X.; Yin, Y.; Zhang, H.; Song, Z. Developmental change of yolk microbiota and its role on early colonization of intestinal microbiota in chicken embryo. Animals 2021, 12, 16. [Google Scholar] [CrossRef]
  14. Jurburg, S.D.; Brouwer, M.S.M.; Ceccarelli, D.; van der Goot, J.; Jansman, A.J.M.; Bossers, A. Patterns of community assembly in the developing chicken microbiome reveal rapid primary succession. MicrobiologyOpen 2019, 8, e821. [Google Scholar] [CrossRef]
  15. Crhanova, M.; Hradecka, H.; Faldynova, M.; Matulova, M.; Havlickova, H.; Sisak, F.; Rychlik, I. Immune response of chicken gut to natural colonization by gut microflora and to Salmonella enterica serovar enteritidis infection. Infect. Immun. 2011, 79, 2755–2763. [Google Scholar] [CrossRef]
  16. Apajalahti, J.; Kettunen, A.; Graham, H. Characteristics of the gastrointestinal microbial communities, with special reference to the chicken. Worlds Poult. Sci. J. 2004, 60, 223–232. [Google Scholar] [CrossRef]
  17. Rogers, A.W.; Tsolis, R.M.; Bäumler, A.J. Salmonella versus the microbiome. Microbiol. Mol. Biol. Rev. 2021, 85, e00027-19. [Google Scholar] [CrossRef]
  18. Johnson, T.J.; Youmans, B.P.; Noll, S.; Cardona, C.; Evans, N.P.; Karnezos, T.P.; Ngunjiri, J.M.; Abundo, M.C.; Lee, C.-W. A consistent and predictable commercial broiler chicken bacterial microbiota in antibiotic-free production displays strong correlations with performance. Appl. Environ. Microbiol. 2018, 84, e00362-18. [Google Scholar] [CrossRef] [Green Version]
  19. Chen, Y.; Wang, J.; Yu, L.; Xu, T.; Zhu, N. Microbiota and metabolome responses in the cecum and serum of broiler chickens fed with plant essential oils or virginiamycin. Sci. Rep. 2020, 10, 1–14. [Google Scholar] [CrossRef] [Green Version]
  20. Rodriguez, J.M.; Murphy, K.; Stanton, C.; Ross, R.P.; Kober, O.I.; Juge, N.; Avershina, E.; Rudi, K.; Narbad, A.; Jenmalm, M.C.; et al. The composition of the gut microbiota throughout life, with an emphasis on early life. Microb. Ecol. Health Dis. 2015, 26, 26050. [Google Scholar] [CrossRef] [PubMed]
  21. Huus, K.E.; Ley, R.E. Blowing hot and cold: Body temperature and the microbiome. mSystems 2021, 6, e00707–e00721. [Google Scholar] [CrossRef] [PubMed]
  22. Mon, K.K.; Zhu, Y.; Chanthavixay, G.; Kern, C.; Zhou, H. Integrative analysis of gut microbiome and metabolites revealed novel mechanisms of intestinal Salmonella carriage in chicken. Sci. Rep. 2020, 10, 4809. [Google Scholar] [CrossRef] [Green Version]
  23. Kempf, F.; Menanteau, P.; Rychlik, I.; Kubasová, T.; Trotereau, J.; Virlogeux-Payant, I.; Schaeffer, S.; Schouler, C.; Drumo, R.; Guitton, E. Gut microbiota composition before infection determines the Salmonella super-and low-shedder phenotypes in chicken. Microb. Biotechnol. 2020, 13, 1611–1630. [Google Scholar] [CrossRef]
  24. Videnska, P.; Sisak, F.; Havlickova, H.; Faldynova, M.; Rychlik, I. Influence of Salmonella enterica serovar Enteritidis infection on the composition of chicken cecal microbiota. BMC Vet. Res. 2013, 9, 140. [Google Scholar] [CrossRef] [PubMed] [Green Version]
  25. He, Y.; Yang, Y.; Dong, Y.; Ito, K.; Zhang, B. Highly nutritious diet resists Salmonella Typhimurium infections by improving intestinal microbiota and morphology in broiler chickens. Poult. Sci. 2020, 99, 7055–7065. [Google Scholar] [CrossRef] [PubMed]
  26. Leyva-Diaz, A.A.; Hernandez-Patlan, D.; Solis-Cruz, B.; Adhikari, B.; Kwon, Y.M.; Latorre, J.D.; Hernandez-Velasco, X.; Hargis, B.M.; Lopez-Arellano, R.; Tellez-Isaias, G. Evaluation of curcumin and copper acetate against Salmonella Typhimurium infection, intestinal permeability, and cecal microbiota composition in broiler chickens. J. Anim. Sci. Biotechnol. 2021, 12, 23. [Google Scholar] [CrossRef]
  27. Zhang, B.; Li, G.; Shahid, M.S.; Gan, L.; Fan, H.; Lv, Z.; Yan, S.; Guo, Y. Dietary l-arginine supplementation ameliorates inflammatory response and alters gut microbiota composition in broiler chickens infected with Salmonella enterica serovar Typhimurium. Poult. Sci. 2020, 99, 1862–1874. [Google Scholar] [CrossRef]
  28. Cobb Vantress. Cobb Broiler Management Guide. 2021. Available online: https://www.cobb-vantress.com/assets/Cobb-Files/045bdc8f45/Broiler-Guide-2021-min.pdfCOBB (accessed on 29 September 2022).
  29. Seliger, C.; Schaerer, B.; Kohn, M.; Pendl, H.; Weigend, S.; Kaspers, B.; Härtle, S. A rapid high-precision flow cytometry based technique for total white blood cell counting in chickens. Vet. Immunol. Immunopathol. 2012, 145, 86–99. [Google Scholar] [CrossRef] [PubMed]
  30. Bolyen, E.; Rideout, J.R.; Dillon, M.R.; Bokulich, N.A.; Abnet, C.C.; Al-Ghalith, G.A.; Alexander, H.; Alm, E.J.; Arumugam, M.; Asnicar, F.; et al. Reproducible, interactive, scalable and extensible microbiome data science using QIIME 2. Nat. Biotechnol. 2019, 37, 852–857. [Google Scholar] [CrossRef] [PubMed]
  31. Amir, A.; McDonald, D.; Navas-Molina, J.A.; Kopylova, E.; Morton, J.T.; Zech Xu, Z.; Kightley, E.P.; Thompson, L.R.; Hyde, E.R.; Gonzalez, A.; et al. Deblur rapidly resolves single-nucleotide community sequence patterns. mSystems 2017, 2, e00191-16. [Google Scholar] [CrossRef] [PubMed] [Green Version]
  32. Quast, C.; Pruesse, E.; Yilmaz, P.; Gerken, J.; Schweer, T.; Yarza, P.; Peplies, J.; Glöckner, F.O. The SILVA ribosomal RNA gene database project: Improved data processing and web-based tools. Nucleic Acids Res. 2012, 41, D590–D596. [Google Scholar] [CrossRef] [PubMed]
  33. R Core Team. R: A Language and Environment for Statistical Computing; R Foundation for Statistical Computing: Vienna, Austria, 2022; Available online: https://www.R-project.org/ (accessed on 29 September 2022).
  34. Wickham, H. Ggplot2: Elegant Graphics for Data Analysis; Springer: New York, NY, USA, 2016. [Google Scholar]
  35. Paulson, J.N.; Stine, O.C.; Bravo, H.C.; Pop, M. Differential abundance analysis for microbial marker-gene surveys. Nat. Methods 2013, 10, 1200–1202. [Google Scholar] [CrossRef] [Green Version]
  36. McMurdie, P.J.; Holmes, S. phyloseq: An R package for reproducible interactive analysis and graphics of microbiome census data. PLoS ONE 2013, 8, e61217. [Google Scholar] [CrossRef] [Green Version]
  37. Gloor, G.B.; Macklaim, J.M.; Pawlowsky-Glahn, V.; Egozcue, J.J. Microbiome datasets are compositional: And this is not optional. Front. Microbiol. 2017, 8, 2224. [Google Scholar] [CrossRef] [Green Version]
  38. Oksanen, J.; Blanchet, F.G.; Kindt, R.; Legendre, P.; Minchin, P.R.; O’hara, R.; Simpson, G.L.; Solymos, P.; Stevens, M.H.H.; Wagner, H. Vegan: Community Ecology Package. R Package Version 2.6-2. 2022. Available online: https://cran.r-project.org/package=vegan (accessed on 29 September 2022).
  39. Fernandes, A.D.; Macklaim, J.; Linn, T.; Reid, G.; Gloor, G. ANOVA-like differential gene expression analysis of single-organism and meta-RNA-seq. PLoS ONE 2013, 8, e67019. [Google Scholar] [CrossRef]
  40. CDC. Salmonella. Available online: https://www.cdc.gov/Salmonella/index.html (accessed on 4 April 2022).
  41. Scallan, E.; Hoekstra, R.M.; Angulo, F.J.; Tauxe, R.V.; Widdowson, M.-A.; Roy, S.L.; Jones, J.L.; Griffin, P.M. Foodborne illness acquired in the United States—Major pathogens. Emerg. Infect. Dis. 2011, 17, 7. [Google Scholar] [CrossRef]
  42. Borda-Molina, D.; Seifert, J.; Camarinha-Silva, A. Current perspectives of the chicken gastrointestinal tract and its microbiome. Comput. Struct. Biotechnol. J. 2018, 16, 131–139. [Google Scholar] [CrossRef]
  43. Oakley, B.B.; Lillehoj, H.S.; Kogut, M.H.; Kim, W.K.; Maurer, J.J.; Pedroso, A.; Lee, M.D.; Collett, S.R.; Johnson, T.J.; Cox, N.A. The chicken gastrointestinal microbiome. FEMS Microbiol. Lett. 2014, 360, 100–112. [Google Scholar] [CrossRef] [PubMed]
  44. Lee, K.C.; Kil, D.Y.; Sul, W.J. Cecal microbiome divergence of broiler chickens by sex and body weight. J. Microbiol. 2017, 55, 939–945. [Google Scholar] [CrossRef] [PubMed]
  45. Zhao, L.; Wang, G.; Siegel, P.; He, C.; Wang, H.; Zhao, W.; Zhai, Z.; Tian, F.; Zhao, J.; Zhang, H.; et al. Quantitative genetic background of the host influences gut microbiomes in chickens. Sci. Rep. 2013, 3, 1163. [Google Scholar] [CrossRef] [Green Version]
  46. Pan, D.; Yu, Z. Intestinal microbiome of poultry and its interaction with host and diet. Gut Microbes 2014, 5, 108–119. [Google Scholar] [CrossRef] [PubMed] [Green Version]
  47. Shi, D.; Bai, L.; Qu, Q.; Zhou, S.; Yang, M.; Guo, S.; Li, Q.; Liu, C. Impact of gut microbiota structure in heat-stressed broilers. Poult. Sci. 2019, 98, 2405–2413. [Google Scholar] [CrossRef]
  48. Zhu, L.; Liao, R.; Wu, N.; Zhu, G.; Yang, C. Heat stress mediates changes in fecal microbiome and functional pathways of laying hens. Appl. Microbiol. Biotechnol. 2019, 103, 461–472. [Google Scholar] [CrossRef]
  49. Oakley, B.B.; Kogut, M.H. Spatial and temporal changes in the broiler chicken cecal and fecal microbiomes and correlations of bacterial taxa with cytokine gene expression. Front. Vet. Sci. 2016, 3, 11. [Google Scholar] [CrossRef] [PubMed] [Green Version]
  50. Kannan, G.; Mench, J. Prior handling does not significantly reduce the stress response to pre-slaughter handling in broiler chickens. Appl. Anim. Behav. Sci. 1997, 51, 87–99. [Google Scholar] [CrossRef]
  51. Michels, N.; Van de Wiele, T.; Fouhy, F.; O’Mahony, S.; Clarke, G.; Keane, J. Gut microbiome patterns depending on children’s psychosocial stress: Reports versus biomarkers. Brain Behav. Immun. 2019, 80, 751–762. [Google Scholar] [CrossRef]
  52. Liu, L.; Lin, L.; Zheng, L.; Tang, H.; Fan, X.; Xue, N.; Li, M.; Liu, M.; Li, X. Cecal microbiome profile altered by Salmonella enterica, serovar Enteritidis inoculation in chicken. Gut Pathog. 2018, 10, 34. [Google Scholar] [CrossRef]
  53. Juricova, H.; Videnska, P.; Lukac, M.; Faldynova, M.; Babak, V.; Havlickova, H.; Sisak, F.; Rychlik, I. Influence of Salmonella enterica serovar enteritidis infection on the development of the cecum microbiota in newly hatched chicks. Appl. Environ. Microbiol. 2013, 79, 745–747. [Google Scholar] [CrossRef] [PubMed] [Green Version]
  54. Khan, S.; Chousalkar, K.K. Short-term feeding of probiotics and synbiotics modulates caecal microbiota during Salmonella Typhimurium infection but does not reduce shedding and invasion in chickens. Appl. Microbiol. Biotechnol. 2020, 104, 319–334. [Google Scholar] [CrossRef]
  55. Khan, S.; Chousalkar, K.K. Salmonella Typhimurium infection disrupts but continuous feeding of Bacillus based probiotic restores gut microbiota in infected hens. J. Anim. Sci. Biotechnol. 2020, 11, 29. [Google Scholar] [CrossRef] [PubMed] [Green Version]
  56. Jacobson, A.; Lam, L.; Rajendram, M.; Tamburini, F.; Honeycutt, J.; Pham, T.; Van Treuren, W.; Pruss, K.; Stabler, S.R.; Lugo, K. A gut commensal-produced metabolite mediates colonization resistance to Salmonella infection. Cell Host Microbe 2018, 24, 296–307.e297. [Google Scholar] [CrossRef] [Green Version]
  57. Litvak, Y.; Mon, K.K.; Nguyen, H.; Chanthavixay, G.; Liou, M.; Velazquez, E.M.; Kutter, L.; Alcantara, M.A.; Byndloss, M.X.; Tiffany, C.R.; et al. Commensal Enterobacteriaceae protect against Salmonella colonization through oxygen competition. Cell Host Microbe 2019, 25, 128–139. [Google Scholar] [CrossRef] [PubMed] [Green Version]
  58. Astill, J.; Wood, R.D.; Sharif, S. Thrombocyte functions in the avian immune system. In Avian Immunology; Elsevier: Amsterdam, The Netherlands, 2022; pp. 205–212. [Google Scholar]
  59. Rydström, A.; Wick, M.J. Monocyte recruitment, activation, and function in the gut-associated lymphoid tissue during oral Salmonella infection. J. Immunol. 2007, 178, 5789–5801. [Google Scholar] [CrossRef] [PubMed] [Green Version]
  60. Kogut, M.H.; Tellez, G.I.; McGruder, E.D.; Hargis, B.M.; Williams, J.D.; Corrier, D.E.; DeLoach, J.R. Heterophils are decisive components in the early responses of chickens to Salmonella enteritidis infections. Microb. Pathog. 1994, 16, 141–151. [Google Scholar] [CrossRef]
  61. van Dijk, A.; Tersteeg-Zijderveld, M.H.; Tjeerdsma-van Bokhoven, J.L.; Jansman, A.J.; Veldhuizen, E.J.; Haagsman, H.P. Chicken heterophils are recruited to the site of Salmonella infection and release antibacterial mature Cathelicidin-2 upon stimulation with LPS. Mol. Immunol. 2009, 46, 1517–1526. [Google Scholar] [CrossRef] [PubMed]
  62. Hitchcock, J.R.; Cook, C.N.; Bobat, S.; Ross, E.A.; Flores-Langarica, A.; Lowe, K.L.; Khan, M.; Dominguez-Medina, C.C.; Lax, S.; Carvalho-Gaspar, M. Inflammation drives thrombosis after Salmonella infection via CLEC-2 on platelets. J. Clin. Investig. 2015, 125, 4429–4446. [Google Scholar] [CrossRef] [PubMed]
Figure 1. Temporal changes in cecal microbiota diversity. Cecal samples from non—infected chicks were used to determine variation in microbiota composition with age. For beta diversity, the distance between samples was calculated using the Euclidean distance of CLR normalized data and visualized with a PCA plot (A). Community richness and evenness were calculated using the Observed Features (B) and Shannon diversity (C) calculators, respectively. Significant differences in beta diversity were determined using permanova. A Kruskal-Wallis test was used to evaluate alpha diversity, and means were separated with pairwise Wilcoxon Rank-Sum tests. Segments not sharing a common superscript are considered significantly different (p < 0.05). Samples falling outside of the first and third quartiles are shown as black dots.
Animals 12 02867 g001
Figure 2. Variation in bacterial composition with age. Bacterial composition was visualized by calculating the relative abundance of CSS normalized data at the phylum (A) and genus (B) levels using 3 to 5 birds per age. Only the top 20 genera are shown.
Animals 12 02867 g002
Figure 3. Characterization of temporal shifts in the proportions of chicken leukocyte populations. Whole blood, collected from 10 control birds at each time point, was subjected to flow cytometry to identify changes in leukocyte subpopulations. Results are shown as the percent of total leukocytes measured (CD45+CD41/61−). Significant differences were determined using Two-way ANOVA, and pairwise comparisons were completed using Tukey HSD. Results were considered significantly different at a p < 0.05. Significant difference for each cell type are indicated by asterisks color-coded to match the cell type (* = p < 0.05, ** = p < 0.01, *** = p < 0.001, **** = p < 0.0001).
Animals 12 02867 g003
Figure 4. Effect of Salmonella colonization on bacterial diversity. PCA plots were used to visualize differences in bacterial composition between control, Salmonella artificial (SA), and Salmonella natural (SN) groups on days 8 (A), 14 (B), and 21(C), as measured by the Euclidean distance between samples. Changes in community richness and evenness were determined using the Observed Features (D) and Shannon diversity (E) calculators, respectively. Relative abundance was calculated using CSS normalized data, and the top 20 genera are shown (F). Significant differences were determined using the permanova and Kruskal-Wallis tests for beta and alpha diversity, respectively. Wilcoxon Rank-Sum tests were used for pairwise comparisons in richness and evenness. Results were considered significant at a p < 0.05. Samples falling outside of the first and third quartiles are shown as black dots.
Animals 12 02867 g004
Figure 5. Shifts in the abundance of bacterial features in response to Salmonella colonization. At 7 days of age, control and SA birds were given an oral gavage of PBS or ST, respectively. Following inoculation, five SA birds were moved to pens with uninoculated birds (SN) to act as Salmonella seeder birds for natural horizontal transmission. Changes in the abundance of ASVs were determined using ALDEx2. Genera with features significantly affected in at least one comparison were plotted. Each dot represents the calculated effect size of a single ASV with significantly affected ASVs colored red. Differences were considered significant at FDR < 0.05 and effect > 1.
Animals 12 02867 g005
Figure 6. Effect of Salmonella inoculation on leukocyte populations. Whole blood, collected from 10 birds at 7 (A) and 14 (B) days post-infection, was subjected to flow cytometry to identify changes in leukocyte subpopulations. Samples displaying high amounts of clotting prior to processing were excluded. Significant differences were determined using the Student’s t-test and results were considered significantly different at p < 0.05 (ns = Not Significant, * = p < 0.05).
Animals 12 02867 g006
Publisher’s Note: MDPI stays neutral with regard to jurisdictional claims in published maps and institutional affiliations.

