
Prediction of Consumers’ Adoption Behavior of Products with Water Efficiency Labeling Based on Hidden Markov Model
1
School of Management and Economics, North China University of Water Resources and Electric Power, No. 136 Jinshui East Road, Zhengzhou 450046, China
2
Research Center of Citizen’s Water Literacy, North China University of Water Resources and Electric Power, No. 136 Jinshui East Road, Zhengzhou 450046, China
3
College of Water Resources, North China University of Water Resources and Electric Power, No. 136 Jinshui East Road, Zhengzhou 450046, China
*
Author to whom correspondence should be addressed.
Water 2024, 16(1), 44; https://doi.org/10.3390/w16010044
Submission received: 16 October 2023
/
Revised: 15 December 2023
/
Accepted: 19 December 2023
/
Published: 21 December 2023
Abstract
:Water efficiency labeling, an environmental protection label, can provide consumers with products’ water-saving information, guide consumers to choose high-efficiency water-saving products, and encourage residents to save water. Data were obtained from a questionnaire survey among 526 respondents in Zhengzhou, China. The study constructed a Hidden Markov Model (HMM) to predict consumers’ adoption behavior of products with water efficiency labeling. The adoption probability of consumers at different perceptions and water-saving awareness for products with water efficiency labeling and the state transition probability of consumers’ adoption behavior of products with water efficiency labeling were calculated. Consumers’ adoption behavior of products with water efficiency labeling in different situations is predicted. The research found: (1) When the degree of perception remains unchanged, the improvement of consumers’ water-saving awareness will promote their adoption of products with water efficiency labeling and increase the probability of continuous adoption behavior. (2) The state of consumers’ adoption behavior depends on the last adoption behavior. Furthermore, as the state level increases, the dependency on adoption behavior becomes more vigorous. (3) HMM is suitable for predicting consumers’ adoption behavior of products with water efficiency labeling and has high accuracy. The research findings can provide a theoretical basis and decision-making reference for the government and enterprises to formulate relevant guiding policies and promotion strategies.
1. Introduction
Water is the source of life, an essential primary natural and strategic economic resource, and one of the indispensable resources for the survival and development of human society. With the continuous advancement of China’s urbanization process and rapid economic growth, problems such as water resource shortages, increased water pollution, and water ecological deterioration have gradually become prominent and have become essential factors affecting sustainable development [1]. To promote high-efficiency water-saving products, improve water-use efficiency, and promote water-saving technological progress since 2005, Australia, Singapore, the United States, Portugal, China, etc., have launched water efficiency labeling programs or management measures. As an essential water-saving management measure, promoting the application of water efficiency labeling has been implemented in succession by many countries. However, existing surveys show that the water efficiency labeling system only covers a small range of products and the lack of effective incentives, in particular, the low degree of recognition and low motivation for adoption among consumers, these problems seriously hinder the comprehensive promotion of water efficiency labeling and the efficient utilization of water resources [2].
Water efficiency labeling has similar functions and purposes to energy efficiency labeling, carbon labels, and eco-labels; that is, it provides consumers with relevant information so that they know the environmental impact of the products they choose [3,4,5]. With the gradual improvement in consumers’ awareness of environmental protection and energy saving, more and more people have expressed their willingness to purchase environmentally friendly products [6,7], but it is not easy to translate this concern or willingness into actual adoption behavior [8]. Driven by this issue, scholars have conducted extensive research on the adoption behavior of energy efficiency labels, carbon labels, and eco-label products, mainly including consumers’ perceptions and preferences [9], adoption intentions [10], willingness to pay premiums [11], and factors affecting adoption behavior [12,13,14]. Moreover, existing studies related to water efficiency labeling mainly focus on the popularization and promotion of water efficiency labeling [15], the effect of plan implementation [16], and the influencing factors and mechanisms of adoption behavior [17,18].
Based on the above analysis, it can be found that although scholars have explored the impact mechanism of consumers’ adoption behavior based on studying consumers’ preferences, willingness, and the current situation of environmental protection products. However, it mainly explores the influencing factors and their interaction relationship. It is still impossible to judge and dynamically predict the specific situation of consumers’ adopting products with water efficiency labeling nor the probability of consumers’ adoption. Therefore, this study takes consumer perception and water-saving awareness as the starting point and constructs a Hidden Markov Model (HMM) to predict the consumers’ adoption behavior of products with water efficiency labeling to provide decision-making references for the government and enterprises to formulate relevant policies.
The theoretical contributions of this study are mainly reflected in the following three aspects: First, by calculating the probability of consumers adopting products with water efficiency labeling under different observation conditions, the impact of water-saving awareness on consumers’ adoption of products with water efficiency labeling is analyzed. Second, by calculating the state transition probability of adoption behavior for products with water efficiency labeling, the dependency and habits of consumers’ adoption behavior of products with water efficiency labeling are evaluated. Based on the consumption data, the prediction of consumers’ adoption behavior of products with water efficiency labeling in different situations is realized. Thirdly, this study proposes a dynamic prediction method for consumers’ adoption behavior of products with water efficiency labeling based on a questionnaire survey and consumption data, which provides a reference for relevant theoretical research and management practice.
2. Literature Review
2.1. Origin and Development of Water Efficiency Labeling
As early as 2005, Australia released the “Water Efficiency Labeling and Standards Act 2005”, which marked the birth of the world’s first water efficiency labeling system. The plan was initially voluntary and became mandatory on 1 July 2006. The WELS program resulted in a national water saving of 112 GL/year in Australia in 2017–2018, which is expected to increase to 186 GL/year by 2026 and 231 GL/year by 2036 [16]. In June 2006, the US Environmental Protection Agency (EPA) launched the Water Sense voluntary certification project. The project saved the United States $32.6 billion in water and energy costs and 1.5 trillion gallons of water and avoided 78 million tons of greenhouse gas emissions [19]. In addition, countries and regions such as Singapore, Portugal, and Europe have successfully implemented water efficiency labeling programs and have significantly achieved water saving [20].
China is the first country among non-developed economies to introduce a water efficiency labeling system. Chinese scholars have systematically defined the concept of water efficiency labeling in the “Water Efficiency Labeling Management Measures” [21]. Water efficiency labeling refers to a mark for classifying aquatic products’ water efficiency grade performance using self-declaration and information filing by the enterprise. Implementing the water efficiency labeling system will improve the water efficiency and quality of China’s terminal water products [22]. According to a study, implementing the water efficiency labeling system will generate at least 6 billion cubic meters of water-saving benefits each year, equivalent to a water cost of more than 12 billion yuan [23].
2.2. Research on the Influencing Factors of Adoption Behavior of Products with Water Efficiency Labeling
The influencing factors of consumers’ adoption behavior for labeled products can be roughly divided into internal and external factors. Internal factors refer to factors related to consumers themselves, such as consumers’ cognition of labels, degree of trust, perceived value, and individual characteristics of consumers. When consumers need an understanding of labels, there is a high probability of affecting the adoption rate for labeled products [24]. The determinant of cognition is whether consumers pay attention to the label information. Only when consumers actively pay attention to the label will the cognition gradually increase, and then they may respond according to the label information and change their adoption behavior [25]. Consumers’ trust in labels mainly depends on perceived value, which can positively impact consumers’ consumption attitudes [26]. Consumer attitudes, perceived value, and environmental concerns will positively influence consumers’ purchase intentions and indirectly influence their adoption behavior [27,28,29]. The impact of consumers’ characteristics on adopting energy efficiency labels is reflected in the level of education, social responsibility, and trust in others [12]. In addition, the individual characteristics of consumers are also the main factors affecting consumers’ adoption of carbon labels, eco-labels, and other products, such as consumers’ age, educational background, place of residence, and monthly disposable income [30,31]. In addition to the internal factors, other factors affecting consumers’ adoption of labeled products are external environmental factors. For example, external environmental factors such as social norms [26], publicity and guidance policies [32], government subsidy policies [2], and macro-political and economic backgrounds [33] will have an impact on consumers’ behavior toward adopting labels. Wang et al. believed that there are two influencing factors for consumers to adopt products with water efficiency labeling: consumer perception and environmental factors. Moreover, they indirectly affect consumers’ adoption behavior of products with water efficiency labeling through the willingness to adopt [2].
2.3. HMM and Its Application
Scholars such as Baum put forward the basic theory of HMM in a series of classic papers from the late 1960s to the early 1970s [34]. HMM is a mathematical model that infers a pattern of observed state sequences by assuming that an unknown sequence of states can produce a known sequence of observations [35]. The basis of HMM in the stochastic Markov process is composed of multiple states and the transition relationship between them [36]. In light of this, HMM provides researchers with a probabilistic framework for inference and prediction and requires fewer training samples, and thus has been applied to behavior recognition [37], speech recognition [38], natural language processing [39], fault detection [40], economic forecasting [41], earthquake prediction [42], hydrological prediction [43], and other fields.
From the above research, scholars at home and abroad have conducted various research on labeled products, which provide an essential theoretical reference for studying the adoption behavior of products with water efficiency labeling. However, there are few kinds of literature on the dynamic research for consumers’ adoption behavior, and even fewer studies on the dynamic prediction for adoption behavior of products with water efficiency labeling based on HMM, which is the focus of this study.
3. Materials and Methods
3.1. Key Variable Identification
Through a comprehensive review of the relevant literature, it was found that consumer perception and water-saving awareness are two critical factors affecting consumers’ adoption of products with water efficiency labeling [2]. Generally, consumers will make preliminary judgments and reactions to new things based on their experience and knowledge. When consumers understand and master more water efficiency labeling information, it is helpful for them to adopt products with water efficiency labeling. Dieu et al. believe that the increased cognition of water efficiency labeling positively impacts consumers’ decision to adopt water-saving equipment [13]. Consumers’ adoption behavior for green products is also affected by consumers’ awareness of green food labels [44]. Trust is the basis for consumers to adopt water efficiency labeling, and consumers’ distrust for labels predominantly affects their adoption behavior. The research shows that consumers’ distrust of labels has a significant negative moderating effect on their adoption behavior [45]. Consumers’ perceived trust significantly impacts their purchase behavior of eco-friendly products [46]. According to the TAM, actors will first consider the benefits that new technologies bring to themselves when adopting new technologies. The empirical study has shown that perceived usefulness significantly and positively affects consumers’ adoption behavior [47]. For example, the perceived usefulness of virtual goods and services can significantly and positively affect consumers’ willingness to adopt them [48]. In addition, consumers, as the main body adopting products with water efficiency labeling, are driven by awareness, which is the basis of behavior. The study found that water-saving awareness positively impacts households’ adoption of water-efficient appliances [13]. Water-saving awareness also directly affects citizens’ acceptance and adoption of recycled water [49].
Based on the above scholars’ views, this study takes consumer perception and water-saving awareness as research variables and measures consumer perception from cognition degree, perceived trust, and perceived usefulness. Water-saving awareness was measured as a separate variable. The specific information is shown in Table 1.
3.2. Data Sources and Tests
- (1)
- Data collection
This study developed consumer perception, water-saving awareness, and adoption behavior of products with water efficiency labeling measurement scales and obtained data through questionnaires. The questionnaire was developed and revised based on literature, expert opinions, and feedback from the respondents in the pre-investigation stage. The final questionnaire has 22 items, including demographic information such as gender, age, education level, occupation type, and average monthly family income of the respondents (the questionnaire is in Appendix A). For the measurement of variables, this study adopts a 5-level Likert scale design, that is, “totally disagree” = 1, “somewhat agree” = 2, “not sure” = 3, “somewhat agree” = 4, and “strongly agree” = 5. Finally, a total of 526 questionnaires were recovered, a total of 82 complete questionnaires were eliminated (if the answering time does not exceed 120 s, and more than 80% of the answers are all options in a particular order), and a total of 444 valid questionnaires were obtained, with an effective rate of 84.41%. Studies have shown that when the sample size is about 300, an agreement of greater than 0.9 of the sample loading relative to the population loading can be obtained, an accepted value used in behavioral science to establish equivalence between two groups of loadings [50,51]. The individual statistical characteristics of the sample are shown in Table 2.
In addition, 50 consumers were randomly sent consumption record collection applications. Since consumption records involve personal privacy, only 25 consumers’ consumption records were collected, with 2615 records, of which 2500 were complete and valid. In collecting consumption records, only the transaction records of consumers in the Alipay and WeChat payment systems are collected. These records can preserve the consumer’s consumption in a relatively comprehensive manner. The information collected also included consumers’ state indicators regarding consumer perception, water-saving awareness, and adoption behavior of products with water efficiency labeling. Eighty percent of the consumption record data are trained using the Baum–Welch algorithm, and the remaining twenty percent is used for prediction to verify the model’s reliability.
- (2)
- Reliability and validity tests
In this study, SPSS 25.0 software tests the reliability of 444 valid questionnaires collected. The formal scale’s internal consistency reliability test results are obtained, as shown in Table 3. The Cronbach’s α coefficient value of each variable is more significant than 0.7, and the “Cronbach’s α coefficient after deletion” is smaller than the Cronbach’s α coefficient of each variable. Each Corrected Item-Total Correlation (CITC) value is not less than 0.3. The analysis results show that the scale has good reliability.
To ensure that the scale has good validity, the Kaiser–Meyer–Olkin (KMO) value test and the Bartlett sphericity test were carried out on the scale, and the results are shown in Table 4. The overall KMO value of the scale was 0.897 > 0.7, and the Bartlett sphericity test significantly rejected the null hypothesis that there was no correlation between variables. The test results show that the scale has good construct validity.
3.3. HMM Construction of Consumers’ Adoption Behavior of Products with Water Efficiency Labeling
- (1)
- The basic idea
By constructing HMM to realize the prediction of consumers’ adoption behavior of products with water efficiency labeling, the following problems must be solved. ① With a certain level of water-saving awareness, how likely are consumers with different perceptions to adopt products with water efficiency labeling? ② How likely is it that consumers with a certain degree of perception will continue to consume products with water efficiency labeling at different levels of water-saving awareness? ③ Under the influence of consumer perception and water-saving awareness, how dependent is the adoption behavior of its products with water efficiency labeling? ④ How to evaluate whether consumers have changed their consumption habits to purchase products with water efficiency labeling?
To solve question ①, it is necessary to establish a state probability model of consumer perception, water-saving awareness, and the adoption behavior of products with water efficiency labeling. Since the state probability is generated under certain conditions, the study constructs a Bayesian network model that can meet the requirements of conditional probability calculation. To solve question ②, adding time series to the Bayesian network model is necessary, extending the static Bayesian network model to a dynamic Bayesian network model based on time series. Based on question ②, the “dependency” of question ③ and the “consumption habit” of question ④ are all about the probability of time series, and the state transition probability needs to be calculated. The state transition probability matrix is introduced into the Bayesian network model based on time series. In addition, since it is challenging to observe consumers’ adoption behavior of products with water efficiency labeling, it is necessary to introduce a function to calculate the probability of the unknown state. So, the study constructed the hidden Markov model (HMM) based on the Bayesian network for empirical research.
This study analyzes the influence of consumer perception and water-saving awareness on consumers’ adoption behavior of products with water efficiency labeling by calculating the probability of consumers’ adoption of products with water efficiency labeling in different observed states and the transition probability of consumers’ adoption behavior of products with water efficiency labeling. In addition, by collecting consumption data and constructing HMM based on known observation sequences (consumer perception, water-saving awareness), the study infers the unknown state sequences (adoption behavior of products with water efficiency labeling). Then, it predicts the consumers’ adoption behavior of products with water efficiency labeling in different observation states.
- (2)
- Construction of HMM
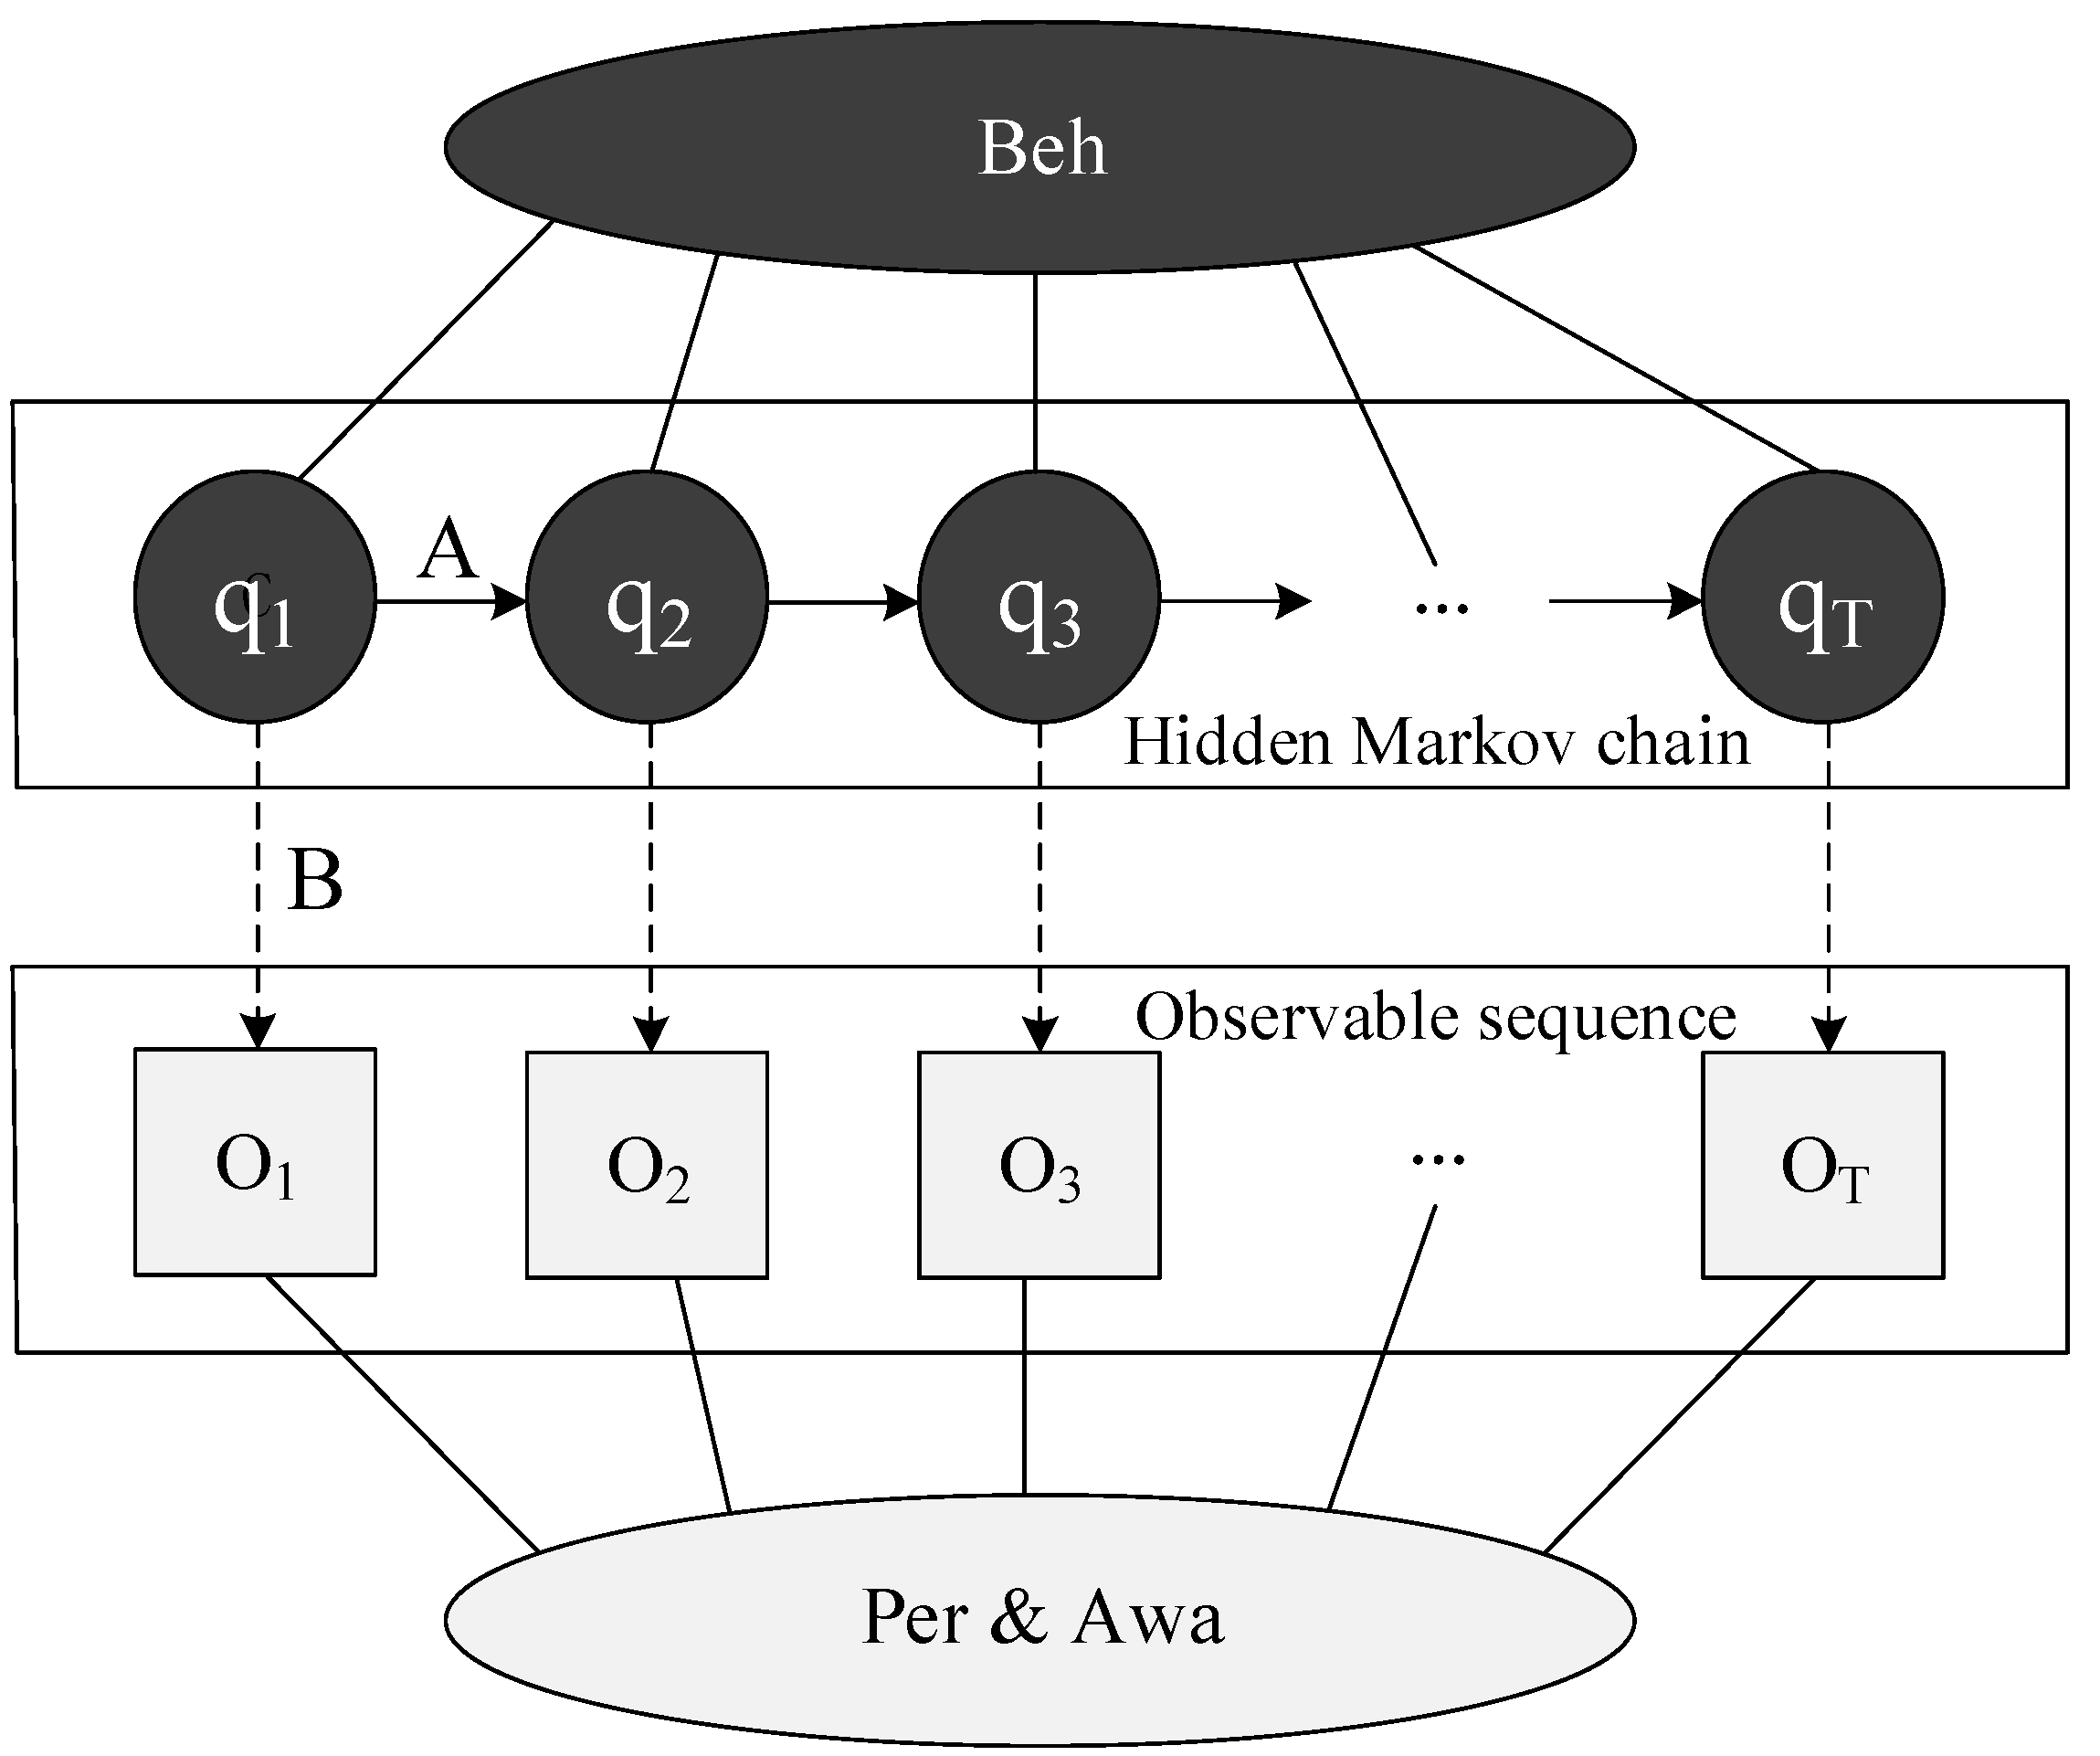
HMM usually consists of five parts: hidden state, observation, state transition probability matrix, observation probability matrix, and initial state probability matrix. Combined with the research content of this paper, the relevant parameters can be set as follows [52]:
N represents the number of hidden states contained in the HMM; si represents the hidden state, 1 ≤ i ≤ N. In the model constructed in this study, N can be expressed as Beh = {s1, s2, …, sN}. At time t, the state of the Markov chain is qt, where qt ∊ Beh.
M represents the number of observations contained in the HMM; vk represents the observed value, 1 ≤ k ≤ M. M can be expressed as Per&Awa = {v1, v2, …, vM}. At time t, the observed value of the Markov chain is ot, where ot ∊ Per&Awa.
A represents the state transition probability matrix. A represents the transition probability distribution of the model in a different state, A = {aij}, where aij = p(qt + 1 = sj|qt = si), 1 ≤ i ≤ N, 1 ≤ j ≤ N. aij represents the probability of transitioning from the si state at time t to the sj state at (t + 1) time.
B is the observation probability matrix (state mapping matrix), which represents the probability distribution of different observation values for each hidden state, B = {bi(k)}, where bi(k) = p(ot = vk|qt = si), 1 ≤ k ≤ M, 1 ≤ i ≤ N, bi(k) represents the probability that the observed value is vk when the state is si at time t.
π is the initial state probability matrix, which is expressed as the probability distribution of the hidden state at the initial moment, π = (π1, π2, …, πN), where πi = p(q1 = si), 1 ≤ i ≤ N, πi represents the probability that the hidden state is si when t = 1.
The HMM of consumers’ adoption behavior of products with water efficiency labeling is shown in Figure 1.
- (3)
- Calculation process
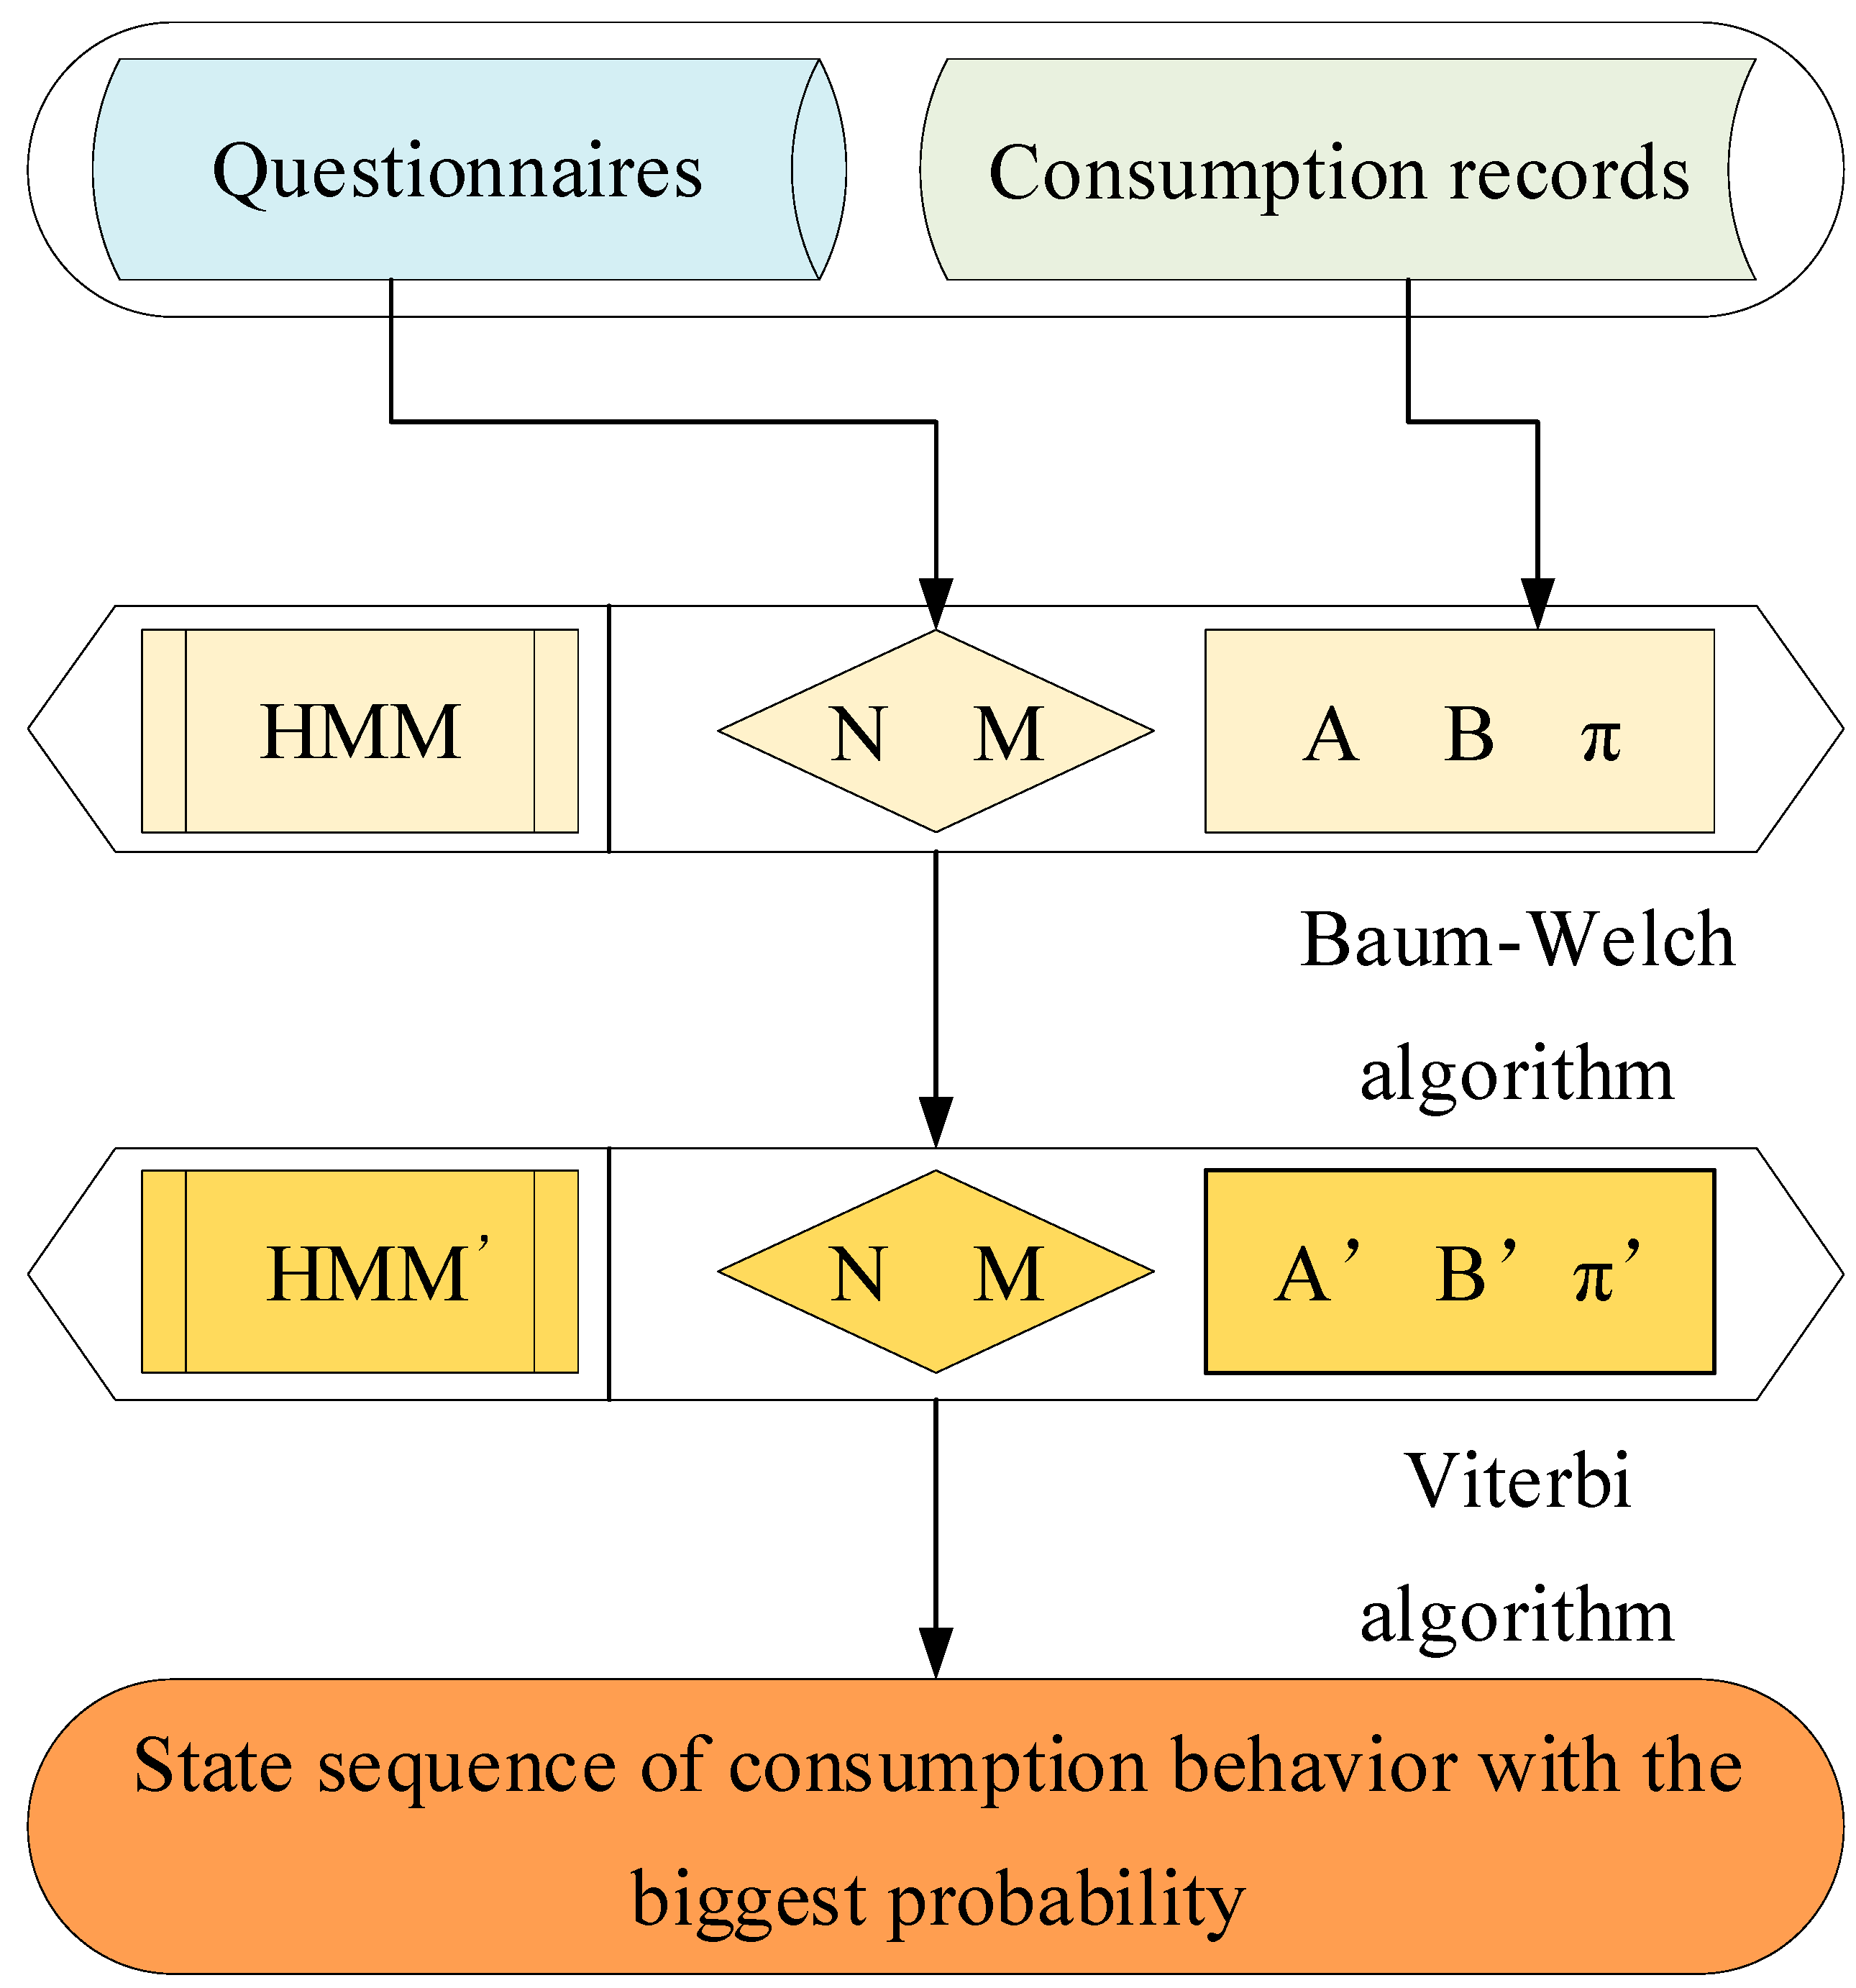
Based on the basic HMM algorithm, the study tests and predicts consumers’ adoption behavior of products with water efficiency labeling according to the following process: ① According to the questionnaire survey data, the mean value and standard error algorithms are used to classify consumer perception, water-saving awareness, and adoption behavior of products with water efficiency labeling. The number of hidden states N and observations M of the hidden Markov model are obtained through calculation. ② According to the consumption records of the respondents (consumers) and the set parameters of N and M, the state transition matrix A, observation probability matrix B, and initial probability matrix π of each consumer are estimated. ③ Part of the consumption records are used as the data training set, and the Baum–Welch algorithm is used to retrain and evaluate each consumer’s state transition matrix A, observation probability matrix B, and initial probability matrix π. ④ Use new parameters to establish HMM for each consumer and calculate the corresponding optimal state sequence under a particular observation sequence through the Viterbi algorithm. The calculation process is shown in Figure 2.
4. Results of Empirical Analysis
4.1. Confirm States Level
This study uses the mean and standard deviation algorithm to classify consumer perception, water-saving awareness, and adoption behavior of products with water efficiency labeling from low to high. Consumer perception is divided into four state levels, water-saving awareness is divided into three state levels, and adoption behavior of products with water efficiency labeling is divided into five state levels. The classification results and explanations are shown in Table 5.
4.2. Calculate the Probability of Consumers Adopting Products with Water Efficiency Labeling
The Baum–Welch algorithm calculates the probability of consumers adopting products with water efficiency labeling under different water-saving awareness and consumer perception observations. The results are shown in Table 6. When the consumer’s observation value is in Per0&Awa0, the probability that the state of adoption behavior of products with water efficiency labeling is Beh4 is 0.017. Furthermore, when the consumer’s observation value is in Per0&Awa1, the probability that the state of adoption behavior of products with water efficiency labeling is Beh4 becomes 0.033. According to the results of the increase in the probability value, when the perception level remains unchanged, the improvement of consumers’ water-saving awareness will promote their adoption of products with water efficiency labeling.
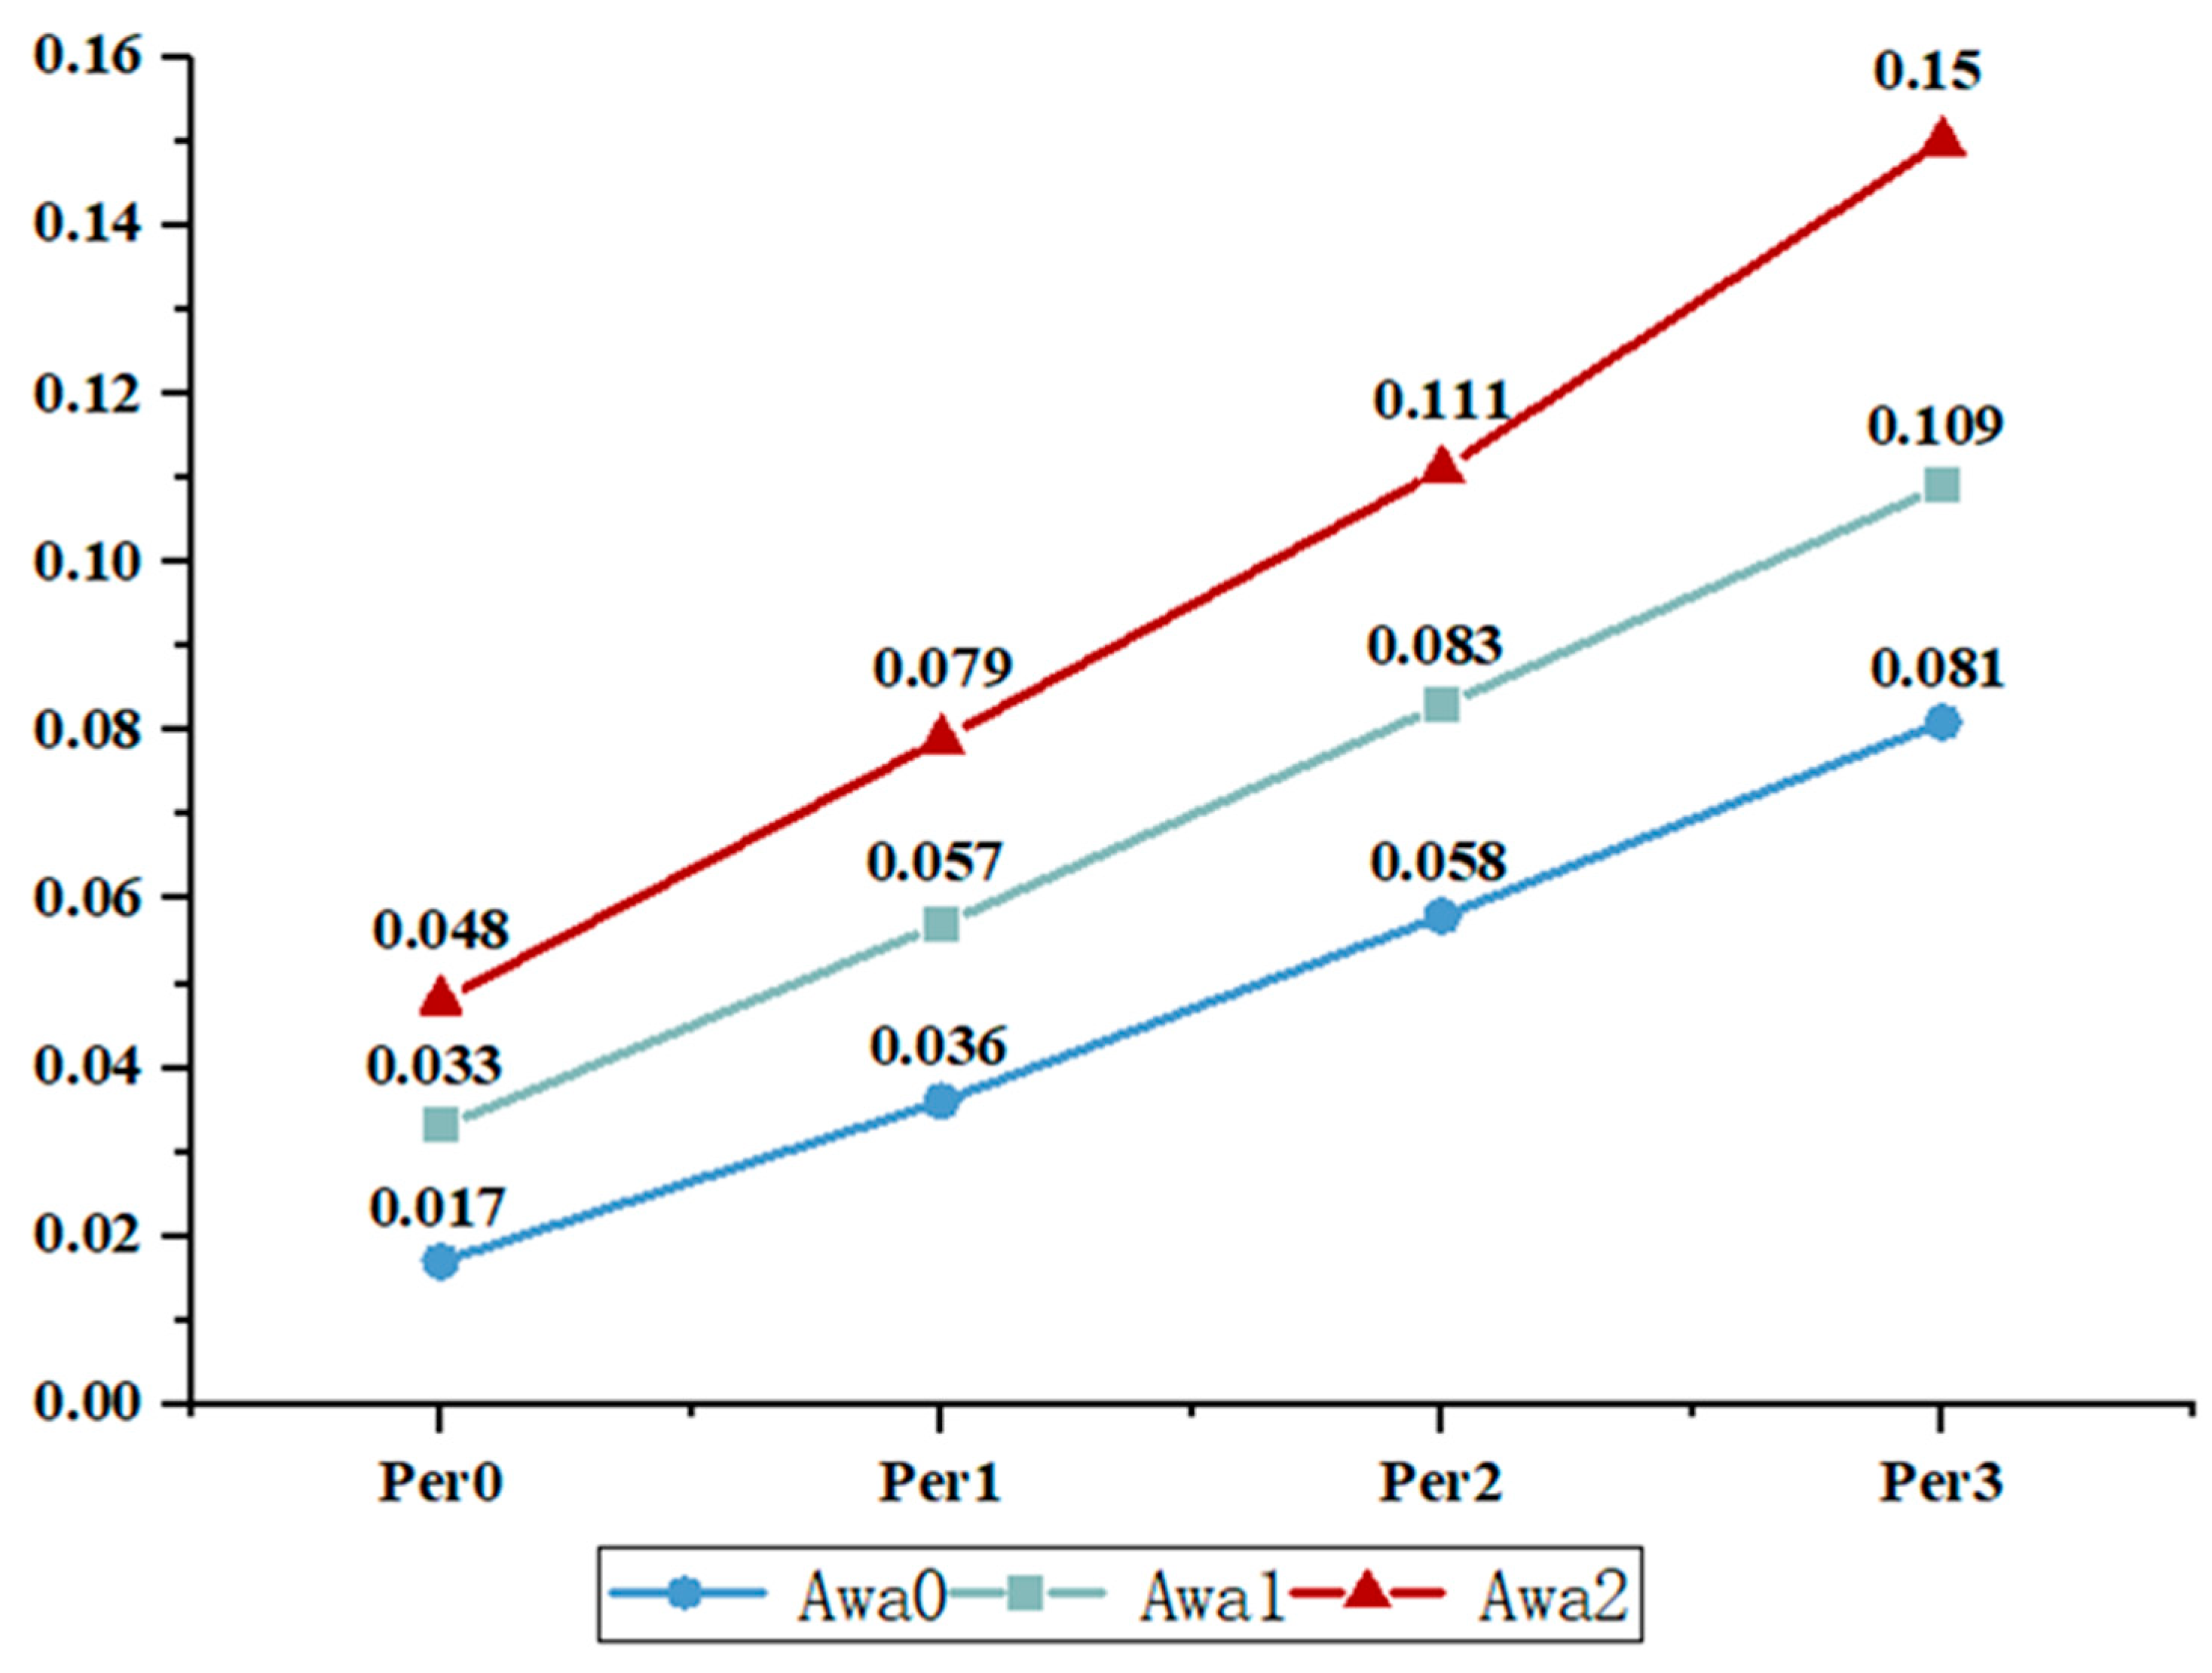
In addition, we further analyzed consumers’ continuous adoption behavior of products with water efficiency labeling. We drew the line statistics (Figure 3) with the probability value of Beh4 in Table 6 as the vertical axis and the consumer perception category as the horizontal axis. It can be seen from the figure that consumers with higher water-saving awareness are more likely to continue to adopt products with water efficiency labeling. Moreover, as the degree of perception increases, the higher the level of consumers’ water-saving awareness, the more significant the change in the probability of continuously adopting products with water efficiency labeling.
4.3. Calculate the State Transition Probability of Consumers’ Adoption Behavior of Products with Water Efficiency Labeling
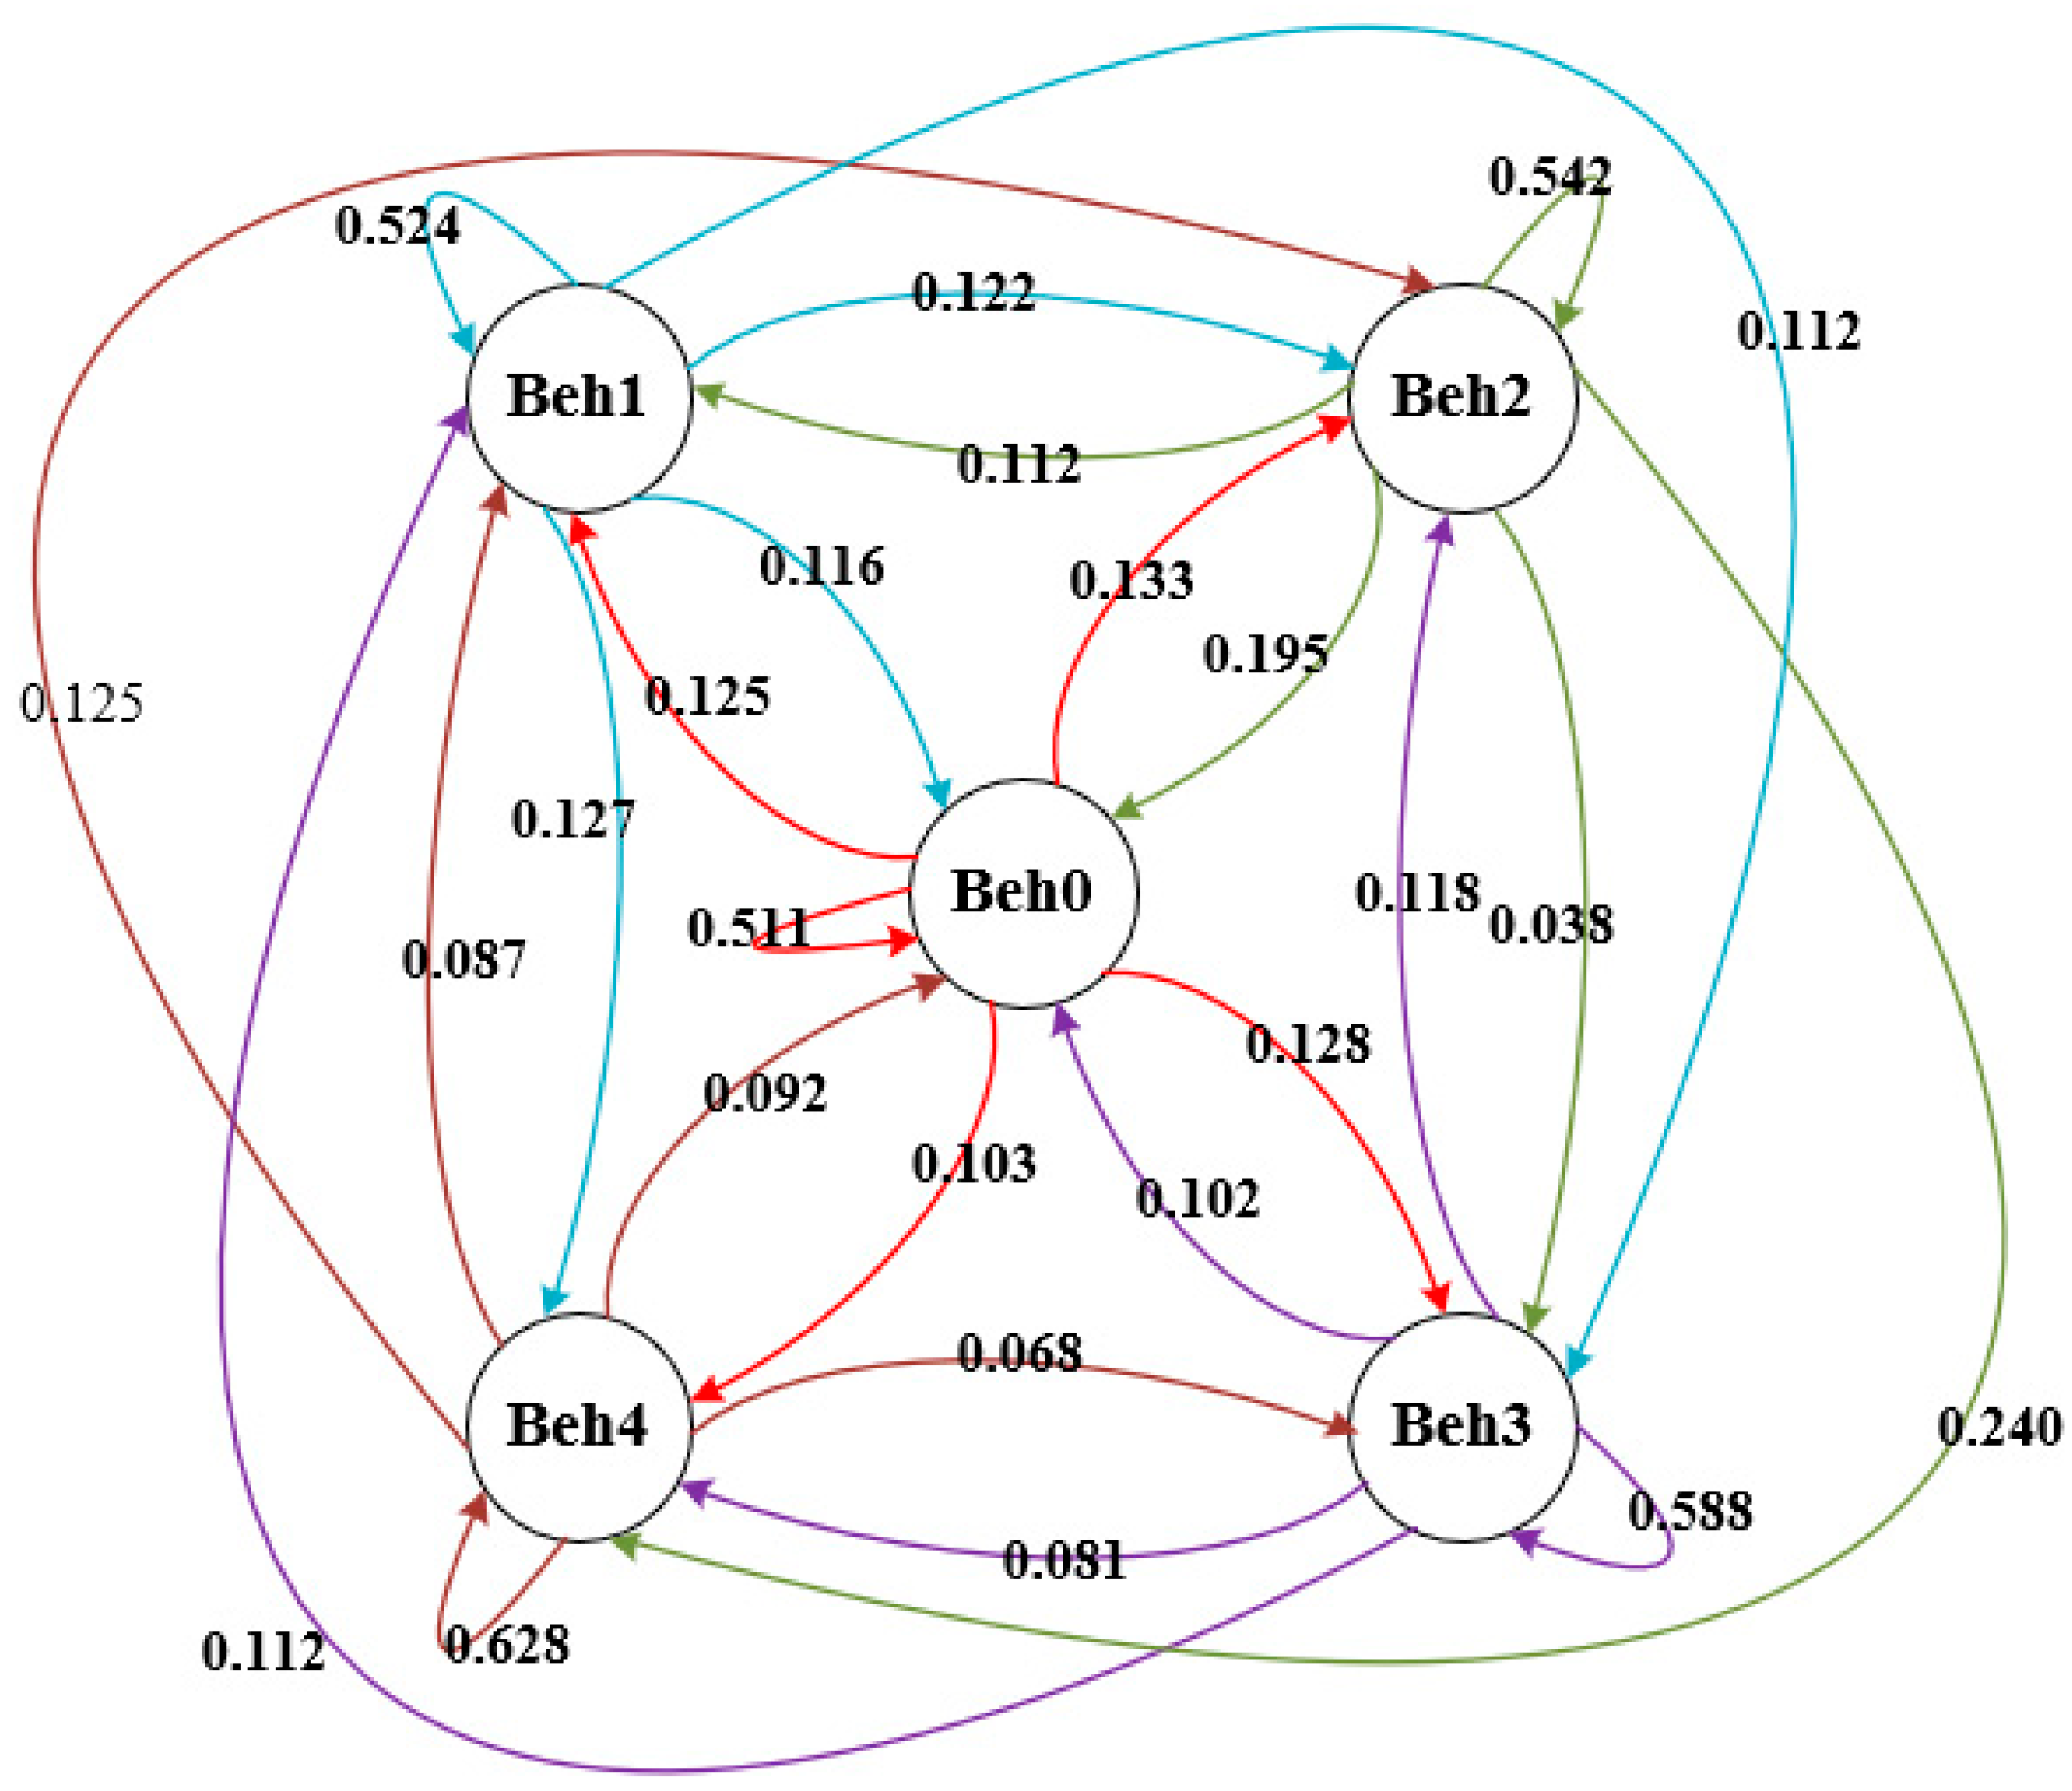
The Baum–Welch algorithm calculates the state transition probability of consumers’ adoption behavior of products with water efficiency labeling, and the results are shown in Figure 4. When the state level of consumers’ adoption behavior of products with water efficiency labeling at time t is Beh2, and the probability that the state level at the time (t + 1) is still Beh2 is 0.542. Consumers who are in the state level of Beh2 in the consumers’ adoption behavior of products with water efficiency labeling have about 54% probability of maintaining the state level of Beh2. When the state level of consumers’ adoption behavior of products with water efficiency labeling at time t is Beh4, and the probability that the state level at the time (t + 1) is still Beh4 is 0.628. Consumers who are in the state level of Beh4 in the consumers’ adoption behavior of products with water efficiency labeling have about a 63% probability of maintaining the state level of Beh4. Comparing the above two results, consumers’ adoption behavior of products with water efficiency labeling tends to depend on the last adoption behavior. As the state level increases, the dependency on adoption behavior gradually becomes more vigorous.
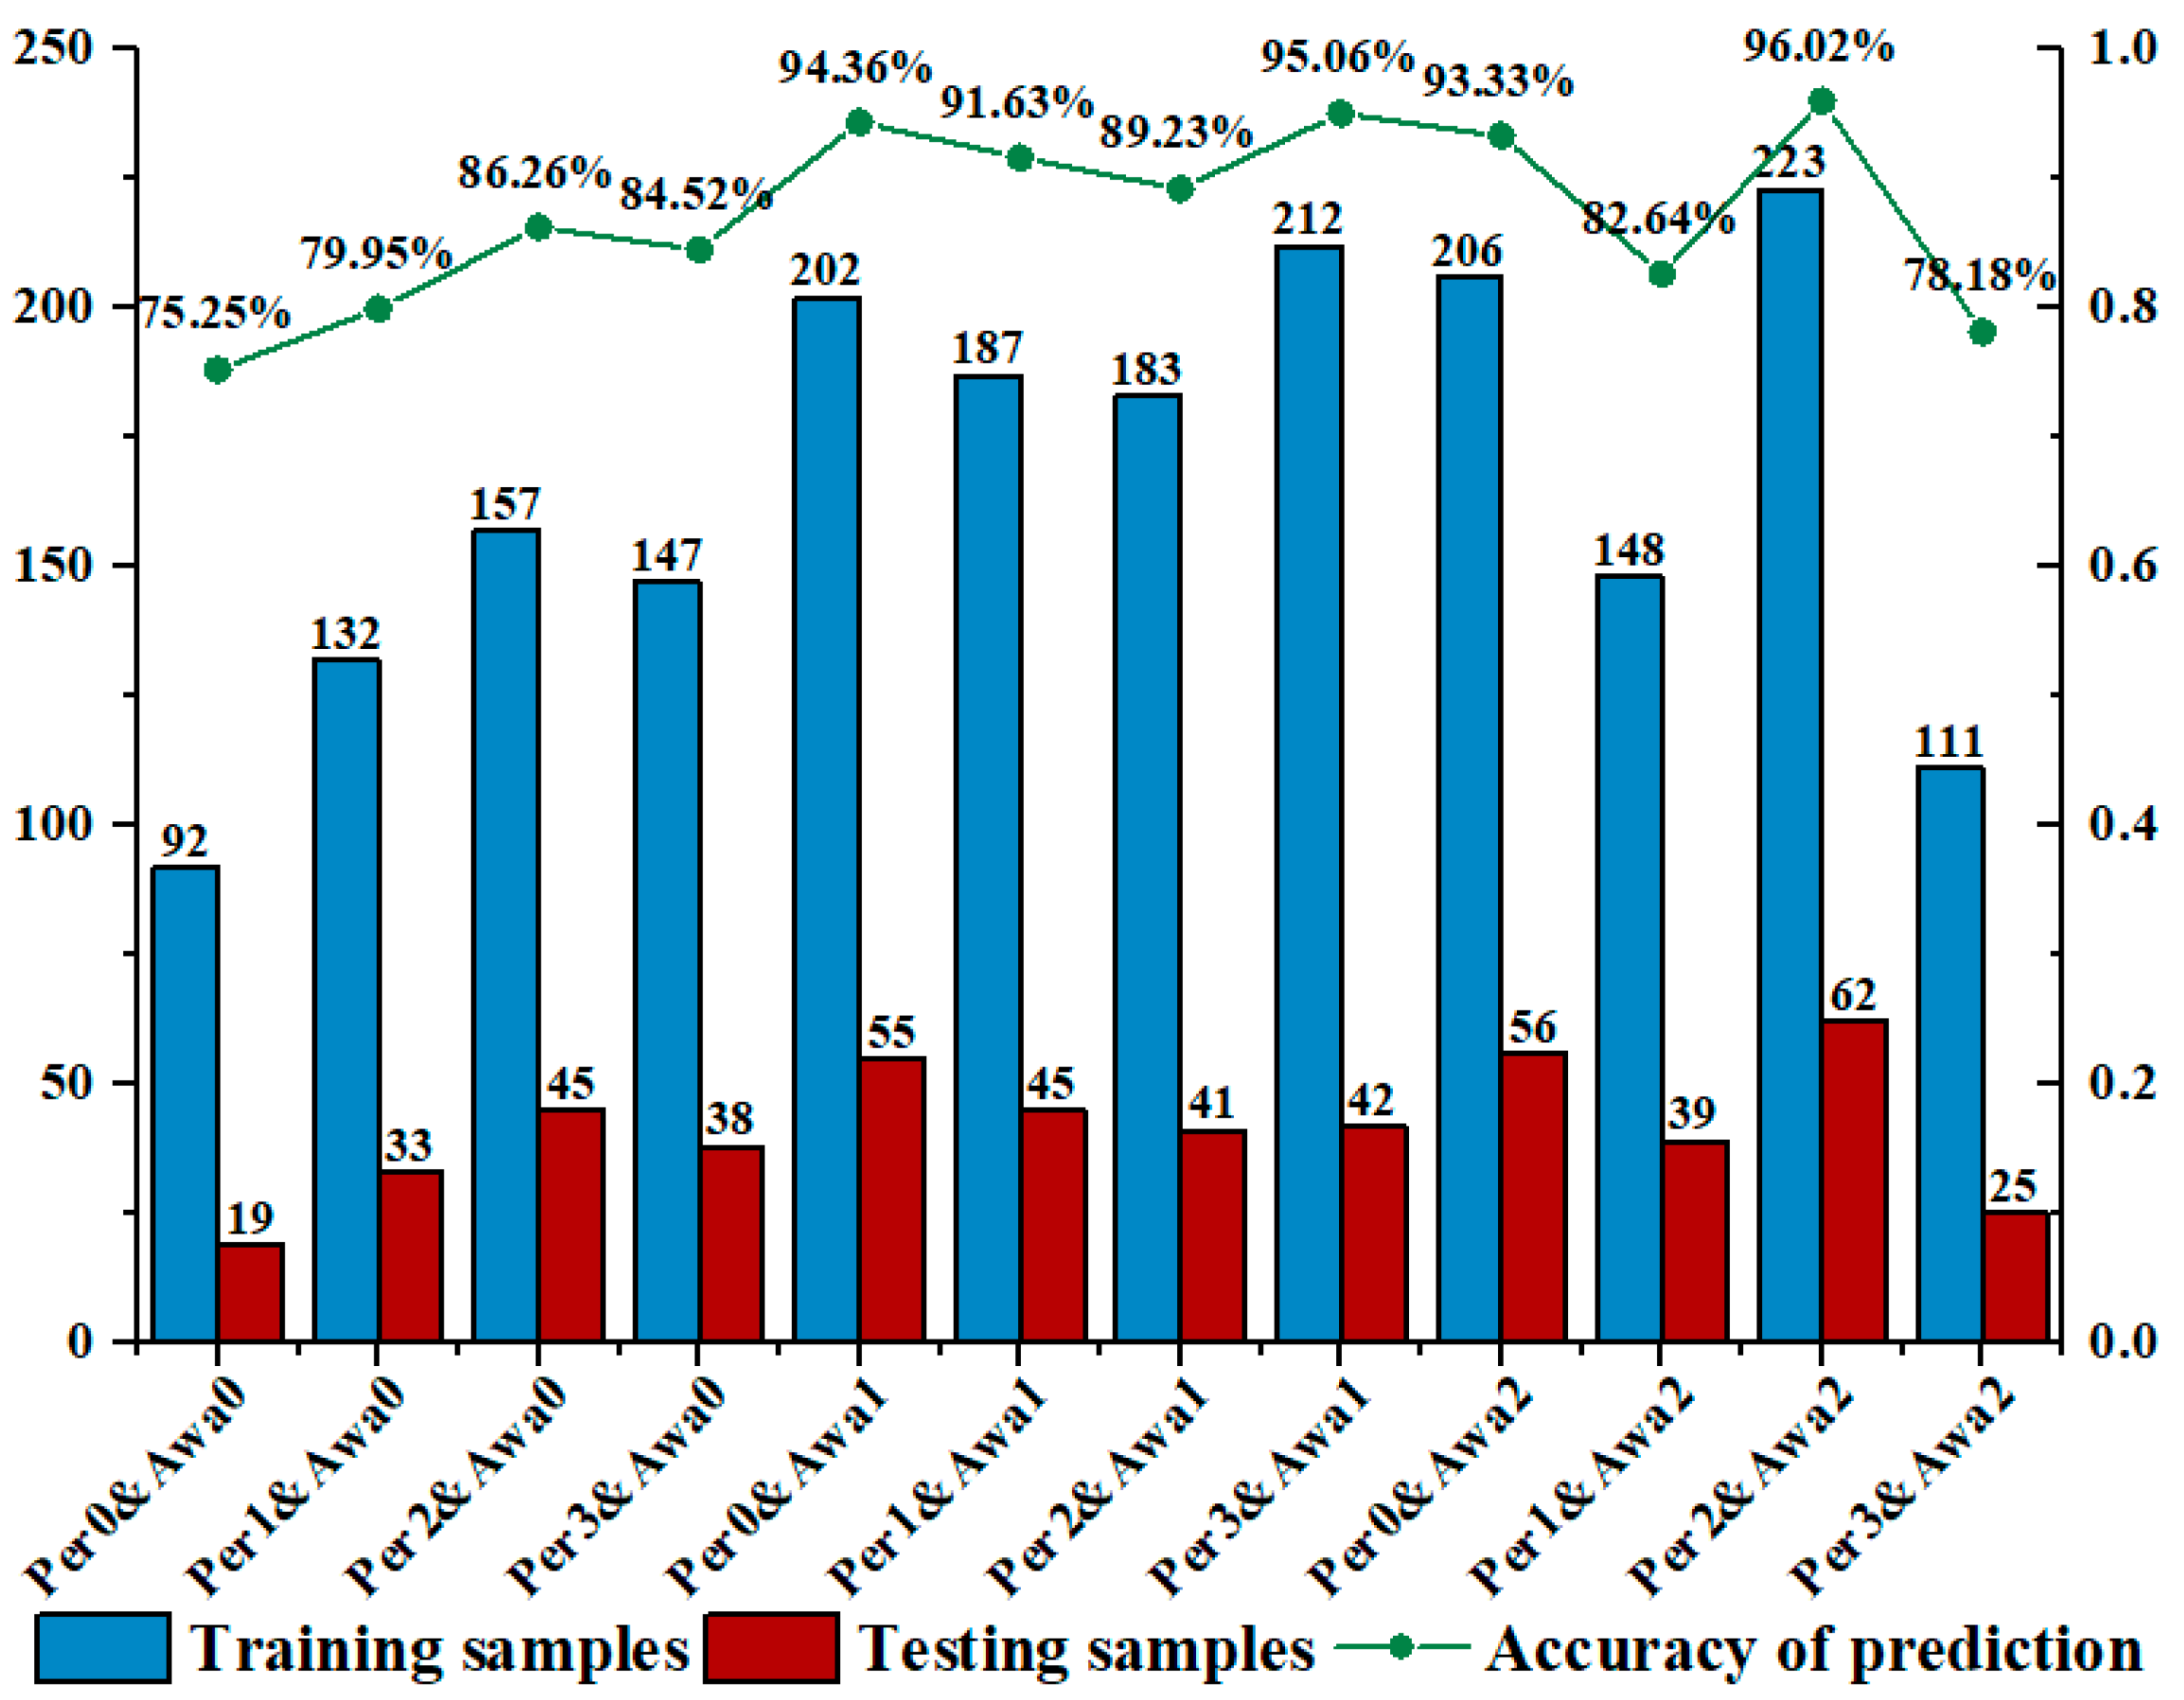
4.4. Evaluate the Prediction Accuracy
Combined with the existing training parameters, this study uses the Viterbi algorithm to predict the remaining data, and the results are shown in Figure 5. The number of training samples with observation value Per1&Awa0 is 132, and the prediction accuracy is 79.95%. The number of training samples with observation value Per2&Awa0 is 157, and the prediction accuracy is increased to 86.26%. This shows that the training parameters of HMM have a high degree of fitting, and the prediction accuracy can reach 96%. As the number of samples increases, the accuracy will increase accordingly.
5. Discussion
This study demonstrates that improving consumers’ water-saving awareness contributes to their adoption of products with water efficiency labeling by calculating the probability of consumers with different degrees of perception for adopting products with water efficiency labeling under a certain level of water-saving awareness. It has been shown that citizens’ lack of water-saving awareness will severely hinder water conservation efforts and that attitudes toward water use can be more effectively improved to support water-saving behavior when individuals maintain positive behavior and the external environment provides favorable conditions [53]. However, although citizens are increasingly aware of the necessity for water conservation, family members’ understanding of water use differs from the actual water-use behavior [54,55]. They do not yet have vigorous water-saving awareness, or at least it is insufficient to drive them to implement water-saving behavior effectively. Tian and Chen argue that only when water users truly perceive the actual data or information can they better cultivate water-saving awareness and thus change their attitudes and concepts of water use to promote the implementation of water-saving behavior [56]. As a kind of information label, water efficiency labeling can alleviate or eliminate the asymmetry of information phenomenon on water efficiency of water-saving products for consumers. Therefore, the government should strengthen the publicity and education of water efficiency labeling, cultivate and enhance citizens’ water-saving awareness, guide consumers’ adoption behavior for products with water efficiency labeling, and promote water conservation in society.
Products with water efficiency labeling are environmentally friendly products compared to available products. Since these labels impose mandatory requirements on the critical point of product energy consumption, this will increase manufacturing costs and higher prices than ordinary products [57]. However, if labeled products provide consumers with the same or higher perceived effects as ordinary products, consumers will be more inclined to buy them [58]. Based on the results of the state probability model, this study found that consumers with more vigorous water-saving awareness are more likely to continue to adopt products with water efficiency labeling. Moreover, when the degree of consumer perception increases, the higher their level of water-saving awareness, the more significant the change in the probability of continuously adopting products with water efficiency labeling. This indicates that consumer perception and water-saving awareness are essential in promoting their adoption behavior [45,46,47,48]. Therefore, when citizens’ water-saving awareness is generally enhanced, governments should increase their efforts in publicizing water efficiency labeling, and highlight the economic, environmental, and social effects of the water efficiency labeling system [59], and encourage production enterprises to innovate water-saving technology and lower product prices. The research and development of more water-saving products can improve the market competitiveness of products with water efficiency labeling, consumers’ consumption experience, and sense of gain [60]. In addition, in promoting products with water efficiency labeling, enterprises should focus on the meaningful effects of consumers’ adoption behaviors on constructing a water-saving society and the sustainable development of resources and the environment. Active publicity can make consumers more intuitively feel the importance of their behavior and stimulate and enhance their moral cognition and social responsibility, which will help systematically improve their perception level.
A psychological study showed that a person’s behavior is primarily determined by their habits, which play a crucial role in adopting protective behaviors [60]. In this study, by calculating the state transition probability between consumers’ adoption behavior of products with water efficiency labeling, the state dependency of consumers’ adoption behavior of products with water efficiency labeling is quantified, and consumers’ consumption habits about products with water efficiency labeling are evaluated. The results show that consumers’ adoption behavior regarding products with water efficiency labeling depends on the last adoption behavior. As the state level increases, the dependency on adoption behavior becomes stronger. This dependency is mainly driven by existing consumption habits, which can inhibit the adoption of new products or specific services [61]. Consumers are less likely to choose alternatives when accustomed to using a particular product or technology [62]. Individuals often develop their reliance on inappropriate behavior as a long-standing habit and are reluctant to change [63]. Therefore, on the one hand, relevant government departments should vigorously strengthen the publicity and education of water-saving knowledge and improve consumers’ water-saving literacy. On the other hand, it is necessary to use water-saving legislation, product subsidies, and information intervention to guide consumers’ adoption behavior, cultivate water-saving habits, and encourage consumers to choose to adopt products with water efficiency labeling.
In addition, this study verified the applicability and accuracy of HMM. The results show that the training parameters are well fitted, and the HMM has high prediction accuracy. The prediction accuracy will also improve as the number of training samples increases. Compared to other machine learning algorithms, HMM will not appear overfitted due to the increase in the number of hidden states, nor will the prediction accuracy decrease with the increase in the number of input features [64]. This has been verified in other scholars’ studies, where HMM has shown better prediction performance [65,66,67]. However, the prediction results have specific errors since the training samples cannot cover all the observed states. This method has certain reference significance for the management decisions of the government and enterprises.
6. Conclusions
The conclusions of this study are as follows: ① Water-saving awareness has a significant positive impact on consumers’ adoption behavior of products with water efficiency labeling and will guide the continuous adoption behavior of consumers for products with water efficiency labeling. ② Consumers’ adoption behavior of products with water efficiency labeling has a dependency, and the degree of dependency varies with the state level of adoption behavior. ③ HMM applies to the prediction of consumers’ adoption behavior of products with water efficiency labeling, and has certain reliability and accuracy. The results are helpful for manufacturers to make management decisions in the development and design of water-saving products, as well as to make basic judgments on market potential, customer dependency, and risk prediction. In addition, this conclusion can also provide a reference for the government to formulate guiding policies or water-saving plans.
However, this study also has limitations that need improvement in future research. Firstly, external factors such as product prices, policies and regulations, and resource constraints influence consumers to adopt products with water efficiency labeling. However, we only consider the internal factors of consumers as research variables. Secondly, HMM has high requirements for the quality of survey data and involves consumers’ privacy. As a result, specific errors in the data we collected may occur. The number of training samples collected in this study is limited and can not cover adoption behavior in all possible states, which will lead to bias in the prediction effect of the model. Therefore, more influencing factors will be considered in future research, and more complete survey data and training samples will be collected to strengthen the model’s explanatory power.
Author Contributions
Conceptualization, Y.W. and C.W.; methodology, H.W. and C.W.; software, C.W.; validation, Y.W.; formal analysis, C.W.; investigation, Y.W. and C.W.; resources, Z.C.; data curation, C.W. and Z.C.; writing—original draft preparation, C.W.; writing—review and editing, Y.W., C.W. and Z.C.; visualization, H.W.; supervision, Y.W.; project administration, Y.W.; funding acquisition, H.W. and Z.C. All authors have read and agreed to the published version of the manuscript.
Funding
This research was funded by the Henan Province Key Research and Development Program (Soft Science) Project (No. 212400410038), the Henan Province Key Research and Development Program (Soft Science) Project (No. 232400411019), the Henan Province Key R&D and Promotion (Soft Science) Project (No. 2019BJJ048).
Data Availability Statement
The data presented in this study are available on request from the corresponding author. The data are not publicly available due to consumers’ privacy.
Conflicts of Interest
The authors declare no conflict of interest.
Appendix A
The Questionnaire on Consumers’ Adoption Behavior of Products with Water Efficiency Labeling
- Dear Sir/Madam:
Hello! This survey was conducted to understand consumers’ adoption behavior of products with water efficiency labeling. We adhere to academic research ethics, the survey results are for research purposes only, and we guarantee that all information will not be made public under any circumstances.
The truthfulness of your answers is crucial to the accuracy of this study, so please be truthful in your answers. This survey will take about 5 min of your time. Your support and cooperation are greatly appreciated.
- Your gender: [Single choice]
◯Male ◯Female
- 2.
- Your age: [Single choice]
◯16~35 ◯36~45 ◯46~59 ◯Above 60
- 3.
- Your education: [Single choice]
◯Junior high school and below ◯Senior high school ◯Undergraduate ◯Graduate
- 4.
- Your occupation: [Single choice]
◯Enterprise personnel ◯Officials ◯Utility personnel ◯Freelancers ◯Other
- 5.
- Average monthly income of your household: [Single choice]
◯Under CNY 4999 ◯CNY 5000~9999 ◯CNY 10,000~19,999 ◯CNY 20,000~49,999 ◯More than CNY 50,000
- 6.
- Please choose your actual situation: [Matrix scale questions]
| Not at All | Not Very Much | Not Sure | More Consistent | Fully Consistent | |
| I understand the information about the water efficiency labeling system | |||||
| I can quickly understand the meaning of the water efficiency labeling through the introduction | |||||
| Different levels of water efficiency labeling mean different levels of water efficiency for water-using products |
- 7.
- Please choose with your actual situation: [Matrix scale questions]
| Not at All | Not Very Much | Not Sure | More Consistent | Fully Consistent | |
| I think the credibility of the water efficiency labeling certification body is very high | |||||
| I think the certification process of the water efficiency labeling is fair and credible | |||||
| I believe that the water efficiency information on the water efficiency labeling is trustworthy and reliable |
- 8.
- Please choose your actual situation: [Matrix scale questions]
| Not at All | Not Very Much | Not Sure | More Consistent | Fully Consistent | |
| Buying products with water efficiency labeling can enjoy more policy benefits | |||||
| I think the water efficiency labeling can help me to get information on water-saving efficiency | |||||
| I think buying water-using products with low water consumption can help me reduce water costs |
- 9.
- Please choose your actual situation: [Matrix scale questions]
| Not at All | Not Very Much | Not Sure | More Consistent | Fully Consistent | |
| When I see others wasting water, I will stop them | |||||
| Saving water means protecting the ecological environment and the earth we live on | |||||
| I have a responsibility to save water, and I am even willing to sacrifice my interests to do so |
- 10.
- Please choose your actual situation: [Matrix scale questions]
| Not at All | Not Very Much | Not Sure | More Consistent | Fully Consistent | |
| When buying water-using products, I will check carefully whether the water efficiency labeling is put on the product | |||||
| In the process of purchasing water appliances, I will pay attention to the water efficiency labeling information attached to the product | |||||
| I try to buy water-using products with the water efficiency labeling | |||||
| When faced with two water-using products with the same function, I try to buy the one with less water consumption | |||||
| When I buy water-using products next time, I will buy water products with water efficiency labeling |
References
- Kang, T. Construction and empirical analysis of Citizens’ Water Literacy Evaluation Index System: A structural equation model. Water Resour. Manag. 2022, 36, 1393–1411. [Google Scholar] [CrossRef]
- Wang, Y.; Liang, J.; Fu, H. Research on the influence of consumer perception and environmental factors on their adoption behavior of water efficiency label. Ecol. Econ. 2022, 38, 173–178+197. [Google Scholar]
- Addo, I.B.; Thoms, M.C.; Parsons, M. The influence of water-conservation messages on reducing household water use. Appl. Water Sci. 2019, 9, 126. [Google Scholar] [CrossRef]
- Dihr, M.; Berthold, A.; Siegrist, M.; Sütterlin, B. Consumers’ knowledge gain through a cross-category environmental label. J. Clean. Prod. 2021, 319, 128688. [Google Scholar] [CrossRef]
- Rondoni, A.; Grasso, S. Consumers behavior towards carbon footprint labels on food: A review of the literature and discussion of industry implications. J. Clean. Prod. 2021, 301, 127031. [Google Scholar] [CrossRef]
- Symeonidou, S.; Vagiona, D. The role of the water footprint in the context of green marketing. Environ. Sci. Pollut. Res. 2018, 25, 26837–26849. [Google Scholar] [CrossRef] [PubMed]
- Yadav, G.; Mangla, S.K.; Luthra, S.; Rai, D.P. Developing a sustainable smart city framework for developing economies: An Indian context. Sustain. Cities Soc. 2019, 47, 101462. [Google Scholar] [CrossRef]
- do Paço, A.; Shiel, C.; Alves, H. A new model for testing green consumer behavior. J. Clean. Prod. 2019, 207, 998–1006. [Google Scholar] [CrossRef]
- Zhao, R.; Yang, M.; Liu, J.; Yang, L.; Bao, Z.; Ren, X. University students’ purchase intention and willingness to pay for carbon-labeled food products: A purchase decision-making experiment. Int. J. Environ. Res. Public Health 2020, 17, 7026. [Google Scholar] [CrossRef]
- Bhutto, M.Y.; Liu, X.; Soomro, Y.A.; Ertz, M.; Baeshen, Y. Adoption of energy-efficient home appliances: Extending the theory of planned behavior. Sustainability 2020, 13, 250. [Google Scholar] [CrossRef]
- Zhang, Y.; Xiao, C.; Zhou, G. Willingness to pay a price premium for energy-saving appliances: Role of perceived value and energy efficiency labeling. J. Clean. Prod. 2020, 242, 118555. [Google Scholar] [CrossRef]
- Li, G.; Li, W.; Jin, Z.; Wang, Z. Influence of environmental concern and knowledge on households’ willingness to purchase energy-efficient appliances: A case study in Shanxi, China. Sustainability 2019, 11, 1073. [Google Scholar] [CrossRef]
- Dieu-Hang, T.; Grafton, R.Q.; Martínez-Espiñeira, R.; Garcia-Valiñas, M. Household adoption of energy and water-efficient appliances: An analysis of attitudes, labelling and complementary green behaviors in selected OECD countries. J. Environ. Manag. 2017, 197, 140–150. [Google Scholar] [CrossRef] [PubMed]
- Gorton, M.; Tocco, B.; Yeh, C.H.; Hartmann, M. What determines consumers’ use of eco-labels? Taking a close look at label trust. Ecol. Econ. 2021, 189, 107173. [Google Scholar] [CrossRef]
- Kelly, D.A. Labelling and water conservation: A European perspective on a global challenge. Build. Serv. Eng. Res. Technol. 2015, 36, 643–657. [Google Scholar] [CrossRef]
- Fane, S.; Grossman, C.; Schlunke, A. Australia’s water efficiency labelling and standards scheme: Summary of an environmental and economic evaluation. Water Supply 2020, 20, 1–12. [Google Scholar] [CrossRef]
- Sarpong, K.A.; Amankwaa, G.; Frimpong, O.; Xu, W.; Cao, Y.; Ni, X.; Nkrumah, N.K. Consumers’ purchasing intentions for efficient water-saving products: The mediating effects of altruistic and egoistic values. J. Water Supply Res. Technol. 2021, 70, 226–238. [Google Scholar] [CrossRef]
- Dean, A.J.; Kneebone, S.; Tull, F.; Lauren, N.; Smith, L.D. ‘Stickiness’ of water-saving behaviors: What factors influence whether behaviors are maintained or given up? Resour. Conserv. Recycl. 2021, 169, 105531. [Google Scholar] [CrossRef]
- Schein, J.; Chan, P.; Chen, Y.; Dunham, C.; Fuchs, H.; Letschert, V.; McNeil, M.; Melody, M.; Price, S.; Stratton, H.; et al. Methodology for the national water savings models–indoor residential and commercial/institutional products, and outdoor residential products. Water Supply 2019, 19, 879–890. [Google Scholar] [CrossRef]
- Liang, J.; Zhang, S.; Wang, H.; Du, P.; Wang, Y. Adoption behavior of water efficiency labeling: Origin, research progress and theoretical framework–evidence from China. Water Policy 2022, 24, 66–82. [Google Scholar] [CrossRef]
- Wang, Y.; Liang, J.; Nirupa, J. Implementation status and promotion strategy of water efficiency labeling system in China. Water Resour. Dev. Res. 2021, 11, 80–84. [Google Scholar] [CrossRef]
- Wang, Z.; Wang, X.; Guo, D. Policy implications of the purchasing intentions towards energy-efficient appliances among China’s urban residents: Do subsidies work? Energy Policy 2017, 102, 430–439. [Google Scholar] [CrossRef]
- Shi, L.; Wang, L.; Li, H.; Zhao, Y.; Wang, J.; Zhu, Y.; He, G. Impact of residential water saving devices on urban water security: The case of Beijing, China. Environ. Sci. Water Res. Technol. 2022, 8, 326–342. [Google Scholar] [CrossRef]
- Camilleri, A.R.; Larrick, R.P.; Hossain, S.; Patino-Echeverri, D. Consumers underestimate the emissions associated with food but are aided by labels. Nat. Clim. Chang. 2019, 9, 53–58. [Google Scholar] [CrossRef]
- Zhang, J.; Yu, B.; Cai, J.; Wei, Y.M. Impacts of household income change on CO2 emissions: An empirical analysis of China. J. Clean. Prod. 2017, 157, 190–200. [Google Scholar] [CrossRef]
- Issock, P.B.I.; Mpinganjira, M.; Roberts-Lombard, M. Drivers of consumer attention to mandatory energy-efficiency labels affixed to home appliances: An emerging market perspective. J. Clean. Prod. 2018, 204, 672–684. [Google Scholar] [CrossRef]
- Waris, I.; Hameed, I. Promoting environmentally sustainable consumption behavior: An empirical evaluation of purchase intention of energy-efficient appliances. Energy Effic. 2020, 13, 1653–1664. [Google Scholar] [CrossRef]
- de Morais Watanabe, E.A.; Alfinito, S.; Curvelo, I.C.G.; Hamza, K.M. Perceived value, trust and purchase intention of organic food: A study with Brazilian consumers. Br. Food J. 2020, 122, 1070–1184. [Google Scholar] [CrossRef]
- Liu, P.; Li, M.; Dai, D.; Guo, L. The effects of social commerce environmental characteristics on customers’ purchase intentions: The chain mediating effect of customer-to-customer interaction and customer-perceived value. Electron. Commer. Res. Appl. 2021, 48, 101073. [Google Scholar] [CrossRef]
- Li, Q.; Long, R.; Chen, H. Empirical study of the willingness of consumers to purchase low-carbon products by considering carbon labels: A case study. J. Clean. Prod. 2017, 161, 1237–1250. [Google Scholar] [CrossRef]
- Zhao, R.; Geng, Y.; Liu, Y.; Tao, X.; Xue, B. Consumers’ perception, purchase intention, and willingness to pay for carbon-labeled products: A case study of Chengdu in China. J. Clean. Prod. 2018, 171, 1664–1671. [Google Scholar] [CrossRef]
- Joshi, N.; Malhotra, M.; Singh, J. Assessing adoption intention of electric vehicles in India: The mediating role of government policies. Eur. J. Transp. Infrastruct. Res. 2022, 22, 1–16. [Google Scholar] [CrossRef]
- Hoek, A.C.; Malekpour, S.; Raven, R.; Court, E.; Byrne, E. Towards environmentally sustainable food systems: Decision-making factors in sustainable food production and consumption. Sustain. Prod. Consump. 2021, 26, 610–626. [Google Scholar] [CrossRef]
- Baum, L.E.; Petrie, T. Statistical inference for probabilistic functions of finite state Markov chains. Ann. Math. Stat. 1966, 37, 1554–1563. Available online: http://www.jstor.org/stable/2238772 (accessed on 12 March 2023). [CrossRef]
- Bryan, J.D.; Levinson, S.E. Autoregressive hidden Markov model and the speech signal. Procedia Comput. Sci. 2015, 61, 328–333. [Google Scholar] [CrossRef]
- Chen, S.; Qiu, H.; Xiao, H.; He, W.; Mou, J.; Siponen, M. Consumption behavior of eco-friendly products and applications of ICT innovation. J. Clean. Prod. 2021, 287, 125436. [Google Scholar] [CrossRef]
- Xu, W.; Wang, J.; Fu, T.; Gong, H.; Sobhani, A. Aggressive driving behavior prediction considering driver’s intention based on multivariate-temporal feature data. Accid. Anal. Prev. 2022, 164, 106477. [Google Scholar] [CrossRef]
- Palaz, D.; Magimai-Doss, M.; Collobert, R. End-to-end acoustic modeling using convolutional neural networks for HMM-based automatic speech recognition. Speech Commun. 2019, 108, 15–32. [Google Scholar] [CrossRef]
- Kang, M.; Ahn, J.; Lee, K. Opinion mining using ensemble text hidden Markov models for text classification. Expert Syst. Appl. 2018, 94, 218–227. [Google Scholar] [CrossRef]
- Xin, G.; Hamzaoui, N.; Antoni, J. Semi-automated diagnosis of bearing faults based on a hidden Markov model of the vibration signals. Measurement 2018, 127, 141–166. [Google Scholar] [CrossRef]
- Zhang, M.; Jiang, X.; Fang, Z.; Zeng, Y.; Xu, K. High-order Hidden Markov Model for trend prediction in financial time series. Physica A 2019, 517, 1–12. [Google Scholar] [CrossRef]
- Yip, C.F.; Ng, W.L.; Yau, C.Y. A hidden Markov model for earthquake prediction. Stoch. Environ. Res. Risk Assess. 2018, 32, 1415–1434. [Google Scholar] [CrossRef]
- Guilpart, E.; Espanmanesh, V.; Tilmant, A.; Anctil, F. Combining split-sample testing and hidden Markov modelling to assess the robustness of hydrological models. Hydrol. Earth Syst. Sci. 2021, 25, 4611–4629. [Google Scholar] [CrossRef]
- Visser, M.; Schoormans, J.; Vogtländer, J. Consumer buying behaviour of sustainable vacuum cleaners-Consequences for design and marketing. J. Clean. Prod. 2018, 195, 664–673. [Google Scholar] [CrossRef]
- Wang, Z.; Sun, Q.; Wang, B.; Zhang, B. Purchasing intentions of Chinese consumers on energy-efficient appliances: Is the energy efficiency label effective? J. Clean. Prod. 2019, 238, 117896. [Google Scholar] [CrossRef]
- Nuttavuthisit, K.; Thøgersen, J. The importance of consumer trust for the emergence of a market for green products: The case of organic food. J. Bus. Ethics 2017, 140, 323–337. [Google Scholar] [CrossRef]
- Davis, F.D. Perceived usefulness, perceived ease of use, and user acceptance of information technology. MIS Q. 1989, 13, 319–340. [Google Scholar] [CrossRef]
- Mäntymäki, M.; Salo, J. Teenagers in social virtual worlds: Continuous use and purchasing behavior in Habbo Hotel. Comput. Hum. Behav. 2011, 27, 2088–2097. [Google Scholar] [CrossRef]
- Hou, C.; Fu, H.; Liu, X.; Wen, Y. The effect of recycled water information disclosure on public acceptance of recycled water—Evidence from residents of Xi’an, China. Sustain. Cities Soc. 2020, 61, 102351. [Google Scholar] [CrossRef]
- Saccenti, E.; Timmerman, M.E. Approaches to sample size determination for multivariate data: Applications to PCA and PLS-DA of omics data. J. Proteome Res. 2016, 15, 2379–2393. [Google Scholar] [CrossRef]
- Chen, Z.; Tian, K. Optimization of Evaluation Indicators for Driver’s Traffic Literacy: An Improved Principal Component Analysis Method. SAGE Open 2022, 12, 21582440221105262. [Google Scholar] [CrossRef]
- Tu, S.; Huang, X.; Zhang, Y.; An, M.; Liu, L.; Huang, Y. HMM-based User Behavior Prediction Method in Heterogeneous Cellular Networks. Int. J. Perform. Eng. 2018, 14, 2163. [Google Scholar] [CrossRef]
- Guagnano, G.A.; Stern, P.C.; Dietz, T. Influences on attitude-behavior relationships: A natural experiment with curbside recycling. Environ. Behav. 1995, 27, 699–718. [Google Scholar] [CrossRef]
- Millock, K.; Nauges, C. Household adoption of water-efficient equipment: The role of socio-economic factors, environmental attitudes and policy. Environ. Resour. Econ. 2010, 46, 539–565. [Google Scholar] [CrossRef]
- Beal, C.D.; Stewart, R.A.; Fielding, K. A novel mixed method smart metering approach to reconciling differences between perceived and actual residential end use water consumption. J. Clean. Prod. 2013, 60, 116–128. [Google Scholar] [CrossRef]
- Tian, K.; Chen, Z. What roles do smart sensors play in citizens’ water use? From the perspective of household water-saving. Water Supply 2022, 22, 3519–3525. [Google Scholar] [CrossRef]
- White, K.; Habib, R.; Hardisty, D.J. How to SHIFT consumer behaviors to be more sustainable: A literature review and guiding framework. J. Mark. 2019, 83, 22–49. [Google Scholar] [CrossRef]
- Safarzadeh, S.; Rasti-Barzoki, M. A game theoretic approach for pricing policies in a duopolistic supply chain considering energy productivity, industrial rebound effect, and government policies. Energy 2019, 167, 92–105. [Google Scholar] [CrossRef]
- Nesticò, A.; Maselli, G.; Ghisellini, P.; Ulgiati, S. A dual probabilistic discounting approach to assess economic and environmental impacts. Environ. Resour. Econ. 2023, 85, 239–265. [Google Scholar] [CrossRef]
- Schwarzer, R. Modeling health behavior change: How to predict and modify the adoption and maintenance of health behaviors. Appl. Psychol.-Int. Rev. 2008, 57, 1–29. [Google Scholar] [CrossRef]
- Mustafa, S.; Hao, T.; Jamil, K.; Qiao, Y.; Nawaz, M. Role of eco-friendly products in the revival of developing countries’ economies and achieving a sustainable green economy. Front. Environ. Sci. 2022, 10, 3389. [Google Scholar] [CrossRef]
- Yen, Y.S.; Wu, F.S. Predicting the adoption of mobile financial services: The impacts of perceived mobility and personal habit. Comput. Hum. Behav. 2016, 65, 31–42. [Google Scholar] [CrossRef]
- Verplanken, B.; Orbell, S. Attitudes, habits, and behavior change. Annu. Rev. Psychol. 2022, 73, 327–352. [Google Scholar] [CrossRef] [PubMed]
- David, R.; Söffker, D. A review on machine learning-based models for lane-changing behavior prediction and recognition. Front. Future Transp. 2023, 4, 950429. [Google Scholar] [CrossRef]
- Jin, H.; Duan, C.; Liu, Y.; Lu, P. Gauss mixture hidden Markov model to characterise and model discretionary lane-change behaviours for autonomous vehicles. IET Intell. Transp. Syst. 2020, 14, 401–411. [Google Scholar] [CrossRef]
- Chen, C.; Zhao, X.; Wang, J.; Li, D.; Guan, Y.; Hong, J. Dynamic graph convolutional network for assembly behavior recognition based on attention mechanism and multi-scale feature fusion. Sci. Rep. 2022, 12, 7394. [Google Scholar] [CrossRef]
- Wen, J.; Abe, T.; Suganuma, T. A customer behavior recognition method for flexibly adapting to target changes in retail stores. Sensors 2022, 22, 6740. [Google Scholar] [CrossRef]
Figure 1.
HMM schematic diagram of consumers’ adoption behavior of products with water efficiency labeling.
Figure 1.
HMM schematic diagram of consumers’ adoption behavior of products with water efficiency labeling.

Figure 2.
Schematic diagram of the calculation process.

Figure 3.
Probability statistics of consumers’ continuous adoption behavior of products with water efficiency labeling.
Figure 3.
Probability statistics of consumers’ continuous adoption behavior of products with water efficiency labeling.

Figure 4.
State transition of consumers’ adoption behavior of products with water efficiency labeling. Note: The solid red line indicates the transition of state level Beh0. The solid blue line indicates the transition of state level Beh1. The solid green line shows the transition of state level Beh2. The solid purple line shows transitions at state level Beh3. The solid brown line indicates the transition to state level Beh4.

Figure 5.
Statistics of prediction results of consumers’ adoption behavior of products with water efficiency labeling.
Figure 5.
Statistics of prediction results of consumers’ adoption behavior of products with water efficiency labeling.


Table 1.
The main factors affecting consumers’ adoption of products with water efficiency labeling.
| Research Variable | Measurement Index | Variable Explanation | References |
|---|---|---|---|
| Consumer Perception | Cognition Degree | Individuals’ understanding and acceptance of the water efficiency labeling information | [13,44] |
| Perceived Trust | Individuals’ beliefs or expectations about water efficiency labeling information | [45,46] | |
| Perceived Usefulness | Individuals’ value judgments about the benefits of adopting products with water efficiency labeling | [47,48] | |
| Water-saving Awareness | Water-saving Awareness | Individuals’ judgment of the significance or responsibility for water-saving behavior | [13,49] |
Table 2.
The information on the demographic characteristics of the sample.
| Item | Category | Number of Samples | Percentage |
|---|---|---|---|
| Gender | Male | 205 | 46.17% |
| Female | 239 | 53.83% | |
| Age | 16~35 | 301 | 67.79% |
| 36~45 | 98 | 22.07% | |
| 46~59 | 42 | 9.46% | |
| Above 60 | 3 | 0.68% | |
| Education | Junior high school and below | 12 | 2.70% |
| Senior high school | 74 | 16.67% | |
| Undergraduate | 334 | 75.23% | |
| Graduate | 24 | 5.41% | |
| Occupation | Enterprise personnel | 224 | 50.45% |
| Officials | 19 | 4.28% | |
| Utility personnel | 75 | 16.89% | |
| Freelancers | 54 | 12.16% | |
| Other | 72 | 16.21% | |
| Average monthly income of your household | Under CNY 4999 | 82 | 18.47% |
| CNY 5000~9999 | 155 | 34.91% | |
| CNY 10,000~19,999 | 143 | 32.21% | |
| CNY 20,000~49,999 | 56 | 12.61% | |
| More than CNY 50,000 | 8 | 1.80% |
Table 3.
Scale reliability test results.
| Measurement Index | Item | CITC | Cronbach’s α after Deleting This Item | Cronbach’s α |
|---|---|---|---|---|
| Consumer Perception | CD1 | 0.425 | 0.763 | 0.779 |
| CD2 | 0.422 | 0.768 | ||
| CD3 | 0.473 | 0.758 | ||
| PT1 | 0.540 | 0.747 | ||
| PT2 | 0.533 | 0.749 | ||
| PT3 | 0.518 | 0.750 | ||
| PU1 | 0.471 | 0.757 | ||
| PU2 | 0.481 | 0.756 | ||
| PU3 | 0.348 | 0.775 | ||
| Water-saving Awareness | WSA1 | 0.662 | 0.661 | 0.782 |
| WSA2 | 0.560 | 0.770 | ||
| WSA3 | 0.641 | 0.681 | ||
| Adoption Behavior of Products with Water Efficiency Labeling | AB1 | 0.541 | 0.702 | 0.754 |
| AB2 | 0.596 | 0.683 | ||
| AB3 | 0.567 | 0.692 | ||
| AB4 | 0.397 | 0.750 | ||
| AB5 | 0.504 | 0.716 |
Table 4.
Scale validity test results.
| KMO and Bartlett Sphericity Test | ||
|---|---|---|
| KMO Sampling Suitability Quantity | 0.897 | |
| Bartlett Sphericity Test | Approximate Chi-square | 2328.514 |
| Degrees of Freedom | 136 | |
| Significant | 0.000 | |
Table 5.
State levels and interpretations of consumer perception, water-saving awareness, and adoption behavior of products with water efficiency labeling.
Table 5.
State levels and interpretations of consumer perception, water-saving awareness, and adoption behavior of products with water efficiency labeling.
| States Category | State Levels | Explain |
|---|---|---|
| Consumer perception | Per0 | Do not know the relevant information on the water efficiency labeling |
| Per1 | Know but do not trust the information on the water efficiency labeling | |
| Per2 | Know and trust the information on the water efficiency labeling, but do not think it is useful | |
| Per3 | The information on water efficiency labeling can help me when purchasing water-saving products | |
| Water-saving awareness | Awa0 | Low |
| Awa1 | Moderate | |
| Awa2 | High | |
| Adoption behavior of products with water efficiency labeling | Beh0 | Ignore whether the purchased products are marked with water efficiency labeling |
| Beh1 | Pay attention to the water efficiency labeling when purchasing products | |
| Beh2 | Use water efficiency ratings as the basis for decision-making when purchasing products | |
| Beh3 | Willing to pay more for products with water efficiency labeling | |
| Beh4 | Will still buy products with water efficiency labeling next time |
Table 6.
Calculation results of state probability of consumers’ adoption behavior of products with water efficiency labeling.
Table 6.
Calculation results of state probability of consumers’ adoption behavior of products with water efficiency labeling.
| Beh0 | Beh1 | Beh2 | Beh3 | Beh4 | |
|---|---|---|---|---|---|
| Per0&Awa0 | 0.080 | 0.066 | 0.015 | 0.017 | 0.017 |
| Per1&Awa0 | 0.072 | 0.062 | 0.025 | 0.032 | 0.036 |
| Per2&Awa0 | 0.065 | 0.058 | 0.037 | 0.059 | 0.058 |
| Per3&Awa0 | 0.061 | 0.072 | 0.055 | 0.078 | 0.081 |
| Per0&Awa1 | 0.071 | 0.058 | 0.023 | 0.024 | 0.033 |
| Per1&Awa1 | 0.064 | 0.051 | 0.037 | 0.039 | 0.057 |
| Per2&Awa1 | 0.055 | 0.045 | 0.053 | 0.052 | 0.083 |
| Per3&Awa1 | 0.042 | 0.066 | 0.073 | 0.088 | 0.109 |
| Per0&Awa2 | 0.051 | 0.048 | 0.025 | 0.033 | 0.048 |
| Per1&Awa2 | 0.038 | 0.032 | 0.044 | 0.058 | 0.079 |
| Per2&Awa2 | 0.031 | 0.016 | 0.072 | 0.086 | 0.111 |
| Per3&Awa2 | 0.025 | 0.011 | 0.108 | 0.123 | 0.150 |
Disclaimer/Publisher’s Note: The statements, opinions and data contained in all publications are solely those of the individual author(s) and contributor(s) and not of MDPI and/or the editor(s). MDPI and/or the editor(s) disclaim responsibility for any injury to people or property resulting from any ideas, methods, instructions or products referred to in the content. |
© 2023 by the authors. Licensee MDPI, Basel, Switzerland. This article is an open access article distributed under the terms and conditions of the Creative Commons Attribution (CC BY) license (https://creativecommons.org/licenses/by/4.0/).
Share and Cite
MDPI and ACS Style
Wang, Y.; Wang, C.; Wang, H.; Chen, Z. Prediction of Consumers’ Adoption Behavior of Products with Water Efficiency Labeling Based on Hidden Markov Model. Water 2024, 16, 44. https://doi.org/10.3390/w16010044
AMA Style
Wang Y, Wang C, Wang H, Chen Z. Prediction of Consumers’ Adoption Behavior of Products with Water Efficiency Labeling Based on Hidden Markov Model. Water. 2024; 16(1):44. https://doi.org/10.3390/w16010044
Chicago/Turabian StyleWang, Yanrong, Cong Wang, Han Wang, and Zhuo Chen. 2024. "Prediction of Consumers’ Adoption Behavior of Products with Water Efficiency Labeling Based on Hidden Markov Model" Water 16, no. 1: 44. https://doi.org/10.3390/w16010044
Note that from the first issue of 2016, this journal uses article numbers instead of page numbers. See further details here.