

Study on the Spatiotemporal Variation in and Driving Mechanism of Water Quality in Baiyangdian Lake
Hebei and China Geological Survey Key Laboratory of Groundwater Remediation, Institute of Hydrogeology and Environmental Geology, Chinese Academy of Geological Sciences, Shijiazhuang 050061, China
*
Author to whom correspondence should be addressed.
Water 2024, 16(1), 166; https://doi.org/10.3390/w16010166
Submission received: 28 November 2023
/
Revised: 23 December 2023
/
Accepted: 26 December 2023
/
Published: 31 December 2023
(This article belongs to the Special Issue Solute Transport Model and Remediation Technology for Groundwater Contamination)
Abstract
:Analyzing 165 data from five national control sites in Baiyangdian Lake, this study unveils its spatiotemporal pattern of water quality. Utilizing machine learning and multivariate statistical techniques, this study elucidates the effects of rainfall and human activities on the lake’s water quality. The results show that the main pollutants in Baiyangdian Lake are TN, TP, and IMN. Spatially, human activities are the main drivers of water quality, with the poorest quality observed in the surrounding village area. The temporal dynamics of water quality parameters exhibit three distinct patterns: Firstly, parameters predominantly influenced by point source pollution, like TN and NH4+-N, show lower concentrations during flood periods. Secondly, parameters affected by non-point source pollution, such as TP, show higher concentrations during flood periods. Thirdly, irregular variations were observed in pH, DO, and IMN. The evaluation of Baiyangdian Lake’s water quality based on the grey relationship analysis method indicates that its water quality is good, falling within Classes I and II. Time series analysis found that the dilution effect of rainfall and the scouring action of runoff dominate the temporal variation in water quality in Baiyangdian Lake. The major pollution sources were identified as domestic sewage, followed by agricultural non-point source pollution and the release of internal pollutants. Additionally, aquaculture emerged as a significant contributor to the Lake’s pollution. This research provides a scientific basis for controlling the continuous deterioration of Baiyangdian Lake’s water quality and restoring its ecological function.
1. Introduction
Lakes not only provide a variety of services for the development of human society but also play a crucial role in maintaining the ecological health of a region [1]. However, in recent years, the rapid development of socioeconomic factors has significantly intensified the impact of human activities on lake water quality, consequently leading to the progressive degradation of this vital resource [2]. Therefore, to prevent further deterioration of lake water quality, it is imperative to implement periodic water quality monitoring, assessment, and precise identification of pollution sources [3]. Subsequently, these findings should form the basis for the formulation of targeted prevention and control strategies. Previous investigations have identified factors that influence lake water quality, including point source pollution from industrial effluents and domestic sewage [4]. Additionally, non-point-source pollution stemming from activities like poultry farming and agriculture, particularly cultivation [5], along with internal pollution originating from sediment deposition in lake beds [6] have been recognized as contributing to the overall degradation of lake water quality.
Baiyangdian Lake, the largest in the North China Plain region, represents a critical lake-type wetland ecosystem. It is located at the heart of the Xiong’an New Area; it holds immense value for flood storage, navigation, fisheries, and climate regulation, thereby providing essential ecological support for the region’s development. Although the lake has historically played these important roles, recent years have seen an alarming rise in water pollution due to the rapid growth of industry and agriculture, coupled with increased water resource demand within the watershed [7]. Consequently, water pollution has emerged as a pressing challenge in the development of the Xiong’an New Area [8]. Scholars have conducted extensive research on issues related to water environmental quality [9], biological community diversity [10], wetland degradation resulting from insufficient inflow water sources, and heavy metal pollution within the Baiyangdian Lake watershed [11]. However, a deeper understanding of the scientific mechanisms behind Baiyangdian Lake’s water pollution is still needed.
This study focuses on the Baiyangdian Basin, investigating the spatiotemporal variations in key water quality factors at five national control sites. By conducting a comprehensive assessment of Baiyangdian Lake’s water quality, this research aims to reveal the mechanisms by which rainfall influences water quality in the area. Furthermore, it seeks to identify the primary pollution sources and underlying drivers of water quality deterioration in Baiyangdian lake, ultimately providing a scientific basis for effective water quality management and restoration efforts in the Baiyangdian Basin.
2. Study Area
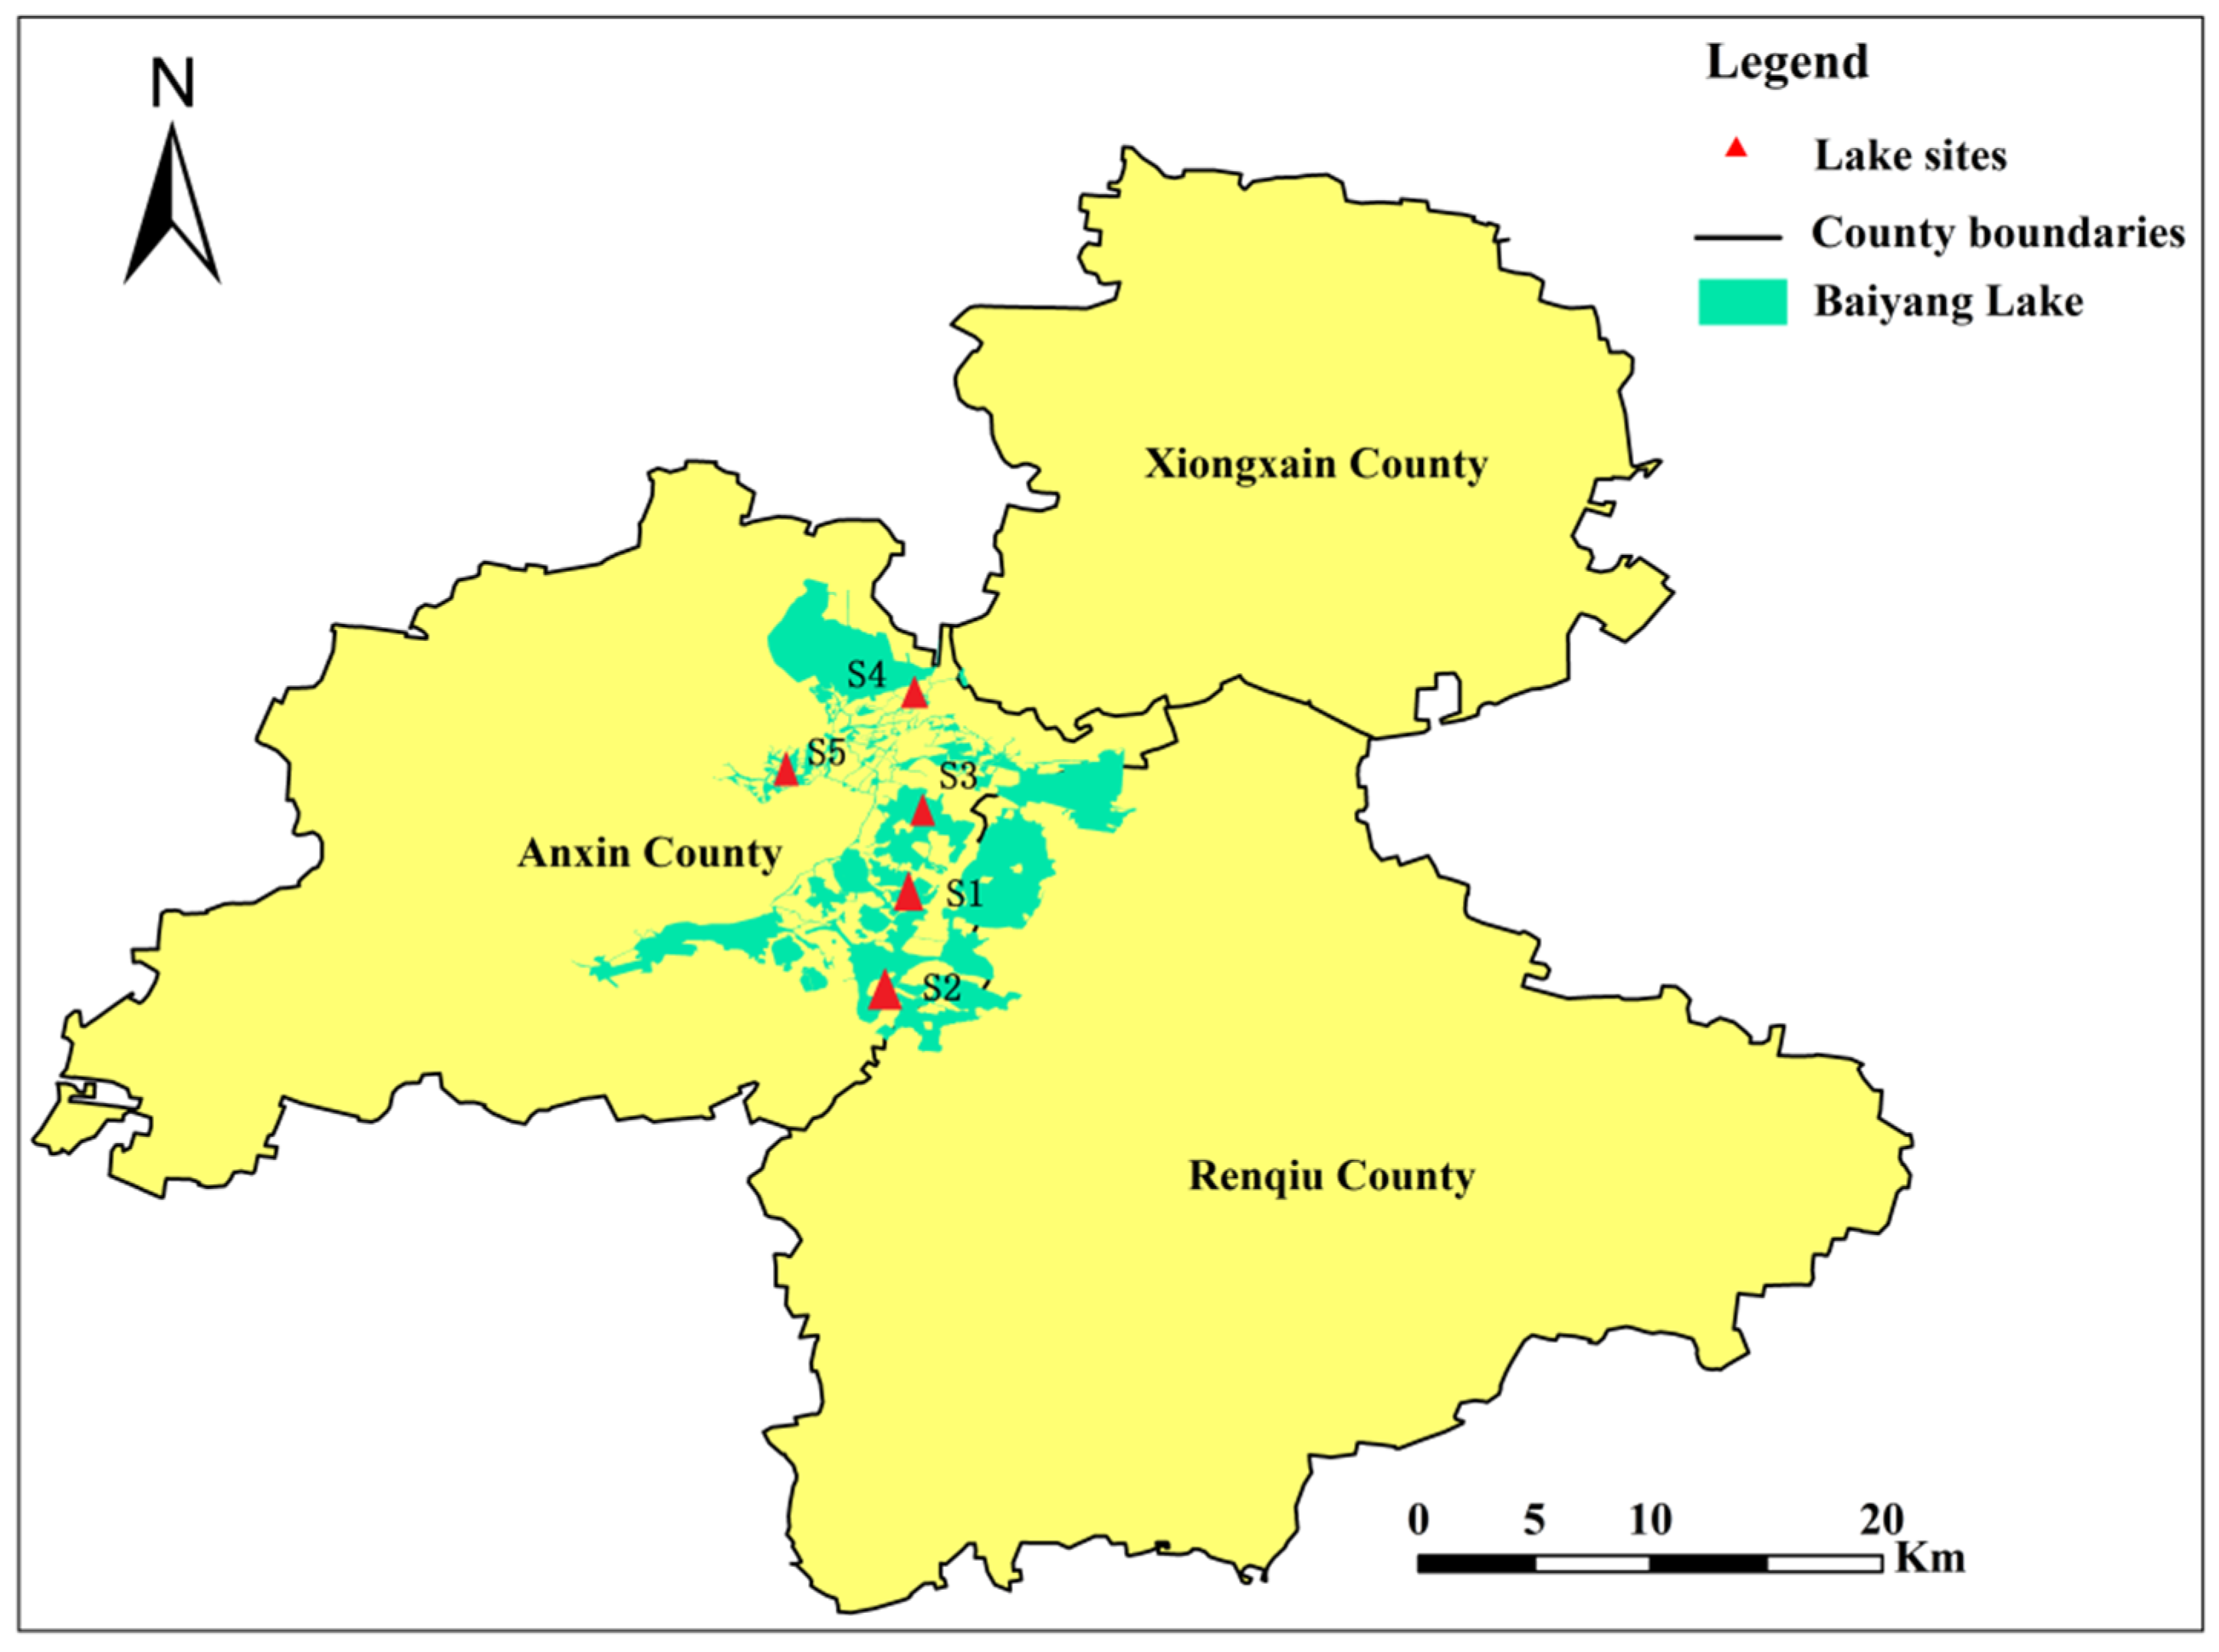
Baiyangdian Lake (115°38′~116°07′ E, 38°43′~39°02′ N) is predominantly situated within Anxin County, Baoding City, Hebei Province (Figure 1). This lake is an integral part of the Daqing River tributary system within the Haihe River Basin. Known as the “Pearl of North China” in the North China Plain, Baiyangdian Lake is distinguished by its substantial size and ecological importance, covering a watershed area of 366 km2 and comprising 143 lakes. Baiyangdian Lake, with an average depth of 2.3 m, stands as the largest wetland ecosystem in the North China Plain, as referenced in [12].
The basin’s topography exhibits a diverse landscape, including mountains, plains, hills, and depressions. The terrain transitions from mountainous regions in the west to plains and depressions towards the east. Climatically, Baiyangdian Lake experiences a temperate, semi-humid continental monsoon climate, marked by four distinct seasons. While the spring is typically dry with less rainfall, the majority of precipitation occurs in July, August, and September. Consequently, the annual mean temperature is approximately 12.2 °C and the annual mean precipitation reaches 529.7 mm.
Due to the combined impact of human production activities and insufficient inflow, the biodiversity within Baiyangdian Lake’s watershed has experienced a notable decline, consequently leading to the degradation of wetland functioning. Consequently, the water quality of Baiyangdian Lake has become an increasing concern [13]. To address this issue, this study selected five national control sections within Baiyangdian Lake—Quantou (S1), Caiputai (S2), Guangdian Zhangzhuang (S3), Shaochedian (S4), and Nanliuzhuang (S5)—as monitoring sites. Table 1 provides a summary of the locations and surrounding conditions of these five monitoring sections.
3. Research Methods
3.1. Source of Data
This study collected 165 water quality routine monitoring data from 5 national control sections in Baiyangdian Lake (Figure 1). Sampling was conducted daily at 12:00 (GMT), spanning from 20 May 2022 to 22 November 2022. The sampling periods were categorized into three phases based on hydrological conditions: the base-flow period from 20 May to 10 June (with 22 samples), the high-flow period from 11 June to September 30 (with 94 samples), and the low-flow period from 1 October to 22 November (with 49 samples). The primary monitoring parameters included pH, dissolved oxygen (DO), permanganate index (IMN), ammonia nitrogen (NH4+-N), total nitrogen (TN), and total phosphorus (TP), comprising a total of six indicators. The method employed for measuring water quality parameters involves online and real-time monitoring, utilizing a multi-parameter water quality detector.
3.2. Data Analysis
3.2.1. The Grey Relational Analysis Method for Water Quality Assessment
Grey Relational Analysis (GRA) can be used to improve our understanding of the diverse processes and complex phenomena involved in environmental studies and can complement data uncertainty that arises from inexact data, small samples, and incomplete information [14,15]. Utilizing the data acquired in this study, an assessment of the water quality in Baiyangdian Lake was conducted, employing the GRA. The fundamental principle of GRA involves selecting six representative water quality parameters (including pH, dissolved oxygen (DO), ion mean concentration (IMN), ammonium nitrogen (NH4+-N), total nitrogen (TN), and total phosphorus (TP)) as measured values for the reference sequence. These parameters serve as the benchmark sequence for water quality evaluation. Multiple relational degrees are calculated in comparison to the benchmark sequence, and the reference sequence corresponding to the maximum relational degree with the benchmark sequence determines the classification of Baiyangdian Lake water quality.
3.2.2. The Computational Steps of the Grey Relational Analysis Method Are as Follows
(1) Determine the sample to be evaluated (reference sequence) and evaluation criteria (comparison sequence).
Let Y0= {y0(k)|k = 1, 2, …, n} represent the measured values of various evaluation indicators for the sample to be assessed, where the subscript 0 denotes the sample to be evaluated and k denotes the evaluation factor, the same as below.
Let Yi = {y i(k)|k= 1, 2, …, n}(I = 1,2, …, m) represent the standard values of various evaluation indicators in the water quality classification standards, where the subscript i indicates the water environmental quality level, the same as below.
(2) Dimensionless processing of the data.
In water quality assessment, the units and magnitudes of various indicators differ, and some indicators have significantly different absolute values. Directly using the original data for calculations may emphasize indicators with larger absolute values and suppress those with smaller absolute values. Therefore, it is necessary to first perform dimensionless processing on the raw data, and the calculation formula is as follows:
In the equation, x0(k) represents the dimensionless value of the k-th evaluation indicator for the sample under consideration; xi(k) denotes the dimensionless value of the k-th evaluation indicator at the i-th level of the evaluation criteria; and y(k) represents the standard value for a specific level of the k-th pollutant factor.
(3) Calculation of absolute deviation Δi(k)
Given that water quality assessment standards are not singular values but rather intervals, some researchers have refined classical correlation analysis methods. They proposed a correlation coefficient formula based on the distance from a point to an interval. The absolute deviation is defined as follows:
In the equation, ai(k) and bi(k) represent the upper and lower limits of the ith level of indicator k, i = 1, 2, …, m.
(4) Compute the grey correlation coefficient ξi (k) of the reference sequence and the comparison sequence
where ρ is the distinguishing coefficient, ρ ∈ [0, 1]. The value represents different distinguishing abilities, where higher values indicate stronger resolution capability. However, it does not impact the overall trend sequence, and the value has no effect on the overall order trend. During the water quality assessment, we need only to compute the order of the correlation coefficient. Generally, ρ is taken as 0.5.
(5) Find the correlation of the comparison series to the reference series ri
where i = 1, 2, …, m, and Wi(k) is the weight of the kth indicator at the ith level; generally, Wi(k) is treated as equal weight.
(6) Determination and ranking of water quality categories for sampled waters
Following the calculation of the correlation coefficient γi, a comparison of the magnitudes of each correlation coefficient is conducted. The water quality category for Baiyangdian Lake is determined according to the principle of maximum correlation.
Data processing in this study was carried out using Excel, while image creation utilized Origin2018, R 4.3.2, and ArcGIS 10.8 software.
4. Results and Analysis
4.1. Characteristics of Baiyangdian Lake Water Quality
Table 2 presents the concentration ranges of pH, DO, IMN, NH4+-N, TN, and TP in 165 data points from five nationally monitored sites of Baiyangdian Lake. The water quality grades corresponding to each parameter are categorized according to the “Surface Water Environmental Quality Standards (GB3838-2002)” [16]. The pH values across the five nationally monitored sites range from 7.23 to 9.21, indicating weak alkaline water. Only two samples from the S1 site and four samples from the S4 site exceed the specified range of surface water quality standards (6–9). DO is a crucial indicator reflecting the redox environment of water. DO concentrations range from 0.120 to 15.1 mg·L−1, with high exceedance rates observed at the S5 (76.4%) and S3 (46.1%) sites. The concentration range of IMN is 0.420 to 13.5 mg·L−1, with elevated exceedance rates at the S1, S2, and S3 sites, reaching 55.2%, 63.6%, and 33.9%, respectively. NH4+-N concentrations range from 0.025 to 0.220, and all samples from the five sites are within the standard limits. TP concentrations vary from 0.005 to 0.1857 mg·L−1, with the highest exceedance rate observed at the S5 site (83.0%). TN concentrations range from 0.005 to 0.1857 mg·L−1, with relatively high exceedance rates at the S4, S5, and S2 sites, reaching 73.3%, 52.1%, and 40.6%, respectively.
4.2. Spatial Variation in Water Quality in Baiyangdian Lake
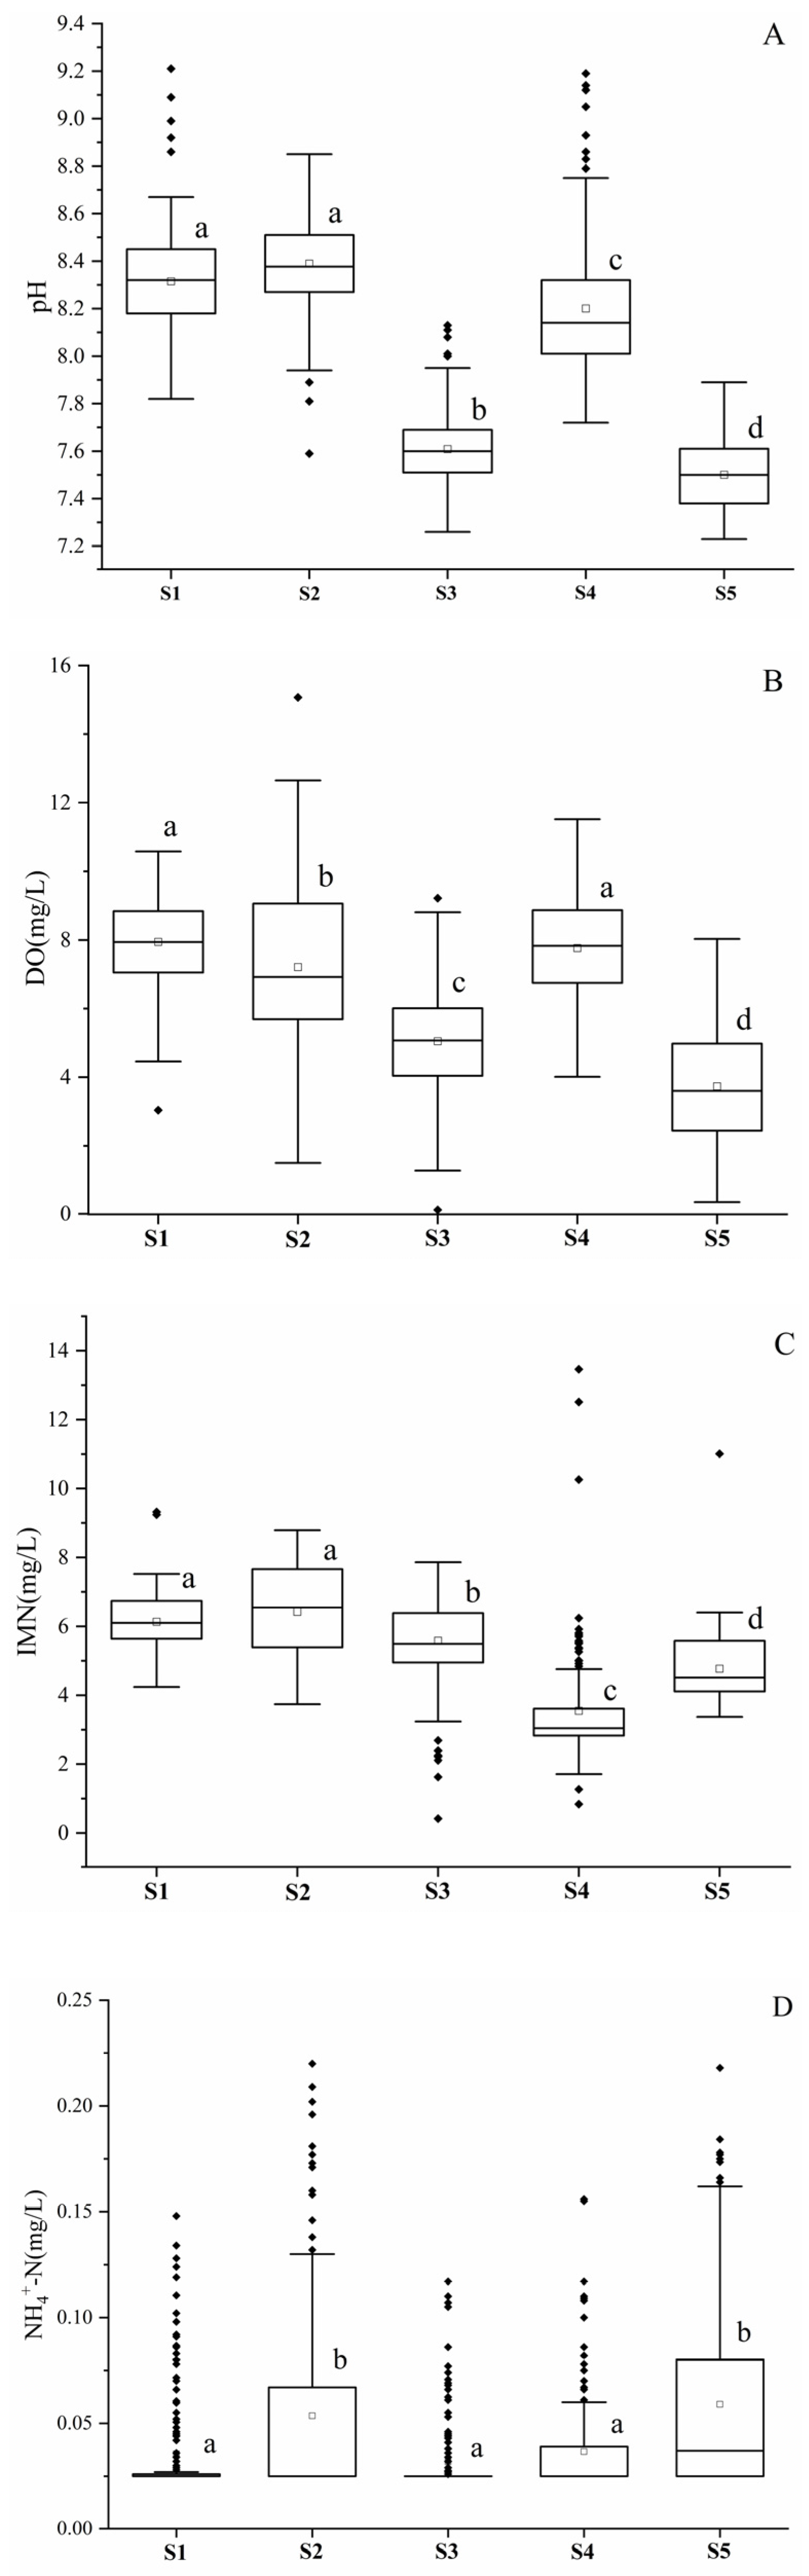
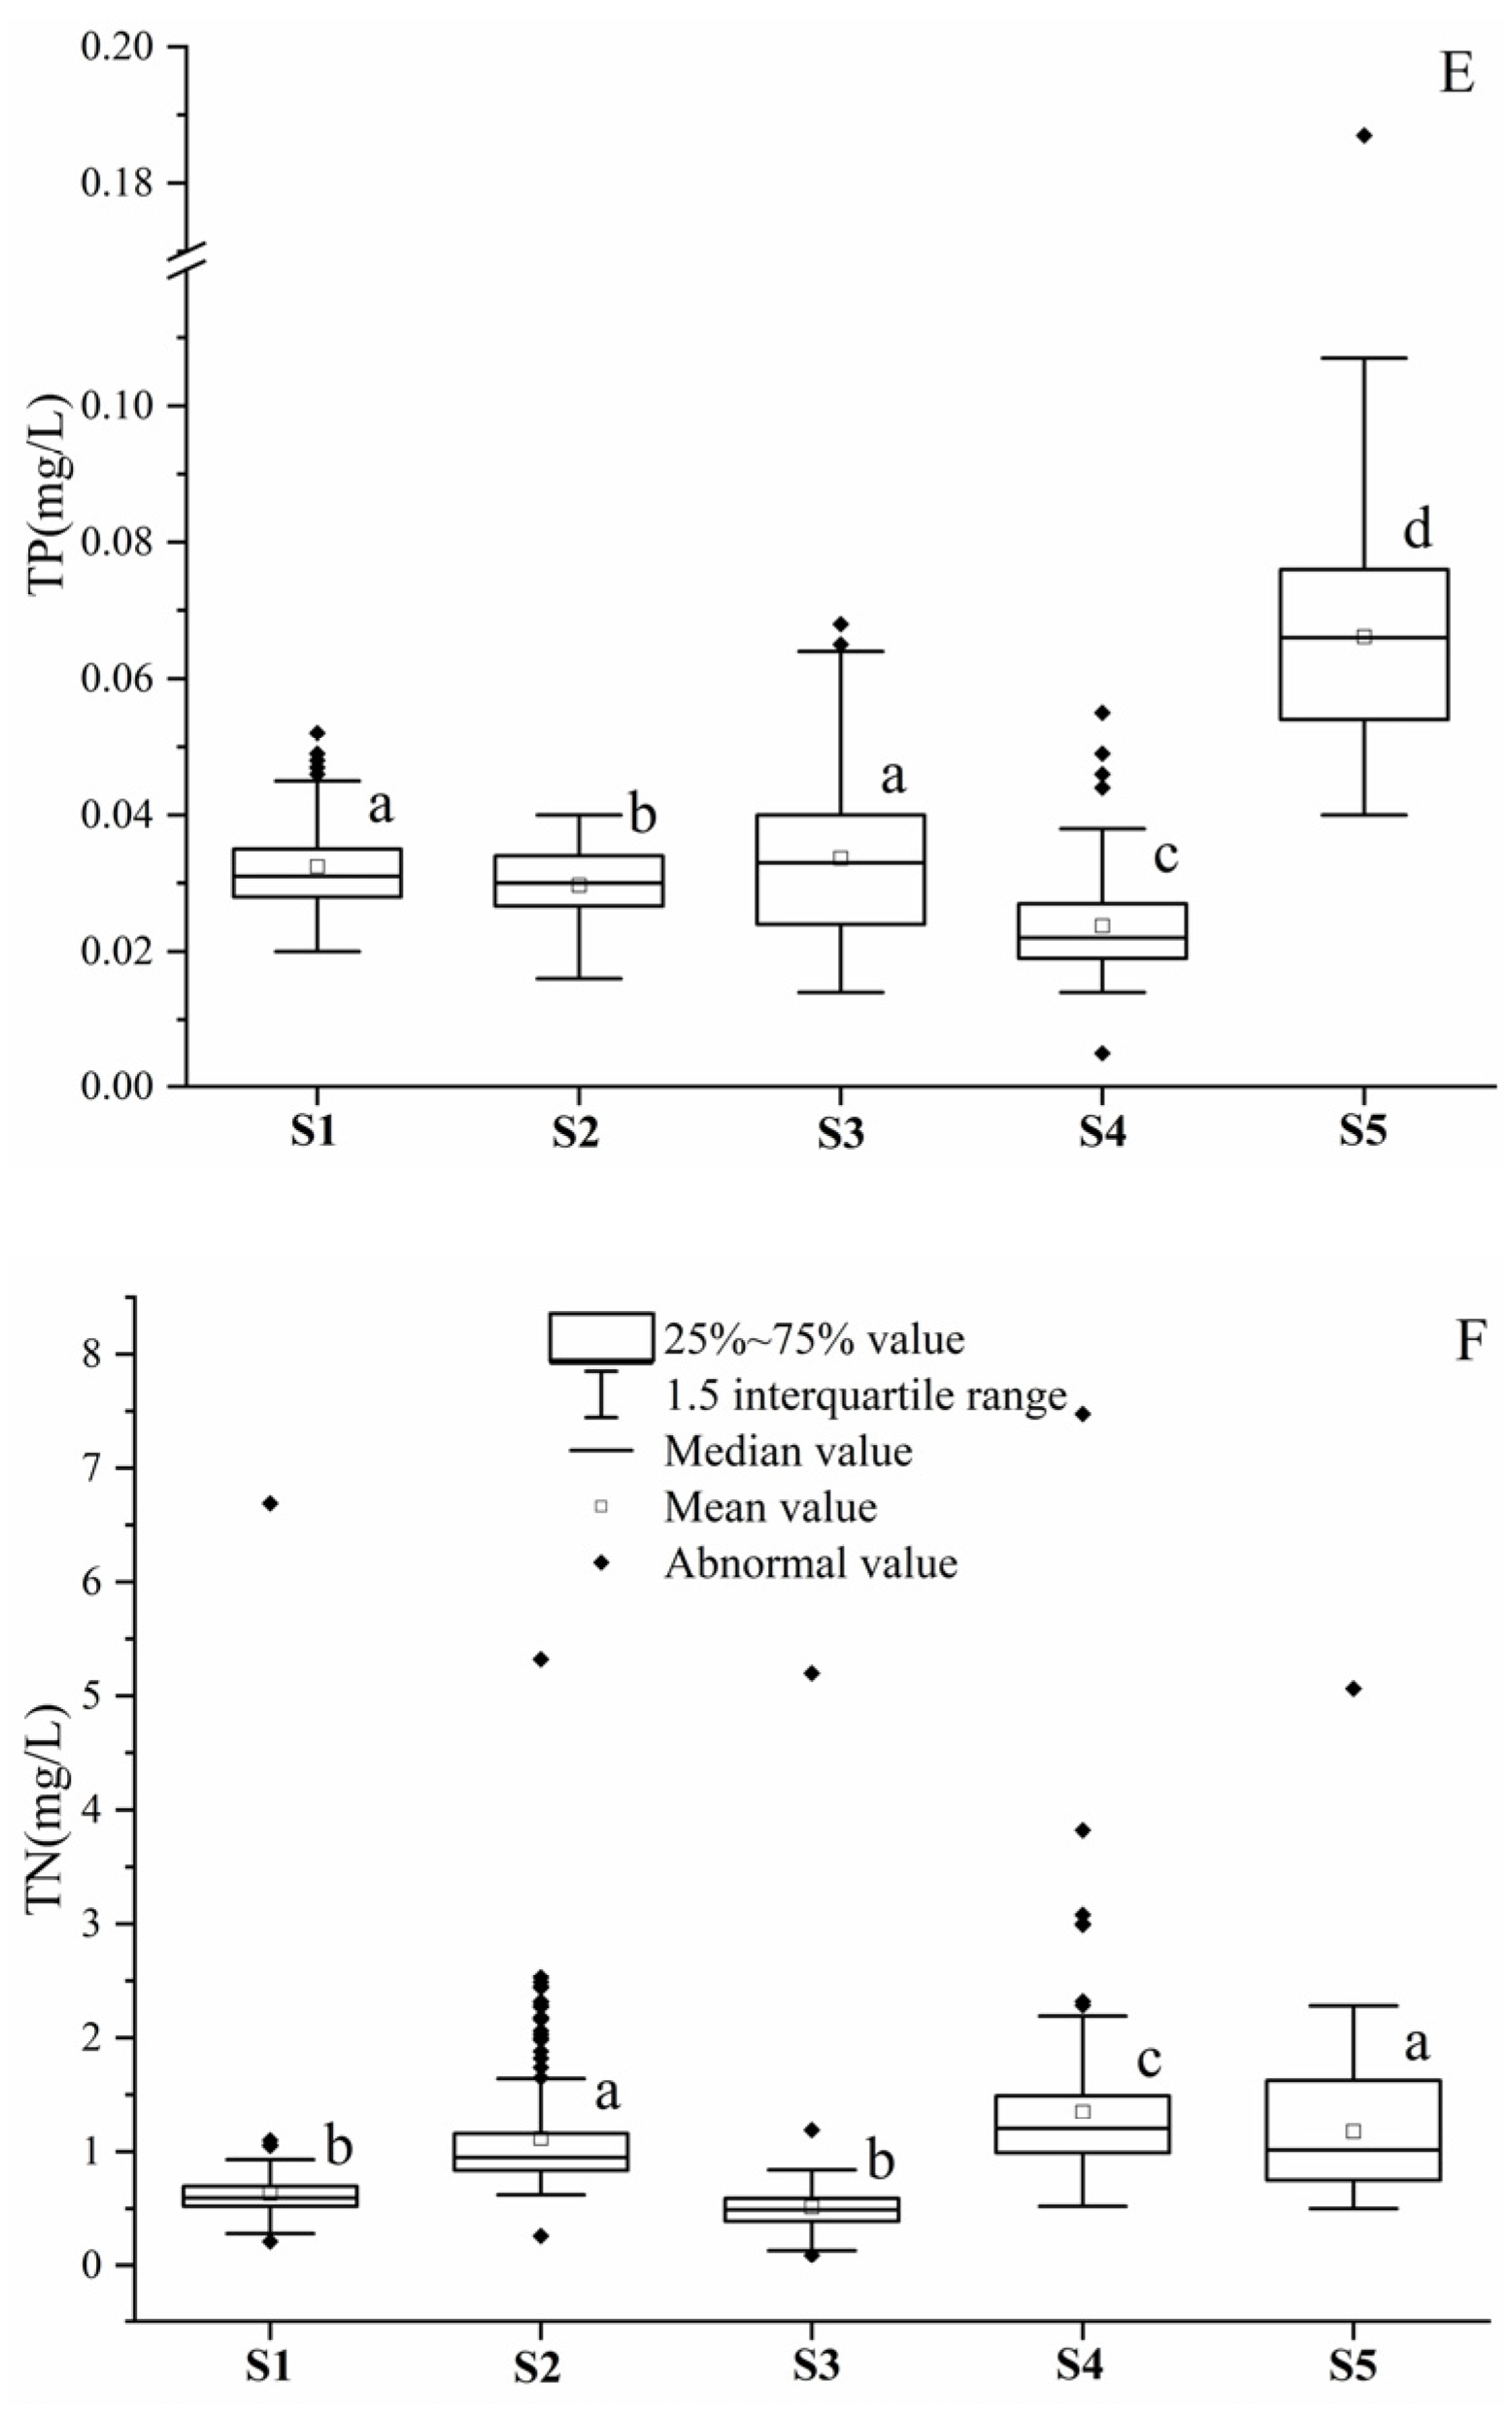
Figure 2 illustrates the spatial variations of six water quality indicators across five sites in Baiyangdian Lake. As depicted in Figure 2, all six indicators show significant spatial variations (p < 0.05). Specifically, there are considerable spatial differences in pH mean values, with the values at the S1, (8.32), S2 (8.39), and S4 (8.20) sites being significantly higher than those at the S3 (7.61) and S5 (7.89) sites (Figure 2A). The spatial variations in mean DO concentration are similar to those of pH, with the S1 (7.94 mg·L−1), S2 (7.21 mg·L−1), and S4 (7.76 mg·L−1) sites exhibiting significantly higher values than the S3 (5.05 mg·L−1) and S5 (3.73 mg·L−1) sites (Figure 2B). Notably, the mean concentration of DO at the S5 site is lower than the Surface Water Quality Class III standard in China (5.0 mg·L−1) [16], indicating the impact of significant human activities. The spatial variation of IMN demonstrates a noticeable decrease in mean concentration at the S4 site (3.55 mg·L−1) compared with the S1 (6.13 mg·L−1), S2 (6.42 mg·L−1), S3 (5.59 mg·L−1), and S5 (4.77 mg·L−1) sites (Figure 2C). Moreover, the mean values of IMN at the S1 and S2 sites exceed the Surface Water Quality Class III standard in China (6.0 mg·L−1) [16], suggesting organic pollution impact at these sites. The average NH4+-N concentration was significantly higher at the S2 (0.052 mg·L−1) and S5 (0.059 mg·L−1) sites than that of the S1 (0.036 mg·L−1), S3 (0.032 mg·L−1), and S4 (0.037 mg·L−1) sites. However, the concentrations at all sites meet the Surface Water Quality Class III standard (1.0 mg·L−1) (Figure 2D). The spatial variation of TP shows a significantly higher value at the S5 site (0.066 mg·L−1) than those at the S1 (0.032 mg·L−1), S2 (0.030 mg·L−1), S3 (0.034 mg·L−1), and S4 (0.024 mg·L−1) sites (Figure 2E). The average concentration of TP at the S5 site exceeded the Surface Water Quality Class III standard in China (0.05 mg·L−1) [16]. Additionally, the spatial variation of TN concentration was significantly higher at the S4 (1.31 mg L−1), S5 (1.16 mg·L−1), and S2 (1.09 mg·L−1) sites compared with the S1 (0.597 mg·L−1) and S3 (0.485 mg·L−1) sites (Figure 2F). Among these, the mean concentrations of TN at the S4, S2, and S5 sites exceeded the Surface Water Quality Class III standard in China (1.0 mg·L−1) [16], indicating a significant impact from human activities such as domestic wastewater and fertilizer use.
Through comprehensive analysis, it is evident that the surface water in Baiyangdian Lake exhibits elevated concentrations of TN, IMN, DO, and TP. Among the five sites, the S5 site shows higher rates of exceeded standard for DO, TN, and TP. This is possibly attributed to the main tributary source from the Fu River, which introduces pollutants into Baiyangdian Lake. The S5 site is approximately 4 km from the Fu River, it serves as a conduit for wastewater from the urban city Baoding, receiving domestic and industrial effluents as well as non-point-source pollutants from agricultural activities along its course. Consequently, pollutants from the Fu River are the primary contributors to the elevated concentrations of TP and TN at the S5 site. They are also responsible for the decline in DO levels. Meanwhile, the S4 and S2 sites exhibit significantly higher concentrations of TN, primarily due to sediment dredging in Baiyangdian Lake. The dredging leads to the release of internal nitrogen, which, in conjunction with agricultural non-point-source pollution within the watershed, contributes to higher TN concentrations. Furthermore, the site at S3 experiences elevated concentrations of IMN and DO, likely stemming from the presence of numerous villages in the vicinity that discharge untreated domestic wastewater directly into the lake, exerting a substantial impact on water quality. Additionally, the high water temperatures during summer, coupled with increased human activities during the peak tourist season, contribute to rapid DO depletion in the water body at the S3 site.
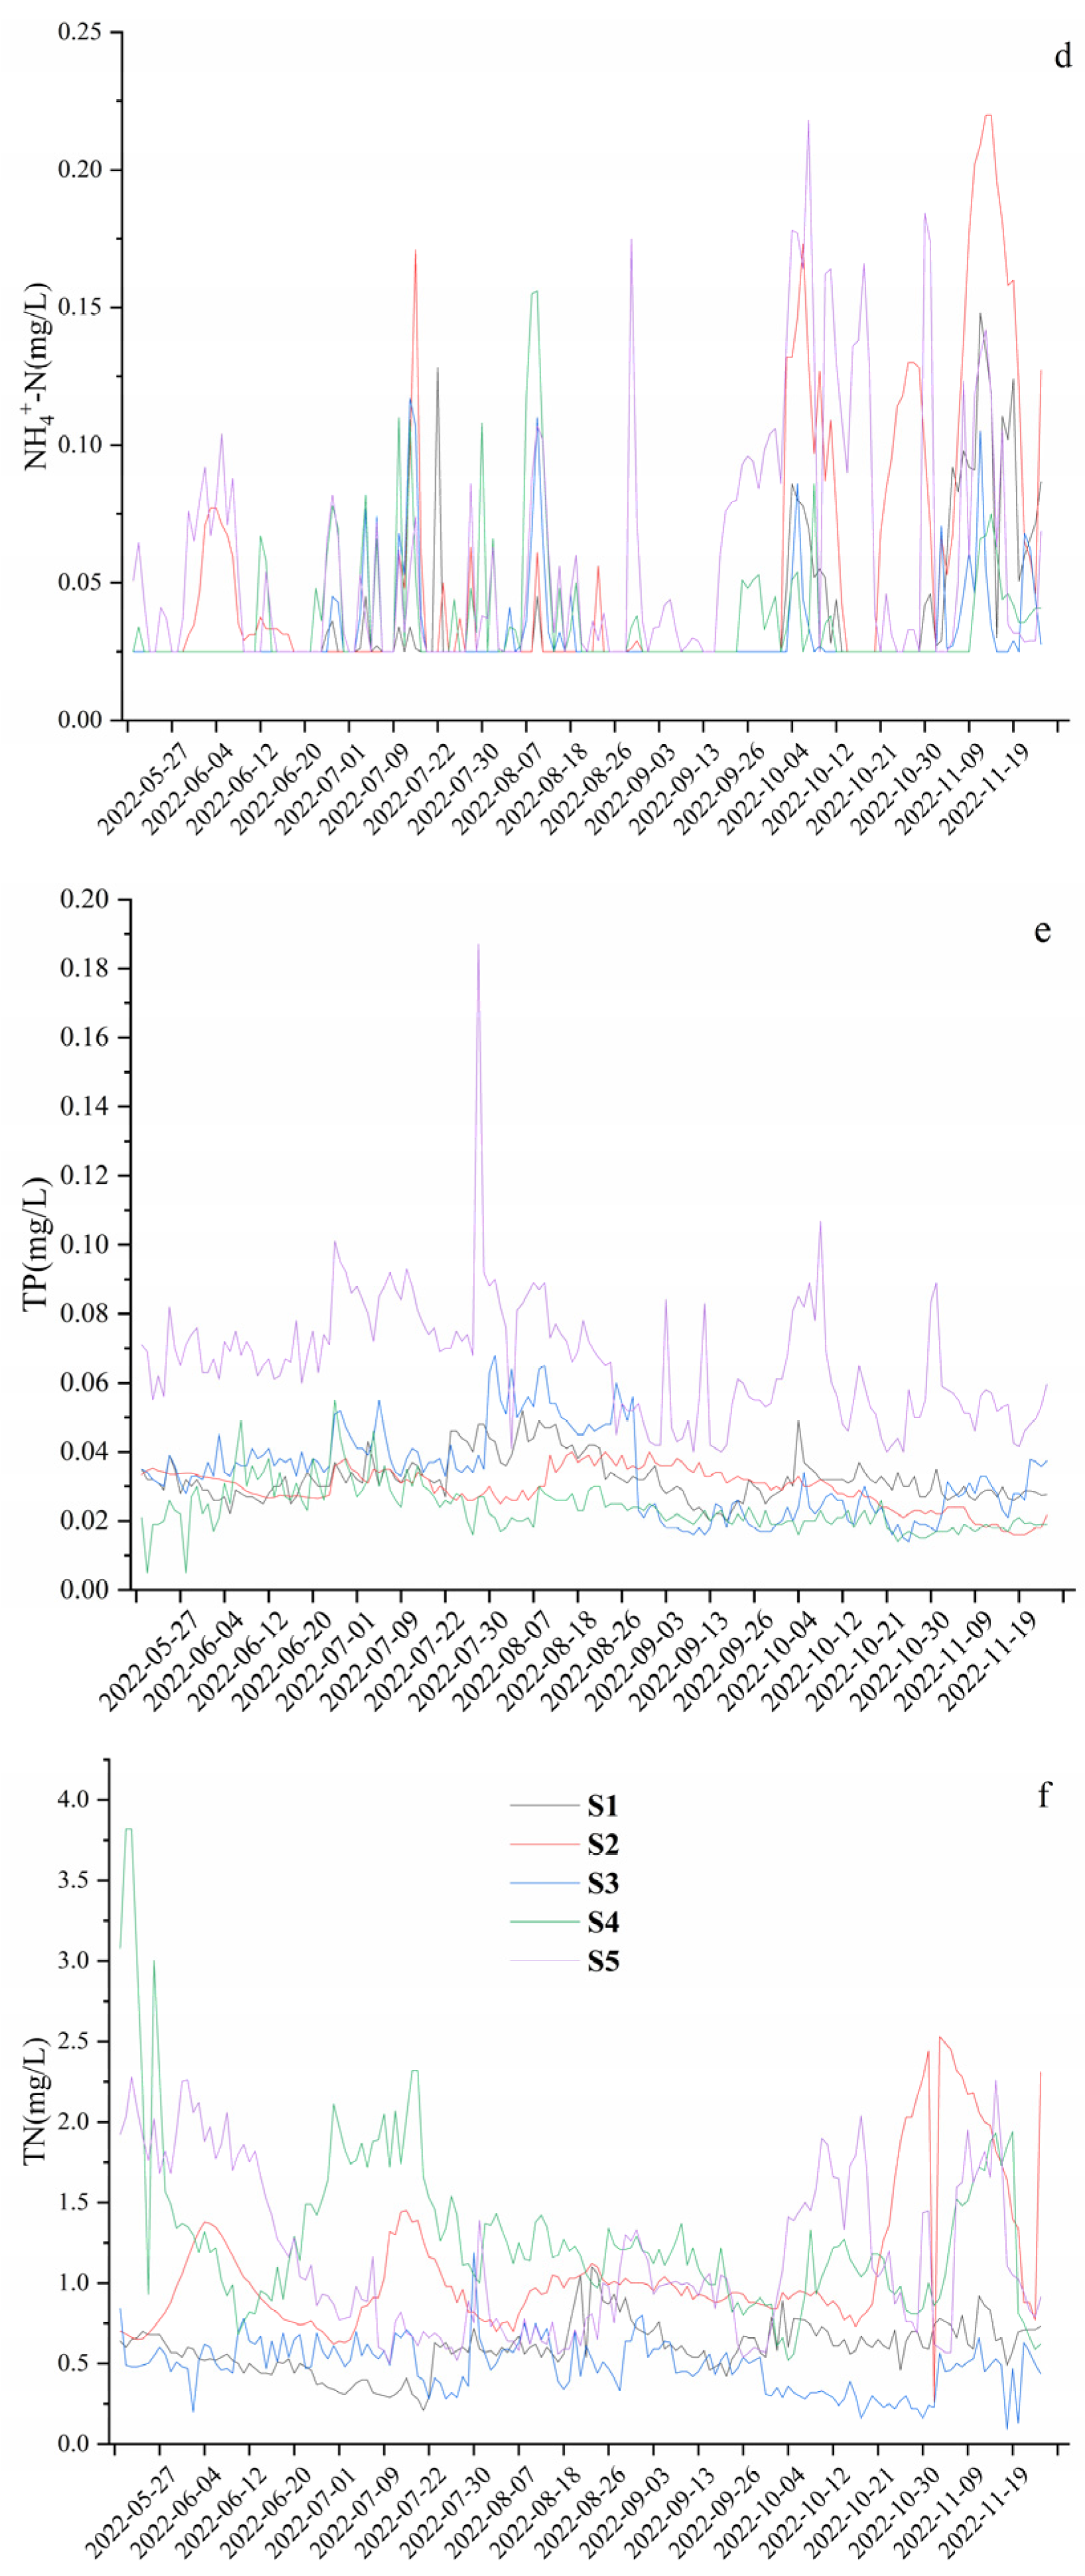
4.3. Characteristics of Temporal Changes in Water Quality in Baiyangdian Lake
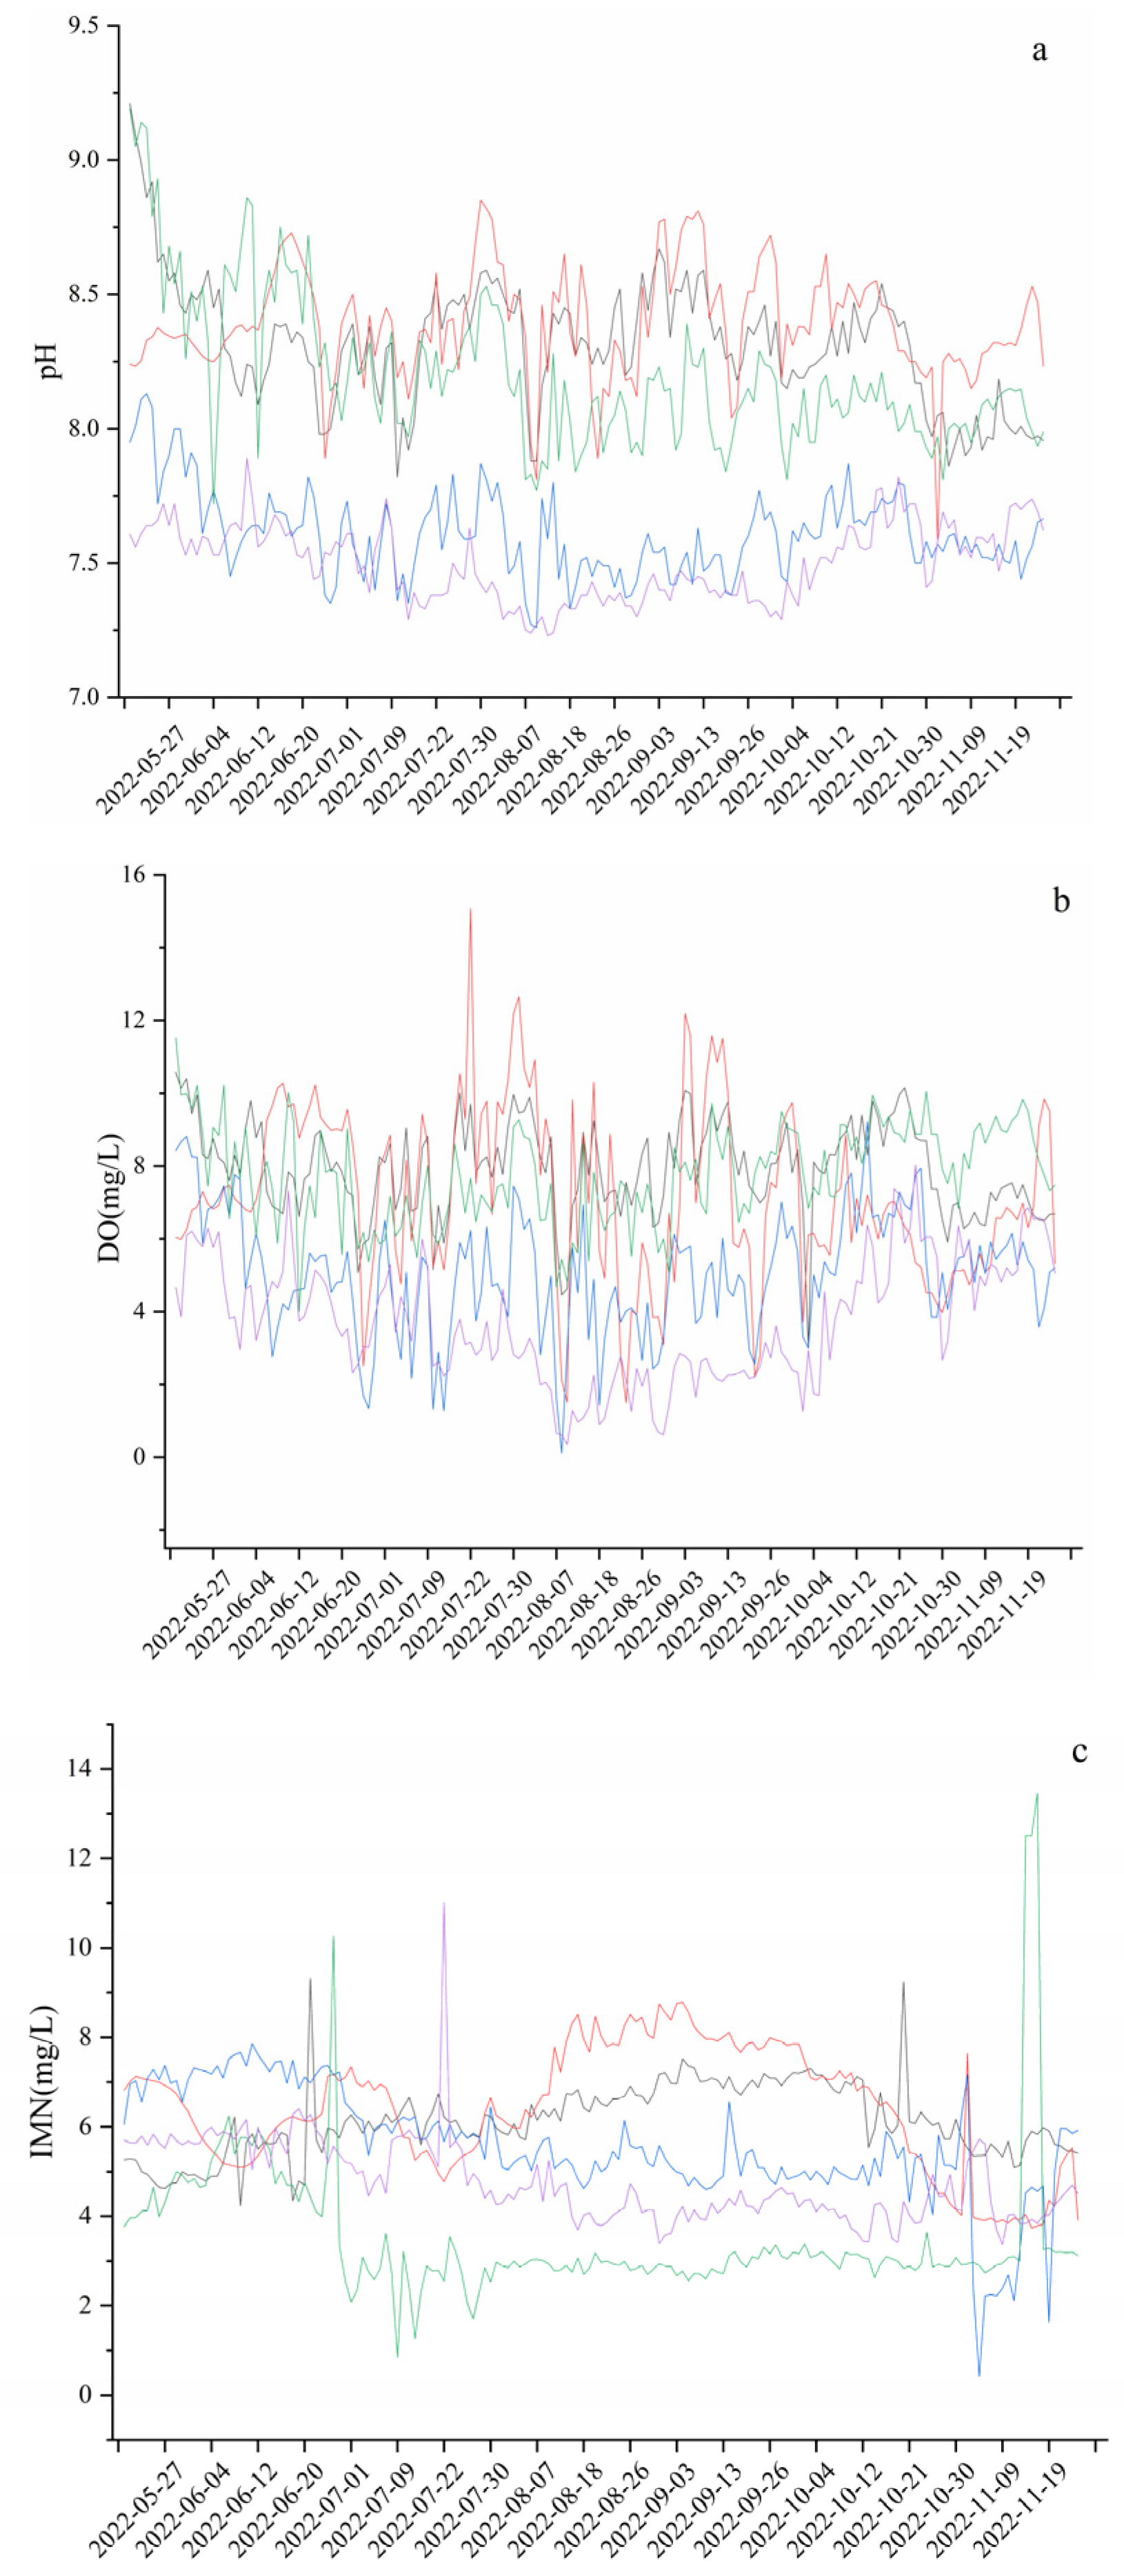
Figure 3 illustrates the temporal variations of six water quality indicators at five sites in Baiyangdian Lake. As shown in Figure 3, these indicators exhibit three main patterns of variation. The first pattern, primarily influenced by point source pollution, is exemplified by TN and NH4+-N, where concentrations during high-flow periods are lower than those during low-flow and normal-flow periods. This variation is mainly attributed to the dilution effect of rainfall, as the concentrations of TN and NH4+-N in rainwater are notably lower than those in Baiyangdian Lake. Conversely, the second pattern, observed in water quality indicators primarily influenced by non-point-source pollution, is demonstrated by TP. Here, concentrations during high-flow periods are higher than those during low-flow and normal-flow periods. This increase is largely due to the influx of fertilizers from agricultural fields. The fertilizers are carried by rainfall runoff into Baiyangdian Lake, consequently resulting in increased TP concentrations in the lake. Additionally, the relatively low concentration of TP in Baiyangdian Lake water, combined with the higher TP concentration in rainfall, contributes to this observed pattern. The third pattern, characterized by irregular variations, is observed in pH, DO, and IMN. This variation may stem from the combined effects of rainfall, sewage discharge, and other anthropogenic activities, resulting in a more complex and unpredictable trend.
4.4. Baiyangdian Lake Water Quality Assessment
Utilizing the Grey Relational Analysis method, a comprehensive water quality assessment was conducted across five sites of Baiyangdian Lake during different time periods. The water quality grades for each assessment are detailed in Table 3. Over the studied period, the water quality in Baiyangdian Lake was predominantly categorized as Class III or above. Notably, the S5 station exhibits a higher proportion of Class IV and V water quality during the normal-flow period, reaching up to 50%. This trend suggests that specific stations experience significantly different water quality levels, possibly due to localized factors. Overall, water quality at all sites shows improvement during high-flow and low-flow periods compared with the normal-flow period, indicating the crucial role of rainfall in diluting pollutants in Baiyangdian Lake. Spatially, the S3 and S4 stations exhibit better water quality compared with the other stations, predominantly falling into Class I and II water quality categories. This spatial variation suggests that these two stations are relatively less influenced by human activities. Hence, it demonstrates the significant role of anthropogenic factors in water quality variation across different areas of the lake.
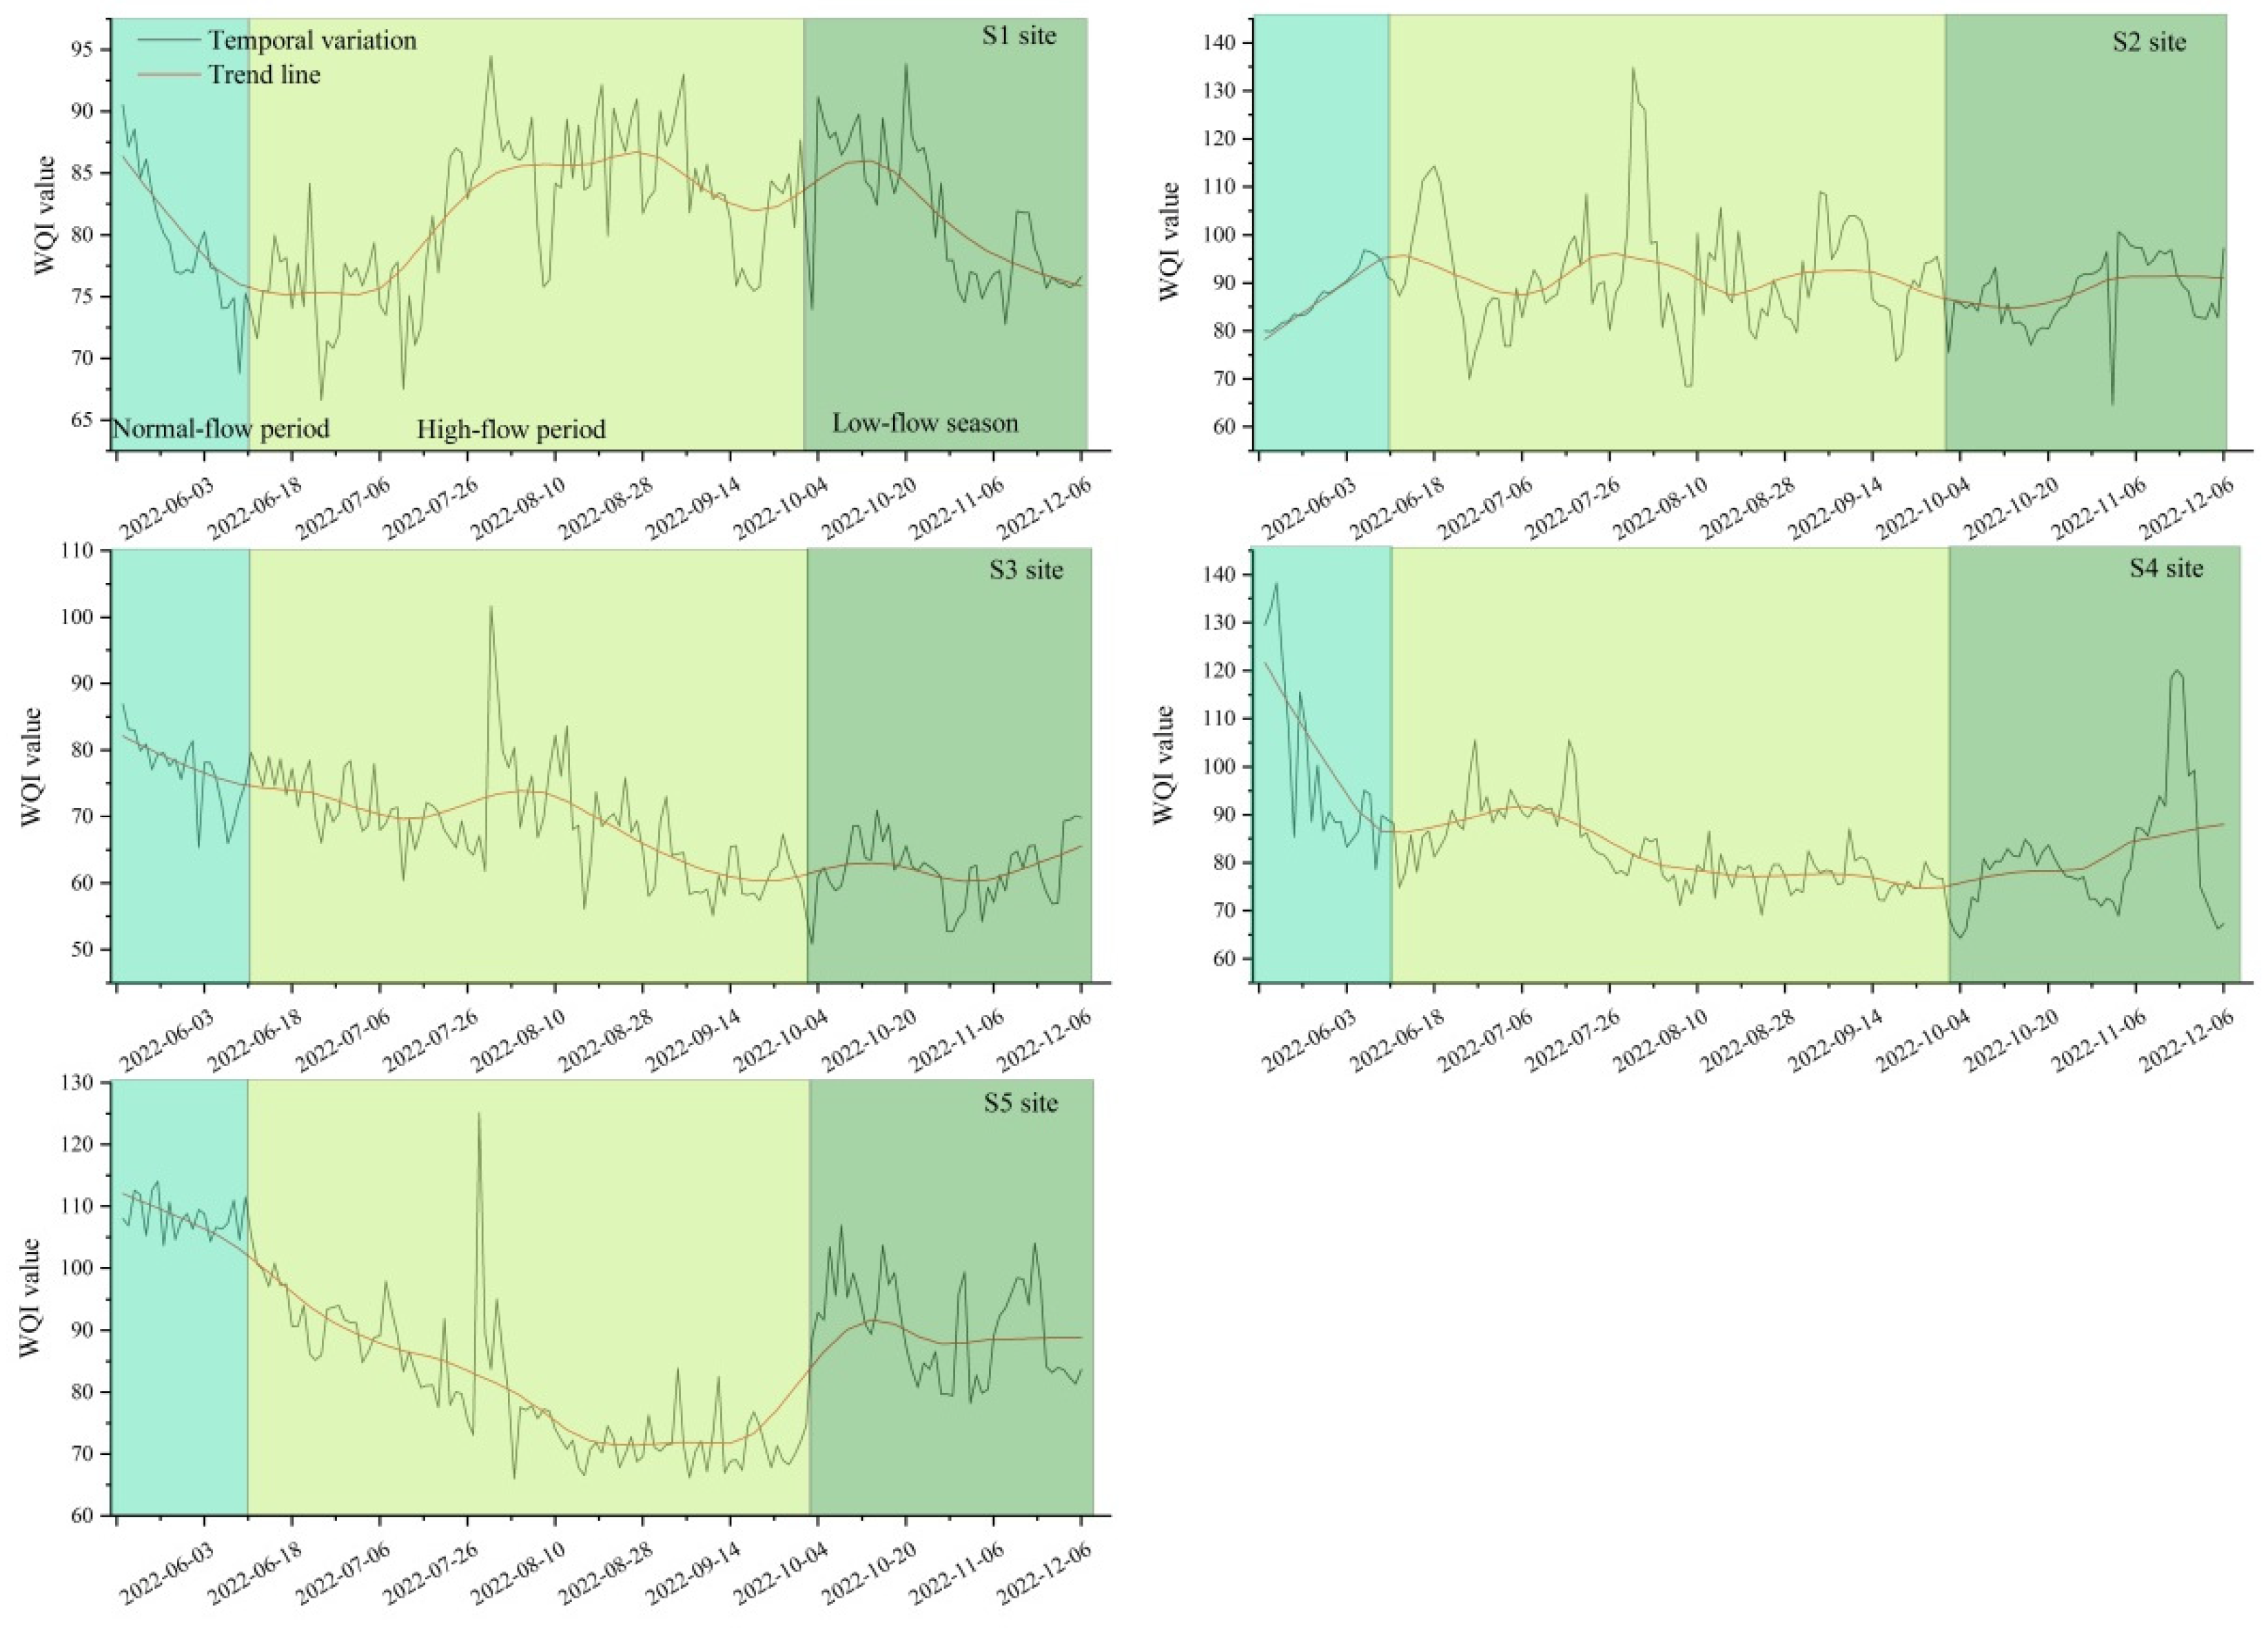
4.5. Temporal Variation and Trend of Water Quality
Based on the time series analysis, it is evident that all five sites in Baiyangdian Lake exhibit significant seasonal fluctuations, indicating that rainfall influences the temporal variations at these sites. As illustrated in Figure 4, the water quality at the five sites presents two distinct temporal patterns. The first pattern, observed at Sites S1 and S2, shows poorer water quality during the high-flow season compared to the low-flow and normal water periods. This suggests that these sites, due to their similar geographical settings, are impacted by surface runoff during rainfall, which carries pollutants into the river, leading to deteriorated water quality during the wet season. The second pattern, exhibited by sites 3, 4, and 5, demonstrates improved water quality during the high-flow season as opposed to the low-flow and normal water periods, indicating that rainfall plays a diluting role for these sites. Notably, sites 4 and 5 show larger seasonal fluctuations in water quality, suggesting that these sites may be influenced by irregular factors such as lake dredging, agricultural activities, or aquaculture operations.
5. Discussion
5.1. Impact of Rainfall on Water Quality in Baiyangdian Lake
Rainfall plays a critically important role in the hydrological cycle, exerting both erosive and dilutive effects on the water quality of rivers and lakes during terrestrial hydrological processes. Accumulated pollutants on land are transported into river–lake systems through rainfall runoff. When the concentration of pollutants in the runoff exceeds that of the river–lake water, it exacerbates the pollutant load in the water body; conversely, it has a diluting effect when the concentration is lower [17].
This study reveals that during high-water periods, the concentration of TP in water is higher than that in low-water periods. This elevation in TP concentration may be attributed to atmospheric rainfall transporting pollutants from the air and land into the water. Wang [18] found that the average concentration of TP in rainfall around the Fu River in Baoding City was 0.44 mg·L−1, which exceeds the concentration of TP in Baiyangdian Lake (average 0.037 mg·L−1). Consequently, atmospheric rainfall significantly contributes to the increased TP levels in water during high-water periods in Baiyangdian Lake. Li et al. and Wang et al. [19,20] found that rainfall significantly impacts the concentration of nitrogen and phosphorus in bodies of water. Furthermore, as the intensity of rainfall increases, the concentrations of nitrogen and phosphorus in the water correspondingly rise. Hence, this suggests that the impact of rainfall on nutrient elements in water is not only related to phosphorus concentration in rainfall but also closely linked to the intensity of the rainfall.
The impact of rainfall on TN at different sites of Baiyangdian Lake exhibits notable variations. At the S5 site, the dilution effect of rainfall on TN is evident, reducing the concentration from 1.95 mg·L−1 during base-flow periods to 0.895 mg·L−1 during high-flow periods. Conversely, at the S3 site, rainfall increases the TN concentration from 0.349 mg·L−1 to 0.547 mg·L−1 during high-flow periods. This variation is primarily due to the rainfall washing pollutants from surrounding areas into the lake, thereby affecting the water quality at these monitoring sites. The underlying reasons for these differences may be linked to the different potential pollutants present near each site. Zhang et al. [21] found that rainfall runoff carries pollutants from villages (such as household waste, sewage in rivers, and compost) into water bodies, resulting in an increase in nitrogen concentration. Researchers have discovered that the primary factor contributing to the elevation of nitrogen concentrations in the rivers is related to rainfall runoff, which carries nitrogen pollutants from agricultural fields and road surfaces into the rivers [22,23]. Consequently, this indicates a significant correlation between increased nitrogen levels in the rivers and the transportation of nitrogenous contaminants through runoff, stemming from rainfall events. In summary, the influence of rainfall on water quality is significantly affected by potential pollution sources in the watershed. When point source pollution dominates, rainfall tends to dilute pollutants in water bodies. However, when non-point-source pollution is prevalent, the flushing action of rainfall can exacerbate water pollution.
5.2. Impact of Human Activities on Water Quality in Baiyangdian Lake
The factors influencing lake water quality can be categorized into three main groups: first, point source pollution resulting from inadequate treatment of residential sewage and industrial wastewater [4]; second, non-point-source pollution, stemming from the nitrogen, phosphorus, and other fertilizers caused by agricultural cultivation and carried into the lake’s rainfall runoff [24,25]; and third, internal source pollution, generated by sediment deposition at the lake floor due to various disturbances [11,12,13].
Point source pollution is identified as the most significant contributor to the degradation of water quality in Baiyangdian Lake. This study reveals that the mean concentration of TP (0.066 mg·L−1) and TN (1.16 mg·L−1) at the S5 site is relatively high, significantly compromising the water quality at this location. The Fu River, passing through the urban area of Baoding City, acts as a receptor for domestic and industrial wastewater from the city, significantly impacting the water quality of Baiyangdian Lake. Sun et al. [26] found that the per capita daily input of domestic wastewater from the Fu River basin into Baiyangdian Lake is 26.3 L/d, contributing 2.3 tons of human and livestock feces, thus posing a substantial threat of nitrogen and phosphorus pollution in the Baiyangdian basin. The S2 and S4 sites exhibit elevated concentrations of TN (1.09 and 1.31 mg·L−1, respectively), surpassing China’s Surface Water Quality Class III standard (1.0 mg·L−1). This phenomenon is primarily attributed to the proximity of these sites to local villages. Although national regulations prohibit wastewater discharge into Baiyangdian Lake, instances of clandestine wastewater disposal by some villagers persist. Therefore, it is inferred that domestic sewage is the principal contributor to the heightened nitrogen and phosphorus concentrations in Baiyangdian Lake. This perspective aligns with the prior literatures. For example, Liang et al. [27], using isotope tracing techniques, identified domestic wastewater discharged by residents in the lake’s surrounding areas as the main source of nitrate pollution in the Baiyangdian basin. Furthermore, Yao et al. [28], found that point source pollution, particularly from the scenic areas within the lake and domestic wastewater, contributes significantly to nitrogen and phosphorus concentrations in Baiyangdian Lake. Therefore, it is evident that domestic wastewater plays a pivotal role in influencing the water quality of Baiyangdian Lake.
Agricultural non-point-source pollution is also identified as a contributing factor to the deterioration of water quality in Baiyangdian Lake. This study reveals that high concentrations of TN are also associated with non-point-source pollution within the watershed. This finding aligns with the conclusions of Zhao et al. [29] and Wang et al. [30], who identified the intensive input of agricultural fertilizers in the surrounding areas to be a significant factor contributing to the severe TN pollution in Baiyangdian Lake. Yang et al.’s [31] research indicates that improvement in the water quality of Baiyangdian Lake basin is linked to enhanced efficiency in the utilization of nitrogen and phosphorus fertilizer in agriculture. Furthermore, Wang et al. [32] discovered that the excessive use of fertilizers in the agriculture-intensive areas of Chaohu Lake basin is a primary cause of severe TN and TP exceedances. As demonstrated by Sun et al. [26], there are 39 villages with approximately 100,000 residents engaged in agricultural cultivation and aquaculture within the Baiyangdian reservoir area. Thus, the impact of agricultural non-point-source pollution on water bodies should not be underestimated.
In the context of inland waters, endogenous releases can also significantly impact water quality. Shallow rivers and lakes are prone to sediment resuspension under the disturbance of wind waves or human activities, leading to the release of nitrogen and phosphorus from the sediment into the overlying water. This study revealed that the elevated concentrations of nitrogen and phosphorus are also linked to the release of internal pollutants caused by the dredging of lake sediments. During the sampling period, it was observed that lake dredging activities were being conducted in the vicinity of site 2. Additionally, previous studies have confirmed that sedimentary TP in the inflow areas of the Fu River to Baiyangdian Lake was classified as heavily polluted. Human-induced disturbances were observed to increase TP concentration by releasing sedimentary TP into the water [33]. It can be inferred that the endogenous release of sediment in lakes is one of the contributing factors to water pollution.
In conclusion, Baiyangdian Lake’s water quality is influenced by various factors, primarily driven by intense human activities. Prolonged pollution stems from the extensive discharge of domestic sewage from surrounding villages, agricultural practices in the watershed, internal pollution within the Baiyangdian Lake reservoir area, and aquaculture activities. To improve water quality in the Baiyangdian Lake watershed, crucial measures include controlling domestic sewage discharge, optimizing fertilizer use, and prohibiting farming in the lakes. These interventions are essential for mitigating the impact of human activities and enhancing the overall health of the lake’s ecosystem.
6. Conclusions
A comprehensive analysis of the water quality differences at five national controlled sites in Baiyangdian Lake indicates that the primary pollutants are TN, TP, and IMN. Spatial variations in Baiyangdian Lake’s water quality are predominantly influenced by human activities, with the villages around the sites exhibiting the poorest water quality. In contrast, areas in the central part of the lake show relatively better water quality. Temporally, Baiyangdian Lake’s water quality demonstrates three patterns: Firstly, indicators primarily influenced by point source pollution, such as TN and NH4+-N, exhibit lower concentrations during high-flow periods compared to low-flow and normal water periods. Secondly, those affected by non-point-source pollution, like TP, show higher concentrations in high-flow periods. Thirdly, irregular variations are noted in pH, DO, and IMN. Using the grey correlation degree water quality assessment method, the evaluation of Baiyangdian Lake’s water quality is generally good, predominantly classified as Class III or higher. Time series analysis indicates that the dilution effect of rainfall and the scouring action of runoff dominate the temporal variation of water quality in Baiyangdian Lake. A detailed analysis reveals that the main pollution sources are domestic sewage, followed by agricultural non-point-source pollution and the release of internal pollutants. Additionally, aquaculture has emerges as a significant contributor to the lake’s pollution. In summary, improving water quality in Baiyangdian Lake necessitates controlling the domestic sewage discharge from basin residents, optimizing fertilizer use, and prohibiting farming in the lakes. These measures are essential to mitigate the impact of human activities and enhance the overall health of the lake’s ecosystem.
Author Contributions
Y.L., investigation, methodology, software, data curation, writing—original draft preparation. Q.Z., supervision, methodology, writing—review and editing, supervision. All authors have read and agreed to the published version of the manuscript.
Funding
This work was supported by the Natural Science Foundation of China (Grant No. 42377232), the Fundamental Research Funds for the Chinese Academy of Geological Sciences (No. YK202310), the Natural Science Foundation of Hebei Province of China (Grant No. D2022504015), and the open funds of Natural Science Foundation of Hebei Province of China (Grant No. D2022504015).
Data Availability Statement
Data are contained within the article.
Acknowledgments
The authors gratefully acknowledge the editor and anonymous reviewers for their valuable comments on this manuscript. The authors also appreciate the financial support from the different organizations.
Conflicts of Interest
The authors declare no conflict of interest.
References
- Paerl, H.W.; Hall, N.S.; Calandrino, E.S. Controlling harmful cyanobacterial blooms in a world experiencing anthropogenic and climatic-induced change. Sci. Total Environ. 2011, 409, 1739–1745. [Google Scholar] [CrossRef] [PubMed]
- Rosca, O.M.; Dippong, T.; Marian, M.; Mihali, C.; Jelea, M. Impact of anthropogenic activities on water quality parameters of glacial lakes from Rodnei mountains, Romania. Environ. Res. 2020, 182, 109136. [Google Scholar] [CrossRef] [PubMed]
- Nong, X.; Shao, D.; Zhong, H.; Liang, J. Evaluation of water quality in the South-to-North Water Diversion Project of China using the water quality index (WQI) method. Water Res. 2020, 178, 115781. [Google Scholar] [CrossRef] [PubMed]
- Yang, M.; Zhu, L.; Liu, J.; Zhang, Y.; Zhou, B. Influence of water conservancy project on runoff in the source region of the Yellow River and wetland changes in the Lakeside Zone, China. J. Groundw. Sci. Eng. 2023, 11, 333–346. [Google Scholar] [CrossRef]
- Zou, L.; Liu, Y.; Wang, Y.; Hu, X. Assessment and analysis of agricultural non-point source pollution loads in China: 1978–2017. J. Environ. Manag. 2020, 263, 110400. [Google Scholar] [CrossRef] [PubMed]
- Zheng, X.; Liu, G.; Yang, W. Dominant Contribution of a Lake’s Internal Pollution to Eutrophication During Rapid Urbanization. Bull. Environ. Contam. Toxicol. 2021, 107, 904–910. [Google Scholar] [CrossRef] [PubMed]
- Zhou, F.; Bo, Y.; Ciais, P.; Patrice, D.; Yoshihide, W. Deceleration of China’s human water use and its key drivers. Proc. Natl. Acad. Sci. USA 2020, 117, 7702–7711. [Google Scholar] [CrossRef] [PubMed]
- Wang, S.; Tang, C.; Song, X.; Wang, Q.; Zhang, Y.; Yuan, R. The impacts of a linear wastewater reservoir on groundwater recharge and geochemical evolution in a semi-arid area of the Lake Baiyangdian watershed, North China Plain. Sci. Total Environ. 2014, 482, 325–335. [Google Scholar] [CrossRef]
- Wang, Y.; Liu, M.; Dai, Y.; Luo, Y.; Zhang, S. Health and ecotoxicological risk assessment for human and aquatic organism exposure to polycyclic aromatic hydrocarbons in the Baiyangdian Lake. Environ. Sci. Pollu. Res. 2021, 28, 574–586. [Google Scholar] [CrossRef]
- Li, H.; Shen, H.; Li, S.; Liang, Y.; Zhang, L. Effects of eutrophication on the benthic-pelagic coupling food web in Baiyangdian Lake. Acta Ecol. Sin. 2018, 38, 2017–2030. [Google Scholar]
- Xue, P.; Zhao, Q.; Wang, Y.; Geng, L.; Wang, D. Distribution characteristics of heavy metals in sediment-submerged macrophyte-water systems of Lake Baiyangdian. J. Lake Sci. 2018, 30, 1525–1536. [Google Scholar]
- Ren, C.; Zhang, Q.; Wang, H.; Wang, Y. Characteristics and source apportionment of polycyclic aromatic hydrocarbons of groundwater in Hutuo river alluvial-pluvial fan, china, based on PMF model. Environ. Sci. Pollut. Res. 2021, 28, 9647–9656. [Google Scholar] [CrossRef] [PubMed]
- Zhang, Q.; Wang, X.; Wan, W.; Hou, P.Q.; Li, R.; Ouyang, Z. The Spatial-Temporal Pattern and Source Apportionment of Water Pollution in a Trans-Urban River. Pol. J. Environ. Stud. 2015, 24, 841–851. [Google Scholar]
- Hou, P.; Ren, Y.; Zhang, Q.; Zhang, Y.; Wang, H.; Lu, F.; Zhang, H.; Ouyang, Z.; Wang, X. Temporal and spatial variations of water quality in a trans-urban river in Beijing, China. Fresenius Environ. Bull. 2013, 22, 561–572. [Google Scholar]
- Zhang, Q.; Wang, H.; Wang, Y.; Yang, M.; Zhu, L. Groundwater quality assessment and pollution source apportionment in an intensely exploited region of northern china. Environ. Sci. Pollut. Res. 2017, 24, 16639–16650. [Google Scholar] [CrossRef]
- GB3838-2002; Environmental Quality Standards for Surface Water. State Environment Protection Bureau of China: Beijing, China, 2002.
- Van, D.; Van, I.; Gabbert, S.; Weikard, H.P.; Hendrix, E.M.T. Impacts of rainfall variability and expected rainfall changes on cost-effective adaptation of water systems to climate change. J. Environ. Manag. 2015, 154, 40–47. [Google Scholar]
- Wang, X. Non-Point Source of Rainfall and Runoff around Fu River in Baoding City Pollution Characteristics Research. Master’s Thesis, Hebei Agricultural University, Baoding, China, 2021. (In Chinese). [Google Scholar]
- Li, X.; Lei, Q.; Zhou, J. Effect of Rainfall Intensity on the Content of Nitrogen and Phosphorus Components in Plateau Areas:A Case Study of the Fengyu River Watershed. Environ. Sci. 2019, 40, 5375–5383. (In Chinese) [Google Scholar]
- Wang, S.; He, Q.; Ai, H.; Wang, Z.; Zhang, Q. Pollutant concentrations and pollution loads in stormwater runoff from different land uses in Chongqing. J Environ. Sci. 2013, 25, 502–510. [Google Scholar] [CrossRef]
- Zhang, Q.; Wang, X.; Hou, P.; Wan, W.; Ren, Y.; Ouyang, Z.; Yang, L. The temporal changes in road stormwater runoff quality and the implications to first flush control in Chongqing, China. Environ. Monitor. Assess. 2013, 185, 9763–9775. [Google Scholar] [CrossRef]
- Jiang, H.; Zhang, Q.; Liu, W.; Zhang, J.; Zhao, T.; Xu, Z. Climatic and anthropogenic driving forces of the nitrogen cycling in a subtropical river basin. Environ. Res. 2021, 194, 110721. [Google Scholar] [CrossRef]
- Sun, X.; Guo, C.; Zhang, J.; Sun, J.; Cui, J.; Liu, M. Spatial-temporal difference between nitrate in groundwater and nitrogen in soil based on geostatistical analysis. J. Groundw. Sci. Eng. 2023, 11, 37–46. [Google Scholar] [CrossRef]
- Zhang, Q.; Wang, H.; Liu, L.; Zhai, T.; Zhang, X. Multiple isotopes reveal the driving mechanism of high NO3–level and key processes of nitrogen cycling in the lower reaches of Yellow River. J. Environ. Sci. 2024, 138, 597–606. [Google Scholar] [CrossRef] [PubMed]
- Cao, W.; Zhang, Z.; Guo, H.; Fu, Y.; Gao, Z.; Nan, T.; Ren, Y.; Li, Z. Spatial distribution and controlling mechanisms of high fluoride groundwater in the coastal plain of bohai rim, north china. J. Hydrol. 2023, 617, 128952. [Google Scholar] [CrossRef]
- Sun, T.; Chen, J.; Wang, H.; Shi, Z. Study on non-point source pollution loads in villages along the Fuhe River, Baiyangdian watershed. Res. Environ. Sci. 2012, 25, 568–572. (In Chinese) [Google Scholar]
- Liang, H.; Zhai, D.; Kong, X.; Yuan, R.; Wang, S. Sources, migration and transformation of nitrate in Fuhe River and Baiyangdian Lake, China. Chin. J. Eco-Agric. 2017, 25, 1236–1244. (In Chinese) [Google Scholar]
- Yao, S.; Zhang, X.; Cai, Y.; He, L.; Li, J.; Wang, X. Study on Distribution Characteristics of Different Nitrogen and Phosphorus Fractions by Spectrophotonbetry in Baiyangdian Lake and Source Analysis. Spectrosc. Spectr. Anal. 2022, 42, 1306–1312. (In Chinese) [Google Scholar]
- Zhao, Y.; Xia, X.; Yang, Z.; Wang, F. Assessment of water quality in Baiyangdian Lake using multivariate statistical techniques. Procedia Environ. Sci. 2012, 13, 1213–1226. [Google Scholar] [CrossRef]
- Wang, G.; Lv, C.; Gu, C.; Yu, Y.; Yang, Z.; Zhang, Z.; Tang, C. Pollutants Source Assessment and Load Calculation in Baiyangdian Lake Using Multi-Model Statistical Analysis. Water 2022, 14, 3386. [Google Scholar] [CrossRef]
- Yang, W.B.; Yang, J.; Zhao, Z.Q.; Zhang, J.; Wei, J. Temporal and spatial characteristics of nutrient flow and losses of the croplivestock system in Baiyangdian Basin. Chin. J. Eco-Agric. 2022, 30, 1722–1736. (In Chinese) [Google Scholar]
- Wang, G.; Ma, Y.; Sun, X.; Song, F.; Xiao, S. Study of nitrogen and phosphorus runoff in wheat-rice rotation farmland in Chao lake basin. J. Soil Water Conserv. 2010, 24, 6–9. [Google Scholar]
- Qin, B.Q.; Zhu, G.W.; Zhang, L.; Luo, L.; Gao, G.; Gu, B. Patterns of endogenous nutrient release from sediments of large shallow lakes and their estimation methods—A case study of Taihu Lake. Sci. China Ser. D Earth Sci. 2005, 35, 33–44. [Google Scholar]
Figure 1.
The geographical location and distribution of monitoring sites of Baiyangdian Lake.

Figure 2.
Concentration distribution characteristics of (A) pH, (B) DO, (C) IMN, (D) NH4+-N, (E) TP, and (F) TN at five sites of Baiyangdian Lake. Values followed by different letters for different sites designate significant differences at the p < 0.05 level by nonparametric Kruskal–Wallis test and Mann–Whitney U test.


Figure 3.
Temporal variation of (a) pH, (b) DO, (c) IMN, (d) NH4+-N, (e) TP, and (f) TN in Baiyangdian Lake.
Figure 3.
Temporal variation of (a) pH, (b) DO, (c) IMN, (d) NH4+-N, (e) TP, and (f) TN in Baiyangdian Lake.


Figure 4.
Temporal variation and trend of water quality in Baiyangdian Lake.


Table 1.
The geographical location and situation of monitoring sites of Baiyangdian Lake.
| Sites | Latitude | Longitude | Land Use | Potential Sources of Pollution |
|---|---|---|---|---|
| S1 | 116°1′9.94″ | 38°51′27.40″ | Village | Domestic sewage |
| S2 | 116°1′33.95″ | 38°49′46.12″ | Village | Domestic sewage |
| S3 | 116°2′11.14″ | 38°54′0.71″ | Village | Domestic sewage |
| S4 | 115°58′26.96″ | 38°56′33.15″ | Scenic spots and farmland | Domestic sewage and chemical fertilizer |
| S5 | 115°57′24.76″ | 38°53′54.3″ | Aquaculture area and village | Domestic sewage and feed fertilizer |
Table 2.
Water quality data statistics of Baiyangdian Lake at 5 sites.
| Sites | Parameters | Min | Max | Mean | Rate of Exceeded Standard (%) |
|---|---|---|---|---|---|
| S1 | pH | 7.82 | 9.21 | 8.32 | 1.21 |
| DO | 3.04 | 10.6 | 7.94 | 1.82 | |
| IMN | 4.24 | 9.32 | 6.13 | 55.2 | |
| NH4+-N | 0.025 | 0.148 | 0.036 | 0.00 | |
| TP | 0.020 | 0.052 | 0.032 | 0.61 | |
| TN | 0.210 | 1.10 | 0.597 | 1.82 | |
| S2 | pH | 7.59 | 8.85 | 8.39 | 0.00 |
| DO | 1.50 | 15.1 | 7.21 | 13.9 | |
| IMN | 3.74 | 8.79 | 6.42 | 63.6 | |
| NH4+-N | 0.025 | 0.220 | 0.054 | 0.00 | |
| TP | 0.016 | 0.040 | 0.030 | 0.00 | |
| TN | 0.260 | 2.53 | 1.09 | 40.6 | |
| S3 | pH | 7.26 | 8.13 | 7.61 | 0.00 |
| DO | 0.120 | 9.22 | 5.05 | 46.1 | |
| IMN | 0.420 | 7.86 | 5.59 | 33.9 | |
| NH4+-N | 0.025 | 0.117 | 0.032 | 0.00 | |
| TP | 0.014 | 0.068 | 0.034 | 12.1 | |
| TN | 0.090 | 1.19 | 0.485 | 0.61 | |
| S4 | pH | 7.72 | 9.19 | 8.20 | 2.42 |
| DO | 4.01 | 11.5 | 7.76 | 1.82 | |
| IMN | 0.840 | 13.5 | 3.55 | 3.03 | |
| NH4+-N | 0.025 | 0.156 | 0.037 | 0.00 | |
| TP | 0.005 | 0.055 | 0.024 | 0.61 | |
| TN | 0.520 | 3.82 | 1.31 | 73.3 | |
| S5 | pH | 7.23 | 7.89 | 7.50 | 0.00 |
| DO | 0.350 | 8.03 | 3.73 | 76.4 | |
| IMN | 3.37 | 11.0 | 4.77 | 3.64 | |
| NH4+-N | 0.025 | 0.218 | 0.059 | 0.00 | |
| TP | 0.040 | 0.187 | 0.066 | 83.0 | |
| TN | 0.500 | 2.28 | 1.16 | 52.1 |
Note: Standard is grade III standard for surface water quality in China (GB/T3838-2002) [16]. The pH value is dimensionless, while the units for all other indices are expressed in mg/L.
Table 3.
Results of water quality assessment of five sites in Baiyangdian Lake.
| Seasons | Sites | Number of Samples | Proportion of Water Quality Grade | ||||||||
|---|---|---|---|---|---|---|---|---|---|---|---|
| I | II | III | IV | V | I | II | III | IV | V | ||
| Normal-flow season | S1 | 0 | 5 | 17 | 0 | 0 | 0% | 23% | 77% | 0% | 0% |
| S2 | 0 | 0 | 22 | 0 | 0 | 0% | 0% | 100% | 0% | 0% | |
| S3 | 1 | 13 | 8 | 0 | 0 | 5% | 59% | 36% | 0% | 0% | |
| S4 | 11 | 2 | 9 | 0 | 0 | 50% | 9% | 41% | 0% | 0% | |
| S5 | 0 | 0 | 11 | 10 | 1 | 0% | 0% | 50% | 45% | 5% | |
| High-flow season | S1 | 6 | 38 | 50 | 0 | 0 | 6% | 40% | 53% | 0% | 0% |
| S2 | 0 | 2 | 92 | 0 | 0 | 0% | 2% | 98% | 0% | 0% | |
| S3 | 1 | 49 | 42 | 1 | 1 | 1% | 52% | 45% | 1% | 1% | |
| S4 | 53 | 28 | 13 | 0 | 0 | 56% | 30% | 14% | 0% | 0% | |
| S5 | 0 | 3 | 73 | 16 | 2 | 0% | 3% | 78% | 17% | 2% | |
| Low-flow season | S1 | 0 | 2 | 47 | 0 | 0 | 0% | 4% | 96% | 0% | 0% |
| S2 | 3 | 28 | 18 | 0 | 0 | 6% | 57% | 37% | 0% | 0% | |
| S3 | 19 | 28 | 2 | 0 | 0 | 39% | 57% | 4% | 0% | 0% | |
| S4 | 41 | 9 | 0 | 0 | 0 | 84% | 16% | 0% | 0% | 0% | |
| S5 | 0 | 3 | 36 | 11 | 0 | 0% | 6% | 73% | 21% | 0% | |
Disclaimer/Publisher’s Note: The statements, opinions and data contained in all publications are solely those of the individual author(s) and contributor(s) and not of MDPI and/or the editor(s). MDPI and/or the editor(s) disclaim responsibility for any injury to people or property resulting from any ideas, methods, instructions or products referred to in the content. |
© 2023 by the authors. Licensee MDPI, Basel, Switzerland. This article is an open access article distributed under the terms and conditions of the Creative Commons Attribution (CC BY) license (https://creativecommons.org/licenses/by/4.0/).
Share and Cite
MDPI and ACS Style
Liu, Y.; Zhang, Q. Study on the Spatiotemporal Variation in and Driving Mechanism of Water Quality in Baiyangdian Lake. Water 2024, 16, 166. https://doi.org/10.3390/w16010166
AMA Style
Liu Y, Zhang Q. Study on the Spatiotemporal Variation in and Driving Mechanism of Water Quality in Baiyangdian Lake. Water. 2024; 16(1):166. https://doi.org/10.3390/w16010166
Chicago/Turabian StyleLiu, Yang, and Qianqian Zhang. 2024. "Study on the Spatiotemporal Variation in and Driving Mechanism of Water Quality in Baiyangdian Lake" Water 16, no. 1: 166. https://doi.org/10.3390/w16010166
Note that from the first issue of 2016, this journal uses article numbers instead of page numbers. See further details here.