
Comparison of Four Sewer Condition Assessment Protocols Based on Field Data

1
Department of Municipal Engineering, Hefei University of Technology, Hefei 230009, China
2
Power-China Huadong Engineering Co., Ltd., Hangzhou 310014, China
3
Yangtze Ecology and Environment Co., Ltd., Wuhan 430062, China
4
Hefei Institute for Public Safety Research, Tsinghua University, Hefei 230601, China
*
Author to whom correspondence should be addressed.
Water 2023, 15(21), 3790; https://doi.org/10.3390/w15213790
Submission received: 19 September 2023
/
Revised: 9 October 2023
/
Accepted: 17 October 2023
/
Published: 29 October 2023
(This article belongs to the Section Urban Water Management)
Abstract
:In order to better plan new or update sewer pipe condition assessment protocols, this paper presents systematic comparisons of four of the most widely used sewer condition assessment protocols, including the fourth edition of the Sewer Rehabilitation Manual (SRM-4) in the UK, the Pipeline Assessment and Certification Program (PACP) in America, the Sewer Physical Condition Grading Protocols (SPCCM) in Canada, and the Technical Specification for Inspection and Evaluation of Urban Sewer (TSIEUR) in China. In the qualitative comparison, the defects categories, deduct values, and assessment methods of the four protocols are analyzed. A new concept of defect weight is firstly introduced to make comparisons between protocols applicable and easy; in the quantitative comparison, the protocols are used to evaluate the same 182 sewer pipe segments based on field data and the assessment results are compared. It is found that the main reasons for the different evaluation results are due to the different defect weights and evaluation methods used. Finally, PACP shows obvious advantages and is recommended for asset managers when making new or updating protocols in the future.
1. Introduction
Underground sewer systems are one of the biggest pieces of infrastructure in modern cities around the world. However, many cities’ sewer systems are deteriorating due to various structural defects on pipe walls, such as cracks, fractures, surface damage, and deformation [1]. The most critical step to avoiding sewer pipe deterioration is to assess sewer conditions regularly and properly. The daily sewer condition assessment work mainly consists of three parts, including sewer pipe structural and functional data acquisition using inspection technologies such as closed-circuit TV (CCTV) and quick view (QV), defects identification and severity level evaluation according to a condition assessment protocol, and assessment report generation for rehabilitation [2]. It is well recognized that which condition assessment protocol is used plays a most important role in this process [3,4,5,6]. However, some previous studies have found that different protocols may generate significantly different results, and detailed explanations have not been reported in previous studies. This situation causes great confusion for some countries or cities that are planning to make their own condition assessment protocols or update their existing protocols.
In 2012, the first sewer condition assessment protocol, named the Technical Specification for Inspection and Evaluation of Urban Sewer (TSIEUR), was released in China. However, in its applications in practice in the past 10 years, many local asset managers have reflected that the protocol has poor accuracy caused by imprecise assessments. Therefore, the National Standardization Administration in China recently issued a project to update the protocol. In order to minimize the inaccuracy of sewer condition assessment, as a first step, it is necessary to make compressive comparisons between different protocols to gain a better understanding of the main reasons causing the different evaluation results and then to choose a better and more suitable protocol as a reference when updating the protocol [7,8].
Since the Water Research Center (WRc) in the UK released the world’s first manual for condition assessment of drainage pipelines in 1980, the technology of sewer inspection and evaluation has developed rapidly [9]. Currently, there are many sewer condition assessment protocols in different countries and regions, such as the fourth edition of the Sewer Rehabilitation Manual (SRM-4) in the UK, the Pipeline Assessment and Certification Program (PACP) in the USA, and the Sewer Physical Condition Grading Protocols (SPCCM) in Canada. The main purpose of these protocols is to guide municipal authorities to formulate work plans for the daily maintenance and repair of drainage networks by properly identifying sewer defect types and ranking severity levels based on certain rules [10]. Previous studies have noticed that different protocols are likely to give significantly different results, even when evaluating the same sewer pipe sections. Khazraeializadeh et al. [11] used SRM-4, PACP, and SPCCM to assess 20 pipe sections with various defects in the City of Edmonton, Canada, and obtained very different results. No pipe segment received the same grade from the three protocols. Shin et al. [12] compared two protocols in South Korea: one being the old sewer pipeline condition assessment protocol formulated by the Ministry of Environment of Korea (MOE) and the other being a newly updated sewer condition assessment and rehabilitation decision-making (SCARD) system based on the MOE protocol. Although the two protocols share the same defect types, there are still great differences in assessment results. For example, 45% of the total investigated pipes received the severity level of Grade 5 as per the MOE protocol, which was much higher than the value of 0.6% given by the SCARD protocol. When using the same sewer pipeline, the defects would not change with the inspection methods or assessment protocols used. Therefore, when analyzing defect types and their severity levels from CCTV or QV images, it is expected that different protocols should give similar assessment results.
In this study, the four most widely used sewer condition assessment protocols, including SRM-4, PACP, SPCCM, and TSIEUR, were compared by evaluating 182 sewer pipe segments with various types of defects, based on field data in the City of Wuhu, China. The comparisons among the protocols were organized into two stages. In the first stage, the defect definition, defect weight, assessment methods, and internal condition grades (ICGs) of the four protocols were qualitatively compared, and the equivalent definitions of structural defects between the protocols was realized. In particular, the new concept of defect weight was introduced and made the comparison applicable and easy. In the second stage, detailed assessments of the 182 sewer pipe segments using the four protocols were conducted, and the assessment results were quantitatively compared and analyzed. The main reasons for the differences in the assessment results were revealed and discussed. Finally, the PACP was recommended due to its obvious advantages.
2. The Four Protocols
To better compare the assessment results of the four protocols (SRM-4, PACP, SPCCM, and TSIEUR), a brief introduction of the protocols is given below.
The first edition of the Sewerage Rehabilitation Manual (SRM) was released in the UK in 1980, and its fourth edition (SRM-4) was a major update published in 2004 [13]. As the first drainage pipeline condition assessment system, SRM is well known and played an important reference role in the development of sewer condition assessment agreements in other countries and regions. In SRM-4, sewer pipeline defects are divided into structural defects and functional defects, and the description or coding method for a pipeline defect consists of two parts. The first part describes the category that the defect belongs to, such as a crack, collapse, or joint, and the second part provides information related to the direction and location of the defect, such as longitudinal, circular, and multiple defects. Then, SRM-4 assigns a score between 1 and 165 to each defect and calls it Deduct Value. Since a sewer pipeline may have many defects, by calculating the peak score of all defects in the pipeline and comparing it with the predetermined thresholds of different internal condition grades (ICGs, Grade 1 to Grade 5), the condition level of the pipeline is then determined.
The National Association of Sewer Service Companies (NASSCO) in the United States established the Pipeline Assessment and Certification Program (PACP) in 2004 with assistance from the WRc [14]. Although PACP is the North American localized SRM, it formulates defect levels and designs a new coding system from the perspective of structure, function, and external factors [15]. In PACP, pipeline defects are divided into four families, including structural, operational and maintenance, construction features, and others. The coding method for a defect consists of two or three parts. The first part gives the defect category, the second part provides information related to the direction and location of the defect, and the third part is the s description of some categories of the defect, which usually quantitatively describes the severity of the defect. After the grade of each defect (Grade 1 to Grade 5) is assigned, ICG of the pipeline is then obtained by calculating the average grade of all defects.
The Sewer Physical Condition Grading Protocol (SPCCM) was developed from the second edition of the WRc protocol in 1996 and adapted to the characteristics of some Canadian cities’ sewage collection systems, such as Edmonton [16]. Therefore, the coding method for a defect in SPCCM also consists of two parts like the SRM. However, SPCCM assigns a Deduct Value between 1 and 115 for a defect. Then, the total score, mean score, and peak score of all defects in a pipeline are calculated and compared with the predetermined thresholds of ICGs, and the highest grade determined by the three values is taken as the condition level of the pipeline.
The Technical Specification for Inspection and Evaluation of Urban Sewer (TSIEUR) is an industry standard issued by China in 2012. This protocol was compiled with reference to the relevant standards of Denmark, the UK, and Japan. In TSIEUR, pipeline defects are divided into structural defects and functional defects. A defect is not only given a score of 0.5 to 10 but also a grade of 1 to 4. By calculating the mean score and peak score of all defects in a pipeline and comparing it with the predetermined thresholds, the ICG of the pipeline is determined. However, in TSIEUR, the pipeline condition is graded into four levels, which is different from the above three protocols.
From the above information, it can be seen that the four protocols have different condition assessment methods. In the following, systematical comparisons among these protocols will be conducted qualitatively and quantitatively. The focus of the comparison in this study is on structural defects and their structural condition grades, considering that the main purpose of the current inspection and repair of a sewer pipeline is to protect its structural safety.
3. Results
3.1. Qualitative Comparison of Defects Categories
The sewer condition assessment protocols determine the condition of a pipeline on the basis of different defect categories and the severity of each defect [17]. Qualitative comparisons aim to firstly recognize the same structural defect categories in different protocols through the descriptions provided by each protocol and then to compare the defects’ severities and pipes’ ICGs. For the first purpose, it is essential to find the equivalent definitions of the defect codes in different protocols, considering the fact that the unique function of a protocol is likely to have some structural defects that other protocols do not have. For example, both SRM-4 and PACP define the category of structural defects in brick sewers, but SPCCM and TSIEUR do not define it because there are no brick pipes in Canada and China. In addition to these special cases, each protocol includes the most common structural defect items, such as Crack, Fracture, Broken, Hole, Deformed, Collapsed, Joint, and Surface Damage, but they may have different names in different protocols. Table 1 lists all the structural defect categories contained in the four assessment protocols. There are 26 different structural defect categories in total in the four protocols, including 16 categories in PACP, 13 categories in SRM-4, 11 categories in SPCCM, and 10 categories in TSIEUR. In order to pick out the same defect in different protocols, the detailed definition or description for each structural defect in each protocol was carefully checked. It is found that PACP has the most detailed descriptions. By comparison, equivalent definitions were obtained, and the results are summarized in Table 2. For better understanding, detailed explanations of eight major and common defects are given below:
- Crack. In PACP, a crack is defined as a “visible crack line” on the surface, which is not visibly open. There are four sub-categories in Crack. If the crack is parallel to the joint, it is defined as Circumferential Crack and coded as CC; if the crack is parallel to the pipeline axis, it is defined as Longitudinal Crack and coded as CL; if the position of a single crack changes along the pipeline, it is regarded as Spiral Crack and coded as CS; and, when Circumferential Crack and Longitudinal Crack appear at the same location, they are regarded as Multiple Crack and coded as CM. All these subcategories in PACP have equivalent items in SRM-4. In SPCCM, Circumferential Crack is regarded as Crack Light and coded as CL. Longitudinal Crack and Spiral Crack both are regarded as Crack Moderate and coded as CM. Multiple Crack is regarded as Crack Severe and coded as CS. In TSIEUR, Crack has not been classified as detailed above. According to the defect description, they are equivalent to level I PL in TSIEUR.
- Fracture. In PACP, Fracture means that a clear gap has been formed at the defect but the shape of the pipe has not been affected and no material has fallen off. It can be regarded as a crack that is visibly open. There are also four sub-categories in Fracture. All the Fracture subcategories in PACP have the same equivalent items in SRM-4. In SPCCM, Circumferential Fracture is regarded as Fracture Light. Longitudinal Fracture and Spiral Fracture both are regarded as Fracture Moderate. Multiple Fracture is regarded as Fracture Severe. In TSIEUR, Crack has not been classified as detailed above. According to the defect description, they are equivalent to level Ⅱ PL in TSIEUR.
- Broken. In PACP, Broken refers to a pipe where its pieces are noticeably displaced and have moved from their original position. Both SRM-4 and SPCCM have the same defect category. The level III PL in TSIEUR is similar to the severity of this defect.
- Collapse. In PACP, pipe has collapsed when it completely loses its structural integrity for about 40% of the cross-sectional area and the camera is blocked. SRM-4 has the same defect category. In SPCCM, if a pipe loses 25% of its cross-sectional area, it is a Collapse Pipe. According to the defect description, Collapse can be equivalent to level Ⅳ PL in TSIEUR.
- Deformed. Deformed is one of the most common structural defects in sewers. The four protocols all have such defect definitions and are divided into sub-categories according to the severity of the deformation. According to the descriptions of these sub-categories, they are found to be equivalent in four protocols.
- Surface Damage. Surface damage is also one of the most common defects. The four protocols all have such defects defined to describe the failure and damage of the inner wall of the pipeline. Different from the other three protocols, PACP does not divide the defect according to the severity but describes the causes of these surface damages in detail.
- Joint. In PACP, Joint defects are divided into three categories, including Offset Joint, Separated Joint, and Angular Joint. The Offset Joint and Separated Joint have similar descriptions and definitions in the other three protocols, and their sub-categories are also divided as per defect severity. According to the descriptions of the sub-categories, we found their equivalences in the four protocols.
- Sag. This is a structural defect defined only in TSIEUR and SPCCM. The defect refers to the displacement of a pipe at the joint, which causes the vertical position of the pipe to change and accumulate water at low places.
3.2. Qualitative Comparison of Defect Severities and Pipe ICGs
The condition assessment of a sewer pipe segment includes two basic steps, firstly to assess the severity of each single defect and then to assign the ICG of the pipe. The Deduct Value is a concept firstly proposed in SRM, which is used to describe the severity of a defect and calculate the ICG of a sewer pipe. Four protocols specify different Deduct Value ranges for structural defects, as shown in Table 3. Because the Deduct Value range of each protocol is not the same, the defect severity cannot be directly compared. Therefore, in this study, a new concept defined as the weight of defect which represents the ratio of a defect’s Deduct Value to the maximum value is introduced to make the comparison applicable and easy. Table 4 compares the Deduct Values of the structural defects and their corresponding weights in the four protocols. After the Deduct Value and the condition level of each defect in a pipe are determined, the ICG of the pipe can be calculated according to the structural rating threshold, as shown in Table 5. ICGs are the data that directly reflect the status of the pipe in the condition assessment report [18]. Different protocols use different predetermined thresholds for ICGs. For PACP, the mean Deduct Value is used for determining the ICG of the pipe, SRM-4 uses the peak Deduct Value, while SPCCM uses the mean, peak, and total Deduct Values at the same time. TSIEUR takes the larger of the mean and the peak Deduct Values.
Table 6 shows the ICGs of the four sewer condition assessment protocols, with Grade 1 being the best pipe condition and Grade 5 being the worst. Among them, only TSIEUR divides the structural condition into four grades. The description of Grade 1 in TSIEUR is similar to the description of Grade 1 and Grade 2 in other protocols. Therefore, to facilitate subsequent quantitative comparisons among the four protocols, the obtained assessment results of Grade 1 and Grade 2 as per SRM-4, PACP, and SPCCM will be assigned to be Grade 1.
3.3. Quantitative Comparison of Field Data
The field data utilized in this research were obtained from the company Power-China Huadong Engineering Co., Ltd., which conducted a lot of sewer inspection projects from 2019 to 2021 in Wuhu city in China. In total, 182 sewer pipeline condition assessment reports from the city were collected for the quantitative comparison among protocols. The quantitative comparison is to compare the assessment results of 182 sewer pipes by using the four protocols and to further reveal major reasons causing the differences. Of the 182 sewer segments, 90 segments are sanitary pipes and the other 92 segments are storm-water pipes. Diameters of the pipes range from 300 mm to 800 mm and the pipes’ materials include reinforced concrete and PVC.
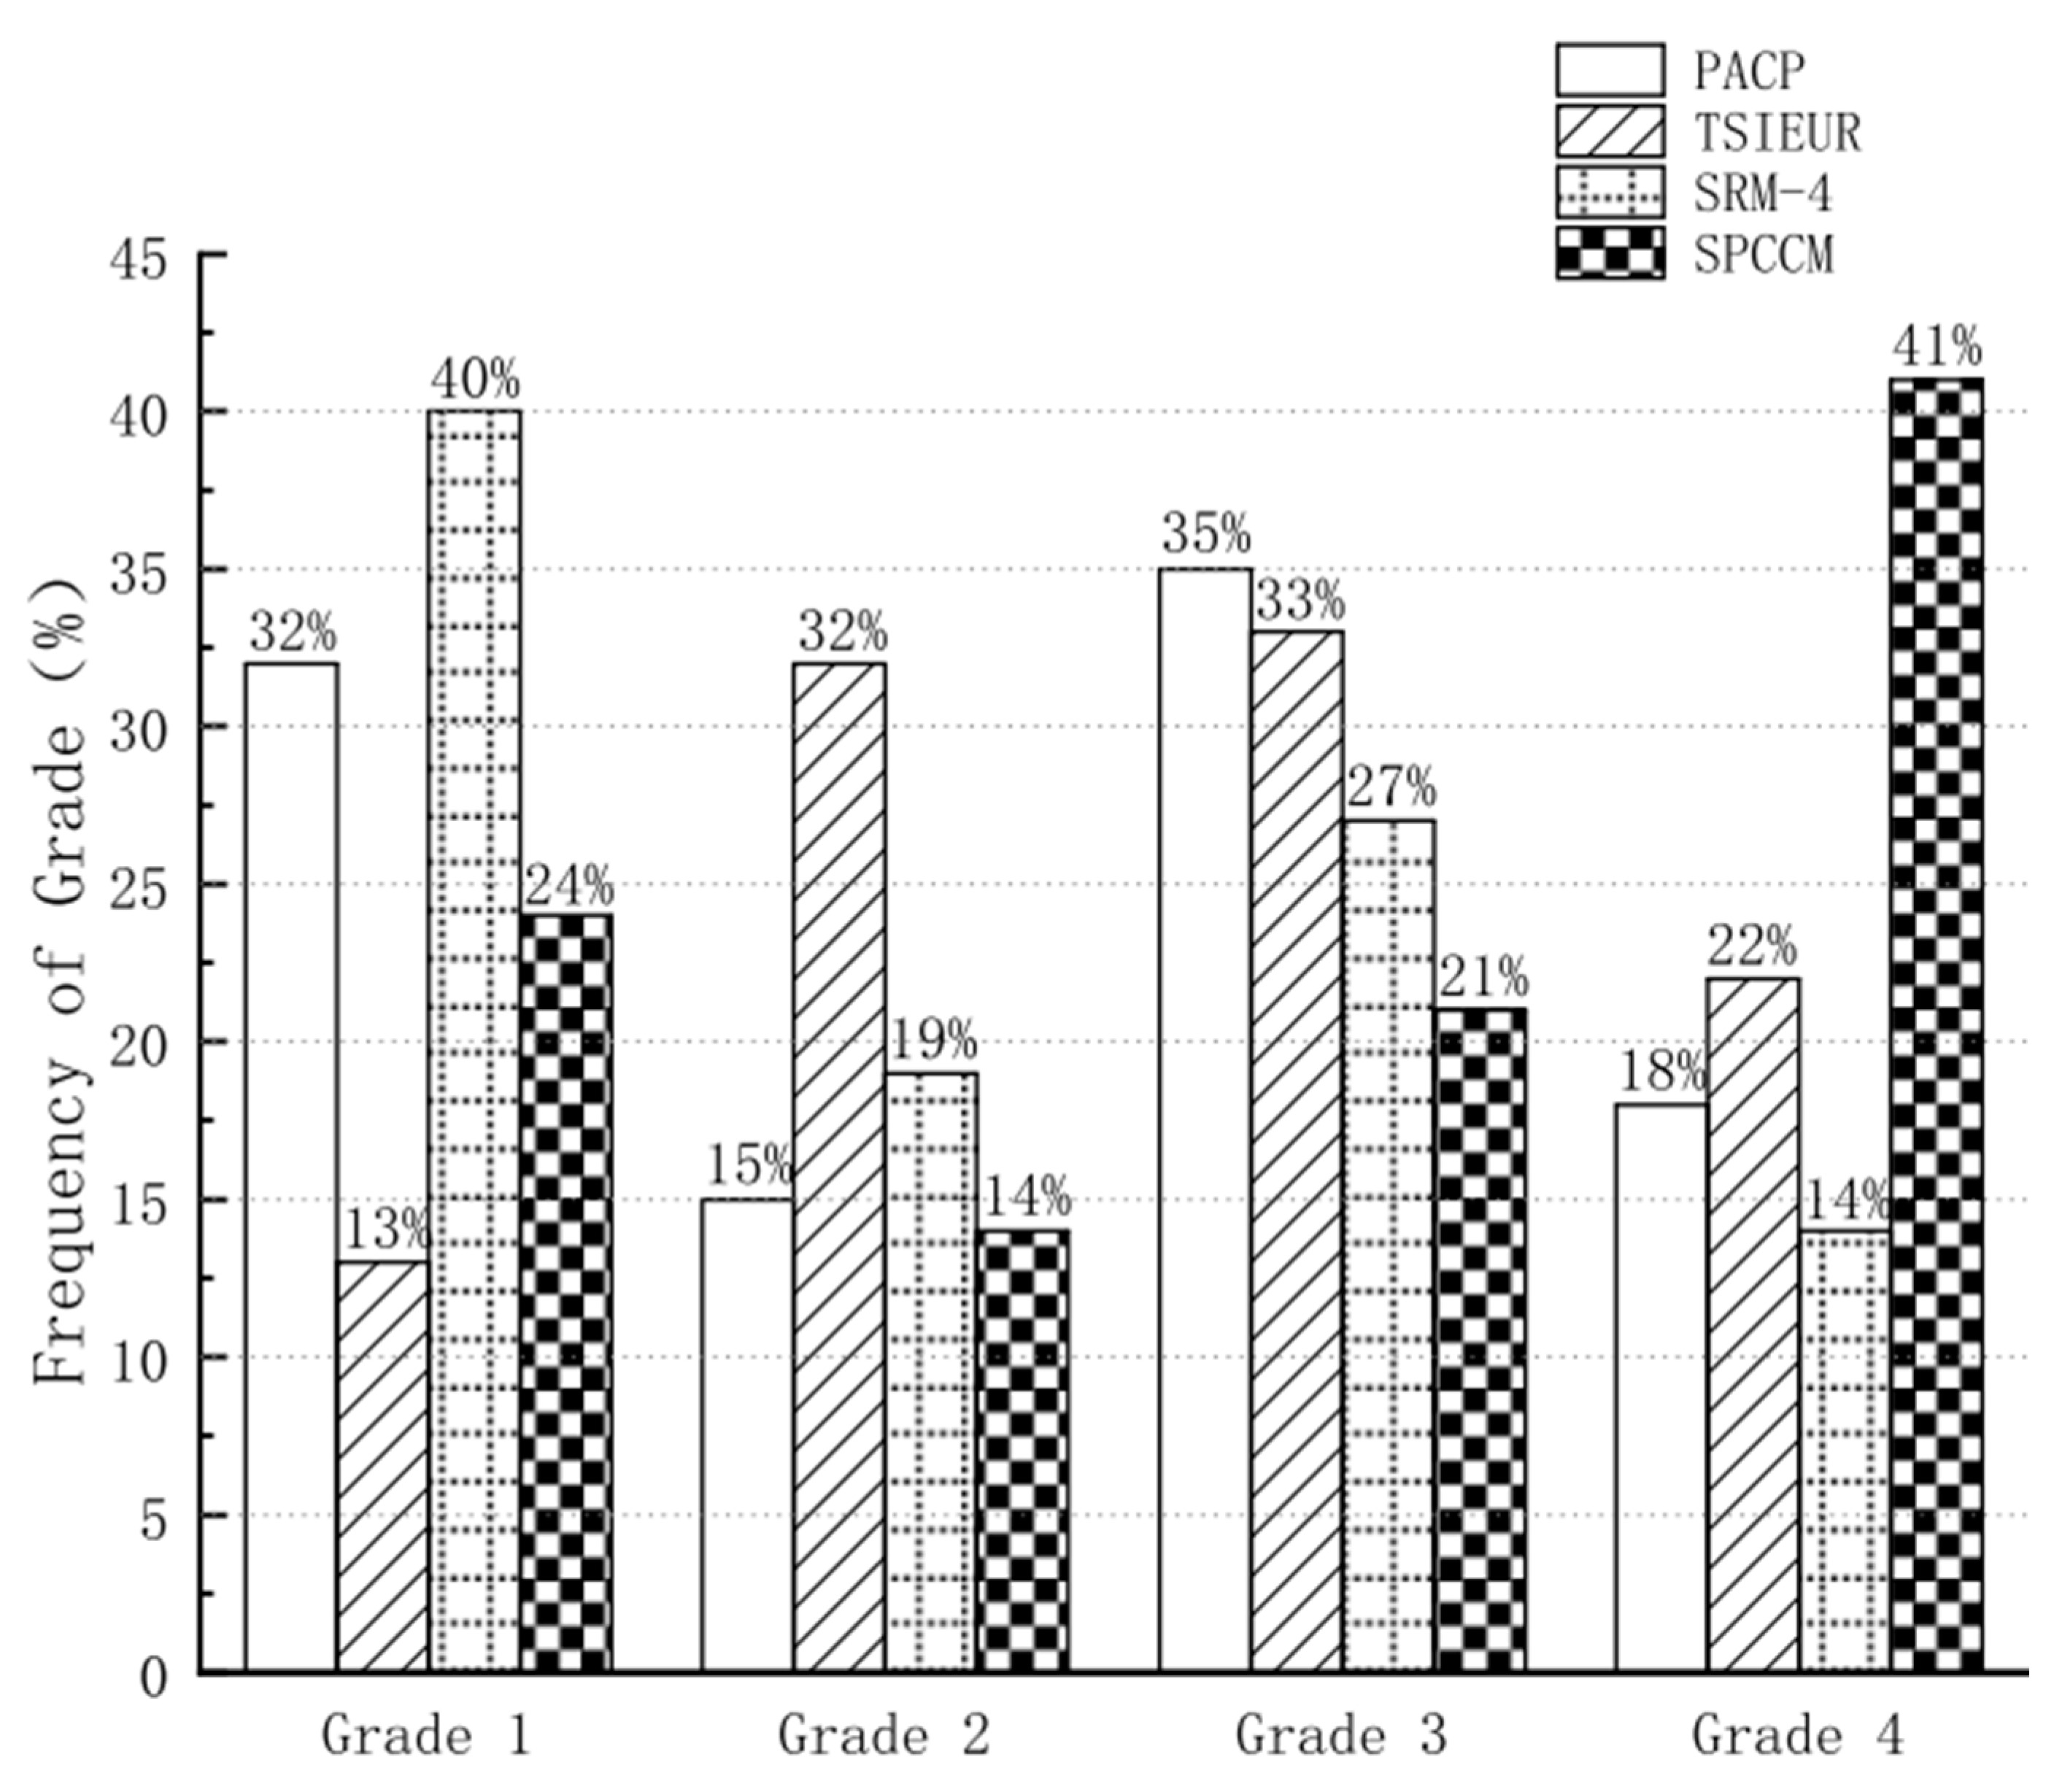
Figure 1 shows the evaluation results on the total 182 segments using the four protocols. According to the evaluation results, it was found that no pipe segment of these 182 segments received the same grade based on the four protocols. To better show the comparison process, Table 7 shows an example of the condition assessment results on the same one pipe segment by the four protocols. The pipeline in the example is a 300 mm sewage pipe with 34.91 m of length. As shown in Table 7, although TEIEUR and PACP both assigned the pipe segment as Grade 3, SRM-4 and SPCCM assigned it as Grade 4.
As shown in Figure 1, most pipes are assigned as Grade 2 (32%) and Grade 3 (33%) as per TSIEUR. However, most pipes are assigned as Grade 1 (32% for PACP and 40% for SRM-4) and Grade 3 (35% for PACP and 27% for SRM-4) by PACP and SRM-4. SPCCM gives the most different evaluation results, with 41% of pipes being Grade 4. In this experiment, the evaluation results obtained from SRM-4 are the most optimistic, with 59% of pipes being Grade 1 and Grade 2, while SPCCM gives the most pessimistic results, with 62% of pipes being Grade 3 and Grade 4. PACP and TSIEUR are in the middle. SRM-4 results show that 40% of the pipes are in good condition and belong to Grade 1, while SPCCM results suggest that 41% are Grade 4 pipes that need rapid repair. These assessment results are different from the results of Khazraeializadeh et al. [9], who found that the assessment results from PACP were most optimistic and the results from SRM-4 and SPCCM were similar. The reasons for the significant differences in the evaluation results of the four protocols are further analyzed and discussed.
4. Discussion
As stated earlier, each protocol may bring some structural defects that other protocols do not have and, thus, may cause assessment results to be different. The selected 182 pipe segments do not have unique structural defects and, therefore, it is not the reason for the different evaluation results.
It is found that the weight of the defect, defined as the ratio of the defect value to the maximum value (Table 4), has important influences on the evaluation results. For the same defect, the weight of the defect in PACP is often higher than the weight in the other three protocols. For example, the defect type of “deformed” will only be assigned Grade 4 or Grade 5 in PACP, and its weight or severity is 80% or 100%. In other protocols, “deformed” has subcategories with lower severity, such as the weight of Deformation Light in SPCCM only being 2%. When these two protocols are used to evaluate the condition of a pipe segment with a slight deformation, it is likely to result in two very different results: PACP evaluates that this pipe needs urgent repair, while SPCCM considers that the repair priority is not high. Actually, SPCCM usually gives less than 10% severity to some low- and medium-severity defects, and it is also the only protocol that does not give a 100% severity for deformations exceeding 10% of the cross-section. From the perspective of deduct values, it is found that PACP is the strictest of the four protocols for the evaluation of a single defect. However, it is not the PACP but the SPCCM that gives the most pessimistic results. This implies that, in addition to the severity of a single defect, there are other factors that affect the ICG results of sewer pipes [19].
PACP uses the mean Deduct Value of all defects to calculate ICG of a pipe segment; this means that, when a pipe has multiple defects, it is easy for a serious defect to be diluted (averaged) by other low-risk defects. This explains why the evaluation results on pipe segments are not so pessimistic (Figure 1), although PACP is the strictest for a single defect among the four protocols. It must be noticed that PACP is the only protocol in which the Deduct Value range coincides with the ICGs (both ranges 1–5), and the dilution phenomenon relies heavily on this fact. When using the peak defect value to determine the pipe’s ICG as in SRM-4, the focus is more on the impact of the worst defect on the pipeline condition and does not encounter the dilution problem. In this experiment, the main reason for the most optimistic evaluation results from SRM-4 is due to its wide Deduct Value range (1–165) with defect scores larger than 80 being regarded as Grade 3 or Grade 4. TSIEUR uses the higher of the mean and peak defect value to obtain the ICG of a pipe. SPCCM uses the mean Deduct Value, the peak value, and the total value, respectively, to compare with predetermined thresholds and take the worst condition as the final ICG evaluation result. Although SPCCM also has a wide Deduct Value range (1–115), it is found that the mean or peak value determines the pipe’s ICG result in most cases due to their narrow predetermined thresholds. As shown in Table 5, when the mean value is beyond 1.5, the ICG results will be Grade 4 at least. And, if the pipe has any defect with a value greater than or equal to 5, SPCCM will assign the pipe’s ICG as Grade 5. This means that, even if the defect weight is only 4% (the ratio of 5 to 115), this Deduct Value is enough to cause the pipe to be regarded as Grade 5. This causes SPCCM to give the most pessimistic evaluation results compared with the other three protocols.
Through the above analysis, it is found that PACP has obvious advantages for at least the following three aspects: (1) it has the most detailed descriptions for each structural defect compared to the other three protocols; (2) compared to SRM-4 and SPCCM, its condition assessment results are not too optimistic or too pessimistic but closer to results of TSIEUR. When updating the next edition of TSIEUR, it can avoid too large differences for asset managers to use. (3) PACP is the only protocol in which the Deduct Value range coincides with the ICGs. Compared to TSIEUR, the five-grade rule is more convenient to use and to compare results with other protocols.
5. Conclusions
In this study, a comparative analysis of four widely used sewer condition assessment protocols, including PACP, TSIEUR, SRM-4, and SPCCM, was conducted. This comparison includes a qualitative analysis of the defect categories, Deduct Values, and assessment methods of the protocols and a quantitative analysis to evaluate 182 real pipe segments in the City of Wuhu, China. The results show that, for the same pipes, the evaluation results of the four protocols are significantly different. The evaluation result of SRM-4 is the most optimistic of the four protocols, while the result of SPCCM is the most pessimistic. The main reasons for the significant difference in results are due to the different weights of defects and evaluation methods used in the four protocols. PACP has been recommended as a reference for asset managers to make new or update protocols in the future due to its obvious advantages.
Author Contributions
Conceptualization, G.C. and S.G.; methodology, G.C.; data resources, J.W.; writing—original draft preparation, G.C.; writing—review and editing, S.G.; visualization, G.C.; supervision, S.G.; project administration, R.H.; funding acquisition, M.L. All authors have read and agreed to the published version of the manuscript.
Funding
This work was supported by the Key Projects of Science and Technology of Anhui Province (funding number: 202003a07020010) and Yangtze Ecology and Environment Co., Ltd. (funding number: HB/AH2021039).
Data Availability Statement
All data, models, and code generated or used during the study appear in the submitted article.
Conflicts of Interest
The authors declare no conflict of interest.
Nomenclature
| CCTV | Closed-Circuit TV |
| ICGs | Internal Condition Grades |
| PACP | Pipeline Assessment and Certification Program |
| QV | Quick View |
| TSIEUR | Technical Specification for Inspection and Evaluation of Urban Sewer |
| SPCCM | Sewer Physical Condition Grading Protocols |
| SRM-4 | The fourth edition of Sewer Rehabilitation Manual |
| WRc | Water Research Center |
References
- Salihu, C.; Hussein, M.; Mohandes, S.R.; Zayed, T. Towards a comprehensive review of the deterioration factors and modeling for sewer pipelines: A hybrid of bibliometric, scientometric, and meta-analysis approach. J. Clean. Prod. 2022, 351, 131460. [Google Scholar] [CrossRef]
- Pan, G.; Wang, B.; Guo, S.; Zhang, W.M.; Edwini-Bonsu, S. Statistical analysis of sewer odour based on 10-year complaint data. Water Sci. Technol. 2020, 81, 1221–1230. [Google Scholar] [CrossRef] [PubMed]
- Chughtai, F.; Zayed, T. Integrating WRc and CERIU Condition Assessment Models and Classification Protocols for Sewer Pipelines. J. Infrastruct. Syst. 2011, 17, 129–136. [Google Scholar] [CrossRef]
- Opila, M.C.; Attoh-Okine, N. Novel Approach in Pipe Condition Scoring. J. Pipeline Syst. Eng. Pract. 2011, 2, 82–90. [Google Scholar] [CrossRef]
- Baranowski, D.; James, F. Developing a Focused CIP to Optimize Resources Using Pipeline Renewal Models. In Pipelines 2019: Condition Assessment, Construction, and Rehabilitation; American Society of Civil Engineers: Reston, VA, USA, 2019; pp. 140–149. [Google Scholar]
- Tade, O.; O’Neill, S.; Smith, K.G.; Williams, T.; Ali, A.; Bayyati, A.; See, H. Modified sewer asset management to accommodate london’s future sustainable development. Struct. Surv. 2019, 37, 22–41. [Google Scholar] [CrossRef]
- Sami, D. Defect-Based Condition Assessment Model and Protocol of Sewer Pipelines. Master’s Thesis, Department of Building, Civil and Environment Engineering, Concordia University, Montreal, QC, Canada, 2015. [Google Scholar]
- Khazraeializadeh, S. A Comparative Analysis on Sewer Structural Condition Grading Systems Using Four Sewer Condition Asssement Protocols. Master’s Thesis, Department of Civil and Environmental Engineering, University of Alberta, Edmonton, AB, Canada, 2012. [Google Scholar]
- Li, Y.F.; Wang, H.X.; Dang, L.M.; Song, H.K.; Moon, H. Vision-Based Defect Inspection and Condition Assessment for Sewer Pipes: A Comprehensive Survey. Sensors 2022, 22, 2722. [Google Scholar] [CrossRef] [PubMed]
- Phyu, H.E.; Khaodhiar, S. Inspection and Understanding of Sewer Network Condition in Dindaeng District, Bangkok, Thailand. Appl. Environ. Res. 2021, 43, 46–59. [Google Scholar] [CrossRef]
- Khazraeializadeh, S.; Gay, L.F.; Bayat, A. Comparative analysis of sewer physical condition grading protocols for the City of Edmonton. Can. J. Civ. Eng. 2014, 41, 811–818. [Google Scholar] [CrossRef]
- Shin, H.; Han, S.; Hwang, H. Comparison of two sewer condition assessment protocols in S. Korea. Desalination Water Treat. 2016, 57, 29384–29392. [Google Scholar] [CrossRef]
- WRC (Water Research Center). Manual of Sewer Condition Classification; Water Research Centre: Swindon, UK, 2004. [Google Scholar]
- Irvin, G. Pipeline assessment and certification program. In New Pipeline Technologies, Security, and Safety; ASCE Press: Baltimore, MD, USA, 2003; pp. 822–825. [Google Scholar]
- Vladeanu, G.; Matthews, J. Wastewater Pipe Condition Rating Model Using Multicriteria Decision Analysis. J. Water Resour. Plan. Manag. 2019, 145, 04019058. [Google Scholar] [CrossRef]
- Transportation Department, Drainage Engineering Section. Sewer Physical Condition Classification Manual; Transportation Department, Drainage Engineering Section: Edmonton, AB, Canada, 1996. [Google Scholar]
- Daher, S.; Zayed, T.; Elmasry, M.; Hawari, A. Determining Relative Weights of Sewer Pipelines’ Components and Defects. J. Pipeline Syst. Eng. Pract. 2018, 9, 04017026. [Google Scholar] [CrossRef]
- Khan, Z.Z.; Ayed, T.; Moselhi, O. Structural Condition Assessment of Sewer Pipelines. J. Perform. Constr. Facil. 2010, 24, 170–179. [Google Scholar] [CrossRef]
- Altarabsheh, A.; Mario, V.; Amr, K. New approach for Critical Pipe Prioritization in Wastewater Asset Management Planning. Am. Soc. Civ. Eng. 2018, 32, 04018044. [Google Scholar] [CrossRef]
Figure 1.
ICG results on 182 pipe segments based on the four protocols.


Table 1.
Categories of structural defects in the four protocols.
| Categories of Structural Defects | PACP | SRM-4 | SPCCM | TSIEUR |
|---|---|---|---|---|
| Crack | Y | Y | Y | N |
| Fractured | Y | Y | Y | N |
| Broken | Y | Y | Y | N |
| Hole | Y | Y | Y | N |
| Pipe Failures (Silent) | Y | N | N | N |
| Collapse | Y | Y | Y | N |
| PoLie | N | N | N | Y |
| Surface Crack | Y | Y | N | N |
| Spalling | Y | Y | N | N |
| Wear | Y | Y | N | N |
| Surface Damage | Y | N | Y | N |
| FuShi | N | N | N | Y |
| Deformed | Y | Y | Y | Y |
| Joint | Y | Y | Y | N |
| CuoKou | N | N | N | Y |
| TuoJie | N | N | N | Y |
| Weld Failure | Y | Y | N | N |
| TuoLuo | N | N | N | Y |
| Point (Defective) Repair | Y | Y | N | N |
| Brick | Y | Y | N | N |
| Lining Failure | Y | N | Y | N |
| Sag | N | N | Y | Y |
| External Pipe | N | N | Y | Y |
| ChuanRu | N | N | N | Y |
| ShenLou | N | N | N | Y |
| Total Number | 16 | 13 | 11 | 10 |
Notes: Y means “yes”, N means “no” in TSIEUR, and Polie can represent four categories of defects, including Crack, Fracture, Broken, and Collapse; FuShi can represent Surface Damage and Wear; TuoLuo can represent Surface Damage and Broken; CuoKou represents some sub-categories of Joint; Tuojie represents some sub-categories of both Joint and Sag; ChuanRu means Broken or Surface Damage which has caused lateral intrusion; ShenLou means Crack or Joint which has caused infiltration to happen.
Table 2.
Equivalent definitions of structural defects in the four protocols.
| PACP | SRM-4 | SPCCM | TSIEUR | ||||
|---|---|---|---|---|---|---|---|
| Code | Definition | Code | Definition | Code | Definition | Code | Definition |
| CC | Circumferential Crack | CC | Crack Circumferential | CL | Crack Light | PL | PLⅠ |
| CL | Longitudinal Crack | CL | Crack Longitudinal | CM | Crack Moderate | ||
| CS | Spiral Crack | CS | Crack Spiral | CM | Crack Moderate | ||
| CM | Multiple Crack | CM | Crack Multiple | CS | Crack Severe | — | — |
| FC | Circumferential Fracture | FC | Fracture Circumferential | FL | Fracture Light | PL | PLⅡ |
| FL | Longitudinal Fracture | FL | Fracture Longitudinal | FM | Fracture Moderate | ||
| FS | Spiral Fracture | FS | Spiral Fracture | FM | Fracture Moderate | ||
| FM | Multiple Fracture | FM | Multiple Fracture | FS | Fracture Severe | — | — |
| B | Broken | B | Broken | FX | Broken | PL | PLⅢ |
| X | Collapse | X | Collapse | XP | Collapse Pipe | PL | PLⅣ |
| D (<10%) | Deformed | D (0–5%) | Deformed | DL | Deformation Light | BX | BianXingⅠ |
| DL | Deformation Light | BianXingⅡ | |||||
| D (5–10%) | DM | Deformation Moderate | BianXing Ⅲ | ||||
| D (≥10%) | D (>10%) | DS | Deformation Severe | BianXing Ⅳ | |||
| — | Surface damage | SWS | Surface Wear Slight | HL | Surface Damage Light | FS | FuShiⅠ |
| SWM | Surface Wear Moderate | HM | Surface Damage Moderate | FuShiⅡ | |||
| SWL | Surface Wear Large | HS | Surface Damage Severe | FuShi Ⅲ | |||
| JOM | Joint Offset Medium | JDM | Joint Displaced Medium | JM | Joint Displaced Moderate | CK | CuoKouⅠ |
| CuoKouⅡ | |||||||
| JOL | Joint Offset Large | JDL | Joint Displaced Large | JS | Joint Displaced Severe | CuoKou Ⅲ | |
| JDSV | Joint Displaced Soil Visible | CuoKou Ⅳ | |||||
| JSM | Joint Separated Medium | OJM | Open Joint Medium | OL | Open Joints Light | TJ | TuoJie Ⅰ |
| TuoJie Ⅱ | |||||||
| JSL | Joint Separated Large | OJL | Open Joint Large | OM | Open Joints Moderate | TuoJie Ⅲ | |
| OJSV | Open Joint Soil Visible | OS | Open Joints Severe | TuoJie Ⅳ | |||
| —— | —— | —— | —— | SL | Sags Light | QF | QiFuⅠ |
| SM | Sags Moderate | QiFuⅡ | |||||
| SS | Sags Severe | QiFu Ⅲ | |||||
| QiFu Ⅳ | |||||||
Table 3.
Ranges of the Deduct Value for all structural defects from the four protocols.
| Protocol | PACP | SRM-4 | SPCCM | TSIEUR |
|---|---|---|---|---|
| Deduct Value Range | 1–5 | 1–165 | 1–115 | 0.5–10 |
Table 4.
Comparison of Deduct Values and weight for equivalent structural defects in the four protocols.
Table 4.
Comparison of Deduct Values and weight for equivalent structural defects in the four protocols.
| Definition | PACP | SRM-4 | SPCCM | TSIEUR | ||||
|---|---|---|---|---|---|---|---|---|
| Value | Weight | Value | Weight | Value | Weight | Value | Weight | |
| Circumferential Crack | 1 | 20% | 10 | 6% | 1 | 1% | 0.5 | 5% |
| Longitudinal Crack | 2 | 40% | 10 | 6% | 2 | 2% | ||
| Spiral Crack | 2 | 40% | 40 | 24% | 2 | 2% | ||
| Multiple Crack | 3 | 60% | 40 | 24% | 4 | 3% | —— | —— |
| Circumferential Fracture | 2 | 40% | 40 | 24% | 2 | 2% | 2 | 20% |
| Longitudinal Fracture | 3 | 60% | 40 | 24% | 4 | 3% | ||
| Spiral Fracture | 3 | 60% | 80 | 48% | 4 | 3% | ||
| Multiple Fracture | 4 | 80% | 80 | 48% | 5 | 4% | —— | —— |
| Broken | 5 | 100% | 80 | 48% | 110 | 96% | 5 | 50% |
| Collapse | 5 | 100% | 165 | 100% | 115 | 100% | 10 | 100% |
| Deformed | 4 | 80% | 20 | 12% | 2 | 2% | 1 | 10% |
| (<10%) | 2 | 20% | ||||||
| 80 | 48% | 4 | 3% | 5 | 50% | |||
| Deformed | 5 | 100% | 165 | 100% | 100 | 87% | 10 | 100% |
| (≥10%) | ||||||||
| Surface damage | 2 | 40% | 5 | 3% | 1 | 1% | 0.5 | 5% |
| 4 | 80% | 20 | 12% | 2 | 2% | 2 | 20% | |
| 5 | 100% | 120 | 73% | 4 | 3% | 5 | 50% | |
| Joint Offset Medium | 1 | 20% | 1 | 1% | 3 | 3% | 0.5 | 5% |
| 2 | 20% | |||||||
| Joint Offset Large | 2 | 40% | 2 | 1% | 100 | 87% | 5 | 50% |
| 80 | 48% | 10 | 100% | |||||
| Joint Separated Medium | 1 | 20% | 1 | 1% | 1 | 1% | 1 | 10% |
| 2 | 20% | |||||||
| Joint Separated Large | 2 | 40% | 2 | 1% | 2 | 2% | 5 | 50% |
| 165 | 100% | 5 | 4% | 10 | 100% | |||
| Sag | —— | —— | —— | —— | 1 | 1% | 0.5 | 5% |
| 2 | 2% | 2 | 20% | |||||
| 20 | 17% | 5 | 50% | |||||
| 10 | 100% | |||||||
Table 5.
Structural rating thresholds of the four protocols.
| ICG | PACP | SRM-4 | SPCCM | ICG | TSIEUR | ||
|---|---|---|---|---|---|---|---|
| Mean | Peak | Total | Mean | Peak | Mean/Peak | ||
| 1 | 1 | <10 | <100 | <0.5 | <1.0 | 1 | ≤1 |
| 2 | 2 | 10–39 | 100–149 | 0.5–0.99 | 1.0–2.0 | ||
| 3 | 3 | 40–79 | 150–199 | 1.0–1.49 | 2.1–3.0 | 2 | 1–3 |
| 4 | 4 | 80–164 | 200–249 | 1.5–2.49 | 3.1–5.0 | 3 | 3–6 |
| 5 | 5 | ≥165 | ≥250 | ≥2.5 | ≥5.0 | 4 | >6 |
Table 6.
Internal conditional grades (ICGs) of the four protocols.
| Protocol | Internal Conditional Grade | ||||
|---|---|---|---|---|---|
| PACP | 1 | 2 | 3 | 4 | 5 |
| SRM-4 | 1 | 2 | 3 | 4 | 5 |
| SPCCM | 1 | 2 | 3 | 4 | 5 |
| TSIEUR | 1 | 1 | 2 | 3 | 4 |
Table 7.
Example of the condition assessment results on the same one pipe segment by four protocols.
Table 7.
Example of the condition assessment results on the same one pipe segment by four protocols.
| No. | Start (m) | End (m) | Clock Description | Defect code | Deduct Value | ||||||
|---|---|---|---|---|---|---|---|---|---|---|---|
| TSIEUR | PACP | SRM-4 | SPCCM | TSIEUR | PACP | SRM-4 | SPCCM | ||||
| 1 | 2.67 | 3.44 | 0012 | PLⅡ | FC | FC | FM | 2 | 3 | 40 | 4 |
| 2 | 6.16 | 7.12 | 0011 | PLⅡ | FC | FC | FM | 4 | 3 | 120 | 4 |
| 3 | 6.17 | 7.24 | 1101 | PLⅡ | FC | FC | FM | 6 | - | 4.28 | |
| 4 | 7.24 | 11.7 | 0805 | PLⅡ | FS | FS | FM | 2 | 15 | 80 | 17.84 |
| 5 | 14.07 | 18.44 | 0001 | PLⅡ | FS | FS | FM | 2 | 15 | 40 | 17.84 |
| 6 | 18.44 | 19.51 | 1212 | CKⅡ | JOM | JDM | JS | 4.5 | 1 | 1 | 3 |
| 7 | 18.38 | 18.38 | 0812 | CRⅠ | - | - | - | - | - | - | |
| 8 | 18.99 | 20.12 | 1204 | PLⅡ | FC | FC | FM | 3 | 40 | 4 | |
| 9 | 22.36 | 23.36 | 1204 | PLⅡ | FC | FC | FM | 2 | 3 | 40 | 4 |
| 10 | 24.18 | 26.38 | 0012 | PLⅡ | FS | FS | FM | 2 | 9 | 40 | 8.8 |
| Internal Condition Grade (ICG) | 3 | 3 | 4 | 4 | |||||||
Disclaimer/Publisher’s Note: The statements, opinions and data contained in all publications are solely those of the individual author(s) and contributor(s) and not of MDPI and/or the editor(s). MDPI and/or the editor(s) disclaim responsibility for any injury to people or property resulting from any ideas, methods, instructions or products referred to in the content. |
© 2023 by the authors. Licensee MDPI, Basel, Switzerland. This article is an open access article distributed under the terms and conditions of the Creative Commons Attribution (CC BY) license (https://creativecommons.org/licenses/by/4.0/).
Share and Cite
MDPI and ACS Style
Cao, G.; Guo, S.; Wei, J.; Huang, R.; Li, M. Comparison of Four Sewer Condition Assessment Protocols Based on Field Data. Water 2023, 15, 3790. https://doi.org/10.3390/w15213790
AMA Style
Cao G, Guo S, Wei J, Huang R, Li M. Comparison of Four Sewer Condition Assessment Protocols Based on Field Data. Water. 2023; 15(21):3790. https://doi.org/10.3390/w15213790
Chicago/Turabian StyleCao, Guangxue, Shuai Guo, Jun Wei, Rongmin Huang, and Mei Li. 2023. "Comparison of Four Sewer Condition Assessment Protocols Based on Field Data" Water 15, no. 21: 3790. https://doi.org/10.3390/w15213790
Note that from the first issue of 2016, this journal uses article numbers instead of page numbers. See further details here.