Article

Genetic Diversity and Population Structure of the Asian Tiger Mosquito (Aedes albopictus) in Vietnam: Evidence for Genetic Differentiation by Climate Region

1
Department of Environmental Science and Ecological Engineering, College of Life Sciences, Korea University, Seoul 02841, Korea
2
Korean Entomological Institute, College of Life Sciences, Korea University, Seoul 02841, Korea
3
Department of Applied Zoology, Faculty of Biology, VNU University of Science, Vietnam National University, Hanoi 100000, Vietnam
*
Author to whom correspondence should be addressed.
Genes 2021, 12(10), 1579; https://doi.org/10.3390/genes12101579
Submission received: 23 August 2021 / Revised: 27 September 2021 / Accepted: 5 October 2021 / Published: 6 October 2021
(This article belongs to the Special Issue Evolutionary Genetics and Phylogenetics of Mosquito Species)

Abstract

:
Aedes albopictus is a native mosquito to Southeast Asia with a high potential for disease transmission. Understanding how Ae. albopictus populations that develop in the species’ native range is useful for planning future control strategies and for identifying the sources of invasive ranges. The present study aims to investigate the genetic diversity and population structure of Ae. albopictus across various climatic regions of Vietnam. We analyzed mitochondrial cytochrome oxidase I (COI) gene sequences from specimens collected from 16 localities, and we used distance-based redundancy analysis to evaluate the amount of variation in the genetic distance that could be explained by both geographic distance and climatic factors. High levels of genetic polymorphism were detected, and the haplotypes were similar to those sequences from both temperate and tropical regions worldwide. Of note, these haplotype groups were geographically distributed, resulting in a distinct population structure in which northeastern populations and the remaining populations were genetically differentiated. Notably, genetic variation among the Ae. albopictus populations was driven primarily by climatic factors (64.55%) and to a lesser extent was also influenced by geographic distance (33.73%). These findings fill important gaps in the current understanding of the population genetics of Ae. albopictus in Vietnam, especially with respect to providing data to track the origin of the invaded regions worldwide.

1. Introduction

Within its native range of Southeast Asia, the Asian tiger mosquito Aedes albopictus (Skuse, 1894) is a tree hole-dwelling zoophilic species [1]. However, during the last few decades, the species has rapidly expanded into a variety of ecological niches in both tropical and temperate regions of the Americas, Africa, and Europe [2], facilitated mainly by international trade and travel [3,4]. Furthermore, the species’ ability to reproduce in domestic containers and to undergo diapause during unfavorable climatic conditions are additional characteristics that have allowed Ae. albopictus to survive unfavorable conditions or novel environments [5]. Interestingly, the capacity for photoperiodic diapause is only found in Ae. albopictus populations in temperate regions, while tropical populations are active all year round [6,7]. Several population genetic studies have suggested the existence of genetic differentiation between distant temperate and tropical populations [8,9,10,11], it remains unclear whether the two groups are genetically differentiated in the species’ native range.
As one of the world’s most medically important vectors, the species is capable of transmitting many arboviruses, including dengue, chikungunya, and Zika [1,12,13,14,15]. Owing to the absence of effective arbovirus vaccines or treatments, the prevention of most mosquito-borne diseases relies predominantly on the reduction of vector populations [16], and effective control strategies can be guided by information about vector species’ population genetics, including sink and source populations, current and future population dynamics, and population scale [17]. However, even though many studies have investigated the population genetics of Ae. albopictus, few have included samples from the species’ native range (i.e., southeast Asia), and for this reason, little is known about the origin of invasive populations.
Additionally, recent studies have demonstrated that geographic distance is not the only factor that affects gene flow. Indeed, the population structure may also be affected by environmental factors, either alone or in conjunction with geographic distance [18]. In particular, major climate factors such as temperature and precipitation are known to affect Ae. albopictus dispersal [19]. However, few, if any, studies have investigated the associations between the species’ genetic variation and the effects of geographic distance and climatic factors.
Vietnam is known as one of the native ranges of Ae. albopictus and is suspected as the source of documented invasions into several tropical nations, including Cameroon, Brazil, and Madagascar [20,21,22]. Thus, investigating the population genetics of the species in Vietnam is essential to improving the current understanding of the geographic origins of past invasions and, thus, to facilitate the development of control strategies. Furthermore, Vietnam has a tropical monsoon climate, but northern Vietnam is influenced by the northeast monsoon and experiences a temperate or subtropical climate, whereas southern Vietnam typically experiences a tropical climate [23]. Moreover, due to the effects of natural mountainous boundaries and monsoon activities, Vietnam’s climate can be separated into seven climatic regions [24]. Aedes albopictus occurs throughout Vietnam [25] and is adapted to a variety of environments, which could potentially cause gradual changes in the morphology, behavior, and genetics of respective populations [26]. Given those conditions, Vietnam is an ideal land to examine the effects of climatic heterogeneity to genetic variation and population structure of Ae. albopictus. In addition, Vietnam has always ranked among the countries most heavily affected by mosquito-borne diseases [27,28,29,30]. Dengue fever, which is the most serious disease transmitted by Aedes aegypti (Linnaeus, 1762) and Ae. albopictus, represents a major threat to both the public health and economy of Vietnam [31,32]. Given the value of population genetic information for establishing vector control programs, the genetic analysis of Ae. albopictus populations is essential to managing the further spread of dengue fever in Vietnam. However, the genetic availability of Ae. albopictus populations in its native range in Vietnam has not been conducted yet.
The present study aims to evaluate the variability of mitochondrial cytochrome oxidase I (COI) gene sequences from Ae. albopictus populations in Vietnam, to investigate the population structure of the species among temperate and tropical regions, and to evaluate the role of geographic distance and climatic factors in determining genetic differentiation. The study’s findings are expected to improve the current understanding of the geographic origins of recent Ae. albopictus invasions and to provide evidence for ongoing gene flow restriction between the species’ temperate and tropical populations. The implications of these findings for mosquito control in Vietnam are also discussed.

2. Materials and Methods

2.1. Insect Materials

From June to October 2019, mosquito specimens were collected from 16 sites that were distributed across a north–south transect in Vietnam (Figure 1A, Table S1) and that were associated with seven climatic regions: northwest (NW), northeast (NE), north delta (ND), north central coast (NC), south central coast (SC), central highlands (CH), and the south (S) [24].
At each site, larvae and/or adult mosquitoes (irrespective of sex) were collected from a variety of habitats, including domestic containers, discarded tires and containers, bonsai tanks, flowerpots, and tree holes. Adults were collected using aspirators and larvae were collected using a small net and forceps. Larvae were either allowed to mature under laboratory conditions or preserved in absolute ethanol in the field. All specimens were initially identified morphologically using taxonomic keys [33] and were then stored in absolute alcohol at −20 °C for subsequent genetic analysis. To avoid the analysis of siblings, only one or two specimens of neither adult nor larva from each source at individual sites were used for genotyping. Special permissions were not required for the collection of mosquitoes at any of the sites, and in the case of private residential areas, permission was obtained from owners before entry.

2.2. DNA Extraction and Sequencing

Total genomic DNA was extracted from two or three legs from each adult specimen or from muscle tissue from the abdomen (segments II–VI) of each larval (4th instar) specimen. The DNA was extracted using a DNeasy Blood & Tissue Kit (Qiagen, Hilden, Germany), following manufacturer instructions, and was then stored at −20 °C. A 658-bp fragment of COI was amplified using the AccuPower PCR PreMix kit (Bioneer Co., Daejeon, South Korea) and a previously published universal primer pair (LCO1490: 5′-GGTCAACAAATCATAAAGATATTGG-3′; HCO2198: 5′-TAAACTTCAGGGTGACCAAAAAATCA-3′) [34]. The 20 μL reactions were subject to the following conditions: 95 °C for 2 min; followed by 35 cycles of 95 °C for 30 s, 48–50 °C for 30 s, and 72 °C for 30 s; and a final extension step of 72 °C for 2 min.
Amplification was confirmed by electrophoresis using 1.5% agarose gels and visualization under UV light, and the validated PCR products were then purified and sequenced using an ABI Prism Sequencer 3130 (Applied Biosystems, Foster City, CA, USA). The resulting sequences of both directions (reverse and forward) were aligned and edited using MEGA v.7 [35] and were checked manually to ensure correct alignment along codons.

2.3. Genetic Diversity and Demographic History

The number of COI haplotypes (available on GenBank, ID: MZ573312-MZ573376) and genetic diversity indices, including haplotype diversity (Hd) and nucleotide diversity (π), were estimated using DnaSP v. 6.12.03 [36]. Meanwhile, the demographic signatures, selective histories, and both Tajima’s D [37] and Fu’s Fs [38] were calculated for each population using ARLEQUIN v. 3.5.2.2 [39], with population expansion signatures inferred using significance values that were calculated by generating 1000 random samples. Finally, to investigate the demographic history, pairwise mismatch distributions were inferred using a population growth-decline model in DnaSP v. 6.12.03 [36].

2.4. Haplotype Network Analysis

A minimum-spanning tree was generated using ARLEQUIN and then used to construct a haplotype network (HAPSTAR v.0.7), which was optimized using InkScape v. 0.92.4 (https://inkscape.org/ accessed on 19 July 2020). To gain a broader understanding of genetic relationships between populations from Vietnam and those from other parts of the world, the sequence dataset was also compared to other available Ae. albopictus COI sequences, which were identified using the basic local alignment search tool (BLAST) from GenBank (http://blast.ncbi.nlm.nih.gov/ accessed on 23 August 2020; Table S2). All the compared sequences were trimmed to be totally matched with sequences in our study (658-bp fragment of COI).

2.5. Population Differentiation and Structure

Pairwise genetic differentiation (FST) among populations was estimated using differences in haplotype frequencies, and sequential Bonferroni correction was used to adjust the significance levels in ARLEQUIN.
To infer the geographic structure of Ae. albopictus populations in Vietnam, principal coordinates analysis (PCoA) of FST values was performed, and GENALEX v.6.5 [40] was used for visualization. In addition, hierarchical analysis of molecular variance (AMOVA) was performed, using ARLEQUIN, to test several specific biogeographic hypotheses that relied on the spatial distribution of haplotypes, FST, climatic separation [24] and urbanization classification [41]. Statistical significance was assessed according to the degree of differentiation among regions (ΦCT), among populations within regions (ΦSC), and within populations (ΦST) using permutation tests with 1000 random permutations. Moreover, spatial analysis of molecular variance (SAMOVA) was applied to further determine the genetic and geographic clusters of homogeneous populations [42]. The number of clusters (K) was assessed by simulating a range of K values, from 1 (no genetic differentiation among all sites) to 16 (all sites are genetically differentiated from one another), with 1000 simulated annealing steps from each of the 100 sets of initial starting conditions. SAMOVA also generates F-statistics (ΦSC, ΦST, ΦCT) using the AMOVA approach to maximize between-group variation.

2.6. Effect of Geography and Climate on Genetic Variation

Distance-based redundancy analysis (dbRDA) [43] was used to examine the effects of geographic distance and climatic factors on patterns of population genetic variation. The 16 sample sites were used as spatial units, and pairwise FST values were used as a measure of genetic differentiation. A genetic distance matrix was used as a response variable, and geographic distance and climatic variables were used as explanatory variables. Geographic distance was transformed using third-order polynomials, and spatial variables that retained three spatial components were used for subsequent analyses. A total of 19 climatic variables related to temperature and precipitation, which are the most influential to this species’ biology and distribution [19], were obtained from the WorldClim database (www.worldclimate.com accessed on 23 August 2020). The most explanatory factors were selected, and collinearity variables were minimized using the principal component analysis (PCA) and Pearson’s correlation. Global dbRDA was then performed between FST and selected spatial and climatic variables (Figure S1, Table S3; Equation (1)).
FST ~ climate (bio2+bio3+bio8+bio10+bio11+bio14+bio18+bio19)
~ geography (geo1+geo2+geo3)          
The best model was selected using a stepwise approach that optimized the model by considering the Akaike information criterion (AIC). Condition tests were conducted to detect the individual effect of either climates or geographic distance on genetic variation. Variance components of dbRDA were then partitioned by running two models: (1) a partial model in which geography explains genetic data conditioned on climatic variables and (2) a reciprocal model in which climatic variables explain genetic data conditioned on geography [44]. The total variance (Inertia), proportion of the variation explained (% variation), and P-values are presented for each model.
The isolation-by-distance hypothesis was also tested using Mantel’s test based on the regression of pairwise FST/(1 − FST) on the natural logarithm (Ln) of straight-line geographic distance [45] (Table S4). Mantel’s test and dbRDA analyses were performed using the VEGAN package in R [44].

3. Results

3.1. Genetic Diversity

COI sequences were generated for a total of 236 Ae. albopictus specimens in 16 localities in Vietnam (Table 1 and Table S1). Fifty-nine of the 658 sites were variable (26 parsimonious informative and 33 singleton), and 65 haplotypes were identified, with a range of seven to 11 haplotypes per population (Table 1). The haplotype diversity was relatively high, with a mean of 0.9020 and range of 0.7714 (S06) to 0.9429 (S01), but estimates of nucleotide diversity were relatively low, with a mean of 0.0033 and range of 0.0019 (S06) to 0.0042 (S08; Table 1).
The evaluation of population expansion yielded significant negative values when all populations were pooled in a single data set (Tajima’s D = −2.3206, P < 0.001; Fu’s Fs = −26.8672, P < 0.001). All Fu’s Fs values, except that for S13, were also significant and negative. However, the Tajima’s D values were non-significant and negative values for all but four sites (S04, S06, S08, and S12; Table 1). The distributions of pairwise differences for the overall population were unimodal and the best fit of equilibrium distributions (Figure S2). Thus, the null hypothesis of a constant-size population under the neutral model was rejected for almost all localities.

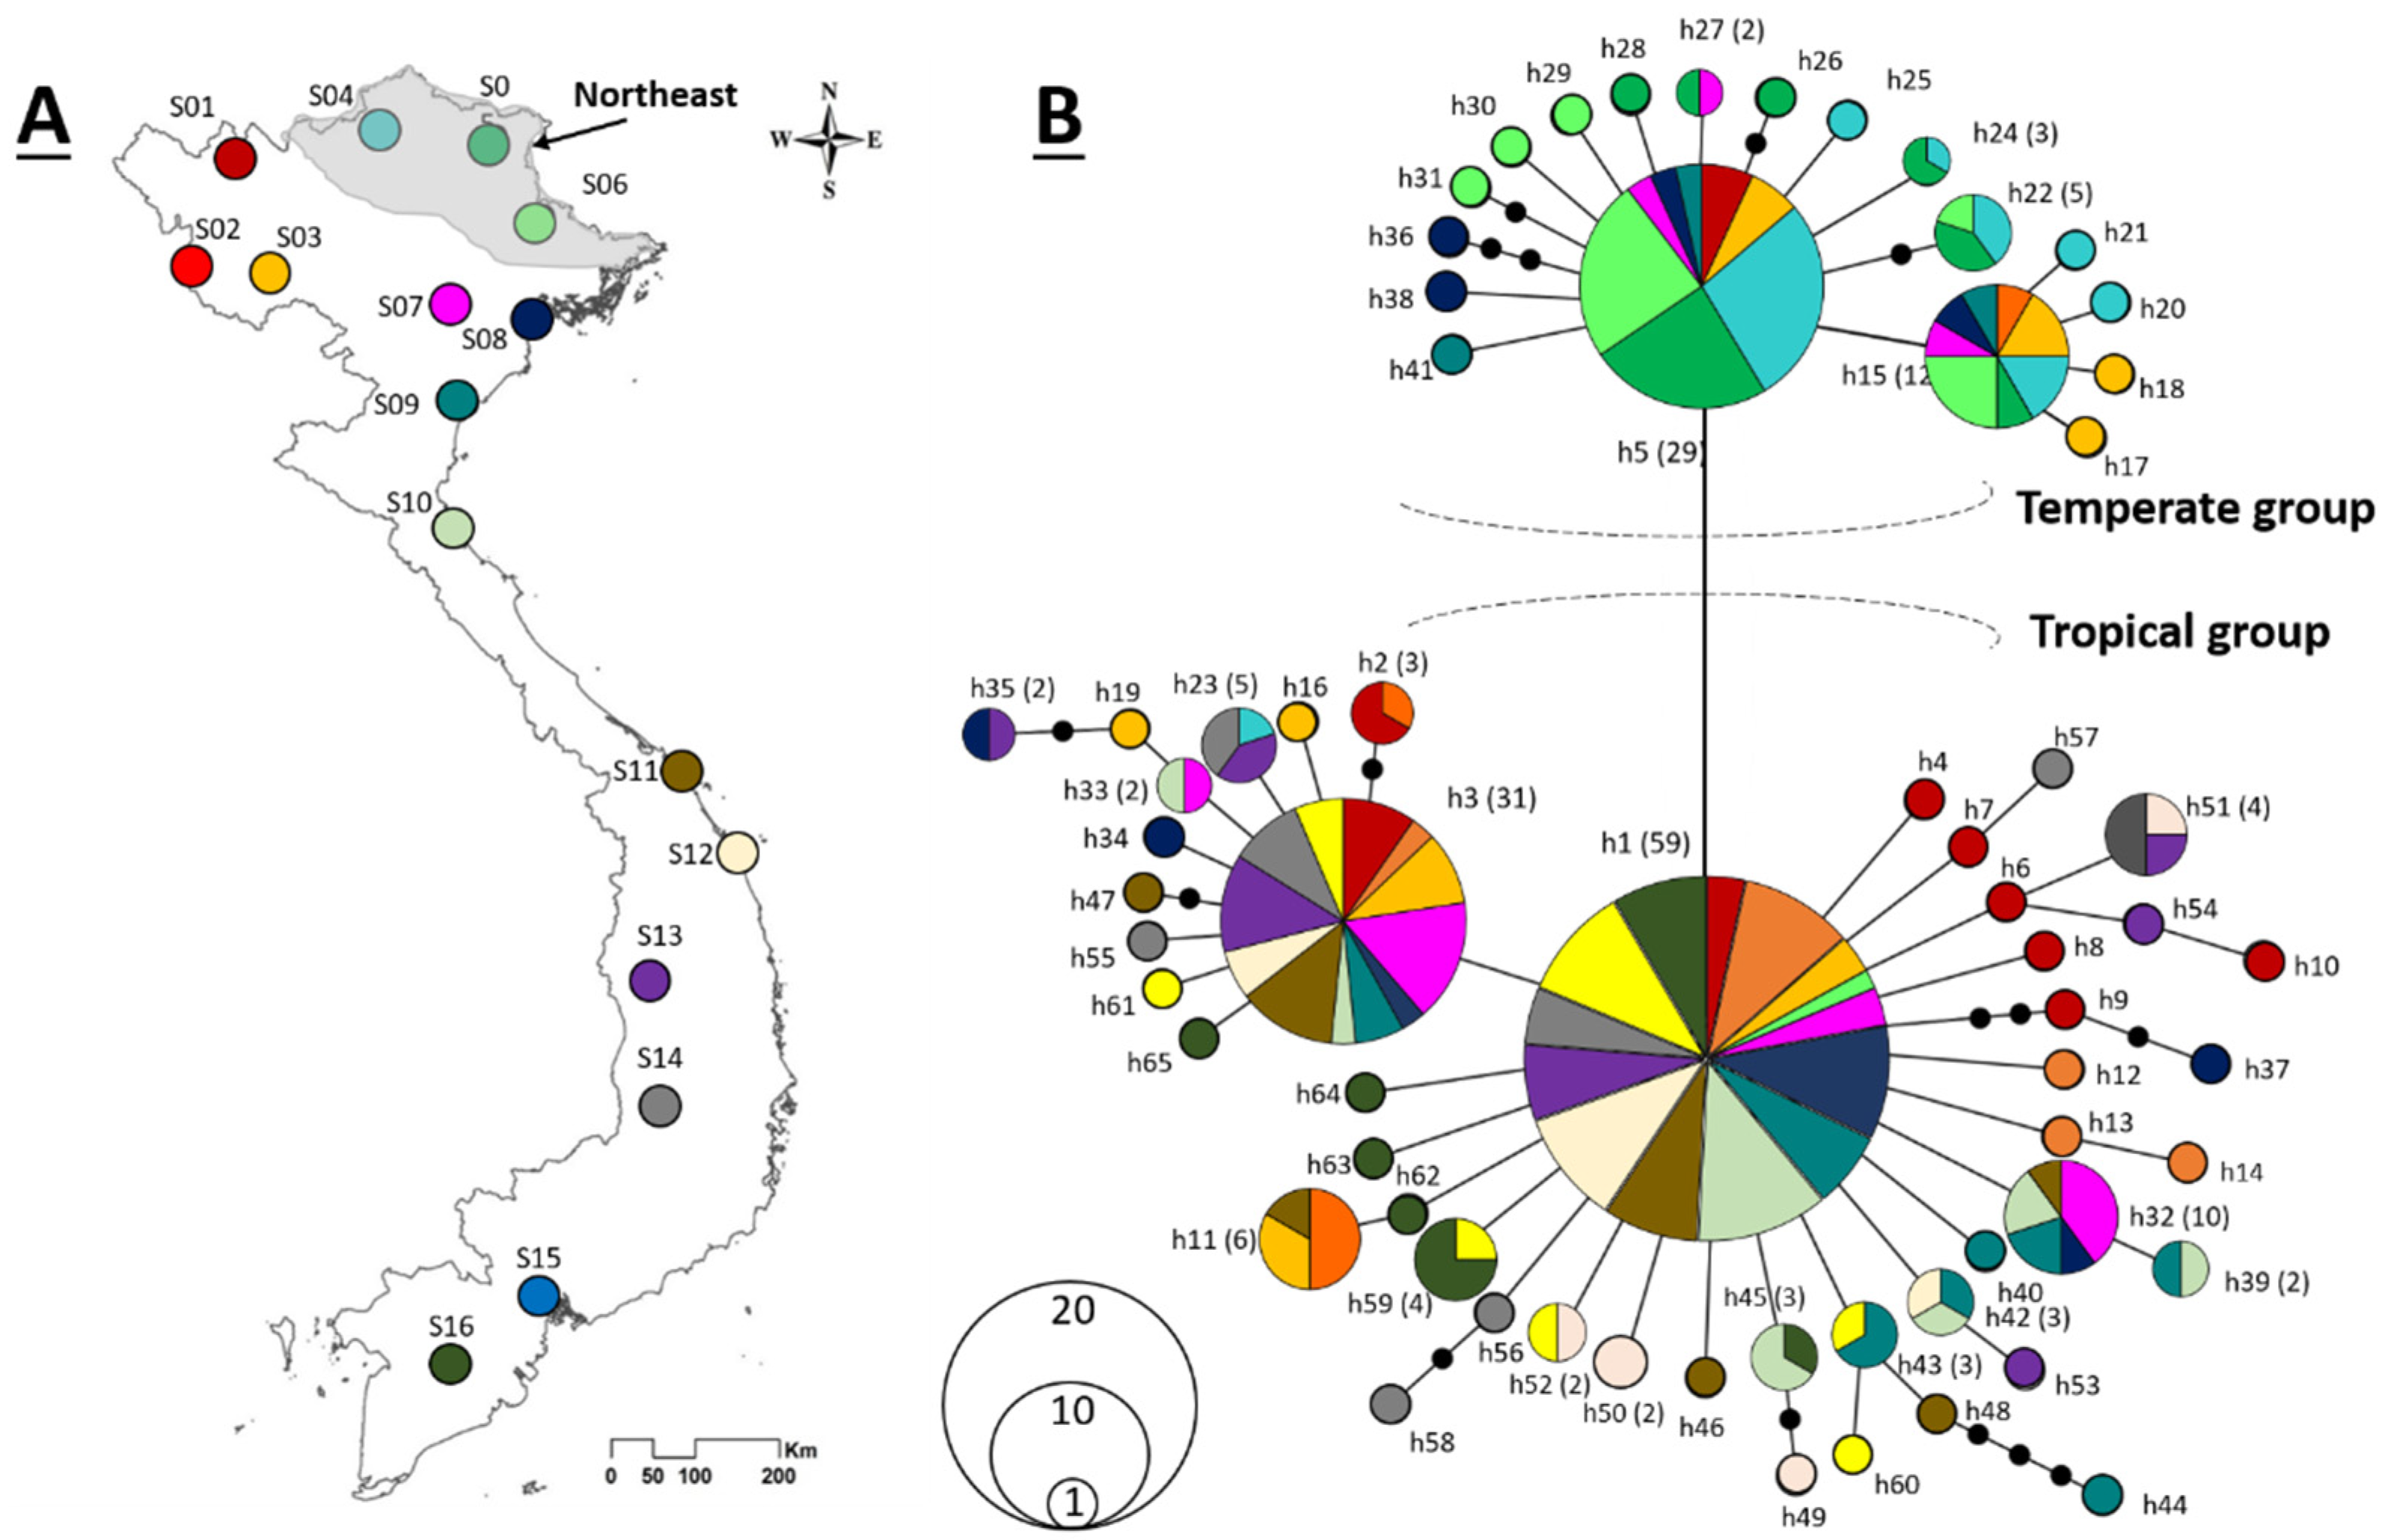
3.2. Haplotype Network

In the minimum-spanning network, the 65 haplotypes were separated by one to four mutational steps. Each of the three dominant haplotypes (H1, H3, and H5) was surrounded by closely related haplotypes, thus forming a ‘star-shape’ (Figure 1B), and a single-step mutation separated H1 from the two other dominant haplotypes (H3 and H5). The central haplotype (H1) accounted for 59 (25%) of the sampled specimens and was recovered from all the sample sites, except S04 and S05. The haplotype was also rare (one occurrence) in the specimens from S06, thereby making the haplotype H1 rare in the NE region. Meanwhile, H3 accounted for 31 (13.1%) of the sampled specimens and was totally absent from samples from the NE region (S04, S05, S06), and H5 accounted for 29 (12.3%) of the sampled specimens and was limited to northern Vietnam, with almost all individuals (n = 22, 75.9%) being sampled from the NE region. In addition, 45 (69.2%) of the 65 haplotypes were singletons, being represented by single specimens (Figure 1B).
Comparison to the 578 matching COI sequences obtained from GenBank revealed that the majority of the 65 haplotypes from Vietnam were novel, with only 15 being shared with sequences originating in other countries (Table S2). However, it is worth noting that a large number of individuals (149/236) belonged to one of the shared haplotypes. Interestingly, the shared haplotypes included sequences that were associated with either temperature or tropical regions of the world. More specifically, H5 and its descendants (H15, H17, H18, H27, H30, and H36) were mainly derived from temperate localities (i.e., China, USA, Italy, Portugal, Russia, and Canada), whereas H1, H3, and their descendants (H13, H16, H40, H43, H50, and H59) were more often reported from tropical localities (i.e., Malaysia, Thailand, India, Singapore, Brazil, and Colombia; Table S2). Therefore, it was concluded that the haplotype network included two genetically distinct groups, with H5 and its descendants belonging to a temperate group and H1, H3, and their descendants belonging to a tropical group (Figure 1B).

3.3. Genetic Differentiation and Population Structure

After correcting for multiple tests with the Bonferroni correction method, 66 out of 120 tests were statistically significant, with a mean FST value of 0.0991 and range of −0.0333 to 0.4346, thereby suggesting some degree of structuring among the populations (Table S4). The maximum difference was observed between S05 and S15, whereas the minimum difference was observed between S04 and S06. Interestingly, all comparisons among the NE populations (S04, S05, S06) were significant, with moderate to very high FST values (0.1361 to 0.4346), whereas comparisons among the remaining populations yielded low and rarely significant FST values (−0.0190 to 0.1647, Table S4).
The spatial structure of Ae. albopictus populations in Vietnam is supported by several analyses. The distribution of haplotypes exhibited a latitudinal pattern and could be separated into three geographic regions (Figure 2A), which were characterized as containing mainly temperate haplotypes (Region 1), an admixture region with mainly tropical haplotypes (Region 2), and all tropical haplotypes (Region 3; Figure 2A). PCoA analysis consistently indicated a distinct structure between the NE (S04, S05, S06) and remaining populations (Figure 2B), and spatial structure was further supported by the SAMOVA analysis (Figure 2C). Indeed, ΦCT values decreased when populations were divided into smaller groups (from K = 2 to K = 16), and the greatest ΦCT value was detected when populations were clustered into two groups (K = 2, P < 0.0001).
Furthermore, hierarchical analyses of molecular variance (AMOVA) also revealed significant geographic structuring among the 16 populations, with statistical support for almost all biogeographic hypotheses (Table 2). One strongly supported hypothesis was that the NE and remaining populations are significantly different (ΦCT = 0.2914, P < 0.001). The separation of populations into three groups that corresponded to the three haplotype regions (Figure 2B) was also supported (ΦCT = 0.1836, P <0.0001), as was the separation of populations into seven groups that corresponded to climatic regions (ΦCT = 0.1599, P < 0.001). Finally, the separation of populations into three groups that were randomly selected among regions based on the urbanization level of each sample site (ΦCT = 0.0323, P = 0.1329; Table 2) was not significant.

3.4. Effect of Geography and Climate on Genetic Variation

In comparison to the full model (Equation (1)), the best and final models were those that retained bio8 (mean temperature of wettest quarter), bio11 (mean temperature of coldest quarter), and geo3 (geographic component).
The db-RDA of the best model indicated that geographic distance and climatic factors together explained 75.98% of the total genetic variation among Ae. albopictus populations (AIC: −30.93, P = 0.001; Table 3). Partial tests indicated that single climatic factors could explain more variance than geographic distance alone (64.55% compared to 33.73%), and when controlling the effects of geographic distance and climate, conditional testing further supported the conclusion that climate was a stronger predictor of genetic differentiation than geographic distance (42.25% compared to 11.42%; Table 3).
The ordination plot of the best model indicated that the mean temperature of the coldest quarter (bio11) was the most explanatory variable for the separation of NE populations (S04, S05, S06) from the other populations (Figure 3). In addition, the correlation between genetic and geographic distance (Mantel’s test) revealed a low but significant pattern of isolation-by-distance (Pearson’s coefficient of correlation [r] = 0.242, P 0.034; Figure S3).

4. Discussion

Even though Ae. albopictus is native to Vietnam and its impacts have been reported for several decades, the current study provides the first comprehensive investigation of the genetic variation and population structure of Ae. albopictus in Vietnam. The results reveal high genetic diversity with an admixture of temperate and tropical haplotypes, as well as an apparent population structure that is mainly determined by climatic differences. The current study’s findings are able to inform future vector control strategies in the country.
The genetic diversity of Ae. albopictus in Vietnam is relatively high (65 haplotypes) and is higher than almost all previous estimates for either native or invasive Ae. albopictus populations around the world (Table S5), which likely reflects that Vietnam is one of the ancestral distribution areas of Ae. albopictus. For many species, the place of origin can be associated with the region of highest genetic diversity [46,47]. Moreover, the higher genetic diversity of populations in Vietnam could also be explained by our large population size collected across Vietnam because it is expected that species with larger geographic ranges will harbor more genetic diversity [48]. Indeed, we have sampled in many climatic regions in different landscapes (mountains, delta, and coastline) and in a large number of habitats in each locality (artificial and natural containers; Table S1). Furthermore, the species’ genetic diversity could be augmented by the presence of multiple haplotype groups (i.e., temperate and tropical). Notably, the two haplotype groups observed in Vietnam (Figure 1B) correspond to the two most prevalent haplogroups in the world, specifically, the A1a (temperate region) and A1b (tropical region) haplotypes reported by Battaglia et al. [49] by the detection of diagnostic mutations at np 1820. The co-occurrence of two worldwide genetic clusters in Vietnam is in agreement with the result that has been reported in a population genomic study of Ae. albopictus [50]. Though both haplotype groups coexist, whether Ae. albopictus in Vietnam responds for source of both temperate and tropical regions globally is uncertain. However, considering the high affiliation between Vietnamese haplotypes to not only tropical haplotypes but also temperate haplotypes from many geographical regions worldwide (Table S2) suggests the genetic data in this study could be useful for tracking the origin of the worldwide invasions. For instance, the previous studies have found a monophyletic group of the Brazilian population suggesting a single source from a tropical region in Southeast Asia, but the exact place was not tracked due to the insufficient sampling in the region [49,50]. Based on genetic data in the current study, we found two major haplotypes (H1 and H5) that have also been reported in Brazil (KX383924 and MK575475, respectively), whose similarities may suggest one of invasion pathways for Ae. albopictus populations in the country (Table S2).
It is noteworthy that the occurrence of haplogroups marginally influenced the estimated genetic diversity in each region in Vietnam. Specifically, genetic diversity was greatest in the contact region (Region 2; Hd = 0.903, π = 0.0034), which harbored both the temperate and tropical haplotypes, followed by Region 3 (Hd = 0.8308, π = 0.0025), which harbored only tropical haplotypes, and then Region 1 (Hd = 0.760, π = 0.0022), which harbored mainly temperate haplotypes. The results of the present study suggest a new perception of the accessing level of genetic diversity in a certain region, which is not higher in tropical or temperate regions, but in a region of contact between them, such as the several northern localities (Region 2) of Vietnam (Figure 2, Table 1). It could be important information to identify the potential distribution of genetic groups of this species worldwide, especially in invaded regions, but larger samples from either native or invaded regions would be needed. However, all samples in this study were collected only in urban areas, and investigation in other landscapes including rural and mountainous areas may give a better evaluation of the genetic diversity level for the country. Furthermore, though the COI gene is widely used as an efficient genetic marker in many population genetic studies of Ae. albopictus to provide valuable insight into genetic variability in a novel area [9,10,11,21,51,52,53,54,55,56], further investigations utilizing other nuclear DNA markers such as simple sequence repeat (SSR) markers and single nucleotide polymorphism (SNPs) are encouraged to validate the present study’s results.
Interestingly, some previous studies revealed little or no differentiation between Ae. albopictus populations in native ranges such as in South-East Asia (China, Thailand, and Japan) using microsatellite loci [57] or studies using COI gene in northern Asia [54] or in Cambodia [10], the present study on the other hand provides multiple lines of evidence that support a geographic separation in Ae. albopictus populations in Vietnam. Particularly, the analyses in the current study clearly revealed a regional clustering of temperate and tropical haplotype groups that can be evidenced by the geographical distribution of haplotype groups (Figure 2A), and the PCoA plot (Figure 2B), SAMOVA tests (Figure 2C), and hierarchy AMOVA (Table 2). The population structure may reflect the current restriction of gene flow between temperate and tropical populations in Vietnam, in which the temperate haplotype group was found only above 19 °N, whereas the tropical haplotype group occurred more more in the southern regions (Figure 2A). Of note, the distinct population structure between temperate and tropical populations in the current study were separated by a single mutation, indicating a low genetic divergence among subpopulations. A plausible explanation for this phenomenon might be due to Ae. albopictus populations in each region having undergone a recent expansion range of major haplotypes, followed by the radiation of unique haplotypes. It can be clearly seen in the haplotype network that haplotypes H1 and H3 were dominant in almost all populations in Regions 2 and 3, whereas haplotype H5 was dominant in populations in Region 1, but in both cases, the dominant haplotypes were surrounded by many unique haplotypes (Figure 1B).
It is obvious that geographical distance must be an important barrier to dispersal preventing genetic exchange of individuals between populations. Thus, previous studies have reported the effects of geographic distance on the genetic structure of Ae. albopictus populations [9,10,55]. However, the present study reveals for the first time the joint effects of both geographic distance and climatic factors on the genetic diversity of Ae. albopictus populations. Based on the results of dbRDA analyses, the observed variation was driven more by climatic factors (42.25%) than by geographical distance (11.42%; Table 3). The mean temperature of the coldest quarter (bio11) directly explained the distinct separation of the NE populations (S04, S05, S06) from the rest of the populations (Figure 3). The NE region is a particularly mountainous area (Table 1) that is annually affected by the northeast monsoon winds from China and that is bordered by the Gulf of Tonkin and Hoang Lien Son mountain range to the east and west, respectively [58]. As a result, the region occasionally experiences snowfall and hoarfrost freezing during winter and is colder and drier in winter than other areas within the same latitudinal belt [24,58,59,60]. Given the periodic harsh weather conditions in the NE region, Ae. albopictus populations are likely to undergo photoperiodic diapause to survive winter conditions, and the cold winter climate may cause an annual bottleneck event that prevents successful inhabitants of the non-diapause population in the NE region. Previous studies have demonstrated the unsuccessful long-term colonization of tropical strains of mosquito species Wyemyia smithii (Coquillett, 1901) that were translocated to temperate regions or of temperate populations that were subjected to tropical conditions [61,62]. The effect of cold temperature on the Ae. albopictus population was also reported by Zhong et al. [11], who found that the elimination of early introduced tropical genotypes by temperate ones within a period of 10 years of temporary colonization of tropical populations in Los Angeles, United States of America. Therefore, the genetic distinction between the NE region and the remaining region in this study is likely consistent with variation in ecophysiological traits (photoperiodic diapause and cold tolerance of eggs) since those traits are adaptive keys affecting both temporal and spatial abundance [63] and that enhance the adaptability of Ae. albopictus to colonize temperate environments [7]. Extensive studies of differentially expressed genes in various mosquito life stages has also revealed many distinctive differences in the gene expression and, thus, physiological processes of diapause and non-diapause populations [64,65]. It is noteworthy that some evidence has been revealed for the differences between northern and southern Ae. albopictus populations in Vietnam. For instance, Ae. albopictus specimens from northern Vietnam (Hanoi) are able to undergo diapause [66] and possess wing morphometrics that are more similar to those of specimens from other temperate areas (Korea, Japan) than to those of specimens from southern Vietnam [67]. The genetic structure related to ecophysiological traits (photoperiodic diapause) has also been reported between tropical and temperate regions in both invasive and native ranges worldwide [50]. However, future studies investigating the diapause ability of Ae. albopictus subpopulations in Vietnam are encouraged, perhaps using translocation experiments, to validate the findings of the present study.
Moreover, the maintenance of restricted gene flow by climatic factors could promote successful invasion from other environments by the effects of climate change (e.g., global warming) since adaptation under rapid environmental change is likely unnecessary [18]. In this context, non-diapausing tropical populations of Ae. albopictus are more likely to extend their ranges to the north because the effects of global warming could limit the range of the temperate zone [18]. In the present study, two haplotypes from the tropical group (H1 in S06 and H23 in S04) occurred in the NE region, which suggested an ongoing process of northward invasion, perhaps as a result of global warming. Surveillance on spatiotemporally genetic change of Ae. albopictus populations in wider ranges (both native and invasive regions) is encouraged to further assess the effects of climate change to the species’ genetic variation.
The findings of the present study regarding the population genetics of Ae. albopictus may improve predictions of vector-borne disease outbreaks and facilitate the development of dengue mosquito control in Vietnam. High levels of genetic diversity were observed in both the temperate and tropical Ae. albopictus populations and especially in the admixture population (Region 2; Figure 2A). Genetic diversity is considered a critical raw material for environmental adaptation and evolutionary capacity and promotes the establishment of new populations in uninhabited areas [18]. Therefore, the high genetic diversity of Ae. albopictus in Vietnam may allow them to resist changes in environmental conditions, pesticide resistance, or increase the likelihood of invasion success. A distinct population structure requires a specific control method for each subpopulation. Indeed, the success of biological control, in particular, requires the intensive selection of suitable biocontrol agents [7]. Moreover, the use of genetic modification to disrupt the diapause of mosquitoes could be effective for reducing temperate Ae. albopictus populations but would not affect populations in the tropics. The present study’s robust evidence for recent population expansion in Vietnam may indicate the consequences of urbanization [68], which has created diverse habitats for Ae. albopictus [69] or may suggest less efficient control methods [17].

5. Conclusions

Currently, the genetic variability among climatic regions of Ae. albopictus population in Vietnam is unknown. The present study of Ae. albopictus populations in Vietnam revealed high genetic diversity with evidence for the admixture of gene pools from temperate and tropical populations, thereby suggesting Vietnam could be an important original source for invaded areas globally. Interestingly, an uncovered population structure between these phenotypic strains of Ae. albopictus was found in a native range in Vietnam. The present study also revealed that the genetic variation observed among populations in Vietnam depended heavily on climatic factors, and to a lesser extent, geographic distance. These findings enrich the current understanding of the genetic diversity and population structure of Ae. albopictus in its native range and possibly allow for a better understanding of the worldwide invasion scenario. However, further studies conducted in larger areas and using different genetic markers are needed to validate our conclusions.

Supplementary Materials

The following are available online at https://www.mdpi.com/article/10.3390/genes12101579/s1, Figure S1. Principal component analysis of 19 bioclimatic variables. Variables are defined in Table S3. The quality of representation of the variables was indicated by a gradient color; Figure S2. Mismatch distribution of Aedes albopictus populations in Vietnam. The solid and dashed lines represent the observed and expected (under expansion) distributions of pairwise differences between mtDNA haplotypes, respectively; Figure S3. Correlation between the geographic and genetic distances of Aedes albopictus populations from Vietnam; Table S1. Collection information of Aedes albopictus samples from Vietnam; Table S2. Comparison of Aedes albopictus haplotypes from around the world; Table S3. Correlations between various bioclimatic variables; Table S4. Pairwise genetic (FST, below the diagonal) and geographic distances (km, above the diagonal) for Aedes albopictus populations in Vietnam; Table S5. Genetic differentiation of Aedes albopictus populations in Vietnam.

Author Contributions

Conceptualization, C.-V.D.; J.-H.K.; V.-V.N., and Y.-J.B.; software and visualization, C.-V.D. and J.-H.K.; writing—original draft preparation, C.-V.D.; writing—review and editing, C.-V.D., J.-H.K.; V.-V.N., and Y.-J.B. All authors have read and agreed to the published version of the manuscript.

Funding

This research was funded by a National Research Foundation of Korea (NRF) grant (2020R1C1C1007098) from the Basic Science Research Program funded by the Ministry of Science, ICT & Future Planning to J.H.K. This study was also supported by a Special Research Grant from Korea University.

Institutional Review Board Statement

Not applicable.

Data Availability Statement

Not applicable.

Acknowledgments

We are grateful to Hieu Viet Ho (Duy Tan University, Danang, Vietnam) and Thao Thi Thanh Dang (Quang Ngai, Vietnam) for assistance in specimen collection, and to members of the Lab of Biodiversity and Ecology (Korea University, Seoul) and Korean Entomological Institute (Korea University, Seoul) for assistance in managing project logistics.

Conflicts of Interest

The authors declare no conflict of interest.

References

  1. Paupy, C.; Delatte, H.; Bagny, L.; Corbel, V.; Fontenille, D. Aedes albopictus, An arbovirus vector: From the darkness to the light. Microbes Infect. 2009, 11, 1177–1785. [Google Scholar] [CrossRef]
  2. Caminade, C.; Medlock, J.M.; Ducheyne, E.; McIntyre, K.M.; Leach, S.; Baylis, M.; Morse, A.P. Suitability of European climate for the Asian tiger mosquito Aedes albopictus: Recent trends and future scenarios. J. R. Soc. Interface. 2012, 9, 2708–2717. [Google Scholar] [CrossRef] [Green Version]
  3. Hawley, W.A.; Reiter, P.; Copeland, R.S.; Pumpuni, C.B.; Craig, G.B. Aedes albopictus in North America: Probable introduction in used tires from northern Asia. Science 1987, 236, 1114–1116. [Google Scholar] [CrossRef]
  4. Scholte, E.J.; Schaffner, F. Waiting for the tiger: Establishment and spread of the Asian tiger mosquito in Europe. Emerg. Pests Vector-Borne Dis. Eur. 2007, 14, 241–261. [Google Scholar]
  5. Urbanski, J.M.; Benoit, J.B.; Michaud, M.R.; Denlinger, D.L.; Armbruster, P. The molecular physiology of increased egg desiccation resistance during diapause in the invasive mosquito, Aedes albopictus. Proc. R. Soc. B. Biol. Sci. 2010, 277, 2683–2692. [Google Scholar] [CrossRef] [PubMed] [Green Version]
  6. Estrada-Franco, J.G.; Craig, G.B. Biology, relationships, and control of Aedes albopictus. Pan. Am. Health Org. Tech. Pap. 2002, 42, 1–61. [Google Scholar]
  7. Hawley, W.A. The biology of Aedes albopictus. J. Am. Mosq. Control. Assoc. Suppl. 1988, 1, 1–39. [Google Scholar]
  8. Birungi, J.; Munstermann, L.E. Genetic structure of Aedes albopictus (Diptera: Culicidae) populations based on mitochondrial ND5 sequences: Evidence for an independent invasion into Brazil and United States. Ann. Entomol. Soc. Am. 2006, 95, 125–132. [Google Scholar] [CrossRef]
  9. Maynard, A.J.; Ambrose, L.; Cooper, R.D.; Chow, W.K.; Davis, J.B.; Muzari, M.O.; Hurk, A.F.; Hall-Mendelin, S.; Hasty, J.M.; Burkot, T.R.; et al. Tiger on the prowl: Invasion history and spatio-temporal genetic structure of the Asian tiger mosquito Aedes albopictus (Skuse 1894) in the Indo-Pacific. PLoS Negl. Trop. Dis. 2017, 11, e0005546. [Google Scholar] [CrossRef]
  10. Motoki, M.T.; Fonseca, D.M.; Miot, E.F.; Demari-Silva, B.; Thammavong, P.; Chonephetsarath, S.; Phommavanh, N.; Hertz, J.C.; Kittayapong, P.; Brey, P.T.; et al. Population genetics of Aedes albopictus (Diptera: Culicidae) in its native range in Lao People’s Democratic Republic. Parasites Vectors 2019, 12, 1–12. [Google Scholar] [CrossRef]
  11. Zhong, D.; Lo, E.; Hu, R.; Metzger, M.E.; Cummings, R.; Bonizzoni, M.; Fujioka, K.K.; Sorvillo, T.E.; Kluh, S.; Healy, S.P.; et al. Genetic analysis of invasive Aedes albopictus populations in Los Angeles County, California and its potential public health impact. PLoS ONE 2013, 8, 1–9. [Google Scholar] [CrossRef] [PubMed] [Green Version]
  12. Gratz, N.G. Critical review of the vector status of Aedes Albopictus. Med. Vet. Entomol. 2004, 18, 215–227. [Google Scholar] [CrossRef] [PubMed]
  13. Rezza, G. Aedes albopictus and the reemergence of Dengue. BMC Public Health 2012, 12, 1–3. [Google Scholar] [CrossRef] [PubMed] [Green Version]
  14. McKenzie, B.A.; Wilson, A.E.; Zohdy, S. Aedes albopictus is a competent vector of Zika virus: A meta-analysis. PLoS ONE 2019, 14, e0216794. [Google Scholar] [CrossRef] [PubMed] [Green Version]
  15. Pagès, F.; Peyrefitte, C.N.; Mve, M.T.; Jarjaval, F.; Brisse, S.; Iteman, I.; Gravier, P.; Nkoghe, D.; Grandadam, M. Aedes albopictus mosquito: The main vector of the 2007 chikungunya outbreak in Gabon. PLoS ONE 2009, 4, e4691. [Google Scholar] [CrossRef]
  16. Wilson, A.L.; Courtenay, O.; Kelly-Hope, L.A.; Scott, T.W.; Takken, W.; Torr, S.J.; Lindsay, S.W. The importance of vector control for the control and elimination of vector-borne diseases. PLoS Negl. Trop. Dis. 2020, 14, e0007831. [Google Scholar] [CrossRef] [Green Version]
  17. Rollins, L.A.; Woolnough, A.P.; Sherwin, W.B. Population genetic tools for pest management: A review. Wildl. Res. 2006, 33, 251–261. [Google Scholar] [CrossRef]
  18. Wang, I.J.; Bradburd, G.S. Isolation by environment. Mol. Ecol. 2014, 23, 5649–5662. [Google Scholar] [CrossRef]
  19. Alto, B.W.; Juliano, S.A. Precipitation and temperature effects on populations of Aedes albopictus (Diptera: Culicidae): Implications for range expansion. J. Med. Entomol. 2001, 38, 646–656. [Google Scholar] [CrossRef] [Green Version]
  20. Kamgang, B.; Brengues, C.; Fontenille, D.; Njiokou, F.; Simard, F.; Paupy, C. Genetic structure of the tiger mosquito, Aedes albopictus, in Cameroon (Central Africa). PLoS ONE 2011, 6, e20257. [Google Scholar] [CrossRef] [Green Version]
  21. Mousson, L.; Dauga, C.; Garrigues, T.; Schaffner, F.; Vazeille, M.; Failloux, A.B. Phylogeography of Aedes (Stegomyia) aegypti (L.) and Aedes (Stegomyia) albopictus (Skuse) (Diptera: Culicidae) based on mitochondrial DNA variations. Genet. Res. 2005, 86, 1–11. [Google Scholar] [CrossRef]
  22. Raharimalala, F.N.; Ravaomanarivo, L.H.; Ravelonandro, P.; Rafarasoa, L.S.; Zouache, K.; Tran, V.V.; Mousson, L.; Failloux, A.; Hellard, E.; Moro, C.V.; et al. Biogeography of the two major arbovirus mosquito vectors, Aedes aegypti and Aedes albopictus (Diptera, Culicidae), in Madagascar. Parasit. Vectors. 2012, 5, 1–10. [Google Scholar] [CrossRef] [PubMed] [Green Version]
  23. Beck, H.E.; Zimmermann, N.E.; McVicar, T.R.; Vergopolan, N.; Berg, A.; Wood, E.F. Present and future Köppen-Geiger climate classification maps at 1-km resolution. Sci. Data 2018, 5, 1–12. [Google Scholar] [CrossRef] [Green Version]
  24. Nguyen, D.N.; Nguyen, T.H. Climate and Climate Resources in Vietnam; Agriculture Publisher: Hanoi, Vietnam, 2004. [Google Scholar]
  25. Higa, Y.; Nguyen, T.Y.; Kawada, H.; Tran, H.S.; Nguyen, T.H.; Takagi, M. Geographic distribution of Aedes aegypti and Aedes albopictus collected from used tires in Vietnam. J. Am. Mosq. Control. Assoc. 2010, 26, 1–9. [Google Scholar] [CrossRef]
  26. Schmid, M.; Guillaume, F. The role of phenotypic plasticity on population differentiation. Heredity 2017, 119, 214–225. [Google Scholar] [CrossRef] [PubMed]
  27. Kuwata, R.; Phan, T.N.; Nguyen, T.Y.; Hoshino, K.; Isawa, H.; Higa, Y.; Nguyen, V.H.; Bui, M.T.; Do, P.L.; Tran, V.P.; et al. Surveillance of Japanese encephalitis virus infection in mosquitoes in Vietnam from 2006 to 2008. Am. J. Trop. Med. Hyg. 2013, 88, 681–688. [Google Scholar] [CrossRef] [PubMed] [Green Version]
  28. Pham, T.K.L.; Briant, L.; Gavotte, L.; Labbe, P.; Perriat-Sanguinet, M.; Cornillot, E.; Vu, T.D.; Nguyen, T.Y.; Tran, V.P.; Nguyen, V.S.; et al. Incidence of dengue and chikungunya viruses in mosquitoes and human patients in border provinces of Vietnam. Parasit. Vectors 2017, 10, 556. [Google Scholar] [CrossRef] [Green Version]
  29. Nguyen, T.H.Q.; Duong, T.H.K.; Rabaa, M.; Nguyen, M.T.; Tran, T.V.; Le, V.T.; Nguyen, T.H.; Ha, M.T.; Ta, V.T.; Nguyen, L.D.H.; et al. Chikungunya and Zika virus cases detected against a backdrop of endemic dengue transmission in Vietnam. Am. J. Trop. Med. Hyg. 2017, 97, 146–150. [Google Scholar]
  30. Nguyen, T.T.; Lundkvist, Å.; Lindahl, J. Urban transmission of mosquito-borne flaviviruses–a review of the risk for humans in Vietnam. Infect. Ecol. Epidemiol. 2019, 9, 1660129. [Google Scholar] [CrossRef] [PubMed] [Green Version]
  31. Lee, J.-S.; Mogasale, V.; Lim, J.K.; Carabali, M.; Lee, K.-S.; Sirivichayakul, C.; Dang, D.A.; Palencia-Florez, D.C.; Nguyen, T.H.A.; Riewpaiboon, A.; et al. A multi-country study of the economic burden of dengue fever: Vietnam, Thailand, and Colombia. PLoS Negl. Trop. Dis. 2017, 11, e0006037. [Google Scholar] [CrossRef] [PubMed] [Green Version]
  32. Harving, M.; Ronsholt, F. The economic impact of dengue hemorrhagic fever on family level in Southern Vietnam. Dan. Med. Bull. 2007, 54, 170–172. [Google Scholar] [PubMed]
  33. Huang, Y.M. The subgenus stegomyia of aedes in the oriental region with keys to the species (Diptera: Culicidae). Med. Entomol. Stud. 1979, 15, 1–79. [Google Scholar]
  34. Folmer, O.; Black, M.; Hoeh, W.; Lutz, R.; Vrijenhoek, R. DNA primers for amplification of mitochondrial cytochrome c oxidase subunit I from diverse metazoan invertebrates. Mol. Mar. Biol. Biotechnol. 1994, 3, 294–299. [Google Scholar] [PubMed]
  35. Kumar, S.; Stecher, G.; Tamura, K. MEGA7: Molecular evolutionary genetics analysis version 7.0 for bigger datasets. Mol. Biol. Evol. 2016, 33, 1870–1874. [Google Scholar] [CrossRef] [Green Version]
  36. Rozas, J.; Ferrer-Mata, A.; Sanchez-DelBarrio, J.C.; Guirao-Rico, S.; Librado, P.; Ramos-Onsins, S.E.; Sánchez-Gracia, A. DnaSP 6: DNA sequence polymorphism analysis of large data sets. Mol. Biol. Evol. 2017, 34, 3299–3302. [Google Scholar] [CrossRef] [PubMed]
  37. Tajima, F. Statistical method for testing the neutral mutation hypothesis by DNA polymorphism. Genetics 1989, 123, 585–595. [Google Scholar] [CrossRef]
  38. Fu, Y.X. Statistical tests of neutrality of mutations against population growth, hitchhiking and background selection. Genetics 1997, 147, 915–925. [Google Scholar] [CrossRef]
  39. Excoffier, L.; Lischer, H.E.L. Arlequin suite ver 3.5: A new series of programs to perform population genetics analyses under Linux and Windows. Mol. Ecol. Resour. 2010, 10, 564–567. [Google Scholar] [CrossRef]
  40. Peakall, R.; Smouse, P.E. GenAlEx 6.5: Genetic analysis in Excel. Population genetic software for teaching and research—An update. Mol. Ecol. Notes. 2012, 28, 2537–2539. [Google Scholar] [CrossRef] [Green Version]
  41. Cira, D.; Arish, D.; Kilroy, A.; Lozano, N.; Wang, H.G. Vietnam Urbanization Review. 2012. Available online: https://www.researchgate.net/publication/272088348_Vietnam_Urbanization_Review (accessed on 23 August 2020).
  42. Dupanloup, I.; Schneider, S.; Excoffier, L. A simulated annealing approach to define the genetic structure of populations. Mol. Ecol. 2002, 11, 2571–2581. [Google Scholar] [CrossRef]
  43. Legendre, P.; Anderson, M.J. Distance-based redundancy analysis: Testing multispecies responses in multifactorial ecological experiments. Ecol. Monogr. 1999, 69, 1–24. [Google Scholar] [CrossRef]
  44. Wagner, J. Vegan: Community Ecology Package. 2019. Available online: https://cran.r-project.org/package=vegan (accessed on 19 July 2020).
  45. Rousset, F. Genetic differentiation and estimation of gene flow from F-statistics under isolation by distance. Genetics 1997, 145, 1219–1228. [Google Scholar] [CrossRef]
  46. Moore, M.; Sylla, M.; Goss, L.; Burugu, M.W.; Sang, R.; Kamau, L.W.; Kenya, E.U.; Bosio, C.; Munoz, M.L.; Sharakova, M.; et al. Dual African origins of global Aedes aegypti s.l. populations revealed by mitochondrial DNA. PLoS Negl. Trop. Dis. 2013, 7, e2175. [Google Scholar] [CrossRef] [PubMed] [Green Version]
  47. Li, H.; Stephan, W. Inferring the demographic history and rate of adaptive substitution in drosophila. PLoS Genet. 2006, 2, e166. [Google Scholar] [CrossRef] [Green Version]
  48. Bergsten, J.; Bilton, D.T.; Fujisawa, T.; Elliott, M.; Monaghan, M.T.; Balke, M.; Hendrich, L.; Geijer, J.; Herrmann, J.; Foster, G.N.; et al. The effect of geographical scale of sampling on DNA barcoding. Syst. Biol. 2012, 61, 851–869. [Google Scholar] [CrossRef] [PubMed] [Green Version]
  49. Battaglia, V.; Gabrieli, P.; Brandini, S.; Capodiferro, M.R.; Javier, P.A.; Chen, X.G.; Achillo, A.; Semino, O.; Gomulski, L.M.; Malacrida, A.R.; et al. The worldwide spread of the tiger mosquito as revealed by mitogenome haplogroup diversity. Front. Genet. 2016, 7, 1–11. [Google Scholar] [CrossRef] [PubMed] [Green Version]
  50. Kotsakiozi, P.; Richardson, J.B.; Pichler, V.; Favia, G.; Martins, A.J.; Urbanelli, S.; Armbruster, P.A.; Caccone, A. Population genomics of the Asian tiger mosquito, Aedes albopictus: Insights into the recent worldwide invasion. Ecol. Evol. 2017, 7, 10143–10157. [Google Scholar] [CrossRef] [Green Version]
  51. Žitko, T.; Kovavic, A.; Desdevises, Y.; Puizina, J. Genetic variation in East-Adriatic populations of the Asian tiger mosquito, Aedes albopictus (Diptera: Culicidae), inferred from NADH5 and COI sequence variability. Eur. J. Entomol. 2011, 108, 501–508. [Google Scholar] [CrossRef] [Green Version]
  52. Fang, Y.; Zhang, J.; Wu, R.; Xue, B.; Qian, Q.; Gao, B. Genetic polymorphism study on Aedes albopictus of different geographical regions based on DNA barcoding. BioMed. Res. Int. 2018, 2018, 1501430. [Google Scholar] [CrossRef] [PubMed] [Green Version]
  53. Zawani, M.K.N.; Abu, H.A.; Sazaly, A.B.; Zary, S.Y.; Darlina, M.N. Population genetic structure of Aedes albopictus in Penang, Malaysia. Genet. Mol. Res. 2014, 13, 8184–8196. [Google Scholar] [CrossRef] [PubMed]
  54. Porretta, D.; Mastrantonio, V.; Bellini, R.; Somboon, P.; Urbanelli, S. Glacial history of a modern invader: Phylogeography and species distribution modelling of the Asian tiger mosquito Aedes Albopictus. PLoS ONE 2012, 7, e44515. [Google Scholar] [CrossRef]
  55. Lee, E.; Yang, S.C.; Kim, T.K.; Noh, B.E.; Lee, H.S.; Kim, H.; Roh, J.Y.; Lee, W.G. Geographical genetic variation and sources of Korean Aedes albopictus (Diptera: Culicidae) populations. J. Med. Entomol. 2020, 57, 1057–1068. [Google Scholar] [CrossRef]
  56. Ismail, N.A.; Adilah-Amrannudin, N.; Hamsidi, M.; Ismail, R.; Dom, N.C.; Ahmad, A.H.; Mastuki, M.F.; Camalxaman, A.N. The genetic diversity, haplotype analysis, and phylogenetic relationship of Aedes albopictus (Diptera: Culicidae) based on the Cytochrome oxidase 1 marker: A Malaysian scenario. J. Med. Entomol. 2017, 54, 1573–1581. [Google Scholar] [CrossRef] [PubMed]
  57. Manni, M.; Gomulski, L.M.; Aketarawong, N.; Tait, G.; Scolari, F.; Somboon, P.; Guglielmino, C.R.; Malacrida, A.R.; Gasperi, G. Molecular markers for analyses of intraspecific genetic diversity in the Asian tiger mosquito, Aedes albopictus. Parasites Vectors 2015, 8, 1–11. [Google Scholar] [CrossRef] [Green Version]
  58. Ho, T.M.H.; Phan, V.T.; Le, N.Q.; Nguyen, Q.T. Extreme climatic events over Vietnam from observational data and RegCM3 projections. Clim. Res. 2011, 49, 87–100. [Google Scholar] [CrossRef] [Green Version]
  59. Raghavan, S.V.; Vu, M.T.; Liong, S.Y. Regional climate simulations over Vietnam using the WRF model. Theor. Appl. Climatol. 2016, 126, 161–182. [Google Scholar] [CrossRef]
  60. Phan, V.T.; Ngo, D.T. Seasonal and interannual variations of surface climate elements over Vietnam. Clim. Res. 2009, 40, 49–60. [Google Scholar] [CrossRef] [Green Version]
  61. Mathias, D.; Reed, L.K.; Bradshaw, W.E.; Holzapfel, C.M. Evolutionary divergence of circadian and photoperiodic phenotypes in the pitcher-plant mosquito, Wyeomyia smithii. J. Biol. Rhythm. 2006, 21, 132–139. [Google Scholar] [CrossRef] [PubMed]
  62. Bradshaw, W.E.; Zani, P.A.; Holzapfel, C.M. Adaptation to temperate climates. Evolution 2004, 58, 1748–1762. [Google Scholar] [CrossRef]
  63. Armbruster, P.A. Photoperiodic diapause and the establishment of Aedes albopictus (Diptera: Culicidae) in North America. J. Med. Entomol. 2016, 53, 1013–1023. [Google Scholar] [CrossRef] [Green Version]
  64. Sota, T.; Mogi, M. Survival time and resistance to desiccation of diapause and non-diapause eggs of temperate Aedes (Stegomyia) mosquitoes. Entomol. Exp. Appl. 1992, 63, 155–161. [Google Scholar] [CrossRef]
  65. Batz, Z.A.; Armbruster, P.A. Diapause-associated changes in the lipid and metabolite profiles of the Asian tiger mosquito, Aedes albopictus. J. Exp. Biol. 2018, 221, jeb189480. [Google Scholar] [CrossRef] [Green Version]
  66. Tsunoda, T.; Chaves, L.F.; Nguyen, T.T.G.; Nguyen, T.Y.; Takagi, M. Winter activity and diapause of Aedes albopictus (Diptera: Culicidae) in Hanoi, northern Vietnam. J. Med. Entomol. 2015, 52, 1203–1212. [Google Scholar] [CrossRef] [PubMed]
  67. Morales Vargas, R.E.; Phumala-Morales, N.; Tsunoda, T.; Apiwathnasorn, C.; Dujardin, J.P. The phenetic structure of Aedes albopictus. Infect. Genet. Evol. 2013, 13, 242–251. [Google Scholar] [CrossRef] [PubMed]
  68. Fan, P.; Ouyang, Z.; Nguyen, D.D.; Nguyen, T.T.H.; Park, H.; Chen, J. Urbanization, economic development, environmental and social changes in transitional economies: Vietnam after Doimoi. Landsc. Urban. Plan. 2019, 187, 145–155. [Google Scholar] [CrossRef]
  69. Li, Y.; Kamara, F.; Zhou, G.; Puthiyakunnon, S.; Li, C.; Liu, Y.; Zhou, Y.; Yao, L.; Yan, G.; Chen, X.G. Urbanization increases Aedes albopictus larval habitats and accelerates mosquito development and survivorship. PLoS Negl. Trop. Dis. 2014, 8, e3301. [Google Scholar] [CrossRef] [Green Version]
Figure 1. Map of collection localities (A) and phylogenetic network of COI haplotypes (B). (A) The color represents for each site matched with color in haplotype network. Codes for collection sites are shown in Table 1. (B) Haplotype network. Colors represent sampling localities (Table 1). Circles and colors represent haplotypes and correspond locality, respectively, and labels and numbers in parentheses indicate haplotype names and frequencies, when >1. Black dots represent intermediate haplotypes that were not recovered during the present study.
Genes 12 01579 g001
Figure 2. Distribution of COI haplotypes and population structure analyses of 16 Aedes albopictus populations in Vietnam. (A) Haplotype distribution map. Each pie chart illustrates the proportion of three major haplotypes and its descendants in each locality. The dashed lines represent the borders of the three regions indicated to the right of the map. (B) Principal coordinates analysis (PCoA) plot based on pairwise genetic distance. (C) Fixation indices obtained by SAMOVA for the best-clustering option at pre-defined values of K.
Genes 12 01579 g002
Figure 3. Plot of distance-based redundancy analyses from the final model. The dbRDA plot partitioned the genetic variance of Ae. albopictus populations explained by the predictor variables including two climatic variables, bio8—mean temperature of wettest quarter, bio11—mean temperature of coldest quarter and a spatial component, geo3—third-order polynomials transformation. Site codes are corresponded with definition in Table 1. Population clusters were indicated by colored circles, in which blue circle clustered populations from region 1 while red circle represent for group of populations from region 2 and 3. The first two axes explained 98.65% of the variability in the final model. Vector notations indicate the strength of the relationship between predictor variables and the dbRDA axes.
Genes 12 01579 g003
Table 1. Location and genetic diversity of Aedes albopictus populations in Vietnam.
IDCRLocalityNNo. Haplotypes (NH)Haplotype Diversity (Hd) (SD)Nucleotide Diversity (π) (SD)Tajima’s DFu’s Fs
S01NWLai Chau province15100.9429 (0.0403)0.0037 (0.0024)−1.3221−5.1246
S02Dien Bien province1580.8286 (0.0849)0.0030 (0.0020)−1.3545−3.1153
S03Son La province1590.9333 (0.0397)0.0036 (0.0023)−0.1473−3.7633
S04NEHa Giang province1780.7794 (0.0985)0.0025 (0.0021)−1.6227−3.3956
S05Cao Bang province1570.7810 (0.1016)0.0021 (0.0016)−1.5728−3.0275
S06Lang Son province1570.7714 (0.1001)0.0019 (0.0016)−1.7724−3.3800
S07NDHanoi city1570.8381 (0.0680)0.0024 (0.0016)0.5623−2.6767
S08Hai Phong city15100.8571 (0.0901)0.0042 (0.0026)−1.5855−4.4915
S09NCThanh Hoa province17110.9338 (0.0426)0.0032 (0.0021)−1.5294−6.8099
S10 Nghe An province1570.7810 (0.1016)0.0020 (0.0014)−1.1519−3.4900
S11SCDa Nang city1470.8242 (0.0781)0.0025 (0.0017)−1.3494−2.7610
S12Quang Ngai province1470.8132 (0.1158)0.0023 (0.0017)−1.7663−2.9501
S13CHGia Lai province1470.8571 (0.0652)0.0031 (0.0020)−1.3491−1.9899
S14Dak Lak province1480.9121 (0.0440)0.0032 (0.0021)−0.6081−3.1394
S15SHo Chi Minh city 1370.7949 (0.1091)0.0020 (0.0015)−1.2441−3.8060
S16Can Tho province1370.8333 (0.0861)0.0020 (0.0015)−1.5939−3.7332
Total236650.90200.0033−2.3260−26.8672
ID, locality code used for the downstream analyses; CR, climatic region; N, number of individuals analyzed; significant values of neutrality tests (Tajima’s D and Fu’s Fs) are indicated in bold.
Table 2. Analysis of molecular variance (AMOVA) testing of hypotheses for the partitioning of genetic variation among Ae. albopictus populations in Vietnam.
HypothesisSource of VariationPercent of VariationF-StatisticP-Value
Two groups: PCoA plot and haplotype distribution map
- Northeast (S04, S05, S06)
- The other populations.
ΦCT29.140.2914<0.001
ΦSC3.150.0445<0.001
ΦST67.710.3229<0.001
Three groups: spatial distribution of haplotypes (Figure 2A)
- Region 1 (S04, S05, S06)
- Region 2 (S01, S02, S03, S07, S08, S09)
- Region 3 (S10, S11, S12, S13, S14, S15, S16)
ΦCT18.360.1836<0.001
ΦSC2.710.0302<0.01
ΦST78.930.2107<0.001
Seven groups, geography and climate
- Northwest (S01, S02, S03)
- Northeast (S04, S05, S06)
- North Delta (S07, S08)
- North Central (S09, S10)
- South Central (S11, S12)
- Central Highlands (S13, S14)
- The South (S15, S16)
ΦCT15.990.1599<0.001
ΦSC1.450.01730.06158
ΦST80.250.1744<0.01
Three groups: level of urbanization
- Class I, municipalities (S7, S8, S11, S15, S16)
- Class II, provincial cities (S1, S2, S3, S4, S5, S6, S13, S14)
- Class III, provincial towns (S9, S10, S12)
ΦCT3.230.03230.1329
ΦSC13.880.1434<0.001
ΦST82.890.1711<0.001
ΦCT: among groups; ΦSC: among populations within groups; ΦST: within populations.
Table 3. Effect of geographic and climatic factors on COI sequence variation.
VariableInertiaPercent of Variation (%)P-Value
Global dbRDA
Geographic distance + Climates0.296175.980.002
Partial dbRDA
Climates0.251664.550.001
Geographic distance0.131433.730.010
Climates | Geography0.164642.250.002
Geography | Climates0.044511.420.020
Publisher’s Note: MDPI stays neutral with regard to jurisdictional claims in published maps and institutional affiliations.

