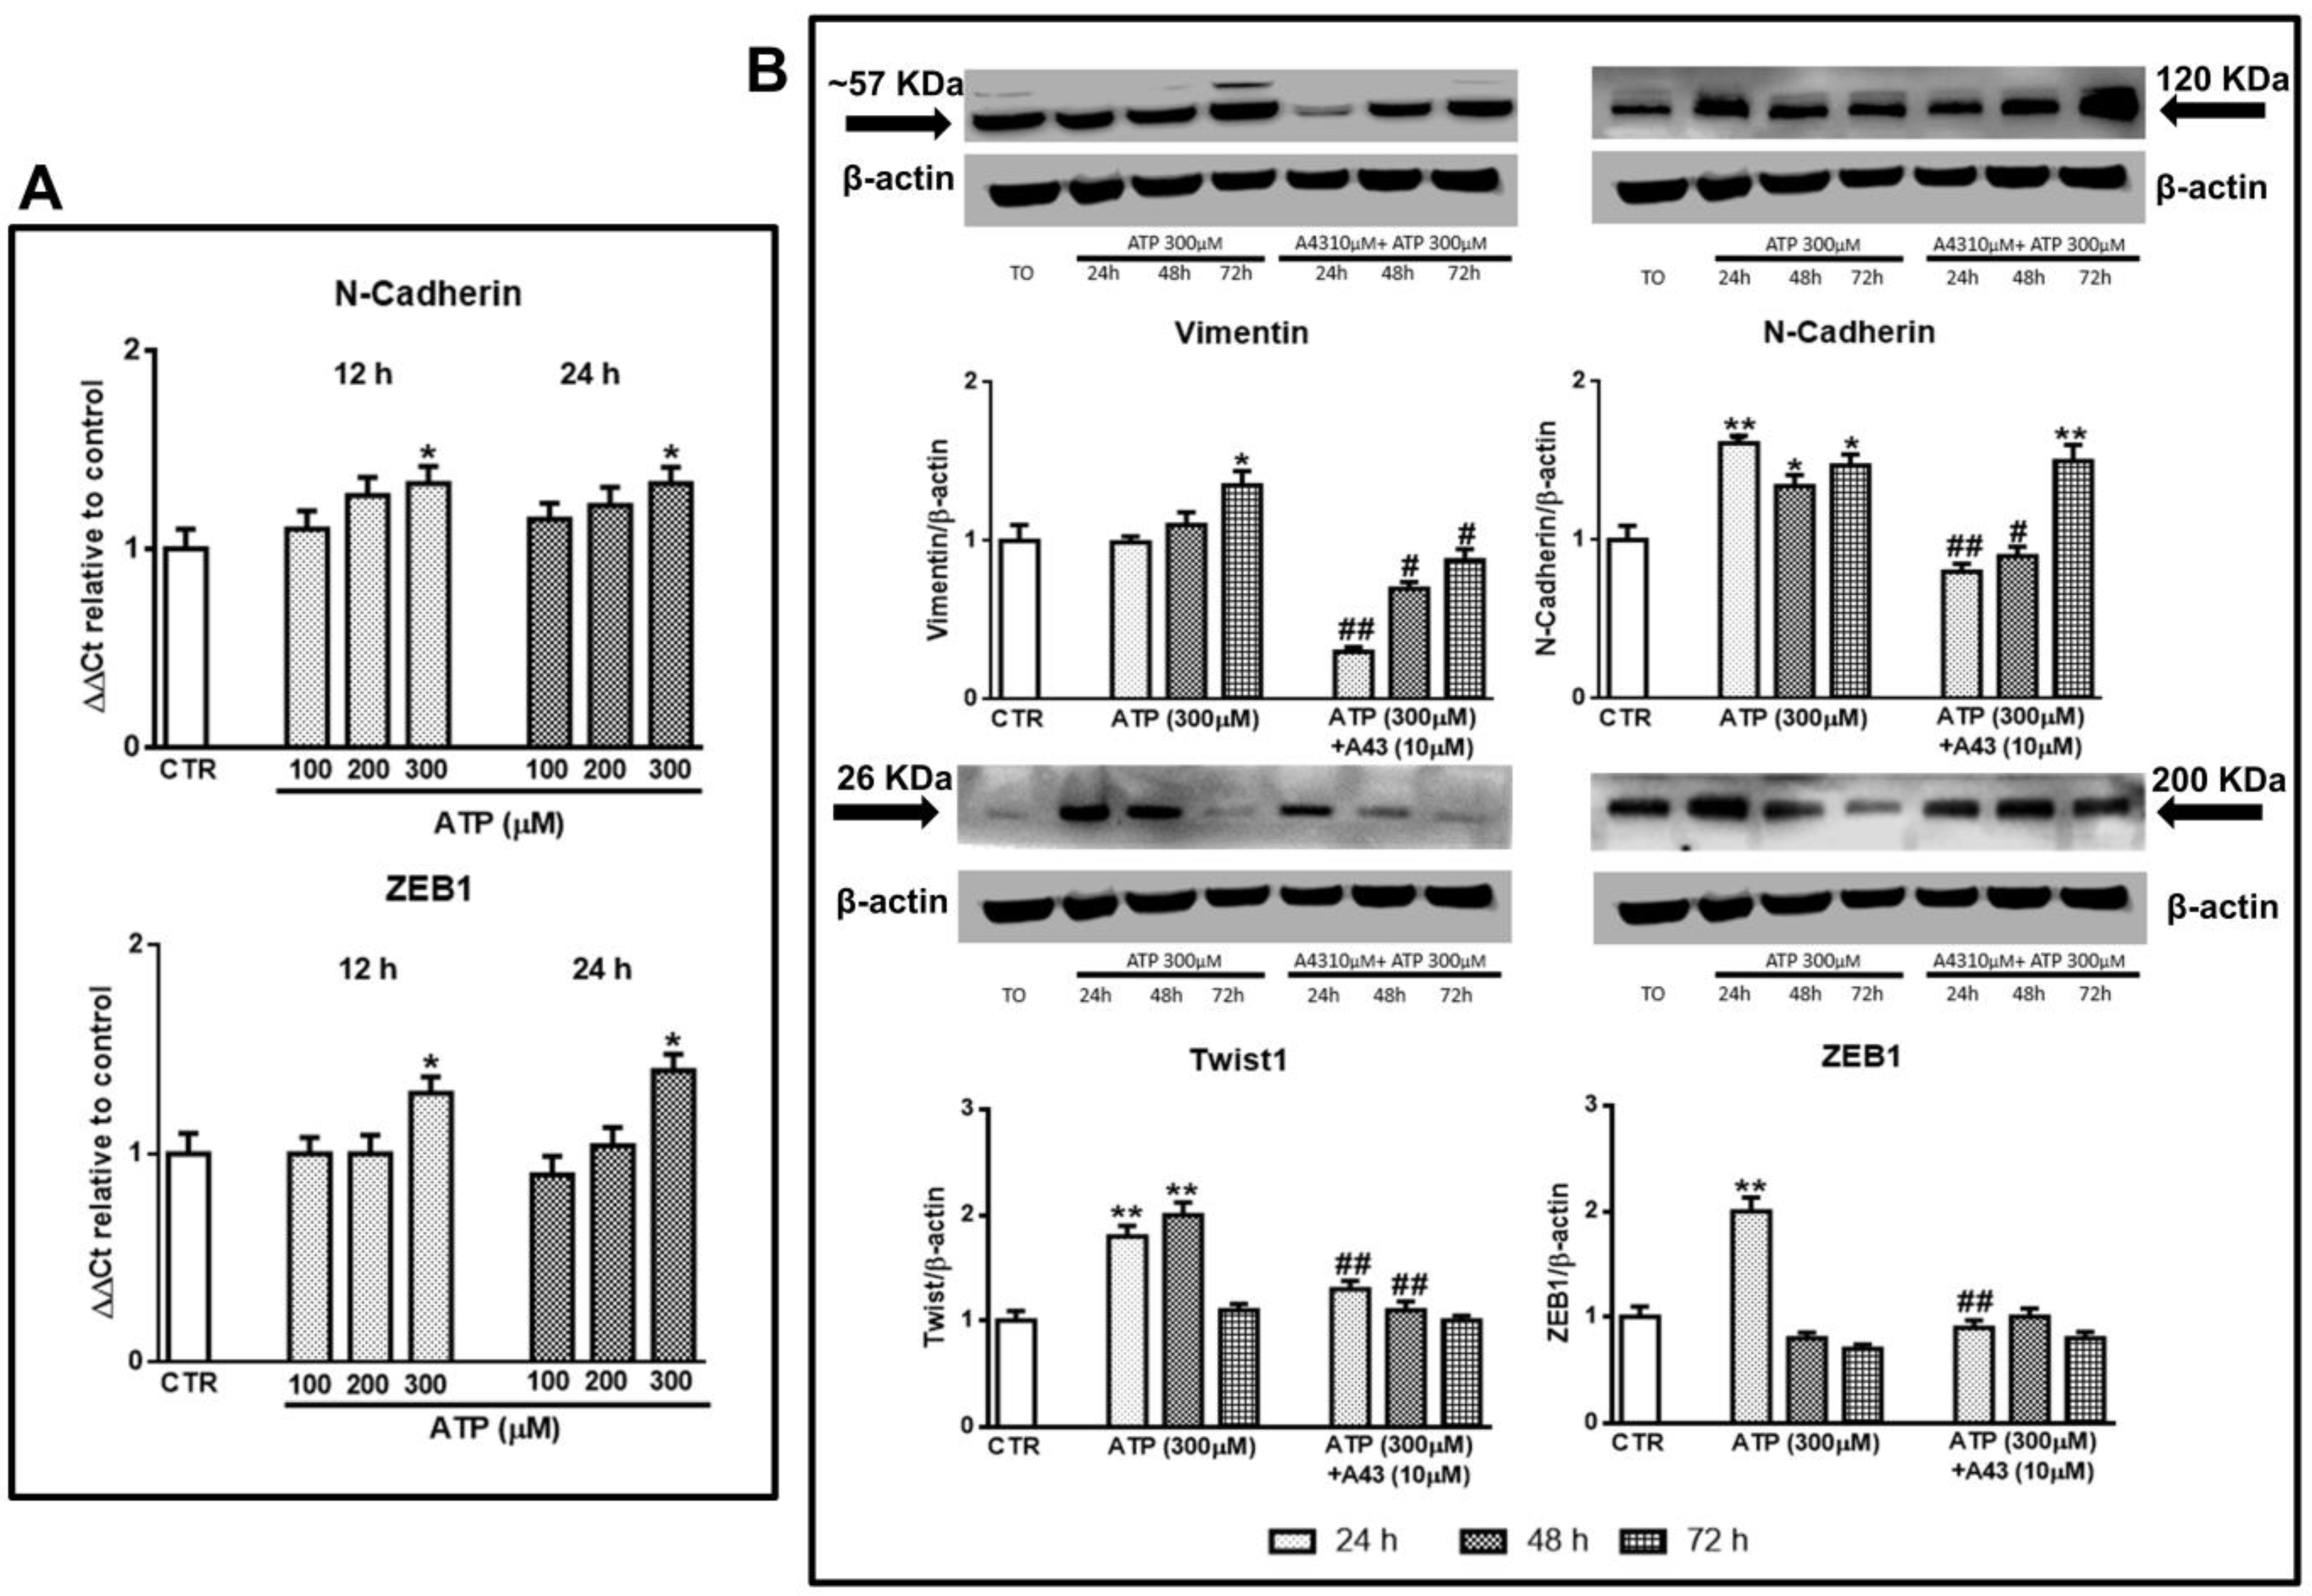
Figure 1.
Effect of ATP on epithelial-to-mesenchymal transition (EMT) markers evaluated at different times after drug administration to cultured glioblastoma stem cells (GSCs). GSCs, cultured up to their confluence in vitro were exposed to different concentrations (A) or 300 μM of ATP (B), in the presence or not of the P2X7R antagonist, A438079, added to the cultures 1 h prior to ATP. (A) At the indicated time periods cells were collected and mRNA was extracted and analyzed for the gene expression of N-cadherin and ZEB1. mRNA levels were normalized (ΔCt) by using the house keeping GAPDH as endogenous control and the results were obtained by relative quantitation among groups using the comparative 2 ΔΔCt method. Values, calculated as fold of increase vs. untreated cells assumed as control (CTR) are the mean ± S.E.M. of three independent experiments where each sample was tested in duplicate. (B) cells, harvested at the indicated time periods, were lysed and the protein levels of EMT markers such as vimentin, N-cadherin, Twist1, and ZEB1 were determined by western blot analysis. Immunoblots were re-probed with an antibody against β actin, quantified by densitometric analysis, normalized to β actin used as an internal control, and reported in the histograms assuming the value of control/β-actin = 1. Immunobands in the figure are representative of independent experiments carried out in GSCs #1 and tested in triplicate. Of note, the band of β-actin is the same for all blots reported in the figures, which were obtained by cutting the same membrane at different heights corresponding to the molecular weights of the selected markers. *p < 0.05, **p < 0.01: statistical significance vs. untreated GSCs assumed as control (CTR); #p < 0.05, ##p < 0.01: statistical significance vs. cells exposed to ATP (one-way ANOVA plus Dunnett’s test).
![Cells 09 00085 g001]()
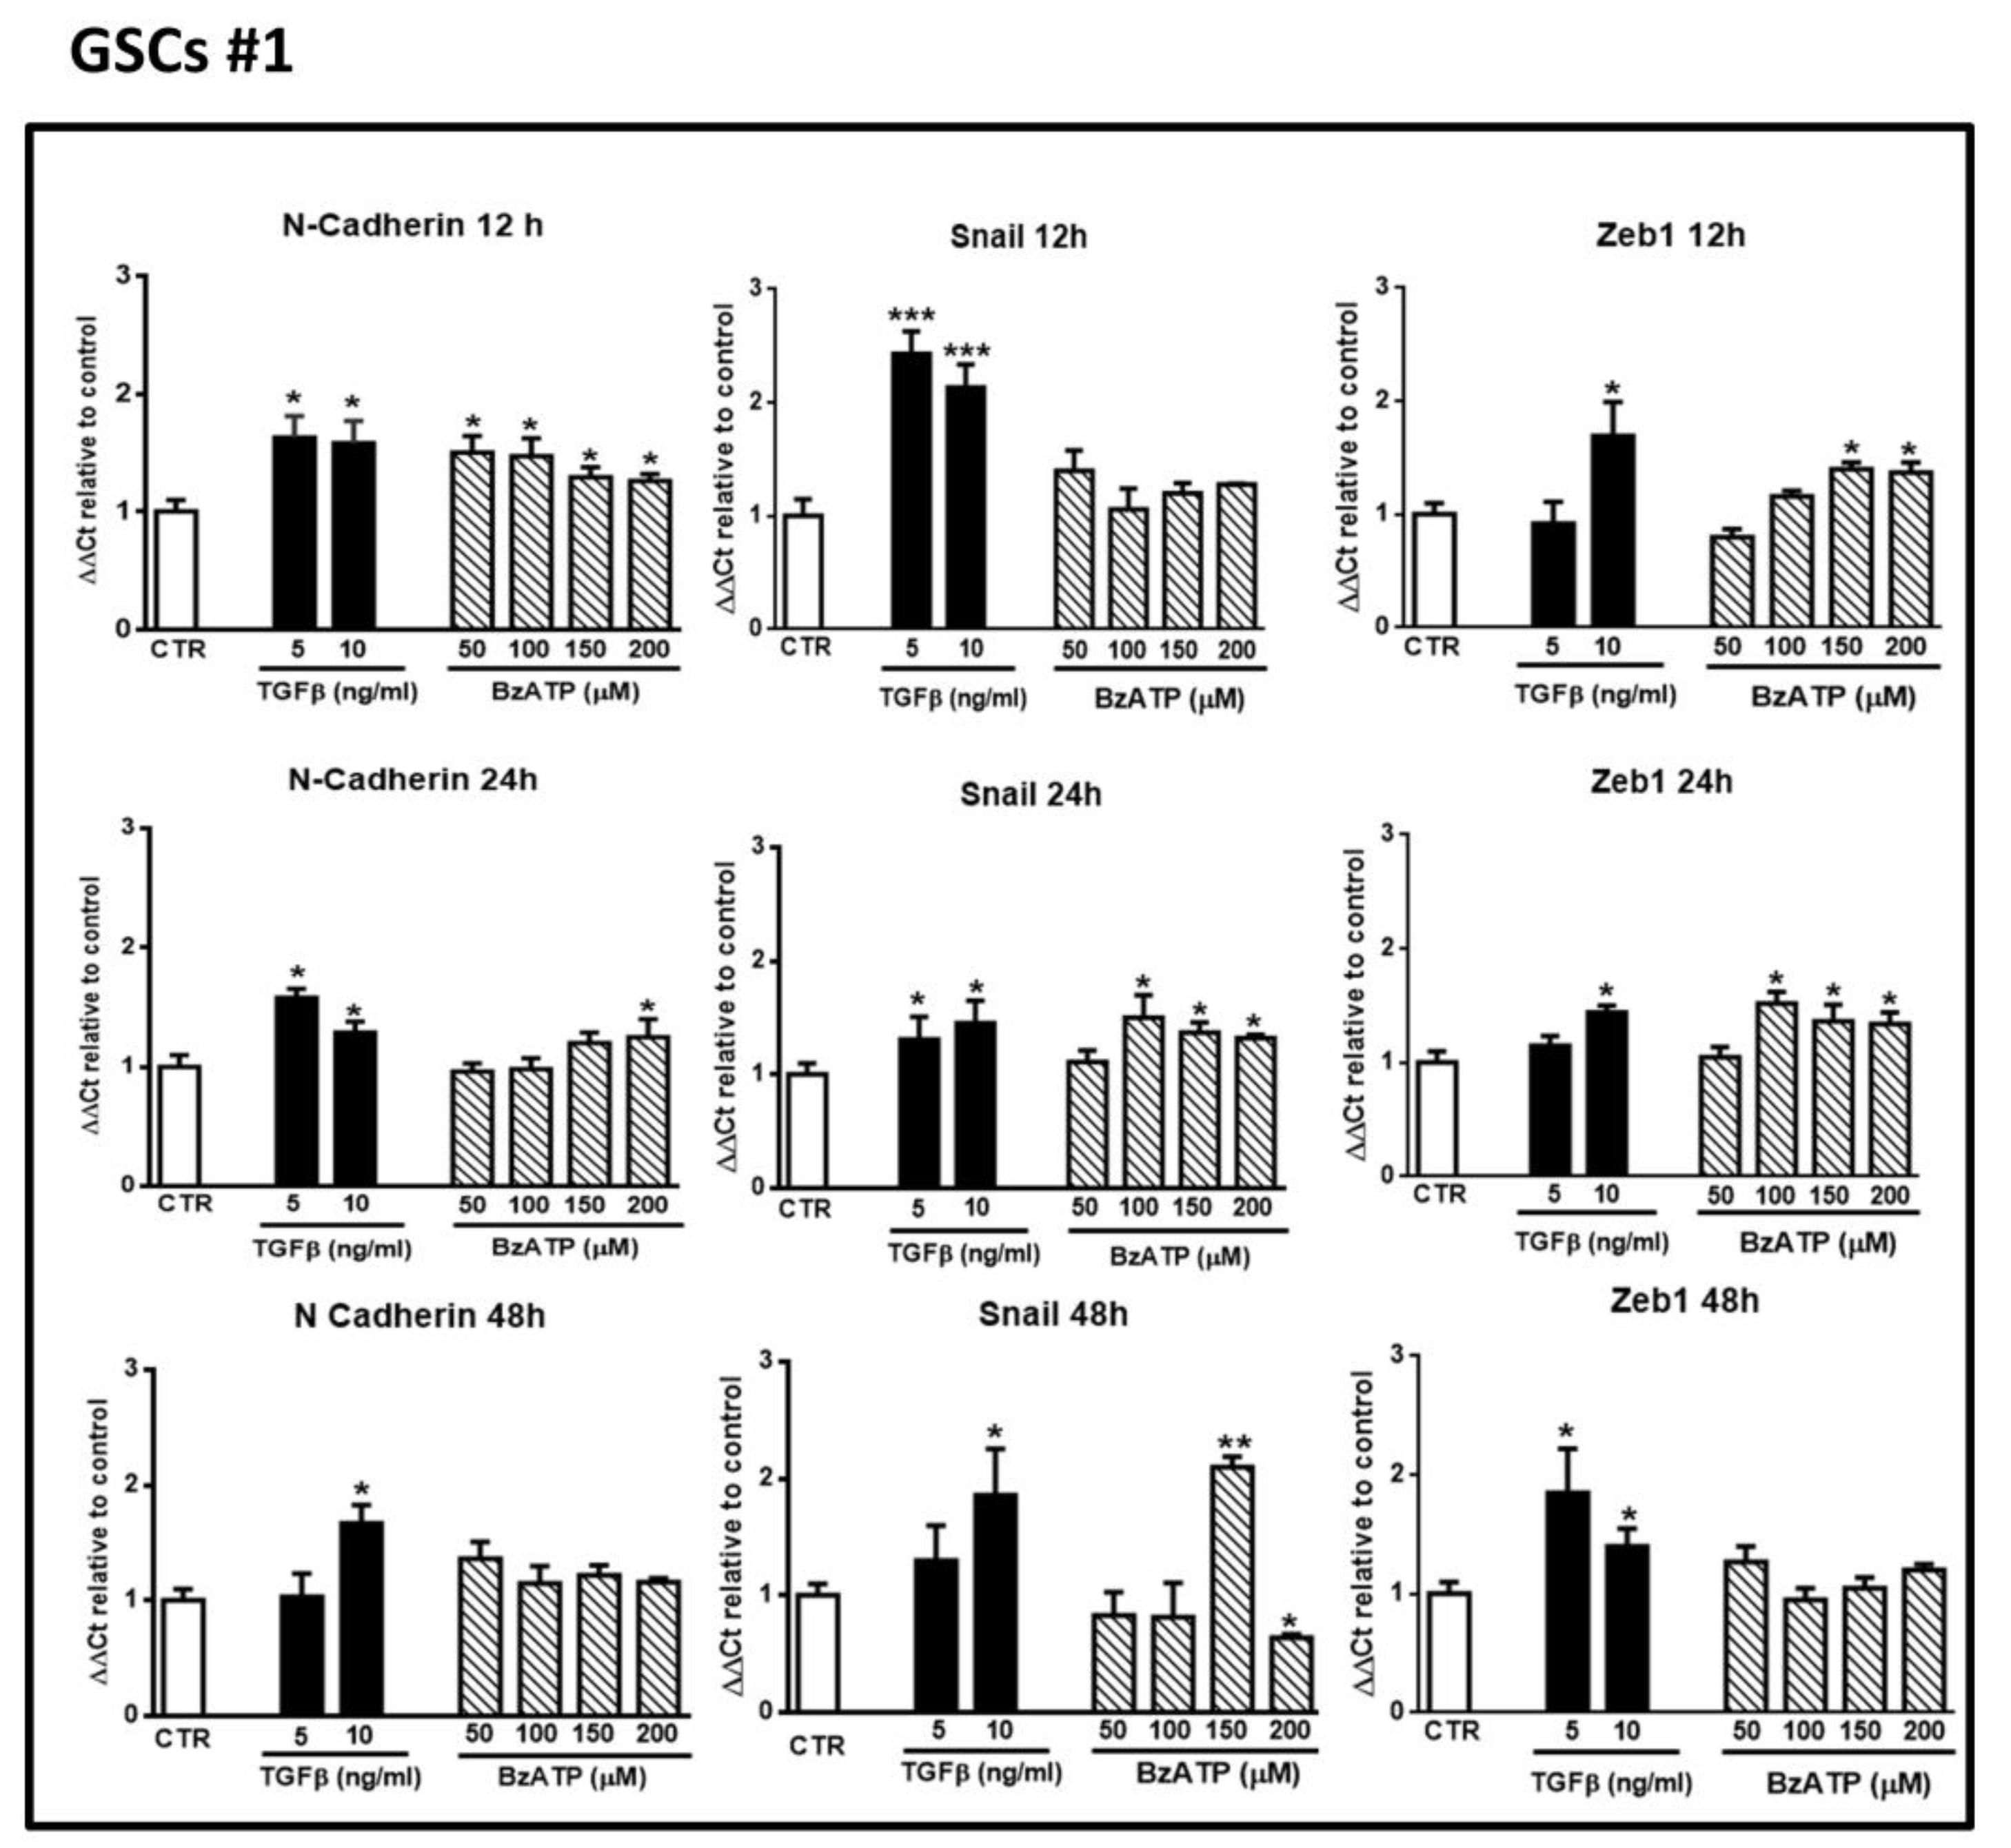
Figure 2.
Effect of Transforming Growth Factor β1 (TGFβ1) or 2’(3’)-O-(4-benzoylbenzoyl)-ATP (BzATP) on EMT markers evaluated by qRT-PCR at different times after drug administration to cultured GSCs #1. GSCs, grown up to their confluence in vitro, were exposed to different concentrations of TGFβ1 or BzATP. At the indicated time points cells were collected to obtain their mRNA to analyze the gene expression of the indicated EMT markers. mRNA levels were normalized (ΔCt) by using the house keeping GAPDH as endogenous control and the results were analyzed for relative quantitation among groups using the comparative 2 ΔΔCt method. Values, calculated as fold of increase vs. untreated cells assumed as control (CTR) are the mean ± S.E.M. of three independent experiments, in which each sample was tested in duplicate. *p < 0.05, **p < 0.01, ***p < 0.001: statistical significance vs. CTR (one-way ANOVA plus Dunnett’s test).
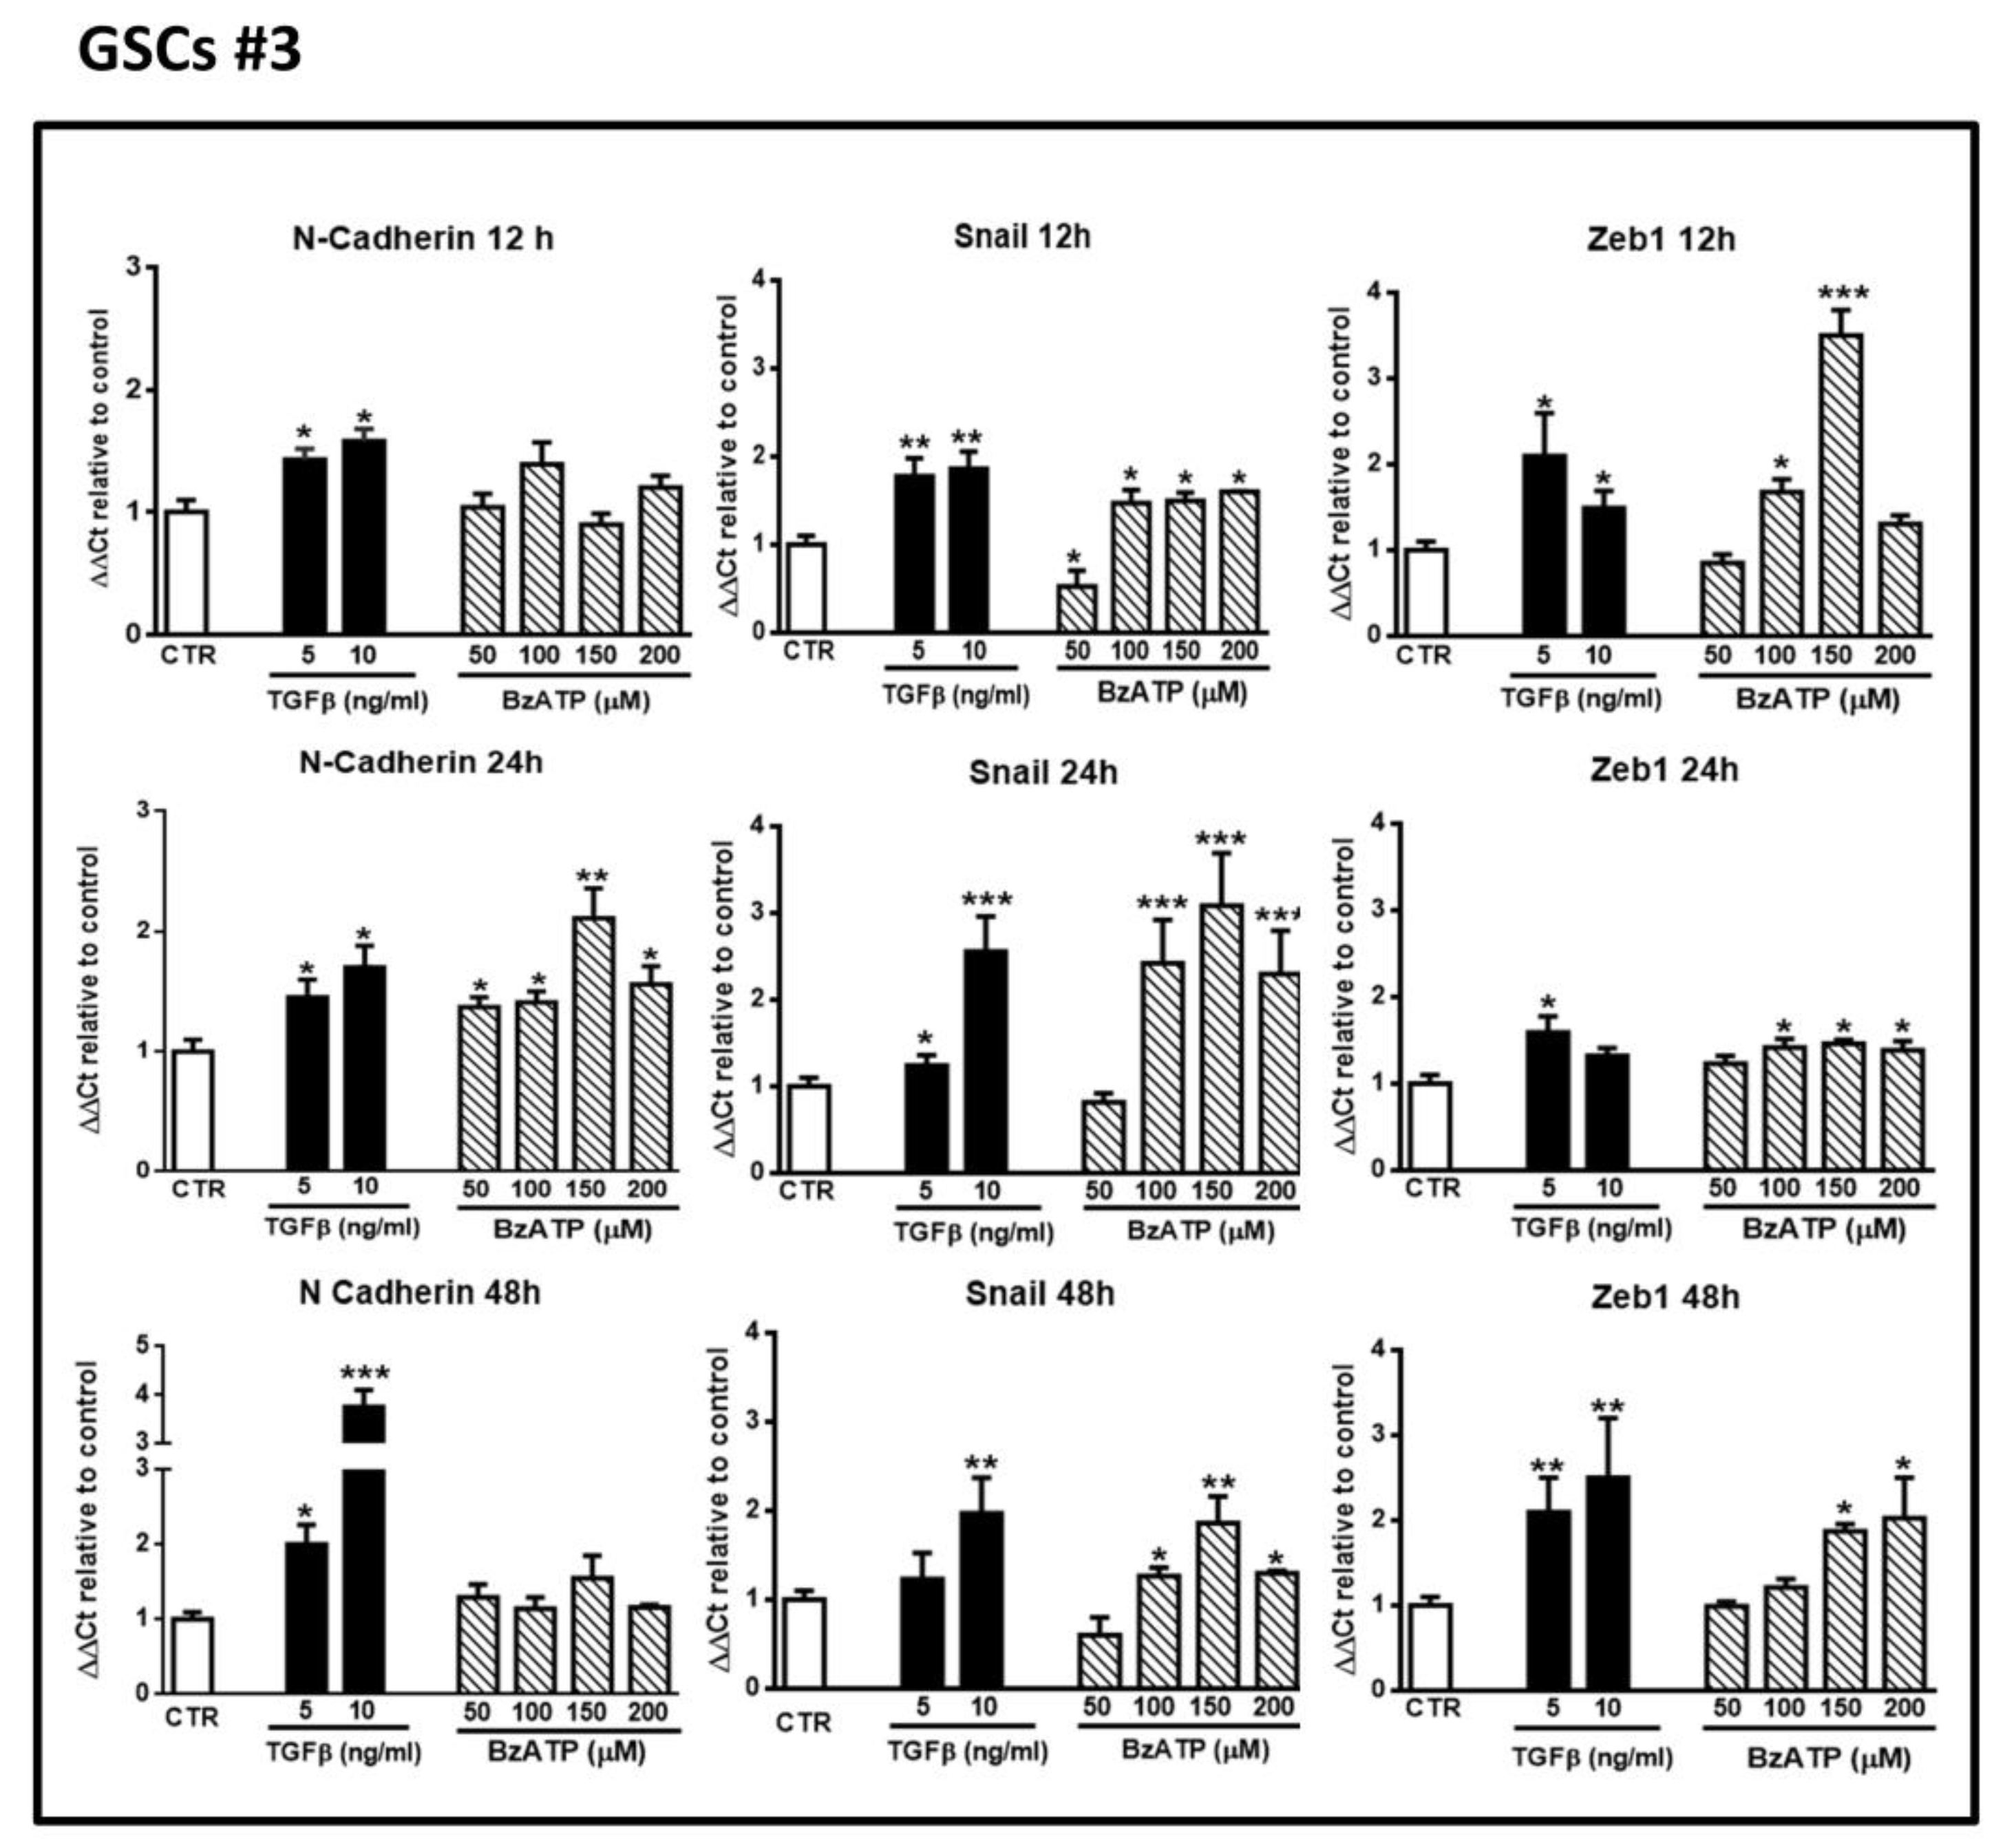
Figure 3.
Effect of TGFβ1 or BzATP on EMT markers evaluated by qRT-PCR at different times after drug administration to cultured GSCs #3. Similar to what is reported in the legend of the
Figure 2, confluent GSCs were exposed to TGFβ1 or BzATP for the indicated times, at the end of which cells were collected and their mRNA was analyzed for the gene expression of EMT markers. mRNA levels were normalized (ΔCt) by using the house keeping GAPDH as endogenous control and the results were analyzed for relative quantitation among groups using the comparative 2
ΔΔCt method. Values, calculated as fold of increase vs. untreated cells assumed as control (CTR) are the mean ± S.E.M. of three independent experiments in which each sample was tested in duplicate. *
p < 0.05, **
p < 0.01, ***
p < 0.001: statistical significance vs. CTR (one-way ANOVA plus Dunnett’s test).
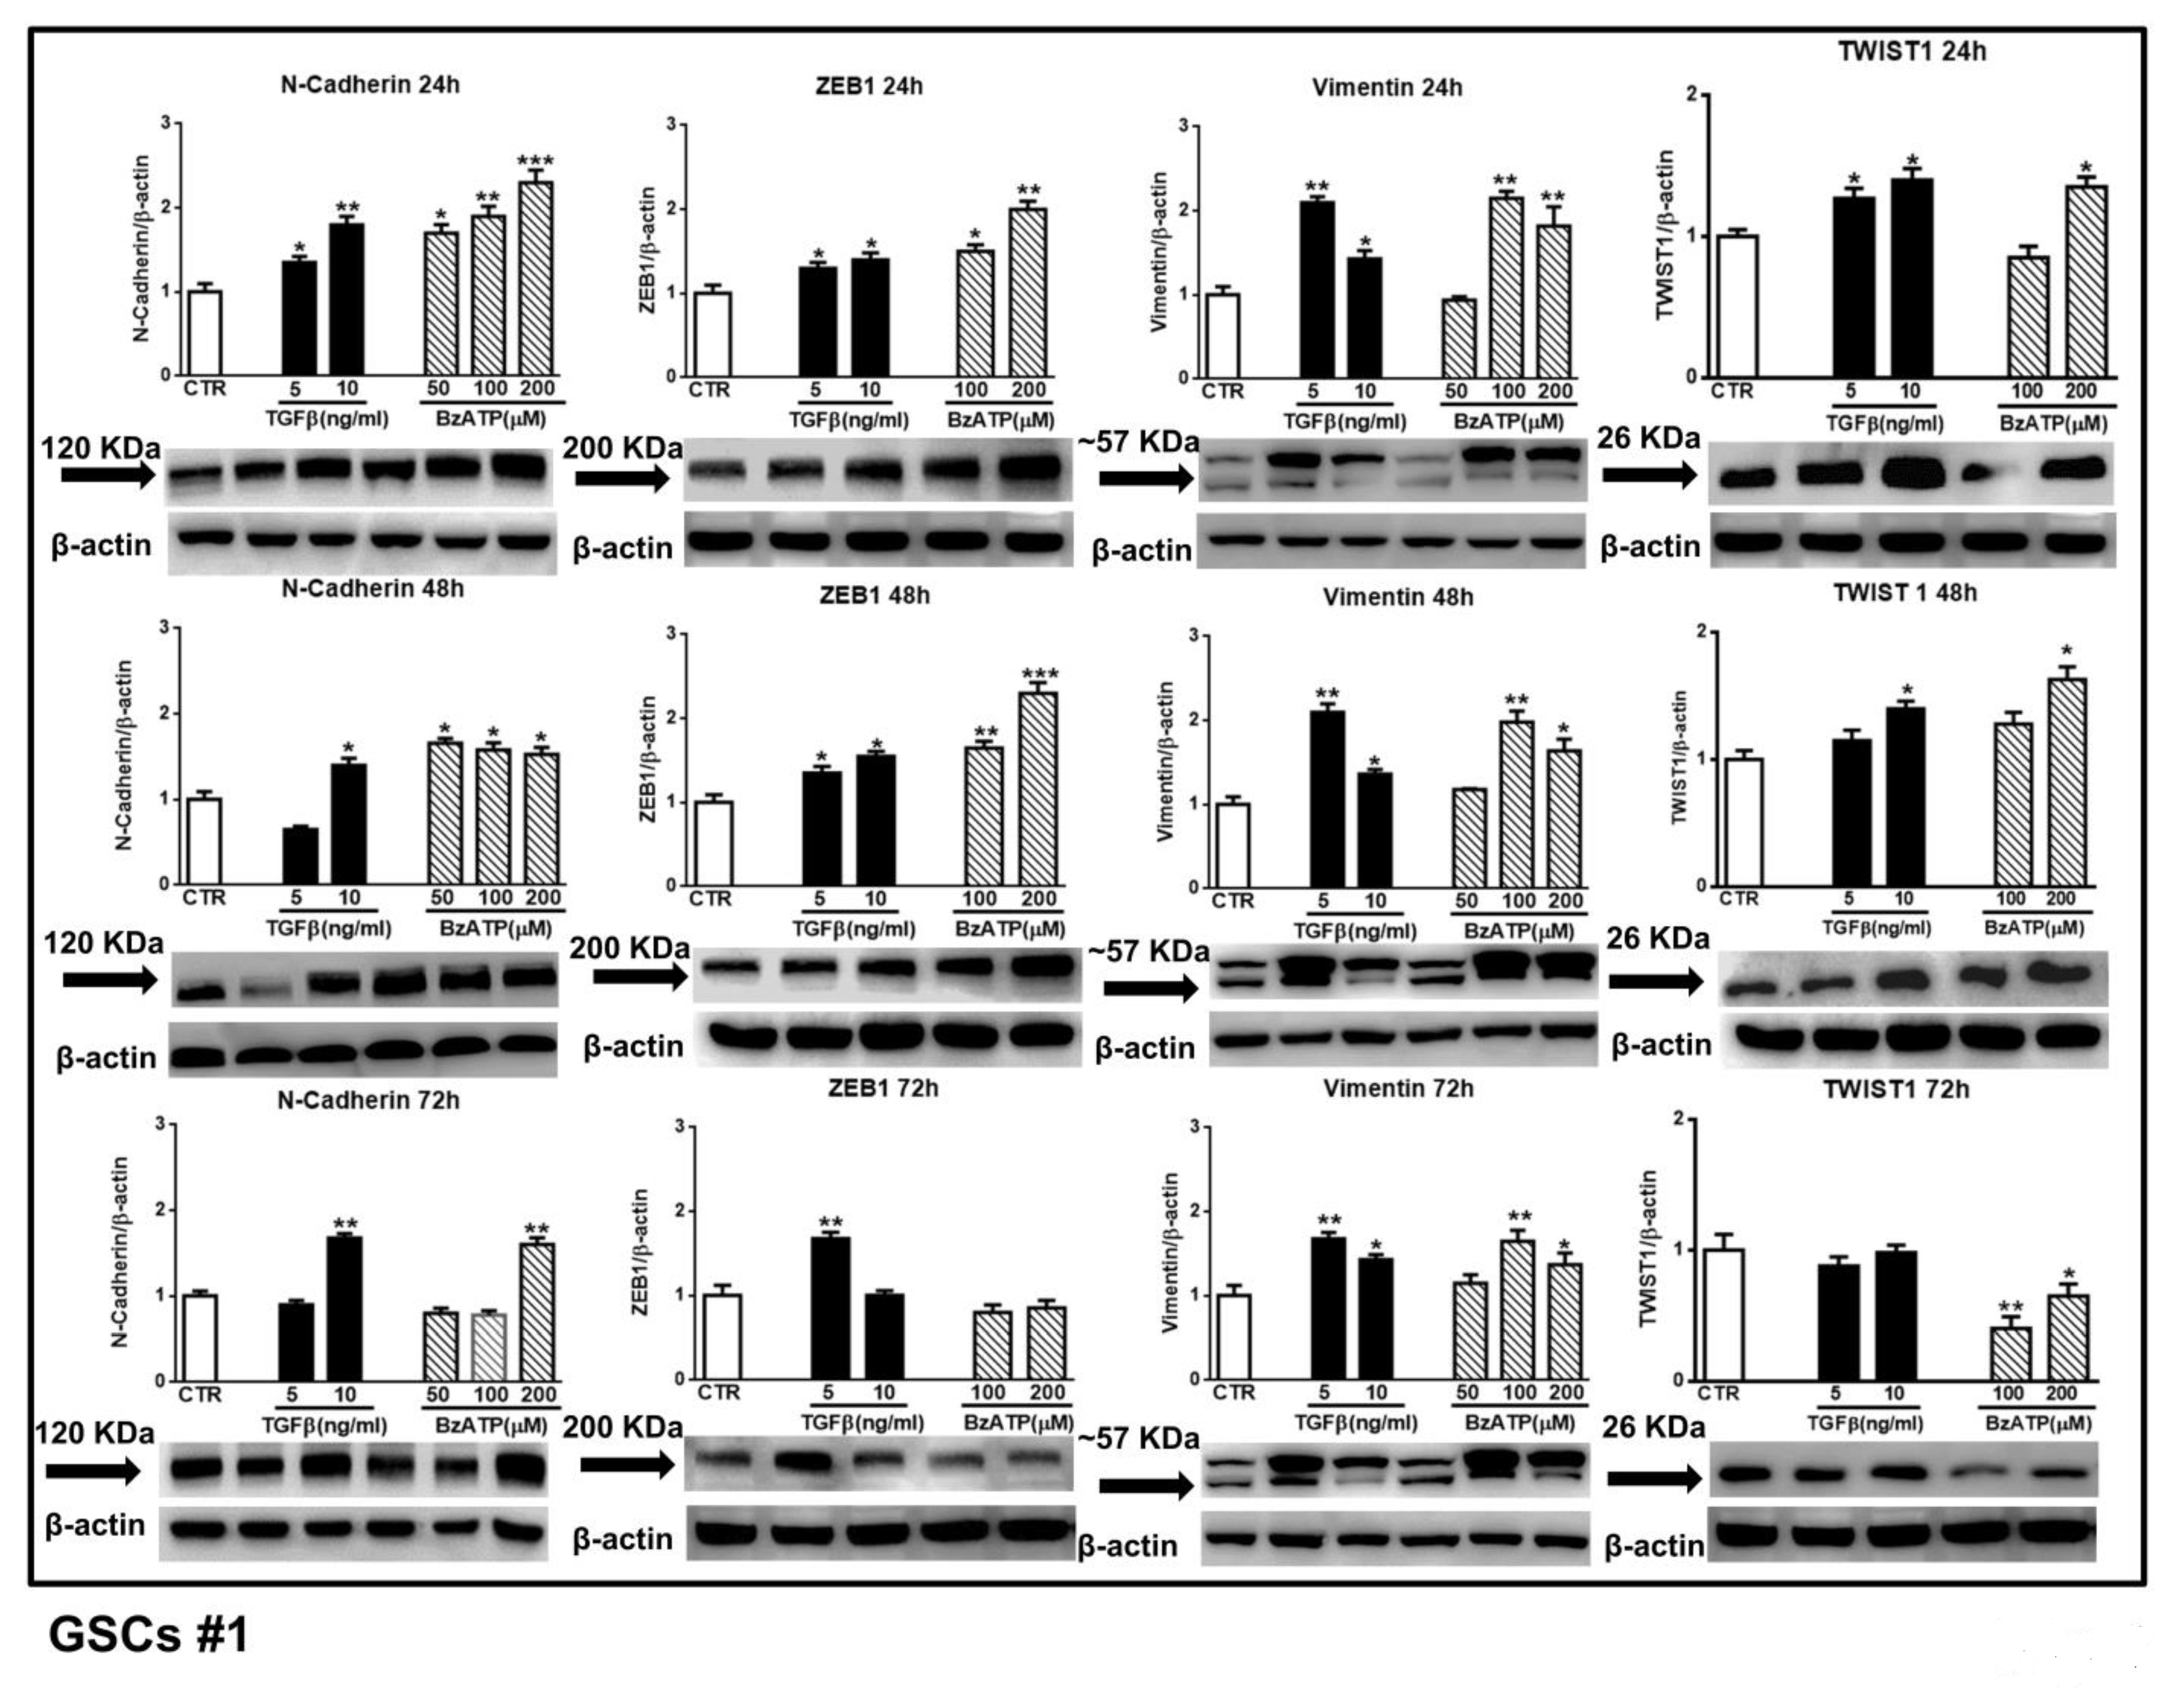
Figure 4.
Effect of TGFβ1 or BzATP on EMT markers evaluated by western blot analysis at different times after drug administration to cultured GSCs. GSCs #1 were exposed to different concentrations of TGFβ1 or BzATP and harvested at the indicated times. The protein levels of EMT markers were determined by western blot analysis. Over the arrows close to the immune-bands the molecular weight (MW) of each EMT marker is reported according to the MW indicated in the data sheet of the used antibody. To note that for vimentin, which showed a double immune-band, as also reported in literature [
35], the molecular weight is equal to about (~) 57 KDa to indicate an average of the weights of the two bands. Immunoblots were re-probed with an antibody against β actin, quantified by densitometric analysis, normalized to β actin used as an internal control, and reported in the histograms assuming the value of control/β-actin = 1. Immunobands in the figure are representative of three independent experiments. Of note, β-actin bands are the same for some blots reported in the figure, since they were obtained by cutting the same membrane at different heights corresponding to the molecular weights of the selected markers. *
p < 0.05, **
p < 0.01, ***
p < 0.001: statistical significance vs. untreated GSCs assumed as control (CTR) (one-way ANOVA plus Dunnett’s test).
![Cells 09 00085 g004]()
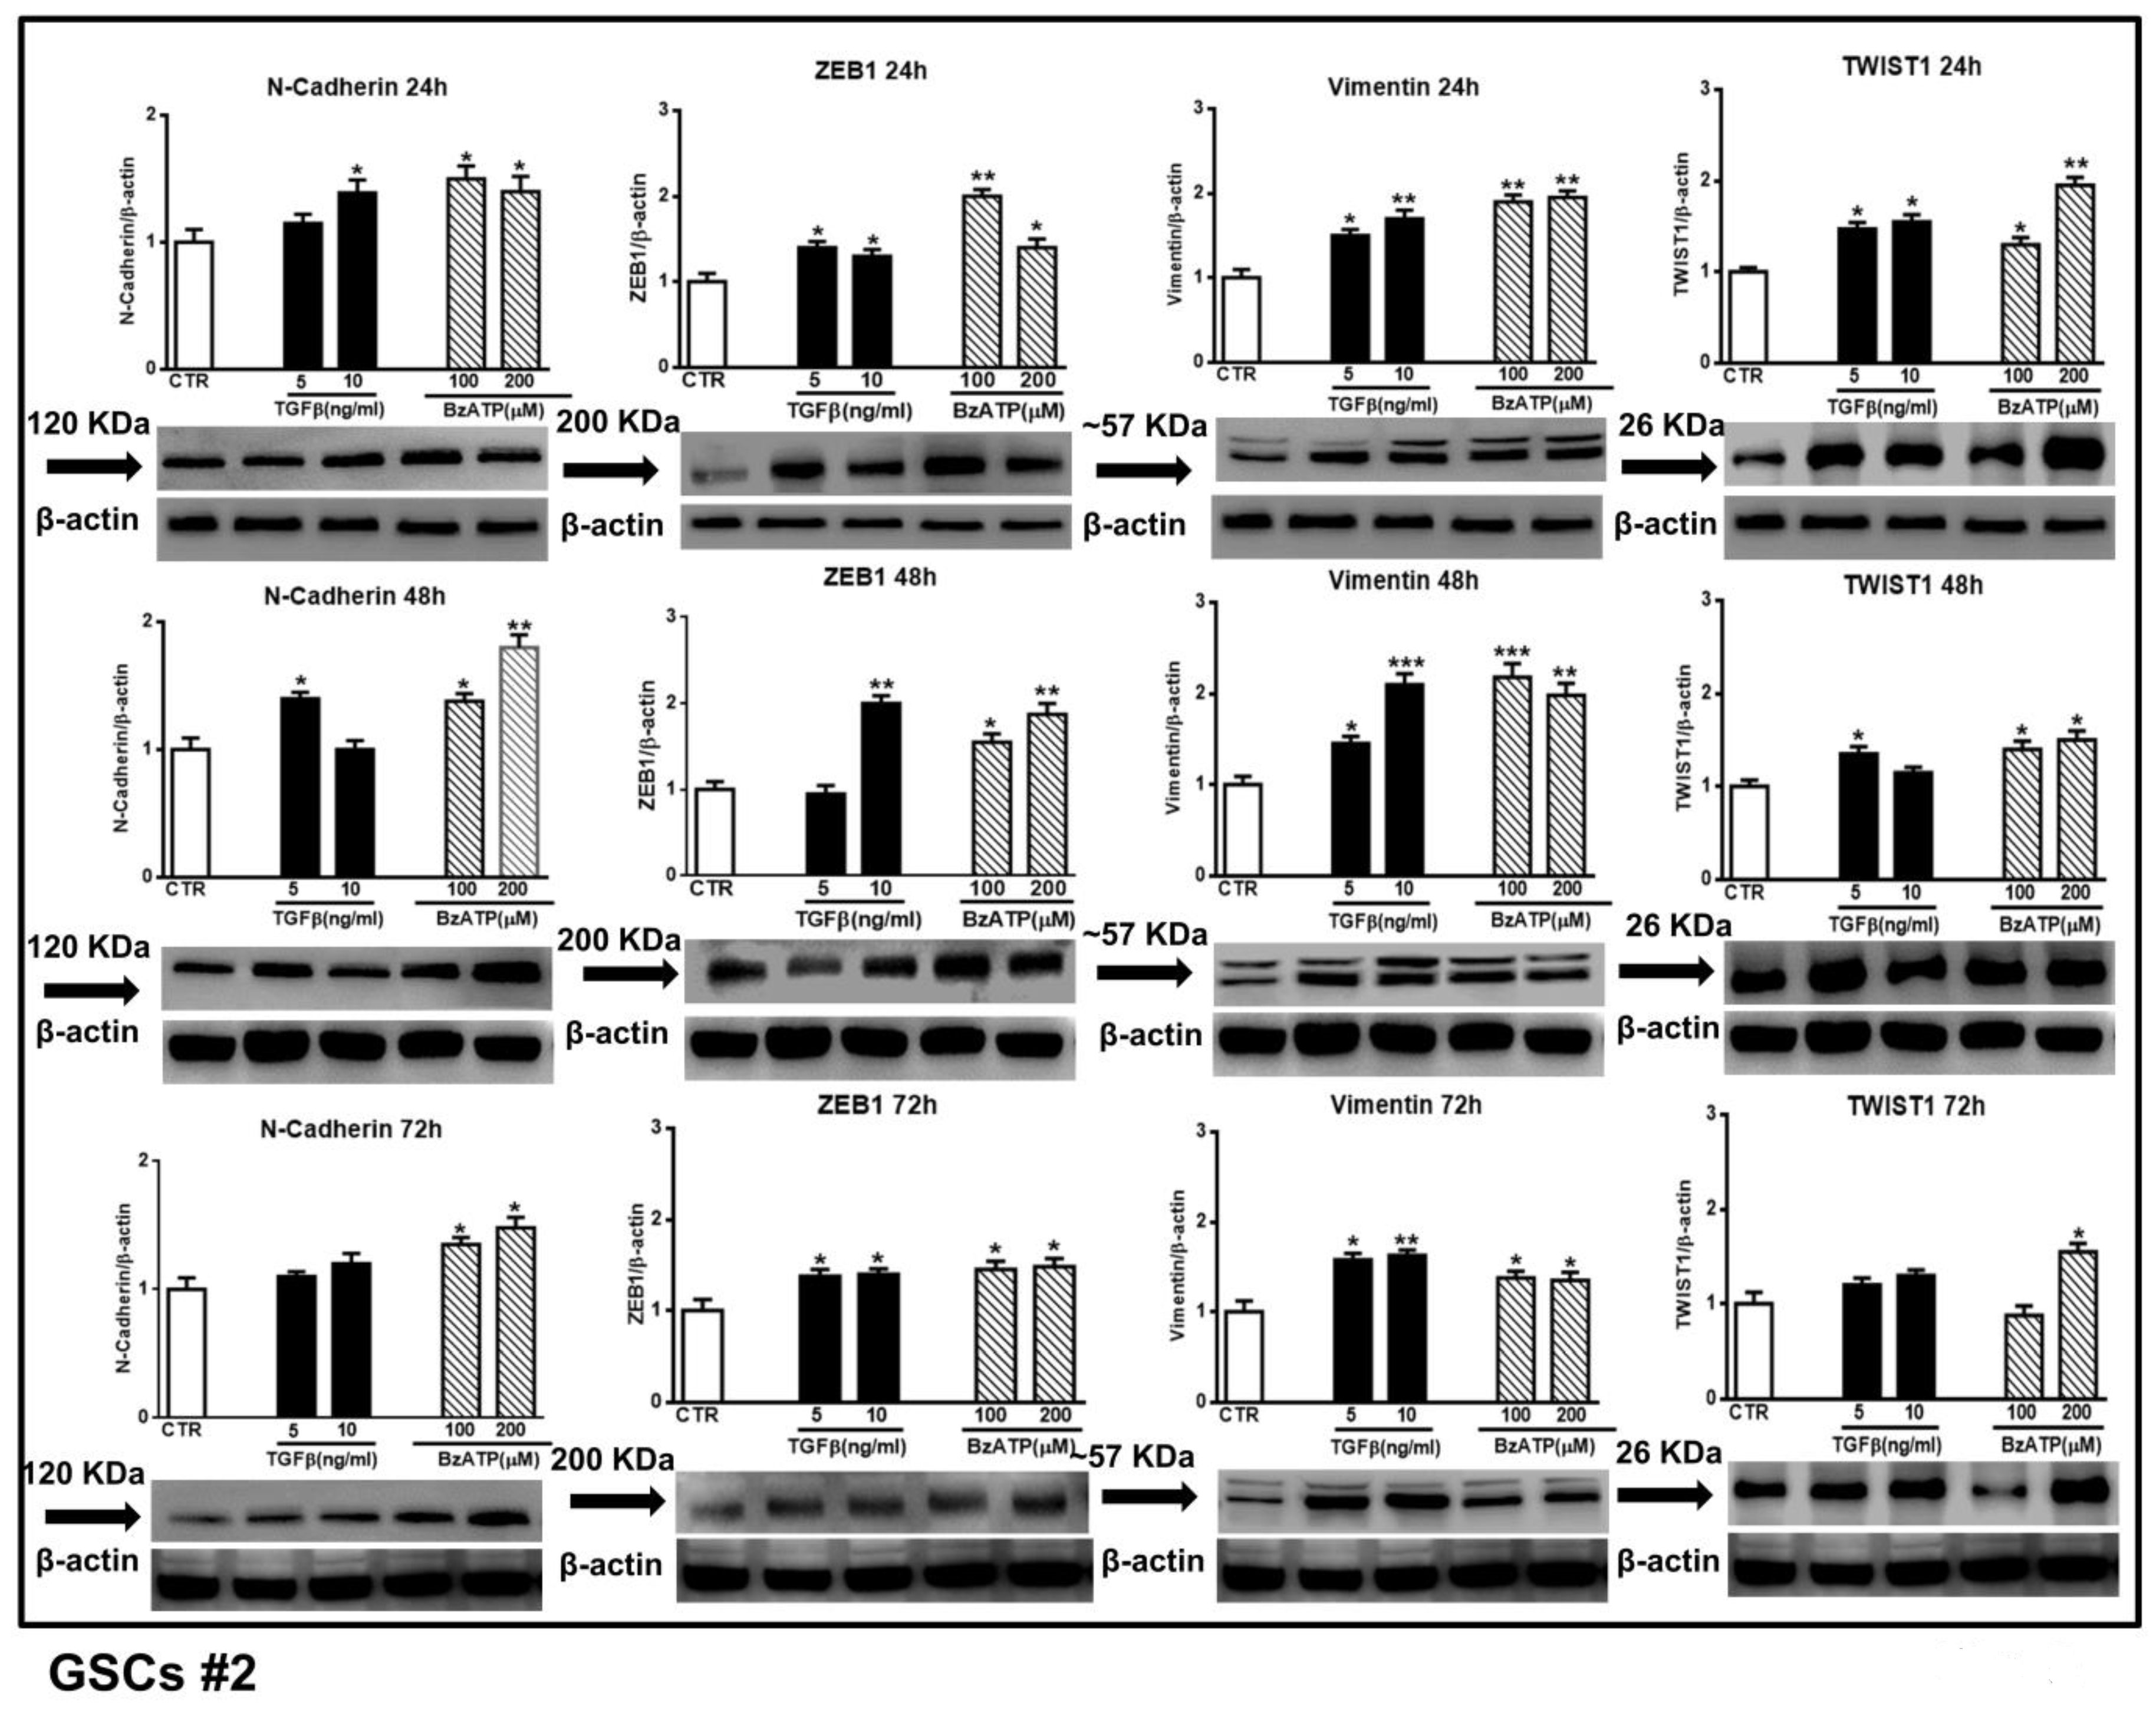
Figure 5.
Effect of TGFβ1 or BzATP on EMT markers evaluated by western blot analysis at different times after drug administration to cultured GSCs #2. After exposure of the cells to different concentrations of TGFβ1 or BzATP, they were harvested at the indicated time periods. The protein levels of selected EMT markers were determined by western blot analysis. Immunoblots were obtained by exposing membranes to appropriate antibodies, recognizing proteins with different molecular weights (indicated close to the immunobands, over the arrows). Immunoblots were then re-probed with an antibody against β actin and quantified by densitometric analysis, the values of which, normalized to β actin used as an internal control, are reported in the histograms, assuming the value of control/β-actin=1. Immunobands reported in the figure are representative of three independent experiments using the same cells. Also in this case, the bands of β-actin are the same for the blots related to the same time point, as they were obtained by cutting the same membrane at different heights corresponding to the molecular weights of the selected markers. *p < 0.05, **p < 0.01, ***p < 0.001: statistical significance vs. untreated GSCs assumed as control (CTR) (one-way ANOVA plus Dunnett’s test).
![Cells 09 00085 g005]()
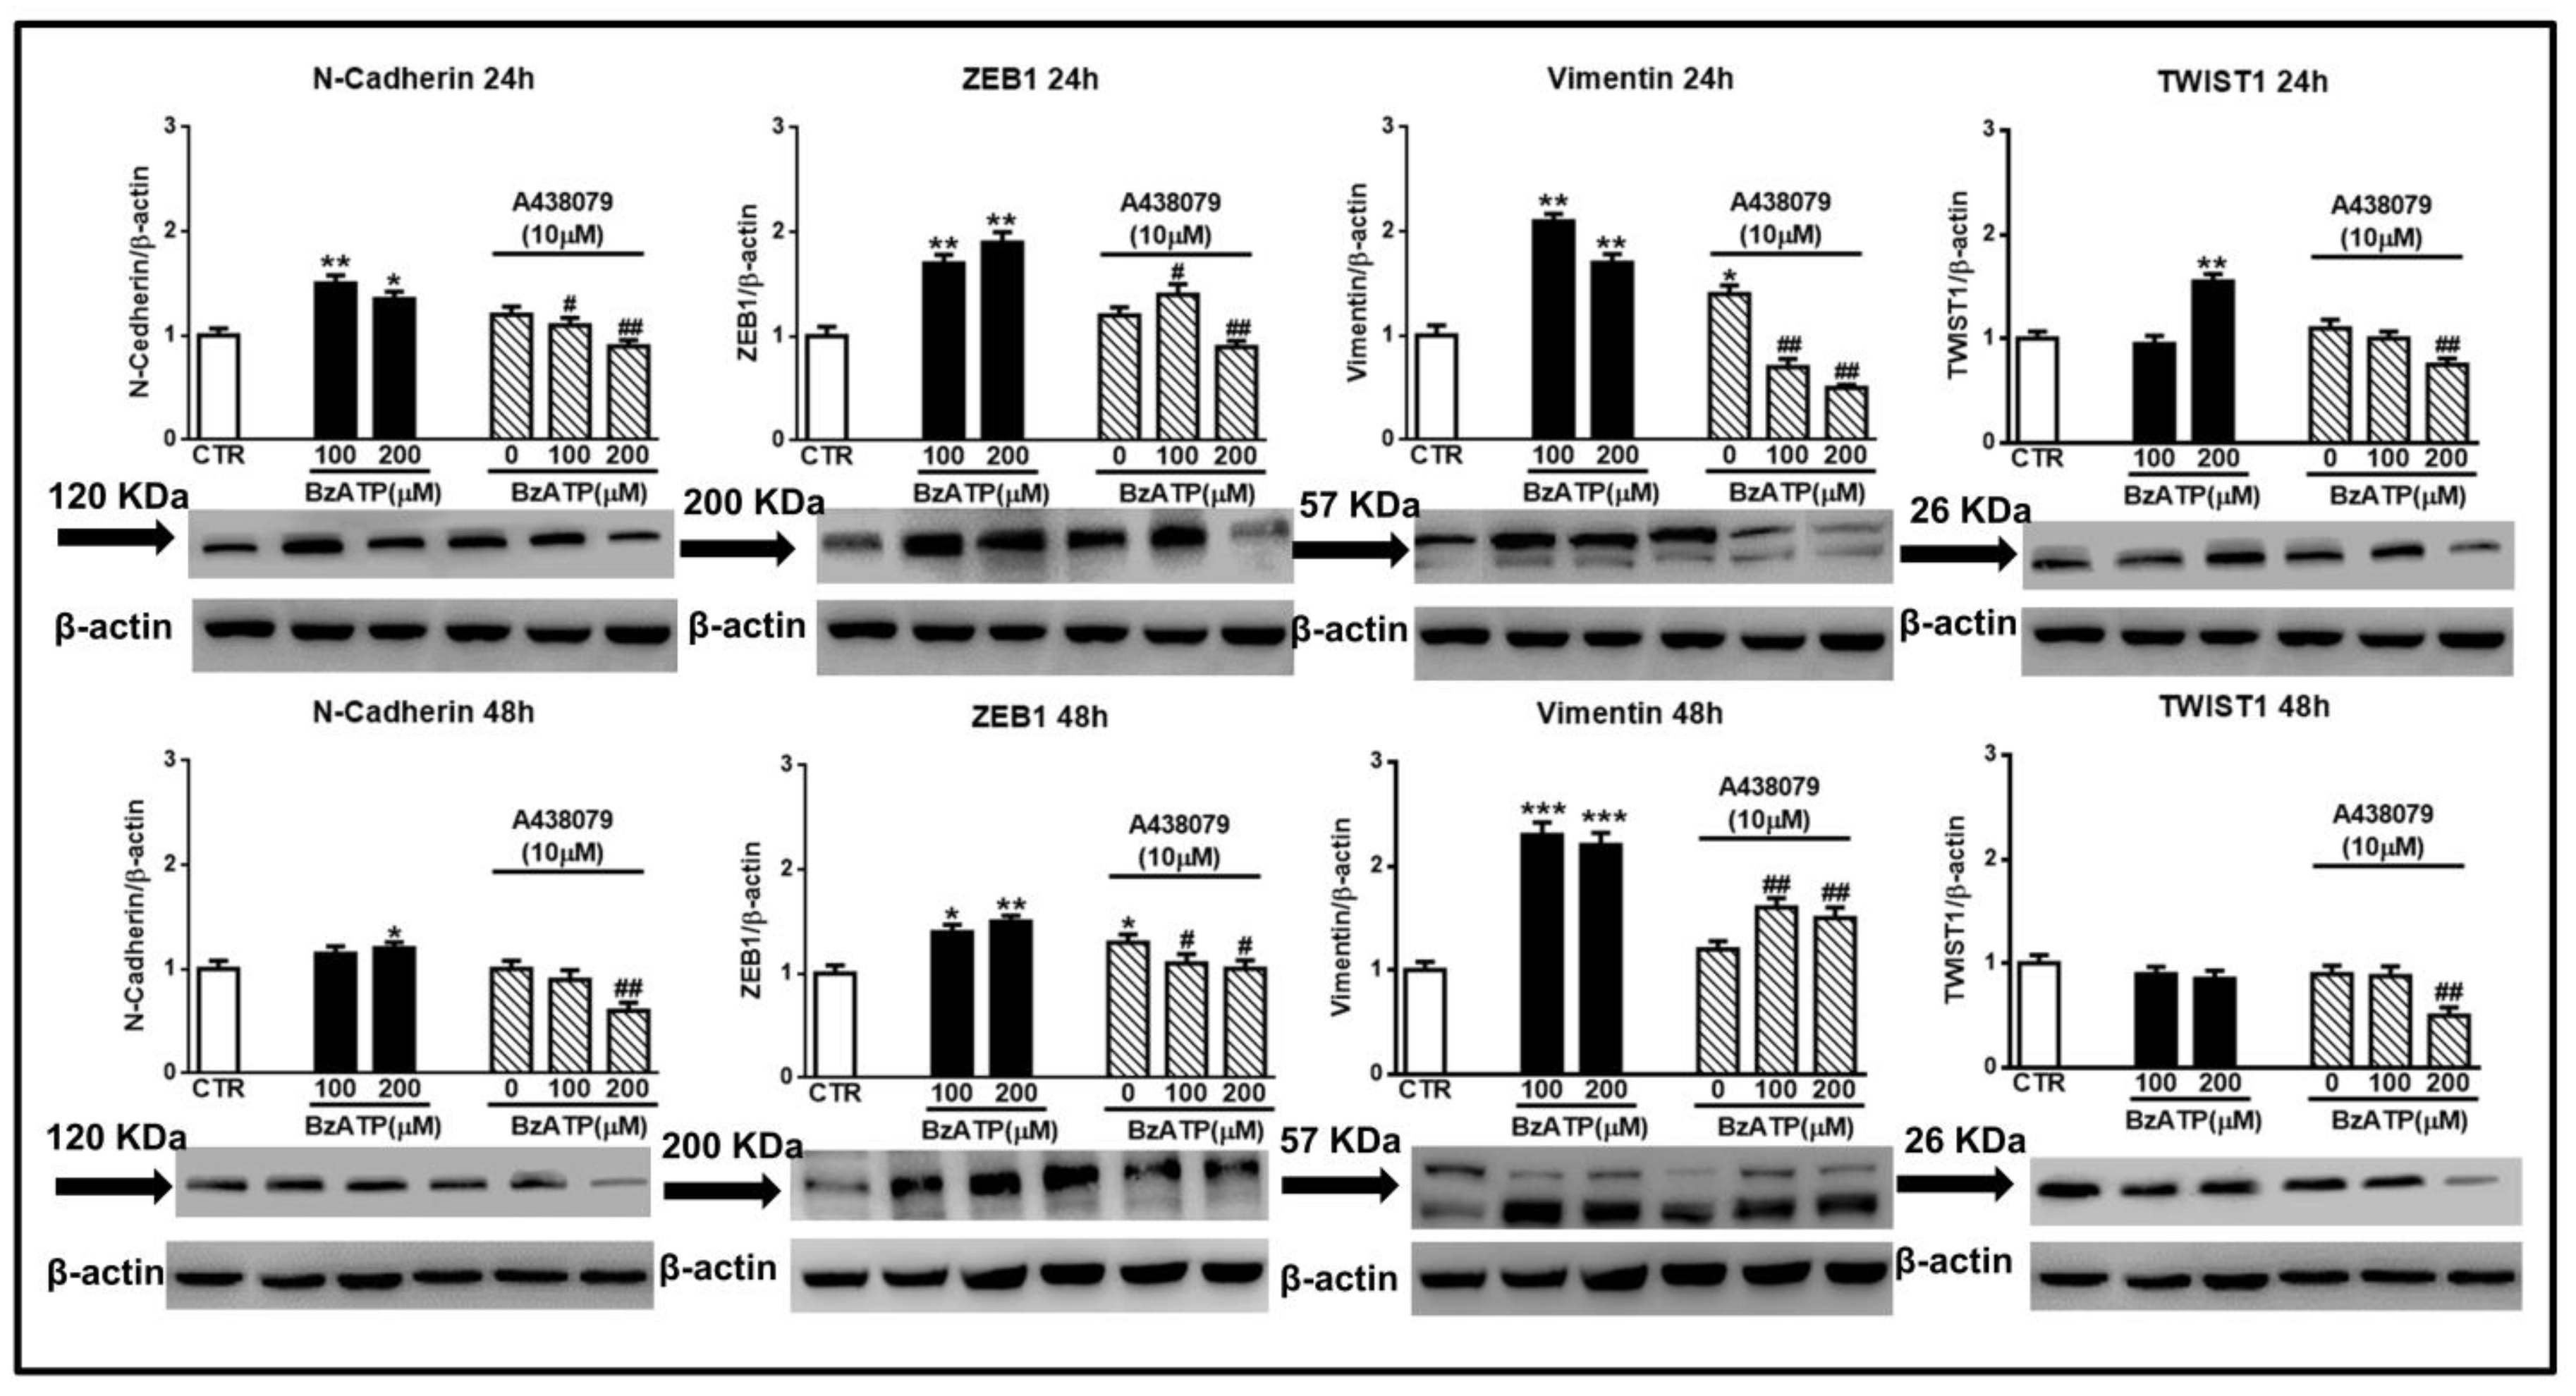
Figure 6.
Blockade of the BzATP effect on EMT markers by the P2X7R selective antagonist A438079. Confluent GSCs were exposed to different concentrations of BzATP, alone or in the presence of the P2X7R antagonist, A438079 added 1 h before BzATP administration. Immunoblots were re-probed with an antibody against β actin, quantified by densitometric analysis, normalized to β actin used as an internal control, and reported in the histograms assuming the value of control/β-actin=1. β-actin bands are the same for some blots reported in the figure, since they were obtained by cutting the same membrane at different heights corresponding to the molecular weights of the selected markers. Immuno-bands reported in the figure are representative of three independent experiments carried out in GSCs #3. *p < 0.05, **p < 0.01, ***p < 0.001: statistical significance vs. untreated GSCs assumed as control (CTR); #p < 0.05, ##p < 0.01: statistical significance vs. GSCs treated with BzATP (one-way ANOVA plus Dunnett’s test).
![Cells 09 00085 g006]()
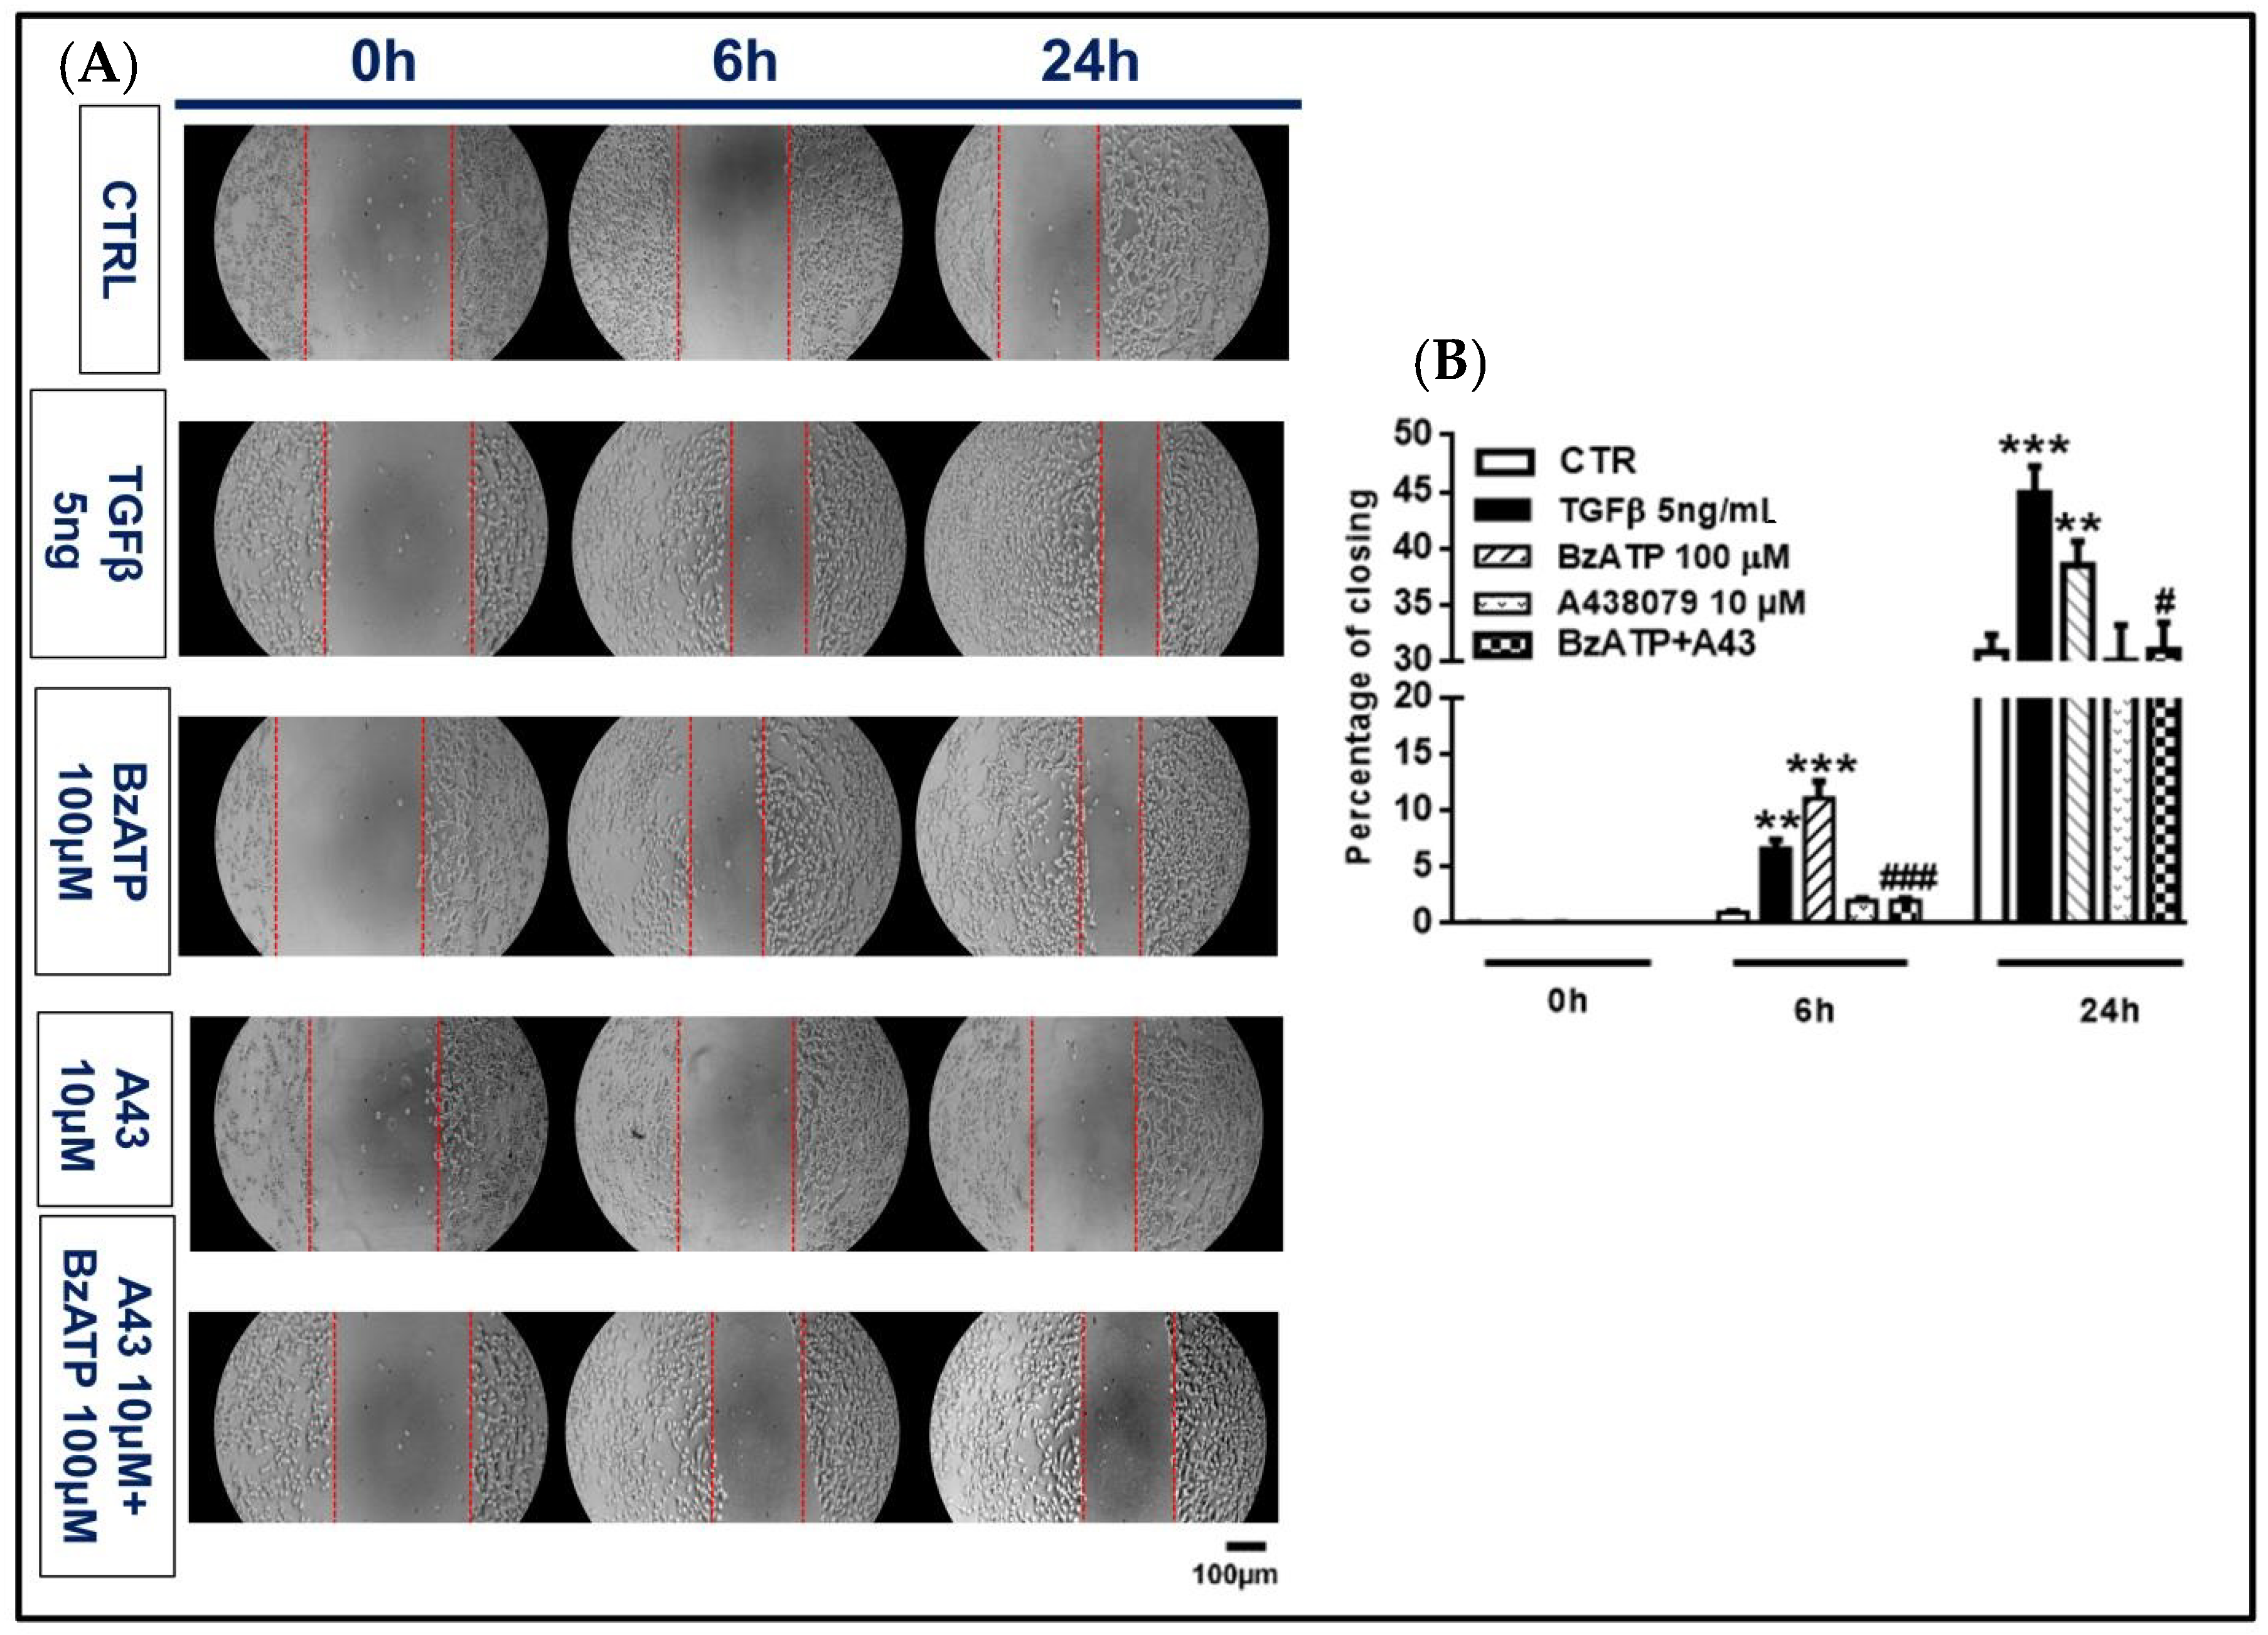
Figure 7.
Effect of TGFβ1 and BzATP on GSC migration evaluated by scratch assay. Nearly confluent GSCs (80%) were incubated in the presence or absence of TGFβ1 or BzATP and when present, the P2X7R antagonist A438079 (A43), was added 1 h prior to the agonist. Cell were then scratch wounded and imaged at indicated times after injury. (A) Images of control and treated cells (GSCs #1) prior to (0 h) and 6 and 24 h after injury are representative of four independent experiments (scale bar = 100 μm for all panels) carried out for each cell type, giving similar results. (B) Quantification of the wound size was performed using ImageJ and graphed as percentage of wound closure. The values in the histograms are given as means± SEM and analyzed by one-way ANOVA and Dunnett’s post hoc test **p < 0.01; ***p < 0.001 vs. control (CTR); #p < 0.05, ###p < 0.001 vs. BzATP. Similar data were obtained using GSCs #2 and #3.
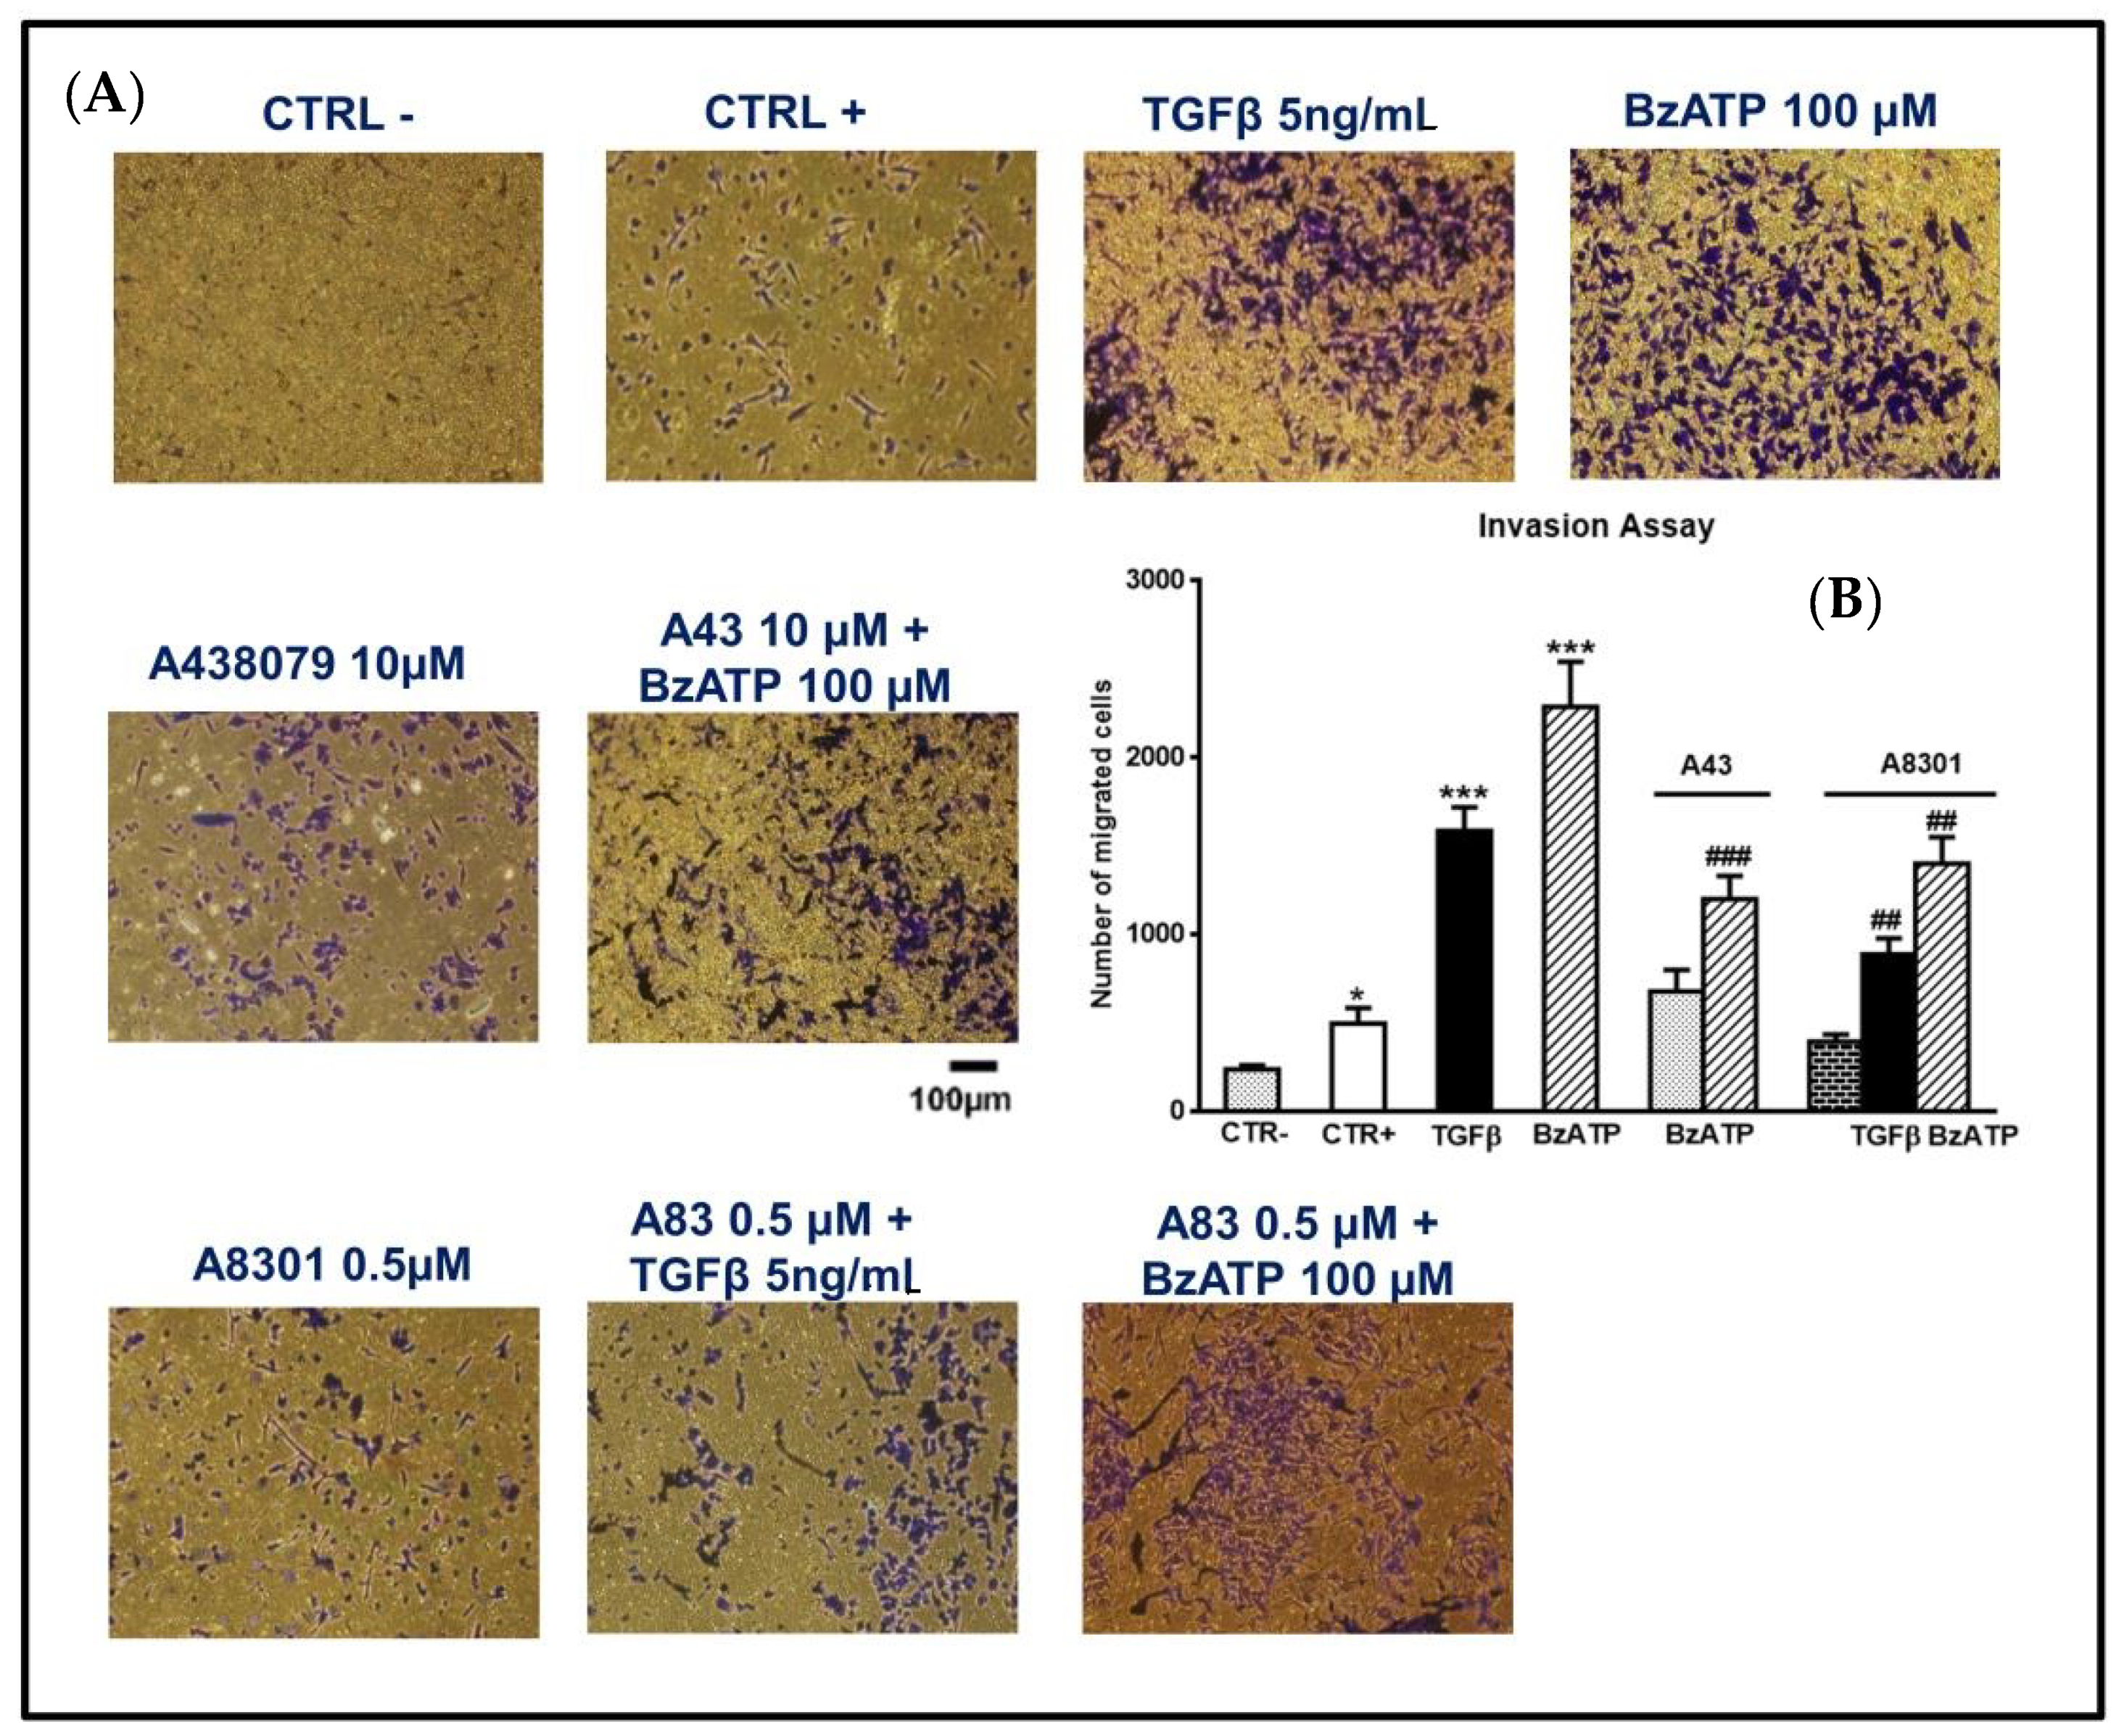
Figure 8.
Effect of TGFβ1 and BzATP on GSC invasiveness evaluated by transwell migration assay. (A) GSCs, plated in the upper surface of a membrane inserted into a suitable plate, were incubated in the usual culture medium alone (CTR-) or in the presence of TGFβ1 or BzATP. In some experiments cells were pretreated with A438079 (A43), a P2X7R antagonist, or A8301 (A83), inhibitor of TGFβ type I receptors, which were added alone and 1 or 2 h, respectively, prior to the further pharmacological treatments. In another set of cells, a high percentage of serum (10%), usually acting as an attractant for cells, was added to the medium and cells were indicated as CTR+. The cells were allowed to migrate to the lower chamber for 24 h. The membranes were then removed and the cells, fixed and stained using crystal violet, were counted under a light microscope (at an average of five semirandom non-overlapping fields at 10x magnification). The images reported in the figure (scale bar = 100 μm) are related to GSCs #2 and are representative of three independent experiments carried out for each cell type, giving similar results. (B) Accordingly, values in the histograms are the mean ± SEM of these independent experiments and have been analyzed by one-way ANOVA and Dunnett’s post hoc test *p < 0.05, ***p < 0.001 vs. control (CTR+); ##p < 0.01; ###p < 0.001 vs. cells treated with TGFβ1 or BzATP.
![Cells 09 00085 g008]()
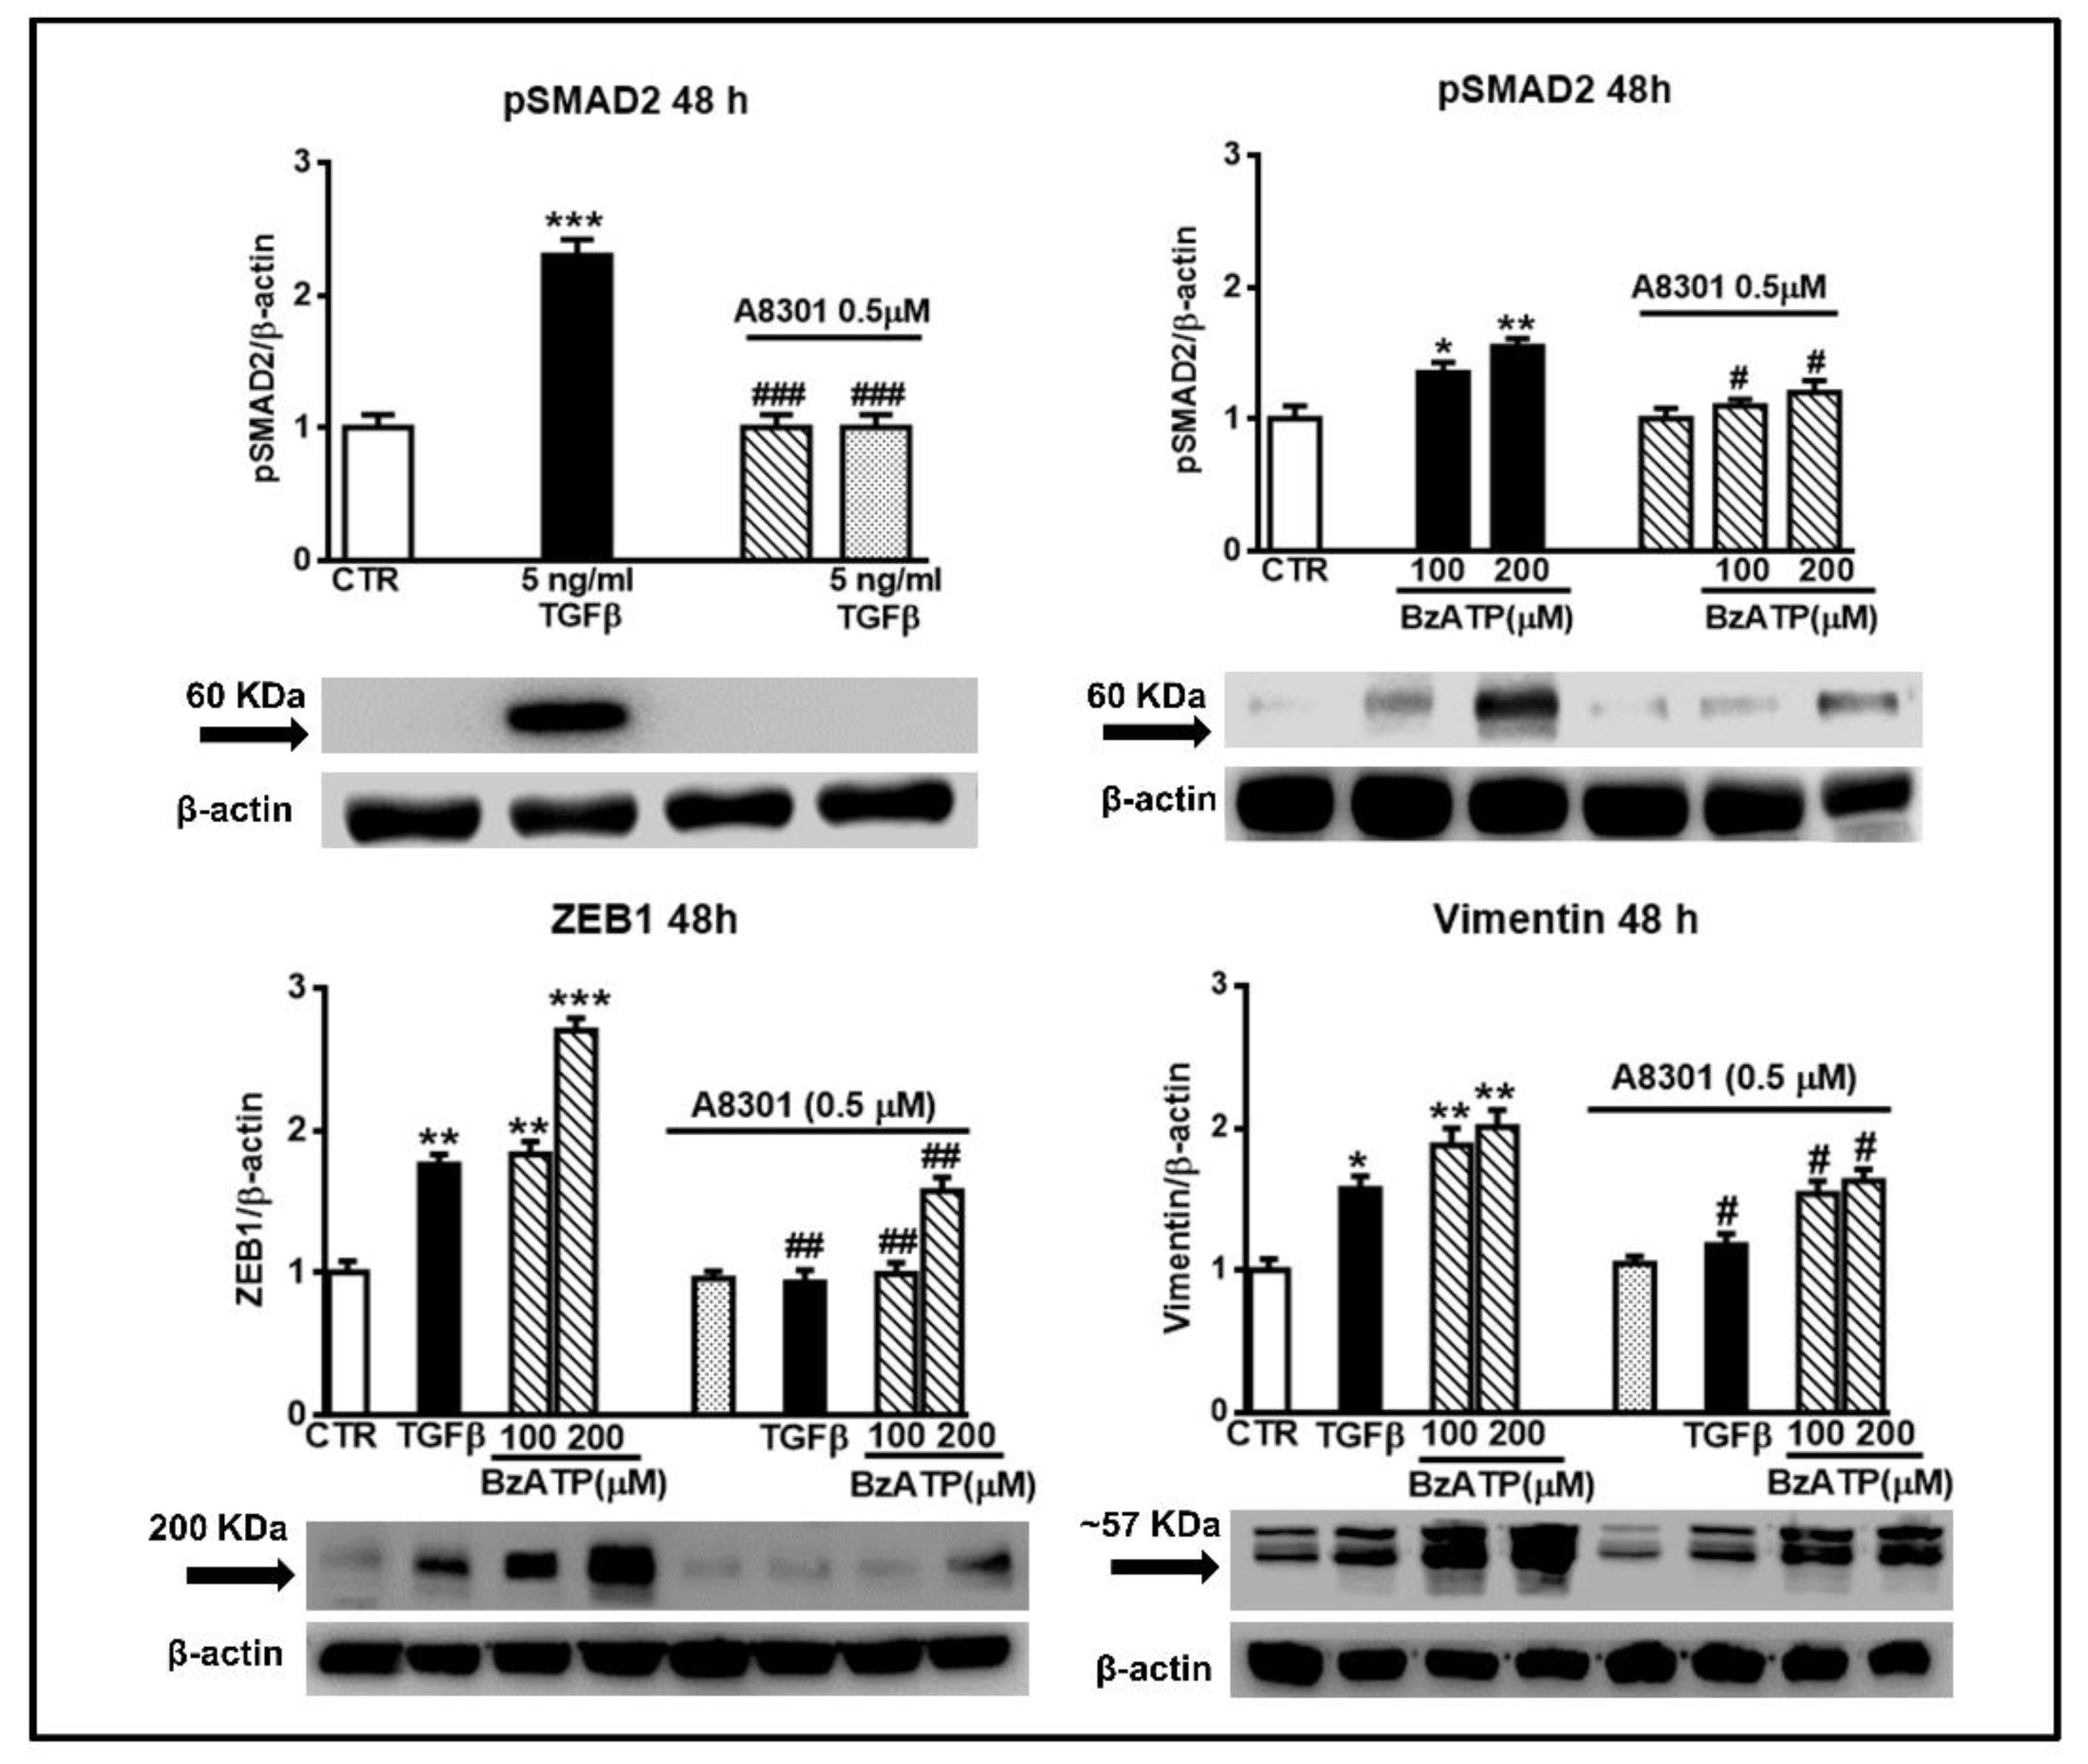
Figure 9.
Increase in SMAD2 phosphorylation is involved in the effects promoted by either TGFβ or BzATP on EMT markers. GSCs were exposed to TGFβ1 or BzATP at the indicated concentrations. In some experiments, cells were pretreated with A8301, inhibitor of TGFβ type I receptors, which was added alone or 2 h prior to the other two drugs. After 48 h, cells were harvested and the protein levels of phosphorylated SMAD2 (pSMAD2) and some EMT markers were determined by western blot analysis. As for pSMAD2, different aliquots of proteins, derived from TGFβ or BzATP treated cells (60 or 80 μg, respectively), were used for the electrophoretic run, to make more evident the BzATP effect. Immunoblots were obtained by exposing membranes to the appropriate antibodies. Then, they were reprobed with an antibody against β actin and quantified by densitometric analysis, the values of which, normalized to β actin used as an internal control, are reported in the histograms, assuming the value of control/β-actin =1. Immunobands in the figure are related to GSCs #2 and are representative of three independent experiments carried out for each cell type giving similar results. *p < 0.05, **p < 0.01, ***p < 0.001: statistical significance vs. untreated GSCs assumed as control (CTR) (one-way ANOVA plus Dunnett’s test); #p < 0.05; ##p < 0.01; ###p < 0.001 vs. cells treated with TGFβ1 or BzATP.
![Cells 09 00085 g009]()
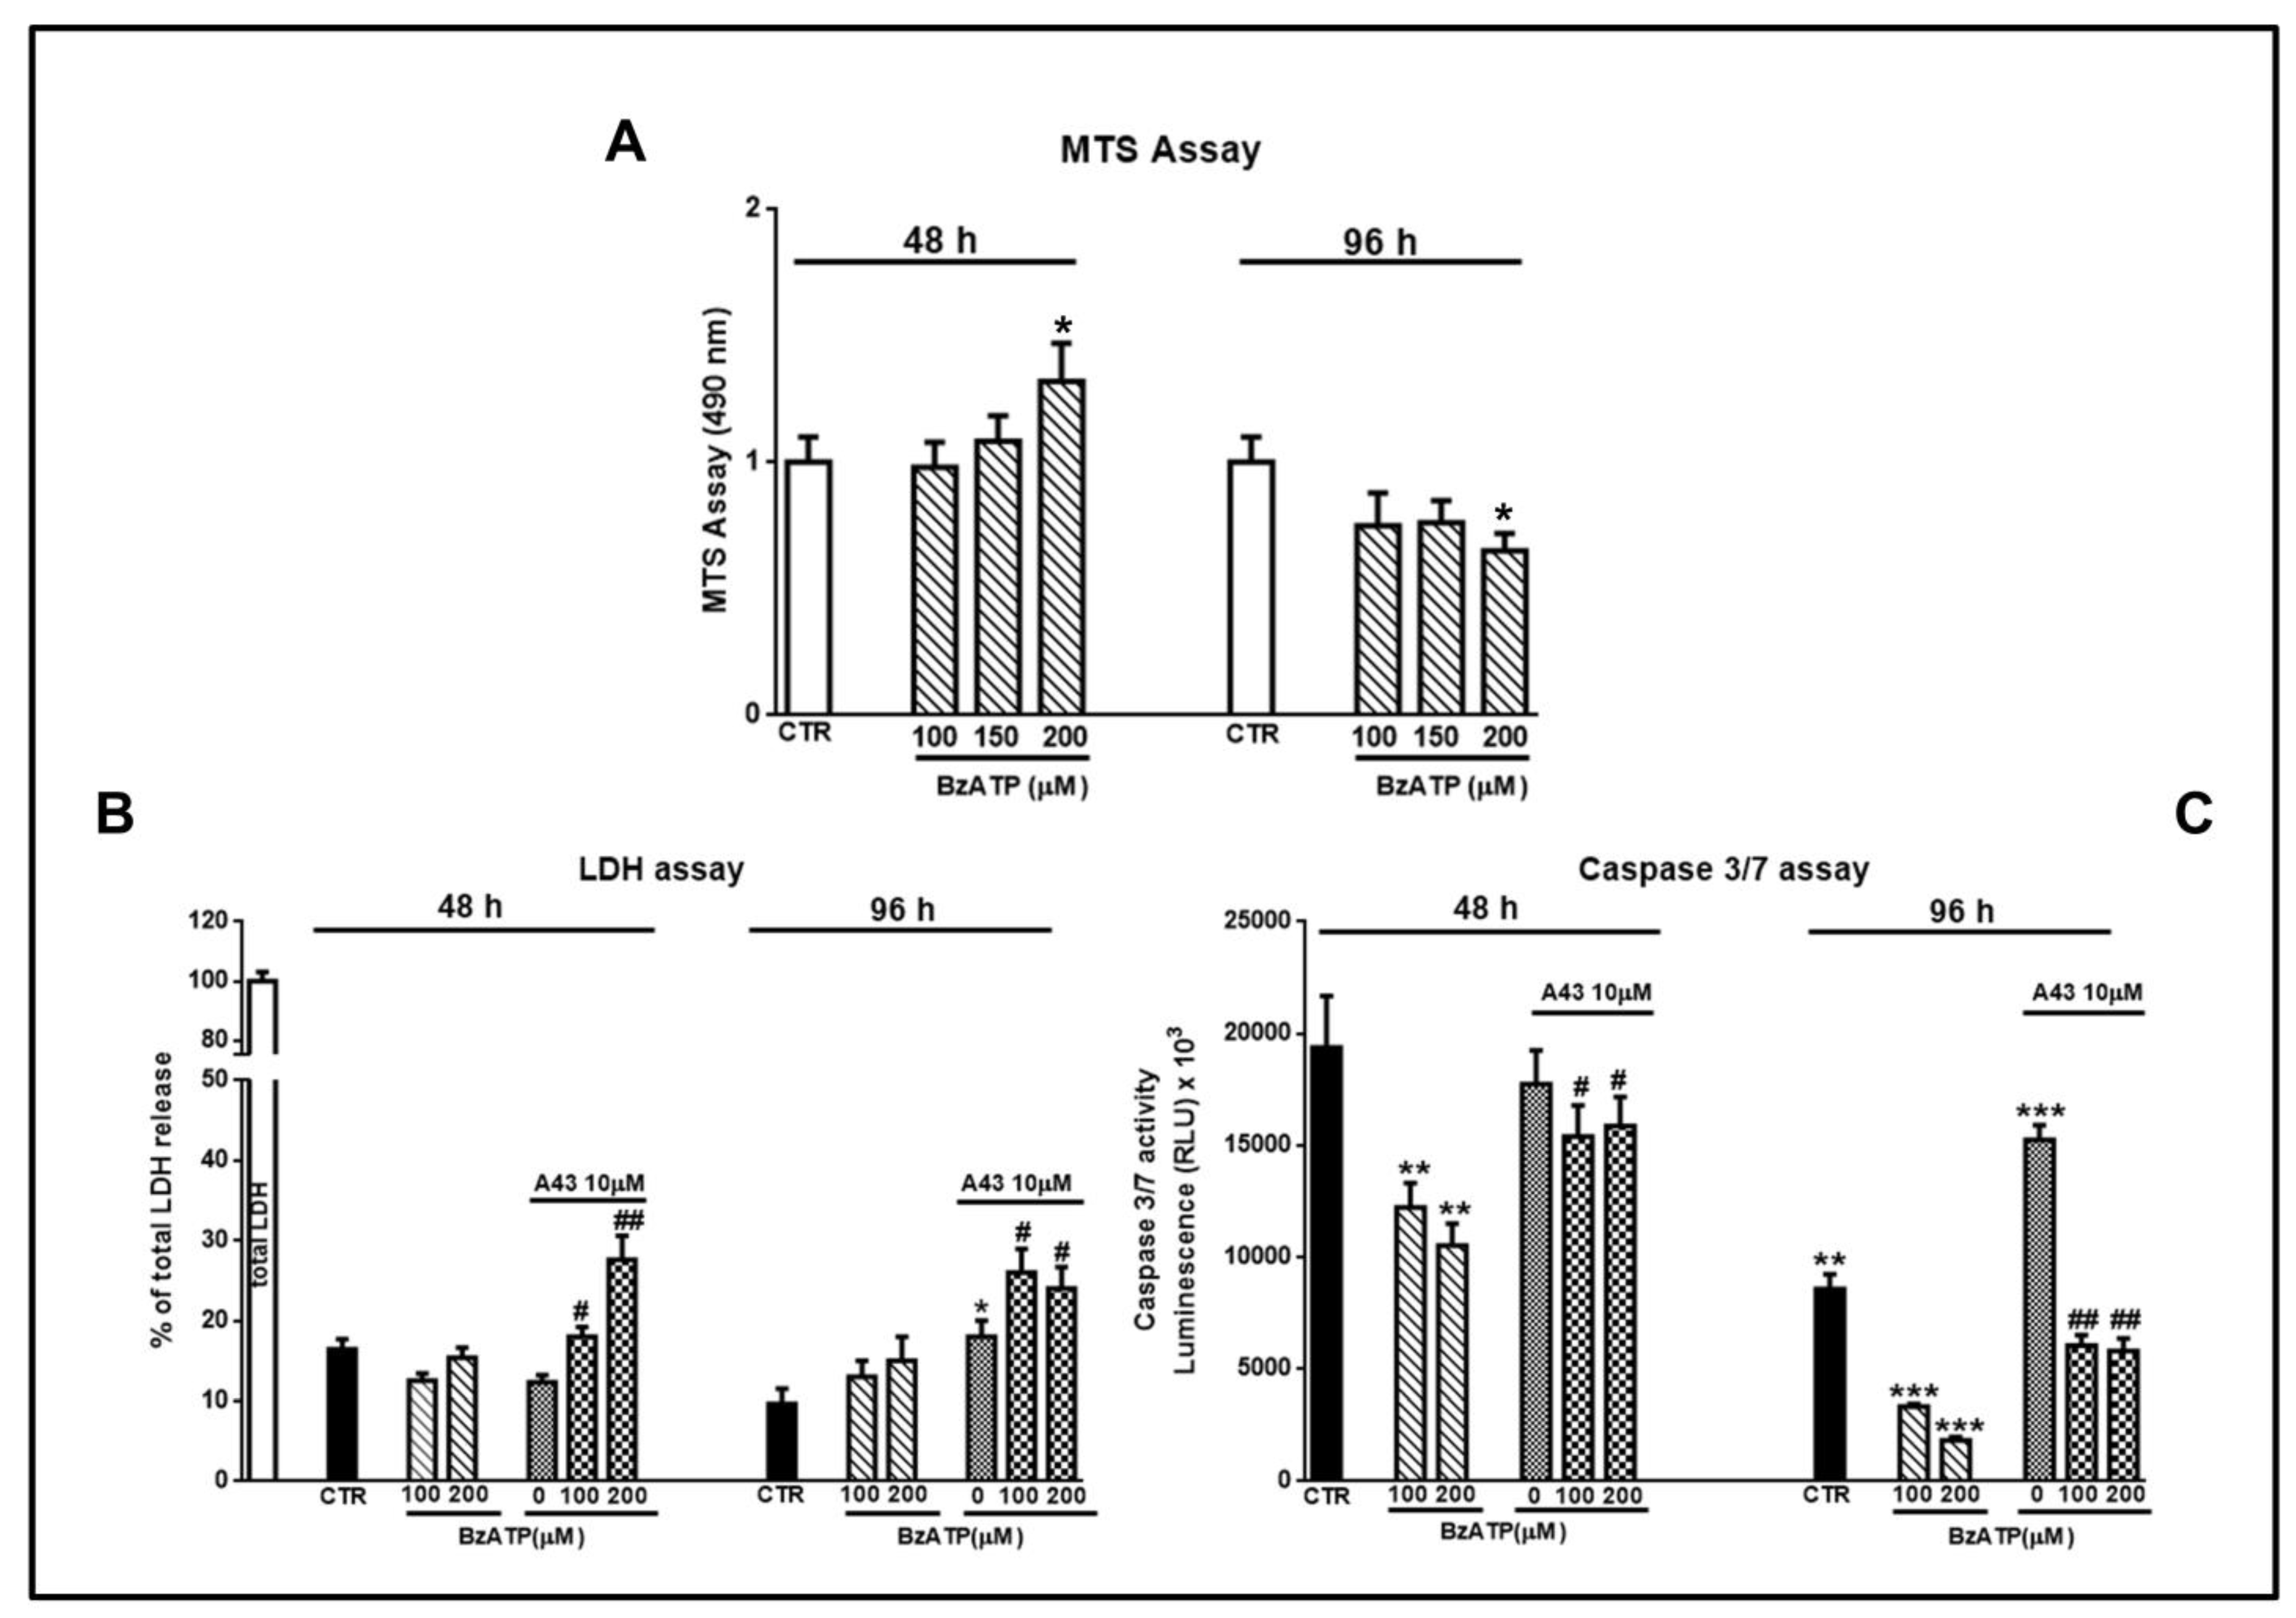
Figure 10.
Evaluation of cell viability and of necrotic or apoptotic death induced by GSC exposure to BzATP. GSCs were treated with BzATP and in some experiments they were pretreated with the P2X7 receptor (P2X7R) antagonist A438079, administered 1 h prior to the agonist. After different times from the beginning of the pharmacological treatments cell viability (A), cell necrosis or apoptosis (B,C) respectively were assayed. (A) Cell medium was removed at the end of each time period and 3-[4,5-dimethylthiazol-2-yl]-5-[3-carboxymethoxy phenyl]-2-[4-sulfophenyl]-2H-tetrazolium (MTS) assay was performed. The values obtained by optical density at 490 nm for each sample are reported in the histograms, assuming the value of control = 1. (B) LDH release from cells, assumed as an index of necrotic death, was measured as reported in the Methods section. Values are expressed as the percentage of the total amount of the enzyme released in the medium from the cells after their lysis. (C) Apoptic death was assessed by the evaluation of the release of caspase 3 and 7, the most involved in this process, by luminescence using a commercial kit and following the manufacturer’s instruction. All values in the histograms are related to GSCs #3, but similar findings were obtained using cells #1 or #2. They are expressed as the mean ± S.E.M. of four independent experiments in which each sample was tested in triplicate. *p < 0.05, **p < 0.01, ***p < 0.001: statistical significance vs. untreated cells; #p < 0.05, ##p < 0.01: statistical significance vs. cells treated with BzATP (one-way ANOVA plus Dunnett’s test).
![Cells 09 00085 g010]()
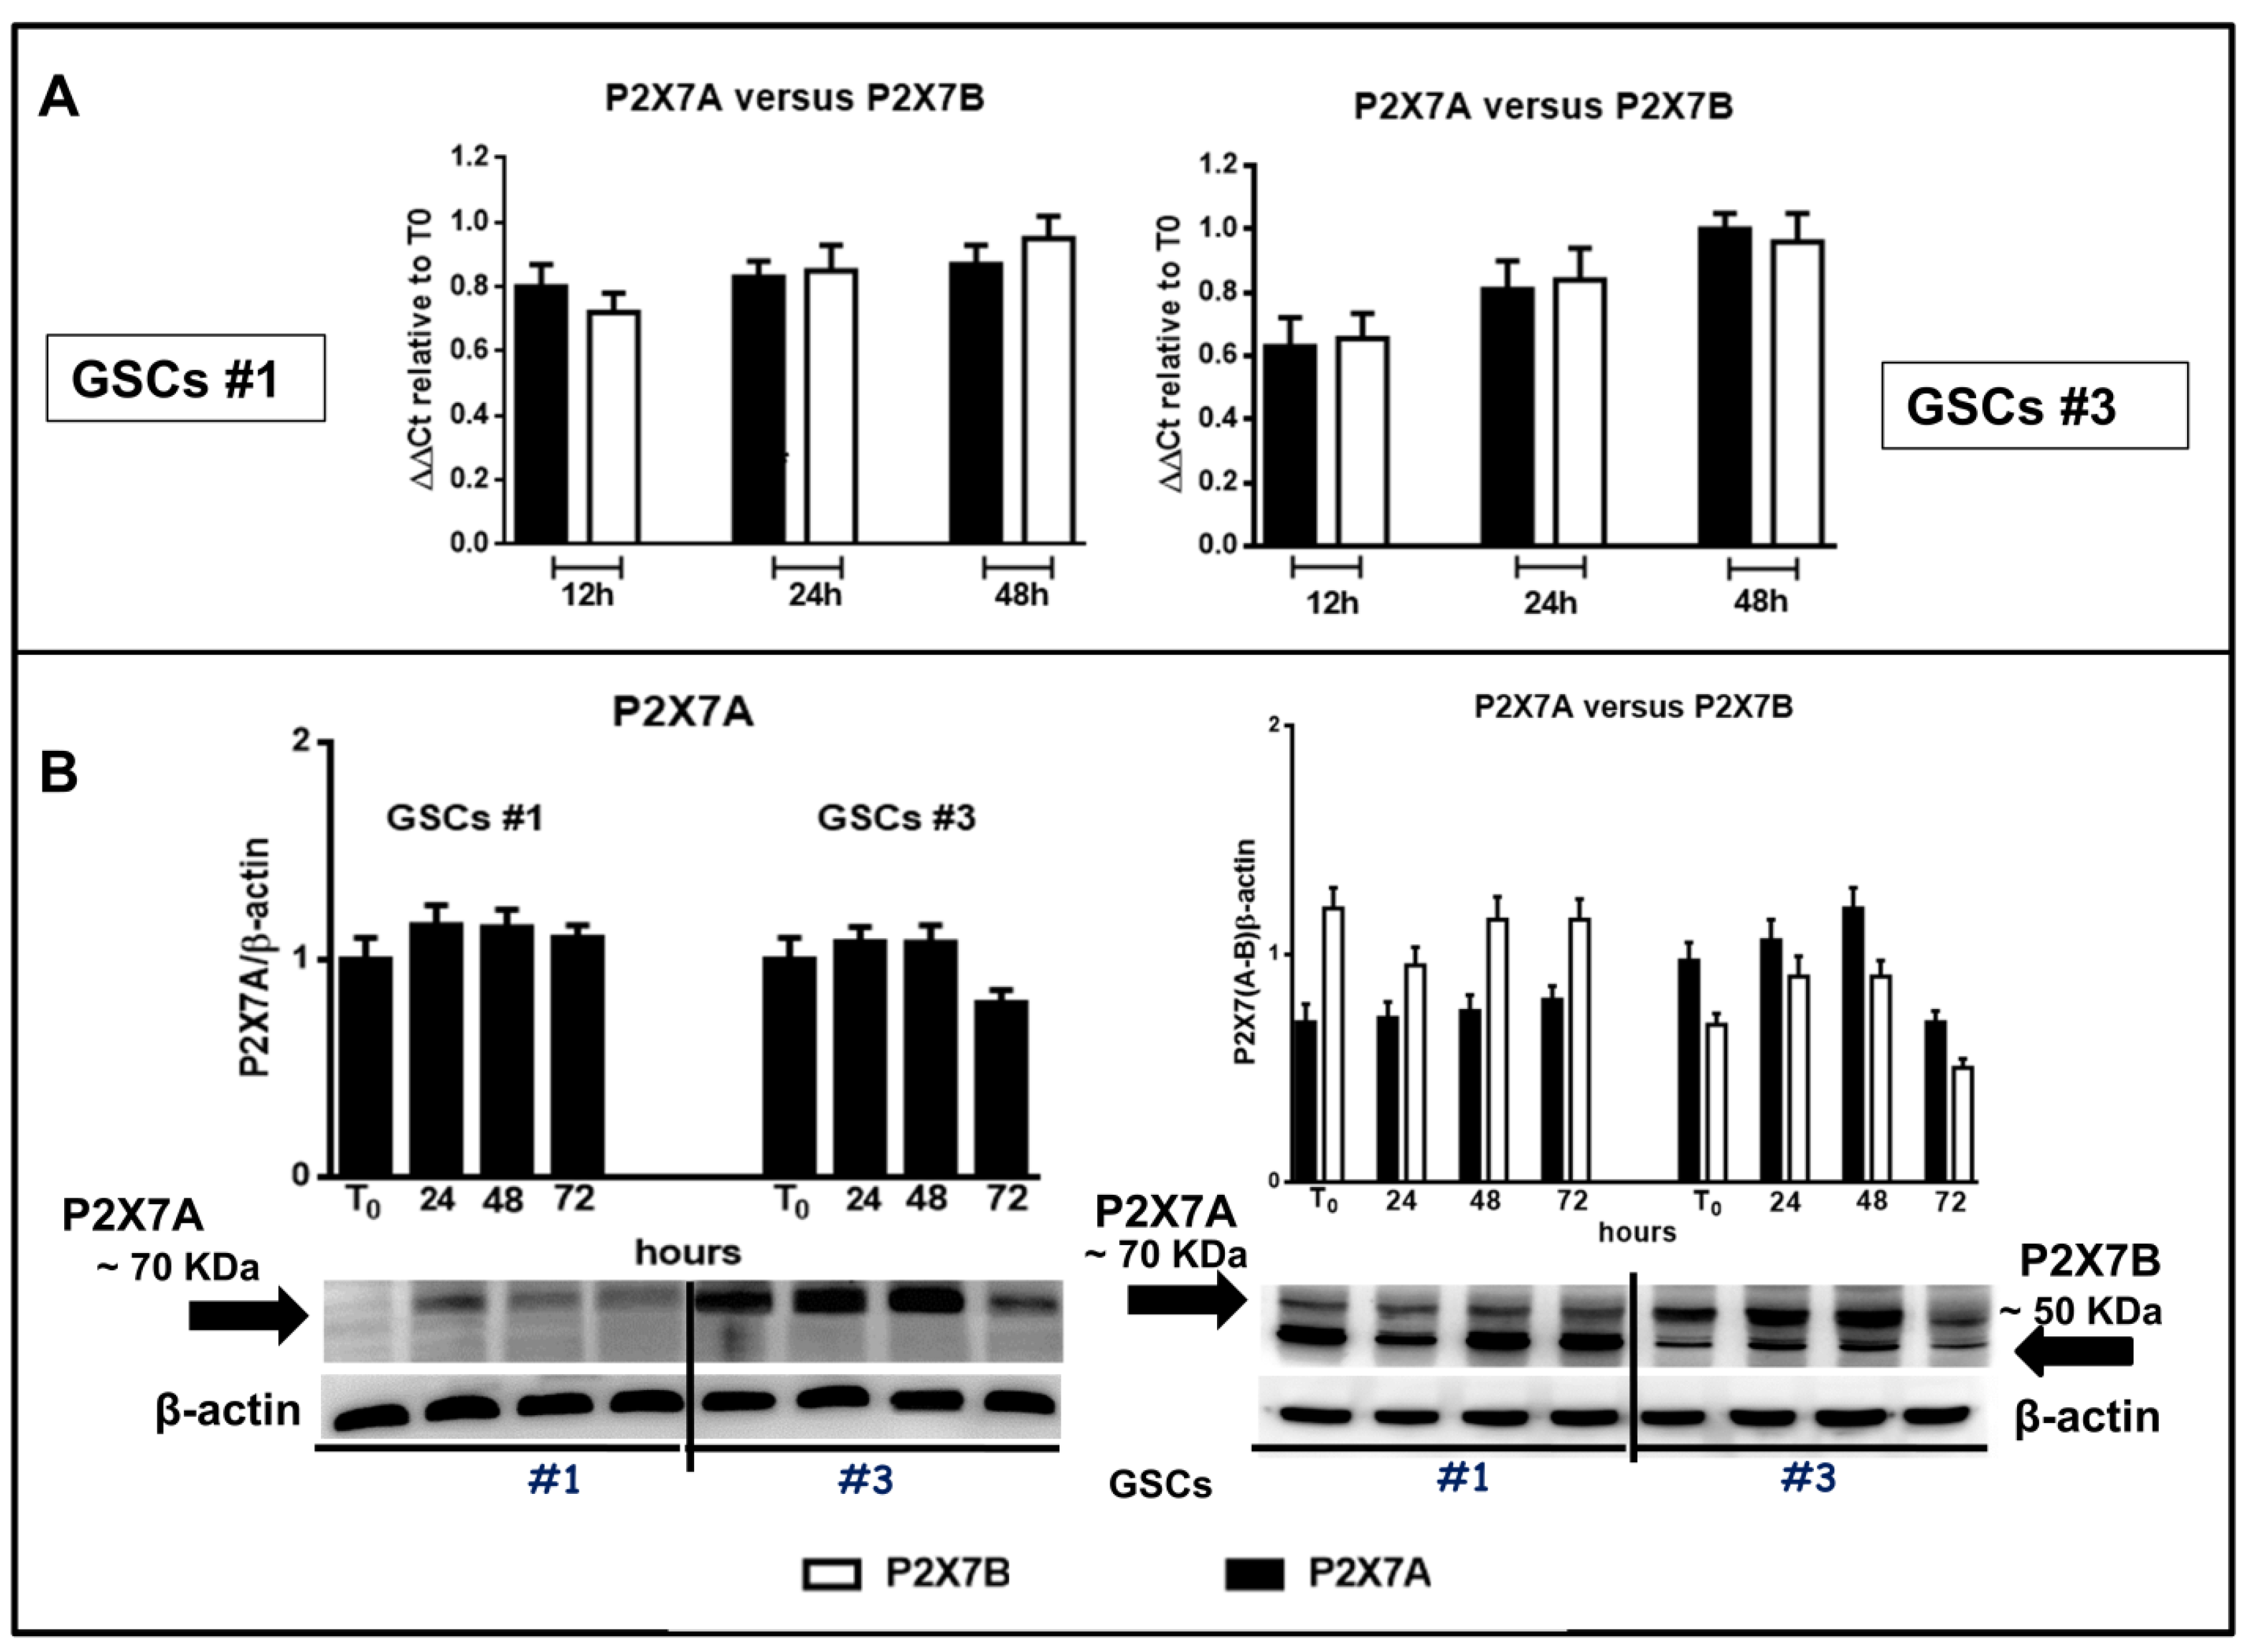
Figure 11.
Expression of the two main human splice variants P2X7R A and B in GSCs. Confluent GSCs were harvested at different time periods to obtain their mRNA or proteins. (A) by qRT-PCR the evaluation of the mRNA levels was performed in relation to the principal P2X7R splice variants in humans that are the full-length form P2X7A and the truncated form (lacking the carboxy-terminal tail) P2X7B in GSCs #1 and #3 (panels on left or right, respectively). mRNA levels were normalized by using the house keeping β2-microglobulin as endogenous control. Values, calculated as fold of increase vs. those measured in cells at the beginning of the experiments (time 0) are the mean ± S.E.M. of 3 independent experiments performed using the cells above mentioned. Each sample was tested in duplicate. (B) protein levels of P2X7A and P2X7B monomers were determined by western blot analysis. Immunoblots were obtained by exposing membranes to two polyclonal antibodies, one recognizing among the others proteins at about 70 KDa and the second one recognizing proteins at about 70 and 50 KDa, respectively. Subsequently, immunoblots were re-probed with an antibody against β actin, to verify equal sample loading, and quantified by densitometric analysis. These values were then normalized to β actin and reported as such as for the histograms related to blots in which both P2X7R A and B subunits were recognized, whereas for the blots related to the only P2X7AR subunit the value were calculated assuming the ratio (cells at T0)/β-actin = 1. All values are the mean ± SEM of three independent experiments for each cell type.
![Cells 09 00085 g011]()
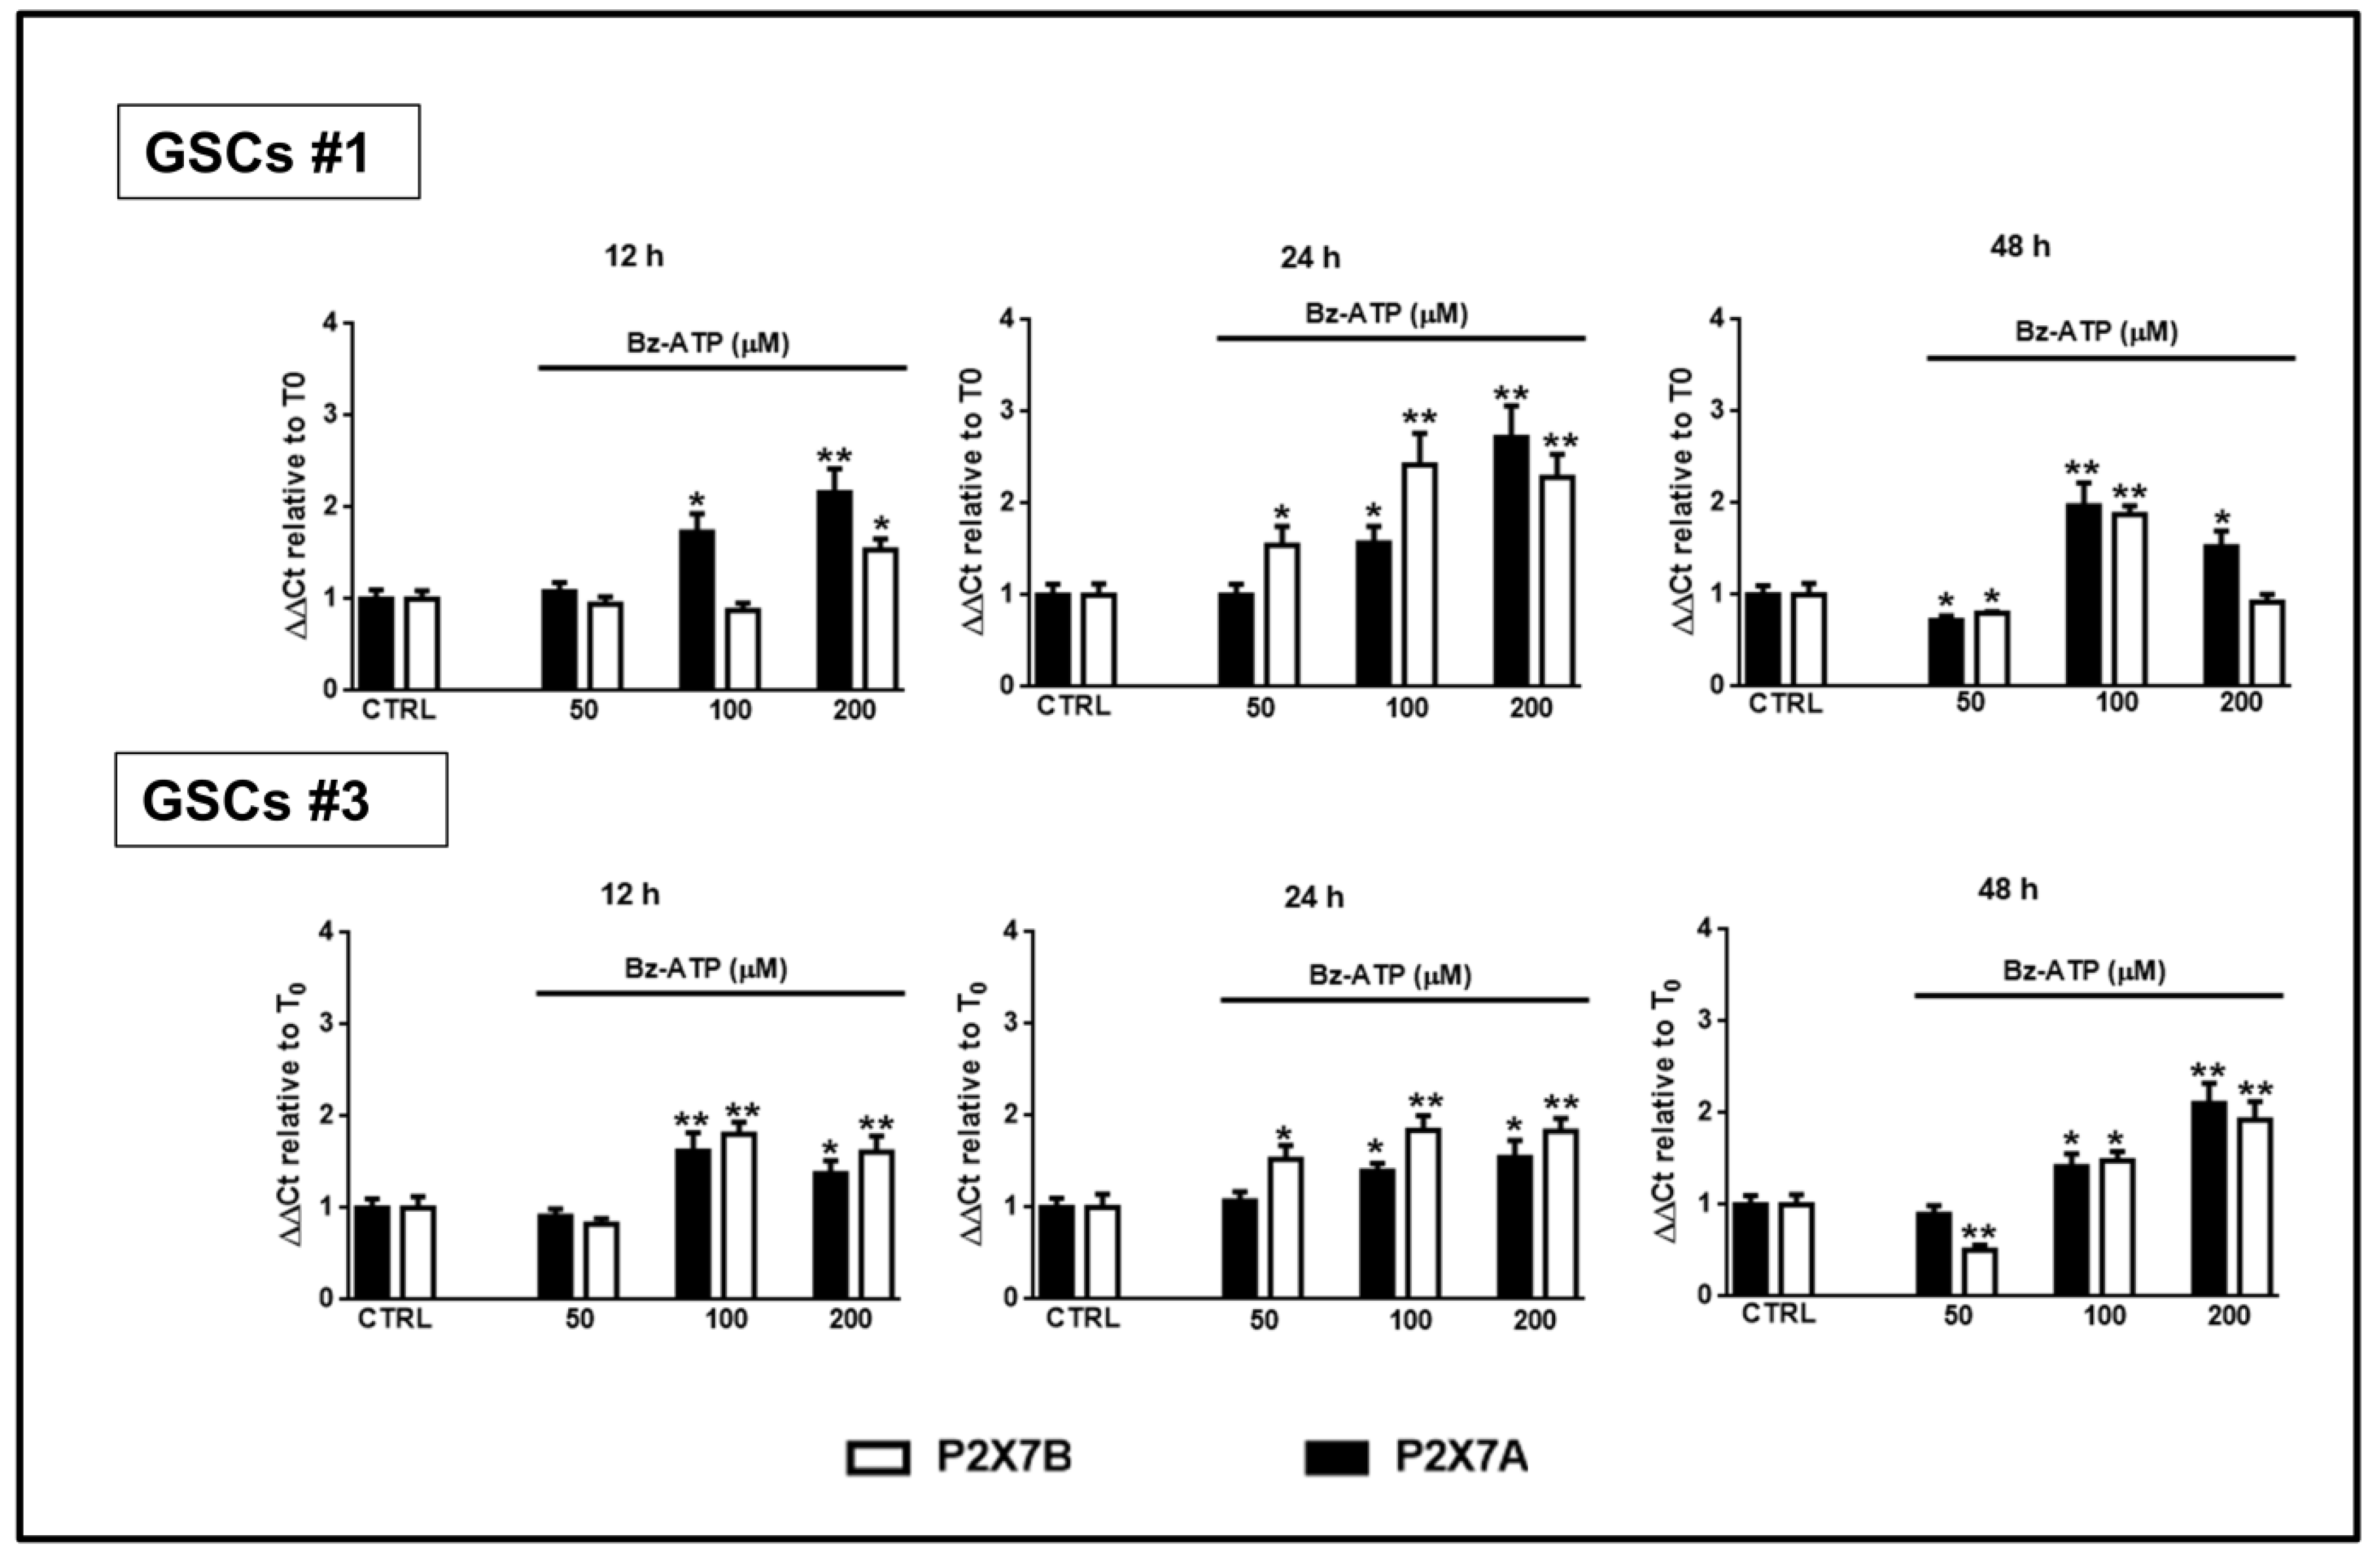
Figure 12.
Modulation of the expression of the P2X7R splice variants A and B in GSCs exposed to BzATP. GSCs #1 and #3 were exposed to BzATP. At the indicated time points cells were collected to obtain their mRNA that was analyzed for the gene expression of the two splice variants P2X7R A and B. mRNA levels were normalized by using the house keeping β2-microglobulin as endogenous control. Values, calculated as fold of increase vs. untreated cells (CTR assumed as = 1), are the mean ± S.E.M. of three independent experiments in which each sample was tested in duplicate. *p < 0.05, **p < 0.01: statistical significance vs. untreated cells (one-way ANOVA plus Dunnett’s test).
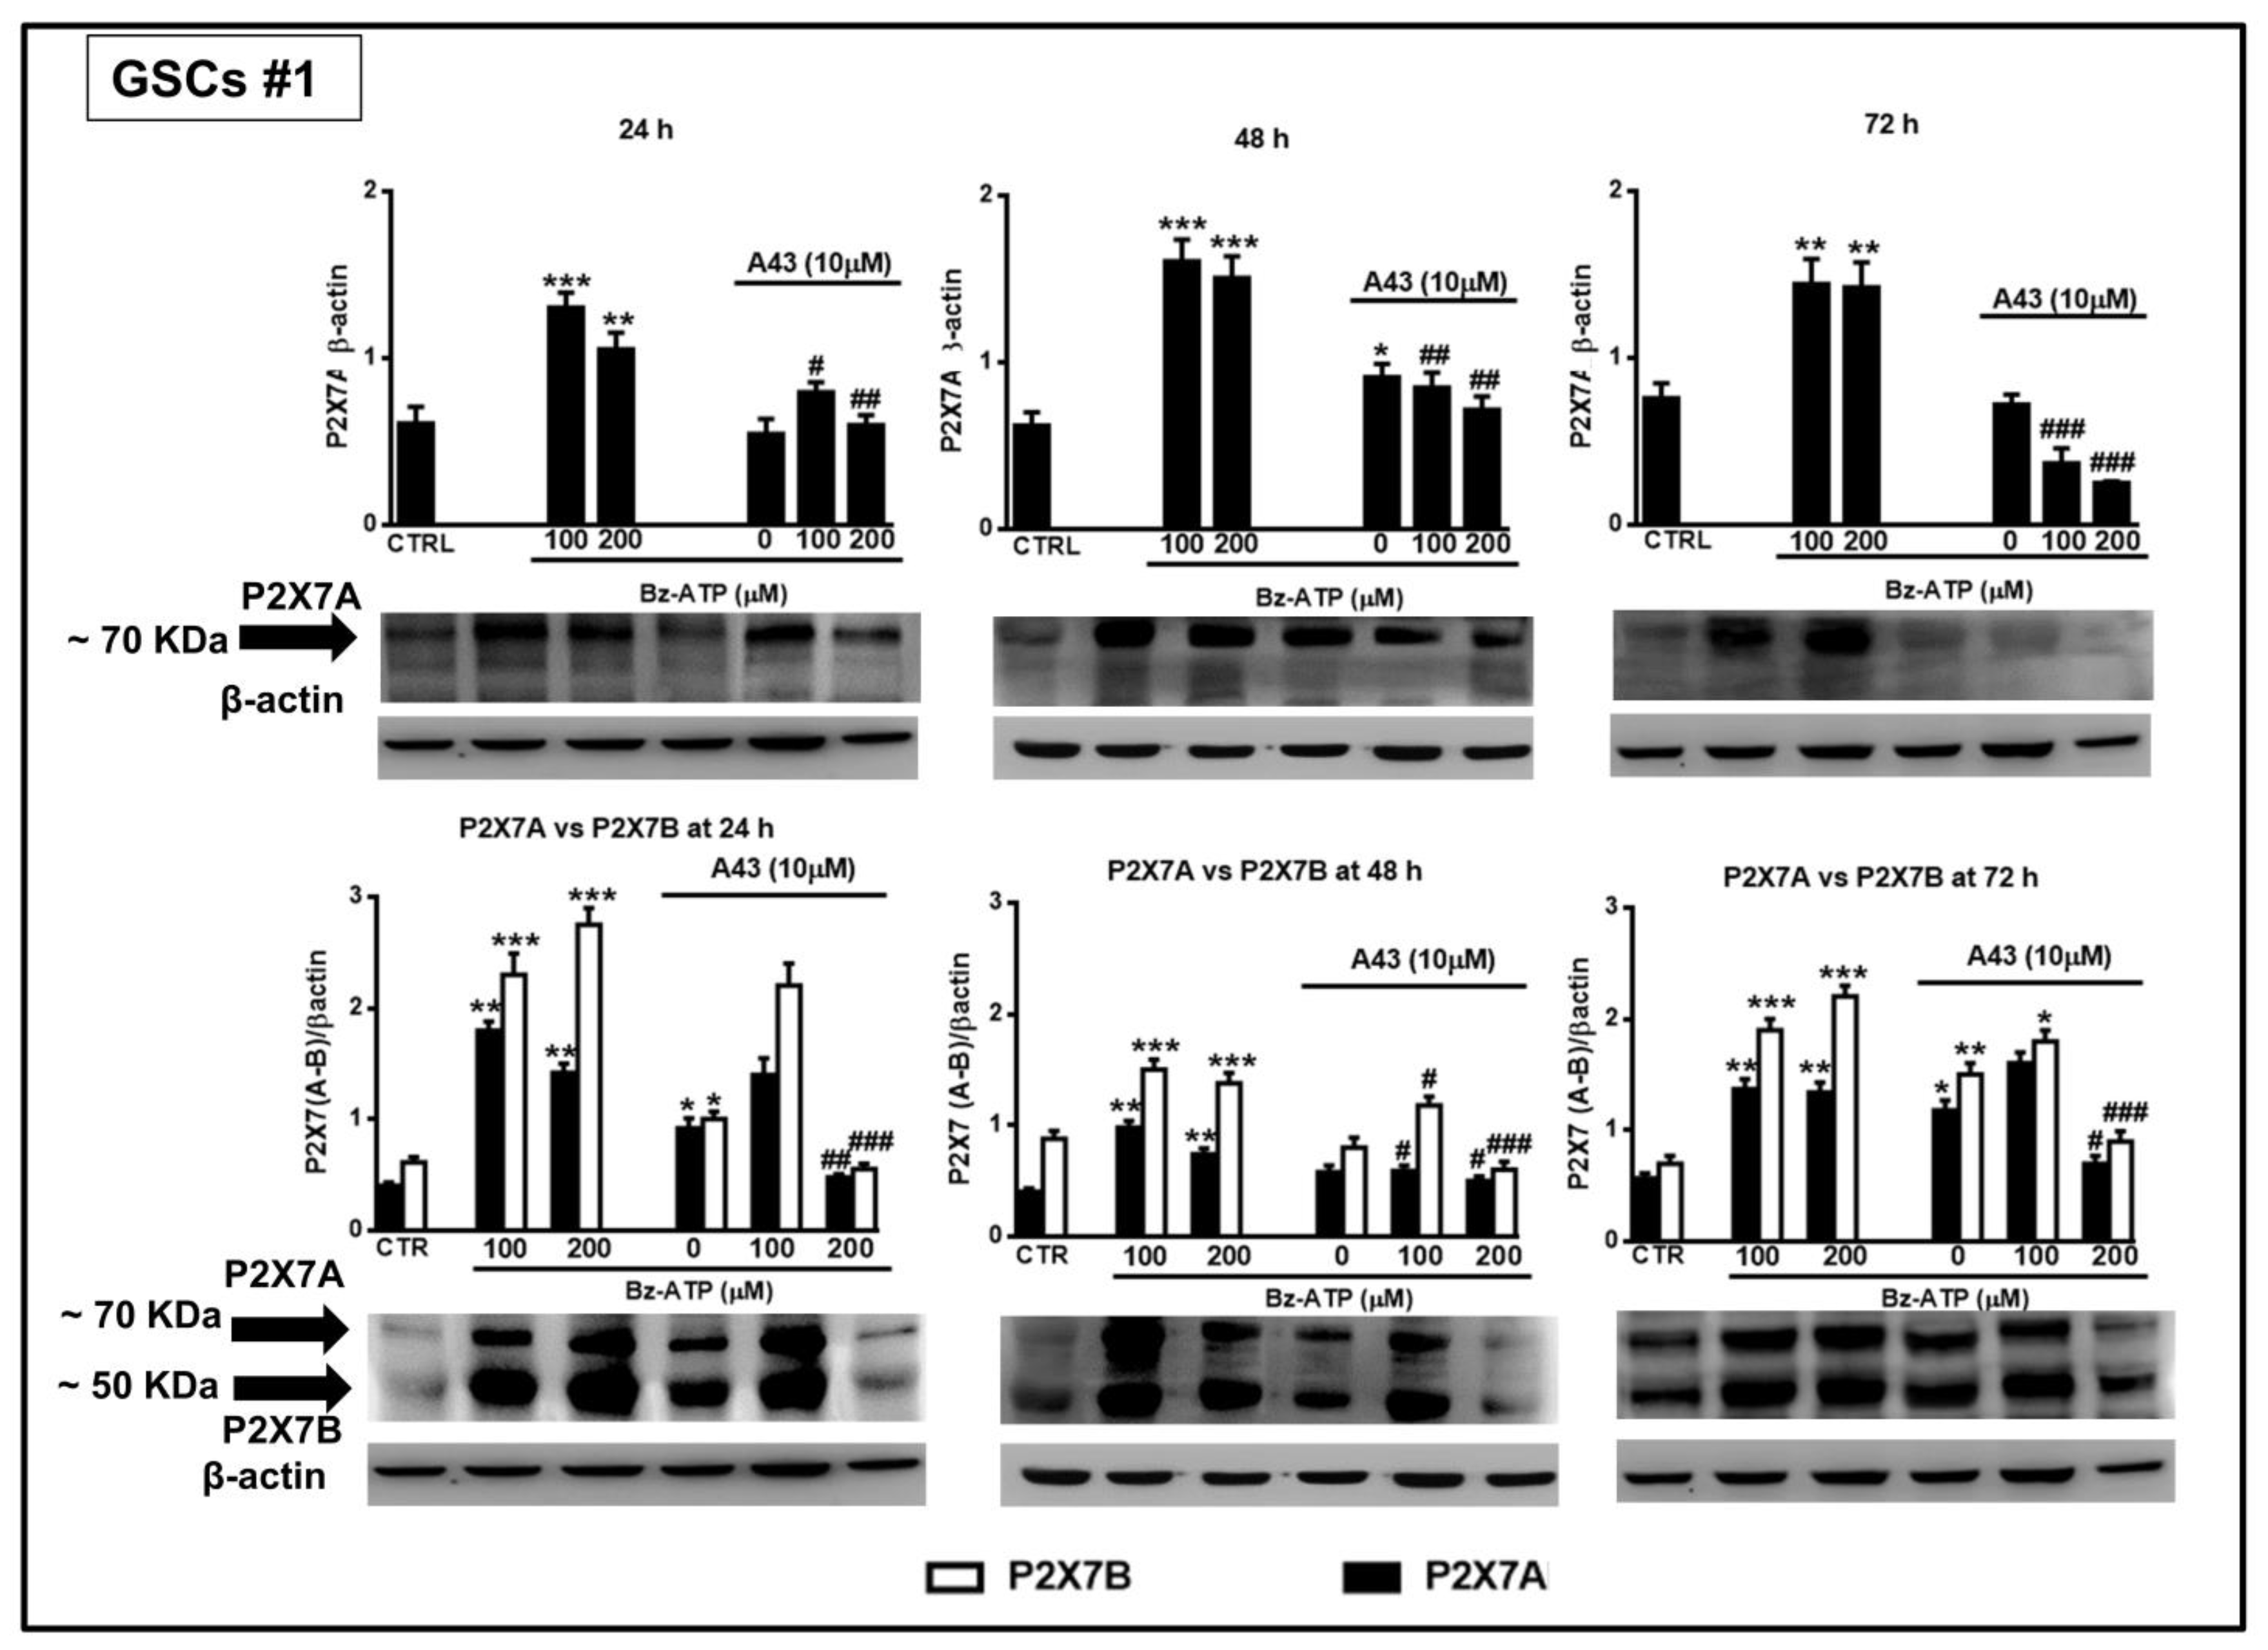
Figure 13.
Modulation of the protein levels related to the P2X7R splice variants A and B in GSCs #1 exposed to BzATP. GSCs #1, cultured up to their confluence in vitro, were harvested at different time points after their exposure to BzATP and/or A438079. Protein levels of P2X7A and P2X7B isoforms were determined by western blot analysis. Immunoblots were obtained by exposing membranes to two antibodies, one recognizing only proteins at about 70 KDa and the second one recognizing proteins at about 70 and 50 KDa, respectively. Immunoblots were then re-probed with an antibody against β actin and quantified by densitometric analysis, the values of which, normalized to β actin used as an internal control, are reported in the histograms. The band of β-actin is the same for the blots at each time period, as the same membrane was first incubated with one antibody and then, after stripping, with the other antibody against the P2X7RA or B subunits. Densitometric values are the mean ± SEM of three independent experiments with very similar results. *p < 0.05, **p < 0.01, ***p < 0.001: statistical significance vs. untreated cells (CTR); #p < 0.05, ##p < 0.01, ###p < 0.001: statistical significance vs. cells treated with BzATP (one-way ANOVA plus Dunnett’s test).
![Cells 09 00085 g013]()
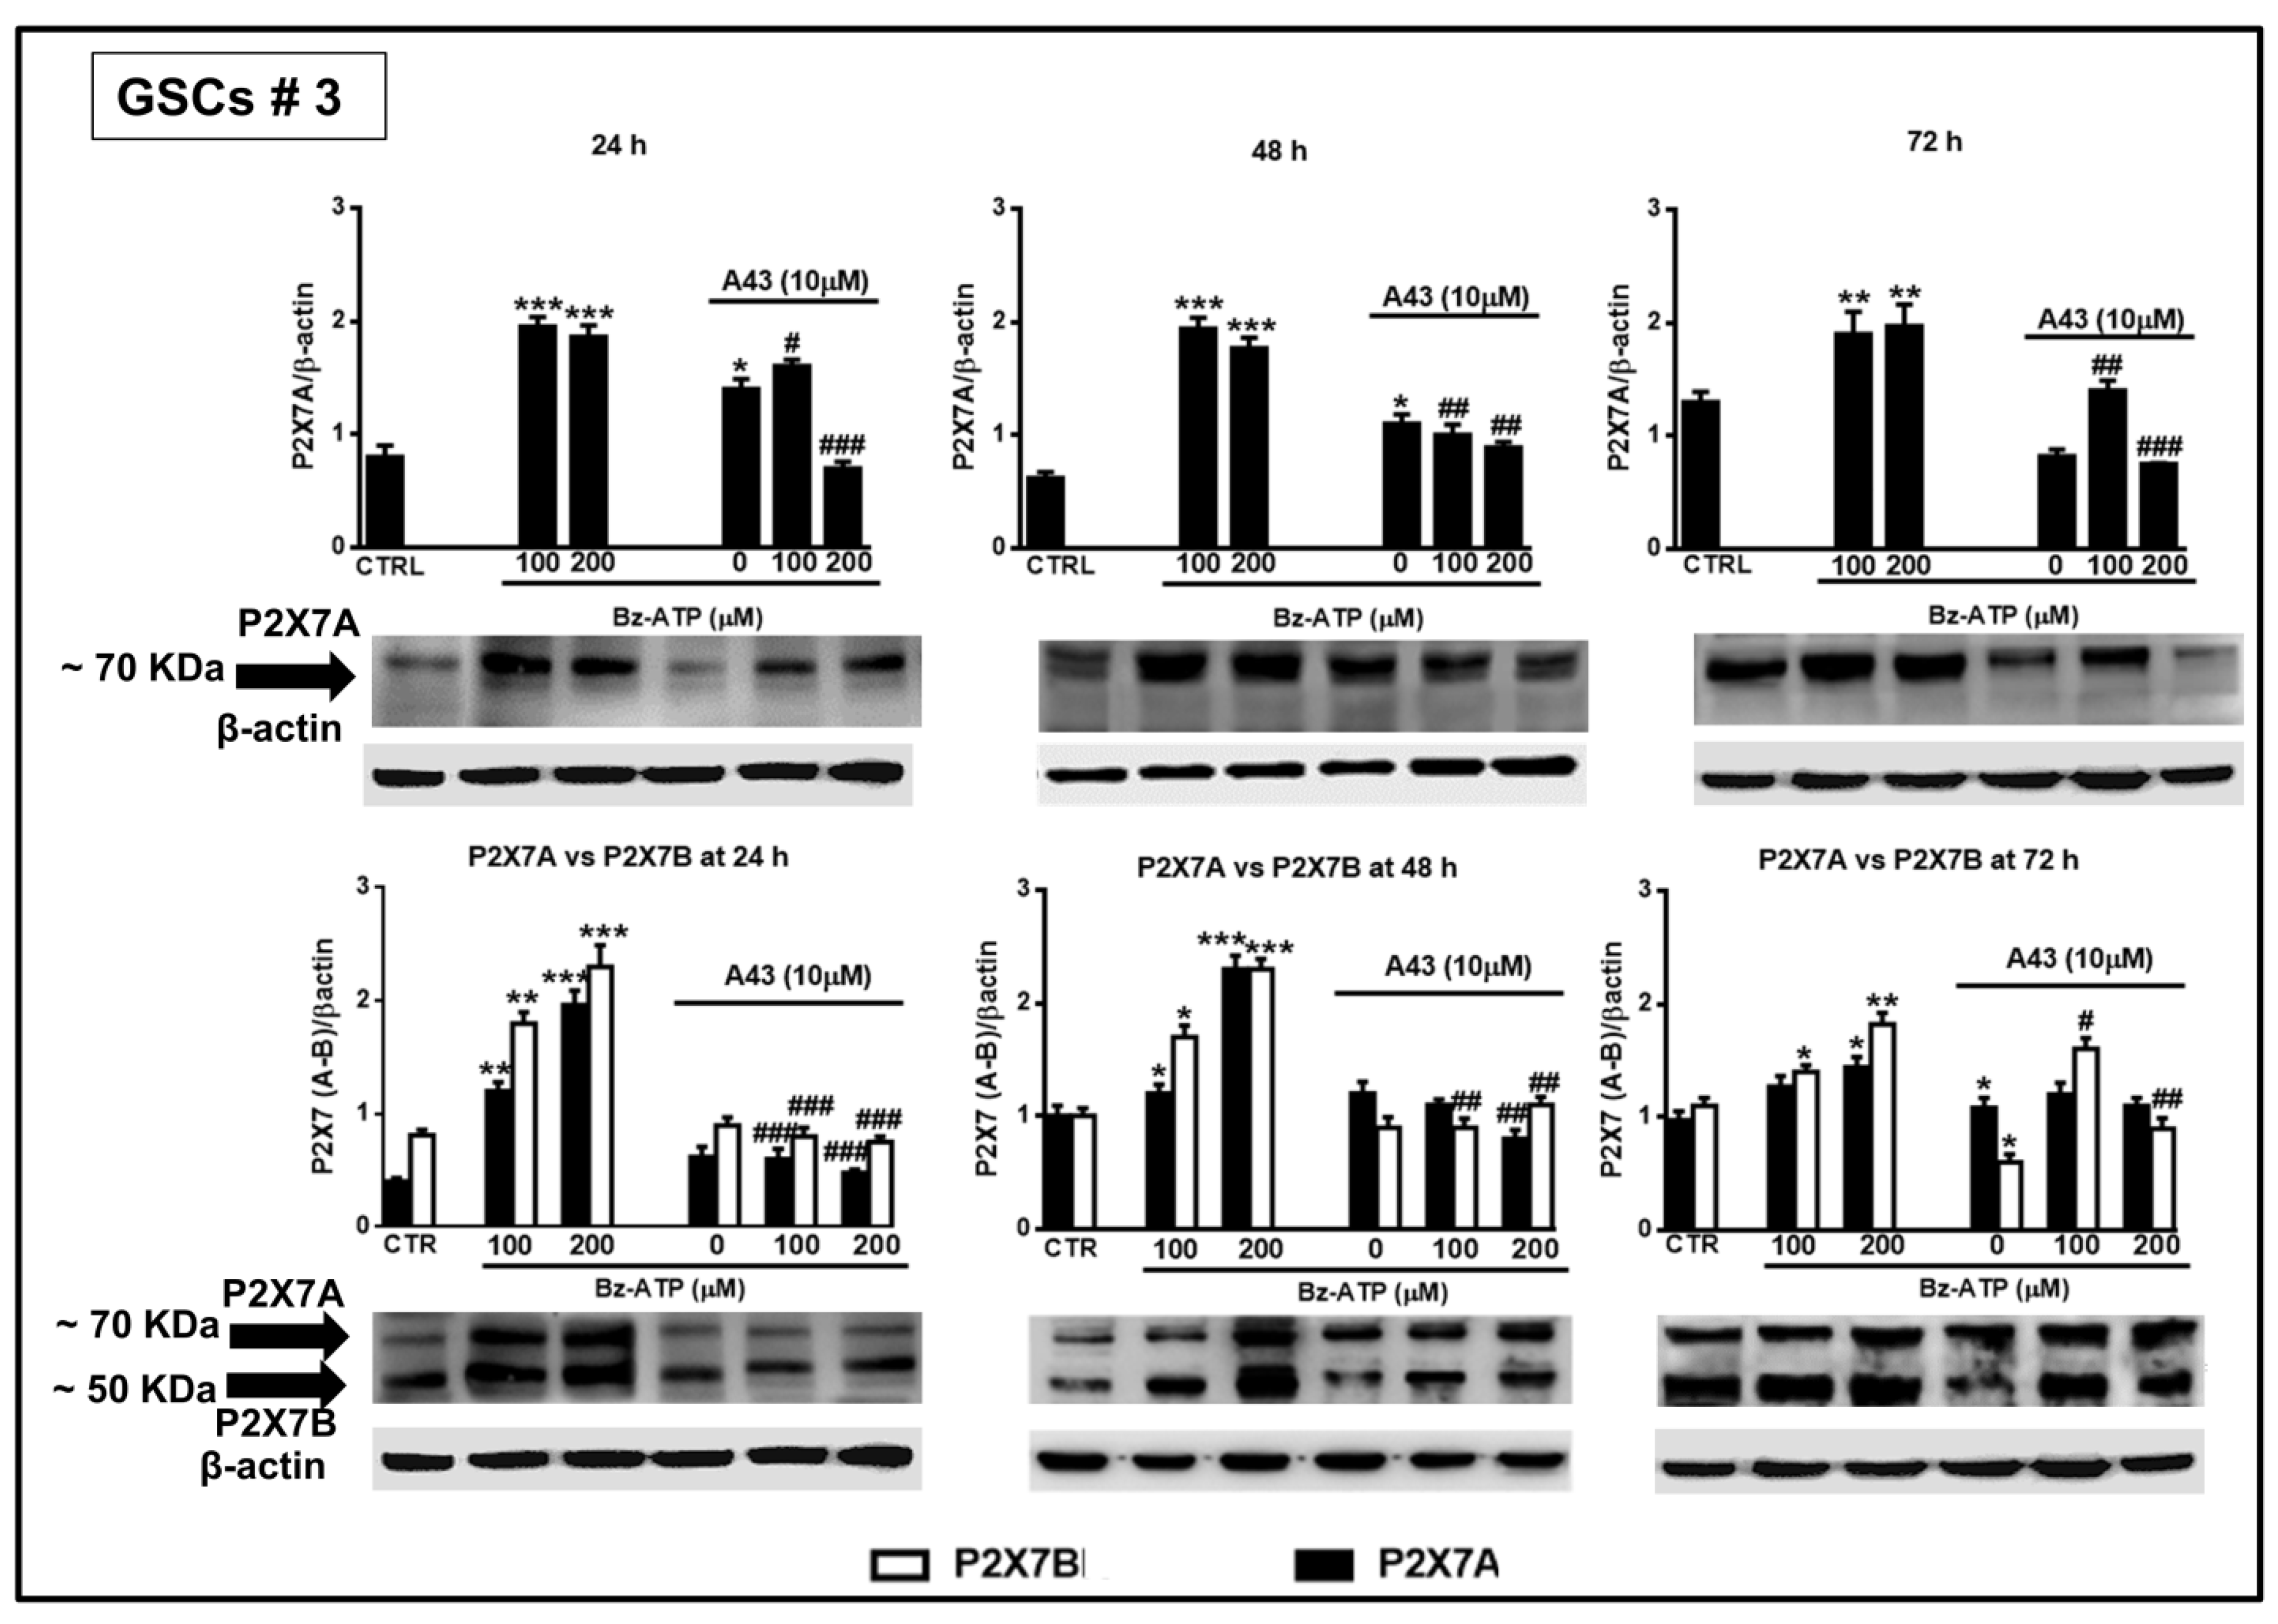
Figure 14.
Modulation of the protein levels related to the P2X7R splice variants A and B in GSCs #3 exposed to BzATP. GSCs #3, cultured up to their confluence in vitro, were harvested at different time points following their exposure to BzATP and/or A438079. Protein levels of P2X7A and P2X7B splice variants were determined by western blot analysis as reported in the legend of the
Figure 13. Immunoblots were re-probed with an antibody against β actin, quantified by densitometric analysis, normalized to β actin used as an internal control, and reported in the histograms. Densitometric values are the mean ± SEM of three independent experiments with very similar results. *
p < 0.05, **
p < 0.01, ***
p < 0.001: statistical significance vs. untreated cells (CTR); #
p < 0.05, ##
p < 0.01, ###
p < 0.001: statistical significance vs. cells treated with BzATP (one-way ANOVA plus Dunnett’s test).


