Temporal and Organ-specific Responses in NUE Traits to N Fertilization, Fungicide Intensity and Early Sowing in Winter Wheat Cultivars


Chair of Plant Nutrition, Technical University of Munich, Department of Plant Sciences, 85354 Freising, Germany
*
Author to whom correspondence should be addressed.
Agronomy 2019, 9(6), 313; https://doi.org/10.3390/agronomy9060313
Submission received: 25 April 2019
/
Revised: 3 June 2019
/
Accepted: 10 June 2019
/
Published: 13 June 2019
(This article belongs to the Section Soil and Plant Nutrition)
Abstract
:Fungicide intensity and sowing time influence the N use efficiency (NUE) of winter wheat but the underlying mechanisms, interactions of plant traits, and the temporal effects are not sufficiently understood. Therefore, organ-specific responses in NUE traits to fungicide intensity and earlier sowing were compared at two nitrogen (N) levels for six winter wheat cultivars in 2017. Plants were sampled at anthesis and at maturity and separated into chaff, grain, culms, and three leaf layers to assess their temporal contribution to aboveground dry matter (DM) and N uptake (Nup). Compared to the control treatment, across cultivars, the treatment without fungicide mostly exerted stronger and inverse effects than early sowing, on grain yield (GY, −12% without fungicide, +8% n.s. for early sowing), grain Nup (GNup, −9% n.s., +5% n.s.) as well as on grain N concentration (+4%, −2% n.s.). Grain yield in the treatment without fungicide was associated with similar total DM, as observed in the control treatment but with lower values in harvest index, thousand kernel weight, N use efficiency for GY (NUE) and N utilization efficiency. Lower GNup was associated with similar vegetative N uptake but lower values in N translocation efficiency and N harvest index. In contrast, early sowing tended to increase total DM at anthesis and maturity as well as post-anthesis assimilation, at similar harvest index and increased the number of grains per spike and total N use efficiency. Total N uptake increased after the winter season but was similar at anthesis. Although the relative N response in many traits was lower without fungicide, few fungicide x interactions were significant, and the sowing date did not interact either with N fertilization for any of the N and DM traits. The results demonstrate the positive effects of fungicides and earlier sowing on various traits related to yield formation and the efficient use of nitrogen and are discussed based on various concepts.
1. Introduction
Wheat contributes about 20% to the global calorie and protein production, but substantial advances in grain yield (GY) are required to meet the rising demand of a growing population with its altered consumption patterns [1]. However, efficient nitrogen (N) use, both in N-limited environments for stabilizing yields and in regions where high amounts of N fertilizers lead to detrimental environmental effects, is a major challenge to be addressed [2,3]. On the one hand, breeding progress increases N use efficiency (NUE) [4,5] through exploiting present genetic variation in NUE [6] and contributes to selecting suitable cultivars for specific growing regions [7]. On the other hand, agronomic measures must be optimized and adapted for modern cultivars. This includes optimal sowing densities and seed placement [8], sowing date [9,10], adapted timing and dosing of N fertilizers [11,12] as well as optimum fungicide strategies [13,14].
Early vigor is considered to improve the water use efficiency by increasing the use of available soil water in drought-prone environments and under climate change scenarios [15,16]. Genotypic differences in early vigor are substantial [17], but the timing of sowing and the interaction with N fertilization are equally important for the early development and final yield potential in different environments [9,10,18]. Winter wheat tolerates a large interval for sowing time, but pre-winter growth can increase the yield potential through enhanced tillering, pre-winter N uptake (Nup), better root growth and thus better acquisition of water and nutrients [19]. In addition, shifted phenology [20] may contribute to escape common drought and heat conditions, especially during grain-filling [21]. Higher pre-winter N uptake can reduce N leaching during winter [22] and thus increase NUE. In contrast, pre-winter growth can only be partly controlled so that early sowing can increase the risk of frost damage and pathogens if pre-winter growth is too strong [23,24]. Still, various studies found advantages in Nup and GY also at maturity [25,26,27,28,29]. Ferrise et al. [10] assessed the influence of the sowing date in interaction with N fertilization on dry matter and nitrogen translocation in durum wheat and reported stronger effects on GY than on GNup, altered grain N concentration but similar translocation efficiencies. In contrast, decreased dry matter translocation efficiencies were reported for late sowing in winter barley [30]. Other studies found increased dry matter production and Nup but a lower harvest index so that GY was little altered in early sowing [19,25]. In contrast, delayed sowing was recommended for Chinese conditions for maintaining NUE and GY [31,32].
Under humid growing conditions, adapted fungicide use is essential for maintaining GY [33,34]. Leaf fungicides can prolong the grain-filling phase by retarding senescence, both through curtailing disease-driven carbon loss and a physiological ‘greening effect’, thus enhancing assimilation [35]. Fungicide effects depend on the growing conditions that include temperature, precipitation and leaf moisture, and the optimum timing of the application [36,37]. Since diseases profit from higher N nutrition of the plant, fungicide effects often positively interact with the N fertilization [38,39,40,41].
Besides yield effects, positive effects on NUE were found [14,40,42,43,44,45]. Extended greenness increased kernel weight, post-anthesis N uptake (PANup), N harvest index and N translocation efficiency (NTEff) of vegetative N into the grain, and therefore GNup in a similar way as GY. Thus, no strong dilution effect on the grain N concentration (GNC) was reported [13]. Rather, the effects were related to longer greenness instead of higher rates of C and N accumulation. Disease-influenced variation in GNup was found to correlate more with PANup than with N translocation (NT) [45]. However, the use of fungicides is costly and increasingly questioned due to pathogen resistance, admission of chemical compounds, consumers’ acceptance, and the uncertainty of the economic benefit [46,47]. Thus, identifying potential detrimental effects of reduced fungicide use on GY and NUE, depending on N fertilization, and comparing cultivars for their response to reduced fungicide is important. Moreover, this study aims at identifying plant traits that influence yield formation and NUE and may help to understand genotypic differences.
Considering the knowledge gap in the traits contributing to NUE, GNup, and GY in response to reduced fungicide treatments and earlier sowing, we compared GY and GNup to a ‘normally’ sown and fungicide-treated control under two contrasting N regimes. Organ-level dry matter and N traits were determined at anthesis and maturity to address the magnitude and mechanisms of how treatments altered the target traits.
2. Materials and Methods
2.1. Study Site and Experiment
The field trial was conducted as a split-split-plot design with control (Cont)/reduced fungicide (RF)/early sowing (sowing date 1: SD1) on the main plot (MP), N level (N) on the sub-plot (SP) and cultivar (Cv) on the sub-sub-plot during the 2016/2017 growing season in southeastern Germany (48.406N, 11.692E). The field consisted mostly of homogeneous Cambisol type of silty clay loam. The average annual precipitation in this region is approximately 800 mm, with an average annual temperature of 7.5 °C. The previous crop was grass-clover, treated with glyphosate before plowing.
A set of six winter wheat cultivars (Table 1) was mechanically drilled in a depth of 3 cm with a row spacing of 12.5 cm at 350 kernels m−2. The plots were 1.5 m wide and 6.4 m long. The winter wheat cultivars comprised three high-performance commercial German line cultivars and three hybrid cultivars, registered and released by the national authorities. Additionally, three other cultivars were included in all main plots but neglected due to the previous sampling during early plant development [48], and another 11 cultivars, included only in Cont and not destructively sampled. The cultivars include three quality groups for winter wheat (E: Highest baking, A: High baking quality and B: Bread wheat) and differ in yield components, disease susceptibility and phenology (Table 1). Especially the line cultivars are frequently grown by German farmers.
Sowing date was 28 September for SD1 and 23 October for Cont and RF. The seeds of the line cultivars were dressed with Landor CT (2.4% fludioxonil, 1.9% difenoconazole and 0.5% tebuconazole), the seeds of the hybrid cultivars with Vibrance Gold (4.63% sedaxane, 2.32% fludioxonil and 2.32% difenoconazole, both Syngenta, Basel, Switzerland), to avoid seed-borne diseases. Each cultivar was cultivated at two N levels (N1, N2) within each of the three main plots, and in four replicates per N level, resulting into four replicates for each factor combination (MP × N × Cv). Nitrogen was fertilized as granulated ammonium nitrate at tillering (27 March, N1: 30 and N2: 60 kg N ha−1), and at stem elongation (18 May, N1: 30 and N2: 60 kg N ha−1). Total nitrogen amounts were kept low due to the pre-crop effect of the grass-clover mixture. An adequate supply of K, P, and S was ensured, and integrated pest management kept the field weed-free. A straw shortener based on chlormequat chloride and trinexapac-ethyl was applied to all plots. Foliar fungicide was applied twice in Cont and SD1 plots, but not in RF plots:
18 May, 2017 at Zadok’s growth stage 39 (end of stem elongation): 0.5 L ha−1 Input® Xpro (100 g l−1 prothioconazole, 250 g L−1 spiroxamine, 50 g L−1 bixafen) + 0.7 L ha−1 Skyway® Xpro 75 g L−1 bixafen, 100 g L−1 prothioconazole, 100 g L−1 tebuconazole (both Bayer CropScience, Leverkusen, Germany).
30 May, 2017 at Zadok’s growth stage 49 (end of booting): 2.0 L ha−1 Ceriax® (41.6 g L−1 epoxiconazole, 41.6 g L−1 fluxapyroxad, 66.6 g L−1 pyraclostrobin (BASF, Ludwigshafen, Germany).
The study year was characterized by overall favorable weather conditions with above-average temperatures and global radiation during March, May, and June in spite of below-average conditions in April (Figure 1). Conversely, precipitation was above average during April and July but lower than in the previous years during May and June, leading to mild drought stress and accelerated senescence in some cultivars during the grain-filling phase.
2.2. Plant Sampling and Sample Analysis
Biomass was sampled at mid-flowering (Zadok’s growth stage 65 [50], similar to the BBCH-scale [51]) and at physiological maturity (growth stage 95). Sampling dates were determined for each genotype within each subplot by visual scoring. Thirty and 60 randomly selected spiked shoots were cut directly at the stem base at anthesis and maturity, respectively. The plants were manually separated into flag leaves, flag leaves-1 (second leaves from above), ‘other leaves’ (remaining leaves), culms including leaf sheaths, and spikes.
Plant samples were oven-dried at 50 °C until a stationary weight was reached for subsequent determination of dry weight [52]. All dry matter (DM) traits were standardized to 100% DM content. The vegetative plant samples were homogeneously ground (1 mm) to assess the N concentration (NC) by near-infrared spectroscopy (NIRS) using a FOSS NIRS 6500 (Foss, Silver Spring, MD, USA) and an FT-NIRS (Bruker, Billerica, MA, USA). Grains were analyzed as complete kernels. After plant sampling at maturity, all plots were harvested (1–2 August, 2017) using a combine harvester, and moisture-corrected grain yield (0%) was determined for each plot. Grain number per spike (GNS) and thousand kernel weight (TKW) were determined. By combining the information of yield per spike and yield per plot, the number of spikes m−2 (spike density: SD) was calculated. Nitrogen uptake (Nup) was calculated by multiplying nitrogen concentration (N%) with DM. Plant height was determined on the plot level using an ultrasonic sensor [53] on 4 July.
2.3. Calculation of Derived Plant Traits
Derived plant traits were calculated for yield components, DM and N translocation as well as the efficiency of N uptake and utilization as described in [52]: See Table 2 for a list of considered plant traits.
Dry matter (DM) units of all plant components corresponding to the number of sampled shoots were scaled-up to kg ha−1 using spikes per m2 values for each plot. The following parameters were assessed to compare the temporal DM and N accumulation (Table 3).
Besides the calculation for the total above-ground plant, the following traits were calculated at the plant organ level (Supplementary Table S1): DMT, DMTEff, NT, NTEff, HI and NHI for the vegetative organs, both at anthesis and at maturity. Beside the values for the three leaf layers, aggregated values for ‘all leaves’ were included.
2.4. Statistical Analysis
Statistical analysis was conducted in R 3.4.2 (R Stat. Core Team, 2017). All traits were subjected to analysis of variance (ANOVA): The main plot treatment (MP) representing three agronomic scenarios was considered as early sowing (sowing date 1, SD1), control (second sowing date, full fungicide treatment) and the reduced fungicide (second sowing date, no leaf fungicide applied). The N fertilization (N) on the sub-plot was present within each main plot and comprised six cultivars (Cv) on the sub-sub-plot. A random replicate effect was considered nested within the main plots. Type III sums of squares were calculated using the lmer function (lmerTest) in R using Satterthwaite’s approximation for the main and interaction effects. In addition to the analysis on the whole trial, the ANOVA analysis was conducted for two subsets, comprising the control (Cont) together with the reduced fungicide (RF, Cont + RF) main plots and Cont together with the sowing date 1 (SD1, Cont + SD1) main plot, respectively. The estimated marginal mean values were calculated based on the model for the whole trial, using the emmeans function and compared by Tukey’s post-hoc test (i) for the three MP treatments, (ii) the two N treatments across the main plots, (iii) the two N treatments within the main plots and (iv) the cultivars across main plots. The percentage treatment response was calculated between RF and Cont, between SD1 and Cont and between N2 and N1 within the three main plots for comparing the response strength.
Trait combinations were tested within each sub-plot (SPs) within the main plot combinations for linear relationships, and for linear and quadratic relationships across the ‘whole trial’ (WT) using estimated marginal mean values and are shown for selected traits corresponding to different trait complexes (Equation (1)).
Equation (1): Concepts applied to dissect NUE into grain yield (GY), grain N uptake (GNup), grain N concentration (GNC) and selected contributing traits: GNup as the product of GY and GNC (a), GY as the product of the yield components spike density (SD), grain number per spike (GNS) and thousand kernel weight (TKW, b), GY as the sum of dry matter translocation (DMT) and post-anthesis assimilation (PAA, c), GY as the product of total DM and harvest index (HI, d), nitrogen use efficiency (NUE) as product of N uptake efficiency and N utilization efficiency with respect to NUE for total DM production (e) and NUE for GY, respectively (f), GNup as the sum of N translocation (NT) and post-anthesis N uptake (PANup, g), GNup as the product of N uptake (Nup) and the N harvest index (NHI, h), dry matter translocation (DMT) as the product of DM at anthesis and DM translocation efficiency (DMTEff, i), Nup at anthesis as the sum of organ-level Nup (j), Nup at maturity as the sum of organ-level Nup (k), N translocation (NT) as the sum of partial NTs by organs (l), NT as the product of Nup at anthesis and N translocation efficiency (NTEff, m).
3. Results
3.1. Treatment Effects
ANOVA was conducted to assess the influence of the main plot (MP) treatments ‘sowing date 1’ (SD1) and ‘fungicide application’ (RF) compared to the control (Cont), the ‘N level’ (N) treatments on the sub-plot and the ‘cultivar’ (Cv) on the sub-sub-plot on the dry matter (DM) and nitrogen (N) traits, both for the whole trial and two subsets, comprising the control (Cont) together with the reduced fungicide (RF) main plots and Cont together with the sowing date 1 (SD1) main plot, respectively (Table 4).
For almost all traits, cultivar effects were significant in the whole trial as well as in both trial subsets with the exception of N concentration (NC) of flag leaf-1 at maturity (Mat.), grain N uptake (Nup), N utilization efficiency (NutEff) at anthesis and total N use efficiency (NUE), and only few other traits within both trial subsets. Among direct DM traits, the main plot treatments showed an effect for the whole trial for anthesis DM only for ‘other leaves’ (leaves excluding both uppermost layers), at maturity most strongly for grain DM (GY) in the whole trial and in Cont + RF, for DM of culms both in the whole trial and in Cont + RF, for ‘other leaves’ in the whole trial, and in Cont + SD1 and for the total above-ground DM only for the total trial. No two-way MP × N interactions were found in the three models and MP × Cv interactions only for the whole trial and for Cont + SD1 mainly for anthesis traits. N × Cv interactions were present for some traits of total DM at anthesis (Ant) for all three models. For N concentration (NC traits), N effects were found for all traits in the three models while MP effects were mainly limited to the maturity sampling date. Within the trial subsets, MP x N interactions were significant for ‘maturity flag leaf’ and for ‘anthesis other leaves’ in Cont + RF. The MP × Cv interactions were found for most anthesis NC traits in Cont + SD1.
Influenced both by the MP and N effects on NC traits, the direct N uptake (Nup) traits responded more to MP and especially N treatments than the DM-related traits, especially for the maturity sampling. Within the trial subsets, MP × N interactions were only found in Cont + RF for ‘anthesis other leaves’, grain Nup and ‘maturity flag leaf’, MP × Cv interactions, especially for anthesis Nup traits in Cont + SD1.
Among the three direct yield components, spike density (SD), grain number per spike (GNS) and thousand kernel weight (TKW), only GNS responded to N in the whole trial and in Cont + RF, whereas the aggregated yield component kernels per m2 showed an N effect in all three models. MP was significant for all direct yield components in the whole trial and in Cont + RF, only for GNS in Cont + SD1, never for kernels per m2 but always for yield per spike. Within the trial subsets, MP × Cv was significant in Cont + SD1. With respect to traits related to DM translocation (DMT, DMTEff) and post-anthesis assimilation (PAA, CPAA), N was always significant, but MP and MP × N never; MP × Cv was significant in Cont + SD1 but not in Cont + RF.
Considering the N use efficiency for grain (NUE_grain) as the product of N uptake efficiency (NupEff) and N utilization efficiency for grain (NutEff_grain), only N and Cv-main effects were found for NupEff. For NutEff_grain, most main effects were significant, but no interactions were observed within trial subsets for both traits. The harvest index (HI) showed the effects of MP in Cont + RF and in the whole trial. As for DMT and PAA, the MP effect was not significant for N translocation (NT) and post-anthesis N uptake (PANup). However, N was always significant for PANup, its contribution to total Nup (CPNup), but for NT only for the whole trial and in Cont + SD1.
All main effects were significant for the N translocation efficiency (NTEff) with the exception of MP in Cont + SD1. Within the trial subsets, MP x N was significant for NT in Cont + RF and MP × Cv for PANup, CPNup, NT, and NTEff in Cont + SD1. For the N harvest index (NHI), no N and interaction effects but an effect of MP in the whole trial and in Cont + RF, and of Cv in all models was found. For anthesis date, MP and N were significant with the exception of MP in Cont + RF, the MP × N interaction only in Cont + SD1 and in the whole trial. For plant height, effects of N were present in all models and of MP and MP × N in Cont + RF.
3.2. Comparison of Trait Values and Trait Relationships
Treatment means were compared by Tukey’s post-hoc-test and represented for selected traits, which are described by different trait complexes (Equation (1)) as estimated marginal mean values (Table 5). The relationships of selected pairwise combinations of traits included in trait complexes were assessed for the variation by cultivars in the six differing MP × N combinations, and across the whole trial (WT).
3.2.1. Trait Complex a: GNup = GY × GNC
Across the whole trial (WT), GNup was linearly related to grain DM at maturity (GY), explaining 51% of the variation (Figure 2a). For the GNC/GNup relationship, mainly the N fertilization effect was captured in WT (Figure 2b), whereas GNC and GY tended to correlate negatively within the sub-plots (Figure 2c). Within the MP × N level combinations, most relationships were weak, not consistent with trait combinations or treatments, and rarely significant due to the low number of cultivars (n = 6).
Grain yield (GY, grain DM at maturity) increased only moderately in response to a doubling of the applied N fertilizer from 60 to 120 kg N ha−1, from 8.8 t ha−1 on average (rounded up to 1 decimal) to 9.3 t ha−1 (Table 5, Figure 2). Reducing fungicide (RF) decreased GY by 1.1 t ha−1 on average (−12%) compared to the control treatment (Cont), whereas earlier sowing tended to increase GY by 0.7 t ha−1 (+8%, n.s.). Within all main plots, GY increased between both N levels (interaction n.s.), in Cont and SD1 by 7%, but in RF by only 4%. With the stronger reaction of the grain N concentration (GNC) to N fertilization by 13%–14% (N2 compared to N1 in Cont and RF) and 18% (SD1), grain N uptake (GNup) increased by 23% (Cont), 17% (RF) and 26% (SD1). Conversely to GY, GNC was higher in RF than in Cont but slightly lower (n.s.) in SD1 than in Cont. Due to the MP*N-interaction, GNup was significantly lower in RF than in Cont and SD1 only in N2 (not shown), and amounted, on average, to 176, 161 and 185 kg N ha−1 in Cont, RF, and SD1, respectively. GY was lowest for the line cultivar Kerubino followed by JB Asano and Impression, and highest for the three hybrid cultivars Hystar, Hybred and Hyland, which reached lower GNC, however. Thus, no cultivar differences were found for GNup across all treatments (Table 4).
3.2.2. Trait Complex b: GY = SD × GNS × TKW
Lower GY in RF than in Cont was mainly related to lower thousand kernel weight (TKW) in RF (33.6 g, −13%) whereas SD1 reached a higher grain number per spike (GNS, +10%) and by tendency higher TKW (+4%) but fewer spikes per m2 (Table 4). Across the main plots, none of the three direct yield components differed between N levels, whereas kernel number per m2 increased (Figure 3). Interestingly, within the main plots, N fertilization increased mainly GNS in RF (+6%) in contrast to TKW (+3%) and spike density (+4%, n.s.) in SD1, and spike density (+5%, n.s.) in Cont, as well as kernel number per m2 (Figure 3), but never yield per spike. Influenced by the strong scattering within MP*N level-combinations and the weak influence of N on the spike density, all relationships between spike density and GY were weak (not shown). For the whole trial, GNS was related to GY (R2 = 0.37***, Figure 3). TKW was related especially to the difference in GY between RF and Cont (R2 = 0.35), whereas within MP × N level combinations, the relationships were negative. The kernel number per m2 explained little in GY across the main plots but 65%–85% of the GY variation between cultivars within the MP x N level-combinations.
3.2.3. Trait Complex c: GY = DMT + PAA
The pre-anthesis component of GY, i.e., DMT, contributed strongly to GY by 53% (SD1), 54% (Cont) and 58% (RF, not shown). DMT (4.9 t ha−1 in Cont) was only slightly decreased in RF (−4%, n.s.) and increased in SD1 (+5%, n.s.) compared to Cont, but PAA reacted stronger (−20% in RF and +10% in SD1, Table 4, Figure 4). However, substantial differences between cultivars were observed in both traits. While N fertilization increased PAA strongly within all main plots, DMT tended to decrease contrariwise, especially within Cont and RF. Due to the weak effects of MP and N treatments on DMT compared to the differing cultivar effects, DMT was not significantly related to GY (not shown), in contrast to PAA (R2 = 0.43, Figure 4).
3.2.4. Trait Complex d: GY = DM × HI
Lower GY (−12%) in RF than in Cont was related to a lower harvest index (−9%) whereas total above-ground DM decreased only moderately (−3%, Table 4, Figure 5). Instead, GY in SD1 increased by tendency (+8%, n.s.) rather than from higher total DM (+8%, n.s.) at a similar harvest index (0.53). With GY reacting to N fertilization weakest in RF, the increase in total DM (+2%, n.s.) was moderate as well compared to Cont and SD1 (both +7%), while HI remained stable within the main plots between N levels. Within MP × N level combinations, harvest index was more descriptive for the variation in GY between cultivars than total DM (Figure 5).
3.2.5. Trait Complex e: NUE_total = NupEff xNutEff_total and Trait Complex f: NUE_grain = NupEff × NutEff_grain
As total DM at maturity, the apparent efficiency of the conversion of applied nitrogen into total DM (NUE_total) was higher in SD1 (231 kg DM/kg N) than in both other main plots (Table 4, Supplementary Figure S1). Due to the weak effect of N on total DM, NUE_total almost halved with the doubling of N fertilization. Due to the low fertilization level but the strong soil mineralization, which was not included in the calculation, the apparent N uptake efficiency (NupEff) was high (2.52 kg Nup/kg Nfert both in Cont and 2.63 kg Nup/kg Nfert in SD1. The internal conversion of Nup into total DM (NutEff_total) was only slightly lower in RF (82 kg DM/kg N, −2%) and higher in SD1 (+3%) than in Cont, but decreased in a similar way (13%–15%) from N1 to N2 in all main plots.
3.2.6. Trait COMPLEX g: GNup = NT + PANup
In spite of the lower absolute contribution, post-anthesis Nup (PANup) was more descriptive for differences in GNup that nitrogen translocation (NT) in the whole trial (R2 = 0.39***), but not within MP × N level combinations (Figure 6).
In contrast to the about equal contribution of pre- and post-anthesis assimilation to GY, PANup was low (3 and 10 kg N ha−1 in Cont and SD1 and partly negative in RF). Thus, it contributed only 5.6%, 2.6% and 9.4% to the overall Nup (CPANup), and 3.8%, 7.6% and 11.5% to the grain Nup (GNup) in Cont, RF and SD1, respectively (not shown). The N translocation (NT) was slightly (−5%, n.s.) lower in RF and similar in SD1 compared to Cont (163 kg N ha−1), respectively. NT increased between N1 and N2 in Cont and SD1 but not in RF, whereas PANup responded to N in all main plot (+20 – 27 kg N ha−1).
3.2.7. Trait Complex h: GNup = Nup × NHI
The overall relationship of GNup with total Nup (R2 = 0.88***, Figure 7a) was mainly driven by differences in total Nup between Cont and SD1 and between the N levels, but also between cultivars within MP × N level combinations, whereas the overall weak relationship of GNup with N harvest index (NHI) was due to the fungicide effect only (Figure 7). While NHI and total Nup were unrelated in RF, a negative relationship is visible within MP × N level combinations in Cont and SD1 (Figure 7c).
NHI was markedly higher than the (DM) harvest index (HI), but as the HI, it decreased without fungicide treatment (0.78, Table 5), but not with early sowing compared to Cont (0.84). As for HI also, no N effect was found for NHI. Total Nup in RF was almost equal but tended to be higher in SD (+5%, n.s.) than in Cont. Both traits interacted to the differing GNup in RF (−15 kg N ha−1) and SD1 (+9 kg N ha−1), respectively. Cultivar differences were found for NHI, ranging from 0.81 (Hybred and Impression) to 0.83 (Hyland and JB Asano) and for total Nup, but not for GNup.
3.2.8. Trait Complex i: DMT = DMAnt × DMTEff
The reaction of total DMT (trait complex c) can be explained by its multiplicative components, the amount and allocation of total above-ground DM at anthesis, and DMTEff. Similar DMT for all main plots was associated with similar total DM at anthesis and, by tendency, lower (−8%) DMTEff in RF, especially due to the decreasing DMTEff of culms and ‘other leaves’ (Figure 8a, Supplementary Table S1). Lower DMT with higher N fertilization, especially within RF and Cont, was mainly due to lower DMTEff (overall 0.38 in N1 and 0.34 in N2). At the organ level, the decrease in DMTEff with higher N fertilization was significant for culms (all main plots) and spikes (only RF). DMTEff differed more between organs than between treatments: Average DMTEff was lowest for spikes (0.23), followed by culms (0.36), flag leaves (0.45), ‘other leaves’ (0.48) and flag leaves-1 (0.51, Figure 8a). However, culms constituted by far the largest DM pool at anthesis with a partial harvest index (HI) of 0.60, followed by spikes (0.20) and similar values for each of the three leaf layers (Figure 8c). Reduced fungicide decreased and increased the partial HIs at anthesis significantly for spikes and culms, respectively. Earlier sowing decreased partial HIs for spikes and both upper leaf layers in favor of culms and ‘other leaves’. N fertilization shifted the DM allocation (higher partial HI) from culms towards spikes and both upper leaf layers.
The lower grain HI at maturity in RF compared to Cont was mainly reflected in increased HI values for culms (0.32 instead of 0.28) and flag leaves (Figure 8e). As for DM and DMT-related traits, genotypic differences were present in all partial harvest indices for both sampling dates (Supplementary Table S1).
3.2.9. Trait Complex j: NupAnt = Nupspikes + Nupculm + Nupflag leaf + Nupflag leaf-1 + Nupother leaves
The allocation of Nup into aboveground plant organs was assessed at anthesis and maturity and related to DM and N concentration (Figure 9). At anthesis, cultivars allocated most N to leaves (partial N harvest index NHI: On average 0.41), followed by culms (0.37) and spikes (0.22, Figure 8d, Figure 9m). Most of the N in leaves was found in the flag leaf layer (0.18) and the flag leaf-1 layer (0.14). Total above-ground Nup at anthesis was similar between the main plots (Table 5), but the allocation to organs differed. Earlier sowing shifted the relative leaf N allocation downwards to lower leaves whereas reduced fungicide resulted into relatively more N in culms at the expense of lower leaves, and spikes (Figure 8d, Figure 9m). Interestingly, N fertilization increased total Nup at anthesis significantly only in Cont (+11%) and SD1 (+15%), but not in RF (Table 5). Moreover, none of the N responses in organ-level Nup was significant in RF, but for culms and for most leaf layers both in Cont and SD1 (not shown). Conversely, the partial NHI decreased in all main plots between N1 and N2 for spikes in favor of culms (Figure 8d).
3.2.10. Trait Complex k: Nuptotal = Nupgrain + Nupspike + Nupculm + Nupflag leaf + Nupflag leaf-1 + Nupother leaves
Total above-ground Nup at maturity was not significantly different between the main plots (Table 5). On the plant-organ level, reduced fungicide decreased the NHI for grain (Table 5) so that both relatively (NHI, Figure 8) and absolutely (Nup, Figure 9), more N was allocated to chaff (n.s.), culms and especially to the flag leaf and flag leaf-1 layers. Early sowing increased Nup and NHI only for the ‘other leaves’. In spite of these effects, given the efficient N translocation (NT) from straw to grains between anthesis and maturity by, on average, 77% in RF and 83% in Cont and SD1, the NHI was low for the vegetative organs at maturity (maximum 0.078 for culms, Figure 8). Still, as for the grain NHI, cultivars differed in NHI in all vegetative organs. As for grain NHI, N fertilization had little effect on the vegetative NHI values but increased and decreased the NHI for flag leaves and chaff, respectively. Within all main plots, the N response in Nup was stronger at maturity than at anthesis, strongest for flag leaves (on average + 33% at maturity) and lowest for chaff (+14%), at totally increased Nup from 191 to 232 kg N ha−1 (+22%, Table 5, Figure 9). However, as at anthesis, the N responses differed by the main plot treatments: The relative increase in Nup in RF (+17%) was lower overall than in Cont (+22%) and SD1 (+26%).
3.2.11. Trait Complex l: NT = NTspike + NTculm + NTflag leaf + NTflag leaf-1 + NTother leaves and trait complex m: NT = NupAnt × NTEff
N translocation (NT) tended to be lower in RF than in Cont (−5%, n.s., Table 5, Figure 10). With similar total Nup at anthesis in all main plots and increased Nup between N levels (+8 kg N ha−1), the apparent N translocation efficiency (NTEff) decreased significantly from 0.83 (Cont) to 0.77 (RF, unchanged for SD1). NT increased only moderately between N1 and N2 and only in Cont (+10%) and SD1 (+13%), due to the low NTEff in RF in N2. The organs differed in NTEff from on average 0.89 (flag leaf-1), 0.87 (flag leaf) to only about 0.77 of all other vegetative organs (Figure 8b). Relative NTEff decreases without leaf fungicides were stronger for leaves (overall −10%) than for culms (−7%) and chaff (−4%, Figure 8b). N fertilization significantly reduced total NTEff and NTEff of flag leaves-1 in Cont, NTEff of flag leaves in SD1 and NTEff of all organs in RF (Figure 8b).
While NT had a close linear relationship with the total Nup at anthesis (R2 > 0.85) both for the whole trials and the MP*N level combinations, NTEff was less descriptive for NT (Figure 10).
4. Discussion
Both the use of fungicides, together with early sowing, were assessed in two N levels as potential measures for increasing N efficiency. Early sowing was expected to increase N-uptake, as well as grain yield through shifted phenological phases. Favorable fungicide effects were expected mainly during grain-filling.
4.1. Trait Level of Dry Matter and N Traits
The treatment factors influenced yield formation during different growth stages, which could be resolved from the response of the contributing traits.
Probably, the strong N-mineralization from the pre-crop grass-clover decreased the use of additional N fertilization for GY. Non-N-fertilized plots in an experiment conducted directly next to the study side yielded approximately 7 t ha−1 and took up 111 kg N ha−1 of GNup, which is not uncommon for this pre-crop [57], considering that soil mineralization was enhanced by warm conditions with sufficient precipitation. In a similar experiment conducted in the three previous years on the same experimental site with 13 genotypes including the six cultivars of this study, the N response in GY between 160 and 220 kg N ha−1 differed between years from a 21% increase under favorable growing conditions and four fungicide treatments to 10% under drought, and only 4% in the year with higher pathogen pressure [52]. The yield level in the present study of 9.5 t ha−1 in N2 in Cont was clearly higher than the 8.5 t ha−1 reached, on average, from 220 kg N ha−1 fertilized N in the previous years [52]. The same was observed for total DM at maturity (17.9 t ha−1 in N2 in Cont compared to 15.6 t ha−1 in previous years).
Total Nup at anthesis and maturity, grain N concentration and GNup (+33 kg N ha−1) were substantially higher in Cont/N2, than at the highest N level in previous years, in spite of a slightly lower NHI [52]. The study year profited from high radiation during May and June at below-average precipitation, conditions which fostered vegetative growth, enabled Cont and RF plots to compensate for later sowing, and curtailed disease growth. Considering the above-average precipitation in April, sowing date effects are likely to be stronger in drier years.
4.2. Dissecting the Grain Yield Response to Fungicide
Given that the fungicide intensity differed substantially between Cont and RF, the yield response (−12%) was moderate due to the low disease incidence influenced by the rather dry and warm conditions but was within the previously reported range [13,37,39]. While fungicides effectively prevented diseases in the treated plots, moderate disease incidence was detected in RF during grain-filling, caused by mildew (Erysiphae graminis), Septoria tritici and in some plots by Puccinia striiformis. However, image-based color analysis evidenced accelerated senescence also in non-visibly diseased leaves, indicating a combined effect of disease control and a secondary physiological ‘greening effect’ of the fungicides [35].
Fungicide-related yield effects were mainly related to increased kernel weight, confirming previous findings [37,38,39,42,58], whereas grain number per spike (GNS) was stable since pathogens were relevant only after anthesis [45]. In this phase, both spike density and grain number per spike were mostly determined, but kernel size reacts to the availability of assimilates. Therefore, increasing the source size through delaying the onset of senescence may be the major fungicide effect [42].
Thus, DM until anthesis was not affected by RF, but post-anthesis assimilation (PAA) decreased clearly (−20%). Still, the decrease in total above-ground DM at maturity (−3%, n.s.) was less pronounced compared to the decrease in the harvest index (HI, −9%). The lower HI is partly explained by a decreased dry matter translocation (DMT), due to a significantly lower translocation efficiency (DMTEff) of the culms. Analyzed from 13 trials, a high variability in the HI response was found previously, reaching from no effect to a relative decrease by 37% without fungicide [44], being in line with [38] and [40], but contrasting with [59], who reported stronger reduction in total DM than in HI. Bancal et al. (2007) found clearly lower DMT and its contribution to GY (15 to 36%) than in the present trial, but also no consistent influence from the fungicide treatment. Since the transport of assimilates to the roots and respiratory losses are not considered in the applied difference method, the apparent DMT and DMTEff captured the loss in DM, but it is likely that the effective translocation was overestimated by about one quarter [60], especially in RF, since assimilate losses are likely to be higher as an effect of fungi [61].
Since the total Nup and Nup efficiency were only marginally affected by RF, the response in NUE_total reflected mainly the response in NutEff_total, which decreased through lower PAA. NUE_grain declined due to lower NutEff_grain, which decreased through the combined effect of decreasing PAA and HI. This is in contrast to [13], where Nup (−7%) and NutEff_grain (−6%) decreased similarly between treated and non-treated plots. Decreased PAA was found to be closely related to lower post-anthesis PAR absorption [44].
4.3. Dissecting the Grain Yield Response to Early Sowing
In contrast to RF, yield effects of earlier sowing were mainly attributed to increased grain number per spike (GNS, +10%). Although pre-winter tillering was visibly increased in SD1, the Cont treatment appears to have quickly compensated for the lower tiller number, supported by the high soil N supply, so that spike densities were comparable. In the autumn, the total mineral soil N content in 0–60 cm was about 83 kg N ha−1 in SD1 and only 69 kg N ha−1 in Cont (not shown). The level remained high with 92 and 87 kg N ha−1 in SD1 and Cont during spring, respectively. The dominant effect of early sowing on GNS compared to spike density is in line with findings on durum wheat [10]. In contrast, depending on the growing conditions, rather spike density and TKW [20,67] or spike density and GNS [26] explained the sowing date effects on GY.
Early sowing resulted in earlier anthesis by only 2.8 days compared to seven to nine days found by [10], from a larger time span between sowing dates, however. High temperatures and radiation around anthesis in early June may have led to decreasing phenological shifts.
As for RF, the yield effect across N levels of early sowing was larger for post-anthesis assimilation (PAA) than for dry matter translocation (DMT). A higher GNS was related to only slightly increased spike weight (+4%, n.s.) at anthesis. Thus, plants sown earlier possibly increased GNS rather by maintaining more GNS through higher PAA, during grain-filling than through initially generating more grains. Higher PAA may be associated with better water and nutrient acquisition, if root growth is fostered through the longer vegetative phase, and with an escape strategy through shifting phenological critical phases like flowering towards more favorable periods [68]. While additional DM at anthesis was allocated to culms (+10%) and ‘other leaves’ (+21%), the higher leaf layers did not profit from earlier sowing, possibly indicating that the leaf area approached saturation. The sowing date’s main effects on DM traits were weaker than reported by [10], possibly due to the shorter time interval between sowing dates and the high baseline values in Cont due to the strong soil N mineralization and favorable growing conditions. More DM of culms and ‘other leaves’ could, however, not be efficiently translocated to the grains. Thus, these organs showed increased absolute and relative (partial HI) DM still at maturity. The overall DMTEff was substantially higher than in durum wheat [10], and also showed no sowing date effect.
In contrast to RF, the (positive) response in NUE_total and NUE_grain was a combined effect of increased NupEff (n.s.) and increased NutEff_total (n.s.) with a similar increase in NUE_grain and NutEff_grain due to the non-altered HI. Notably, no significant interaction of sowing date and N level was found for any one of the carbon and nitrogen traits, which is in line with [10]. The relative beneficial effect of earlier sowing was similar to the one found under Danish conditions (+0.9–1.1 t ha−1), where it was related to higher pre-winter Nup [29]. If early sowing leads to excessive pre-winter development, it may increase disease susceptibility [23]. However, unlike in RF, the N response was equal as in Cont, indicating that the two fungicide applications effectively compensated for the higher disease risk in SD1, together with the low disease pressure.
4.4. Dissecting the Response in Grain N Uptake to Reduced Fungicide
Considering that more than 90% of total Nup occurred until anthesis in all main plots, it is plausible that the fungicide treatment affected neither Nup at anthesis nor at maturity since disease effects were mostly detected after anthesis. Thus, the decrease in post-anthesis N uptake (PANup) by 6 kg N ha−1 was not significant either and weaker than the one found by [13]. In the present study, GNup tended to decrease by 9% in RF, mainly due to the lower NHI (−8%). This is in line with [40], whereas many trials, found a combined effect on total Nup, N mobilization, and NHI [38,43].
In all main plots, PANup contributed little (only 3%–11%) to GNup, in contrast to about one third found by [13] and [45]. The similar negative response in NT and PANup without fungicide contrasts with Bancal et al. (2008), who found a dominant effect on PANup and a wide response in NT. Concerning genotypic differences, the close relationship of GNup with total Nup but not with NHI, irrespective of the fungicide treatment, is in line with [45].
Bancal et al. (2008) reported a good relationship between leaf NT and GNup across environments without fungicide. Among organ-level NT traits, NT of flag leaves-1 explained genotypic GNup variation by 31–83% in the present data, but only in N1 (not shown). For all data, PANup explained GNup better (Figure 6) than total NT, but in contrast to [45], no relation was found for the variation between cultivars, possibly due to the considerably lower PANup. These authors reported only a few effects of late foliar diseases on NT of culms and chaff compared to leaf blades. Our data confirm the strongest reactions in leaf NTEff but also shows significantly decreased NTEff of spikes and culms. The level of NTEff (0.83 in Cont and 0.77 in RF) was higher than under English conditions [13] (0.72 and 0.68, respectively), clearly higher than in [14] (0.61–0.67 and 0.57–0.58, respectively) but similar in Cont as in [69], where NTEff decreased to 0.56 without fungicide, however. NTEff in Cont was similar as in previous years when fungal pathogens were well controlled, and on the same level as in another, fungi-affected year [52].
Although fungicide may delay the release of N from leaf blades [14,42,43,45], leaf residual Nup at maturity was increased by about 40% [45] without fungicide, and the disease effect was strongest for the flag leaves and flag leaves-1 [13]. These findings confirm the strong increase in Nup and the partitioning to flag leaves and flag leaves-1 as an effect of decreased NTEff in the present data. With GNup decreasing less than GY, GNC slightly increased without fungicide. In contrast, GNC did not respond to fungicide [13], increased [38,45] or reacted inconsistently [14] and may depend on the dominant fungi. The relative N response for anthesis and maturity Nup and GNup tended to be lower in RF. Other authors reported no N × fungicide interaction for total Nup, NT, and PANup [45], but for GNup [40].
The overall significant decrease in NTEff of all vegetative organs by 1% to 3% with higher fertilization is in line with [29]. In contrast, in a similar experiment conducted at the same site, a negative N effect was found on NTEff of culms but not of leaves [52]. Since both relative N-reactions in GY and GNup tended to be lower in RF, the N response of GNC was comparable in Cont and RF, which is in line with [45] and [70], who reported fungicide × N level interactions for GNC only in few reviewed studies.
4.5. Dissecting the Response in Grain N Uptake to Early Sowing
Early sowing increased total Nup (+5%) less clearly than total DM due to a concomitant decrease in N concentration. Thus, the Nup of most organs changed only marginally. Still, GNup reacted in the same way as total Nup due to the stable N harvest index (NHI) in contrast to RF. Negative relationships between total Nup at maturity and NHI (Figure 7) may indicate some degree of sink limitation for GNup too under high Nup conditions [71].
However, due to the advanced anthesis by two to three days, the slight advantage in total Nup at maturity (+10 kg N ha−1) is likely to originate partly from increased pre-winter Nup, being a major reason to sow earlier to decrease N losses over winter. In the present trial, three other genotypes were evaluated for early vigor [48]. In early spring, Nup was 19.5 kg ha−1 or 5 times higher than in late sown control plots (Supplementary Table S2: 15 March), and the difference increased to 36, 51 and 26 kg N ha−1 on 28 March, 4 April and 3 May, respectively. In contrast to post-anthesis Nup, N translocation and N translocation efficiency were almost unaltered by early sowing in spite of differing contributions of the vegetative organs, being in line with [10]. Since GNup increased less than GY with early sowing, GNC tended to decrease slightly, in contrast to substantially lower GNC in early sowing in [10].
In contrast to RF, the relative N response in SD1 was similar as in Cont for most N-related traits and no significant MP × N interactions were found, suggesting that no adapted fertilization was required for early sowing.
5. Conclusions
Traits contributing to GY and GNup were compared in response to reduced fungicide and earlier sowing at two N levels on six cultivars differing in phenology and pathogen susceptibility. The comparable low effect of the fungicide suggests that one application would have been sufficient for most cultivars. Though interactions of fungicide intensity and sowing date can be relevant [23,24], earlier sowing should be considered for decreasing over-winter N losses and for possible beneficial effects both on GY and GNup under the present conditions with optimum pre-crop and low pathogen incidence. However, the effects of the sowing date differ strongly between environments [72], and aspects of management and weather conditions must be considered in practice as well. The low interactions between sowing date and N level suggest that no specific fertilization timing would be necessary whereas the N effect was lower for several traits when no leaf fungicide was applied, confirming that levels of both treatments should be adapted together. Assessing the studied treatment factors in differing environments is recommended.
Supplementary Materials
The following are available online at https://www.mdpi.com/2073-4395/9/6/313/s1, Supplementary Figure S1: Pairwise trait relationships of traits of trait complexes e and f, Supplementary Table S1: ANOVA results for further, Supplementary Table S2: Early development from leaf development to early stem elongation.
Author Contributions
L.P. and U.S. conceived and designed the experiment; L.P. and M.G. conducted the experiment; L.P. analyzed the data; L.P. and U.S. wrote the manuscript.
Funding
This research was funded by the DFG (German Research Foundation)-funded project SCHM 1456/6-1.
Acknowledgments
The authors are grateful to two anonymous reviewers for helpful suggestions on the manuscript.
Conflicts of Interest
The authors declare no conflict of interest.
References
- Mueller, N.D.; Gerber, J.S.; Johnston, M.; Ray, D.K.; Ramankutty, N.; Foley, J.A. Closing yield gaps through nutrient and water management. Nature 2012, 490, 254–257. [Google Scholar] [CrossRef] [PubMed]
- Galloway, J.N.; Cowling, E.B. Reactive nitrogen and the world: 200 years of change. AMBIO A J. Hum. Environ. 2002, 31, 64–71. [Google Scholar] [CrossRef] [PubMed]
- Hirel, B.; Lemaire, G. From agronomy and ecophysiology to molecular genetics for improving nitrogen use efficiency in crops. J. Crop Improv. 2006, 15, 213–257. [Google Scholar] [CrossRef]
- Parry, M.A.J.; Reynolds, M.; Salvucci, M.E.; Raines, C.; Andralojc, P.J.; Zhu, X.G.; Price, G.D.; Condon, A.G.; Furbank, R.T. Raising yield potential of wheat. II. Increasing photosynthetic capacity and efficiency. J. Exp. Bot. 2011, 62, 453–467. [Google Scholar] [CrossRef] [PubMed]
- Cormier, F.; Faure, S.; Dubreuil, P.; Heumez, E.; Beauchêne, K.; Lafarge, S.; Praud, S.; Le Gouis, J. A multi-environmental study of recent breeding progress on nitrogen use efficiency in wheat (Triticum aestivum L.). Theor. Appl. Genet. 2013, 126, 3035–3048. [Google Scholar] [CrossRef]
- Guttieri, M.J.; Frels, K.; Regassa, T.; Waters, B.M.; Baenziger, P.S. Variation for nitrogen use efficiency traits in current and historical great plains hard winter wheat. Euphytica 2017, 213, 1–18. [Google Scholar] [CrossRef]
- Latshaw, S.P.; Vigil, M.F.; Haley, S.D. Genotypic Differences for Nitrogen Use Efficiency and Grain Protein Deviation in Hard Winter Wheat. Agron. J. 2016, 108, 2201. [Google Scholar] [CrossRef]
- Zecevic, V.; Boskovic, J.; Knezevic, D.; Micanovic, D. Effect of seeding rate on grain quality of winter wheat. Chil. J. Agric. Res. 2014, 74, 23–28. [Google Scholar] [CrossRef] [Green Version]
- Ehdaie, B.; Waines, J.G. Sowing date and nitrogen rate effects on dry matter and nitrogen partitioning in bread and durum wheat. Field Crop. Res. 2001, 73, 47–61. [Google Scholar] [CrossRef]
- Ferrise, R.; Triossi, A.; Stratonovitch, P.; Bindi, M.; Martre, P. Sowing date and nitrogen fertilisation effects on dry matter and nitrogen dynamics for durum wheat: An experimental and simulation study. Field Crop. Res. 2010, 117, 245–257. [Google Scholar] [CrossRef]
- Efretuei, A.; Gooding, M.; White, E.; Spink, J.; Hackett, R. Effect of nitrogen fertilizer application timing on nitrogen use efficiency and grain yield of winter wheat in Ireland. Ir. J. Agric. Food Res. 2016, 55, 63–73. [Google Scholar] [CrossRef] [Green Version]
- Nguyen, G.N.; Kant, S. Improving nitrogen use efficiency in plants: Effective phenotyping in conjunction with agronomic and genetic approaches. Funct. Plant Biol. 2018. [Google Scholar] [CrossRef]
- Gooding, M.J.; Gregory, P.J.; Ford, K.E.; Pepler, S. Fungicide and cultivar affect post-anthesis patterns of nitrogen uptake, remobilization and utilization efficiency in wheat. J. Agric. Sci. 2005, 143, 503. [Google Scholar] [CrossRef]
- Ruske, R.E.; Gooding, M.J.; Jones, S.A. The effects of triazole and strobilurin fungicide programmes on nitrogen uptake, partitioning, remobilization and grain N accumulation in winter wheat cultivars. J. Agric. Sci. 2003, 140, 395–407. [Google Scholar] [CrossRef]
- Munns, R.; James, R.A.; Sirault, X.R.R.; Furbank, R.T.; Jones, H.G. New phenotyping methods for screening wheat and barley for beneficial responses to water deficit. J. Exp. Bot. 2010, 61, 3499–3507. [Google Scholar] [CrossRef] [Green Version]
- Cammarano, D.; Basso, B.; Stefanova, L.; Grace, P. Adapting wheat sowing dates to projected climate change in the Australian subtropics: Analysis of crop water use and yield. Crop Pasture Sci. 2012, 63, 974. [Google Scholar] [CrossRef]
- Kipp, S.; Mistele, B.; Baresel, P.; Schmidhalter, U. High-throughput phenotyping early plant vigour of winter wheat. Eur. J. Agron. 2014, 52, 271–278. [Google Scholar] [CrossRef]
- Subedi, K.D.; Ma, B.L.; Xue, A.G. Planting date and nitrogen effects on grain yield and protein content of spring wheat. Crop Sci. 2007, 47, 36–44. [Google Scholar] [CrossRef]
- Rasmussen, I.S.; Thorup-Kristensen, K. Does earlier sowing of winter wheat improve root growth and N uptake? Field Crop. Res. 2016, 196, 10–21. [Google Scholar] [CrossRef]
- Kiss, T.; Balla, K.; Bányai, J.; Veisz, O.; Karsai, I. Effect of different sowing times on the plant developmental parameters of wheat (Triticum aestivum L.). Cereal Res. Commun. 2014, 42, 239–251. [Google Scholar] [CrossRef]
- Semenov, M.A.; Stratonovitch, P.; Alghabari, F.; Gooding, M.J. Adapting wheat in Europe for climate change. J. Cereal Sci. 2014, 59, 245–256. [Google Scholar] [CrossRef] [Green Version]
- Rasmussen, I.S.; Dresbøll, D.B.; Thorup-Kristensen, K. Winter wheat cultivars and nitrogen (N) fertilization—Effects on root growth, N uptake efficiency and N use efficiency. Eur. J. Agron. 2015, 68, 38–49. [Google Scholar] [CrossRef]
- Joergensen, L.N.; Secher, B.J.M.; Olesen, J.E.; Mortensen, J. Need for fungicide treatments when varying agricultural parameters. Asp. Appl. Biol. 1997, 50, 285–292. [Google Scholar]
- Kelley, K.W. Planting date and foliar fungicide effects on yield components and grain traits of winter wheat. Agron. J. 2001, 93, 380–389. [Google Scholar] [CrossRef]
- Milford, G.F.J.; Penny, A.; Prew, R.D.; Darby, R.J.; Todd, A.D. Effects of previous crop, sowing date, and winter and spring applications of nitrogen on the growth, nitrogen uptake and yield of winter wheat. J. Agric. Sci. 1993, 121, 1–12. [Google Scholar] [CrossRef]
- Donaldson, E.; Schillinger, W.F.; Dofing, S.M. Straw Production and Grain Yield Relationships in Winter Wheat. Crop Sci. 2001, 41, 100. [Google Scholar] [CrossRef]
- Schwarte, A.J.; Gibson, L.R.; Karlen, D.L.; Liebman, M.; Jannink, J. Planting Date Effects on Winter Triticale Dry Matter and Nitrogen Accumulation. Agron. J. 2005, 97, 1333–1341. [Google Scholar] [CrossRef] [Green Version]
- Christensen, B.T.; Jensen, J.L.; Thomsen, I.K. Impact of Early Sowing on Winter Wheat Receiving Manure or Mineral Fertilizers. Agron. J. 2017, 109, 1312. [Google Scholar] [CrossRef]
- Suarez-Tapia, A.; Rasmussen, J.; Thomsen, I.K.; Christensen, B.T. Early sowing increases nitrogen uptake and yields of winter wheat grown with cattle slurry or mineral fertilizers. J. Agric. Sci. 2018, 156, 177–187. [Google Scholar] [CrossRef]
- Mirosavljevic, M.; Przulj, N.; Momcilovic, V.; Hristov, N.; Maksimovic, I. Dry matter accumulation and remobilization in winter barley as affected by genotype and sowing date. Genetika 2015, 47, 751–763. [Google Scholar] [CrossRef]
- Ding, D.; Feng, H.; He, J.Q.; Zou, F.; Jin, J.M. Modifying Winter Wheat Sowing Date as an Adaptation to Climate Change on the Loess Plateau. Agron. J. 2016, 108, 53–63. [Google Scholar] [CrossRef] [Green Version]
- Yin, L.; Dai, X.; He, M. Delayed sowing improves nitrogen utilization e ffi ciency in winter wheat without impacting yield. Field Crop. Res. 2018, 221, 90–97. [Google Scholar] [CrossRef]
- Singh, R.P.; Singh, P.K.; Rutkoski, J.; Hodson, D.P.; He, X.; Jørgensen, L.N.; Hovmøller, M.S.; Huerta-Espino, J. Disease Impact on Wheat Yield Potential and Prospects of Genetic Control. Annu. Rev. Phytopathol. 2016, 54, 303–322. [Google Scholar] [CrossRef] [Green Version]
- Figueroa, M.; Hammond-Kosack, K.E.; Solomon, P.S. A review of wheat diseases—A field perspective. Mol. Plant Pathol. 2018, 19, 1523–1536. [Google Scholar] [CrossRef]
- Bertelsen, J.R.; De Neergaard, E.; Smedegaard-Petersen, V. Fungicidal effects of azoxystrobin and epoxiconazole on phyllosphere fungi, senescence and yield of winter wheat. Plant Pathol. 2001, 50, 190–205. [Google Scholar] [CrossRef]
- Wegulo, S.; Stevens, J.; Zwingman, M.; Baenziger, P.S. Yield Response to Foliar Fungicide Application in Winter Wheat. In Fungicides for Plant and Animal Diseases; InTech: Rijeka, Croatia, 2012; pp. 227–244. ISBN 9533078049. [Google Scholar]
- Bhatta, M.; Regassa, T.; Wegulo, S.N.; Baenziger, P.S. Foliar fungicide effects on disease severity, yield, and agronomic characteristics of modern winter wheat genotypes. Agron. J. 2018, 110, 602–610. [Google Scholar] [CrossRef]
- Olesen, J.E.; Jørgensen, L.N.; Mortensen, J.V. Irrigation strategy, nitrogen application and fungicide control in winter wheat on a sandy soil. II. Radiation interception and conversion. J. Agric. Sci. 2000, 134, 13–23. [Google Scholar] [CrossRef]
- Varga, B.; Svečnjak, Z.; Maćešić, D.; Uher, D. Winter wheat cultivar responses to fungicide application are affected by nitrogen fertilization rate. J. Agron. Crop Sci. 2005, 191, 130–137. [Google Scholar] [CrossRef]
- Ishikawa, S.; Hare, M.C.; Kettlewell, P.S. Effects of strobilurin fungicide programmes and fertilizer nitrogen rates on winter wheat: Leaf area, dry matter yield and nitrogen yield. J. Agric. Sci. 2012, 150, 427–441. [Google Scholar] [CrossRef]
- Mourtzinis, S.; Marburger, D.; Gaska, J.; Diallo, T.; Lauer, J.G.; Conley, S. Corn, soybean, and wheat yield response to crop rotation, nitrogen rates, and foliar fungicide application. Crop Sci. 2017, 57, 983–992. [Google Scholar] [CrossRef]
- Gooding, M.J.; Dimmock, J.P.R.E.; France, J.; Jones, S.A. Green leaf area decline of wheat flag leaves: The influence of fungicides and relationships with mean grain weight and grain yield. Ann. Appl. Biol. 2000, 136, 77–84. [Google Scholar] [CrossRef]
- Gooding, M.J. Influence of foliar diseases and their control by fungicides on grain yield and quality in wheat. In Wheat Production in Stressed Environments; Springer: Dordrecht, The Neverlands, 2007; Volume 12, pp. 567–581. [Google Scholar]
- Bancal, M.-O.; Robert, C.; Ney, B. Modelling Wheat Growth and Yield Losses from Late Epidemics of Foliar Diseases using Loss of Green Leaf Area per Layer and Pre-anthesis Reserves. Ann. Bot. 2007, 100, 777–789. [Google Scholar] [CrossRef] [Green Version]
- Bancal, M.-O.; Roche, R.; Bancal, P. Late foliar diseases in wheat crops decrease nitrogen yield through N uptake rather than through variations in N remobilization. Ann. Bot. 2008, 102, 579–590. [Google Scholar] [CrossRef]
- Garnault, M.; Duplaix, C.; Leroux, P.; Couleaud, G.; Carpentier, F.; David, O.; Walker, A.A. Spatiotemporal dynamics of fungicide resistance in the wheat pathogen Zymoseptoria tritici in France. Pest Manag. Sci. 2019. [Google Scholar] [CrossRef]
- Wegulo, S.N.; Zwingman, M.V.; Breathnach, J.A.; Baenziger, P.S. Economic returns from fungicide application to control foliar fungal diseases in winter wheat. Crop Prot. 2011, 30, 685–692. [Google Scholar] [CrossRef] [Green Version]
- Prey, L.; von Bloh, M.; Schmidhalter, U. Evaluating RGB Imaging and Multispectral Active and Hyperspectral Passive Sensing for Assessing Early Plant Vigor in Winter Wheat. Sensors 2018, 18, 2931. [Google Scholar] [CrossRef]
- Bundessortenamt. Beschreibende Sortenliste Getreide, Mais, Öl- und Faserpflanzen, Leguminosen, Rüben, Zwischenfrüchte; Bundessortenamt: Hannover, Germany, 2016. [Google Scholar]
- Zadoks, J.C.; Chang, T.T.; Konzak, C.F. A decimal code for the growth stages of cereals. Weed Res. 1974, 14, 415–421. [Google Scholar] [CrossRef]
- Meier, U. Entwicklungsstadien mono- und dikotyler Pflanzen. Biol. Bundesanst. L. Forstwirtsch. 2001, 2, 1–165. [Google Scholar]
- Prey, L.; Kipp, S.; Hu, Y.; Schmidhalter, U. Nitrogen Use Efficiency and Carbon Traits of High-Yielding European Hybrid vs. Line Winter Wheat Cultivars: Potentials and Limitations. Front. Plant Sci. 2019, 9, 1988. [Google Scholar] [CrossRef] [Green Version]
- Barmeier, G.; Mistele, B.; Schmidhalter, U. Referencing laser and ultrasonic height measurements of barley cultivars by using a herbometre as standard. Crop Pasture Sci. 2017, 67, 1215–1222. [Google Scholar] [CrossRef]
- Papakosta, D.K.; Gagianas, A.A. Nitrogen and Dry Matter Accumulation, Remobilization, and Losses for Mediterranean Wheat during Grain Filling. Agron. J. 1991, 83, 864–870. [Google Scholar] [CrossRef]
- Cox, M.C.; Qualset, C.O.; Rains, D.W. Genetic Variation for Nitrogen Assimilation and Translocation in Wheat. II. Nitrogen Assimilation in Relation to Grain Yield and Protein. Crop Sci. 1985, 25, 435–440. [Google Scholar] [CrossRef]
- Moll, R.H.; Kamprath, E.J.; Jackson, W.A. Analysis and Interpretation of Factors Which Contribute to Efficiency of Nitrogen Utilization1. Agron. J. 1982, 74, 562. [Google Scholar] [CrossRef]
- Brozyna, M.A.; Petersen, S.O.; Chirinda, N.; Olesen, J.E. Effects of grass-clover management and cover crops on nitrogen cycling and nitrous oxide emissions in a stockless organic crop rotation. Agric. Ecosyst. Environ. 2013, 181, 115–126. [Google Scholar] [CrossRef]
- McCartney, C.; Mercer, P.C.; Cooke, L.R.; Fraaije, B.A. Effects of a strobilurin-based spray programme on disease control, green leaf area, yield and development of fungicide-resistance in Mycosphaerella graminicola in Northern Ireland. Crop Prot. 2007, 26, 1272–1280. [Google Scholar] [CrossRef]
- Serrago, R.A.; Carretero, R.; Bancal, M.O.; Miralles, D.J. Foliar diseases affect the eco-physiological attributes linked with yield and biomass in wheat (Triticum aestivum L.). Eur. J. Agron. 2009, 31, 195–203. [Google Scholar] [CrossRef]
- Gebbing, T.; Schnyder, H.; Kühbauch, W. The utilization of pre-anthesis reserves in grain filling of wheat. Assessment by steady-state 13CO2/12CO2 labelling. Plant Cell Environ. 1999, 22, 851–858. [Google Scholar] [CrossRef]
- Ayres, P.G.; Press, M.C.; Spencer-Phillips, P.T.N. Effects of pathogens and parasitic plants on source-sink relationships. In Photoassimilate Distribution in Plants and Crops; Zamski, E., Schaffer, A.A., Eds.; Marcel Dekker: New York, NY, USA, 1996; Volume 8, pp. 479–499. [Google Scholar]
- Fagard, M.; Launay, A.; Clement, G.; Courtial, J.; Dellagi, A.; Farjad, M.; Krapp, A.; Soulie, M.-C.; Masclaux-Daubresse, C. Nitrogen metabolism meets phytopathology. J. Exp. Bot. 2014, 65, 5643–5656. [Google Scholar] [CrossRef] [PubMed]
- Dordas, C. Role of nutrients in controlling plant diseases in sustainable agriculture. A review. Agron. Sustain. Dev. 2008, 28, 33–46. [Google Scholar] [CrossRef] [Green Version]
- Robert, C.; Bancal, M.; Lannou, C. Wheat Leaf Rust Uredospore Production and Carbon and Nitrogen Export in Relation to Lesion Size and Density. Phytopathology 2002, 92, 762–768. [Google Scholar] [CrossRef] [Green Version]
- Howard, D.D.; Chambers, A.Y.; Logan, J. Nitrogen and fungicide effects on yield components and disease severity in wheat. J. Prod. Agric. 1994, 7, 448–454. [Google Scholar] [CrossRef]
- Leitch, M.H.; Jenkins, P.D. Influence of nitrogen on the development of Septoria epidemics in winter wheat. J. Agric. Sci. 1995, 124, 361–368. [Google Scholar] [CrossRef]
- Tapley, M.; Ortiz, B.V.; Van Santen, E.; Balkcom, K.S.; Mask, P.; Weaver, D.B. Location, Seeding Date, and Variety Interactions on Winter Wheat Yield in Southeastern United States. Agron. J. 2001, 105, 509–518. [Google Scholar] [CrossRef]
- Bodner, G.; Nakhforoosh, A.; Kaul, H.-P. Management of crop water under drought: A review. Agron. Sustain. Dev. 2015, 35, 401–442. [Google Scholar] [CrossRef]
- Barbottin, A.; Lecomte, C.; Bouchard, C.; Jeuffroy, M.-H. Nitrogen Remobilization during Grain Filling in Wheat. Crop Sci. 2005, 45, 1141. [Google Scholar] [CrossRef]
- Dimmock, J.; Gooding, M.J. The influence of foliar diseases, and their control by fungicides, on the protein concentration in wheat grain: A review. Wheat Prod. Stress. Environ. 2005, 138, 567–581. [Google Scholar] [CrossRef]
- Bancal, P. Decorrelating source and sink determinism of nitrogen remobilization during grain filling in wheat. Ann. Bot. 2009, 103, 1315–1324. [Google Scholar] [CrossRef] [Green Version]
- Winter, S.R.; Musick, J.T. Wheat planting date effects on soil water extraction and grain yield. Agron. J. 1993, 85, 912–916. [Google Scholar] [CrossRef]
Figure 1.
Weather conditions during the main wheat-growing period from March to July 2017 at the experimental site. On 9–10 June, anthesis was on average in the control and reduced fungicide plots and on 6–7 June in the earlier sown plots.
Figure 1.
Weather conditions during the main wheat-growing period from March to July 2017 at the experimental site. On 9–10 June, anthesis was on average in the control and reduced fungicide plots and on 6–7 June in the earlier sown plots.

Figure 2.
Pairwise trait relationships in trait complex a: The relationships between grain Nup and grain yield (a), grain Nup and grain N concentration (b) and grain yield and grain N concentration (c). Data points correspond to average cultivar values. N levels are distinguished by line types and color intensities (N1: Dashed lines and light colors, N2: Dotted lines and dark colors). Dashed and dotted lines delimit the bivariate data range covered by cultivars within MP × N-combinations. Colored regression lines indicate the linear trait relationships within MP × N-combinations and gray lines the regression line for the whole trial, calculated across the included data of reduced fungicide (RF), control (Cont) and sowing date 1 (SD1). Gray lines are only drawn for significant relationships (p < 0.05). P-values of regression slopes are indicated as p < 0.01 (***), p < 0.01(**), p < 0.05 (*) and p < 0.1 (´).

Figure 3.
Selected pairwise trait relationships in trait complex b: DM of grain at maturity (GY) in relation to the direct yield components grain number per spike (a) and thousand kernel weight (b) and the combined yield component kernels per m2 (c). N levels are distinguished by line types and color intensities (N1: Dashed lines and light colors, N2: Dotted lines and dark colors). Dashed and dotted lines delimit the bivariate data range covered by cultivars within MP × N-combinations. Colored regression lines indicate the linear trait relationships within MP × N-combinations and gray lines the regression line for the whole trial, calculated across the included data of reduced fungicide (RF), control (Cont) and sowing date 1 (SD1). Gray lines are only drawn for significant relationships (p < 0.05). P-values of regression slopes are indicated as p < 0.01 (***), p < 0.01(**), p < 0.05 (*) and p < 0.1 (´).

Figure 4.
Selected pairwise trait relationship in trait complex c: DM of grain at maturity (GY) in relation to its additive component post-anthesis assimilation (PAA). N levels are distinguished by line types and color intensities (N1: Dashed lines and light colors, N2: Dotted lines and dark colors). Dashed and dotted lines delimit the bivariate data range covered by cultivars within MP × N-combinations. Colored regression lines indicate the linear trait relationships within MP × N-combinations and gray lines the regression line for the whole trial, calculated across the included data of reduced fungicide (RF), control (Cont) and sowing date 1 (SD1). Gray lines are only drawn for significant relationships (p < 0.05). P-values of regression slopes are indicated as p < 0.01 (***), p < 0.01(**), p < 0.05 (*) and p < 0.1 (´).

Figure 5.
Selected pairwise trait relationships in trait complex d: DM of grain at maturity (GY) in relation to its two multiplicative components total dry matter at maturity (DM Mat. total, (a)), and harvest index (unitless, (b)). N levels are distinguished by line types and color intensities (N1: Dashed lines and light colors, N2: Dotted lines and dark colors). Dashed and dotted lines delimit the bivariate data range covered by cultivars within MP × N-combinations. Colored regression lines indicate the linear trait relationships within MP × N-combinations and gray lines the regression line for the whole trial, calculated across the included data of reduced fungicide (RF), control (Cont) and sowing date 1 (SD1). Gray lines are only drawn for significant relationships (p < 0.05). P-values of regression slopes are indicated as p < 0.01 (***), p < 0.01(**), p < 0.05 (*) and p < 0.1 (´).

Figure 6.
Selected pairwise trait relationships in trait complex g: Nup of grain at maturity (GNup) by its two additive components N translocation (NT, (a)) and post-anthesis N uptake (PANup, (b)). N levels are distinguished by line types and color intensities (N1: Dashed lines and light colors, N2: Dotted lines and dark colors). Dashed and dotted lines delimit the bivariate data range covered by cultivars within MP × N-combinations. Colored regression lines indicate the linear trait relationships within MP × N-combinations and gray lines the regression line for the whole trial, calculated across the included data of reduced fungicide (RF), control (Cont) and sowing date 1 (SD1). Gray lines are only drawn for significant relationships (p < 0.05). p-values of regression slopes are indicated as p < 0.01 (***), p < 0.01(**), p < 0.05 (*) and p < 0.1 (´).

Figure 7.
Pairwise trait relationships in trait complex h: Nup of grain at maturity (GNup) in relation to its two multiplicative components total Nup at maturity (Nup Mat. total, (a)) and the N harvest index (NHI, unitless, (b)) as well as the relationship of total Nup at maturity with NHI (c). N levels are distinguished by line types and color intensities (N1: Dashed lines and light colors, N2: Dotted lines and dark colors). Dashed and dotted lines delimit the bivariate data range covered by cultivars within MP × N-combinations. Colored regression lines indicate the linear trait relationships within MP × N-combinations and gray lines the regression line for the whole trial, calculated across the included data of reduced fungicide (RF), control (Cont) and sowing date 1 (SD1). Gray lines are only drawn for significant relationships (p < 0.05). P-values of regression slopes are indicated as p < 0.01 (***), p < 0.01(**), p < 0.05 (*) and p < 0.1 (´).

Figure 8.
Reaction in the apparent translocation efficiency of dry matter (DMTEff, (a)) and nitrogen (NTEff, (b)) as well as in the proportional organ-level allocation of DM (partial harvest index HI, (c,e)) and nitrogen (partial harvest index NHI, (d,f)), both at anthesis and maturity, by vegetative plant organs and main plot (colors) and N (color intensity) treatments. Error bars are one-sided standard deviations. The ANOVA treatment effects are reported in Supplementary Table S1.

Figure 9.
Vertical distribution of dry matter (DM, a–f), N concentration (NC, g–l) and N uptake (Nup, m–r) by sampling dates (Ant: Anthesis and Mat: Maturity): Average values for three MP treatment blocks (above, RF: Reduced fungicide, Cont: Control, SD1: Sowing date 1), the two N levels (middle) and six cultivars (bottom).

Figure 10.
N translocation (NT) and its relation to total Nup at anthesis (left, kg N ha−1, (a)) and the apparent N translocation efficiency (NTEff, (b)). N levels are distinguished by line types and color intensities (N1: Dashed lines and light colors, N2: Dotted lines and dark colors). Dashed and dotted lines delimit the bivariate data range covered by cultivars within MP × N-combinations. Colored regression lines indicate the linear trait relationships within MP × N-combinations and gray lines the regression line for the whole trial, calculated across the included data of reduced fungicide (RF), control (Cont) and sowing date 1 (SD1). Gray lines are only drawn for significant relationships (p < 0.05). P-values of regression slopes are indicated as p < 0.01 (***), p < 0.01(**), p < 0.05 (*) and p < 0.1 (´).


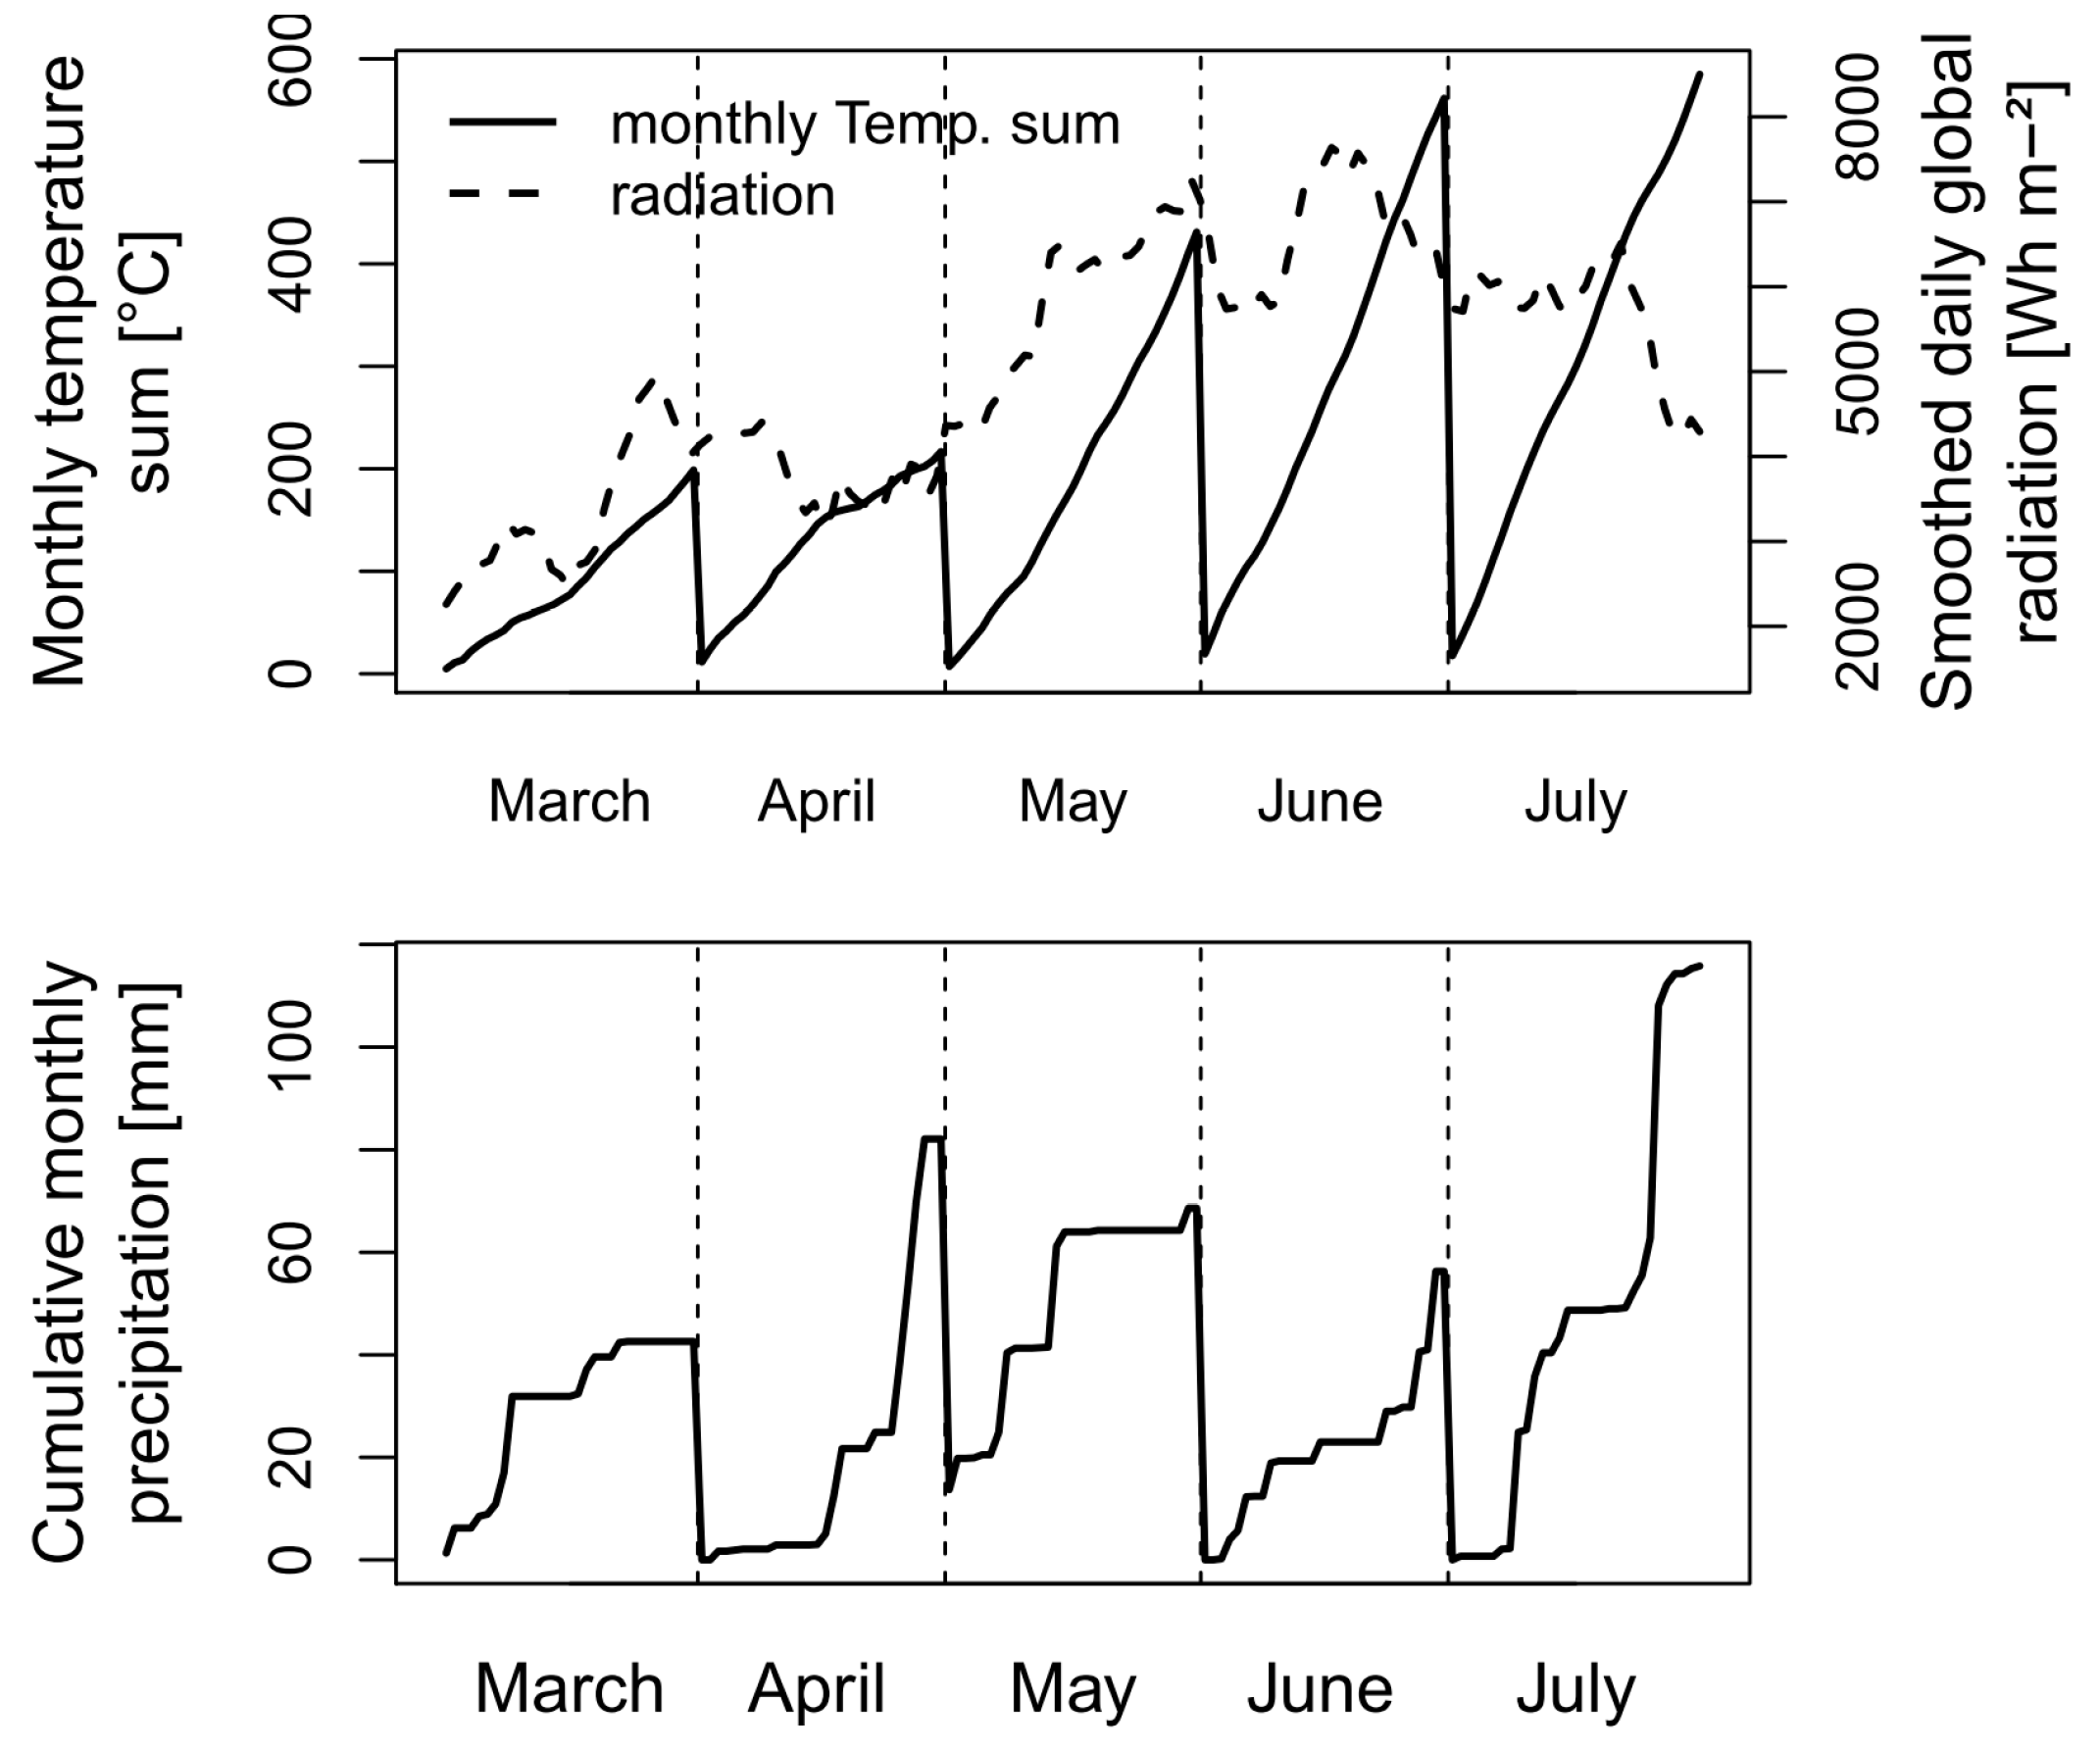
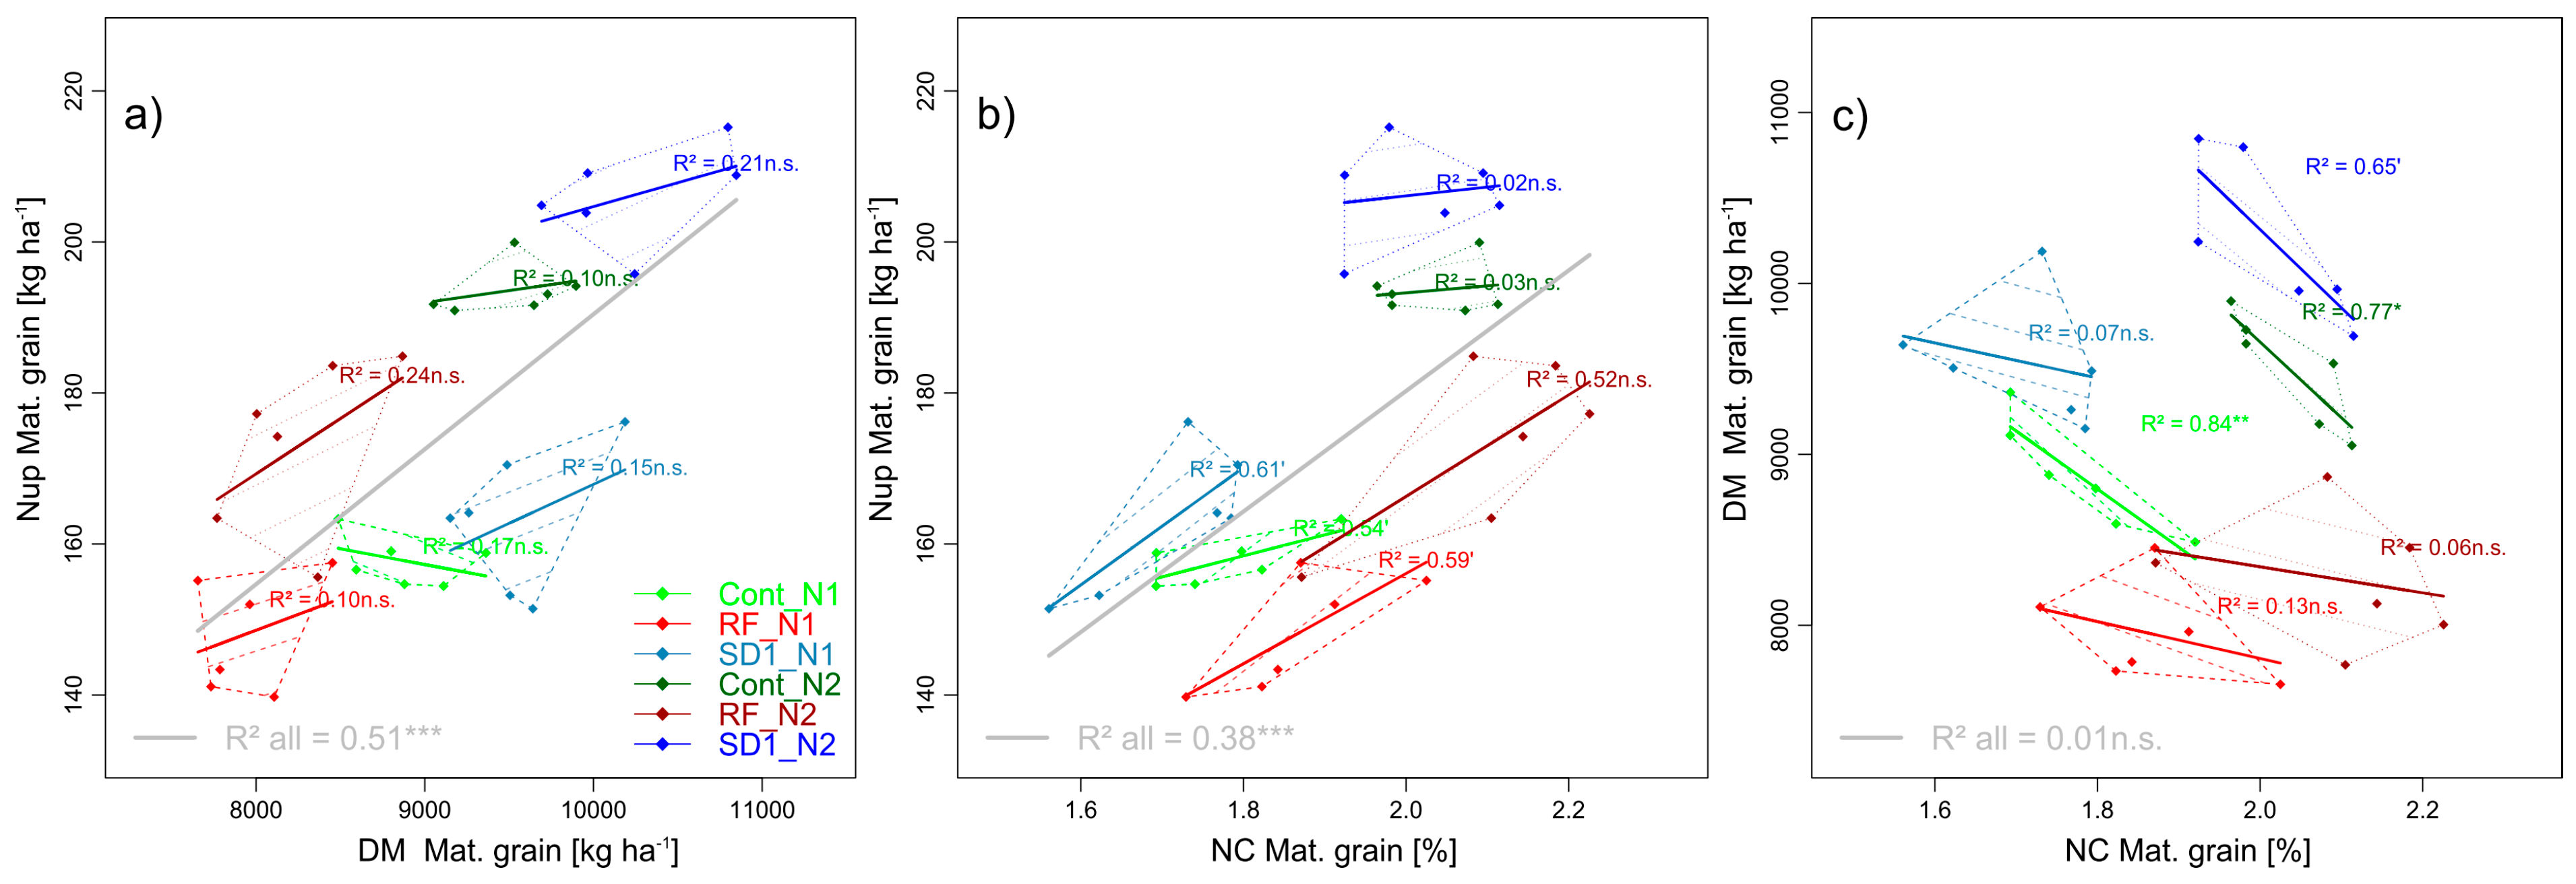
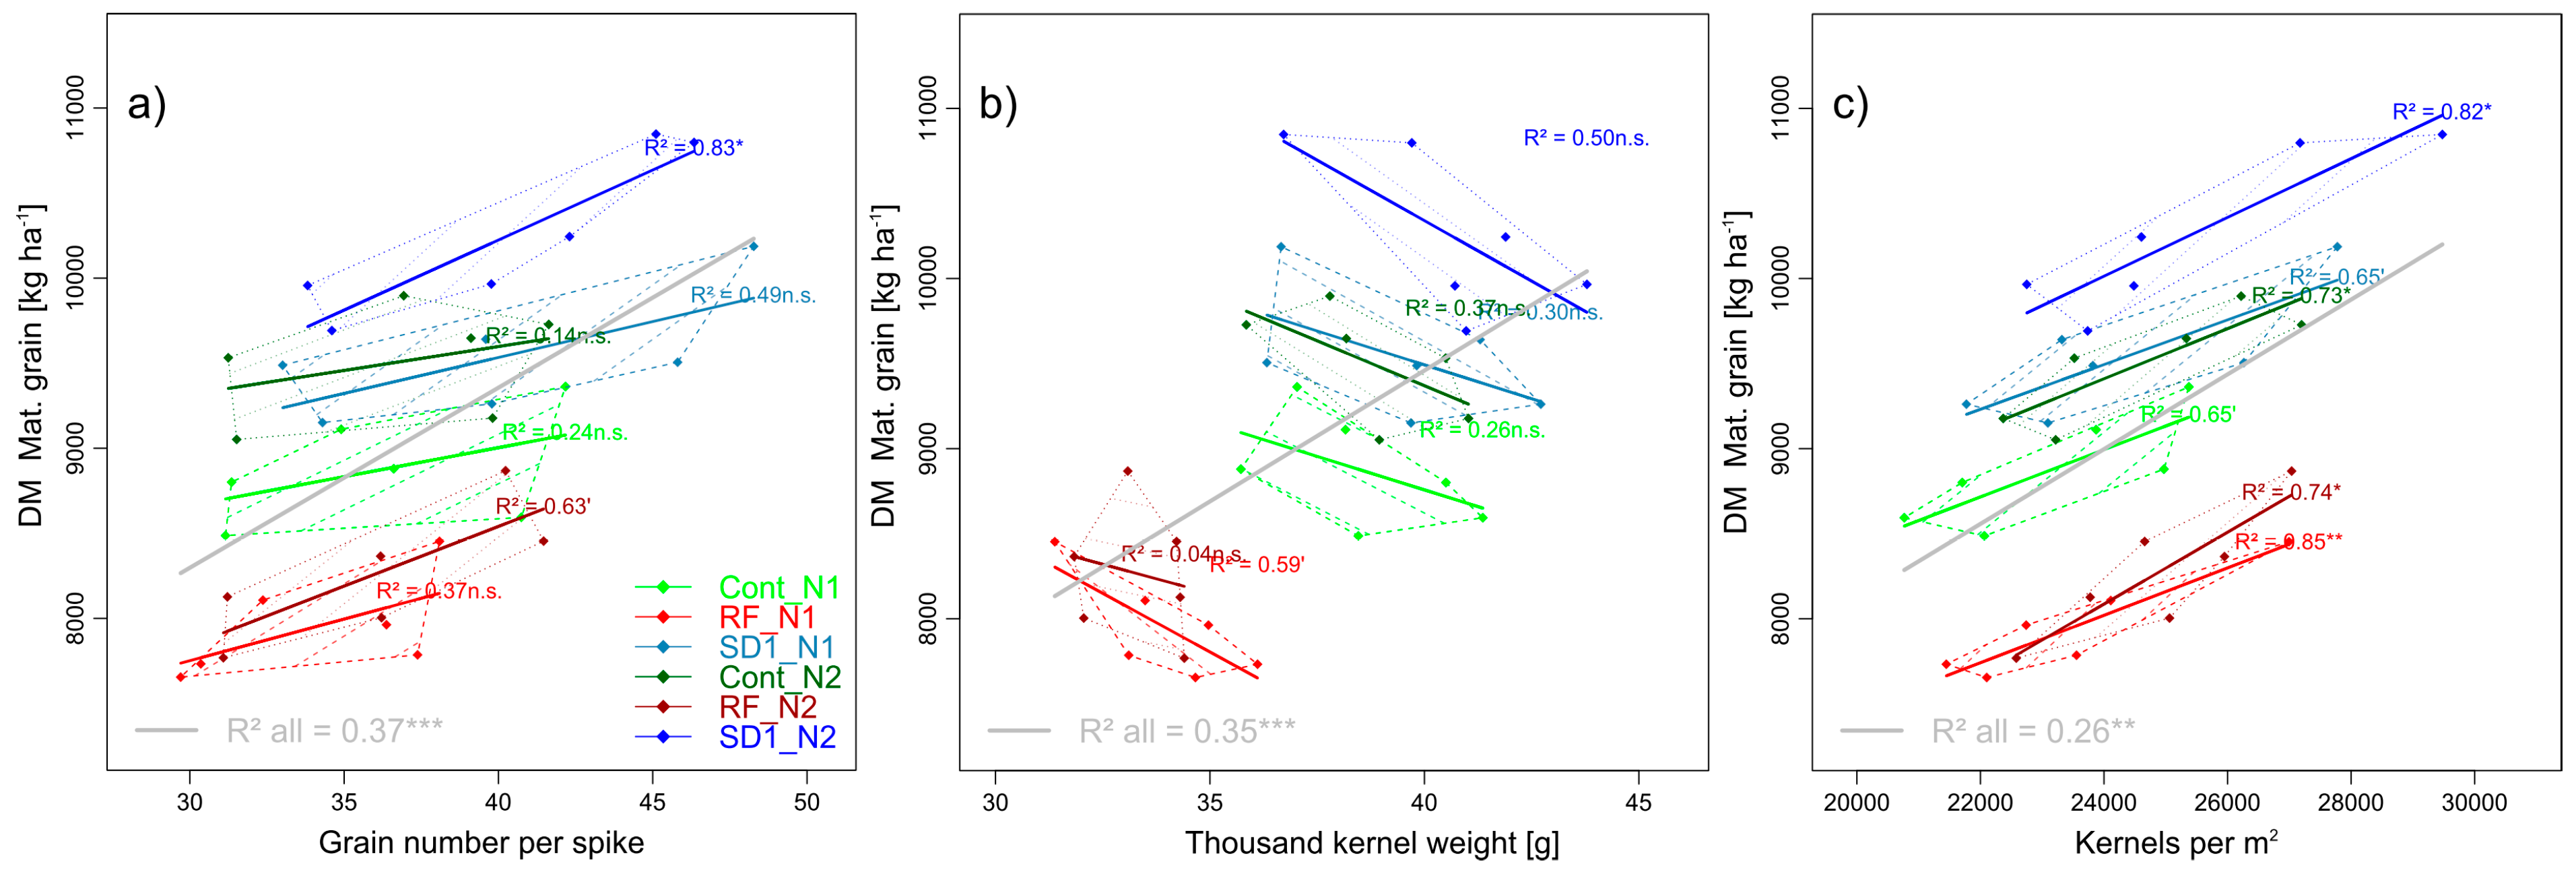
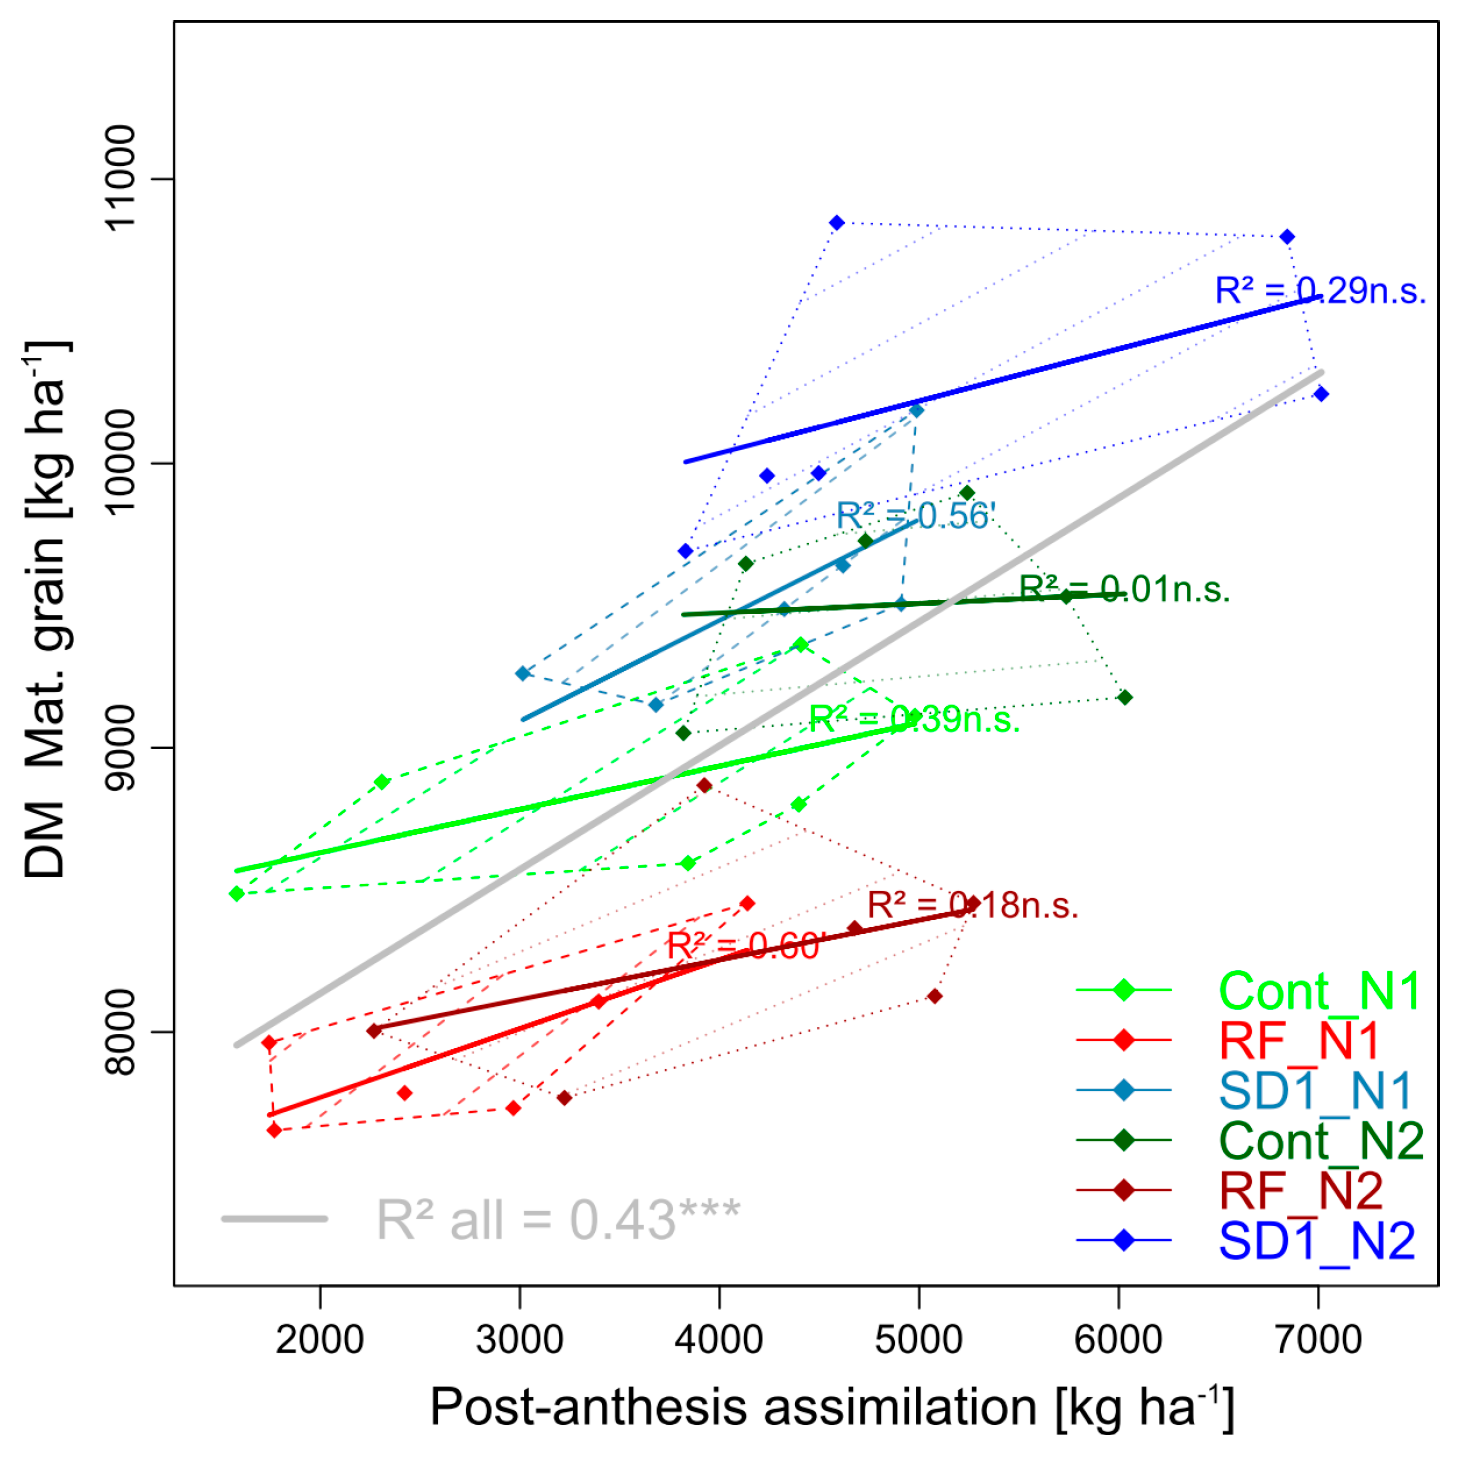
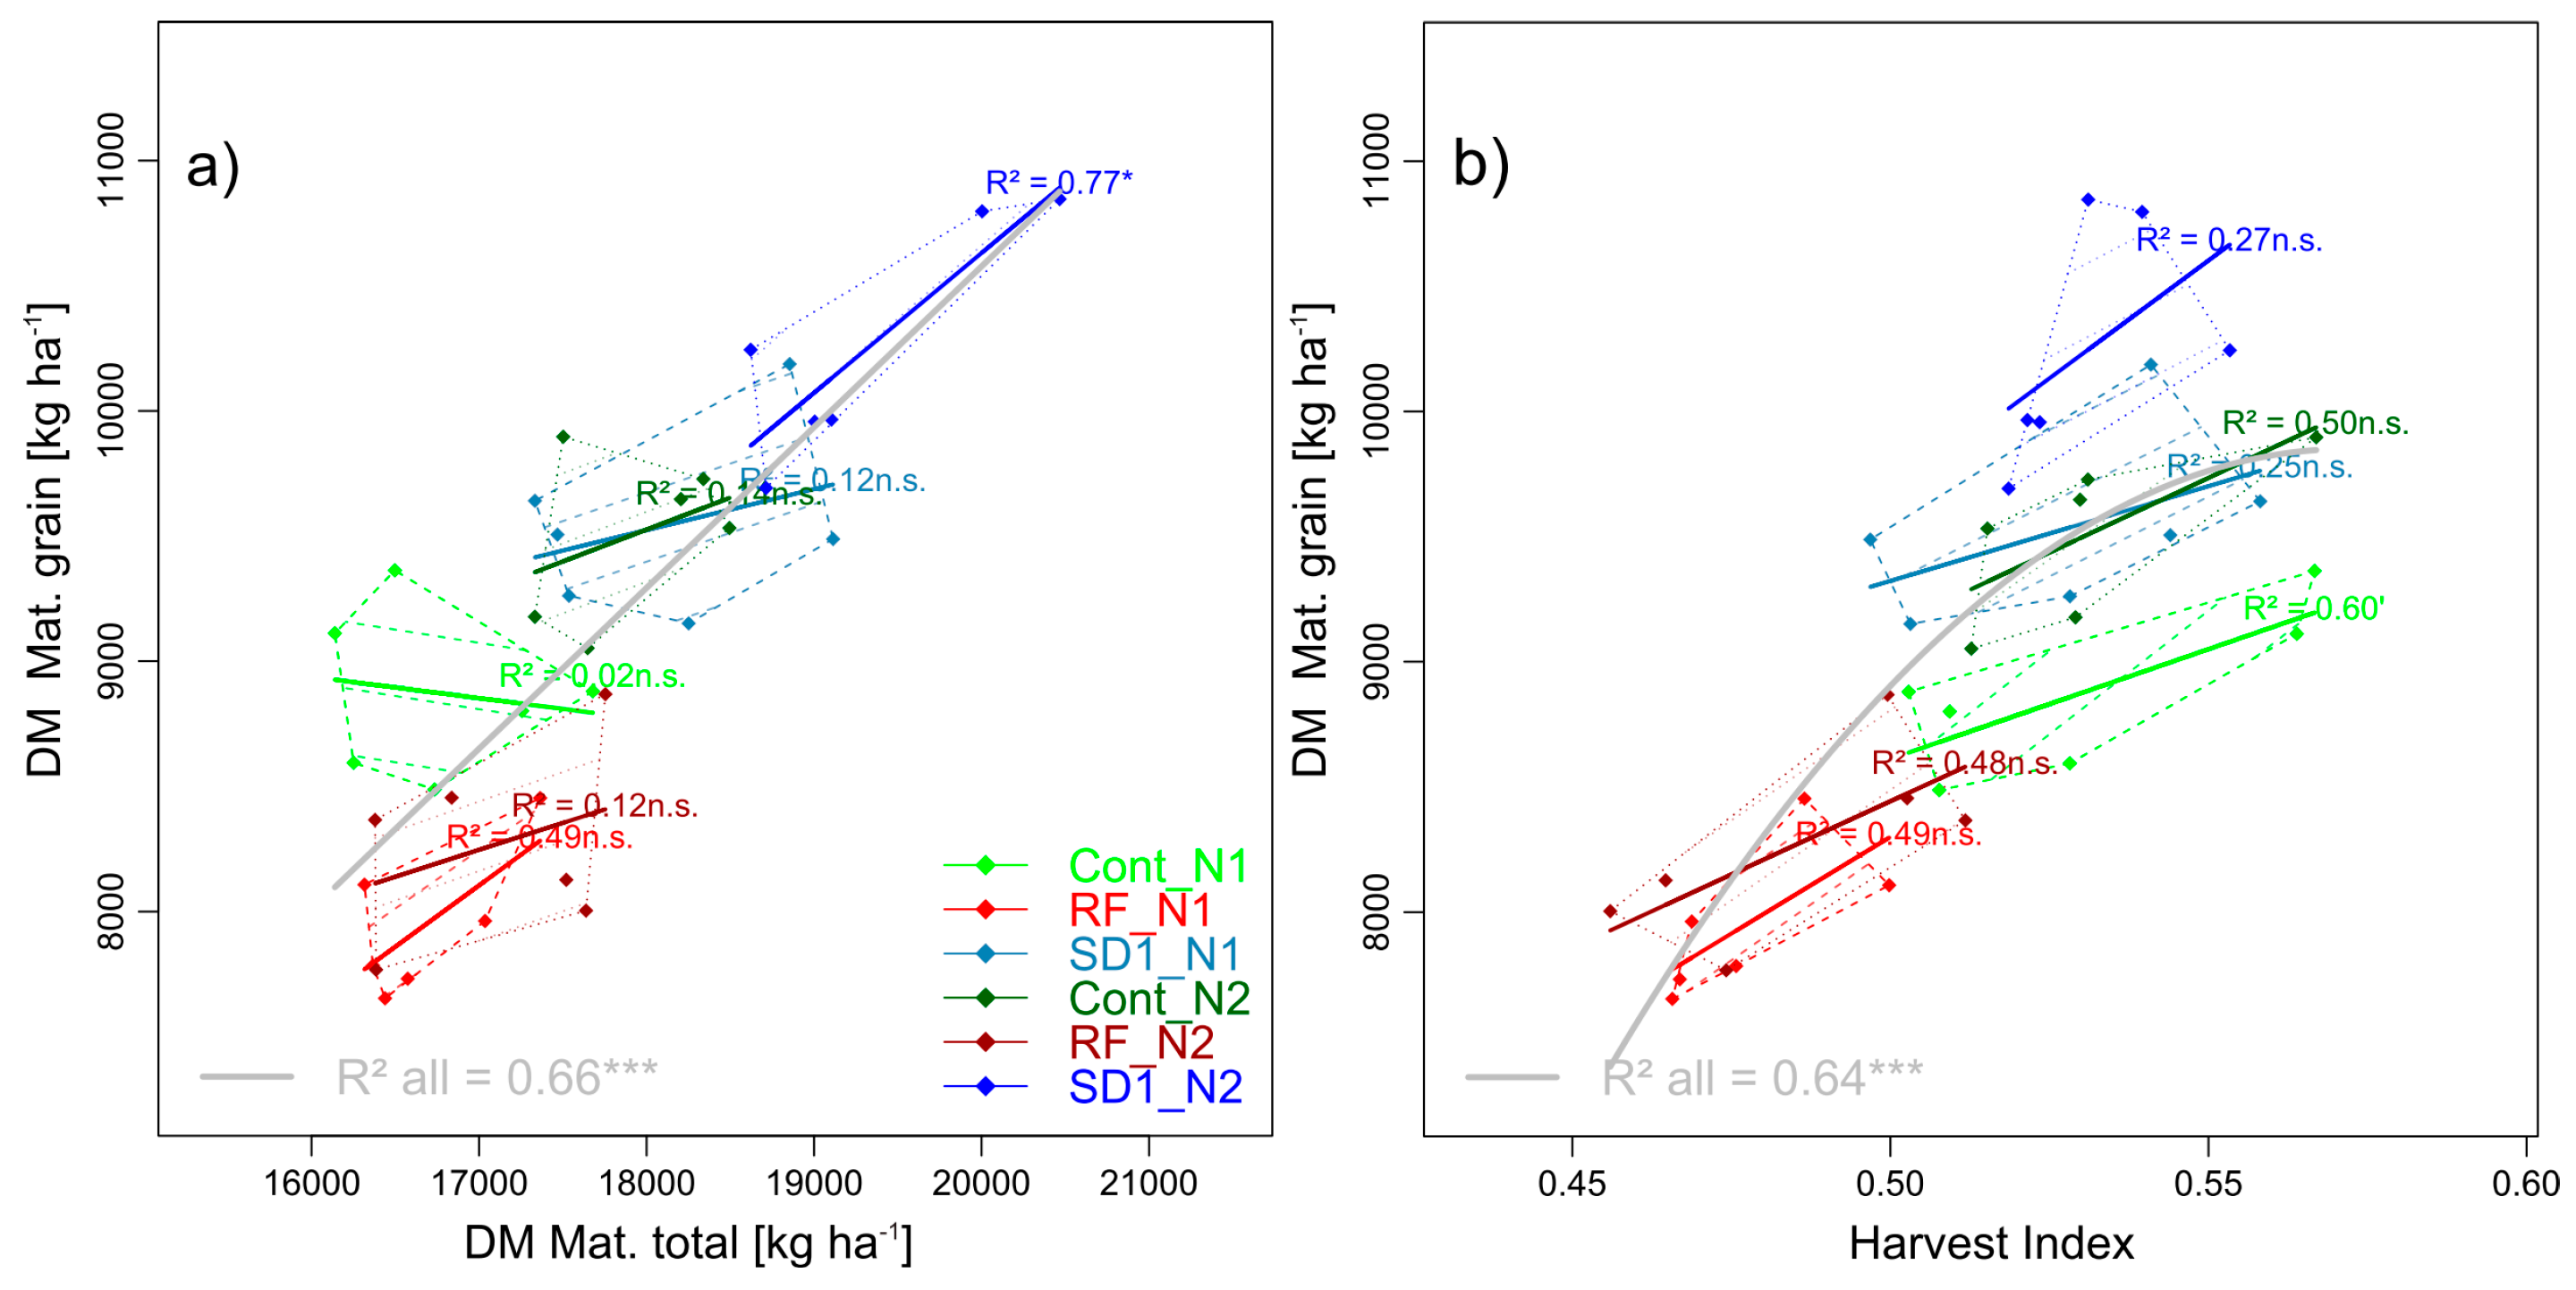
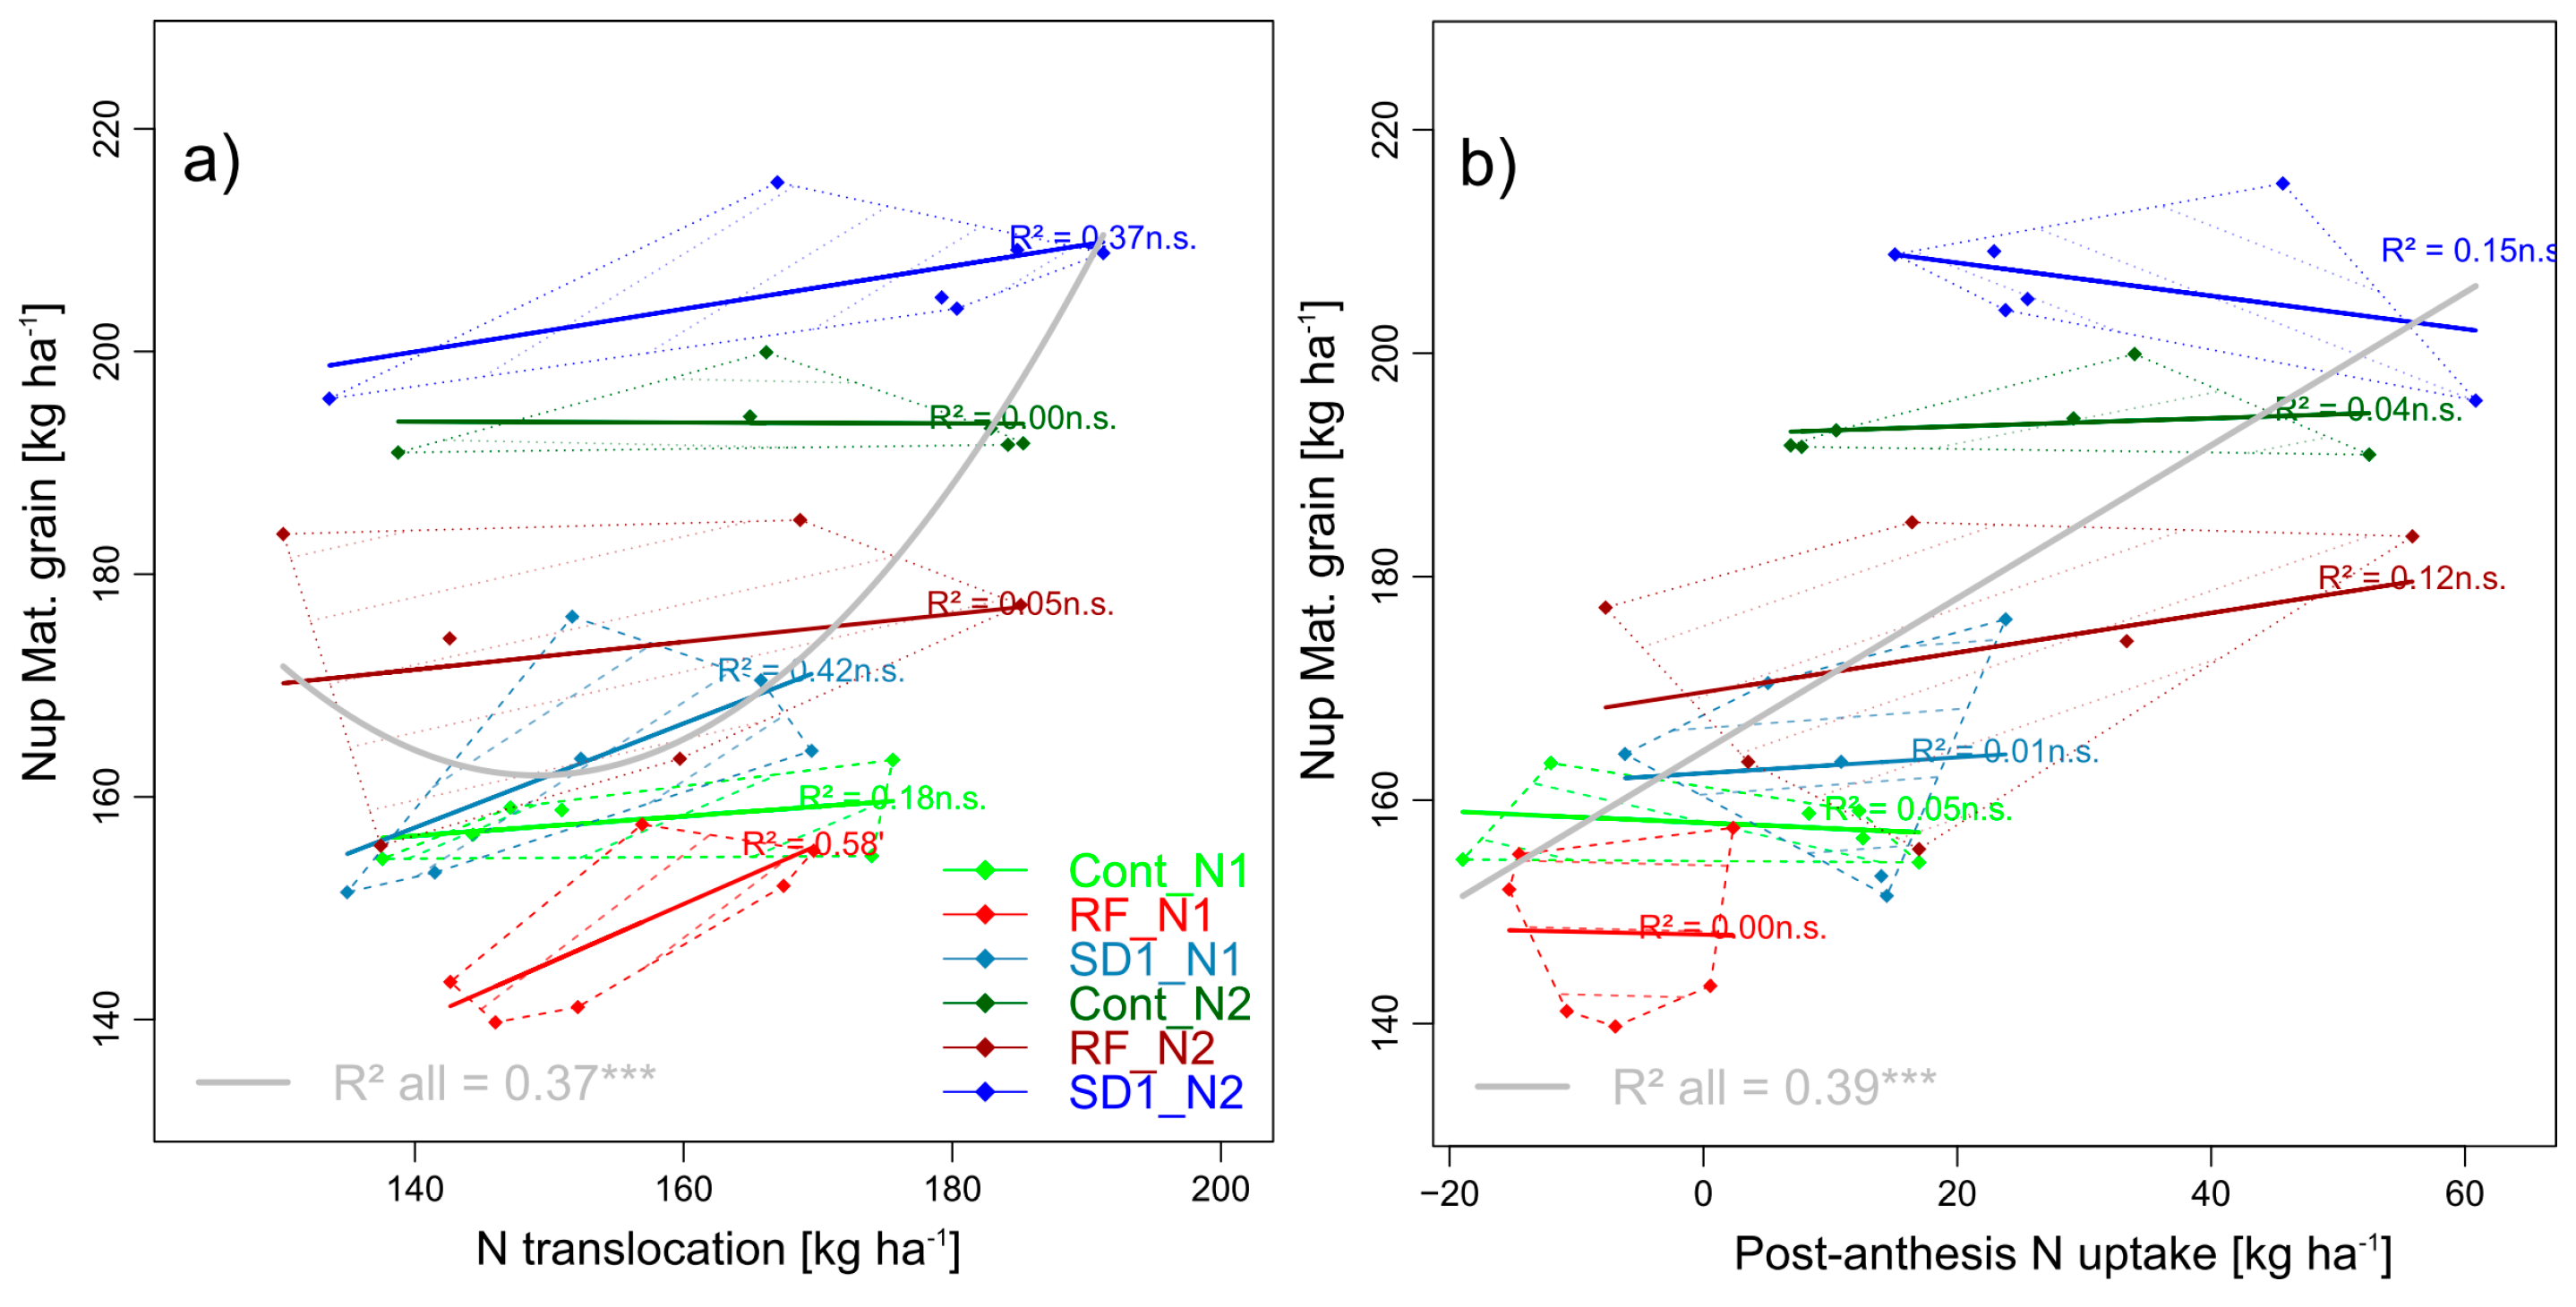
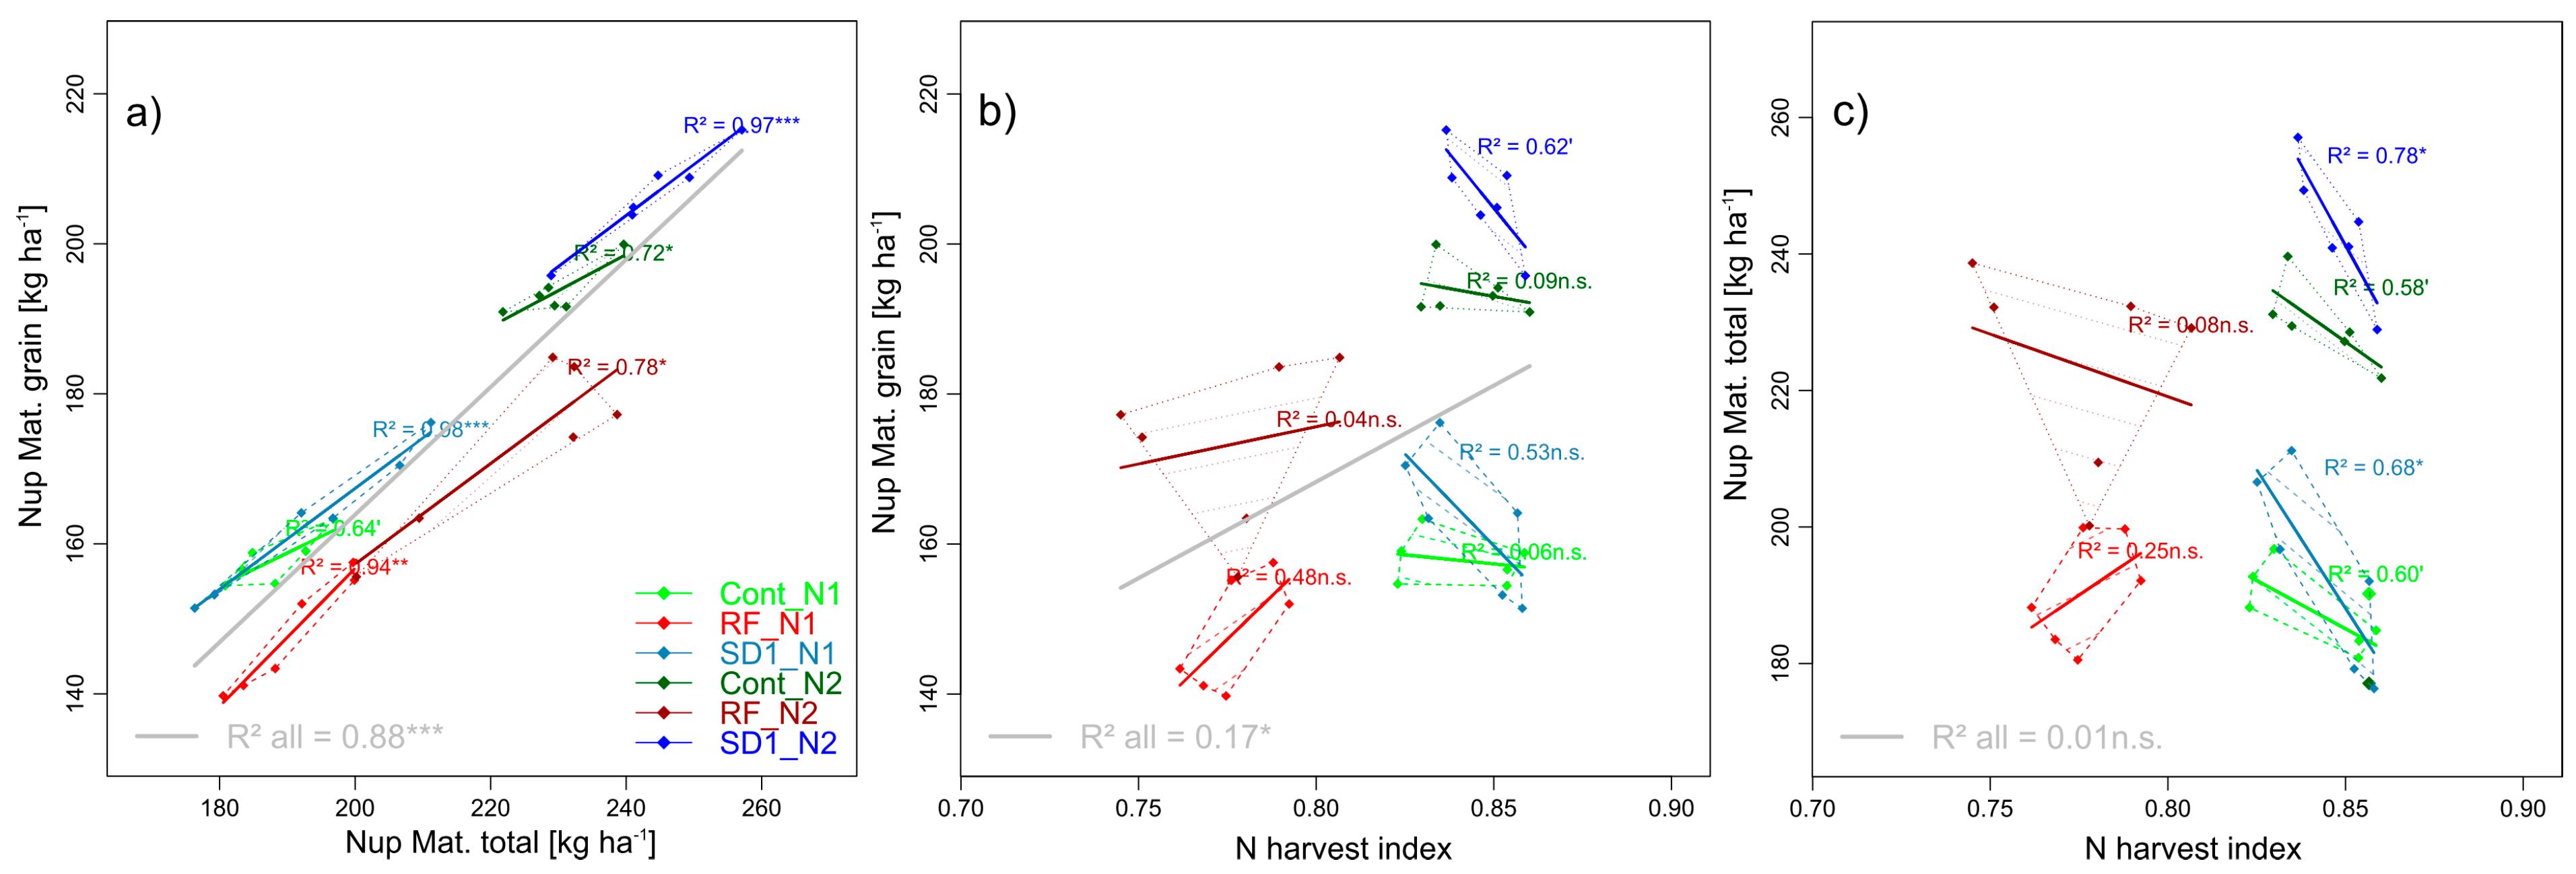
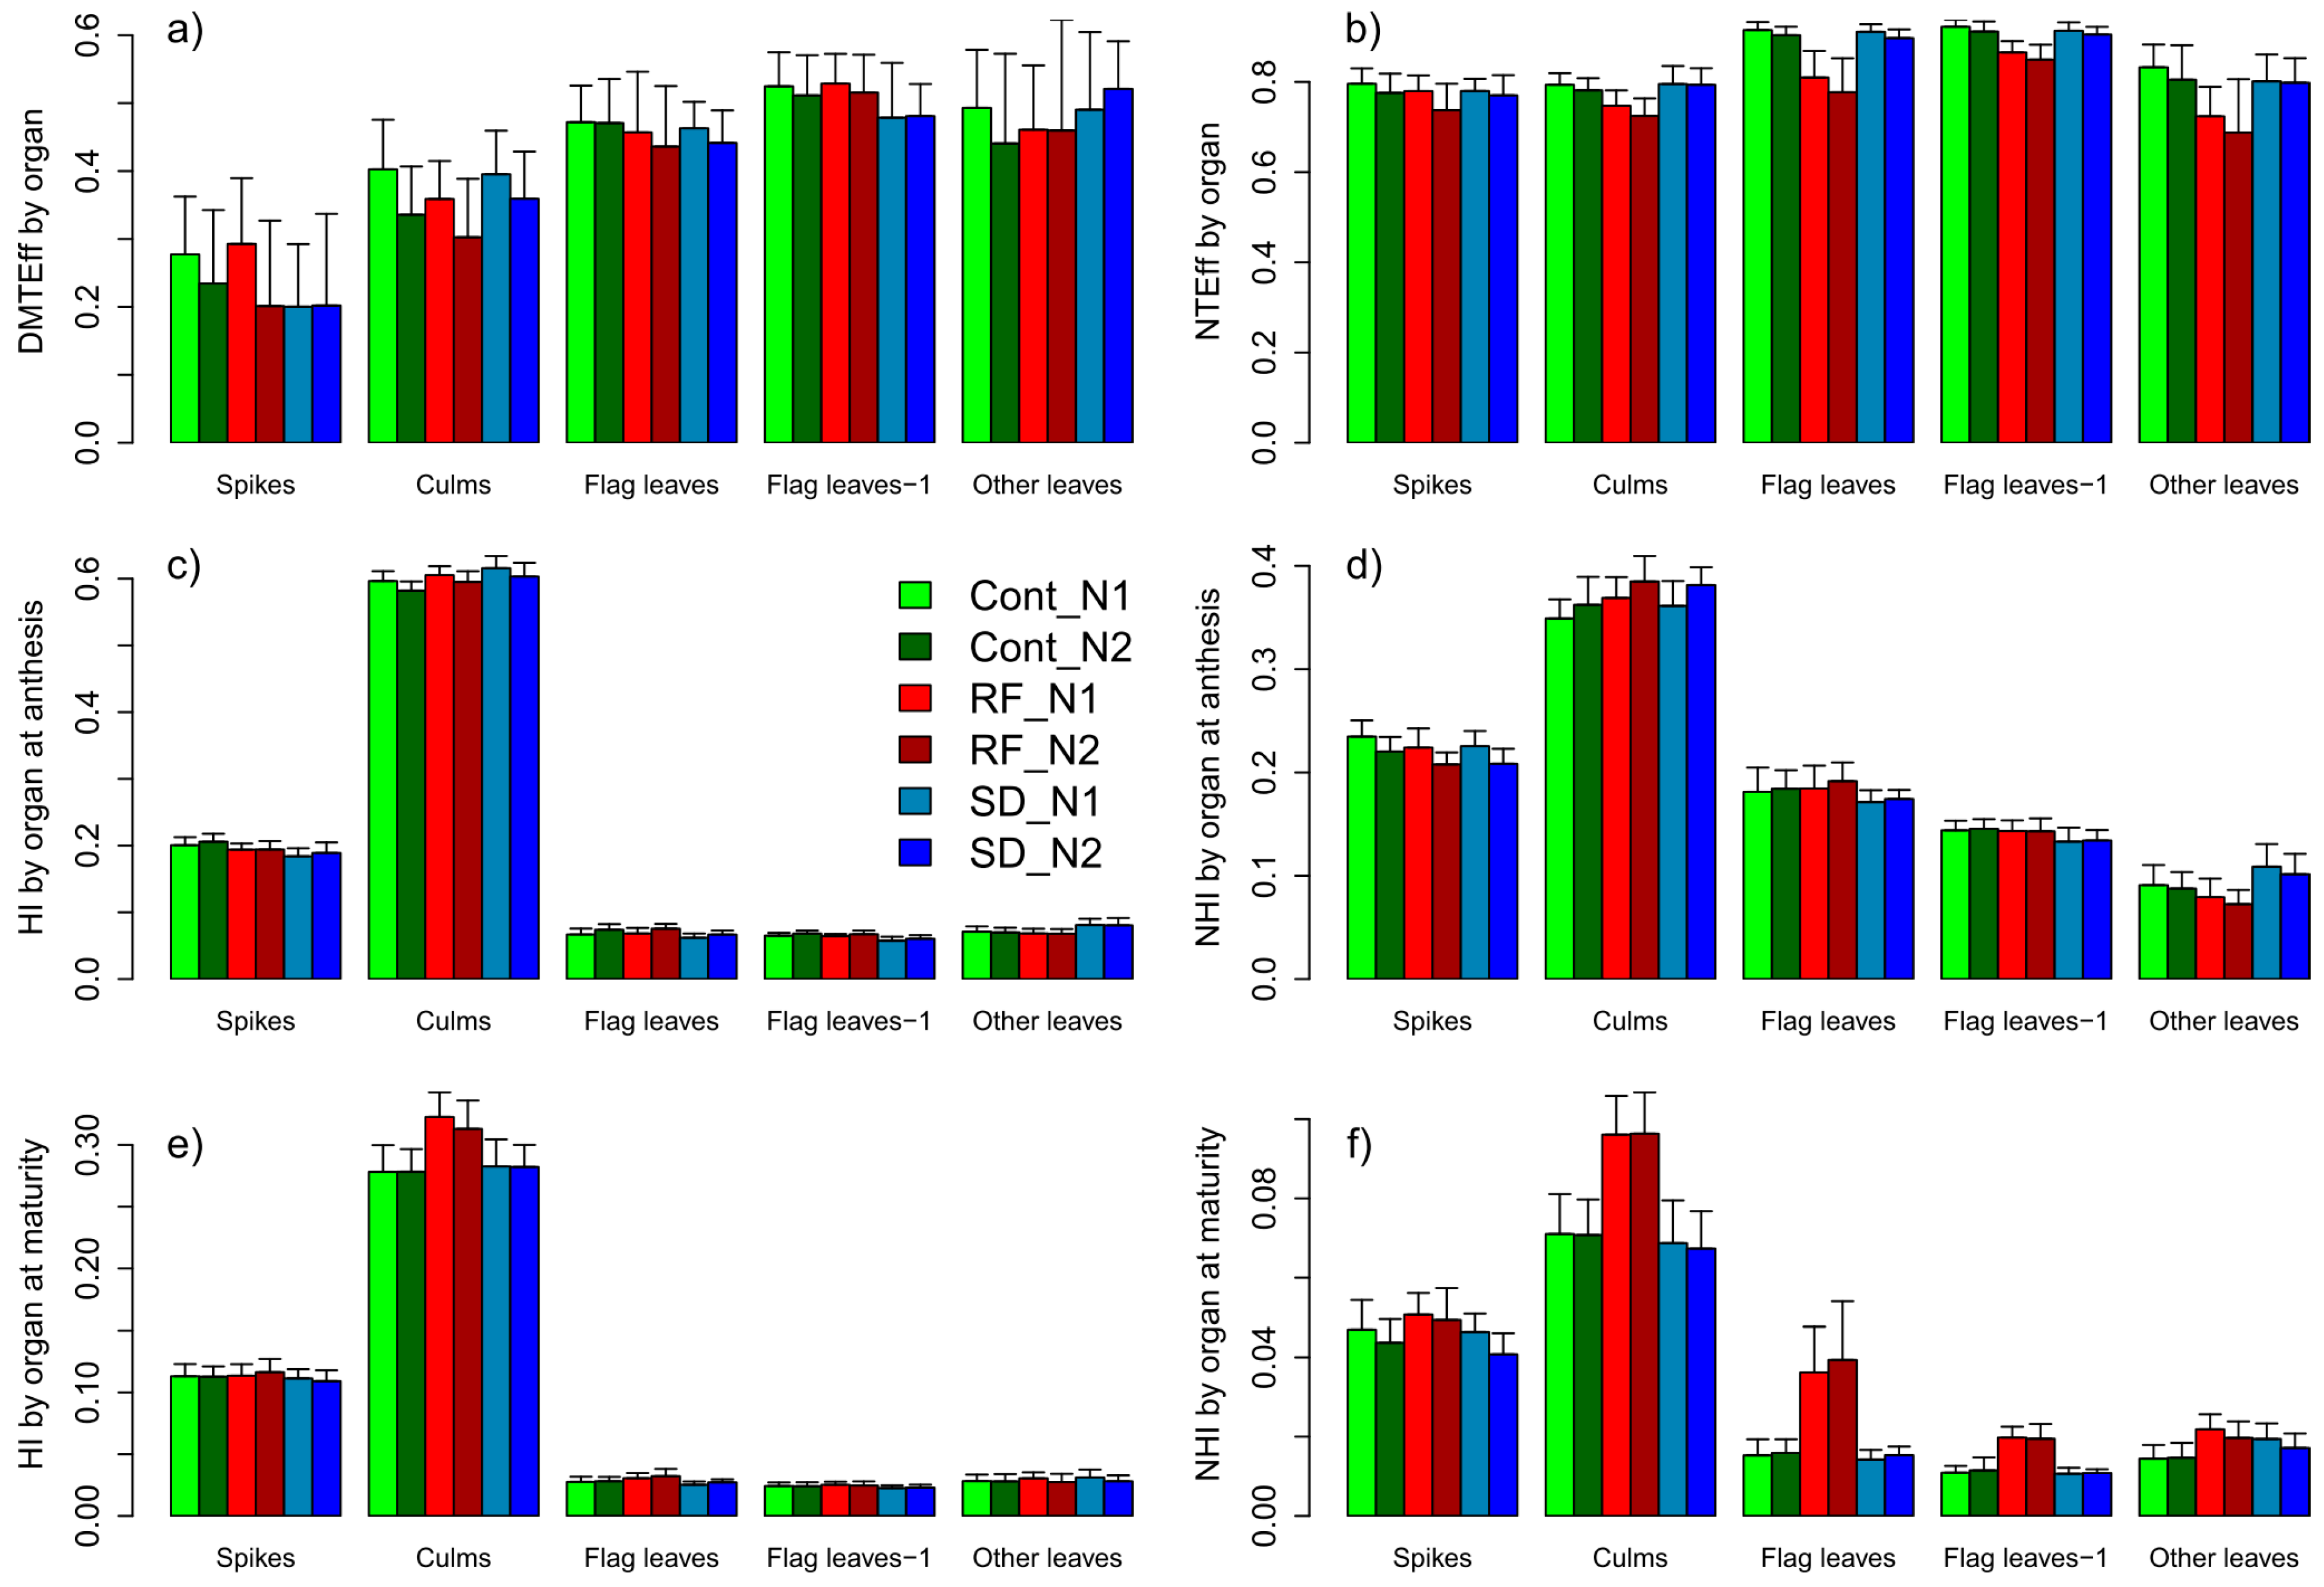
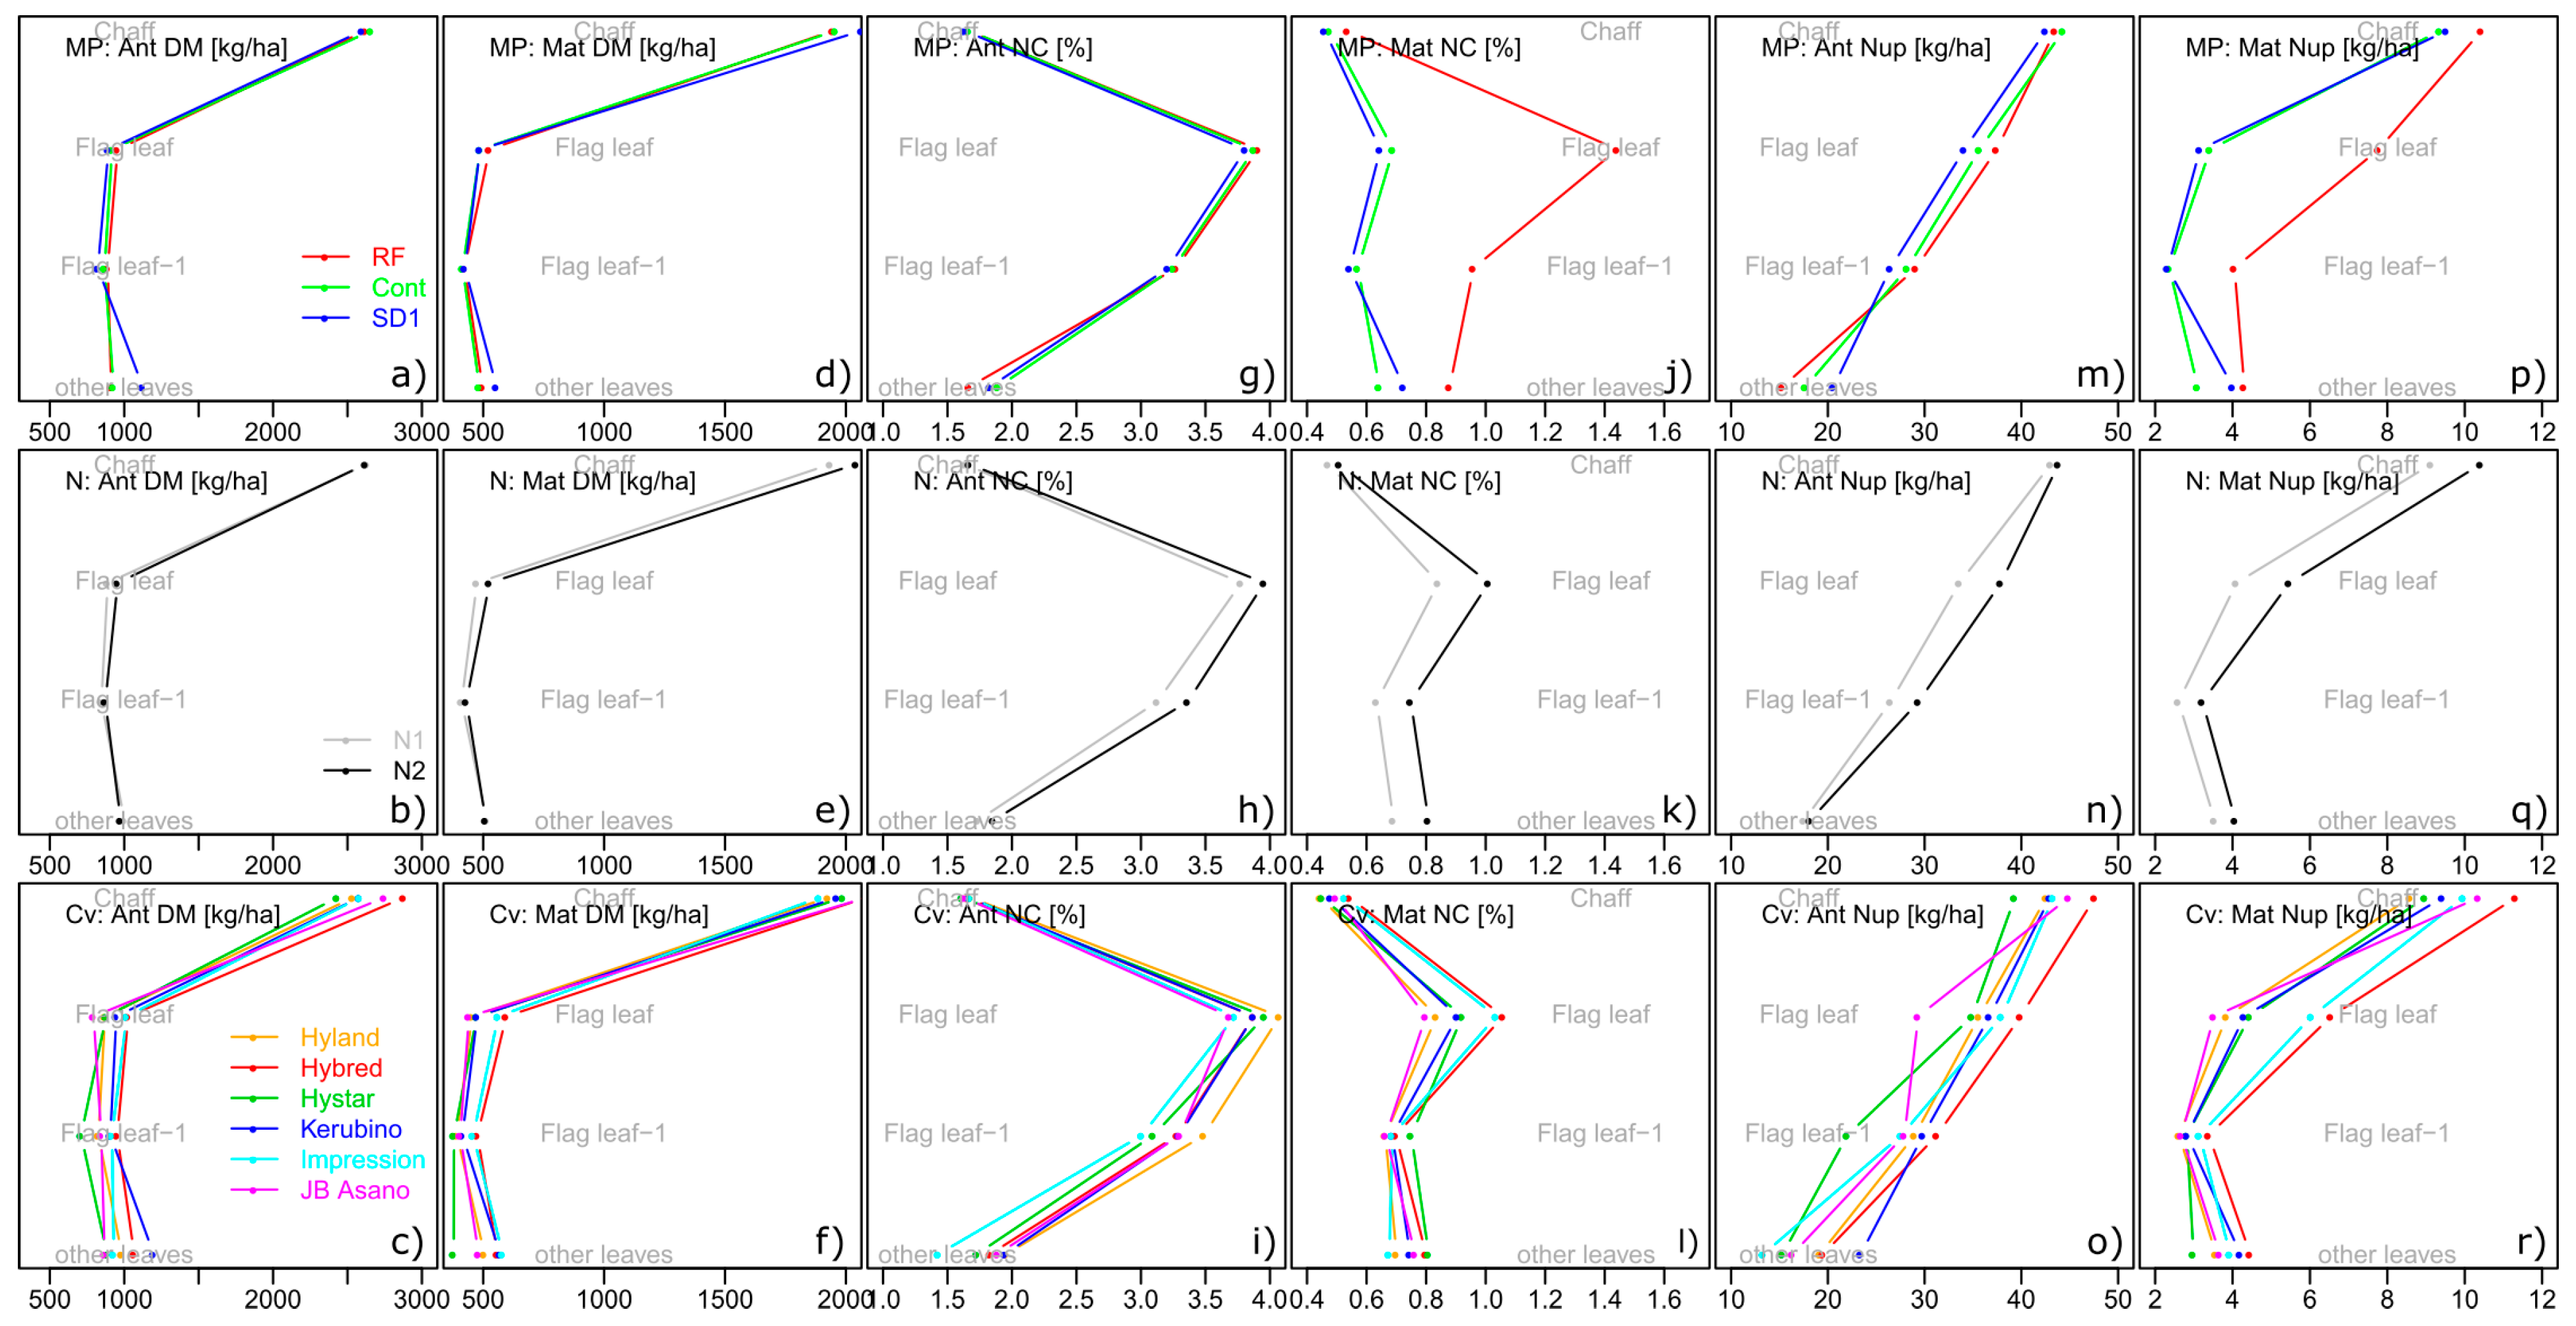
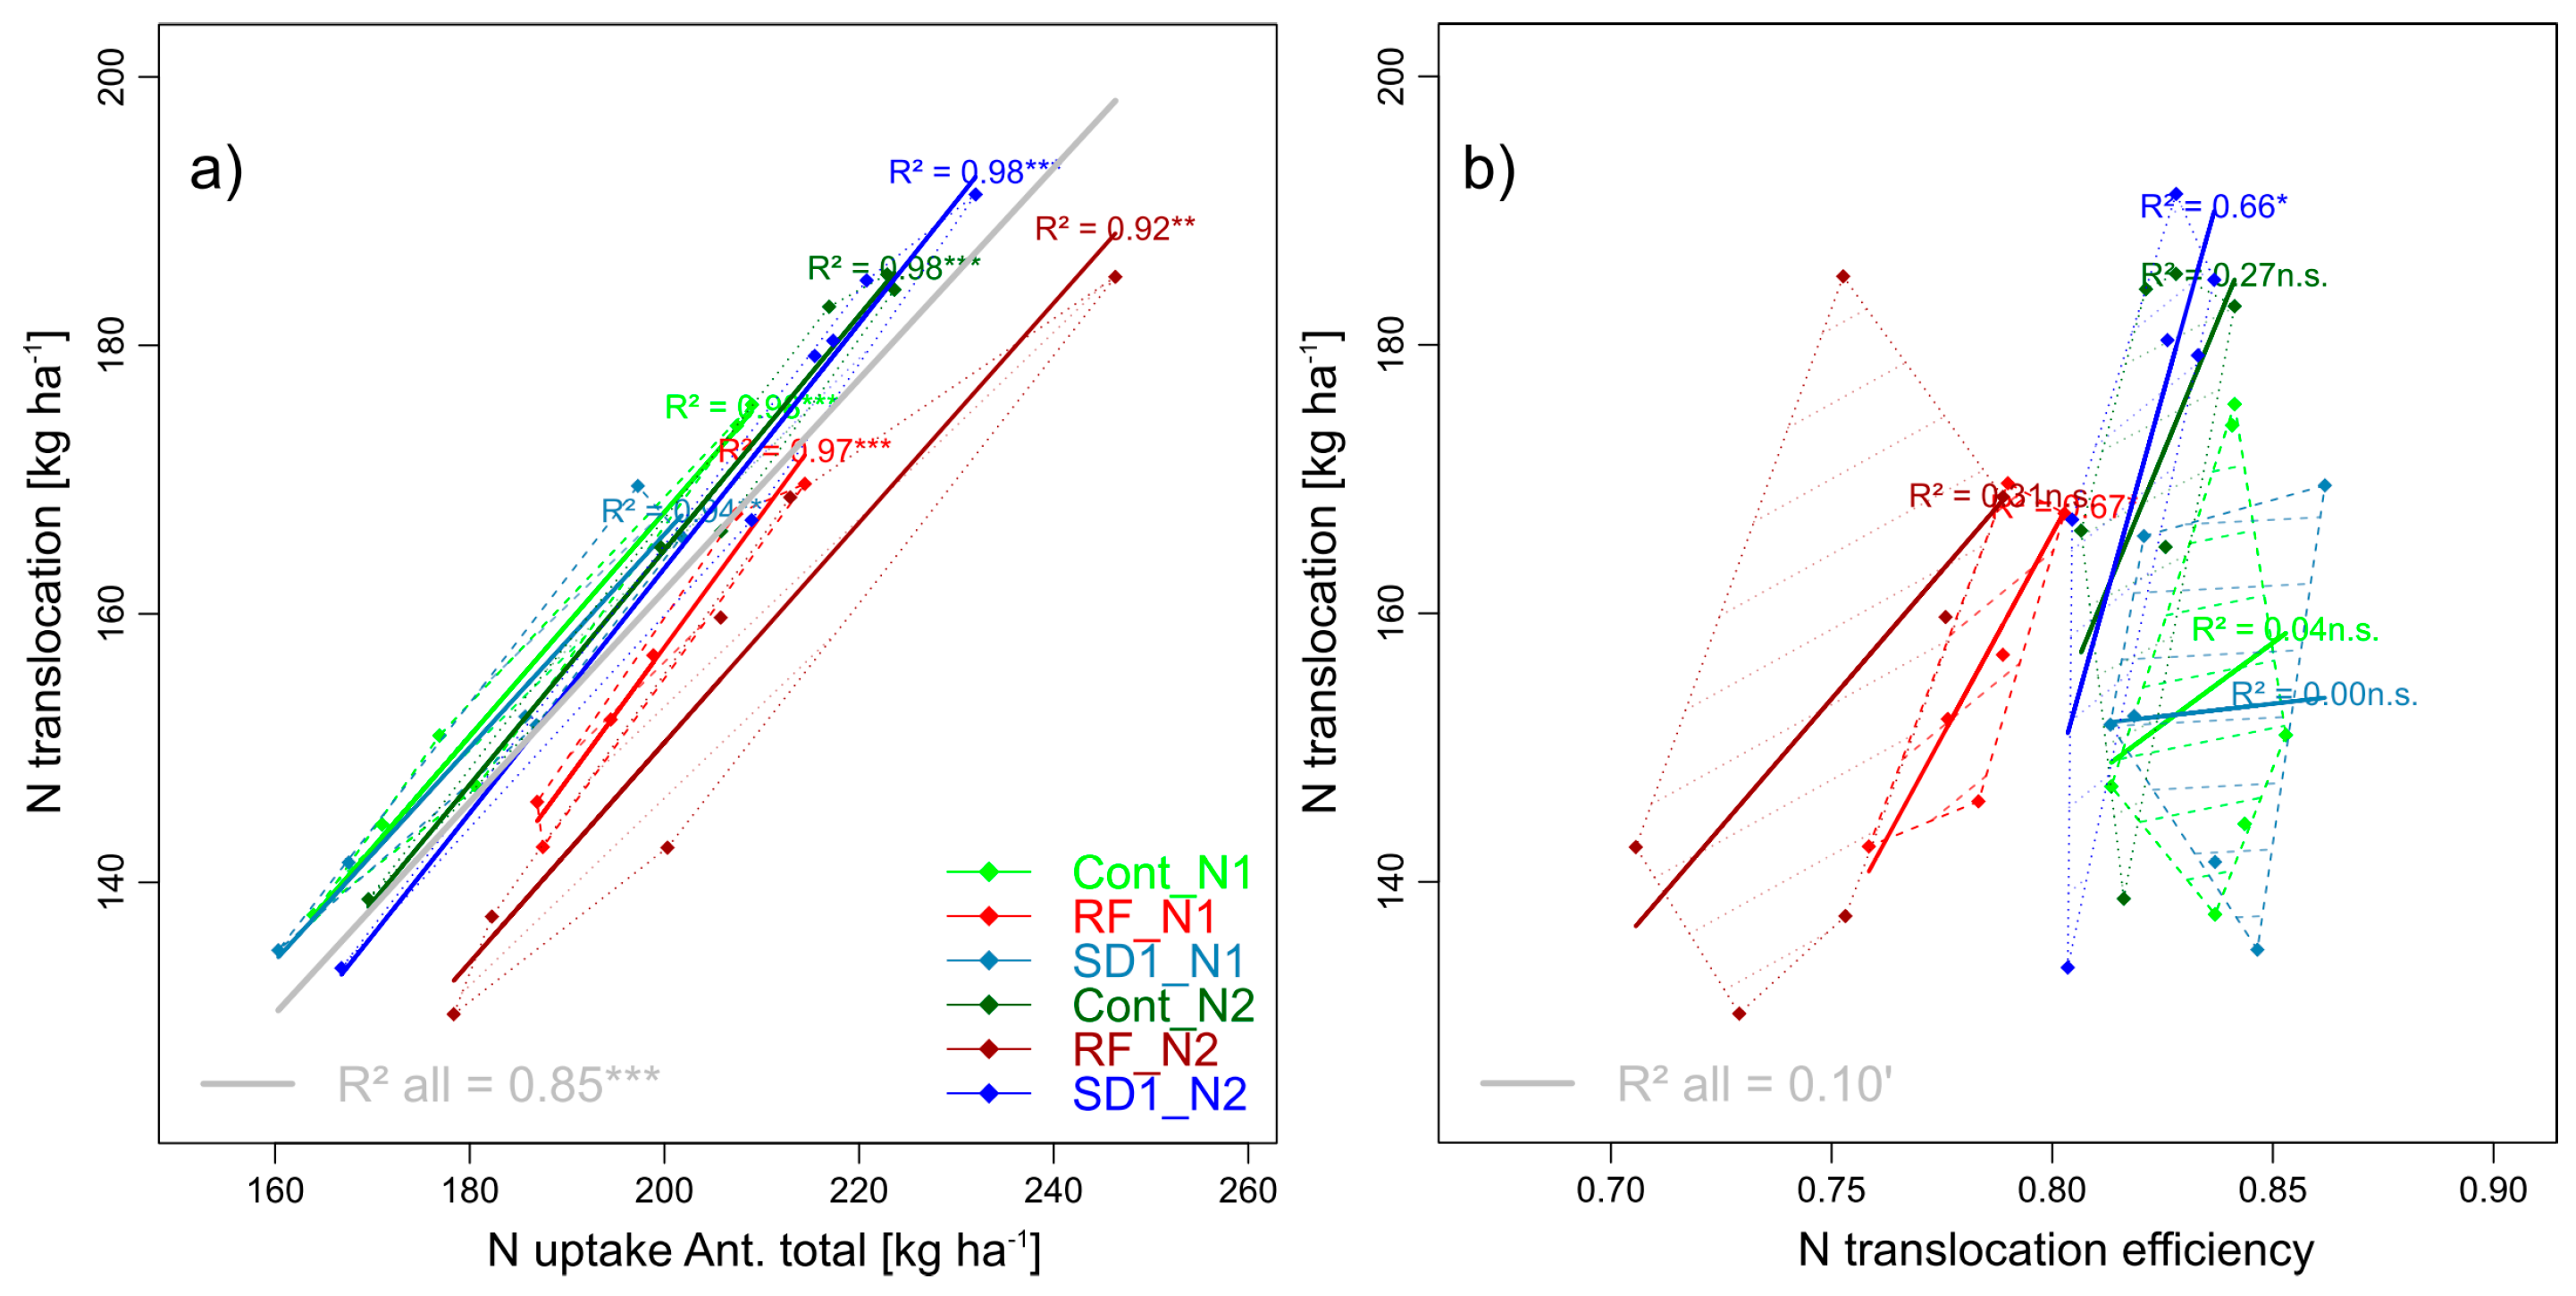
Table 1.
List of cultivars and ratings of the German official registration authority [49]: Yield components, baking quality class (E: Highest baking, A: High baking quality, and B: Bread wheat), heading, senescence and susceptibility (Suscep.) for main diseases, from 1 (low) to 9 (high).
Table 1.
List of cultivars and ratings of the German official registration authority [49]: Yield components, baking quality class (E: Highest baking, A: High baking quality, and B: Bread wheat), heading, senescence and susceptibility (Suscep.) for main diseases, from 1 (low) to 9 (high).
| Cultivar | Year of Release | Cultivar Group | Spikes/m2 | GNS | Kernel Weight | Quality Class | Heading | Senesc-ence | Suscep. Septoria | Suscep. Yellow Rust | Suscep. Fusariosis |
|---|---|---|---|---|---|---|---|---|---|---|---|
| Hybred | 2003 | hybrid | 4 | 8 | 5 | B | 5 | 6 | 6 | 4 | |
| Hyland | 2009 | hybrid | 4 | 9 | 4 | B | 4 | 5 | 3 | 2 | 4 |
| Hystar | 2007 | hybrid | 5 | 6 | 5 | B | - | 4 | - | - | - |
| Impression | 2005 | line | 7 | 4 | 5 | A | 5 | 6 | 5 | 3 | 3 |
| JB Asano | 2008 | line | 5 | 5 | 7 | A | 4 | 4 | 6 | 5 | 5 |
| Kerubino | 2004 | line | 7 | 4 | 5 | E | 4 | 5 | 4 | - | 4 |
Table 2.
List of plant traits considered in this study, grouped by trait groups. See Table 3 for equations of derived, calculated plant traits. Corresponding trait complexes are indicated as described in Equation (1).
Table 2.
List of plant traits considered in this study, grouped by trait groups. See Table 3 for equations of derived, calculated plant traits. Corresponding trait complexes are indicated as described in Equation (1).
| Trait Group | Plant Trait | Abbreviation | Description | Trait Complex |
|---|---|---|---|---|
| Dry matter traits [kg ha−1] | organ-specific dry matter (vegetative) | DM [organ-name] | at anthesis (Ant) and maturity (Mat) for flag leaf, flag leaf-1, ‘other leaves’, culms, and summed up for the three leaf layers, at anthesis for spikes and at maturity for chaff | |
| total dry matter | DMAnt, DMMat | sum of organ-specific DM-traits at anthesis and maturity | (d), (i) | |
| grain yield | GY (DM grain) | (a), (b), (c), (d) | ||
| N concentration traits [%] | organ-specific N concentration (vegetative) | NC [organ-name] | at anthesis and maturity for flag leaf, flag leaf-1, ‘other leaves’ and culms, at anthesis for spikes and at maturity for chaff | |
| grain N concentration | GNC | (a) | ||
| N uptake traits [kg ha−1] | organ-specific N uptake (vegetative) | Nup [organ-name] | at anthesis and maturity for flag leaf, flag leaf-1, ‘other leaves’, culms, and summed up for the three leaf layers at anthesis for spikes and at maturity for chaff | (j), (k) |
| total N uptake | NupAnt, NupMat | sum of organ-specific DM-traits at anthesis and maturity | (h), (k) | |
| N uptake straw | Nup straw | sum of organ-specific vegetative N uptake at maturity | ||
| grain N uptake | GNup | (a), (g), (h) | ||
| Derived DM traits | harvest index | HI | relative dry matter partitioning to the grain | (d) |
| organ-specific dry matter harvest index (vegetative) | HI [organ-name] | relative dry matter partitioning to vegetative organs at anthesis and maturity | ||
| post-anthesis assimilation | PAA | (c) | ||
| Table 2 (continued) | ||||
| Derived DM traits | total dry matter translocation efficiency | DMTEff | (i) | |
| organ-specific dry matter translocation efficiency | DMTEff [organ-name] | |||
| contribution of post-anthesis assimilates to grain-filling | CPAA | |||
| total dry matter translocation | DMT | (c) | ||
| organ-specific dry matter translocation | DMT [organ-name] | |||
| grain number per spike | GNS | (b) | ||
| thousand kernel weight | TKW | (b) | ||
| spike density | SD | (b) | ||
| N utilization efficiency for total dry matter at maturity | NutEff_total | |||
| N utilization efficiency for grain yield | NutEff_grain | |||
| N use efficiency for total dry matter at maturity | NUE_total_Mat | |||
| N use efficiency for grain yield | NUE_grain | |||
| kernels per m2 | - | |||
| yield per spike | - | |||
| Derived N traits | post-anthesis N uptake | PANup | (g) | |
| contribution of post-anthesis nitrogen to total nitrogen uptake | CPNup | |||
| total N translocation | NT | (g) | ||
| organ-specific N translocation (vegetative) | NT [organ-name] | |||
| N translocation efficiency | NTEff | (m) | ||
| organ-specific N translocation efficiency | NTEff [organ-name] | |||
| N harvest index | NHI | relative N partitioning to the grain | (h) | |
| organ-specific N harvest index (vegetative) | NHI [organ-name] | relative N partitioning to vegetative organs at anthesis and maturity | ||
| apparent N uptake efficiency at anthesis | NupEffAnt | |||
| apparent N uptake efficiency at maturity | NupEffMat | |||
| Other traits | plant height | - | ||
| anthesis date | - | |||
Table 3.
List of derived plant traits, which were calculated from ‘direct’ dry matter (DM) and N-uptake (Nup) traits. Dry matter translocation, N translocation, dry matter translocation efficiency, N translocation efficiency, harvest index, and N harvest index were calculated on the total aboveground plant level and on the organ-level.
| Equation | Plant Trait and Description |
|---|---|
| Dry matter translocation (DMT): Absolute amount of translocated pre-anthesis accumulated assimilates from vegetative plant organs into grains between anthesis and maturity, in kg ha−1 [54] | |
| DMT-efficiency (DMTEff): Relative amount of translocated pre-anthesis accumulated assimilates into grains [54]. | |
| Post-anthesis assimilation (PAA) | |
| Contribution of post-anthesis assimilates to grain-filling (CPAA) | |
| Harvest index (HI): Ratio of grain DM to total DM at maturity | |
| Absolute amount of translocated pre-anthesis accumulated nitrogen from vegetative plant organs into grains between anthesis and maturity in kg ha−1 (NT) [55] | |
| NT-efficiency (NTEff): Relative amount of translocated pre-anthesis accumulated nitrogen into grains [55] | |
| Post-anthesis nitrogen uptake (PANup) | |
| Contribution of post-anthesis nitrogen to total nitrogen uptake (CPNup) | |
| N-Harvest index (NHI): Ratio of grain nitrogen uptake (Nup) to total Nup at maturity | |
| Apparent nitrogen uptake efficiency, calculated for anthesis and maturity as ratio of total Nup to total N fertilized [56] | |
| Nitrogen utilization efficiency (NutEff): Efficiency of the internal conversion of N into grain and total DM [56]. | |
| (1) |
Table 4.
ANOVA results for significant (*: p < 0.05, **: p < 0.01, **: p < 0.001) effects of the main plot (MP), N level (N) and cultivar (Cv) as well as two-way interactions, SD1: Sowing date 1, Cont: Control, RF: Reduced fungicide. Models are reported for the whole trial and for the combined main plots Cont + RF and Con t + SD1 for assessing the effect of reduced fungicide and SD1 in comparison to Cont, respectively. The main effects are shaded in gray and interaction effects in blue. For anthesis date, no cultivar effects are reported due to missing data. ‘Other leaves’ denotes the leaves, excluding both uppermost leaf layers, ‘Ant.’ anthesis and ‘Mat.’ maturity. See Supplementary Table S1 for results of further indirect DM and N traits related to organ-specific DM and N allocation, DM and N translocation and translocation efficiencies.
| Whole Trial | Cont + RF | Cont + SD1 | Whole Trial | Cont + RF | Cont + SD1 | ||||||||||||||
|---|---|---|---|---|---|---|---|---|---|---|---|---|---|---|---|---|---|---|---|
| MP | N | Cv | MP | N | Cv | MP | N | Cv | MP x N | MP x Cv | N x Cv | MP x | MP x Cv | N x Cv | MP x N | MP x Cv | N x Cv | ||
| DM traits [kg ha−1] | Ant. spikes | *** | *** | *** | * | * | *** | * | |||||||||||
| Ant. culms | * | *** | * | *** | * | *** | * | ** | * | *** | * | ||||||||
| Ant. flag leaf | *** | *** | ** | *** | *** | *** | *** | *** | |||||||||||
| Ant. flag leaf-1 | *** | *** | * | *** | * | *** | |||||||||||||
| Ant. other leaves | *** | *** | * | *** | ** | *** | ** | ** | ** | *** | * | ||||||||
| Ant. leaves | *** | *** | * | *** | * | *** | |||||||||||||
| Mat. grain (GY) | *** | *** | *** | * | *** | *** | *** | *** | |||||||||||
| Mat. chaff | ** | ** | ** | * | ** | * | |||||||||||||
| Mat. culms | * | * | *** | *** | ** | *** | *** | * | |||||||||||
| Mat. flag leaf | *** | *** | ** | *** | *** | *** | ** | ||||||||||||
| Mat. flag leaf-1 | * | *** | *** | * | *** | * | |||||||||||||
| Mat. other leaves | * | *** | *** | * | *** | * | |||||||||||||
| Mat. leaves | * | *** | *** | ** | *** | * | |||||||||||||
| Ant. total | *** | *** | *** | * | * | * | *** | * | |||||||||||
| Mat. total | * | *** | * | *** | *** | ** | |||||||||||||
| NC traits [%] | Ant. spikes | * | *** | *** | *** | *** | * | *** | ** | *** | *** | *** | *** | *** | |||||
| Ant. culms | *** | *** | *** | *** | *** | ** | * | ||||||||||||
| Ant. flag leaf | *** | *** | *** | *** | *** | *** | * | *** | * | ** | ** | ||||||||
| Ant. flag leaf-1 | *** | *** | *** | *** | *** | *** | *** | *** | * | ** | |||||||||
| Ant. other leaves | ** | *** | *** | ** | ** | *** | *** | *** | * | * | |||||||||
| Mat. grain (GNC) | ** | *** | *** | * | *** | *** | *** | *** | * | * | |||||||||
| Mat. chaff | *** | *** | *** | *** | *** | *** | *** | *** | |||||||||||
| Mat. culms | *** | *** | ** | *** | *** | ** | *** | *** | * | * | * | ||||||||
| Mat. flag leaf | *** | *** | *** | *** | *** | *** | *** | *** | ** | *** | ** | *** | * | ||||||
| Mat. flag leaf-1 | *** | *** | *** | *** | *** | * | * | ||||||||||||
| Mat. other leaves | *** | *** | *** | *** | *** | *** | *** | *** | *** | ** | *** | ||||||||
| Nup traits [kg ha−1] | Ant. spikes | *** | ** | ** | *** | ** | * | * | *** | ||||||||||
| Ant. culms | *** | * | *** | *** | *** | ** | |||||||||||||
| Ant. flag leaf | *** | *** | *** | *** | *** | *** | ** | *** | |||||||||||
| Ant. flag leaf-1 | * | *** | *** | *** | *** | *** | *** | * | * | *** | |||||||||
| Ant. other leaves | *** | *** | ** | *** | * | ** | *** | ** | * | *** | * | * | *** | * | |||||
| Ant. leaves | *** | *** | ** | *** | *** | *** | * | *** | |||||||||||
| Mat. grain (GNup) | * | *** | *** | *** | ** | * | |||||||||||||
| Mat. chaff | *** | *** | * | *** | *** | *** | *** | ** | |||||||||||
| Mat. culms | *** | *** | *** | *** | *** | ** | *** | *** | |||||||||||
| Mat. flag leaf | *** | *** | *** | *** | *** | *** | *** | *** | ** | *** | ** | *** | * | ||||||
| Mat. flag leaf-1 | *** | *** | *** | *** | *** | *** | *** | * | |||||||||||
| Mat. other leaves | *** | *** | *** | *** | ** | *** | ** | *** | *** | * | |||||||||
| Table 4 (continued) | |||||||||||||||||||
| Nup traits [kg ha−1] | Mat. leaves | *** | *** | *** | *** | *** | *** | *** | *** | *** | ** | ||||||||
| Ant. total | *** | *** | ** | ** | *** | *** | * | *** | |||||||||||
| Mat. total | *** | ** | *** | *** | * | * | |||||||||||||
| Mat. straw | *** | *** | *** | *** | *** | *** | *** | *** | |||||||||||
| Derived DM traits | HI | *** | *** | *** | *** | *** | * | ** | |||||||||||
| PAA | *** | *** | *** | *** | *** | *** | ** | * | *** | ||||||||||
| DMTEff | *** | * | *** | ** | ** | ** | |||||||||||||
| CPAA | *** | *** | *** | *** | *** | *** | * | * | *** | ||||||||||
| DMT | ** | *** | ** | *** | * | ** | * | *** | |||||||||||
| GNS | *** | * | *** | ** | * | *** | *** | *** | *** | *** | |||||||||
| TKW | *** | *** | *** | *** | *** | * | |||||||||||||
| spike density | * | *** | * | *** | * | *** | * | ||||||||||||
| NutEff_total | * | *** | ** | *** | *** | * | * | * | |||||||||||
| NutEff_grain | *** | *** | *** | *** | *** | *** | *** | *** | * | ||||||||||
| NUE_total | * | *** | *** | *** | ** | ||||||||||||||
| kernels per m2 | *** | *** | *** | *** | *** | *** | ** | * | |||||||||||
| yield per spike | *** | * | *** | *** | *** | ** | *** | *** | *** | ||||||||||
| NUE_grain | *** | *** | *** | * | *** | *** | *** | *** | ** | * | |||||||||
| derived N traits | PANup | *** | * | *** | *** | *** | * | ** | * | * | *** | ||||||||
| CPNup | *** | ** | *** | *** | *** | ** | ** | * | * | *** | |||||||||
| NT | ** | ** | ** | *** | *** | * | * | * | *** | ||||||||||
| NTEff | *** | *** | *** | *** | *** | *** | ** | * | * | ||||||||||
| NHI | *** | *** | *** | *** | *** | ||||||||||||||
| NupEff Ant. | *** | *** | *** | ** | *** | *** | *** | ||||||||||||
| NupEff Mat. | *** | * | *** | *** | * | ||||||||||||||
| other traits | plant height | *** | *** | ** | *** | *** | *** | *** | * | * | |||||||||
| anthesis date | *** | *** | - | *** | - | *** | *** | - | *** | - | - | - | - | *** | - | - | |||
Table 5.
Estimated marginal mean values and grouping letters of Tukey’s post-hoc-test by treatment factors for selected traits. See Equation (1) for the relationship of traits within trait complexes. Cells colored from red (strong negative reaction) to green (strong positive reaction) indicate the relative response in the trait value between Cont and RF and between Cont and SD1 as the main plot effects and between N1 and N2 within the main plots. PANup was not included for coloring due to extreme relative responses, however on low levels only. For the anthesis date, independent data was lacking for statistics within the main plots.
| Treatment | DM Mat. Grain (GY) | DM Ant. total | DM Mat. total | HI | PAA | DMTEff | DMT | GNS | TKW | Spike Density | NutEff Total | NutEff Grain | NUE Mat. Total | NUE Mat. Grain | NC Mat. Grain (GNC) | Nup Ant. Spikes | Nup Ant. Culms | Nup Ant. Flag Leaf | Nup Ant. Flag Leaf-1 | Nup Ant. Other Leaves | Nup Mat. Grain (GNup) | Nup Mat. Chaff | Nup Mat. Culms | Nup Mat. Flag Leaf | Nup Mat. Flag Leaf-1 | Nup Mat. Other Leaves | Nup Ant. Total | Nup Mat. Total | PANup | NT | NTEff | NHI | NupEff Mat. | Plant Height | Anthesis (Days in June) |
|---|---|---|---|---|---|---|---|---|---|---|---|---|---|---|---|---|---|---|---|---|---|---|---|---|---|---|---|---|---|---|---|---|---|---|---|
| Cont | 9189b | 13091a | 17340ab | 0.53b | 4267ab | 0.37a | 4930a | 36.4a | 38.6b | 663ab | 83.94ab | 44.49b | 214a | 114b | 1.9a | 44a | 70a | 36a | 28ab | 18b | 176ab | 9a | 15a | 3a | 2a | 3a | 196a | 209a | 13a | 163a | 0.83b | 0.84b | 2.52a | 0.65a | 9.5b |
| RF | 8107a | 13477a | 16884a | 0.48a | 3407a | 0.34a | 4717a | 35.1a | 33.6a | 697b | 82.09a | 39.43a | 211a | 101a | 2b | 43a | 76a | 37a | 29b | 15a | 161a | 10a | 20b | 8b | 4b | 4b | 201a | 207a | 6a | 155a | 0.77a | 0.78a | 2.52a | 0.69b | 9.5b |
| SD1 | 9895b | 13956a | 18706b | 0.53b | 4712b | 0.37a | 5154a | 40.2b | 40b | 629a | 86.56b | 45.87b | 231b | 122c | 1.9a | 43a | 73a | 34a | 26a | 21c | 185b | 10a | 15a | 3a | 2a | 4b | 197a | 219a | 21a | 163a | 0.83b | 0.85b | 2.63a | 0.67ab | 6.7a |
| Cont->RF | −12% | 3% | −3% | −9% | −20% | −8% | −4% | −4% | −13% | 5% | −2% | −11% | −2% | −11% | 4% | −2% | 9% | 5% | 3% | −14% | −9% | 11% | 35% | 127% | 71% | 39% | 3% | −1% | −5% | −8% | −8% | 0% | 6% | ||
| Cont->SD1 | 8% | 7% | 8% | 0% | 10% | −2% | 5% | 10% | 4% | −5% | 3% | 3% | 8% | 8% | −2% | −4% | 5% | −4% | −6% | 16% | 5% | 2% | 1% | −8% | −2% | 29% | 1% | 5% | 0% | 0% | 0% | 5% | 3% | ||
| N1 | 8787a | 13658a | 17178a | 0.51a | 3527a | 0.38b | 5264b | 36.8a | 37.3a | 653a | 90.33b | 46.27b | 286b | 146b | 1.8a | 43a | 68a | 34a | 27a | 18a | 156a | 9a | 15a | 4a | 3a | 4a | 189a | 191a | 2a | 154a | 0.82b | 0.82a | 3.18b | 0.65a | 8.3a |
| N2 | 9340b | 13358a | 18108b | 0.52a | 4730b | 0.34a | 4603a | 37.7a | 37.6a | 673a | 78.06a | 40.25a | 151a | 78a | 2.1b | 44a | 78b | 38b | 29b | 18a | 191b | 10b | 18b | 5b | 3b | 4b | 207b | 232b | 25b | 166b | 0.8a | 0.82a | 1.94a | 0.69b | 8.9b |
| cv. Hyland | 9461c | 13546b | 17982a | 0.53cd | 4450b | 0.37ab | 5024abc | 42.2c | 35.1a | 645b | 85.74b | 45.18b | 222a | 117c | 1.9ab | 43ab | 74ab | 36bc | 29bc | 19c | 176a | 9a | 17ab | 4a | 3a | 4ab | 201ab | 212ab | 11ab | 165b | 0.82c | 0.83c | 2.55ab | 0.68bc | 8.7c |
| cv. Hybred | 9217bc | 14281b | 18125a | 0.51ab | 3827ab | 0.37ab | 5379bc | 40.7c | 35.9ab | 639b | 83.58ab | 42.46a | 224a | 114bc | 1.9bc | 48c | 72ab | 40c | 31c | 20c | 176a | 11d | 17ab | 7b | 3b | 4c | 210b | 219b | 9ab | 167b | 0.8ab | 0.81a | 2.64b | 0.66b | 10.5f |
| cv. Hystar | 9228bc | 11989a | 17049a | 0.54d | 4987b | 0.35ab | 4182a | 37b | 37.4bc | 678bc | 86.25b | 46.7b | 212a | 114bc | 1.8a | 39a | 65a | 35b | 22a | 15ab | 165a | 9ab | 15a | 4a | 3ab | 3a | 177a | 199a | 22b | 142a | 0.81abc | 0.83bc | 2.41a | 0.6a | 4.3a |
| cv. Kerubino | 8634a | 14380b | 17362a | 0.5a | 2984a | 0.39b | 5652c | 32.1a | 37.9c | 715c | 82.2a | 40.85a | 216a | 107a | 2d | 43ab | 76b | 37bc | 30bc | 23d | 174a | 9abc | 18b | 4a | 3a | 4bc | 209b | 212ab | 3a | 170b | 0.81bc | 0.82ab | 2.59ab | 0.69bcd | 8.5b |
| cv. Impression | 8939ab | 13572b | 17994a | 0.5a | 4457b | 0.33a | 4517ab | 31.8a | 38.7cd | 728c | 84.34ab | 41.8a | 223a | 111ab | 1.9cd | 43abc | 78b | 38bc | 28b | 13a | 175a | 10bc | 18b | 6b | 3ab | 4bc | 200ab | 216b | 16ab | 159ab | 0.79a | 0.81a | 2.61ab | 0.69cd | 10.3e |
| cv. JB Asano | 8902ab | 13279ab | 17350a | 0.51bc | 4066ab | 0.36ab | 4848abc | 39.7bc | 39.7d | 571a | 83.06ab | 42.58a | 215a | 110ab | 2cd | 45bc | 72ab | 29a | 28b | 16b | 176a | 10cd | 15a | 4a | 3a | 4abc | 191ab | 211ab | 20ab | 156ab | 0.82bc | 0.83c | 2.54ab | 0.71d | 9d |
| Cont N1 | 8872a | 13198a | 16760a | 0.53a | 3585a | 0.4b | 5304b | 36.2a | 38.5a | 645a | 89.64b | 47.47b | 280b | 148b | 1.8a | 43a | 64a | 33a | 27a | 17a | 158a | 9a | 13a | 3a | 2a | 3a | 185a | 188a | 3a | 155a | 0.84b | 0.84a | 3.13b | 0.64a | - |
| Cont N2 | 9505b | 12984a | 17921b | 0.53a | 4948b | 0.35a | 4557a | 36.7a | 38.7a | 680a | 78.24a | 41.5a | 149a | 79a | 2b | 45a | 75b | 38b | 30b | 18a | 194b | 10b | 16b | 4b | 3b | 3b | 206b | 230b | 23b | 170b | 0.82a | 0.84a | 1.91a | 0.67b | - |
| RF N1 | 7949a | 13942b | 16683a | 0.48a | 2739a | 0.37b | 5219b | 34a | 34a | 696a | 87.63b | 41.79b | 278b | 133b | 1.9a | 44a | 73a | 36a | 28a | 16a | 148a | 10a | 18a | 7a | 4a | 4a | 198a | 191a | -7a | 156a | 0.78b | 0.78a | 3.18b | 0.68a | - |
| RF N2 | 8264b | 13011a | 17086a | 0.48a | 4074b | 0.31a | 4215a | 36.1b | 33.3a | 698a | 76.55a | 37.07a | 143a | 69a | 2.1b | 43a | 78a | 39a | 30a | 15a | 173b | 11b | 22b | 9b | 4b | 4a | 204a | 224b | 20b | 154a | 0.75a | 0.78a | 1.87a | 0.7a | - |
| SD1 N1 | 9539a | 13833a | 18093a | 0.53a | 4256a | 0.38a | 5270a | 40.1a | 39.4a | 617a | 93.72b | 49.57b | 301b | 159b | 1.7a | 41a | 66a | 32a | 24a | 20a | 163a | 9a | 13a | 3a | 2a | 4a | 183a | 194a | 10a | 153a | 0.83a | 0.84a | 3.23b | 0.64a | - |
| SD1 N2 | 10250b | 14079a | 19319b | 0.53a | 5168b | 0.35a | 5037a | 40.3a | 40.6b | 641a | 79.39a | 42.18a | 162a | 86a | 2b | 44a | 80b | 37b | 29b | 22b | 206b | 10b | 17b | 4b | 3b | 4b | 210b | 244b | 32b | 173b | 0.82a | 0.85a | 2.04a | 0.69b | - |
| Cont: N1->N2 | 7% | −2% | 7% | 0% | 38% | −13% | −14% | 2% | 0% | 5% | −13% | −13% | −47% | −47% | 14% | 5% | 16% | 15% | 12% | 7% | 23% | 13% | 22% | 24% | 29% | 22% | 12% | 22% | 10% | −2% | 0% | −39% | 5% | ||
| RF: N1->N2 | 4% | −7% | 2% | 2% | 49% | −15% | −19% | 6% | −2% | 0% | −13% | −11% | −48% | −48% | 13% | −4% | 7% | 8% | 4% | −8% | 17% | 16% | 17% | 34% | 19% | 8% | 3% | 17% | −1% | −4% | 0% | −41% | 3% | ||
| SD1: N1->N2 | 7% | 2% | 7% | 1% | 21% | −7% | −4% | 0% | 3% | 4% | −15% | −15% | −46% | −46% | 18% | 6% | 20% | 17% | 17% | 10% | 26% | 12% | 25% | 41% | 28% | 18% | 15% | 26% | 13% | −1% | 1% | −37% | 8% |
© 2019 by the authors. Licensee MDPI, Basel, Switzerland. This article is an open access article distributed under the terms and conditions of the Creative Commons Attribution (CC BY) license (http://creativecommons.org/licenses/by/4.0/).
Share and Cite
MDPI and ACS Style
Prey, L.; Germer, M.; Schmidhalter, U. Temporal and Organ-specific Responses in NUE Traits to N Fertilization, Fungicide Intensity and Early Sowing in Winter Wheat Cultivars. Agronomy 2019, 9, 313. https://doi.org/10.3390/agronomy9060313
AMA Style
Prey L, Germer M, Schmidhalter U. Temporal and Organ-specific Responses in NUE Traits to N Fertilization, Fungicide Intensity and Early Sowing in Winter Wheat Cultivars. Agronomy. 2019; 9(6):313. https://doi.org/10.3390/agronomy9060313
Chicago/Turabian StylePrey, Lukas, Moritz Germer, and Urs Schmidhalter. 2019. "Temporal and Organ-specific Responses in NUE Traits to N Fertilization, Fungicide Intensity and Early Sowing in Winter Wheat Cultivars" Agronomy 9, no. 6: 313. https://doi.org/10.3390/agronomy9060313
Note that from the first issue of 2016, this journal uses article numbers instead of page numbers. See further details here.