
Heat Stress Recovery of Chlorophyll Fluorescence in Tomato (Lycopersicon esculentum Mill.) Leaves through Nitrogen Levels
 ,
,  , and
, and
Abstract
:1. Introduction
2. Materials and Methods
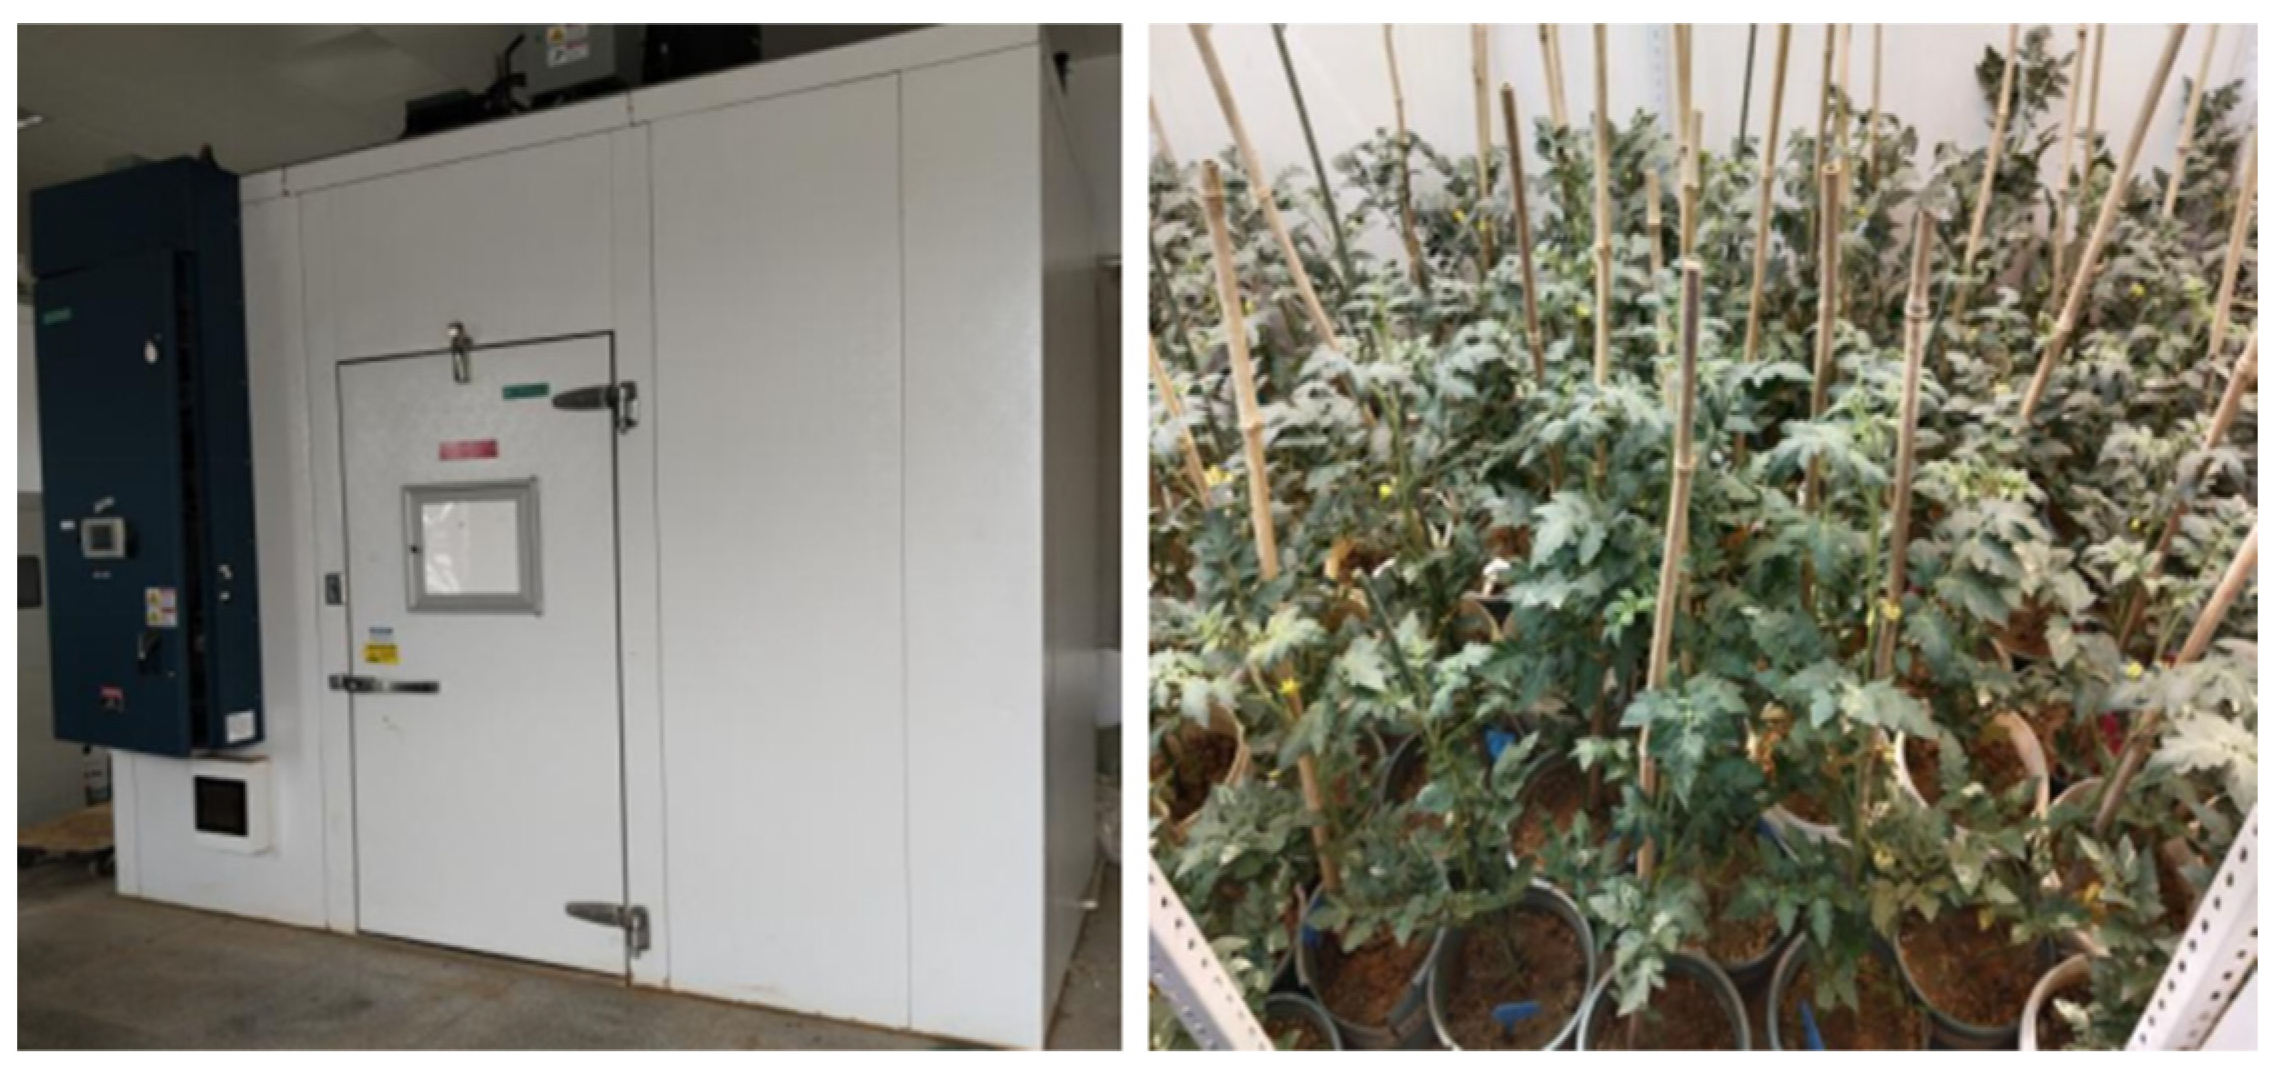
2.1. Plant Materials and Experimental Conditions
2.2. Evaluation of Chlorophll Fluorescence
2.3. Specific Energy Fluxes (per RC: PSII Reaction Center)
2.4. Heatmap
2.5. Statistical Analysis
3. Results
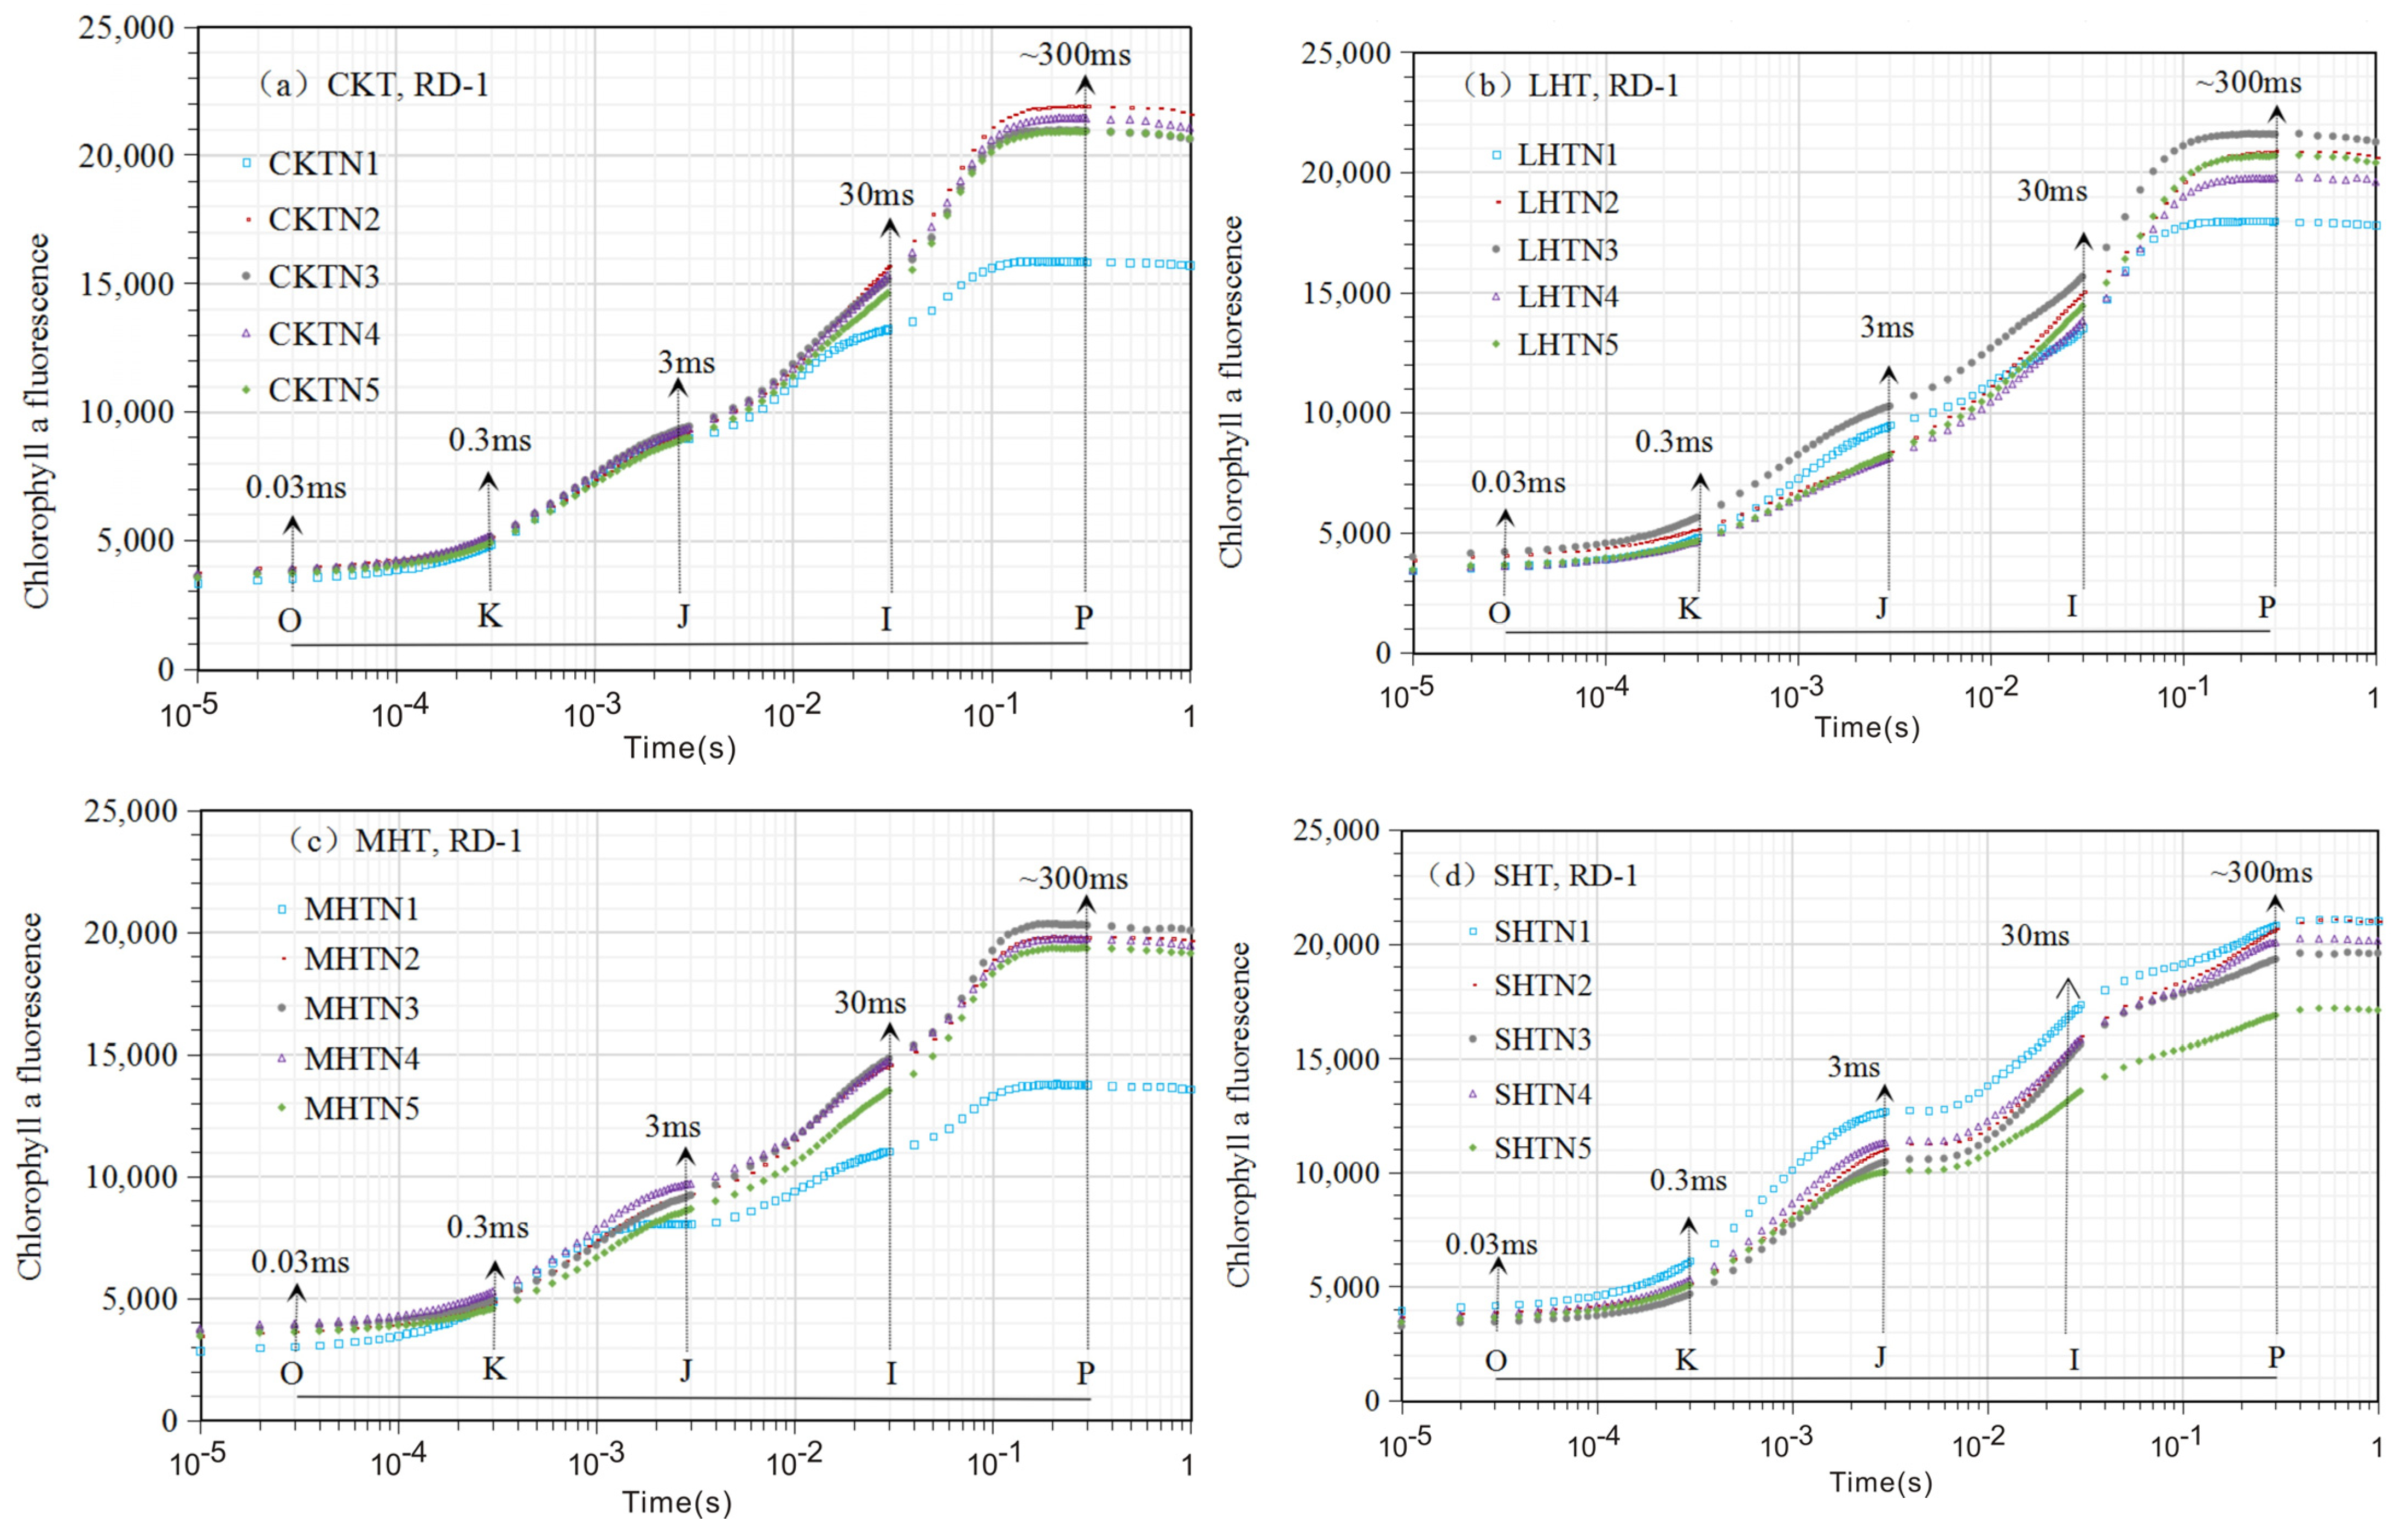
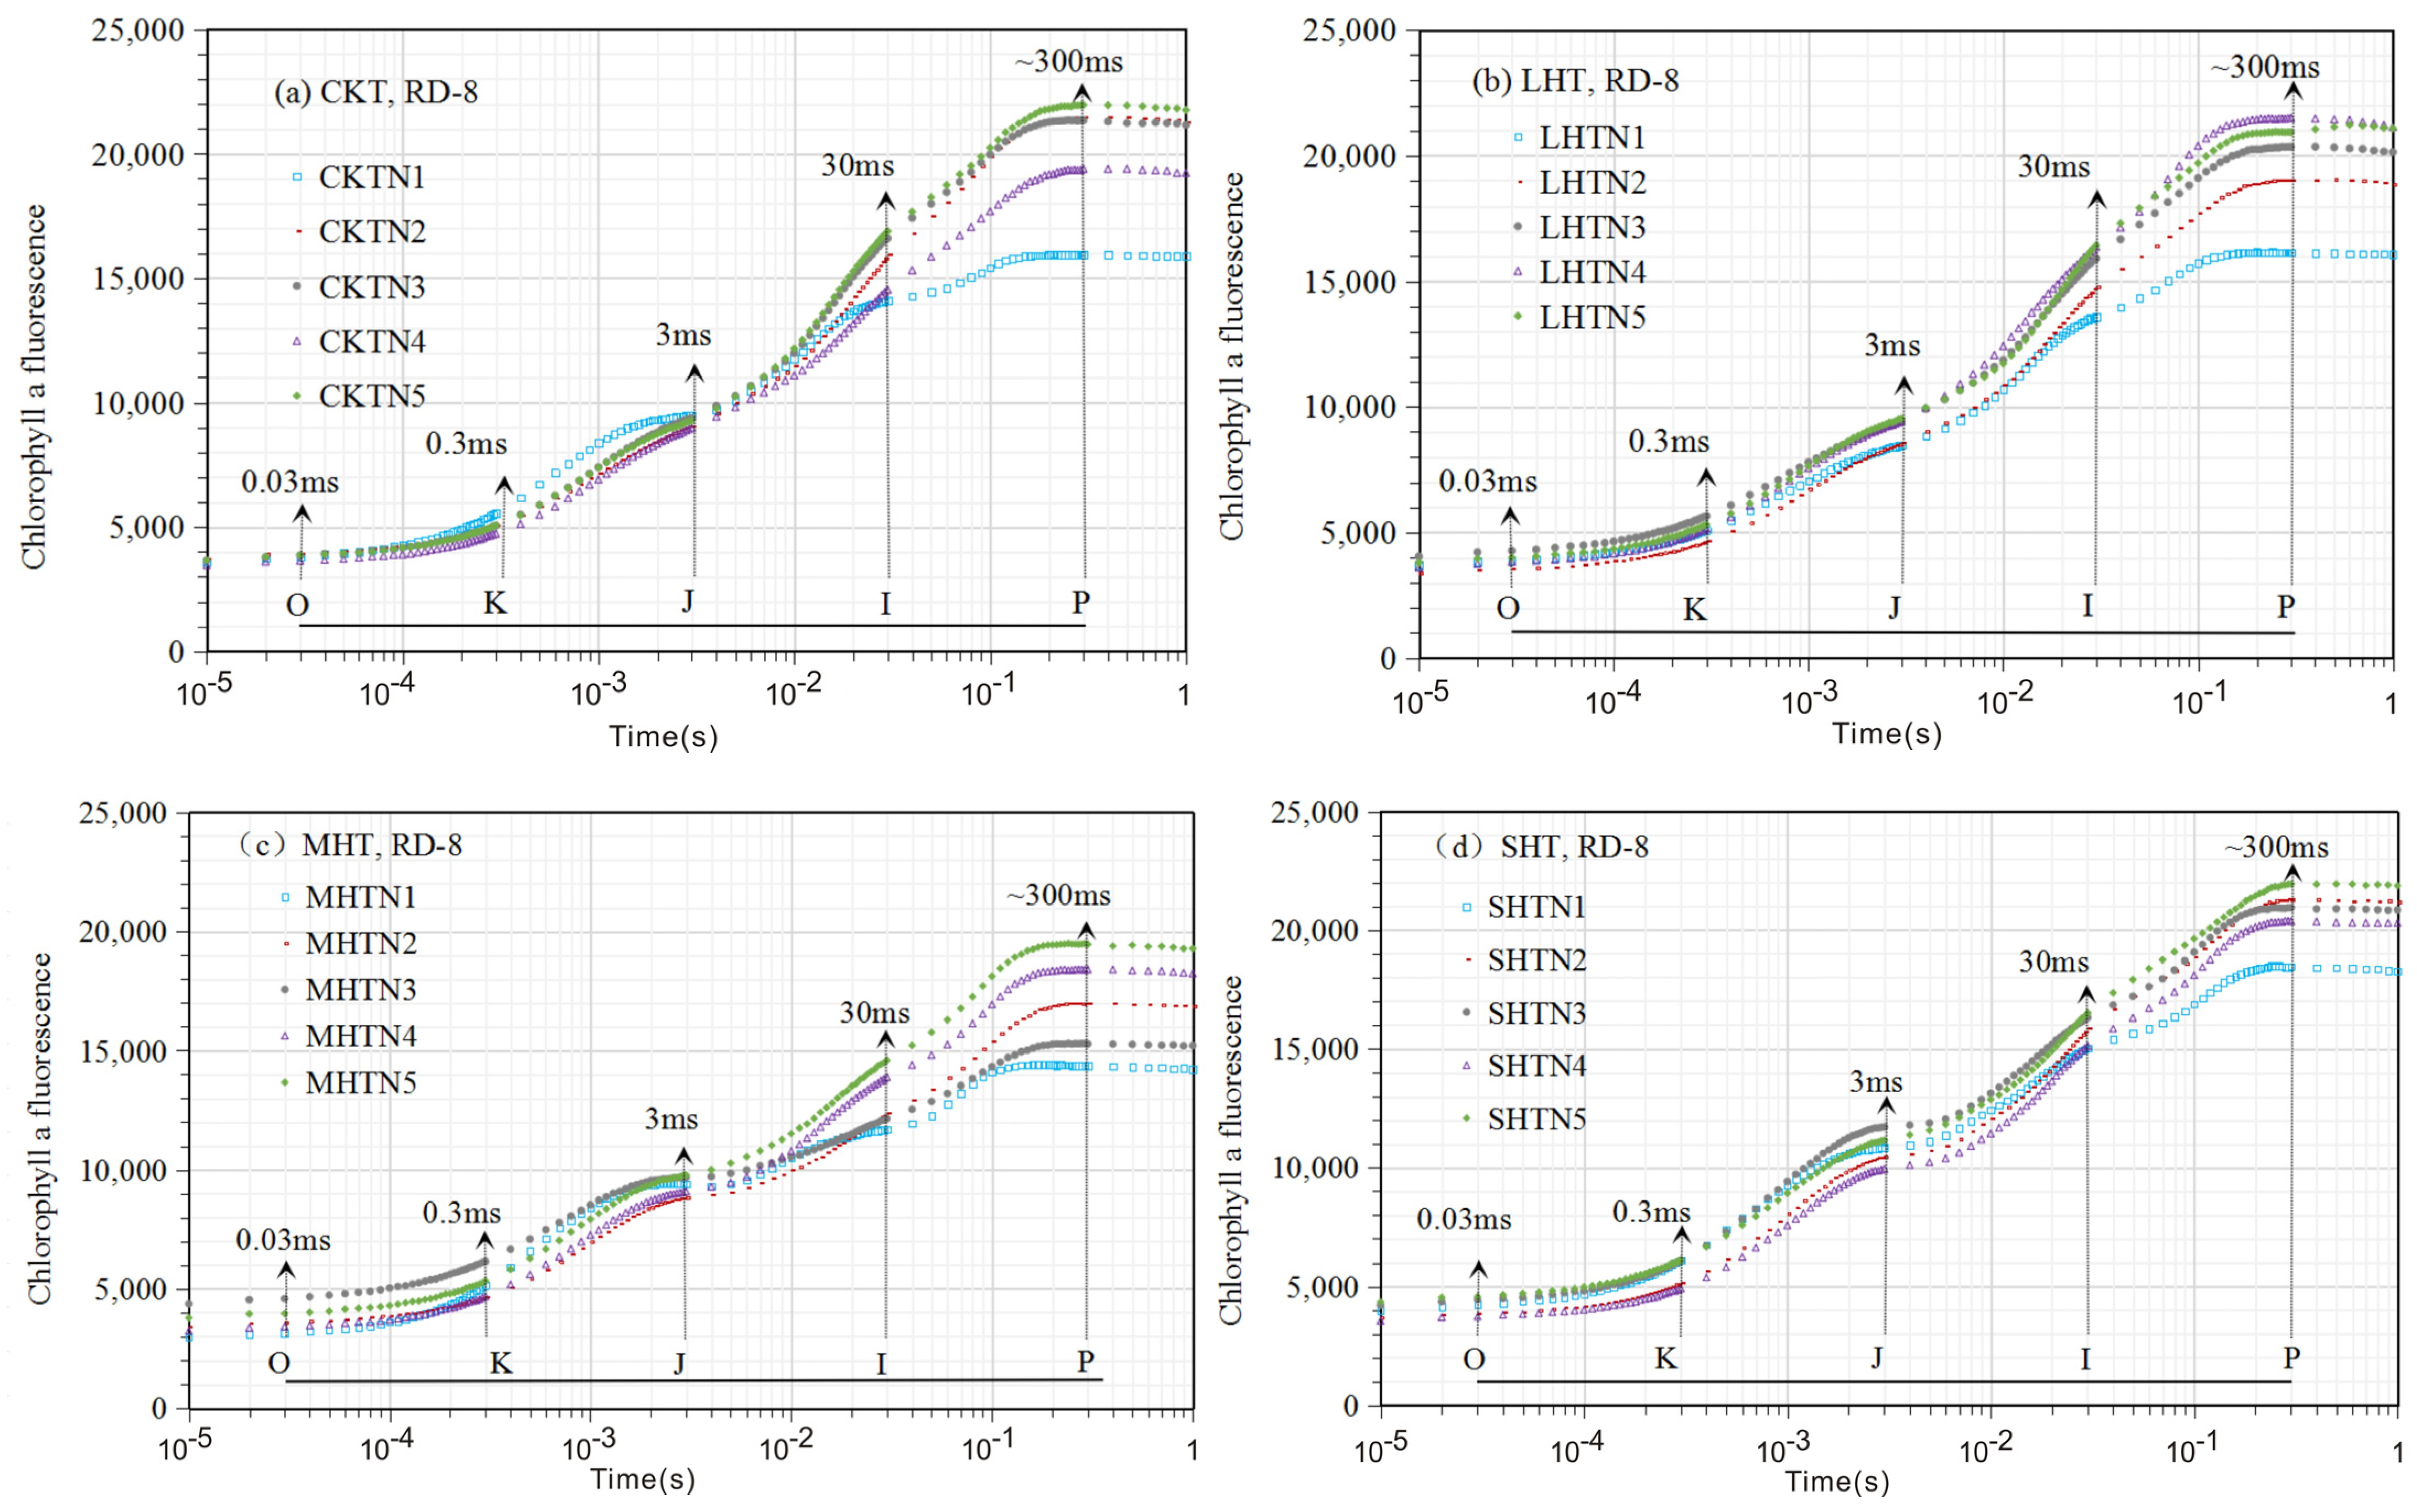
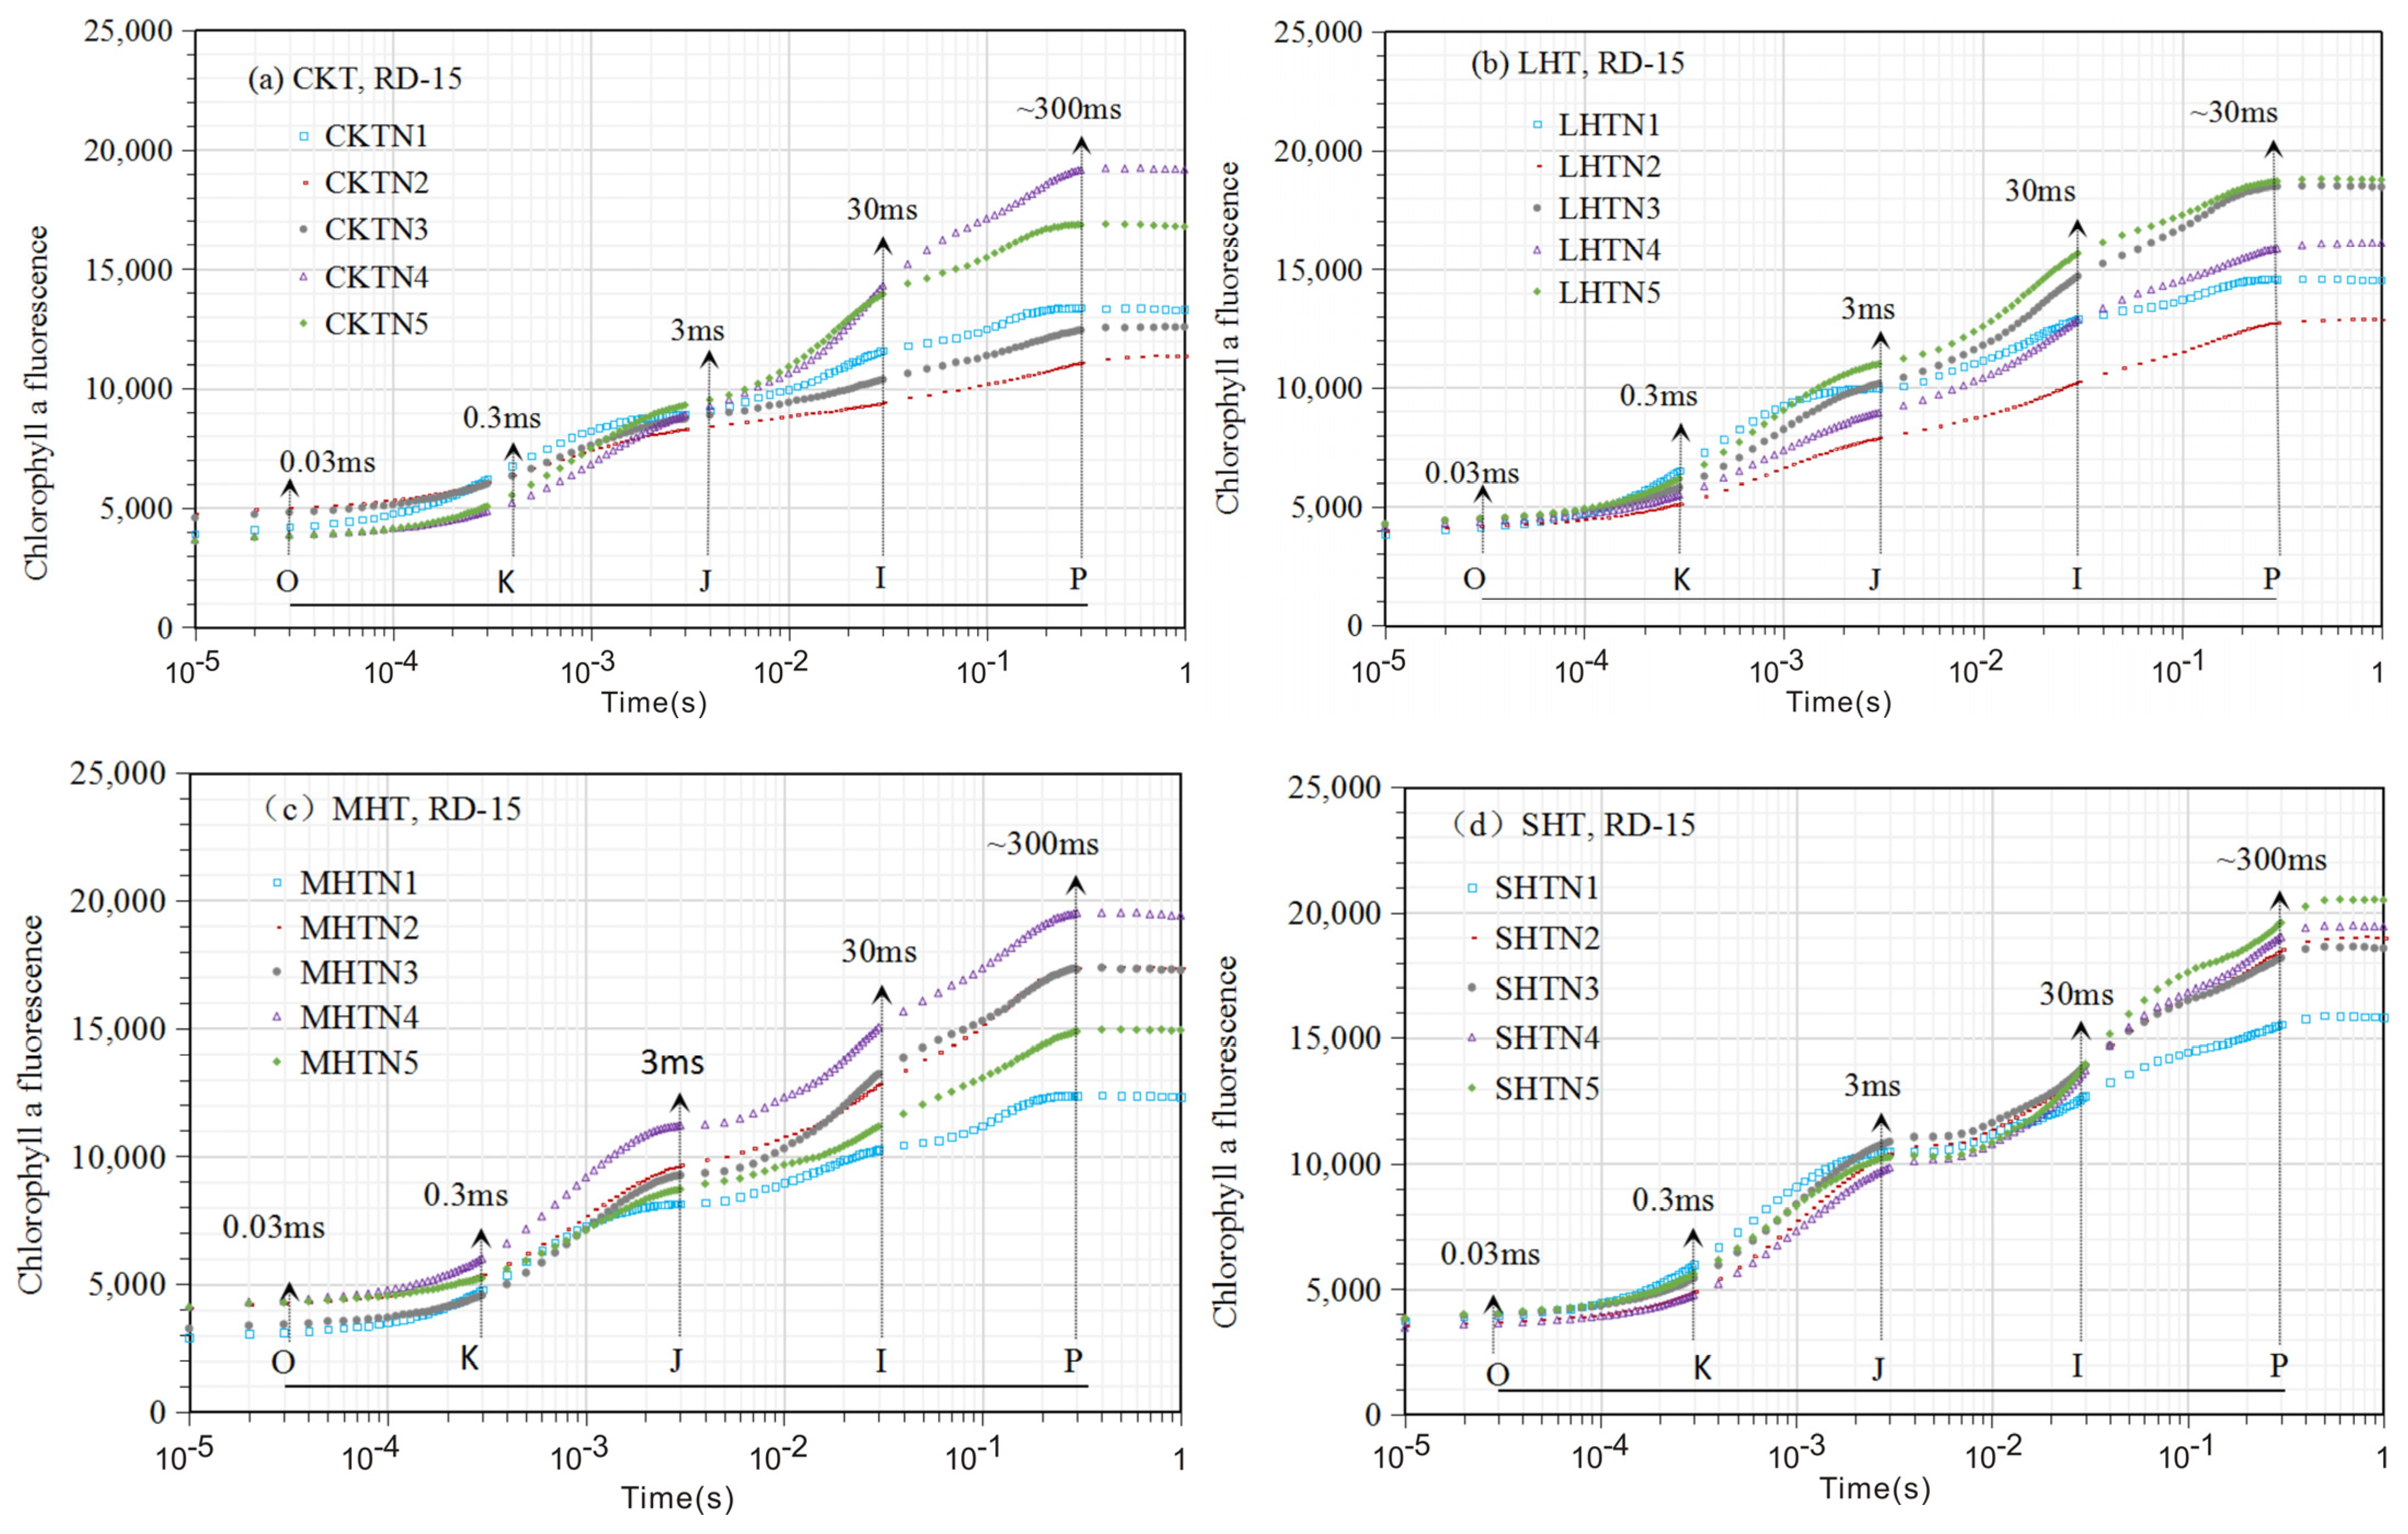
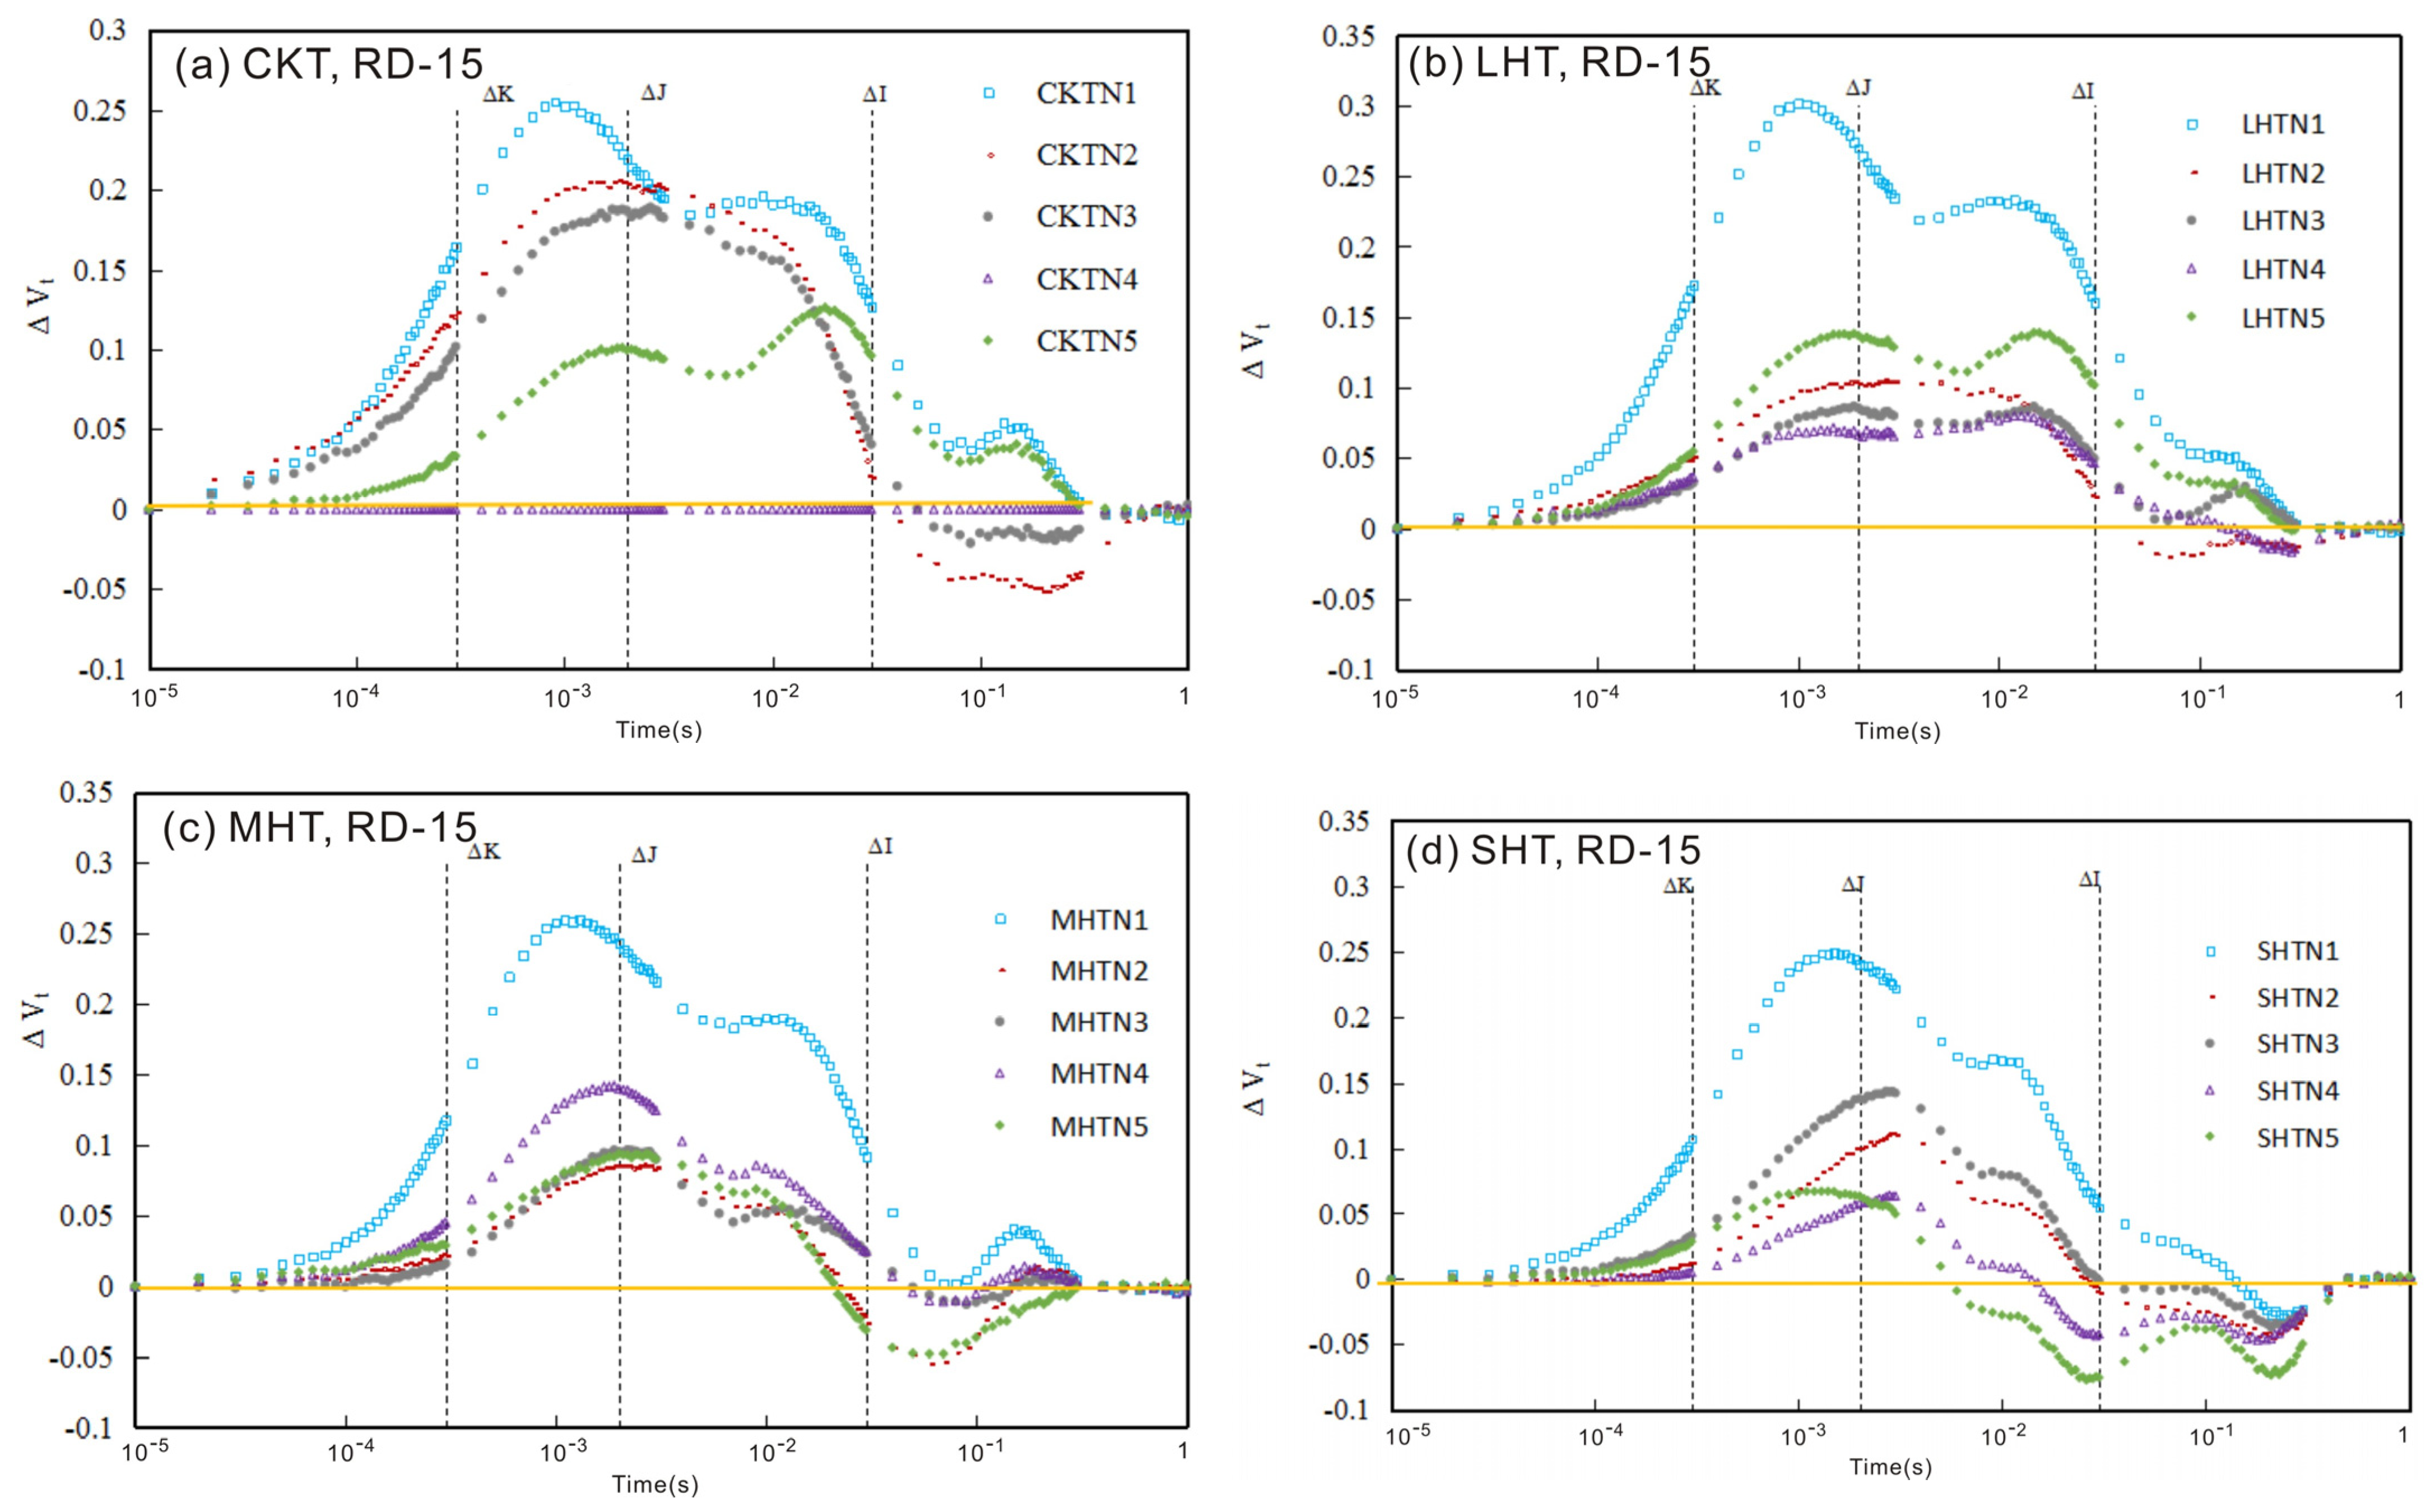
3.1. The Chlorophyll Fluorescence (ChlF) Curve
3.1.1. ChlF Rise
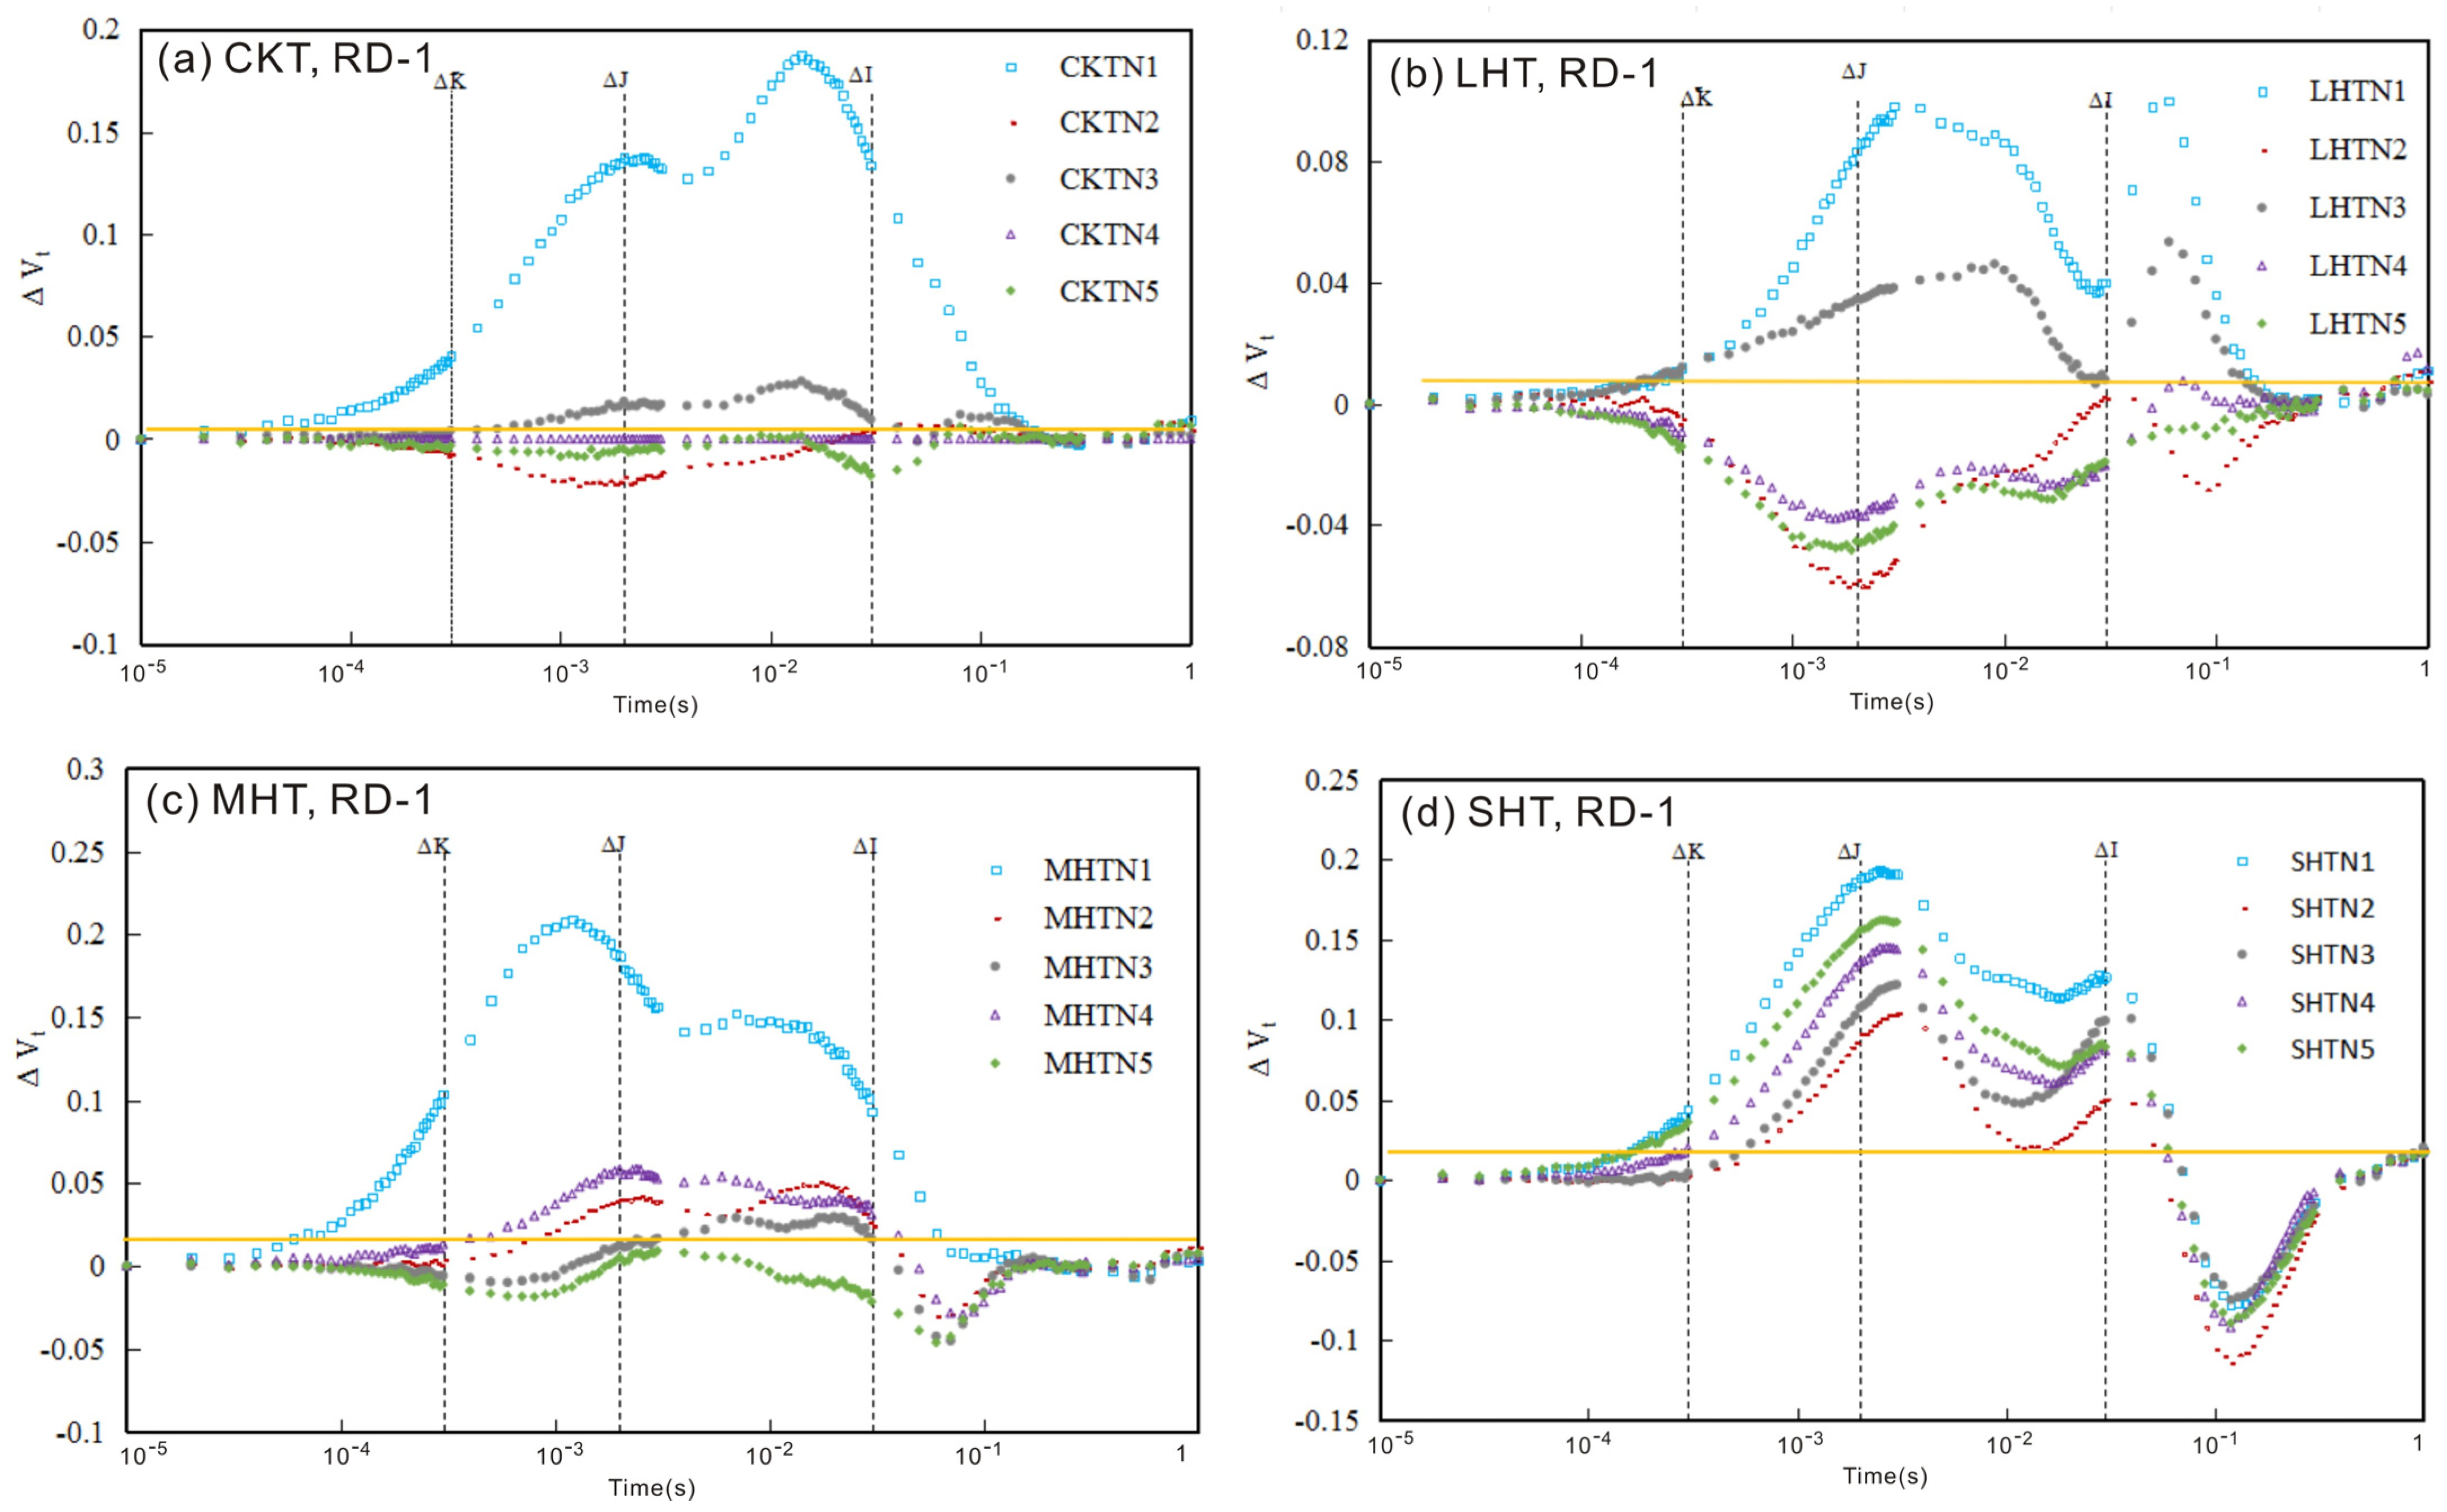
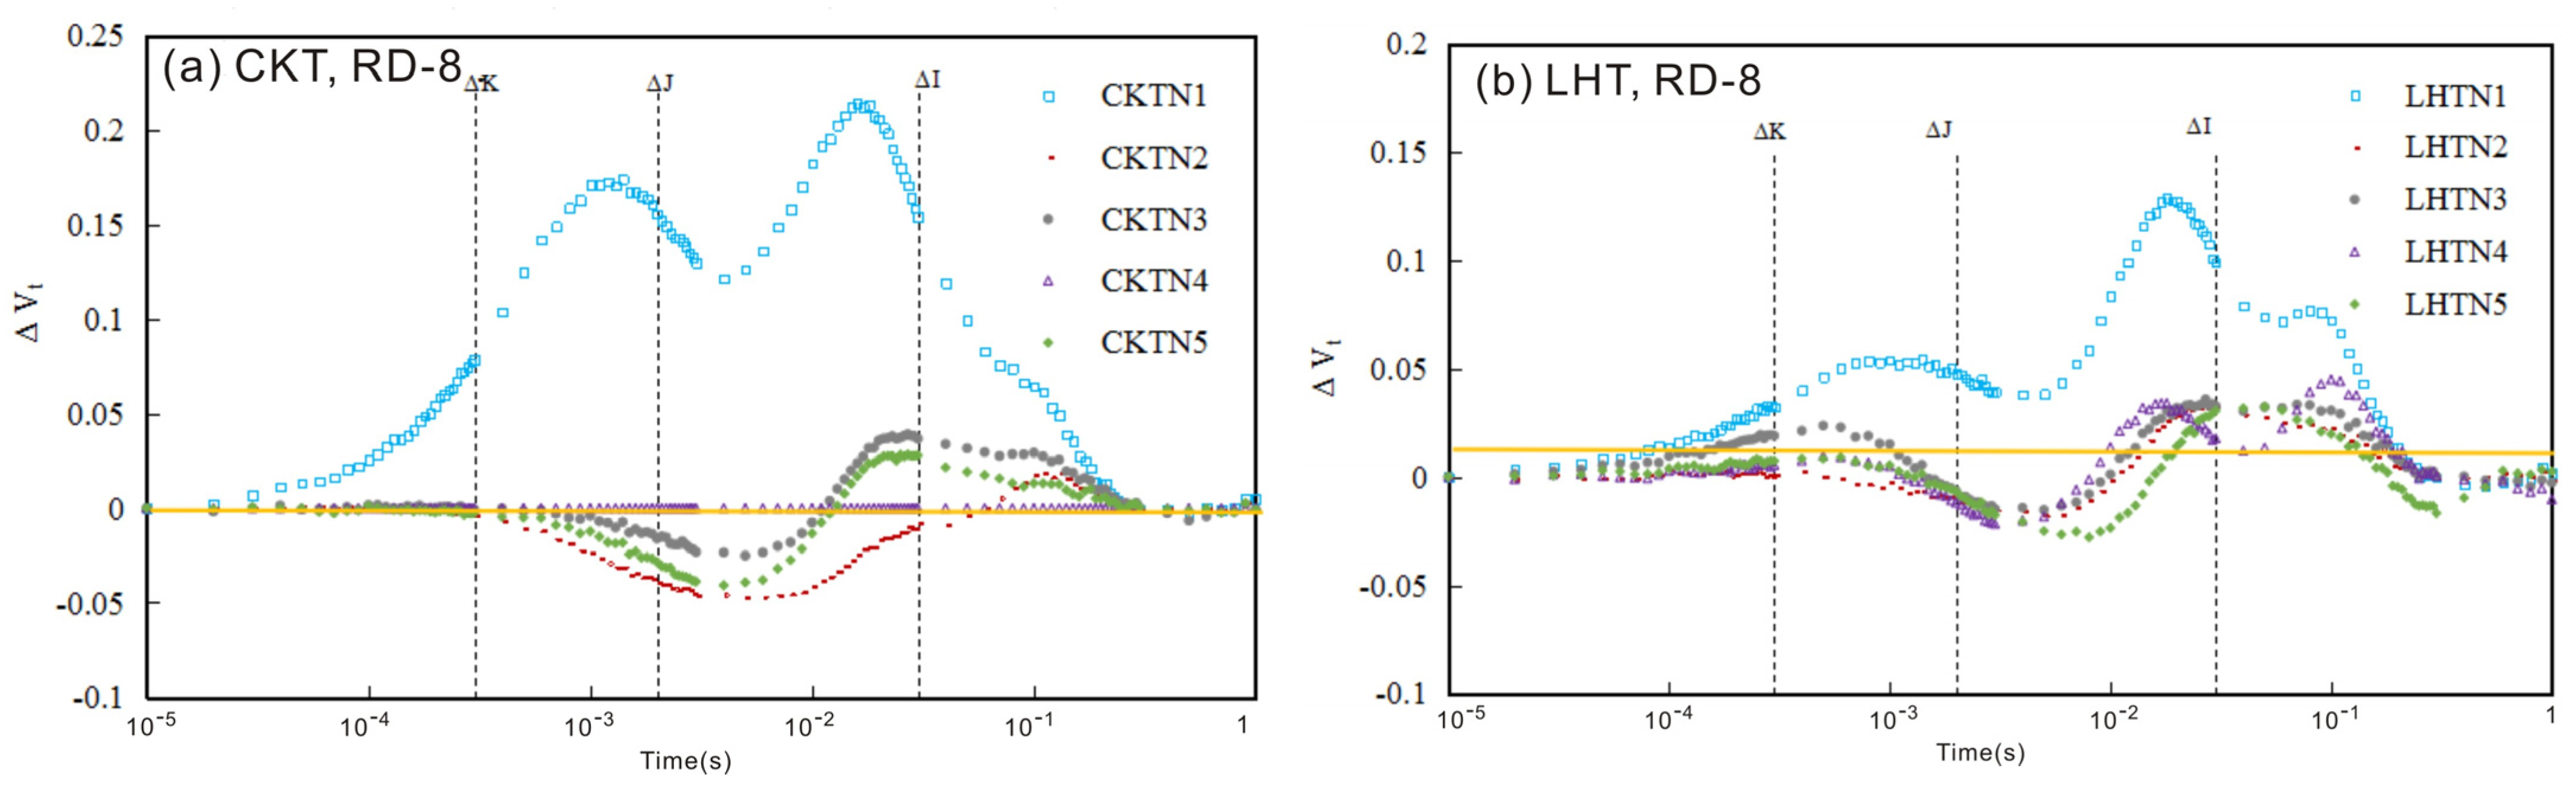
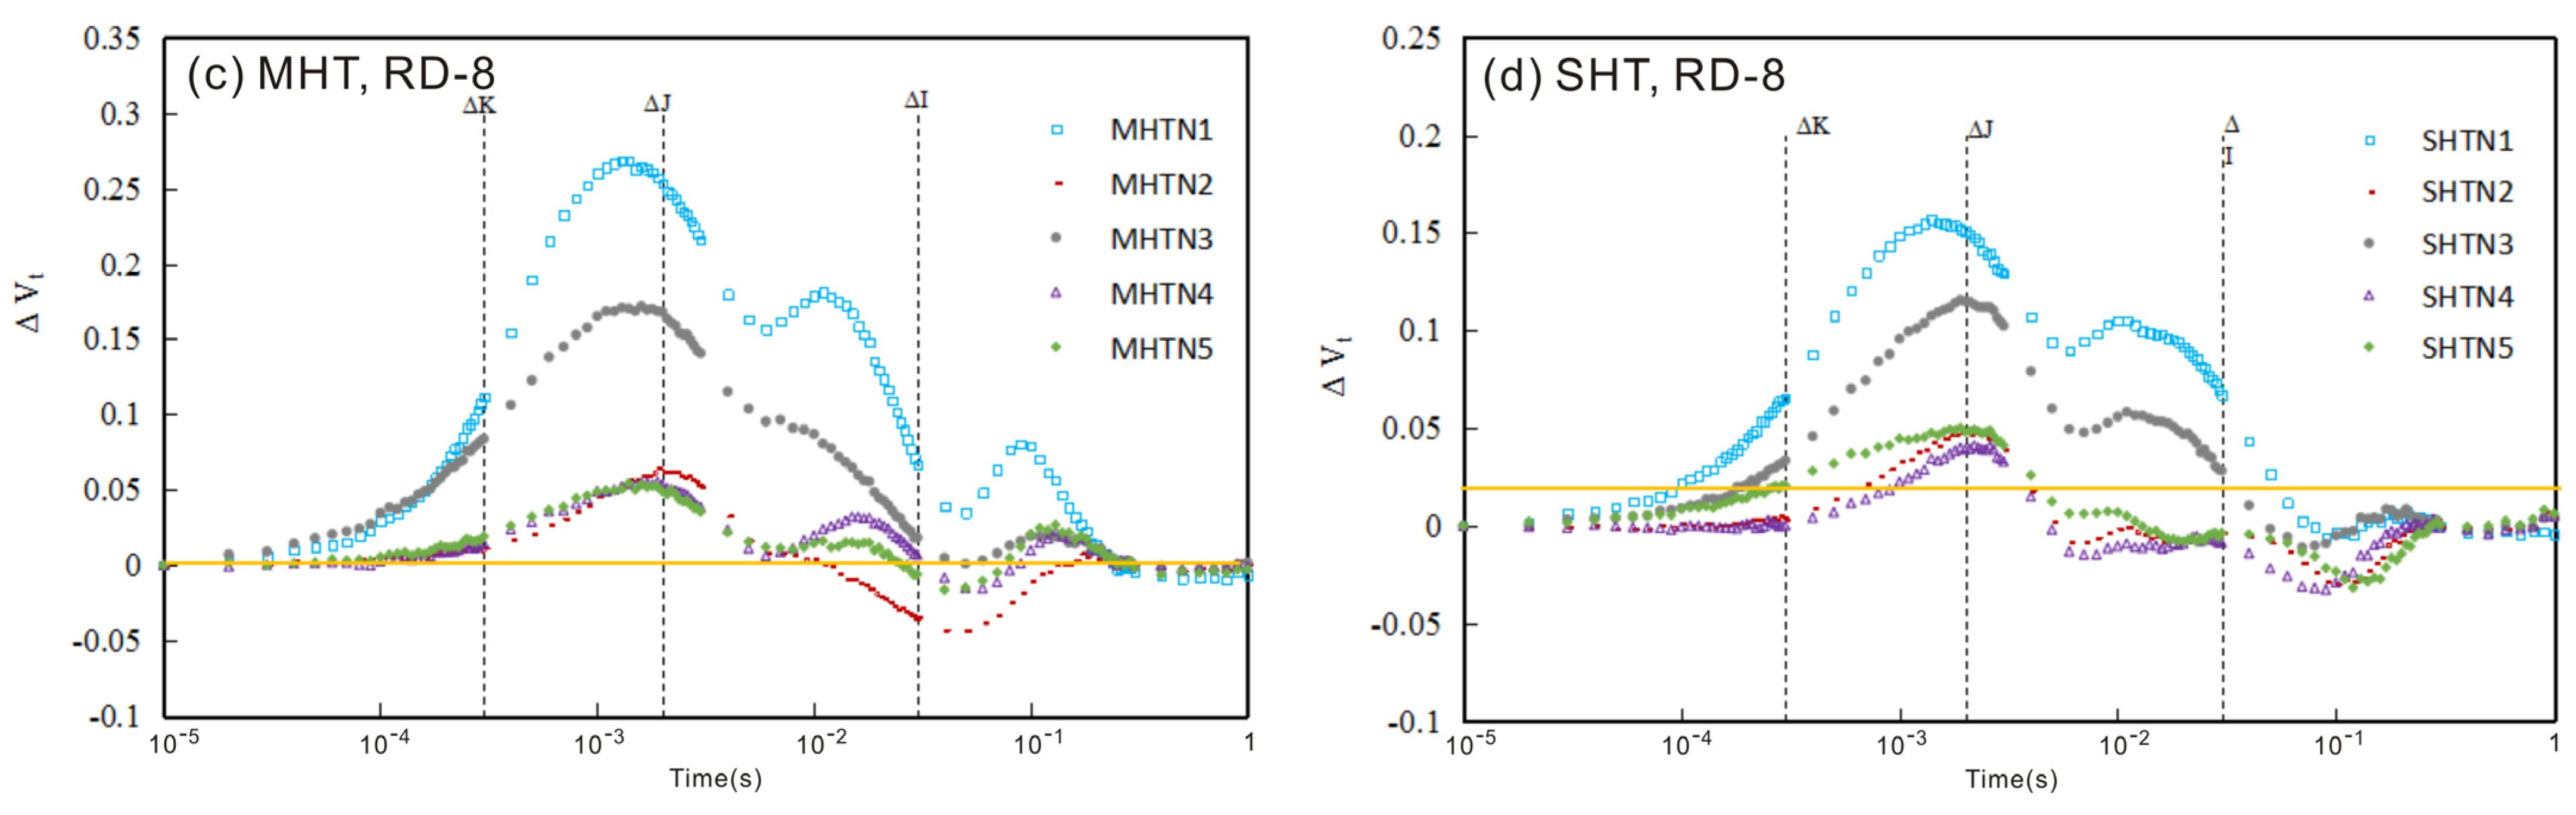
3.1.2. The Relative Variable Fluorescence Changes in Tomato Leaves
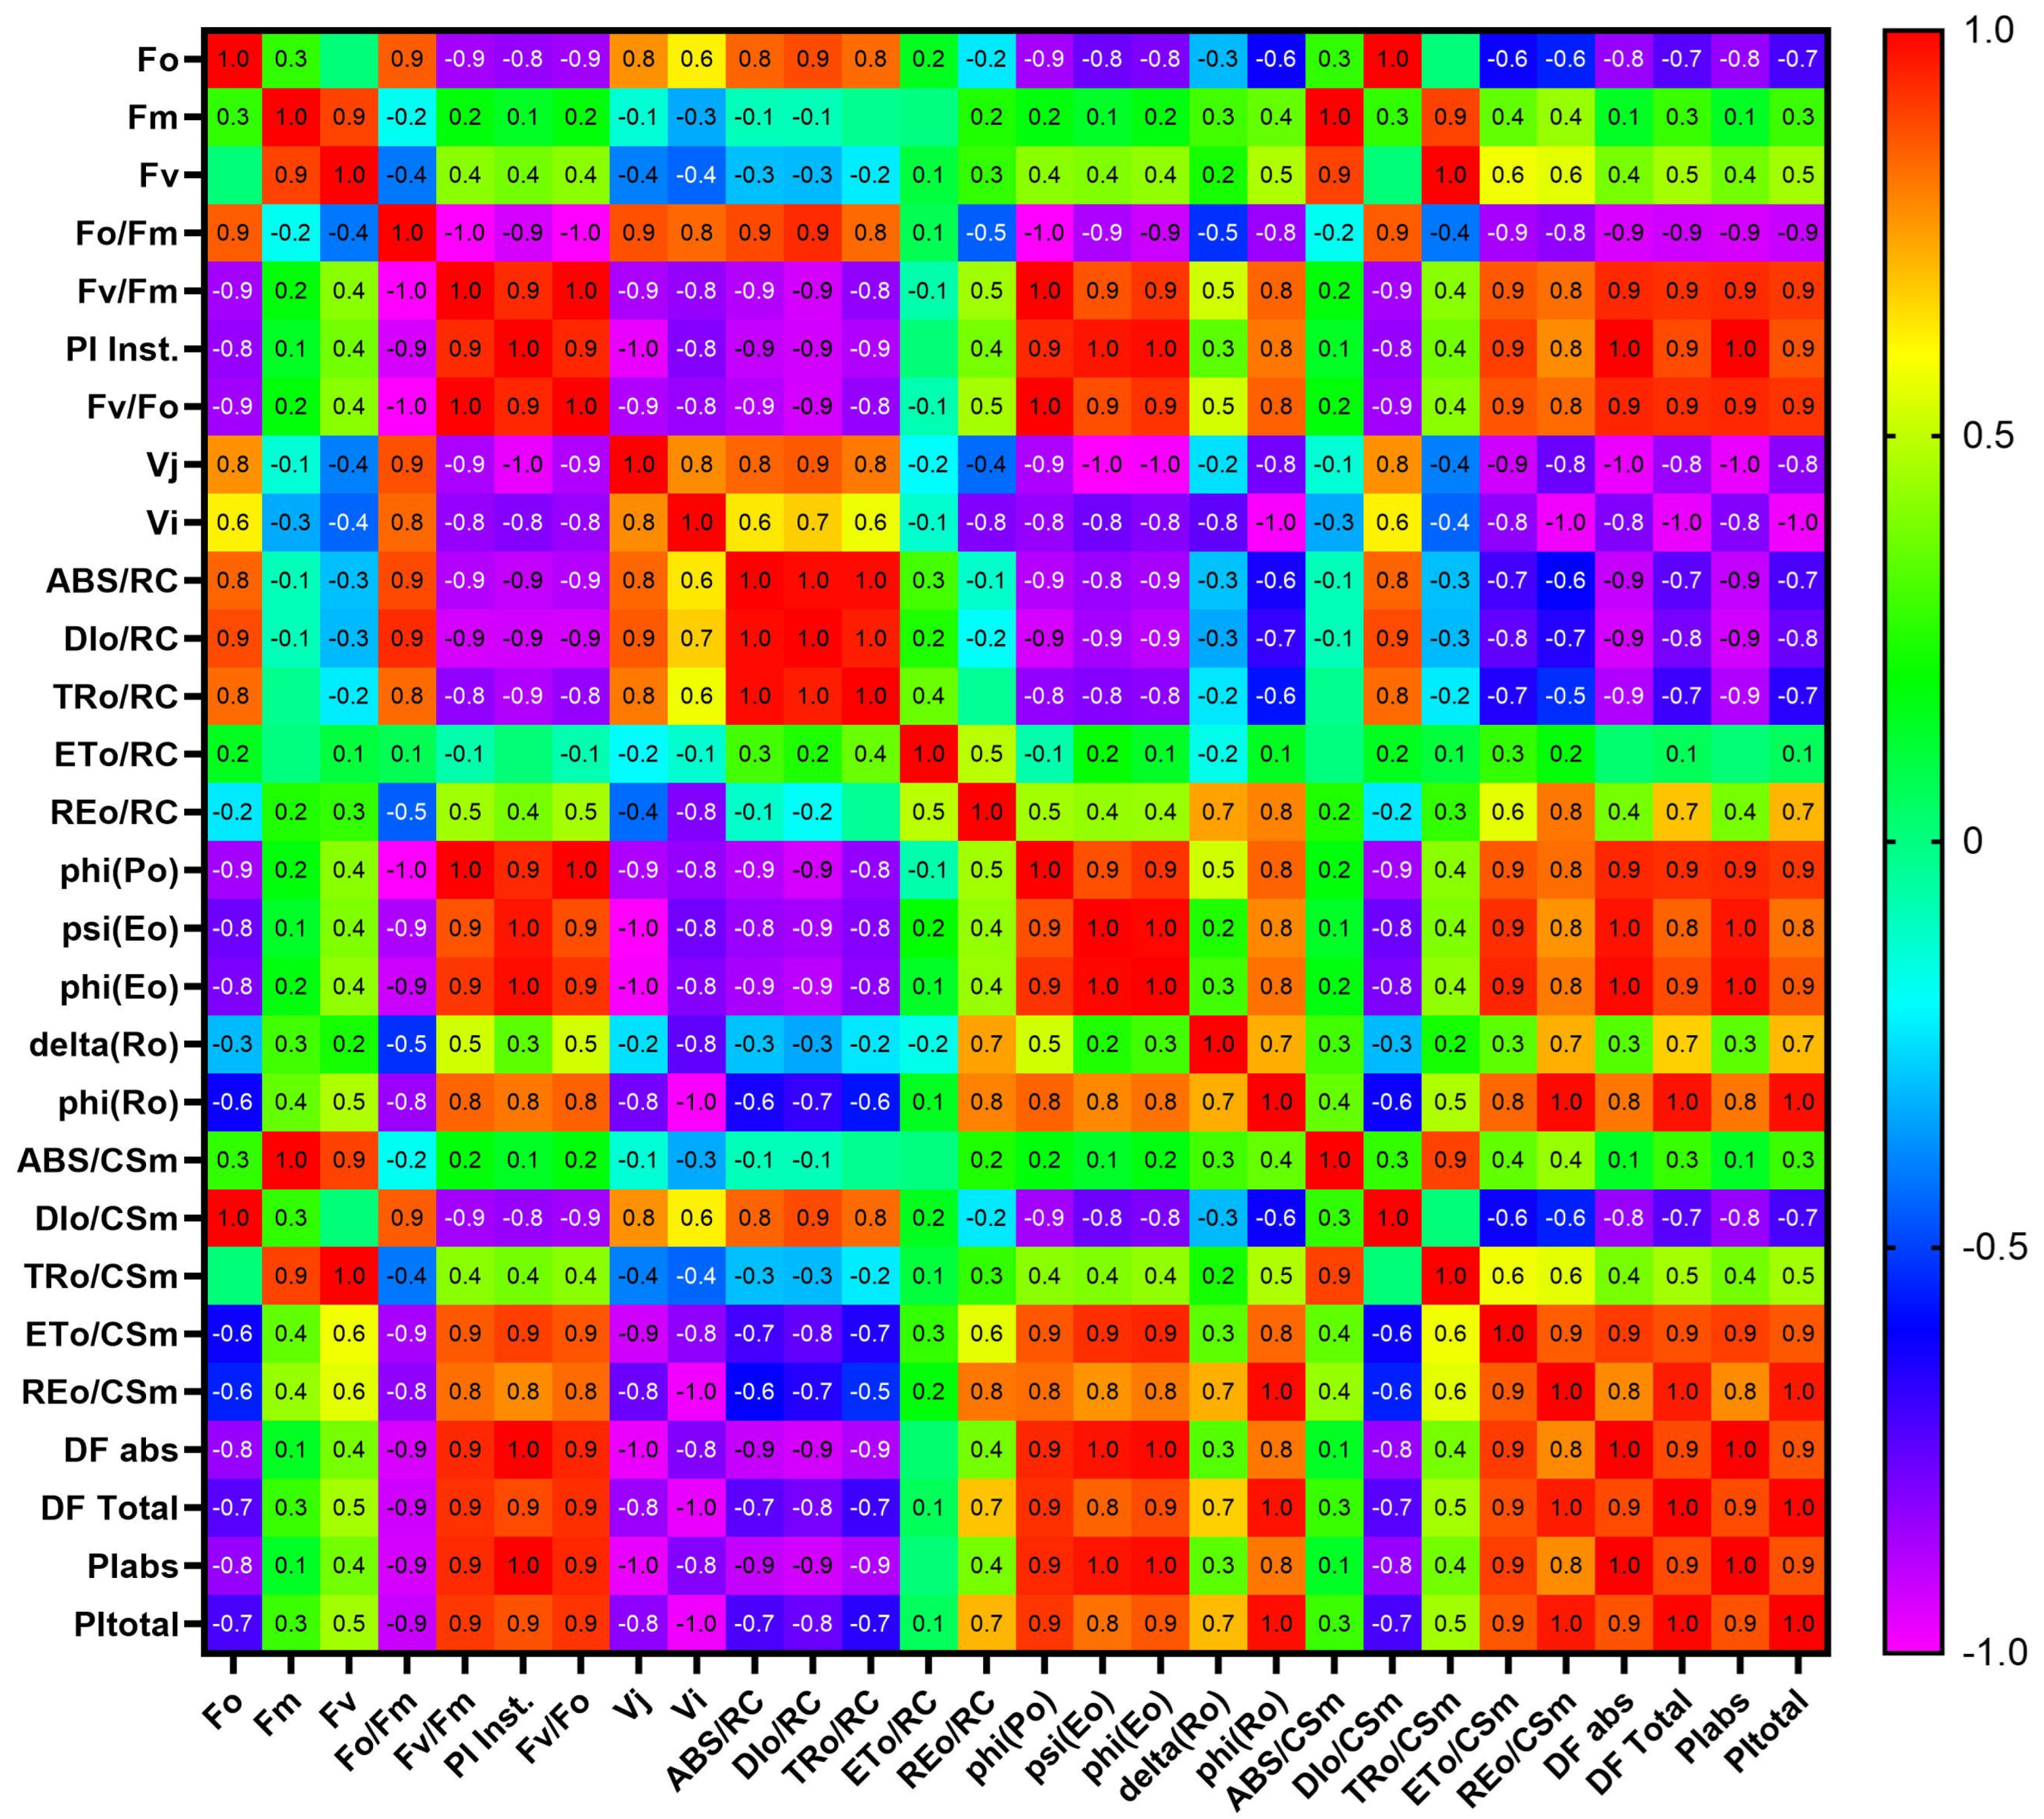
3.2. Physical Biological Parameters from JIP-Test Equations
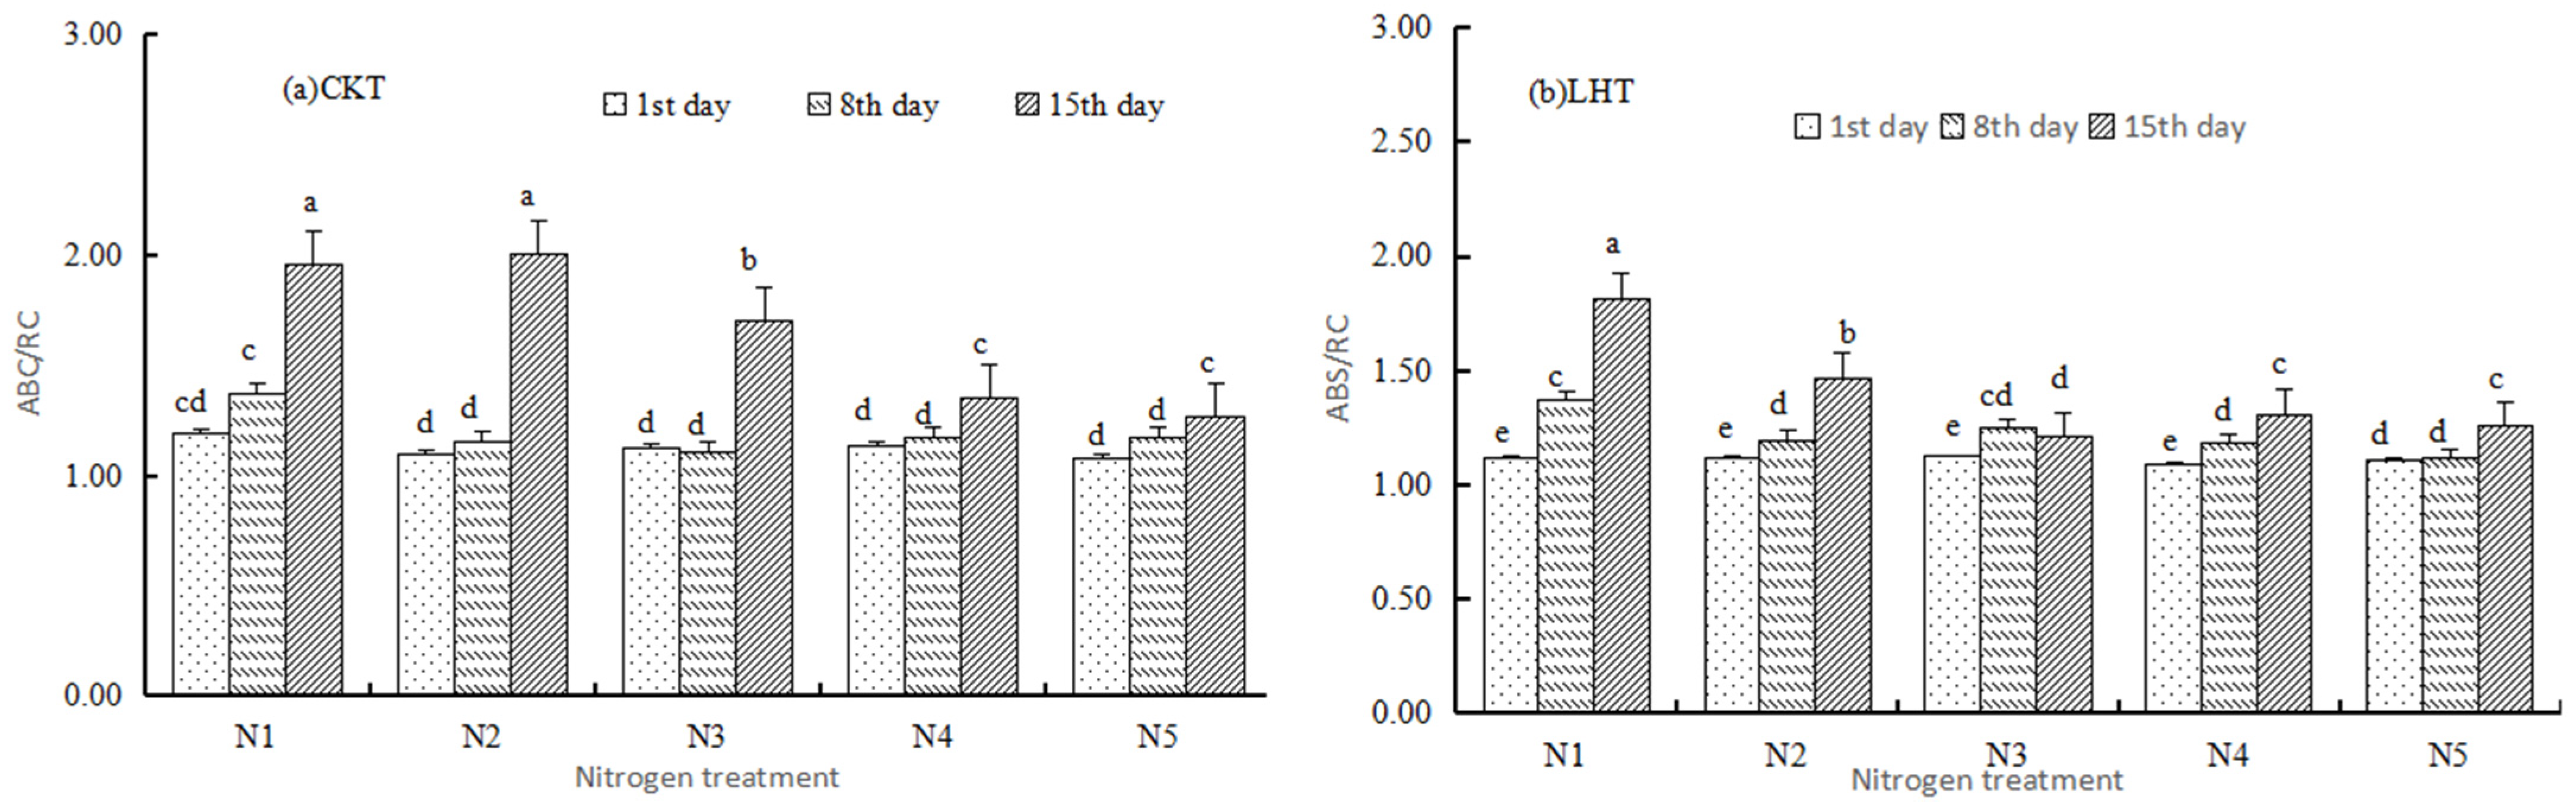
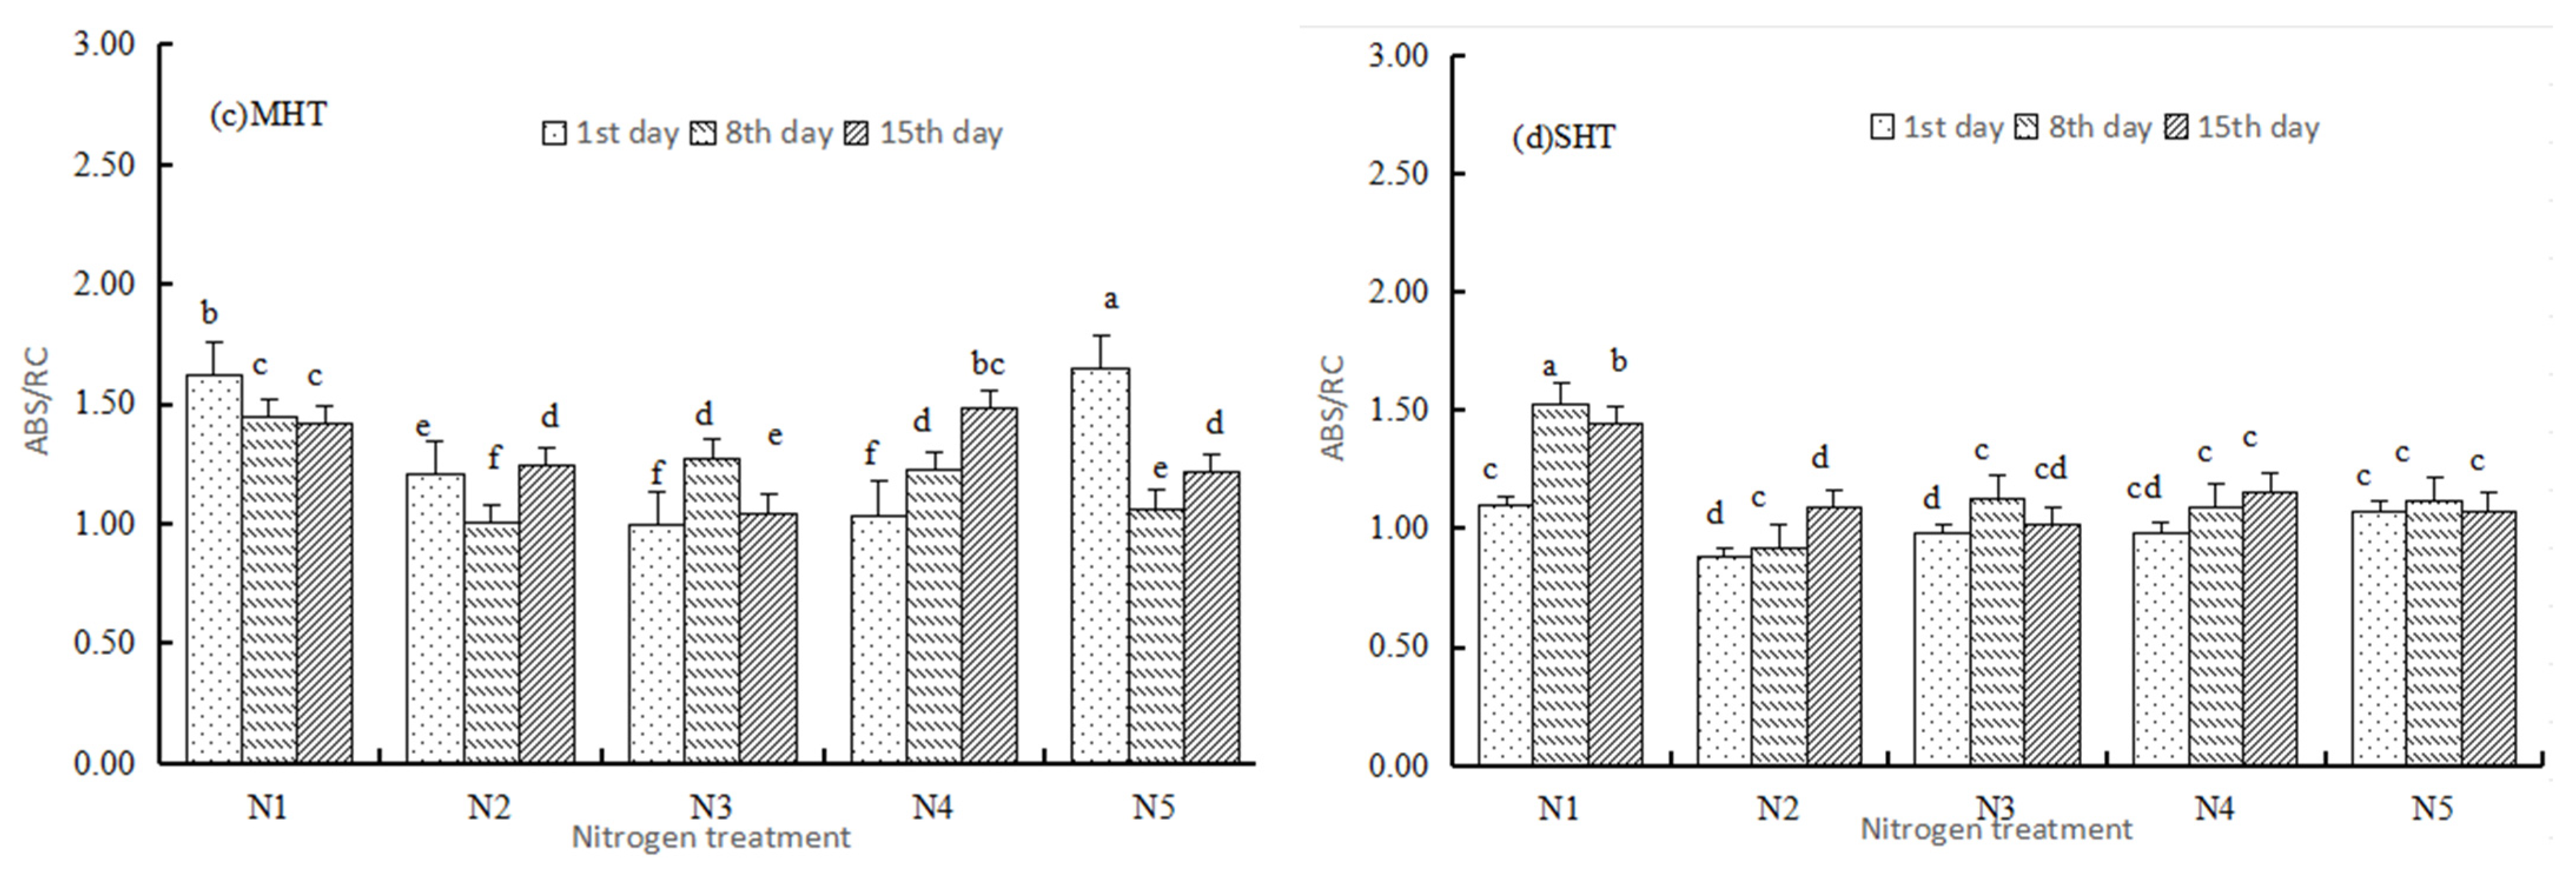
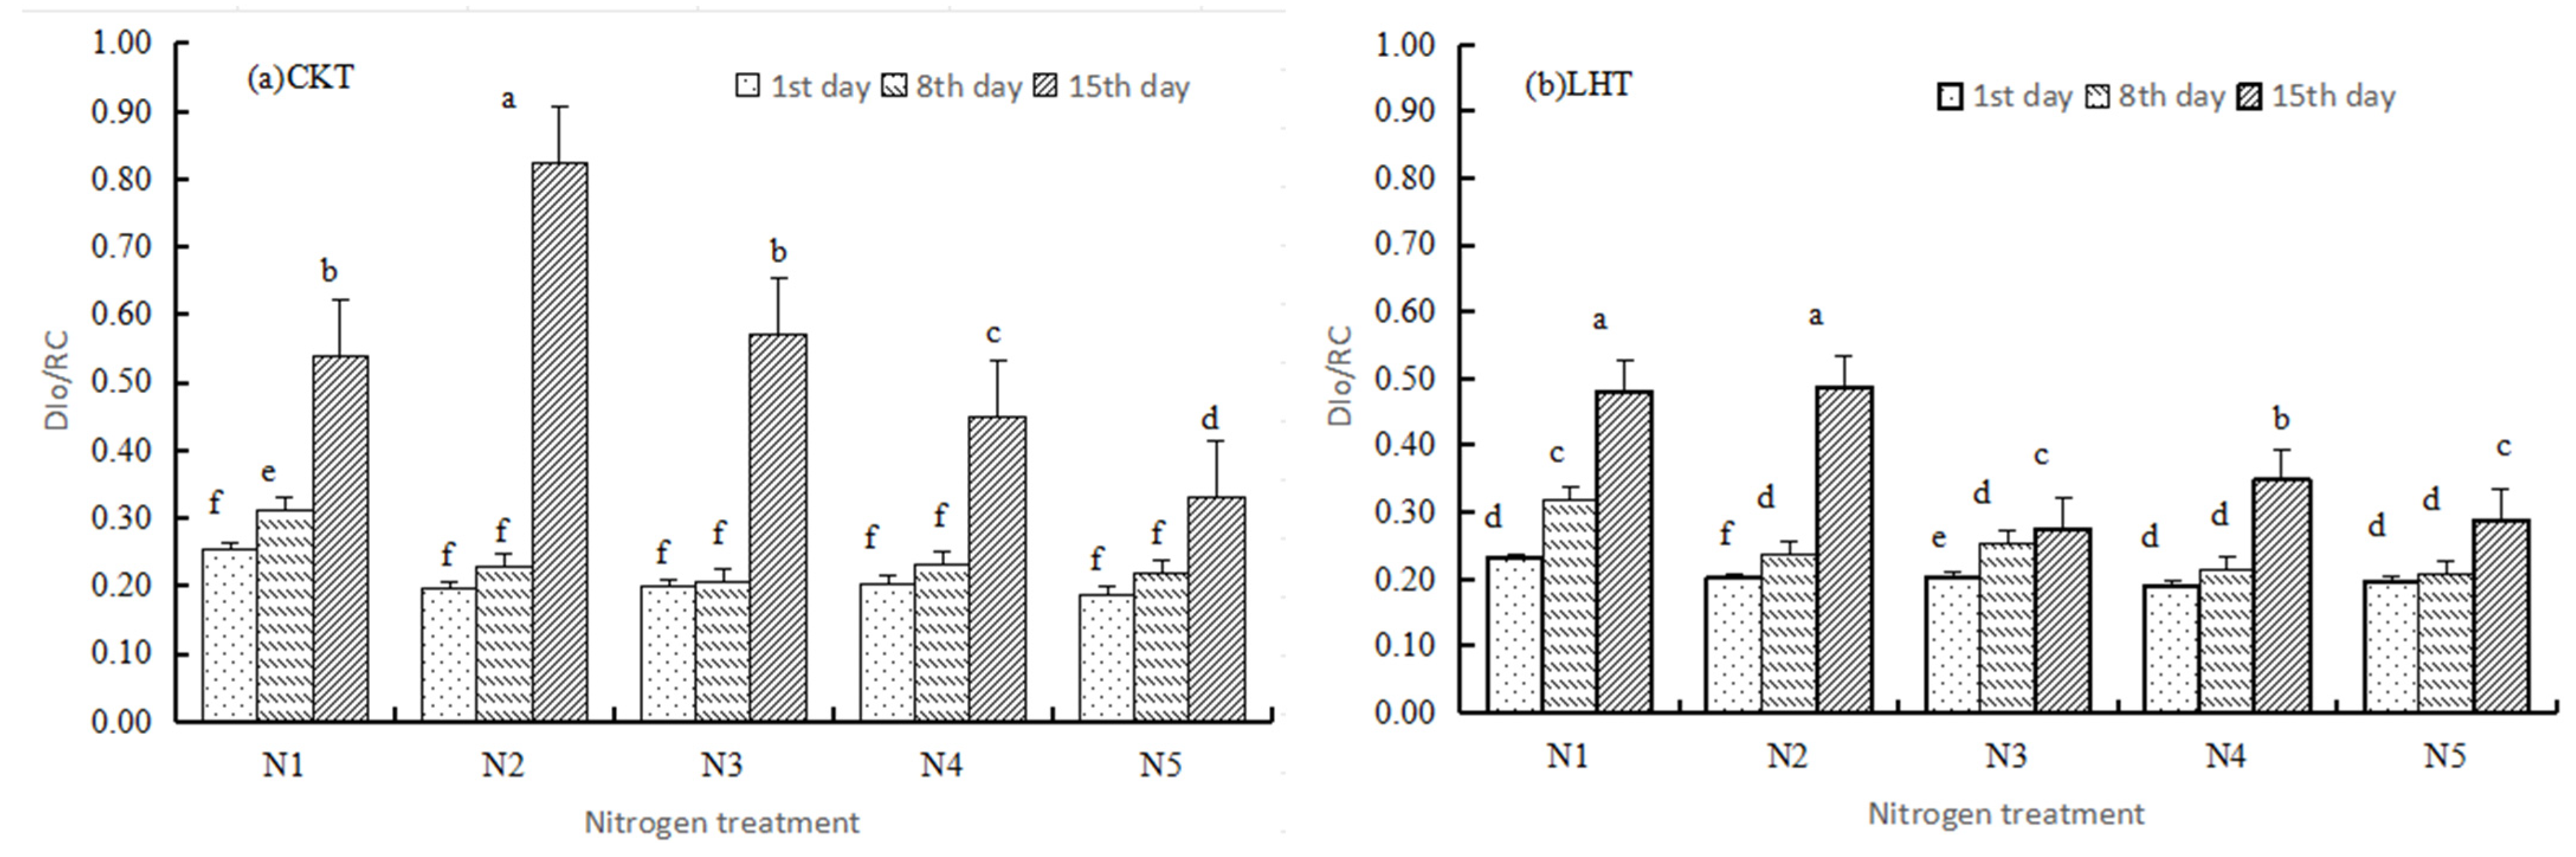
3.2.1. Basic Parameters
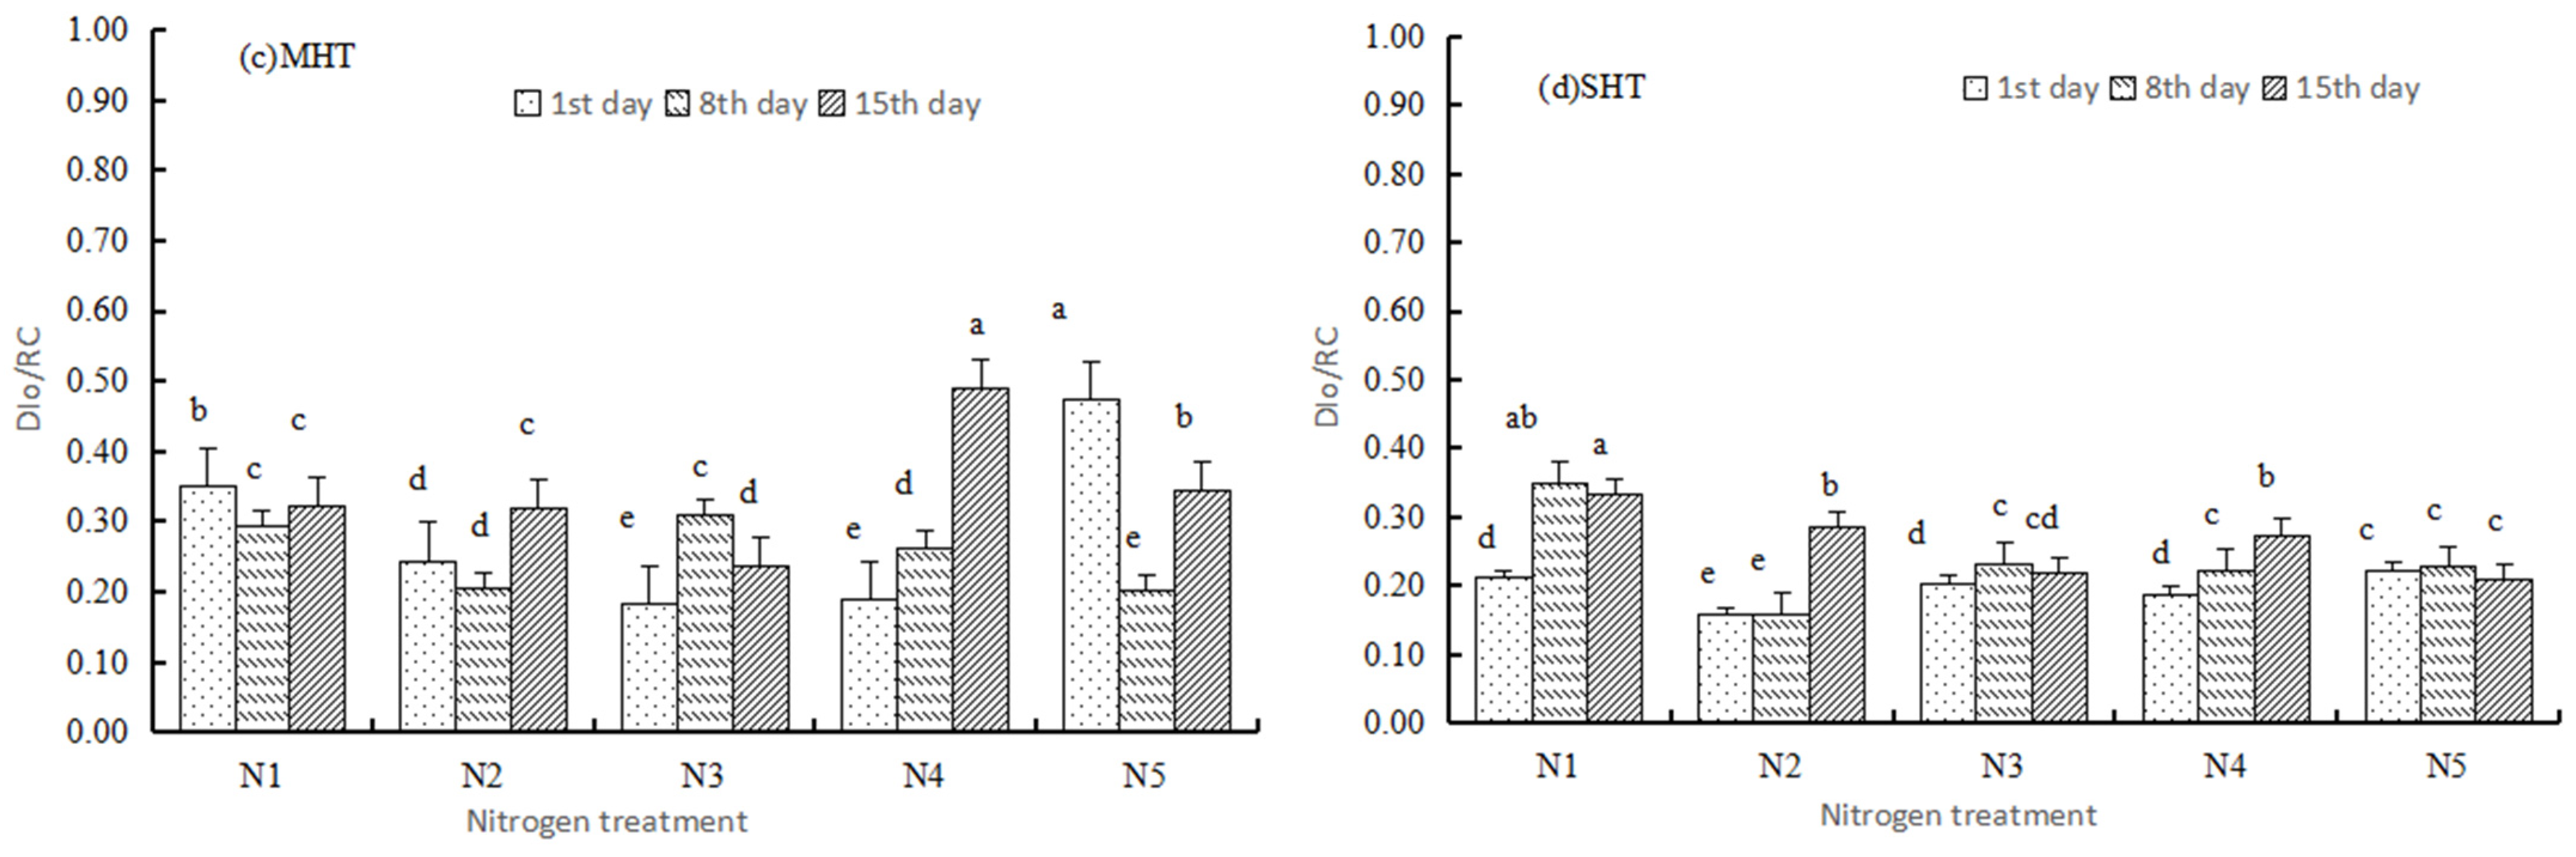
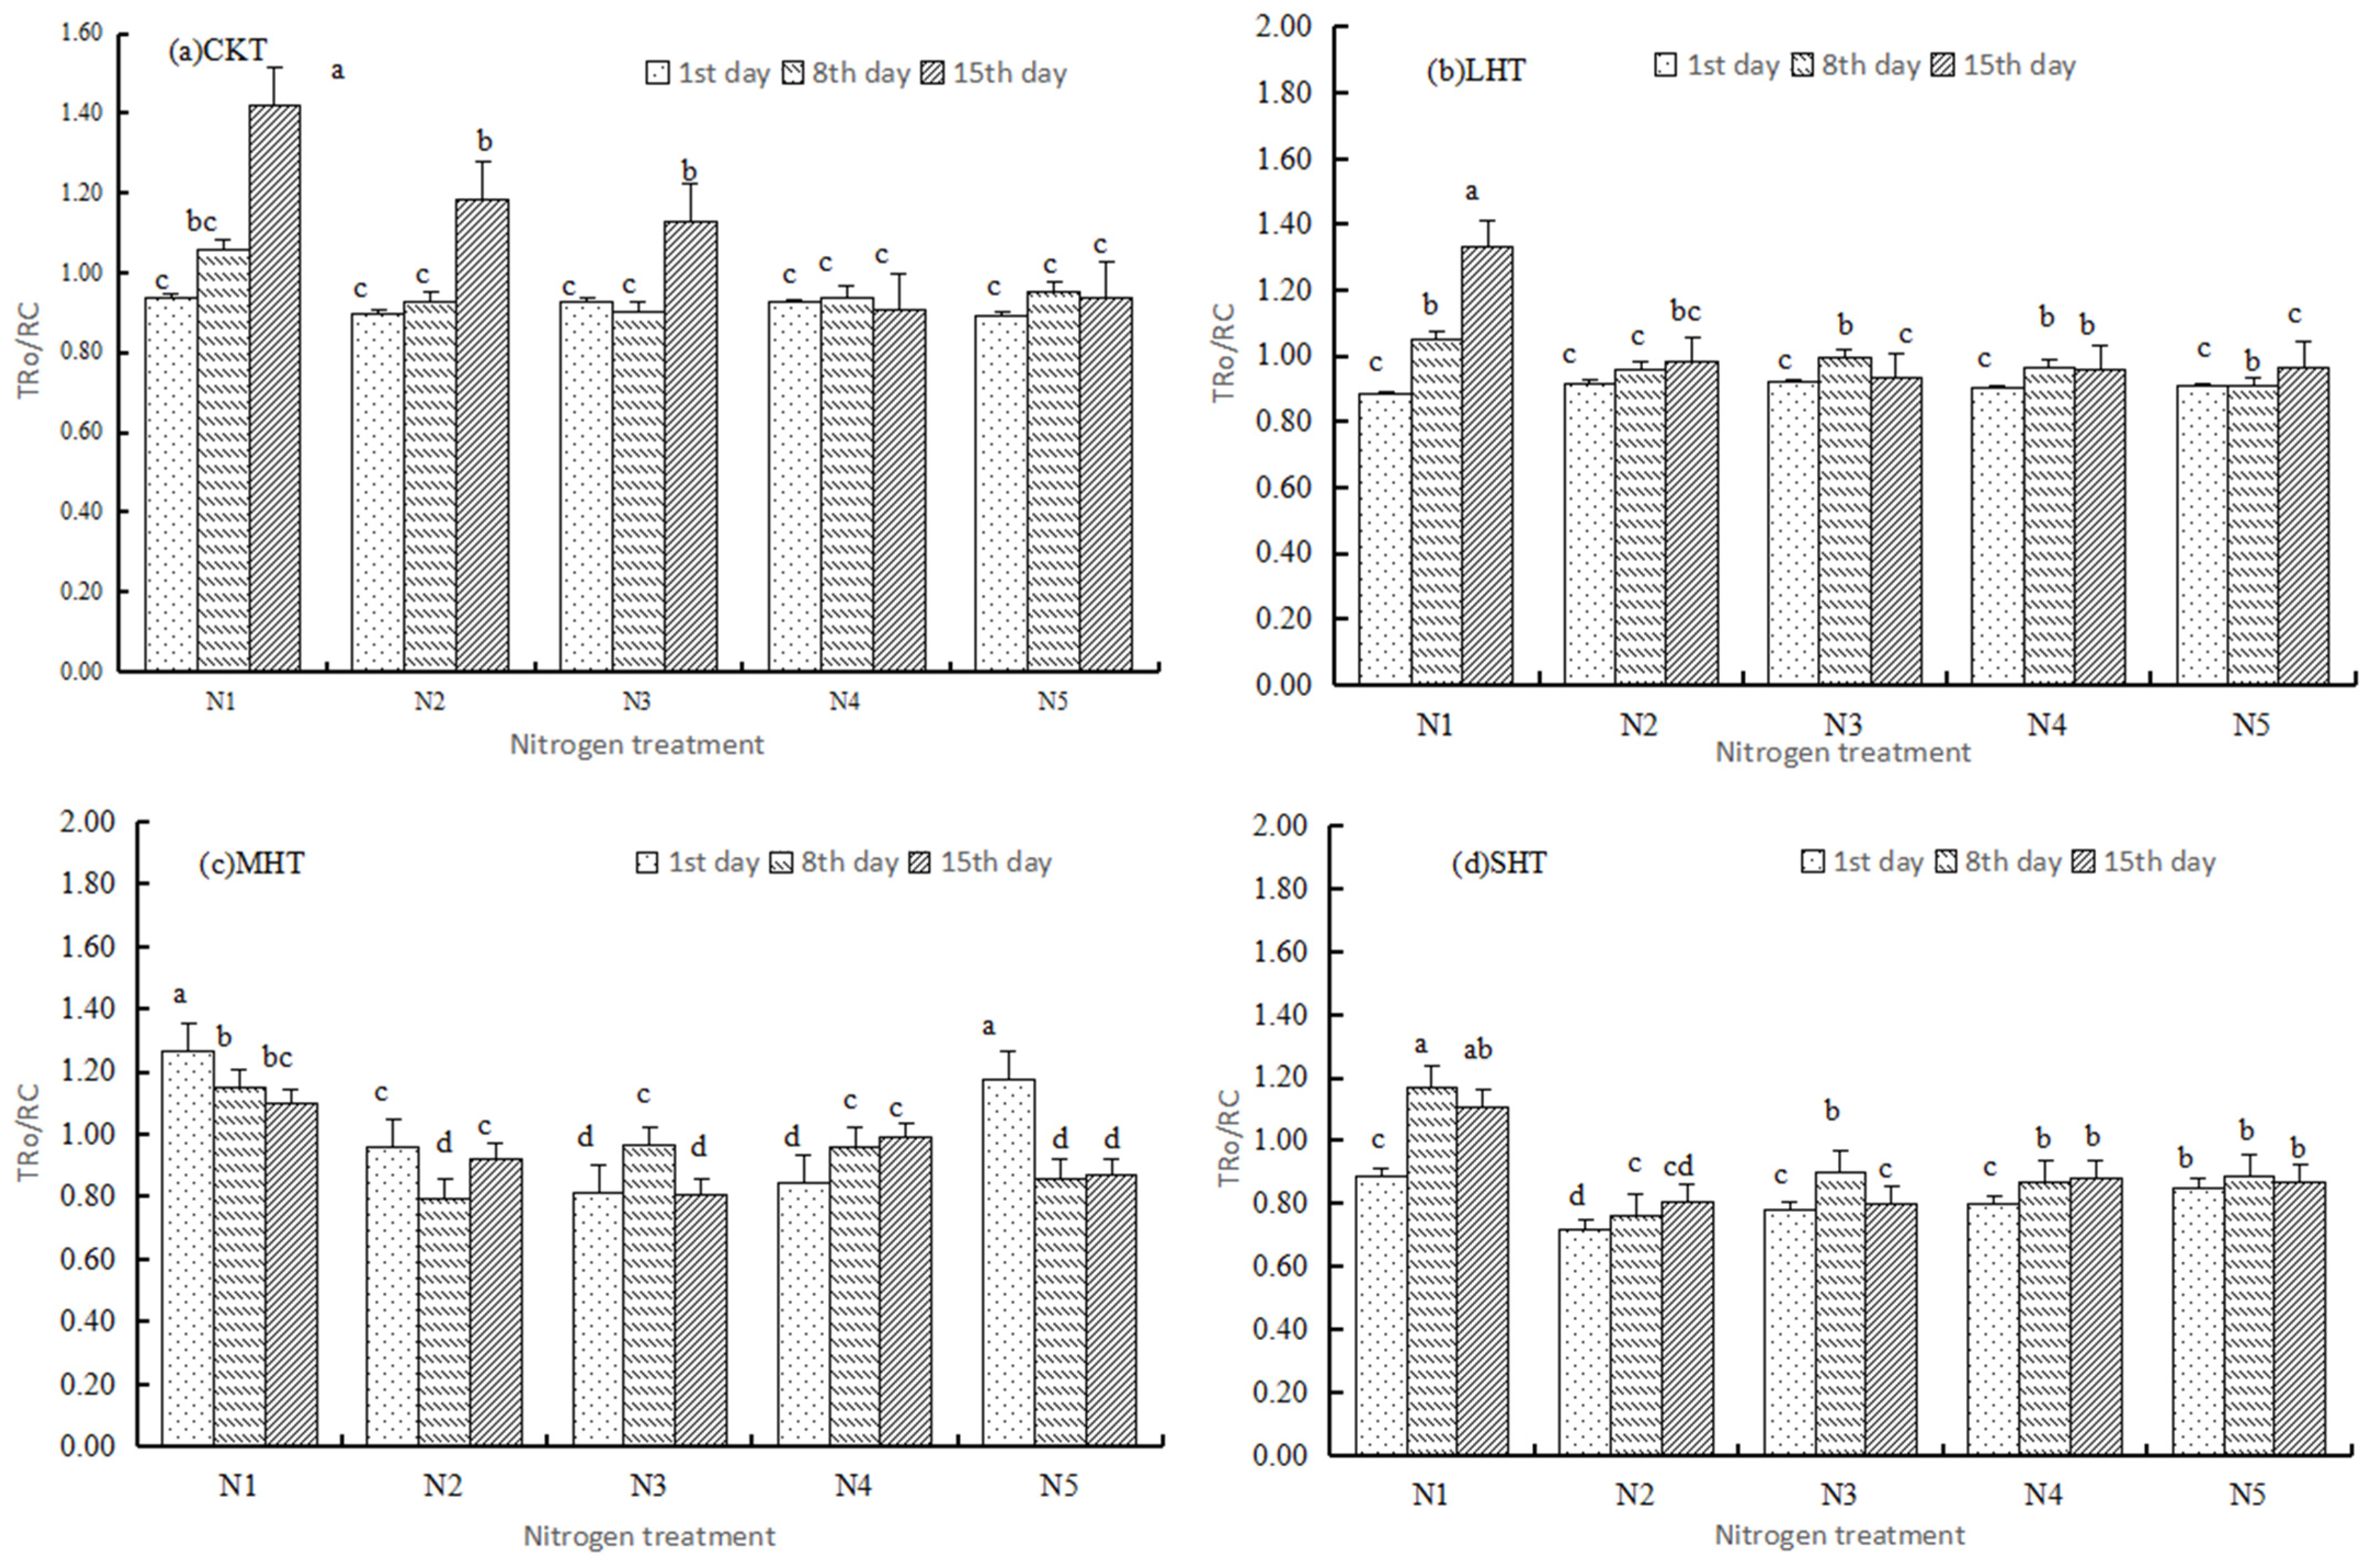
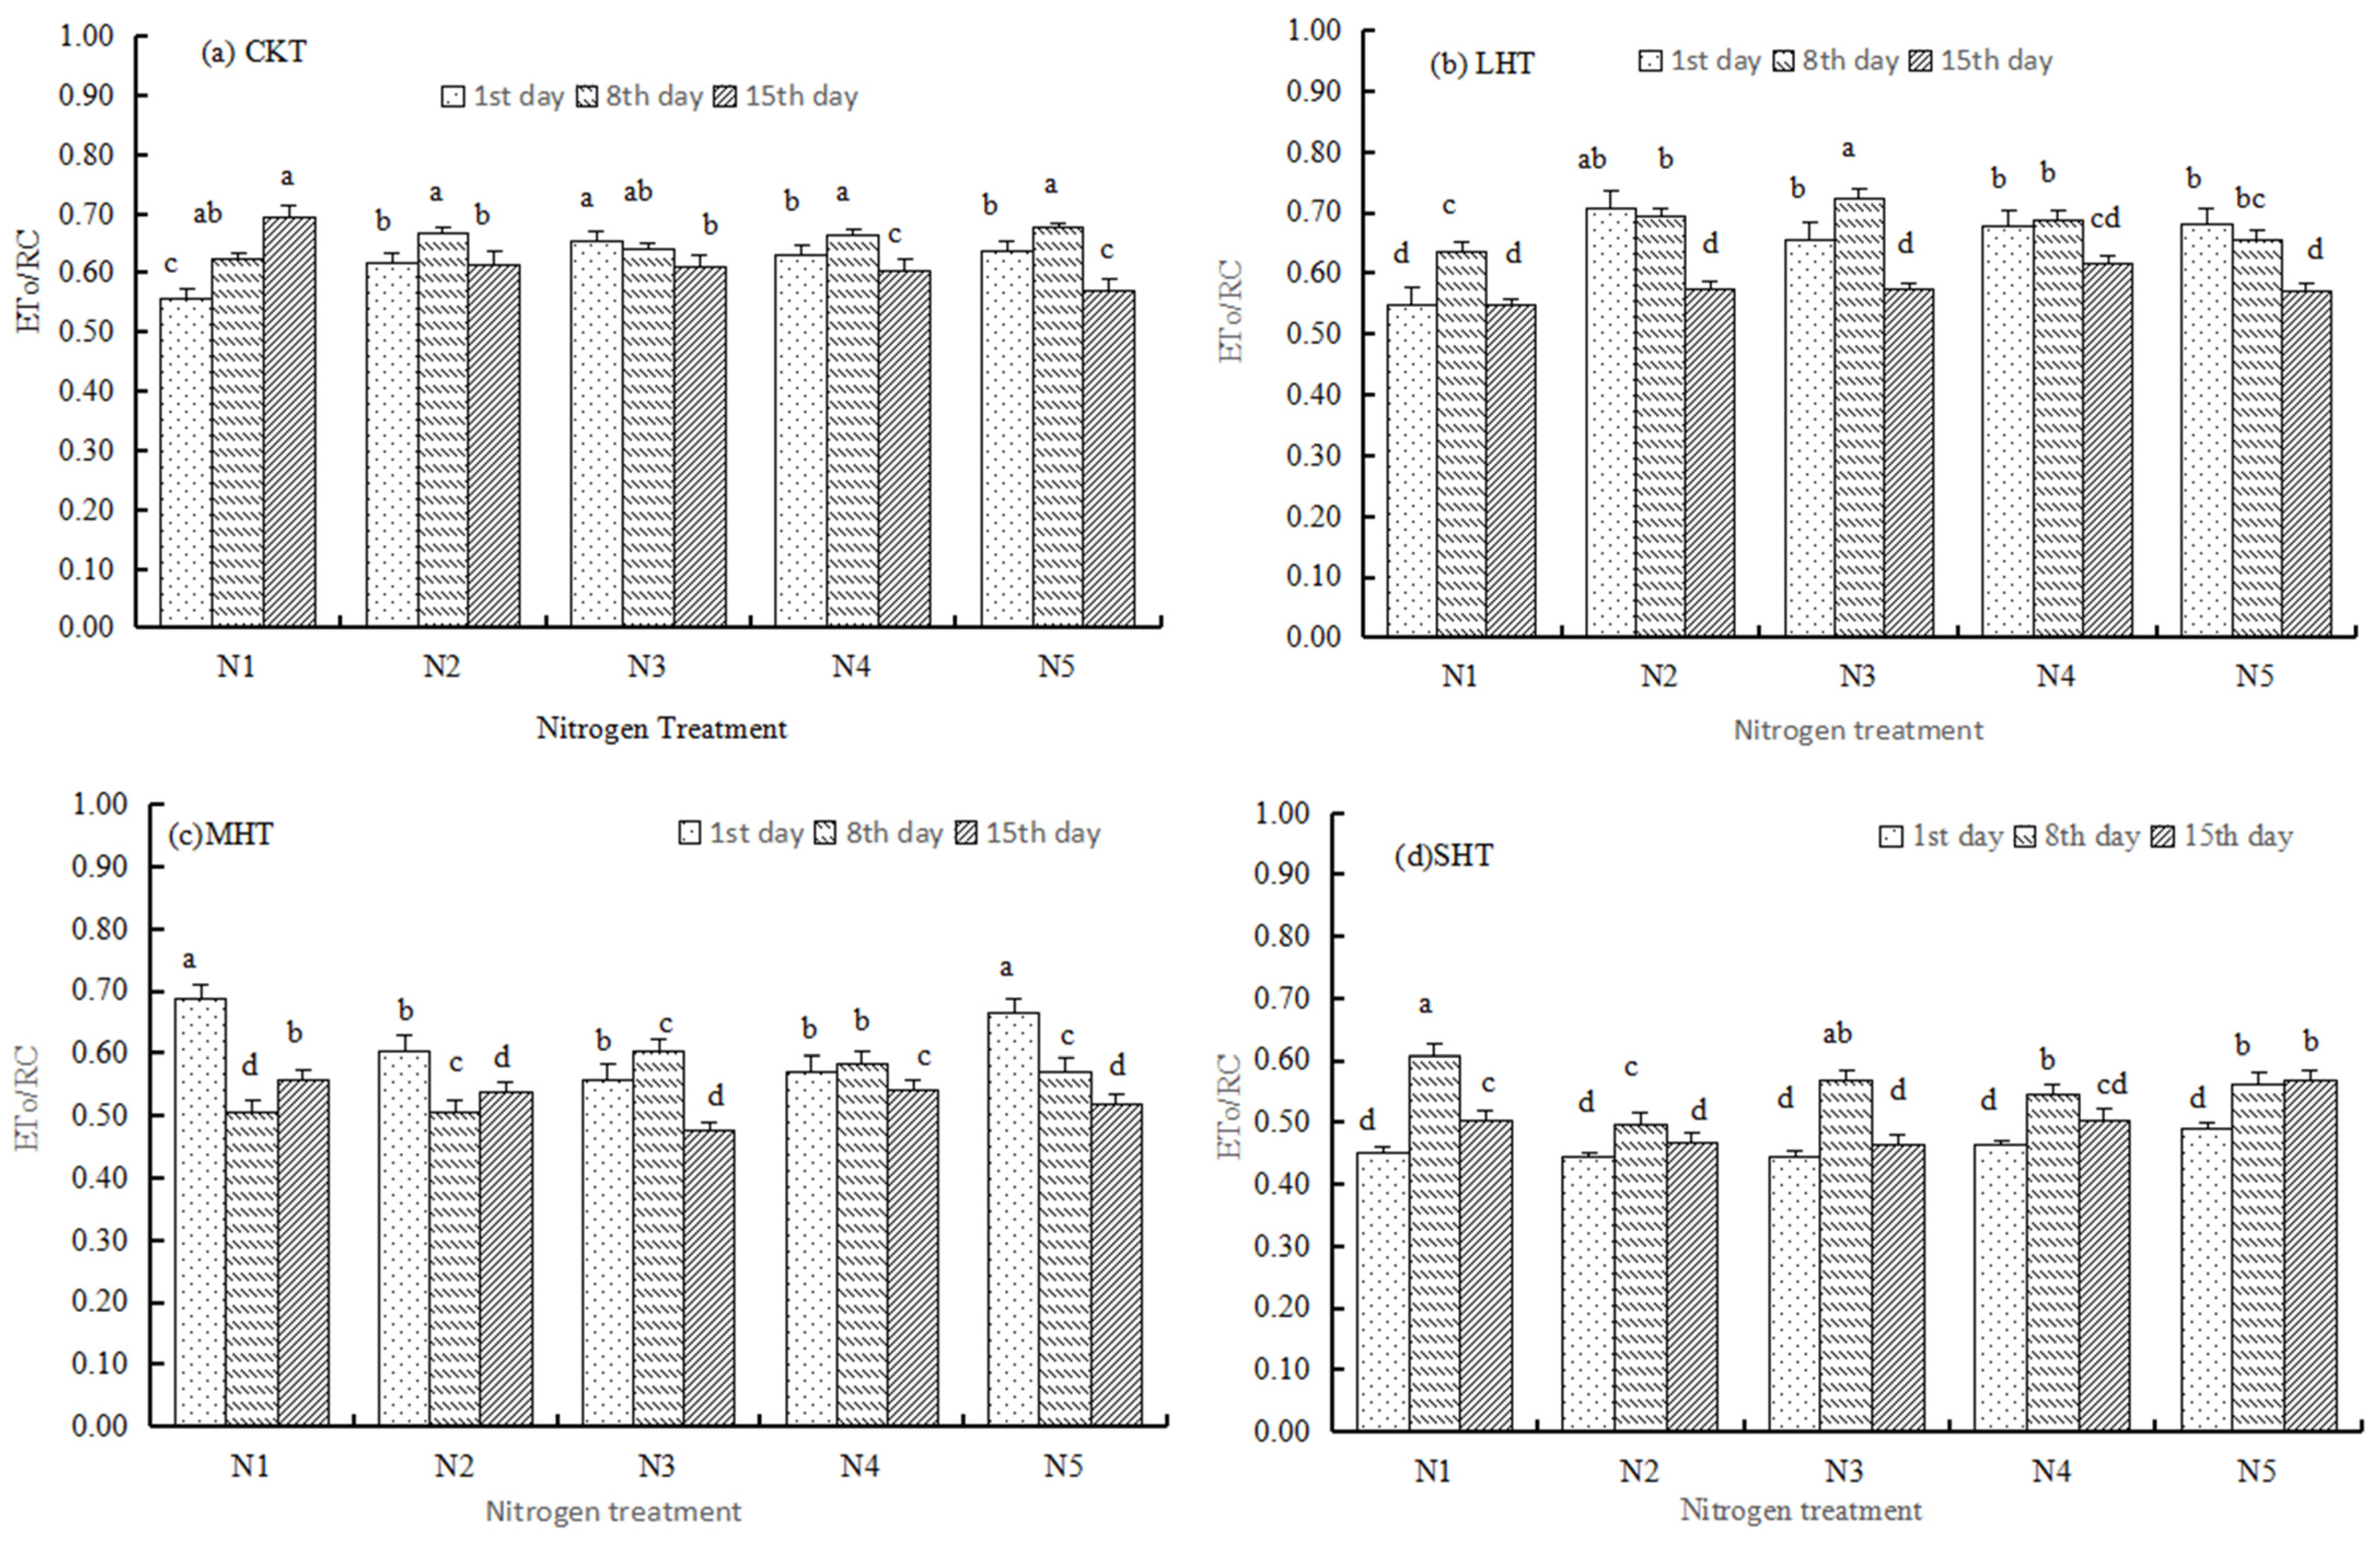
3.2.2. Specific Energy Fluxes
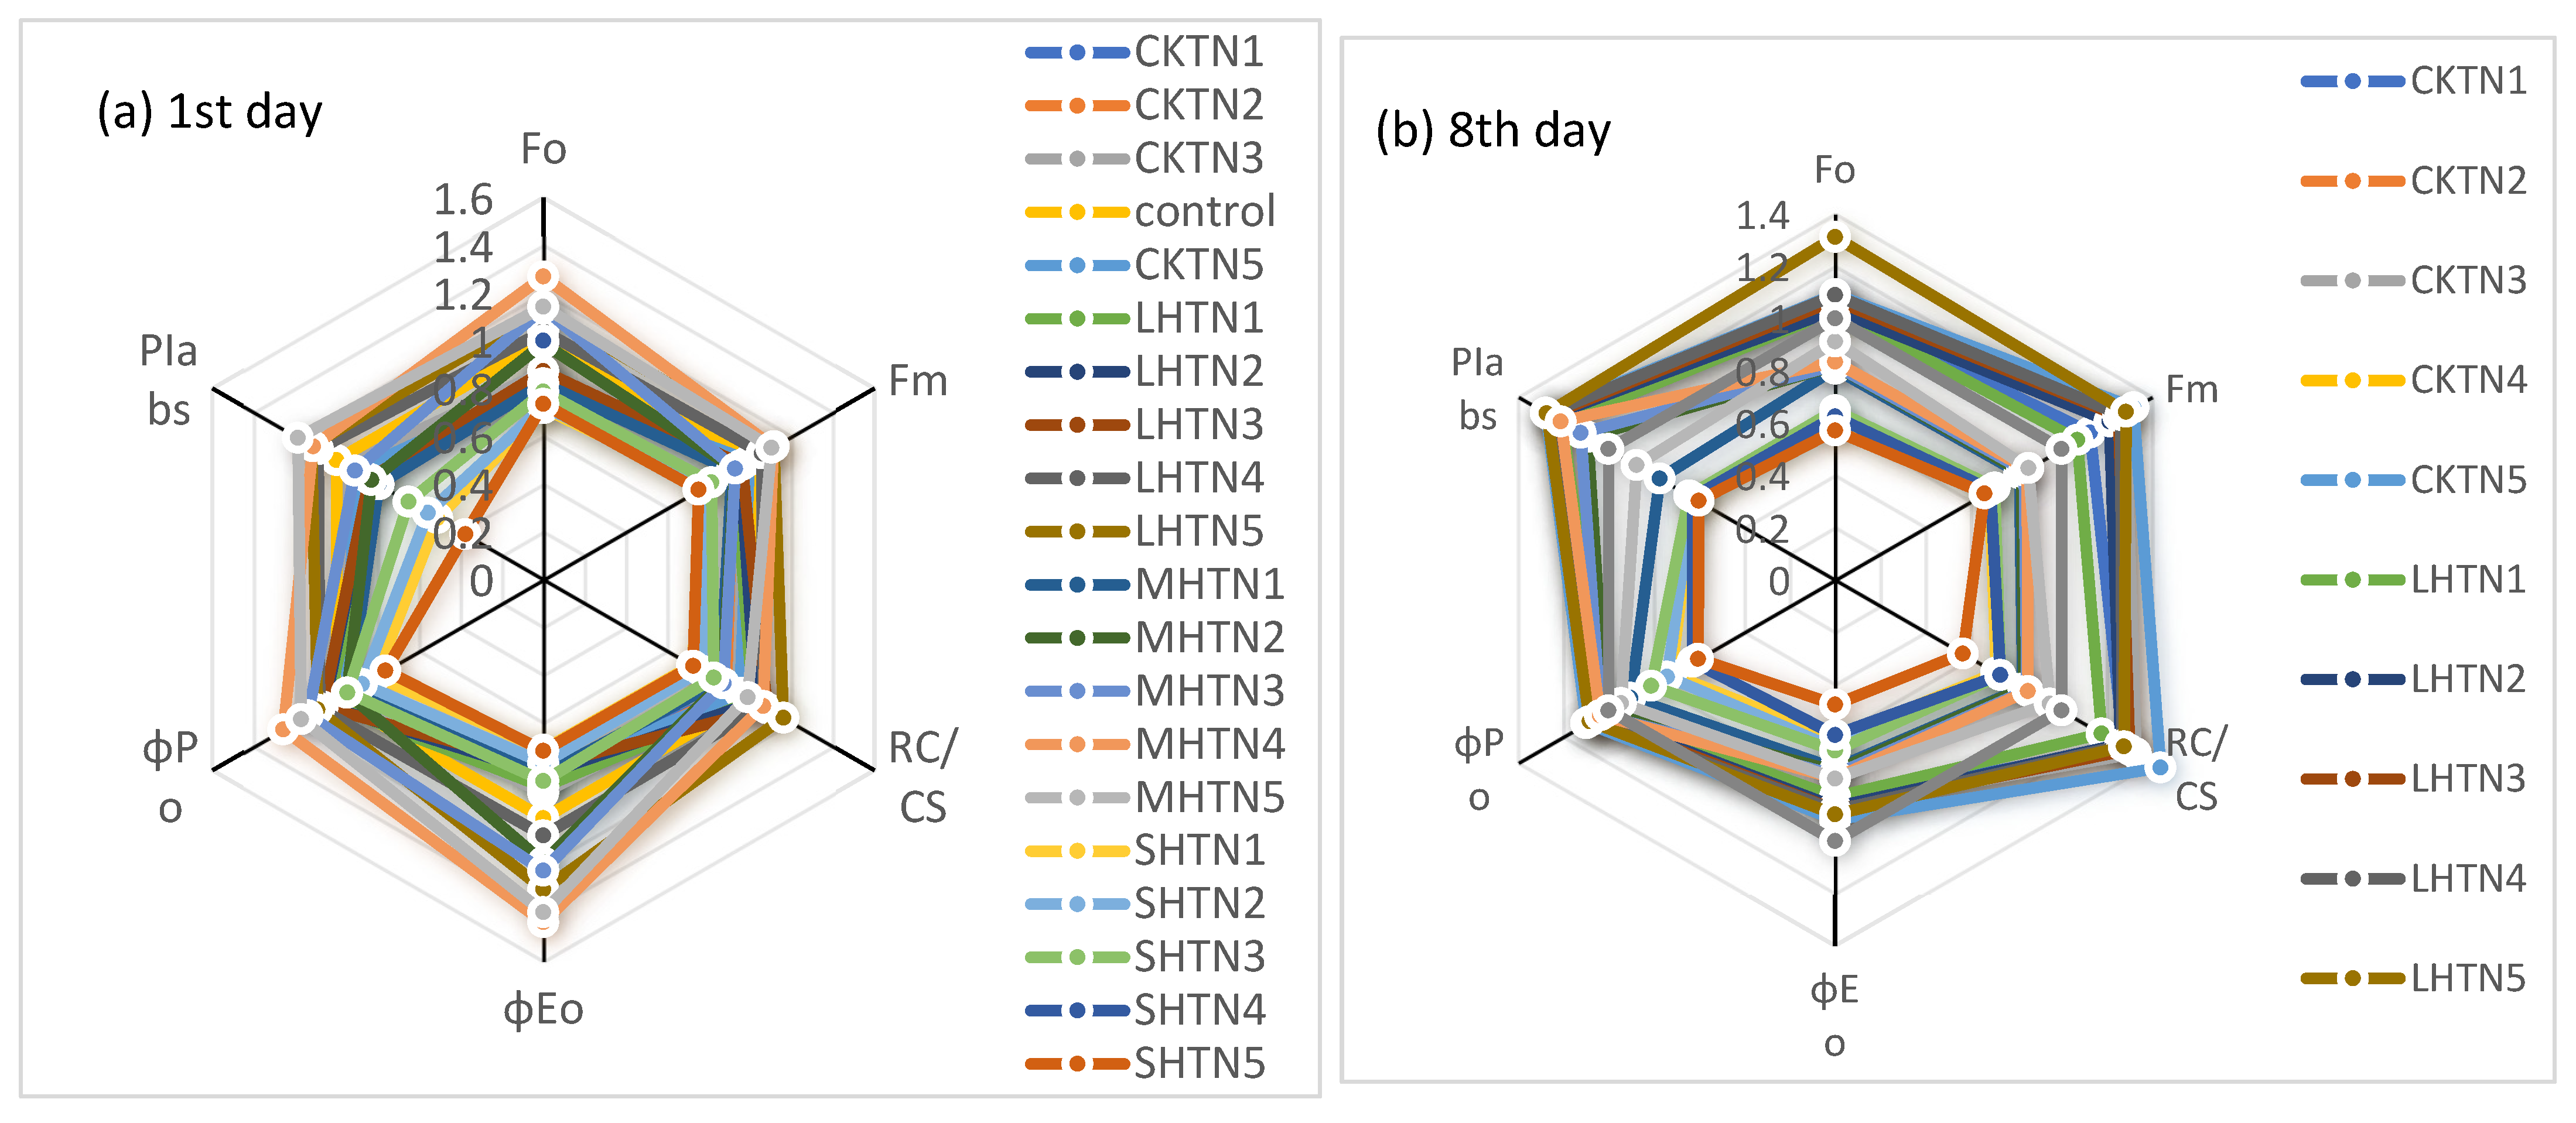
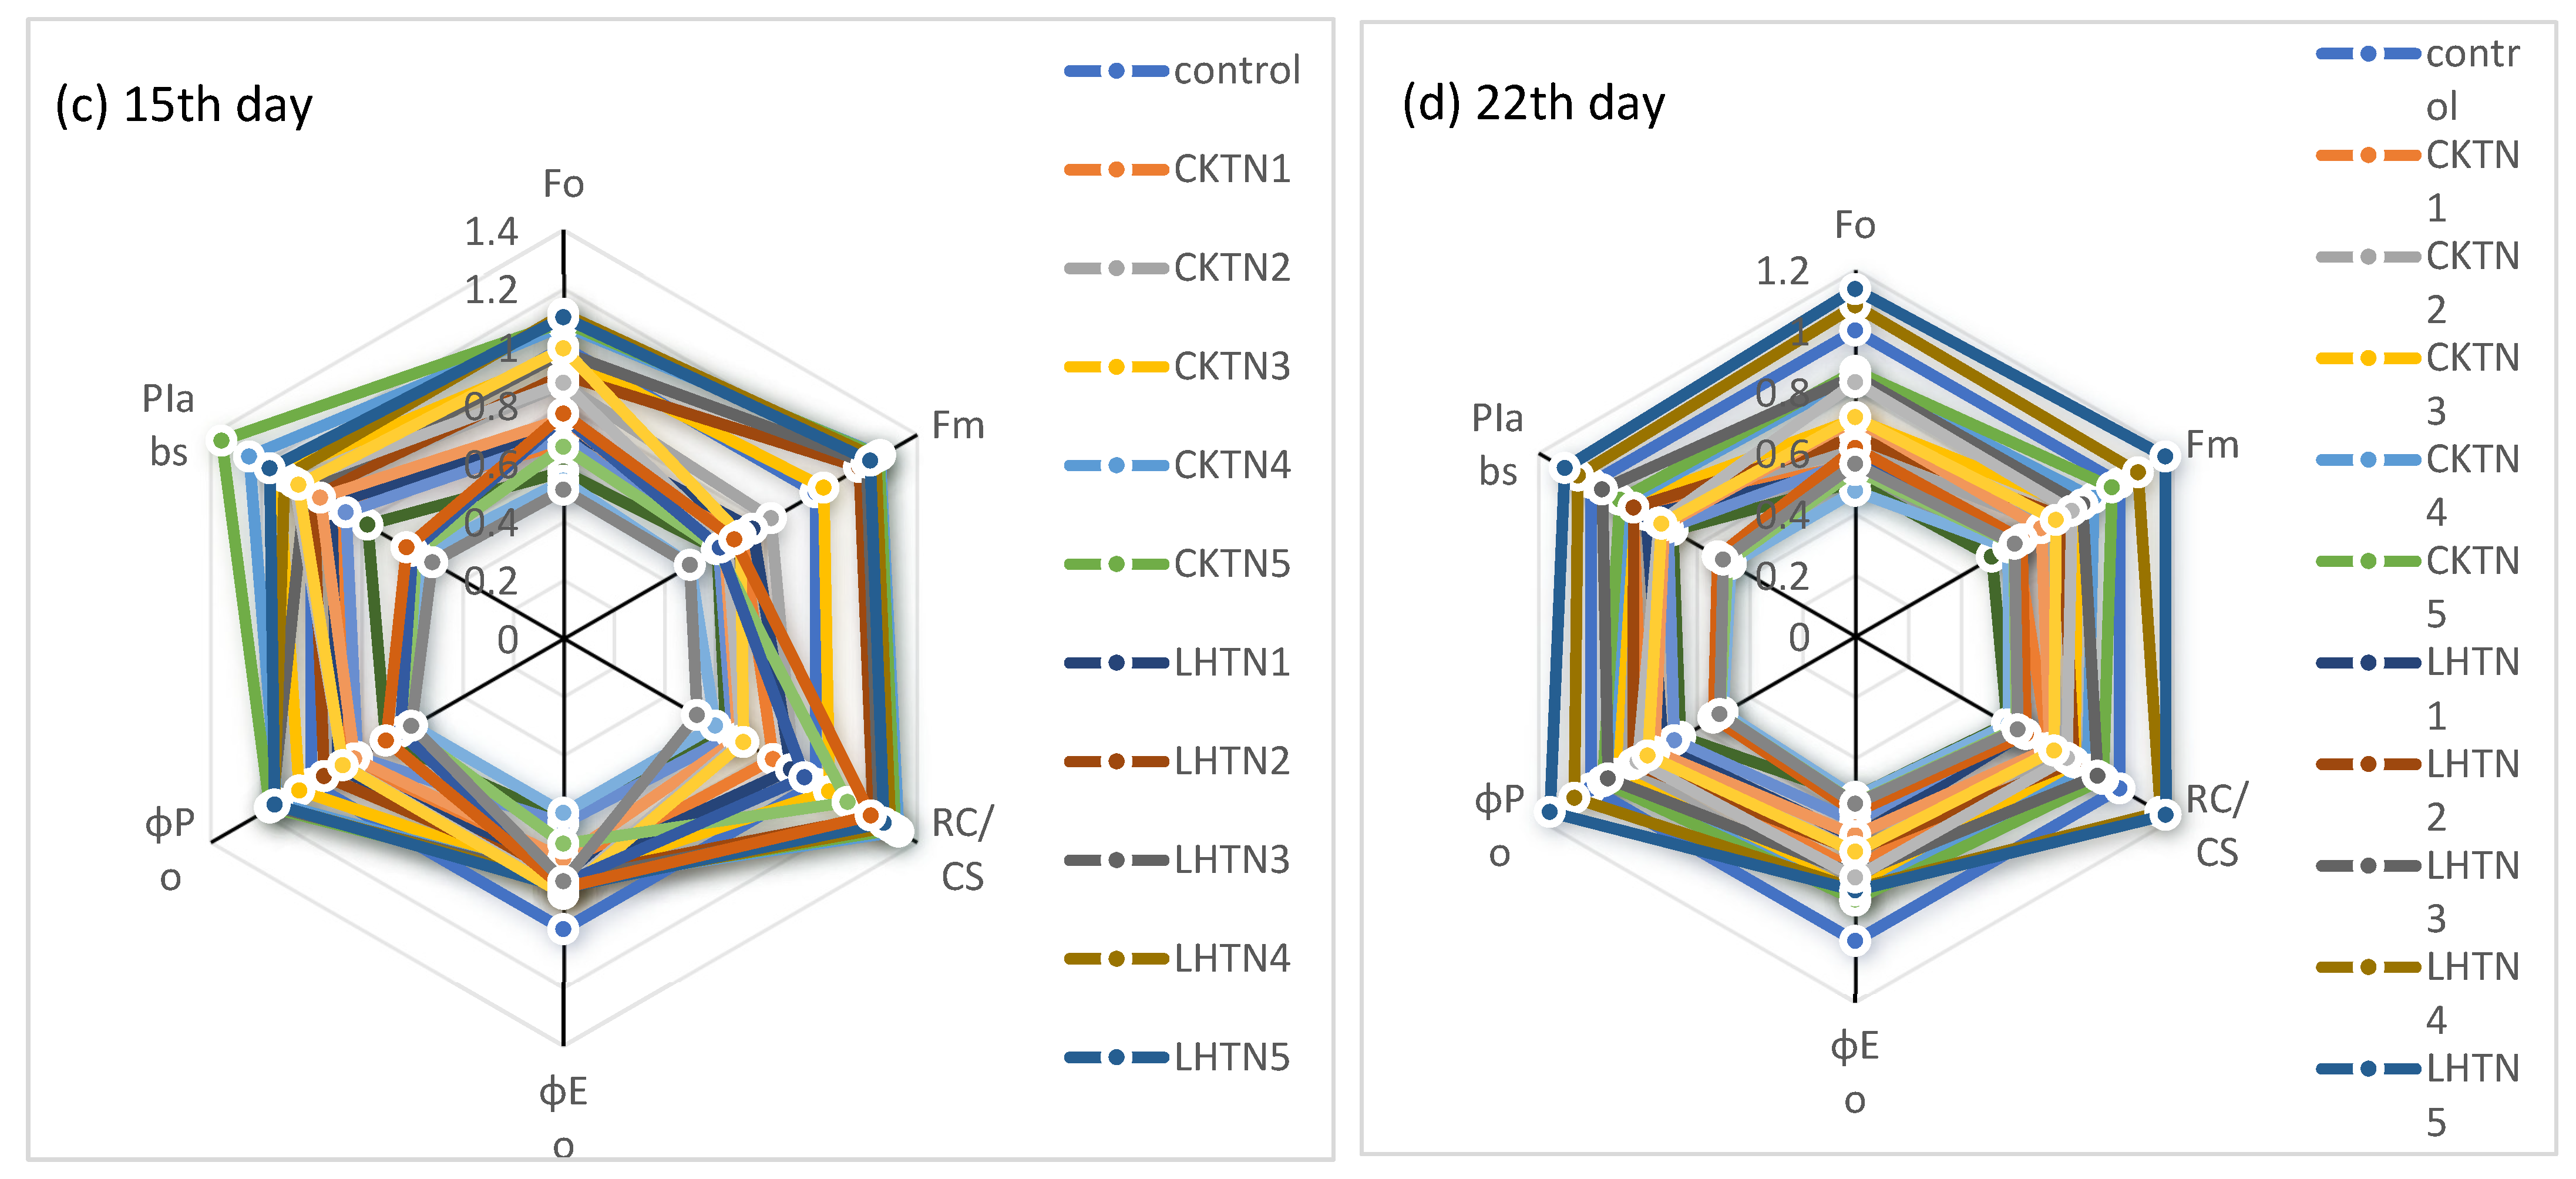
3.3. Performance Indexes
4. Discussion
5. Conclusions
Supplementary Materials
Author Contributions
Funding
Data Availability Statement
Acknowledgments
Conflicts of Interest
References
- Bertin, N. Analysis of the tomato fruit growth response to temperature and plant fruit load in relation to cell division, cell expansion and dna endoreduplication. Ann. Bot. 2005, 95, 439–447. [Google Scholar] [CrossRef] [PubMed]
- De Koning, A. Development and Dry Matter Distribution in Glasshouse Tomato: A Quantitative Approach. Doctoral dissertation, Wageningen Agricultural University, Wageningen, The Netherlands, 1994; pp. 102–240. [Google Scholar]
- Bertin, N.; Guichard, S.; Leonardi, C.; Longuenesse, J.J.; Langlois, D.; Navez, B. Seasonal evolution of the quality of fresh glasshouse tomatoes under Mediterranean conditions, as affected by vapor pressure deficit and plant fruit loads. Ann. Bot. 2000, 85, 741–750. [Google Scholar] [CrossRef]
- Zhang, Q.; Zhang, X.; Yang, Z.; Huang, Q.; Qiu, R. Characteristics of plastic greenhouse high-temperature and high-humidity events and their impacts on facility tomatoes growth. Front. Earth Sci. 2022, 10, 848924. [Google Scholar] [CrossRef]
- Gong, X.; Qiu, R.; Zhang, B.; Wang, S.; Ge, J.; Gao, S.; Yang, Z. Energy budget for tomato plants grown in a greenhouse in northern China. Agric. Water Manag. 2021, 255, 107039. [Google Scholar] [CrossRef]
- Xiao, F.; Yang, Z.; Han, W.; Li, Y.; Qiu, Y.; Sun, Q.; Zhang, F. Effects of day and night temperature on photosynthesis, antioxidant enzyme activities, and endogenous hormones in tomato leaves during the flowering stage. J. Hortic. Sci. Biotechnol. 2018, 93, 306–315. [Google Scholar] [CrossRef]
- Alsamir, M.; Mahmood, T.; Trethowan, R.; Ahmad, N. An overview of heat stress in tomato (Solanum lycopersicum L.). Saudi J. Biol. Sci. 2021, 28, 1654–1663. [Google Scholar] [CrossRef]
- Huang, H.; Han, Y.; Hao, J.; Qin, X.; Liu, C.; Fan, S. Exogenous spermidine modulates osmoregulatory substances and leaf stomata to alleviate the damage to lettuce seedlings caused by high temperature stress. J. Plant Growth Regul. 2023, 42, 1236–1255. [Google Scholar] [CrossRef]
- Berry, J.A.; Björkman, O. Photosynthetic response and adaptation to temperature in higher plants. Annu. Rev. Plant Physiol. 1980, 31, 491–543. [Google Scholar] [CrossRef]
- Salvucci, M.E.; Crafts-Brandner, S.J. Inhibition of photosynthesis by heat stress: The activation state of Rubisco as a limiting factor in photosynthesis. Physiol. Plant. 2004, 120, 179–186. [Google Scholar] [CrossRef]
- Kalaji, H.M.; Loboda, T. Photosystem II of barley seedlings under cadmium and lead stress. Plant Soil Environ. 2007, 53, 511. [Google Scholar] [CrossRef]
- Allakhverdiev, S.I.; Kreslavski, V.D.; Klimov, V.V.; Los, D.A.; Carpentier, R.; Mohanty, P. Heat stress: An overview of molecular responses in photosynthesis. Photosynth. Res. 2008, 98, 541–550. [Google Scholar] [CrossRef] [PubMed]
- Kalaji, H.M.; Schansker, G.; Ladle, R.J.; Goltsev, V.; Bosa, K.; Allakhverdiev, S.I.; Brestic, M.; Bussotti, F.; Calatayud, A.; Dąbrowski, P.; et al. Frequently asked questions about in vivo chlorophyll fluorescence: Practical issues. Photosynth. Res. 2014, 122, 121–158. [Google Scholar] [CrossRef] [PubMed]
- Kalaji, H.M.; Bąba, W.; Gediga, K.; Goltsev, V.; Samborska, I.A.; Cetner, M.D.; Dimitrova, S.; Piszcz, U.; Bielecki, K.; Karmowska, K.; et al. Chlorophyll fluorescence as a tool for nutrient status identification in rapeseed plants. Photosynth. Res. 2018, 136, 329–343. [Google Scholar] [CrossRef]
- Yamane, Y.; Kashino, Y.; Koike, H.; Satoh, K. Effects of high temperatures on the photosynthetic systems in spinach: Oxygen-evolving activities, fluorescence characteristics and the denaturation process. Photosynth. Res. 1998, 57, 51–59. [Google Scholar] [CrossRef]
- Zhou, R.; Wu, Z.; Wang, X.; Rosenqvist, E.; Wang, Y.; Zhao, T.; Ottosen, C.-O. Evaluation of temperature stress tolerance in cultivated and wild tomatoes using photosynthesis and chlorophyll fluorescence. Hortic. Environ. Biotechnol. 2018, 59, 499–509. [Google Scholar] [CrossRef]
- Essemine, J.; Govindachary, S.; Ammar, S.; Bouzid, S.; Carpentier, R. Enhanced sensitivity of the photosynthetic apparatus to heat stress in digalactosyl-diacylglycerol deficient Arabidopsis. Environ. Exp. Bot. 2012, 80, 16–26. [Google Scholar] [CrossRef]
- Brestic, M.; Zivcak, M.; Kalaji, H.M.; Carpentier, R.; Allakhverdiev, S.I. Photosystem II thermostability in situ: Environmentally induced acclimation and genotype-specific reactions in Triticum aestivum L. Plant Physiol. Biochem. 2012, 57, 93–105. [Google Scholar] [CrossRef]
- Strasser, R.J.; Tsimilli-Michael, M.; Srivastava, A. Analysis of the chlorophyll a fluorescence transient. In Chlorophyll a Fluorescence; Springer: Berlin, The Netherlands, 2004; pp. 321–362. [Google Scholar]
- Force, L.; Critchley, C.; van Rensen, J.J.S. New fluorescence parameters for monitoring photosynthesis in plants. Photosynth. Res. 2003, 78, 17–33. [Google Scholar] [CrossRef]
- Mehta, P.; Allakhverdiev, S.I.; Jajoo, A. Characterization of photosystem II heterogeneity in response to high salt stress in wheat leaves (Triticum aestivum L.). Photosynth. Res. 2010, 105, 249–255. [Google Scholar] [CrossRef]
- Baath, G.S.; Kakani, V.G.; Northup, B.K.; Gowda, P.H.; Rocateli, A.C.; Singh, H. Quantifying and Modeling the Influence of Temperature on Growth and Reproductive Development of Sesame. J. Plant Growth Regul. 2022, 41, 143–152. [Google Scholar] [CrossRef]
- James, D.; Borphukan, B.; Fartyal, D.; Ram, B. Concurrent overexpression of OsGS1; 1 and OsGS2 Genes in transgenic rice (Oryza sativa L.): Impact on tolerance to abiotic stresses. Front. Plant Sci. 2018, 9, 786–804. [Google Scholar] [CrossRef] [PubMed]
- Yang, J.; Shi, W.; Xiao, G.; Zhang, X.; Wang, D.; Xu, H.; Wu, J.; Yang, Z.; Lai, Y.; Duan, M.; et al. Optimum total nitrogen application is required to reduce the yield loss of hybrid rice to high temperature. Field Crops Res. 2022, 288, 108696. [Google Scholar] [CrossRef]
- Zhu, R.; Mu, Y.; Kang, J.; Zhao, J.; Wu, H. Effects of different nitrogen application rates on chlorophyll content and fluorescence characteristics of spring wheat with high temperature after anthesis. South. J. Agric. Sci. 2017, 48, 609–615. [Google Scholar]
- Jingjing, Z.D. Effect Mechanism of Different Nitrogen Application Rates on Yield Formation of Spring Wheat under High Temperature Stress after Anthesis. Ph.D. Thesis, Ningxia University, Ningxia, China, 2015. [Google Scholar]
- Dupont, F.M.; Hurkman, W.J.; Vensel, W.H.; Tanaka, C.; Kothari, K.M.; Chung, O.K.; Altenbach, S.B. Protein accumulation and composition in wheat grains: Effects of mineral nutrients and high temperature. Eur. J. Agron. 2006, 25, 96–107. [Google Scholar] [CrossRef]
- Zahedi, M.; Mcdonald, G.; Jenner, C.F. Nitrogen supply to the grain modifies the effects of temperature on starch and protein accumulation during grain filling in wheat. Aust. J. Agric. Res. 2004, 55, 551–564. [Google Scholar] [CrossRef]
- Leiming, Z.; Shangguan, Z.; Mingce, M.; Guirui, Y. Effects of long-term nitrogen application on chlorophyll fluorescence parameters of dryland wheat at grain filling stage. Chin. J. Appl. Ecol. 2003, 5, 695–698. [Google Scholar]
- Meiduo, M.; Yu, M.; Xiaohua, D.; Jingjing, Z.; Jianhong, K. Effects of different nitrogen application rates on the antioxidant properties of spring wheat under high temperature stress after flowering. Jiangsu Agric. Sci. 2017, 45, 52–56. [Google Scholar]
- Chunhua, G.; Bo, B.; Fang, C.; Shengdong, L.; Zongshuai, W.; Bin, Z.; Zheng, W.; Lingan, K.; Fahong, W. Effects of nitrogen application on accumulation, transport and yield of wheat assimilates under high temperature stress after flowering. China Agric. Sci. 2020, 53, 4365–4375. [Google Scholar]
- Changfu, R.; Anhe, C.; Baoguo, L. Physiological and biochemical basis of the effect of high temperature on flowering and fruiting of hybrid rice. J. Southwest Univ. (Nat. Sci. Ed.) 1990, 5, 440–443. [Google Scholar]
- Naiyao, M.D. Mitigation Effect and Physiological Mechanism of Nitrogen Fertilizer on High Temperature Stress in the Early Stage of Grain Filling in Rice. Ph.D. Thesis, Nanjing Agricultural University, Nanjing, China, 2016. [Google Scholar]
- Lin, W.; Zaiqiang, Y.; Mingtian, W.; Shiqiong, Y.; Xia, C.; Jie, Z. The effect of relative air humidity on the nutrient content and dry matter distribution of tomato seedlings under high temperature. Chin. J. Agric. Meteorol. 2018, 39, 304–313. [Google Scholar]
- Kazufumi, Z.; Kajiwara, S.; Matsuzoe, N. Chlorophyll a fluorescence OJIP transient as a tool to characterize and evaluate response to heat and chilling stress in tomato leaf and fruit. Sci. Hortic. 2012, 148, 39–46. [Google Scholar]
- Jiashuai, L.; Zaiqiang, Y.; Yongxiu, L. Establishment of critical nitrogen dilution curve model and nitrogen nutrition diagnosis of grapes under different water conditions. Chin. J. Agric. Meteorol. 2019, 40, 523–533. [Google Scholar]
- Tingting, W.; Zaiqiang, Y.; Lin, W. Hourly temperature simulation model in glass and plastic greenhouses. Chin. J. Agric. Meteorol. 2018, 39, 26–37. [Google Scholar]
- Shamsabad, M.R.; Esmaeilizadeh, M.; Roosta, H.R.; Dehghani, M.R.; Dąbrowski, P.; Kalaji, H.M. The effect of supplementary light on the photosynthetic apparatus of strawberry plants under salinity and alkalinity stress. Sci. Rep. 2022, 12, 13257. [Google Scholar] [CrossRef] [PubMed]
- Hanwant, S.; Kumar, D.; Soni, V. Impact of mercury on photosynthetic performance of Lemna minor: A chlorophyll fluorescence analysis. Sci. Rep. 2023, 13, 12181. [Google Scholar]
- Strasser, R.J. Merope Tsimilli-Michael, and Alaka Srivastava. Analysis of the chlorophyll a fluorescence transient. In Chlorophyll a Fluorescence: A Signature of Photosynthesis; Springer: Dordrecht, The Netherlands, 2004; pp. 321–362. [Google Scholar]
- Marečková, M.; Barták, M.; Hájek, J. Temperature effects on photosynthetic performance of Antarctic lichen Dermatocarpon polyphyllizum: A chlorophyll fluorescence study. Polar Biol. 2019, 42, 685–701. [Google Scholar] [CrossRef]
- Chen, L.-S.; Pengmin, L.; Cheng, L. Comparison of thermotolerance of sun-exposed peel and shaded peel of ‘Fuji’apple. Environ. Exp. Bot. 2009, 66, 110–116. [Google Scholar] [CrossRef]
- Camejo, D.; Nicolás, E.; Torres, W.; Alarcón, J.J. Differential heat-induced changes in the CO2 assimilation rate and electron transport in tomato (Lycopersicon esculentum Mill.). J. Hortic. Sci. Biotechnol. 2010, 85, 137–143. [Google Scholar] [CrossRef]
- Caffarri, S.; Tibiletti, T.; Jennings, R.C.; Santabarbara, S. A comparison between plant photosystem I and photosystem II architecture and functioning. Curr. Protein Pept. Sci. 2014, 15, 296–331. [Google Scholar] [CrossRef]
- Ogweno, J.O.; Zhou, Y.H.; Yu, J.Q. Changes in activities of antioxidant enzymes and photosynthesis in detached leaves of tomato after exposure to different temperatures. J. Hortic. Sci. 2009, 2, 124–137. [Google Scholar]
- Wahid, A.; Gelani, S.; Ashraf, M.; Foolad, M.R. Heat tolerance in plants: An overview. Environ. Exp. Bot. 2007, 61, 199–223. [Google Scholar] [CrossRef]
- Luo, J.; Yang, Z.; Zhang, F.; Li, C. Effect of nitrogen application on enhancing high-temperature stress tolerance of tomato plants during the flowering and fruiting stage. Front. Plant Sci. 2023, 14, 1172078. [Google Scholar] [CrossRef] [PubMed]
- Yuan, L.; Tang, L.; Zhu, S.; Hou, J.; Chen, G.; Liu, F.; Liu, S.; Wang, C. Influence of heat stress on leaf morphology and nitrogen–carbohydrate metabolisms in two wucai (Brassica campestris L.) genotypes. Acta Soc. Bot. Pol. 2017, 86. [Google Scholar] [CrossRef]
- Sonal, M.; Allakhverdiev, S.I.; Jajoo, A. Analysis of high temperature stress on the dynamics of antenna size and reducing side heterogeneity of Photosystem II in wheat leaves (Triticum aestivum L.). Biochim. Et Biophys. Acta (BBA)-Bioenerg. 2011, 1807, 22–29. [Google Scholar]
- Zhou, R.; Yu, X.; Kjær, K.H.; Rosenqvist, E.; Ottosen, C.O.; Wu, Z. Screening and validation of tomato genotypes under heat stress using Fv/Fm to reveal the physiological mechanism of heat tolerance. Environ. Exp. Bot. 2015, 118, 1–11. [Google Scholar]
- Chen, S.; Yang, J.; Zhang, M.; Strasser, R.J.; Qiang, S. Classification and characteristics of heat tolerance in Ageratina adenophora populations using fast chlorophyll a fluorescence rise OJIP. Environ. Exp. Bot. 2016, 122, 126–140. [Google Scholar]
- Murkowski, A. Heat stress and spermidine: Effect on chlorophyll fluorescence in tomato plants. Biol. Plant. 2001, 44, 53–57. [Google Scholar]
- Cui, L.J.; Li, J.L.; Fan, Y.M.; Xu, S.; Zhang, Z. High temperature effects on photosynthesis, PSII functionality and antioxidant activity of two Festuca arundinacea cultivars with different heat susceptibility. Bot. Stud. 2006, 47, 61–69. [Google Scholar]
- Kadir, S.; Von, W.M.; Al, K.K. Photochemical efficiency and recovery of photosystem II in grapes after exposure to sud-den and gradual heat stress. J. Am. Soc. Hortic. Sci. 2007, 132, 764–769. [Google Scholar]
- Luo, H.B.; Ma, L.; Xi, H.F.; Duan, W.; Li, S.H.; Loescher, W.; Wang, J.F.; Wang, L.J. Photosynthetic responses to heat treatments at different temperatures and following recovery in grapevine (Vitis amurensis L.) leaves. PLoS ONE 2011, 6, e23033. [Google Scholar]
- Petkova, V.; Denev, I.D.; Cholakov, D.; Porjazov, I. Field screening for heat tolerant common bean cultivars (Phaseolus vulgaris L.) by measuring of chlorophyll fluorescence inductionparameters. Sci. Hortic. 2007, 111, 101–106. [Google Scholar]


| Nitrogen Treatment (g·Plant−1) | High Temperature Treatment (Day/Night) | |||
|---|---|---|---|---|
| CKT (25 °C/15 °C) | LHT (30 °C/20 °C) | MHT (35 °C/25 °C) | SHT (40 °C/30 °C) | |
| N1: 0N (0 g·plant−1) | CKTN1 | LHTN1 | MHTN1 | SHTN1 |
| N2: 0.5N (1.3 g·plant−1) | CKTN2 | LHTN2 | MHTN2 | SHTN2 |
| N3: 0.75N (1.95 g·plant−1) | CKTN3 | LHTN3 | MHTN3 | SHTN3 |
| N4: 1N (2.6 g·plant−1,CKN4) | CKTN4 | LHTN4 | MHTN4 | SHTN4 |
| N5: 1.25N (3.25 g·plant−1) | CKTN5 | LHTN5 | MHTN5 | SHTN5 |
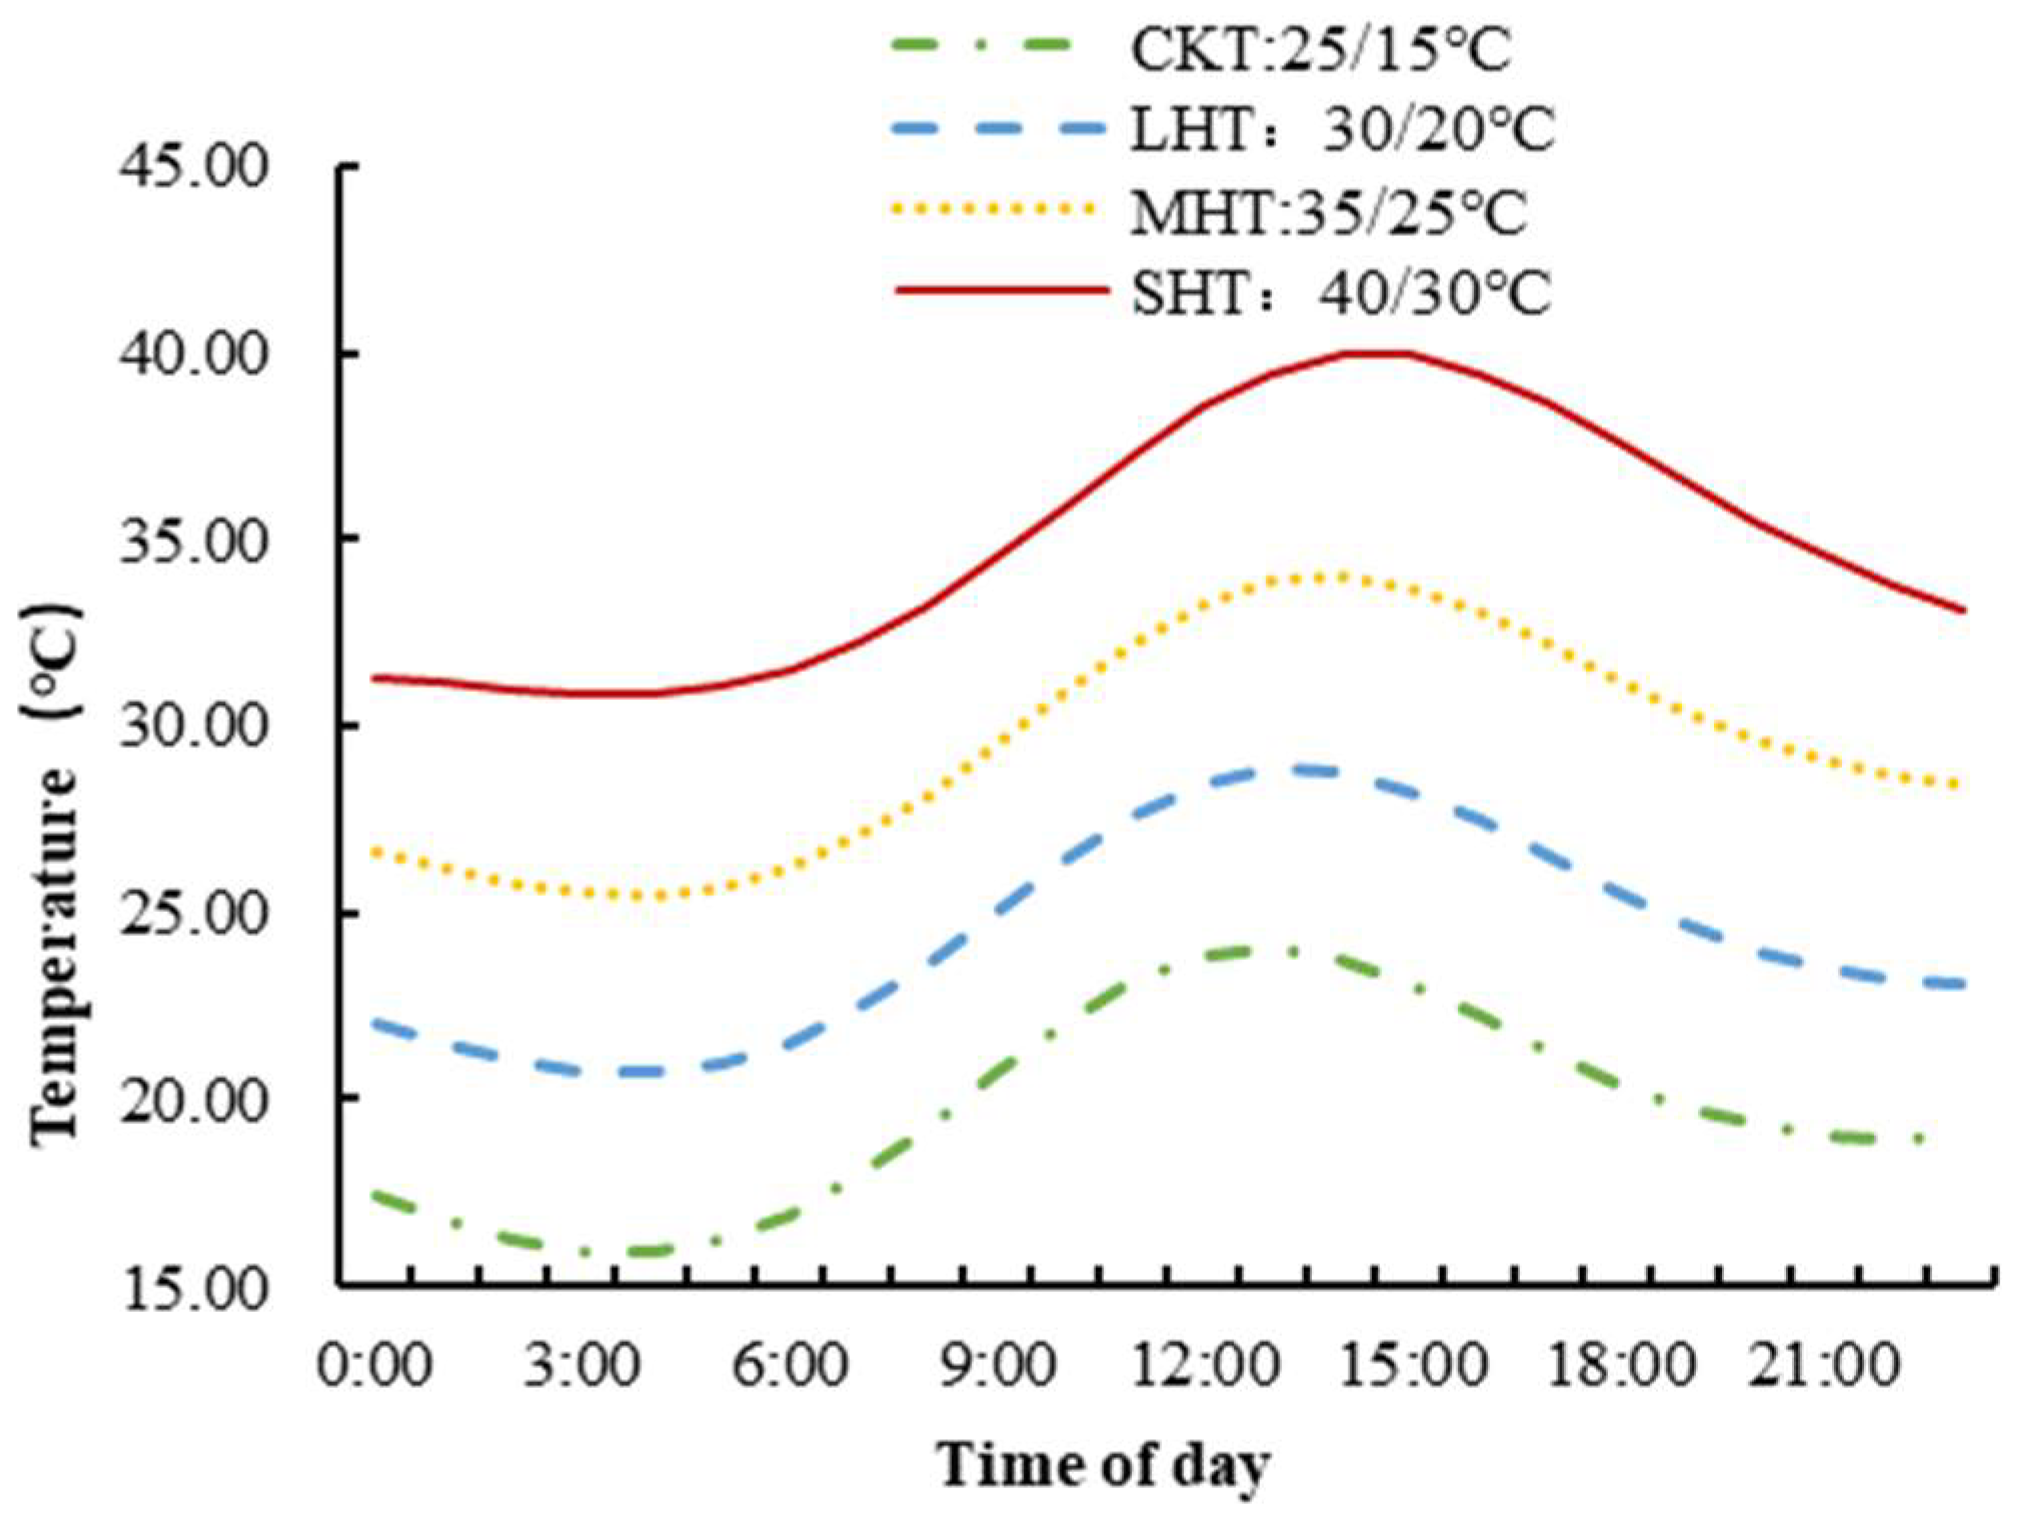
| Time of day | 0:00 | 1:00 | 2:00 | 3:00 | 4:00 | 5:00 | 6:00 | 7:00 | 8:00 | 9:00 | 10:00 | 11:00 |
| PAR (μmol m−2 s−1) | 0 | 0 | 0 | 0 | 0 | 0 | 600 | 700 | 800 | 800 | 800 | 1000 |
| Relative humidity (%) | 67 | 66 | 68 | 69 | 71 | 73 | 73 | 74 | 70 | 65 | 65 | 65 |
| Time of day | 12:00 | 13:00 | 14:00 | 15:00 | 16:00 | 17:00 | 18:00 | 19:00 | 20:00 | 21:00 | 22:00 | 23:00 |
| PAR (μmol m−2 s−1) | 1000 | 1000 | 1000 | 800 | 800 | 700 | 600 | 0 | 0 | 0 | 0 | 0 |
| Relative humidity (%) | 65 | 65 | 65 | 65 | 66 | 67 | 71 | 72 | 72 | 72 | 73 | 74 |
| Fluorescence Parameters | Sample Period | Treatments | ||||
|---|---|---|---|---|---|---|
| CKTN1 | CKTN2 | CKTN3 | CKTN4 | CKTN5 | ||
| RD-1 | 13,007 ± 375 g | 17,267 ± 498 a | 17,273 ± 499 a | 16,578 ± 478 ab | 17,005 ± 490 ab | |
| RD-8 | 12,235 ± 353 ef | 16,143 ± 466 bcd | 16,039 ± 463 bcd | 15,638 ± 451 bcd | 16,999 ± 490 ab | |
| RD-15 | 10,107 ± 291 gh | 6473 ± 186 j | 9768 ± 281 h | 11,003 ± 317 efg | 11,733 ± 338 ef | |
| RD-1 | 0.79 ± 0.023 ab | 0.82 ± 0.024 ab | 0.82 ± 0.024 ab | 0.82 ± 0.024 ab | 0.83 ± 0.024 a | |
| RD-8 | 0.77 ± 0.022 a | 0.80 ± 0.023 a | 0.81 ± 0.024 a | 0.80 ± 0.023 a | 0.81 ± 0.024 a | |
| RD-15 | 0.73 ± 0.021 bcd | 0.59 ± 0.017 e | 0.67 ± 0.019 d | 0.70 ± 0.020 cd | 0.74 ± 0.021 abc | |
| 1st day | 3.73 ± 0.108 hi | 4.60 ± 0.133 abc | 4.67 ± 0.135 ab | 4.56 ± 0.132 abc | 4.77 ± 138 a | |
| RD-8 | 3.38 ± 0.097 g | 4.10 ± 0.118 cde | 4.42 ± 0.127 abc | 4.16 ± 0.120 cde | 4.4 ± 0.127 abc | |
| RD-15 | 2.69 ± 0.078 ef | 1.46 ± 0.042 h | 2.06 ± 0.059 g | 2.77 ± 0.079 def | 2.98 ± 0.086 d | |
| Fluorescence Parameters | Sample Period | Treatments | ||||
| LHTN1 | LHTN2 | LHTN3 | LHTN4 | LHTN5 | ||
| RD-1 | 14,012 ± 404 efg | 16,385 ± 472 bcd | 16,918 ± 488 ab | 16,487 ± 475 abc | 16,336 ± 471 bcd | |
| RD-8 | 11,471 ± 331 f | 15,032 ± 433 cd | 15,585 ± 449 bcd | 17,805 ± 513 a | 16,445 ± 474 bc | |
| RD-15 | 10,210 ± 294 gh | 8285 ± 239 i | 13,903 ± 401 bc | 11,729 ± 338 ef | 13,842 ± 399 bc | |
| RD-1 | 0.79 ± 0.023 ab | 0.82 ± 0.024 ab | 0.82 ± 0.024 ab | 0.83 ± 0.024 a | 0.82 ± 0.024 ab | |
| RD-8 | 0.77 ± 0.022 a | 0.80 ± 0.023 a | 0.80 ± 0.023 a | 0.82 ± 0.024 a | 0.81 ± 0.024 a | |
| RD-15 | 0.74 ± 0.021 bcd | 0.67 ± 0.020 d | 0.77 ± 0.022 ab | 0.73 ± 0.021 bcd | 0.77 ± 0.022 ab | |
| RD-1 | 3.90 ± 0.113 ghi | 4.57 ± 0.132 abc | 4.56 ± 0.132 abc | 4.74 ± 0.137 a | 4.64 ± 0.134 ab | |
| RD-8 | 3.34 ± 0.167 g | 4.08 ± 0.096 cde | 3.98 ± 0.117 def | 4.56 ± 0.131 ab | 4.39 ± 0.126 bc | |
| RD-15 | 2.78 ± 0.080 def | 2.02 ± 0.058 g | 3.40 ± 0.098 abc | 2.76 ± 0.079 def | 3.35 ± 0.096 bc | |
| Fluorescence Parameters | Sample Period | Treatments | ||||
| MHTN1 | MHTN2 | MHTN3 | MHTN4 | MHTN5 | ||
| RD-1 | 10,905 ± 314 h | 15,067 ± 434 cde | 15,959 ± 460 bcd | 16,020 ± 462 bcd | 13,635 ± 393 fg | |
| RD-8 | 11,479 ± 331 f | 13,506 ± 389 e | 12,303 ± 355 ef | 14,851 ± 428 d | 15,934 ±459 bcd | |
| RD-15 | 10,614 ± 306 gh | 12,895 ± 372 cd | 12,056 ± 348 de | 10,697 ± 308 fgh | 10,080 ± 290 gh | |
| RD-1 | 0.78 ± 0.023 ab | 0.80 ± 0.023 ab | 0.82 ± 0.024 ab | 0.82 ± 0.024 ab | 0.74 ± 0.021 b | |
| RD-8 | 0.80 ± 0.022 a | 0.79 ± 0.022 a | 0.77 ± 0.023 a | 0.79 ± 0.023 a | 0.81 ± 0.023 a | |
| RD-15 | 0.78 ± 0.022 ab | 0.75 ± 0.022 abc | 0.78 ± 0.022 ab | 0.69 ± 0.020 cd | 0.72 ± 0.021 bcd | |
| RD-1 | 3.63 ± 0.105 i | 4.08 ± 0.112 fgh | 4.45 ± 0.129 bcd | 4.52 ± 0.131 abc | 3.27 ± 0.094 j | |
| RD-8 | 3.91 ± 0.113 ef | 3.86 ± 0.112 ef | 3.69 ± 0.106 fg | 3.86 ± 0.111 ef | 4.30 ± 0.124 bcd | |
| RD-15 | 3.45 ± 0.099 abc | 2.94 ± 0.084 de | 3.57 ± 0.103 bc | 2.57 ± 0.074 f | 2.53 ± 0.073 f | |
| Fluorescence Parameters | Sample Period | Treatments | ||||
| SHTN1 | SHTN2 | SHTN3 | SHTN4 | SHTN5 | ||
| RD-1 | 15,761 ± 454 bcd | 16,604 ± 479 ab | 14,961 ± 431 def | 15,602 ± 450 cd | 13,852 ± 399 efg | |
| RD-8 | 13,220 ± 381 e | 16,260 ± 469 bcd | 15,840 ± 457 bcd | 16,586 ± 478 ab | 16,206 ± 467 bcd | |
| RD-15 | 11,826 ± 341 e | 13,133 ± 379 c | 13,880 ± 400 bc | 14,284 ± 412 b | 16,098 ± 292 a | |
| RD-1 | 0.81 ± 0.023 ab | 0.82 ± 0.024 ab | 0.80 ± 0.023 ab | 0.81 ± 0.023 ab | 0.79 ± 0.023 ab | |
| RD-8 | 0.77 ± 0.022 a | 0.83 ± 0.024 a | 0.79 ± 0.024 a | 0.80 ± 0.023 a | 0.80 ± 0.023 a | |
| RD-15 | 0.77 ± 0.022 ab | 0.75 ± 0.022 abc | 0.79 ± 0.022 ab | 0.77 ± 0.022 ab | 0.80 ± 0.023 a | |
| RD-1 | 4.20 ± 0.121 efg | 4.59 ± 0.133 abc | 4.08 ± 0.118 fgh | 4.29 ± 0.124 cde | 3.83 ± 0.111 ghi | |
| RD-8 | 3.40 ± 0.098 g | 4.77 ± 0.137 a | 3.87 ± 0.112 ef | 4.06 ± 0.117 def | 3.92 ± 0.113 ef | |
| RD-15 | 3.34 ± 0.096 bc | 3.27 ± 0.094 c | 3.67 ± 0.105 b | 3.6 ± 0.103 bc | 4.11 ± 0.118 a | |
| Sample Period | Source | df | ABS/RC | |||||||||
|---|---|---|---|---|---|---|---|---|---|---|---|---|
| RD-1 | High Temperature (HT) | 4 | ** | ** | ** | ** | ** | ** | ** | ** | ** | ** |
| Nitrogen (N) | 5 | * | NS | NS | NS | NS | ** | NS | NS | * | ** | |
| HT × N | 20 | ** | ** | ** | * | * | ** | * | * | ** | ** | |
| RD-8 | High Temperature (HT) | 4 | NS | * | ** | * | * | * | * | * | ** | ** |
| Nitrogen (N) | 5 | NS | ** | ** | * | * | ** | * | * | * | NS | |
| HT × N | 20 | NS | NS | NS | NS | NS | NS | NS | NS | * | ** | |
| RD-15 | High Temperature (HT) | 4 | * | ** | ** | ** | ** | ** | ** | ** | ** | ** |
| Nitrogen (N) | 5 | * | ** | ** | ** | ** | ** | ** | ** | ** | NS | |
| HT × N | 20 | * | * | ** | ** | ** | ** | ** | ** | ** | ** |
Disclaimer/Publisher’s Note: The statements, opinions and data contained in all publications are solely those of the individual author(s) and contributor(s) and not of MDPI and/or the editor(s). MDPI and/or the editor(s) disclaim responsibility for any injury to people or property resulting from any ideas, methods, instructions or products referred to in the content. |
© 2023 by the authors. Licensee MDPI, Basel, Switzerland. This article is an open access article distributed under the terms and conditions of the Creative Commons Attribution (CC BY) license (https://creativecommons.org/licenses/by/4.0/).
Share and Cite
Li, C.; Yang, Z.; Zhang, C.; Luo, J.; Jiang, N.; Zhang, F.; Zhu, W. Heat Stress Recovery of Chlorophyll Fluorescence in Tomato (Lycopersicon esculentum Mill.) Leaves through Nitrogen Levels. Agronomy 2023, 13, 2858. https://doi.org/10.3390/agronomy13122858
Li C, Yang Z, Zhang C, Luo J, Jiang N, Zhang F, Zhu W. Heat Stress Recovery of Chlorophyll Fluorescence in Tomato (Lycopersicon esculentum Mill.) Leaves through Nitrogen Levels. Agronomy. 2023; 13(12):2858. https://doi.org/10.3390/agronomy13122858
Chicago/Turabian StyleLi, Chunying, Zaiqiang Yang, Chunlong Zhang, Jing Luo, Nan Jiang, Fengyin Zhang, and Wangsheng Zhu. 2023. "Heat Stress Recovery of Chlorophyll Fluorescence in Tomato (Lycopersicon esculentum Mill.) Leaves through Nitrogen Levels" Agronomy 13, no. 12: 2858. https://doi.org/10.3390/agronomy13122858