Article

Complex Spectroscopic Study for Fusarium Genus Fungi Infection Diagnostics of “Zalp” Cultivar Oat

1
Center for Optical and Laser Materials Research, St. Petersburg State University, Ulianovskaya 5, 198504 St. Petersburg, Russia
2
Institute of Chemistry, St. Petersburg State University, Universitetskii pr. 26, 198504 St. Petersburg, Russia
3
Federal Scientific Agro-Engineering Center VIM, 1st Institutskiy Proezd 5, 109428 Moscow, Russia
*
Author to whom correspondence should be addressed.
Agronomy 2021, 11(12), 2402; https://doi.org/10.3390/agronomy11122402
Submission received: 10 October 2021 / Revised: 19 November 2021 / Accepted: 20 November 2021 / Published: 25 November 2021

Abstract

:
At present, one of the critical problems in agriculture is the identification of cereals, including oats, infected by Fusarium spp. genus fungi. Timely diagnostics can prevent the further disease spread and help to identify the already stored infected grains. In this regard, the aim of this work is to develop the spectroscopic approaches that determine the infected grains. As an object of the investigation the “Zalp” cultivar oat, both healthy and infected grains of the 2020 harvest were chosen. The spectroscopic diagnostics included FTIR in the mid-IR region, Raman, and luminescence methods. Combination of chemometric tools with FTIR and Raman spectroscopy allowed obtaining approaches based on identified characteristic spectral features which may be used as infection markers. These approaches make it possible to detect the infection on the grain husk. The carotenoid type fungi pigment was identified within the resonance conditions of Raman scattering excitation. The luminescence study of infected oat husk revealed the presence of characteristic chlorophyll α peak which is absent in healthy grain husk.

1. Introduction

In recent years, an increasing attention has been paid to the development of methods for non-contact and non-invasive diagnostics of biological impact on grown crops. Oats (Avena sativa L. ) are one of the most important grain crops cultivated in northern European countries. It is used for livestock feed (forage purposes), food production (oatmeal, bran, beverages), as well as for industrial purposes, e.g., obtaining cellulose fiber from husks [1].
Fungi infection leads to a damage of cultivated cereals, a decrease in crop yields and further spread of disease to the surrounding areas. Infection by the genus Fusarium fungi takes special place among the oat diseases. The content of more than 10% of total mass of grains affected by Fusarium automatically excludes the possibility of its use in food, sowing, breeding and production. Fusarium causes the damage to the grain endosperm, resulting in the starch and partly fiber destruction, the protein decay with the release of ammonia (NH3). One of the main difficulties connected with the Fusarium fungi infection is that this disease does not always manifest itself visually.
Another problem with Fusarium fungi infection relates to the trichothecenes toxins which are generated and accumulated by its species and are hazardous for humans and animals [2,3,4]. In particular, widely spread deoxynivalenol (DON) and T-2 toxins (resistant to high temperatures up to 280–300 °C) are produced by F. graminearum, F. crookwellense, F. culmorum and F. sporotrichioides, F. poae, F. tricinctum respectively [2,5]. The T-2 toxin inhibit RNA and DNA synthesis, induce apoptosis, affect gene expression, exhibit immunosuppressive effects, and damage or destroy cells in vivo and in vitro. The Fusarium fungi infection is a significant object for research due to its aggressive biological influence on oats, consisting in the rapid sporulation and the mycotoxins production.
In this regard, an important task arises to control the grown grain quality, as well as to detect disease at the earliest possible stage. The most traditional method used to identify the damage by Fusarium infection consists of the fungus cultivation and its morphology analysis. However, this technique is time-consuming, laborious, and rather complicated due to the simultaneous molding and bacterial growth [6]. Alternatively, some methods are aimed at identifying the mycotoxins produced by the fungus, e.g., chromatography and polymerase chain reaction (PCR) analysis [6,7]. Also, several precision methods are based on the DNA sequence identification, e.g., fungal DNA barcoding [8,9]. However, these techniques require highly complicated sample preparation, difficulty in real-life application, expensive scientific equipment, and high qualification personnel.
The usage of spectroscopic express analysis represents an alternative approach aimed at the identification of certain spectral characteristics and dependencies, e.g., the hyperspectral imaging, the Fourier-transform infrared (FTIR) spectroscopy in the middle infrared (MIR) region, the NIR absorption spectroscopy and the chlorophyll luminescence [10,11]. These methods are non-destructive, non-invasive, and highly accurate. The NIR absorption spectroscopy for organic compounds is focused on the O-H, N-H, S-H and C-H vibrations overtones investigation, which confirms the fungi infection appearance by changes in carbohydrates, lipids, and proteins. The chlorophyll luminescence, in particular, in the leaves, allows controlling the changes during the infection process in the characteristic bands [11]. The combination with chemometric tools is often used to quantify the results and estimate the toxin concentration [10,12]. In particular, the chemometric tools are combined in such way to reduce the data dimension and to perform the classification [13,14,15]. The principle component analysis (PCA) is among the most effective and widely spread dimension reduction methods [16,17,18]. There is a big amount of classification algorithms takes place, the support vector machine (SVM) algorithm is one relatively new and perspective [17]. SVM was successfully used in several combined spectroscopic and chemometric studies dealt with different aspects of plant and crops [17,19,20]. A good applicability of SVM for even small data sets and less susceptibility to overfitting influence was noted [17].
In case of the infected grains detection the luminescence methods seem rather promising owing to the relatively low fungi concentrations detection [21,22,23,24] and the determination of grains maturity [25,26]. The combination of the luminescence and vibrational spectroscopy methods (FTIR and Raman spectroscopy) is a rapid, non-invasive and powerful high-throughput tool that significantly expands the information obtained. The FTIR spectroscopy in the MIR region provides comprehensive information on carbohydrates, lipids and proteins [12,27,28,29,30]. In the FTIR-ATR spectroscopy the radiation penetrates relatively shallowly into the volume of the sample, thus, the method is suitable for studying the structure of the grain husk and also the microbiological structure. Additionally, the Raman spectroscopy technique allows one to identify various media and pigments [31,32,33]. It is worth noting that many fungi of the genus Fusarium usually share the ability to synthesize carotenoids, a family of widespread in nature hydrophobic terpenoid pigments. The main Fusarium carotenoid is the neurosporaxanthin, a carboxyl xanthophyll. These fungi also produce small amounts of β-carotene, which can be cleaved by CarX oxygenase to form retinal, a rhodopsin chromophore. In the Fusarium fungi the synthesis of carotenoids is induced by light through the structural gene transcriptional induction [34].
In this regard, the current investigation was devoted to the complex study of the 2020 harvest “Zalp” cultivar oat, both healthy and infected by Fusarium fungi grains, by FTIR, Raman and luminescence spectroscopy. The main goal of the study is to take advantage of this spectroscopy techniques applied to determine the fungi genus Fusarium infection and to define spectral markers to separate infected grains from healthy ones. Additionally, the approach based on PCA and SVM was used in order to distinguish healthy and infected grains. In order to determine the predictive power of the PCA and SVM combination (PCA-SVM) approach, a comparative analysis with the combination of PCA and LDA (PCA-LDA) approach was performed.
The object of the investigation by aforementioned methods was the husk, due to its strong affection by diseases.

2. Materials and Methods

2.1. Plant Material

The “Zalp” cultivar oat grains of the 2020 harvest were studied. The grains within the framework of this study were grown in the Central Black Earth zone of Russia, samples were taken from agricultural fields of The Federal Scientific Agro-Engineering Center VIM at coordinates 54°34′56.5” N 39°32′42.0” E. The pedigree of the oat cultivar “Zalp” was described by Kabashov A. et al. in [35]. The “Zalp” is known to be weakly affected by crown, stem rust, head smut and has an average resistance to the bacterial burns. The mass of 1000 grains is in the range of 33–41 g. The cultivar has a good grain filling and quality. The protein content is 11.1–14.2%, the filminess is 26.7%. The average yield for three years of this cultivar is 44.7 metric centners per hectare. The spectroscopic investigation of two groups of grains (healthy and infected) were performed. Each group consisted of 300 grains. The procedure of the infected grains selection is described below.

2.2. Grains Selection

Infected grains were identified by the testing laboratory of the Branch of the Federal State Budgetary Institution “Federal Center for Evaluation of the Safety and Quality of Grain and its Processing Products”, registration number ROSS RU 0001.21PT12. The analysis was performed according to the GOST 31646-2012 Interstate standard (Cereals. Method for determination of scabby kernels content). For this method 2.0 ± 0.1 kg of oat grains were used. Using this method, the grain surface and shape were analyzed in terms of an embryo coloration, endosperm structure and fungi presence. Infected grains were shriveled and had the stains on the surface. The endosperm structure was loose and its vitreousness was lower compared to the healthy grains. The color of the cut embryo was dark brown. Moreover, the light gray coating of the fungus was located on the embryo part.
At the next stage the chromatographic methods were involved in order to identify the T-2 toxin on the basis of the State Guidelines МУ 3184-84 (Guidelines for the detection, identification and determination of the content of the T-2 toxin in food and food raw materials). The guideline is based on a combination of the thin-layer chromatography used as a screening method and the T-2 toxin derivative fluorescence for the T-2 toxin presence confirmation. The fluorescence technique was performed under long wavelength UV irradiation (365 nm) of grain spot after treatment with an alcoholic solution of sulfuric acid followed by heating at 100–105 °C.
According to the laboratory research it was found that 82 ± 1% of grains were infected by Fusarium fungi, the 65.7 ng of Т-2 toxin were found in chromatographic spot.
Using this information, 300 infected and 300 healthy grains were taken as standard samples for further spectroscopic investigation presented in this article to find the spectroscopic criteria for the disease determination.
The average grain weight measured from 300 infected grains was 34.374 ± 0.001 mg. For comparison, the average grain weight taken from 300 healthy grains was 39.435 ± 0.001 mg.

2.3. Fourier-Transform Infrared Spectroscopy

The FTIR spectra were obtained using the Nicolet 8700 (Thermo Fisher Scientific; Waltham, MA, USA) spectrometer purged by nitrogen. Attenuated total reflectance (ATR) method was performed on all samples included in this study. The spectra were collected in the range 650–4000 cm−1. The XT-KBr beamsplitter with the reflective Ge coating and liquid nitrogen-cooled wide band mercury cadmium telluride (MCT) detector were used. Spectra were averaged over 100 scans at a resolution of 4 cm−1, and the Blackman-Harris apodization function was applied. The Mertz phase correction was used. To compare the obtained spectra, all data was normalized in [0, 1] range using the standard Origin 9 function (OriginLab Co.; Northampton, MA, USA). To compare the averaged changes between infected and healthy spectra the difference spectrum was calculated. The difference spectrum is obtained as difference between the first spectrum minus the second spectrum. The first spectrum is averaged by 20 normalized infected FTIR spectrum. And the second one is averaged by 20 normalized healthy FTIR spectrum. No other procedures were applied to the difference spectrum.

2.4. Raman Spectroscopy

Raman spectra were obtained using Senterra (Bruker; Billerica, MA, USA) spectrometer. To obtain spectra from the husk surface, the 785 nm solid state laser was used. The choice of 785 nm excitation laser is determined to avoid the risk of photodegradation processes during the spectra collection. The laser power was 1 mW and 0.1 mW for the healthy and infected grains correspondingly. For carotenoids pigment detection, the laser wavelength 532 nm was chosen to obtain the spectra under resonance conditions, 0.03 mW laser power was focused on the sample surface. For both laser wavelengths the radiation was focused using the 50x microobjective (numerical aperture NA = 0.5). The laser focal spot was about 3–4 μm in diameter. The Raman spectra were collected in the 80–4500 cm−1 and 80–3700 cm−1 region in case of 532 and 785 nm lasers correspondingly. The 400 L/mm diffraction grating and the 25 × 1000 µm aperture were used. The spectra were collected for 60 and 150 s with 2 repetitions for 532 and 785 nm lasers correspondingly. The spectra processing and baseline correction was performed using Origin 9.0 software (OriginLab Co.; Northampton, MA, USA). All spectra were normalized to a maximum value.

2.5. Luminescence Spectroscopy

The luminescence images were obtained using the Nikon Ti2-E (Nikon Corporation, Minato, Tokyo, Japan) inverted luminescence microscope with 20x microobjective. The laser diodes with 405, 488, 561 and 638 nm wavelength were used for the luminescence excitation. In the multi-excitation regime (405, 488, 561 and 638 nm lasers) emission spectra was collected in four spectral regions: 425–475, 500–550, 570–620 and 663–738 nm correspondingly. The 32 images regime with about 5 nm spectral window on each image and 1 nm step between spectral regions was used.
Luminescence spectra were obtained by LabRamHR800 (Horiba Jobin-Yvon, Kyoto, Japan). The fungi luminescence was excited by Ar+ laser (514.5 nm wavelength, 5 μW on sample). The laser radiation was focused by 50x microobjective (NA = 0.5). The luminescence was registered in the 516–1000 nm region. The 600 L/mm diffraction grating and the 100 μm confocal pinhole were used.

2.6. Data Analysis

2.6.1. Chemometric Tools

To perform the data analysis the following approach was used. At the initial stage the dimensionality of obtained data was reduced by the PCA method. The main idea of this method consists in transformation to the new coordinates which are linear combination of former coordinates. The new coordinates are called principal components (PCs). And they are ordered in such way that the data variance in it decreases from previous to subsequent PC. It means that the much variability is accumulated in the first coordinate (PC1). Each of the PCs are orthogonal and for the spectrum (or the spectral region) in new coordinates the score vector is corresponded. Often the significant amount of information can be described in the space with a few PCs (the so-called dimensionality reduction) [36,37]. From the obtained loadings plot it can be concluded which spectral region has a greater weight in each PC.
In this article the PCA method was performed by OriginPro2021b (OriginLab Co.; Northampton, MA, USA) software and Principal Component Analysis for Spectroscopy v1.3 application. For this procedure the data were preprocessed as described in the Section 2.3 and Section 2.4. Considering FTIR spectra, the 650–4000 cm−1 spectral region containing the information about saccharides, proteins and lipids was chosen. And the 150–1800 cm−1 region where the main intensive spectral features are situated was chosen for the Raman spectra. The cumulative percentage of retained original information was chosen at 90% level. The obtained scores were further used for classification purposes.
At the next stage the division into classes was performed. The LDA and SVM classification approaches were used to distinguish the healthy and infected sample classes. The SVM is a machine learning technique that allows training and further prediction of class. The main idea consists in the hyperplanes in k-dimensional space obtaining in order to construct classifiers. The support vectors in this case are the vectors made with points at the edges of sets that are aided in hyperplanes creation [38]. In SVM the kernels are used in order to solve the nonlinear problem with initial nonlinear boundary classes [38]. In this study the RBF kernel was applied for better prediction. The training set was made up of 30 (15 healthy and 15 infected grains) items and 10 more (5 healthy and 5 infected grains) were used to evaluate the predictive power. This procedure was performed with SVM Classification software v1.7 incorporated in OriginPro2021b (OriginLab Co.; Northampton, MA, USA).
For comparison of obtained results within SVM classification approach we have also chosen widely used LDA tool which can be considered as generalized case of Fisher’s linear discriminant method [39]. The last one’s main idea is in obtaining linear combination of parameters which allows to unite objects into one class or to separate into different classes. The main steps of this method can be found in [38,39]. To test the LDA predictive power, the same testing set and was applied as in case of SVM. The LDA procedure was performed with OriginPro2021b software (OriginLab Co.; Northampton, MA, USA).

2.6.2. Model Evaluation

The methods efficiency was compared in terms of accuracy, sensitivity and specificity coefficients defined on the basis of formula (1)–(3) [40,41]:
Accuracy = ncorrect/ntotal
Sensitivity = TP/(TP + FN)
Specificity = TN/(TN + FP)
where ncorrect—number of correctly classified samples, ntotal—the number of total samples, TP (true positive)—the number of positive samples classified as positive, FN (false negative)—the number of positive samples classified as negative, TN (true negative)—the number of negative samples classified as negative and FP (false positive) the number of negative samples classified as positive. Considering healthy and infected grains the positive result corresponds to infected, and negative one corresponds to healthy.

3. Results and Discussions

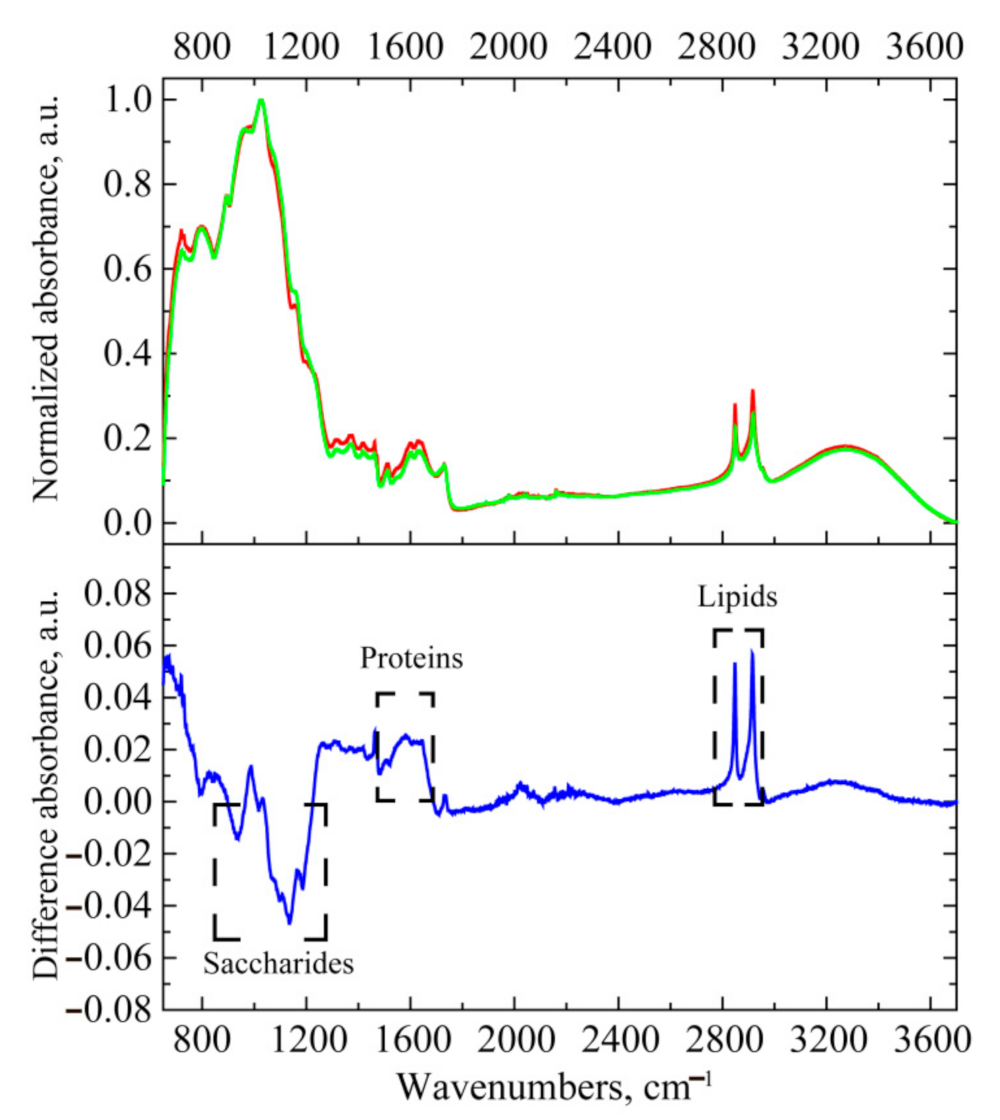
3.1. FTIR Spectroscopy

The FTIR-ATR spectra of 20 healthy (a) and 20 infected (b) grains are shown in Figure 1. The identified peaks and their interpretation are presented in Table 1. As it can be seen from Figure 1a, the spectra from healthy grains show characteristic peaks of carbohydrates, the obtained frequencies are close to the peaks of cellulose and hemicellulose given in [42,43,44,45,46], leading to the fact that the main components in the oat husks are cellulose and hemicellulose with a small content of lignin [1,47]. As it can be seen, the spectra for both infected and healthy oat husk possess a similar peak positions, arising from the relatively small amount of fungi contribution in FTIR spectra. However, the absorbance may strongly vary from grain to grain. To obtain the difference between the spectra of infected and healthy grains, the difference spectrum of the averaged ones was taken (see Figure 2). In the difference spectrum (Figure 2) the presence of positive absorbance in the three important regions: 3100–3600 cm−1, 2800–3000 cm−1 and 1300–1750 cm−1 can be seen. The broad band in 3100–3600 cm−1 region corresponds to the OH stretching vibrations. The 2800–3000 cm−1 region is typical for aliphatic hydrocarbons C-H stretching vibrations with two sharp peaks at 2848 and 2917 cm−1 assigned with C-H symmetric and asymmetric stretching vibrations in methylene groups [48]. Their relatively high absorbance and small width indicate a long alkane chain that is essential for lipids. The Amide I and Amide II protein peaks were obtained near 1635 cm–1 and 1570 cm–1, respectively [48,49]. The appearance of protein and lipid peaks in the difference spectrum indicates the fungi presence.
However, the presence of protein and lipid peaks may occur due to the with plant protection against fungal disease as well. According to [50] it occurs by insolubilization and the oxidative crosslinking of extensins and proline-rich proteins. Also, in [50,51] it was noted that fatty acids and its derivatives may fight the plant pathogens.
In Figure 2, various C-O and C-C bonds typical for polysaccharides compounds and their combination are located at 900–960 and 1015–1220 cm−1 negative absorption regions [48]. Additionally, β(1-4)-glycosidic linkage and vas(C-O-C) vibrations in cellulose bridge structures possess maxima in this area as well. In our opinion, negative absorption features occur as a consequence of bonds destruction due to the fungi infection. However, also, the decrease in absorption in the saccharide band may be due to the use of carbohydrates by the fungus. In case of β(1-4)-glycosidic linkage the possible hydrolization of these bonds by engaged fungi enzymes is in accordance with one of the possible degradation processes of different cellulose materials [46,51,52].
According to the analysis of the difference absorption spectrum it can be concluded that the infected grains spectra have an additional contribution in the areas of Amide peaks and stretching vibrations in lipid C-H bonds in comparison with healthy grains spectra. At the same time, for healthy grains in the averaged spectrum there is a larger absorption in the region typical for saccharides (900–1220 cm−1).
However, these spectral features are rather difficult to analyze due to the low contribution of infected area to the full spectrum at this stage with infection present in localized area. The reduction of data dimension by PCA was applied to determine more precise spectral characteristics of grain infection.
The PCA was performed in the 650–4000 cm−1 region. At the same time, special attention was paid to the region of 650–1800 cm−1, where the prominent peaks for saccharides and proteins are located. The calculated eigenvalues ranked in descending order and percentage variance explained depending on the PC number are presented in Figure S1. The first 3 PCs were chosen to explain slightly more than 90% of variance. At the same time, the first two main components account for approximately 81.9%. Figure 3 shows the loadings for the first three principal components.
It can be noted that the weights for the loading of the PC1 correlates with the difference IR absorption spectrum shown in the bottom of Figure 2. So, in particular, the highest weights were noted in the range of 1210–1680 cm−1 where the protein media absorption is also located. Significant weights are also observed in the stretching CH2 vibrations near 2848 and 2916 cm−1 associated with lipids. At the same time, the weights for the region near 1100 cm−1, which is characteristic for the bands with the highest absorption in saccharides, have the opposite sign compared to aforementioned peaks.
Also, for the PC2 loading, the greatest weight is introduced in the 1065–1186 cm−1 range, which is characteristic for saccharides. The dependence of the one PC score on the other is shown in Figure 4 in case of first three PCs.
According to Figure 4, the obtained scores data after applying the PCA is mixed and no obvious distinguish is observed.
At the further step the obtained scores were classified with the use of LDA and SVM approaches. The combination of scores data for 3 main components were chosen for training and further prediction test. The defined according to (1–3) results are listed in the Table 2 for the accuracy, sensitivity, and specificity. According to the Table 2, the PCA-SVM approach is more effective than the PCA-LDA. The higher accuracy, sensitivity, and specificity coefficients for PCA-SVM approach were obtained when the training was performed on the data set which is made up of united scores for PC1, PC2 and PC3 components.

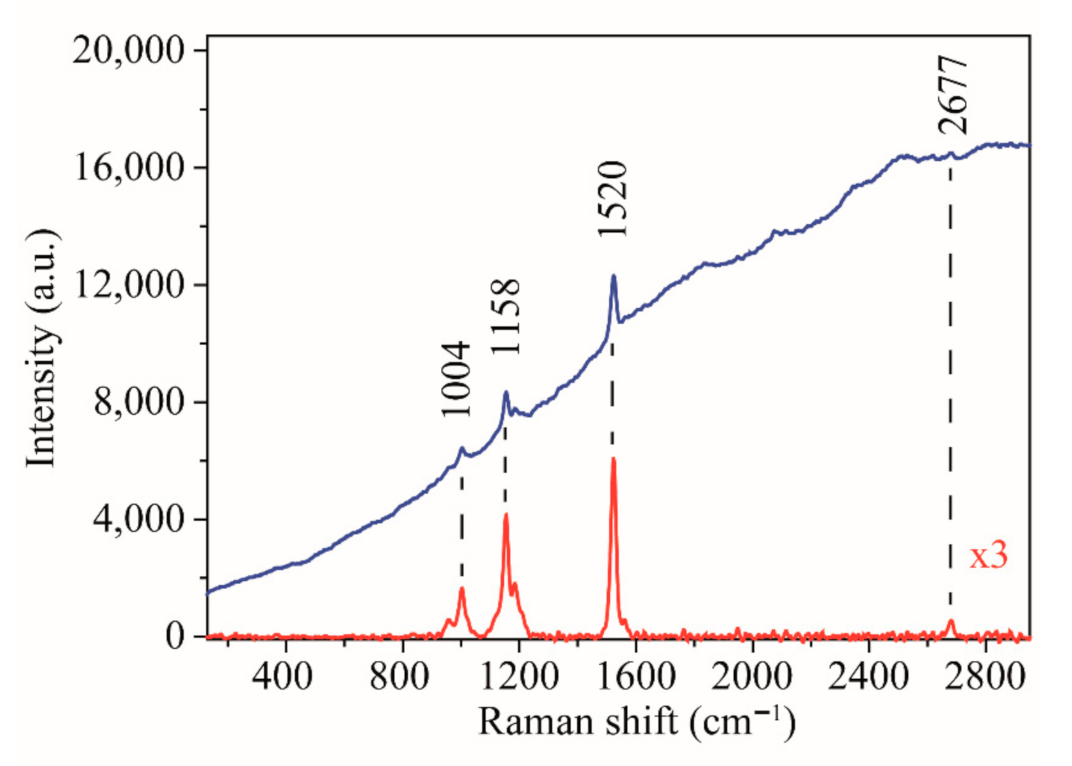
3.2. Raman Spectroscopy

The micro-Raman spectroscopy involves acquiring spatially resolved Raman spectra by combining the optical microscope with the Raman spectrometer. For the visible and near-infrared radiation the laser focal spot diameter of 3–4 µm is observed using the 50x microobjective. The confocal microscope allows to localize the signal up to 10 microns in depth, which is comparable to a single fungal hypha and the area of the husk beneath it in the case of an infected grain.
The obtained spectra from healthy and infected grains are demonstrated in Figure 5a,c correspondingly. The example of the healthy and infected grain area are presented in Figure 5 (b,d correspondingly). Unlike healthy grains the infected ones contain the dark colored area with the typical fungal hypha shape.
Raman spectra taken from the healthy grains contain several well-pronounced peaks with the centers at 376 cm−1, 897 cm−1, 1090 cm−1, 1119 cm−1, 1266 cm−1, 1337 cm−1, 1376 cm−1 and 1460 cm−1. The mentioned peaks are close to cellulose peaks reported in [53,54]. The 376 cm−1 peak is related to skeletal vibrations δ(CCC), δ(COC), δ(OCC), δ(OCO), symmetric vibrations in the ring. The peak near 897 cm−1 is attributed to the deformation vibrations in the HCO and HCC groups [53], as well as to the planar symmetric stretching vibrations in COC [54]. The glycosidic v(COC) vibrations are assigned to the peaks at 1090 cm−1 and 1119 cm−1. The 1266 cm−1 peak corresponds to δ(HCC), δ(HOC), δ(COH) vibrations, the peak at 1337 cm−1 is related to δ(HCC), δ(HOC), δ(COH) vibrations, the peak near 1376 cm−1 corresponds to δ(HCH), δ(HCC), δ(HOC), δ(COH) vibrations and peak at 1460 cm−1 related to δ(HCH) vibrations. In the high frequency region the stretching C-H vibrations ascribed to methyl and methylene groups were obtained near 2888 cm−1 and 2930 cm−1.
The most intense peaks in the spectrum at 1600 cm−1 and 1627 cm−1 are attributed to the C=C bonds vibrations. According to [55,56], these maxima could be interpreted as the lignin peaks in the husk. The identification of cellulose and lignin in the healthy grain spectra coincide both with the results obtained by the FTIR spectroscopy and with the husk chemical composition [1,47].
The obtained Raman spectra from the infected grains are shown in Figure 5c. In the region of 200 cm−1 to 1200 cm−1 three most intense peaks have the frequencies 410 cm−1, 907 cm−1 and 1065 cm−1. The spectra in the range of 1155–1700 cm−1 consist of the peaks at 1278 cm−1, 1347 cm−1, and 1603 cm−1. Near the 1603 cm−1 peak, two shoulders were noted on the low-frequency side and one shoulder on the high-frequency side. The six Voight contours expansion was applied to the averaged spectrum in 1155–1700 cm−1, the details see in Supporting Information Figure S2. The identified peaks have centers at 1278 cm−1, 1347 cm−1, 1464 cm−1, 1537 cm−1, 1604 cm−1 and 1641 cm−1, their position is close to the ones observed in [46,57,58,59]. For both healthy and infected grains the main intensive peak near 1604 cm−1 corresponds to the C=С stretching vibrations. However, the spectral width of this peak in the infected grain is 54 cm−1 for the Gaussian contribution, which is much larger than for the same parameter in the healthy grain, which is 7 cm−1. This maximum broadening can be associated with structural disordering in lignin, because its production and accumulation is one of the plant’s defense mechanisms [50,60]. The 1641 cm−1 peak form is composite, since it can include both C=C bond stretching vibrations originating from the broadened peak at 1627 cm−1 and the contribution from the Amide I peak [57], which indicates a protein constituent of the fungi. The maximum at 1537 cm−1 was interpreted as hydrogen bending vibrations in XNH (δ(XNH) where X is another atom) including the Amide II peak, another peak from the protein structure [48,57] and vibrations including bending atom motions in HCH groups and, possibly, stretching vibrations in double C=C or C=N bonds. The maxima at 410 cm−1, 907 cm−1 with 1065 cm−1, as well as 1278 cm−1 were attributed to saccharide peaks [58] and interpreted as, correspondingly, skeletal vibrations, stretching vibrations in C-O bonds, as well as deformation vibrations of hydrogen mixed with stretching vibrations C-O and C-C and Amide III peak [32]. Peaks at 1346 cm−1 and 1446 cm−1 were attributed to lipids and, in particular, fatty acids and assign with the various CH3 and СН2 group deformation vibrations [32,58]. It should be noted that, in contrast to healthy grains, the intensity of C-H stretching vibrations in infected grains is much lower.
The PCA analysis of the obtained spectra was performed in the 150–1800 cm−1 region where the most intensive and characteristic for the husk peaks are located. The calculated eigenvalues ranked in descending order and percentage variance explained depending on the PC number are presented in Figure S3. A faster convergence of Raman results comparing to FTIR results is clearly manifested (see for comparison Figures S1 and S3).
The first two PCs explain about 93% of variance and first three PCs explains slightly more than 95%. Figure 6 demonstrates the obtained loadings for first 3 PCs. At it for the PC1 loading the greater contribution (weight) is in the region about 1292 and 1550 cm−1 (including protein peaks region). The greater variance can be noticed according to the healthy and infected grain Raman spectra comparison in these regions. The greater contribution of PC2 loading is located near 1344 cm−1 (the lipid region) with smaller values at 906 cm−1, 1048 cm−1, 1205 cm−1, 1281 cm−1 и 1468 cm−1.
Figure 7 shows the clear scores areas separation for infected and healthy samples. The further application of LDA and SVM for obtained scores with PCA leads to the calculated results for the accuracy, sensitivity and specificity listed in Table 3. In the case when the data sets are separated and the corresponding 95% probability ellipsoids (Euclidean distance is about 12 a.u. between centers of 95% probability ellipsoids, see Figure 7) do not intersect and are not contained in one another both approaches (PCA-LDA and PCA-SVM) are reliable and there is no misclassification during infected and healthy samples classification.
When the PC2 and PC3 scores were chosen as training set the predictable ability was greater for PCA-SVM as compared with PCA-LDA. The PCA-SVM allowed more correctly localize the smaller area of health samples. In case of PCA-LDA it was noted misclassification of infected samples as being healthy during training. This leads to the greater error for prediction set.
The PCA analysis and observed Raman spectral features of infected and healthy samples allowed to introduce two additional approaches which can be implemented at practice.
First approach is based on the integral intensities comparison in the two following regions: 1190–1400 cm−1 and 1400–1565 cm−1, where the significant variance concerning the qualitative and quantitative changes between healthy and infected samples was noticed. According to the Table 4 the integral intensities in these regions possess significantly different mean values, standard deviations and other properties. Therefore, the healthy and infected samples are effectively separated in two classes. The separation is demonstrated in Figure 8 along with 95% probability ellipsoids. In both regions a significant contribution of various bending vibrations of different origin are observed in spectra. This contribution arises mainly from carbohydrates which predominantly form oat husk for healthy samples. On the contrary, the significant contributions from the lipids and protein media in the 1190–1400 cm−1 and 1400–1565 cm−1 region is clearly seen for infected samples.
The difference in Raman spectra of healthy and infected grains occurs due to two main reasons. The first one comprises from the fact that fungi grows on the outer husk surface, which results in lower Raman signal from the grain husk. Another reason is connected with the peaks broadening associated with structural disordering or chemical transformation. The husk peaks broadening could be obviously observed by Figure 5a,c in the 350–600 and 1565–1670 cm−1 region comparing.
However, in Figure 6 all three PC loadings in the 1565–1670 cm−1 region have low weights. This information could be used as an another approach for the grain characterization on the basis of integral intensities ratio A(1565–1670)/A(1400–1565), where A(1565–1670)—integral intensity in 1565–1670 cm−1 and A(1400–1565)—integral intensity in 1400–1565 cm−1. This ratio was chosen due to the fact that the integral intensity in the region 1190–1400 cm−1 is greater than in 1400–1565 cm−1 see Table 4. This leads to greater separation of results obtained for two classes (infected and healthy samples). Figure 9 shows two obtained datasets for A(1565–1670)/A(1400–1565) ratios for infected and healthy grains. These two datasets were tested with t-test and it was obtained that statistically significance for the two groups with a p-value is much lower than 0.05. Moreover, the difference between two data sets means (about 2.42) lying between 2.24 and 2.61 was calculated with the 95% confidence. Also, the T2 Hotteling test (F-distribution and χ2 approximation) have shown statistically significance for the two groups with a p-value much lower than 0.05.
Moreover, these two additional approaches were tested for predictive power with LDA and SVM. The obtained results are summarized in Table S1. It was noted that the accuracy, sensitivity and specificity coefficient were equal to 1 for both approaches.
To reveal the additional characteristic features, which may be used as a marker in disease detection, the investigation of infected areas by 532 nm laser was performed. This approach allowed obtaining resonance Raman spectra of fungi pigment. The Raman spectrum from Figure 10, obtained from the infected area, demonstrates a set of peaks typical for carotenoids. The peaks at 1004 cm−1, 1158 cm−1, and 1520 cm−1 belong to the first order Raman scattering, whereas peak 2677 cm−1 is attributed to the second order. The first order Raman peaks are assigned for C-CH3 rocking mode (1004 cm−1), stretching C-C vibrations coupled with bending in plane C-H vibrations (1158 cm−1) and C=C stretching vibrations in conjugated chain (1520 cm−1) [61,62]. The second order peak at 2677 cm−1 is considered as the sum of 1004 cm−1 and 1158 cm−1. The 532 nm laser excitation wavelength is close to the S0 (11Ag) → S2 (11Bu) electronic transition in the carotenoids resulting in the intense signal of the first and second order Raman scattering in infected grains [63,64]. The similar spectrum was not observed for the healthy grains. Under certain conditions some of the Fusarium fungi can produce the pigments belonging to the carotenoids class, which is described in [34,65,66,67,68]. The demonstrated capability of intense carotenoids Raman signal detection from the grain surface can be potentially used as an additional marker for the fungi disease detection.
To sum up, the Raman spectroscopy is a powerful technique allowing the accurate identification of the infected grains.

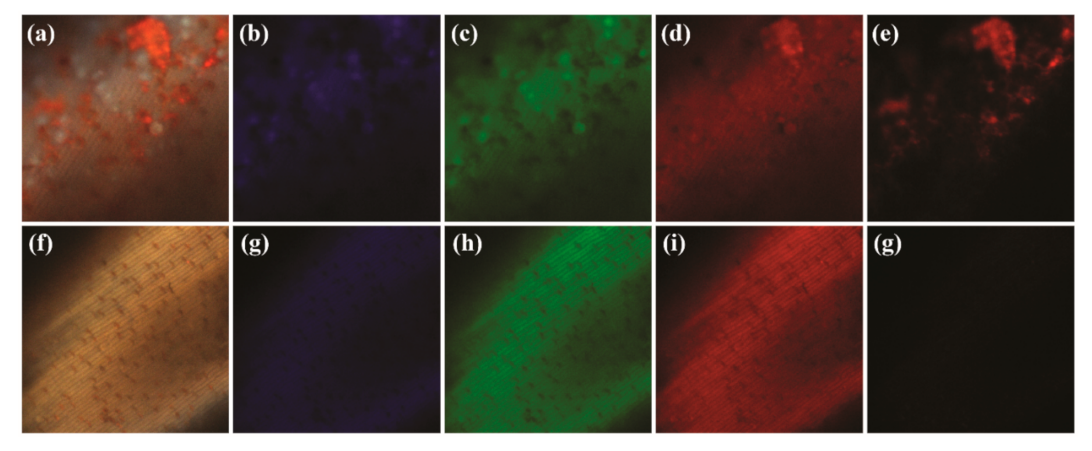
3.3. Luminescence Spectroscopy

Unlike Raman spectroscopy the luminescence microscopy is prominent for visual fungi identification and mapping.
In the present study, the healthy and infected grains were investigated with different laser wavelength excitation using the confocal luminescence microscope. The main signal was obtained from the husk (Figure 11).
At the first stage, all four lasers (405 nm, 488 nm, 561 nm, 638 nm) simultaneously excited the emission in order to determine the greater luminescence contrast between healthy and infected areas. The healthy grains emission demonstrates the homogeneous behavior in the whole spectral region without any additional luminescence centers. On the contrary the infected grains emission spectra possess several spectral features. As it can be clearly seen in Figure 11, the most intense luminescence contrast was observed in the region 663–738 nm (see Figure 11e,g).
According to the measurements, the luminescence main maximum position was found to be near 680 nm only for the infected grains (Figure 12 red line).
The presence of this luminescence peak from infected grains was also confirmed using 514.5 nm Ar+ laser excitation by LabRam HR800 Raman spectrometer (Figure 12 blue line). Moreover, the second peak near 730 nm under 514.5 nm excitation was also identified as a shoulder on the long-wave side of 680 nm peak. Both spectra from luminescence microscope and Raman spectrometer are presented in Figure 12. The identified peaks were attributed to chlorophyll α luminescence [69,70]. Its presence in the infected grains may occur due to infection process during plant flowering period.

4. Conclusions

A multianalytical study was performed with the healthy and infected oat husks of “Zalp” cultivar in order to determine the certain spectral features of Fusarium fungi infected grains. The infected grains have local infected areas. All grains were investigated using FTIR-ATR, Raman and luminescence spectroscopies. An average increase in FTIR-ATR absorption in the case of infected grains was observed in the regions 2800–3000 cm−1 and 1300–1750 cm−1, which are associated with lipid and protein components correspondingly. At the same time the lower absorbance in the regions 900–960 and 1015–1220 cm−1 is present in infected grains compared with healthy one.
In order to distinguish infected and healthy grains the PCA analysis was applied at the first stage to the FTIR spectra. The further application of SVM and LDA to PCA scores have shown the better predictive power of the PCA-SVM approach.
A study by Raman spectroscopy under non-resonant conditions (785 nm excitation) demonstrates a significant difference between infected and healthy grains. The application of PCA allowed effective separation. The further test of predictive power results with SVM and LDA approach have shown the best values when the combinations of PC1 and PC2, PC1 and PC3, (PC,PC2, PC3) scores datasets were used. Moreover, the same predictive power results were shown when SVM and LDA were tested on datasets of integral intensities 1190–1400 cm−1 and 1400–1650 cm−1 as soon as integral intensity ratio A(1565–1670)/A(1400–1565). The obtained predictive power has a greater value at the stage with infection present in localized area by the Raman spectroscopy then for FTIR spectroscopy.
Additionally, the excitation of Raman scattering under the resonance conditions (532 nm excitation) allowed obtaining the information about fungi pigments. In the studied infected grains, the presence of peaks at 1004 cm−1, 1158 cm−1, 1520 cm−1, attributed to carotenoid type fungi pigments, was confirmed.
The luminescence spectroscopy can also be informative for such differentiation. An intense luminescence signal from chlorophyll α (680 nm) was observed in grain infected areas.
Thus, it was shown that the combination of the FTIR-ATR, Raman and luminescence spectroscopies is an effective technique for differentiation of healthy and infected oat grains by Fusarium fungi.

Supplementary Materials

The following are available online at https://www.mdpi.com/article/10.3390/agronomy11122402/s1, Figure S1: Eigenvalue depending on the principle component number (blue) and percent variance explained up to the principle component number (red) in case of PCA analysis of healthy and infected FTIR spectra performed in 650–4000 cm−1 region, Figure S2: Infected grains averaged Raman spectra. The decomposition by 6 Voight peaks is presented in the 1155–1700 cm−1 region (Coefficient of determination R2 = 0.994), Figure S3: Eigenvalue depending on the principle component number (blue) and percentage variance explained up to the principle component number (red) in case of PCA analysis of healthy and infected Raman spectra performed in 150–1800 cm−1 region. Table S1: Test of simple models based on integral intensity in several regions.

Author Contributions

Conceptualization, D.P. and A.P. (Anastasia Povolotckaia); formal analysis, D.P.; investigation, D.P., A.K., M.M., A.G., A.L. and A.I.; writing—original draft preparation, D.P. and A.P. (Anastasia Povolotckaia); writing—review and editing, D.P., A.P. (Anastasia Povolotckaia), E.B., M.M., A.G. and A.L.; visualization, D.P.; supervision, A.P. (Anastasia Povolotckaia), A.P. (Alexey Povolotskiy). All authors have read and agreed to the published version of the manuscript.

Funding

This work was supported by a grant of the Ministry of Science and Higher Education of the Russian Federation for large scientific project in priority areas of scientific and technological development (grant number 075-15-2020-774).

Acknowledgments

The measurements were performed at The Center for Optical and Laser Materials Research of Saint Petersburg State University Research Park.

Conflicts of Interest

The authors declare no conflict of interest.

References

  1. Webster, F.H.; Wood, P.J. Oats: Chemistry and Technology: American Association of Cereal Chemists, 2nd ed.; Elsevier Science: St. Paul, MN, USA, 2011; p. 376. ISBN 9780128104521. [Google Scholar]
  2. Adhikari, M.; Negi, B.; Kaushik, N.; Adhikari, A.; Al-Khedhairy, A.A.; Kaushik, N.K.; Choi, E.H. T-2 Mycotoxin: Toxicological Effects and Decontamination Strategies. Oncotarget 2017, 8, 33933–33952. [Google Scholar] [CrossRef] [Green Version]
  3. Gagkaeva, T.; Gavrilova, O.; Orina, A.; Lebedin, Y.; Shanin, I.; Petukhov, P.; Eremin, S. Analysis of Toxigenic Fusarium Species Associated with Wheat Grain from Three Regions of Russia: Volga, Ural, and West Siberia. Toxins 2019, 11, 252. [Google Scholar] [CrossRef] [Green Version]
  4. Hautsalo, J.; Jalli, M.; Manninen, O.; Veteläinen, M. Evaluation of Resistance to Fusarium Graminearum in Oats. Euphytica 2018, 214, 139. [Google Scholar] [CrossRef]
  5. Batt, C.; Pattel, P. Encyclopedia of Food Microbiology, 2nd ed.; Academic Press: London, UK, 2014; p. 3248. ISBN 9780123847331. [Google Scholar]
  6. Fredlund, E.; Gidlund, A.; Pettersson, H.; Olsen, M.; Börjesson, T. Real-Time PCR Detection of Fusarium Species in Swedish Oats and Correlation to T-2 and HT-2 Toxin Content. World Mycotoxin J. 2010, 3, 77–88. [Google Scholar] [CrossRef]
  7. Trombete, F.; Barros, A.; Vieira, M.; Saldanha, T.; Venâncio, A.; Fraga, M. Simultaneous Determination of Deoxynivalenol, Deoxynivalenol-3-Glucoside and Nivalenol in Wheat Grains by HPLC-PDA with Immunoaffinity Column Cleanup. Food Anal. Methods 2016, 9, 2579–2586. [Google Scholar] [CrossRef] [Green Version]
  8. Xu, J. Fungal DNA Barcoding. Genome 2016, 59, 913–932. [Google Scholar] [CrossRef] [Green Version]
  9. Hoang, M.T.V.; Irinyi, L.; Chen, S.C.A.; Sorrell, T.C.; Meyer, W. Dual DNA Barcoding for the Molecular Identification of the Agents of Invasive Fungal Infections. Front. Microbiol. 2019, 10, 1647. [Google Scholar] [CrossRef] [PubMed] [Green Version]
  10. Femenias, A.; Gatius, F.; Ramos, A.J.; Sanchis, V.; Marín, S. Use of Hyperspectral Imaging as a Tool for Fusarium and Deoxynivalenol Risk Management in Cereals: A Review. Food Control 2020, 108, 106819. [Google Scholar] [CrossRef]
  11. Bauriegel, E.; Herppich, W. Hyperspectral and Chlorophyll Fluorescence Imaging for Early Detection of Plant Diseases, with Special Reference to Fusarium Spec. Infections on Wheat. Agriculture 2014, 4, 32–57. [Google Scholar] [CrossRef] [Green Version]
  12. Levasseur-Garcia, C. Updated Overview of Infrared Spectroscopy Methods for Detecting Mycotoxins on Cereals (Corn, Wheat, and Barley). Toxins 2018, 10, 38. [Google Scholar] [CrossRef] [Green Version]
  13. Haq, Q.M.I.; Mabood, F.; Naureen, Z.; Al-Harrasi, A.; Gilani, S.A.; Hussain, J.; Jabeen, F.; Khan, A.; Al-Sabari, R.S.M.; Al-khanbashi, F.H.S.; et al. Application of Reflectance Spectroscopies (FTIR-ATR & FT-NIR) Coupled with Multivariate Methods for Robust in Vivo Detection of Begomovirus Infection in Papaya Leaves. Spectrochim. Acta Part A Mol. Biomol. Spectrosc. 2018, 198, 27–32. [Google Scholar] [CrossRef]
  14. Zhan, W.; Yang, X.; Lu, G.; Deng, Y.; Yang, L. A Rapid Quality Grade Discrimination Method for Gastrodia Elata Powderusing ATR-FTIR and Chemometrics. Spectrochim. Acta Part A Mol. Biomol. Spectrosc. 2022, 264, 120189. [Google Scholar] [CrossRef] [PubMed]
  15. Angrish, A.; Kumar, R.; Chauhan, R.; Sharma, V. On the IR Spectroscopy and Chemometric Based Rapid and Non-Destructive Method for the Investigation of Sunscreen Stains: Application in Forensic Science. Spectrochim. Acta Part A Mol. Biomol. Spectrosc. 2020, 242, 118708. [Google Scholar] [CrossRef] [PubMed]
  16. Li, Y.; Yang, K.; Gao, W.; Han, Q.; Zhang, J. A Spectral Characteristic Analysis Method for Distinguishing Heavy Metal Pollution in Crops: VMD-PCA-SVM. Spectrochim. Acta Part A Mol. Biomol. Spectrosc. 2021, 255, 119649. [Google Scholar] [CrossRef] [PubMed]
  17. Yao, S.; Li, T.; Li, J.; Liu, H.; Wang, Y. Geographic Identification of Boletus Mushrooms by Data Fusion of FT-IR and UV Spectroscopies Combined with Multivariate Statistical Analysis. Spectrochim. Acta Part A Mol. Biomol. Spectrosc. 2018, 198, 257–263. [Google Scholar] [CrossRef]
  18. Abbaspour-Gilandeh, Y.; Molaee, A.; Sabzi, S.; Nabipur, N.; Shamshirband, S.; Mosavi, A. A Combined Method of Image Processing and Artificial Neural Network for the Identification of 13 Iranian Rice Cultivars. Agronomy 2020, 10, 117. [Google Scholar] [CrossRef] [Green Version]
  19. Zhang, D.; Chen, G.; Zhang, H.; Jin, N.; Gu, C.; Weng, S.; Wang, Q.; Chen, Y. Integration of Spectroscopy and Image for Identifying Fusarium Damage in Wheat Kernels. Spectrochim. Acta Part A Mol. Biomol. Spectrosc. 2020, 236, 118344. [Google Scholar] [CrossRef]
  20. Yang, B.; Chen, C.; Chen, F.; Chen, C.; Tang, J.; Gao, R.; Lv, X. Identification of Cumin and Fennel from Different Regions Based on Generative Adversarial Networks and near Infrared Spectroscopy. Spectrochim. Acta Part A Mol. Biomol. Spectrosc. 2021, 260, 119956. [Google Scholar] [CrossRef]
  21. Thirumalai, J. Luminescence: An Outlook on the Phenomena and Their Applications; InTech: Rijieka, Croatia, 2016; p. 388. ISBN 9789535127628. [Google Scholar]
  22. Finkner, R.E.; Murphy, H.C.; Atkins, R.E.; West, D.W. Seed Fluorescence in Oats. Proc. Assoc. Off. Seed Anal. 1954, 44, 202–205. [Google Scholar]
  23. Baum, B.R.; Brach, E.J. Identification of Oat Cultivars by Means of Fluorescence Spectrography—A Pilot Study Aimed at Automatic Identification of Cultivars. Can. J. Bot. 1975, 53, 305–309. [Google Scholar] [CrossRef]
  24. Brach, E.J.; Baum, B. Identification of Oat Cultivars by Fluorescence Spectroscopy. Appl. Spectrosc. 1975, 29, 326–333. [Google Scholar] [CrossRef]
  25. Belyakov, M.; Sokolova, E.; Listratenkova, V.; Ruzanova, N.; Kashko, L. Photoluminescent Control Ripeness of the Seeds of Plants. E3S Web Conf. 2021, 273, 01003. [Google Scholar] [CrossRef]
  26. Scholes, J.D.; Rolfe, S.A. Photosynthesis in Localised Regions of Oat Leaves Infected with Crown Rust (Puccinia Coronata): Quantitative Imaging of Chlorophyll Fluorescence. Planta 1996, 199, 573–582. [Google Scholar] [CrossRef]
  27. Salman, A.; Tsror, L.; Pomerantz, A.; Moreh, R.; Mordechai, S.; Huleihel, M. FTIR Spectroscopy for Detection and Identification of Fungal Phytopathogenes. Spectroscopy 2010, 24, 723489. [Google Scholar] [CrossRef]
  28. Oberle, J.; Dighton, J.; Arbuckle-Keil, G. Comparison of Methodologies for Separation of Fungal Isolates Using Fourier Transform Infrared (FTIR) Spectroscopy and Fourier Transform Infrared-Attenuated Total Reflectance (FTIR-ATR) Microspectroscopy. Fungal Biol. 2015, 119, 1100–1114. [Google Scholar] [CrossRef]
  29. López-Malvar, A.; Santiago, R.; Malvar, R.A.; Martín, D.; Pereira dos Santos, I.; Batista de Carvalho, L.A.E.; Faas, L.; Gómez, L.D.; da Costa, R.M.F. FTIR Screening to Elucidate Compositional Differences in Maize Recombinant Inbred Lines with Contrasting Saccharification Efficiency Yields. Agronomy 2021, 11, 1130. [Google Scholar] [CrossRef]
  30. Tomás, D.; Rodrigues, J.C.; Viegas, W.; Silva, M. Assessment of High Temperature Effects on Grain Yield and Composition in Bread Wheat Commercial Varieties. Agronomy 2020, 10, 499. [Google Scholar] [CrossRef] [Green Version]
  31. De Gussem, K.; Vandenabeele, P.; Verbeken, A.; Moens, L. Raman Spectroscopic Study of Lactarius Spores (Russulales, Fungi). Spectrochim. Acta Part A Mol. Biomol. Spectrosc. 2005, 61, 2896–2908. [Google Scholar] [CrossRef]
  32. Vandenabeele, P.; Wehling, B.; Moens, L.; Edwards, H.; de Reu, M.; van Hooydonk, G. Analysis with Micro-Raman Spectroscopy of Natural Organic Binding Media and Varnishes Used in Art. Anal. Chim. Acta 2000, 407, 261–274. [Google Scholar] [CrossRef]
  33. Jehlička, J.; Edwards, H.G.M.; Oren, A. Raman Spectroscopy of Microbial Pigments. Appl. Environ. Microbiol. 2014, 80, 3286–3295. [Google Scholar] [CrossRef] [Green Version]
  34. Avalos, J.; Pardo-Medina, J.; Parra-Rivero, O.; Ruger-Herreros, M.; Rodríguez-Ortiz, R.; Hornero-Méndez, D.; Limón, M. Carotenoid Biosynthesis in Fusarium. J. Fungi 2017, 3, 39. [Google Scholar] [CrossRef] [PubMed] [Green Version]
  35. Kabashov, A.D.; Loskutov, I.G.; Vlasenko, N.M.; Leibovich, Y.G.; Markova, A.S.; Filonenko, Z.v.; Razumovskaya, L.G. Oat Cultivars Developed at Nemchinovka and Included into the State Register in Recent Years (a Review). Proc. Appl. Bot. Genet. Breed. 2020, 181, 110–118. [Google Scholar] [CrossRef]
  36. Dahlberg, D.B.; Lee, S.M.; Wenger, S.J.; Vargo, J.A. Classification of Vegetable Oils by FT-IR. Appl. Spectrosc. 1997, 51, 1118–1124. [Google Scholar] [CrossRef]
  37. Demir, P.; Onde, S.; Severcan, F. Phylogeny of Cultivated and Wild Wheat Species Using ATR–FTIR Spectroscopy. Spectrochim. Acta Part A Mol. Biomol. Spectrosc. 2015, 135, 757–763. [Google Scholar] [CrossRef]
  38. do Vale Madeiro, J.P.; Cortez, P.C.; Monteiro Filho, J.M.D.S.; Brayner, A.R.A. Developments and Applications for ECG Signal Processing: Modeling, Segmentation, and Pattern Recognition; Academic Press: London, UK, 2018; p. 210. ISBN 9780128140352. [Google Scholar]
  39. Oroian, M.; Ropciuc, S. Botanical Authentication of Honeys Based on Raman Spectra. J. Food Meas. Charact. 2018, 12, 545–554. [Google Scholar] [CrossRef]
  40. Porto, N.d.A.; Roque, J.v.; Wartha, C.A.; Cardoso, W.; Peternelli, L.A.; Barbosa, M.H.P.; Teófilo, R.F. Early Prediction of Sugarcane Genotypes Susceptible and Resistant to Diatraea Saccharalis Using Spectroscopies and Classification Techniques. Spectrochim. Acta Part A Mol. Biomol. Spectrosc. 2019, 218, 69–75. [Google Scholar] [CrossRef]
  41. Huang, F.; Song, H.; Guo, L.; Guang, P.; Yang, X.; Li, L.; Zhao, H.; Yang, M. Detection of Adulteration in Chinese Honey Using NIR and ATR-FTIR Spectral Data Fusion. Spectrochim. Acta Part A Mol. Biomol. Spectrosc. 2020, 235, 118297. [Google Scholar] [CrossRef]
  42. Proniewicz, L.M.; Paluszkiewicz, C.; Wesełucha-Birczyńska, A.; Majcherczyk, H.; Barański, A.; Konieczna, A. FT-IR and FT-Raman Study of Hydrothermally Degradated Cellulose. J. Mol. Struct. 2001, 596, 163–169. [Google Scholar] [CrossRef]
  43. Lisperguer, J.; Perez, P.; Urizar, S. Structure and thermal properties of lignins: Characterization by infrared spectroscopy and differential scanning calorimetry. J. Chil. Chem. Soc. 2009, 54, 460–463. [Google Scholar] [CrossRef] [Green Version]
  44. Abidi, N.; Cabrales, L.; Haigler, C.H. Changes in the Cell Wall and Cellulose Content of Developing Cotton Fibers Investigated by FTIR Spectroscopy. Carbohydr. Polym. 2014, 100, 9–16. [Google Scholar] [CrossRef]
  45. Kavkler, K.; Demšar, A. Application of FTIR and Raman Spectroscopy to Qualitative Analysis of Structural Changes in Cellulosic Fibres. Tekstilec 2012, 55, 19–44. [Google Scholar]
  46. Povolotckaia, A.v.; Pankin, D.v.; Sazanova, K.v.; Petrov, Y.v.; Kurganov, N.S.; Mikhailova, A.A.; Povolotckiy, A.v.; Kurochkin, A.v.; Vlasov, A.D.; Gonobobleva, S.L.; et al. Biodamage to Paper by Micromycetes under Experimental Conditions: A Study by Vibrational Spectroscopy Methods. Opt. Spectrosc. 2019, 126, 354–359. [Google Scholar] [CrossRef]
  47. Welch, R.W. The Oat Crop: Production and Utilization, 1st ed.; Springer Science & Business Media: Dordrecht, The Netherlands, 1995; p. 584. ISBN 978-94-011-0015-1. [Google Scholar]
  48. Mayo, D.W.; Miller, F.A.; Hannah, R.W. Course Notes on the Interpretation of Infrared and Raman Spectra; John Wiley & Sons: Hoboken, NJ, USA, 2004. [Google Scholar]
  49. Huang, W.E.; Li, M.; Jarvis, R.M.; Goodacre, R.; Banwart, S.A. Shining Light on the Microbial World. In Advances in Applied Microbiology; Laskin, A.I., Gadd, G.M., Sariaslani, S., Eds.; Elsevier Science: Amsterdam, The Netherlands, 2010; pp. 153–186. [Google Scholar] [CrossRef]
  50. Havrlentová, M.; Šliková, S.; Gregusová, V.; Kovácsová, B.; Lančaričová, A.; Nemeček, P.; Hendrichová, J.; Hozlár, P. The Influence of Artificial Fusarium Infection on Oat Grain Quality. Microorganisms 2021, 9, 2108. [Google Scholar] [CrossRef] [PubMed]
  51. Kachroo, A.; Kachroo, P. Fatty Acid–Derived Signals in Plant Defense. Annu. Rev. Phytopathol. 2009, 47, 153–176. [Google Scholar] [CrossRef] [PubMed]
  52. Coughlan, M.P. Mechanisms of Cellulose Degradation by Fungi and Bacteria. Anim. Feed. Sci. Technol. 1991, 32, 77–100. [Google Scholar] [CrossRef]
  53. Szymańska-Chargot, M.; Cybulska, J.; Zdunek, A. Sensing the Structural Differences in Cellulose from Apple and Bacterial Cell Wall Materials by Raman and FT-IR Spectroscopy. Sensors 2011, 11, 5543–5560. [Google Scholar] [CrossRef] [Green Version]
  54. Edwards, H.G.M.; Farwell, D.W.; Webster, D. FT Raman Microscopy of Untreated Natural Plant Fibres. Spectrochim. Acta Part A Mol. Biomol. Spectrosc. 1997, 53, 2383–2392. [Google Scholar] [CrossRef]
  55. Agarwal, U.P. Analysis of Cellulose and Lignocellulose Materials by Raman Spectroscopy: A Review of the Current Status. Molecules 2019, 24, 1659. [Google Scholar] [CrossRef] [PubMed] [Green Version]
  56. Yang, G.; Wang, Q.; Liu, C.; Wang, X.; Fan, S.; Huang, W. Rapid and Visual Detection of the Main Chemical Compositions in Maize Seeds Based on Raman Hyperspectral Imaging. Spectrochim. Acta Part A Mol. Biomol. Spectrosc. 2018, 200, 186–194. [Google Scholar] [CrossRef]
  57. Lawson, E.E.; Edwards, H.G.M.; Johnson, A.F. Fourier Transform Raman Spectroscopic Study of Hydrogen Bonding in 2,5-Dimercapto-1,3,4-Thiadiazole Using an Environmental Chamber. J. Raman Spectrosc. 1995, 26, 617–622. [Google Scholar] [CrossRef]
  58. Ghosal, S.; Macher, J.M.; Ahmed, K. Raman Microspectroscopy-Based Identification of Individual Fungal Spores as Potential Indicators of Indoor Contamination and Moisture-Related Building Damage. Environ. Sci. Technol. 2012, 46, 6088–6095. [Google Scholar] [CrossRef] [PubMed]
  59. Žukovskaja, O.; Kloß, S.; Blango, M.G.; Ryabchykov, O.; Kniemeyer, O.; Brakhage, A.A.; Bocklitz, T.W.; Cialla-May, D.; Weber, K.; Popp, J. UV-Raman Spectroscopic Identification of Fungal Spores Important for Respiratory Diseases. Anal. Chem. 2018, 90, 8912–8918. [Google Scholar] [CrossRef] [PubMed]
  60. Bhuiyan, N.H.; Selvaraj, G.; Wei, Y.; King, J. Role of Lignification in Plant Defense. Plant Signal. Behav. 2009, 4, 158–159. [Google Scholar] [CrossRef] [Green Version]
  61. Okamoto, H.; Sekimoto, Y.; Tasumi, M. Assignment and Anharmonicity Analysis of Overtone and Combination Bands Observed in the Resonance Raman Spectra of Carotenoids. Spectrochim. Acta Part A Mol. Spectrosc. 1994, 50, 1467–1473. [Google Scholar] [CrossRef]
  62. Horiue, H.; Sasaki, M.; Yoshikawa, Y.; Toyofuku, M.; Shigeto, S. Raman Spectroscopic Signatures of Carotenoids and Polyenes Enable Label-Free Visualization of Microbial Distributions within Pink Biofilms. Sci. Rep. 2020, 10, 7704. [Google Scholar] [CrossRef] [PubMed]
  63. Ermakov, I.v.; Sharifzadeh, M.; Ermakova, M.; Gellermann, W. Resonance Raman Detection of Carotenoid Antioxidants in Living Human Tissue. J. Biomed. Opt. 2005, 10, 064028. [Google Scholar] [CrossRef] [PubMed]
  64. Lu, L.; Shi, L.; Secor, J.; Alfano, R. Resonance Raman Scattering of β-Carotene Solution Excited by Visible Laser Beams into Second Singlet State. J. Photochem. Photobiol. B Biol. 2018, 179, 18–22. [Google Scholar] [CrossRef]
  65. Jin, J.-M.; Lee, J.; Lee, Y.-W. Characterization of Carotenoid Biosynthetic Genes in the Ascomycete Gibberella Zeae. FEMS Microbiol. Lett. 2010, 302, 197–202. [Google Scholar] [CrossRef] [Green Version]
  66. Cambaza, E. Comprehensive Description of Fusarium Graminearum Pigments and Related Compounds. Foods 2018, 7, 165. [Google Scholar] [CrossRef] [Green Version]
  67. Lagashetti, A.C.; Dufossé, L.; Singh, S.K.; Singh, P.N. Fungal Pigments and Their Prospects in Different Industries. Microorganisms 2019, 7, 604. [Google Scholar] [CrossRef] [Green Version]
  68. Tekle, S.; Dill-Macky, R.; Skinnes, H.; Tronsmo, A.M.; Bjørnstad, Å. Infection Process of Fusarium Graminearum in Oats (Avena Sativa L.). Eur. J. Plant Pathol. 2012, 132, 431–442. [Google Scholar] [CrossRef]
  69. Pedrós, R.; Moya, I.; Goulas, Y.; Jacquemoud, S. Chlorophyll Fluorescence Emission Spectrum inside a Leaf. Photochem. Photobiol. Sci. 2008, 7, 498. [Google Scholar] [CrossRef] [PubMed] [Green Version]
  70. Menke, W.; Schmid, G.H. Fluorescence and Photochemical Properties of Plants with Defective Photosystem II. Z. Nat. C 1980, 35, 461–466. [Google Scholar] [CrossRef]
Figure 1. Normalized FTIR absorbance spectra of 20 healthy (a) and 20 infected (b) grains (grey). The averaged spectra are colored with green and red respectively.
Agronomy 11 02402 g001
Figure 2. Normalized and averaged by 20 grains FTIR absorbance spectra (top) for healthy (green) and infected (red) cases and their difference spectrum (bottom).
Agronomy 11 02402 g002
Figure 3. Loadings for the first 3 PCs for FTIR data at the bottom for PC1, at the center for PC2 and at the top for PC3.
Agronomy 11 02402 g003
Figure 4. PCA scores graphs: (a)—PC1-PC2, (b)—PC1-PC3 and (c)—PC2-PC3. The black color is used for the healthy scores and red color is used for infected and their 95% probability ellipsoids with the corresponding color.
Agronomy 11 02402 g004
Figure 5. Raman spectra obtained from the healthy grain (a) and the microphoto of investigated area with 50× magnification (b). Raman spectra from the fungi hypha area of the infected grain (c) and corresponding microphoto with 50× magnification (d). All spectra were collected using the 785 nm laser. Scale bar in microns.
Agronomy 11 02402 g005
Figure 6. Loadings spectra for the first 3 PCs for Raman data at the bottom for PC1, at the center for PC2 and at the top for PC3.
Agronomy 11 02402 g006
Figure 7. Scores graphs for first 3 PCs (a), PC1-PC2 (b), PC1-PC3 (c), and PC2-PC3 (d) and their 95% probability ellipsoids. The black color is used for the healthy score and red color is used for infected.
Agronomy 11 02402 g007
Figure 8. Integral intensities of the Raman spectra from regions: 1190–1400 cm−1 and 1400–1650 cm−1 for healthy (green) and infected (red) grains. 95% probability ellipsoids and their main axes are also presented, Euclidean distance between ellipsoid centers is about 101 a.u.
Agronomy 11 02402 g008
Figure 9. Ratio A(1565–1670)/A(1400–1565) of integral intensities for healthy and infected grains, where A(1565–1670)—integral intensity in 1565–1670 cm−1 region and A(1400–1565)—integral intensity in 1400–1565 cm−1 region. The confidence interval (CI) is presented in Table 4.
Agronomy 11 02402 g009
Figure 10. Raman spectra with highlighted carotenoid peaks obtained at the fungi infected oat grain area as is (blue) and with the baseline correction (red).
Agronomy 11 02402 g010
Figure 11. Luminescence microscope images from the area of infected (ae) and healthy (f,g) grains emission in the regions 425–738 nm (a,f), 425–475 nm (b,g), 500–550 nm (c,h), 570–620 nm (d,i) and 663–738 nm (e,g).
Agronomy 11 02402 g011
Figure 12. Normalized luminescence spectra obtained by Luminescence microscope (red) under 405 nm excitation and Raman spectrometer (blue) under 514.5 nm excitation.
Agronomy 11 02402 g012
Table 1. Assignment of relevant FTIR-ATR absorption bands characteristic of healthy and infected grains [42,43,44,45,46,48], where v—stretching mode, δ—bending mode, s—symmetric, as—antisymmetric.
Peak Frequency, cm−1Peak Assignments
Healthy GrainInfected Grain
892892β(1-4)-glycosidic linkage in cellulose
10251026v(C-O)
11561156vas(C-O-C) vibrations in bridge structures
13161316δ(COH), δ(HCC)
13721372δ(COH), δ(HCC) in cellulose and hemicellulose
14201416δ(H-C-H), δ(O-C-H)
15141514v(C=C), δ(XCH), aromatic ring in lignin
16021600v(C=C),
16301630δ(H-O-H)
17321732v(C=O)
28482848vs(C-H) in methylene group
29182916vas(C-H) in methylene group
32753269v(O-H) intra- and inter-molecular hydrogen bonding, absorbed water
Table 2. Comparison of several classification models for FTIR data (the data was rounded to the second meaning digit).
ModelScores DataAccuracy for Training Set,
Prediction Set, Total Set
Sensitivity for Training Set,
Prediction Set, Total Set
Specificity for Training Set,
Prediction Set, Total Set
PCA-SVM (with RBF kernel and regularization parameter 10)PC1, PC2 0.90, 0.90, 0.900.93, 0.80, 0.900.87, 1.00, 0.90
PC1, PC30.83, 0.80, 0.830.93, 0.80, 0.900.73, 0.80, 0.75
PC2, PC30.80, 0.90, 0.830.73,0.80,0.750.87, 1.00, 0.90
PC1, PC2,PC30.93, 1.00, 0.950.93, 1.00, 0.950.93, 1.00, 0.95
PCA-LDAPC1, PC2 0.60, 0.60, 0.600.69,0.67,0.680.57, 0.80, 0.63
PC1, PC30.50, 0.90, 0.600.50, 1.00, 0.620.50, 0.80, 0.58
PC2, PC30.57, 0.60, 0.58 0.63, 0.40, 0.570.67, 0.80, 0.71
PC1, PC2,PC30.60, 0.70, 0.630.59, 0.60, 0.590.62, 0.80, 0.67
Table 3. Comparison of several classification models for Raman data scores (the data was rounded to the second meaning digit).
ModelScores DataAccuracy for Training Set,
Prediction Set, Total Set
Sensitivity for Training Set,
Prediction Set, Total Set
Specificity for Training Set,
Prediction Set, Total Set
PCA-SVM (with RBF kernel and regularization parameter 10)PC1, PC2 1.00, 1.00, 1.001.00, 1.00, 1.001.00, 1.00, 1.00
PC1, PC31.00, 1.00, 1.001.00, 1.00, 1.001.00, 1.00, 1.00
PC2, PC30.97, 1.00, 0.980.93, 1.00, 0.951.00, 1.00, 1.00
PC1, PC2, PC31.00, 1.00, 1.001.00, 1.00, 1.001.00, 1.00, 1.00
PCA-LDAPC1, PC2 1.00, 1.00, 1.001.00, 1.00, 1.001.00, 1.00, 1.00
PC1, PC31.00, 1.00, 1.001.00, 1.00, 1.001.00, 1.00, 1.00
PC2, PC30.80, 0.60, 0.75 0.60, 0.25, 0.501.00, 1.00, 1.00
PC1, PC2, PC31.00, 1.00, 1.001.00, 1.00, 1.001.00, 1.00, 1.00
Table 4. The mean value, standard deviation, standard error of mean, confidence interval (CI) parameters for 95% criteria, minimum, median, maximum, Raman spectra integral intensity values for characteristic regions taken from healthy and infected grains. Raman spectra were baseline corrected and normalized by maximum before calculations.
Infected GrainHealthy Grain
Spectral Range1190–1400 cm−11400–1565 cm−1A(1565–1670)/A(1400–1565)1190–1400 cm−11400–1565 cm−1A(1565–1670)/A(1400–1565)
Integral Intensity
Mean value, a.u.94.8266.170.7514.295.363.18
Standard deviation, a.u.12.9519.480.101.841.180.40
Standard error of mean value, a.u.2.904.730.020.410.260.09
Lower 95% CI of Mean88.7656.150.7213.434.802.99
Upper 95% CI of Mean100.8876.190.8015.155.913.36
Minimum, a.u.69.7632.510.5511.273.292.63
Median, a.u.93.9967.930.7514.135.23.13
Maximum, a.u.129.41102.160.9716.986.863.94
Publisher’s Note: MDPI stays neutral with regard to jurisdictional claims in published maps and institutional affiliations.

