
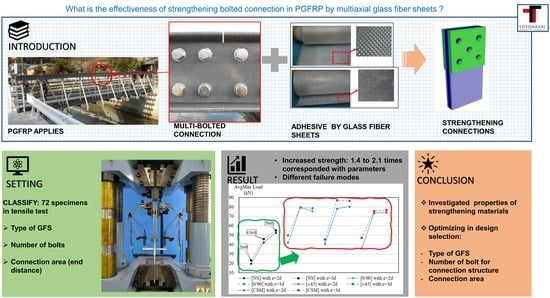
Multi-Bolted Connection for Pultruded Glass Fiber Reinforced Polymer’s Structure: A Study on Strengthening by Multiaxial Glass Fiber Sheets


Abstract
:
1. Introduction
2. Experimental Design
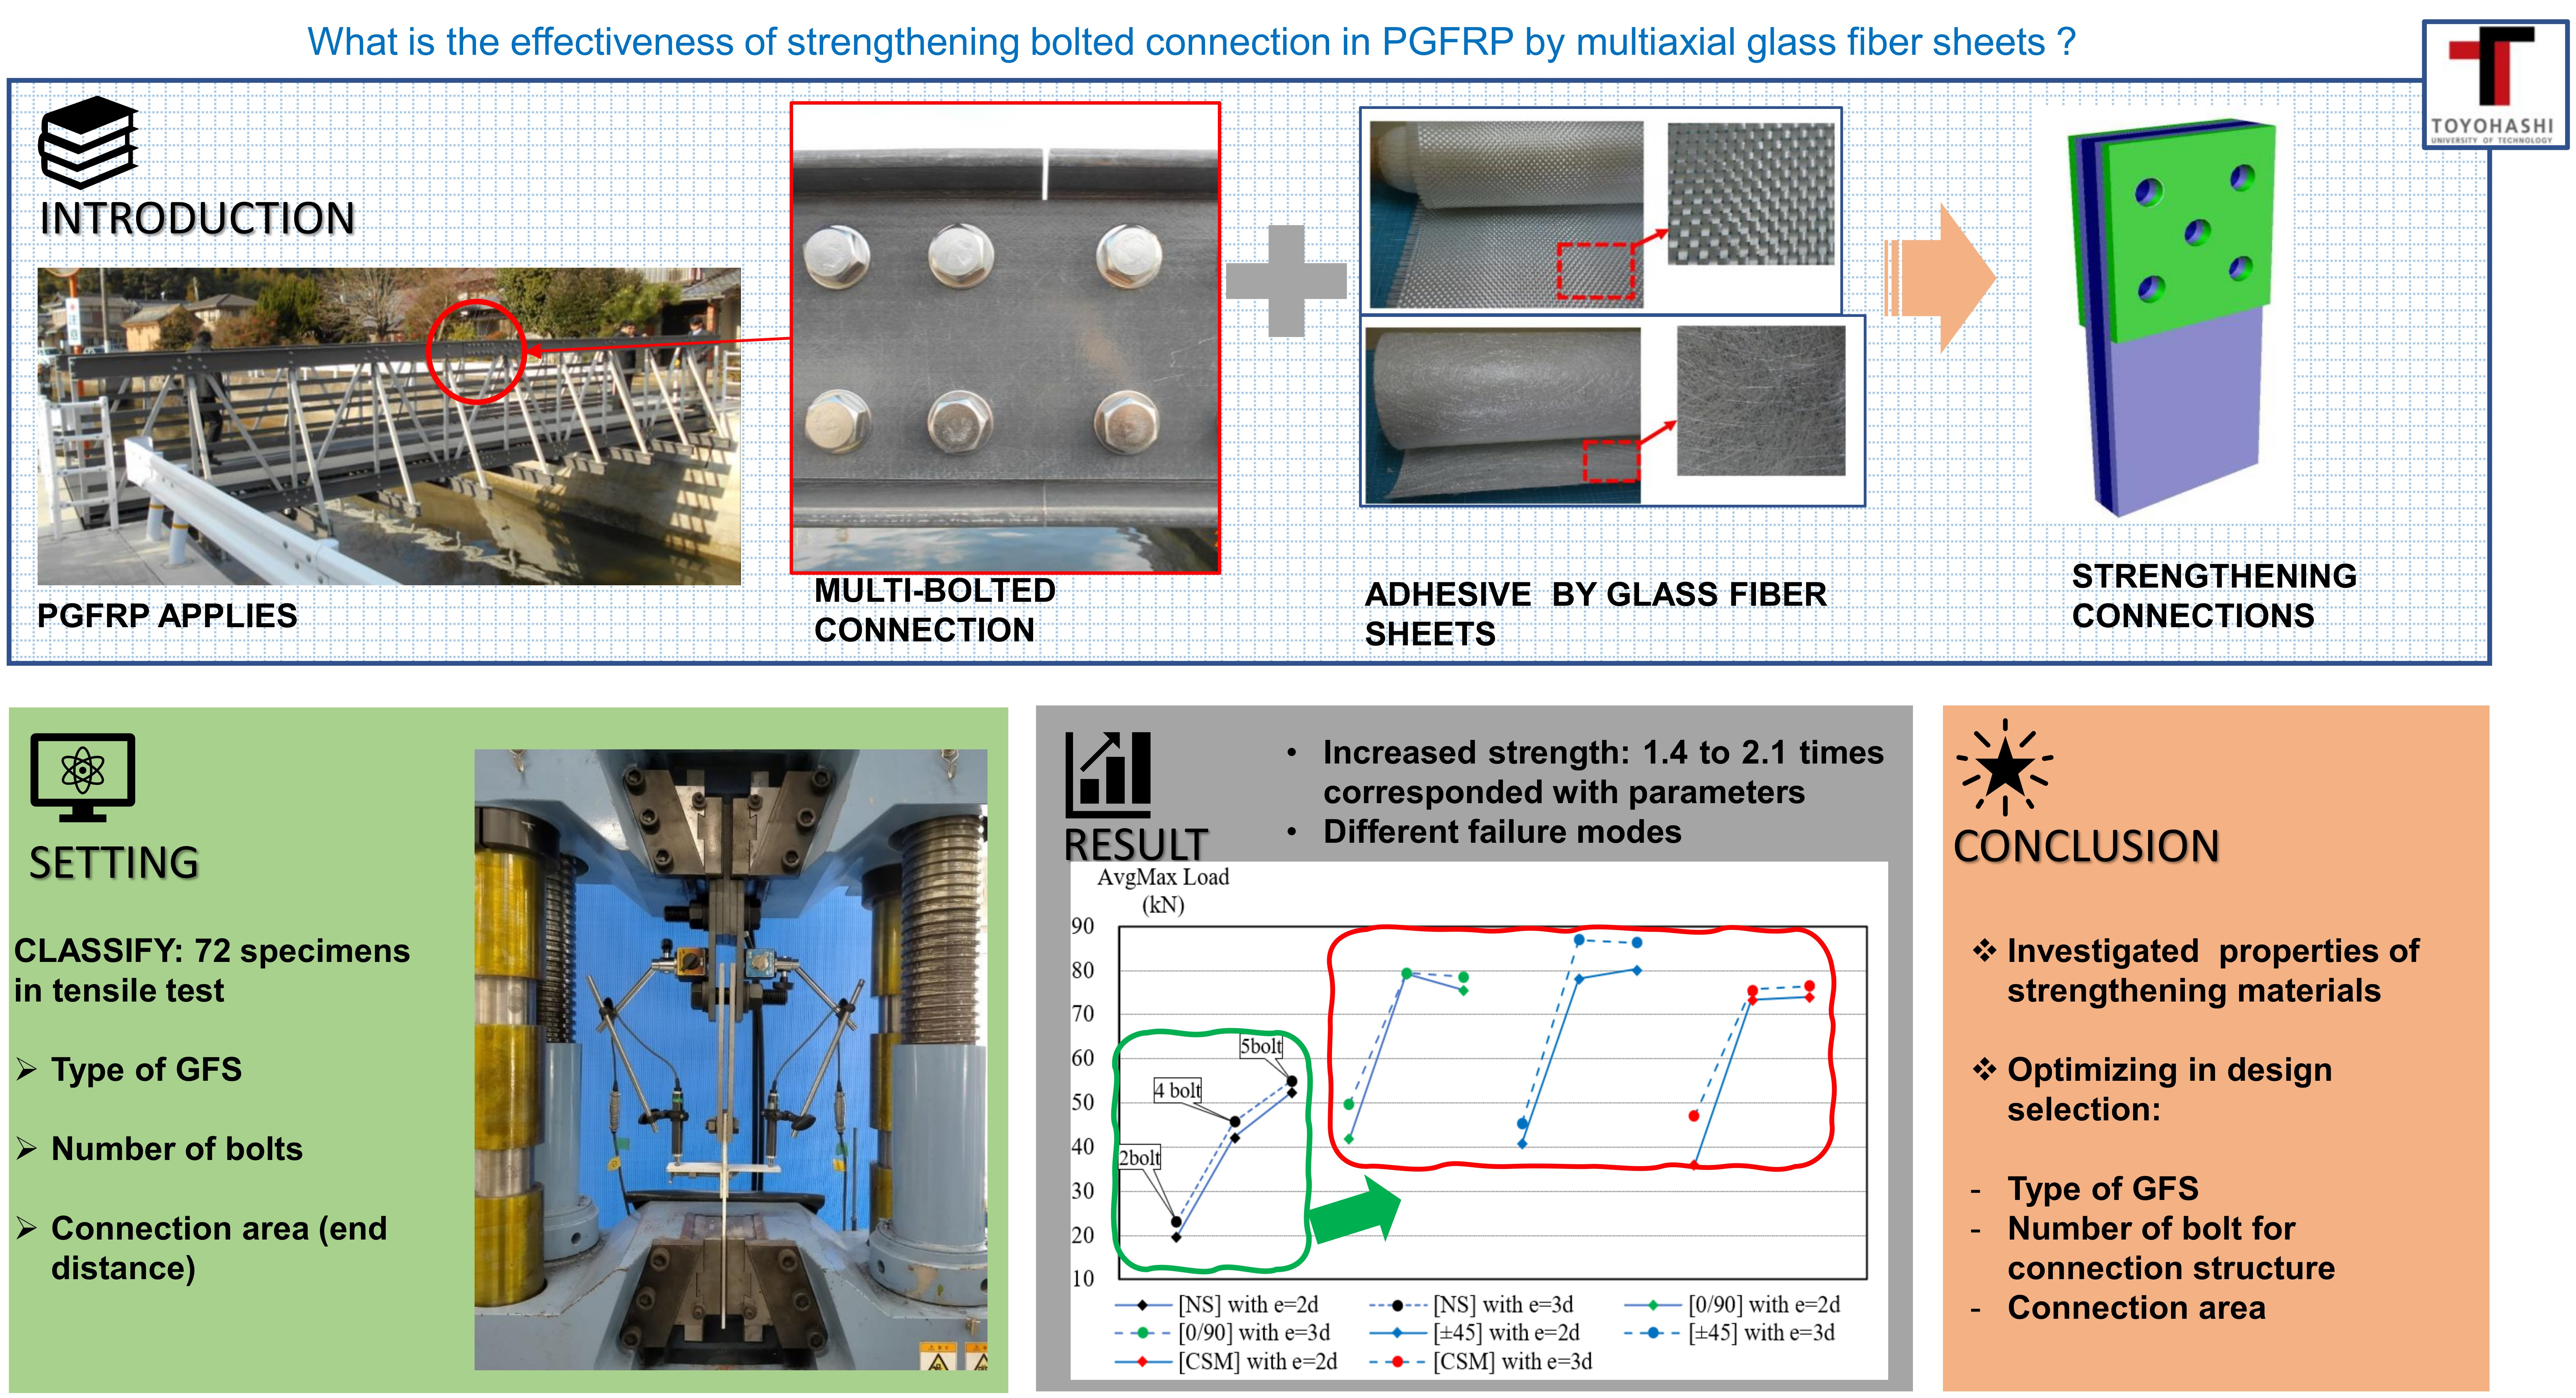
2.1. Connection System
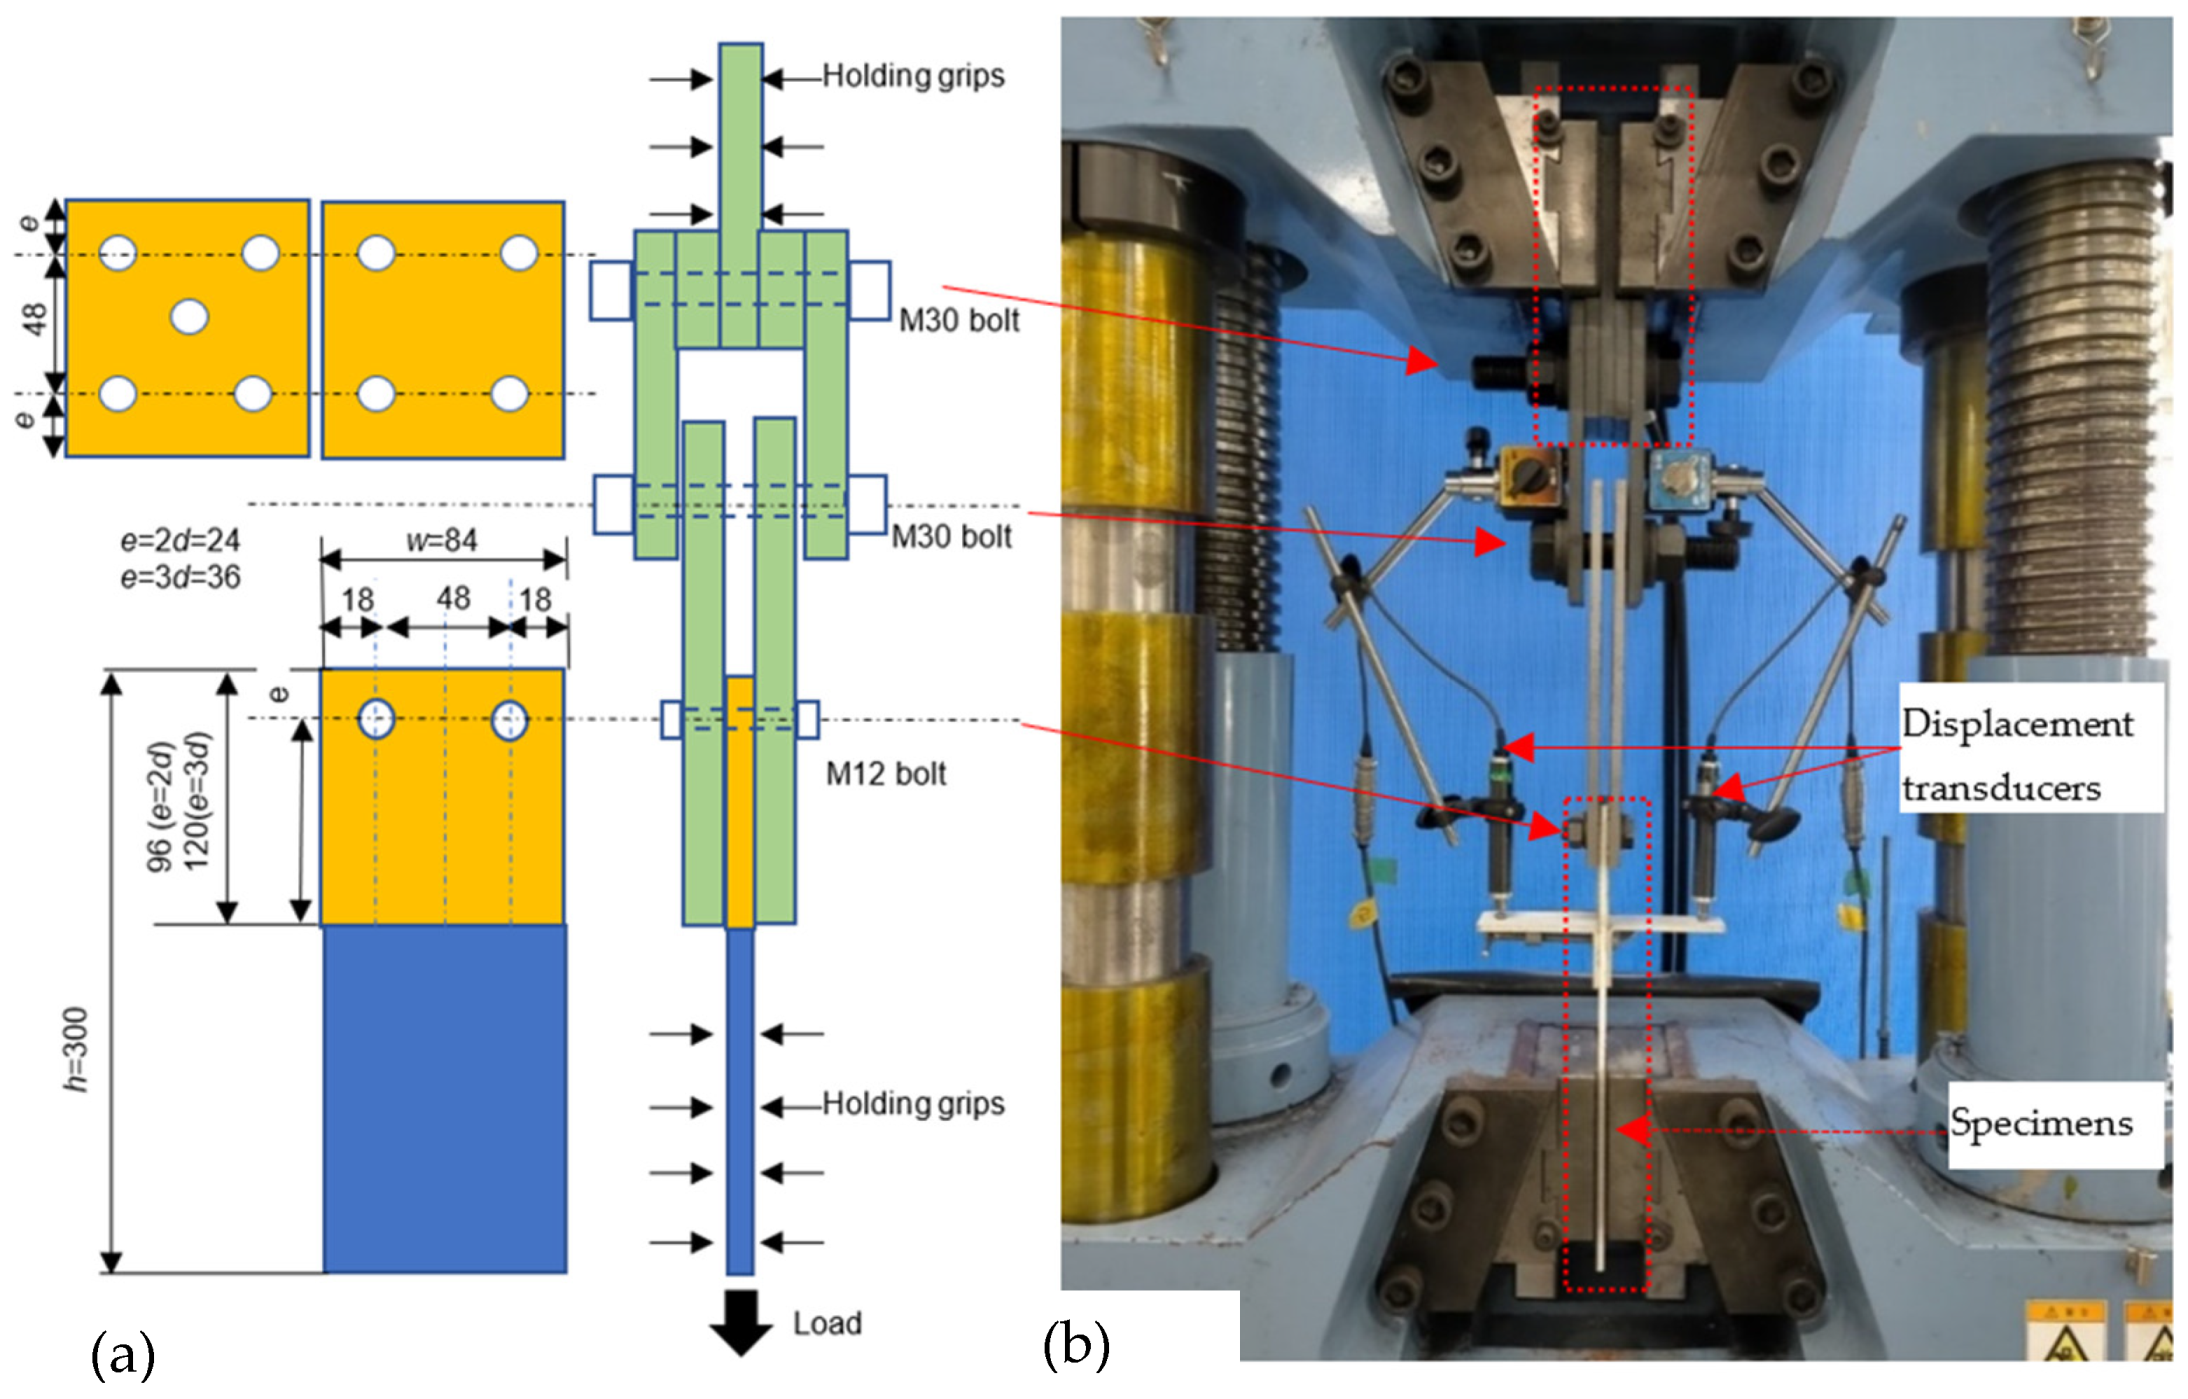
2.2. Bolts and Bolt Holes
2.3. Prediction of Modes of Failure
3. Specimens’ Material
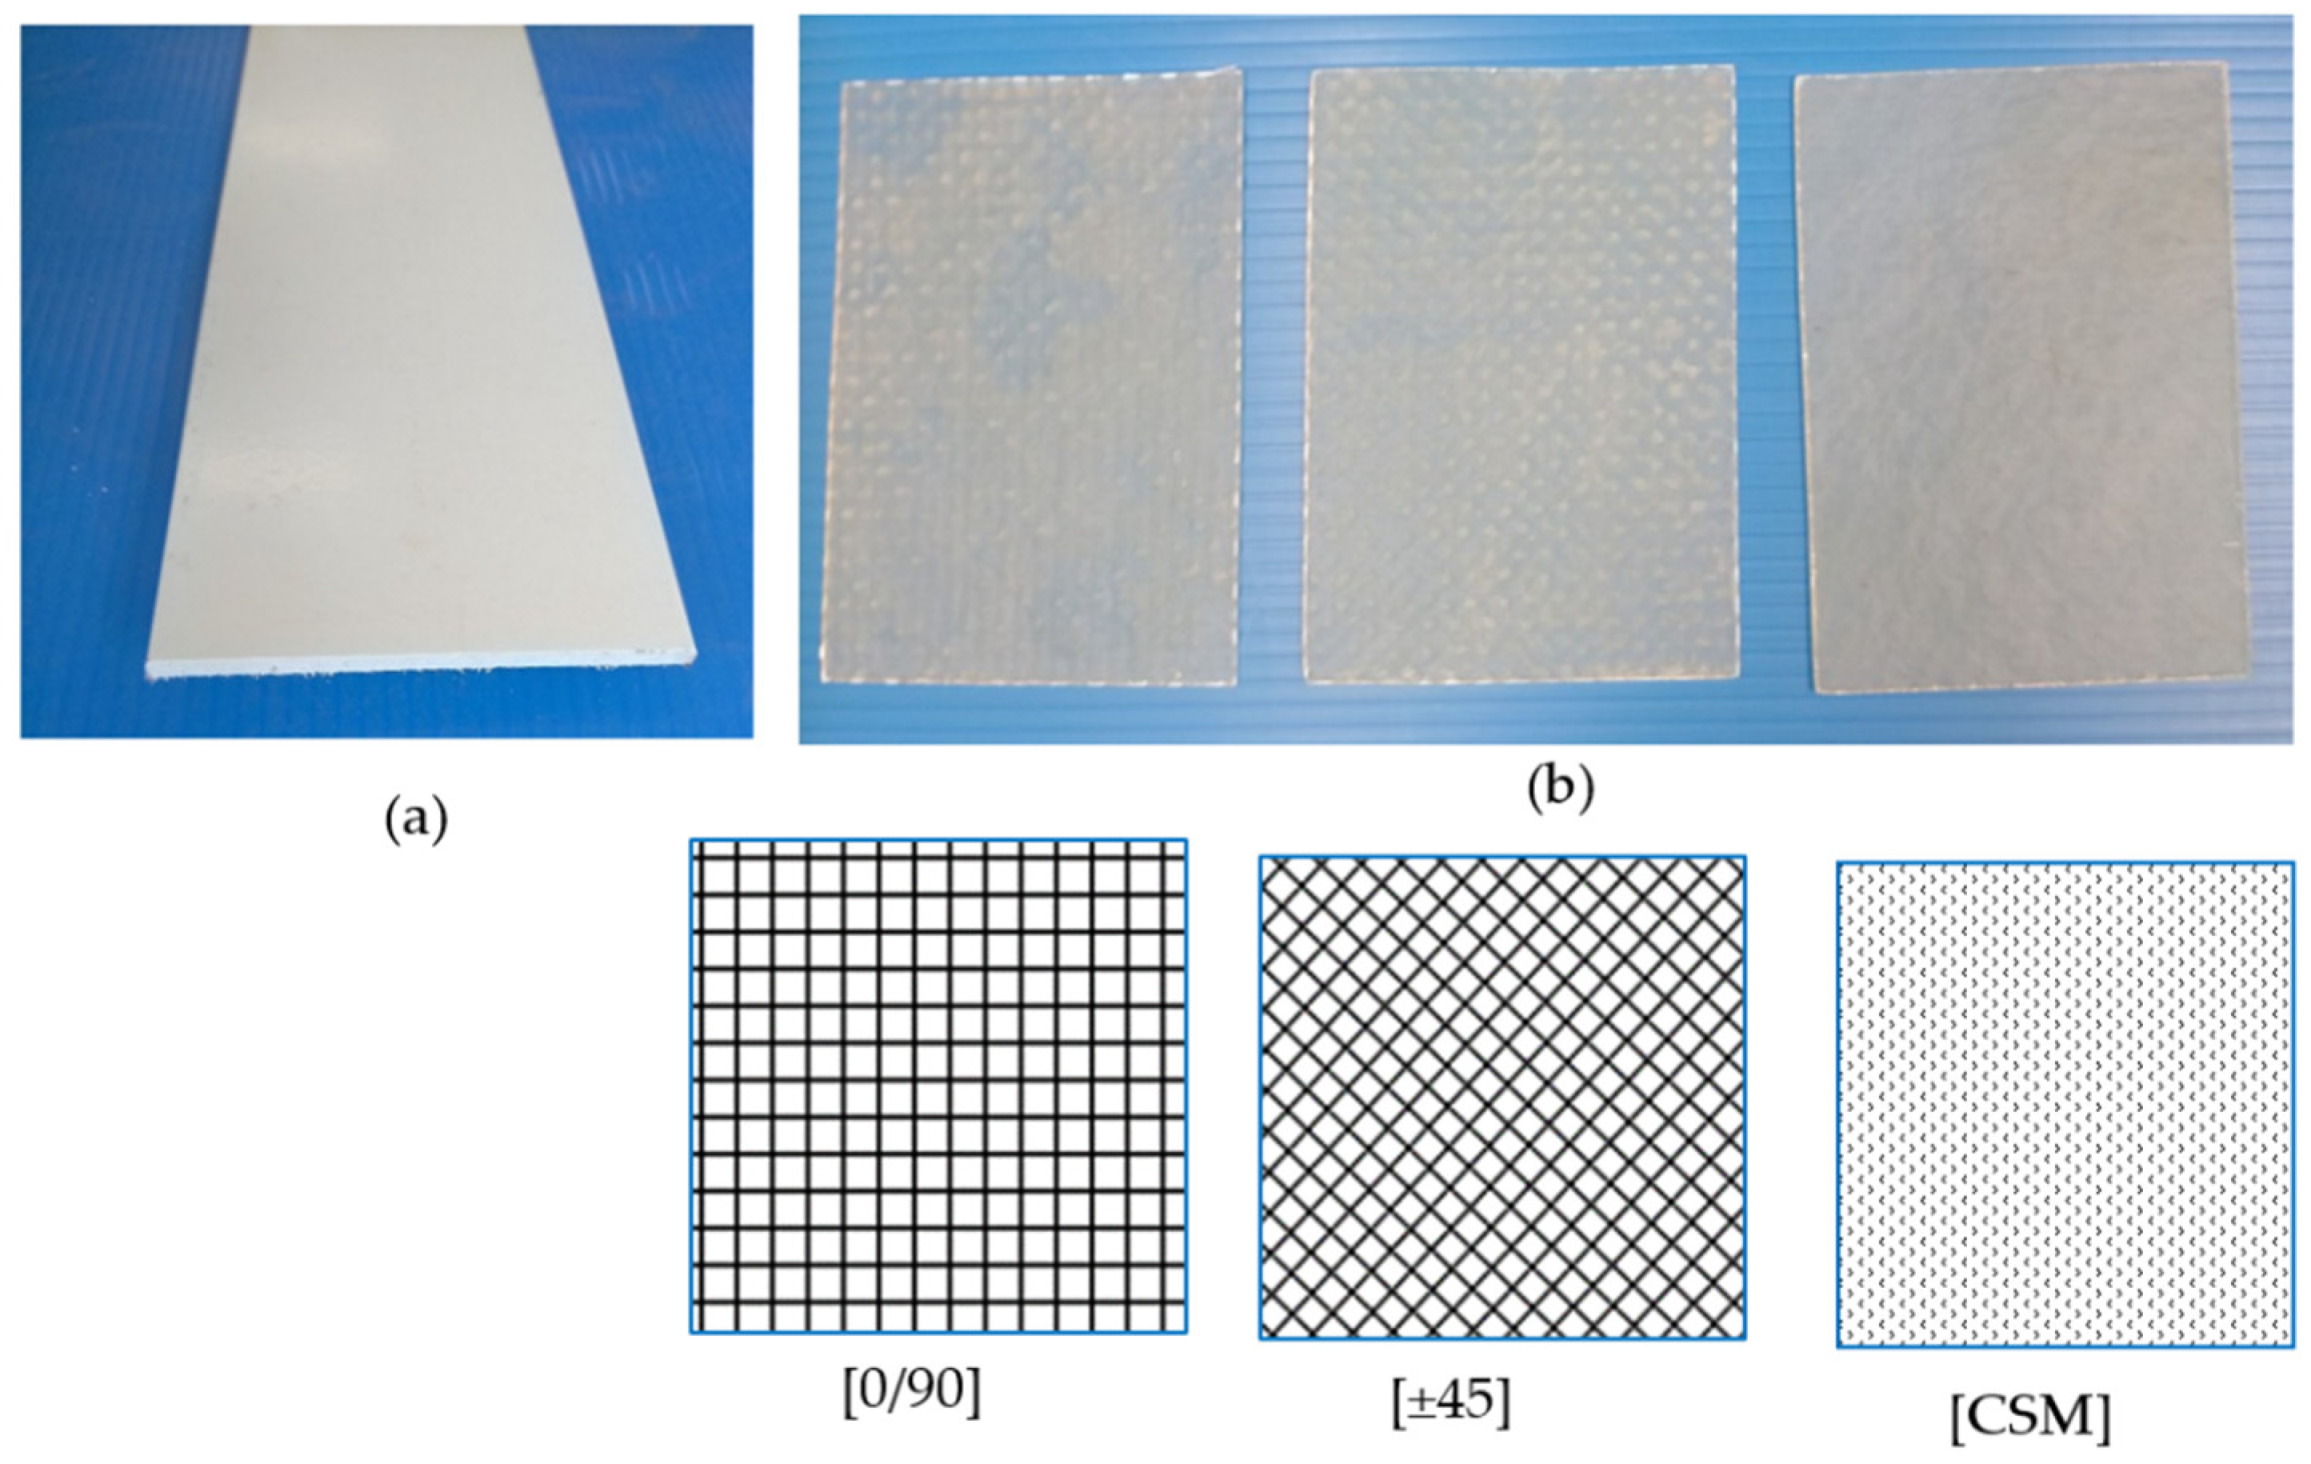
3.1. PGFRP Material
3.2. Strengthening by Fiber Sheet
4. Experiment Procedure
4.1. Setup and Instrumental for Connection Tests
- NST-N is the non-strengthened specimen;
- [0/90]T-N, [±45]T-N, and [CSM]T-N are the specimens strengthened by (on both sides) 0°/90°GFS, ±45° GFS, and CSM GFS;
- T is the ratio of end distance (e) and bold diameter (d) (e = 2d and e = 3d);
- N is the number of bolts, respectively (N = 2; 4 and 5).
4.2. Expanding the Strengthening Area for the Connection Tests
5. Results and Discussions
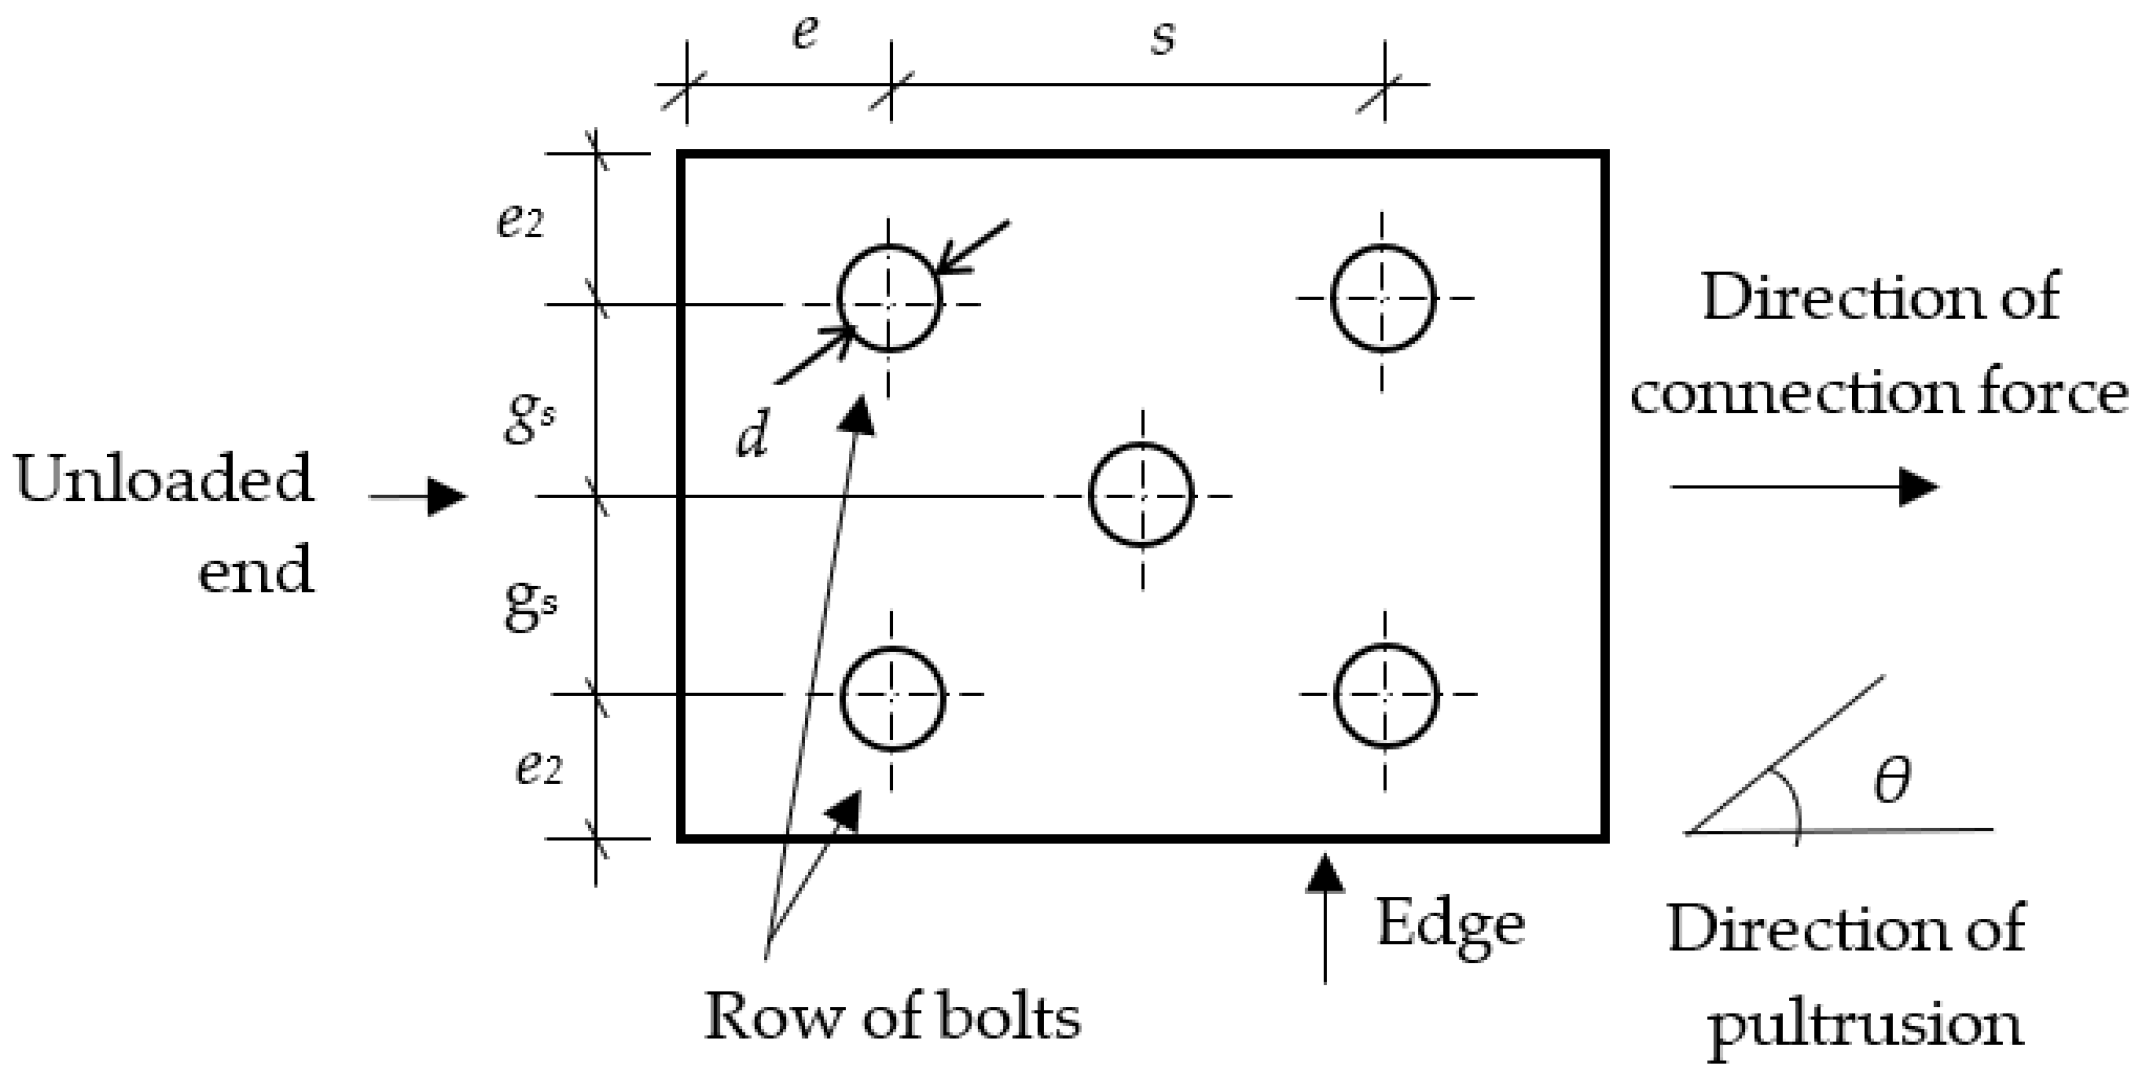
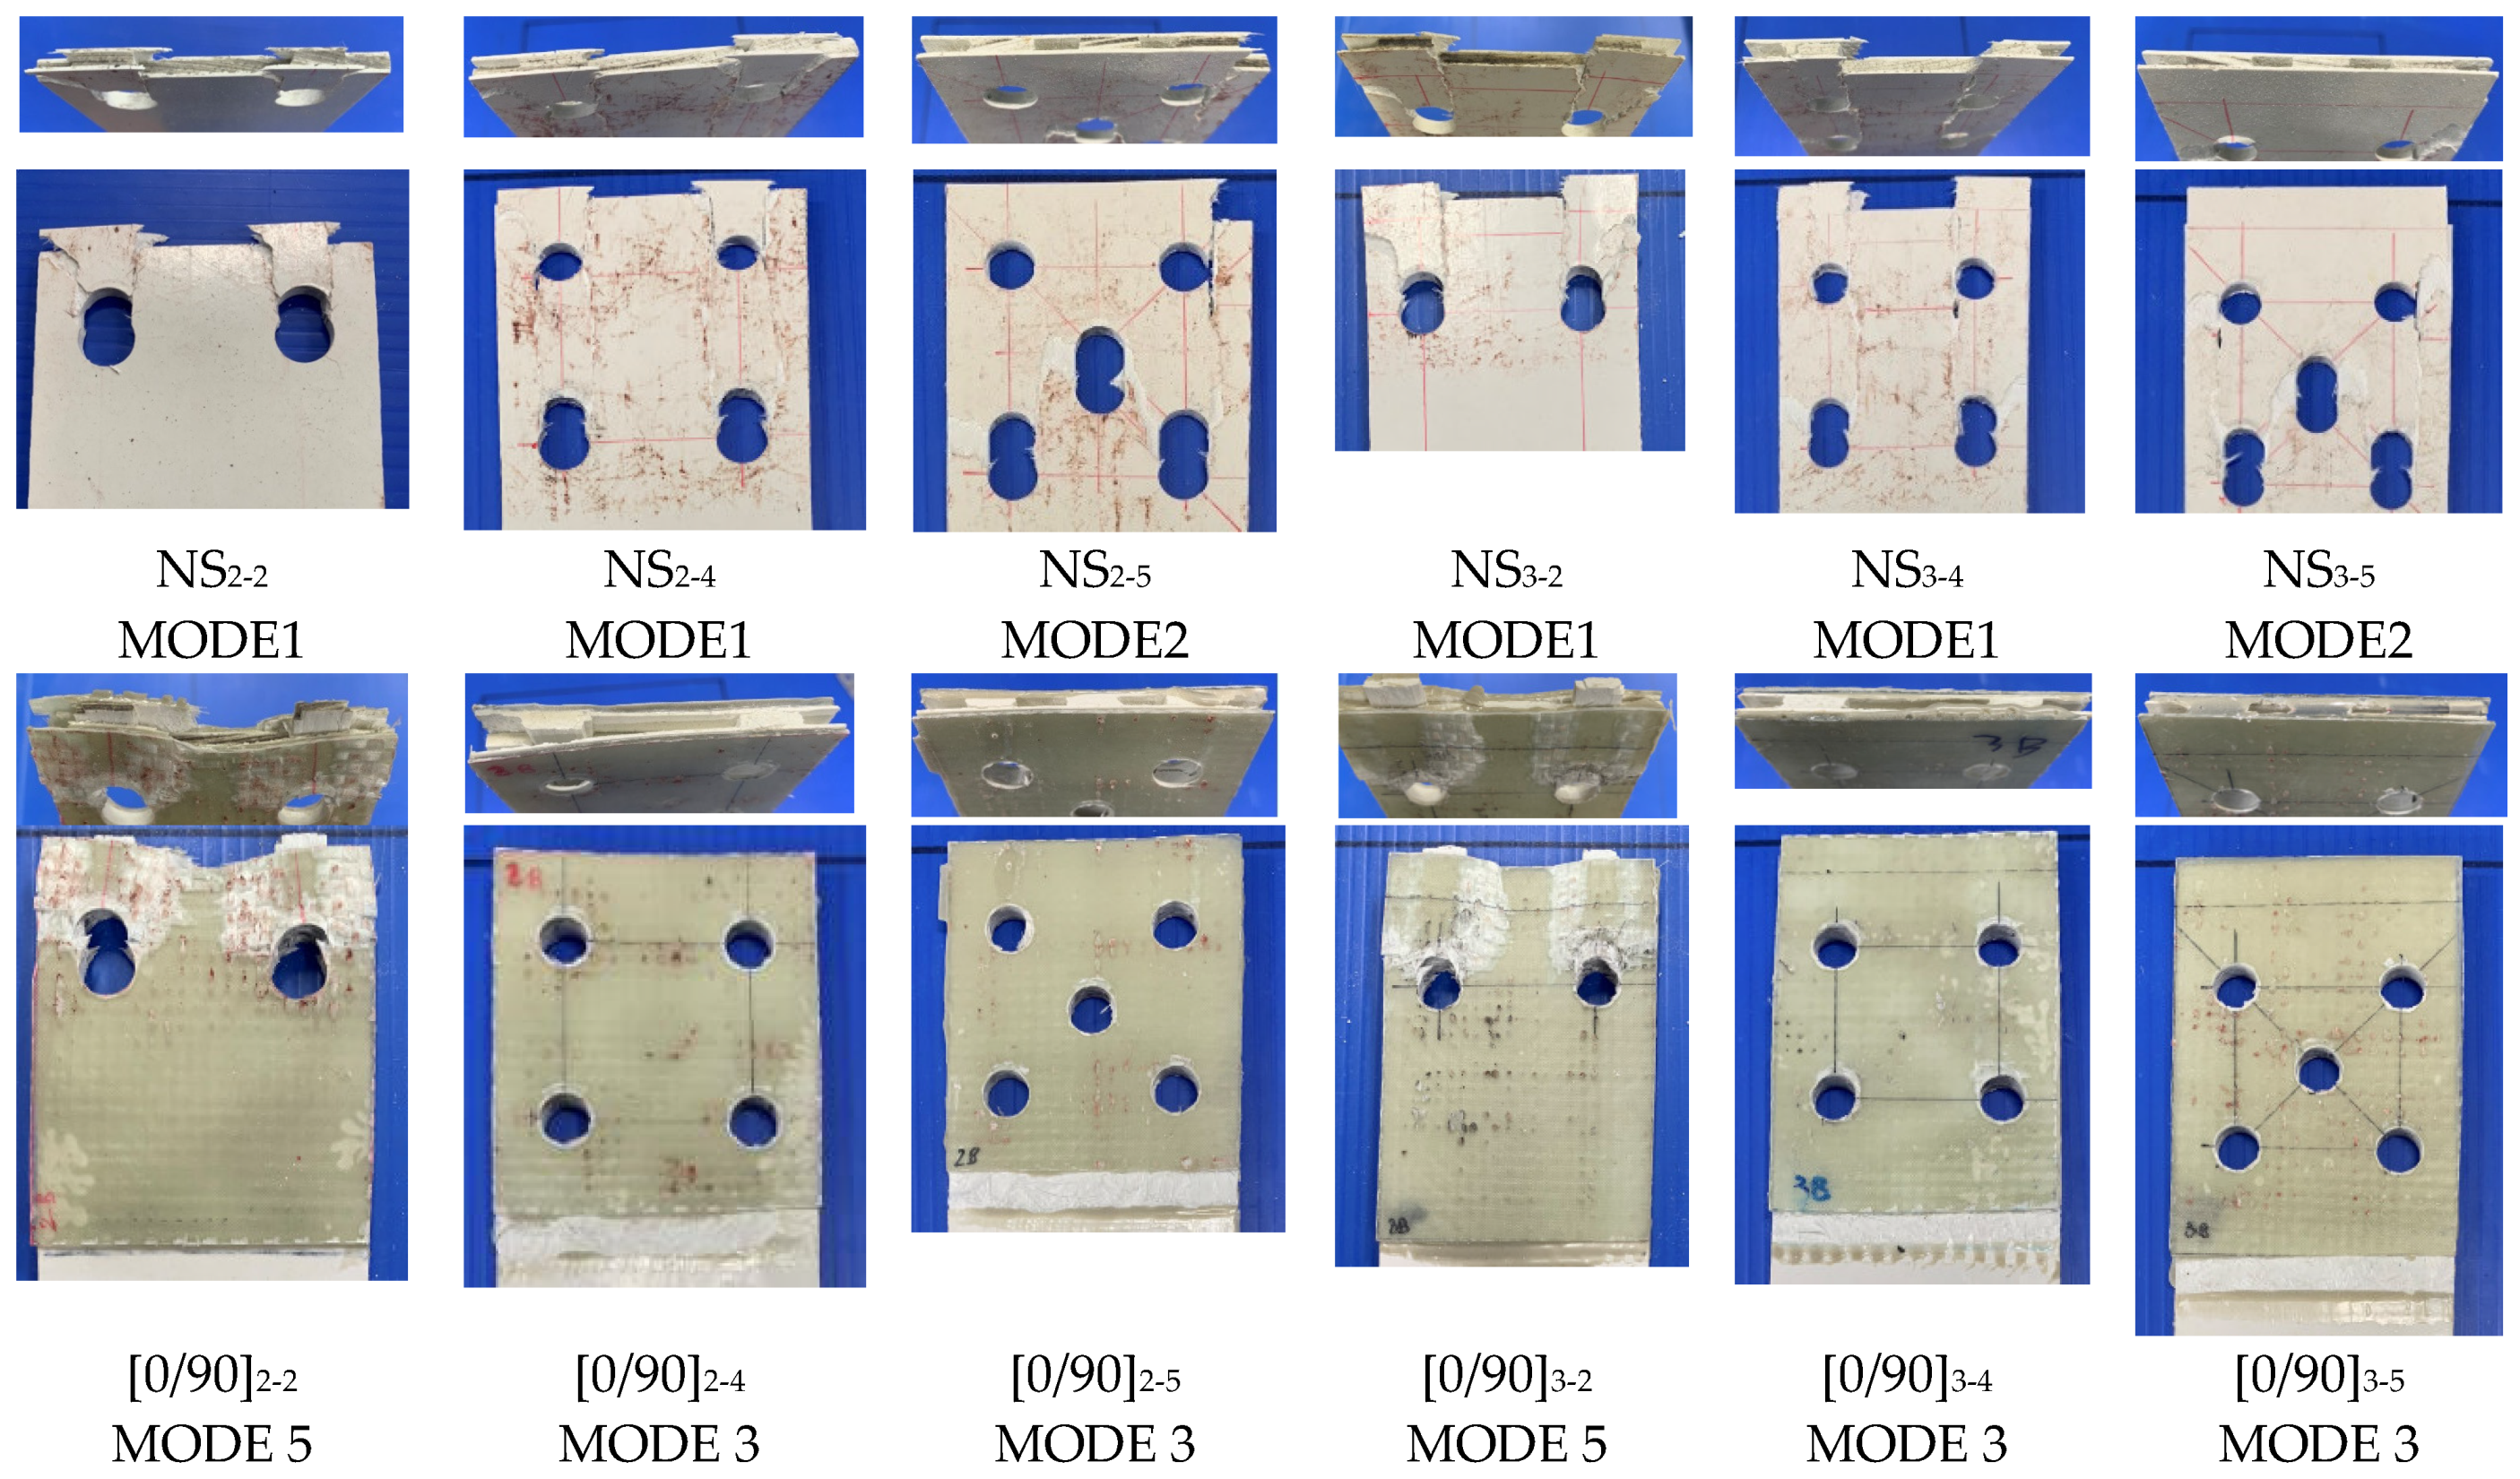
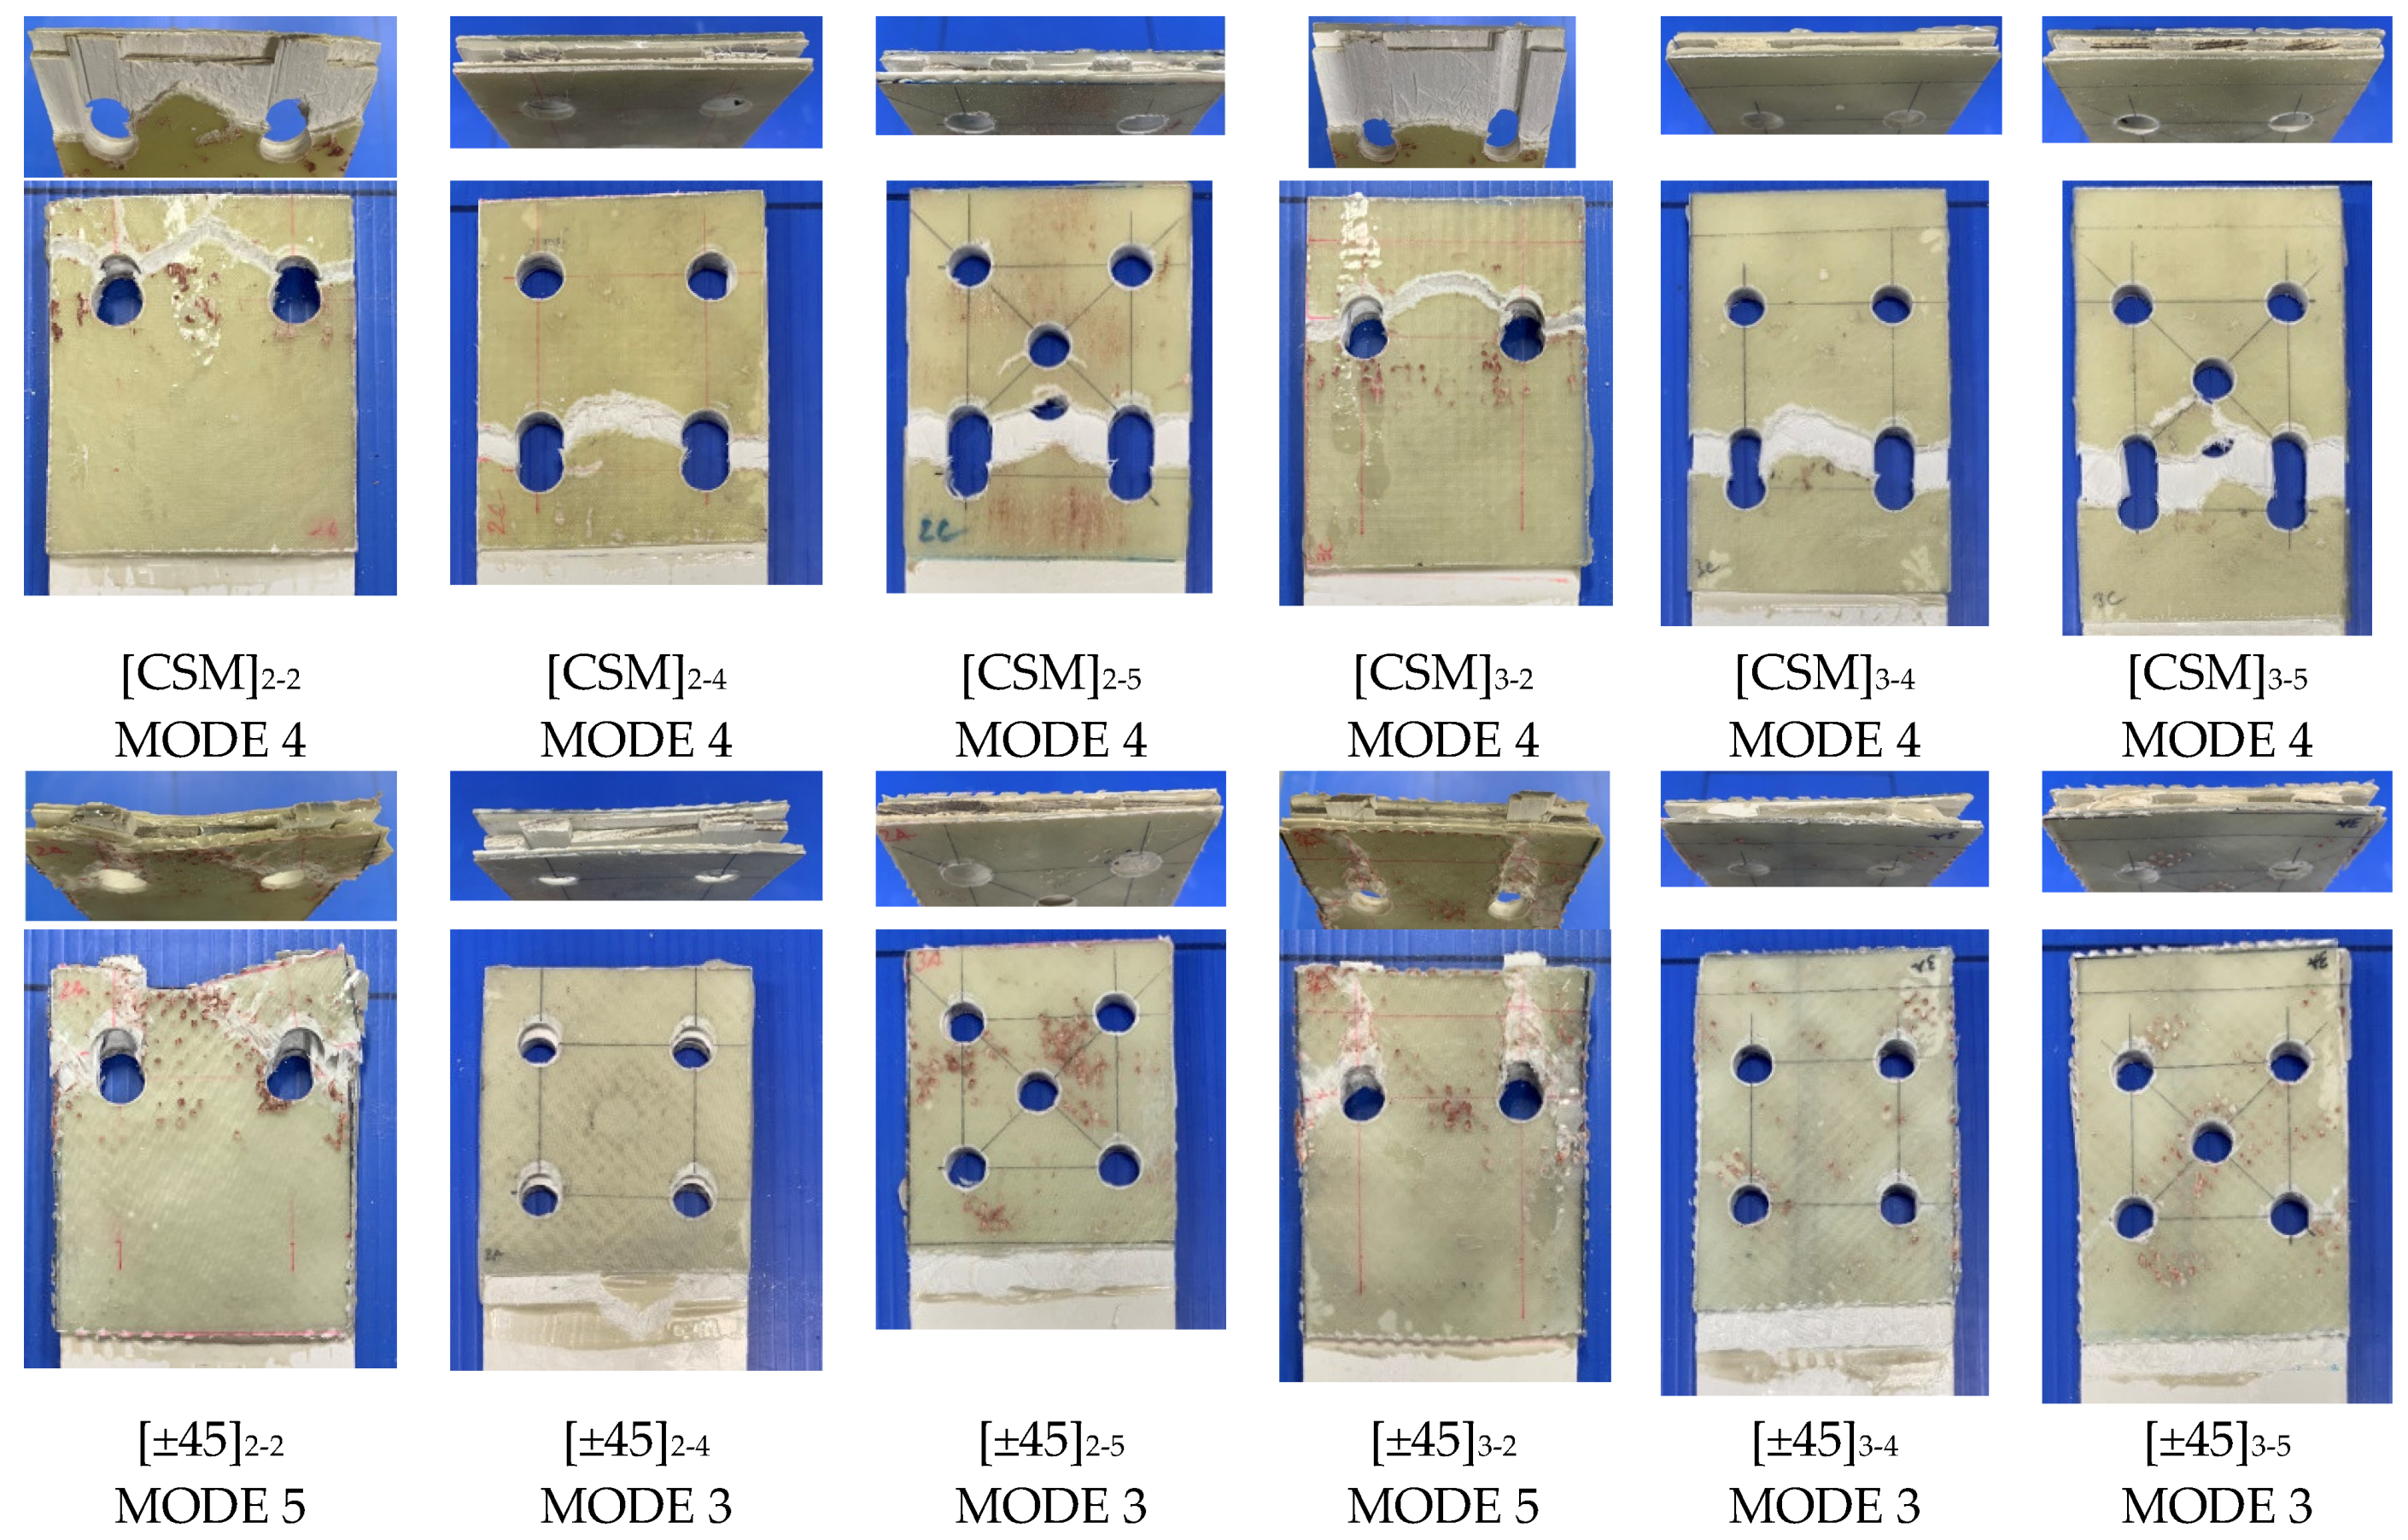
5.1. Failure Modes of the Specimens in the PGFRP Connections
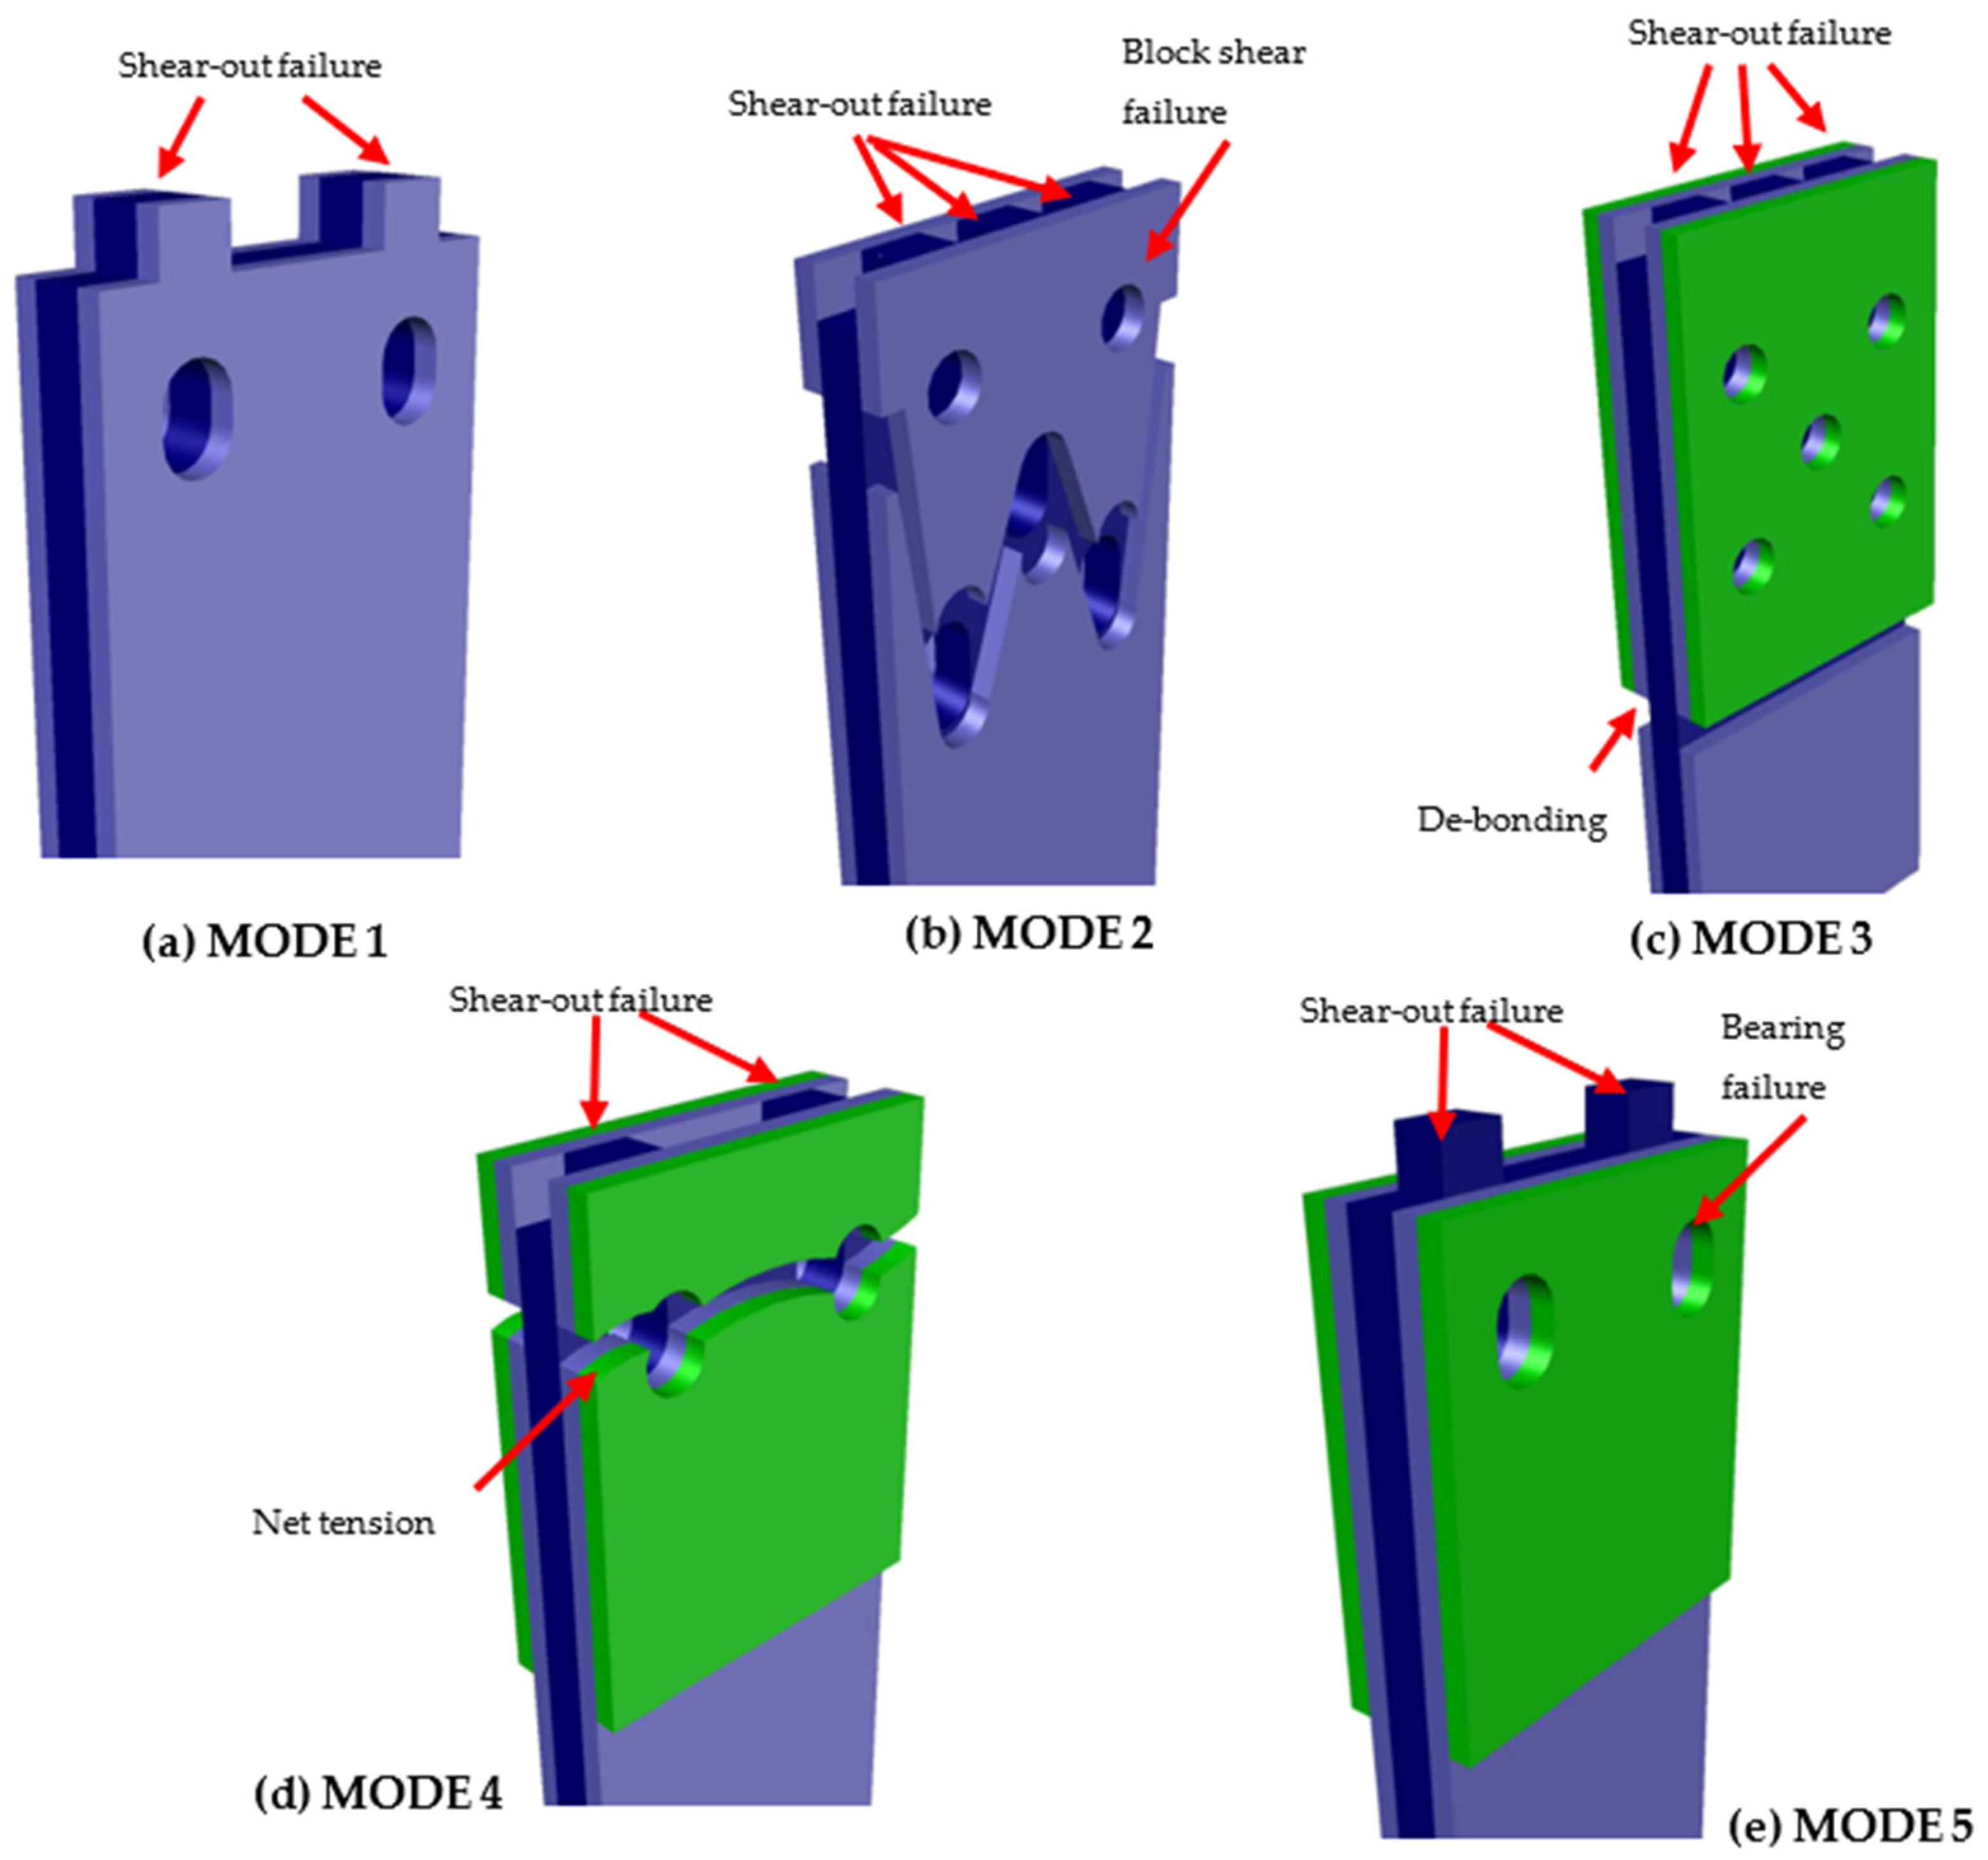
- MODE 1 was a shear-out failure in both the GFM and CD layers in two bolts and four bolts with non-strengthened specimens (NS).
- MODE 2 is a two-element failure mode: shear-out inside (CD layer) and block shear failure outside (GFM layer), which occurred in five-bolt NS specimens.
- MODE 3 is a combined failure mode with shear-out in the CD layer as GFM and GFS de-bonded together. This failure mode occurred in four- and five-bolt specimens with [0/90] and [±45] GFS.
- MODE 4 was obtained in all CSM-strengthened specimens (two, four, and five bolts). It consists of net-tension in the GFS and GFM parts and shear-out in the GFM part.
- The MODE 5 failure type was a bearing in the GFS/CD part and shear-out in the CD part. This mode was taken in [0/90] and [±45] GFS specimens with two bolts.
- Rbt = Bolt strength;
- Rtt = Tension (through-the-thickness) strength;
- Rbr = Pin-bearing strength;
- Rnt,f = Net-tension strength at the first bolt row;
- Rsh = Shear-out strength;
- Rbs = Block shear strength for concentric load; and
- Rbs,e = Block shear strength for eccentric load
- MODE 1 occurred in all thicknesses of NS two and four bolts. The results met with previous studies’ results that investigated the failure mode in the base plate PGFRP. The shear-out strength of the CD layer is much less in comparison with the bearing or tensile strength. Therefore, the shear-out failure mode has appearance in CD and lead to GFM layer shear-out meanwhile the loading increases.
- The other mode in NS is MODE 2, the block shear failure mode, which occurred with three-bolt rows in five-bolt specimens. As shown in Appendix A, block shear strength was considered as the weakest. After block shear failure occurred, the second component failure came with shear-out of the inside layer (CD), corresponding with the order of strength size.
- The debonding failure witnessed in MODE 3 occurred in the whole GFS strengthening area. As indicated by the ASCE [15] principle, bonding strength tended to increase to the combined strength of the bearing or shear-out strength of GFM/GFS before debonding. However, due to debonding occurring in the whole surface of the GFM/GFS area, only in the CD layer, which weakest with shear-out strength, was failure consequently.
- By a similar method, MODE 4 failure in the [CSM] specimens can be explained. After loading reached the lowest combined strength (the tensile strength) the net-tension failure occurred. Consequently, the CD layer inside also demonstrated shear-out. In e = 2d and two-bolt specimens, the tensile and shear strength in GFM/GFS were equivalent, thereby leading to the “hybrid mode” in which shear-out and net-tension failure co-occurred.
- With reference to Appendix A, the combined bearing strength of GFM/GFS was lower than others. Therefore, MODE 5 occurred in [0/90] and [±45] GFS with two-bolt specimens corresponded with the bearing failure modes.
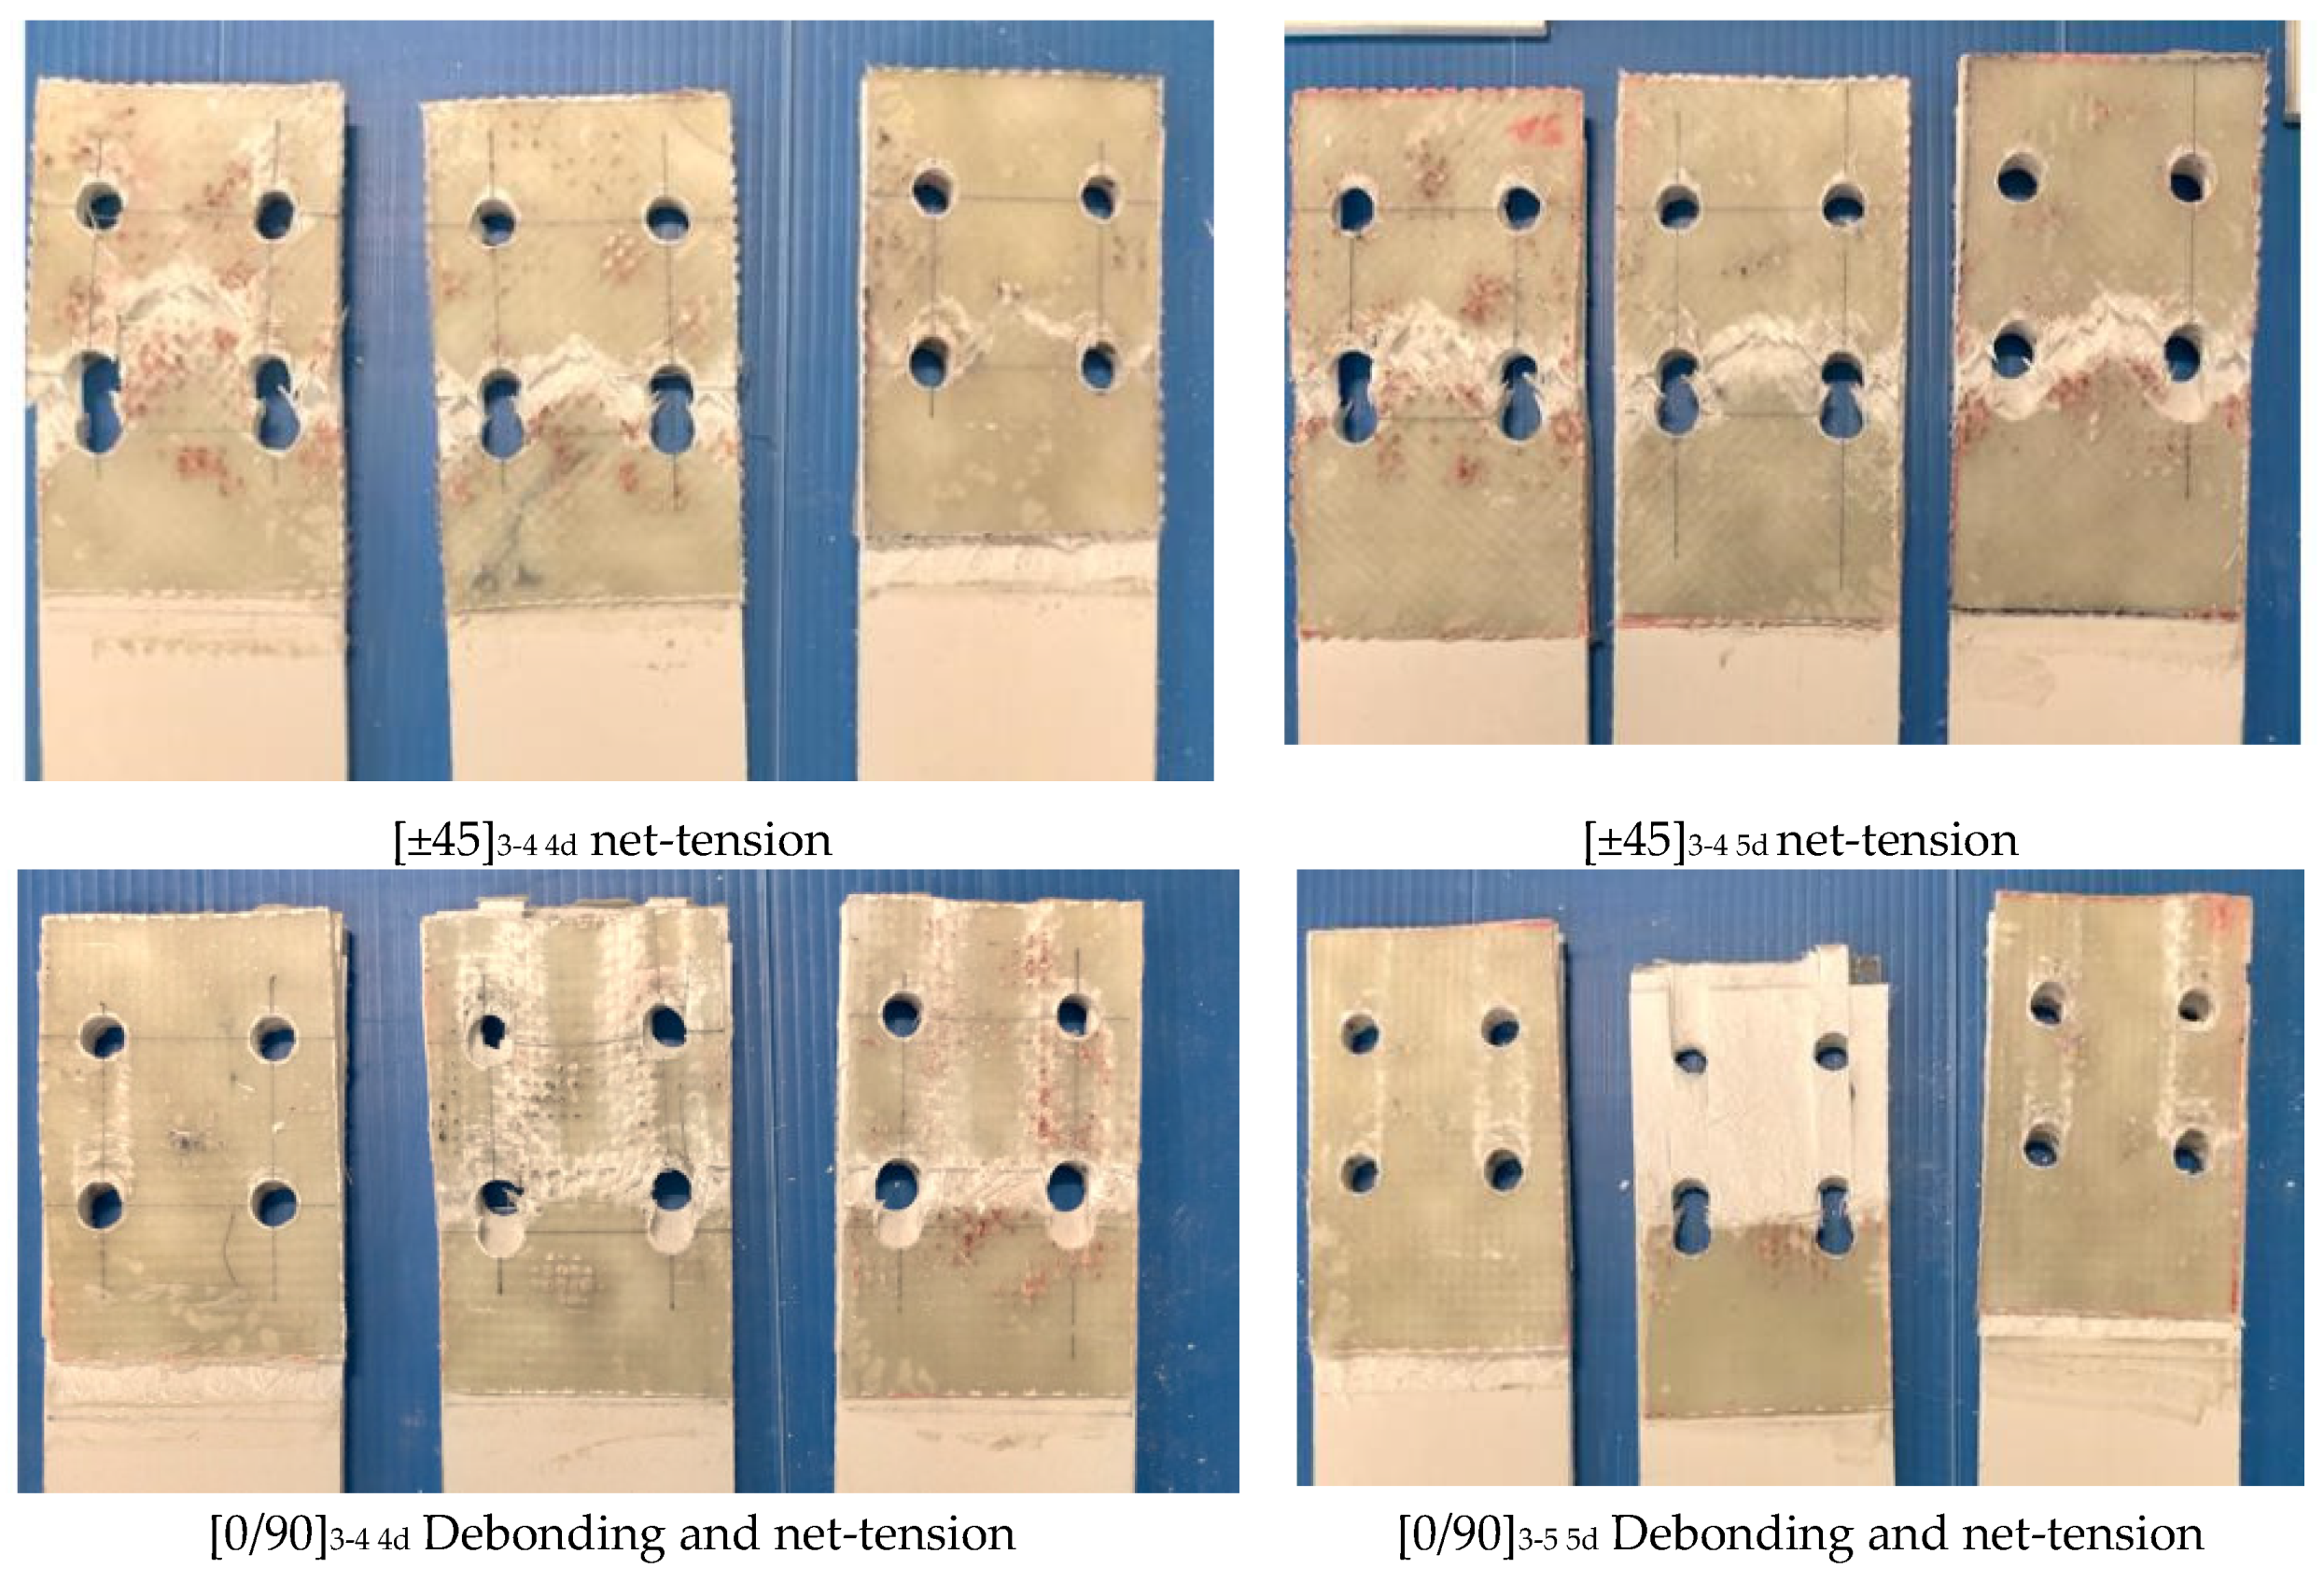
- There was a distinction in the failure modes of GFS area-expanded specimens. The net-tension occurred in all specimens [±45]3-4 4d and [±45]3-4 5d. The debonding was a major failure mode in [0/90]3-4 4d and [0/90]3-4 5d, as depicted in Figure 9. Previously, Nhut [46] measured the tensile stress of [±45] and [0/90]. The result was that the tensile stress of the [0/90] specimen was two times higher than that of the [±45] specimen, which is the major reason explaining the difference in the failure modes.
5.2. Strengthening Effects of GFSs on the PGFRP Connections
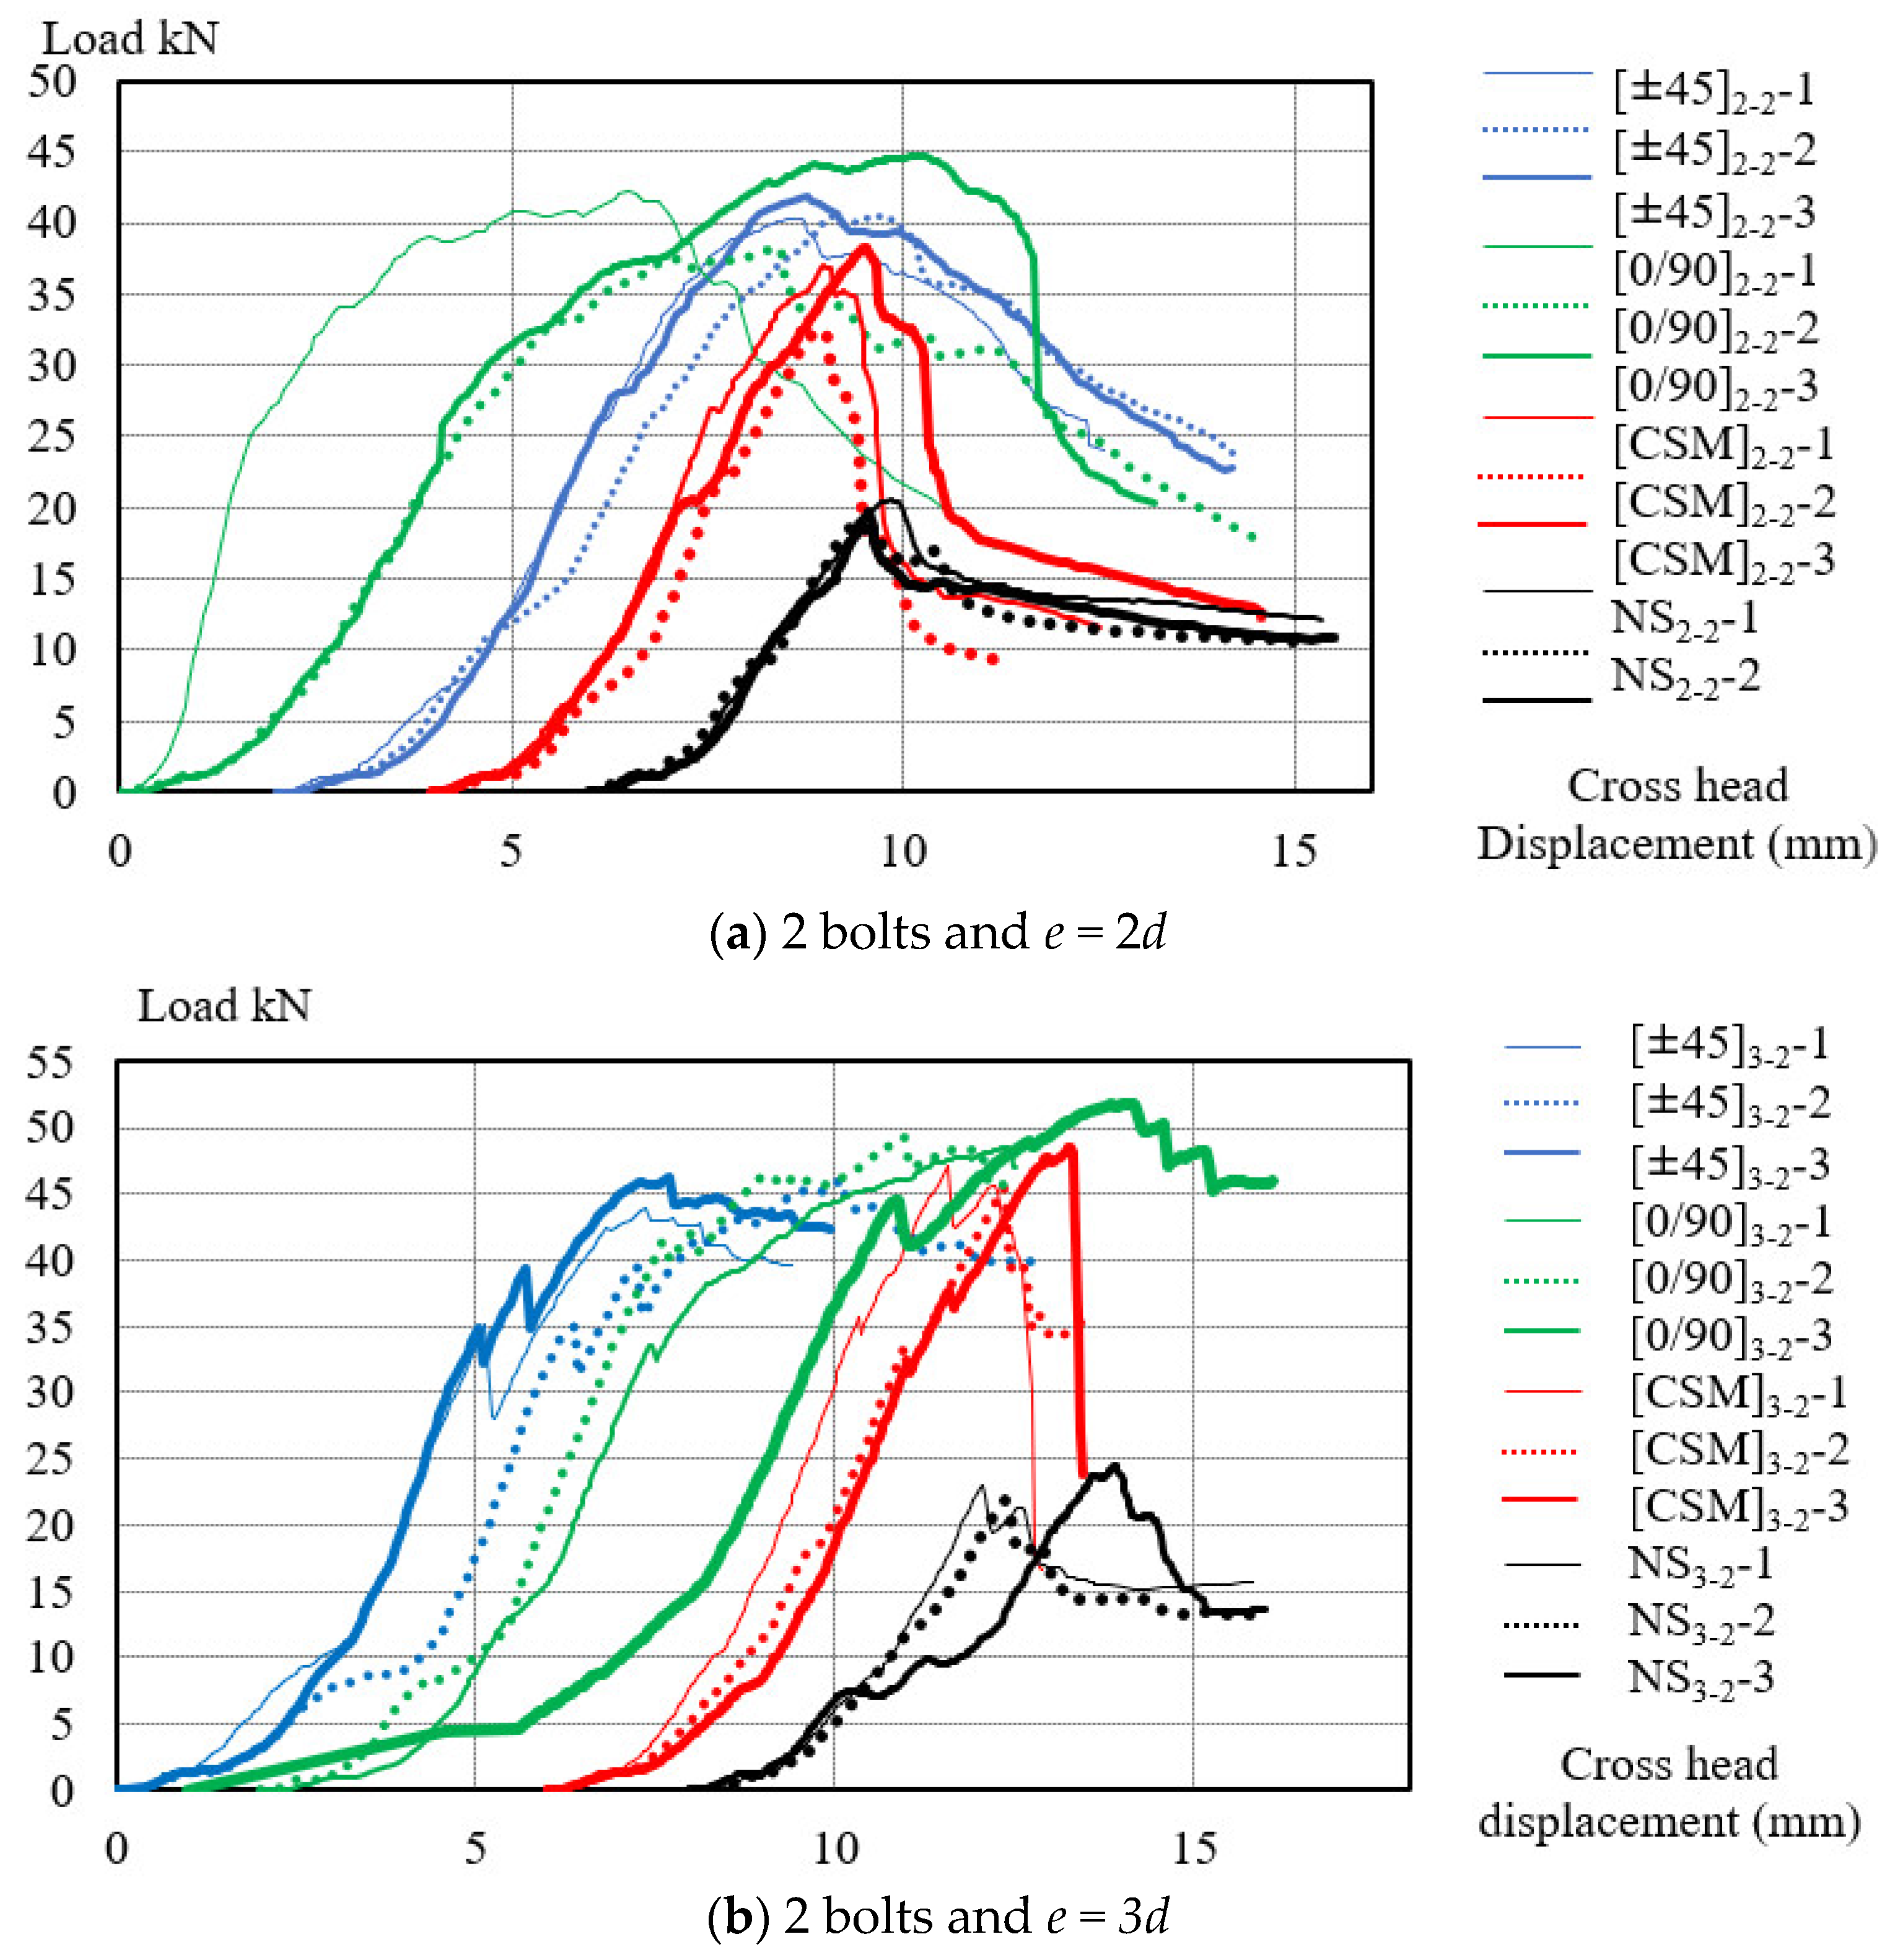
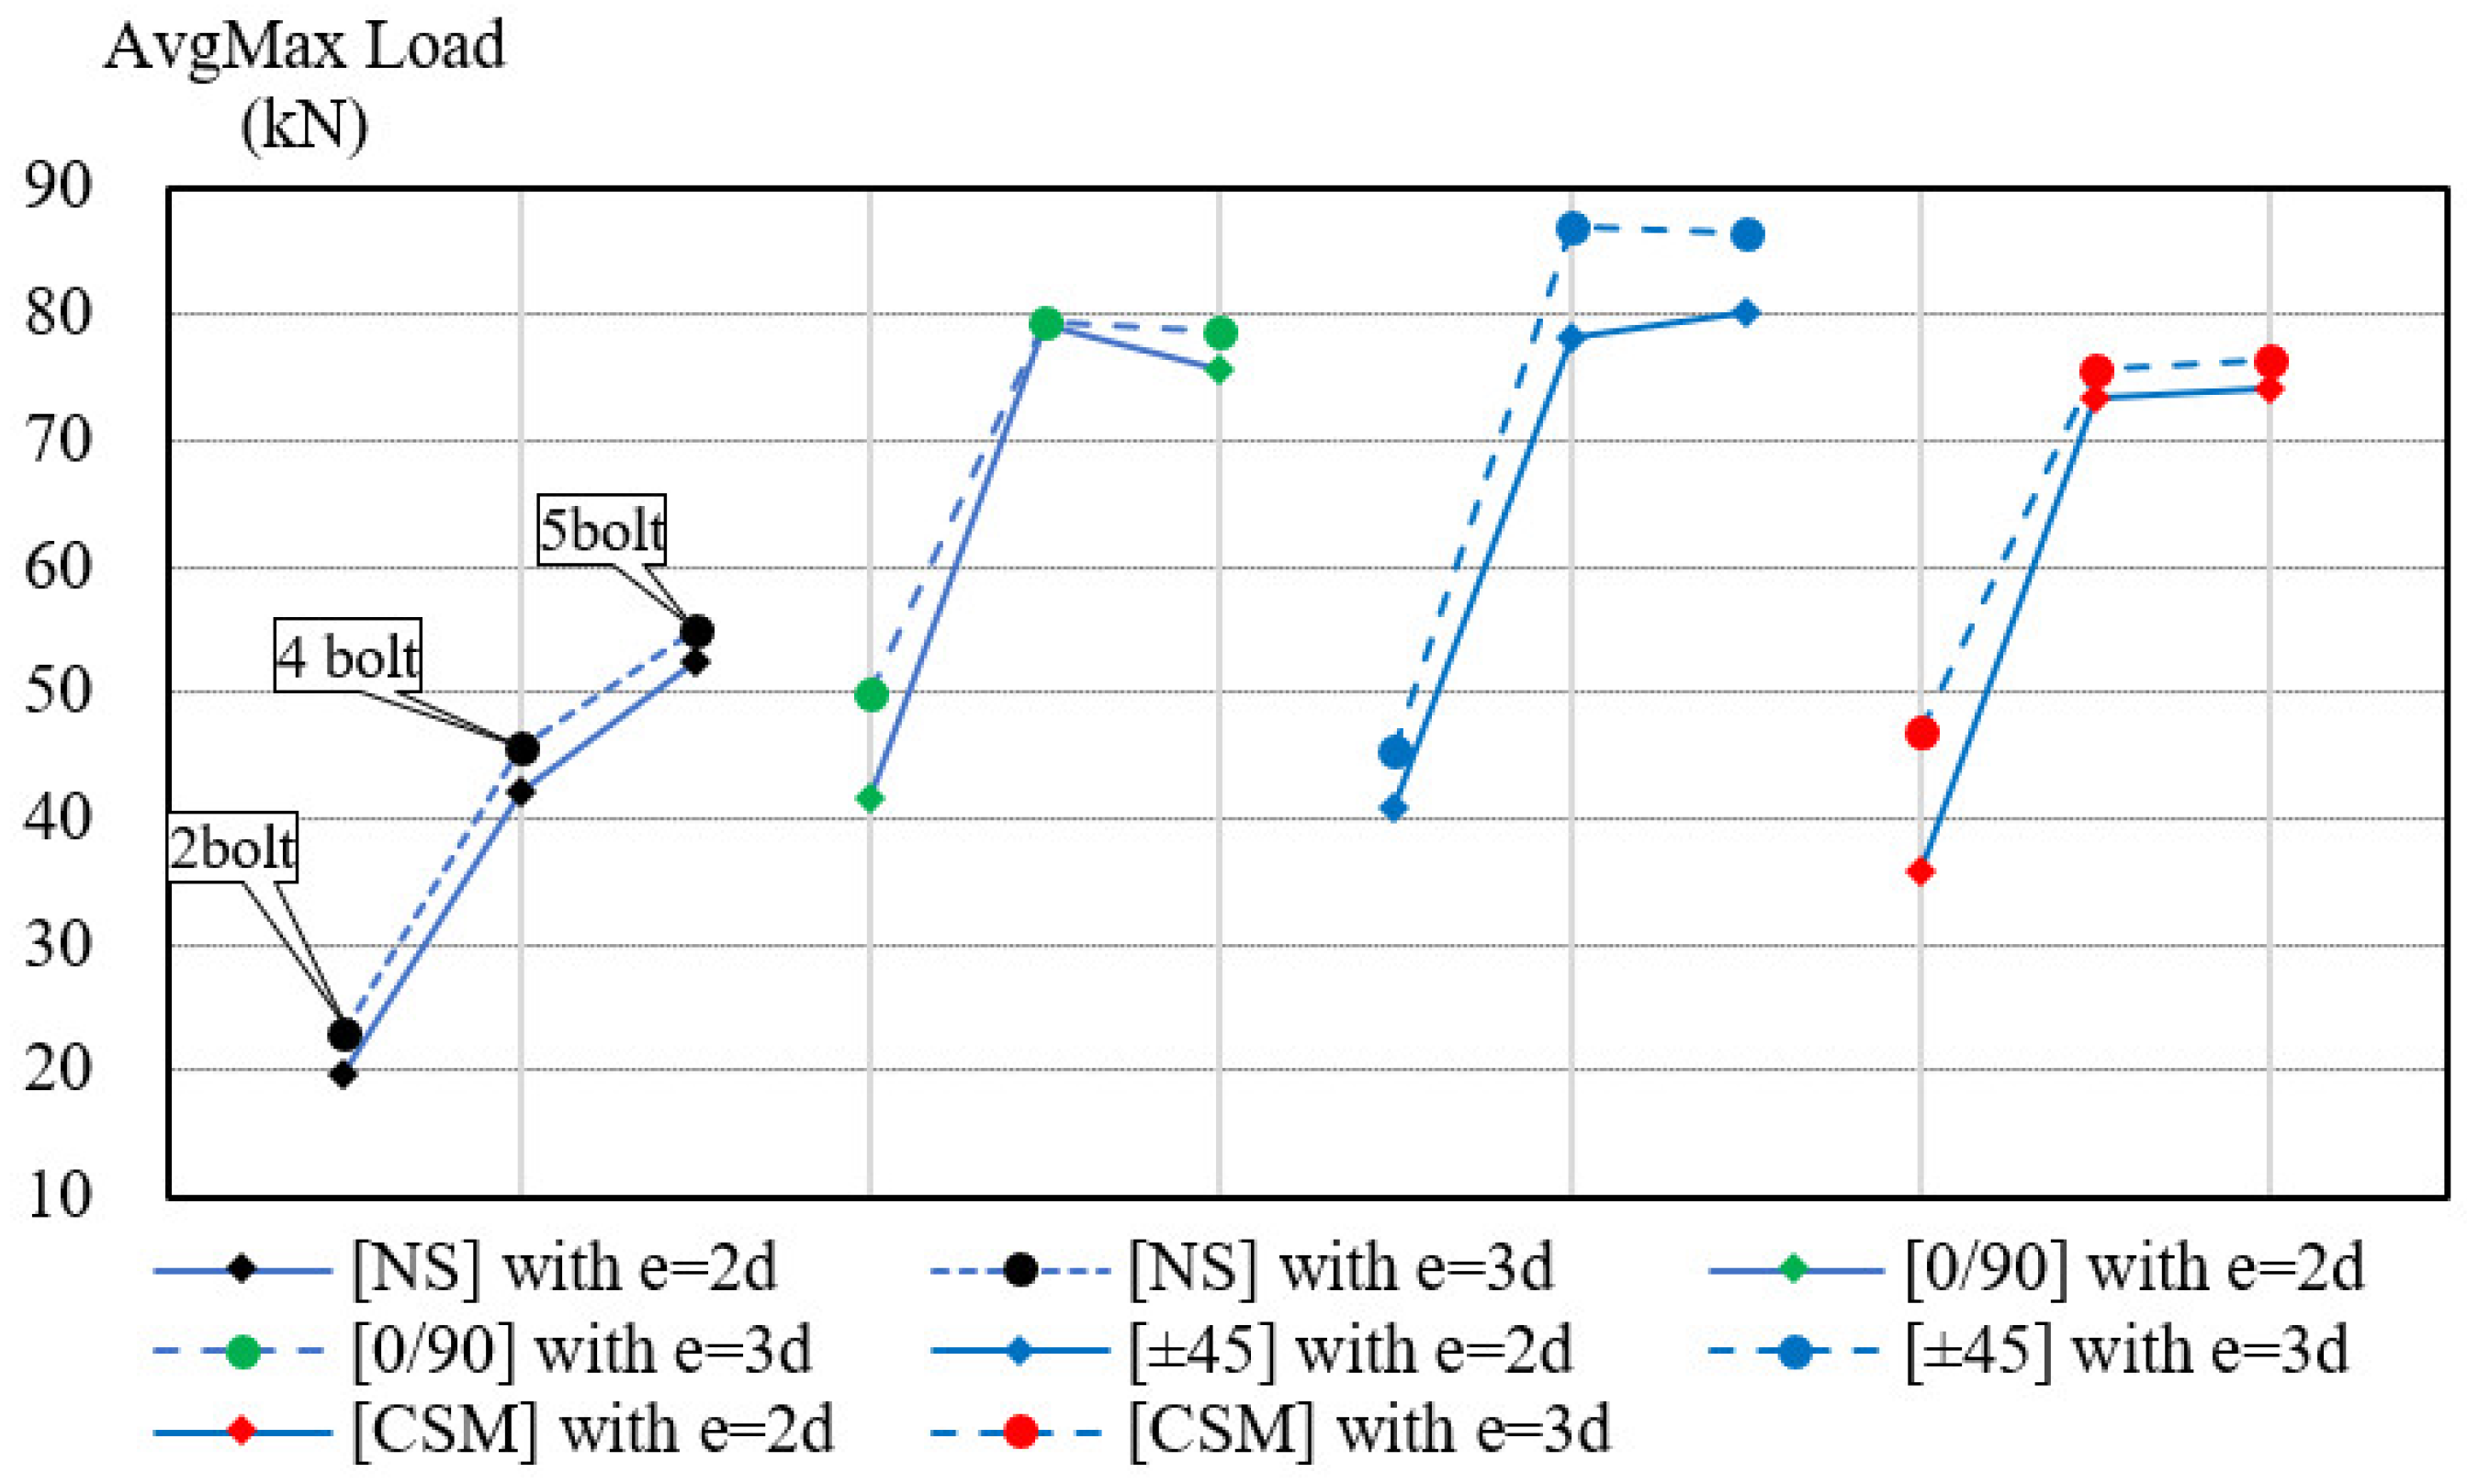
5.2.1. Maximum Load
- Two bolts and e = 2d;
- Two bolts and e = 3d;
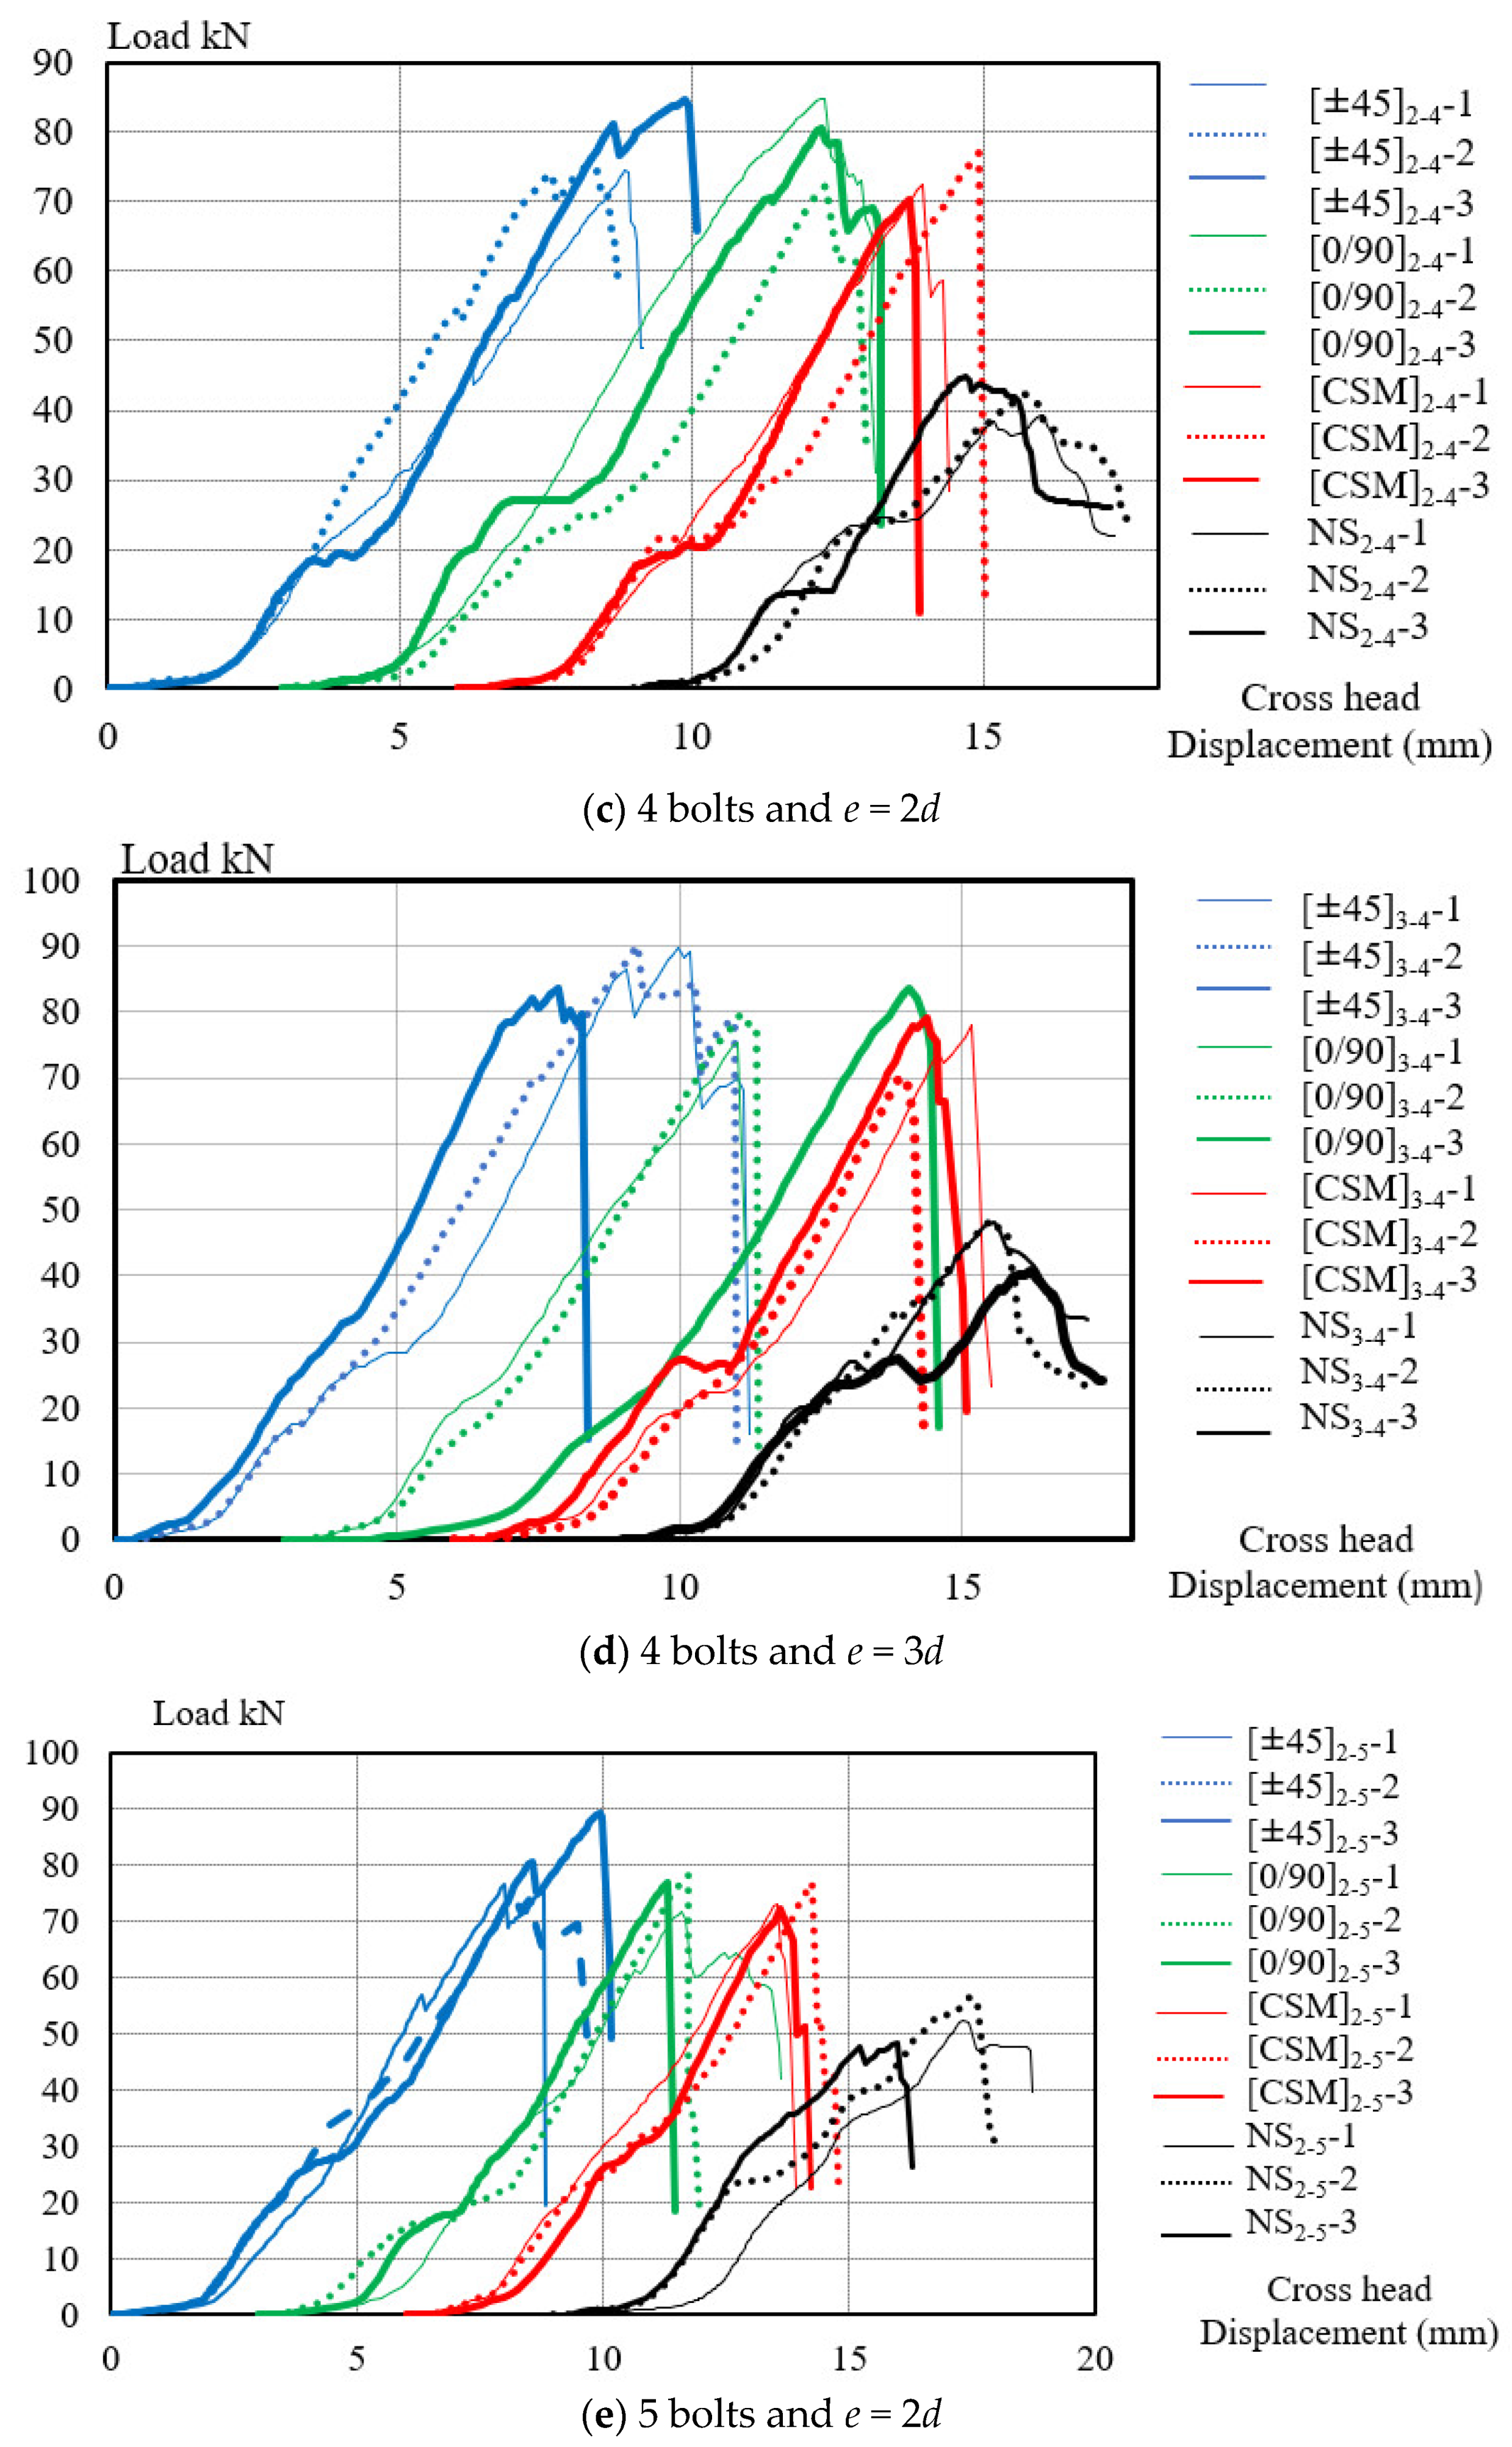
- Four bolts and e = 2d;
- Four bolts and e = 3d;
- Five bolts and e = 2d;
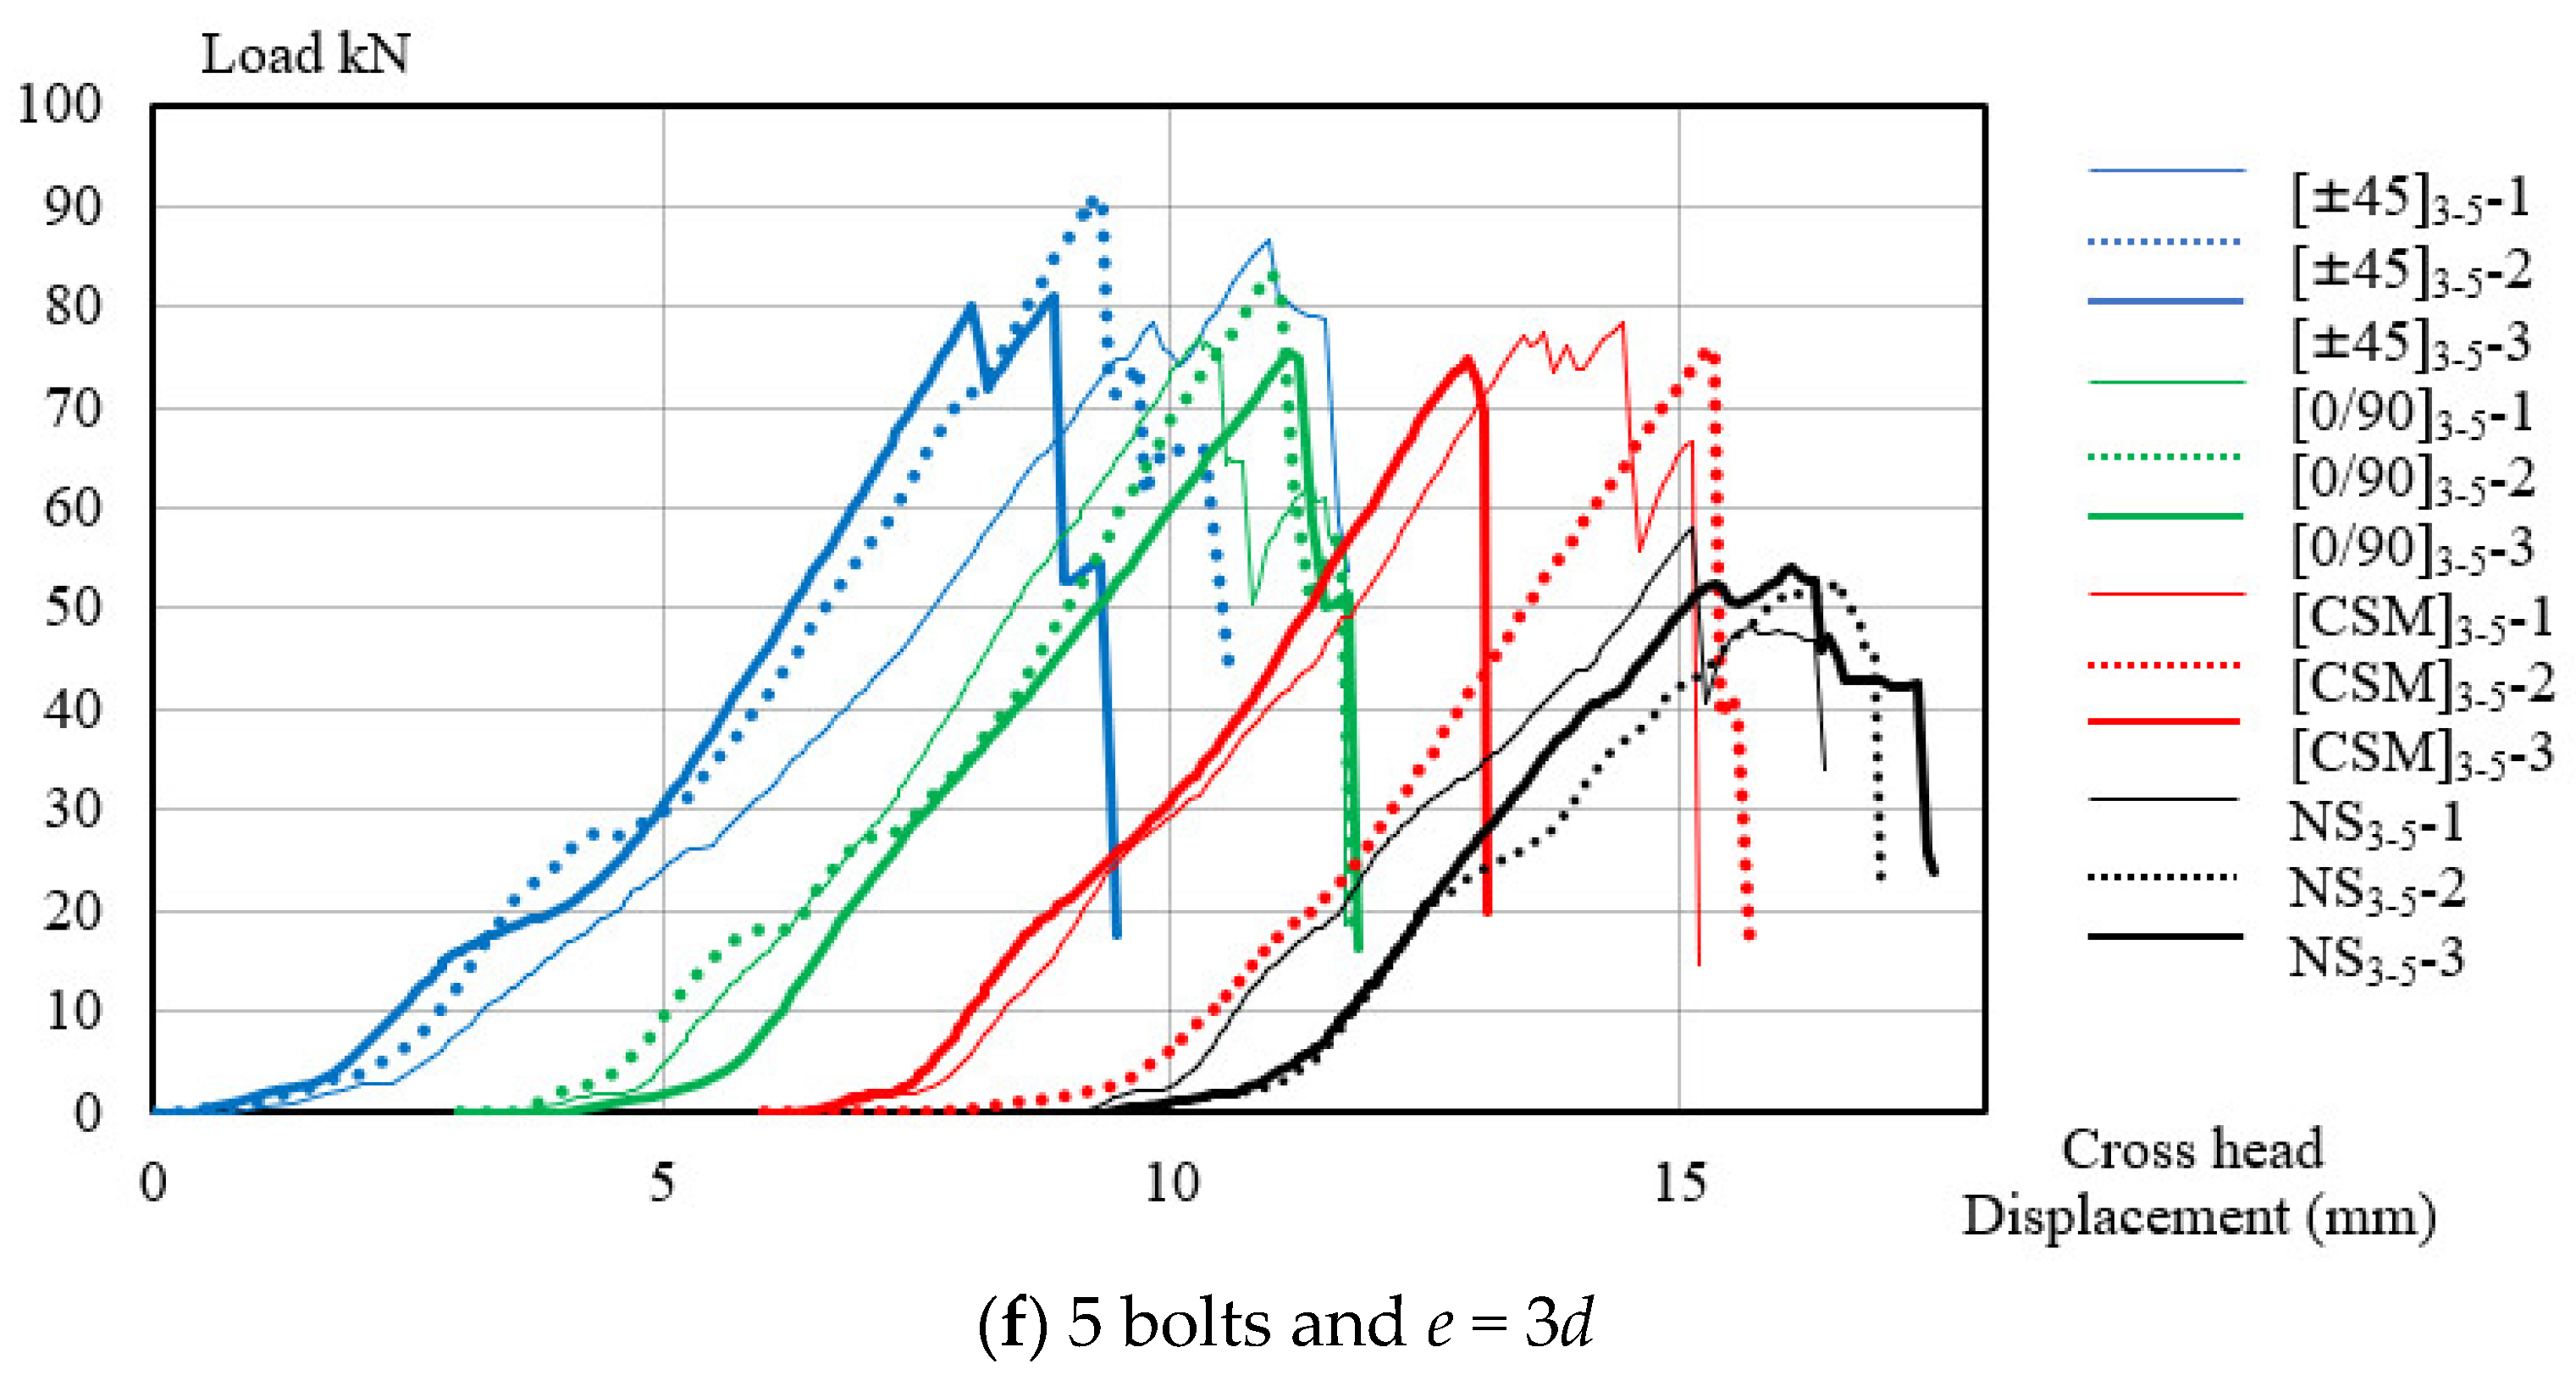
- Five bolts and e = 3d
5.2.2. Evaluation Strengthening Effect by Types of GFSs
5.2.3. Evaluating the Strengthening Effect by Number of Bolts
5.2.4. Strengthening Effect Related to End Distance
5.2.5. Strengthening the Effect of Expanded GFS Areas
6. Conclusions
- Five types of failure modes occurred in the 72 samples of the 24 types of specimens in the testing. In two- and four-bolt NS specimens, shear-out occurred in the whole cross-section. Block shear failure occurred at GFM and shear-out occurred at CD in the five-bolt NS specimens. The failure modes in the GFS specimens were all based on two-component failures mode. All the [CSM] specimens experienced net-tension failures in the GFS parts, while the failure modes in the [0/90] and [±45] specimens were dependent on the number of bolts. The combination between the bearing failures in GFS/GFM and the shear-out failures in the CD parts can be seen in the two-bolt specimens. On the other hand, the combination of shear-out failure in CD parts and debonding between CD and GFM parts was found in [0/90] and [±45] with four- and five-bolt specimens.
- The trend in failure modes that occurred in categories of specimens could be explained by separate measurements of component strength. The explanation of failure modes and the size of ultimate loads can be referred to in subsequent investigations of the design parameters of specimens and strengthening materials.
- The effectiveness of strengthening by GFSs was demonstrated by the results of the tests. The maximum loads in all the GFS specimens were higher than those of the NS specimens, ranging from 1.4 to 2.1 times higher. Therefore, the number of bolts in the NS specimens could be reduced by GFS strengthening (from four and five bolts to two bolts) in application. Furthermore, the end distance (connection area) in the NS specimens could be reduced by GFS-strengthening (from e = 3d to e = 2d).
- In comparison between types of GFS, the [0/90] specimens had the highest effect in the case of two bolts with both second and third end distances. Among the four- and five-bolt GFS specimens, the [±45] specimens had the highest effect; second were the [0/90] specimens. The types of [CSM] had the lowest effectiveness in all the GFS specimens. This result is necessary for consideration in the selection of GFS types in strengthening the PGFRP connection.
- The effectiveness of the increasing numbers of bolts was also investigated. There was an effectiveness in the NS specimens and the GFSs in cases of increasing from two to four bolts. However, this was an unremarkable result in regard to the GFS specimens with an increase from four to five bolts. This means that an increase in the number of bolts could be considered as a strengthening method for NS specimens.
- Increasing the end distance was shown to be an effective method for improvement in the case of two bolts for all NS and GFSs specimens.
- The failure mode is one of the safety factors for connections. Debonding failure depends on bond strength, which is a property of the PGFRP products. Therefore, it is necessary to investigate bond strength when designing the strengthening of bolted connections in PGFRPs.
Author Contributions
Funding
Institutional Review Board Statement
Informed Consent Statement
Data Availability Statement
Acknowledgments
Conflicts of Interest
Appendix A

| Material Properties | |||||||||
|---|---|---|---|---|---|---|---|---|---|
| Fail. Mode | Specimens | Bearing Strg of GFM (Mpa) | Bearing Strg of GFS (Mpa) | Bearing Strength of (CD Mpa) | Shear-Out Strg of CD (Mpa) | Shear-Out Strg of (GFM) | Shear Strg of GFS (Mpa) | Tensile Strg of PGFRP (Mpa) | Tensile Strg of GFS (Mpa) |
| MODE 5 | [0/90] 2 bolts 2d | 199.71 | 146.03 | 260.49 | 11.68 | 81.91 | 86.00 | 536.00 | 420.00 |
| [0/90] 2bolts 3d | 199.71 | 146.03 | 260.49 | 11.68 | 81.91 | 86.00 | 536.00 | 420.00 | |
| MODE 3 | [0/90] 4 bolts 2d | 199.71 | 146.03 | 260.49 | 11.68 | 81.91 | 86.00 | 536.00 | 420.00 |
| [0/90] 4 bolts 3d | 199.71 | 146.03 | 260.49 | 11.68 | 81.91 | 86.00 | 536.00 | 420.00 | |
| [0/90] 5 bolts 2d | 199.71 | 146.03 | 260.49 | 11.68 | 81.91 | 86.00 | 536.00 | 420.00 | |
| [0/90] 5 bolts 3d | 199.71 | 146.03 | 260.49 | 11.68 | 81.91 | 86.00 | 536.00 | 420.00 | |
| MODE 5 | [±45] 2 bolts 2d | 199.71 | 154.56 | 260.49 | 11.68 | 81.91 | 94.92 | 536.00 | 169.00 |
| [±45] 2 bolts 3d | 199.71 | 154.56 | 260.49 | 11.68 | 81.91 | 94.92 | 536.00 | 169.00 | |
| MODE 3 | [±45] 4 bolts 2d | 199.71 | 154.56 | 260.49 | 11.68 | 81.91 | 94.92 | 536.00 | 169.00 |
| [±45] 4 bolts 3d | 199.71 | 154.56 | 260.49 | 11.68 | 81.91 | 94.92 | 536.00 | 169.00 | |
| [±45] 5 bolts 2d | 199.71 | 154.56 | 260.49 | 11.68 | 81.91 | 94.92 | 536.00 | 169.00 | |
| [±45] 5 bolts 3d | 199.71 | 154.56 | 260.49 | 11.68 | 81.91 | 94.92 | 536.00 | 169.00 | |
| MODE 4 | [CSM] 2 bolts 2d | 199.71 | 199.71 | 260.49 | 11.68 | 81.91 | 81.91 | 536.00 | 164.80 |
| [CSM] 2 bolts 3d | 199.71 | 199.71 | 260.49 | 11.68 | 81.91 | 81.91 | 536.00 | 164.80 | |
| [CSM] 4 bolts 2d | 199.71 | 199.71 | 260.49 | 11.68 | 81.91 | 81.91 | 536.00 | 164.80 | |
| [CSM] 4 bolts 3d | 199.71 | 199.71 | 260.49 | 11.68 | 81.91 | 81.91 | 536.00 | 164.80 | |
| [CSM] 5 bolts 2d | 199.71 | 199.71 | 260.49 | 11.68 | 81.91 | 81.91 | 536.00 | 164.80 | |
| [CSM] 5 bolts 3d | 199.71 | 199.71 | 260.49 | 11.68 | 81.91 | 81.91 | 536.00 | 164.80 | |
| MODE 1 | NS 2 bolt 2d | 199.71 | 260.49 | 11.68 | 81.91 | 536.00 | |||
| NS 2 bolt 3d | 199.71 | 260.49 | 11.68 | 81.91 | 536.00 | ||||
| NS 4 bolt 2d | 199.71 | 260.49 | 11.68 | 81.91 | 536.00 | ||||
| NS 4 bolt 3d | 199.71 | 260.49 | 11.68 | 81.91 | 536.00 | ||||
| MODE 2 | NS 5 bolt 2d | 199.71 | 260.49 | 11.68 | 81.91 | 536.00 | |||
| NS 5 bolt 3d | 199.71 | 260.49 | 11.68 | 81.91 | 536.00 | ||||
- A: is the net area subject to each component strength:
- -
- Bearing strength: A = dtn with d and n are the diameter of bolt and number of bolts, t is the thickness of component layers.
- -
- Shear strength; tensile strength: A = tL with t; T is the thickness and total length of subject component layers
| Specimens’ Parameters | ||||||||
|---|---|---|---|---|---|---|---|---|
| Fail. Mode | Specimens | Width w mm | End Distance e mm | Length of GFS l mm | No of Bolts n nos | Thk of CD tCD (mm) | Thk of GFS tGFS (mm) | Thk of GFM tGFM (mm) |
| MODE 5 | [0/90] 2 bolts 2d | 84.00 | 24.00 | 96.00 | 2.00 | 4.00 | 1.26 | 0.50 |
| [0/90] 2bolts 3d | 84.00 | 36.00 | 120.00 | 2.00 | 4.00 | 1.29 | 0.50 | |
| MODE 3 | [0/90] 4 bolts 2d | 84.00 | 24.00 | 96.00 | 4.00 | 4.00 | 1.25 | 0.50 |
| [0/90] 4 bolts 3d | 84.00 | 36.00 | 120.00 | 4.00 | 4.00 | 1.26 | 0.50 | |
| [0/90] 5 bolts 2d | 84.00 | 24.00 | 96.00 | 5.00 | 4.00 | 1.26 | 0.50 | |
| [0/90] 5 bolts 3d | 84.00 | 36.00 | 120.00 | 5.00 | 4.00 | 1.25 | 0.50 | |
| MODE 5 | [±45] 2 bolts 2d | 84.00 | 24.00 | 96.00 | 2.00 | 4.00 | 1.21 | 0.50 |
| [±45] 2 bolts 3d | 84.00 | 36.00 | 120.00 | 2.00 | 4.00 | 1.20 | 0.50 | |
| MODE 3 | [±45] 4 bolts 2d | 84.00 | 24.00 | 96.00 | 4.00 | 4.00 | 1.23 | 0.50 |
| [±45] 4 bolts 3d | 84.00 | 36.00 | 120.00 | 4.00 | 4.00 | 1.24 | 0.50 | |
| [±45] 5 bolts 2d | 84.00 | 24.00 | 96.00 | 5.00 | 4.00 | 1.23 | 0.50 | |
| [±45] 5 bolts 3d | 84.00 | 36.00 | 120.00 | 5.00 | 4.00 | 1.24 | 0.50 | |
| MODE 4 | [CSM] 2 bolts 2d | 84.00 | 24.00 | 96.00 | 2.00 | 4.00 | 1.65 | 0.50 |
| [CSM] 2 bolts 3d | 84.00 | 36.00 | 120.00 | 2.00 | 4.00 | 1.61 | 0.50 | |
| [CSM] 4 bolts 2d | 84.00 | 24.00 | 96.00 | 4.00 | 4.00 | 1.61 | 0.50 | |
| [CSM] 4 bolts 3d | 84.00 | 36.00 | 120.00 | 4.00 | 4.00 | 1.59 | 0.50 | |
| [CSM] 5 bolts 2d | 84.00 | 24.00 | 96.00 | 5.00 | 4.00 | 1.57 | 0.50 | |
| [CSM] 5 bolts 3d | 84.00 | 36.00 | 120.00 | 5.00 | 4.00 | 1.59 | 0.50 | |
| MODE 1 | NS 2 bolt 2d | 84.00 | 24.00 | 96.00 | 2.00 | 4.00 | 0.50 | |
| NS 2 bolt 3d | 84.00 | 36.00 | 120.00 | 2.00 | 4.00 | 0.50 | ||
| NS 4 bolt 2d | 84.00 | 24.00 | 96.00 | 4.00 | 4.00 | 0.50 | ||
| NS 4 bolt 3d | 84.00 | 36.00 | 120.00 | 4.00 | 4.00 | 0.50 | ||
| MODE 2 | NS 5 bolt 2d | 84.00 | 24.00 | 96.00 | 5.00 | 4.00 | 0.50 | |
| NS 5 bolt 3d | 84.00 | 36.00 | 120.00 | 5.00 | 4.00 | 0.50 | ||
| Component Strength (kN) | |||||||
|---|---|---|---|---|---|---|---|
| Fail. Mode | Specimens | PbrCD | PbrGFM/GFS | PsoCD | PsoGFS/GFM | PntGFS/GFM | PntPGFRP |
| MODE 5 | [0/90] 2 bolts 2d | 25.01 | 13.62 | 4.48 | 28.65 | 68.45 | 300.16 |
| [0/90] 2bolts 3d | 25.01 | 13.80 | 6.72 | 43.62 | 69.68 | 300.16 | |
| MODE 3 | [0/90] 4 bolts 2d | 50.01 | 27.05 | 13.45 | 68.72 | 67.84 | 300.16 |
| [0/90] 4 bolts 3d | 50.01 | 27.25 | 15.69 | 83.62 | 68.50 | 300.16 | |
| [0/90] 5 bolts 2d | 62.52 | 34.06 | 13.45 | 69.28 | 68.50 | 300.16 | |
| [0/90] 5 bolts 3d | 62.52 | 33.82 | 15.69 | 82.94 | 67.84 | 300.16 | |
| MODE 5 | [±45] 2 bolts 2d | 25.01 | 13.77 | 4.48 | 29.92 | 32.13 | 300.16 |
| [±45] 2 bolts 3d | 25.01 | 13.70 | 6.72 | 44.60 | 31.94 | 300.16 | |
| MODE 3 | [±45] 4 bolts 2d | 50.01 | 27.84 | 13.45 | 73.18 | 32.51 | 300.16 |
| [±45] 4 bolts 3d | 50.01 | 28.04 | 15.69 | 89.06 | 32.78 | 300.16 | |
| [±45] 5 bolts 2d | 62.52 | 34.80 | 13.45 | 73.18 | 32.51 | 300.16 | |
| [±45] 5 bolts 3d | 62.52 | 35.06 | 15.69 | 89.06 | 32.78 | 300.16 | |
| MODE 4 | [CSM] 2 bolts 2d | 25.01 | 20.61 | 4.48 | 33.81 | 39.68 | 300.16 |
| [CSM] 2 bolts 3d | 25.01 | 20.23 | 6.72 | 49.78 | 38.95 | 300.16 | |
| [CSM] 4 bolts 2d | 50.01 | 40.41 | 13.45 | 80.12 | 38.91 | 300.16 | |
| [CSM] 4 bolts 3d | 50.01 | 40.07 | 15.69 | 95.87 | 38.58 | 300.16 | |
| [CSM] 5 bolts 2d | 62.52 | 49.61 | 13.45 | 78.67 | 38.21 | 300.16 | |
| [CSM] 5 bolts 3d | 62.52 | 50.09 | 15.69 | 95.87 | 38.58 | 300.16 | |
| MODE 1 | NS 2 bolt 2d | 25.01 | 4.79 | 4.48 | 7.86 | 300.16 | |
| NS 2 bolt 3d | 25.01 | 4.79 | 6.72 | 11.80 | 300.16 | ||
| NS 4 bolt 2d | 50.01 | 9.59 | 13.45 | 19.00 | 300.16 | ||
| NS 4 bolt 3d | 50.01 | 9.59 | 15.69 | 22.93 | 300.16 | ||
| MODE 2 | NS 5 bolt 2d | 62.52 | 11.98 | 13.45 | 23.59 | 300.16 | |
| NS 5 bolt 3d | 62.52 | 11.98 | 15.69 | 27.52 | 300.16 | ||
- Fsh = Characteristic in-plane shear strength of FRP material appropriate to the shear-out failure
- FtL = Characteristic tensile strength of the FRP material in the longitudinal Ans = Net area subjected to shear
- Ant = Net area subjected to tension, where the bolts are staggered the total deducted in c determining Ant shall be the greater of
- (a)
- the maximum of the sectional area in any cross-section perpendicular to the member axis, or
- (b)
- t(ndn − ∑bs)
- n = Number of holes extending in any diagonal or zig-zag line progressively across the member or part of the member (nmax = 3)
- dn = Nominal diameter of hole
References
- Balsamo, A.; Coppola, L.; Zaffaroni, P. FRP in Construction: Applications, Advantages, Barriers and Perspectives. Compos. Constr. 2001, 58–64. [Google Scholar] [CrossRef]
- Frigione, M.; Lettieri, M. Durability Issues and Challenges for Material Advancements in FRP Employed in the Construction Industry. Polymers 2018, 10, 247. [Google Scholar] [CrossRef] [PubMed] [Green Version]
- Bank, L.C. Composites for Construction: Structural Design with FRP Materials; John Wiley & Sons: Hoboken, NJ, USA, 2006. [Google Scholar]
- Green, A.; Bisarnsin, T.; Love, E.A. Pultruded Reinforced Plastics for Civil Engineering Structural Applications. J. Reinf. Plast. Compos. 1994, 13, 942–951. [Google Scholar] [CrossRef]
- Kim, Y.J. State of the practice of FRP composites in highway bridges. Eng. Struct. 2019, 179, 1–8. [Google Scholar] [CrossRef]
- Sonnenschein, R.; Gajdosova, K.; Holly, I. FRP Composites and their Using in the Construction of Bridges. Procedia Eng. 2016, 161, 477–482. [Google Scholar] [CrossRef] [Green Version]
- Correia, J.R. Pultrusion of advanced fibre-reinforced polymer (FRP) composites. In Advanced Fibre-Reinforced Polymer (FRP) Composites for Structural Applications; Woodhead Publishing: Cambridge, MA, USA, 2013; pp. 207–251. [Google Scholar]
- Ferdous, W.; Manalo, A.; AlAjarmeh, O.; Mohammed, A.; Salih, C.; Yu, P.; Khotbehsara, M.; Mehrinejad, S.P. Static behaviors of glass fiber reinforced novel composite sleepers for mainline railway track. Eng. Struct. 2021, 229, 111627. [Google Scholar] [CrossRef]
- Al-Rubaye, M.; Manaloa, A.; Alajarmeh, O.; Ferdous, W.; Lokuge, W.; Benmokrane, B.; Edooc, A. Flexural behaviors of concrete slabs reinforced with GFRP bars and hollow composite rein-forcing systems. Compos. Struct. 2020, 236, 111836. [Google Scholar] [CrossRef] [Green Version]
- Siddika, A.; Al Mamun, M.A.; Ferdous, W.; Rayed, A. Performances, challenges and opportunities in strengthening reinforced concrete structures by using FRPs–A state-of-the-art review. Eng. Fail. Anal. 2020, 111, 104480. [Google Scholar] [CrossRef]
- Bank, L.C. Properties of Pultruded Fiber. Transp. Res. Rec. 1989, 1223, H7. [Google Scholar]
- Nunes, F.; Silvestre, N.; Correia, J.R. Structural behaviour of hybrid FRP pultruded columns. Part 2: Numerical study. Compos. Struct. 2016, 139, 304–319. [Google Scholar] [CrossRef]
- Liu, T.; Liu, X.; Feng, P. A comprehensive review on mechanical properties of pultruded FRP composites subjected to long-term environmental effects. Compos. Part B Eng. 2020, 191, 107958. [Google Scholar] [CrossRef]
- Bazli, M.; Zhao, X.-L.; Jafari, A.; Ashrafi, H.; Bai, Y.; Raman, R.S.; Khezrzadeh, H. Mechanical properties of pultruded GFRP profiles under seawater sea sand concrete environment coupled with UV radiation and moisture. Constr. Build. Mater. 2020, 258, 120369. [Google Scholar] [CrossRef]
- American Society of Civil Engineers (ASCE). ASCE 2010 Pre-Standard for Load & Resistance Factor Design (LRFD) of Pultruded Fiber Reinforced Polymer (FRP) Structures. Available online: http://dev1.kreysler.com/information/specifications/specs-resources/LRFD%20PreStandard%20-%20Revised%20FINAL%20-%20Nov%209%202010.pdf (accessed on 11 October 2021).
- Ascione, L.; Caron, J.-F.; Godonou, P.; van IJselmuijden, K.; Knippers, J.; Mottram, T.; Oppe, M.; Gantriis, S.; Taby, J.; Tromp, L. Prospect for New Guidance in the Design of FRP: SUPPORT to the Implementation, Harmonization and Further Development of the Eurocodes; Publications Office of the European Union: Luxembourg, 2016. [Google Scholar]
- Clarke, J. EUROCOMP Design Code and Handbook; Elsevier: Amsterdam, The Netherlands, 1989. [Google Scholar]
- Turvey, G.J. Bolted connections in PFRP structures. Prog. Struct. Eng. Mater. 2000, 2, 146–156. [Google Scholar] [CrossRef]
- Bank, L.C.; Mosallam, A.S.; McCoy, G.T. Design and Performance of Connections for Pultruded Frame Structures. J. Reinf. Plast. Compos. 1994, 13, 199–212. [Google Scholar] [CrossRef]
- Ascione, F. A preliminary numerical and experimental investigation on the shear stress distribution on multi-row bolted FRP joints. Mech. Res. Commun. 2010, 37, 164–168. [Google Scholar] [CrossRef]
- Feo, L.; Marra, G.; Mosallam, A. Stress analysis of multi-bolted joints for FRP pultruded composite structures. Compos. Struct. 2012, 94, 3769–3780. [Google Scholar] [CrossRef]
- Russo, S. On failure modes and design of multi-bolted FRP plate in structural joints. Compos. Struct. 2019, 218, 27–38. [Google Scholar] [CrossRef]
- Turvey, G.J. Single-bolt tension joint tests on pultruded GRP plate—Effects of tension direction relative to pultrusion direction. Compos. Struct. 1998, 42, 341–351. [Google Scholar] [CrossRef]
- Ascione, F.; Feo, L.; Maceri, F. On the pin-bearing failure load of GFRP bolted laminates: An experimental analysis on the influence of bolt diameter. Compos. Part B Eng. 2010, 41, 482–490. [Google Scholar] [CrossRef]
- Prabhakaran, R.; Robertson, J. An experimental investigation of load-sharing in a multi-bolt pultruded composite joint. In Proceedings of the 2nd International Conference on Composites in Infrastructure National Science Foundation, Tuscon, AZ, USA, 5–7 January 1998. [Google Scholar]
- Wu, C.; Feng, P.; Bai, Y. Comparative Study on Static and Fatigue Performances of Pultruded GFRP Joints Using Ordinary and Blind Bolts. J. Compos. Constr. 2015, 19, 04014065. [Google Scholar] [CrossRef]
- Persson, E.; Eriksson, I. Fatigue of multiple row bolted joints in carbon/epoxy laminates: Ranking of factors affecting strength and fatigue life. Int. J. Fatigue 1999, 21, 337–353. [Google Scholar] [CrossRef]
- Cooper, C.; Turvey, G. Effects of joint geometry and bolt torque on the structural performance of single bolt tension joints in pultruded GRP sheet material. Compos. Struct. 1995, 32, 217–226. [Google Scholar] [CrossRef]
- Wang, Y. Bearing Behavior of Joints in Pultruded Composites. J. Compos. Mater. 2002, 36, 2199–2216. [Google Scholar] [CrossRef]
- Hassan, N.K.; Mohamedien, M.A.; Rizkalla, S.H. Multibolted Joints for GFRP Structural Members. J. Compos. Constr. 1997, 1, 3–9. [Google Scholar] [CrossRef]
- Wang, P. Structural Integrity of Bolted Joints for Pultruded GRP Profiles. Ph.D. Thesis, University of Lancaster, Lancaster, UK, 2004. [Google Scholar]
- Abd-El-Naby, S.; Hollaway, L. The experimental behaviour of bolted joints in pultruded glass/ polyester material. Part 1: Single-bolt joints. Composites 1993, 24, 531–538. [Google Scholar] [CrossRef]
- Mottram, J.T.; Turvey, G.J. Physical test data for the appraisal of design procedures for bolted joints in pultruded FRP structural shapes and systems. Prog. Struct. Eng. Mater. 2003, 5, 195–222. [Google Scholar] [CrossRef]
- Girão Coelho, A.M.; Mottram, J.T. A review of the behaviour and analysis of bolted connections and joints in pultruded fibre reinforced polymers. Mater. Des. 2015, 74, 86–107. [Google Scholar] [CrossRef] [Green Version]
- Gand, A.K.; Chan, T.M.; Mottram, J.T. Civil and structural engineering applications, recent trends, research and developments on pultruded fiber reinforced polymer closed sections: A review. Front. Struct. Civ. Eng. 2013, 7, 227–244. [Google Scholar] [CrossRef]
- Vedernikov, A.; Safonov, A.; Tucci, F.; Carlone, P.; Akhatov, I. Pultruded materials and structures: A review. J. Compos. Mater. 2020, 54, 4081–4117. [Google Scholar] [CrossRef]
- Shin, Y.H.; Yoong, Y.Y.; Hejazi, F.; Saifulnaz, M.R.R. Review on pultruded FRP structural design for building construction. IOP Conf. Ser. Earth Environ. Sci. 2019, 357, 012006. [Google Scholar] [CrossRef]
- Phan Viet, N.; Yukio, K.; Yukihiro, M. Experimental investigations of the strengthening effects of CFRP for thin-walled storage tanks under dynamic loads. Appl. Sci. 2020, 10, 2521. [Google Scholar] [CrossRef] [Green Version]
- Viet, N.P.; Yoresta, F.S.; Kitane, Y.; Hashimoto, K.; Matsumoto, Y. Improving the shear strength of bolted connections in pultruded GFRP using glass fiber sheets. Compos. Struct. 2021, 255, 112896. [Google Scholar] [CrossRef]
- Uddin, N.; Vaidya, U.; Shohel, M.; Serrano-Perez, J. Cost-effective bridge girder strengthening using vacuum-assisted resin transfer molding (VARTM). Adv. Compos. Mater. 2004, 13, 255–281. [Google Scholar] [CrossRef]
- Genedy, M.; Chennareddy, R.; Soliman, E.M.; Kandil, U.F.; Taha, M.M.R. Improving shear strength of bolted joints in pultruded glass fiber reinforced polymer composites using carbon nanotubes. J. Reinf. Plast. Compos. 2017, 36, 958–971. [Google Scholar] [CrossRef]
- Agubra, V.A.; Owuor, P.S.; Hosur, M.V. Influence of Nanoclay Dispersion Methods on the Mechanical Behavior of E-Glass/Epoxy Nanocomposites. Nanomaterials 2013, 3, 550–563. [Google Scholar] [CrossRef] [PubMed]
- Qiu, J.; Zhang, C.; Wang, B.; Liang, R. Carbon nanotube integrated multifunctional multiscale composites. Nanotechnology 2007, 18, 275708. [Google Scholar] [CrossRef]
- Mara, V.; Haghani, R.; Al-Emrani, M. Improving the performance of bolted joints in composite structures using metal inserts. J. Compos. Mater. 2016, 50, 3001–3018. [Google Scholar] [CrossRef]
- Prabhakaran, R.; Razzaq, Z.; Devara, S. Load and resistance factor design (LRFD) approach for bolted joints in pultruded com-posites. Compos. Part B Eng. 1996, 27, 351–360. [Google Scholar] [CrossRef]
- Nhut, P.V.; Yoresta, F.S.; Kitane, Y.; Hashimoto, K.; Matsumoto, Y. On the Strengthening of Pultruded GFRP Connections Using Glass Fiber Sheets: A Study on the Influence of Bolt Diameter. Appl. Compos. Mater. 2021, 1–31. [Google Scholar] [CrossRef]


| Notation | Definition | Minimum Required Spacing (or Distance in Terms of Bolt Diameters) |
|---|---|---|
| emin | End distance | Tension load |
| Single row of bolts | 4d | |
| Two or three bolt rows | 2d | |
| End distance | Compression load | |
| All connections | 2d | |
| e2,min | Edge distance | 1.5d |
| smin | Pitch spacing | 4d |
| gmin | Gage spacing | 4d |
| g2,min | Gage spacing with staggered bolts | 2d |
| Specimen | End Distance | No. of Bolts | dn (mm) | tUD (mm) | tGFM (mm) | tGF (mm) avg | No. of Specimens | d (mm) |
|---|---|---|---|---|---|---|---|---|
| NS2-2 | 24 | 2 | 13.5 | 4 | 1 | - | 3 | 12 |
| NS2-4 | 24 | 4 | 13.5 | 4 | 1 | - | 3 | 12 |
| NS2-5 | 24 | 5 | 13.5 | 4 | 1 | - | 3 | 12 |
| NS3-2 | 36 | 2 | 13.5 | 4 | 1 | - | 3 | 12 |
| NS3-4 | 36 | 4 | 13.5 | 4 | 1 | - | 3 | 12 |
| NS3-5 | 36 | 5 | 13.5 | 4 | 1 | - | 3 | 12 |
| [0/90]2-2 | 24 | 2 | 13.5 | 4 | 1 | 1.259 | 3 | 12 |
| [0/90]2-4 | 24 | 4 | 13.5 | 4 | 1 | 1.260 | 3 | 12 |
| [0/90]2-5 | 24 | 5 | 13.5 | 4 | 1 | 1.260 | 3 | 12 |
| [0/90]3-2 | 36 | 2 | 13.5 | 4 | 1 | 1.285 | 3 | 12 |
| [0/90]3-4 | 36 | 4 | 13.5 | 4 | 1 | 1.246 | 3 | 12 |
| [0/90]3-5 | 36 | 5 | 13.5 | 4 | 1 | 1.246 | 3 | 12 |
| [CSM]2-2 | 24 | 2 | 13.5 | 4 | 1 | 1.650 | 3 | 12 |
| [CSM]2-4 | 24 | 4 | 13.5 | 4 | 1 | 1.608 | 3 | 12 |
| [CSM]2-5 | 24 | 5 | 13.5 | 4 | 1 | 1.570 | 3 | 12 |
| [CSM]3-2 | 36 | 2 | 13.5 | 4 | 1 | 1.610 | 3 | 12 |
| [CSM]3-4 | 36 | 4 | 13.5 | 4 | 1 | 1.590 | 3 | 12 |
| [CSM]3-5 | 36 | 5 | 13.5 | 4 | 1 | 1.590 | 3 | 12 |
| [±45]2-2 | 24 | 2 | 13.5 | 4 | 1 | 1.210 | 3 | 12 |
| [±45]2-4 | 24 | 4 | 13.5 | 4 | 1 | 1.230 | 3 | 12 |
| [±45]2-5 | 24 | 5 | 13.5 | 4 | 1 | 1.230 | 3 | 12 |
| [±45]3-2 | 36 | 2 | 13.5 | 4 | 1 | 1.200 | 3 | 12 |
| [±45]3-4 | 36 | 4 | 13.5 | 4 | 1 | 1.244 | 3 | 12 |
| [±45]3-5 | 36 | 5 | 13.5 | 4 | 1 | 1.244 | 3 | 12 |
| Specimen | End Distance | No. of Bolts | dn (mm) | tUD (mm) | tGFM (mm) | tGF (mm) avg | No. of Specimens | d (mm) |
|---|---|---|---|---|---|---|---|---|
| [±45]3-4 4d | 36 | 4 | 14 | 4 | 1 | 1.244 | 3 | 12 |
| [±45]3-4 5d | 36 | 4 | 14 | 4 | 1 | 1.244 | 3 | 12 |
| [0/90]3-4 4d | 36 | 4 | 14 | 4 | 1 | 1.246 | 3 | 12 |
| [0/90]3-5 5d | 36 | 4 | 14 | 4 | 1 | 1.246 | 3 | 12 |
| Failure Mode | CD | GFM | GFS | |||||
|---|---|---|---|---|---|---|---|---|
| Shear-Out | Net Tension | Block Shear | Shear-Out | Debonding | Bearing | Net Tension | Bearing | |
| 1 | x | x | ||||||
| 2 | x | x | ||||||
| 3 | x | x | ||||||
| 4 | x | x | x | |||||
| 5 | x | x | x | |||||
| Types | NS2-2 | NS2-4 | NS2-5 | NS3-2 | NS3-4 | NS3-5 |
|---|---|---|---|---|---|---|
| 1 | 20.56 | 44.73 | 48.28 | 24.45 | 40.82 | 54.06 |
| 2 | 18.89 | 42.29 | 56.39 | 23.03 | 48.37 | 52.70 |
| 3 | 19.62 | 39.25 | 52.42 | 21.90 | 48.06 | 58.15 |
| Avg | 19.69 | 42.09 | 52.36 | 23.13 | 45.75 | 54.97 |
| Types | [0/90]2-2 | [0/90]2-4 | [0/90]2-5 | [0/90]3-2 | [0/90]3-4 | [0/90]3-5 |
| 1 | 44.70 | 72.33 | 78.10 | 51.78 | 79.66 | 83.42 |
| 2 | 38.19 | 84.82 | 71.68 | 49.21 | 75.41 | 76.98 |
| 3 | 42.14 | 80.64 | 76.96 | 48.48 | 83.46 | 75.32 |
| Avg | 41.68 | 79.26 | 75.58 | 49.82 | 79.51 | 78.57 |
| Pst/PNS | 2.12 | 1.88 | 1.44 | 2.15 | 1.74 | 1.43 |
| Types | [±45]2-2 | [±45]2-4 | [±45]2-5 | [±45]3-2 | [±45]3-4 | [±45]3-4 |
| 1 | 40.31 | 74.39 | 89.31 | 43.87 | 89.8 | 87.08 |
| 2 | 40.51 | 75.30 | 74.83 | 46.21 | 90.23 | 91.02 |
| 3 | 41.79 | 84.53 | 76.71 | 45.94 | 83.64 | 80.93 |
| Avg | 40.87 | 78.07 | 80.28 | 45.34 | 87.89 | 86.34 |
| Pst/PNS | 2.08 | 1.85 | 1.53 | 1.96 | 1.92 | 1.57 |
| Types | [CSM]2-2 | [CSM]2-4 | [CSM]2-5 | [CSM]3-2 | [CSM]3-4 | [CSM]3-5 |
| 1 | 36.97 | 70.18 | 72.92 | 45.50 | 79.06 | 74.82 |
| 2 | 32.58 | 72.57 | 77.04 | 47.01 | 77.88 | 78.29 |
| 3 | 38.25 | 77.08 | 72.07 | 48.6 | 70.08 | 76.04 |
| Avg | 35.93 | 73.27 | 74.01 | 47.04 | 75.67 | 76.38 |
| Pst/PNS | 1.83 | 1.74 | 1.41 | 2.03 | 1.65 | 1.39 |
| No. Bolts | [±45] | [0/90] | [CSM] |
|---|---|---|---|
| e = 2d specimens | |||
| 2 | 108% | 112% | 83% |
| 4 | 85% | 88% | 74% |
| 5 | 53% | 44% | 41% |
| e = 3d specimens | |||
| 2 | 96% | 115% | 103% |
| 4 | 92% | 74% | 65% |
| 5 | 57% | 43% | 39% |
| No. Bolts | [±45] | [0/90] | [CSM] | NS |
|---|---|---|---|---|
| 2 | 10.9% | 19.5% | 30.9% | 17.5% |
| 4 | 12.6% | 0.3% | 3.3% | 8.7% |
| 5 | 7.6% | 4.0% | 3.2% | 5.0% |
| Types | [±45]3-4 4d | [±45]3-4 5d | [0/90]3-4 4d | [0/90]3-4 5d |
|---|---|---|---|---|
| 1 | 87.72 | 79.988 | 75.368 | 77.372 |
| 2 | 91.44 | 87.416 | 75.36 | 68.316 |
| 3 | 86.72 | 80.712 | 69.496 | 75.04 |
| Avg | 88.62 | 82.71 | 73.41 | 73.58 |
Publisher’s Note: MDPI stays neutral with regard to jurisdictional claims in published maps and institutional affiliations. |
© 2022 by the authors. Licensee MDPI, Basel, Switzerland. This article is an open access article distributed under the terms and conditions of the Creative Commons Attribution (CC BY) license (https://creativecommons.org/licenses/by/4.0/).
Share and Cite
Tran, Q.D.; Nhut, P.V.; Matsumoto, Y. Multi-Bolted Connection for Pultruded Glass Fiber Reinforced Polymer’s Structure: A Study on Strengthening by Multiaxial Glass Fiber Sheets. Polymers 2022, 14, 1561. https://doi.org/10.3390/polym14081561
Tran QD, Nhut PV, Matsumoto Y. Multi-Bolted Connection for Pultruded Glass Fiber Reinforced Polymer’s Structure: A Study on Strengthening by Multiaxial Glass Fiber Sheets. Polymers. 2022; 14(8):1561. https://doi.org/10.3390/polym14081561
Chicago/Turabian StyleTran, Quang Duc, Phan Viet Nhut, and Yukihiro Matsumoto. 2022. "Multi-Bolted Connection for Pultruded Glass Fiber Reinforced Polymer’s Structure: A Study on Strengthening by Multiaxial Glass Fiber Sheets" Polymers 14, no. 8: 1561. https://doi.org/10.3390/polym14081561