
Silver-Modified Nano Mordenite for Carbonylation of Dimethyl Ether


Engineering Research Center of Large-scale Reactor Engineering and Technology, Ministry of Education, State Key Laboratory of Chemical Engineering, School of Chemical Engineering, East China University of Science and Technology, Shanghai 200237, China
*
Author to whom correspondence should be addressed.
Catalysts 2021, 11(2), 197; https://doi.org/10.3390/catal11020197
Submission received: 15 January 2021
/
Revised: 29 January 2021
/
Accepted: 29 January 2021
/
Published: 3 February 2021
Abstract
:Mordenite (H-MOR) catalysts were synthesized by a hydrothermal method, and silver-modified mordenite (Ag-MOR) catalysts were prepared by ion exchange with AgNO3 at different concentrations. The performance of these catalysts in the carbonylation of dimethyl ether (DME) to methyl acetate (MA) was also evaluated. The catalysts were characterized by Ar adsorption/desorption, XRD, ICP-AES, SEM, HRTEM, 27Al NMR, H2-TPR, NH3-TPD, Py-IR, and CO-TPD. According to the characterization results, Ag ion exchange sites were mainly located in the 8-membered ring (8-MR) channels of Ag-MOR; evenly dispersed Ag2O particles were also present. The acid site distribution was changed by the modification of Ag, and the amount of Brønsted acid sites increased in 8-MR and decreased in 12-MR. The CO adsorption performance of the catalyst significantly increased with the modification of Ag. These changes improved the conversion and selectivity of the carbonylation of DME. Over 4Ag-MOR in particular, DME conversion and MA selectivity reached 94% and 100%, respectively.
1. Introduction
Because of the increasing serious environmental problems caused by the use of fossil energy, ethanol, a promising alternative, has received more and more attention [1]. The traditional ethanol production process includes grain fermentation [2] and ethylene hydration [3], but separation and purification processes tend to be costly [4]. In recent years, the process of dimethyl ether (DME) carbonylation to methyl acetate (MA) and MA hydrogenation to ethanol has gained the attention of researchers owing to its high atom utilisation and environmental friendliness. Currently, catalysts for this process are mainly divided into two types: zeolite catalysts (such as mordenite (MOR) [5], ZSM-35 [6], ZSM-5 [7], and HFER [8,9]) and heteropoly acid catalysts [10,11]. In recent years, EU-12 [12], SSZ-13 [13], and HSUZ-4 [14] zeolites have also been used in this reaction. However, owing to its unique structure and properties, MOR occupies an important position in the DME carbonylation reaction.
The main structure of MOR is a parallel 12-membered ring (12-MR) with 0.65 × 0.70 nm channels and an 8-membered ring (8-MR) with 0.26 × 0.57 nm channels [15]. The unique steric effect and the Brønsted acid sites of 8-MR are the active sites of the DME carbonylation reaction [16,17]. However, the Brønsted acid sites of 12-MR are more likely to generate hydrocarbons during the reaction [18]. As the reaction progresses, hydrocarbons accumulate in the channels, hindering the progress of the carbonylation reaction [19]. Therefore, adjusting and controlling the distribution of Brønsted acid sites is of great significance in improving the reactivity of MOR. Wang et al. [20] successfully improved the distribution of acid sites in 8-MR by changing the molar ratio of Si/Al and adding template agents. Xue et al. [21] used steam treatment for the selective dealumination of MOR, reducing the amount of acid sites in 12-MR. Zhao et al. [22] formed more Brønsted acid sites in the MOR through steam treatment and improved the reaction activity. Moreover, acid treatment [23], alkali treatment [24], and pyridine adsorption [25,26,27] were also effective in improving the activity of the catalyst and alleviating catalyst poisoning.
Another effective approach to modifying MOR is the addition of transition metals such as Cu [28,29], Zn [30,31], Ce [32], Co [33], Fe [34], and Ni [35]. The addition of transition metals mainly changed the distribution of acid sites, reduced the rate of coking, and alleviated carbon deposition. In addition to single-metal modification, bimetal modification has also been investigated. Reule et al. [36,37] used ion exchange-modified MOR with Cu and Zn and found that the addition of Zn effectively increased the dispersion of Cu, which affected the location of Zn in MOR during ion exchange. Catalyst poisoning was effectively alleviated by the interaction between Cu and Zn. Sheng et al. [38] impregnated Cu ion-exchanged MOR with Pt and obtained a Pt-Cu bimetallic-modified MOR. The addition of Pt increased the amount of acid sites in 8-MR and reduced the amount of acid sites in 12-MR, which improved the reaction activity and eased the formation of hard coke. Regrettably, there are few studies on silver-modified MOR for the carbonylation of DME. As a common monovalent metal, silver is widely used in the field of molecular sieve modification [39]. Therefore, it is possible to try silver-modified mordenite to improve the performance of dimethyl ether carbonylation.
In this study, nano MOR was synthesized by a hydrothermal method. A series of Ag-MOR catalysts with different Ag mass fractions were prepared using the ion exchange method. The purpose of this work was to evaluate and characterize the effect of Ag-MOR on the catalytic performance of DME carbonylation. The catalysts were evaluated in a fixed-bed tubular reactor at 1.0 MPa and 273 °C. The catalysts were characterized using Ar adsorption/desorption, X-ray diffraction (XRD), inductively coupled plasma atomic emission spectroscopy (ICP-AES), scanning electron microscopy (SEM), high-resolution transmission electron microscopy (HRTEM), 27Al magic angle spinning nuclear magnetic resonance (27Al MAS NMR), H2 temperature-programmed reduction (H2-TPR), NH3 temperature-programmed desorption (NH3-TPD), pyridine-infrared (Py-IR) analysis, and CO temperature-programmed desorption (CO-TPD).
2. Results and Discussion
2.1. Catalyst Structure
Figure 1 presents the Ar adsorption-desorption isotherms of the samples. All the samples exhibited typical type-I isotherms. The adsorption capacity increased sharply when P/P0 < 0.05, indicating that the samples contained numerous microporous structures. The hysteresis loop of P/P0 between 0.8 and 1.0 indicated that a mesoporous structure existed in the sample. No obvious change was found in the adsorption-desorption isotherms of the samples, revealing that the addition of Ag did not change the main structure of the MOR.
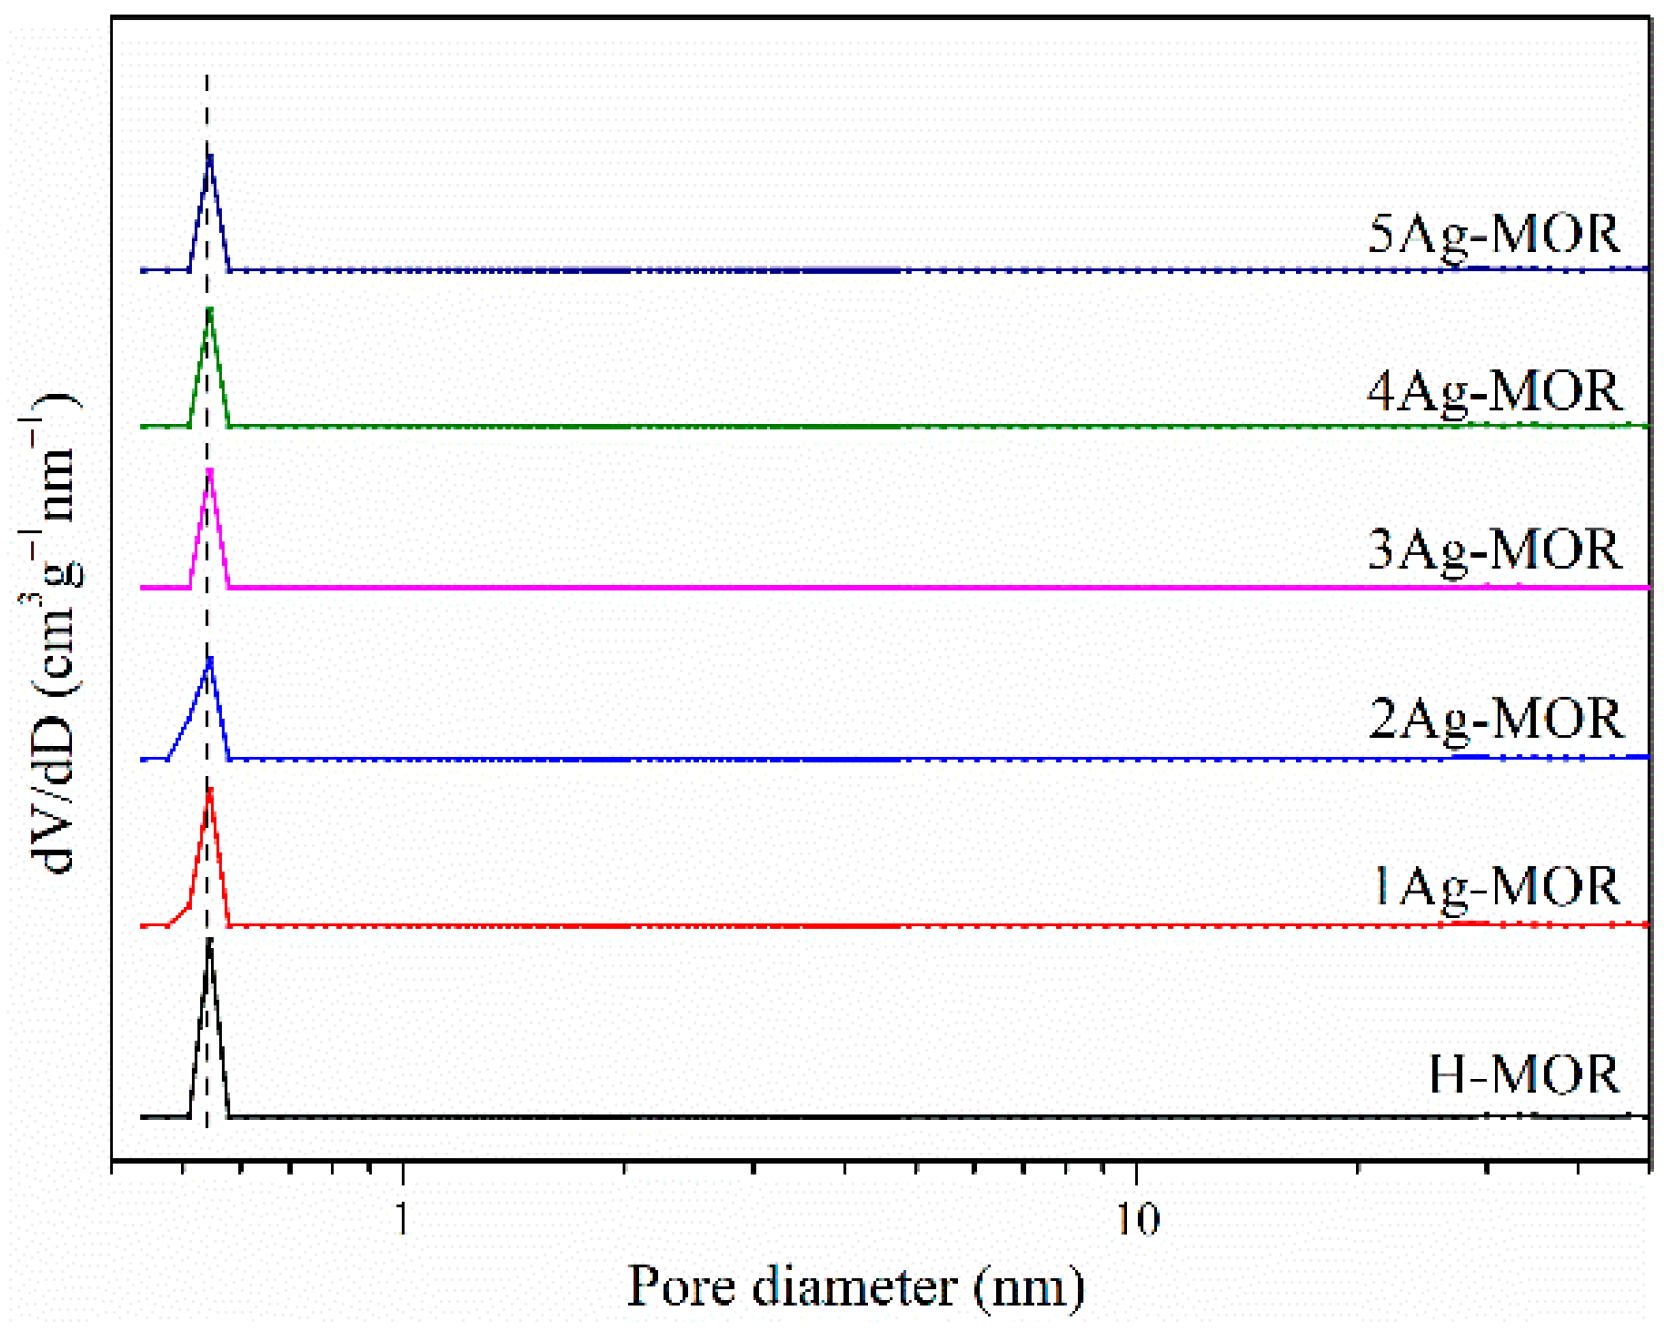
The textural properties of the samples are presented in Table 1. The specific surface area of H-MOR was 385 m2/g, which was the largest of all the samples. With the increase in the concentration of AgNO3 used in the ion exchange, the specific surface area of Ag-MOR decreased slightly. It can be observed from the pore-size distribution of the samples in Figure 2 that the pore diameter was concentrated at approximately 0.55 nm, which corresponded to the microporous structure in MOR. The variation trend of the microporous volume presented in Table 1 corresponds to the results shown in Figure 2. It could be inferred that some of the micropores were obscured by the Ag species, it is also possible that the Ag species entered the micropores, leading to a decrease in the Brunauer-Emmett-Teller (BET) surface area and pore volume of Ag-MOR.
Figure 3a shows the XRD patterns of fresh catalysts. The characteristic peaks can be observed at 2θ = 13.4°, 15.3°, 19.7°, 22.3°, 25.7°, 26.4°, 27.8°, 31.0°, and 35.8°, which are associated with MOR, the Miller indices corresponding to these peaks are also marked [38]. Compared with H-MOR, the peak intensities of Ag-MOR at 19.7°, 22.3° and 25.7° are drastically attenuated, which was also found in other research [40]. These results indicate that MOR was sensitive to the addition of Ag during the ion exchange. In addition, there are no characteristic peaks associated with Ag species in the XRD patterns, suggesting that Ag had a high degree of dispersion in the Ag-MOR [41]. Figure 3b shows a partial view of the XRD results of 2θ = 22.0°–23.0°. From H-MOR to 5Ag-MOR, the peak position shifts to a smaller angle, which represents an increase in the unit lattice parameters. This is caused by the introduction of silver, which has a larger atomic radius, into MOR [32]. In addition, the average crystallite size of the sample is calculated based on the XRD, and the results are listed in Table 1. The average crystallite size of H-MOR exceeds 200 nm and is much higher than that of Ag-MOR. The average crystallite size of Ag-MOR is between 30–50 nm. This shows that the ion exchange process changes the morphology of MOR and reduces the average crystallite size.
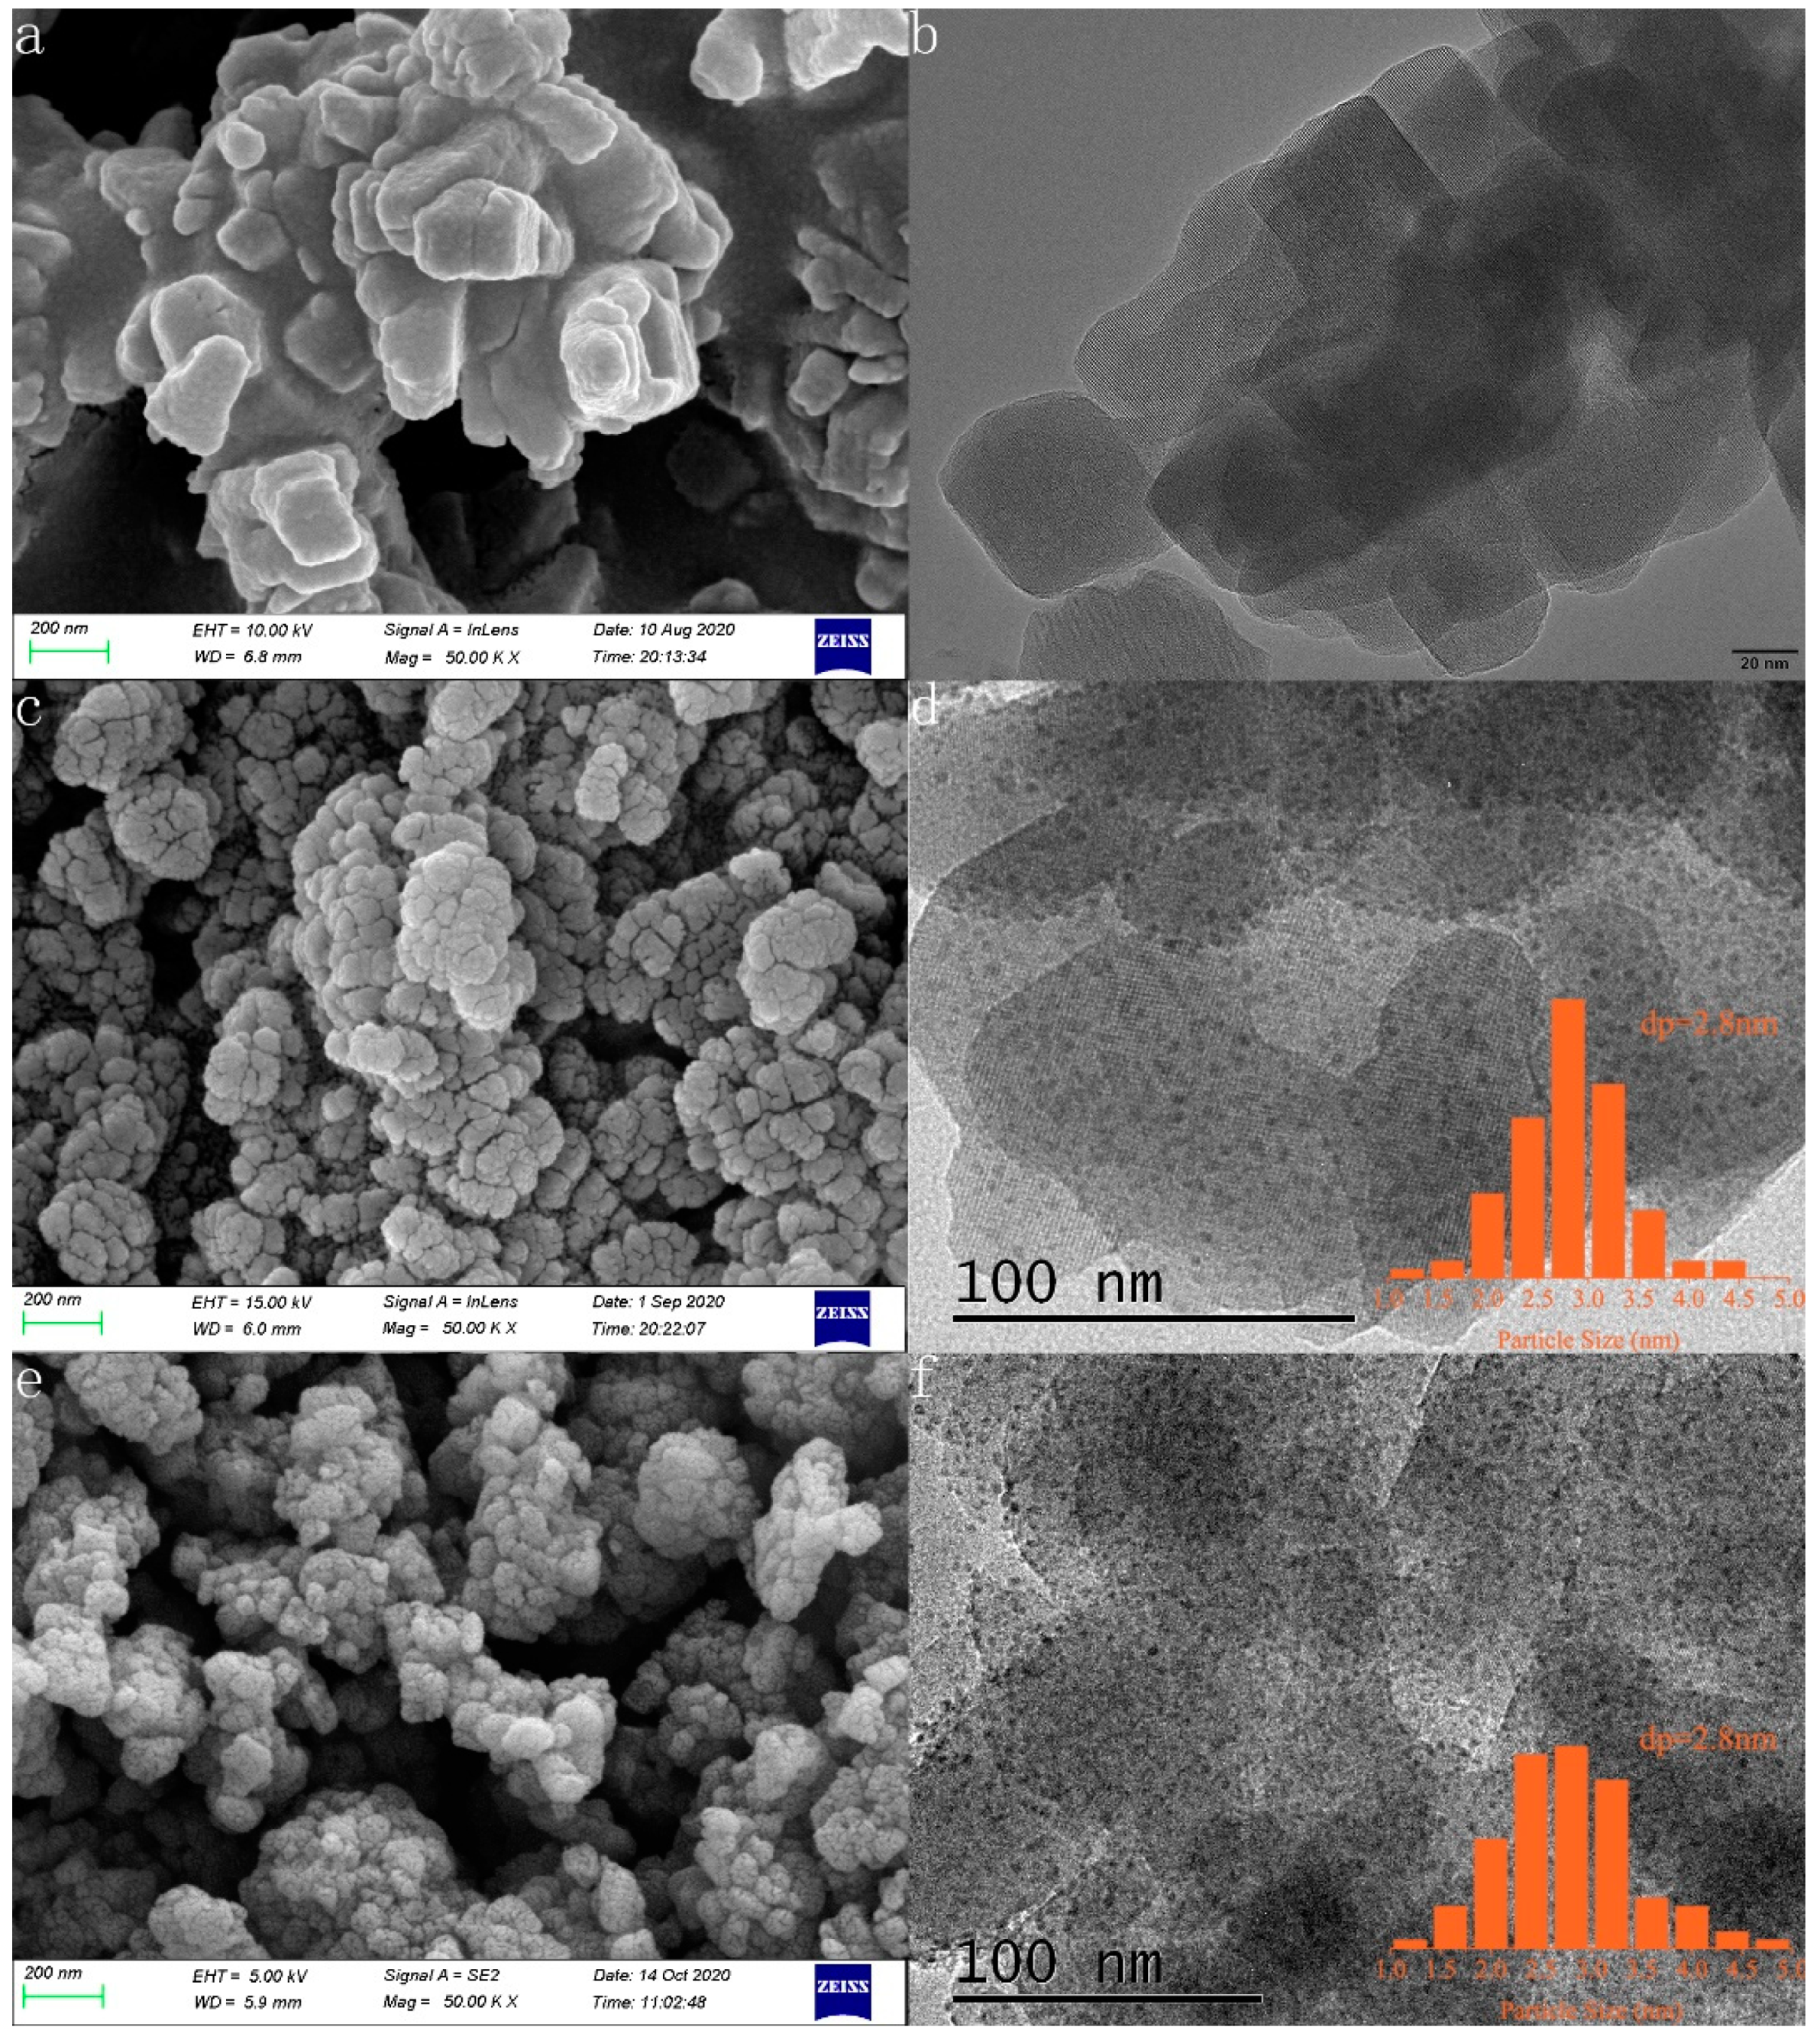
Figure 4 further reveals the microstructure of the samples through SEM and HRTEM. From Figure 4a, the nanometer-scale agglomerate structure of H-MOR can be clearly observed. The size of the particles is about 200 nm. In Figure 4c,e, a nanospherical cluster structure is visible. The size of the particles is about 50 nm. Compared with H-MOR, the particles are significantly smaller. The particle size obtained by SEM observation is basically consistent with the average crystallite size calculated by XRD. The particle size tends to decrease from H-MOR to Ag-MOR owing to the weak acidity of the AgNO3 solution during ion exchange. Research has shown that acid treatment can affect the structure of MOR [42].
The nanochannels are clearly visible in Figure 4b; they can also be observed in Figure 4d,f. This was attributed to the characteristic structure of MOR and indicated that the ion exchange process did not destroy the main structure of MOR. In addition, evenly distributed black shadows can be clearly observed in Figure 4d,f, which correspond to Ag2O particles on Ag-MOR. It can be observed from the particle-size distribution that the average diameter of Ag2O particles (dp) was 2.8 nm in 2Ag-MOR and 4Ag-MOR. Compared with 2Ag-MOR, the particle-size distribution of 4Ag-MOR was more uneven because of the higher concentration of AgNO3 during the ion exchange.
2.2. Catalyst Composition
The chemical compositions of the samples are listed in Table 2. As the AgNO3 concentration increased during ion exchange, the mass fraction of Ag (wt% Ag) in Ag-MOR increased from 4.9% to 8.3%. The Ag contents of the 4Ag-MOR and 5Ag-MOR samples were both 8.3 wt%, indicating that the Ag load reached a maximum. The Si/Al molar ratios of the samples did not change significantly, demonstrating the structural integrity of MOR. The XRD and HRTEM results also proved the integrity of the MOR structure.
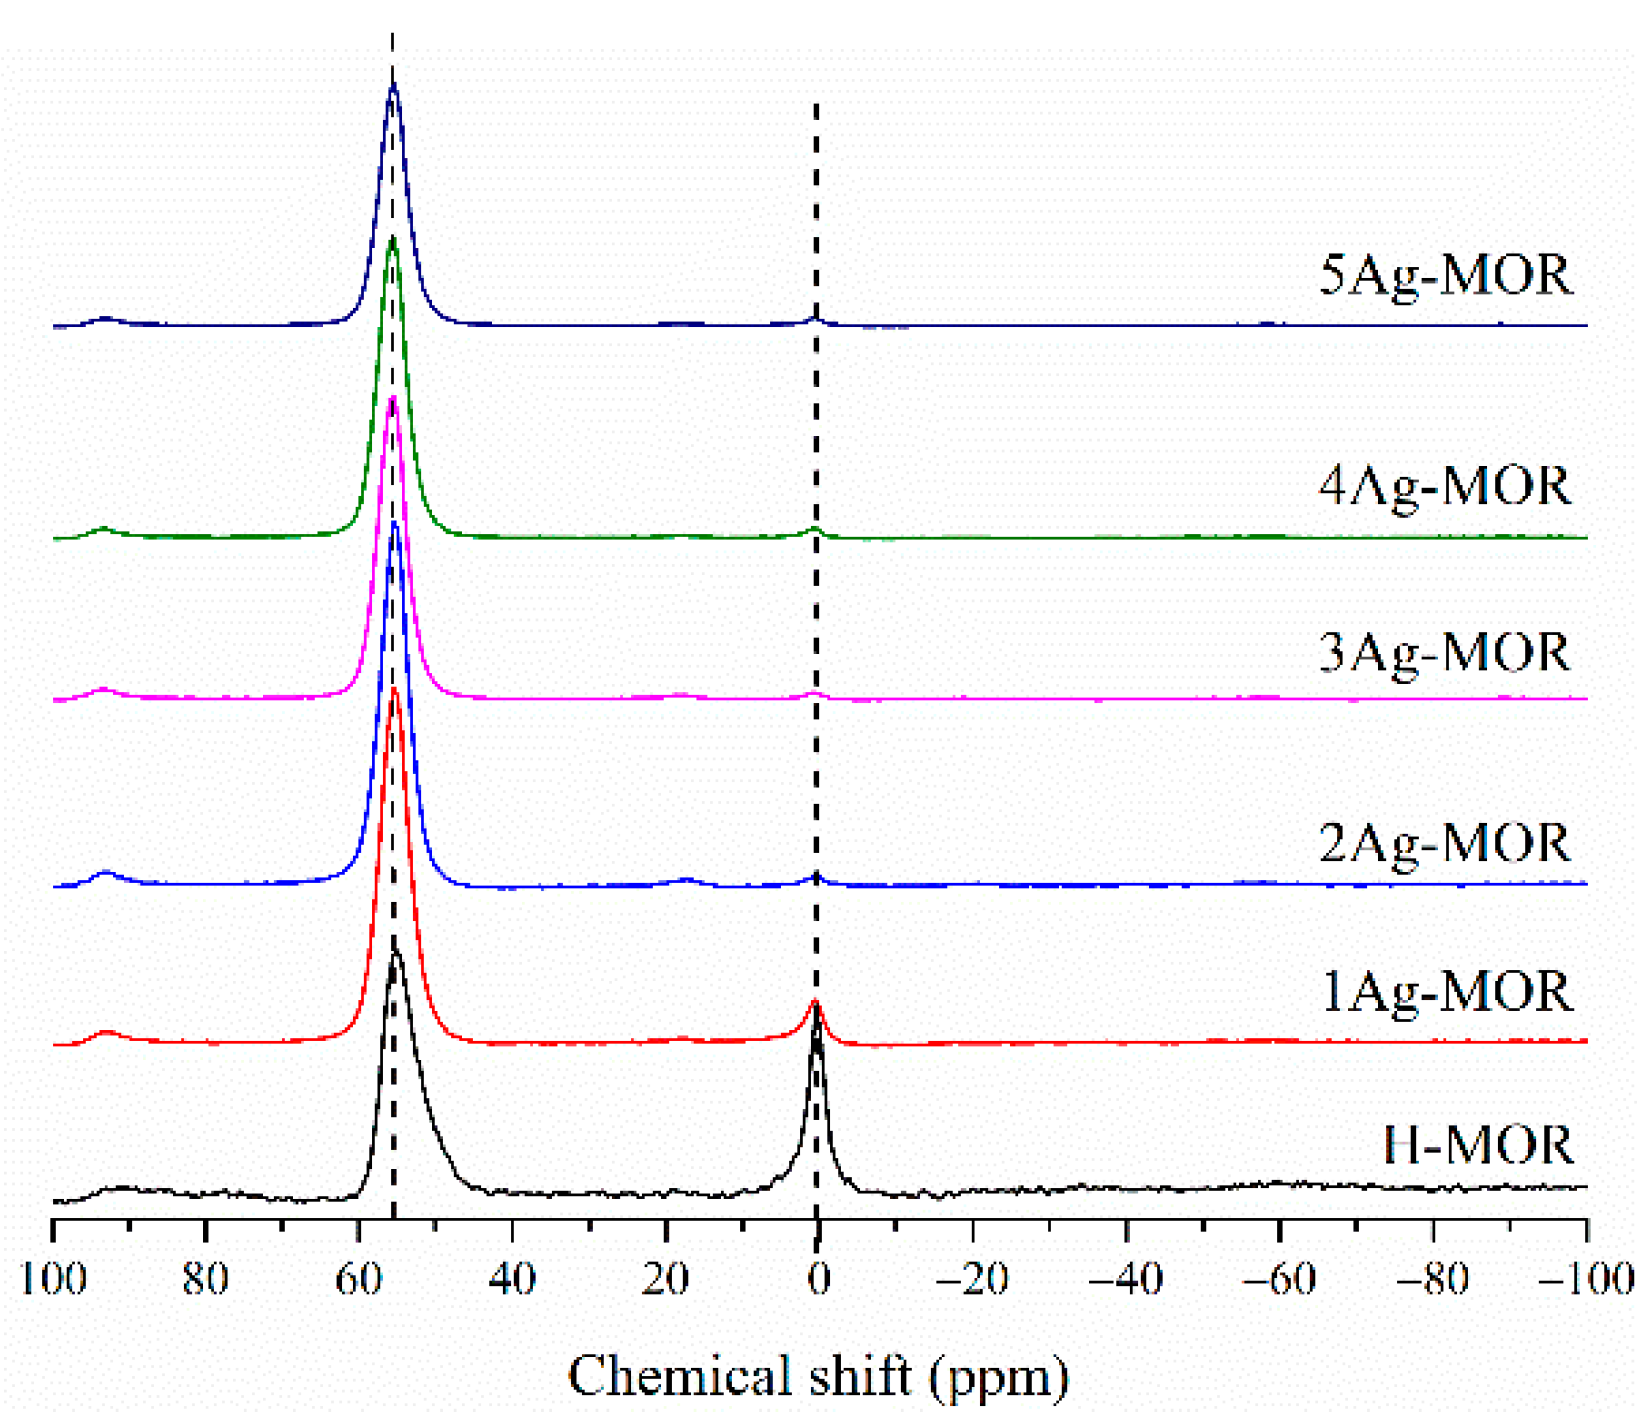
The 27Al MAS NMR spectra of the samples are shown in Figure 5. Because of Loewenstein’s rule, the formation of an Al–O–Al bond is forbidden in MOR [43]. The signal at approximately 55 ppm is thought to be unique as a tetrahedrally coordinated framework aluminum (Alf) and the signal at approximately 0 ppm corresponds to the octahedrally coordinated extra-framework aluminum (Alef) [44]. Studies have shown that Alef determines the distribution of Lewis acid sites and Alf determines the distribution of Brønsted acid sites [42]. The percentages of Alf and Alef, which were calculated by the peak area integral, are listed in Table 2. As the Ag content of Ag-MOR increased, the signal at approximately 55 ppm became stronger and the peak at approximately 0 ppm became weaker and nearly disappeared. Combined with the results of the elemental analysis listed in Table 2, the total amount of Al did not change significantly, suggesting that the distribution of Al changed during ion exchange. It could be inferred that Alef was reinserted into the framework structure during the ion exchange.
The catalytic activity was related to the different species of silver present in the catalyst [45], and H2-TPR is an effective way to identify the Ag species. Figure 6 shows the H2-TPR profiles of the catalysts. The samples exhibit peaks in three temperature regions, which could be attributed to the different kinds of Ag species formed during the ion exchange process. Wichterlová and coworkers [46] divided cationic sites in Coexchanged MOR into three types of sites: α cationic sites are located on 12-MR, β cationic sites are located on 8-MR, and γ cationic sites are located in small cavities of MOR. β cationic sites exhibit octahedral coordination with oxygen atoms, which have higher coordination. The peak centered at approximately 110 °C is assigned to Ag+, which is located inside the 12-MR (α cationic sites), and the peak at approximately 400 °C originated from the reduction of Ag+ in 8-MR (β cationic sites) [47]. According to the H2-TPR studies of mechanical mixtures of Ag2O and Na-MOR, the reduction peak at approximately 180 °C corresponds to the highly dispersed nano Ag2O particles of MOR [48]. The peak intensities at 110 °C and 180 °C are much weaker than the peak intensity at 400 °C, suggesting that most of the Ag entered the pores of 8-MR for ion exchange, whereas a small part of the Ag entered 12-MR or became nano-oxide particles of MOR.
2.3. Acid Site Distribution
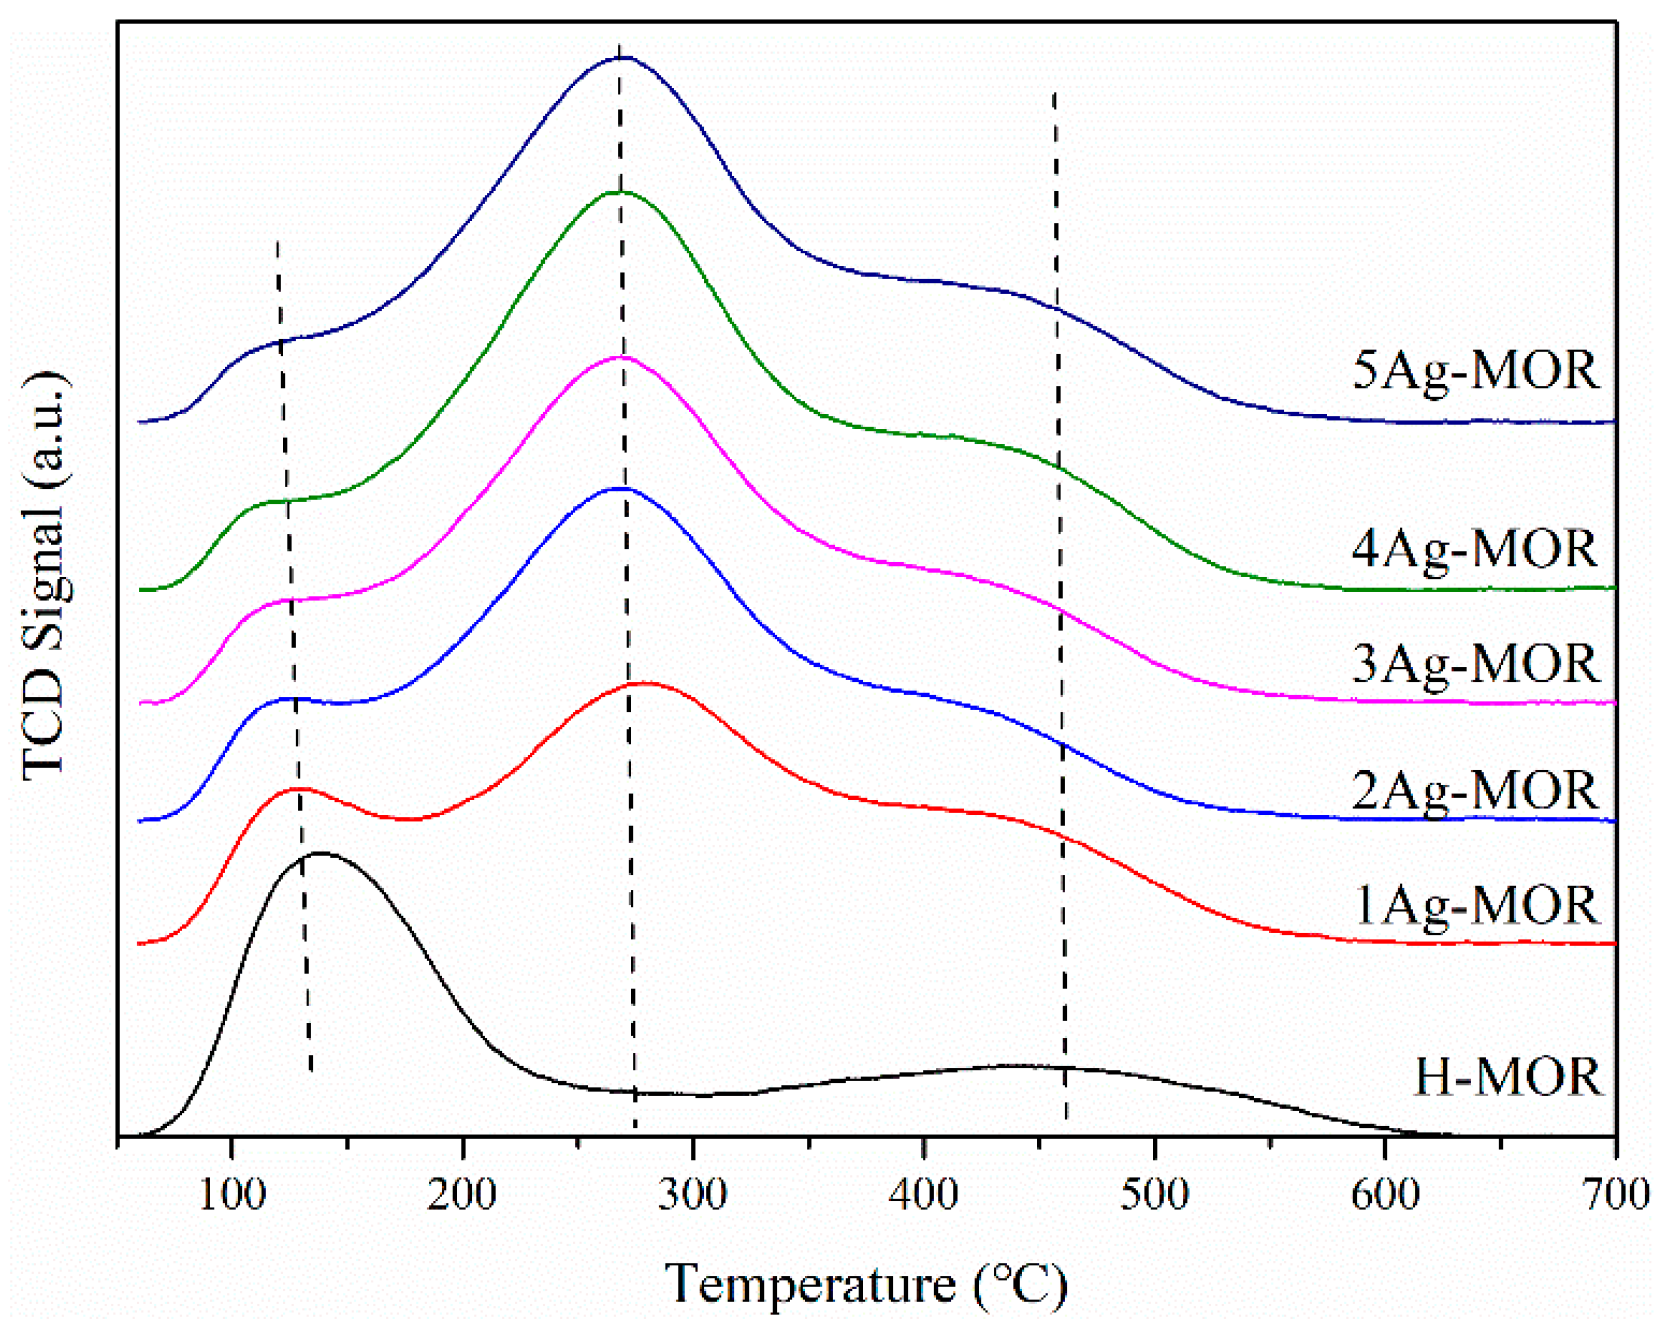
The corresponding NH3-TPD profile is depicted in Figure 7, which was used to identify different acid sites. NH3 desorption peaks located at 130 °C and 460 °C are observed, which are associated with weak and strong acid sites. An additional peak of ammonia desorption is observed at 270 °C in the Ag-MOR samples, which is associated with moderate acid sites [32]. The amounts of weak, moderate, and strong acid sites are listed in Table 3. According to the work of Ma and coworkers [20,32], strong acid sites can be considered as framework Brønsted acid sites in MOR because the high-temperature peak disappears when the Brønsted acid sites are replaced by sodium. The appearance of a moderate-temperature peak is accompanied by a sharp decrease in the low-temperature peak, suggesting that the addition of Ag led to a variation in the distribution of the acid sites. In addition, with the increase in Ag content in MOR, the amount of total acid sites increased, indicating that Ag species play a role in producing more acid sites. However, 5Ag-MOR, which had the same Ag content as 4Ag-MOR, showed a decrease in the amount of acid sites. Combined with the reduction of specific surface area and the increase of Alf content, it may be that the change of Al distribution during ion exchange caused Lewis acid sites decrease significantly.
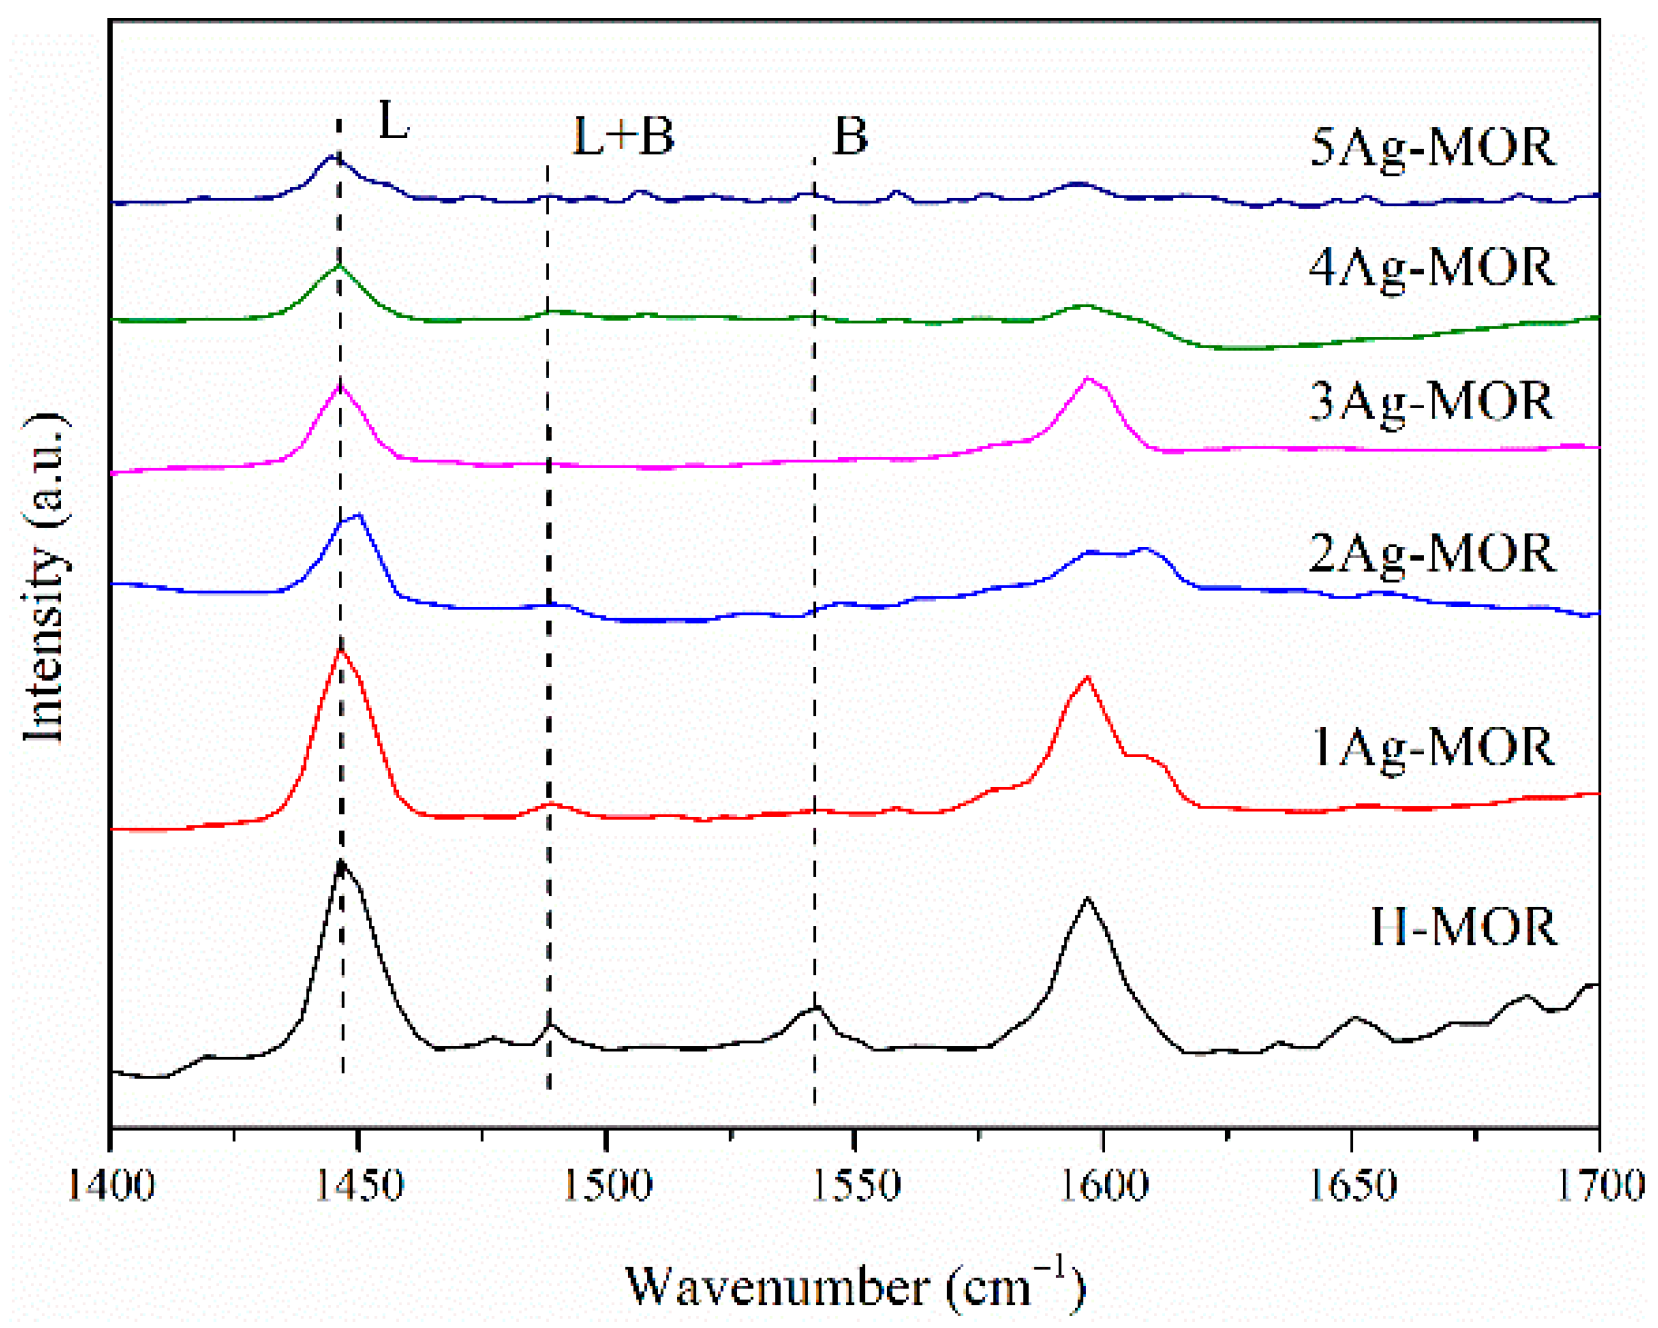
The kinetic diameter of pyridine is suitable for adsorption by 12-MR but not by 8-MR. Thus, Py-IR analysis could exclude the interference of 8-MR and measure the acid site amount and distribution in 12-MR [49]. The results of the characterization are depicted in Figure 8. The pyridine adsorption characteristic bands of the 12-MR Brønsted acid sites are located at 1540 cm−1 and 1630 cm−1. As for Lewis acid sites in 12-MR, the characteristic bands are located at 1450 cm−1 and 1610 cm−1. In addition, the band at 1490 cm−1 is attributed to the joint action of Brønsted acidic sites and Lewis acid sites adsorbed with pyridine [50]. The amount of Brønsted acid sites and Lewis acid sites in 12-MR (B12-MR and L12-MR) were calculated based on the peak areas of the band at 1540 cm−1 and 1450 cm−1. The calculated results are summarized in Table 4. With increasing Ag content in MOR, the amount of B8-MR increased significantly, but it decreased with 5Ag-MOR. This trend coincided with that of the total amount of acid sites. This revealed that Ag could affect the distribution of Brønsted acid sites in 8-MR and produce additional acid sites. Meanwhile, the amount of B12-MR and L12-MR decreased significantly with increasing Ag content, presenting a completely opposite trend to that of 8-MR. It has been reported that in 12-MR, Ag tends to form a cluster structure consisting of 10–15 atoms [51], suggesting that Ag2O accumulated in 12-MR, covered the acid sites, and blocked the pyridine probe molecules from entering 12-MR, resulting in a decrease in the number of acid sites.
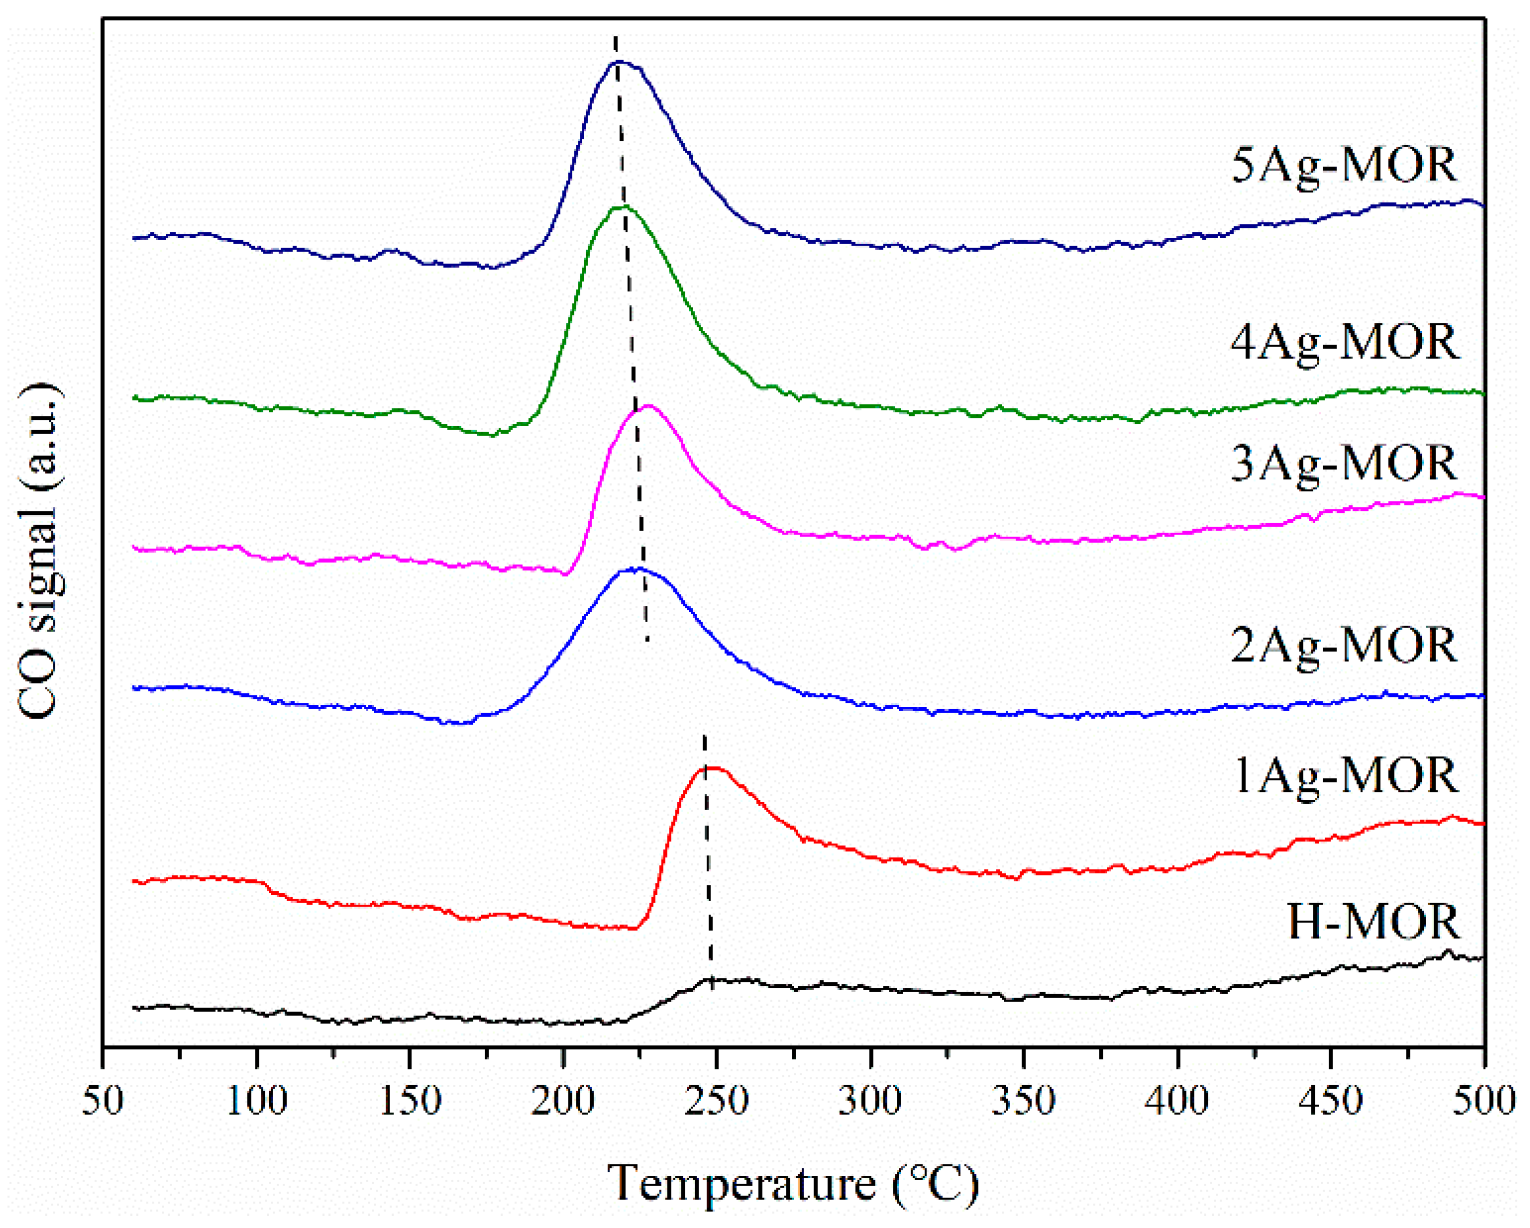
The insertion of CO into the methyl group is the rate-controlling step of DME carbonylation [17,18]. Therefore, the adsorption performance of CO on the catalyst is an important indicator for evaluating the activity of the catalyst [33].It is generally believed that the CO adsorption sites of H-MOR come from the Alef atoms, and the metal atoms introduced through the ion exchange process can form metal Lewis acid sites, providing more CO adsorption sites [35].
It can be seen from the CO-TPD results in Figure 9 that all samples have CO desorption peaks located between 220 and 250 °C, which are attributed to the adsorption of CO on MOR. As the Ag ion exchange concentration increased, the area of the desorption peak increased significantly and moved to the low-temperature region. Combined with the NH3-TPD results, we speculate that the moderate acid sites generated after silver modification provided new sites for CO adsorption [35,52], and the adsorption performance of MOR to CO was greatly enhanced. This helped improve the DME carbonylation performance of the catalyst.
2.4. Activity Test for Carbonylation of DME
Figure 10 shows the results of the carbonylation of DME over the catalysts. All catalysts were evaluated under the same conditions (200 °C, 1.0 MPa, GHSV 9280 mL·g−1·h−1). All samples had an induction period of approximately 100 min in the early stages of the reaction. During the induction period, the reactivity gradually increased, and after the end of the induction period, the reactivity slowly decreased. This is a typical DME carbonylation reaction on MOR.
The DME conversion (XDME) of the catalyst continued to increase from H-MOR to 1Ag-MOR, 2Ag-MOR, 3Ag-MOR, and 4Ag-MOR, whereas that of 5Ag-MOR decreased below that of 3Ag-MOR. The DME conversion of Ag-MOR was higher than that of H-MOR during the evaluation period. 4Ag-MOR performed best in the evaluation process, reaching an XDME value of 96%; the XDME value of H-MOR was 16%.
According to the results of chromatographic analysis, during the reaction, the mainly by-product of the reaction is methanol. For H-MOR, methane, ethane and propane are also produced during the reaction, which is also the main reason for the decrease in MA selectivity on H-MOR. For most Ag-MOR, only a small amount of methanol was generated during the reaction, maintaining a high MA selectivity. For 1Ag-MOR, a small amount of propane and ethane were formed in 0-900 min, but no alkanes are generated after 900 min, making the selectivity slightly increased. The MA selectivities (SMA) of Ag-MOR were higher than those of H-MOR, especially 2Ag-MOR, 3Ag-MOR, 4Ag-MOR, and 5Ag-MOR, which maintained 100% SMA for more than 8 h. The increase in selectivity of Ag-MOR comes from the decrease in the amount of acid sites in 12-MR, which inhibited the side reactions. At the same time, Figure 10c shows the space-time yield at 120 min. It is obvious that 4Ag-MOR > 3Ag-MOR > 5Ag-MOR > 2Ag-MOR > 1Ag-MOR > H-MOR. This is consistent with the result of Figure 10a.
After modifying the MOR with Ag ion exchange, the crystallite size of the sample was significantly reduced. Obviously, the material transfer process is strengthened, which can effectively improve the activity of the reaction. The CO adsorption capacity of Ag-MOR was enhanced, thus strengthening the insertion of CO into the methyl group. More B8-MR was generated after the silver-modified MOR. The amount of B8-MR in Ag-MOR increased with the increase in the concentration of AgNO3 used for MOR modification and decreased at 5Ag-MOR, but it was still higher than that of H-MOR. DME carbonylation requires synergy between B8-MR and CO adsorption. Therefore, the performance of DME carbonylation increased significantly owing to the increase in B8-MR and CO adsorption capacity. In addition, the increase in the MA selectivity of Ag-MOR was owing to the decrease in the amount of acid sites in 12-MR, and the DME conversion of 5Ag-MOR decreased owing to the decrease in B8-MR content.
3. Experimental Section
3.1. Catalyst Preparation
3.1.1. Na-MOR Preparation
A nano sodium mordenite (Na-MOR) was prepared by hydrothermal synthesis. The specific synthesis steps were as follows. First, 1.64 g NaAlO2 (macklin, Shanghai, China) and 1.60 g NaOH (macklin, Shanghai, China) were dissolved in 64 mL deionized water. After the solution was stable, silica sol (SiO2 30 wt%, macklin, Shanghai, China) was added dropwise. Then, 14.11 g tetraethyl ammonium hydroxide (TEAOH, 25 wt% aqueous solution, macklin, Shanghai, China) as the template agent was added to the mixture. The mixture was stirred continuously during the aforementioned processes. Finally, the mixture was transferred to a Teflon-lined autoclave after ageing for 2 h at 20 °C, rotated, and crystallized at 80 °C for 96 h at a rotating speed of 90 rpm. After crystallization, the reacted slurry was centrifuged, washed with deionized water until pH = 7, dried in an oven at 110 °C for 12 h, and calcined in a muffle furnace at 550 °C for 4 h at a heating rate of 1 °C/min to obtain Na-MOR. The molar composition of the mother liquor was as follows: 1NaAlO2:2NaOH:12SiO2:3.00H2O:1.2TEAOH.
3.1.2. NH4-MOR Preparation
NH4-MOR was obtained via NH4Cl ion exchange. Per gram of Na-MOR was thoroughly mixed with 20 mL of a 1.0 mol/L NH4Cl solution, stirred at 80 °C for 4 h, then centrifuged and washed. The above steps were repeated twice. The sample was finally washed to pH 7, placed in an oven, and dried for 12 h at 110 °C.
3.1.3. H-MOR/Ag-MOR Preparation
H-MOR was obtained by calcining NH4-MOR in a muffle furnace at 550 °C for 4 h at a heating rate of 1 °C/min. Ag-MOR was prepared using the AgNO3 ion exchange method. Per gram of NH4-MOR was ion exchanged with 50 mL of x mol/L AgNO3 (x = 0.005, 0.010, 0.015, 0.020, 0.025) at 353 K for 4 h; this process was repeated twice. The sample was then washed to pH = 7, dried for 12 h in an oven at 110 °C, and calcined in a muffle furnace at 550 °C for 4 h to obtain catalysts denoted as XAg-MOR (X = 1, 2, 3, 4, 5). The number before Ag-MOR corresponds to the concentration of AgNO3 in the ion exchange from low to high.
3.2. DME Carbonylation
The catalyst was evaluated in a fixed-bed tubular reactor with an inner diameter of 10 mm. A 40–60 mesh catalyst (500 mg) was placed into the reactor and the upper and lower ends of the catalyst bed were filled with quartz sand and separated by quartz wool. After the catalyst was loaded, it was first purged in N2 at 350 °C and then reduced adequately by a mixture gas of H2/N2 5/95 vol% for 3.5 h. After the above pretreatment, the temperature of the catalyst bed was cooled to a reaction temperature of 200 °C in N2 and then the reactant gas (3 vol% DME, 90 vol% CO, 7 vol% N2) was introduced. The gas hourly space velocity (GHSV) was controlled at 9280 mL/(g·h), and the pressure was maintained at 1.0 MPa. The reaction tail gas was analyzed using an online gas chromatograph (Agilent 7890 A), which was equipped with a TCD and hydrogen flame ion detector (FID) coupled with an HP-PLOT/Q capillary column and an HP-INNOWAX capillary column.
3.3. Catalyst Characterization
The specific surface area, pore volume, and pore diameter of the samples were measured at −196 °C on a Micrometrics ASAP 2020 instrument (America). Prior to the analysis, 200 mg of the sample was degassed under high vacuum conditions at 300 °C for 10 h to remove adsorbed species such as water.
XRD measurements were performed using a rotating anode X-ray powder diffractometer (Rigaku D/max2550VB, Japan) with a Cu Kα radiation source (λ = 0.154 nm) at 40 kV and 200 mA. The patterns were obtained in the 2θ range from 10° to 80° at a scanning speed of 8°/min.
The atomic composition of the samples was determined by ICP-AES (Agilent 725, America). Before the test, 20 mg of the sample was dissolved in an aqueous HF solution.
The SEM characterization was performed using a ZEISS SIGMA 500 instrument (Germany). Before the experiment, the samples were dispersed on conductive tape.
HRTEM micrographs of the catalysts were obtained using a high-resolution JEOL 2010 microscope (Japan). Before the text, the samples were dispersed in ethanol under ultrasonication.
27Al MAS NMR measurements were carried out on a superconducting Fourier NMR spectrometer (BRUKER 500 MHZ/AVANCE III, (Germany) with a solid mass probe.
H2-TPR was carried out using a Micromerities Autochem II 2920 (America) chemisorption apparatus. One hundred milligrams (100 mg) of the sample was cleaned by flowing He for 1 h at 400 °C as a pretreatment. The profile was recorded from 60 to 600 °C at a heating rate of 10 °C/min under a 10/90% volume fraction (vol%) H2/Ar mixture flow.
NH3-TPD was recorded using a Micromerities Autochem II 2920 chemisorption (America) apparatus equipped with a thermal conductivity detector (TCD). One hundred milligrams (100 mg) of the sample was loaded into a U-shaped silica tube and cleaned by flowing He for 0.5 h at 600 °C as a pretreatment. The sample was adsorbed with a 10/90 vol% NH3/He mixture for 30 min after cooling to 60 °C. Then, the sample was purged with He for 30 min to remove NH3, which had no adsorption. The profile was recorded from 60 to 800 °C at a heating rate of 10 K/min under He.
Py-IR spectra were recorded on a Thermo Scientific Nicolet 6700 (Thermo Fisher Scientific, Waltham, MA, USA) with a KBr background. The mass ratio of the samples to KBr was 1:100. The mixture was ground evenly, and approximately 20 mg of the sample was compressed into a wafer and placed in an in situ cell. The sample was purged by N2 flow at 300 °C for 1 h to remove water and exposed to pyridine vapor at 120 °C until saturation. Finally, the sample was cooled to room temperature, and the spectra were collected in the range of 4000–500 cm−1.
CO-TPD was carried out using a Micromerities Autochem II 2920 chemisorption (America) apparatus. One hundred milligrams (100 mg) of the sample was reduced at 300 °C for 2 h under flowing H2. Then, the sample was adsorbed with 5/95 vol% CO/He mixture for 0.5 h after cooling to 60 °C. Finally, the sample was purged with He for 0.5 h to remove the unadsorbed CO. The profile was recorded from 60 to 800 °C under He at a heating rate of 10 °C/min.
4. Conclusions
H-MOR was synthesized via a hydrothermal synthesis, while 1Ag-MOR, 2Ag-MOR, 3Ag-MOR, 4Ag-MOR, and 5Ag-MOR were obtained by a low-concentration AgNO3 ion exchange process. The change in the silver modification to the DME carbonylation performance of the MOR was explored. The lattice expansion and characteristic peak intensity decrease in the XRD patterns indicated that Ag atoms entered the structure of MOR and dispersed evenly. According to the H2-TPR and HRTEM analyses, Ag atoms mainly entered 8-MR and partly entered 12-MR; Ag2O particles were also uniformly dispersed in Ag-MOR. XRD and SEM showed that the modified Ag-MOR crystallite size was reduced. The acid site distribution obtained from NH3-TPD and Py-IR showed that the amount of Brønsted in 8-MR increased. CO-TPD indicated that the CO adsorption capacity of Ag-MOR increased. Under their synergism, the catalytic activity of Ag-MOR increased significantly. For instance, 4Ag-MOR at a content of 8.3 wt% Ag showed the best DME carbonylation activity, with an XDME of 96%, and SMA was maintained at 100% over 8 h. In addition, the amount of acid sites in 12-MR was reduced after the modification of Ag, which inhibited side reactions and increased SMA.
Author Contributions
Q.L., software, formal analysis, investigation, data curation, writing—original draft preparation; W.Q., conceptualization, validation, supervision; H.Z., resources, funding acquisition; H.M., methodology, validation; W.Y., conceptualization, writing—review and editing, validation, project administration. All authors have read and agreed to the published version of the manuscript.
Funding
This research was funded by the Fundamental Research Funds for the Central Universities, grant number 50321012117013.
Data Availability Statement
The data used to support the findings of this study are available from the corresponding author upon request.
Conflicts of Interest
The authors declare no conflict of interest.
References
- Subramani, V.; Gangwal, S.K. A Review of Recent Literature to Search for an Efficient CatalyticProcess for the Conversion of Syngas to Ethanol. Energy Fuels 2008, 22, 814–839. [Google Scholar] [CrossRef]
- Kumar, S.; Singh, N.; Prasad, R. Anhydrous ethanol: A renewable source of energy. Renew. Sustain. Energy Rev. 2010, 14, 1830–1844. [Google Scholar] [CrossRef]
- Nakagawa, Y.; Tajima, N.; Hirao, K. A Theoretical Study of Catalytic Hydration Reactions of Ethylene. J. Comput. Chem. 2000, 21, 1292–1304. [Google Scholar] [CrossRef]
- Yue, H.; Ma, X.; Gong, J. An alternative synthetic approach for efficient catalytic conversion of syngas to ethanol. Acc. Chem. Res. 2014, 47, 1483–1492. [Google Scholar] [CrossRef] [PubMed]
- Sheng, H.; Qian, W.; Zhang, H.; Zhao, P.; Ma, H.; Ying, W. Synthesis of hierarchical porous H-mordenite zeolite for carbonylation of dimethyl ether. Microporous Mesoporous Mater. 2020, 295, 109950. [Google Scholar] [CrossRef]
- Wei, Q.; Yang, G.; Gao, X.; Tan, L.; Ai, P.; Zhang, P.; Lu, P.; Yoneyama, Y.; Tsubaki, N. A facile ethanol fuel synthesis from dimethyl ether and syngas over tandem combination of Cu-doped HZSM35 with Cu-Zn-Al catalyst. Chem. Eng. J. 2017, 316, 832–841. [Google Scholar] [CrossRef]
- Liu, G.; Zhang, Q.; Han, Y.; Tan, Y. Direct oxidation of dimethyl ether to ethanol over WO3/HZSM-5 catalysts. Catal. Commun. 2012, 26, 173–177. [Google Scholar] [CrossRef]
- Ham, H.; Jung, H.S.; Kim, H.S.; Kim, J.; Cho, S.J.; Lee, W.B.; Park, M.-J.; Bae, J.W. Gas-Phase Carbonylation of Dimethyl Ether on the Stable Seed-Derived Ferrierite. ACS Catal. 2020, 10, 5135–5146. [Google Scholar] [CrossRef]
- Jung, H.S.; Ham, H.; Bae, J.W. Highly stable seed-derived ferrierite for carbonylation of dimethyl ether to methyl acetate: Effects of seed content to catalytic stability. Catal. Today 2020, 339, 79–85. [Google Scholar] [CrossRef]
- Luzgin, M.V.; Kazantsev, M.S.; Volkova, G.G.; Stepanov, A.G. Solid-state NMR study of the kinetics and mechanism of dimethyl ether carbonylation on cesium salt of 12-tungstophosphoric acid modified with Ag, Pt, and Rh. J. Catal. 2013, 308, 250–257. [Google Scholar] [CrossRef]
- Shen, H.; Li, Y.; Huang, S.; Cai, K.; Cheng, Z.; Lv, J.; Ma, X. The carbonylation of dimethyl ether catalyzed by supported heteropoly acids: The role of Brønsted acid properties. Catal. Today 2019, 330, 117–123. [Google Scholar] [CrossRef]
- Feng, X.B.; Yao, J.; Li, H.J.; Fang, Y.; Yoneyama, Y.; Yang, G.H.; Tsubaki, N. A brand new zeolite catalyst for carbonylation reaction. Chem. Commun. 2019, 55, 1048–1051. [Google Scholar] [CrossRef] [PubMed]
- Lusardi, M.; Chen, T.T.; Kale, M.; Kang, J.H.; Neurock, M.; Davis, M.E. Carbonylation of Dimethyl Ether to Methyl Acetate over SSZ-13. ACS Catal. 2020, 10, 842–851. [Google Scholar] [CrossRef] [Green Version]
- Xiong, Z.; Zhan, E.; Li, M.; Shen, W. DME carbonylation over a HSUZ-4 zeolite. Chem. Commun. 2020, 56, 3401–3404. [Google Scholar] [CrossRef]
- Shaikh, A.A.; Joshi, P.N.; Jacob, N.E.; Shiralkar, V.P. Direct hydrothermal crystallization of high-silica large-port mordenite. Zeolites 1993, 13, 511–517. [Google Scholar] [CrossRef]
- Liu, Z.Q.; Yi, X.F.; Wang, G.R.; Tang, X.M.; Li, G.C.; Huang, L.; Zheng, A.M. Roles of 8-ring and 12-ring channels in mordenite for carbonylation reaction: From the perspective of molecular adsorption and diffusion. J. Catal. 2019, 369, 335–344. [Google Scholar] [CrossRef]
- Chu, Y.; Lo, A.-Y.; Wang, C.; Deng, F. Origin of High Selectivity of Dimethyl Ether Carbonylation in the 8-Membered Ring Channel of Mordenite Zeolite. J. Phys. Chem. C 2019, 123, 15503–15512. [Google Scholar] [CrossRef]
- Zhou, H.; Zhu, W.; Shi, L.; Liu, H.; Liu, S.; Ni, Y.; Liu, Y.; He, Y.; Xu, S.; Li, L.; et al. In situ DRIFT study of dimethyl ether carbonylation to methyl acetate on H-mordenite. J. Mol. Catal. A Chem. 2016, 417, 1–9. [Google Scholar] [CrossRef]
- Chaouati, N.; Soualah, A.; Chater, M.; Tarighi, M.; Pinard, L. Mechanisms of coke growth on mordenite zeolite. J. Catal. 2016, 344, 354–364. [Google Scholar] [CrossRef]
- Wang, M.; Huang, S.; Lü, J.; Cheng, Z.; Li, Y.; Wang, S.; Ma, X. Modifying the acidity of H-MOR and its catalytic carbonylation of dimethyl ether. Chin. J. Catal. 2016, 37, 1530–1537. [Google Scholar] [CrossRef]
- Xue, H.; Huang, X.; Zhan, E.; Ma, M.; Shen, W. Selective dealumination of mordenite for enhancing its stability in dimethyl ether carbonylation. Catal. Commun. 2013, 37, 75–79. [Google Scholar] [CrossRef]
- Zhao, N.; Cheng, Q.; Lyu, S.; Guo, L.; Tian, Y.; Ding, T.; Xu, J.; Ma, X.; Li, X. Promoting dimethyl ether carbonylation over hot-water pretreated H-mordenite. Catal. Today 2020, 339, 86–92. [Google Scholar] [CrossRef]
- Han, H.B.; Wang, Y.H.; Li, K.; Lei, J.; Liu, D.H.; Yan, Z.F. Acetic Acid Leaching on the Structure, Acidity and Performance of HMOR Catalyst. J. Inorg. Mater. 2019, 34, 179–185. [Google Scholar] [CrossRef]
- Wang, X.; Li, R.; Yu, C.; Liu, Y.; Zhang, L.; Xu, C.; Zhou, H. Enhancing the dimethyl ether carbonylation performance over mordenite catalysts by simple alkaline treatment. Fuel 2019, 239, 794–803. [Google Scholar] [CrossRef]
- Cao, K.; Fan, D.; Li, L.; Fan, B.; Wang, L.; Zhu, D.; Wang, Q.; Tian, P.; Liu, Z. Insights into the Pyridine-Modified MOR Zeolite Catalysts for DME Carbonylation. ACS Catal. 2020, 10, 3372–3380. [Google Scholar] [CrossRef]
- Zhao, N.; Tian, Y.; Zhang, L.F.; Cheng, Q.P.; Lyu, S.S.; Ding, T.; Hu, Z.P.; Ma, X.B.; Li, X.G. Spacial hindrance induced recovery of over-poisoned active acid sites in pyridine-modified H-mordenite for dimethyl ether carbonylation. Chin. J. Catal. 2019, 40, 895–904. [Google Scholar] [CrossRef]
- Liu, J.; Xue, H.; Huang, X.; Wu, P.; Huang, S.; Liu, S.; Shen, W. Stability Enhancement of H-Mordenite in Dimethyl Ether Carbonylation to Methyl Acetate by Pre-adsorption of Pyridine. Chin. J. Catal. 2010, 31, 729–738. [Google Scholar] [CrossRef]
- Cheng, Z.; Huang, S.; Li, Y.; Cai, K.; Yao, D.; Lv, J.; Wang, S.; Ma, X. Carbonylation of dimethyl ether over MOR and Cu/H-MOR catalysts: Comparative investigation of deactivation behavior. Appl. Catal. A Gen. 2019, 576, 1–10. [Google Scholar] [CrossRef]
- Zhan, H.; Huang, S.; Li, Y.; Lv, J.; Wang, S.; Ma, X. Elucidating the nature and role of Cu species in enhanced catalytic carbonylation of dimethyl ether over Cu/H-MOR. Catal. Sci. Technol. 2015, 5, 4378–4389. [Google Scholar] [CrossRef]
- Zhang, Z.; Zhao, N.; Ma, K.; Cheng, Q.; Zhang, J.; Zheng, L.; Tian, Y.; Li, X. Isolated zinc in mordenite stabilizing carbonylation of dimethyl ether to methyl acetate. Chin. Chem. Lett. 2019, 30, 513–516. [Google Scholar] [CrossRef]
- Aponte, Y.; de Lasa, H. The Effect of Zn on Offretite Zeolite Properties. Acidic Characterizations and NH3-TPD Desorption Models. Ind. Eng. Chem. Res. 2017, 56, 1948–1960. [Google Scholar] [CrossRef]
- Li, Y.; Huang, S.; Cheng, Z.; Cai, K.; Li, L.; Milan, E.; Lv, J.; Wang, Y.; Sun, Q.; Ma, X. Promoting the activity of Ce-incorporated MOR in dimethyl ether carbonylation through tailoring the distribution of Brønsted acids. Appl. Catal. B Environ. 2019, 256, 117777. [Google Scholar] [CrossRef]
- Ma, M.; Zhan, E.; Huang, X.; Ta, N.; Xiong, Z.; Bai, L.; Shen, W. Carbonylation of dimethyl ether over Co-HMOR. Catal. Sci. Technol. 2018, 8, 2124–2130. [Google Scholar] [CrossRef]
- Zhou, H.; Zhu, W.; Shi, L.; Liu, H.; Liu, S.; Xu, S.; Ni, Y.; Liu, Y.; Li, L.; Liu, Z. Promotion effect of Fe in mordenite zeolite on carbonylation of dimethyl ether to methyl acetate. Catal. Sci. Technol. 2015, 5, 1961–1968. [Google Scholar] [CrossRef]
- Wang, S.; Guo, W.; Zhu, L.; Wang, H.; Qiu, K.; Cen, K. Methyl Acetate Synthesis from Dimethyl Ether Carbonylation over Mordenite Modified by Cation Exchange. J. Phys. Chem. C 2014, 119, 524–533. [Google Scholar] [CrossRef]
- Reule, A.A.C.; Semagina, N. Zinc Hinders Deactivation of Copper-Mordenite: Dimethyl Ether Carbonylation. ACS Catal. 2016, 6, 4972–4975. [Google Scholar] [CrossRef]
- Reule, A.A.C.; Shen, J.; Semagina, N. Copper Affects the Location of Zinc in Bimetallic Ion-Exchanged Mordenite. ChemPhysChem 2018, 19, 1500–1506. [Google Scholar] [CrossRef]
- Sheng, H.; Ma, H.; Qian, W.; Fei, N.; Zhang, H.; Ying, W. Platinum–Copper Bimetallic-Modified Nanoprism Mordenite for Carbonylation of Dimethyl Ether. Energy Fuels 2019, 33, 10159–10166. [Google Scholar] [CrossRef]
- Conte, M.; Lopez-Sanchez, J.A.; He, Q.; Morgan, D.J.; Ryabenkova, Y.; Bartley, J.K.; Carley, A.F.; Taylor, S.H.; Kiely, C.J.; Khalid, K.; et al. Modified zeolite ZSM-5 for the methanol to aromatics reaction. Catal. Sci. Technol. 2012, 2, 105–112. [Google Scholar] [CrossRef]
- Sánchez-López, P.; Antúnez-García, J.; Fuentes-Moyado, S.; Galván, D.H.; Petranovskii, V.; Chávez-Rivas, F. Analysis of theoretical and experimental X-ray diffraction patterns for distinct mordenite frameworks. J. Mater. Sci. 2019, 54, 7745–7757. [Google Scholar] [CrossRef]
- Aspromonte, S.G.; Romero, A.; Boix, A.V.; Alonso, E. Hydrolysis of cellulose to glucose by supercritical water and silver mesoporous zeolite catalysts. Cellulose 2019, 26, 2471–2485. [Google Scholar] [CrossRef] [Green Version]
- Reule, A.A.C.; Sawada, J.A.; Semagina, N. Effect of selective 4-membered ring dealumination on mordenite-catalyzed dimethyl ether carbonylation. J. Catal. 2017, 349, 98–109. [Google Scholar] [CrossRef]
- Abdelrasoul, A.; Zhang, H.; Cheng, C.-H.; Doan, H. Applications of molecular simulations for separation and adsorption in zeolites. Microporous Mesoporous Mater. 2017, 242, 294–348. [Google Scholar] [CrossRef]
- Van laak, A.N.C.; Gosselink, R.W.; Sagala, S.L.; Meeldijk, J.D.; de Jongh, P.E.; de Jong, K.P. Alkaline treatment on commercially available aluminum rich mordenite. Appl. Catal. A Gen. 2010, 382, 65–72. [Google Scholar] [CrossRef]
- Li, S.; Cai, K.; Li, Y.; Liu, S.; Yu, M.; Wang, Y.; Ma, X.; Huang, S. Identifying the Active Silver Species in Carbonylation of Dimethyl Ether over Ag−HMOR. ChemCatChem 2020, 12, 3290–3297. [Google Scholar] [CrossRef]
- Kaucký, D.; Vondrová, A.; Dědeček, J.; Wichterlová, B. Activity of Co Ion Sites in ZSM-5, Ferrierite, and Mordenite in Selective Catalytic Reduction of NO with Methane. J. Catal. 2000, 194, 318–329. [Google Scholar] [CrossRef]
- Chiericatti, C.; Basílico, J.C.; Basílico, M.L.Z.; Zamaro, J.M. Antifungal activity of silver ions exchanged in mordenite. Microporous Mesoporous Mater. 2014, 188, 118–125. [Google Scholar] [CrossRef]
- Aspromonte, S.G.; Serra, R.M.; Miró, E.E.; Boix, A.V. AgNaMordenite catalysts for hydrocarbon adsorption and deNOx processes. Appl. Catal. A Gen. 2011, 407, 134–144. [Google Scholar] [CrossRef]
- He, T.; Liu, X.; Xu, S.; Han, X.; Pan, X.; Hou, G.; Bao, X. Role of 12-Ring Channels of Mordenite in DME Carbonylation Investigated by Solid-State NMR. J. Phys. Chem. C 2016, 120, 22526–22531. [Google Scholar] [CrossRef]
- Huang, S.; Wang, Y.; Wang, Z.; Yan, B.; Wang, S.; Gong, J.; Ma, X. Cu-doped zeolites for catalytic oxidative carbonylation: The role of Brønsted acids. Appl. Catal. A Gen. 2012, 417, 236–242. [Google Scholar] [CrossRef]
- Rimsza, J.M.; Chapman, K.W.; Nenoff, T.M. Energetics and Structure of Ag–Water Clusters Formed in Mordenite. J. Phys. Chem. C 2020, 124, 4517–4524. [Google Scholar] [CrossRef]
- Zhao, P.; Qian, W.; Ma, H.; Sheng, H.; Zhang, H.; Ying, W. Effect of Zr Incorporation on Mordenite Catalyzed Dimethyl Ether Carbonylation. Catal. Lett. 2020, 1–15. [Google Scholar] [CrossRef]
Figure 1.
Ar adsorption–desorption isotherms of the catalysts.

Figure 2.
Pore-size distribution of the catalysts.

Figure 3.
XRD patterns of samples. (a) Enlarged scale 2θ = 10.0°–50.0°; (b) enlarged scale 2θ = 22.0°–23.0°.
Figure 3.
XRD patterns of samples. (a) Enlarged scale 2θ = 10.0°–50.0°; (b) enlarged scale 2θ = 22.0°–23.0°.

Figure 4.
(a) SEM image of H-MOR; (b) HRTEM image of H-MOR; (c) SEM image of 2Ag-MOR; (d) HRTEM image of 2Ag-MOR; (e) SEM image of 4Ag-MOR; (f) HRTEM image of 4Ag-MOR.
Figure 4.
(a) SEM image of H-MOR; (b) HRTEM image of H-MOR; (c) SEM image of 2Ag-MOR; (d) HRTEM image of 2Ag-MOR; (e) SEM image of 4Ag-MOR; (f) HRTEM image of 4Ag-MOR.

Figure 5.
27Al MAS NMR spectra of catalysts.

Figure 6.
H2-TPR profiles of the catalysts.

Figure 7.
NH3-TPD profiles of the catalysts.

Figure 8.
Py-IR spectra of the catalysts.

Figure 9.
CO-TPD spectra of the catalysts.

Figure 10.
Performances of DME carbonylation over catalysts. (a) DME conversion rate during catalyst evaluation; (b) MA selectivity during catalyst evaluation; (c) MA space-time yield at 120 min.
Figure 10.
Performances of DME carbonylation over catalysts. (a) DME conversion rate during catalyst evaluation; (b) MA selectivity during catalyst evaluation; (c) MA space-time yield at 120 min.


Table 1.
Textural properties of the catalysts.
| Sample | Surface Area (m2/g) | Pore Volume (cm3/g) | Crystallite Size e (nm) | ||||
|---|---|---|---|---|---|---|---|
| SBETa | Smicrob | Sextc | Vtotalb | Vmicrob | Vmesod | ||
| H-MOR | 385 | 310 | 75 | 0.35 | 0.15 | 0.20 | 204 |
| 1Ag-MOR | 334 | 276 | 58 | 0.31 | 0.13 | 0.18 | 54 |
| 2Ag-MOR | 331 | 273 | 58 | 0.32 | 0.12 | 0.20 | 33 |
| 3Ag-MOR | 327 | 270 | 57 | 0.32 | 0.13 | 0.19 | 30 |
| 4Ag-MOR | 320 | 265 | 55 | 0.31 | 0.13 | 0.18 | 40 |
| 5Ag-MOR | 316 | 261 | 55 | 0.30 | 0.12 | 0.18 | 32 |
a BET surface area. b Microporous surface area and pore volume calculated by t-plot method. c External surface area Sext = SBET − Smicro. d Mesoporous pore volume Vmeso = Vtotal − Vmicro. e Crystallite size calculated by Scherrer equation according to the results of XRD.
Table 2.
Chemical compositions of catalysts.
| Sample | Element Content a (wt%) | Si/Al (Molar Ratio) | Alf b (%) | Alef b (%) | ||
|---|---|---|---|---|---|---|
| Al | Si | Ag | ||||
| H-MOR | 3.3 | 34 | - | 9.9 | 72.1 | 27.9 |
| 1Ag-MOR | 3.1 | 32 | 4.9 | 10.0 | 93.0 | 7.0 |
| 2Ag-MOR | 3.1 | 32 | 6.9 | 10.0 | 97.6 | 2.4 |
| 3Ag-MOR | 3.0 | 32 | 7.8 | 10.3 | 97.7 | 2.3 |
| 4Ag-MOR | 3.0 | 31 | 8.3 | 10.0 | 98.0 | 2.0 |
| 5Ag-MOR | 3.0 | 31 | 8.3 | 10.0 | 97.3 | 2.7 |
a Measured by ICP-AES. b Measured by 27Al MAS NMR.
Table 3.
The amount of acid sites of catalysts.
| Catalyst | Amount of Acid Sites (μmol/g) a | |||
|---|---|---|---|---|
| Weak | Moderate | Strong | Total | |
| H-MOR | 933 | - | 301 | 1234 |
| 1Ag-MOR | 264 | 1084 | 405 | 1753 |
| 2Ag-MOR | 194 | 1198 | 446 | 1838 |
| 3Ag-MOR | 178 | 1277 | 457 | 1912 |
| 4Ag-MOR | 168 | 1435 | 569 | 2172 |
| 5Ag-MOR | 178 | 1265 | 561 | 2004 |
a Calculated based on NH3-TPD.
Table 4.
The distribution of acid sites of catalysts.
| Catalyst | Amount of Acid Sites (μmol/g) | |||
|---|---|---|---|---|
| Btotal a | B12-MR b | L12-MR b | B8-MR c | |
| H-MOR | 301 | 59 | 461 | 242 |
| 1Ag-MOR | 405 | 19 | 431 | 386 |
| 2Ag-MOR | 447 | 12 | 195 | 435 |
| 3Ag-MOR | 457 | 8 | 208 | 449 |
| 4Ag-MOR | 569 | 6 | 131 | 563 |
| 5Ag-MOR | 560 | 11 | 101 | 549 |
a Total Brønsted acid site (Btotal) calculated based on NH3-TPD. b Calculated based on Py-IR. c Brønsted acid site in 8-MR (B8-MR) B8-MR = Btotal − B12-MR.
Publisher’s Note: MDPI stays neutral with regard to jurisdictional claims in published maps and institutional affiliations. |
© 2021 by the authors. Licensee MDPI, Basel, Switzerland. This article is an open access article distributed under the terms and conditions of the Creative Commons Attribution (CC BY) license (http://creativecommons.org/licenses/by/4.0/).
Share and Cite
MDPI and ACS Style
Lu, Q.; Qian, W.; Ma, H.; Zhang, H.; Ying, W. Silver-Modified Nano Mordenite for Carbonylation of Dimethyl Ether. Catalysts 2021, 11, 197. https://doi.org/10.3390/catal11020197
AMA Style
Lu Q, Qian W, Ma H, Zhang H, Ying W. Silver-Modified Nano Mordenite for Carbonylation of Dimethyl Ether. Catalysts. 2021; 11(2):197. https://doi.org/10.3390/catal11020197
Chicago/Turabian StyleLu, Qijia, Weixin Qian, Hongfang Ma, Haitao Zhang, and Weiyong Ying. 2021. "Silver-Modified Nano Mordenite for Carbonylation of Dimethyl Ether" Catalysts 11, no. 2: 197. https://doi.org/10.3390/catal11020197
Note that from the first issue of 2016, this journal uses article numbers instead of page numbers. See further details here.