
Pan-Cancer Study on Variants of Canonical miRNA Biogenesis Pathway Components: A Pooled Analysis

 , ,
, , 
Abstract
:Simple Summary
Abstract
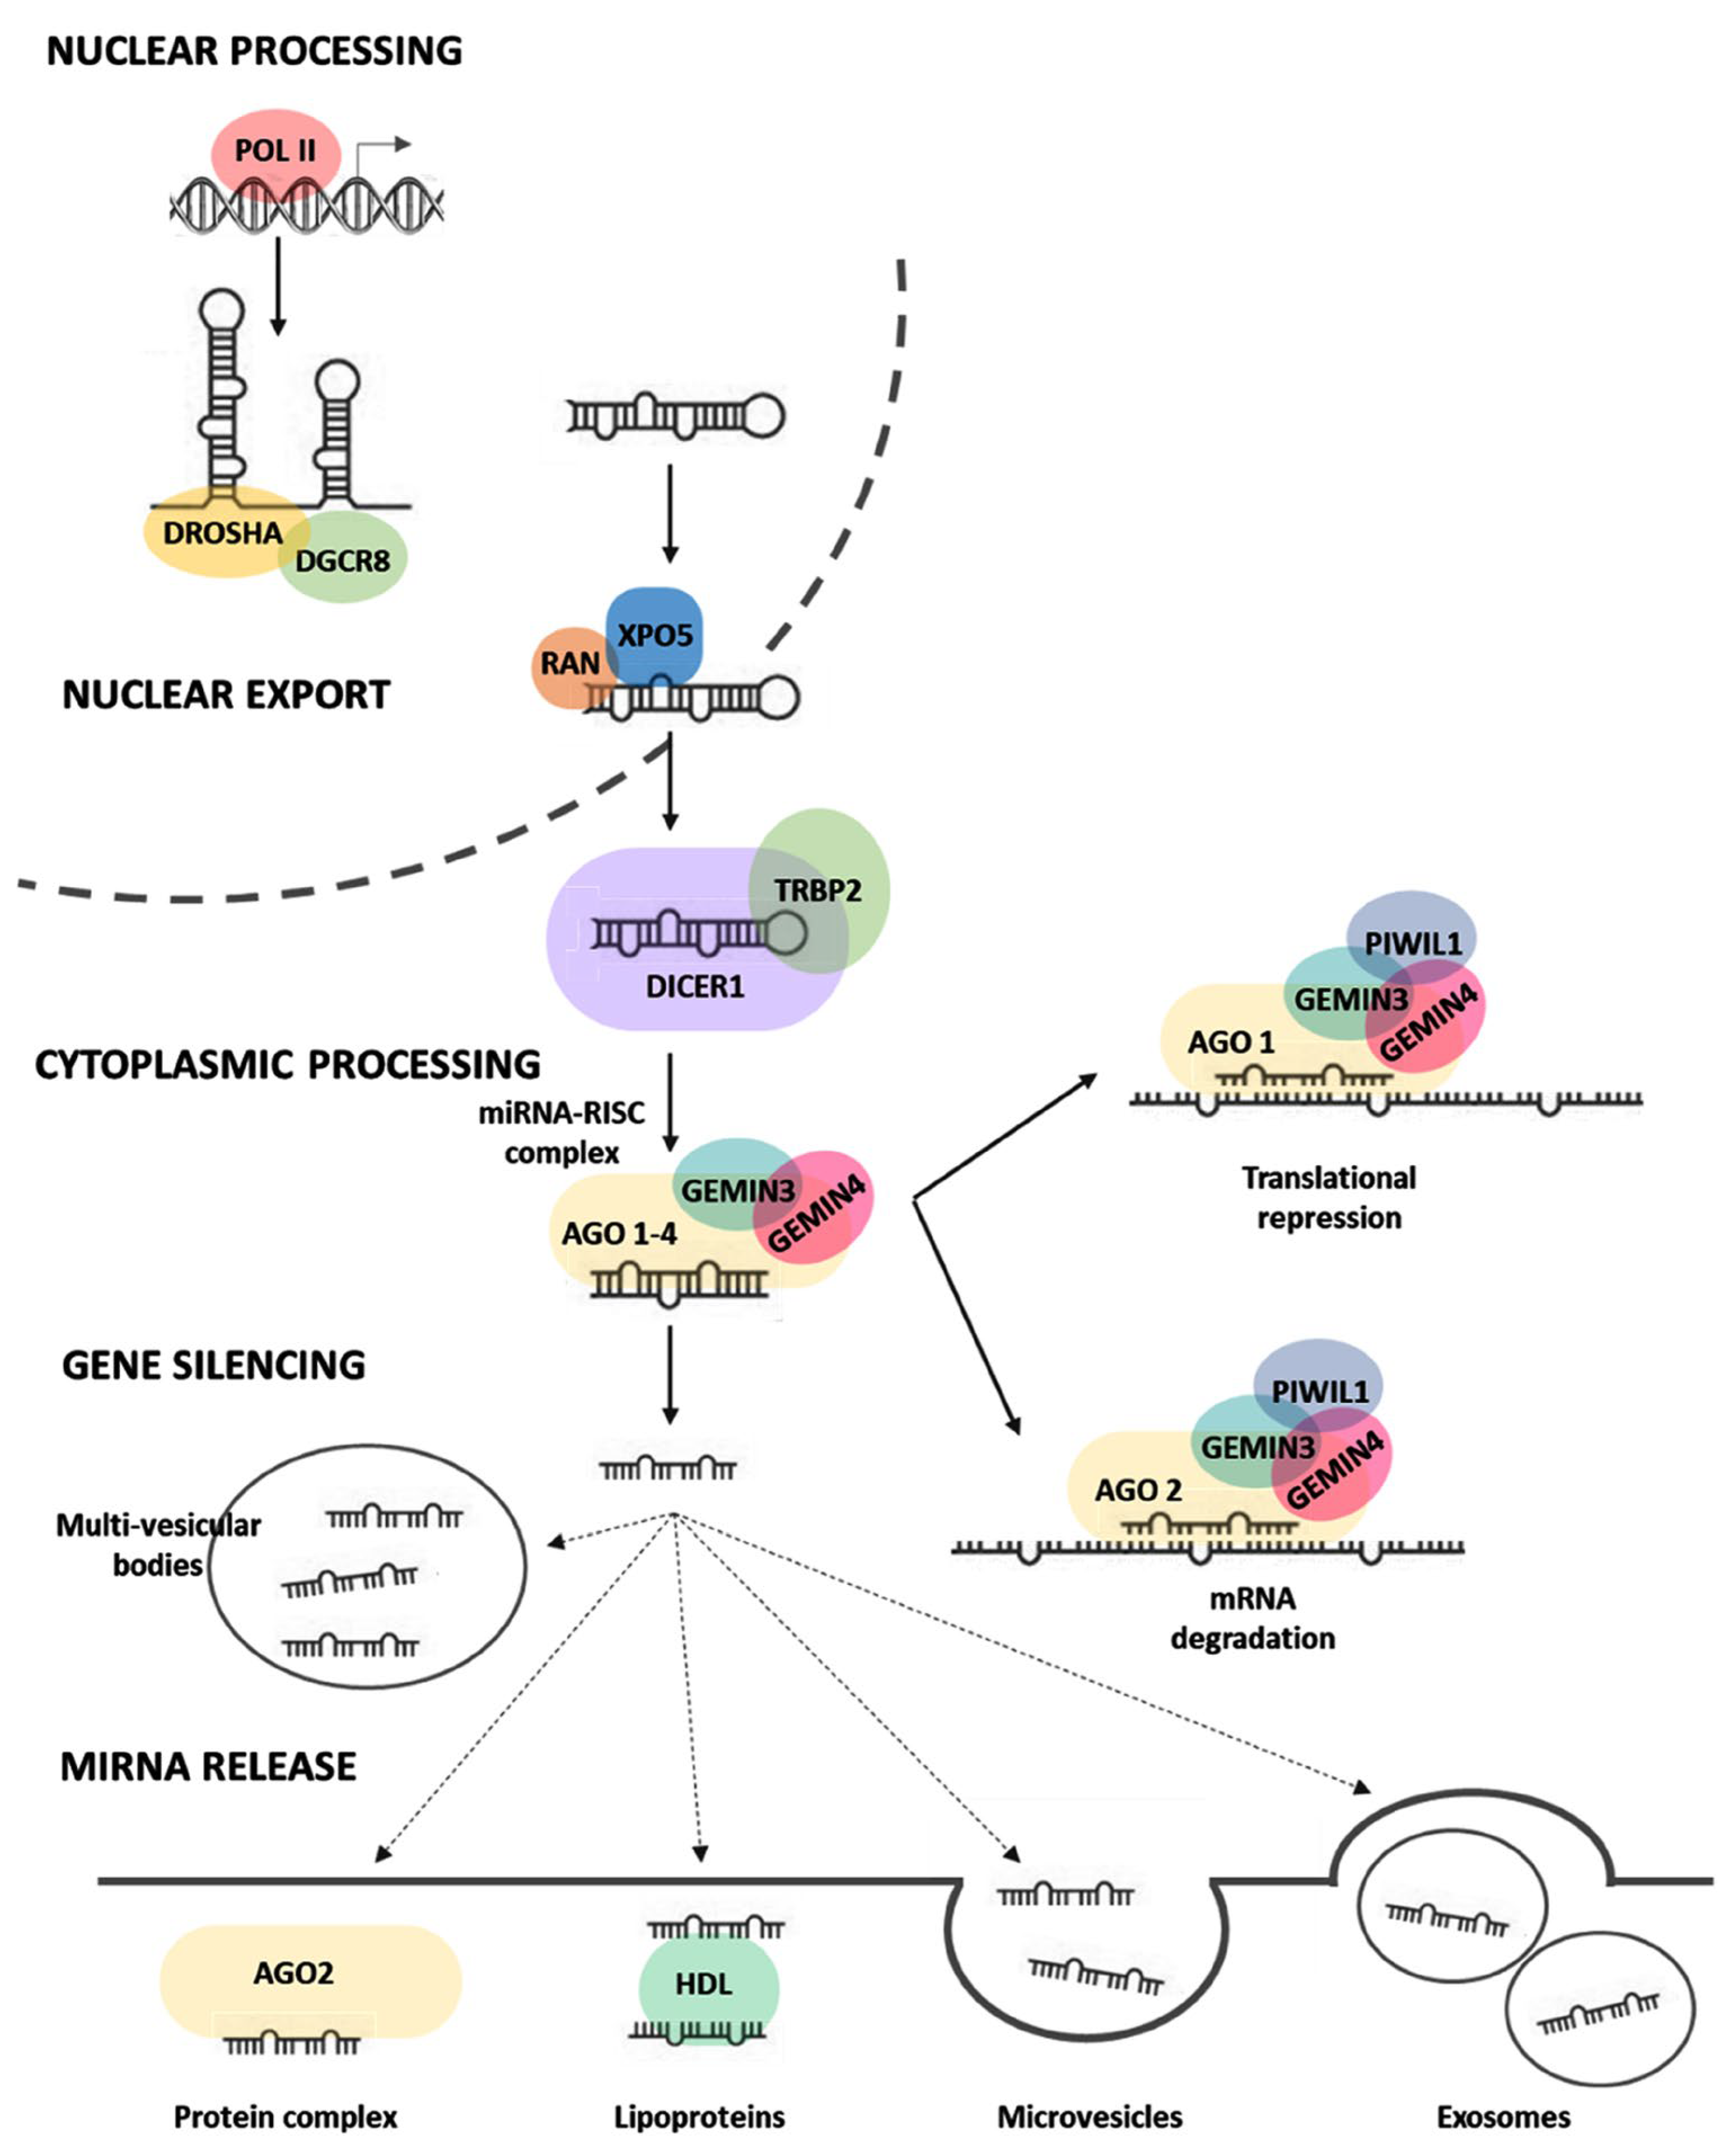
1. Introduction
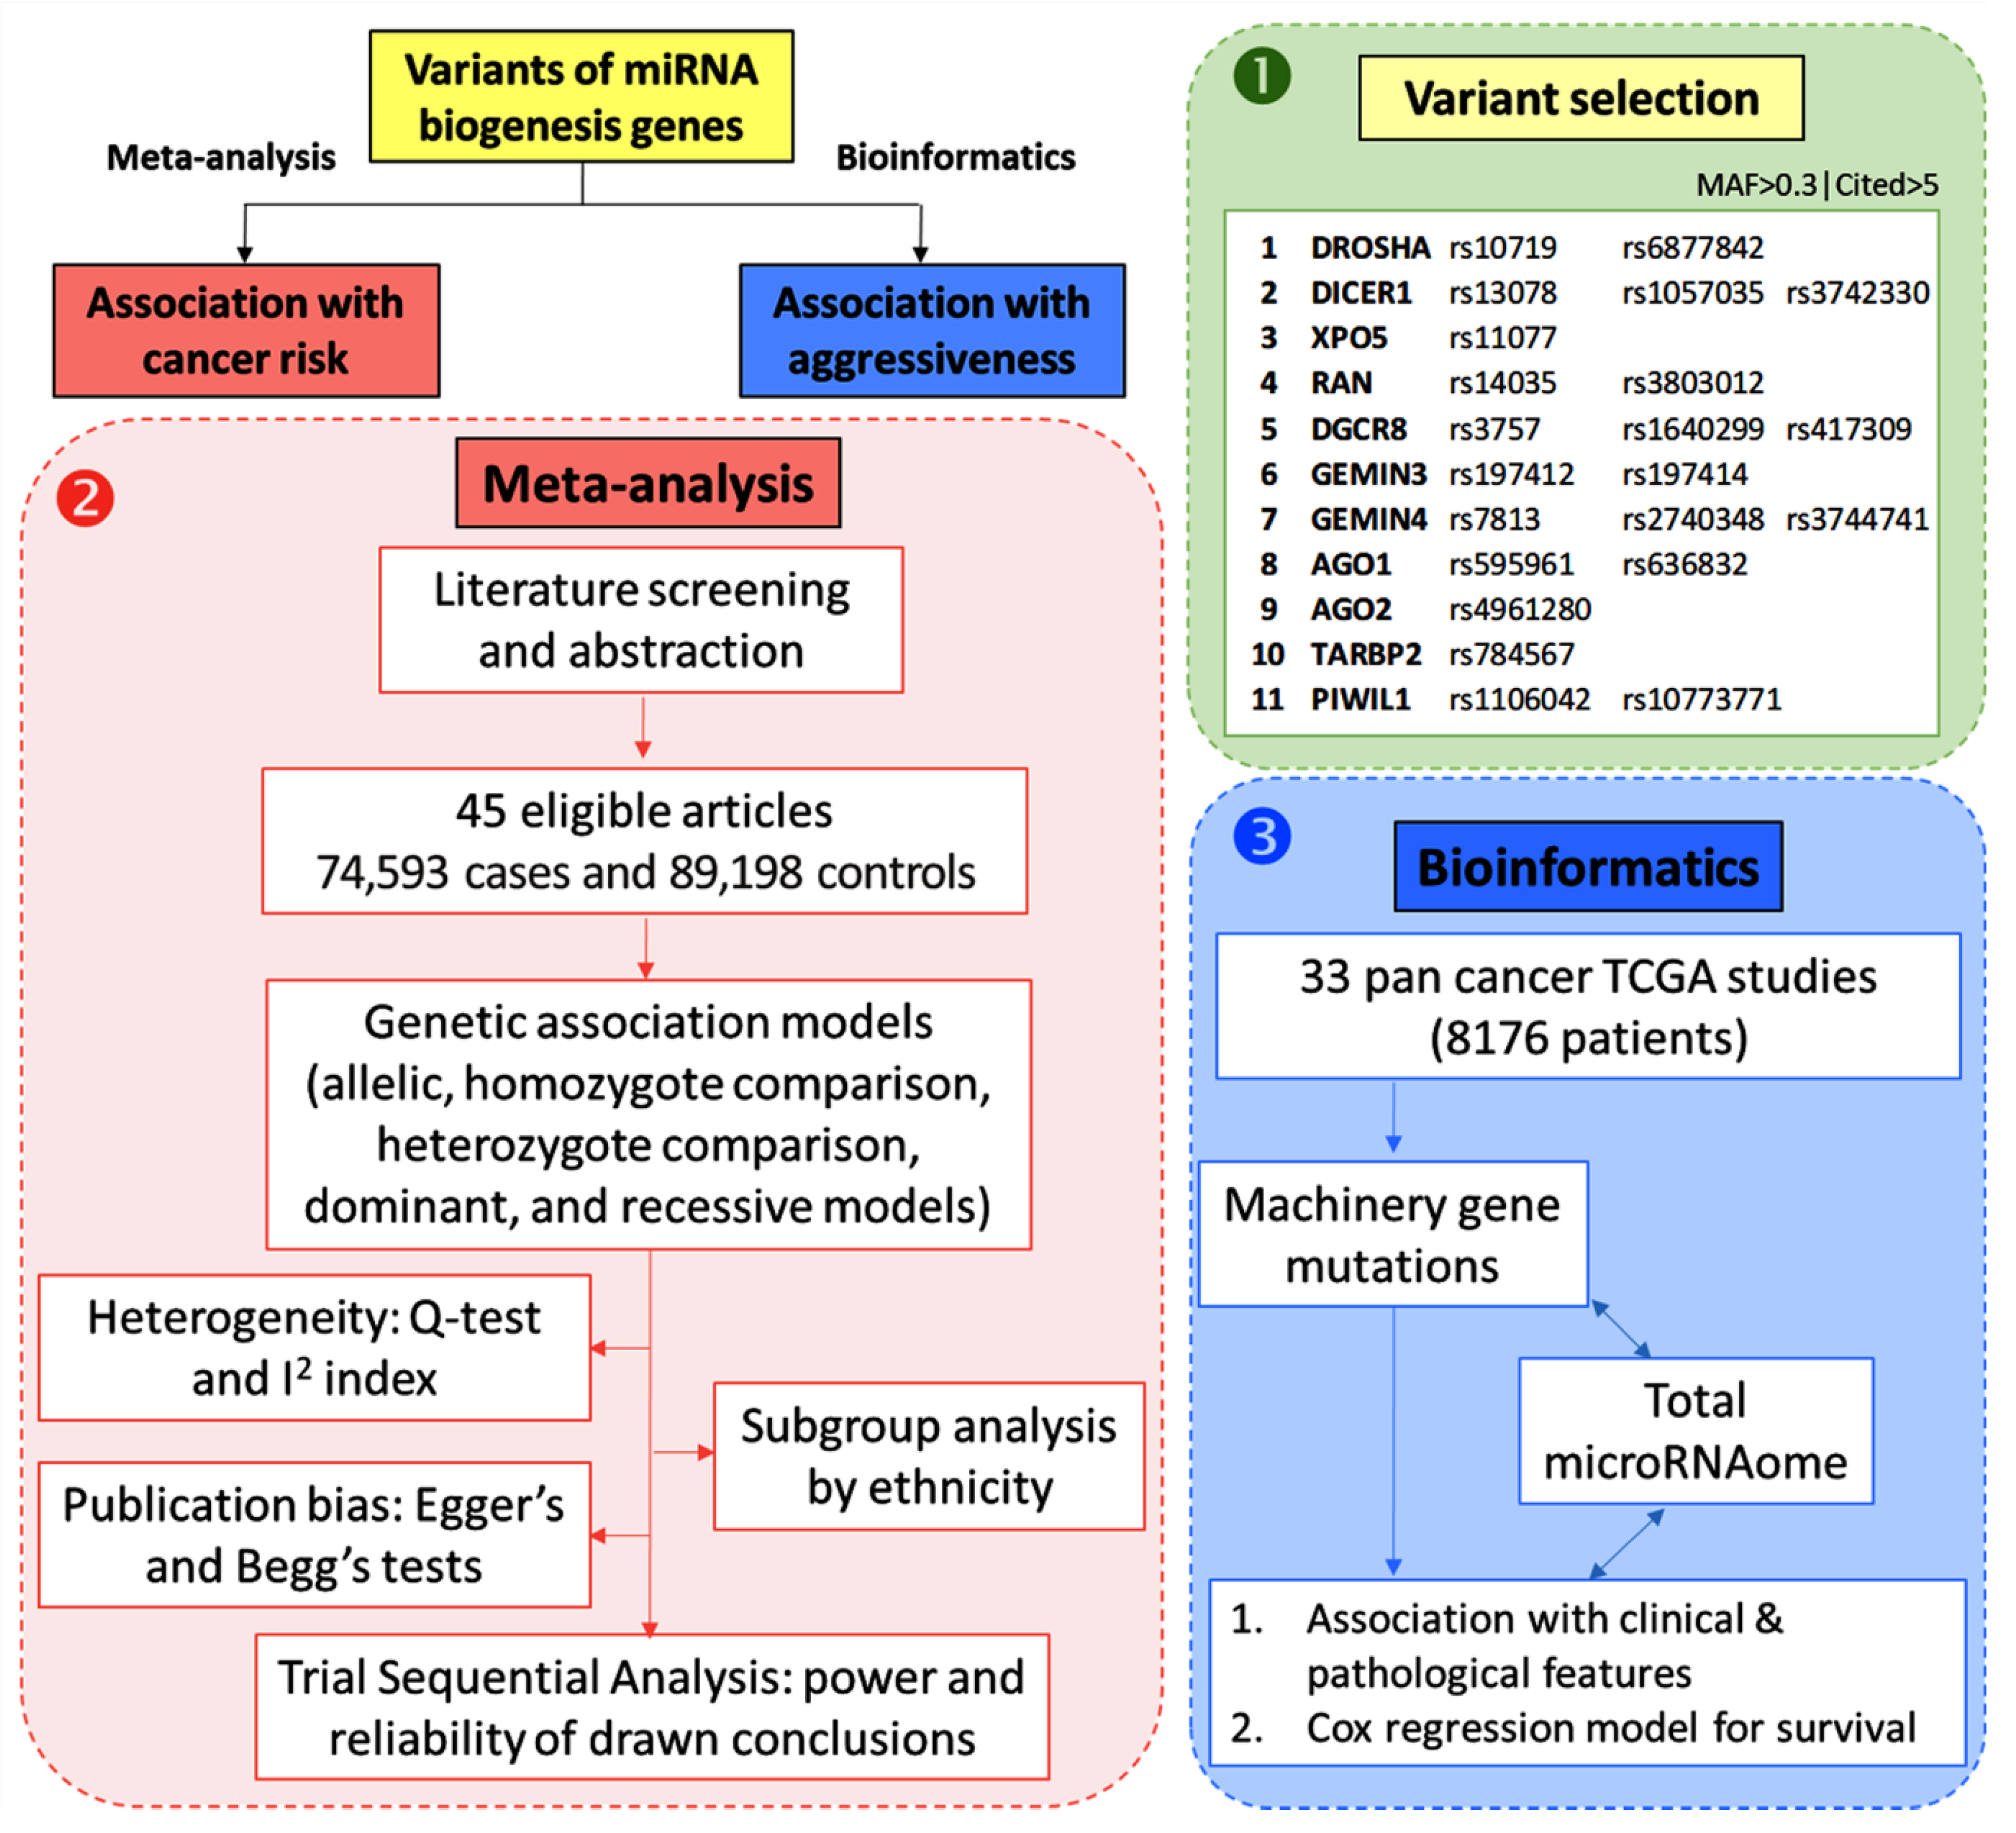
2. Materials and Methods
2.1. Variant Selection
2.2. Meta-Analysis on miRNA Biogenesis Gene Variants and Cancer Risk
2.2.1. Search Strategy
2.2.2. Identification of Eligible Studies
2.2.3. Data Extraction
2.2.4. Quality Scoring
2.2.5. Statistical Analysis for Pooling Results
2.2.6. Heterogeneity Assessment
2.2.7. Subgroup Analysis
2.2.8. Publication Bias
2.2.9. Trial Sequential Analysis (TSA) ta Extraction
2.3. In Silico Analysis on miRNA Biogenesis Gene Mutations and Cancer Prognosis
2.3.1. Data Source
2.3.2. The Total microRNAome Expression Level
2.3.3. Association between Gene Mutations and Total miroRNome and Clinicopathological Characteristics
2.3.4. Survival Analysis
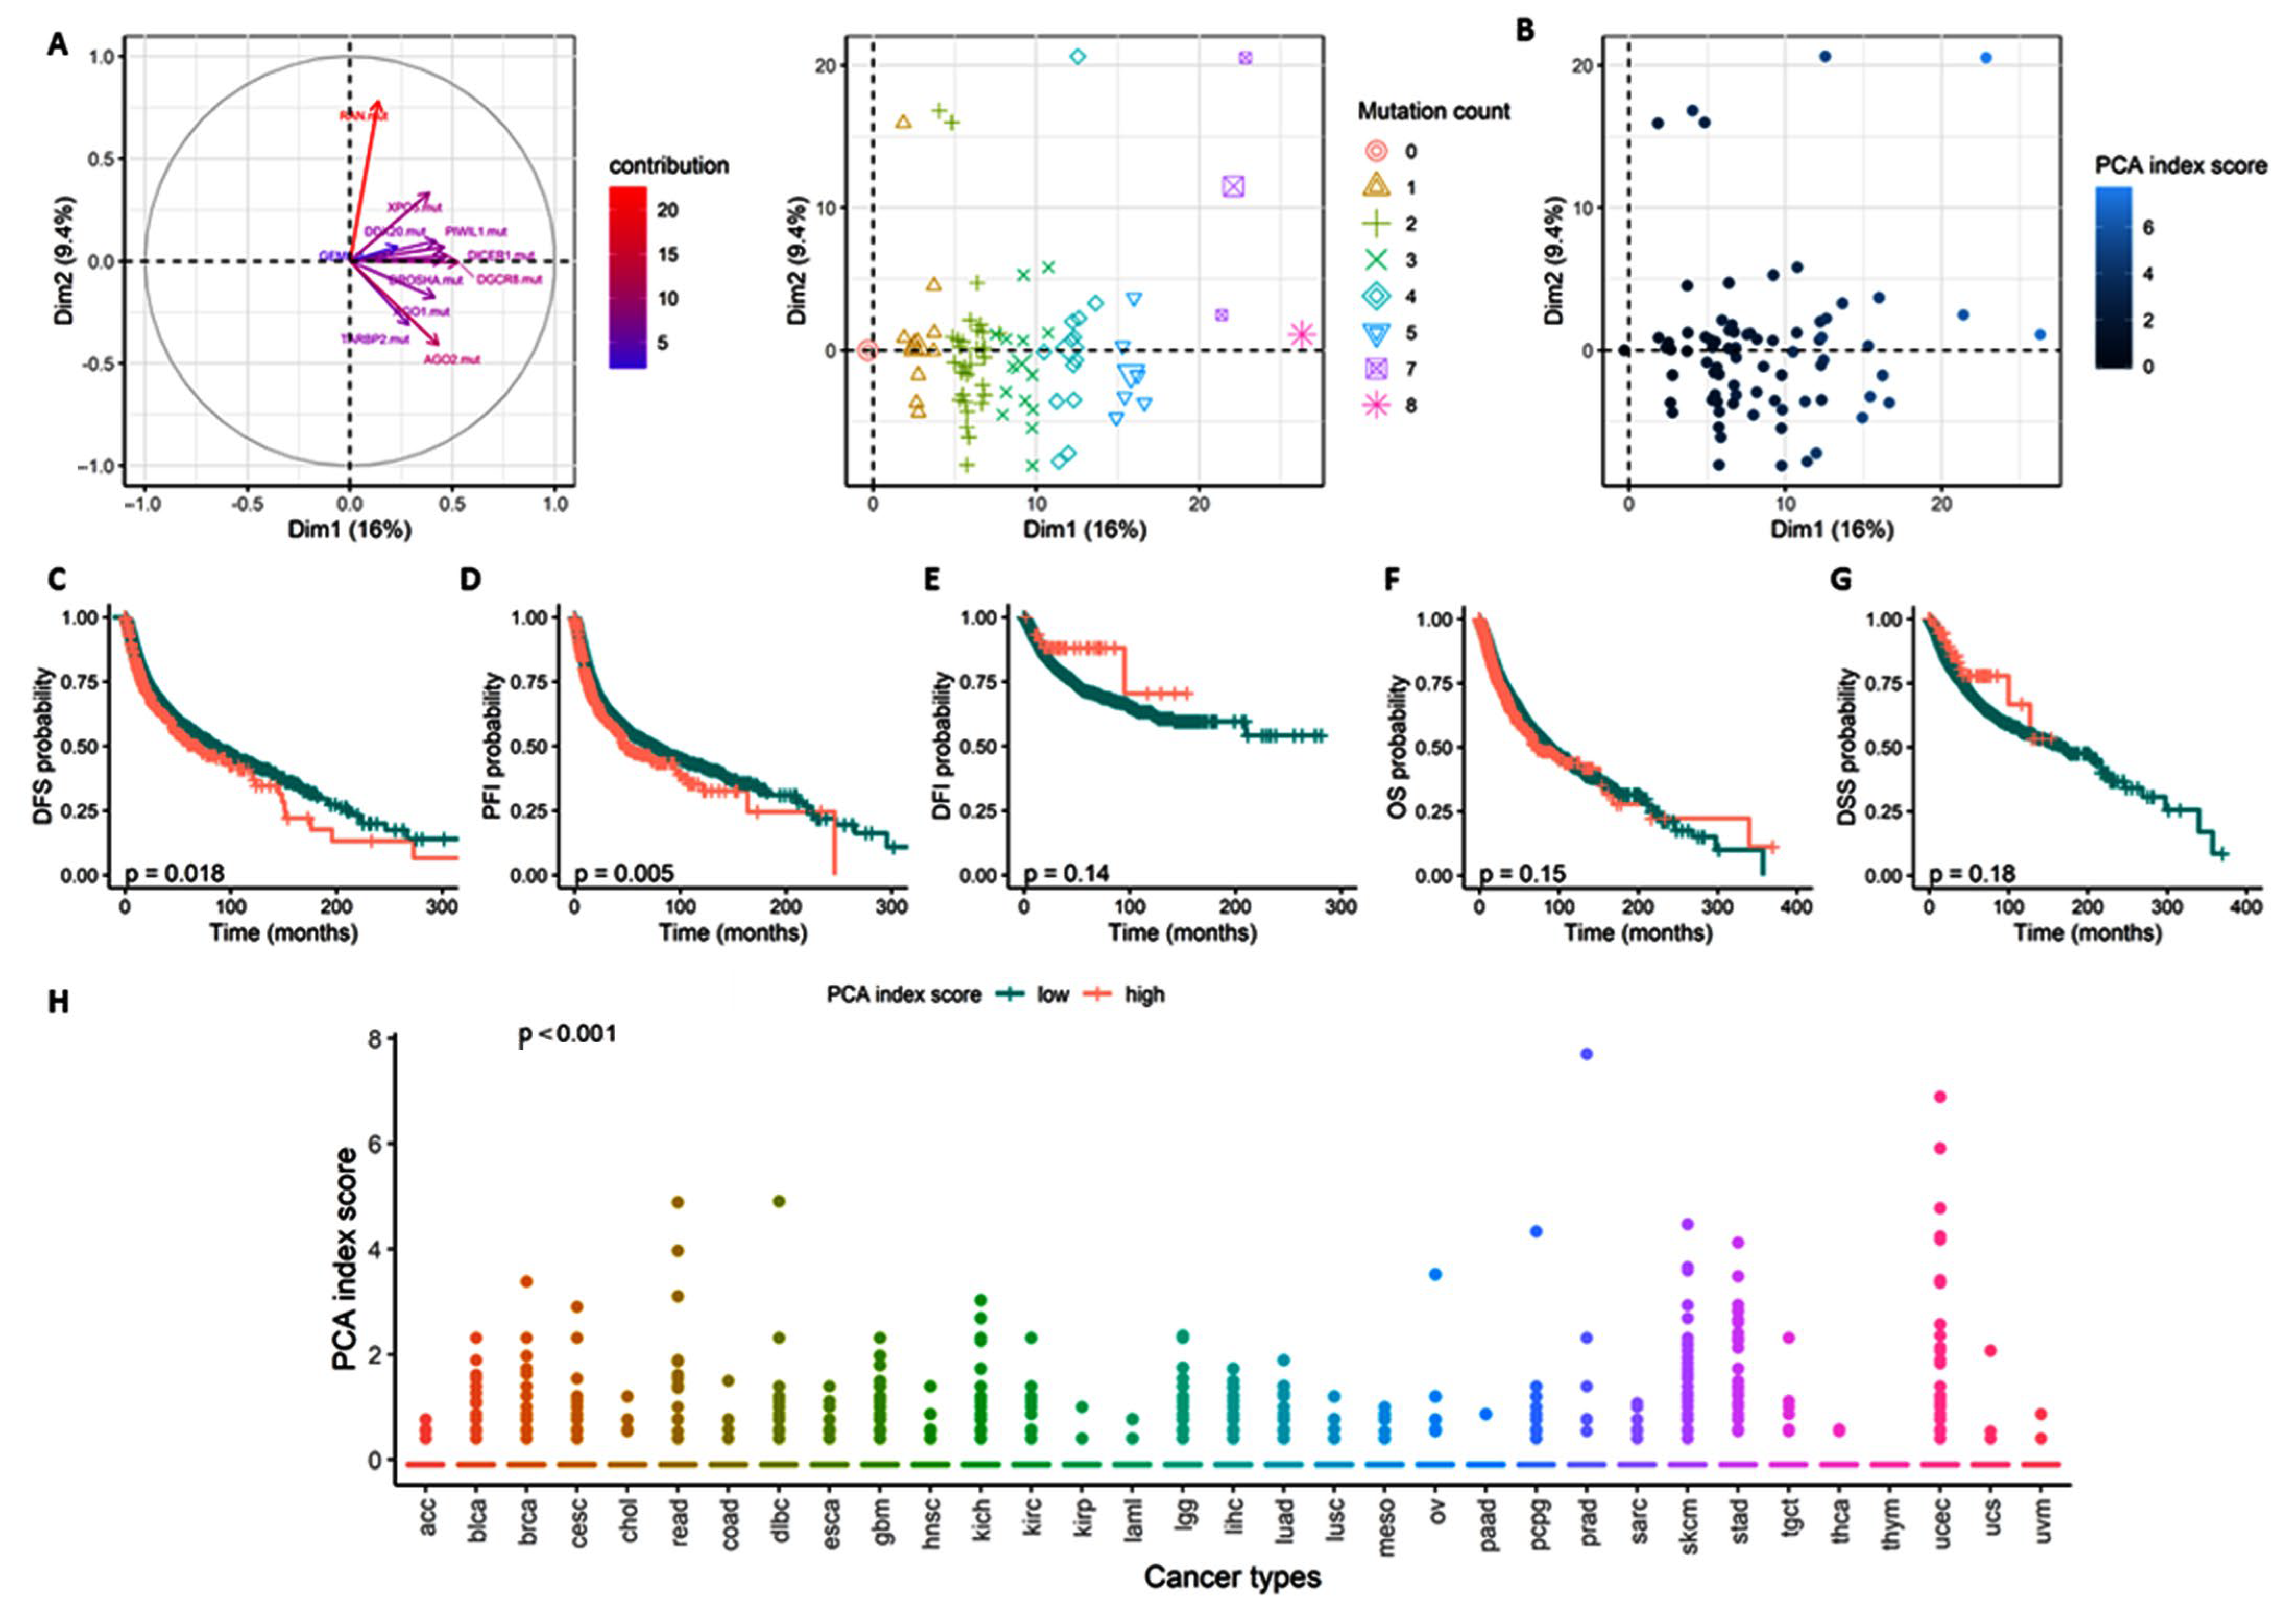
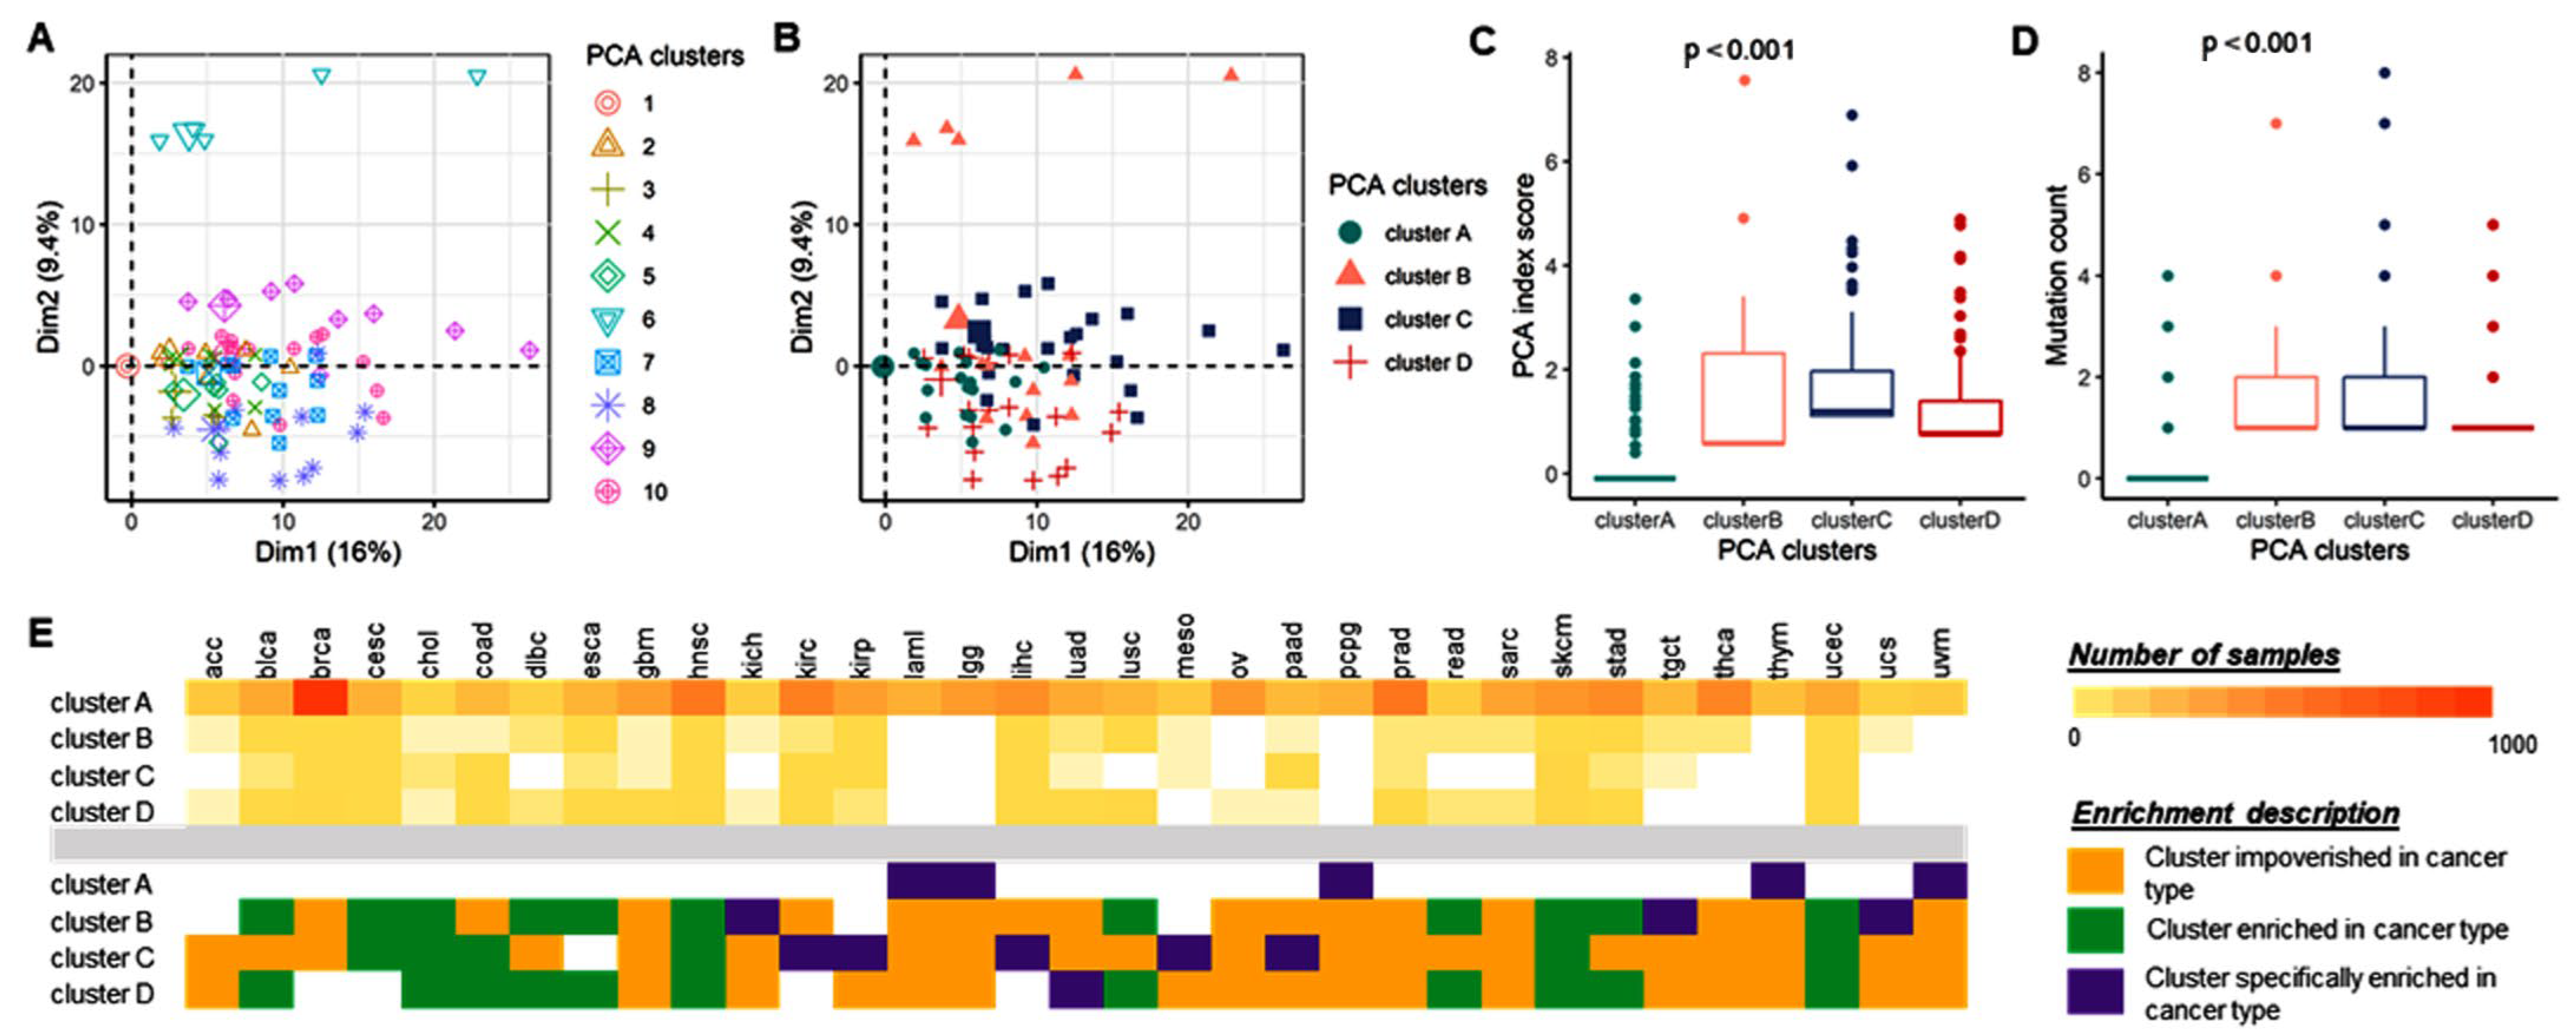
2.3.5. Principal Component Analysis
3. Results
3.1. Meta-Analysis on miRNA Biogenesis Gene Variants and Cancer Risk
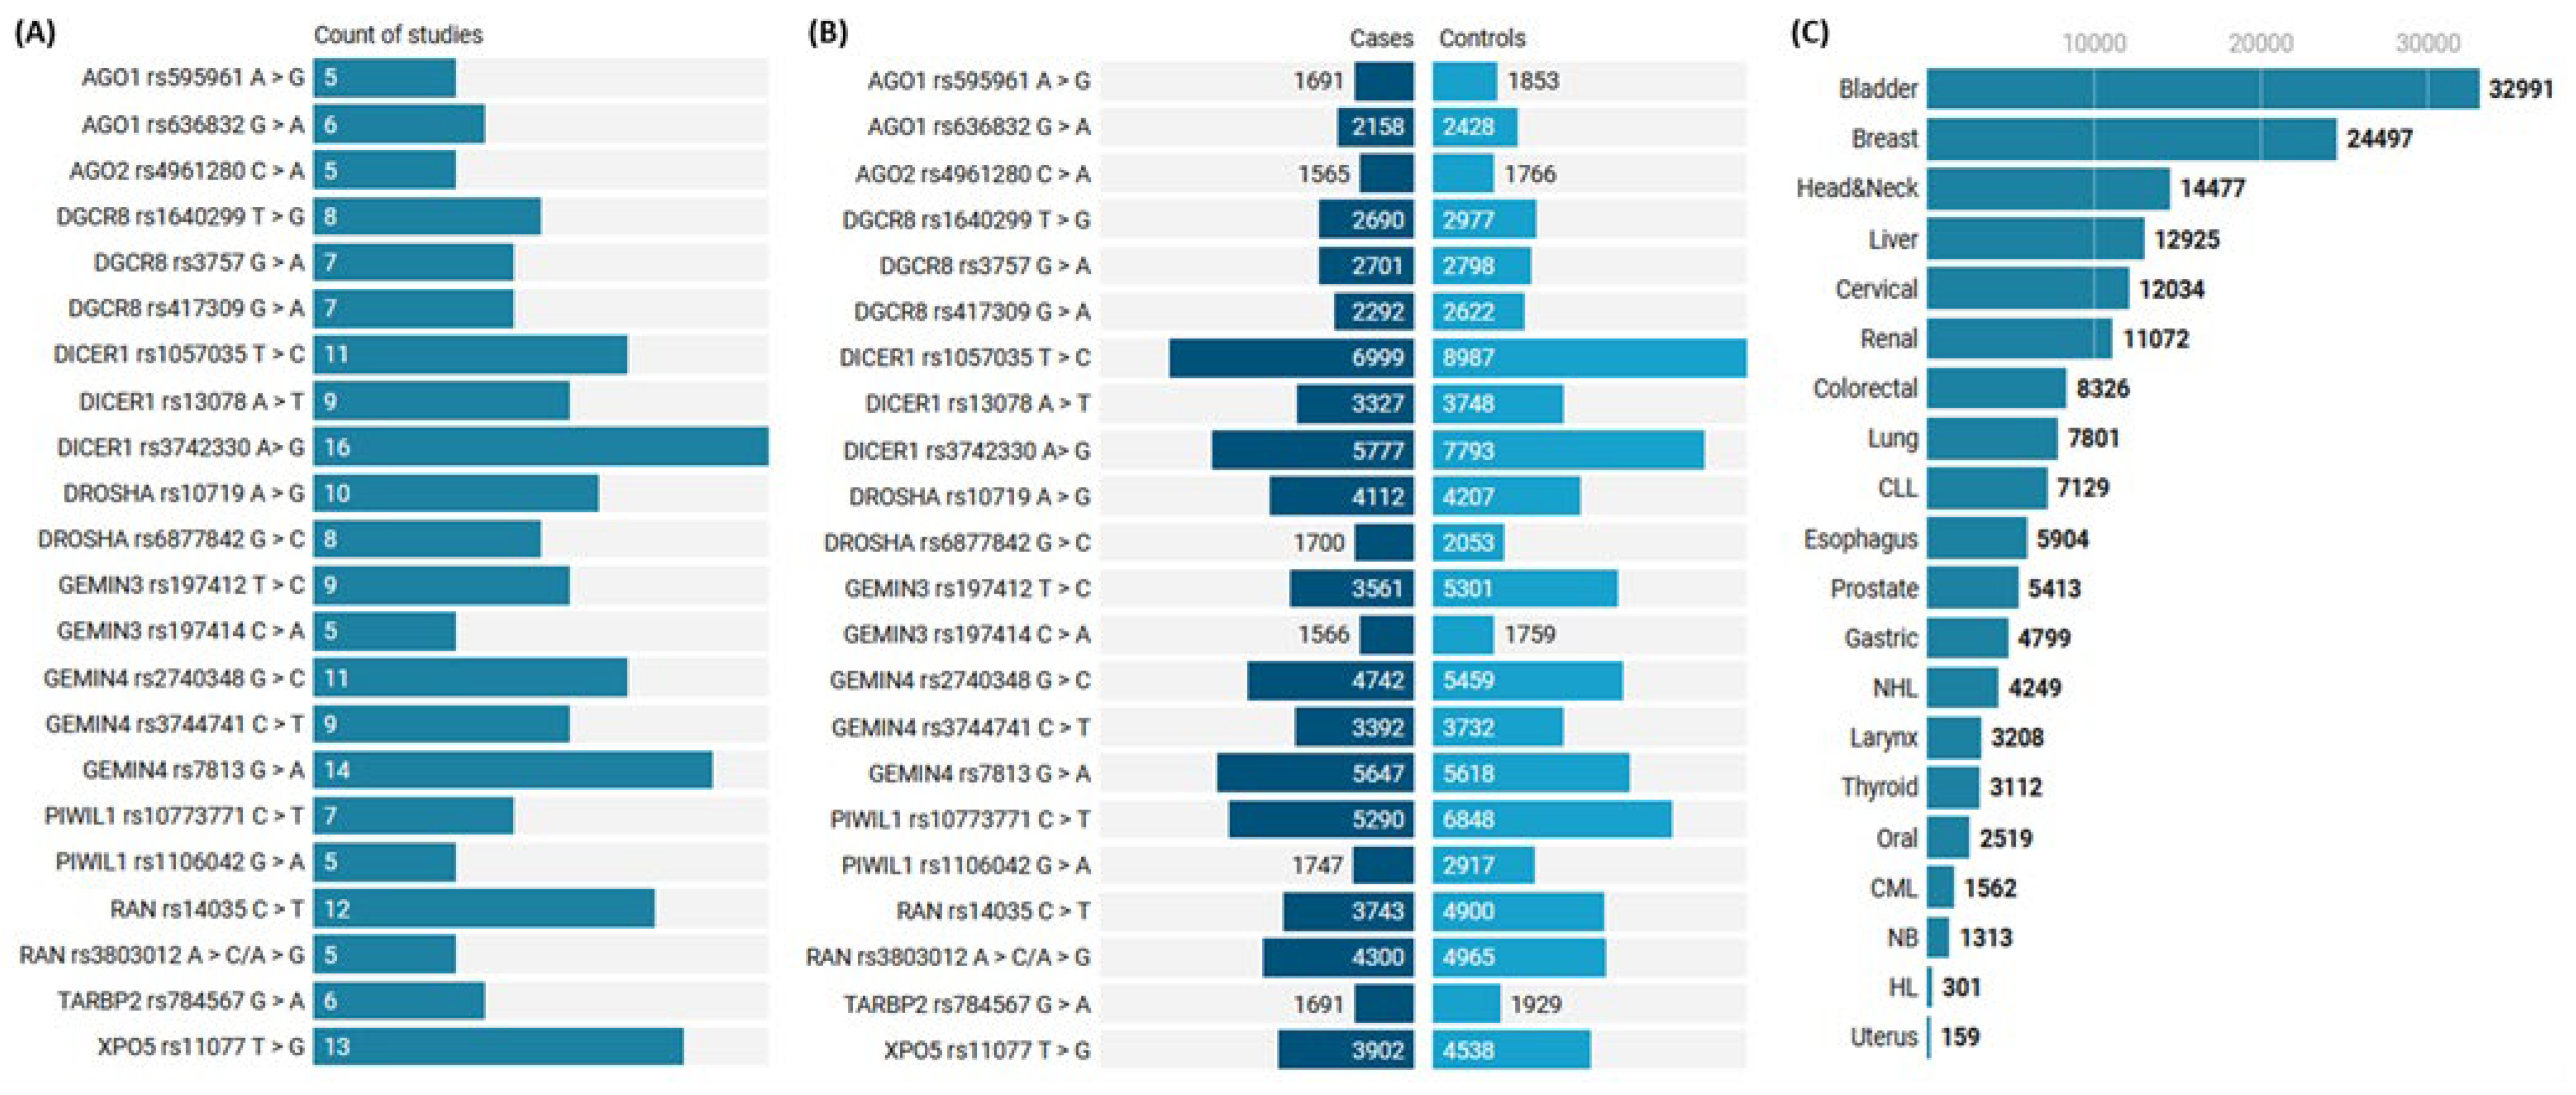
3.1.1. Characteristics of Studies Included in the Meta-Analysis
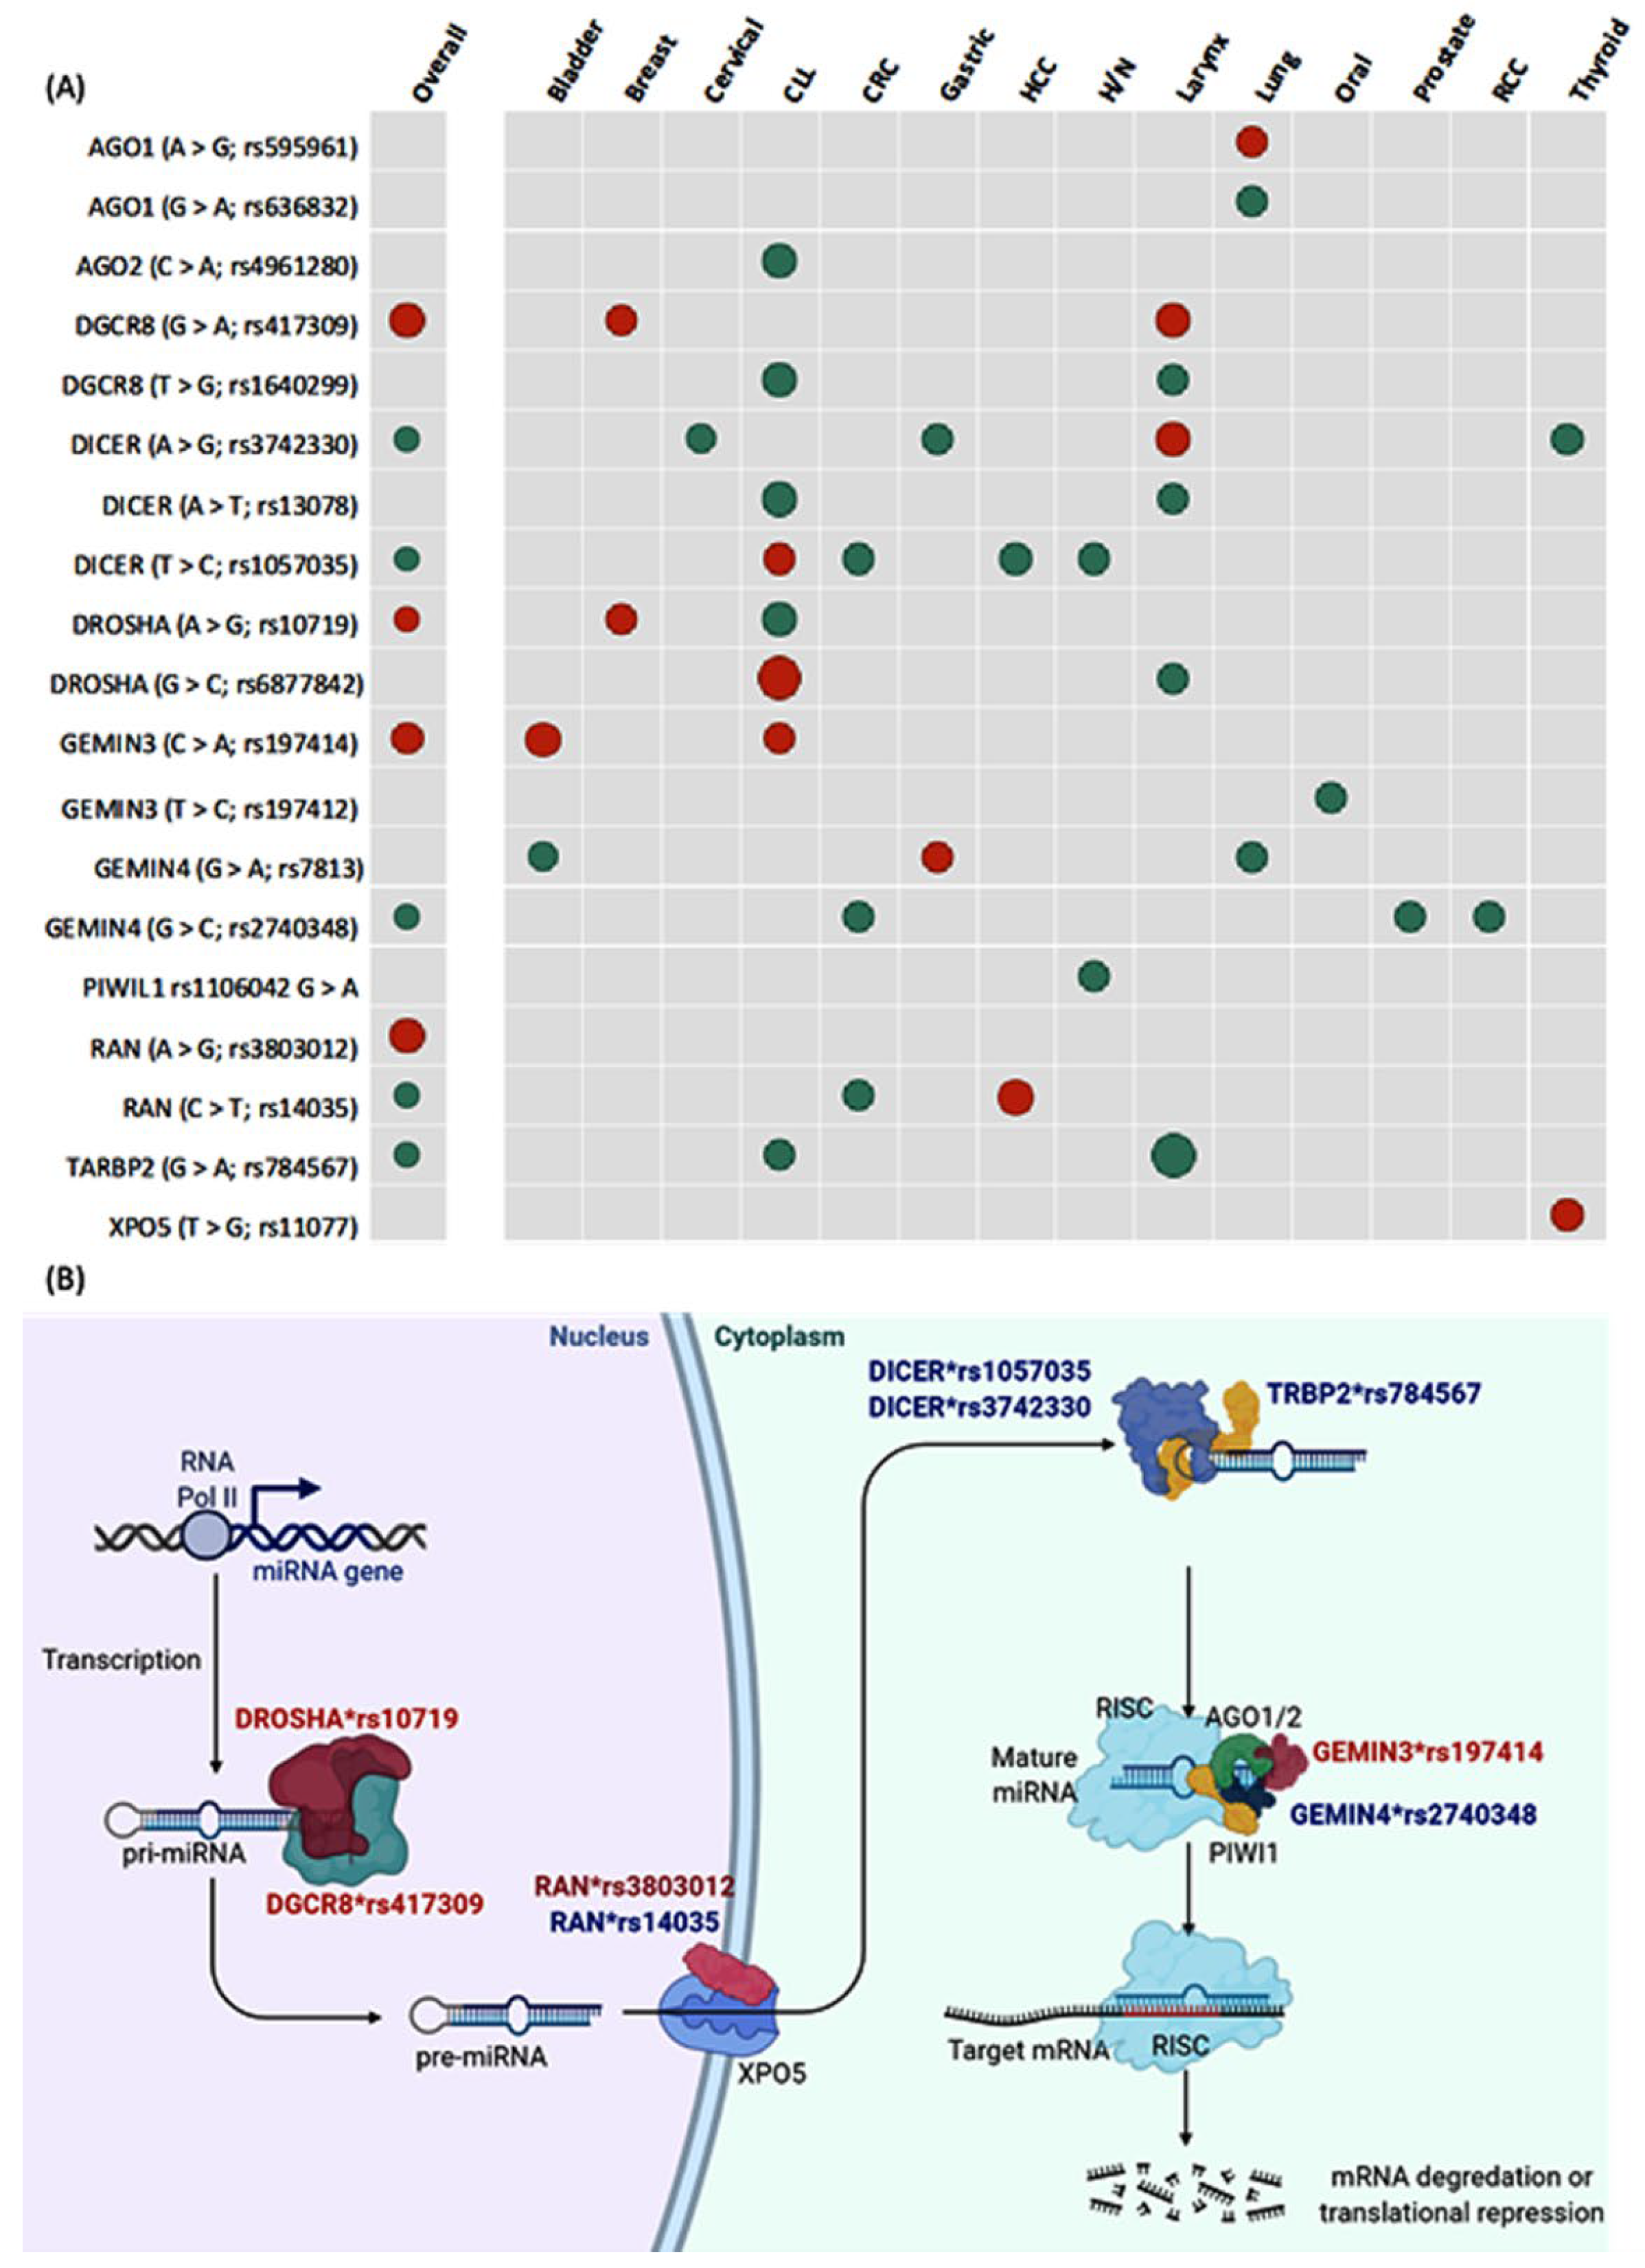
3.1.2. Pooled Analysis of Pairwise Comparisons
3.1.3. Subgroup Analysis and Publication Bias
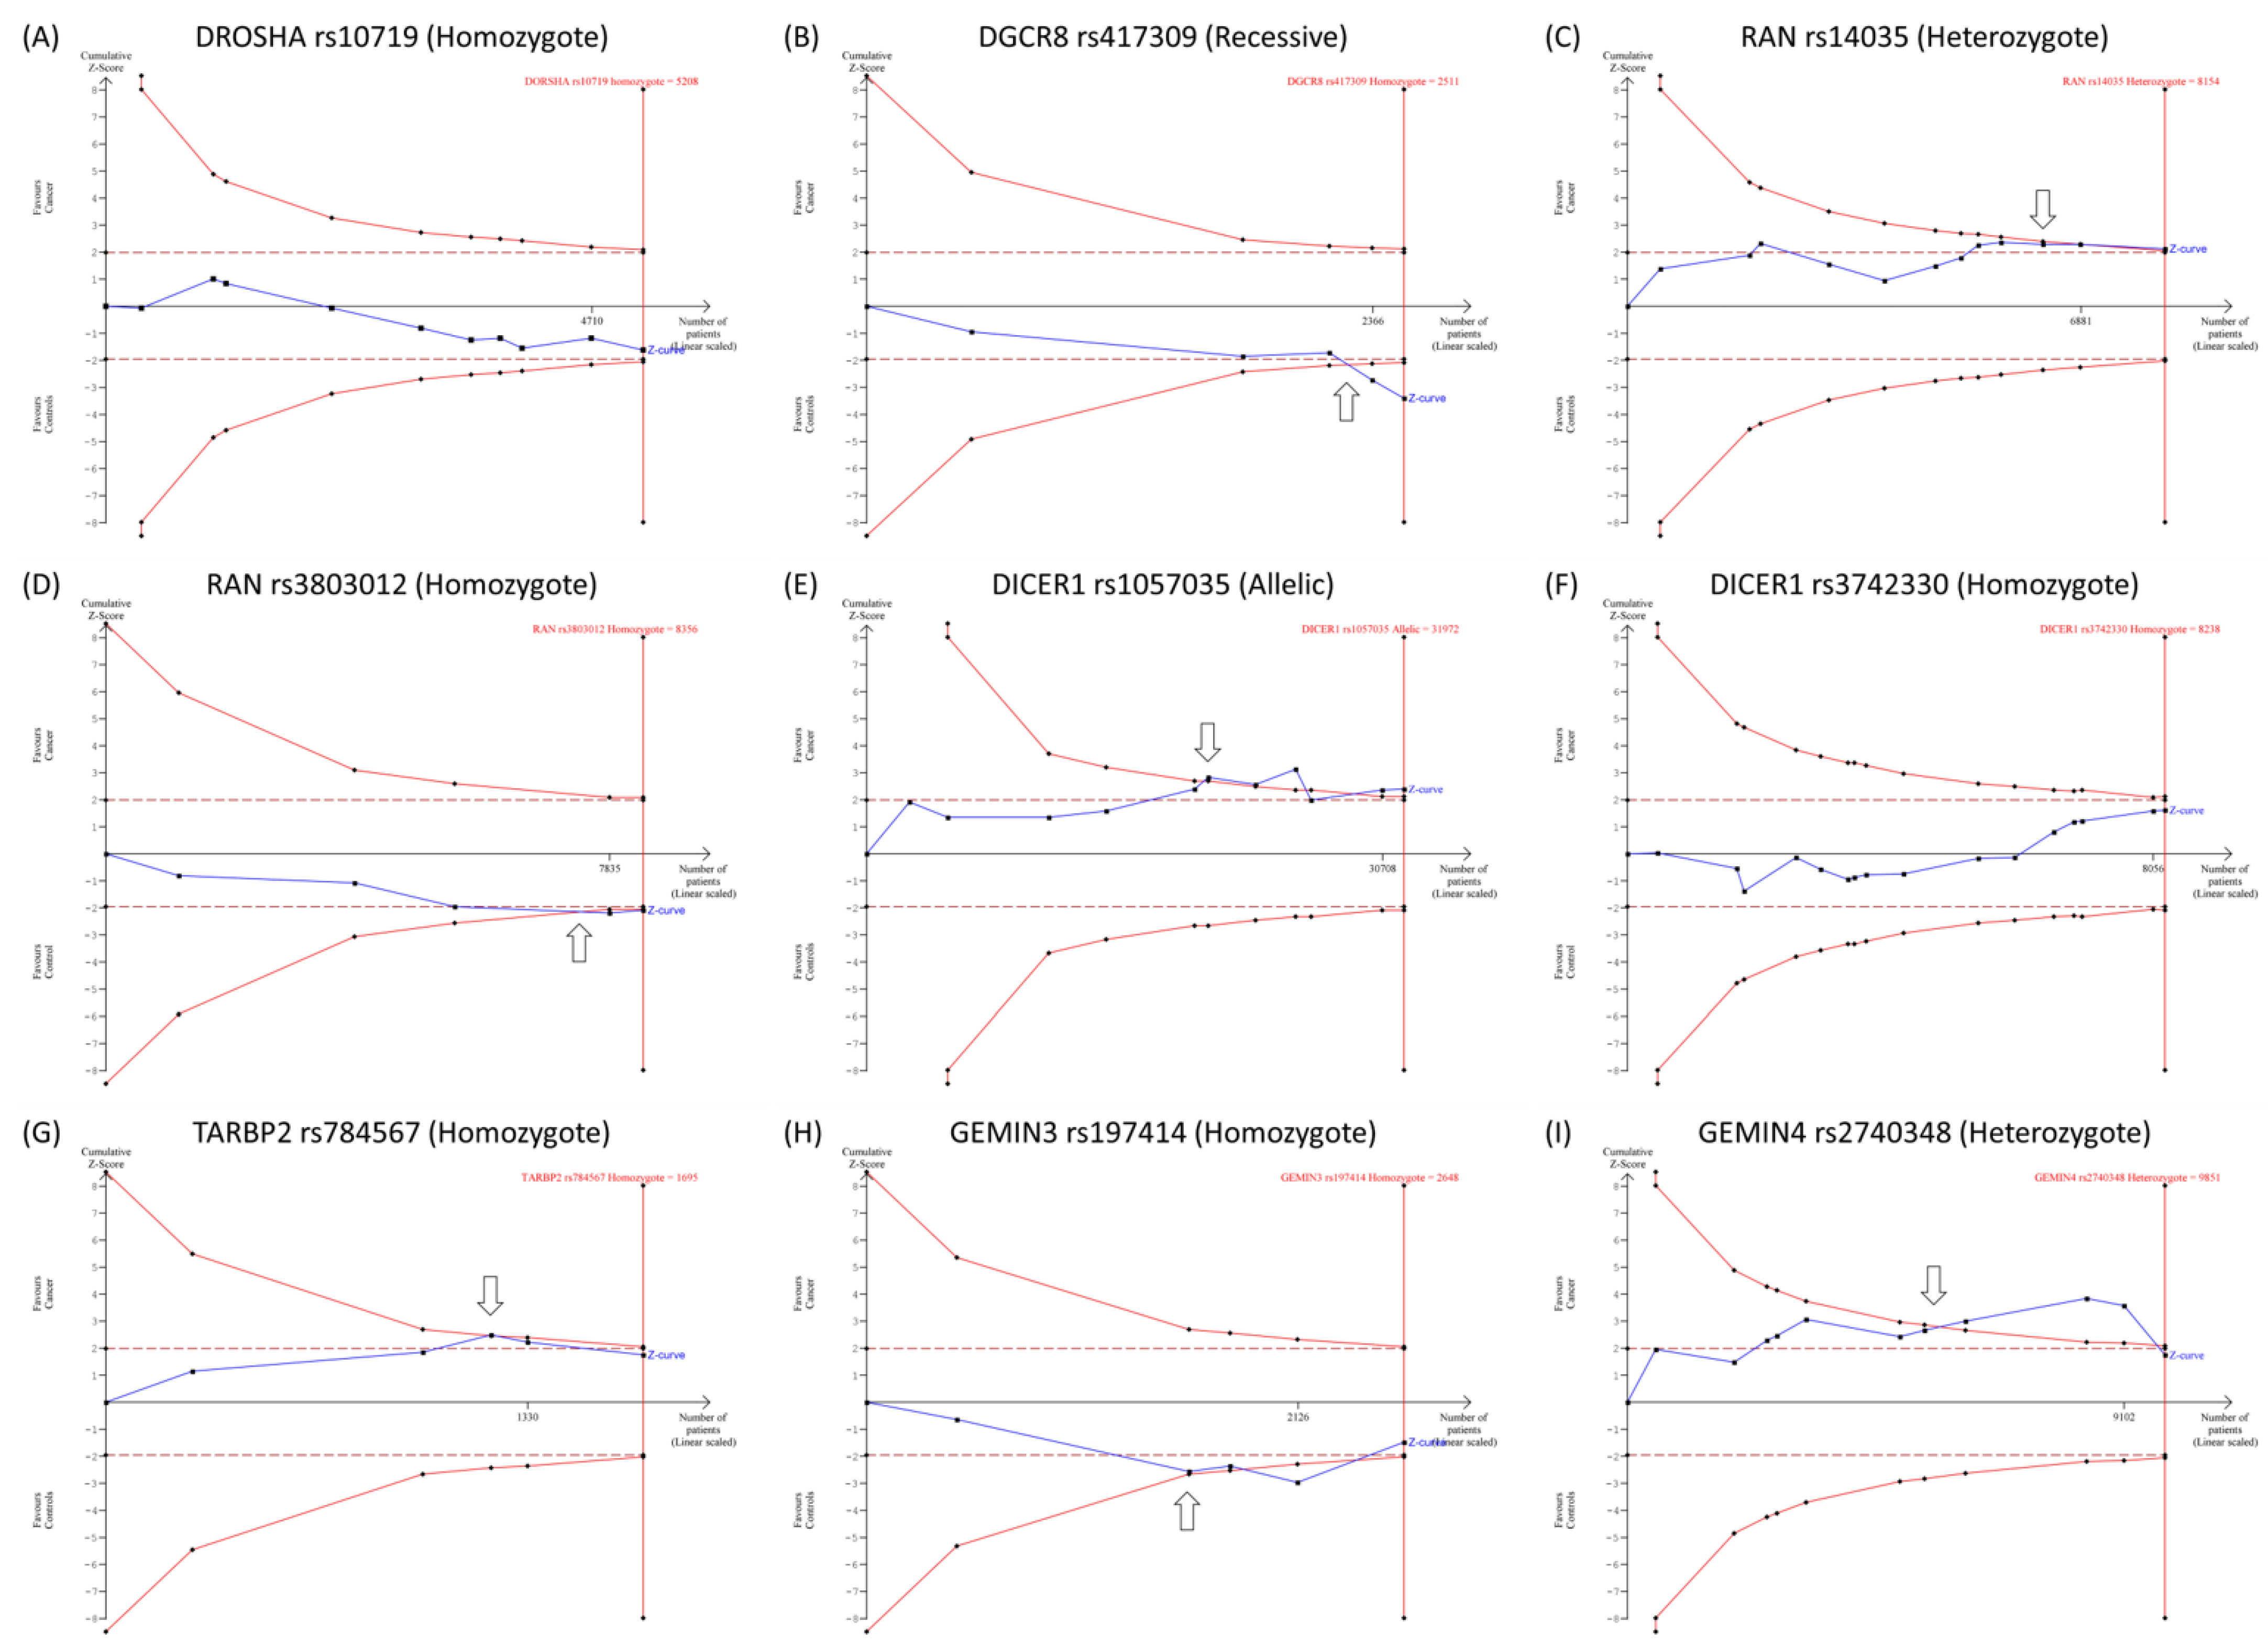
3.1.4. Trial Sequential Analysis
3.2. Bioinformatics on miRNA Biogenesis Gene Mutation and Cancer Prognosis
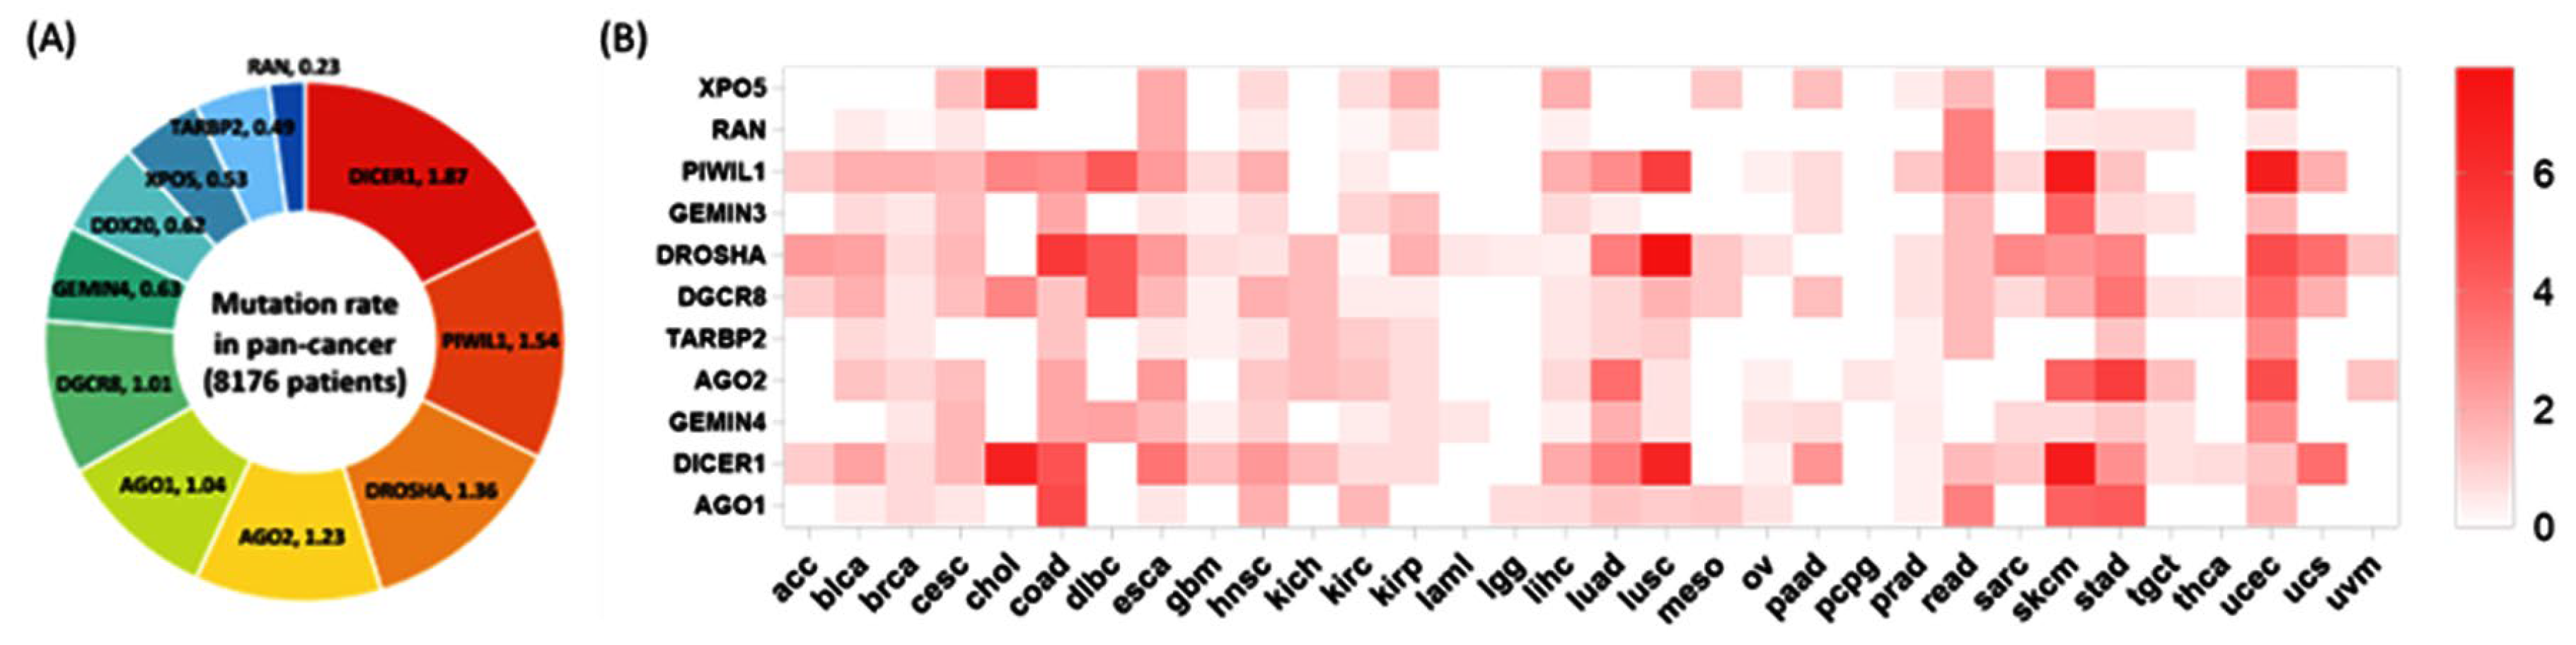
3.2.1. Mutation Rates in Cancer
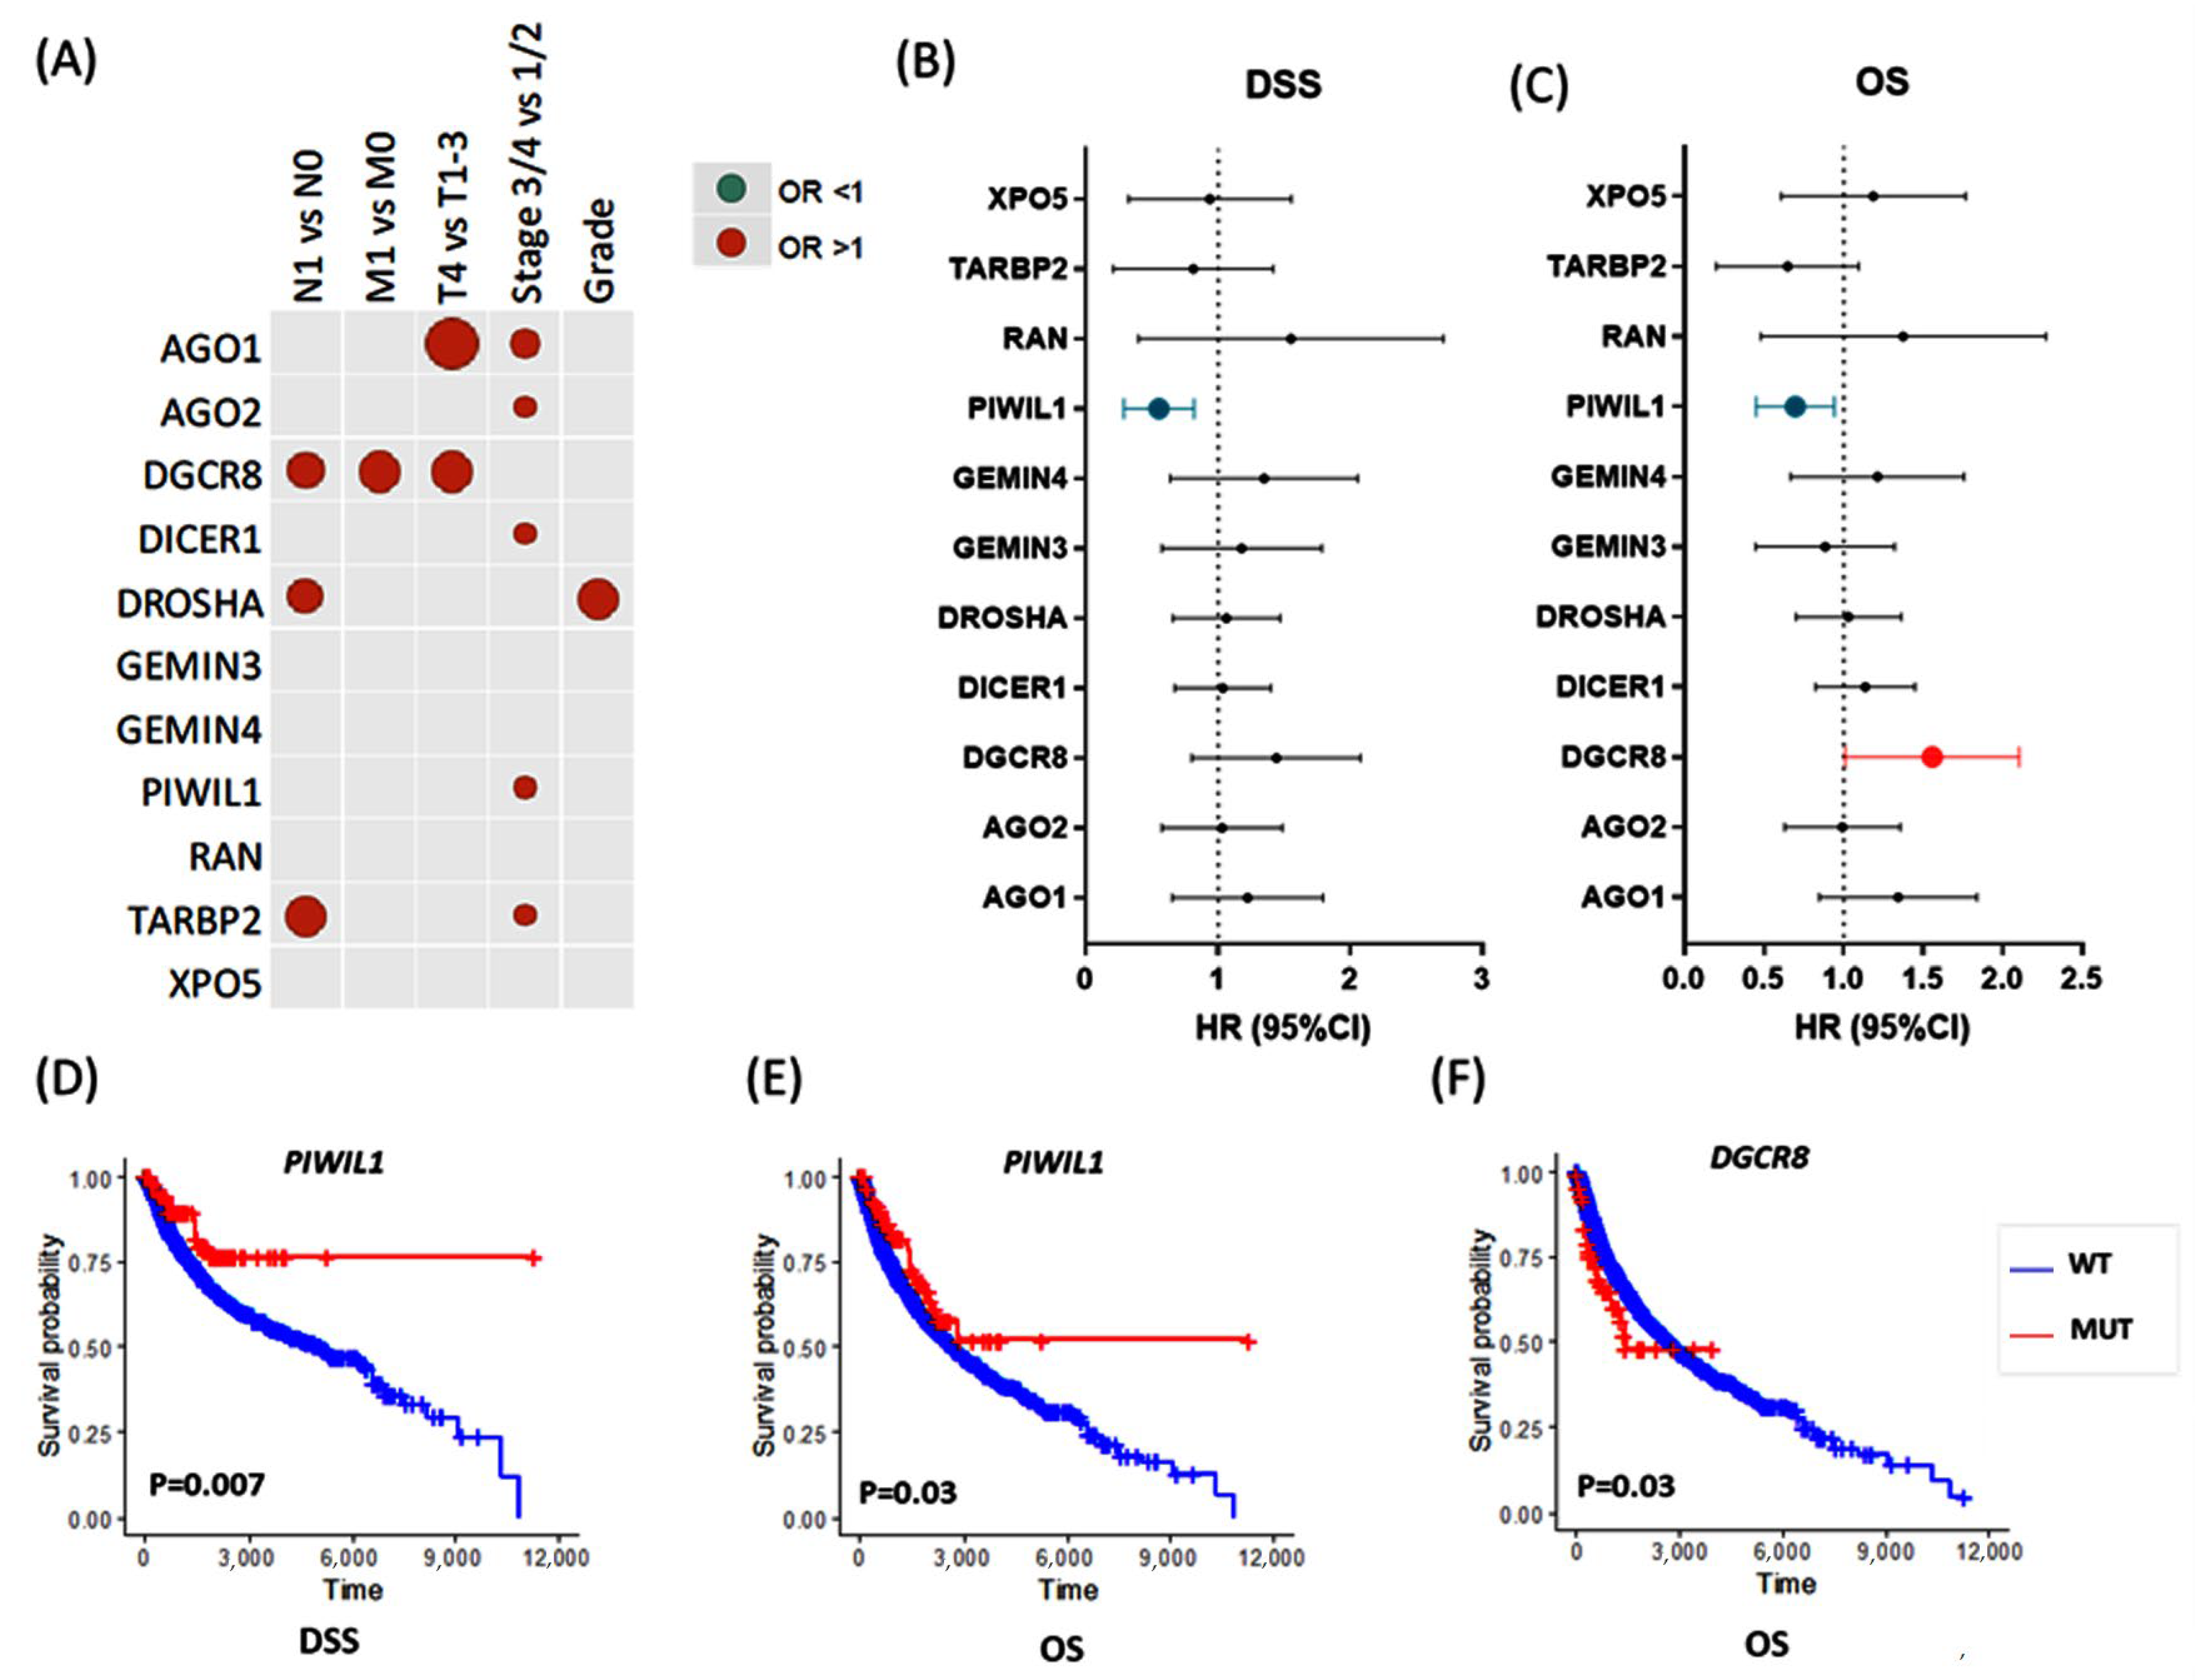
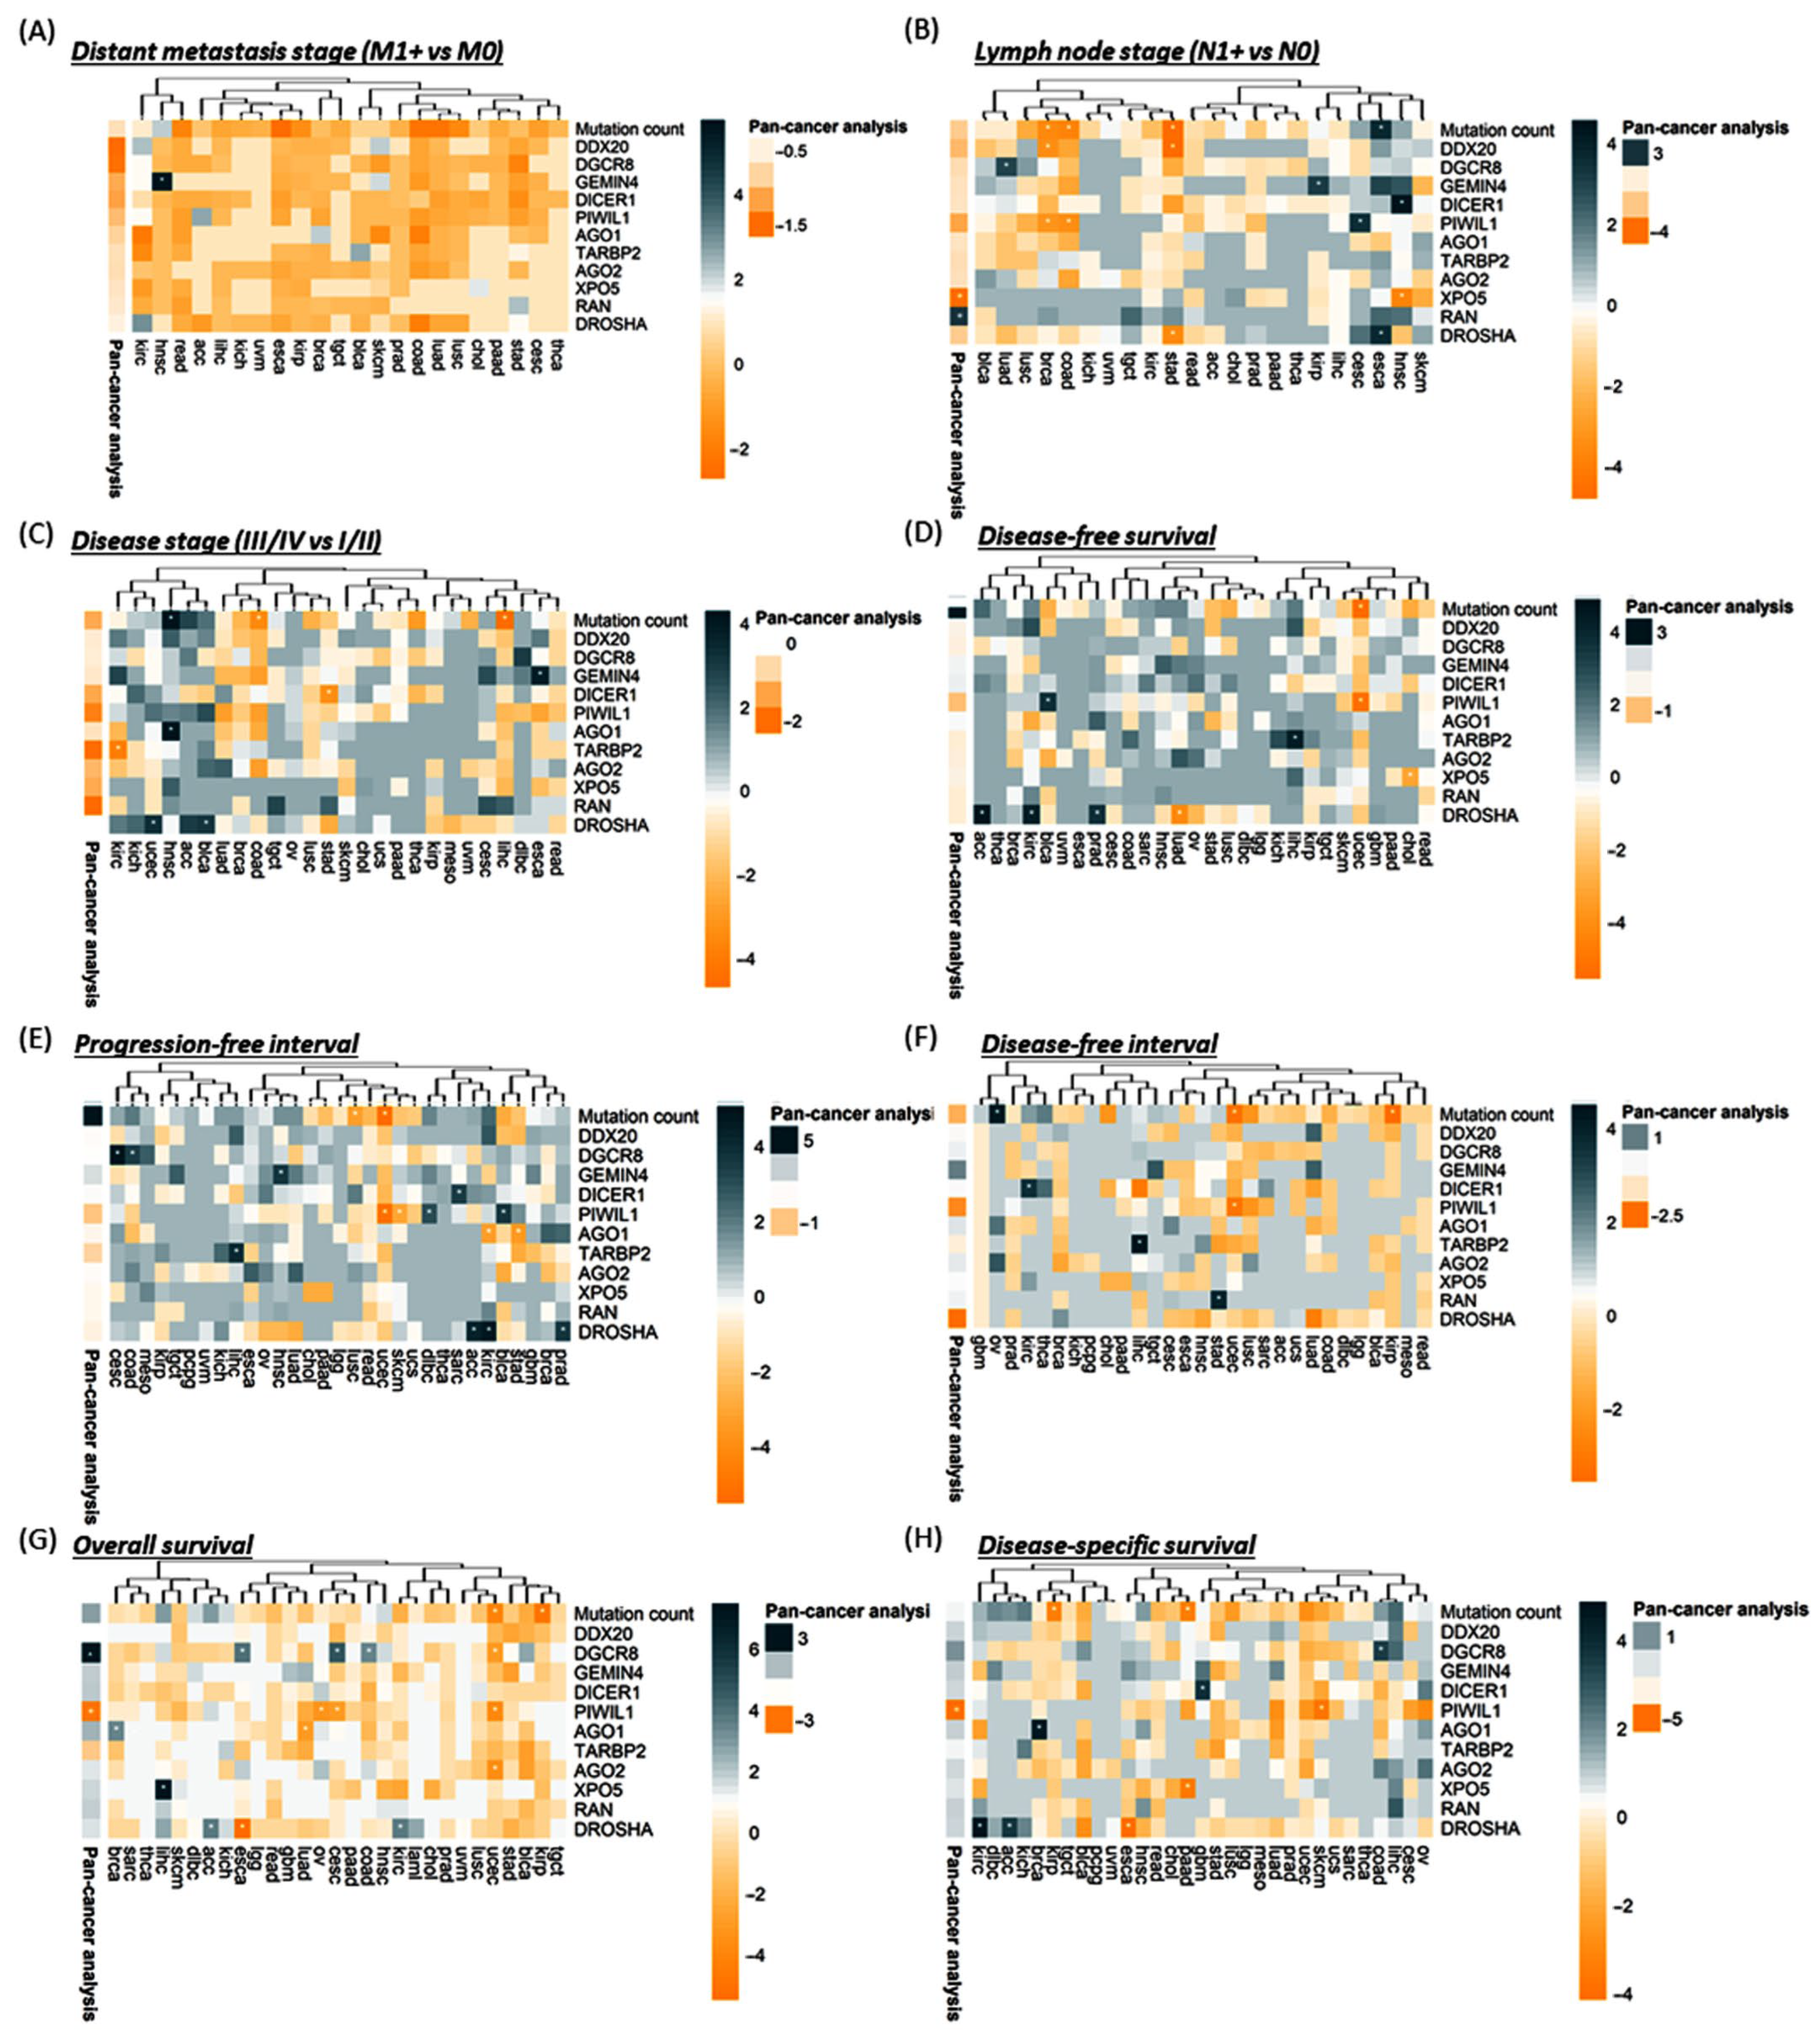
3.2.2. Association with Clinical and Pathological Characteristics
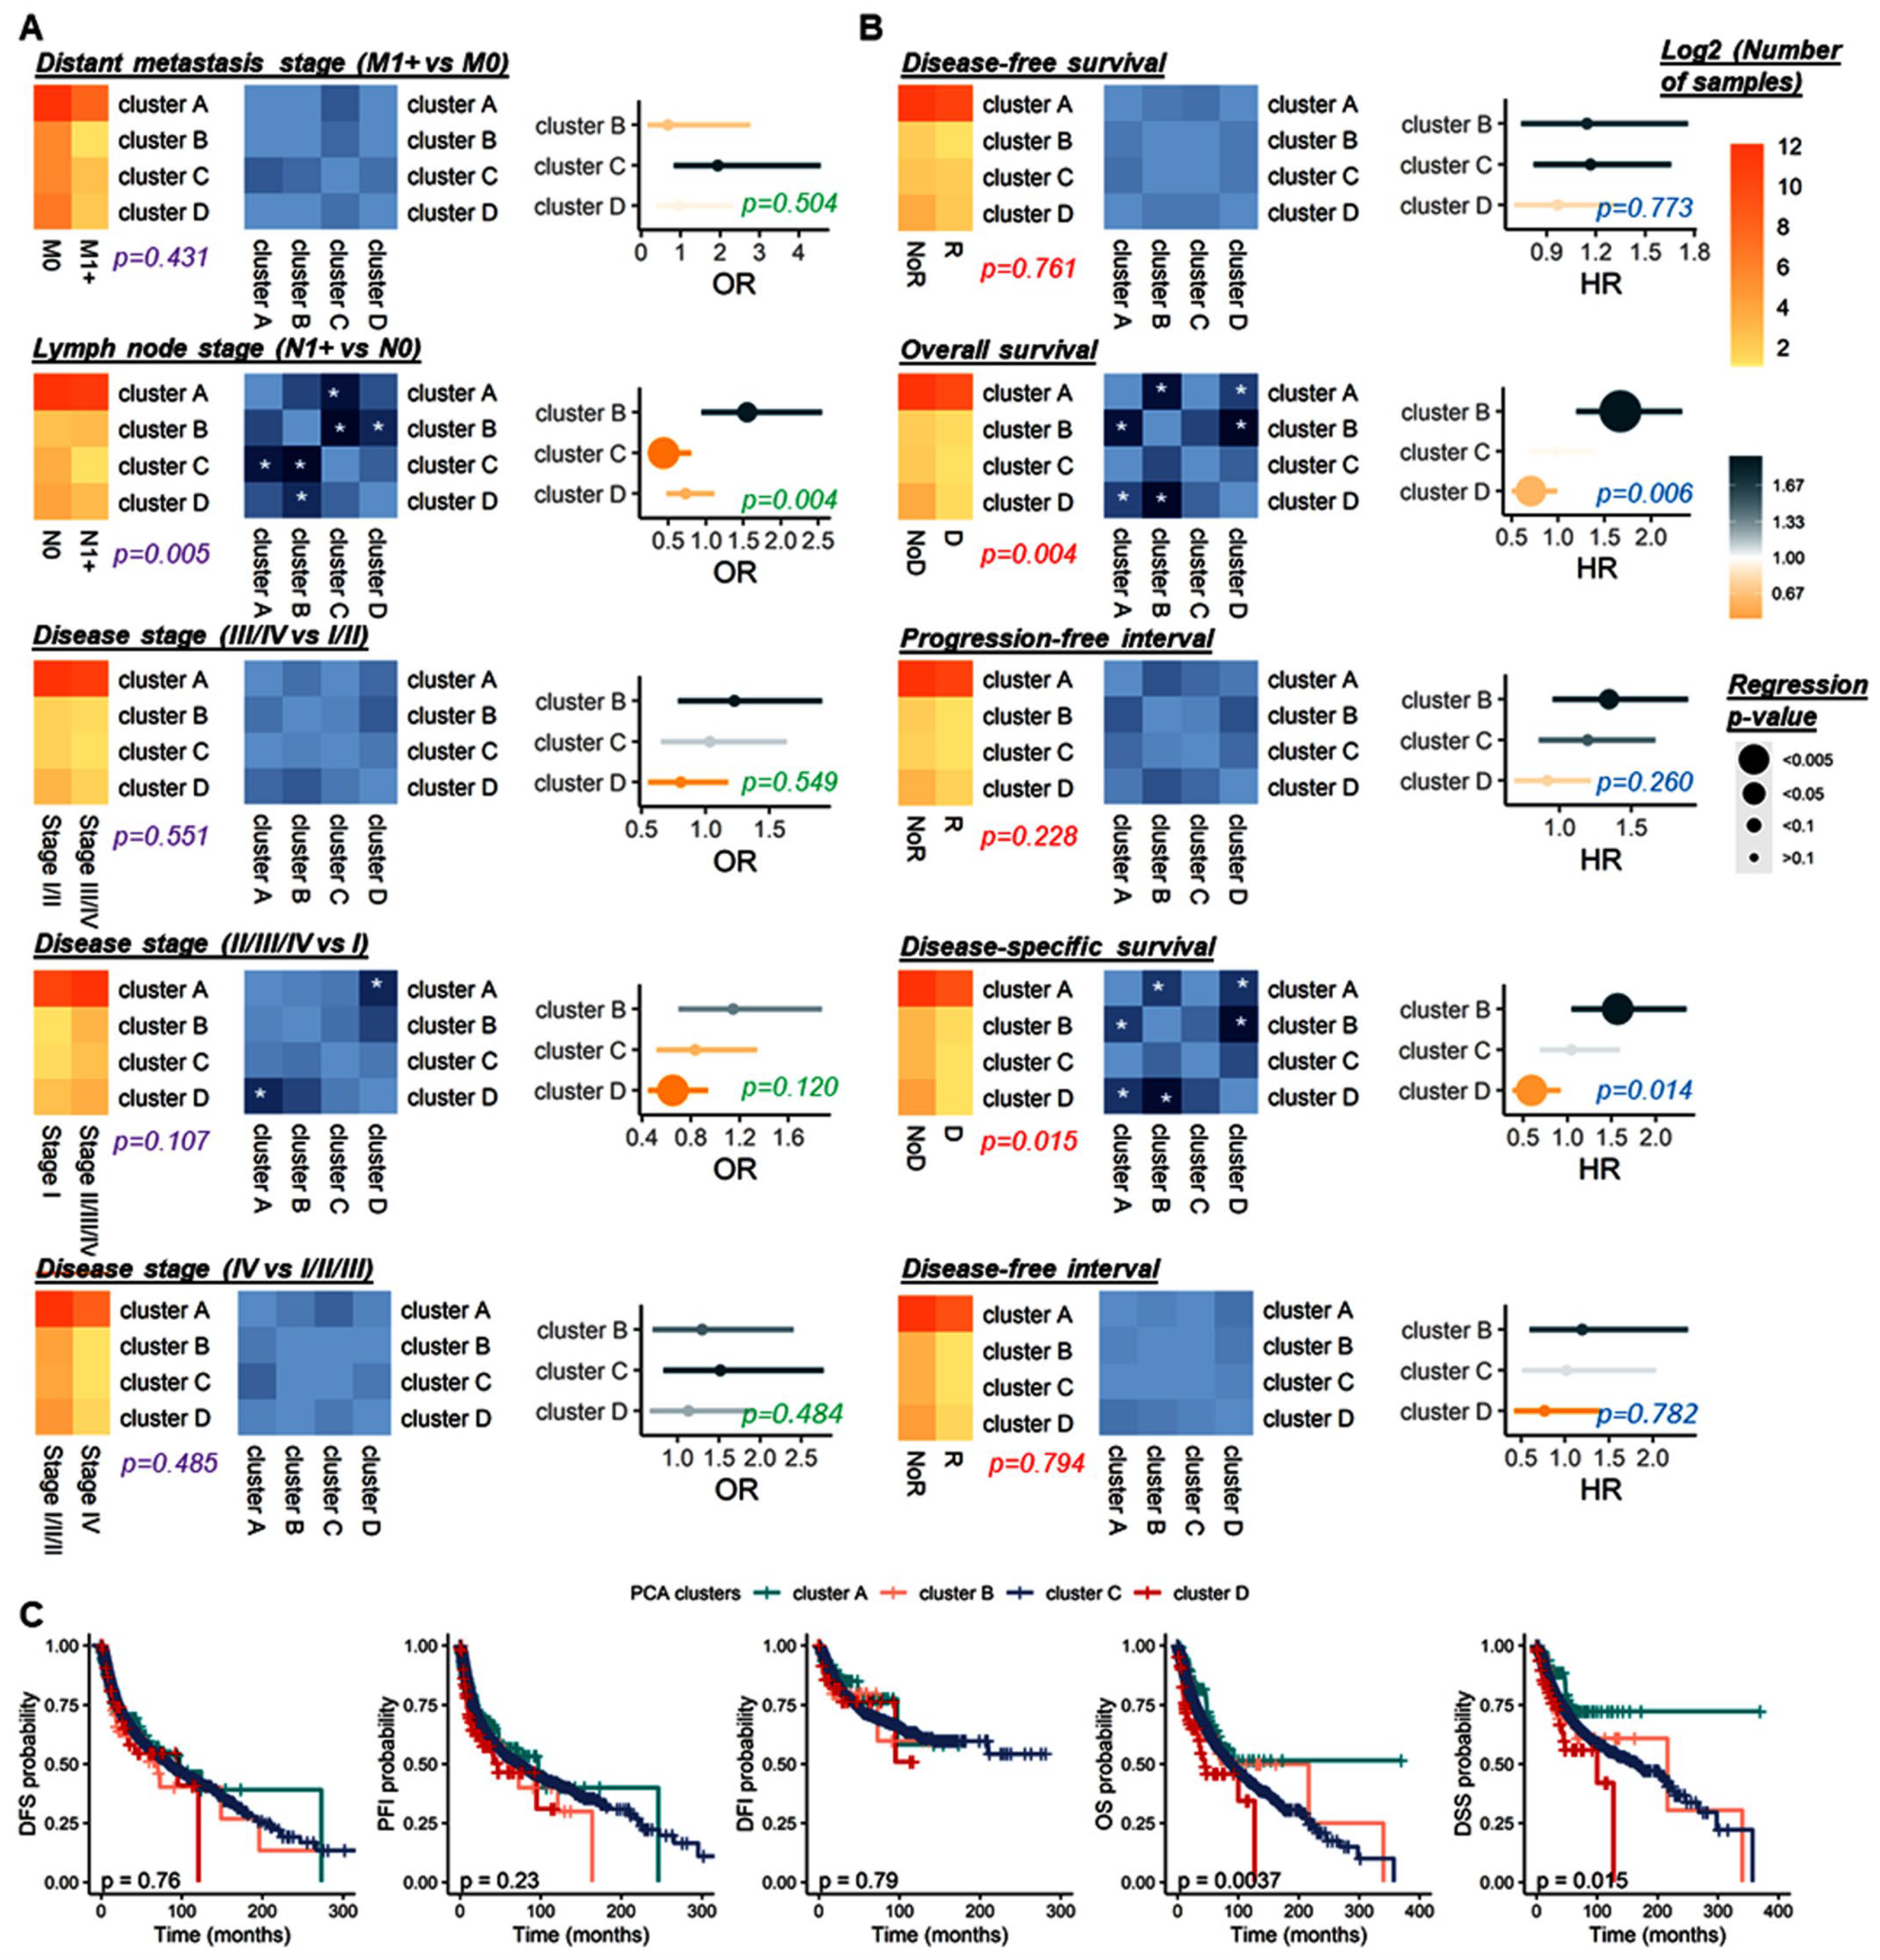
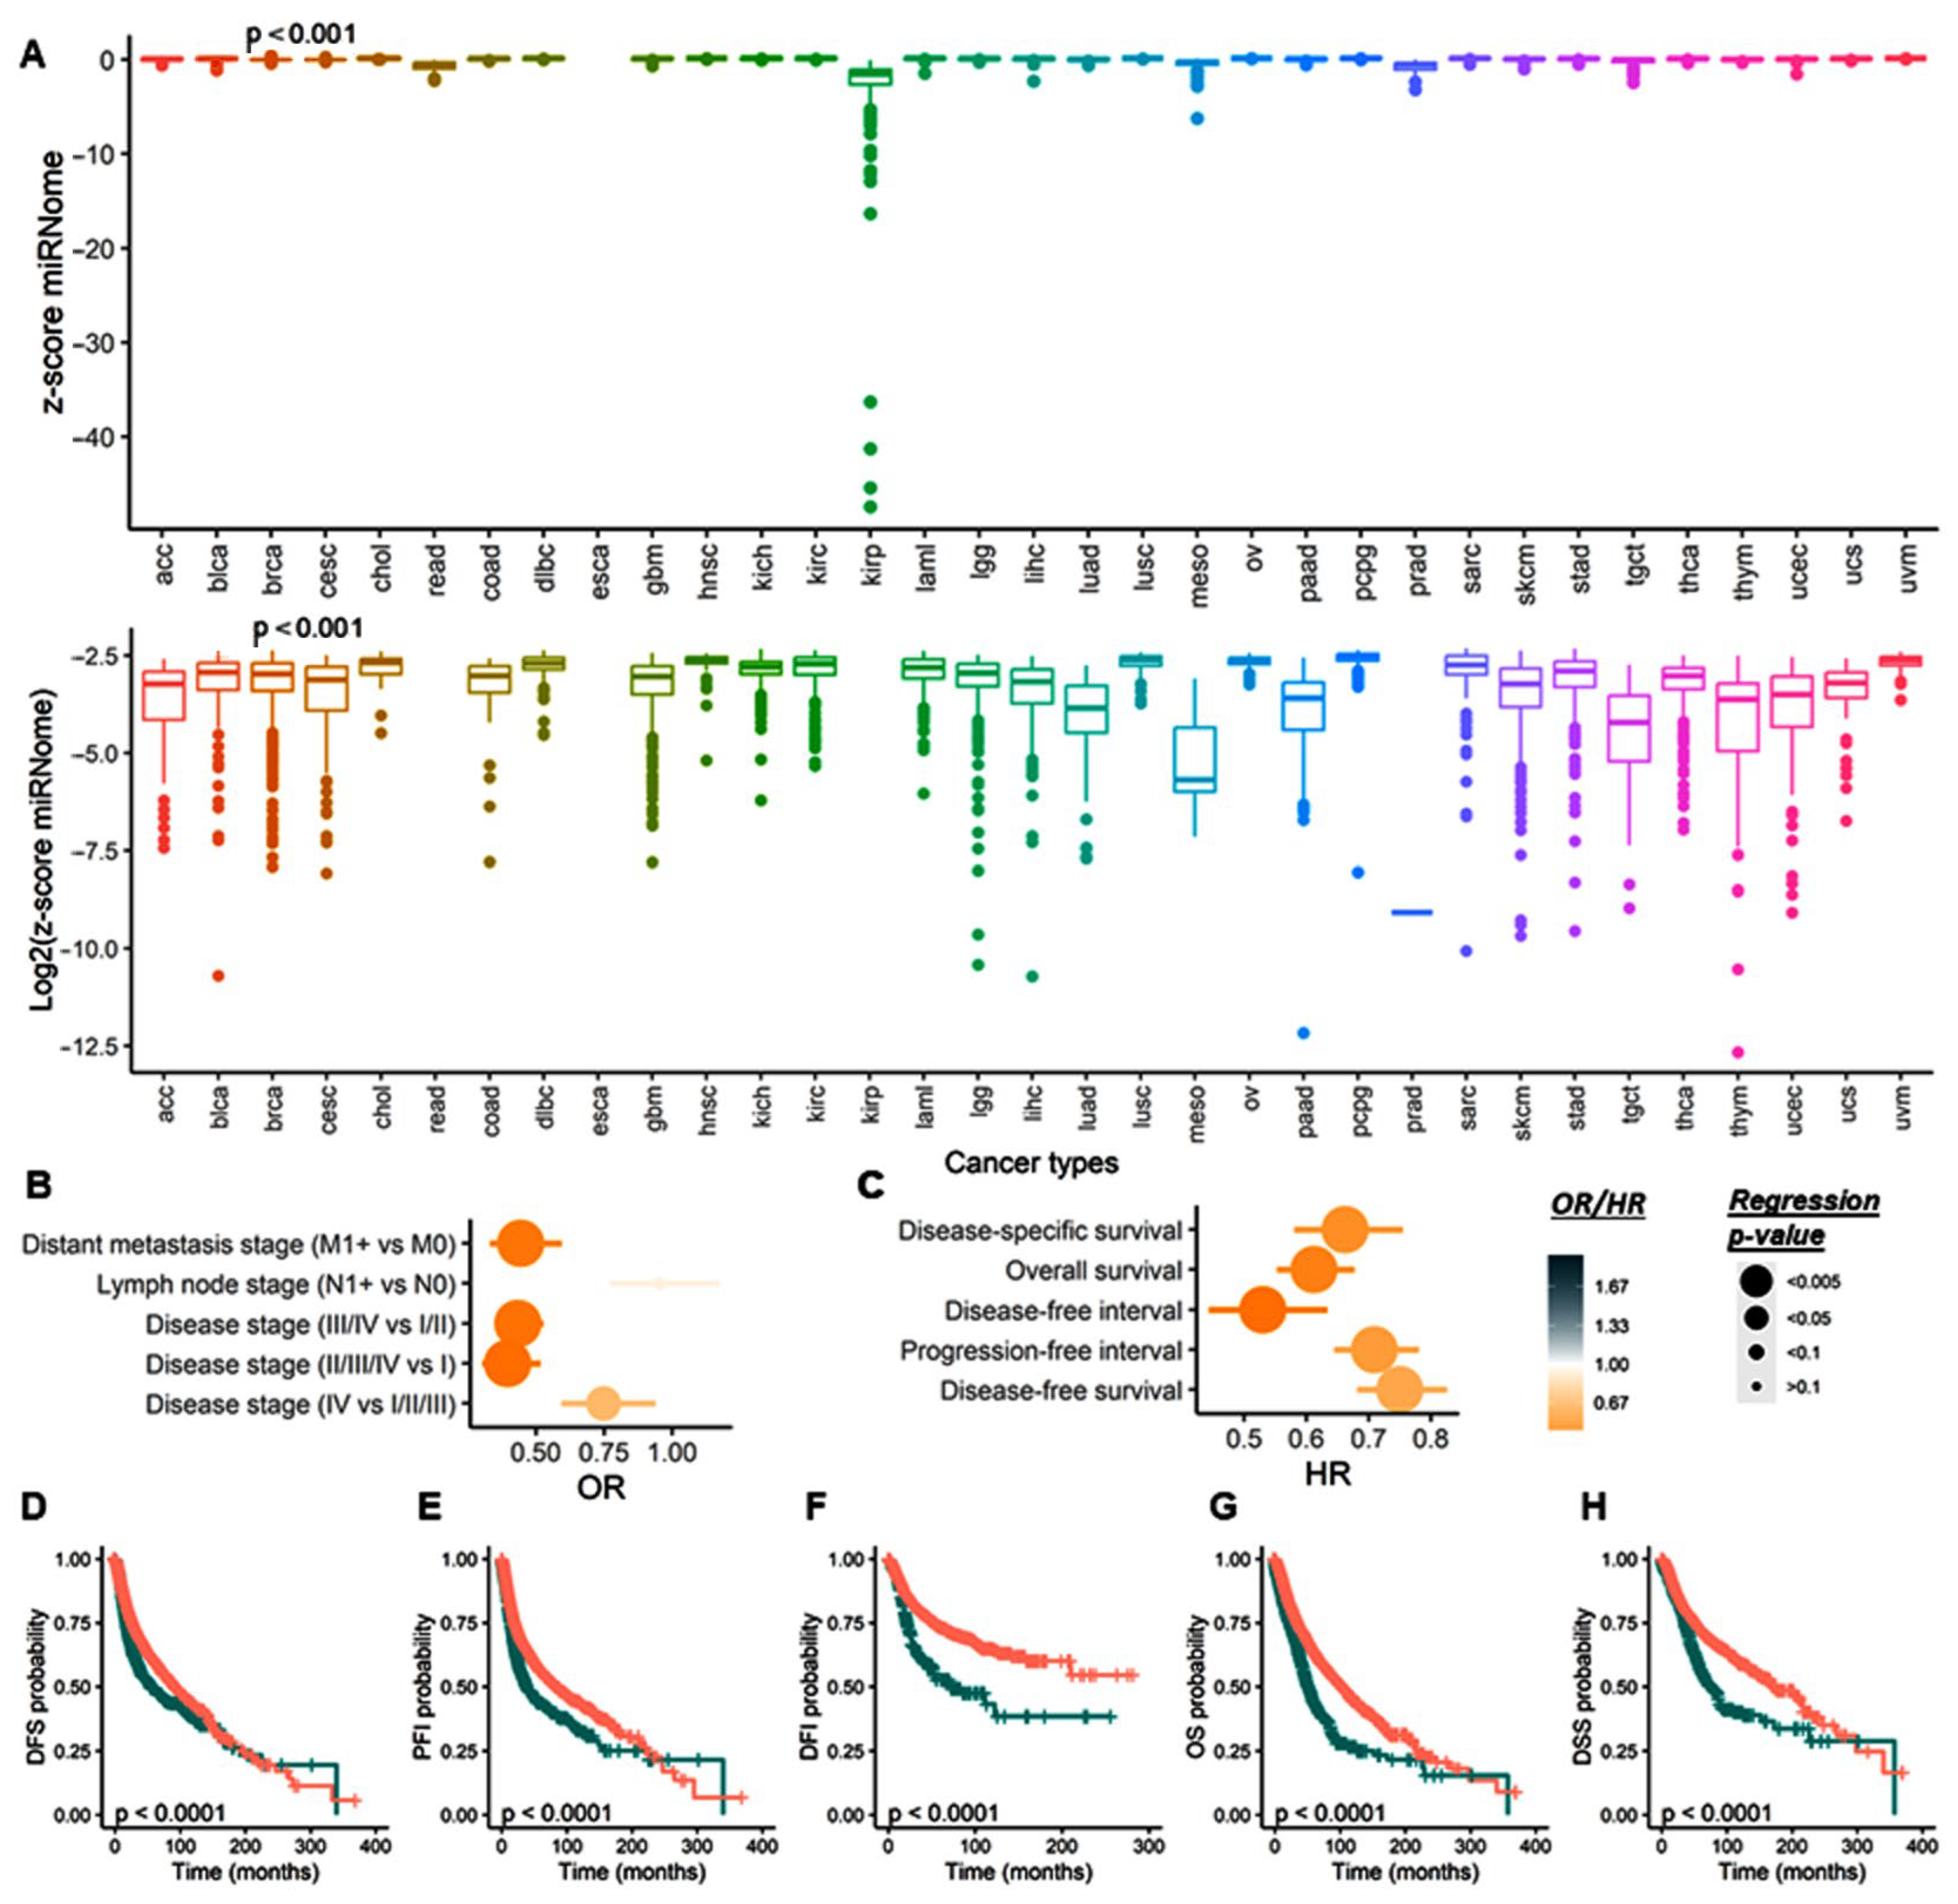
3.2.3. Survival Analysis
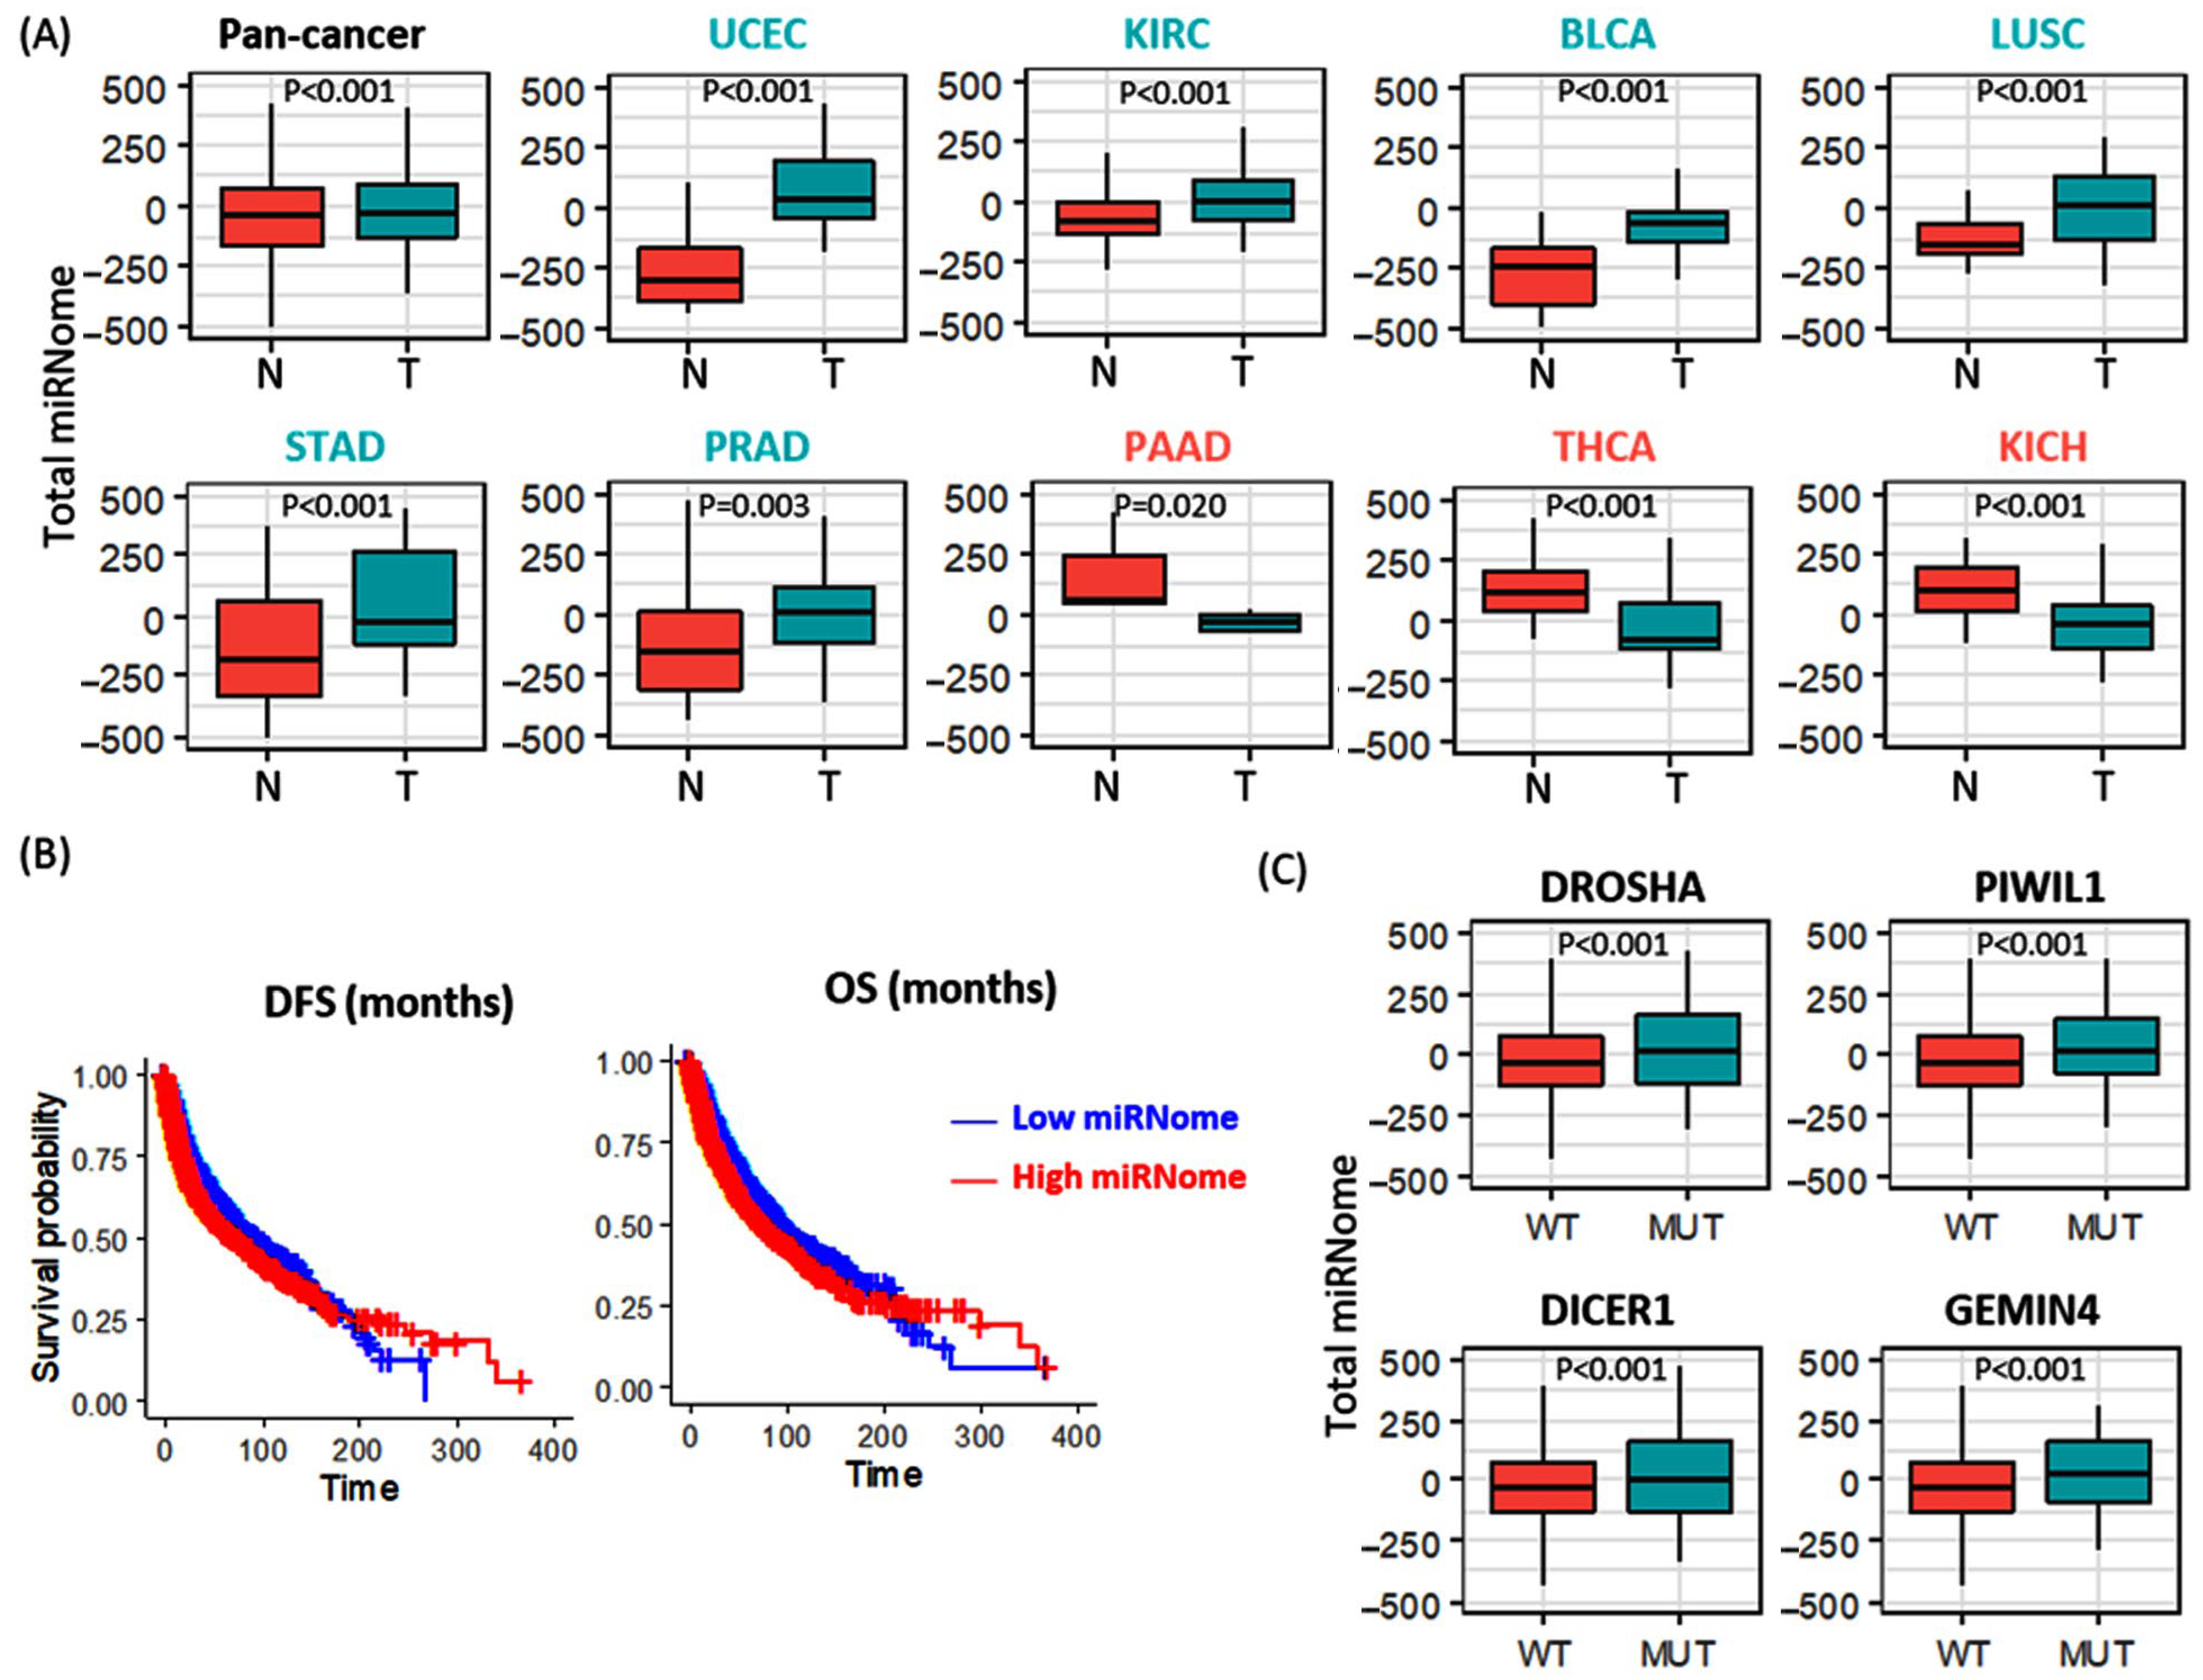
3.2.4. Total microRNome Analysis
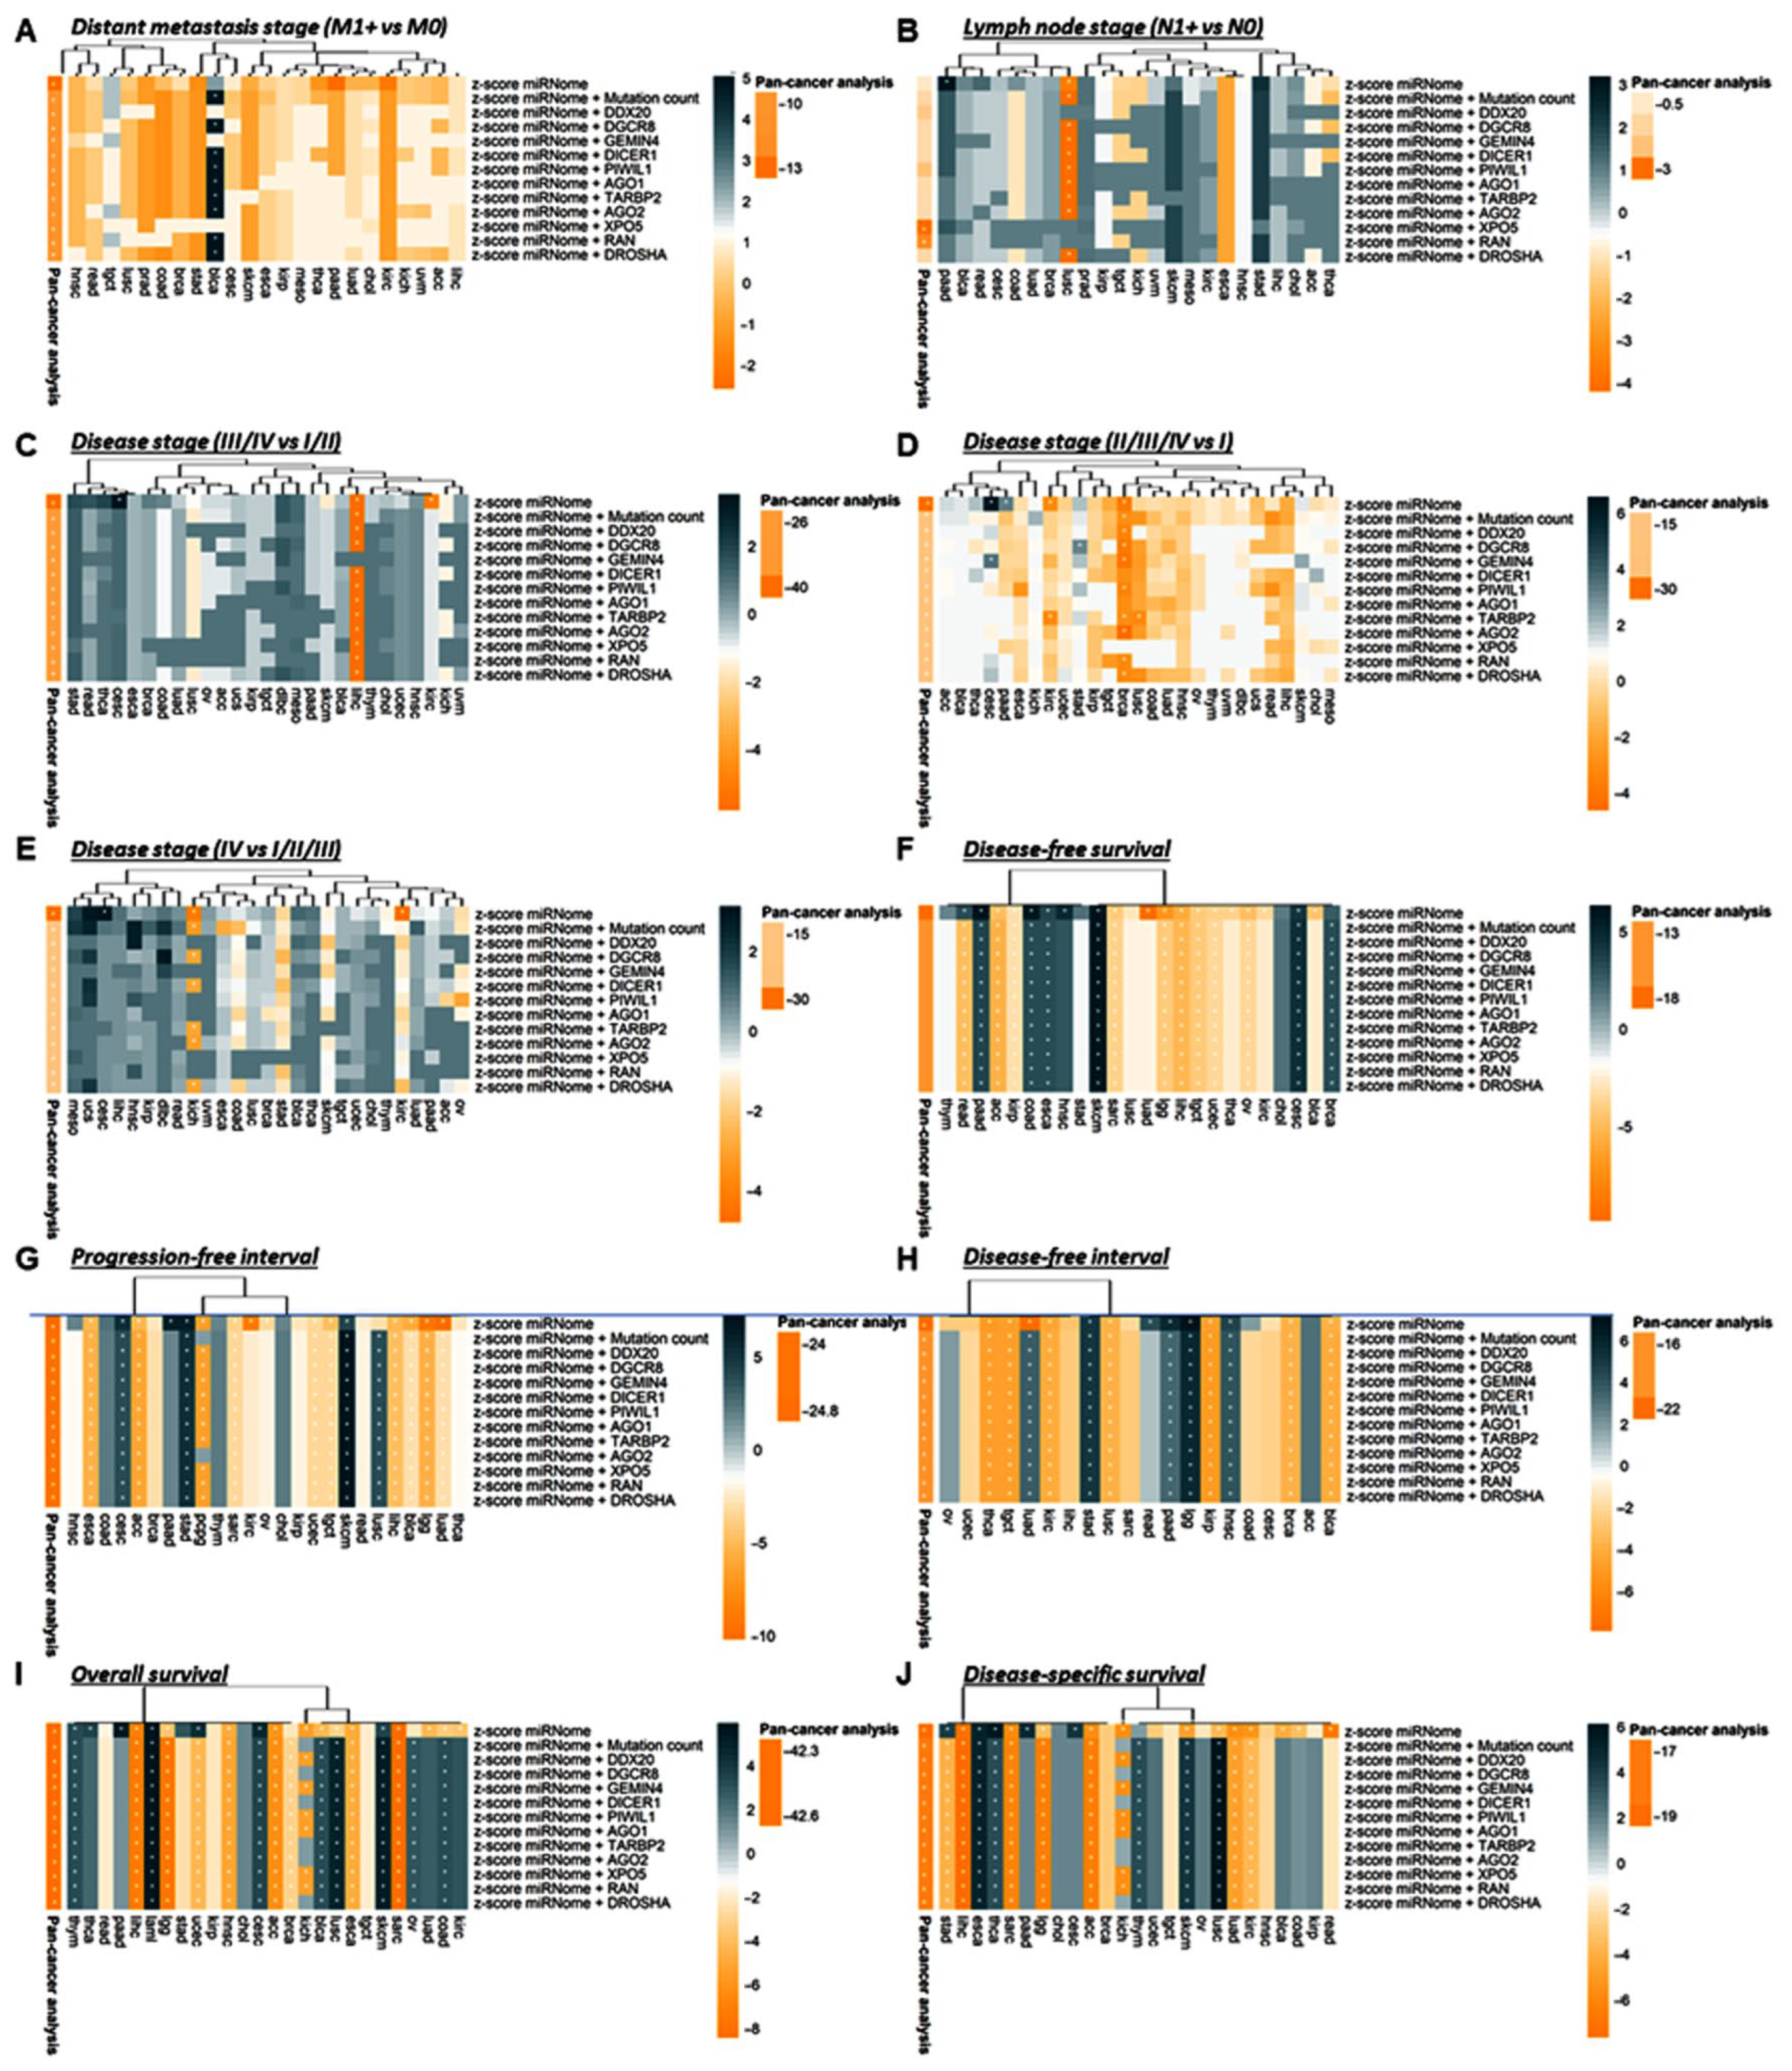
3.2.5. Stratification Analysis for Genetic Alteration by Cancer Type
3.2.6. Stratification Analysis for Total miRNome by Cancer Type
4. Discussion
5. Conclusions
Supplementary Materials
Author Contributions
Funding
Institutional Review Board Statement
Informed Consent Statement
Data Availability Statement
Acknowledgments
Conflicts of Interest
References
- Liu, H.; Lei, C.; He, Q.; Pan, Z.; Xiao, D.; Tao, Y. Nuclear functions of mammalian MicroRNAs in gene regulation, immunity and cancer. Mol. Cancer 2018, 17, 64. [Google Scholar] [CrossRef] [PubMed] [Green Version]
- Shrestha, S.; Hutchison, R.L. Outcomes for late presenting lateral condyle fractures of the humerus in children: A case series. J. Clin. Orthop. Trauma 2020, 11, 251–258. [Google Scholar] [CrossRef]
- Toraih, E.A.; Ibrassshiem, A.T.; Fawzy, M.S.; Hussein, M.H.; Al-Qahtani, S.A.M.; Shaalan, A.A.M. MicroRNA-34a: A Key Regulator in the Hallmarks of Renal Cell Carcinoma. Oxid. Med. Cell. Longev. 2017, 2017, 3269379. [Google Scholar] [CrossRef] [PubMed] [Green Version]
- Marzi, M.J.; Ghini, F.; Cerruti, B.; de Pretis, S.; Bonetti, P.; Giacomelli, C.; Gorski, M.M.; Kress, T.; Pelizzola, M.; Muller, H.; et al. Degradation dynamics of microRNAs revealed by a novel pulse-chase approach. Genome Res. 2016, 26, 554–565. [Google Scholar] [CrossRef] [Green Version]
- Toraih, E.A.; Alghamdi, S.A.; El-Wazir, A.; Hosny, M.M.; Hussein, M.H.; Khashana, M.S.; Fawzy, M.S. Dual biomarkers long non-coding RNA GAS5 and microRNA-34a co-expression signature in common solid tumors. PLoS ONE 2018, 13, e0198231. [Google Scholar] [CrossRef] [Green Version]
- Maldonado, E.; Morales-Pison, S.; Urbina, F.; Jara, L.; Solari, A. Role of the Mediator Complex and MicroRNAs in Breast Cancer Etiology. Genes 2022, 13, 234. [Google Scholar] [CrossRef]
- Macfarlane, L.A.; Murphy, P.R. MicroRNA: Biogenesis, Function and Role in Cancer. Curr. Genom. 2010, 11, 537–561. [Google Scholar] [CrossRef] [PubMed] [Green Version]
- O’Brien, J.; Hayder, H.; Zayed, Y.; Peng, C. Overview of MicroRNA Biogenesis, Mechanisms of Actions, and Circulation. Front. Endocrinol. 2018, 9, 402. [Google Scholar] [CrossRef] [Green Version]
- Li, C.; Zhou, T.; Chen, J.; Li, R.; Chen, H.; Luo, S.; Chen, D.; Cai, C.; Li, W. The role of Exosomal miRNAs in cancer. J. Transl. Med. 2022, 20, 6. [Google Scholar] [CrossRef] [PubMed]
- Klum, S.M.; Chandradoss, S.D.; Schirle, N.T.; Joo, C.; MacRae, I.J. Helix-7 in Argonaute2 shapes the microRNA seed region for rapid target recognition. Embo J. 2018, 37, 75–88. [Google Scholar] [CrossRef] [PubMed]
- Zhu, J.; Lu, K.; Zhang, N.; Zhao, Y.; Ma, Q.; Shen, J.; Lin, Y.; Xiang, P.; Tang, Y.; Hu, X.; et al. Myocardial reparative functions of exosomes from mesenchymal stem cells are enhanced by hypoxia treatment of the cells via transferring microRNA-210 in an nSMase2-dependent way. Artif. Cells Nanomed. Biotechnol. 2018, 46, 1659–1670. [Google Scholar] [CrossRef] [Green Version]
- Koppers-Lalic, D.; Hackenberg, M.; Bijnsdorp, I.V.; van Eijndhoven, M.A.J.; Sadek, P.; Sie, D.; Zini, N.; Middeldorp, J.M.; Ylstra, B.; de Menezes, R.X.; et al. Nontemplated nucleotide additions distinguish the small RNA composition in cells from exosomes. Cell Rep. 2014, 8, 1649–1658. [Google Scholar] [CrossRef] [Green Version]
- Zhou, X.; Wang, L.; Zou, W.; Chen, X.; Roizman, B.; Zhou, G.G. hnRNPA2B1 Associated with Recruitment of RNA into Exosomes Plays a Key Role in Herpes Simplex Virus 1 Release from Infected Cells. J. Virol. 2020, 94, e00367-20. [Google Scholar] [CrossRef] [PubMed]
- Cheng, Q.; Li, X.; Wang, Y.; Dong, M.; Zhan, F.H.; Liu, J. The ceramide pathway is involved in the survival, apoptosis and exosome functions of human multiple myeloma cells in vitro. Acta Pharm. Sin. 2018, 39, 561–568. [Google Scholar] [CrossRef]
- Reichholf, B.; Herzog, V.A.; Fasching, N.; Manzenreither, R.A.; Sowemimo, I.; Ameres, S.L. Time-Resolved Small RNA Sequencing Unravels the Molecular Principles of MicroRNA Homeostasis. Mol. Cell 2019, 75, 756–768.e757. [Google Scholar] [CrossRef] [PubMed]
- Makarova, J.A.; Shkurnikov, M.U.; Wicklein, D.; Lange, T.; Samatov, T.R.; Turchinovich, A.A.; Tonevitsky, A.G. Intracellular and extracellular microRNA: An update on localization and biological role. Prog. Histochem. Cytochem. 2016, 51, 33–49. [Google Scholar] [CrossRef] [PubMed]
- Zlotorynski, E. Insights into the kinetics of microRNA biogenesis and turnover. Nat. Rev. Mol. Cell Biol. 2019, 20, 511. [Google Scholar] [CrossRef]
- Wegert, J.; Ishaque, N.; Vardapour, R.; Geörg, C.; Gu, Z.; Bieg, M.; Ziegler, B.; Bausenwein, S.; Nourkami, N.; Ludwig, N.; et al. Mutations in the SIX1/2 pathway and the DROSHA/DGCR8 miRNA microprocessor complex underlie high-risk blastemal type Wilms tumors. Cancer Cell 2015, 27, 298–311. [Google Scholar] [CrossRef] [Green Version]
- Walz, A.L.; Ooms, A.; Gadd, S.; Gerhard, D.S.; Smith, M.A.; Guidry Auvil, J.M.; Meerzaman, D.; Chen, Q.R.; Hsu, C.H.; Yan, C.; et al. Recurrent DGCR8, DROSHA, and SIX homeodomain mutations in favorable histology Wilms tumors. Cancer Cell 2015, 27, 286–297. [Google Scholar] [CrossRef] [Green Version]
- Merritt, W.M.; Lin, Y.G.; Han, L.Y.; Kamat, A.A.; Spannuth, W.A.; Schmandt, R.; Urbauer, D.; Pennacchio, L.A.; Cheng, J.F.; Nick, A.M.; et al. Dicer, Drosha, and outcomes in patients with ovarian cancer. N. Engl. J. Med. 2008, 359, 2641–2650. [Google Scholar] [CrossRef]
- Karube, Y.; Tanaka, H.; Osada, H.; Tomida, S.; Tatematsu, Y.; Yanagisawa, K.; Yatabe, Y.; Takamizawa, J.; Miyoshi, S.; Mitsudomi, T.; et al. Reduced expression of Dicer associated with poor prognosis in lung cancer patients. Cancer Sci. 2005, 96, 111–115. [Google Scholar] [CrossRef]
- Kopanos, C.; Tsiolkas, V.; Kouris, A.; Chapple, C.E.; Albarca Aguilera, M.; Meyer, R.; Massouras, A. VarSome: The human genomic variant search engine. Bioinformatics 2018, 35, 1978–1980. [Google Scholar] [CrossRef] [PubMed] [Green Version]
- Yates, A.; Akanni, W.; Amode, M.R.; Barrell, D.; Billis, K.; Carvalho-Silva, D.; Cummins, C.; Clapham, P.; Fitzgerald, S.; Gil, L.; et al. Ensembl 2016. Nucleic Acids Res. 2015, 44, D710–D716. [Google Scholar] [CrossRef]
- Stroup, D.F.; Berlin, J.A.; Morton, S.C.; Olkin, I.; Williamson, G.D.; Rennie, D.; Moher, D.; Becker, B.J.; Sipe, T.A.; Thacker, S.B. Meta-analysis of observational studies in epidemiology: A proposal for reporting. Meta-analysis Of Observational Studies in Epidemiology (MOOSE) group. JAMA 2000, 283, 2008–2012. [Google Scholar] [CrossRef]
- Moher, D.; Shamseer, L.; Clarke, M.; Ghersi, D.; Liberati, A.; Petticrew, M.; Shekelle, P.; Stewart, L.A. Preferred reporting items for systematic review and meta-analysis protocols (PRISMA-P) 2015 statement. Syst. Rev. 2015, 4, 1. [Google Scholar] [CrossRef] [Green Version]
- Elshazli, R.M.; Toraih, E.A.; Elgaml, A.; Kandil, E.; Fawzy, M.S. Genetic polymorphisms of TP53 (rs1042522) and MDM2 (rs2279744) and colorectal cancer risk: An updated meta-analysis based on 59 case-control studies. Gene 2020, 734, 144391. [Google Scholar] [CrossRef] [PubMed]
- Elshazli, R.M.; Salman, D.O.; Kamel, M.M.; Toraih, E.A.; Fawzy, M.S. Genetic polymorphisms of IL-17A rs2275913, rs3748067 and IL-17F rs763780 in gastric cancer risk: Evidence from 8124 cases and 9873 controls. Mol. Biol. Rep. 2018, 45, 1421–1444. [Google Scholar] [CrossRef] [PubMed]
- Abou-El-Naga, A.M.; Abo El-Khair, S.M.; Mahmoud, A.Z.; Hamza, M.; Elshazli, R.M. Association of genetic variants in the 3’-untranslated region of the mesothelin (MSLN) gene with ovarian carcinoma. J. Biochem. Mol. Toxicol. 2020, 35, e22637. [Google Scholar] [CrossRef] [PubMed]
- Alghamdi, S.A.; Kattan, S.W.; Toraih, E.A.; Alrowaili, M.G.; Fawzy, M.S.; Elshazli, R.M. Association of AIRE (rs2075876), but not CTLA4 (rs231775) polymorphisms with systemic lupus erythematosus. Gene 2021, 768, 145270. [Google Scholar] [CrossRef] [PubMed]
- Cochran, W.G. Some Methods for Strengthening the Common χ2 Tests. Biometrics 1954, 10, 417–451. [Google Scholar] [CrossRef]
- Higgins, J.P.T.; Thompson, S.G.; Deeks, J.J.; Altman, D.G. Measuring inconsistency in meta-analyses. BMJ 2003, 327, 557. [Google Scholar] [CrossRef] [PubMed] [Green Version]
- Mantel, N.; Haenszel, W. Statistical Aspects of the Analysis of Data From Retrospective Studies of Disease. Stat. Asp. Anal. Data Retrosp. Stud. Dis. 1959, 22, 719–748. [Google Scholar]
- DerSimonian, R.; Laird, N. Meta-analysis in clinical trials. Control. Clin. Trials 1986, 7, 177–188. [Google Scholar] [CrossRef]
- Egger, M.; Smith, G.D.; Schneider, M.; Minder, C. Bias in meta-analysis detected by a simple, graphical test. BMJ 1997, 315, 629. [Google Scholar] [CrossRef] [PubMed] [Green Version]
- Duval, S.; Tweedie, R. Trim and fill: A simple funnel-plot-based method of testing and adjusting for publication bias in meta-analysis. Biometrics 2000, 56, 455–463. [Google Scholar] [CrossRef] [PubMed]
- Elshazli, R.M.; Toraih, E.A.; Elgaml, A.; El-Mowafy, M.; El-Mesery, M.; Amin, M.N.; Hussein, M.H.; Killackey, M.T.; Fawzy, M.S.; Kandil, E. Diagnostic and prognostic value of hematological and immunological markers in COVID-19 infection: A meta-analysis of 6320 patients. PLoS ONE 2020, 15, e0238160. [Google Scholar] [CrossRef] [PubMed]
- Claire, R.; Gluud, C.; Berlin, I.; Coleman, T.; Leonardi-Bee, J. Using Trial Sequential Analysis for estimating the sample sizes of further trials: Example using smoking cessation intervention. BMC Med. Res. Methodol. 2020, 20, 284. [Google Scholar] [CrossRef]
- Xie, S.; Shan, X.F.; Shang, K.; Xu, H.; He, J.; Cai, Z.G. Relevance of LIG4 gene polymorphisms with cancer susceptibility: Evidence from a meta-analysis. Sci. Rep. 2014, 4, 6630. [Google Scholar] [CrossRef] [Green Version]
- Thorsson, V.; Gibbs, D.L.; Brown, S.D.; Wolf, D.; Bortone, D.S.; Ou Yang, T.-H.; Porta-Pardo, E.; Gao, G.F.; Plaisier, C.L.; Eddy, J.A.; et al. The Immune Landscape of Cancer. Immunity 2018, 48, 812–830.e814. [Google Scholar] [CrossRef] [Green Version]
- Liu, J.; Lichtenberg, T.; Hoadley, K.A.; Poisson, L.M.; Lazar, A.J.; Cherniack, A.D.; Kovatich, A.J.; Benz, C.C.; Levine, D.A.; Lee, A.V.; et al. An Integrated TCGA Pan-Cancer Clinical Data Resource to Drive High-Quality Survival Outcome Analytics. Cell 2018, 173, 400–416.e411. [Google Scholar] [CrossRef] [Green Version]
- Toraih, E.A.; Fawzy, M.S.; Ning, B.; Zerfaoui, M.; Errami, Y.; Ruiz, E.M.; Hussein, M.H.; Haidari, M.; Bratton, M.; Tortelote, G.G.; et al. A miRNA-Based Prognostic Model to Trace Thyroid Cancer Recurrence. Cancers 2022, 14, 4128. [Google Scholar] [CrossRef]
- Bermisheva, M.A.; Takhirova, Z.R.; Gilyazova, I.R.; Khusnutdinova, E.K. MicroRNA Biogenesis Pathway Gene Polymorphisms Are Associated with Breast Cancer Risk. Russ. J. Genet. 2018, 54, 568–575. [Google Scholar] [CrossRef]
- Song, X.; Zhong, H.; Wu, Q.; Wang, M.; Zhou, J.; Zhou, Y.; Lu, X.; Ying, B. Association between SNPs in microRNA machinery genes and gastric cancer susceptibility, invasion, and metastasis in Chinese Han population. Oncotarget 2017, 8, 86435–86446. [Google Scholar] [CrossRef] [Green Version]
- Kim, M.N.; Kim, J.O.; Lee, S.M.; Park, H.; Lee, J.H.; Rim, K.S.; Hwang, S.G.; Kim, N.K. Variation in the Dicer and RAN Genes Are Associated with Survival in Patients with Hepatocellular Carcinoma. PLoS ONE 2016, 11, e0162279. [Google Scholar] [CrossRef]
- Martin-Guerrero, I.; Gutierrez-Camino, A.; Lopez-Lopez, E.; Bilbao-Aldaiturriaga, N.; Pombar-Gomez, M.; Ardanaz, M.; Garcia-Orad, A. Genetic variants in miRNA processing genes and pre-miRNAs are associated with the risk of chronic lymphocytic leukemia. PLoS ONE 2015, 10, e0118905. [Google Scholar] [CrossRef] [PubMed]
- Cho, S.H.; Ko, J.J.; Kim, J.O.; Jeon, Y.J.; Yoo, J.K.; Oh, J.; Oh, D.; Kim, J.W.; Kim, N.K. 3’-UTR Polymorphisms in the MiRNA Machinery Genes DROSHA, DICER1, RAN, and XPO5 Are Associated with Colorectal Cancer Risk in a Korean Population. PLoS ONE 2015, 10, e0131125. [Google Scholar] [CrossRef] [Green Version]
- Yuan, L.; Chu, H.; Wang, M.; Gu, X.; Shi, D.; Ma, L.; Zhong, D.; Du, M.; Li, P.; Tong, N.; et al. Genetic variation in DROSHA 3’UTR regulated by hsa-miR-27b is associated with bladder cancer risk. PLoS ONE 2013, 8, e81524. [Google Scholar] [CrossRef] [Green Version]
- Jiang, Y.; Chen, J.; Wu, J.; Hu, Z.; Qin, Z.; Liu, X.; Guan, X.; Wang, Y.; Han, J.; Jiang, T.; et al. Evaluation of genetic variants in microRNA biosynthesis genes and risk of breast cancer in Chinese women. Int. J. Cancer 2013, 133, 2216–2224. [Google Scholar] [CrossRef] [PubMed]
- Kim, J.S.; Choi, Y.Y.; Jin, G.; Kang, H.G.; Choi, J.E.; Jeon, H.S.; Lee, W.K.; Kim, D.S.; Kim, C.H.; Kim, Y.J.; et al. Association of a common AGO1 variant with lung cancer risk: A two-stage case-control study. Mol. Carcinog. 2010, 49, 913–921. [Google Scholar] [CrossRef]
- Yang, H.; Dinney, C.P.; Ye, Y.; Zhu, Y.; Grossman, H.B.; Wu, X. Evaluation of genetic variants in microRNA-related genes and risk of bladder cancer. Cancer Res. 2008, 68, 2530–2537. [Google Scholar] [CrossRef] [Green Version]
- Horikawa, Y.; Wood, C.G.; Yang, H.; Zhao, H.; Ye, Y.; Gu, J.; Lin, J.; Habuchi, T.; Wu, X. Single nucleotide polymorphisms of microRNA machinery genes modify the risk of renal cell carcinoma. Clin. Cancer Res. 2008, 14, 7956–7962. [Google Scholar] [CrossRef] [PubMed]
- Mohammadpour-Gharehbagh, A.; Heidari, Z.; Eskandari, M.; Aryan, A.; Salimi, S. Association between Genetic Polymorphisms in microRNA Machinery Genes and Risk of Papillary Thyroid Carcinoma. Pathol. Oncol. Res. 2020, 26, 1235–1241. [Google Scholar] [CrossRef]
- Bruzgielewicz, A.; Osuch-Wojcikiewicz, E.; Walczak, A.; Nowak, A.; Uczkowski, H.; Majsterek, I. Evaluation of polymorphisms in microRNA biosynthesis genes and risk of laryngeal cancer in the Polish population. Pol. J. Pathol. 2016, 67, 283–290. [Google Scholar] [CrossRef] [PubMed] [Green Version]
- Osuch-Wojcikiewicz, E.; Bruzgielewicz, A.; Niemczyk, K.; Sieniawska-Buccella, O.; Nowak, A.; Walczak, A.; Majsterek, I. Association of Polymorphic Variants of miRNA Processing Genes with Larynx Cancer Risk in a Polish Population. Biomed. Res. Int. 2015, 2015, 298378. [Google Scholar] [CrossRef] [PubMed] [Green Version]
- Mi, Y.; Wang, L.; Zong, L.; Pei, M.; Lu, Q.; Huang, P. Genetic variants in microRNA target sites of 37 selected cancer-related genes and the risk of cervical cancer. PLoS ONE 2014, 9, e86061. [Google Scholar] [CrossRef] [PubMed] [Green Version]
- Zu, Y.; Ban, J.; Xia, Z.; Wang, J.; Cai, Y.; Ping, W.; Sun, W. Genetic variation in a miR-335 binding site in BIRC5 alters susceptibility to lung cancer in Chinese Han populations. Biochem. Biophys. Res. Commun. 2013, 430, 529–534. [Google Scholar] [CrossRef]
- Wang, K.; Li, J.; Guo, H.; Xu, X.; Xiong, G.; Guan, X.; Liu, B.; Li, J.; Chen, X.; Yang, K.; et al. MiR-196a binding-site SNP regulates RAP1A expression contributing to esophageal squamous cell carcinoma risk and metastasis. Carcinogenesis 2012, 33, 2147–2154. [Google Scholar] [CrossRef]
- Thakkar, D.N.; Palugulla, S.; Selvarajan, S.; Dubashi, B. Frequency distribution of BLMH, XPO5 and HFE gene polymorphisms in the South Indian population and their association with Hodgkin Lymphoma. Int. J. Biol. Markers 2018, 33, 514–519. [Google Scholar] [CrossRef] [Green Version]
- Huang, S.Q.; Zhou, Z.X.; Zheng, S.L.; Liu, D.D.; Ye, X.H.; Zeng, C.L.; Han, Y.J.; Wen, Z.H.; Zou, X.Q.; Wu, J.; et al. Association of variants of miRNA processing genes with cervical precancerous lesion risk in a southern Chinese population. Biosci. Rep. 2018, 38, BSR20171565. [Google Scholar] [CrossRef] [Green Version]
- Wen, J.; Gao, Q.; Wang, N.; Zhang, W.; Cao, K.; Zhang, Q.; Chen, S.; Shi, L. Association of microRNA-related gene XPO5 rs11077 polymorphism with susceptibility to thyroid cancer. Medicine 2017, 96, e6351. [Google Scholar] [CrossRef]
- Peckham-Gregory, E.C.; Thapa, D.R.; Martinson, J.; Duggal, P.; Penugonda, S.; Bream, J.H.; Chang, P.Y.; Dandekar, S.; Chang, S.C.; Detels, R.; et al. MicroRNA-related polymorphisms and non-Hodgkin lymphoma susceptibility in the Multicenter AIDS Cohort Study. Cancer Epidemiol. 2016, 45, 47–57. [Google Scholar] [CrossRef]
- Zhao, Y.; Du, Y.; Zhao, S.; Guo, Z. Single-nucleotide polymorphisms of microRNA processing machinery genes and risk of colorectal cancer. OncoTargets Ther. 2015, 8, 421–425. [Google Scholar] [CrossRef] [Green Version]
- Xie, Y.; Wang, Y.; Zhao, Y.; Guo, Z. Single-nucleotide polymorphisms of microRNA processing machinery genes are associated with risk for gastric cancer. OncoTargets Ther. 2015, 8, 567–571. [Google Scholar] [CrossRef] [Green Version]
- Wang, J.; Zhuo, Z.; Chen, M.; Zhu, J.; Zhao, J.; Zhang, J.; Chen, S.; He, J.; Zhou, H. RAN/RANBP2 polymorphisms and neuroblastoma risk in Chinese children: A three-center case-control study. Aging (Albany NY) 2018, 10, 808–818. [Google Scholar] [CrossRef] [Green Version]
- Roy, R.; De Sarkar, N.; Ghose, S.; Paul, R.R.; Pal, M.; Bhattacharya, C.; Chowdhury, S.K.; Ghosh, S.; Roy, B. Genetic variations at microRNA and processing genes and risk of oral cancer. Tumor Biol. 2014, 35, 3409–3414. [Google Scholar] [CrossRef] [PubMed]
- Li, Y.C.; Song, C.H.; Yang, W.J.; Dai, L.P.; Wang, P.; Shi, J.X.; Zhang, J.Y.; Wang, K.J. Correlation between tag single nucleotide polymorphisms of microRNA regulatory genes and the genetic susceptibility of primary liver cancer. Zhonghua Yu Fang Yi Xue Za Zhi 2012, 46, 533–537. [Google Scholar] [PubMed]
- Wang, Z.; Wang, J.; Wang, Q.; Wang, J.; Yuan, J.; Si, Y. Genetic variant in DICER gene is associated with prognosis of hepatocellular carcinoma in a Chinese cohort. Hepatol. Res. 2017, 47, 845–853. [Google Scholar] [CrossRef]
- Liu, L.; An, J.; Liu, J.; Wen, J.; Zhai, X.; Liu, Y.; Pan, S.; Jiang, J.; Wen, Y.; Liu, Z.; et al. Potentially functional genetic variants in microRNA processing genes and risk of HBV-related hepatocellular carcinoma. Mol. Carcinog. 2013, 52 (Suppl. S1), E148–E154. [Google Scholar] [CrossRef]
- Chen, J.; Qin, Z.; Pan, S.; Jiang, J.; Liu, L.; Liu, J.; Chen, X.; Hu, Z.; Shen, H. Genetic variants in RAN, DICER and HIWI of microRNA biogenesis genes and risk of cervical carcinoma in a Chinese population. Chin. J. Cancer Res. 2013, 25, 565–571. [Google Scholar] [CrossRef]
- Ma, H.; Yuan, H.; Yuan, Z.; Yu, C.; Wang, R.; Jiang, Y.; Hu, Z.; Shen, H.; Chen, N. Genetic variations in key microRNA processing genes and risk of head and neck cancer: A case-control study in Chinese population. PLoS ONE 2012, 7, e47544. [Google Scholar] [CrossRef] [Green Version]
- Yuan, W.W.; Hang, D.; Wang, L.H.; Chen, S.H.; Ding, Z.X.; Hu, Z.B.; Ma, H.X. Association between genetic variants in microRNA biosynthesis genes and the risk of head and neck squamous cell carcinoma. Zhonghua Liu Xing Bing Xue Za Zhi 2016, 37, 1069–1073. [Google Scholar] [CrossRef]
- Slaby, O.; Sachlova, M.; Brezkova, V.; Hezova, R.; Kovarikova, A.; Bischofova, S.; Sevcikova, S.; Bienertova-Vasku, J.; Vasku, A.; Svoboda, M.; et al. Identification of microRNAs regulated by isothiocyanates and association of polymorphisms inside their target sites with risk of sporadic colorectal cancer. Nutr. Cancer 2013, 65, 247–254. [Google Scholar] [CrossRef] [PubMed]
- Kim, J.; Lee, J.; Oh, J.H.; Chang, H.J.; Sohn, D.K.; Kwon, O.; Shin, A.; Kim, J. Dietary Lutein Plus Zeaxanthin Intake and DICER1 rs3742330 A > G Polymorphism Relative to Colorectal Cancer Risk. Sci. Rep. 2019, 9, 3406. [Google Scholar] [CrossRef] [Green Version]
- Oz, M.; Karakus, S.; Yildirim, M.; Bagci, B.; Sari, I.; Bagci, G.; Yildiz, C.; Akkar, O.; Cetin, A.; Yanik, A. Genetic variants in the microRNA machinery gene (Dicer) have a prognostic value in the management of endometrial cancer. J. Cancer Res. Ther. 2018, 14, 1279–1284. [Google Scholar] [CrossRef]
- Nikolic, Z.; Savic Pavicevic, D.; Vucic, N.; Cerovic, S.; Vukotic, V.; Brajuskovic, G. Genetic variants in RNA-induced silencing complex genes and prostate cancer. World J. Urol. 2017, 35, 613–624. [Google Scholar] [CrossRef]
- Zheng, L.; Gu, H.; Zhang, L.; Wang, Z. DICER rs3742330 A>G polymorphism and risk of esophageal cancer. Chin. J. Cancer Prev. Treat. 2013, 20, 1794–1796. [Google Scholar]
- Fang, X.; Yin, Z.; Li, X.; Xia, L.; Zhou, B. Polymorphisms in GEMIN4 and AGO1 Genes Are Associated with the Risk of Lung Cancer: A Case-Control Study in Chinese Female Non-Smokers. Int. J. Environ. Res. Public Health 2016, 13, 939. [Google Scholar] [CrossRef] [PubMed] [Green Version]
- Gutiérrez-Malacatt, H.; Ayala-Sanchez, M.; Aquino-Ortega, X.; Dominguez-Rodriguez, J.; Martinez-Tovar, A.; Olarte-Carrillo, I.; Martinez-Hernandez, A.; Cecilia, C.C.C.; Orozco, L.; Cordova, E.J. The rs61764370 Functional Variant in the KRAS Oncogene is Associated with Chronic Myeloid Leukemia Risk in Women. Asian Pac. J. Cancer Prev. 2016, 17, 2265–2270. [Google Scholar] [CrossRef] [Green Version]
- Roy, R.; De Sarkar, N.; Ghose, S.; Paul, R.R.; Ray, A.; Mukhopadhyay, I.; Roy, B. Association between risk of oral precancer and genetic variations in microRNA and related processing genes. J. Biomed. Sci. 2014, 21, 48. [Google Scholar] [CrossRef]
- Verma, A.; Singh, V.; Jaiswal, P.K.; Mittal, R.D. Anomalies in MiRNAs Machinery Gene, GEMIN-4 Variants Suggest Renal Cell Carcinoma Risk: A Small Experimental Study from North India. Indian J. Clin. Biochem. 2019, 34, 45–51. [Google Scholar] [CrossRef]
- Zhang, L.L.; Sun, L.; Zhu, X.Q.; Xu, Y.; Yang, K.; Yang, F.; Yang, Y.G.; Chen, G.Q.; Fu, J.C.; Zheng, C.G.; et al. rs10505474 and rs7837328 at 8q24 cumulatively confer risk of prostate cancer in Northern Han Chinese. Asian Pac. J. Cancer Prev. 2014, 15, 3129–3132. [Google Scholar] [CrossRef] [Green Version]
- Qu, Y.; Qu, H.; Luo, M.; Wang, P.; Song, C.; Wang, K.; Zhang, J.; Dai, L. MicroRNAs related polymorphisms and genetic susceptibility to esophageal squamous cell carcinoma. Mol. Genet. Genom. 2014, 289, 1123–1130. [Google Scholar] [CrossRef] [PubMed]
- Liu, J.; Liu, J.; Wei, M.; He, Y.; Liao, B.; Liao, G.; Li, H.; Huang, J. Genetic variants in the microRNA machinery gene GEMIN4 are associated with risk of prostate cancer: A case-control study of the Chinese Han population. DNA Cell Biol. 2012, 31, 1296–1302. [Google Scholar] [CrossRef] [PubMed] [Green Version]
- Sung, H.; Lee, K.M.; Choi, J.Y.; Han, S.; Lee, J.Y.; Li, L.; Park, S.K.; Yoo, K.Y.; Noh, D.Y.; Ahn, S.H.; et al. Common genetic polymorphisms of microRNA biogenesis pathway genes and risk of breast cancer: A case-control study in Korea. Breast Cancer Res. Treat. 2011, 130, 939–951. [Google Scholar] [CrossRef]
- Ye, Y.; Wang, K.K.; Gu, J.; Yang, H.; Lin, J.; Ajani, J.A.; Wu, X. Genetic variations in microRNA-related genes are novel susceptibility loci for esophageal cancer risk. Cancer Prev. Res. 2008, 1, 460–469. [Google Scholar] [CrossRef] [Green Version]
- Mullany, L.E.; Herrick, J.S.; Wolff, R.K.; Buas, M.F.; Slattery, M.L. Impact of polymorphisms in microRNA biogenesis genes on colon cancer risk and microRNA expression levels: A population-based, case-control study. BMC Med. Genom. 2016, 9, 21. [Google Scholar] [CrossRef] [Green Version]
- Rakheja, D.; Chen, K.S.; Liu, Y.; Shukla, A.A.; Schmid, V.; Chang, T.-C.; Khokhar, S.; Wickiser, J.E.; Karandikar, N.J.; Malter, J.S. Somatic mutations in DROSHA and DICER1 impair microRNA biogenesis through distinct mechanisms in Wilms tumours. Nat. Commun. 2014, 5, 4802. [Google Scholar] [CrossRef] [Green Version]
- Lin, R.J.; Lin, Y.C.; Chen, J.; Kuo, H.H.; Chen, Y.Y.; Diccianni, M.B.; London, W.B.; Chang, C.H.; Yu, A.L. microRNA signature and expression of Dicer and Drosha can predict prognosis and delineate risk groups in neuroblastoma. Cancer Res. 2010, 70, 7841–7850. [Google Scholar] [CrossRef] [PubMed] [Green Version]
- Yang, J.-S.; Lai, E.C. Alternative miRNA Biogenesis Pathways and the Interpretation of Core miRNA Pathway Mutants. Mol. Cell 2011, 43, 892–903. [Google Scholar] [CrossRef] [PubMed] [Green Version]
- Bollaert, E.; de Rocca Serra, A.; Demoulin, J.B. The HMG box transcription factor HBP1: A cell cycle inhibitor at the crossroads of cancer signaling pathways. Cell. Mol. Life Sci. 2019, 76, 1529–1539. [Google Scholar] [CrossRef]
- Wen, J.; Lv, Z.; Ding, H.; Fang, X.; Sun, M. Association of miRNA biosynthesis genes DROSHA and DGCR8 polymorphisms with cancer susceptibility: A systematic review and meta-analysis. Biosci. Rep. 2018, 38, BSR20180072. [Google Scholar] [CrossRef] [Green Version]
- Dedes, K.J.; Natrajan, R.; Lambros, M.B.; Geyer, F.C.; Lopez-Garcia, M.A.; Savage, K.; Jones, R.L.; Reis-Filho, J.S. Down-regulation of the miRNA master regulators Drosha and Dicer is associated with specific subgroups of breast cancer. Eur. J. Cancer 2011, 47, 138–150. [Google Scholar] [CrossRef] [PubMed]
- Murabito, J.M.; Rosenberg, C.L.; Finger, D.; Kreger, B.E.; Levy, D.; Splansky, G.L.; Antman, K.; Hwang, S.J. A genome-wide association study of breast and prostate cancer in the NHLBI’s Framingham Heart Study. BMC Med. Genet. 2007, 8 (Suppl. S1), S6. [Google Scholar] [CrossRef] [PubMed] [Green Version]
- Shao, Y.; Shen, Y.; Zhao, L.; Guo, X.; Niu, C.; Liu, F. Association of microRNA biosynthesis genes XPO5 and RAN polymorphisms with cancer susceptibility: Bayesian hierarchical meta-analysis. J. Cancer 2020, 11, 2181–2191. [Google Scholar] [CrossRef] [PubMed]
- Salinas-Jazmín, N.; Rosas-Cruz, A.; Velasco-Velázquez, M. Reporter gene systems for the identification and characterization of cancer stem cells. World J. Stem Cells 2021, 13, 861–876. [Google Scholar] [CrossRef] [PubMed]
- Barrington, C.; Georgopoulou, D.; Pezic, D.; Varsally, W.; Herrero, J.; Hadjur, S. Enhancer accessibility and CTCF occupancy underlie asymmetric TAD architecture and cell type specific genome topology. Nat. Commun. 2019, 10, 2908. [Google Scholar] [CrossRef] [Green Version]
- Liao, Y.; Liao, Y.; Li, J.; Liu, L.; Li, J.; Wan, Y.; Peng, L. Genetic variants in miRNA machinery genes associated with clinicopathological characteristics and outcomes of gastric cancer patients. Int. J. Biol. Markers 2018, 33, 301–307. [Google Scholar] [CrossRef] [Green Version]
- Solarski, M.; Rotondo, F.; Foulkes, W.D.; Priest, J.R.; Syro, L.V.; Butz, H.; Cusimano, M.D.; Kovacs, K. DICER1 gene mutations in endocrine tumors. Endocr.-Relat. Cancer 2018, 25, R197–R208. [Google Scholar] [CrossRef]
- Heravi-Moussavi, A.; Anglesio, M.S.; Cheng, S.W.; Senz, J.; Yang, W.; Prentice, L.; Fejes, A.P.; Chow, C.; Tone, A.; Kalloger, S.E.; et al. Recurrent somatic DICER1 mutations in nonepithelial ovarian cancers. N. Engl. J. Med. 2012, 366, 234–242. [Google Scholar] [CrossRef]
- Lee, J.C.; Villanueva-Meyer, J.E.; Ferris, S.P.; Sloan, E.A.; Hofmann, J.W.; Hattab, E.M.; Williams, B.J.; Guo, H.; Torkildson, J.; Florez, A.; et al. Primary intracranial sarcomas with DICER1 mutation often contain prominent eosinophilic cytoplasmic globules and can occur in the setting of neurofibromatosis type 1. Acta Neuropathol. 2019, 137, 521–525. [Google Scholar] [CrossRef] [PubMed]
- Huang, H.; Yu, X.; Han, X.; Hao, J.; Zhao, J.; Bebek, G.; Bao, S.; Prayson, R.A.; Khalil, A.M.; Jankowsky, E.; et al. Piwil1 Regulates Glioma Stem Cell Maintenance and Glioblastoma Progression. Cell Rep. 2021, 34, 108522. [Google Scholar] [CrossRef]
- Torrezan, G.T.; Ferreira, E.N.; Nakahata, A.M.; Barros, B.D.; Castro, M.T.; Correa, B.R.; Krepischi, A.C.; Olivieri, E.H.; Cunha, I.W.; Tabori, U.; et al. Recurrent somatic mutation in DROSHA induces microRNA profile changes in Wilms tumour. Nat. Commun. 2014, 5, 4039. [Google Scholar] [CrossRef]
- Galka-Marciniak, P.; Urbanek-Trzeciak, M.O.; Nawrocka, P.M.; Kozlowski, P. A pan-cancer atlas of somatic mutations in miRNA biogenesis genes. Nucleic Acids Res. 2021, 49, 601–620. [Google Scholar] [CrossRef]


Disclaimer/Publisher’s Note: The statements, opinions and data contained in all publications are solely those of the individual author(s) and contributor(s) and not of MDPI and/or the editor(s). MDPI and/or the editor(s) disclaim responsibility for any injury to people or property resulting from any ideas, methods, instructions or products referred to in the content. |
© 2023 by the authors. Licensee MDPI, Basel, Switzerland. This article is an open access article distributed under the terms and conditions of the Creative Commons Attribution (CC BY) license (https://creativecommons.org/licenses/by/4.0/).
Share and Cite
Elshazli, R.M.; Toraih, E.A.; Hussein, M.H.; Ruiz, E.M.; Kandil, E.; Fawzy, M.S. Pan-Cancer Study on Variants of Canonical miRNA Biogenesis Pathway Components: A Pooled Analysis. Cancers 2023, 15, 338. https://doi.org/10.3390/cancers15020338
Elshazli RM, Toraih EA, Hussein MH, Ruiz EM, Kandil E, Fawzy MS. Pan-Cancer Study on Variants of Canonical miRNA Biogenesis Pathway Components: A Pooled Analysis. Cancers. 2023; 15(2):338. https://doi.org/10.3390/cancers15020338
Chicago/Turabian StyleElshazli, Rami M., Eman A. Toraih, Mohammad H. Hussein, Emmanuelle M. Ruiz, Emad Kandil, and Manal S. Fawzy. 2023. "Pan-Cancer Study on Variants of Canonical miRNA Biogenesis Pathway Components: A Pooled Analysis" Cancers 15, no. 2: 338. https://doi.org/10.3390/cancers15020338