Evaluating Nutrient-Based Indices against Food- and Diet-Based Indices to Assess the Health Potential of Foods: How Does the Australian Health Star Rating System Perform after Five Years?


Abstract
:1. Introduction
2. Materials and Methods
2.1. Data Collection
2.2. Nutrition Classification Schemes’ Categorisation of a Food’s Health Potential
2.2.1. HSR Classification Scheme
2.2.2. NOVA Classification Scheme
2.2.3. ADG Classification Scheme
2.3. Statistical Analysis
3. Results
3.1. Comparison of the HSR System with NOVA
3.2. Comparison of the HSR System with the Australian Dietary Guidelines
4. Discussion
5. Conclusions
Supplementary Materials
Author Contributions
Funding
Acknowledgments
Conflicts of Interest
References
- Afshin, A.; Sur, P.J.; Fay, K.A.; Cornaby, L.; Ferrara, G.; Salama, J.S.; Mullany, E.C.; Abate, K.H.; Abbafati, C.; Abebe, Z.; et al. Health effects of dietary risks in 195 countries, 1990–2017: A systematic analysis for the Global Burden of Disease Study 2017. Lancet 2019, 393, 1958–1972. [Google Scholar] [CrossRef] [Green Version]
- Food and Agricultural Organization of the United Nations; World Health Organization. Second International Conference on Nutrition—Conference Outcome Document: Framework for action. Proceedings of Second International Conference on Nutrition, Rome, Italy, 19–21 November 2014. [Google Scholar]
- The World Health Organization. Report of the Commission on Ending Childhood Obesity; The World Health Organization: Geneva, Switzerland, 2016; Available online: http://www.who.int/end-childhood-obesity/publications/echo-report/en/ (accessed on 5 April 2020).
- World Cancer Research Fund International. Nourishing Framework. Available online: http://www.wcrf.org/int/policy/nourishing-framework (accessed on 12 March 2020).
- World Health Organization. Global Action Plan for the Prevention and Control of NCDs 2013–2020; World Health Organization: Geneva, Switzerland, 2013; Available online: https://www.who.int/nmh/events/ncd_action_plan/en/ (accessed on 5 April 2020).
- Stok, F.M.; Renner, B.; Allan, J.; Boeing, H.; Ensenauer, R.; Issanchou, S.; Kiesswetter, E.; Lien, N.; Mazzocchi, M.; Monsivais, P.; et al. Dietary Behavior: An Interdisciplinary Conceptual Analysis and Taxonomy. Front. Psychol. 2018, 9. [Google Scholar] [CrossRef] [Green Version]
- Cespedes, E.M.; Hu, F.B. Dietary patterns: From nutritional epidemiologic analysis to national guidelines. Am. J. Clin. Nutr. 2015, 101, 899–900. [Google Scholar] [CrossRef] [Green Version]
- Tapsell, L.C.; Neale, E.P.; Satija, A.; Hu, F.B. Foods, Nutrients, and Dietary Patterns: Interconnections and Implications for Dietary Guidelines. Adv. Nutr. 2016, 7, 445–454. [Google Scholar] [CrossRef] [PubMed]
- World Health Organization. Nutrient Profiling: Report of a WHO/IASO Technical Meeting, London, United Kingdom, 4–6 October 2010. 2011. Available online: http://www.who.int/nutrition/publications/profiling/WHO_IASO_report2010/en/ (accessed on 5 April 2020).
- World Health Organization. Set of Recommendations for the Marketing of Foods and Non-Alcoholic Beverages to Children; WHO: Geneva, Switzerland, 2010; Available online: https://apps.who.int/iris/bitstream/handle/10665/44416/9789241500210_eng.pdf?sequence=1 (accessed on 20 February 2019).
- World Cancer Research Fund International. Building Momentum: Lessons on Implementing Robust Restrictions of Food and Non-Alcoholic Beverage Marketing to Children. 2020. Available online: http://wcrf.org/buildingmomentum (accessed on 5 April 2020).
- Labonté, M.È.; Poon, T.; Gladanac, B.; Ahmed, M.; Franco-Arellano, B.; Rayner, M.; L’Abbé, M.R. Nutrient Profile Models with Applications in Government-Led Nutrition Policies Aimed at Health Promotion and Noncommunicable Disease Prevention: A Systematic Review. Adv. Nutr. 2018, 9, 741–788. [Google Scholar] [CrossRef] [Green Version]
- Department of Health and Social Care United Kingdom. The Nutrient Profiling Model. Available online: https://www.gov.uk/government/publications/the-nutrient-profiling-model (accessed on 5 April 2020).
- Food Standards Australia New Zealand. Overview of the Nutrient Profiling Scoring Criteria. Available online: http://www.foodstandards.gov.au/industry/labelling/Pages/Consumer-guide-to-NPSC.aspx (accessed on 12 March 2020).
- Joint WHO/FAO Food Standards Programme Codex Committee on Nutrition and Foods for Special Dietary Uses. Discussion Paper on General Guidelines to Establish Nutrient Profiles for Foods Labelling Rome. 2019. Available online: http://www.fao.org/fao-who-codexalimentarius/sh-proxy/en/?lnk=1&url=https%253A%252F%252Fworkspace.fao.org%252Fsites%252Fcodex%252FMeetings%252FCX-720-40%252FWD%252Fnf40_13e.pdf (accessed on 28 January 2020).
- Julia, C.; Etilé, F.; Hercberg, S. Front-of-pack Nutri-Score labelling in France: An evidence-based policy. Lancet Public Health 2018, 3, e164. [Google Scholar] [CrossRef] [Green Version]
- Sacks, G.; Rayner, M.; Swinburn, B. Impact of front-of-pack ‘traffic-light’ nutrition labelling on consumer food purchases in the UK. Health Promot. Int. 2009, 24, 344–352. [Google Scholar] [CrossRef] [Green Version]
- Freire, W.B.; Waters, W.F.; Rivas-Mariño, G.; Nguyen, T.; Rivas, P. A qualitative study of consumer perceptions and use of traffic light food labelling in Ecuador. Public Health Nutr. 2017, 20, 805–813. [Google Scholar] [CrossRef] [Green Version]
- Corvalan, C.; Reyes, M.; Garmendia, M.L.; Uauy, R. Structural responses to the obesity and non-communicable diseases epidemic: Update on the Chilean law of food labelling and advertising. Obes. Rev. 2019, 20, 367. [Google Scholar] [CrossRef]
- Ministry of Health: State of Israel. The Red Labels: Harmful Food Labelling. Available online: https://www.health.gov.il/English/Topics/FoodAndNutrition/Nutrition/Adequate_nutrition/Pages/FoodLabeling.aspx (accessed on 24 March 2020).
- Department of Health. About Health Star Ratings. Available online: http://healthstarrating.gov.au/internet/healthstarrating/publishing.nsf/Content/About-health-stars (accessed on 24 March 2020).
- Deschasaux, M.; Srour, B.; Kesse-Guyot, E.; Latino-Martel, P.; Touvier, M.; Julia, C.; Hercberg, S.; Kyrø, C.; Olsen, A.; Affret, A.; et al. Nutritional quality of food as represented by the FSAm-NPS nutrient profiling system underlying the Nutri-Score label and cancer risk in Europe: Results from the EPIC prospective cohort study. PLoS Med. 2018, 15, e1002651. [Google Scholar] [CrossRef] [Green Version]
- Donnenfeld, M.; Julia, C.; Kesse-Guyot, E.; Méjean, C.; Ducrot, P.; Péneau, S.; Deschasaux, M.; Latino-Martel, P.; Fezeu, L.; Hercberg, S.; et al. Prospective association between cancer risk and an individual dietary index based on the British Food Standards Agency Nutrient Profiling System. Br. J. Nutr. 2015, 114, 1702–1710. [Google Scholar] [CrossRef] [PubMed] [Green Version]
- Adriouch, S.; Julia, C.; Kesse-Guyot, E.; Méjean, C.; Ducrot, P.; Péneau, S.; Donnenfeld, M.; Deschasaux, M.; Menai, M.; Hercberg, S.; et al. Prospective association between a dietary quality index based on a nutrient profiling system and cardiovascular disease risk. Eur. J. Prev. Cardiol. 2016, 23, 1669–1676. [Google Scholar] [CrossRef]
- Adriouch, S.; Julia, C.; Kesse-Guyot, E.; Ducrot, P.; Péneau, S.; Méjean, C.; Assmann, K.E.; Deschasaux, M.; Hercberg, S.; Touvier, M.; et al. Association between a dietary quality index based on the food standard agency nutrient profiling system and cardiovascular disease risk among French adults. Int. J. Cardiol. 2017, 234, 22–27. [Google Scholar] [CrossRef] [PubMed]
- Monteiro, C.; Cannon, C.; Lawrence, M.; Costa Louzada, M.; Pereira Machado, P. Ultra-Processed Foods, Diet Quality, and Health Using the NOVA Classification System, Rome. 2019. Available online: http://www.fao.org/3/ca5644en/ca5644en.pdf (accessed on 28 January 2020).
- Srour, B.; Fezeu, L.K.; Kesse-Guyot, E.; Allès, B.; Méjean, C.; Andrianasolo, R.M.; Chazelas, E.; Deschasaux, M.; Hercberg, S.; Galan, P.; et al. Ultra-processed food intake and risk of cardiovascular disease: Prospective cohort study (NutriNet-Santé). BMJ 2019, 365, l1451. [Google Scholar] [CrossRef] [PubMed] [Green Version]
- Fiolet, T.; Srour, B.; Sellem, L.; Kesse-Guyot, E.; Allès, B.; Méjean, C.; Deschasaux, M.; Fassier, P.; Latino-Martel, P.; Beslay, M.; et al. Consumption of ultra-processed foods and cancer risk: Results from NutriNet-Santé prospective cohort. BMJ 2018, 360, k322. [Google Scholar] [CrossRef] [PubMed] [Green Version]
- Adjibade, M.; Julia, C.; Allès, B.; Touvier, M.; Lemogne, C.; Srour, B.; Hercberg, S.; Galan, P.; Assmann, K.E.; Kesse-Guyot, E. Prospective association between ultra-processed food consumption and incident depressive symptoms in the French NutriNet-Santé cohort. BMC Med. 2019, 17. [Google Scholar] [CrossRef] [Green Version]
- Schnabel, L.; Buscail, C.; Sabate, J.M.; Bouchoucha, M.; Kesse-Guyot, E.; Allès, B.; Touvier, M.; Monteiro, C.A.; Hercberg, S.; Benamouzig, R.; et al. Association Between Ultra-Processed Food Consumption and Functional Gastrointestinal Disorders: Results From the French NutriNet-Santé Cohort. Am. J. Gastroenterol. 2018, 113, 1217–1228. [Google Scholar] [CrossRef]
- Rico-Campa, A.; Martinez-Gonzalez, M.A.; Alvarez-Alvarez, I.; De Deus Mendonca, R.; De la Fuente-Arrillaga, C.; Gomez-Donoso, C.; Bes-Rastrollo, M. Association between consumption of ultra-processed foods and all cause mortality: SUN prospective cohort study. BMJ 2019, 365. [Google Scholar] [CrossRef] [Green Version]
- Hall, K.D.; Ayuketah, A.; Brychta, R.; Cai, H.; Cassimatis, T.; Chen, K.Y.; Chung, S.T.; Costa, E.; Courville, A.; Darcey, V.; et al. Ultra-Processed Diets Cause Excess Calorie Intake and Weight Gain: An Inpatient Randomized Controlled Trial of Ad Libitum Food Intake. Cell Metab. 2019, 30, 67–77. [Google Scholar] [CrossRef] [Green Version]
- Australian Bureau of Statistics. Australian Health Survey Users’ Guide, 2011–2013. Cat. 4363.0.55.001. Available online: http://www.abs.gov.au/ausstats/[email protected]/Lookup/4363.0.55.001Chapter65062011-13 (accessed on 12 March 2020).
- National Health and Medical Research Council. Australian Dietary Guidelines; National Health and Medical Research Council: Canberra, Australia, 2013. Available online: https://www.nhmrc.gov.au/_files_nhmrc/file/publications/n55_australian_dietary_guidelines1.pdf (accessed on 26 February 2018).
- Chiavaroli, L.; Viguiliouk, E.; Nishi, S.K.; Mejia, S.B.; Rahelic, D.; Kahleova, H.; Salas-Salvado, J.; Kendall, C.W.C.; Sievenpiper, J.L. DASH Dietary Pattern and Cardiometabolic Outcomes: An Umbrella Review of Systematic Reviews and Meta-Analyses. Nutrients 2019, 11, 338. [Google Scholar] [CrossRef] [Green Version]
- Salas-Salvadó, J.; Becerra-Tomás, N.; García-Gavilán, J.F.; Bulló, M.; Barrubés, L. Mediterranean Diet and Cardiovascular Disease Prevention: What Do We Know? Prog. Cardiovasc. Dis. 2018, 61, 62–67. [Google Scholar] [CrossRef] [PubMed]
- Onvani, S.; Haghighatdoost, F.; Surkan, P.J.; Larijani, B.; Azadbakht, L. Adherence to the Healthy Eating Index and Alternative Healthy Eating Index dietary patterns and mortality from all causes, cardiovascular disease and cancer: A meta-analysis of observational studies. J. Hum. Nutr. Diet. 2017, 30, 216–226. [Google Scholar] [CrossRef] [PubMed]
- Qian, F.; Liu, G.; Hu, F.B.; Bhupathiraju, S.N.; Sun, Q. Association between Plant-Based Dietary Patterns and Risk of Type 2 Diabetes: A Systematic Review and Meta-analysis. JAMA Intern. Med. 2019, 179, 1335–1344. [Google Scholar] [CrossRef] [PubMed]
- Secretariat, F.R. Legislative and Governance Forum on Food Regulation Communique 27 June 2014. Available online: https://foodregulation.gov.au/internet/fr/publishing.nsf/Content/forum-communique-2014-June (accessed on 10 March 2020).
- MP Consulting. Health Star Rating System Five Year Review Report. 2019. Available online: http://www.healthstarrating.gov.au/internet/healthstarrating/publishing.nsf/Content/D1562AA78A574853CA2581BD00828751/$File/Health-Star-Rating-System-Five-Year-Review-Report.pdf (accessed on 10 March 2020).
- Hamlin, R.; McNeill, L. The Impact of the Australasian ‘Health Star Rating’, Front-of-Pack Nutritional Label, on Consumer Choice: A Longitudinal Study. Nutrients 2018, 10, 906. [Google Scholar] [CrossRef] [PubMed] [Green Version]
- Pettigrew, S.; Talati, Z.; Miller, C.; Dixon, H.; Kelly, B.; Ball, K. The types and aspects of front-of-pack food labelling schemes preferred by adults and children. Appetite 2017, 115. [Google Scholar] [CrossRef] [PubMed] [Green Version]
- MP Consulting. Report on Submissions to the Five Year Review of Teh Health Star Rating System: Report Prepared for The Department of Health October 2017. 2017. Available online: http://www.healthstarrating.gov.au/internet/healthstarrating/publishing.nsf/Content/formal-review-of-the-system-after-five-years (accessed on 28 January 2020).
- Department of Health, Australia, D.O.H. Reviews of the Health Star Rating System. Available online: http://healthstarrating.gov.au/internet/healthstarrating/publishing.nsf/Content/reviews (accessed on 9 April 2020).
- Dickie, S.; Woods, J.L.; Lawrence, M. Analysing the use of the Australian Health Star Rating system by level of food processing. Int. J. Behav. Nutr. Phys. Act. 2018, 15, 128. [Google Scholar] [CrossRef]
- Lawrence, A.M.; Dickie, S.; Woods, L.J. Do Nutrient-Based Front-of-Pack Labelling Schemes Support or Undermine Food-Based Dietary Guideline Recommendations? Lessons from the Australian Health Star Rating System. Nutrients 2018, 10, 32. [Google Scholar] [CrossRef] [Green Version]
- Ares, G.; Varela, F.; Machin, L.; Antúnez, L.; Giménez, A.; Curutchet, M.R.; Aschemann-Witzel, J. Comparative performance of three interpretative front-of-pack nutrition labelling schemes: Insights for policy making. Food Qual. Prefer. 2018, 68, 215–225. [Google Scholar] [CrossRef]
- Jones, A.; Rådholm, K.; Neal, B. Defining ‘Unhealthy’: A Systematic Analysis of Alignment between the Australian Dietary Guidelines and the Health Star Rating System. Nutrients 2018, 10, 501. [Google Scholar] [CrossRef] [Green Version]
- Dunford, E.; Cobcroft, M.; Thomas, M.; Wu, J. Technical Report: Alignment of NSW Healthy Food Provision Policy with the Health Star Rating System; NSW Ministry of Health: Sydney, Australia, 2015. Available online: http://www.health.nsw.gov.au/heal/Publications/health-star-rating-system.pdf (accessed on 6 April 2020).
- Menday, H.; Neal, B.; Wu, J.H.Y.; Crino, M.; Baines, S.; Petersen, K.S. Use of Added Sugars Instead of Total Sugars May Improve the Capacity of the Health Star Rating System to Discriminate between Core and Discretionary Foods. J. Acad. Nutr. Diet. 2017, 117, 1921–1930. [Google Scholar] [CrossRef]
- Crino, M.; Sacks, G.; Dunford, E.; Trieu, K.; Webster, J.; Vandevijvere, S.; Swinburn, B.; Wu, J.; Neal, B. Measuring the Healthiness of the Packaged Food Supply in Australia. Nutrients 2018, 10, 702. [Google Scholar] [CrossRef] [PubMed] [Green Version]
- Söderlund, F.; Eyles, H.; Mhurchu, C.N. Stars versus warnings: Comparison of the Australasian Health Star Rating nutrition labelling system with Chilean Warning Labels. Aust. N. Z. J. Public Health 2019. [Google Scholar] [CrossRef] [PubMed] [Green Version]
- Monteiro, C.A.; Cannon, G.; Levy, R.B.; Moubarac, J.C.; Louzada, M.L.C.; Rauber, F.; Khandpur, N.; Cediel, G.; Neri, D.; Martinez-Steele, E.; et al. Ultra-processed foods: What they are and how to identify them. Public Health Nutr. 2019, 1–6. [Google Scholar] [CrossRef] [PubMed]
- Machado, P.P.; Steele, E.M.; Levy, R.B.; Sui, Z.X.; Rangan, A.; Woods, J.; Gill, T.; Scrinis, G.; Monteiro, C.A. Ultra-processed foods and recommended intake levels of nutrients linked to non-communicable diseases in Australia: Evidence from a nationally representative cross-sectional study. BMJ Open 2019, 9, 12. [Google Scholar] [CrossRef] [Green Version]
- National Health and Medical Research Council. Australian Guide to Healthy Eating. Available online: https://www.eatforhealth.gov.au/guidelines/australian-guide-healthy-eating (accessed on 11 February 2020).
- National Health and Medical Research Council. Australian Dietary Guidelines: Educator Guide. Available online: https://eatforhealth.govcms.gov.au/sites/default/files/content/The%20Guidelines/n55b_educator_guide_140321_1.pdf (accessed on 11 February 2020).
- StataCorp. Stata Statistical Software: Release 16; StataCorp LLC: College Station, TX, USA, 2019. [Google Scholar]
- Peters, A.S.; Dunford, E.; Jones, A.; Ni Mhurchu, C.; Crino, M.; Taylor, F.; Woodward, M.; Neal, B. Incorporating Added Sugar Improves the Performance of the Health Star Rating Front-of-Pack Labelling System in Australia. Nutrients 2017, 9, 701. [Google Scholar] [CrossRef] [Green Version]
- Lawrence, M.; Lawrence, A.; Stanton, R.; Pollard, C.; Pulker, C.; Woods, J.; Ashton, B. Letter to the Editor: Interpretive nutrient profiling algorithms are a limited tool for assessing the healthiness of countries’ packaged food and beverage supplies, and the conclusions are not substantiated by the data. Obes. Rev. 2019. [Google Scholar] [CrossRef]
- Talati, Z.; Pettigrew, S.; Kelly, B.; Ball, K.; Dixon, H.; Shilton, T. Consumers’ responses to front-of-pack labels that vary by interpretive content. Appetite 2016, 101, 205–213. [Google Scholar] [CrossRef] [Green Version]
- Hamlin, R.; McNeill, L. Does the Australasian “Health Star Rating” front of pack nutritional label system sork? Nutrients 2016, 8, 327. [Google Scholar] [CrossRef] [Green Version]
- Barabási, A.-L.; Menichetti, G.; Loscalzo, J. The unmapped chemical complexity of our diet. Nat. Food 2020, 1, 33–37. [Google Scholar] [CrossRef] [Green Version]
- Hoffmann, I. Transcending reductionism in nutrition research. Am. J. Clin. Nutr. 2003, 78, 514S–516S. [Google Scholar] [CrossRef] [Green Version]
- Jacobs Jr, D.R.; Gross, M.D.; Tapsell, L.C. Food synergy: An operational concept for understanding nutrition. Am. J. Clin. Nutr. 2009, 89, 1543S–1548S. [Google Scholar] [CrossRef] [PubMed]
- Pelly, F.E.; Swanepoel, L.; Rinella, J.; Cooper, S. Consumers’ perceptions of the australian health star rating labelling scheme. Nutrients 2020, 12, 704. [Google Scholar] [CrossRef] [PubMed] [Green Version]
- Riesenberg, D.; Backholer, K.; Zorbas, C.; Sacks, G.; Paix, A.; Marshall, J.; Blake, M.R.; Bennett, R.; Peeters, A.; Cameron, A.J. Price Promotions by Food Category and Product Healthiness in an Australian Supermarket Chain, 2017–2018. AJPH 2019, 109, 1434–1439. [Google Scholar] [CrossRef]
- Sainsbury, E.; Colagiuri, S.; Magnusson, R. An audit of food and beverage advertising on the Sydney metropolitan train network: Regulation and policy implications. BMC Public Health 2017, 17, 490. [Google Scholar] [CrossRef] [PubMed]
- Smithers, L.G.; Wang, X.; Haag, D.; Lynch, J.; Agnew, B.; Sorell, M. Discretionary food advertising on television in 2017: A descriptive study. Aust. N. Z. J. Public Health 2019, 43, 519–521. [Google Scholar] [CrossRef] [PubMed] [Green Version]
- Pulker, C.E.; Scott, J.A.; Pollard, C.M. Ultra-processed family foods in Australia: Nutrition claims, health claims and marketing techniques. Public Health Nutr. 2017, 1–11. [Google Scholar] [CrossRef] [Green Version]
- Khandpur, N.; Monteiro, C.A.; Swinburn, B. Nutrient-Based Warning Labels May Help in the Pursuit of Healthy Diets. Obesity 2018, 26, 1670–1671. [Google Scholar] [CrossRef] [Green Version]
- Pulker, C.; Trapp, G.; Scott, J.; Pollard, C. Alignment of Supermarket Own Brand Foods’ Front-of-Pack Nutrition Labelling with Measures of Nutritional Quality: An Australian Perspective. Nutrients 2018, 10, 1465. [Google Scholar] [CrossRef] [Green Version]
- Hawkes, C.; Smith, T.G.; Jewell, J.; Wardle, J.; Hammond, R.A.; Friel, S.; Thow, A.M.; Kain, J. Smart food policies for obesity prevention. Lancet 2015, 2410. [Google Scholar] [CrossRef]
- Scrinis, G. Reformulation, fortification and functionalization: Big Food corporations’ nutritional engineering and marketing strategies. J. Peasant Stud. 2016, 43, 17–37. [Google Scholar] [CrossRef]
- Food and Agricultural Organization of the United Nations. Food-Based Dietary Guidelines—Uruguay. Available online: http://www.fao.org/nutrition/education/food-dietary-guidelines/regions/countries/uruguay/en/ (accessed on 12 March 2020).
- Ministry of Health of Brazil. Dietary Guidelines for the Brazilian Population; Ministry of Health of Brazil: Rio de Janeiro, Brazil, 2014. Available online: http://www.fao.org/nutrition/education/food-dietary-guidelines/regions/countries/brazil/en/ (accessed on 6 April 2020).
- Rodrigues, V.M.; Rayner, M.; Fernandes, A.C.; De Oliveira, R.C.; Proenca, R.P.; Fiates, G.M.R. Nutritional quality of packaged foods targeted at children in Brazil: Which ones should be eligible to bear nutrient claims? Int. J. Obes. 2017. [Google Scholar] [CrossRef] [PubMed]
- Arambepola, C.; Scarborough, P.; Rayner, M. Validating a nutrient profile model. Public Health Nutr. 2007, 11, 371–378. [Google Scholar] [CrossRef] [PubMed] [Green Version]
- Food Regulation Secretariat. Australia and New Zealand Ministerial Forum on Food Regulation Communique 29 June 2018. Available online: https://foodregulation.gov.au/internet/fr/publishing.nsf/Content/forum-communique-2018-June (accessed on 12 March 2020).
- Kim, D.H.; Liu, W.G.A.; Rangan, A.; Gemming, L. A comparison of the Health Star Rating and nutrient profiles of branded and generic food products in Sydney supermarkets, Australia. Public Health Nutr. 2019, 22, 2132–2139. [Google Scholar] [CrossRef] [PubMed]
- Gibney, M.J.; Forde, C.G.; Mullally, D.; Gibney, E.R. Ultra-processed foods in human health: A critical appraisal. Am. J. Clin. Nutr. 2017, 106, 717–724. [Google Scholar] [CrossRef] [Green Version]
- Mialon, M.; Serodio, P.M.; Scagliusi, F.B. Criticism of the NOVA classification: Who are the protagonists? World Nutr. 2018, 9, 176–240. [Google Scholar] [CrossRef]
- National Health and Medical Research Council. Discretionary Foods and Drinks Expert Working Group. Available online: https://www.nhmrc.gov.au/about-us/leadership-and-governance/committees/discretionary-foods-and-drinks-expert-working-group (accessed on 17 February 2020).


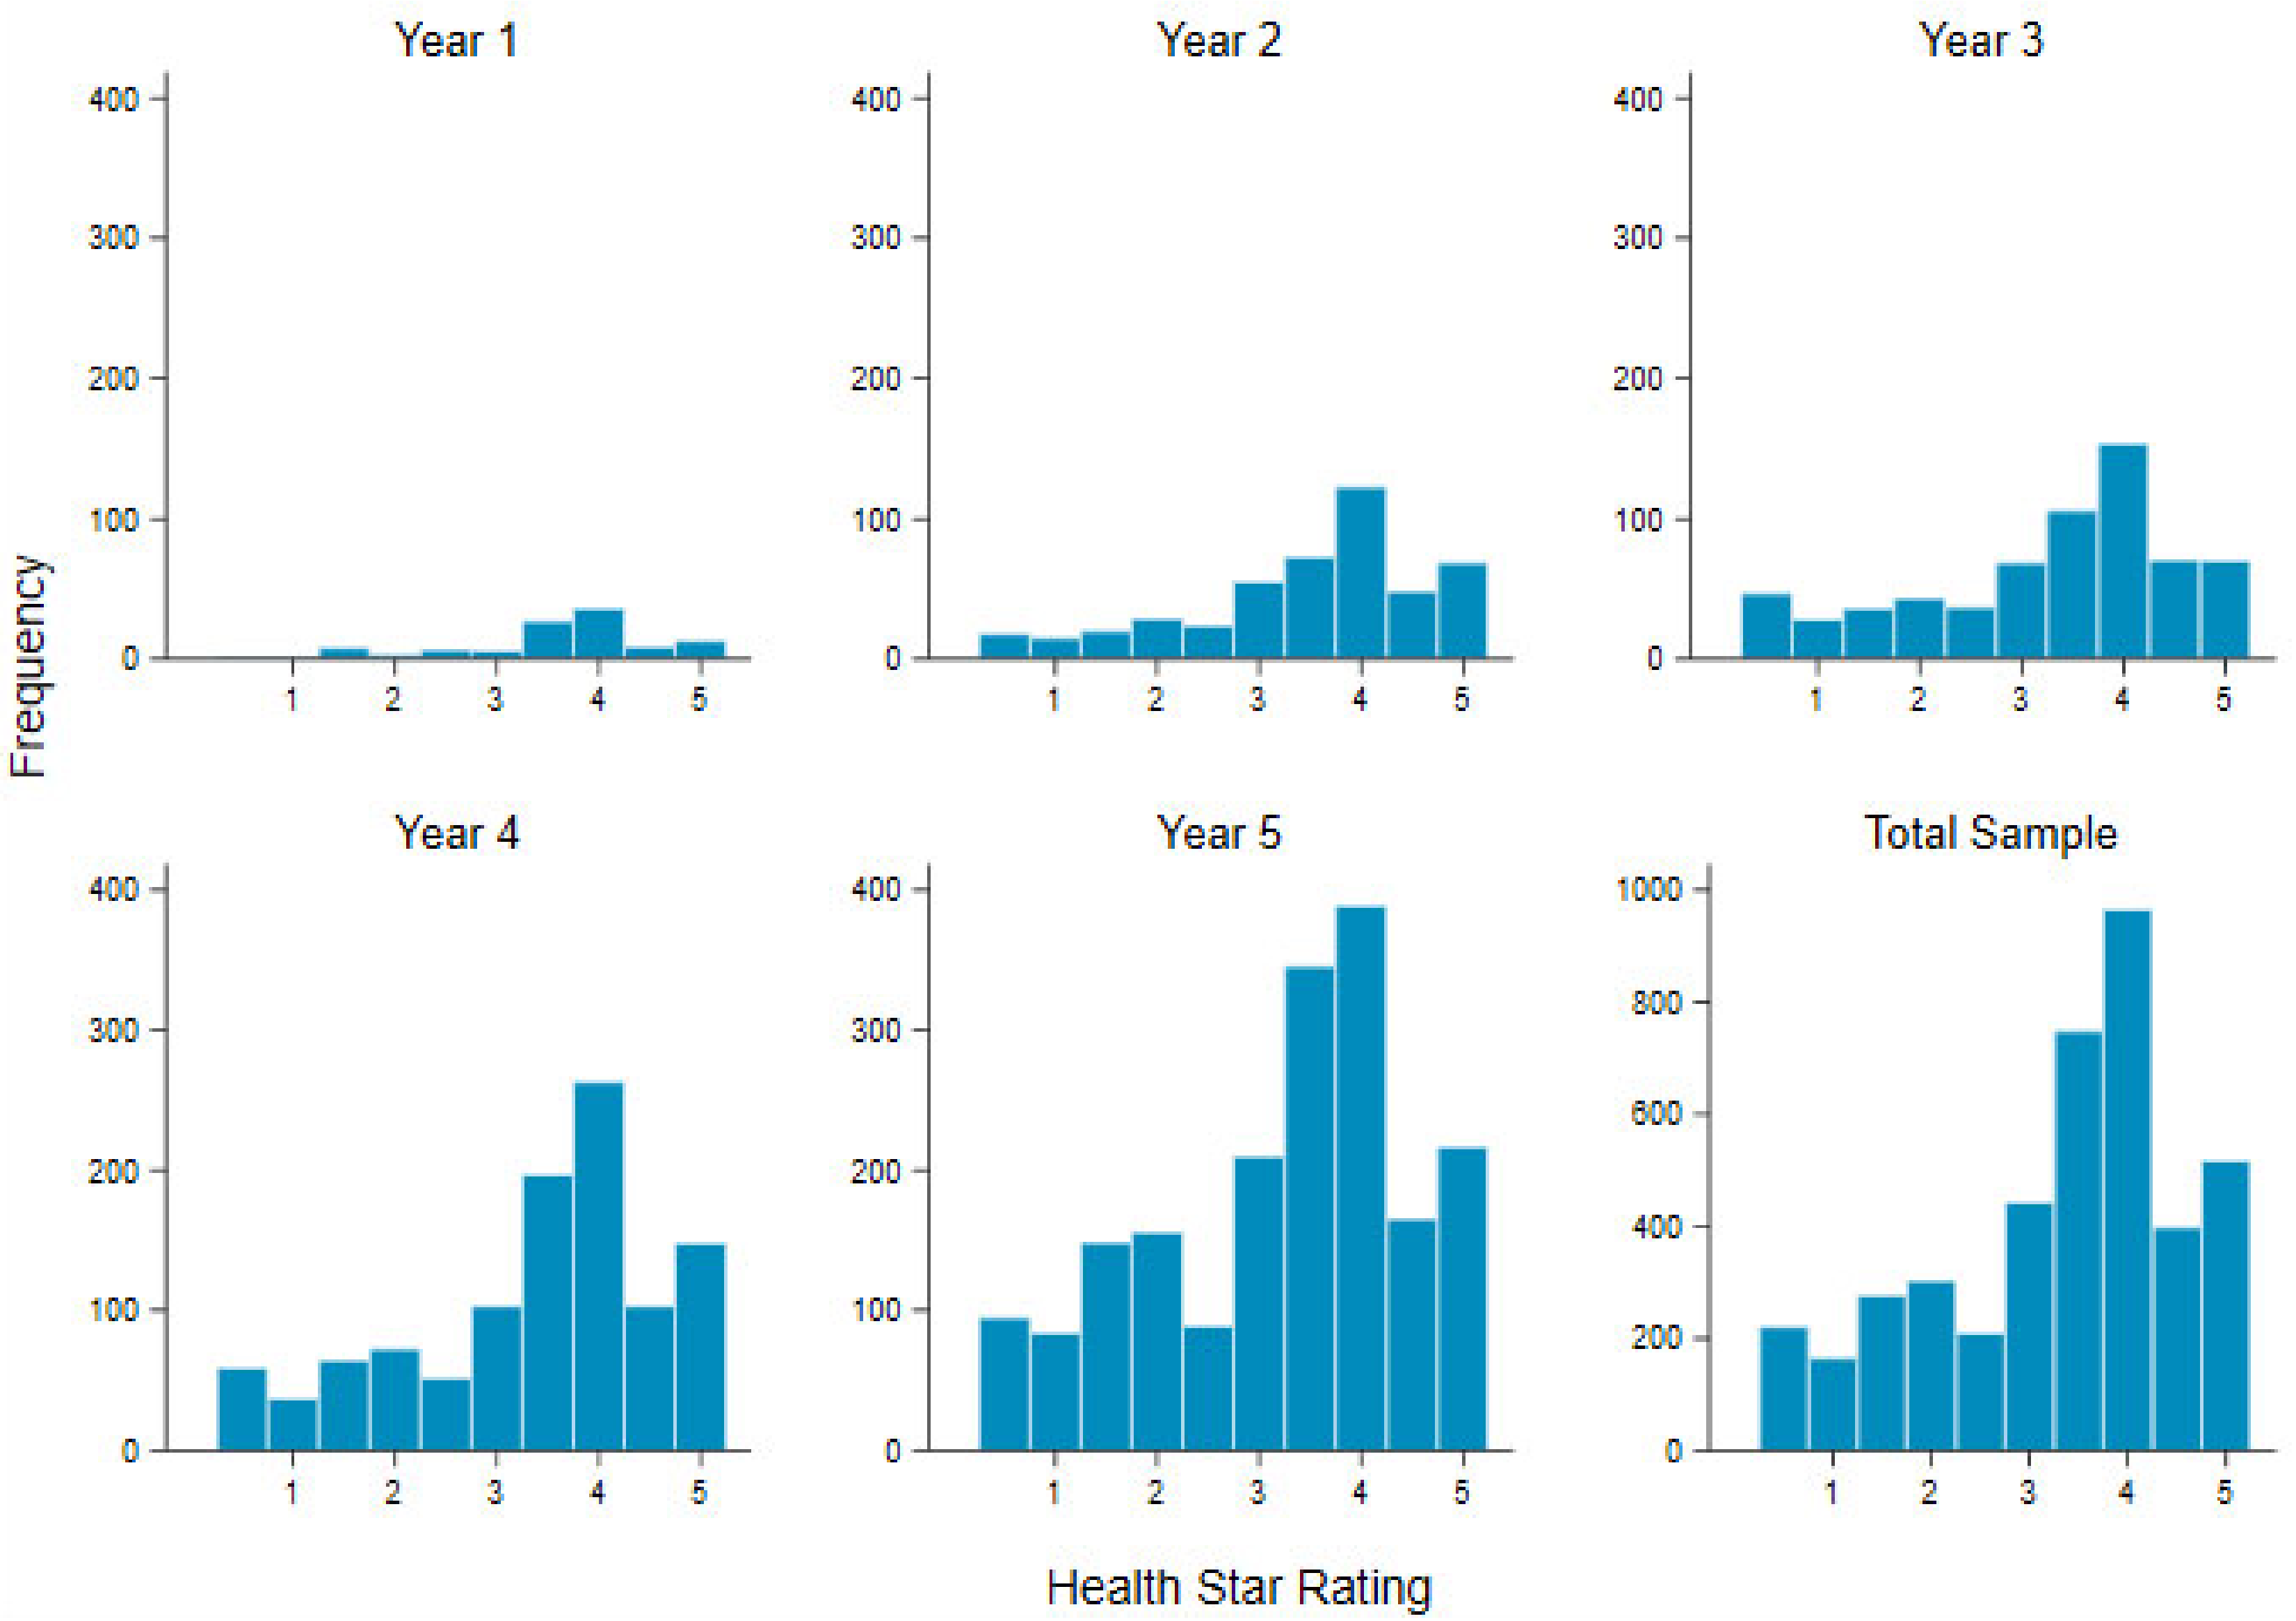
| n (%) | Median HSR | Range | IQR | n HSR ≤ 2 (%) * | n HSR ≥ 2.5 (%) * | n HSR ≥ 3.5 (%) * | |
|---|---|---|---|---|---|---|---|
| Year 1 | 113 (2.7) | 4 | 0.5–5 | 0.5 | 15 (13.3) | 98 (86.7) | 85 (75.2) |
| Year 2 | 475 (11.2) | 4 | 0.5–5 | 1 | 82 (17.3) | 393 (82.7) | 314 (66.1) |
| Year 3 | 662 (15.6) | 3.5 | 0.5–5 | 1.5 | 155 (23.4) | 507 (76.6) | 401 (60.6) |
| Year 4 | 1100 (25.9) | 3.5 | 0.5–5 | 1.5 | 234 (21.3) | 866 (78.7) | 711 (64.6) |
| Year 5 | 1901 (44.7) | 3.5 | 0.5–5 | 2 | 484 (25.5) | 1417 (74.5) | 1118 (58.8) |
| Total | 4251 | 3.5 | 0.5–5 | 1.5 | 970(22.8) | 3281(77.2) | 2629 (61.8) |
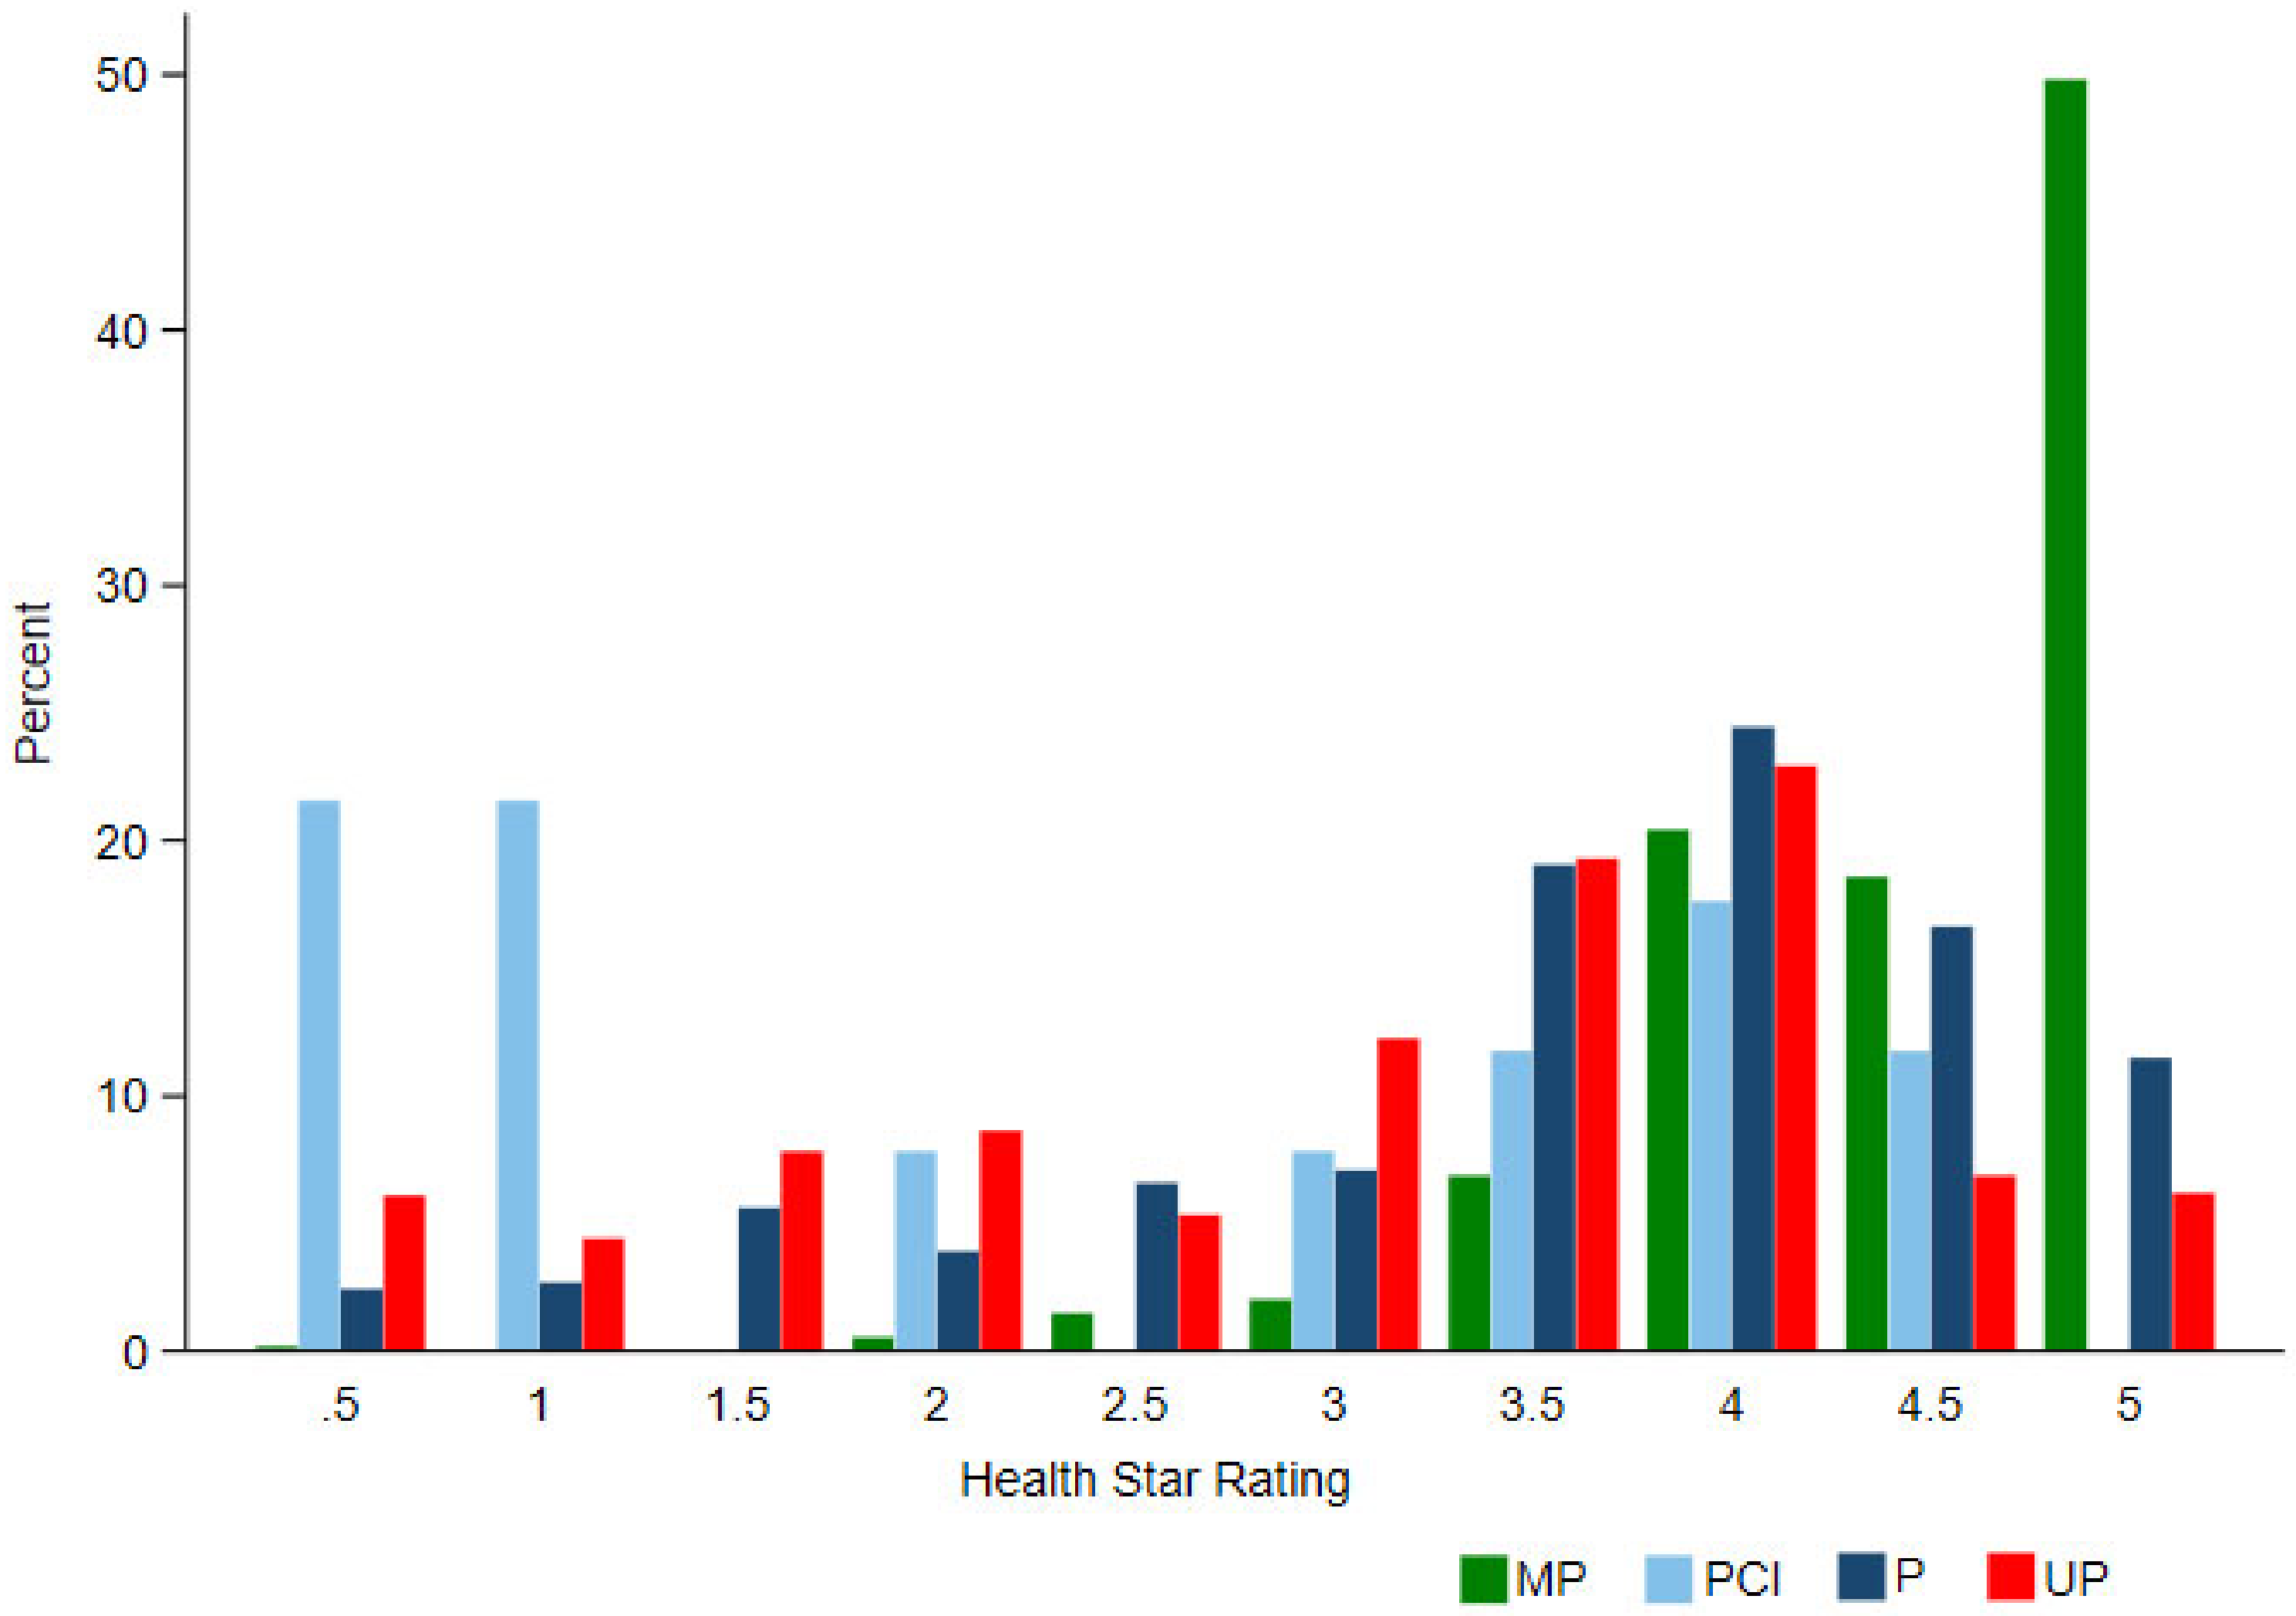
| NOVA | Year | n (%) | HSR Median | HSR Range | IQR | n HSR ≤ 2 (%) * | n HSR ≥ 2.5 (%) * | n HSR ≥ 3.5 (%) * |
|---|---|---|---|---|---|---|---|---|
| MP | Year 1 | 10 | 4 | 3–5 | 1.5 | 0 (0) | 10 (100.0) | 9 (90.0) |
| Year 2 | 44 | 5 | 2–5 | 0.5 | 1 (2.3) | 43 (97.7) | 42 (95.5) | |
| Year 3 | 80 | 4.5 | 0.5–5 | 1 | 1 (1.2) | 79 (98.8) | 76 (95.0) | |
| Year 4 | 151 | 5 | 2–5 | 1 | 1 (0.7) | 150 (99.3) | 146 (96.7) | |
| Year 5 | 253 | 4.5 | 2–5 | 1 | 1 (0.4) | 252 (99.6) | 242 (95.7) | |
| Total | 538 (12.7) | 4.5 | 0.5–5 | 1 | 4 (0.75) | 534 (99.25) | 515 (95.72) | |
| PCI | Year 1 | 1 | 0.5 | 0.5–0.5 | 0 | 1 (100.0) | 0 | 0 |
| Year 2 | 0 | - | - | - | - | - | - | |
| Year 3 | 10 | ** | 0.5–4 | 0.5 | 8 (80.0) | 2 (20.0) | 1 (10.0) | |
| Year 4 | 14 | 3.5 | 1–4.5 | 2 | 5 (35.7) | 9 (64.3) | 8 (57.1) | |
| Year 5 | 182 | 3 | 0.5–4.5 | 3 | 12 (6.6) | 170 (93.4) | 168 (92.3) | |
| Total | 51 (1.2) | 2 | 0.5–4.5 | 3 | 26 (51.00) | 25 (49.0) | 21 (41.2) | |
| P | Year 1 | 9 | 3.5 | 2.5–4.5 | 1.5 | 0 (0) | 9 (100.0) | 6 (6.7) |
| Year 2 | 53 | 4 | 0.5–5 | 1 | 8 (15.1) | 45 (84.9) | 44 (83.0) | |
| Year 3 | 66 | 4 | 0.5–5 | 1 | 8 (12.1) | 58 (87.9) | 55 (83.3) | |
| Year 4 | 97 | 4 | 0.5–5 | 0.5 | 9 (9.3) | 88 (90.7) | 75 (77.3) | |
| Year 5 | 182 | 3.5 | 0.5–5 | 1.5 | 35 (19.2) | 147 (80.8) | 111 (61.0) | |
| Total | 409 (9.6) | 4 | 0.5–5 | 1.5 | 60 (14.7) | 347 (85.3) | 293 (71.6) | |
| Non-UP combined | Year 1 | 20 | ** | 0.5–5 | 1 | 1 (5.0) | 19 (95.0) | 15 (75.0) |
| Year 2 | 97 | 4.5 | 0.5–5 | 1 | 9 (9.3) | 88 (90.7) | 86 (88.7) | |
| Year 3 | 157 | 4.5 | 0.5–5 | 1.5 | 17 (10.8) | 140 (89.2) | 133 (84.7) | |
| Year 4 | 262 | 4.5 | 0.5–5 | 1.5 | 15 (5.7) | 247 (94.3) | 229 (87.4) | |
| Year 5 | 462 | 4 | 0.5–5 | 1.5 | 48 (10.4) | 414 (89.6) | 366 (79.2) | |
| Total | 998 | 4 | 0.5–5 | 1.5 | 90 (9.0) | 908 (91.0) | 829 (83.1) | |
| UP | Year 1 | 93 | 4 | 0.5–5 | 0.5 | 14 (15.1) | 79 (84.9) | 70 (75.3) |
| Year 2 | 378 | 3.5 | 0.5–5 | 1.5 | 73 (19.3) | 305 (80.7) | 228 (60.3) | |
| Year 3 | 506 | 3.5 | 0.5–5 | 2 | 138 (27.3) | 368 (72.7) | 269 (53.1) | |
| Year 4 | 838 | 3.5 | 0.5–5 | 2 | 219 (26.1) | 619 (73.9) | 482 (57.5) | |
| Year 5 | 1440 | 3.5 | 0.5–5 | 2 | 436 (30.3) | 1004 (69.7) | 753 (52.3) | |
| Total | 3253 (76.5) | 3.5 δ | 0.5–5 | 2 | 880 (27.00) | 2375 (73.0) | 1800 (55.3) | |
| Total | 4251 | 3.5 | 0.5–5 | 1.5 | 970 (22.8) | 3281 (77.2) | 2629 (61.8) |
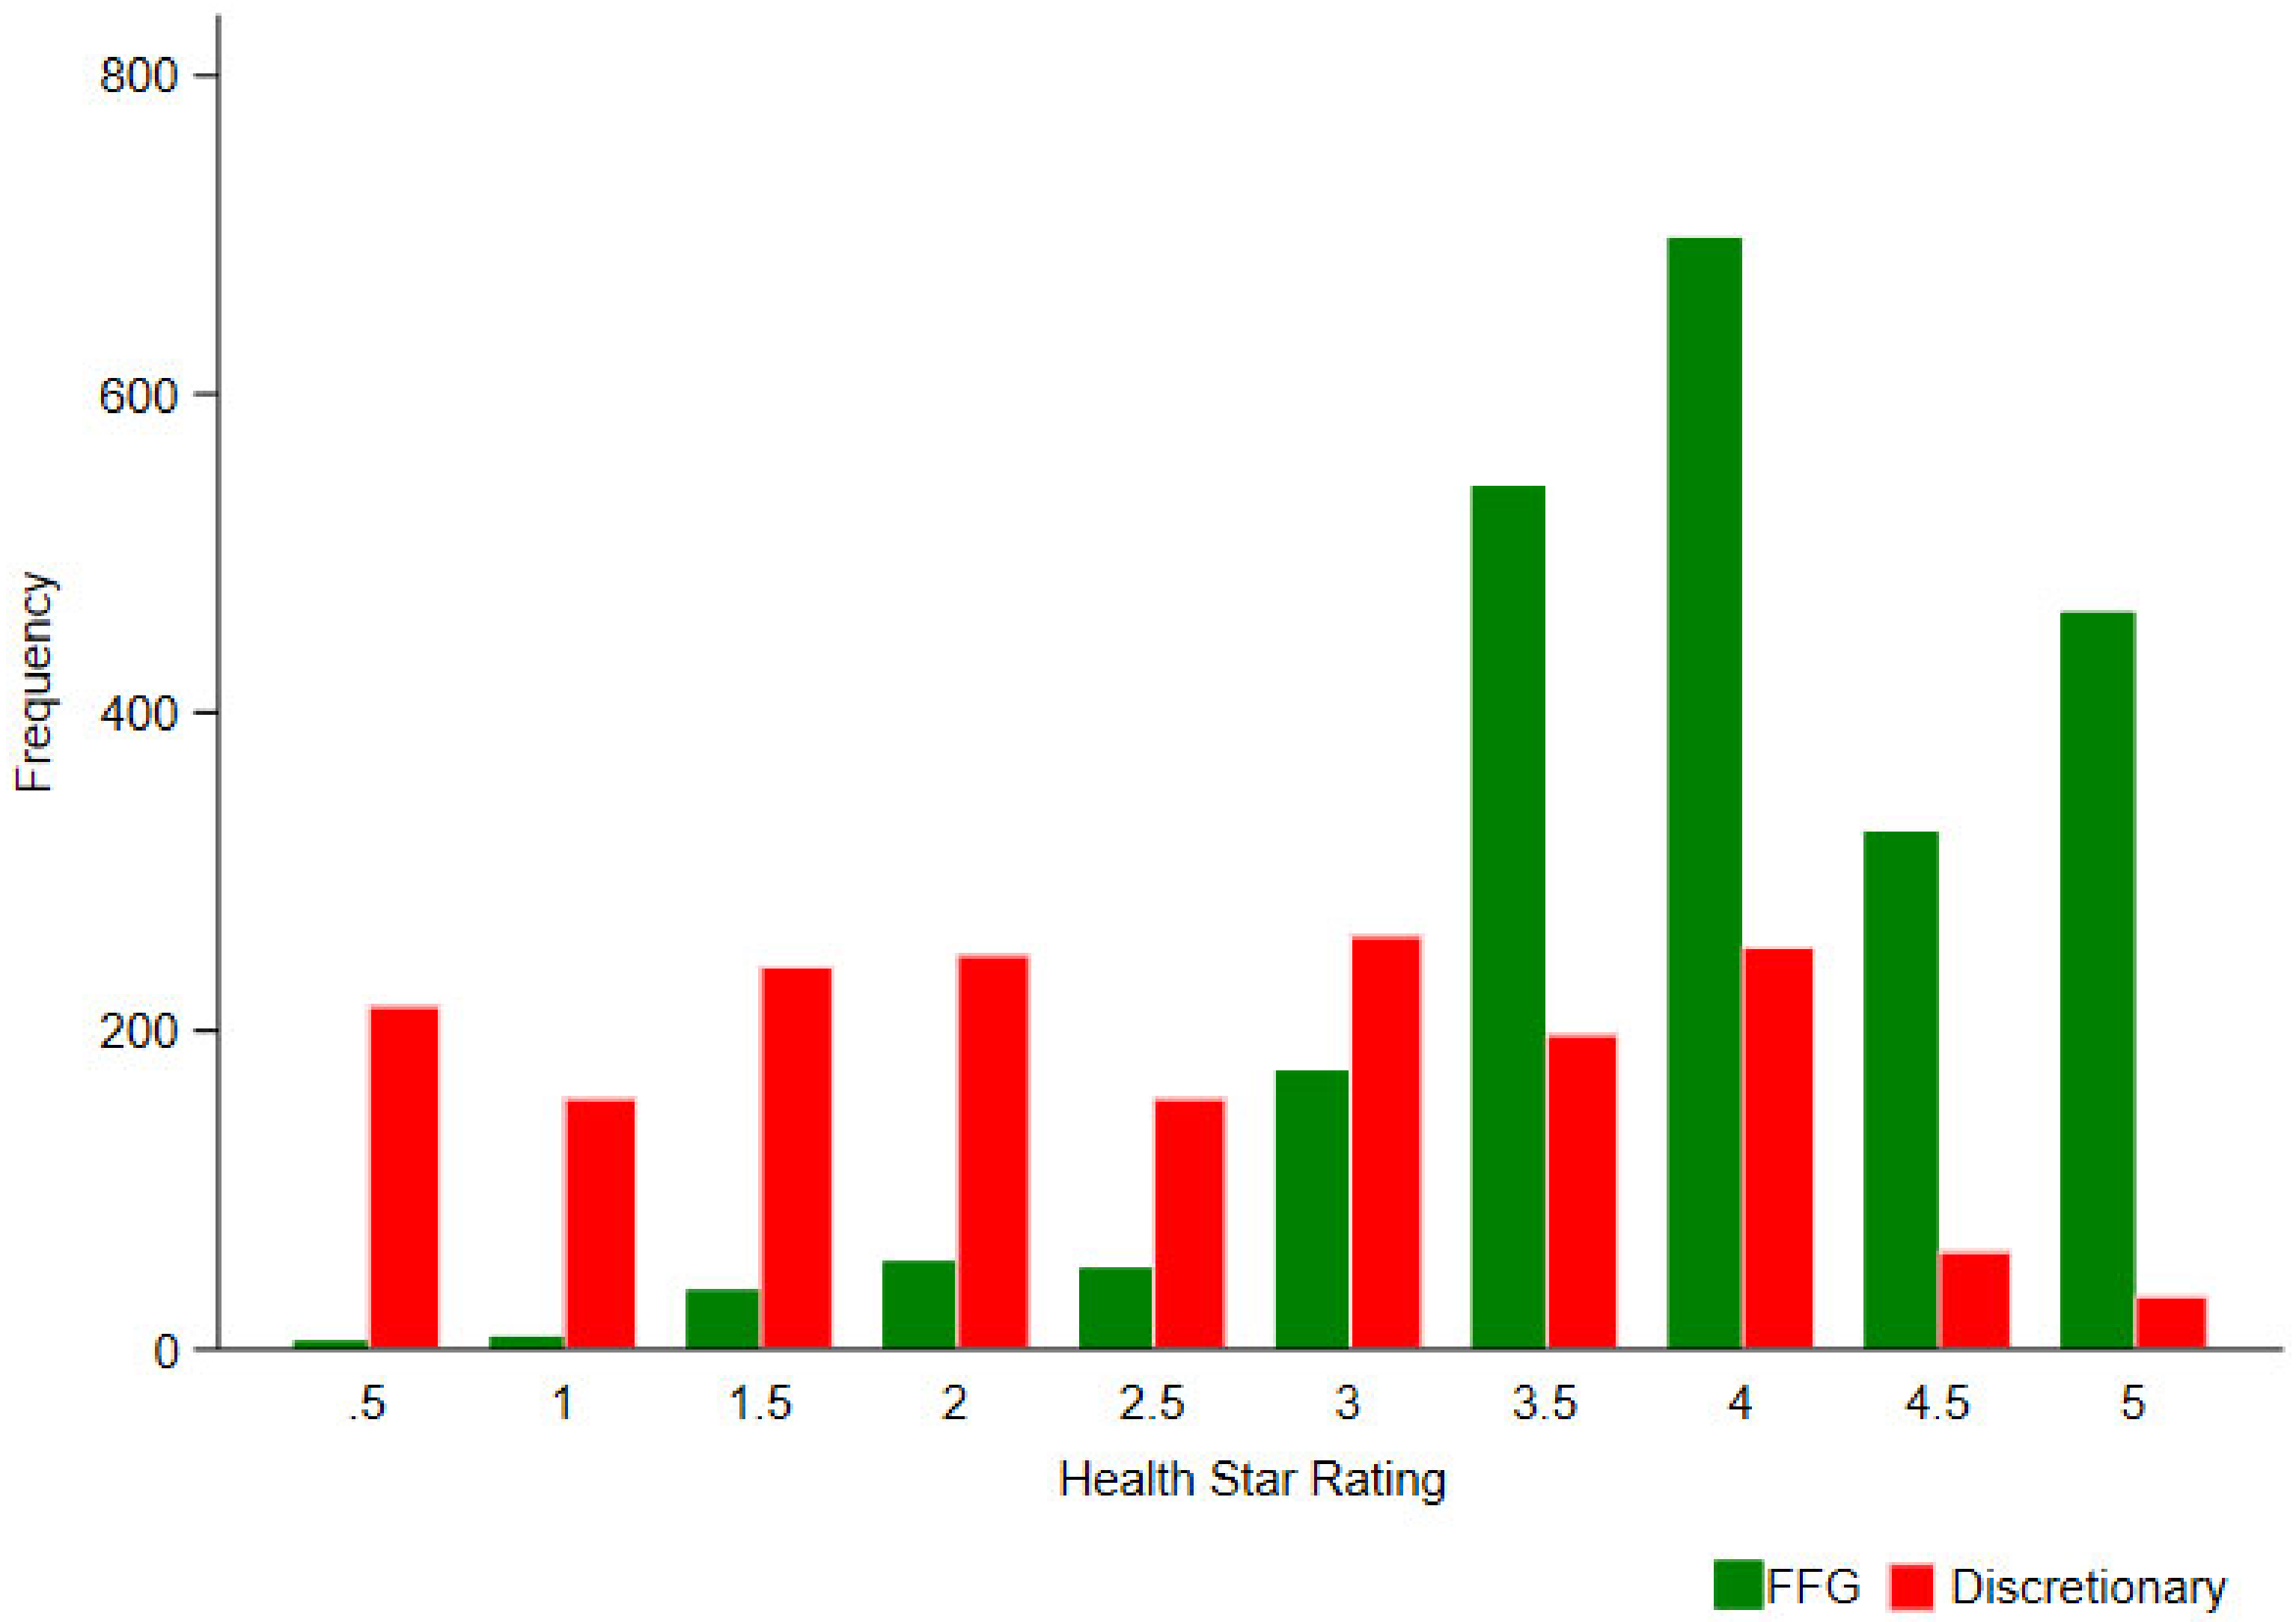
| ADG | n (%) | HSR Median | HSR Range | IQR | n HSR ≤ 2 (%) * | n HSR ≥ 2.5 (%) * | n HSR ≥ 3.5 (%) * | |
|---|---|---|---|---|---|---|---|---|
| FFG Foods | Year 1 | 77 | 4 | 2.5–5 | 0.5 | 0 | 77 | 61 |
| Year 2 | 267 | 4 | 0.5–5 | 1 | 11 | 256 | 226 | |
| Year 3 | 368 | 4 | 0.5–5 | 1 | 15 | 353 | 316 | |
| Year 4 | 608 | 4 | 0.5–5 | 1 | 28 | 580 | 535 | |
| Year 5 | 1039 | 4 | 1–5 | 1 | 51 | 988 | 880 | |
| Total | 2359 (55.5) | 4 | 0.5–5 | 1 | 105 (4.5) | 2254 (95.5) | 2028 (86.0) | |
| Disc Foods | Year 1 | 35 | 4 | 0.5–5 | 2.5 | 15 | 20 | 13 |
| Year 2 | 204 | 3 | 0.5–5 | 2 | 71 | 133 | 84 | |
| Year 3 | 286 | 2.5 | 0.5–5 | 2.5 | 140 | 146 | 78 | |
| Year 4 | 471 | 2.5 | 0.5–5 | 2 | 204 | 267 | 160 | |
| Year 5 | 832 | 2 | 0.5–5 | 2 | 433 | 399 | 212 | |
| Total | 1828 (43.0) | 2.5 δ | 0.5–5 | 2 | 863 (47.2) | 965 (52.8) | 547 (29.9) | |
| Grains | 578 (13.6) | 4 | 1.5–5 | 3 | 16 (2.8) | 562 (97.2) | 502 (86.9) | |
| Fruit | 272 (6.4) | 4.5 | 1.5–5 | 1 | 3 (1.1) | 269 (98.9) | 250 (91.9) | |
| Vegetables | 295 (6.9) | 4.5 | 3–5 | 1 | 0 | 295 (100.0) | 285 (96.6) | |
| MLNSE | 647 (15.2) | 4 | 1–5 | 1 | 53 (8.2) | 594 (91.8) | 554 (85.6) | |
| Dairy/alternatives | 225 (5.3) | 4 | 0.5–5 | 1.5 | 29 (12.9) | 196 (87.1) | 141 (62.7) | |
| Mixed foods | 342 (8.1) | 3.5 | 0.5–5 | 0.5 | 4 (1.2) | 338 (98.8) | 296 (86.6) | |
| Culinary | 37 (0.9) | 3.5 | 2–5 | 1 | 2 (5.4) | 35 (94.6) | 27 (73.0) | |
| FSF | 18 (0.4) | 5 | 4–5 | 0.5 | 0 | 18 (100.0) | 18 (100.0) | |
| Water | 9 (0.2) | 5 | 5–5 | 0 | 0 | 9 (100.0) | 9 (100.0) | |
| Total Sample | 4251 | 3.5 | 0.5–5 | 1.5 | 970 (22.8) | 3281 (77.2) | 2629 (61.8) | |
© 2020 by the authors. Licensee MDPI, Basel, Switzerland. This article is an open access article distributed under the terms and conditions of the Creative Commons Attribution (CC BY) license (http://creativecommons.org/licenses/by/4.0/).
Share and Cite
Dickie, S.; Woods, J.L.; Baker, P.; Elizabeth, L.; Lawrence, M.A. Evaluating Nutrient-Based Indices against Food- and Diet-Based Indices to Assess the Health Potential of Foods: How Does the Australian Health Star Rating System Perform after Five Years? Nutrients 2020, 12, 1463. https://doi.org/10.3390/nu12051463
Dickie S, Woods JL, Baker P, Elizabeth L, Lawrence MA. Evaluating Nutrient-Based Indices against Food- and Diet-Based Indices to Assess the Health Potential of Foods: How Does the Australian Health Star Rating System Perform after Five Years? Nutrients. 2020; 12(5):1463. https://doi.org/10.3390/nu12051463
Chicago/Turabian StyleDickie, Sarah, Julie L. Woods, Phillip Baker, Leonie Elizabeth, and Mark A. Lawrence. 2020. "Evaluating Nutrient-Based Indices against Food- and Diet-Based Indices to Assess the Health Potential of Foods: How Does the Australian Health Star Rating System Perform after Five Years?" Nutrients 12, no. 5: 1463. https://doi.org/10.3390/nu12051463