
Mapping Suspended Sediment Changes in the Western Pacific Coasts
by
 , , , ,
Tao Zhou
1,
Bowen Cao
2,
Junliang Qiu
2 ,
,
Shirong Cai
1,
Haidong Ou
1,
Wei Fan
1,
Xiankun Yang
1,3,* ,
,
Xuetong Xie
1,
Yu Bo
4 and
Gaige Zhang
5 1
School of Geography and Remote Sensing, Guangzhou University, Guangzhou 510006, China
2
Department of Land, Environment, Agriculture and Forestry (TESAF), University of Padova, Agripolis, Viale dell’Università 16, 35020 Legnaro, Italy
3
Rural Non-Point Source Pollution Comprehensive Management Technology Center of Guangdong Province, Guangzhou University, Guangzhou 510006, China
4
CAS Key Laboratory of Regional Climate and Environment for Temperate East Asia, Institute of Atmospheric Physics, Chinese Academy of Sciences, Beijing 100029, China
5
Ministry of Education Key Laboratory for Earth System Modeling, Department of Earth System Science, Tsinghua University, Beijing 100084, China
*
Author to whom correspondence should be addressed.
Remote Sens. 2023, 15(21), 5192; https://doi.org/10.3390/rs15215192
Submission received: 27 August 2023
/
Revised: 18 October 2023
/
Accepted: 27 October 2023
/
Published: 31 October 2023
(This article belongs to the Special Issue Remote Sensing in Coastal Ecosystem Monitoring)
Abstract
:The Western Pacific Coasts (WPC) are the outlets of many large Asian rivers. In recent years, the interplay of climate changes and human activities has persistently altered the suspended sediment concentrations (SSC) in the WPC, triggering substantial shifts in coastal ecosystems. However, the scarcity of coastal observation stations hampered comprehensive investigations at large scales. This study employed three representative SSC retrieval models and utilized Landsat images acquired from 1990 to 2020 to estimate the SSC in the WPC with a focused endeavor to dissect the intricate spatial and temporal variability of SSC in the region. The findings revealed the following insights: (1) The outcomes derived from the three distinct SSC models consistently manifested a discernible decreasing pattern in SSC changes over the past three decades across all six major estuaries (Liao River Estuary, Yellow River Estuary, Yangtze River Estuary, Hangzhou Bay, Pearl River Estuary, and Mekong River Estuary). (2) The seasonal attributes of the six major estuaries differed, primarily due to distinct dominant influencing factors like precipitation, upstream sediment load, wind, and tides. (3) Collectively, SSC tends to be relatively higher in the Yangtze River Estuary, Hangzhou Bay, and Yellow River Estuary, while the Pearl River and Mekong River Estuaries exhibit relatively lower levels. Notably, the SSC exhibited distinct spatial traits along the coastlines of different estuaries. (4) SSC in the non-estuarine regions along the WPC, a similar significant declining trend in SSC is observed as in the estuaries, albeit the rate of decline generally appeared to be less pronounced. Furthermore, regions with faster rates of SSC reduction are typically concentrated near major estuaries in the northern part of the Coasts. The decline in estuarine SSC plays an important role in the overall decrease in SSC across the WPC. These study outcomes held substantial significance for advancing the stability and sustainable evolution of the WPC.
1. Introduction
Suspended sediment plays a crucial role as a water quality indicator in estuarine and offshore environments. This parameter holds the potential to influence the growth, reproduction, and distribution of phytoplankton and plants, effectively altering water body transparency [1]. Moreover, it serves as a conduit for nutrients, contributing to the establishment and development of offshore aquatic ecosystems [2]. Furthermore, the sediment load from rivers significantly shapes the morphology of estuarine and coastal landscapes, including the formation of deltas, beaches, and wetlands [3]. Coastal ecosystems are directly influenced by variations in sediment discharge from rivers, which act as the primary suppliers of coastal SSC [4,5]. Nevertheless, the dynamics of sediment distribution have been substantially disrupted by various anthropogenic activities over the past century. Persistent practices like dam construction and soil and water conservation initiatives in upstream basins have drastically curtailed sediment transport to coastal areas, leading to widespread sediment deficits across global coastal waters [6,7]. For instance, the Mekong Delta has experienced a staggering 70% reduction in sediment supply since the construction of dams within its basin [8]. Similarly, the Yellow River’s sediment load has plummeted by 90% over the past six decades [9]. In the Mississippi River Basin, dam construction has also contributed to a one-third reduction in sediment discharge within the Barataria section [10].
In the 1950s, over 200 major rivers worldwide contributed approximately 15.3 billion tons of sediment to the sea, with approximately 6.3 billion tons attributed to the large Asian rivers. Prominently, the major Asian rivers (such as the Yellow River, Yangtze River, Pearl River, Mekong River, and Liao River) emptying into the Western Pacific collectively accounted for nearly 2 billion tons [11]. Although constituting only about 2.5% of global rivers, these major Asian rivers in the Western Pacific remarkably contribute approximately 10% of the sediment into the sea. Notably, a significant trend over the last six decades has been the substantial decline in the annual sediment discharge from the world’s major rivers, totaling approximately 6.8 billion tons (representing a decline of about 44.4%). In comparison, the sediment discharge from major Asian rivers in the Western Pacific experienced a dramatic reduction of about 1.4 billion tons (reflecting a staggering decrease of around 70%) [12,13]. This reduction rate in the Asian rivers notably exceeds that observed in other intercontinental rivers worldwide.
This decline in sediment supply to the sea, coupled with sea-level rise attributed to climate warming, holds the potential to trigger a persistent retreat of local coastlines [14,15]. As a consequence, the stability of landforms and the ecological equilibrium of the Western Pacific Coasts (WPC) could be significantly affected [16]. The major rivers of the Western Pacific region play a pivotal role in global land–sea material transport; however, they also serve as a prime example of the profound anthropogenic influence on changing sediment loads.
Concurrently, the WPC often comprises densely populated regions and serves as a hub for economic activity across various nations. The coastal areas in the Western Pacific represent the final destination for major Asian rivers, including the Yangtze River, Yellow River, Pearl River, Red River, and Mekong River. The diminishing sediment load has notably exacerbated coastal erosion along the Western Pacific shoreline. This erosion, coupled with the rising sea levels attributed to climate warming, poses a significant risk of coastal disappearance. Such alterations ultimately extend their impact on the overall stability of the ecosystem along the entire WPC. Hence, given the combined influence of ongoing climate change and human interventions on suspended sediment dynamics, comprehending alterations in suspended sediment concentration (SSC) within the world’s major river estuaries gains paramount significance. This comprehension holds particularly true for understanding the distinctive changes in SSC, especially in the estuaries of large Asian rivers. This knowledge proves invaluable for research on the stability of the coasts encompassing major global rivers and estuaries, the effective management of coastal resources, and the promotion of sustainable coastal development.
The traditional approach to monitoring suspended sediment levels in estuaries and coastal areas typically involves planned ship routes for field sampling and subsequent laboratory analysis. While these methods yield precise and reliable data regarding physicochemical indicators of coastal waters, they are labor-intensive and costly and are confined to capturing suspended sediment distribution within limited geographic areas. This approach struggles to convey the comprehensive large-scale spatiotemporal dynamics [17]. Moreover, relying solely on data from upstream river hydrological stations falls short of representing suspended sediment changes at river outlets. In recent years, remote sensing techniques have gained prominence for retrieving water SSC [18,19,20]. These techniques offer continuous and consistent spatial distribution of SSC, presenting a cost-effective avenue for long-term monitoring. For instance, Zhan et al. [21] employed MODIS to trace a 12-year SSC shift in the Pearl River Estuary, while Luo et al. [22] utilized Landsat to investigate 37-year SSC dynamics in the Yangtze River Estuary. However, due to the complicated interplay of water quality parameters and optical properties in coastal waters [23], the development of SSC retrieval models has produced satisfactory outcomes solely in local contexts, leading to the application of most retrieval models to a single estuary. This divergence in retrieval models across different estuaries, combined with variations in data quality and study periods, has yielded non-comparable results. Recently, Yunus et al. [24] utilized ten models to explore the dynamics of SSC in ten large Asian river estuaries, proving the feasibility of remote sensing in large-scale SSC retrieval. Nevertheless, the study area is still confined to the scale of an individual estuary. Such issues have constrained the comprehensive understanding of SSC dynamics along the WPC regions. Consequently, a systematic exploration of the long-term spatiotemporal SSC dynamics in the entire WPC becomes imperative.
In this study, Landsat satellite images spanning from 1990 to 2020 were meticulously chosen to extract SSC data from the coastal waters along the western shores of the Pacific Ocean. The objective was to scrutinize both the spatial distribution and temporal evolution of SSC. To ensure the precision of the findings, three distinct retrieval models employing different band combinations were employed. The primary goal was to delve into the enduring shifts in SSC within the six major estuaries lining the Western Pacific Coasts. A comparative analysis was also conducted, examining SSC alterations in both estuarine and non-estuarine regions. The overarching aim was to unravel the pivotal factors influencing suspended sediment changes throughout the expanse of the WPC. The insights gleaned from this study hold significance in advancing the assessment of stability and sustainable development strategies for the entire WPC.
2. Materials and Methods
2.1. Study Area
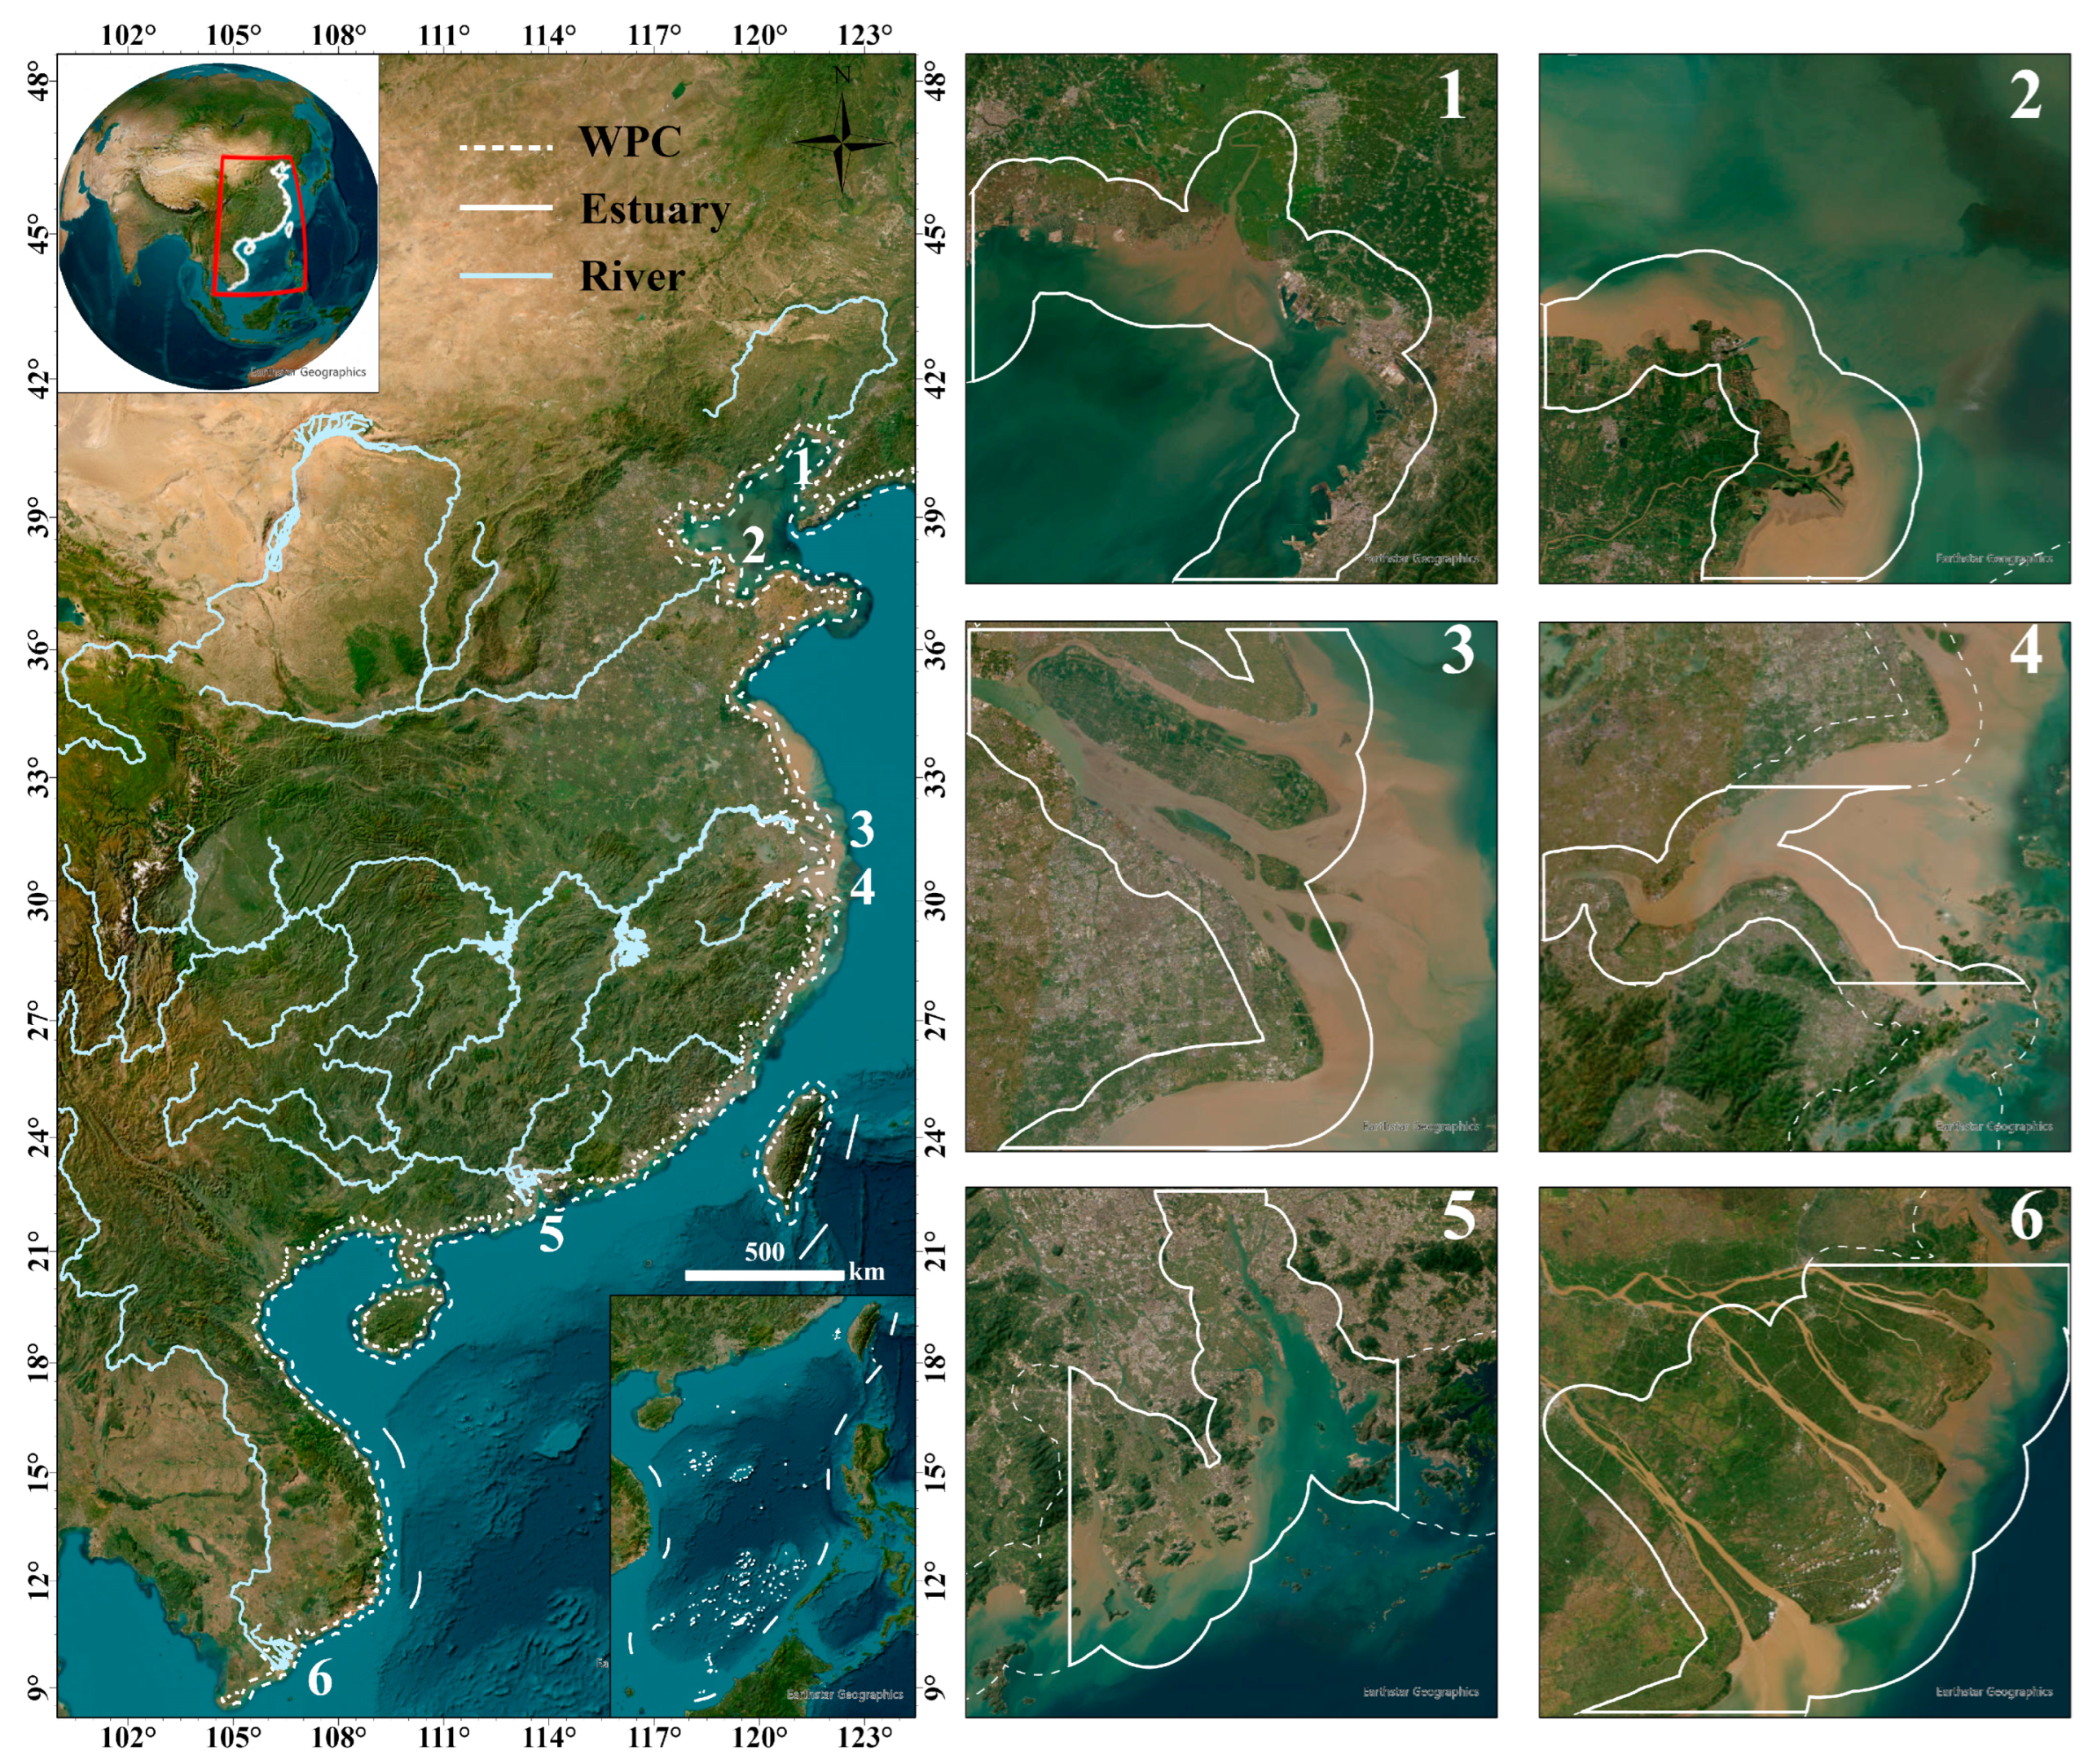
In this study, for precise monitoring of the dynamic in SSC across the WPC, A distinctive region extending from the northernmost Liao River to the southernmost Mekong River was delineated, creating a delineated strip encompassing 5 km landward and 10 nautical miles oceanward along the Western Pacific coastline. This demarcated area defined the scope of our investigation, encompassing the coastal waters of the WPC (Figure 1). Our study primarily centered on the estuaries of six major Asian rivers, combined with an analysis of watershed characteristics and alternations in surface processes, aiming at unraveling the intricate spatial and temporal patterns in suspended sediment changes.
The WPC features six significant basin estuaries, comprising the Liao River, Yellow River, Yangtze River, Qiantang River (Hangzhou Bay), Pearl River, and Mekong River estuaries. Originating from the Guangtou Mountains of China’s Hebei Province, the Liao River discharges into the Bohai Sea, carrying an average annual sediment load of 1.19 × 10⁷ t [25]. The Yellow River, originating from the Qinghai–Tibet Plateau and flowing into the Bohai Sea, is renowned as one of the world’s most turbid rivers, historically conveying a sediment load of 5.98 × 10⁸ t·yr−1 [26]. Originating from the Tanggula Mountains on the Qinghai–Tibet Plateau, the Yangtze River bears an average annual runoff of 9.04 × 10¹¹ m3 and a sediment load of 4.35 × 10⁸ t [27].
Hangzhou Bay, housing the Qiantang River estuary to the south of the Yangtze River Estuary, experiences resuspension of bottom sediment due to strong winds and strong tides. Transported sediment from the Yangtze River Estuary to Hangzhou Bay is characterized by extreme turbidity under the influence of multiple factors [28,29]. The Pearl River, spanning 2216 km in length, contributes an average annual sediment load of approximately 7.53 × 10⁷ t·yr−1 [30]. Originating from the Tanggula Mountains, the Mekong River, the third-largest river in Asia and the eleventh-largest globally in sediment transport, also plays a significant role in the region’s hydrology and sediment dynamics [31].
These rivers play a crucial role in supplying water, sediments, and nutrients to the Western Pacific Ocean. However, over the past few decades, human activities have led to the construction of numerous reservoirs, dams, and other hydraulic facilities within the six basins. As a result, the interventions have significantly influenced and impacted the coastal ecosystems.
2.2. Data and Processing
2.2.1. Satellite Data and Processing
The Landsat satellite platform, encompassing Landsat-TM/ETM+/OLI sensors, provides imagery products with a consistent revisit cycle (16 days) and a spatial resolution (30 m). The Google Earth Engine (GEE, https://earthengine.google.com/ (accessed on 28 May 2023)) platform facilitates access to the satellites’ Level-2 surface reflectance products. For Landsat-TM/ETM+ reflectance products, the Ecosystem Disturbance Adaptive Processing System (LEDAPS) algorithm was employed for generation [32]. Similarly, the Landsat-OLI imagery was generated using the Land Surface Reflectance Code (LaSRC) algorithm [33]. Both algorithms effectively account for the influence of atmospheric conditions, aerosols, and water vapor variations across time, space, and spectral domains, thus calibrating scattering and absorption effects.
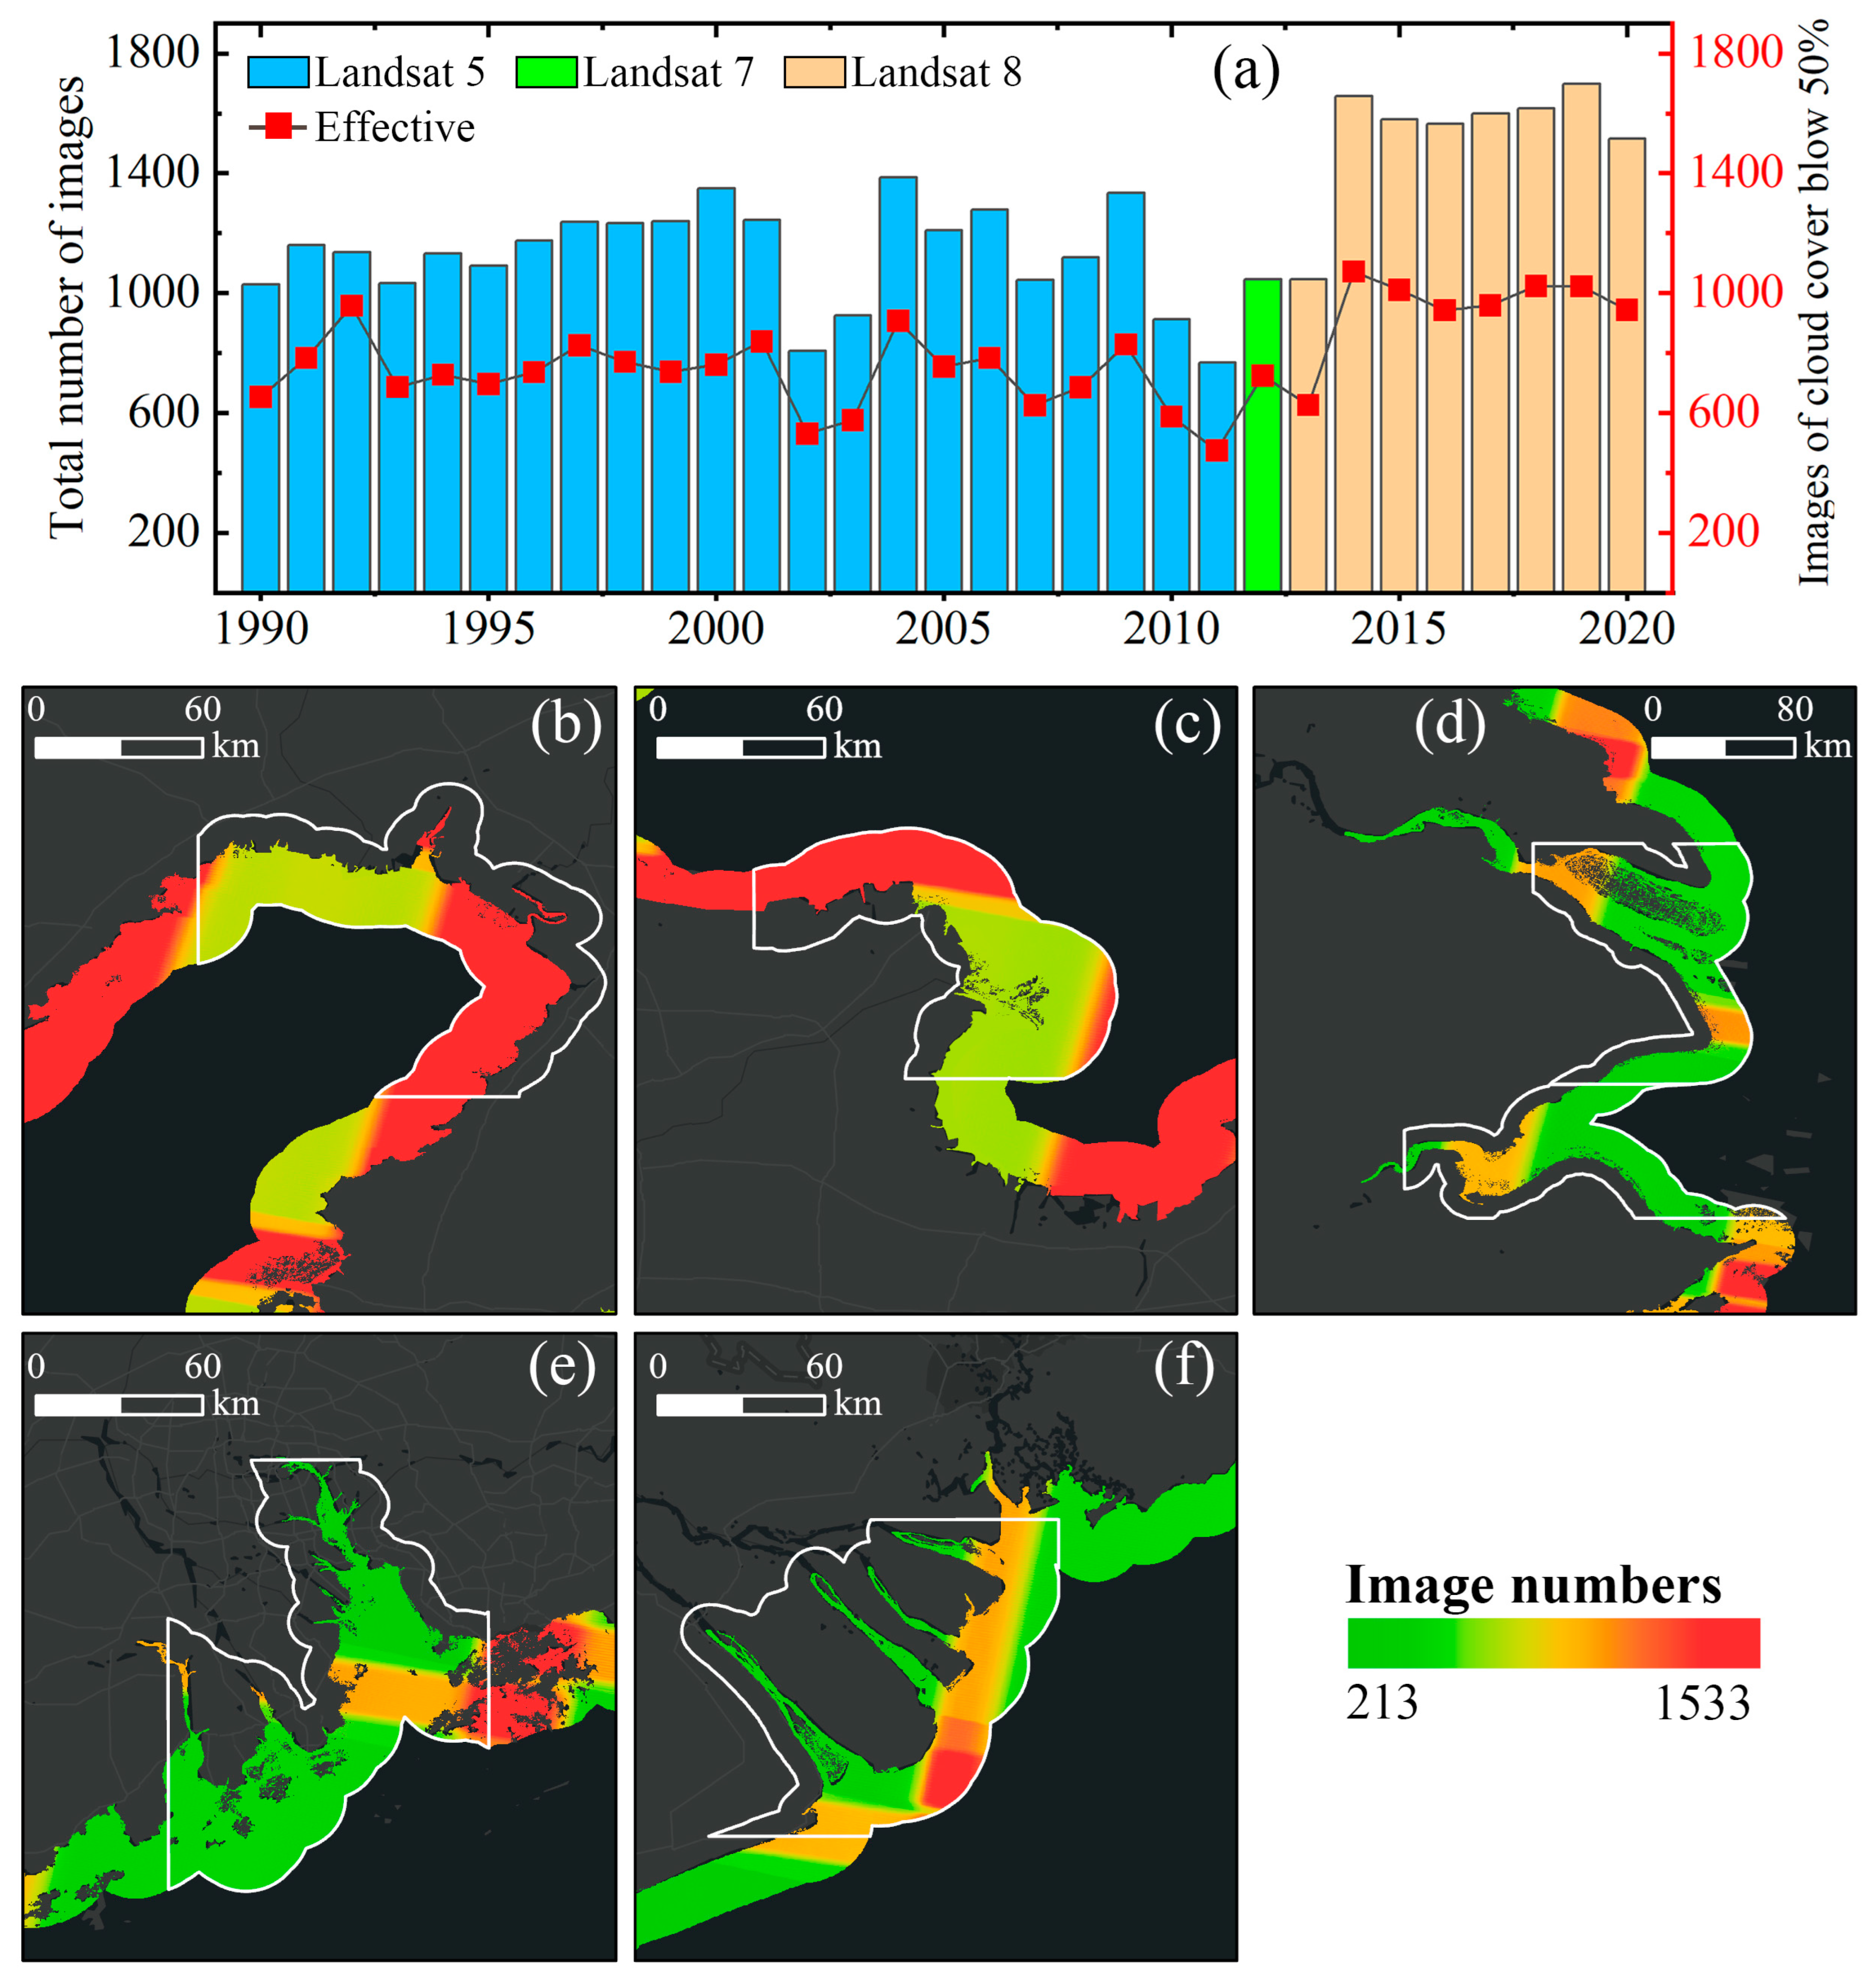
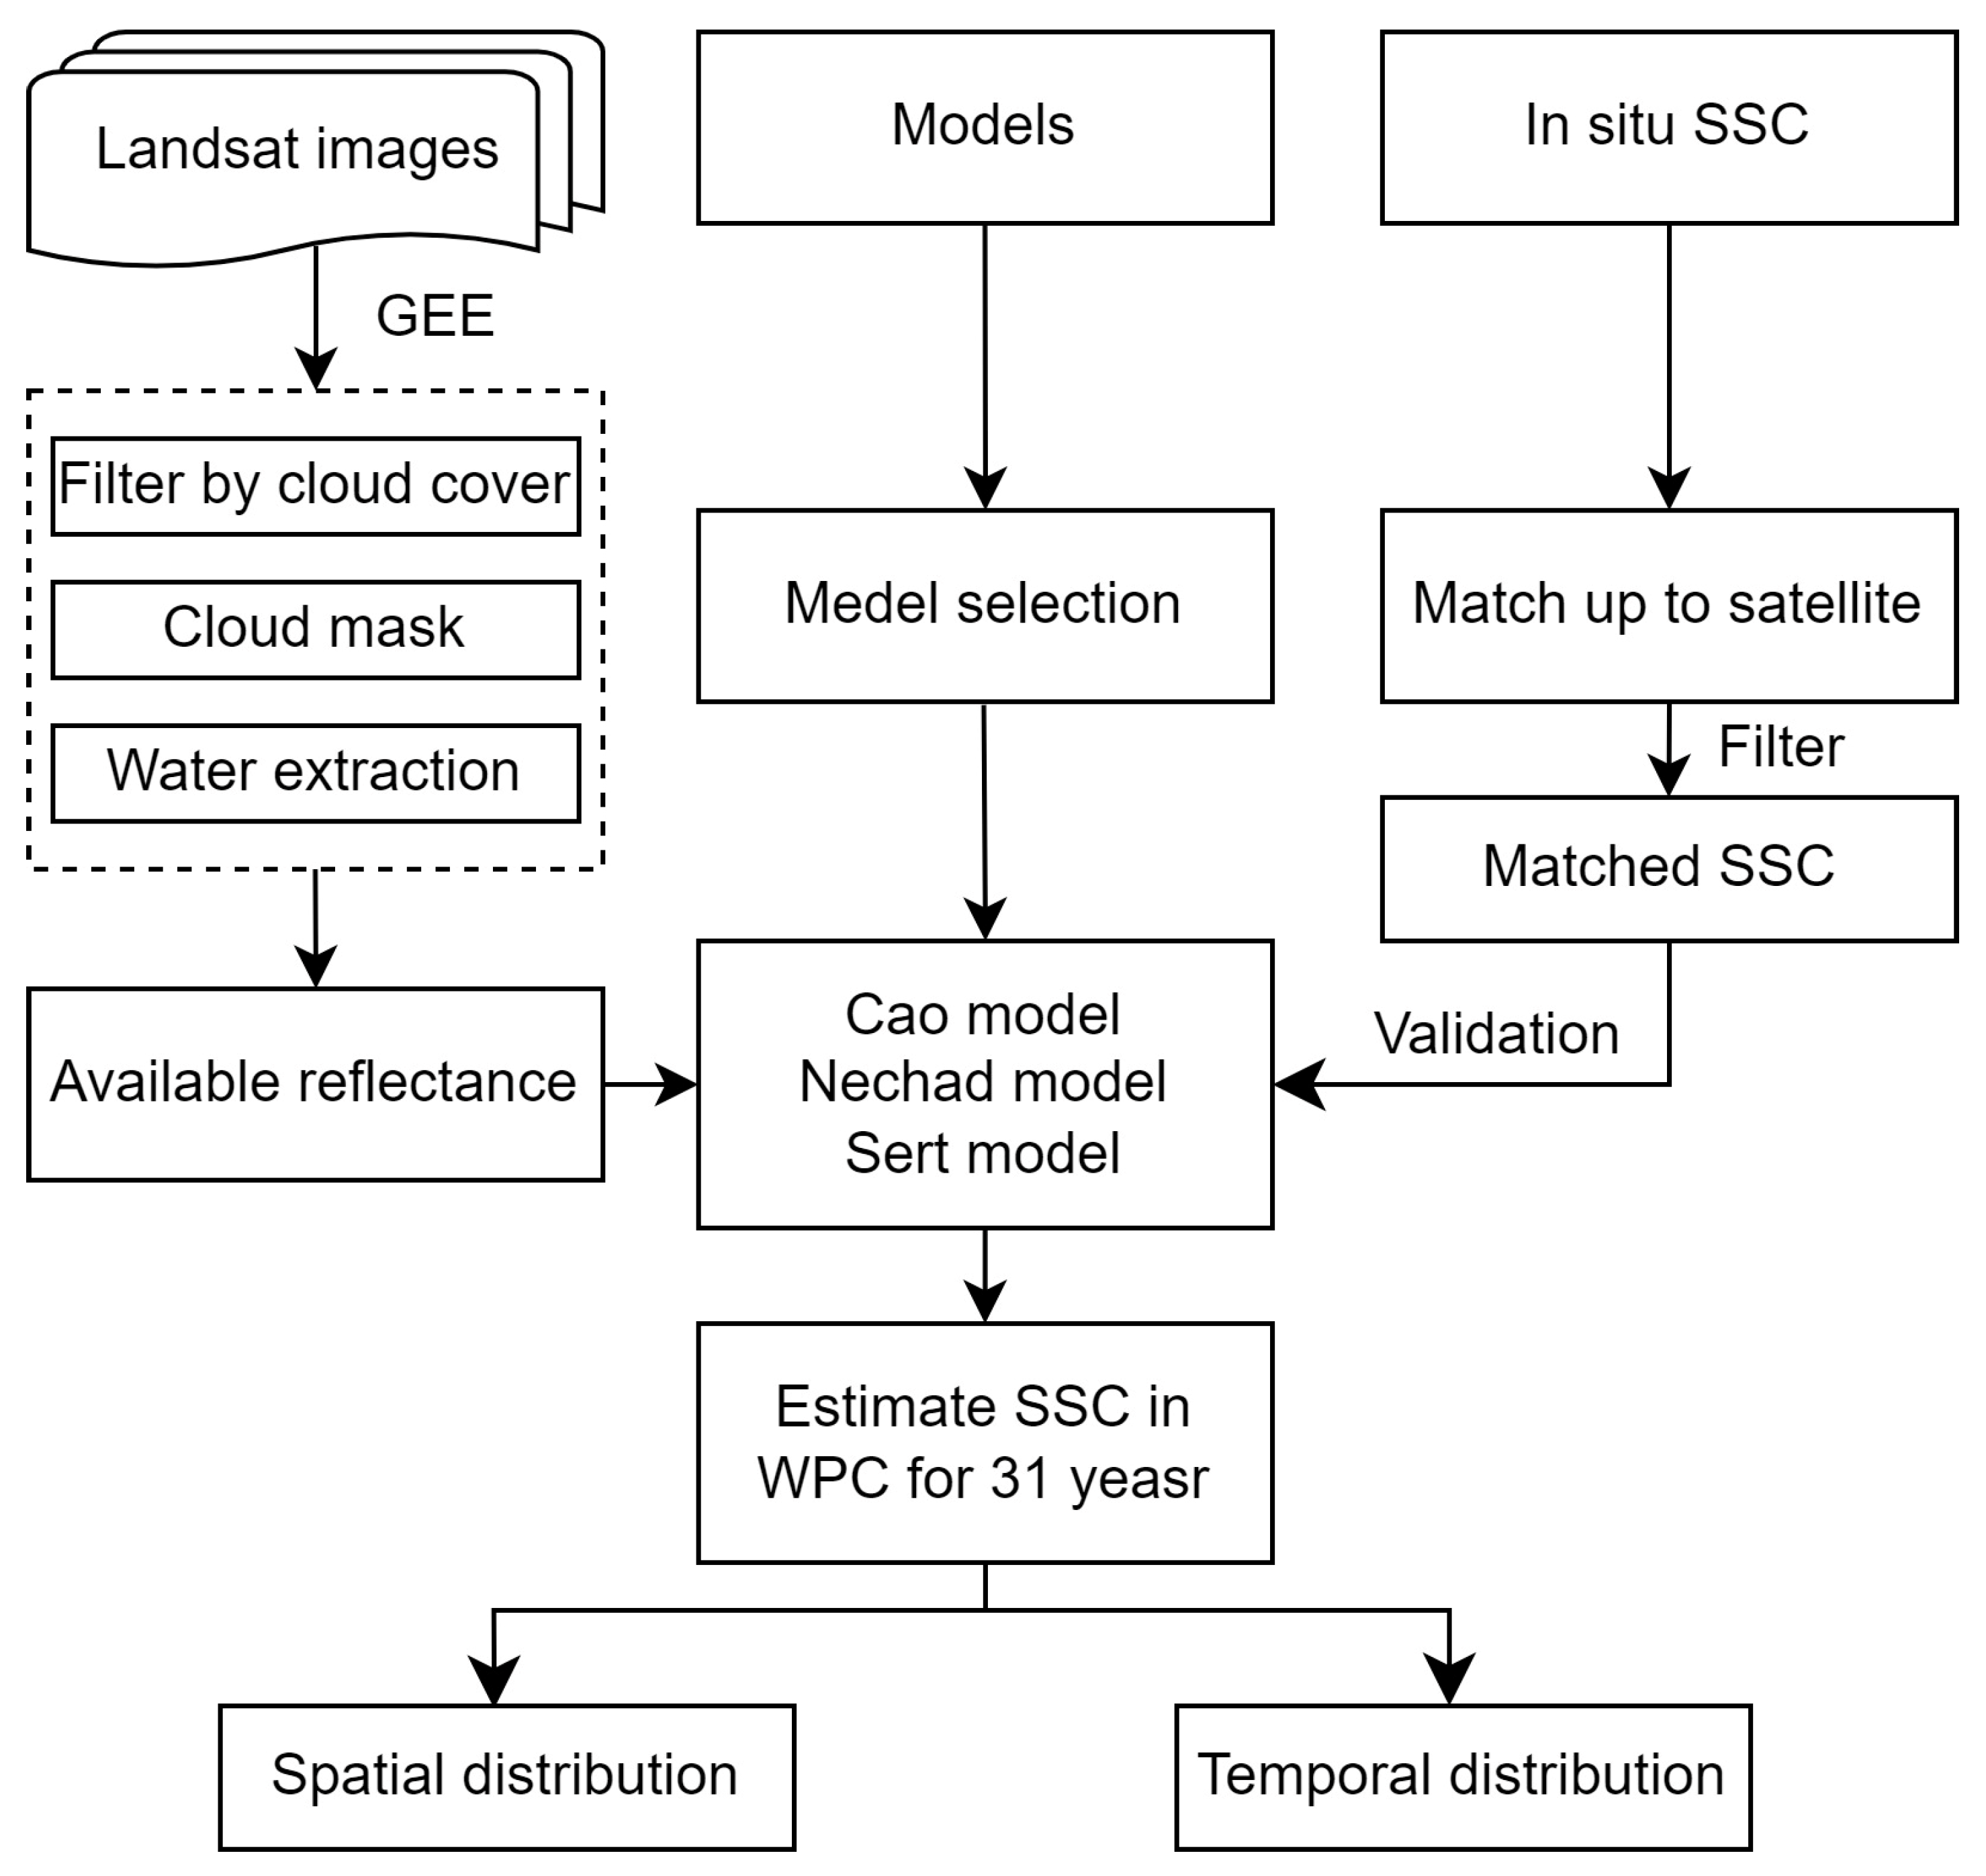
The GEE platform not only provides a complete global time series of satellite imagery and diverse data products but also offers robust computing capabilities, affording researchers the opportunity to engage in extensive and prolonged studies [34]. The cloud filtering method introduced by GEE can effectively sift through image collections, retaining those within a specific threshold of cloud cover. The number of images eventually acquired is contingent on the cloud coverage over each estuary, resulting in the following accounts: Liao River Estuary: 1890 images, Yellow River Estuary: 1810 images, Yangtze River Estuary: 960 images, Hangzhou Bay: 815 images, Pearl River Estuary: 1054 images, and Mekong River Estuary: 1087 images (Figure 2). Additionally, the quality assessment bands generated through the CFMask algorithm served to mask out pixels containing clouds and cloud shadows. Figure 3 illustrates the workflow of image preprocessing and SSC retrieval on the GEE platform (Figure 3).
Additionally, post-May 31st, 2003, all Landsat-ETM+ images exhibit constant stripe gaps stemming from the malfunction of the ETM+ sensor’s Scan Line Corrector (SLC) [35]. To address this, some researchers have applied interpolation methods to fill the gaps [36]. In this study, a simple filling approach was implemented to fill the gaps using the focal statistical algorithm within GEE.
2.2.2. In Situ Data Collection and Processing
The in situ SSC data were obtained from the field cruise measurements conducted from 2020 to 2023 in the Pearl River Estuary. Navigation routes and sampling points were randomly selected, with 500 mL of water samples collected at each site and preserved in a refrigerator. Corresponding location data for each site was documented. The samples were subsequently filtered, dried, and weighed in the laboratory. From these, SSC values under cloud-free conditions were finally selected for the calibration and accuracy validation of SSC retrieval models (Table 1).
Figure 2.
Statistics of available Landsat images for the WPC for the period of 1990 to 2020. (a) Total number and count of Landsat imagery with cloud cover below 50%. Spatial distribution of images with cloud cover below 50% for different locations: Liao River Estuary (b), Yellow River Estuary (c), Yangtze River Estuary and Hangzhou Bay (d), Pearl River Estuary (e), and Mekong River Estuary (f) within the period of 1990–2020. The white lines indicate the boundaries of the estuaries.

Figure 3.
Flowchart for image preprocessing and SSC retrieval.

Considering the prevalent high cloud coverage over the Pearl River Estuary, field surveys were conducted during cloud-free conditions one day before or after the Landsat satellites pass over the study area. These fieldwork activities were carried out in July 2020, December 2020, April 2021, July 2021, and February 2023. Spectral data were collected using the Analytical Spectral Devices (ASD) FieldSpec 4, generously provided by ASD Company (West Hollywood, CA, USA). The measurements were based on NASA-recommended protocols for above-water hyperspectral remote sensing reflectance (Rrs) [37]. Random routes and locations were selected for sampling, resulting in a total of 126 collected samples, with 119 of them being considered valid (Table A1). Some samples were deemed invalid due to spectral data being improperly collected under overexposed conditions. Based on these data, Cao et al. [38] completed the model calibration using data from 2020 to 2022 and applied it to the SSC retrieval in the Pearl River Estuary. The remaining data were used for the accuracy validation and comparison of the remaining models.
Simultaneously, at each sampling site, two 500 mL bottles of water were collected for subsequent laboratory analysis of suspended sediment concentration and other physicochemical factors (not covered in this study). The water samples were promptly stored in a mobile fridge to preserve their physicochemical characteristics. In addition to sediment data, pertinent environmental information such as longitude, latitude, wind speed, and other ambient factors were documented for later data processing, particularly for matching the Fresnel reflectance of the water surface for Rrs calculation.
The collection and processing of water samples play pivotal roles in estimating SSC. The acquired spectral data were analyzed following the operational guidelines of the FieldSpec 4 instrument and the methodology outlined in the study by Tang et al. [39]. To ensure the quality of the water sample data, the collection and processing adhered to specific rules: firstly, the sampled SSC values should exhibit a statistically normal distribution. Secondly, the discrepancy in double measurements of filter paper weight should not exceed 0.5 mg, and the filter paper was weighed both before and after filtration. Lastly, the sediment retained by each filter paper was required to exceed 10 mg but remain below 100 mg.
Spectral data were acquired using the above-water measurement method. The handheld ASD Spectroradiometer was positioned over the water surface at either a 45° or 135° angle to prevent direct perpendicular sunlight input. This positioning was essential to minimize potential distortions. The incident light obtained by the fiber optic probe included both scattered light from the sky and reflected light from the surrounding environment. Consequently, calibration with a reference panel was undertaken to ensure the accuracy of the measurements. Subsequently, the collected ASD spectral data underwent meticulous processing to derive precise reflectance values.
In the case of other estuarine areas, addressing the substantial challenges posed by extensive in situ investigations and associated travel costs, a pragmatic approach for model validation was adopted. This involved the amalgamation of field datasets derived from previous study outcomes. It is worth noting that these datasets are primarily concentrated within the Yangtze River Estuary, Yellow River Estuary, and Mekong River Estuary regions.
Before the application of these integrated datasets, a stringent process of quality assurance was implemented. This involved meticulous scrutiny of data quality and rigorous assessment of data collection timestamps. These measures were taken to ensure the reliability, accuracy, and consistency of the integrated data, which subsequently formed the bedrock for our model verification procedures.
2.3. SSC Retrieval Models
Since a sole sediment retrieval model may introduce considerable uncertainty across diverse applications, employing multiple models can enhance the overall resilience of model performance [24,40]. In this study, the selection retrieval algorithms adhered to the following guiding principles: (a) Inclusion of both global and regional application models; (b) Incorporation of both single-band and multi-band models; (c) Integration of models rooted in distinct development principles, encompassing empirical, semi-analytical, and analytical models.
It is important to note that the model selection process mentioned above ensures the applicability of each model. Models that have been frequently applied in previous studies were chosen to ensure the model’s reliability across various regions. Ultimately, the Nechad, Sert, and Cao models were selected as the optional models.
Nechad model: Nechad et al. [41] developed a comprehensive multi-sensor model, which operates on a single-band basis and employs a semi-analytical approach. The model has gained widespread utilization for SSC estimation in turbid waters. Its mathematic expression is presented as follows:
where SSC is the suspended sediment concentration in mg·L−1, , , and are dimensionless variables. is the reflectance at the wavelength λ. Novoa et al. [42] calibrate the parameters based on the red band, with parameters as , , and = 0.1686.
Sert model: The Sert model, developed by Shen et al. [20], is the single-band semi-analytical model based on in situ data obtained from the Yangtze River estuary. The model has found applications in turbid waters [43], which is expressed as
where SSC represents the suspended sediment concentration in g·L−1, while a and b stand for the coefficients of empirical knowledge and bands. denotes the reflectance at wavelength . Shen et al. [44] recalibrated these parameters primarily using the red band data from the Landsat satellite; the resulting parameters are presented in Table A2.
Cao Model: Cao et al. [38] formulated the multi-band empirical model designed to exhibit particular sensitivity to the SSC of waters with medium or low turbidity, such as the Pearl River Estuary. The mathematic expression of this model is as follows:
where SSC represents the suspended sediment concentration in mg·L−1, and B3 and B4 correspond to the reflectance values in the blue and red bands, respectively.
Due to the unavailability of in situ data in other estuaries and the huge size of this study area, the calibration process only focused on Cao’s model. Nevertheless, it is crucial to acknowledge that calibrating all model parameters using in situ data solely from the Pearl River Estuary cannot actually improve their accuracy across the entire Western Pacific Coasts (WPC). To address this issue, we explored the potential of incorporating model parameters derived from diverse regions to augment the Cao model’s performance. For instance, we considered the Sert model, which was calibrated using in situ data from the Yangtze River estuary. This model excels at retrieving high SSC values, effectively complementing and contrasting with Cao’s model, which is primarily designed for low-SSC regions. This approach allows us to gain a more comprehensive understanding of the influence of different regional models when examining large-scale trend changes.
2.4. Model Evaluation Metrics
The statistical analysis metrics encompass the minimum, maximum, mean, and median of SSC to scrutinize regional traits. The Pearson correlation coefficient (R) was employed via correlation analysis to quantify the degree of correlation between two variables. For evaluating the efficacy of the SSC model, the root mean square error () and mean absolute percentage error () were utilized and are defined as follows:
where denotes the in situ observed SSC, represents the estimated SSC derived from the models, and n is the number of samples. The smaller the and , the higher the model accuracy.
2.5. SSC Temporal Variation and Trend Analysis
Sen’s slope test constitutes a non-parametric statistical approach for trend assessment. The trend within the time series is gauged through the statistical value β, wherein β exceeding 0 signifies an ascending trend, while β below 0 signifies a descending trend [45]. The Mann–Kendall (M-K) trend test, a widely applicable nonparametric method for climate and hydrological series [46], captures both trend and variability within the time series by calculating the statistical value Z. Furthermore, when surpasses or equals 1.64, 1.96, and 2.58, it indicates that the trend passes significance testing with confidence levels of 90%, 95%, and 99%, respectively.
3. Results
3.1. Model Performance Assessment
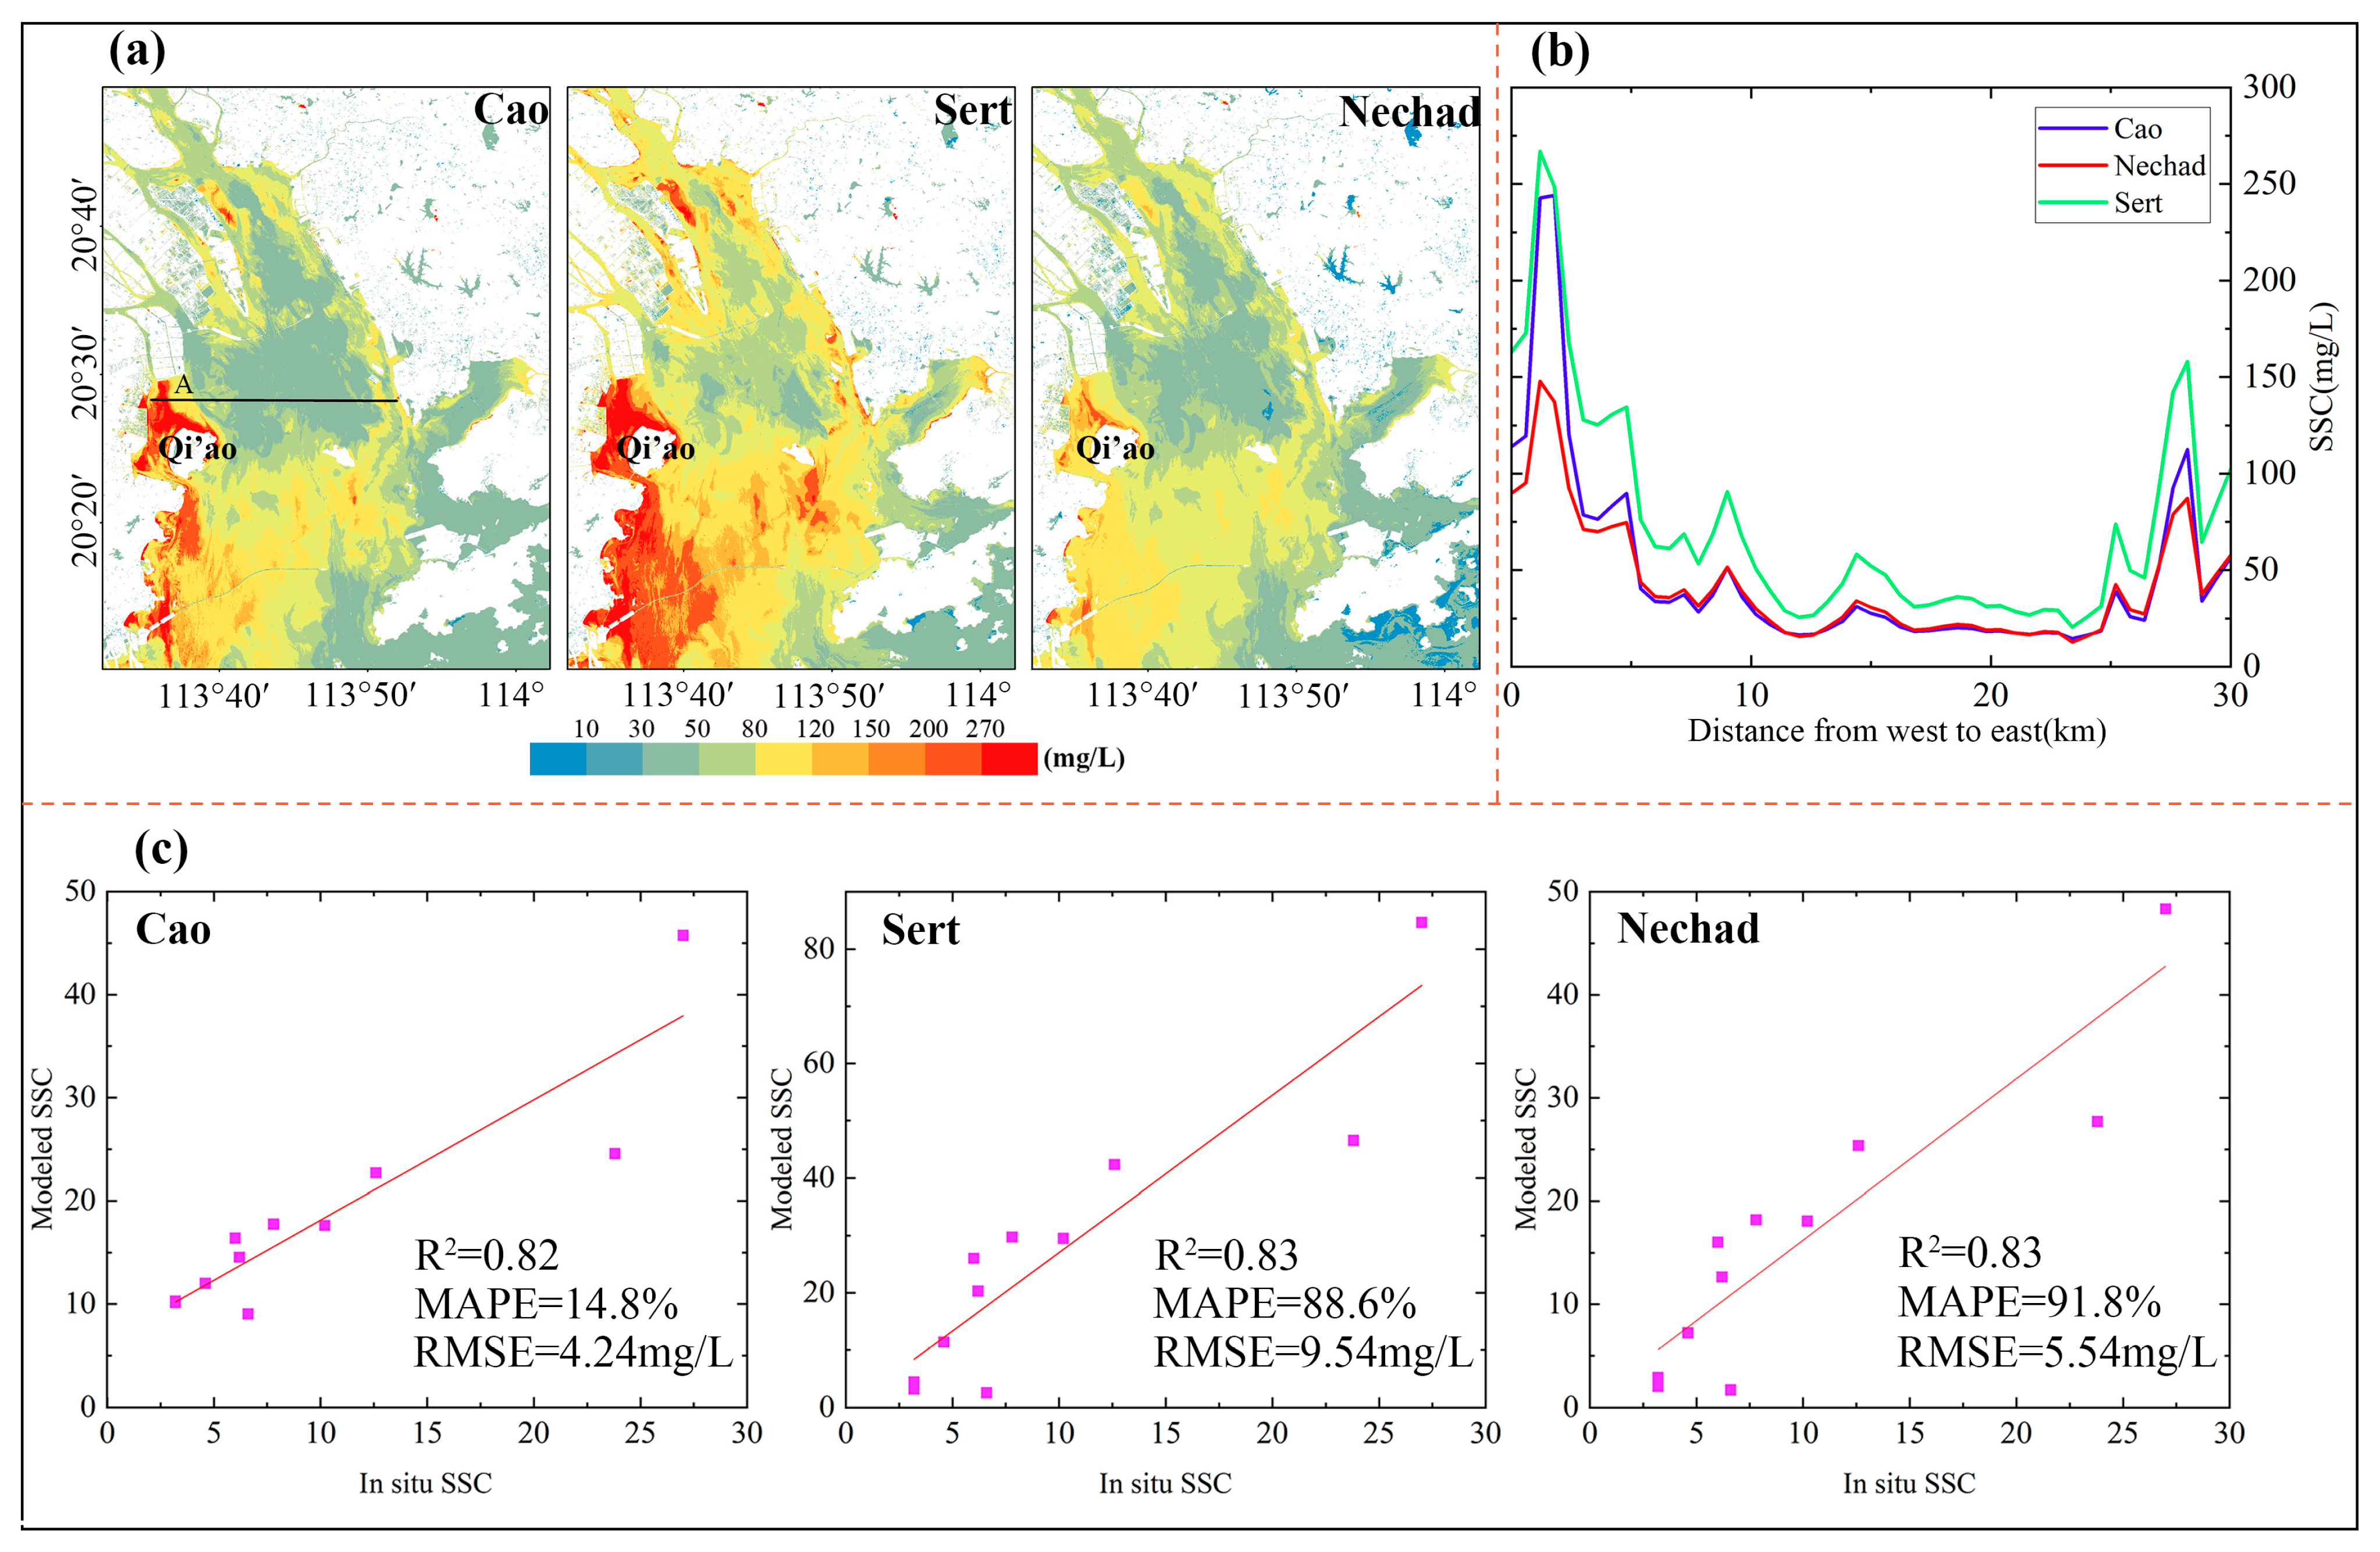
SSC estimations based on cloud-free images of the Pearl River Estuary were conducted on 14 December 2022, using Cao’s, Sert’s, and Nechad’s models, respectively. Despite slight differences in the SSC range, the three models demonstrated remarkable consistency in representing the spatial distribution of SSC (Figure 4a). Elevated SSC zones are evident in Qi’ao Island and the southern part of the Pearl River Estuary, exhibiting a gradual decrease from west to east. Notably, a distinct ‘rectangular’ area with lower SSC is observable in the eastern part of Qi’ao Island. The analysis along the transect line revealed the consistent capability of all models to capture the same trend (Figure 4b).
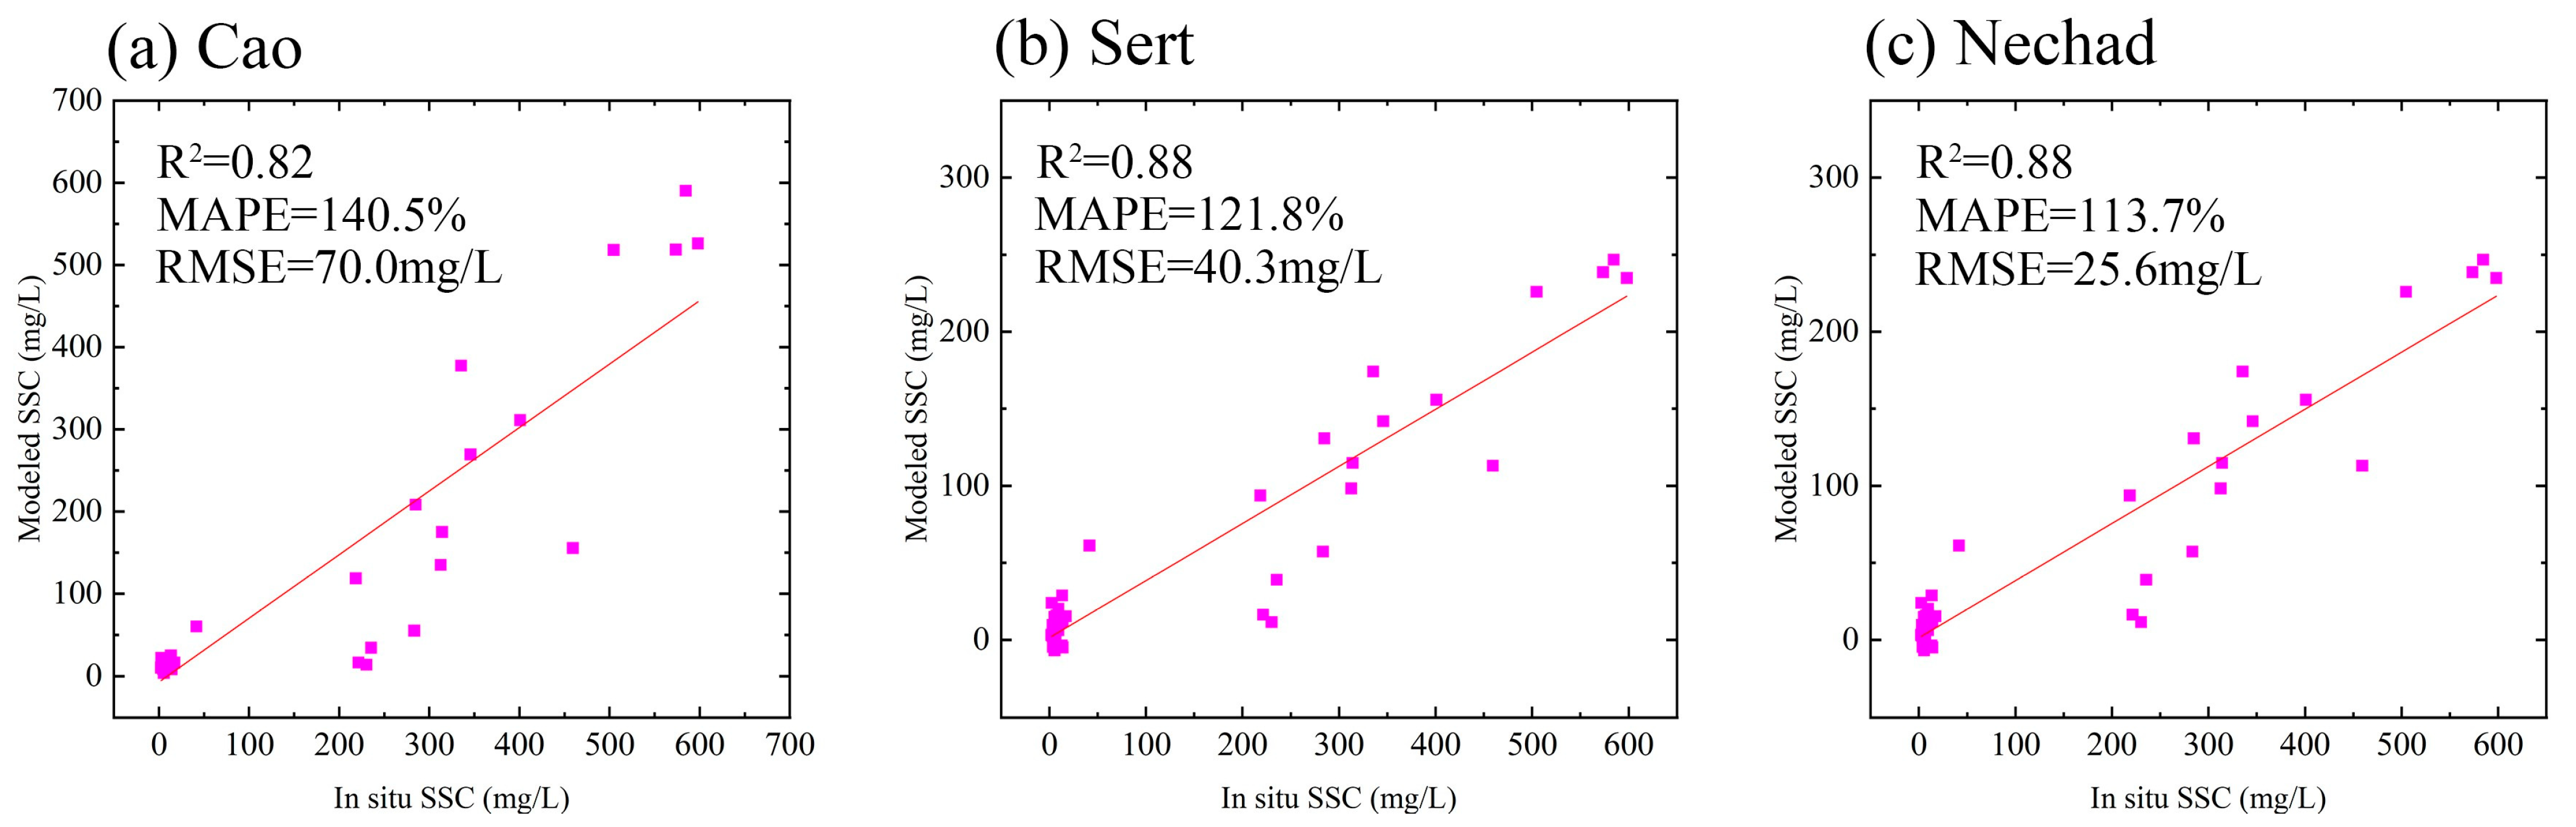
The Cao model has been effectively calibrated and validated using in situ data from 2020 to 2022. As such, there is no longer a need to rely on this dataset for further validation of the Cao model’s performance. However, to ensure the utmost data consistency and validation accuracy, we collected the most recent in situ data on 26 February 2023. This data was meticulously synchronized with Landsat imagery, with a time window of ±1 day. This updated dataset was employed to rigorously assess and compare the accuracy of the three models. This involved extracting corresponding image values using a 3 × 3 pixel window. The accuracy evaluation results for each model are illustrated in scatter plots (Figure 4c). Notably, Cao’s, Sert’s, and Nechad’s models exhibit strong R2 values of 0.82, 0.83, and 0.83, respectively, while demonstrating varying degrees of RMSE in comparison to the measured values (4.24 mg·L−1, 9.48 mg·L−1, and 5.54 mg·L−1, respectively) for the provided test dataset. Furthermore, integrated datasets from previous studies were utilized for model verification. These datasets included both high and low SSC values, allowing for a more comprehensive assessment of these models’ accuracy in turbid waters. It is noteworthy that in comparison to the validation results in the Pearl River Estuary, the uncertainty from the integrated datasets has increased (see Figure 5). However, given the potential bias arising from the temporal and spatial alignment of the measured and validated values and considering the study’s primary focus on large-scale SSC variability trends, the performance of these three models can be deemed acceptable. However, it is important to acknowledge that due to the limited availability of high-quality measured data, the obtained results may not always be representative.
3.2. Interannual Changes in SSC across the Major Estuaries
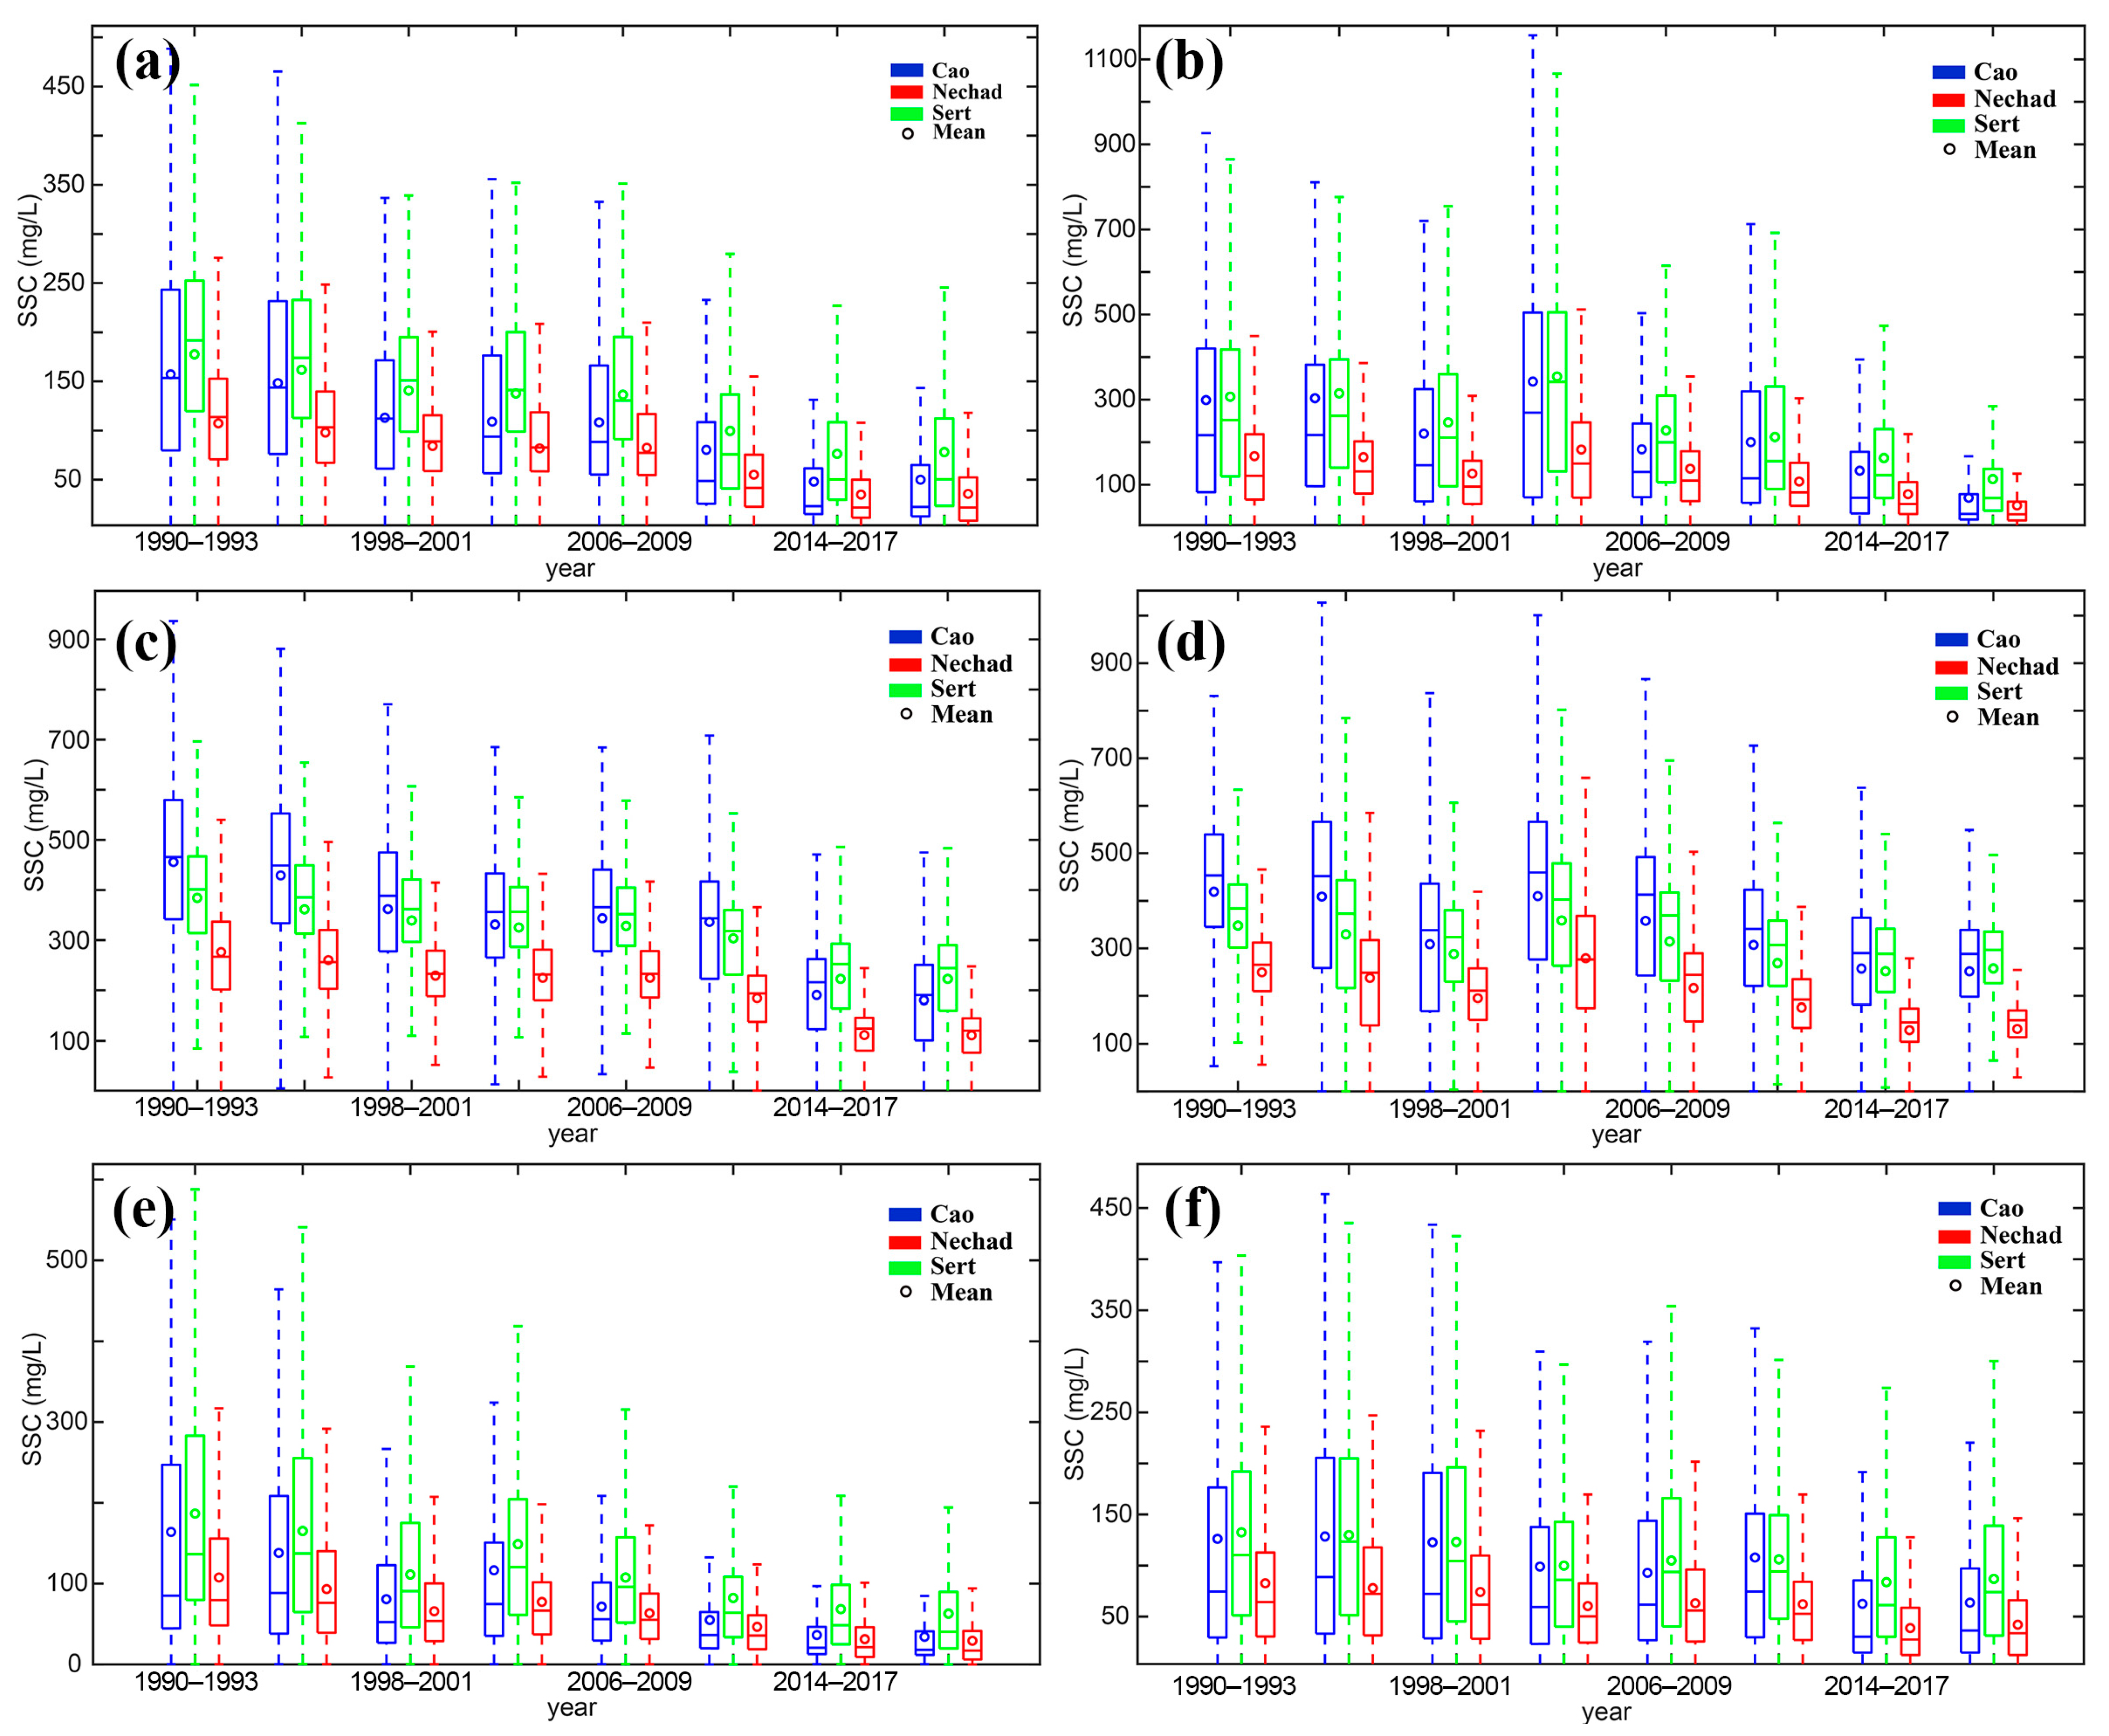
Figure 6 illustrates the interannual fluctuations in SSC at the estuaries of the Liao River, Yellow River, Yangtze River, Hangzhou Bay, Pearl River, and Mekong River, spanning the years from 1990 to 2020 (Figure 6). The outcomes underscore a notable coherence among all three models in capturing the interannual variations in SSC within each estuary. Across the board, there is a discernible decrease in SSC across the estuaries, although the extent of reduction varies among the six locations. Particularly, the Yangtze River estuary witnessed the most pronounced decline in SSC. Over the periods from 1990 to 1993 and 2018 to 2020 (Figure 6c), average concentrations plummeted from 455.9 mg·L−1, 276.1 mg L−1, and 384.2 mg·L−1 to 180.4 mg·L−1, 111 mg·L−1, and 223 mg·L−1 as predicted by Sert’s, Nechad’s, and Cao’s models, respectively (Figure 6c). Similarly, the Yellow River Estuary observed the second most substantial SSC reduction, with average levels decreasing by 215.6 mg·L−1, 116 mg·L−1, and 193.4 mg·L−1 (Figure 6b) according to the three models. Comparatively modest SSC decreases were found in the Liao River Estuary and the Mekong River Estuary, registering at 107.1 mg·L−1, 71.7 mg·L−1, 99.4 mg·L−1, and 45.5 mg·L−1, 40.6 mg·L−1, 62.4 mg·L−1, respectively (Figure 6a,f). It is noteworthy that all estuaries, except the Mekong River Estuary, exhibited a significant SSC decrease between 1998 and 2001. Notably, previous studies suggest that the El Niño-Southern Oscillation could contribute to abrupt shifts in water body SSC [47].
This study utilized Sen’s slope and M-K test to scrutinize the trends in SSC data across various estuaries during the timeframe spanning from 1990 to 2020 (Table 2). The results indicated a significant downward trend in SSC for all the examined estuaries, as indicated by the three models (p < 0.01). Remarkably, the Yangtze River Estuary exhibited the swiftest decline with rates of −12.44 mg·L−1·yr−1, −7.57 mg·L−1·yr−1, and −7.65 mg·L−1·yr−1 according to Sert’s, Nechad’s, and Cao’s models, respectively. Following suit, the Yellow River Estuary registered a noteworthy reduction, with rates of −9.39 mg·L−1·yr−1, −4.78 mg·L−1·yr−1, and -8.23 mg·L−1·yr−1 across the respective models. Meanwhile, the Mekong River Estuary displayed a comparably milder decline with rates of −3.19 mg·L−1·yr−1, −1.88 mg·L−1·yr−1, and −3.81 mg·L−1·yr−1 based on the corresponding models.
3.3. Seasonal Variations in SSC
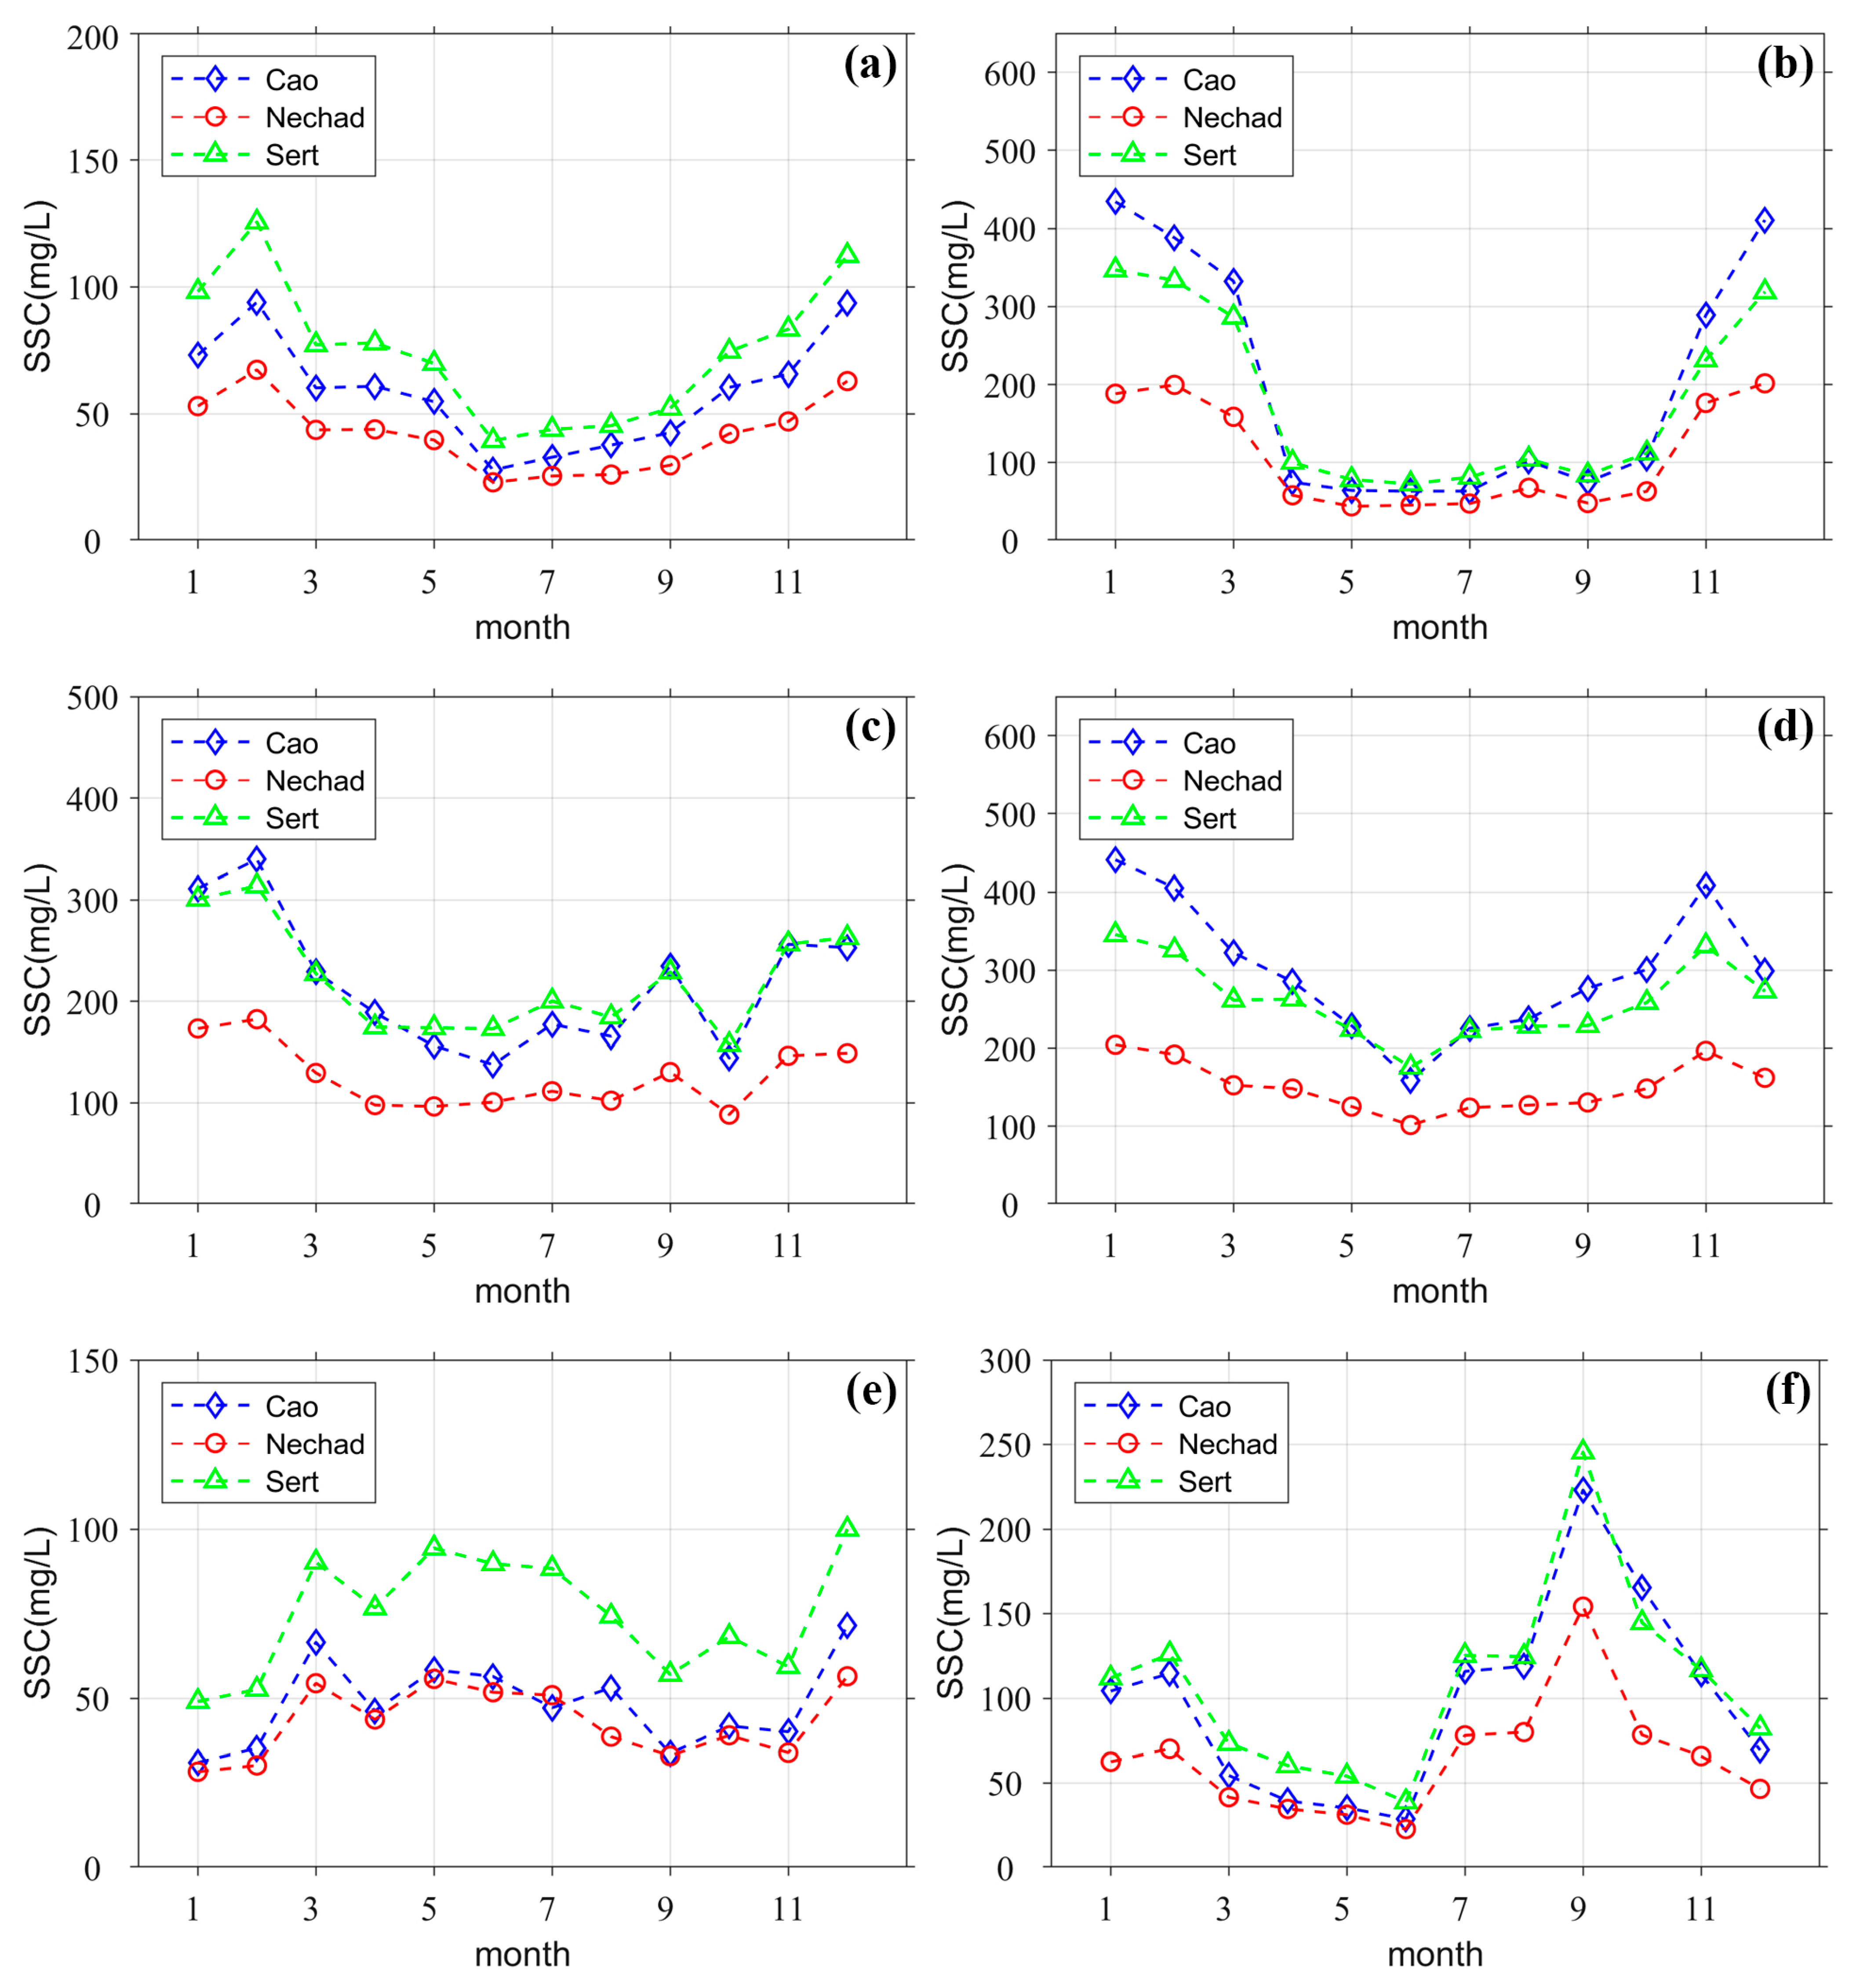
This study conducted further analysis of the seasonal fluctuations in SSC across different estuaries. The monthly SSC average values from 2013 to 2020 were calculated to explore these variations. As illustrated in Figure 7, there exists a high degree of consistency among the three models in depicting the intra-annual variations for each estuary (Figure 7). Moreover, the SSC patterns of the six major estuaries exhibit distinct and significant seasonal disparities. In the Mekong River Estuary, the SSC exhibits a pronounced increase during the monsoon season compared to the dry season, with levels increasing from June and reaching a peak in September. Similarly, the Pearl River Estuary displays remarkable seasonal variation, with high SSC values during spring and summer contrasted with lower values in autumn and winter. Specifically, SSC reaches its zenith in March and May, while February registers the lowest monthly SSC levels [21,24]. In Hangzhou Bay, SSC follows a well-defined seasonal rhythm, characterized by higher values during winter and spring (November to April) and relatively lower values during summer and autumn. SSC gradually diminishes from February and reaches its nadir in June. Moving to the Yangtze River Estuary, SSC attains its peak during winter and steadily declines throughout spring, subsequently showing an upward trend as summer commences.
Comparatively, the Yellow River Estuary experiences higher SSC from November to March and lower levels from April to October. The seasonal variation in the Liao River Estuary mirrors that of the Yellow River Estuary, featuring a decline from April to October, followed by an increase [48].
3.4. Spatial Patterns of SSC across Estuaries
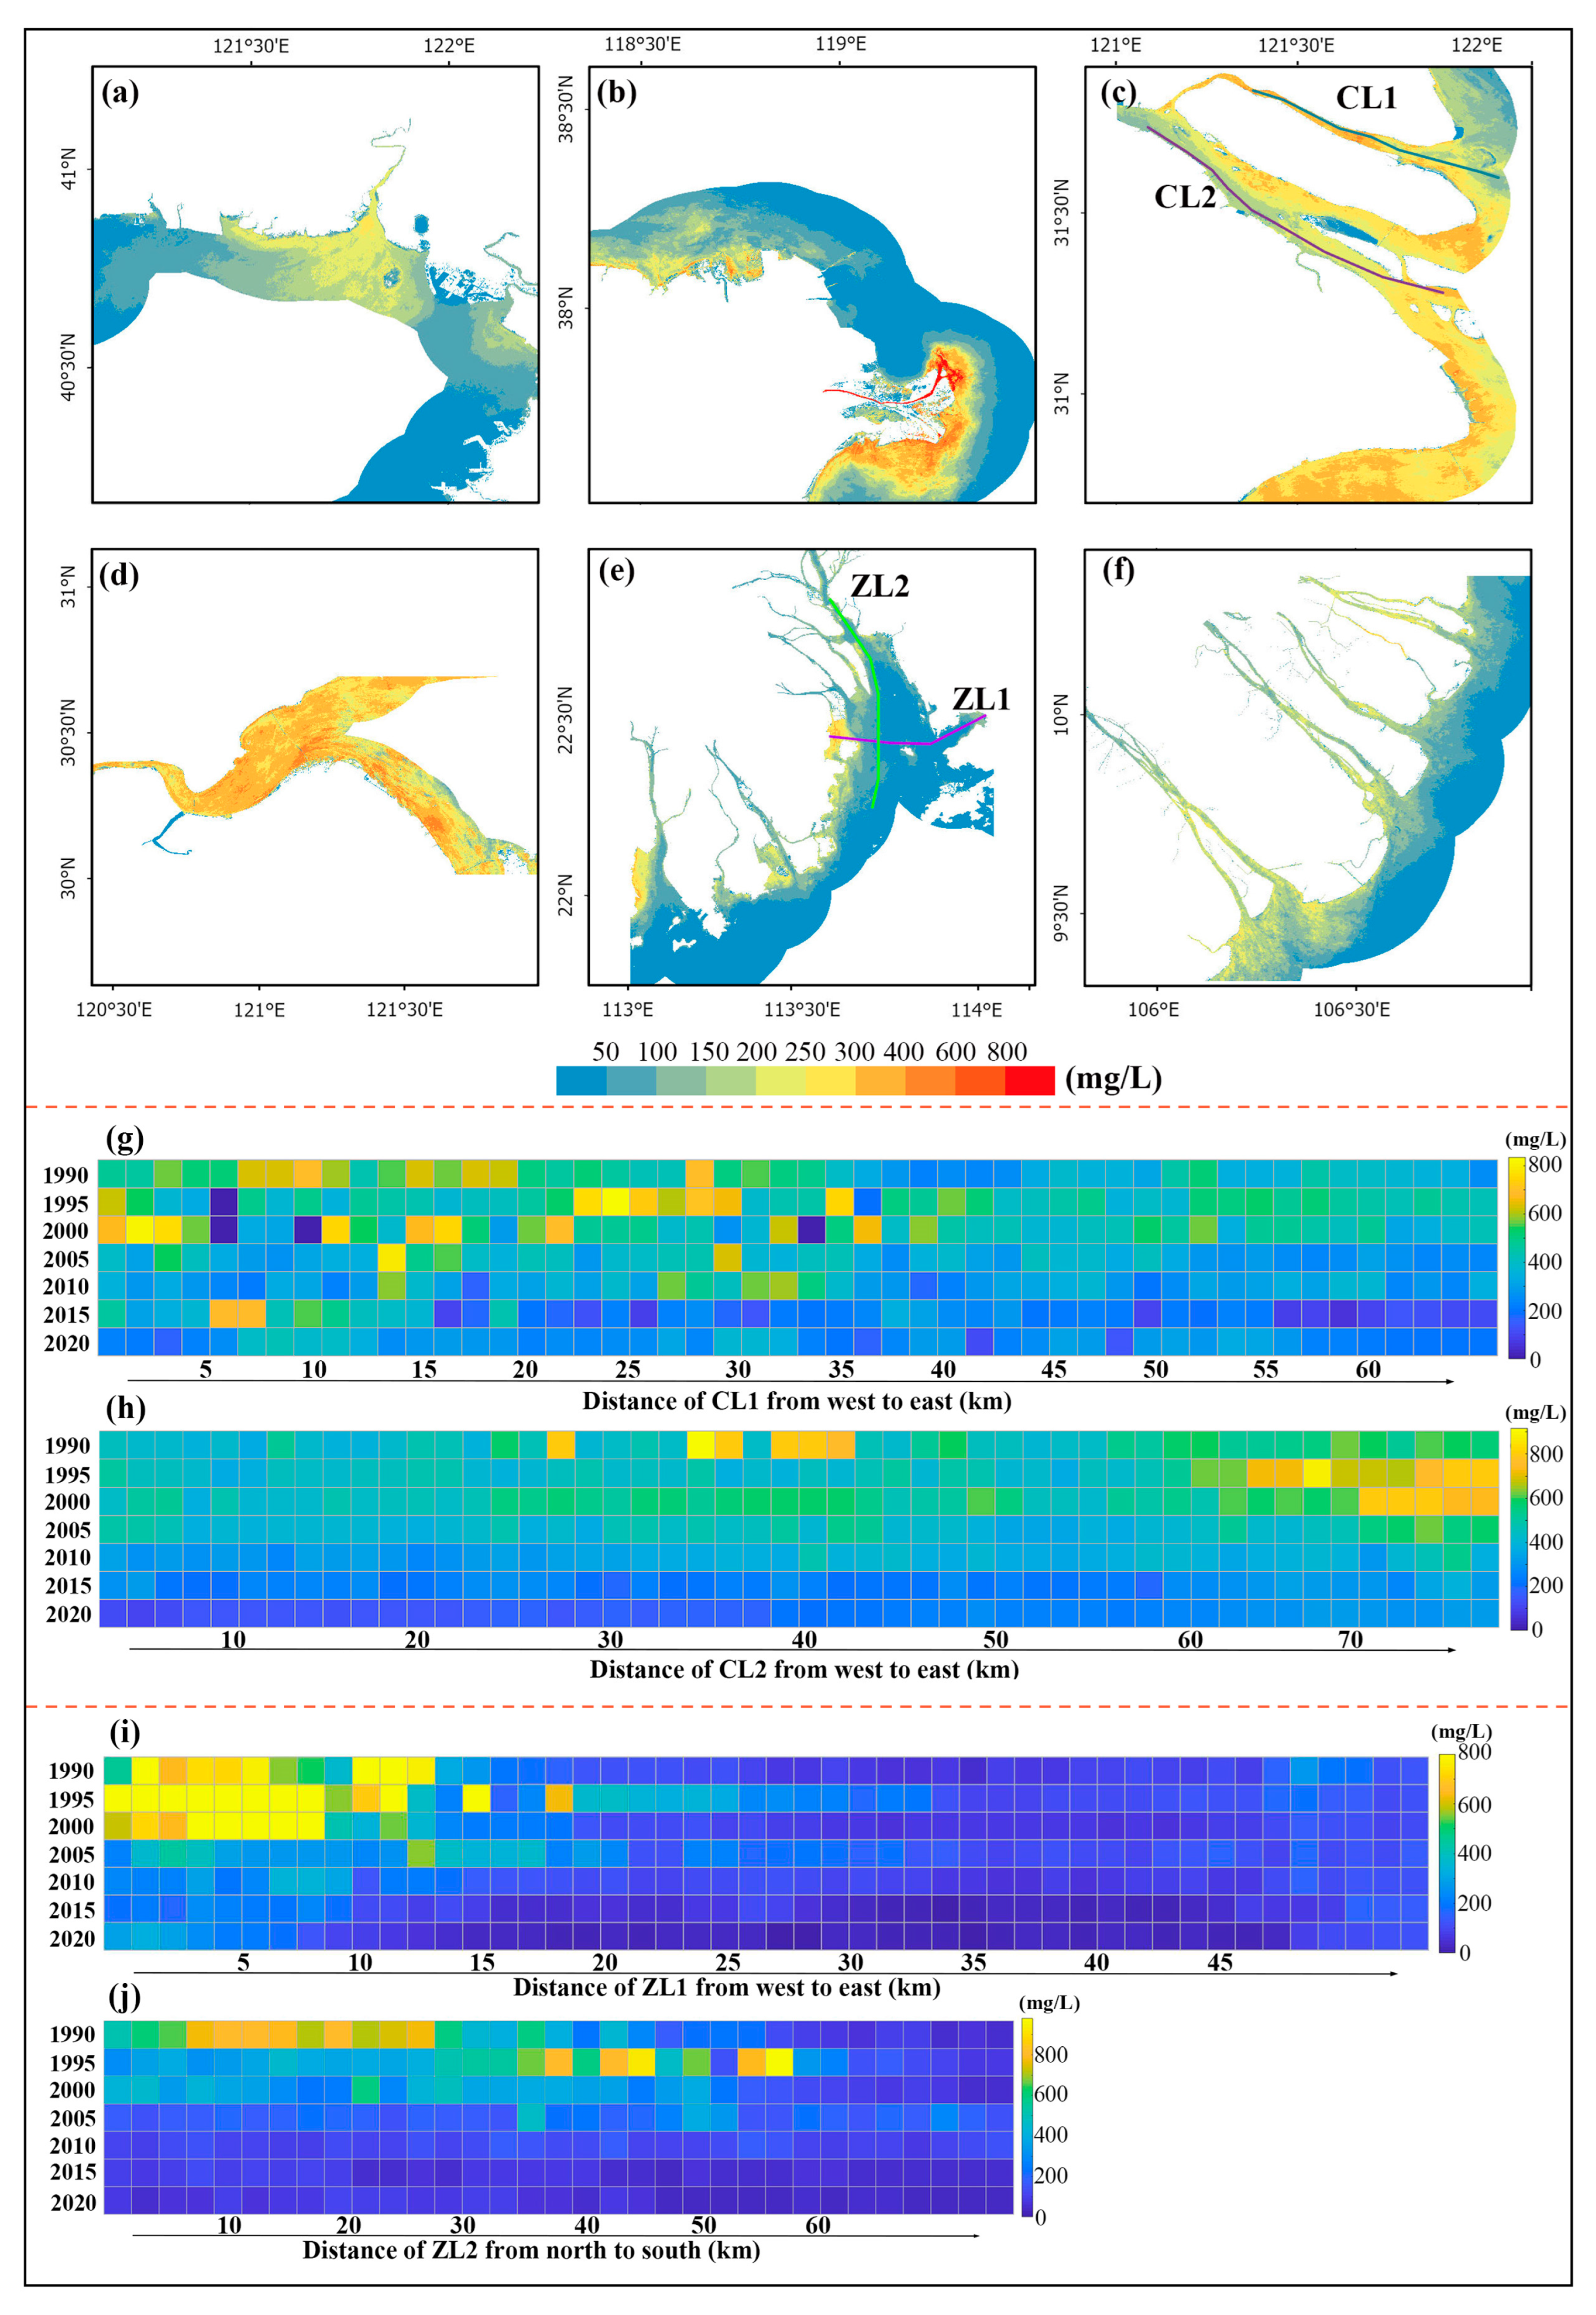
Figure 8 illustrates the average spatial distribution of SSC in the six estuaries from 2018 to 2020. Notably, each estuary exhibits a consistent spatial distribution pattern across the three models. This study exemplified the spatial distribution pattern of SSC using Sert’s model. According to Figure 8, the SSC in the Yangtze River Estuary, Yellow River Estuary, and Hangzhou Bay exhibited notable elevation compared to the other estuaries. Insight from Figure 6 has revealed that the Yangtze River Estuary, Hangzhou Bay, and Yellow River Estuary have consistently exhibited higher sediment concentrations over the past three decades, with most or all of the time demonstrating average SSC values exceeding 100 mg·L−1. Particularly, the Yangtze River Estuary and Hangzhou Bay even showed SSC values surpassing 400 mg·L−1. In contrast, the Liao River Estuary, Pearl River Estuary, and Mekong River Estuary have relatively lower sediment concentrations, with their average SSC values predominantly falling below 100 mg·L−1 (Figure 6). Spatially, the SSC distribution in the Liao River Estuary, Yellow River Estuary, and Mekong River Estuary demonstrated a spatial distribution with a decreasing gradient from the inner to the outer parts of the estuaries. Conversely, the spatial distribution patterns within the Pearl River Estuary, Yangtze River Estuary, and Hangzhou Bay exhibited a more intricate arrangement.
Figure 7.
Monthly variation of suspended sediment concentration in six estuaries under three models from 2013 to 2020 for Liao River Estuary (a), Yellow River Estuary (b), Yangtze River Estuary (c), Hangzhou Bay (d), Pearl River Estuary (e), Mekong River Estuary (f).
Figure 7.
Monthly variation of suspended sediment concentration in six estuaries under three models from 2013 to 2020 for Liao River Estuary (a), Yellow River Estuary (b), Yangtze River Estuary (c), Hangzhou Bay (d), Pearl River Estuary (e), Mekong River Estuary (f).

To delve into the intricate spatiotemporal dynamics of the Pearl River Estuary and the Yangtze River Estuary, this study conducted a detailed analysis of SSC within specific local regions (ZL1, ZL2, CL1, and CL2 in Figure 8c,e). Across the transect ZL1 of the Pearl River Estuary, SSC exhibited a distinctive spatial pattern of ‘high-low-high-low-high’ from the west to the east coast (Figure 8i). Similarly, along the longitudinal transect ZL2, a clear decreasing trend in SSC was observed from north to south (Figure 8j). Regarding CL1 and CL2, which represent transect along the northern and southern navigation channels of the Yangtze River Estuary, respectively, intriguing patterns emerged. SSC within CL1 showcased a gradual decrease from west to east (Figure 8g), while in CL2, the gradient intensified, indicating contrasting transverse SSC variations between the northern and southern navigation channels of the Yangtze River Estuary (Figure 8h). Notably, across all these cross-sections, a consistent decline in SSC was evident over the study period, aligning with the interannual variations discussed in Section 3.1. This reinforces the findings of declining SSC concentrations and highlights the robustness of the observed trends.
3.5. Long-Term SSC Variations along the WPC
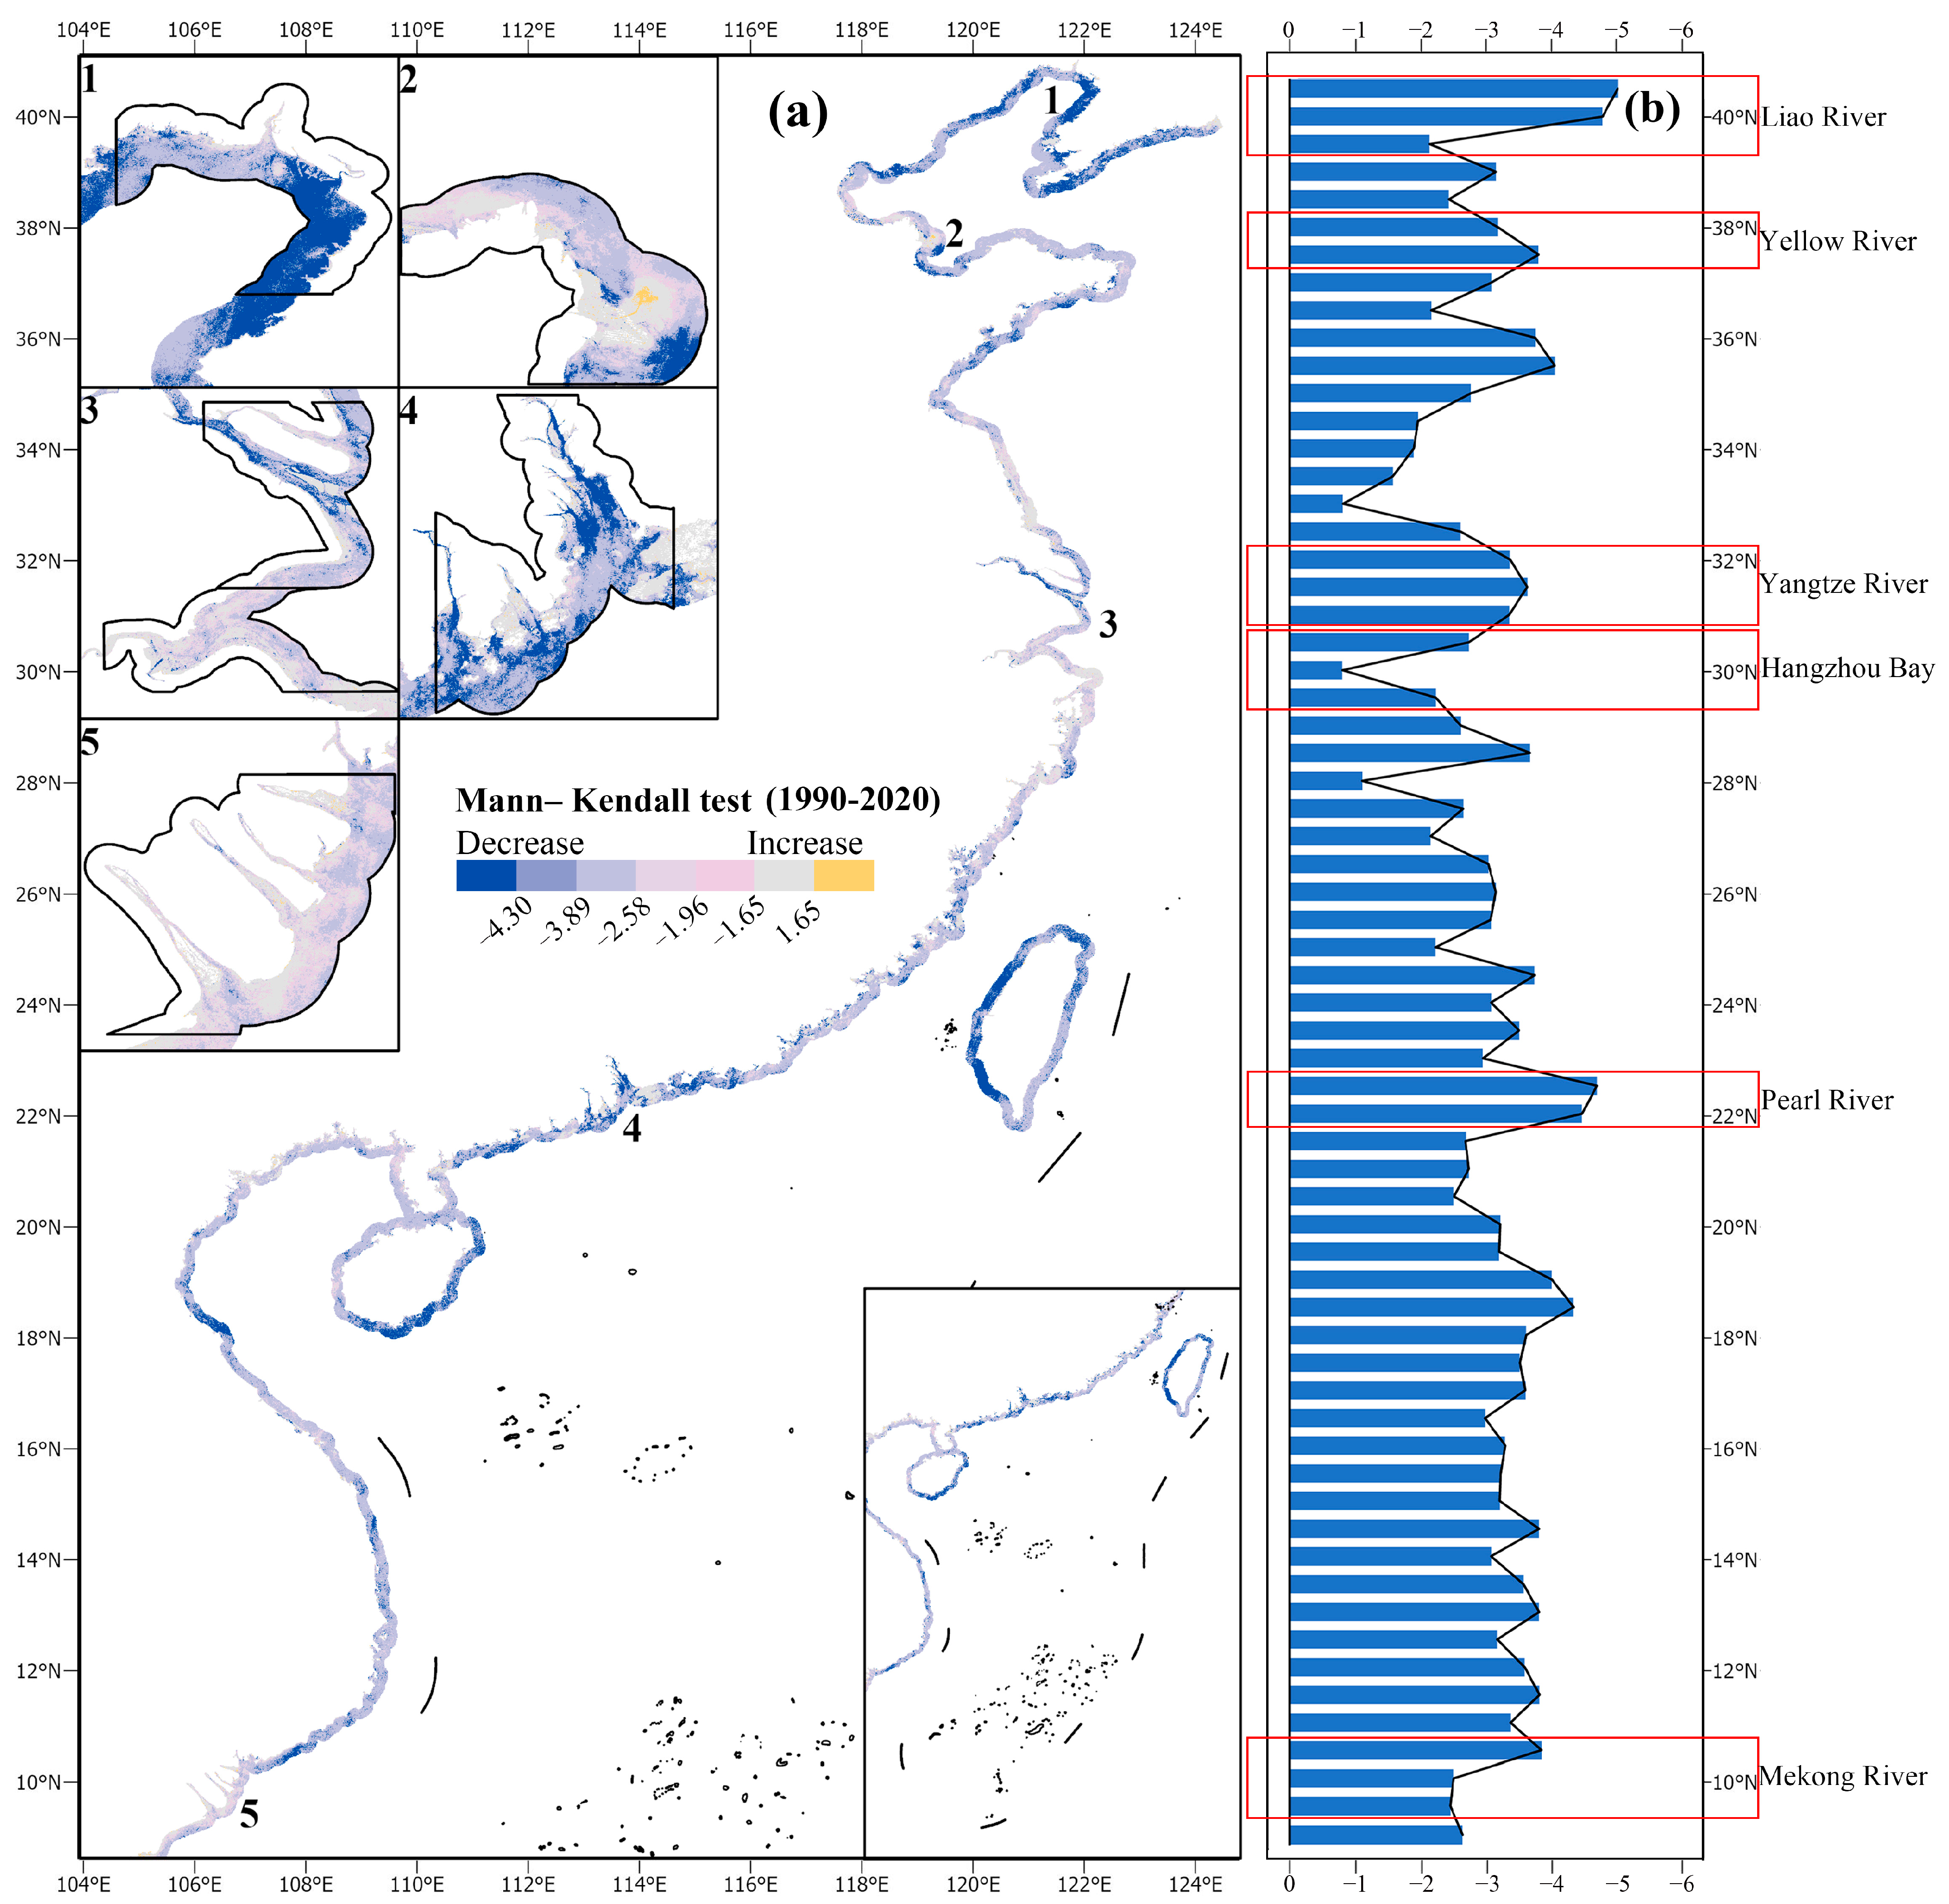
In order to comprehensively analyze the changes that transpired in the WPC during the period from 1990 to 2020, a dual approach involving the M-K trend test and Sen’s slope test was employed for the entire coastal region. Additionally, to examine the longitudinal spatial patterns of these trend tests along the WPC, Z and β samples were systematically collected at an interval of 0.5° from 9°N to 40.5°N. This meticulous examination was conducted utilizing the outcomes derived from Sert’s model. The examination of the past 31 years revealed a compelling and noteworthy trend—a significant overall decline in SSC along the WPC (Figure 9). The trend is reflected in the Liao River Estuary, Yellow River Estuary, Yangtze River Estuary, Hangzhou Bay, Pearl River Estuary, and Mekong River Estuary, all of which exhibited marked and substantial decreasing trends (indicated by Z-values < −1.96). These findings seamlessly align with the results presented in Section 3.2.
However, it is more interesting that a significant proportion of non-estuarine coasts also manifested a comparable decreasing trend. In certain instances, the trend is even more pronounced than that observed in estuaries. Notably, specific sections within the Hangzhou Bay and Mekong River Estuary displayed lower Z-values, underscoring the complexity and heterogeneity of sedimentary dynamics across the WPC.
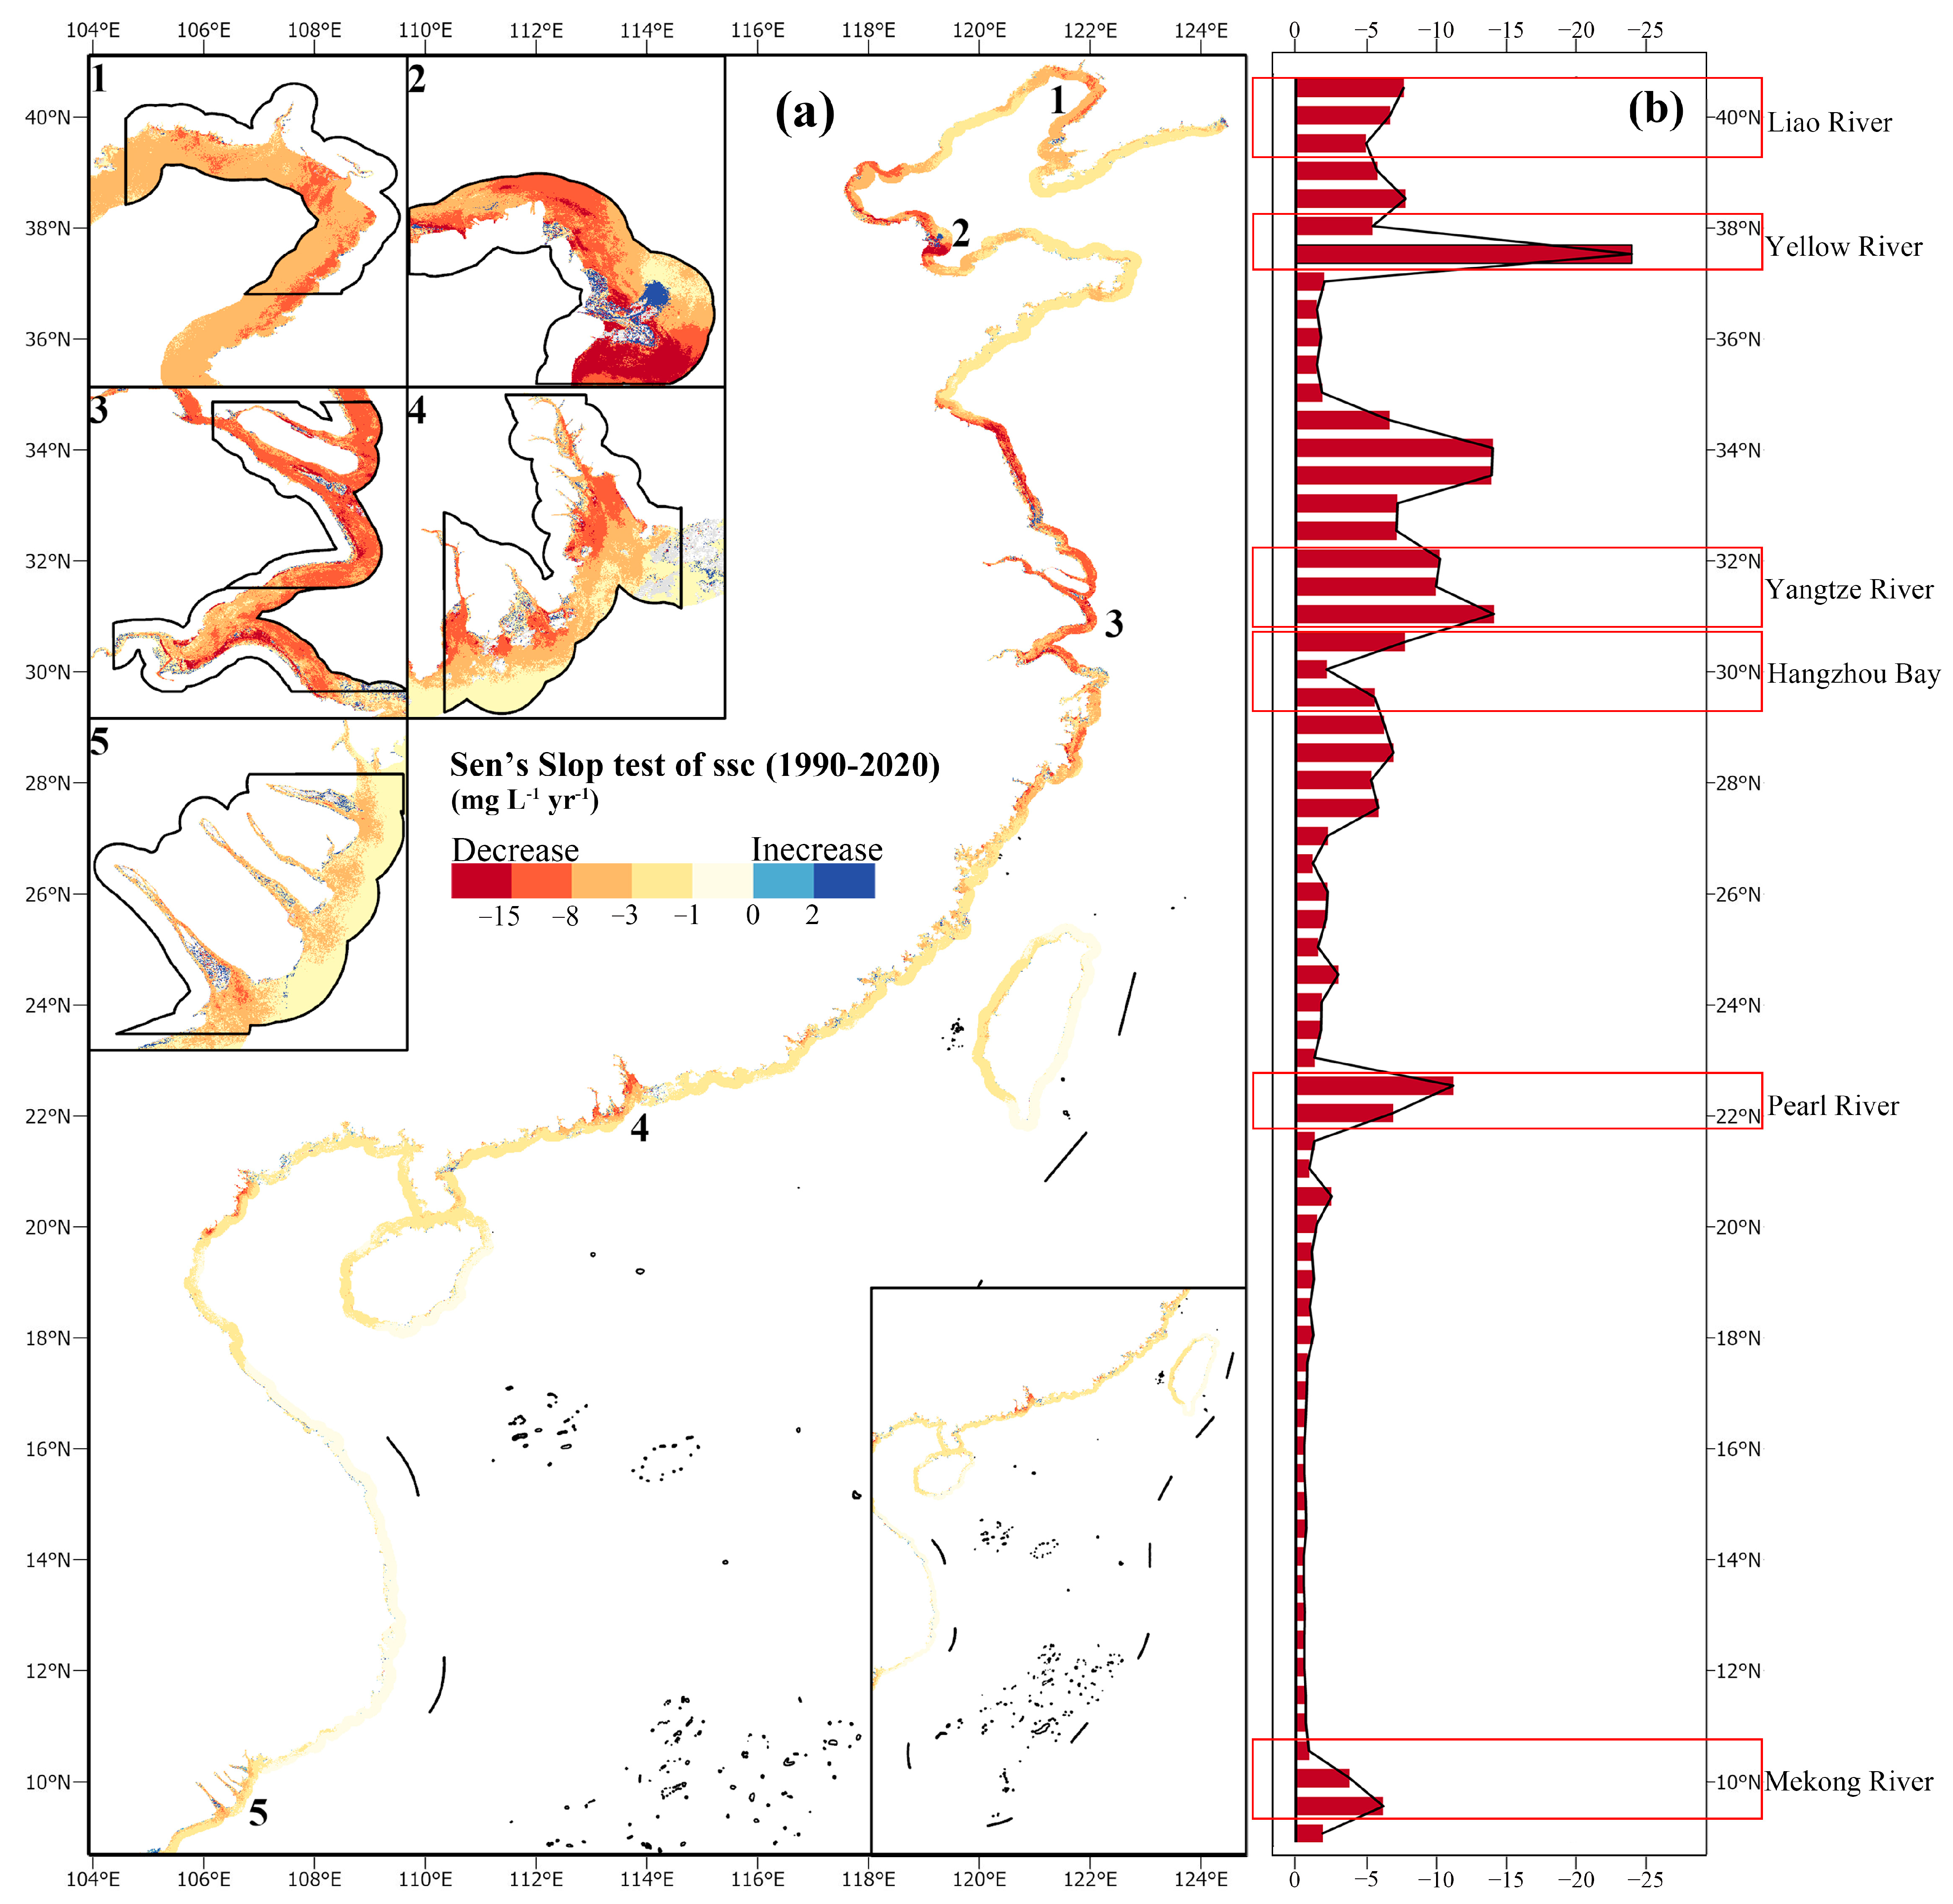
The results obtained from Sen’s slope test for SSC in the WPC also further accentuated a substantial and meaningful overall downward trend. However, in contrast to the M-K test, a distinct differentiation was observed between the estuarine and non-estuarine sections (Figure 10). The absolute magnitude of the decline in SSC within the estuarine sections has significantly outpaced that observed in the majority of non-estuarine sections. Remarkably, the absolute rate of SSC decline at approximately 37.5°N (Located within the Yellow River Estuary) registered an astonishing −20 mg·L−1·yr−1, representing the most rapid decline in SSC across the entire WPC.
Among the expanse of estuaries, the regions proximate 10°N and 30°N (corresponding to the Pearl River Estuary and Hangzhou Bay, respectively) exhibited relatively more modest decline rates in SSC. In the context of non-estuarine regions, the northern region spanning 33.5°N to 34.5°N, which corresponds to the Yangtze River Estuary, exhibits the most rapid decline in SSC, even surpassing certain estuaries. In stark contrast, the coastal stretch from the Pearl River Estuary to the Mekong River Estuary (ranging from 11°N to 21°N) along the Vietnamese coastline exhibited the most meager decline rate in SSC, characterized by a rate below 1.0 mg·L−1·yr−1.
It is notably discernible that both estuarine and non-estuarine sections in the northern part of the WPC exhibited higher decline rates than their counterparts in the southern part. Moreover, a noticeable spatial pattern emerges as the overall SSC decline rate within the WPC gradually decreases from north to south.
4. Discussion
4.1. Possible Causes of Seasonal SSC Changes
The influence of the marine environment on SSC variations reveals distinct patterns. Both the Liao River Estuary and the Yellow River Estuary exhibit significant susceptibility to the hydrological conditions of the Yellow Sea, consequently showcasing similar sediment change characteristics. Conversely, the Yangtze River Estuary and Hangzhou Bay are primarily influenced by the hydrological conditions of the East China Sea, resulting in relatively comparable sediment change traits. Moving to the Pearl River Estuary and the Mekong Estuary, their sediment dynamics are impacted by the hydrological conditions of the South China Sea. However, due to the substantial spatial separation between these two estuaries, their seasonal sediment change characteristics differ significantly.
Indeed, the seasonal fluctuations in estuaries result from a complex interplay of various factors, and the observed discrepancies among the six estuaries can be attributed to distinct dominant influencing elements. The Mekong River, for instance, influenced by the southwest monsoon, encounters heightened SSC levels during the monsoon season (June to November) due to substantial precipitation [49]. Despite the similar monsoon impact, the Pearl River exhibits unique SSC seasonal variations. Intriguingly, the flood period of the Yangtze River (May to November) does not coincide with the peak SSC period, also suggesting that precipitation might not solely govern the seasonal SSC changes in both the Yangtze River Estuary and the Pearl River Estuary. The pronounced winter SSC peak in these estuaries might instead be influenced by Pacific Ocean currents [50].
As mentioned above, the close proximity of Hangzhou Bay to the Yangtze River Estuary results in similar seasonal variation characteristics. This correlation stems from the Yangtze River Estuary acting as the primary source of suspended sediment for Hangzhou Bay, hereby influencing the seasonal SSC fluctuations within Hangzhou Bay. In contrast, the seasonal variations in the Yellow River Estuary are predominantly influenced by sediment discharge from the Yellow River itself and prevailing wind patterns [51]. During autumn, winter, and spring, the nearshore waters near the Yellow River estuary often encountered cold wave intrusions, leading to significant sea surface wave heights. In this estuary, sediment discharged during the flood season accumulates near the river mouth, while the dry season witnesses strong marine hydrodynamic conditions that resuspended the previously deposited sediment. Notably, storm surges play a significant role in dispersing suspended sediment from estuaries towards the open sea. The dynamics of suspended sediment transport in the nearshore area of the Yellow River Estuary are a result of the combined effects of river flow and tidal dynamics. Conversely, the interplay between the tidal system of the Bohai Sea and the local topography modulates coastal tidal currents. This modulation, in turn, influences the transport of suspended sediment in the vicinity of the Yellow River Estuary.
4.2. Possible Causes of Interannual SSC Changes
Our investigation has unveiled a complex interplay of spatial and temporal fluctuations in SSC within the WPC. Notably, distinct seasonal variabilities exist among the six major estuaries distributed across varying geographical locales. Furthermore, disparities in long-term trend fluctuations emerged not only among larger estuaries but also between estuaries and smaller non-estuarine sections, as well as within the non-estuarine regions themselves. Climate change and human activities emerged as shared catalysts shaping this intricate variability, with specific factors asserting dominance over particular variations.
Climate change exerts both direct and indirect influences on SSC dynamics. It directly impacts the erosive potential and transport capacity of suspended sediment while also indirectly altering land cover and management practices, ultimately influencing erosion patterns [52]. A significant correlation between SSC and runoff, where SSC tends to rise alongside increased runoff, underscores this connection [14]. The consistent intra-annual SSC variability, illustrated in Figure 7, can be ascribed to the impact of seasonal rainfall patterns on runoff dynamics. Additionally, it is worth noting that extreme rainfall events can lead to increased river discharge and sediment flux, resulting in elevated SSC [4,40]. Hence, it is evident that climate change primarily influences short-term and periodic SSC fluctuations, which, in turn, contribute to the varying seasonal patterns observed among different estuaries [5].
In contrast, human activities have emerged as the primary driver of long-term declines in riverine sediment flux, particularly in recent decades. Studies have indicated that a significant proportion of the world’s major rivers, including many large rivers in Asia, have experienced substantial alterations in sediment flux due to human activities. Dethier et al. [14] indicated that more than 50% of large rivers in the world have experienced significant changes in sediment flux since 1980, and the sediment flux of most Asian rivers decreased over the past four decades. This phenomenon is echoed in our observations. Dam construction, soil conservation measures, and alterations in water usage patterns have collectively contributed to the marked reduction in sediment transport in Asian rivers. The Mekong River Basin has seen the construction of over 130 large dams between 1990 and 2015, leading to the interception of a substantial portion of upstream sediment, resulting in a staggering 74.1% reduction in sediment flux to the Mekong River delta [8]. Similarly, over 50,000 dams have been erected in the Yangtze River Basin since 1950 [53], with the Three Gorges Dam’s water retention in 2003 causing a drastic 95% reduction in sediment discharge over a five-year span [54]. Dam construction has similarly impacted sediment levels in the Pearl River Basin since the 1990s [55].
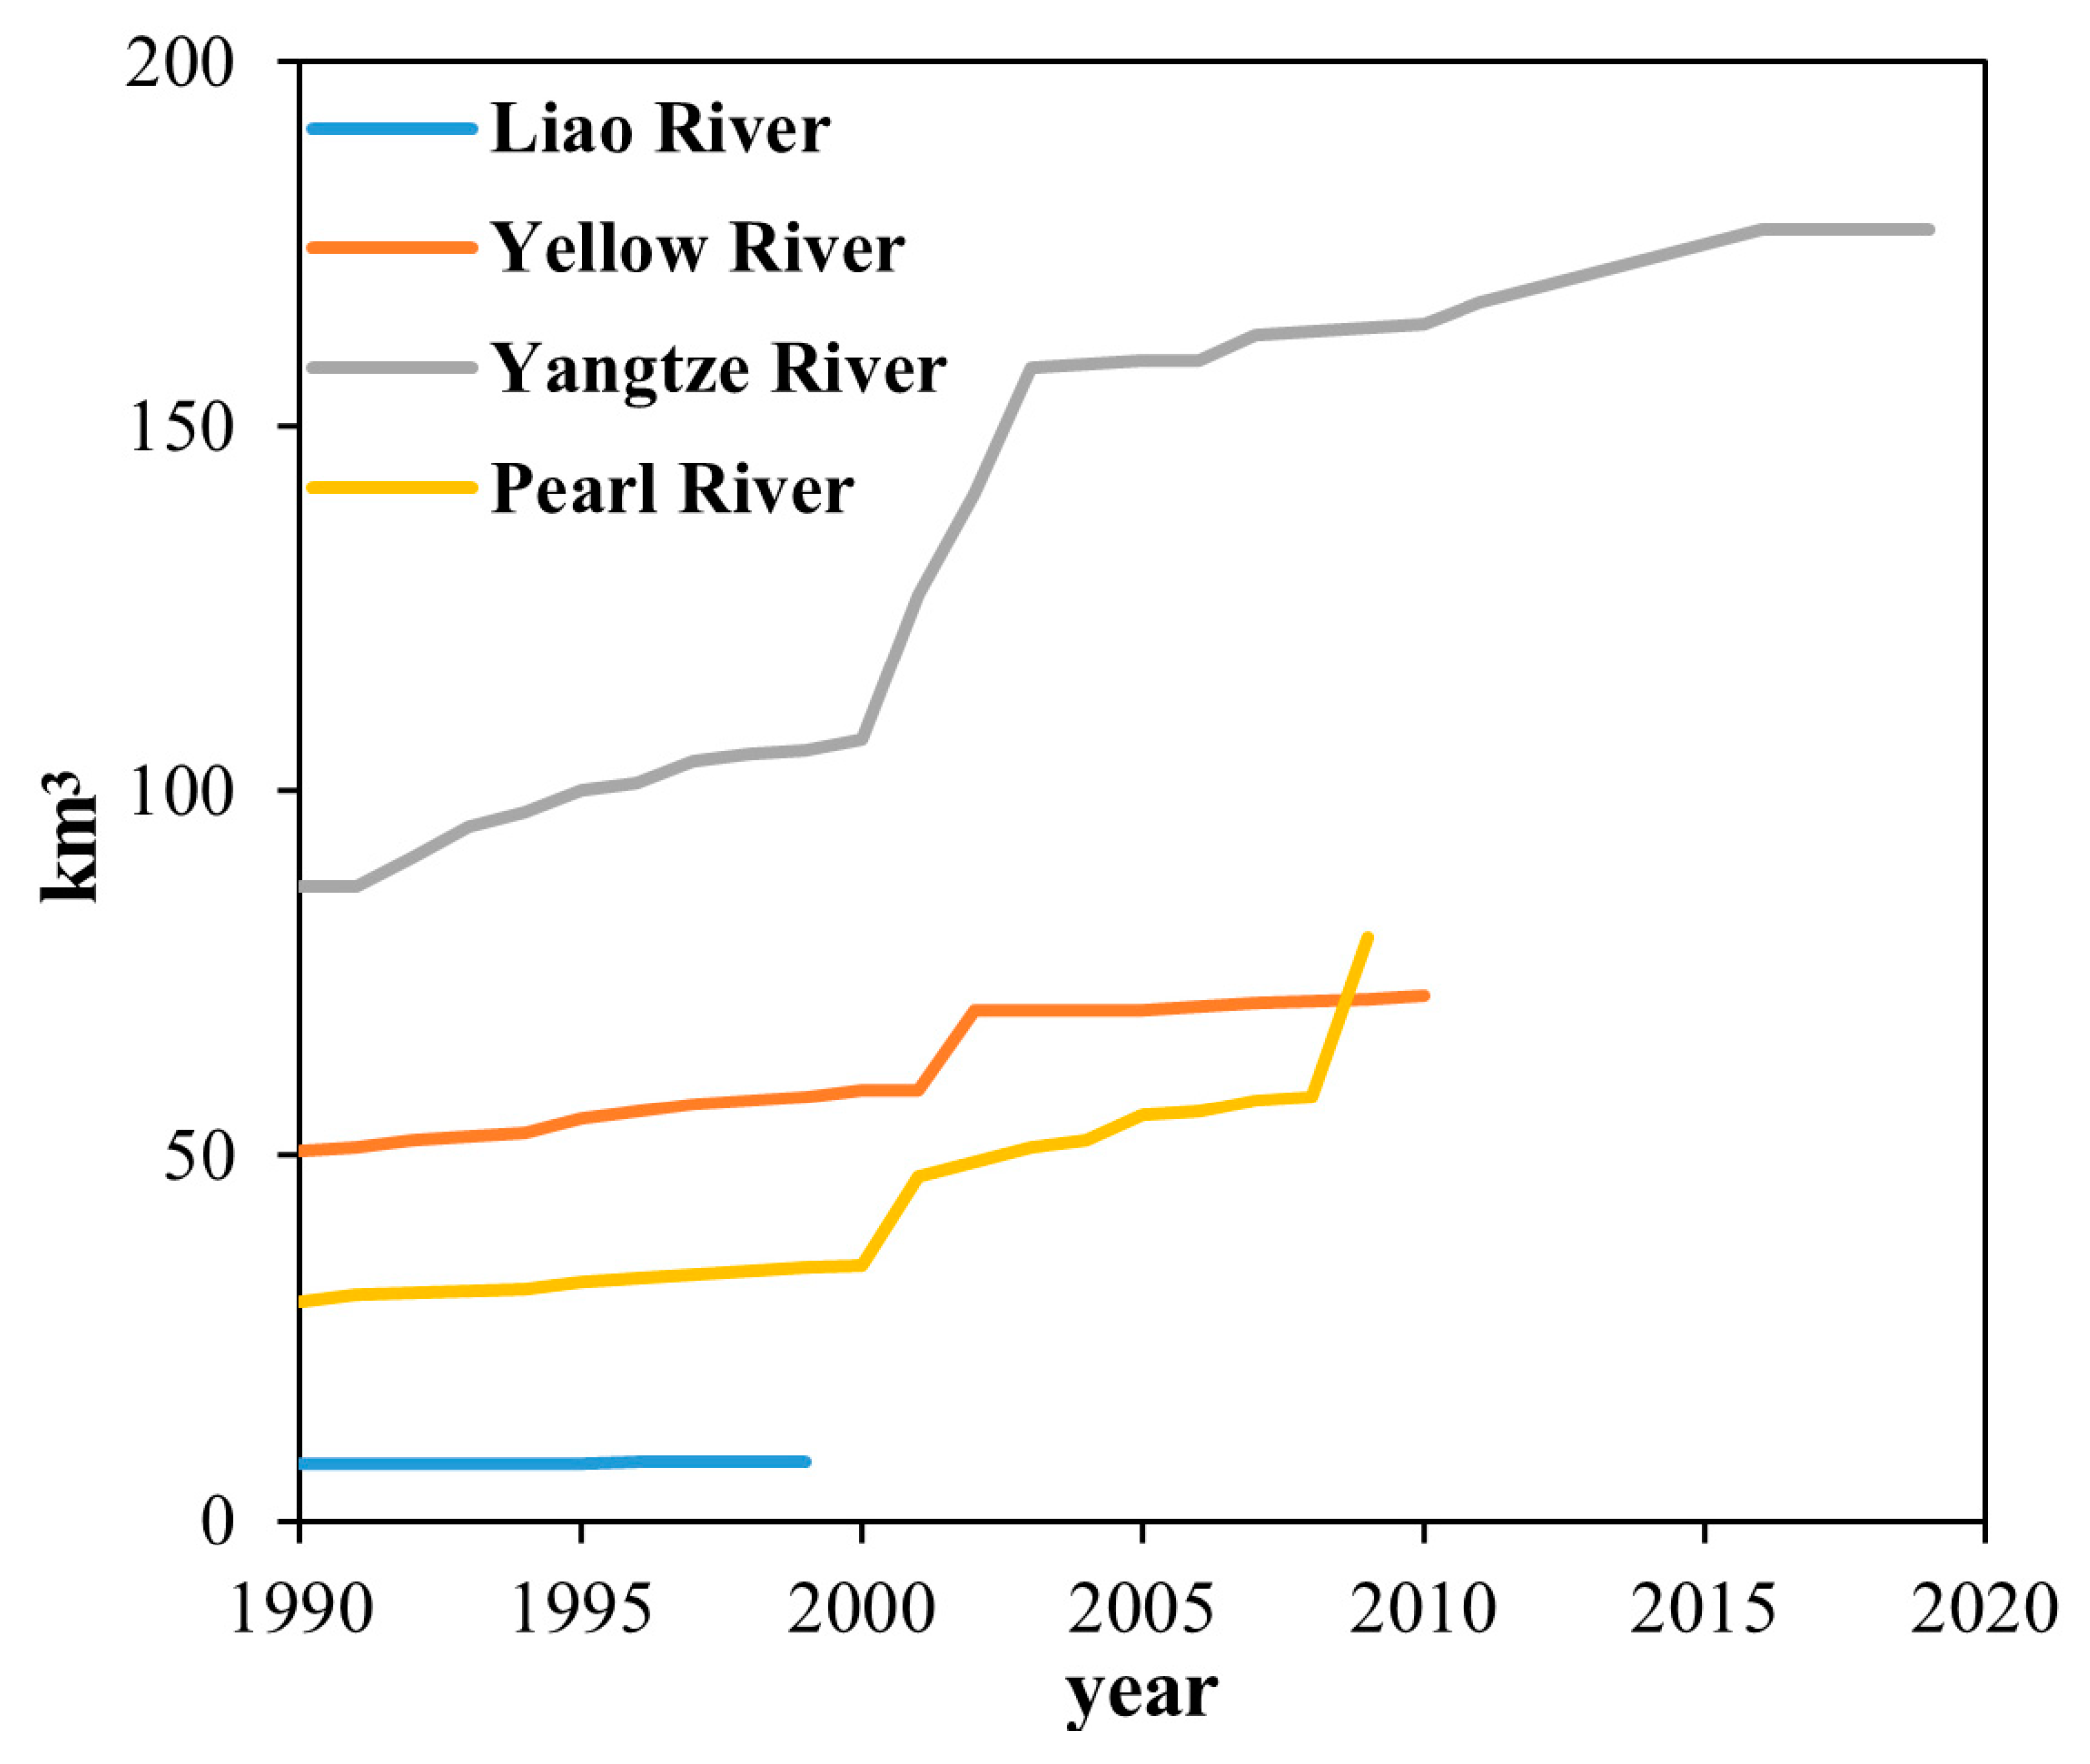
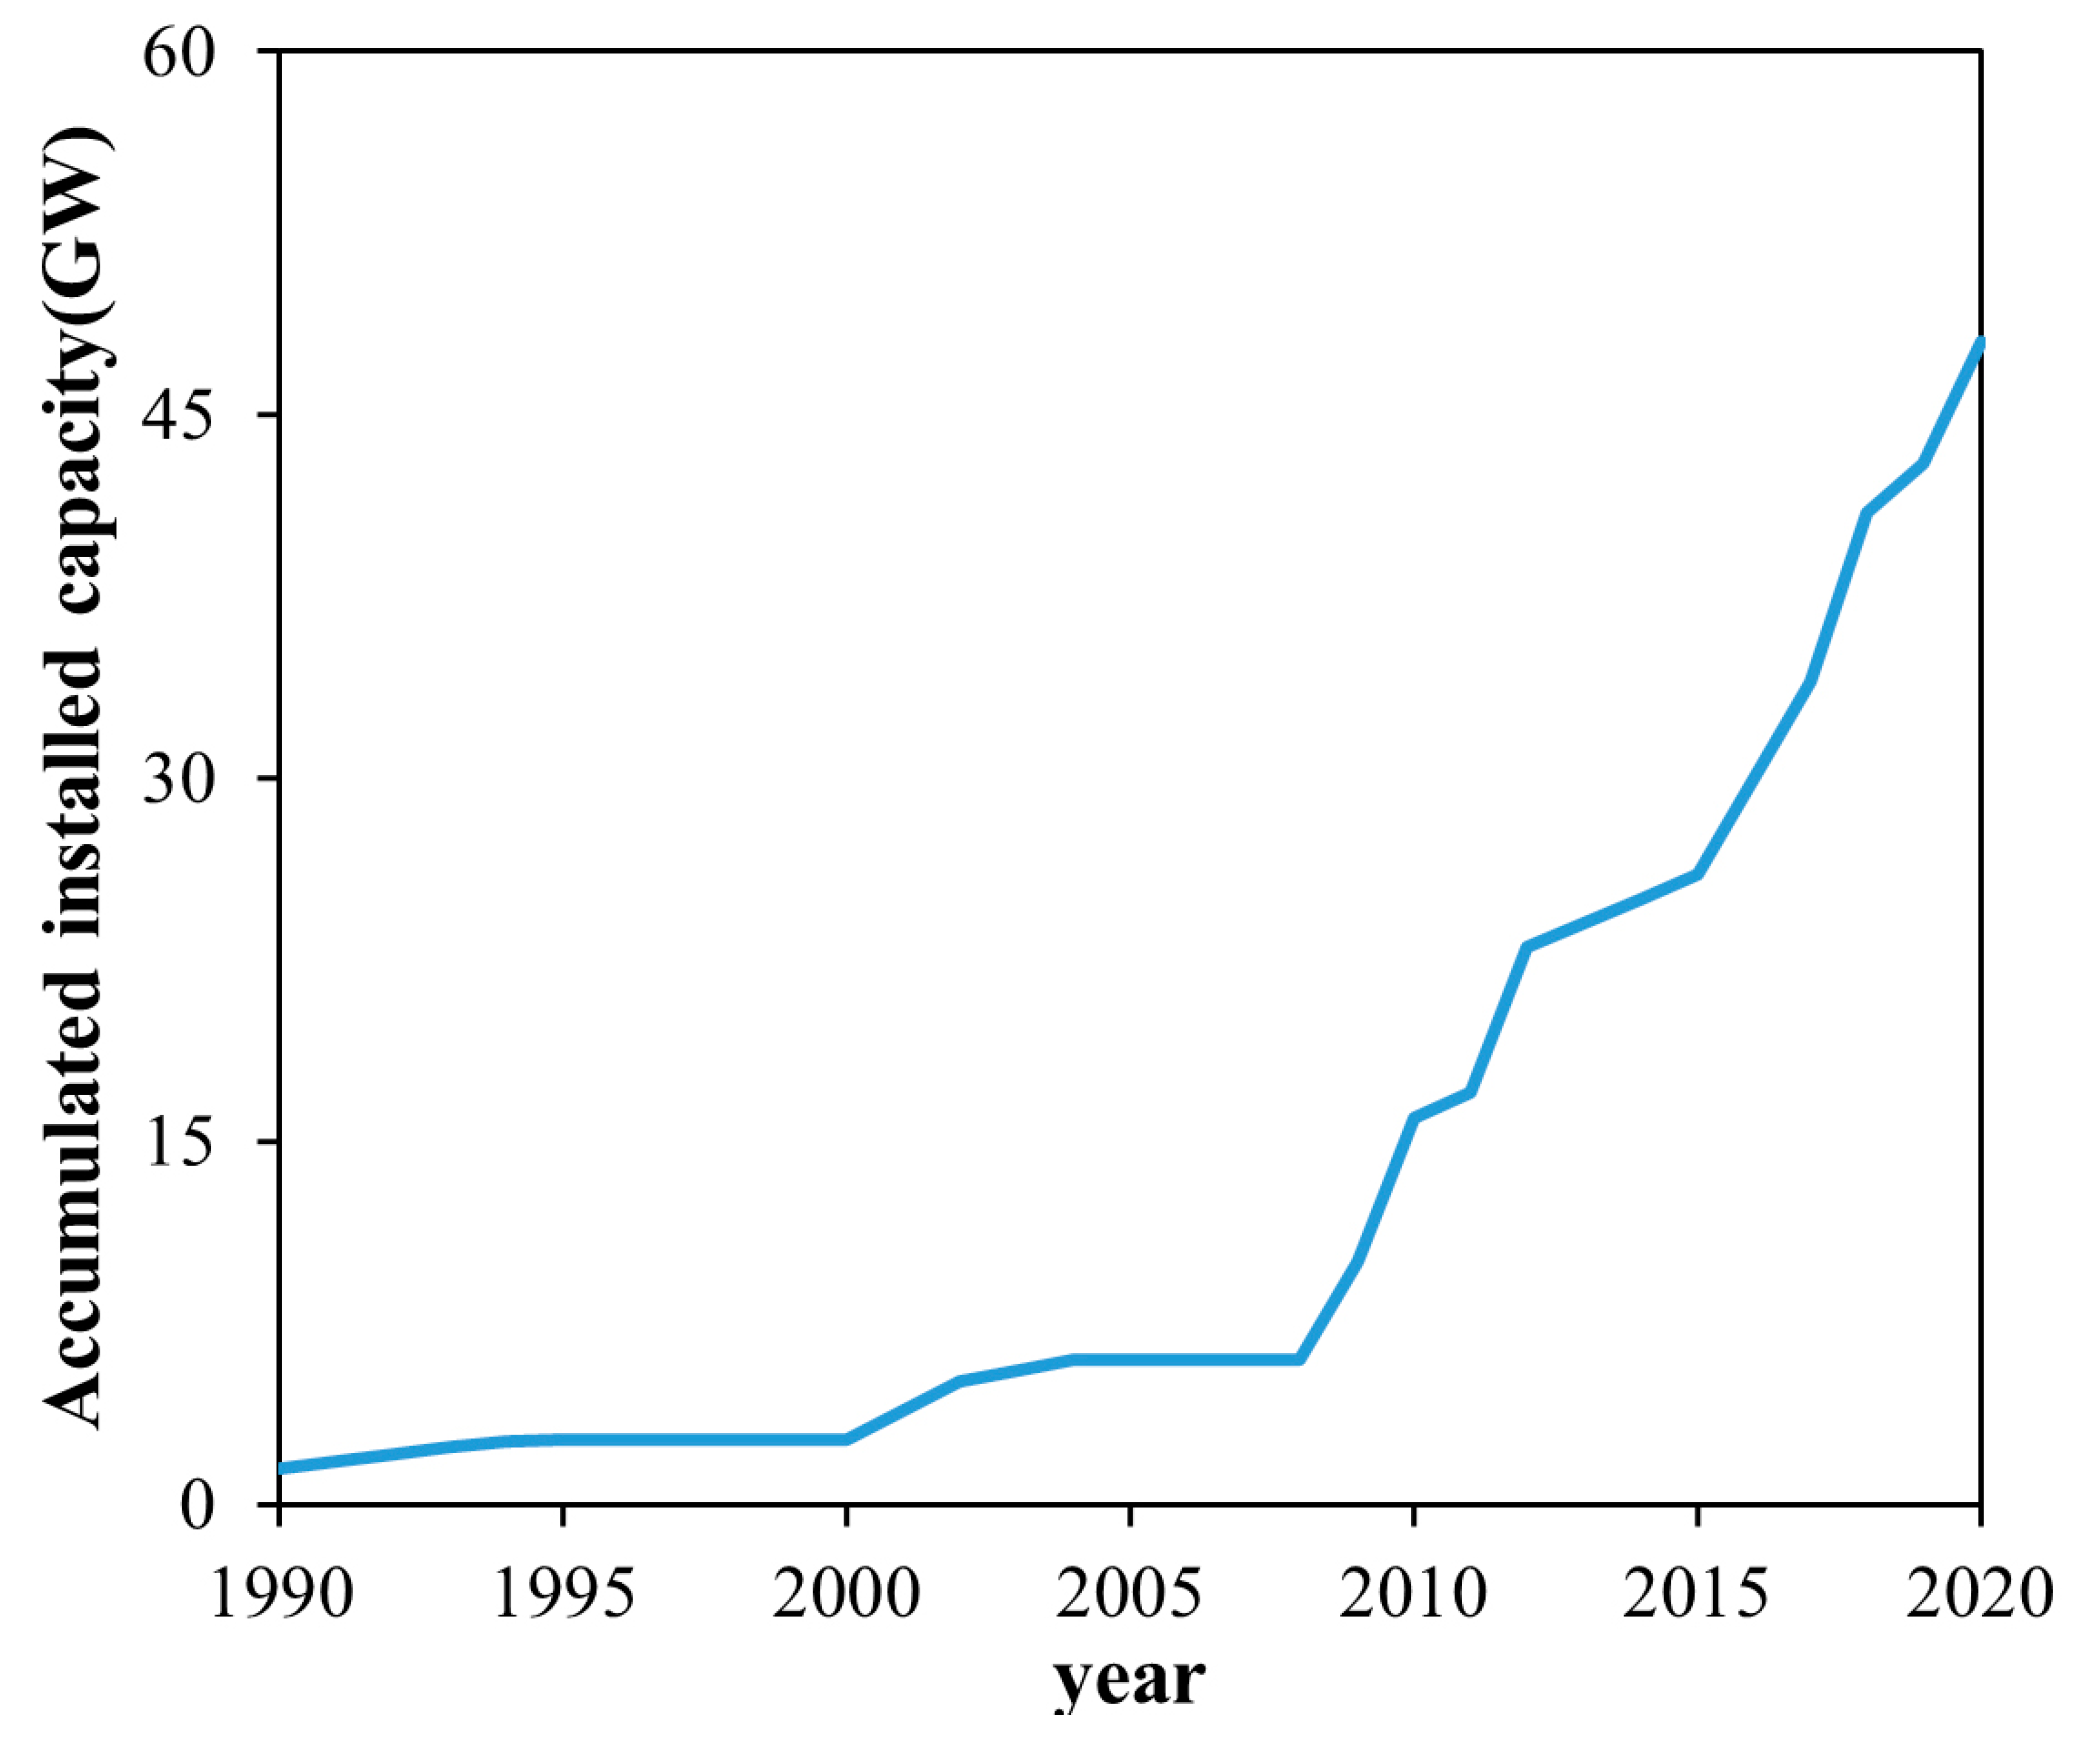
Figure 11 and Figure 12 provide a graphical representation of the cumulative storage capacity of medium- and large-sized dams in various river basins over the past two decades. This data illustrates an escalating trend in dam storage capacity, except for the Liao River basin. This surge in dam construction has effectively intercepted substantial amounts of suspended sediment, leading to significant declines in SSC levels within estuarine and nearshore waters (Figure 11 and Figure 12).
Soil conservation measures and changes in domestic water usage have also played a significant role in curtailing sediment loads. The Yellow River, once renowned as the world’s largest sediment contributor, experienced rampant soil erosion in the Loess Plateau region. Notably, strategic soil conservation efforts have curbed sediment inflow into the Yellow River by means of robust vegetation planting initiatives. Moreover, the extensive utilization of water for industrial and agricultural purposes has dampened the hydrodynamic impact of the Yellow River, consequently diminishing its sediment-carrying capacity [9,56]. In contrast, the scenario in the Liao River presents a different facet. Despite the relative stability in the number of dams over the past three decades, the decline in sediment load is predominantly attributed to shifts in domestic and industrial water consumption and the implementation of soil conservation strategies.
The dynamic shifts in SSC within estuaries predominantly stem from the intricate interplay of river sand transport mechanisms. This intricate process yields a swift reduction in estuarine SSC, thereby manifesting as the most pronounced decline in SSC across the entire coastal zone. This phenomenon serves to elucidate the observations we have made (Figure 10). However, it is noteworthy that non-estuarine areas within the WPC also exhibit a notable downward trend in SSC. Remarkably, the pace of this decline is markedly more rapid in the northern WPC compared to its southern counterpart. Furthermore, the estuaries displaying the most notable rate of decline (namely, the Liao River estuary, Yellow River estuary, and Yangtze River estuary) are geographically concentrated in the northern WPC. These compelling findings collectively indicated that the alterations in SSC within non-estuarine sections are likely under the influence of their larger counterparts. Importantly, the decline in SSC within estuaries significantly contributes to the overarching reduction in SSC across the entire WPC.
4.3. The Impact of Suspended Sediment Reduction
With the intensifying human activities, the decrease in suspended sediment within rivers has become a global phenomenon since the mid-20th century, attracting intense research attention and concern from the international community. Preserving sustained estuarine sediment supply to estuaries holds the potential to mitigate issues like shoreline erosion, land subsidence, and riverbed incision [57,58]. Remarkably, coastal zones stand as some of the world’s most densely populated regions, with estuarine deltas supporting over 500 million people. However, the continuous reduction of sediment from upstream intensifies the erosion in these estuarine delta regions, leading to substantial land loss. Model projections by Edmonds et al. illustrate this trend; for instance, the Barataria Basin, constituting a significant portion of land loss in the Mississippi Delta, has seen nearly a 50% decrease in its natural expansion from 1890 to 2020, primarily due to human activities such as dam construction, levee building, and resource extraction [10]. Similarly, the impoundment of water at the Xiaolangdi reservoir around 2000 has caused a significant reduction in sand transport from the Yellow River. As a result, there is a rapid decline in the land areas of the Yellow River delta lobe [59].
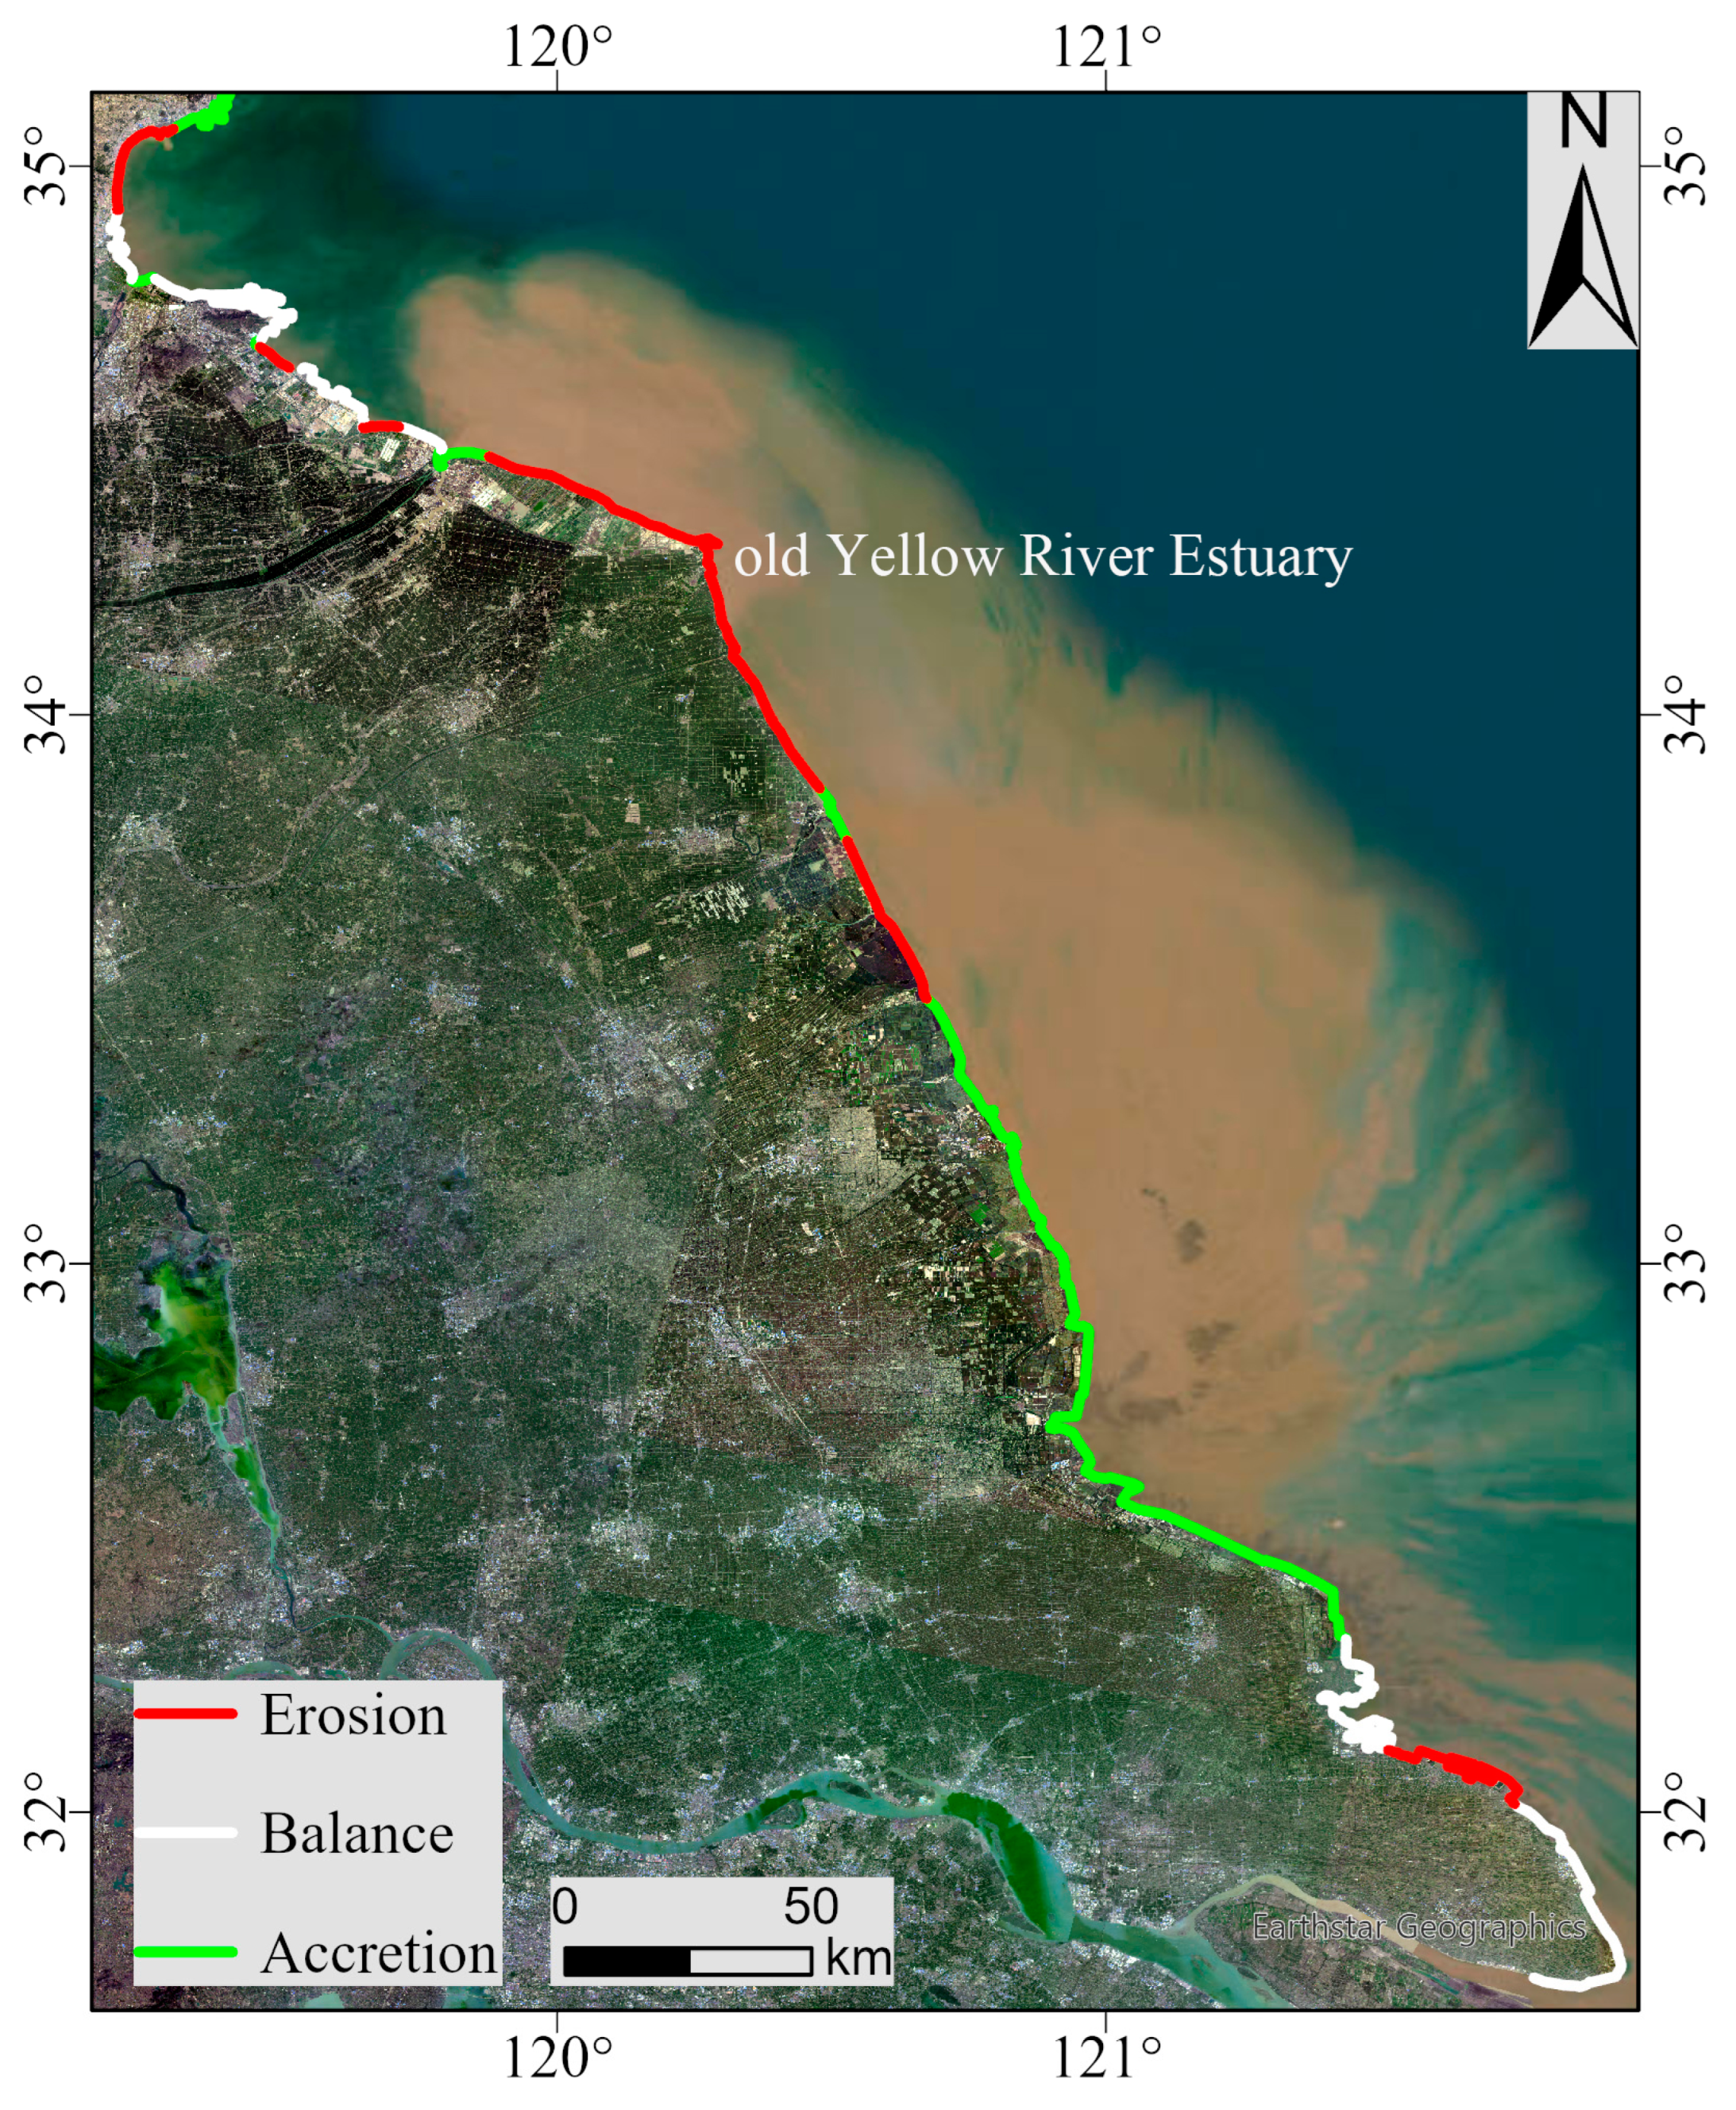
Beyond estuarine deltas, certain non-estuarine regions are also confronting severe erosion due to declining SSC. In 2023, the Jiangsu Province government in China issued a statement highlighting substantial erosion along specific coastal areas of the province, particularly within the 33.5°N to 34.5°N latitude range (Figure 13). Notably, our study underscored a marked decline in SSC within this region, presenting the most rapid rate of decline among non-estuarine regions (Figure 10). The diminished sediment discharge resulting from coastal engineering has amplified coastal erosion in this area, further compounded by rising sea levels that escalate erosion intensity and frequency. This confluence of factors has contributed to the continuous retreat of the local coastline. As a response, the local government has invested 1.45 billion RMB in recent years to restore and safeguard the coastal zone [60]. In summation, both deltaic and non-estuarine regions grappled with substantial erosion triggered by sediment imbalances, which may pose significant threats to the ecological stability and economic progress of the coastal regions.
The sediment transported into the sea serves as a crucial source of essential nutrients within estuaries, containing both organic and inorganic components that nourish aquatic flora and fauna. This nutrient supply plays a pivotal role in maintaining the delicate balance of the estuarine ecosystem. Rivers act as natural conduits, transport estuaries, and offshore waters, making them significant contributors of nutrients to offshore waters on a global scale. The decline in sediment fluxes may lead to the degradation of aquatic ecosystems and a decrease in species diversity and would ultimately have negative ramifications for both estuarine and offshore environments. In summation, the dwindling river sediment fluxes have profound applications for coastal ecosystems and human activities. Hence, it is imperative to strengthen monitoring and assessment endeavors to accurately track changes and impacts of sediment fluxes, facilitating the adaptation and optimization of management strategies accordingly.
4.4. Sources of Study Uncertainty and Comparative Analysis
Continuous advancements in remote sensing techniques are driving the evolution of SSC retrieval models. Existing models generally fall into empirical, semi-analytical, and analytical categories and have found wide use in SSC retrieval in local waters [61]. However, these models face many limitations when applied to large-scale waters. For instance, single-band models tend to exhibit decreased sensitivity to higher SSC levels, leading to a “saturation” effect that can result in underestimated SSC values in turbid waters [41]. Additionally, empirical statistical models are confined by the specific SSC range and optical properties of the water body in the region where they were developed, thus limiting broader applicability. To address this challenge and create a more versatile retrieval model, some researchers have turned to employing diverse wavebands for modeling across waters of varying turbidity levels. Subsequently, these models are combined into a multi-model algorithm capable of accommodating a broader SSC range [42,62,63]. However, the adoption of multi-model algorithms necessitates a substantial volume of measured data to establish thresholds for model switching or to develop classification algorithms tailored to water bodies with varying turbidity levels. The acquisition of such measured data for diverse water bodies proves costly, and differences in available datasets for distinct water bodies and research objectives may curtail the widespread applicability of classification algorithms for different water bodies [64].
Owing to the scarcity of extensive measured data and a universally applicable algorithm for assessing SSC in coastal waters, the ability to conduct long-term studies on suspended sediment across broad spatial scales is constrained. In light of this limitation, our study employed multiple regional models to investigate SSC trends overall in the WPC, recognizing that these models may not precisely and quantitatively reflect SSC values specific to distinct regions. However, our focus was aimed at discerning the overall trends in SSC dynamics rather than providing individual quantitative assessments for any specific estuarine regions. Ensuring comparable study results necessitates the use of the same models across the entire WPC. As depicted in Figure 6 and Figure 7, while SSC values may slightly diverge among regions under the three models, they maintain consistent interannual and seasonal trends (Figure 6 and Figure 7). For a more in-depth assessment of the influence of different models on the identification of long-term trends across various estuaries, we computed the overall absolute and relative decreases for each estuary from 1990 to 2020. The analysis indicated that the variations between the models had a negligible impact on the investigations of divergent trends and magnitudes in SSC dynamics across these diverse estuaries. (Table A3). Additionally, the higher R2 values, signifying the models’ accuracy, validate their capability to elucidate observed suspended sediment trends. Consequently, the outcomes derived from the multiple regional models, capturing the dynamics of SSC on a large scale, offer substantial insights for this study despite the inherent limitations. However, the use of multiple regional models in the study also has its limitations, depending on different research objectives. Model selection, model validation, and results evaluation are all more complex than using a single model. When using multiple models, it may cause inconsistent results from the multiple models. Problem identification and model optimization are more cumbersome.
The findings of this study were comparable with previous studies, and we discovered a remarkable alignment between our results and numerous investigations on the SSC trends in WPC estuaries (refer to Table A4). Furthermore, we meticulously examined the variations in seasonal trends, finding compelling resemblances with previous work. For instance, Heege et al. [49] reported a significant increase in SSC in the Mekong River Estuary from June to November compared to December to April, closely mirroring our observed monthly fluctuation curve. Zhang et al. [51] documented a consistent SSC rise in specific regions of the Yellow River estuary during the summer, peaking in winter, followed by a rapid decline, which corresponds to our observations. Additionally, Yunus et al. [24] scrutinized seasonal fluctuations in SSC in various large Asian river estuaries, and the changes in the Yangtze River Estuary, Hangzhou Bay, Pearl River Estuary, and Yellow River Estuary concurred with our findings. While it is important to note that these comparisons are somewhat constrained by variations in the demarcation of study areas, the consistent agreement among numerous long-term and short-term trend results underscores the robustness of our methodology.
The study area encompasses temperate, subtropical, and tropical regions. In certain subtropical and tropical regions, cloud cover is very high throughout the year. For instance, in 2002, no Landsat-TM images were available for the Mekong Delta with less than 50% cloud cover. The SSC values in coastal waters exhibit significant intra-annual and even intra-monthly variations. The unavailability of imagery undermined the reliability of regional SSC data for deriving annual or monthly results, consequently impacting the analysis of inter-annual and seasonal variability in certain regions. Additionally, the variability in imagery availability across different regions (Figure 2) introduces complications when comparing the spatial and temporal variability of SSC among these regions. However, in studies analyzing long time series (31 years), the absence of some monthly data has a limited impact on the overall trend analysis of SSC. Simultaneously, in subsequent studies, the aim is to incorporate remote sensing data with higher temporal resolution to provide additional support.
5. Conclusions
This study, using three SSC retrieval models, investigated SSC dynamics in the WPC over a period of 31 years (1990–2020). Each algorithm exhibited commendable performance, ensuring reliable and consistent outcomes. Here are the key findings and conclusions derived from this comprehensive analysis:
- (1)
- Estuarine decline in SSC: A compelling and noteworthy decline in SSC was observed across all six estuaries along the WPC. Among these, the Yangtze Estuary experienced the most pronounced reduction, while the Mekong River Estuary exhibited a relatively modest decline.
- (2)
- Distinct seasonal variations: Each of the six estuaries exhibited unique seasonal variations in SSC, primarily influenced by geographical factors specific to their respective locations.
- (3)
- Spatial gradient pattern: While most estuaries showed a consistent trend of decreasing SSC from the estuary outlet to its outer regions, the Pearl River and Yangtze River estuaries exhibited distinctive patterns of their own.
- (4)
- Estuarine vs. non-Estuarine: Estuaries exhibited a more rapid decline in SSC in contrast to the majority of non-estuarine regions within the WPC. Moreover, the northern part of the WPC experienced a notably higher rate of SSC decline than its southern counterpart, affecting both estuarine and non-estuarine areas.
This study has emphasized natural factors as the primary drivers of seasonal SSC variations within specific WPC regions. Simultaneously, human activities, including dam construction, soil conservation efforts, and shifts in water usage patterns, have led to sediment reduction in upper reaches, which is the predominant factor contributing to the sustained reduction in SSC across the WPC. In essence, this research offers an in-depth assessment of the temporal dynamics of SSC in the WPC, utilizing remote sensing techniques. These findings are valuable for informing policy decisions aimed at preserving ecosystem stability and advancing sustainable development in the WPC coastal regions. They also underscore the significance of continuous monitoring and well-informed management strategies.
Author Contributions
Conceptualization, X.Y.; formal analysis, T.Z.; data curation, T.Z. supervision, X.Y.; writing—review editing, X.Y., B.C., J.Q., S.C., H.O. and W.F.; resources, X.X., Y.B. and G.Z. All authors have read and agreed to the published version of the manuscript.
Funding
The Natural Science Foundation of Guangdong Province (Grant No.: 2021A1515011533), the Special Fund Project for Marine Economic Development of Guangdong Province (grant number: GDNRC [2020]013), and the Major Project of High-Resolution Earth Observation System (Grant No.: 30-Y60B01-9003-22/23) funded this research.
Data Availability Statement
The data presented in this study are available on request from the corresponding author.
Acknowledgments
The authors are very grateful to the National Aeronautics and Space Administration for providing the Level-2 surface reflectance products of Landsat-TM/ETM+/OLI.
Conflicts of Interest
The authors declare no conflict of interest.
Appendix A

Table A1.
Sampling sites for in situ SSC data collections in the Pearl River Estuary.
| ID | Longitude | Latitude | SSC (mg L−1) |
|---|---|---|---|
| 20-07-01 | 113°44.0 | 22°00.7 | 4.0 |
| 20-07-02 | 113°44.7 | 22°01.6 | 39.7 |
| 20-07-03 | 113°42.4 | 22°04.1 | 0.7 |
| 20-07-04 | 113°40.5 | 22°06.1 | 24.3 |
| 20-07-05 | 113°38.4 | 22°07.9 | 40.7 |
| 20-07-06 | 113°39.7 | 22°12.9 | 32.7 |
| 20-07-07 | 113°38.6 | 22°11.3 | 14.7 |
| 20-07-08 | 113°37.7 | 22°09.8 | 6.3 |
| 20-07-09 | 113°37.1 | 22°08.7 | 37.7 |
| 20-07-10 | 113°36.4 | 22°08.0 | 49.6 |
| 20-07-11 | 113°36.0 | 22°07.2 | 40.3 |
| 20-07-12 | 113°35.4 | 22°06.6 | 10.0 |
| 20-07-13 | 113°34.9 | 22°05.8 | 42.7 |
| 20-07-14 | 113°34.5 | 22°05.0 | 47.7 |
| 20-07-15 | 113°35.2 | 22°03.8 | 45.7 |
| 20-07-16 | 113°35.6 | 22°03.0 | 46.7 |
| 20-07-17 | 113°36.3 | 22°02.4 | 49.7 |
| 20-07-18 | 113°36.8 | 22°01.8 | 44.0 |
| 20-07-19 | 113°37.6 | 22°01.4 | 4.7 |
| 20-07-20 | 113°38.4 | 22°01.2 | 41.3 |
| 20-07-21 | 113°39.6 | 22°00.0 | 4.3 |
| 20-07-22 | 113°41.0 | 21°58.9 | 1.3 |
| 20-07-23 | 113°42.2 | 21°59.2 | |
| 20-07-24 | 113°43.5 | 21°59.7 | 3.3 |
| 20-07-25 | 113°37.2 | 22°11.7 | 9.3 |
| 20-07-26 | 113°38.9 | 22°11.5 | 6.0 |
| 20-07-27 | 113°41.5 | 22°11.1 | 33.0 |
| 20-07-28 | 113°44.3 | 22°10.2 | 37.0 |
| 20-07-29 | 113°45.7 | 22°10.0 | 3.3 |
| 20-07-30 | 113°46.7 | 22°09.9 | 5.7 |
| 20-07-31 | 113°48.0 | 22°07.8 | 53.0 |
| 20-07-32 | 113°47.8 | 22°06.3 | 4.7 |
| 20-07-33 | 113°47.2 | 22°04.6 | 0.7 |
| 20-07-34 | 113°46.0 | 22°03.1 | 0.3 |
| 20-07-35 | 113°44.8 | 22°01.7 | 1.0 |
| 20-07-36 | 113°36.4 | 22°12.4 | 20.0 |
| 20-07-37 | 113°35.8 | 22°13.2 | 46.0 |
| 20-07-38 | 113°35.6 | 22°13.7 | 54.0 |
| 20-12-01 | 113.605 | 22.207 | 278.0 |
| 20-12-02 | 113.612 | 22.197 | 232.3 |
| 20-12-03 | 113.631 | 22.167 | 288.0 |
| 20-12-04 | 113.664 | 22.148 | 129.8 |
| 20-12-05 | 113.672 | 22.187 | 169.3 |
| 20-12-06 | 113.677 | 22.214 | 189.7 |
| 20-12-07 | 113.684 | 22.231 | 180.3 |
| 20-12-08 | 113.661 | 22.238 | 103.0 |
| 20-12-09 | 113.651 | 22.26 | 162.0 |
| 20-12-10 | 113.663 | 22.281 | 84.6 |
| 20-12-11 | 113.672 | 22.301 | 80.3 |
| 20-12-12 | 113.695 | 22.328 | 54.7 |
| 20-12-13 | 113.703 | 22.361 | 53.3 |
| 20-12-14 | 113.722 | 22.382 | 57.7 |
| 20-12-15 | 113.699 | 22.39 | 46.2 |
| 20-12-16 | 113.673 | 22.374 | |
| 20-12-17 | 113.655 | 22.357 | 25.2 |
| 20-12-18 | 113.640 | 22.338 | 74.3 |
| 20-12-19 | 113.634 | 22.329 | 64.3 |
| 20-12-20 | 113.632 | 22.32 | 91.7 |
| 20-12-21 | 113.626 | 22.307 | 71.7 |
| 20-12-22 | 113.614 | 22.293 | 88.3 |
| 20-12-23 | 113.613 | 22.279 | |
| 21-04-01 | 113.655° | 22.61° | 67.8 |
| 21-04-02 | 113.695° | 22.569° | 26.6 |
| 21-04-03 | 113.724° | 22.529° | 14.0 |
| 21-04-04 | 113.731° | 22.463° | 10.6 |
| 21-04-05 | 113.743° | 22.412° | 21.0 |
| 21-04-06 | 113.746° | 22.348° | 13.6 |
| 21-04-07 | 113.727° | 22.266° | 28.0 |
| 21-04-08 | 113.709° | 22.208° | 23.8 |
| 21-04-09 | 113.691° | 22.165° | 17.8 |
| 21-04-10 | 113.686° | 22.113° | 11.6 |
| 21-04-11 | 113.679° | 22.34° | 18.2 |
| 21-04-12 | 113.703° | 22.70° | 25.0 |
| 21-04-13 | 113.747° | 22.88° | |
| 21-04-14 | 113.751° | 22.145° | |
| 21-04-15 | 113.725° | 22.149° | 13.0 |
| 21-04-16 | 113.665° | 22.184° | 19.2 |
| 21-04-17 | 113.603° | 22.212° | 14.2 |
| 21-04-18 | 113.609° | 22.275° | 14.2 |
| 21-04-19 | 113.630° | 22.323° | 23.8 |
| 21-04-20 | 113.647° | 22.356° | 14.2 |
| 21-04-21 | 113.673° | 22.404° | 16.4 |
| 21-04-22 | 113.699° | 22.473° | 7.4 |
| 21-04-23 | 113.71° | 22.515° | |
| 21-04-24 | 113.698° | 22.567° | 16.0 |
| 21-04-25 | 113.666° | 22.596° | 15.7 |
| 21-07-01 | 113.716° | 22.538° | 25.4 |
| 21-07-02 | 113.698° | 22.503° | 78.2 |
| 21-07-03 | 113.687° | 22.476° | 67.4 |
| 21-07-04 | 113.681° | 22.435° | 29 |
| 21-07-05 | 113.667° | 22.4° | 20.8 |
| 21-07-06 | 113.714° | 22.441° | 18 |
| 21-07-07 | 113.731° | 22.485° | 18 |
| 21-07-08 | 113.733° | 22.523° | 26.2 |
| 21-07-12 | 113.726° | 22.576° | 22.2 |
| 23-02-01 | 113.619 | 22.106 | 23.8 |
| 23-02-02 | 113.615 | 22.007 | 27 |
| 23-02-03 | 113.634 | 22.060 | 12.6 |
| 23-02-04 | 113.677 | 22.060 | 6.2 |
| 23-02-05 | 113.724 | 22.059 | 3.2 |
| 23-02-06 | 113.762 | 22.088 | 4.6 |
| 23-02-07 | 113.807 | 22.138 | 6.6 |
| 23-02-08 | 113.794 | 22.156 | 3.2 |
| 23-02-09 | 113.755 | 22.173 | 7.8 |
| 23-02-10 | 113.717 | 22.180 | 6.0 |
| 23-02-11 | 113.684 | 22.188 | 10.2 |
Table A2.
Coefficients of the Sert model for Landsat TM/ETM/OLI red band images.
| Sensor | Band | a | b |
|---|---|---|---|
| Landsat-TM | 3 | 0.0771 | 11.0158 |
| Landsat-ETM+ | 3 | 0.0773 | 10.9543 |
| Landsat-OLI | 4 | 0.0763 | 11.5306 |
Table A3.
Comparison of SSC declines in the WPC estuaries from 1990 to 2020 using three models.
| Estuary | Bo | Nechad | Sert | |||
|---|---|---|---|---|---|---|
| Value (mg/L) | Percentage (%) | Value (mg/L) | Percentage (%) | Value (mg/L) | Percentage (%) | |
| Liao River Estuary | 107.13 | 0.68 | 71.74 | 0.67 | 99.41 | 0.56 |
| Yellow River Estuary | 215.60 | 0.72 | 116.02 | 0.69 | 193.42 | 0.63 |
| Yangtze River Estuary | 275.49 | 0.6 | 165.16 | 0.6 | 161.46 | 0.42 |
| Hangzhou Bay | 167.49 | 0.4 | 118.39 | 0.47 | 90.15 | 0.26 |
| Pearl River Estuary | 130.32 | 0.79 | 78.44 | 0.73 | 123.78 | 0.66 |
| Mekong River Estuary | 69.14 | 0.39 | 52.27 | 0.49 | 93.72 | 0.5 |
Table A4.
Long-term monitoring studies with declining trend results in the WPC Estuaries.
| Estuary | Reference |
|---|---|
| Liao River Estuary * | |
| Yellow River Estuary | [24,65] |
| Yangtze River Estuary and HangzhouBay | [22,24] |
| Pearl River Estuary | [38,66] |
| Mekong River Estuary | [67] |
* Our comparisons of long-term trend results span at least over a decade, with limited remote sensing monitoring of (SSC) in the Liao River Estuary for over ten years.
References
- Shi, Z.; Xu, J.; Huang, X.; Zhang, X.; Jiang, Z.; Ye, F.; Liang, X. Relationship between nutrients and plankton biomass in the turbidity maximum zone of the Pearl River Estuary. J. Environ. Sci. 2017, 57, 72–84. [Google Scholar] [CrossRef] [PubMed]
- Webster, T.; Lemckert, C. Sediment resuspension within a microtidal estuary/embayment and the implication to channel management. J. Coast. Res. 2002, 36, 753–759. [Google Scholar] [CrossRef]
- Darby, S.E.; Hackney, C.R.; Leyland, J.; Kummu, M.; Lauri, H.; Parsons, D.R.; Best, J.L.; Nicholas, A.P.; Aalto, R. Fluvial sediment supply to a mega-delta reduced by shifting tropical-cyclone activity. Nature 2016, 539, 276–279. [Google Scholar] [CrossRef] [PubMed]
- Nukapothula, S.; Yunus, A.P.; Chuqun, C.; Lin, X. Impact of extreme climatic events on the total suspended matter concentrations in coastal waters using OceanSat-2 observations. Phys. Chem. Earth Parts A/B/C 2023, 131, 103435. [Google Scholar] [CrossRef]
- Burgan, H.I. The short-term and seasonal trend detection of sediment discharges in Turkish rivers. Rocz. Ochr. Sr. 2022, 24, 214–230. [Google Scholar]
- Dai, Z.; Fagherazzi, S.; Mei, X.; Gao, J. Decline in suspended sediment concentration delivered by the Changjiang (Yangtze) River into the East China Sea between 1956 and 2013. Geomorphology 2016, 268, 123–132. [Google Scholar] [CrossRef]
- Syvitski, J.P.; Kettner, A.J.; Overeem, I.; Hutton, E.W.; Hannon, M.T.; Brakenridge, G.R.; Day, J.; Vörösmarty, C.; Saito, Y.; Giosan, L. Sinking deltas due to human activities. Nat. Geosci. 2009, 2, 681–686. [Google Scholar] [CrossRef]
- Van Binh, D.; Kantoush, S.; Sumi, T. Changes to long-term discharge and sediment loads in the Vietnamese Mekong Delta caused by upstream dams. Geomorphology 2020, 353, 107011. [Google Scholar] [CrossRef]
- Wang, S.; Fu, B.; Piao, S.; Lü, Y.; Ciais, P.; Feng, X.; Wang, Y. Reduced sediment transport in the Yellow River due to anthropogenic changes. Nat. Geosci. 2016, 9, 38–41. [Google Scholar] [CrossRef]
- Edmonds, D.A.; Toby, S.C.; Siverd, C.G.; Twilley, R.; Bentley, S.J.; Hagen, S.; Xu, K. Land loss due to human-altered sediment budget in the Mississippi River Delta. Nat. Sustain. 2023, 6, 644–651. [Google Scholar] [CrossRef]
- Syvitski, J.P.; Vörösmarty, C.J.; Kettner, A.J.; Green, P. Impact of humans on the flux of terrestrial sediment to the global coastal ocean. Science 2005, 308, 376–380. [Google Scholar] [CrossRef]
- Syvitski, J.; Ángel, J.R.; Saito, Y.; Overeem, I.; Vörösmarty, C.J.; Wang, H.; Olago, D. Earth’s sediment cycle during the Anthropocene. Nat. Rev. Earth Environ. 2022, 3, 179–196. [Google Scholar] [CrossRef]
- Wang, H.; Saito, Y.; Zhang, Y.; Bi, N.; Sun, X.; Yang, Z. Recent changes of sediment flux to the western Pacific Ocean from major rivers in East and Southeast Asia. Earth-Sci. Rev. 2011, 108, 80–100. [Google Scholar] [CrossRef]
- Dethier, E.N.; Renshaw, C.E.; Magilligan, F.J. Rapid changes to global river suspended sediment flux by humans. Science 2022, 376, 1447–1452. [Google Scholar] [CrossRef]
- Li, X.; Liu, J.P.; Saito, Y.; Nguyen, V.L. Recent evolution of the Mekong Delta and the impacts of dams. Earth Sci. Rev. 2017, 175, 1–17. [Google Scholar] [CrossRef]
- Fagherazzi, S.; Edmonds, D.A.; Nardin, W.; Leonardi, N.; Canestrelli, A.; Falcini, F.; Jerolmack, D.J.; Mariotti, G.; Rowland, J.C.; Slingerland, R.L. Dynamics of river mouth deposits. Rev. Geophys. 2015, 53, 642–672. [Google Scholar] [CrossRef]
- Dethier, E.; Renshaw, C.; Magilligan, F. Toward improved accuracy of remote sensing approaches for quantifying suspended sediment: Implications for suspended-sediment monitoring. J. Geophys. Res. Earth Surf. 2020, 125, e2019JF005033. [Google Scholar] [CrossRef]
- Petus, C.; Chust, G.; Gohin, F.; Doxaran, D.; Froidefond, J.-M.; Sagarminaga, Y. Estimating turbidity and total suspended matter in the Adour River plume (South Bay of Biscay) using MODIS 250-m imagery. Cont. Shelf Res. 2010, 30, 379–392. [Google Scholar] [CrossRef]
- Xiao-Le, W.; Han-Qiu, X.U. Quantitative Estimation of Suspended Solid Concentration in the Lower Min River Based on Multi-Source Synchronal Data. Environ. Sci. 2008, 29, 2441–2447. [Google Scholar]
- Shen, F.; Verhoef, W.; Zhou, Y.; Salama, M.S.; Liu, X. Satellite estimates of wide-range suspended sediment concentrations in Changjiang (Yangtze) estuary using MERIS data. Estuaries Coasts 2010, 33, 1420–1429. [Google Scholar] [CrossRef]
- Zhan, W.; Wu, J.; Wei, X.; Tang, S.; Zhan, H. Spatio-temporal variation of the suspended sediment concentration in the Pearl River Estuary observed by MODIS during 2003–2015. Cont. Shelf Res. 2019, 172, 22–32. [Google Scholar] [CrossRef]
- Luo, W.; Shen, F.; He, Q.; Cao, F.; Zhao, H.; Li, M. Changes in suspended sediments in the Yangtze River Estuary from 1984 to 2020: Responses to basin and estuarine engineering constructions. Sci. Total Environ. 2022, 805, 150381. [Google Scholar] [CrossRef]
- Sathyendranath, S. Remote Sensing of Ocean Colour in Coastal, and Other Optically-Complex, Waters. 2000. Available online: http://ioccg.org/wp-content/uploads/2015/10/ioccg-report-03.pdf (accessed on 7 July 2023).
- Yunus, A.P.; Masago, Y.; Boulange, J.; Hijioka, Y. Natural and anthropogenic forces on suspended sediment dynamics in Asian estuaries. Sci. Total Environ. 2022, 836, 155569. [Google Scholar] [CrossRef] [PubMed]
- Ting-Ting, Z.; Wei, Q.U.; Hao-Ming, F.; Guo-Fan, Y. Inversion and Analysis on Liaohe the River Surface Sediment Concentration by Remote Sensing. J. Shenyang Agric. Univ. 2015, 46, 596–602. [Google Scholar]
- Yin, S.; Gao, G.; Huang, A.; Li, D.; Ran, L.; Nawaz, M.; Xu, Y.J.; Fu, B. Streamflow and sediment load changes from China’s large rivers: Quantitative contributions of climate and human activity factors. Sci. Total Environ. 2023, 876, 162758. [Google Scholar] [CrossRef]
- Shen, F.; Suhyb Salama, M.; Zhou, Y.-X.; Li, J.-F.; Su, Z.; Kuang, D.-B. Remote-sensing reflectance characteristics of highly turbid estuarine waters–a comparative experiment of the Yangtze River and the Yellow River. Int. J. Remote Sens. 2010, 31, 2639–2654. [Google Scholar] [CrossRef]
- Liu, W.; Yu, Z.; Zhou, B.; Jiang, J.; Ling, Z. Assessment of suspended sediment concentration at the Hangzhou Bay using HJ CCD imagery. J. Remote Sens. 2013, 17, 905–918. [Google Scholar]
- Shenliang, C.; Guoan, Z.; Shilun, Y.; Zhiying, Y.U. Temporal and Spatial Changes of Suspended Sediment Concentration and Resuspension in the Yangtze River Estuary and Its Adjacent Waters. Acta Geogr. Sin. 2004, 59, 260–266. [Google Scholar]
- Wang, C.; Li, W.; Chen, S.; Li, D.; Wang, D.; Liu, J. The spatial and temporal variation of total suspended solid concentration in Pearl River Estuary during 1987–2015 based on remote sensing. Sci. Total Environ. 2018, 618, 1125–1138. [Google Scholar] [CrossRef]
- Milliman, J.D.; Farnsworth, K.L. River Discharge to the Coastal Ocean: A Global Synthesis; Cambridge University Press: Cambridge, UK, 2013. [Google Scholar]
- Schmidt, G.L.; Jenkerson, C.; Masek, J.G.; Vermote, E.; Gao, F. Landsat Ecosystem Disturbance Adaptive Processing System (LEDAPS) Algorithm Description. 2013. Available online: https://pubs.usgs.gov/of/2013/1057/ofr13_1057.pdf (accessed on 9 August 2023).
- Vermote, E.; Roger, J.-C.; Franch, B.; Skakun, S. LaSRC (Land Surface Reflectance Code): Overview, application and validation using MODIS, VIIRS, LANDSAT and Sentinel 2 data’s. In Proceedings of the IGARSS 2018–2018 IEEE International Geoscience and Remote Sensing Symposium, Valencia, Spain, 22–27 July 2018; pp. 8173–8176. [Google Scholar]
- Kumar, L.; Mutanga, O. Google Earth Engine applications since inception: Usage, trends, and potential. Remote Sens. 2018, 10, 1509. [Google Scholar] [CrossRef]
- Qian, L.; Li, S. Image Quality Evaluation of Landsat 7 ETM SLC-OFF Based on a Single Image Local Regression Model Retrieved. Geogr. Geo-Inf. Sci. 2012, 28, 14–21. [Google Scholar]
- Chen, J.; Zhu, X.; Vogelmann, J.E.; Gao, F.; Jin, S. A simple and effective method for filling gaps in Landsat ETM+ SLC-off images. Remote Sens. Environ. 2011, 115, 1053–1064. [Google Scholar] [CrossRef]
- Mobley, C.D. Estimation of the remote-sensing reflectance from above-surface measurements. Appl. Opt. 1999, 38, 7442–7455. [Google Scholar] [CrossRef] [PubMed]
- Cao, B.; Qiu, J.; Zhang, W.; Xie, X.; Lu, X.; Yang, X.; Li, H. Retrieval of suspended sediment concentrations in the Pearl River estuary using multi-source satellite imagery. Remote Sens. 2022, 14, 3896. [Google Scholar] [CrossRef]
- Jun, T.; Guo, T.; Xiao, W.; Xiao, W.; Qing, S. The Methods of Water Spectra Measurement and Analysis Ⅰ:Above-Water Method. J. Remote Sens. 2004, 8, 37. [Google Scholar]
- Xu, Z.; Zhang, S.; Yang, X. Water and sediment yield response to extreme rainfall events in a complex large river basin: A case study of the Yellow River Basin, China. J. Hydrol. 2021, 597, 126183. [Google Scholar] [CrossRef]
- Nechad, B.; Ruddick, K.G.; Park, Y. Calibration and validation of a generic multisensor algorithm for mapping of total suspended matter in turbid waters. Remote Sens. Environ. 2010, 114, 854–866. [Google Scholar] [CrossRef]
- Novoa, S.; Doxaran, D.; Ody, A.; Vanhellemont, Q.; Lafon, V.; Lubac, B.; Gernez, P. Atmospheric corrections and multi-conditional algorithm for multi-sensor remote sensing of suspended particulate matter in low-to-high turbidity levels coastal waters. Remote Sens. 2017, 9, 61. [Google Scholar] [CrossRef]
- Tang, R.; Shen, F.; Pan, Y.; Ruddick, K.; Shang, P. Multi-source high-resolution satellite products in Yangtze Estuary: Cross-comparisons and impacts of signal-to-noise ratio and spatial resolution. Opt. Express 2019, 27, 6426–6441. [Google Scholar] [CrossRef]
- Shen, F.; Zhou, Y.; Peng, X.; Chen, Y. Satellite multi-sensor mapping of suspended particulate matter in turbid estuarine and coastal ocean, China. Int. J. Remote Sens. 2014, 35, 4173–4192. [Google Scholar] [CrossRef]
- Sen, P.K. Estimates of the regression coefficient based on Kendall’s tau. J. Am. Stat. Assoc. 1968, 63, 1379–1389. [Google Scholar] [CrossRef]
- Kendall, M.G. Rank correlation methods. 1948. Available online: https://psycnet.apa.org/record/1948-15040-000 (accessed on 6 May 2023).
- Xiao, F.; Wang, D.; Zeng, L.; Liu, Q.-Y.; Zhou, W. Contrasting changes in the sea surface temperature and upper ocean heat content in the South China Sea during recent decades. Clim. Dyn. 2019, 53, 1597–1612. [Google Scholar] [CrossRef]
- Wang, X.; Wen, Z.; Liu, G.; Tao, H.; Song, K. Remote estimates of total suspended matter in China’s main estuaries using Landsat images and a weight random forest model. ISPRS J. Photogramm. Remote Sens. 2022, 183, 94–110. [Google Scholar] [CrossRef]
- Heege, T.; Kiselev, V.; Wettle, M.; Hung, N.N. Operational multi-sensor monitoring of turbidity for the entire Mekong Delta. In Remote Sensing the Mekong; Routledge: London, UK, 2018; pp. 164–180. [Google Scholar]
- Bian, C.; Jiang, W.; Quan, Q.; Wang, T.; Greatbatch, R.J.; Li, W. Distributions of suspended sediment concentration in the Yellow Sea and the East China Sea based on field surveys during the four seasons of 2011. J. Mar. Syst. 2013, 121, 24–35. [Google Scholar] [CrossRef]
- Zhang, M.; Dong, Q.; Cui, T.; Xue, C.; Zhang, S. Suspended sediment monitoring and assessment for Yellow River estuary from Landsat TM and ETM+ imagery. Remote Sens. Environ. 2014, 146, 136–147. [Google Scholar] [CrossRef]
- Thodsen, H.; Hasholt, B.; Kjærsgaard, J. The influence of climate change on suspended sediment transport in Danish rivers. Hydrol. Process. Int. J. 2008, 22, 764–774. [Google Scholar] [CrossRef]
- Yang, S.; Milliman, J.; Li, P.; Xu, K. 50,000 dams later: Erosion of the Yangtze River and its delta. Glob. Planet. Change 2011, 75, 14–20. [Google Scholar] [CrossRef]
- Tena, A.; Batalla, R.J. The sediment budget of a large river regulated by dams (The lower River Ebro, NE Spain). J. Soils Sediments 2013, 13, 966–980. [Google Scholar] [CrossRef]
- Tan, C.; Huang, B.; Liu, K.; Chen, H.; Liu, F.; Qiu, J.; Yang, J. Using the wavelet transform to detect temporal variations in hydrological processes in the Pearl River, China. Quat. Int. 2017, 440, 52–63. [Google Scholar] [CrossRef]
- Liu, Y.; Song, H.; An, Z.; Sun, C.; Trouet, V.; Cai, Q.; Liu, R.; Leavitt, S.W.; Song, Y.; Li, Q. Recent anthropogenic curtailing of Yellow River runoff and sediment load is unprecedented over the past 500 y. Proc. Natl. Acad. Sci. USA 2020, 117, 18251–18257. [Google Scholar] [CrossRef]
- Manh, N.V.; Dung, N.V.; Hung, N.N.; Merz, B.; Apel, H. Large-scale suspended sediment transport and sediment deposition in the Mekong Delta. Hydrol. Earth Syst. Sci. 2014, 18, 3033–3053. [Google Scholar] [CrossRef]
- Anthony, E.J.; Brunier, G.; Besset, M.; Goichot, M.; Dussouillez, P.; Nguyen, V.L. Linking rapid erosion of the Mekong River delta to human activities. Sci. Rep. 2015, 5, 14745. [Google Scholar] [CrossRef] [PubMed]
- Bi, N.; Wang, H.; Yang, Z. Recent changes in the erosion–accretion patterns of the active Huanghe (Yellow River) delta lobe caused by human activities. Cont. Shelf Res. 2014, 90, 70–78. [Google Scholar] [CrossRef]
- jPNR Department. Reply to Proposal No. 0314 of the 13th session of the Provincial Committee of the Chinese People’s Political Consultative Conference (Proposal on Attaching Great Importance to Coastal Erosion in the Province). Available online: http://zrzy.jiangsu.gov.cn/gtxxgk/nrglIndex.action?messageID=2c908254893eaff001893f19097d007d (accessed on 10 August 2023).
- Han, B.; Loisel, H.; Vantrepotte, V.; Mériaux, X.; Bryère, P.; Ouillon, S.; Dessailly, D.; Xing, Q.; Zhu, J. Development of a semi-analytical algorithm for the retrieval of suspended particulate matter from remote sensing over clear to very turbid waters. Remote Sens. 2016, 8, 211. [Google Scholar] [CrossRef]
- Balasubramanian, S.V.; Pahlevan, N.; Smith, B.; Binding, C.; Schalles, J.; Loisel, H.; Gurlin, D.; Greb, S.; Alikas, K.; Randla, M. Robust algorithm for estimating total suspended solids (TSS) in inland and nearshore coastal waters. Remote Sens. Environ. 2020, 246, 111768. [Google Scholar] [CrossRef]
- Yu, X.; Lee, Z.; Shen, F.; Wang, M.; Wei, J.; Jiang, L.; Shang, Z. An empirical algorithm to seamlessly retrieve the concentration of suspended particulate matter from water color across ocean to turbid river mouths. Remote Sens. Environ. 2019, 235, 111491. [Google Scholar] [CrossRef]
- Jiang, D.; Matsushita, B.; Pahlevan, N.; Gurlin, D.; Lehmann, M.K.; Fichot, C.G.; Schalles, J.; Loisel, H.; Binding, C.; Zhang, Y. Remotely estimating total suspended solids concentration in clear to extremely turbid waters using a novel semi-analytical method. Remote Sens. Environ. 2021, 258, 112386. [Google Scholar] [CrossRef]
- Yu, D.; Bian, X.; Yang, L.; Zhou, Y.; An, D.; Zhou, M.; Chen, S.; Pan, S. Monitoring suspended sediment concentration in the Yellow River Estuary from 1984 to 2021 using landsat imagery and Google Earth Engine. Int. J. Remote Sens. 2023, 44, 3122–3145. [Google Scholar] [CrossRef]
- Guo, J.; Ma, C.; Ai, B.; Xu, X.; Huang, W.; Zhao, J. Assessing the effects of the Hong Kong-Zhuhai-Macau Bridge on the total suspended solids in the Pearl River estuary based on Landsat time series. J. Geophys. Res. Ocean. 2020, 125, e2020JC016202. [Google Scholar] [CrossRef]
- Wackerman, C.; Hayden, A.; Jonik, J. Deriving spatial and temporal context for point measurements of suspended-sediment concentration using remote-sensing imagery in the Mekong Delta. Cont. Shelf Res. 2017, 147, 231–245. [Google Scholar] [CrossRef]
Figure 1.
Geographical configuration of the WPC and the six major estuaries of Liao River (1), Yellow River (2), Yangtze River (3), Qiantang River (Hangzhou Bay) (4), Pearl River (5), and Mekong River (6).
Figure 1.
Geographical configuration of the WPC and the six major estuaries of Liao River (1), Yellow River (2), Yangtze River (3), Qiantang River (Hangzhou Bay) (4), Pearl River (5), and Mekong River (6).

Figure 4.
Retrieval results of SSC in the Pearl River Estuary employ Cao’s, Sert’s, and Nechad’s models, respectively (a), black line A indicates intercept. SSC variation from west to east along intercept A for the three models (b). Comparison between satellite modeled and in situ SSC employ Cao’s, Sert’s, and Nechad’s models, respectively (c).

Figure 5.
Validate Cao’s, Sert’s, and Nechad’s models using integrated datasets derived from previous studies (a–c).
Figure 5.
Validate Cao’s, Sert’s, and Nechad’s models using integrated datasets derived from previous studies (a–c).

Figure 6.
The average variation of SSC in estuaries every four years from 1990 to 2020: Liao River Estuary (a), Yellow River Estuary (b), Yangtze River Estuary (c), Hangzhou Bay (d), Pearl River Estuary (e), and Mekong River Estuary (f).
Figure 6.
The average variation of SSC in estuaries every four years from 1990 to 2020: Liao River Estuary (a), Yellow River Estuary (b), Yangtze River Estuary (c), Hangzhou Bay (d), Pearl River Estuary (e), and Mekong River Estuary (f).

Figure 8.
Distribution of SSC in six major Asian river estuaries in the WPC in 2020 (a–f): the Liao River Estuary (a), Yellow River Estuary (b), Yangtze River Estuary (c), Hangzhou Bay (d), Pearl River Estuary (e), and Mekong River Estuary (f); the colored lines on the maps indicate specific transects (CL1 and CL2 indicate the northern and southern transects of the Yangtze River, respectively (c); ZL1 and ZL2 indicate the transverse and longitudinal transects (e) across the Pearl River Estuary); Corresponding SSC variations in different transects between 1990 and 2020 (g–j): (g) in CL1, (h) in CL2, (i) in ZL1, and (j) in ZL2.

Figure 9.
M-K test results for SSC variations within the WPC during the period 1990–2020: latitudinal variations of the M-K test for SSC in the WPC between 1990 and 2020 (a) with z-values sampled at 0.5° intervals from 9°N to 40.5°N (b); sections for estuaries are highlighted by red rectangles. The black lines indicate the boundaries of estuaries; Number 1 to 5 indicate the estuaries of the Liao River, the Yellow River, the Yangtze River and Hangzhou Bay, the Pearl River and the Mekong River, respectively.

Figure 10.
Sen’s slope test results for SSC in the WPC during the period 1990–2020: Latitudinal variation of Sen’s slope test for SSC in the WPC during the period 1990–2020 (a) with β-values sampled at 0.5° intervals from 9°N to 40.5°N (b); sections for estuaries are indicated by red rectangles. The black lines indicate the boundaries of estuaries. Number 1 to 5 indicate the estuaries of the Liao River, the Yellow River, the Yangtze River and Hangzhou Bay, the Pearl River and the Mekong River, respectively.

Figure 11.
Changes in cumulative storage capacity of medium- and large-sized dams in the Liaohe River, Yellow River, Yangtze River, and Pearl River basins from 1990 to 2020.
Figure 11.
Changes in cumulative storage capacity of medium- and large-sized dams in the Liaohe River, Yellow River, Yangtze River, and Pearl River basins from 1990 to 2020.

Figure 12.
Accumulated installed power generation capacity of dams in the Mekong River Basin (1990 to 2020).
Figure 12.
Accumulated installed power generation capacity of dams in the Mekong River Basin (1990 to 2020).

Figure 13.
Coastal erosion in non-large estuaries.

Table 1.
Descriptive statistics of in situ SSC data obtained in the Pearl River Estuary from 2020 to 2023.
Table 1.
Descriptive statistics of in situ SSC data obtained in the Pearl River Estuary from 2020 to 2023.
| Statistics (mg) | Date | |||||
|---|---|---|---|---|---|---|
| 07/2020 | 12/2020 | 04/2021 | 07/2021 | 02/2023 | Total | |
| min | 0.3 | 25.2 | 3.6 | 18 | 3.2 | 0.3 |
| max | 54 | 288 | 67.8 | 78.2 | 27 | 288 |
| mean | 24.48 | 114.63 | 18.23 | 33.91 | 10.11 | 43.12 |
| median | 24.33 | 84.6 | 15.67 | 25.4 | 6.6 | 24.3 |
| cv | 0.81 | 0.66 | 0.66 | 0.66 | 0.80 | 1.29 |
| sk | 0.06 | 1.12 | 12.47 | 1.57 | 1.09 | 2.64 |
Table 2.
Trend analysis of six Estuaries using the three models for the period of 1990 to 2020.
| Estuary | Cao | Nechad | Sert | |||
|---|---|---|---|---|---|---|
| β (mg·L−1·yr−1) | z | β (mg·L−1·yr−1) | z | β (mg·L−1·yr−1) | z | |
| Liao River Estuary | −5.29 | −5.44 * | −3.37 | −5.30 * | −4.84 | −5.20 * |
| Yellow River Estuary | −9.39 | −4.59 * | −4.78 | −4.59 * | −8.23 | −4.56 * |
| Yangtze River Estuary | −12.44 | −5.95 * | −7.57 | −5.10 * | −7.65 | −5.68 * |
| Hangzhou Bay | −8.46 | −4.42 * | −5.78 | −4.41 * | −5.10 | −4.42 * |
| Pearl River Estuary | −4.77 | −5.68 * | −2.84 | −5.50 * | −4.60 | −5.47 * |
| Mekong River Estuary | −3.19 | −3.91 * | −1.88 | −4.39 * | −3.81 | −2.37 * |
* indicate the significance level at p < 0.01.
Disclaimer/Publisher’s Note: The statements, opinions and data contained in all publications are solely those of the individual author(s) and contributor(s) and not of MDPI and/or the editor(s). MDPI and/or the editor(s) disclaim responsibility for any injury to people or property resulting from any ideas, methods, instructions or products referred to in the content. |
© 2023 by the authors. Licensee MDPI, Basel, Switzerland. This article is an open access article distributed under the terms and conditions of the Creative Commons Attribution (CC BY) license (https://creativecommons.org/licenses/by/4.0/).
Share and Cite
MDPI and ACS Style
Zhou, T.; Cao, B.; Qiu, J.; Cai, S.; Ou, H.; Fan, W.; Yang, X.; Xie, X.; Bo, Y.; Zhang, G. Mapping Suspended Sediment Changes in the Western Pacific Coasts. Remote Sens. 2023, 15, 5192. https://doi.org/10.3390/rs15215192
AMA Style
Zhou T, Cao B, Qiu J, Cai S, Ou H, Fan W, Yang X, Xie X, Bo Y, Zhang G. Mapping Suspended Sediment Changes in the Western Pacific Coasts. Remote Sensing. 2023; 15(21):5192. https://doi.org/10.3390/rs15215192
Chicago/Turabian StyleZhou, Tao, Bowen Cao, Junliang Qiu, Shirong Cai, Haidong Ou, Wei Fan, Xiankun Yang, Xuetong Xie, Yu Bo, and Gaige Zhang. 2023. "Mapping Suspended Sediment Changes in the Western Pacific Coasts" Remote Sensing 15, no. 21: 5192. https://doi.org/10.3390/rs15215192
Note that from the first issue of 2016, this journal uses article numbers instead of page numbers. See further details here.