
Dependence of the Hydration of the Lunar Surface on the Concentrations of TiO2, Plagioclase, and Spinel
by
 , ,
, ,
Marcel Hess
1,* ,
,
Christian Wöhler
1,
Alexey A. Berezhnoy
2,3,
Janice L. Bishop
4 and
Vladislav V. Shevchenko
2,3 1
Image Analysis Group, TU Dortmund University, Otto-Hahn-Straße 4, 44227 Dortmund, Germany
2
Sternberg Astronomical Institute, Moscow State University, Universitetskij Pr., 13, 119234 Moscow, Russia
3
Institute of Physics, Kazan Federal University, Kremlyovskaya Str., 18, 420008 Kazan, Russia
4
SETI Institute, 339 Bernardo Ave., Suite 200, Mountain View, CA 94043, USA
*
Author to whom correspondence should be addressed.
Remote Sens. 2022, 14(1), 47; https://doi.org/10.3390/rs14010047
Submission received: 14 October 2021
/
Revised: 10 December 2021
/
Accepted: 17 December 2021
/
Published: 23 December 2021
(This article belongs to the Special Issue Cartography of the Solar System: Remote Sensing beyond Earth)
Abstract
:We investigate the interrelation between the hydration of the lunar regolith and the mineral composition of the surface of the Moon with respect to the concentrations of plagioclase, TiO (highly correlated with the oxide mineral ilmenite), and Mg-spinel. The spectral properties of lunar regions with a low concentration of plagioclase or a high concentration of TiO or Mg-spinel show a significant reduction in hydration at lunar midday compared to other compositions. This suggests that these oxide minerals contain less of the strongly bound OH component, which is not removed at lunar midday. The time-of-day-dependent variation of the 3 m band depth is greater in TiO-rich areas compared to other mare regions. The TiO-rich regions therefore appear to have a strong tendency to adsorb solar wind-induced hydrogen into binding states of low energy that can more readily desorb and readsorb OH/ on a daily basis.
1. Introduction
Near-infrared (NIR) hyperspectral data from the Moon Mineralogy Mapper (M) instrument reveal an absorption band near 3 m that is found all across the Moon under a variety of thermal conditions. The presence and nature of volatile species on the Moon, especially OH/HO, has been studied extensively by many groups (e.g., [1,2,3,4]), but the different processes leading to the hydration of the surface and their relative importance are still under debate. New data provided by the M instrument on Chandrayaan-1 [1] yield NIR spectra that cover the Moon nearly globally for different local times of day. This unique coverage enables the investigation of diurnal changes on the Moon. These M data show an absorption band near 3 m that can be found at all latitudes [3,4,5]. This absorption band is indicative of the presence of hydroxyl/water in the uppermost lunar regolith layer. The strength of the feature, however, varies with the local time of day and latitude (e.g., [6,7]). This observation is also consistent with independent data obtained from telescopic measurements [8,9]. Hendrix et al. [10] investigated far ultraviolet data, which are not affected by thermal emission, and also found that OH/HO is variable with local time. Other publicly available data sources cannot match the resolution and coverage of M data in the NIR wavelength range, such that the M data set is still a useful tool to investigate the presence of OH/HO until hyperspectral data with similar resolution extending to beyond 3 m are available. The main source of hydroxyl has been commonly attributed to the solar wind, by which protons are implanted into the regolith, where they react with O atoms in the other minerals (e.g., [7,11,12,13]). But there is evidence of endogenous OH as well. For instance, Klima et al. [14] found OH/HO signatures at the Bullialdus crater to be of magmatic origin.
The 3 m absorption band has been found to be the strongest in the lunar morning and evening (e.g., [3,5,8]). Its strength decreases towards lunar midday, when sink processes, including diffusive loss and photolysis, become dominant [7]. Because the absorption band persists at lunar midday [3,5,8], Wöhler et al. [5] assert the presence of two components, a weakly and a strongly bound component, with different binding energies in the uppermost regolith layer. The modeling of Grumpe et al. [7] suggested that OH/HO with binding energies around 2 eV would be more stable against diffusive loss and photolysis. According to Zhang et al. [15] and Zhuravlev [16], such binding sites exist in silicate minerals. We use this as the definition of strongly bound OH/HO. In this setting, weakly bound OH/HO is estimated to have binding energies of around eV and evaporates within several hours at lunar daytime temperatures [7]. At lunar midday, it is expected that only the strongly bound component is left in the upper layers of the regolith [5,7]. An extensive review of lunar OH/HO is given in Schörghofer et al. [17]. On Earth, mapping the content of OH-bearing minerals is usually performed based on the analysis of the satellite near infrared spectra as well (e.g., see [18]).
The surface of the Moon is mainly covered with silicate minerals such as clinopyroxene, orthopyroxene, olivine, Ca-rich plagioclase, and smaller amounts of oxide minerals such as ilmenite FeTiO and spinel [19]. According to spectral modeling studies [20], the broadly occurring featureless spectra (e.g., [21]) of the lunar highlands can be reproduced by assuming a mixture of more than 90% plagioclase and less than 10% pyroxene. The lunar maria consist of up to about 60% plagioclase, 30–40% pyroxene, up to 10% olivine, and up to about 20% ilmenite [19].
Algorithms relying on spectral parameters have been employed successfully to examine the occurrence of specific minerals in the lunar surface material (e.g., [22]). The abundances of FeO and TiO in the lunar surface material were determined based on the parameters of spectral absorption bands such as reflectance ratios and continuum reflectance [23,24], or band depth, position, width, and continuum slope [25,26,27,28]. Such parameter maps have, for example, been used by Wöhler et al. [29] to show a correlation between the 3 m band depth and the abundance of TiO in mare areas. Here, we use the same TiO maps but exclude highland areas that are misleading in the analysis, and we focus in more detail on midday and morning correlations. Early studies on M data have also found that highland materials generally show a stronger 3 m absorption compared to the mare composition (e.g., [6,30]). Those studies, however, relied on an insufficient thermal emission removal of the M level 2 data [3,4,5,31], which tends to underestimate the temperature [3,4,5,31] and consequently underestimates the 3 m band depth. The method of Clark et al. [2] relies on assumptions about the shape of the spectra and is not physically motivated. Newer models, such as Bandfield et al. [4] and Wöhler et al. [5], are based on physical modeling similar to methods that have been applied in the asteroid community for many years and have been proven to be well-suited for estimating the thermal emission of particulate regolith surfaces (e.g., see [32]). Recent works on lunar OH/HO, e.g., Honniball et al. [8], also make use of such physically based methods.
Lunar mare areas have high concentrations of different types of pyroxene, exhibiting pronounced absorption bands near 1 m and 2 m (e.g., [22,28]), as well as contributions from the mineral olivine, which displays a broad and deep absorption band near 1–1.2 m but no absorption band at 2 m (e.g., [22]), and the oxide mineral ilmenite (), which has a relatively dark, flat, and nearly featureless spectrum in the NIR wavelength range (e.g., [33]). Typical highland surfaces consist of anorthositic rocks showing no or only very weak absorption bands near 1 m and 2 m (e.g., [21]). Minerals of the spinel group are widely distributed on the Moon, but they usually only appear in small fractions [34]. Mg-spinel can be distinguished from other lunar minerals by its deep absorption band at 2 m and the absence of a 1 m band [35,36]. Based on M hyperspectral data, some spatially limited areas were found to contain high Mg-spinel concentrations in several regions of the Moon [36]. Other types of spinel (namely Fe- and/or Cr-spinel) have been detected in Sinus Aestuum [37,38,39]. Ilmenite and some spinels are opaque minerals that strongly influence the measured reflectance spectra in regolith mixtures; therefore, these minerals are easier to distinguish even for low-weight percentages (e.g., [40]).
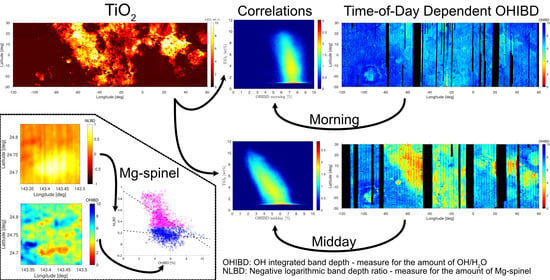
In this work, we examined time-of-day-dependent and regional variations in the spectral properties due to surficial OH/HO in regions containing TiO-bearing minerals and Mg-spinel. The purpose of this study was to understand the dependencies between implanted OH/HO and the mineral composition of the surface.
2. Data Set and Methods
The studies carried out in this work were based on the level 1B data set acquired by M [41], which was subsequently photometrically calibrated and its thermal emission component removed. We used M images that were resampled to 300 pixels/degree for regional analysis and to 20 pixels/degree to construct a nearly global mosaic. The spectral radiance values were then converted to normalized spectral reflectance values using Hapke’s anisotropic multiple scattering approximation [42] and the topography of the surface, which is represented by a high-resolution Digital Terrain Model (DTM) constructed with the method of Grumpe and Wöhler [43]. All M images were carefully co-registered at the reference WAC mosaic [44] such that all pixels corresponded to the same location on the ground. Absorption features near 3 m for estimating the amount of OH/HO were affected by thermal emission, requiring the thermal emission component to be removed from the measured spectral radiance. We used the thermal correction framework described by Wöhler et al. [31], Wöhler et al. [5], and Grumpe et al. [7], which corresponds to an iterative extension of the thermal equilibrium method of Shkuratov et al. [45]. Our method accounts for the influence of surface roughness (see also [4]) and yields an effective surface temperature (see [7] for details). The thermally corrected spectra were then used to determine the OH-integrated band depth (OHIBD) parameter of the 3 m band, which is a measure of the amount of hydroxyl/water in the uppermost layer of the regolith [5,31], according to the following equation:
where is the thermally corrected reflectance spectrum (e.g., see Figure 1a) and the linear continuum fitted to the reflectance values between 2.537 and 2.657 m (see green lines in Figure 1b). The OHIBD parameter can be interpreted as the mean relative absorption across the wavelength interval with m and m. The part over which the integral was calculated is marked in Figure 1c,d, for the weak and strong absorption, respectively. Differences in gain between M observations did not influence the measured OHIBD.
The other spectral parameters used for this work, characterizing the absorption bands near 1 m and 2 m, were inferred with the framework described by Wöhler et al. [26] and Bhatt et al. [27]. First, the spectra were smoothed by applying an optimization scheme that minimizes the deviation from the reflectance values and the second derivative [46]. The continuum was removed according to the convex hull method [47]. The continuum-removed spectra were then used to calculate the spectral parameters BD1 and BD2, as shown in Figure 1c,d, with BD1 referring to the band depth of the 1 m band and BD2 to the 2 m band, respectively.
In this study, we specifically used the negative logarithmic band depth ratio of the BD1 and BD2 (NLBD) parameters, corresponding to the negative value of the logarithmic band depth ratio (LBD) parameter defined by Bhatt et al. [27]:
Hence, a high NLBD value occurs when the 2 m band is strong and the 1 m band is weak, which is the case when Mg-spinels are present. However, this is only a qualitative description of the mineral abundance—a quantitative analysis is planned to be conducted in future studies, e.g., based on the spectral unmixing framework of Rommel et al. [48]. Areas found to exhibit a high spinel abundance according to the NLBD parameter are very similar to the findings of previous studies relying on other methods (e.g., [35,36,49]).
To study the possible dependence of the NLBD values on the photometric conditions of the observations, we compared the NLBD, BD1, BD2, and OHIBD values from the morning and midday observations (see Figure 2). The measured BD1 parameter changed slightly between morning and midday observations despite the photometric corrections. In the range of the 1 m band, the radiometric corrections are the strongest due to the detector temperatures [50], which might introduce systematic errors in this wavelength range. In contrast, the BD2 parameter is stable between morning and midday (see Figure 2d). The NLBD parameter slightly varies mainly because the BD1 parameter exhibited slight differences between the morning and midday observations. This behavior may well be due to the fact that the correction for the detector temperature applied to the M spectral radiances by the science team is strongest in the 1 m range [51]. However, the correlation between the morning and midday NLBD is high, such that the higher NLBD values in the morning also correspond to the higher NLBD values at midday. Therefore, when determining the NLBD value, we always use spectra that have been optimized by the Hapke model [42] to best fit all available observations from the same location. OHIBD, on the other hand, is systematically lower at midday than it is in the morning. Therefore, we used the spectra of all individual observations to be able to compare different times of day.
Ti, with an abundance highly correlated with the abundance of opaque minerals [23] and whose most important representative is ilmenite [19], is distinguished in the NIR wavelength range by a low albedo and continuum slope towards 2.5 m [52] and a high LBD (low NLBD) value due to partial suppression of the 2 m pyroxene band [27]. In the UV wavelength range, the TiO abundance is linearly correlated with the 321 nm and 415 nm reflectance ratio. This parameter was used by Sato et al. [24] to derive a TiO abundance map from the global WAC mosaic. These abundance maps were used in this work to find relations to the hydration of the regolith. Furthermore, we employed the mineral maps of Lemelin et al. [53] based on Kaguya MI images for the minerals plagioclase, olivine, orthopyroxene, and clinopyroxene.
3. Results
3.1. Abundant Minerals
First, we use the TiO maps of Sato et al. [24] and the mineral maps of Lemelin et al. [53] described in Section 2 to find correspondences between the composition and the OHIBD parameter.
Regional OHIBD maps illustrate the time-of-day-dependent changes in hydration (Figure 3). The images were divided into morning and midday images, and a global mosaic was created by Wöhler et al. [5]. Images taken between 7 AM and 8 AM local time were defined as morning values, and images taken between noon and 2 PM were defined as midday images. The OHIBD maps show artifacts in the form of vertical lines. This variance of OHIBD does not result from an actual change in OHIBD, but most likely from inaccuracies of the detector that may have been caused by temperature effects inside the sensor and inaccuracies of the flat-field corrections [5]. At latitudes beyond 30° the time-of-day-dependent variations of the 3 m band depth are higher than at lower latitudes, leading to systematic latitude-dependent differences. In order to reduce the influence of latitude in our analysis, we omitted the higher latitudes as well as the areas west of 120° W and east of 60° E because there is only very limited M coverage at different times of the day. Figure 3a shows the OHIBD map of the lunar morning, where the OHIBD values are higher compared to the midday values, but the location-dependent variations are small. At midday (Figure 3b), the OHIBD difference between different mare areas is much more pronounced. The ilmenite-rich mare areas in Mare Tranquillitatis and the western part of Oceanus Procellarum show OH/HO abundances of approximately 60% less compared to the surrounding mare regions. The data in Figure 3c depicting the difference values are noisier than the OHIBD maps for morning and midday because errors had been enhanced through the subtraction of uncertain quantities. Additionally, some areas lack data for morning or midday values.
Ilmenite shows large abundances in Ti-rich regions, while minor carriers of Ti are rare forms of the pyroxene augite ((Ca,Na)(Mg,Fe,Al,Ti)(Si,Al)O) or the oxide minerals rutile (TiO) and Ti-rich spinels (e.g., ulvöspinel ) [19]. Subsequently, we will use the notation of TiO following the nomenclature of Sato et al. [24], referring to minerals where a cation is Ti and the anions are O in the crystal structure. Note that we do not refer to rutile, which is very rare on the lunar surface. In the finest fraction of the lunar mare soils (≤45 m in size), 40–60% of the TiO is in the form of ilmenite, 20–40% in agglutinitic glass, 15–20% in volcanic glass, and less than 3% in plagioclase, olivine, and pyroxene [54]. A similar relationship was found by Coman et al. [55] where it was noted that from 1/3 to 2/3 of the TiO content in lunar samples could be attributed to ilmenite, with an average of wt %. Ilmenite is widely assumed to be responsible for the overall remotely sensed TiO abundance based on spectral parameters in the UV and NIR wavelength range (e.g., [24,27,33,55,56]). The ilmenite abundance has also been found to be strongly correlated with the TiO concentration () of the lunar mare returned samples [56]. In the mare areas, the TiO abundance is dominantly above 2 wt %. In conclusion, we opted to use a map as a proxy to investigate the relationship between ilmenite and OHIBD.
Since the lunar highlands uniformly contain only negligible amounts of TiO, we focused on the mare areas to calculate the correlation between abundance and OHIBD. To differentiate between mare and highland regions, we used the map by Nelson et al. [57] converted to a binary map and then scaled it to 20 pixels per degree. Figure A1 shows the TiO map for our study site from Sato et al. [24], illustrating that minerals containing TiO can be found in high abundances in some mare areas such as Mare Tranquillitatis and the western part of Oceanus Procellarum. In Figure 1, the selected average M spectra of two regions of mare areas with high (Mare Tranquillitatis) and low (Mare Serenitatis) TiO concentrations are shown. These spectra illustrate the trend that areas rich in TiO, and consequently in ilmenite, have less pronounced absorption bands at 1 m, 2 m, and 3 m (blue curve in Figure 1). Even though the absorption band depths are dependent on the overall composition, the pyroxene absorption bands are dampened by the flat ilmenite spectrum. Overall ilmenite-rich areas are darker compared to the surrounding mare areas.
In this study we always used the correlation coefficient r rather than its square in order to be able to distinguish between positive and negative correlations. The correlation coefficients for all minerals are listed in Table 1. For TiO in the morning, the correlation coefficient is only , effectively corresponding to the absence of correlation (see Figure 4a). In the morning hours, the range of OHIBD values is from 5.5% at the lowest to 9% at the maximum. This means that the variance of OHIBD in the morning is relatively small (Figure 4a) compared to that at midday. At midday, the strongly bound component is the dominating factor because the weakly bound component had mostly evaporated by this time. The inverse correlation between midday OHIBD and TiO abundance is clearly visible (Figure 4b). Here, the correlation coefficient r corresponds to . Both correlation coefficients are negative, suggesting that the OHIBD values generally increased with a decrease in TiO abundance. Figure 4c shows that the OHIBD difference between morning and midday, in contrast to the absolute values, increases with increasing TiO abundance. The OHIBD difference values, however, are relatively noisy as a consequence of the propagation of uncertainty due to the subtraction of two uncertain quantities. e.g., both OHIBD morning and OHIBD midday values are subject to uncertainties, which are enhanced in the difference values. This uncertainty is also apparent in the correlation coefficients of the difference values, which show a positive correlation of visible in the density plot in Figure 4c.
To make sure that temperature would not affect the observed correlations, we needed to investigate whether the temperature changed significantly between high-Ti and low-Ti maria. Figure 5 depicts the temperature at the borders between the highland and mare of Oceanus Procellarum, and between high-Ti and low-Ti maria. While there is a small difference in temperature between the highland and mare areas (see Figure 5a), there is no significant difference between the temperatures of high-Ti and low-Ti maria (see Figure 5b). The dependence on the latitude is visibly the strongest, such that we had to compare high-Ti and low-Ti maria at similar latitudes. The variance in the mare areas amounts to about 1 K. Therefore, we can rule out the possibility that the trends of TiO and OHIBD could be attributed to temperature alone.
Let us consider correlations of the OHIBD values with the abundances of other minerals on the surface of the Moon. Plagioclase is the most abundant mineral for the majority of the lunar surface. For the lunar nearside in the equatorial region between 30° S–30° N and 120° W–60° E, that relationship is shown in Figure A2. The plagioclase abundance, as determined by Lemelin et al. [58], is shown in Figure A3. In Figure 6, the density plots of the correlation between plagioclase abundance and OHIBD are shown for mare and highland areas separately. According to Figure 6, plagioclase-rich rocks contain more OH/HO than other areas. Plagioclase is positively correlated with the OHIBD values at midday in both highland and mare areas, for both. In the morning, a moderate correlation () can be observed only in the highlands, while the difference values are correlated in the mare areas ().
Compositional maps by Lemelin et al. [58] of the orthopyroxene, clinopyroxene, and olivine show only weak correlations with the OHIBD values at different times of the day (see Figure A4, Figure A5 and Figure A6 for orthopyroxene, clinopyroxene, and olivine, respectively). Orthopyroxenes are essentially uncorrelated in the mare areas, but a relatively flat correlation can be observed in the highlands for morning and midday values. In the highlands, the abundance is usually quite low compared to the mare areas, where a correlation is almost absent.
3.2. Spinel
Spinel is the name of a group of cubic oxide minerals with the general formula ADO, where A is typically a divalent metal cation and D is a trivalent metal cation. Most spinels in returned lunar samples belong to chromite (), ulvöspinel (), and hercynite () [19]. Spinel minerals are found in mare basalt (mainly titanium chromites and chromian ulvöspinel) as well as in highland rocks (chromite and pleonaste spinel) [19]. Using M data, minerals of the spinel group have been found in high concentrations at several locations on the Moon [36]. The first region that was identified to have abundant spinel occurrences is the highland immediately west of Mare Moscoviense [35]. Another region showing similar spectral signatures is the Theophilus crater [49]. In the regions of interest, previous studies identified Mg-spinel () as the mineral most likely to be present [35,49]. The spectral signature of spinel appears most clearly in the two areas selected for this study, we will use these areas for evaluating the relationship between the parameters NLBD, indicating the presence of spinel, and OHIBD, indicating the integrated 3-m band depth. The spectral properties of spinel can be seen in Figure 7, which shows laboratory spectra from the RELAB database (https://pds-geosciences.wustl.edu/spectrallibrary/default.htm, accessed on 10 June 2021) [59] of nearly pure spinels from terrestrial samples alongside a nearly pure ilmenite spectrum inferred from lunar rocks.
The Mg-spinel spectrum exhibits a strong absorption band at around 2 m and no absorption band at 1 m, which is characteristic of low-Fe spinel [60]. For studies of hercynite, chromite, and ulvöspinel, the reflectance maximum around 1.5 m should be investigated. The spectral difference between the (Fe/Cr)-spinel and the surrounding mare surface, as shown by Weitz et al. [39], is less pronounced than the spectral difference between Mg-spinel and the surrounding highland areas examined by Pieters et al. [35] and Dhingra et al. [49]. Furthermore, it was found that spinels exhibit a broad 2.6–3 m absorption band in an almost anhydrous state [61] or a narrow 2.8 m absorption band [60]. These features can be explained by the presence of Fe [61] and O-H stretching [60]. Hence, even small amounts of hydroxyl (and possibly also Fe) might lead to a more pronounced absorption at around 3 m.
In this study, we examined regions in the Theophilus crater and west of Mare Moscoviense because they show the spatially most extended lunar areas with a high content of Mg-spinel [35,36,49]. Regions containing Fe,Cr-spinels are planned to be studied in future papers.
3.2.1. Theophilus Crater
The first region of interest is selected from the Theophilus crater located on the lunar near-side at the northwestern border of Mare Nectaris. The mineralogy of the central peak of the Theophilus crater is quite diverse, with occurrences of plagioclase, pyroxene, spinel, and olivine, but the most common compositions are mafic-free anorthosites [49]. The M image available for this region was taken at 08:45 local time, or about 81 h after sunrise. This crater is located near the equator, so we expected that about half of the weakly bound OH/HO component had already been removed at this time of day (see Grumpe et al. [7], compare Figures S1h and S1g for regions 7 and 8 therein). Therefore, we assume that the behavior can be interpreted as being intermediate between morning and midday. There are several areas in the Theophilus crater with high Mg-spinel abundances, and we chose the region with the strongest Mg-spinel signature whose position is shown in Figure 8. The NLBD and OHIBD parameters were then calculated according to the procedure described in Section 2.
Figure 9 shows an overview of the radiance, NLBD, and OHIBD maps along with the estimated surface temperature as a reference. The strongest NLBD values correspond to low OHIBD values. The estimated effective temperature does not correlate with the NLBD values, suggesting that temperature variations in the scene are not associated with mineralogy. The strong temperature variations are due to the uneven terrain and the relatively low elevation of the sun. Therefore, a small moderate positive correlation between temperature and OHIBD is visible in Figure 10.
The analysis of spinel-rich areas differs from the analysis of the other minerals in one significant way. While the other minerals are contained to a certain extent in nearly each mare region, spectrally detectable abundances of spinel are only found in spatially limited areas. This implies that there are two distinct classes, one containing spinel and one (the surrounding terrain) containing no or an undetectable amount of spinel. To distinguish between these two classes, we assume that all pixels having an NLBD parameter higher than , which corresponds to a 2 m band depth—twice as deep as compared to the 1 m band depth, contain spinel (in spectra of mature areas without spinel, the 1 m band is deeper than the 2 m band). In Figure 11, areas containing spinel (magenta points) show a correlation, but for the areas that are assumed to contain negligible amounts of spinel (blue points), the values are effectively uncorrelated. For reference, the mean spectra of the two clusters at the Theophilus crater are shown in Figure A7. In general, high NLBD values correspond to lower OH/HO abundances. This is apparent in Figure 12 as well, which shows some example spectra and the locations where they have been extracted. In the still darker and cold spinel-rich areas, the correlation between NLBD and OHIBD is less pronounced.
Another important factor that might contribute to the measured OHIBD values is the surface roughness on sub-pixel scales. Shkuratov et al. [62] proposed that phase ratio images could be used to investigate the surface roughness. Because the influence of the albedo is significantly reduced in phase ratio images, they are mostly correlated with the small-scale surface roughness [63]. For the area in Theophilus crater, the phase ratio image is shown in Figure A9a. It can be seen that in the region of interest, there are no anomalies that correlate with the OHIBD values, except for a small part to the northeast where higher phase ratio values (which are presumably due to topography) correspond to lower OHIBD values. The correlation coefficient describing the relationship between the phase ratio values and the OHIBD values at Theophilus is only (Figure A10e). All correlation coefficients for the spinel-rich regions are listed in Table 2. The plagioclase abundance in this area (Figure A8a) is also uncorrelated with the OHIBD values (Figure A10f).
Spectra 1–3 and 6 indicate the presence of Mg-spinel, but the spinel-specific signature in spectrum 6 is not nearly as clear as that in the other three examples. Spectra 4 and 5 show a deep absorption at 3 m, while the spinel-rich spectra are comparably flat. The continuum-removed spectrum of location 2 is shown in Figure 12c as a representative of a high spinel abundance region, and the continuum-removed spectrum of location 5 is shown in Figure 12d as an example of a region with low spinel concentration. The OHIBD parameter is high for spectrum 5 and low for spectrum 2 with a spinel signature. This region at the central peak of Theophilus shows that spinel-rich areas correspond to a reduced OH/HO integrated band depth when the surface temperatures are so high that large amounts of the weakly bound OH/HO component have been removed. Unfortunately, there is no M image of this region available for early morning or late midday.
3.2.2. Mare Moscoviense
High concentrations of spinel were found for the first time in two small areas to the west of Mare Moscoviense [35]. In this section, we examine the larger southern occurrence at the rim of the basin, as shown in Figure 13. The surrounding surface is typical anorthositic highland. For this region, images from two different times of day are available. In the late lunar morning, at 09:20 (image M3G20090125T172601) local time, it can be assumed that the weakly bound OH/HO component is still partially present due to the moderately high latitude (see Grumpe et al. [7], compare Figures 22 and 23 for region 17 therein). At the acquisition time of the second image, at lunar midday at around 11:15 (image M3G20081229T101650), Grumpe et al. [7] argued that the weakly bound OH/HO component is diminished and only the strongly bound OH/HO component remains.
The NLBD values are not dependent on the time of day, allowing this parameter to be calculated based on all available M spectral radiance data simultaneously. The OHIBD parameter maps were constructed separately for both available times of day. At midday, the region with the lowest OHIBD lies in the center of the region characterized by the highest NLBD values, but its immediate surroundings that also show elevated NLBD values are not as strongly deprived in the OHIBD. For this OHIBD-depleted region, temperature variations are only minor (≤3 K). This area also appears to be rather flat in the radiance image, making it unlikely to be influenced by artifacts due to thermal emission removal. In the lunar morning, the high-NLBD areas in part also show lower OHIBD values, but the difference is not as significant. This trend is illustrated in the scatter plots in Figure 14, where the morning values are nearly uncorrelated; at lunar midday, however, high NLBD values correspond to low OHIBD values. The correlation coefficients are listed in Table 2. For the cluster of pixels that are likely to contain spinel (NLBD values ), we found a correlation coefficient of in the lunar morning and at lunar midday. Corresponding values for regions with low spinel content (NLBD values below 0.3) are and , respectively. For reference, the phase ratio image is shown in Figure A9b. In general, the surface is relatively smooth when compared to the Theophilus crater. In Figure A10a,b, the correlation between the phase ratio values and the OHIBD parameter is depicted. There appears to be no correlation in the region of interest between phase ratio and OHIBD, so that we can safely rule out the possibility that the surface roughness influences the observed correlation between the OHIBD and the spinel. The plagioclase abundance is also uncorrelated with the OHIBD values (Figure A8b and Figure A10c,d).
Figure 16 shows some example spectra and their positions in the NLBD map. These spectra indicate that in the lunar morning, the OHIBD values are generally higher than at midday, but at both times of day, the selected spectra 1 and 2 show the typical 2 m absorption band of Mg-spinel and a relatively weak 3 m absorption band. Spectrum 4 is possibly overcompensated in thermal emission due to small-scale localized inaccuracies in the digital elevation model (DEM), leading to an inaccurate estimate of the incidence angle at that specific location.
4. Discussion
Our analysis of M data has demonstrated that the OHIBD values at midday in the mare regions decrease significantly (by a factor of up to about three) with the TiO content of the mare material, increasing from near-zero to its maximum value of about 8 wt % (see [5] for the OHIBD behavior on global scales). At low latitudes, the OHIBD difference between morning and midday, which we interpret as a measure of the amount of weakly bound OH/HO in the lunar surface material, is near zero in the highlands and about 20–30 percent of the morning value in the low-Ti maria, but increases with increasing TiO content in the mare areas. This suggests that the TiO-bearing minerals contained in the lunar surface material bind small amounts of OH/HO strongly and large amounts of OH/HO weakly to their crystal structure.
The strength of the OHIBD parameter is influenced by a wide range of factors apart from composition, such as latitude, time of day, and roughness, among others. Additionally, it should be considered that the part of the composition that influences the hydration signatures the most is not always clear. For example, TiO-rich regions are depleted in plagioclase because the TiO abundance is highly correlated with plagioclase abundance (see also Figure A2). Therefore, the reduced amount of strongly bound OHIBD in TiO-rich regions might be attributed to the absence of plagioclase that has been found to more strongly bind OH/HO [64]. Similarly, Poston et al. [65] showed that a feldspathic highland sample retained significantly more OH/HO compared to a mare sample. However, the spectral effect of the opaque mineral ilmenite is presumably stronger than to be expected based on its weight fraction. For ilmenite, this behavior was shown in laboratory experiments and was attributed to the excessively high extinction coefficient of ilmenite compared to non-opaque minerals (e.g., [66]). As a consequence, the OHIBD values might also already be strongly influenced by moderate amounts of opaque minerals. Of course, it is not self-evident that this behavior applies in the same way to the ilmenite-bound OH/HO; hence, it is necessary to conduct further studies, e.g., focusing on hydrated ilmenite in the laboratory to provide a definite explanation.
In addition to that, another solar wind-implanted volatile, He, is mainly bound by ilmenite, a behavior which has been attributed to the presence of a large number of defect sites in ilmenite (e.g., see [67,68]). Milliken and Mustard [69] further suggested that the measured 3 m band strength is dependent on the albedo. TiO-rich regions are generally darker compared to mare areas with low TiO concentration. This effect may have an influence on the overall correlation, but our spectral reflectance data have been carefully photometrically corrected with the model of Hapke [42], and the albedo is not variable during the day in our data. If the albedo had a strong influence on this correlation, we would also expect a stronger correlation in the morning, which is not the case, except for plagioclase in the highlands. High-Ti mare basalt might also be influenced by other phases, such as olivine [70], but we did not observe any correlation between olivine abundance and OHIBD in our study (see Figure A6).
Plagioclase does not release large amounts of OH/HO in the course of the lunar day because the lunar highlands show only weak time-of-day-dependent OHIBD variations [5]. Our observations thus suggest that most of the OH/HO component in TiO-bearing minerals is weakly bound, whereas most of the OH/HO component in plagioclase is strongly bound. In this line of thought, the depletion of plagioclase in the TiO-rich mare areas explains the low OHIBD values at midday (corresponding to strongly bound OH/HO), whereas the presence of large amounts of TiO in the same areas explains the strong time-of-day-dependent OHIBD variations (due to weakly bound OH/HO).
However, another factor that is difficult to assess is the influence of agglutinitic glass. As it is difficult to accurately determine the glass content remotely, their effect cannot be estimated directly. It has been found that these glass contain strongly bound OH/HO and possibly internal OH/HO [71]. The correlation of the agglutinitic glass and TiO abundance from Pieters et al. [56] is ; therefore, soil with a higher TiO concentration would contain a smaller amount of agglutinates. This could also explain why the plagioclase-deprived and TiO-rich regions contain only small amounts of strongly bound OH/HO. The moderate correlation found by Pieters et al. [56] in the lunar returned samples is, however, not sufficient to attribute the observed strongly bound component entirely to agglutinates, and the stronger variability during the day compared to other minerals cannot be explained by the strongly bound OH/HO component in glass. For the Mg-spinel-rich regions, the difference in agglutinitic glass content with respect to the surrounding areas is expected to be small because there are no measurable maturity differences.
Regarding the midday OHIBD values, we observed a behavior for spinel that is similar to TiO. The OHIBD in the spinel-bearing area to the west of Mare Moscoviense is nearly the same as that in the surrounding region in the late morning, whereas it shows a strong contrast (by a factor of about two) at midday. In the surrounding highland-like terrain, almost no difference in OHIBD between morning and midday is apparent. For the spinel-bearing area inside the Theophilus crater, the contrast of OHIBD values between spinel and no-spinel regions at this intermediate time between morning and midday even amounts to a factor of about three. Even though no comparison between morning and midday is possible for the Theophilus crater due to the lack of M data acquired in the early lunar morning or at late midday, studying this region is important as it is the spatially most extended area with the strongest spectral spinel signature in the lunar highlands. The temperature at the Theophilus crater also shows a moderate correlation with OHIBD (see Figure 10). An immediate, unintuitive (and not very pronounced), positive correlation between surface temperature and OHIBD is apparent in Figure 10 for temperature values between 340 and 380 K. A possible explanation for this is: if a surface part that is first shadowed by another surface part still contains a large abundance of OH/HO from the previous lunar day, and then heats up as the sun suddenly falls relatively steeply on the same surface part, it will take a while for the OH/HO to evaporate and photo-dissociate. In such a configuration, which often occurs in uneven terrain, it may, therefore, well be the case that relatively large amounts of OH/HO occur on warm parts of the surface. Such unexpected correlations should be further examined, e.g., by applying the OH model of Grumpe et al. [7] to realistic lunar surface topography, which, however, goes beyond the scope of this paper.
The content of pyroxene and olivine is estimated to be as low as 5 wt % in the regions rich in Mg-spinel in the Theophilus crater and Mare Moscoviense [35,49]. For this reason, the influence of other mafic minerals on the OHIBD values in these regions should be negligible. As shown in Figure A8a,b, the OHIBD values are also not correlated with the plagioclase abundance in these regions of interest. For the spinel-bearing regions, no reliable evaluation of the weakly bound OH/HO component can be performed due to the limited amount of data available from different times of day. The strongly bound component, however, is lower in the high-spinel regions when compared to the surrounding low-spinel surface. The general observations at Mare Moscoviense are similar to those at Theophilus in that both show lower OHIBD values for the high-NLBD regions. At Theophilus, this correlation is apparent at an earlier time of day than at Mare Moscoviense. Because Mare Moscoviense is located at a higher latitude than the equatorial crater Theophilus, this observation is consistent with the interpretation that the strongly bound OH/HO component is less abundant in Mg-spinel-rich areas [7].
Our observations suggest that lunar minerals containing TiO, including ilmenite and spinel-rich materials have similar tendencies to release (in the late morning up to midday) and build up (in the early morning and in the afternoon) large amounts of weakly bound OH/HO. In contrast, the amount of strongly bound OH/HO that is insensitive to loss processes such as thermal evaporation and photolysis [7] is small for both types of materials, but large for plagioclase. This behavior differs from low-spinel highland areas and low-ilmenite maria, which consist nearly completely of silicate minerals. They show much smaller time-of-day-dependent OHIBD variations than areas rich in TiO or spinel, and thus appear to be dominated by strongly bound OH/HO.
5. Summary
In this work, we have investigated the relationship between TiO-bearing minerals, plagioclase, and Mg-spinel on the one hand, and the hydration of the surface material on the other. The correlation between TiO abundance and OHIBD values was investigated in the mare areas on the lunar near-side. At lunar midday, the OHIBD values of TiO-rich, and consequently probably ilmenite-rich, mare basalt areas were systematically lower than those of other mare terrains, whereas variations of OH/HO abundance with time of day were the strongest in Ti-rich areas. Hence, we attribute the variable (weakly bound) OH/HO component to the presence of TiO-bearing minerals. In contrast, plagioclase is likely to contain most of the strongly bound OH/H2O component: the plagioclase-rich highland regions showed only weak time-of-day-dependent OHIBD variations so that the OH/H2O component bound by plagioclase could not be released in large amounts in the course of the lunar day. The abundance of lunar glass could not be reliably determined, but it could also contribute to the observed trends as laboratory samples suggest that the abundance of glass is correlated with plagioclase and TiO abundance.
As Mg-spinel very rarely occurs in high concentrations, the analysis was carried out for two small areas in the Theophilus crater and west of the Mare Moscoviense basin ring. At around midday, when most of the weakly bound OH/HO had been released and mainly the strongly bound OH/HO remained, both regions exhibited a low OHIBD for areas characterized by high NLBD parameter values. These observations suggest that the ilmenite and Mg-spinel in the lunar surface material are unlikely to bind OH/HO strongly, which is in contrast to the behavior of plagioclase.
In future studies, we plan to further examine spinel-rich areas, including Fe and Ti spinels that show less pronounced spectral signatures but have better coverage by M data for different times of day, and to employ spectral unmixing techniques to quantify the abundances of Mg-spinel and ilmenite.
Author Contributions
Conceptualization, M.H. and C.W.; methodology, M.H. and C.W.; software, M.H.; validation, M.H., C.W., A.A.B., and J.L.B.; formal analysis, M.H. and C.W.; investigation, M.H., C.W., A.A.B., J.L.B., and V.V.S.; resources, A.A.B. and J.L.B.; data curation, M.H.; writing—original draft preparation, M.H.; writing—review and editing, C.W., A.A.B., J.L.B., and V.V.S.; visualization, M.H.; supervision, C.W. All authors have read and agreed to the published version of the manuscript.
Funding
A.A.B. was partially supported by TU Dortmund University. A.A.B. and V.V.S. were partially supported by the Russian Science Foundation (Grant No. 20-12-00105) and the Kazan Federal University Strategic Academic Leadership Program (“PRIORITY-2030”).
Data Availability Statement
Level 1B data set acquired by M from NASA and JPL [41]; OHIBD maps in Wöhler et al. [5]; TiO maps in Sato et al. [24]; Kaguya MI mineral maps in Lemelin et al. [53]; Mare borders as in Nelson et al. [57]; RELAB database (https://pds-geosciences.wustl.edu/spectrallibrary/default.htm, accessed on 10 June 2021) [59].
Acknowledgments
We are grateful to the M team for collecting the data analyzed in this study.
Conflicts of Interest
The authors declare no conflict of interest.
Appendix A
Figure A1.
TiO content in the equatorial mare regions from Sato et al. [24].
Figure A1.
TiO content in the equatorial mare regions from Sato et al. [24].

Figure A2.
Density plot of plagioclase and TiO abundance. The trend corresponds to a correlation coefficient of . The color bar represents the decadal logarithm of the number of examples at a discrete pixel in parameter space.
Figure A2.
Density plot of plagioclase and TiO abundance. The trend corresponds to a correlation coefficient of . The color bar represents the decadal logarithm of the number of examples at a discrete pixel in parameter space.

Figure A3.
Plagioclase content in the equatorial regions. Data from Lemelin et al. [58].
Figure A3.
Plagioclase content in the equatorial regions. Data from Lemelin et al. [58].

Figure A4.
Density plots for the orthopyroxene weight percentage from Lemelin et al. [58] plotted against the OHIBD values at different times of day. The comparison is carried out in the equatorial mare and highland regions on the lunar near-side. The color bar represents the decadal logarithm of the number of examples at a discrete pixel in parameter space. (a) Highland morning (), (b) Highland midday (), (c) Highland difference (), (d) Mare morning (), (e) Mare midday (), (f) Mare difference ().

Figure A5.
Density plots for the clinopyroxene weight percentage from Lemelin et al. [58] plotted against the OHIBD values at different times of day. The comparison is carried out in the equatorial mare and highland regions on the lunar near-side. The color bar represents the decadal logarithm of the number of examples at a discrete pixel in parameter space. (a) Highland morning (), (b) Highland midday (), (c) Highland difference (), (d) Mare morning (), (e) Mare midday (), (f) Mare difference ().


Figure A6.
Density plots for the olivine weight percentage from Lemelin et al. [58] plotted against the OHIBD values at different times of day. The comparison is limited to the equatorial mare regions on the lunar near-side because the abundance of olivine in the highlands is negligible. The color bar represents the decadal logarithm of the number of examples at a discrete pixel in parameter space. (a) Mare morning (), (b) Mare midday (), (c) Mare difference ().

Figure A7.
Mean spectra for the pixels with an NLBD value above 0.3 (blue curve) and below 0.3 (red curve) representing the spinel and no-spinel clusters, respectively (see Figure 11). These spectra are taken from the Theophilus crater region of interest.
Figure A7.
Mean spectra for the pixels with an NLBD value above 0.3 (blue curve) and below 0.3 (red curve) representing the spinel and no-spinel clusters, respectively (see Figure 11). These spectra are taken from the Theophilus crater region of interest.

Figure A8.
Plagioclase abundance data from Lemelin et al. [58] for the regions of interest in the Theophilus crater and near Mare Moscoviense. The plagioclase abundance is uncorrelated with the OHIBD parameter maps in Figure 9c and Figure 15c,e for the Theophilus crater () and Mare Moscoviense in the morning () and at midday (), respectively. (a) Theophilus crater, (b) Mare Moscoviense.

Figure A9.
Phase ratio images for the regions of interest at the Theophilus crater and the western basin rim of Mare Moscoviense. The phase ratio images are correlated with the macroscopic and microscopic surface roughness [63]. In the Theophilus crater, the correlation with the OHIBD values is , near Mare Moscoviense it is and for morning and midday, respectively. (a) Theophilus crater /, (b) Mare Moscoviense /.

Figure A10.
Correlations of plagioclase abundance and phase ratio values with the OHIBD values at Mare Moscoviense and Theophilus crater (Figure A8 and Figure A9), for the entire region of interest respectively. (a) Mare Moscoviense morning (), (b) Mare Moscoviense midday (), (c) Mare Moscoviense morning (), (d) Mare Moscoviense midday (), (e) Theophilus (), (f) Theophilus ().

References
- Pieters, C.M.; Boardman, J.; Buratti, B.; Chatterjee, A.; Clark, R.; Glavich, T.; Green, R.; Head, J.; Isaacson, P.; Malaret, E.; et al. The Moon Mineralogy Mapper (M3) on Chandrayaan-1. Curr. Sci. 2009, 96, 500–505. [Google Scholar]
- Clark, R.N.; Pieters, C.M.; Green, R.O.; Boardman, J.W.; Buratti, B.J.; Head, J.W.; Isaacson, P.; Livo, K.E.; McCord, T.B.; Mustard, J.F.; et al. Water, Hydroxyl, and the Search for Alteration and Oxidation on the Moon (Invited). In Proceedings of the AGU Fall Meeting Abstracts, San Francisco, CA, USA, 13–18 December 2009; p. P34A-03. [Google Scholar]
- Li, S.; Milliken, R.E. Water on the surface of the Moon as seen by the Moon Mineralogy Mapper: Distribution, abundance, and origins. Sci. Adv. 2017, 3, e1701471. [Google Scholar] [CrossRef] [PubMed] [Green Version]
- Bandfield, J.L.; Poston, M.; Klima, R.L.; Christopher, E. Widespread distribution of OH/H2O on the lunar surface inferred from spectral data. Nat. Geosci. 2018, 11, 173–177. [Google Scholar] [CrossRef] [PubMed]
- Wöhler, C.; Grumpe, A.; Berezhnoy, A.A.; Shevchenko, V.V. Time-of-day–dependent global distribution of lunar surficial water/hydroxyl. Sci. Adv. 2017, 3, e1701286. [Google Scholar] [CrossRef] [PubMed] [Green Version]
- McCord, T.; Taylor, L.; Combe, J.P.; Kramer, G.; Pieters, C.; Sunshine, J.; Clark, R. Sources and physical processes responsible for OH/H2O in the lunar soil as revealed by the Moon Mineralogy Mapper (M3). J. Geophys. Res. Planets 2011, 116, 1–22. [Google Scholar] [CrossRef] [Green Version]
- Grumpe, A.; Wöhler, C.; Berezhnoy, A.A.; Shevchenko, V.V. Time-of-day-dependent behavior of surficial lunar hydroxyl/water: Observations and modeling’. Icarus 2019, 321, 486–507. [Google Scholar] [CrossRef]
- Honniball, C.I.; Lucey, P.; Ferrari-Wong, C.M.; Flom, A.; Li, S.; Kaluna, H.M.; Takir, D. Telescopic Observations of Lunar Hydration: Variations and Abundance. J. Geophys. Res. Planets 2020, 125, e2020JE006484. [Google Scholar] [CrossRef]
- Honniball, C.; Lucey, P.; Li, S.; Shenoy, S.; Orlando, T.; Hibbitts, C.; Hurley, D.; Farrell, W. Molecular water detected on the sunlit Moon by SOFIA. Nat. Astron. 2021, 5, 121–127. [Google Scholar] [CrossRef]
- Hendrix, A.R.; Hurley, D.M.; Farrell, W.M.; Greenhagen, B.T.; Hayne, P.O.; Retherford, K.D.; Vilas, F.; Cahill, J.T.; Poston, M.J.; Liu, Y. Diurnally migrating lunar water: Evidence from ultraviolet data. Geophys. Res. Lett. 2019, 46, 2417–2424. [Google Scholar] [CrossRef]
- Farrell, W.; Hurley, D.; Zimmerman, M. Solar wind implantation into lunar regolith: Hydrogen retention in a surface with defects. Icarus 2015, 255, 116–126. [Google Scholar] [CrossRef] [Green Version]
- Starukhina, L. Water on the Moon: What Is Derived from the Observations? In Moon: Prospective Energy and Material Resources; Springer: Berlin/Heidelberg, Germany, 2013; pp. 57–85. [Google Scholar]
- Tucker, O.J.; Farrell, W.M.; Poppe, A.R. On the effect of magnetospheric shielding on the lunar hydrogen cycle. J. Geophys. Res. Planets 2021, 126, e2020JE006552. [Google Scholar] [CrossRef]
- Klima, R.; Cahill, J.; Hagerty, J.; Lawrence, D. Remote detection of magmatic water in Bullialdus Crater on the Moon. Nat. Geosci. 2013, 6, 737–741. [Google Scholar] [CrossRef]
- Zhang, Y.; Stolper, E.M.; Wasserburg, G. Diffusion of water in rhyolitic glasses. Geochim. Cosmochim. Acta 1991, 55, 441–456. [Google Scholar] [CrossRef]
- Zhuravlev, L. The surface chemistry of amorphous silica. Zhuravlev model. Colloids Surfaces A Physicochem. Eng. Asp. 2000, 173, 1–38. [Google Scholar] [CrossRef] [Green Version]
- Schörghofer, N.; Benna, M.; Berezhnoy, A.A.; Greenhagen, B.; Jones, B.M.; Li, S.; Orlando, T.M.; Prem, P.; Tucker, O.J.; Wöhler, C. Water group exospheres and surface interactions on the Moon, Mercury, and Ceres. Space Sci. Rev. 2021, 217, 1–35. [Google Scholar] [CrossRef]
- Pour, A.B.; Park, Y.; Park, T.Y.S.; Hong, J.K.; Hashim, M.; Woo, J.; Ayoobi, I. Regional geology mapping using satellite-based remote sensing approach in Northern Victoria Land, Antarctica. Polar Sci. 2018, 16, 23–46. [Google Scholar] [CrossRef]
- Papike, J.; Taylor, L.; Simon, S. Lunar minerals. In Lunar Sourcebook: A User’s Guide to the Moon; Heiken, G., Vaniman, D., French, B., Eds.; Cambridge University Press: Cambridge, UK, 1991; pp. 121–182. [Google Scholar]
- Lucey, P.G. Radiative transfer model constraints on the shock state of remotely sensed lunar anorthosites. Geophys. Res. Lett. 2002, 29, 124-1–124-3. [Google Scholar] [CrossRef]
- Yamamoto, S.; Nakamura, R.; Matsunaga, T.; Ogawa, Y.; Ishihara, Y.; Morota, T.; Hirata, N.; Ohtake, M.; Hiroi, T.; Yokota, Y.; et al. Featureless spectra on the Moon as evidence of residual lunar primordial crust. J. Geophys. Res. Planets 2015, 120, 2190–2205. [Google Scholar] [CrossRef]
- Mustard, J.F.; Pieters, C.M.; Isaacson, P.J.; Head, J.W.; Besse, S.; Clark, R.N.; Klima, R.L.; Petro, N.E.; Staid, M.I.; Sunshine, J.M.; et al. Compositional diversity and geologic insights of the Aristarchus crater from Moon Mineralogy Mapper data. J. Geophys. Res. Planets 2011, 116, E00G12. [Google Scholar] [CrossRef] [Green Version]
- Lucey, P.G.; Blewett, D.T.; Jolliff, B.L. Lunar iron and titanium abundance algorithms based on final processing of Clementine ultraviolet-visible images. J. Geophys. Res. Planets 2000, 105, 20297–20305. [Google Scholar] [CrossRef]
- Sato, H.; Robinson, M.S.; Lawrence, S.J.; Denevi, B.W.; Hapke, B.; Jolliff, B.L.; Hiesinger, H. Lunar mare TiO2 abundances estimated from UV/Vis reflectance. Icarus 2017, 296, 216–238. [Google Scholar] [CrossRef]
- Le Mouelic, S.; Langevin, Y.; Erard, S.; Pinet, P.; Chevrel, S.; Daydou, Y. Discrimination between maturity and composition of lunar soils from integrated Clementine UV-visible/near-infrared data: Application to the Aristarchus Plateau. J. Geophys. Res. Planets 2000, 105, 9445–9456. [Google Scholar] [CrossRef]
- Wöhler, C.; Grumpe, A.; Berezhnoy, A.; Bhatt, M.U.; Mall, U. Integrated topographic, photometric and spectral analysis of the lunar surface: Application to impact melt flows and ponds. Icarus 2014, 235, 86–122. [Google Scholar] [CrossRef]
- Bhatt, M.; Mall, U.; Wöhler, C.; Grumpe, A.; Bugiolacchi, R. A comparative study of iron abundance estimation methods: Application to the western nearside of the Moon. Icarus 2015, 248, 72–88. [Google Scholar] [CrossRef]
- Bhatt, M.; Wöhler, C.; Grumpe, A.; Hasebe, N.; Naito, M. Global mapping of lunar refractory elements: Multivariate regression vs. machine learning. Astron. Astrophys. 2019, 627, A155. [Google Scholar] [CrossRef]
- Wöhler, C.; Berezhnoy, A.A.; Grumpe, A.; Shevchenko, V.V. Correlation Between Lunar Soil Composition and Weakly Bounded Surficial OH/H2O Component. In Proceedings of the European Lunar Symposium, Toulouse, France, 14–16 May 2018. [Google Scholar]
- Cheek, L.C.; Pieters, C.M.; Boardman, J.W.; Clark, R.N.; Combe, J.P.; Head, J.W.; Isaacson, P.J.; McCord, T.B.; Moriarty, D.; Nettles, J.W.; et al. Goldschmidt crater and the Moon’s north polar region: Results from the Moon Mineralogy Mapper (M3). J. Geophys. Res. Planets 2011, 116, E00G02. [Google Scholar] [CrossRef] [Green Version]
- Wöhler, C.; Grumpe, A.; Berezhnoy, A.A.; Feoktistova, E.A.; Evdokimova, N.A.; Kapoor, K.; Shevchenko, V.V. Temperature regime and water/hydroxyl behavior in the crater Boguslawsky on the Moon. Icarus 2017, 285, 118–136. [Google Scholar] [CrossRef]
- Delbo, M.; Mueller, M.; Emery, J.P.; Rozitis, B.; Capria, M.T. Asteroid Thermophysical Modeling; University of Arizona Press: Tucson, AZ, USA, 2015. [Google Scholar]
- Blewett, D.T.; Lucey, P.G.; Hawke, B.R.; Jolliff, B.L. Clementine images of the lunar sample-return stations: Refinement of FeO and TiO2 mapping techniques. J. Geophys. Res. Planets 1997, 102, 16319–16325. [Google Scholar] [CrossRef]
- Prinz, M.; Dowty, E.; Keil, K.; Bunch, T.E. Spinel Troctolite and Anorthosite in Apollo 16 Samples. Science 1973, 179, 74–76. [Google Scholar] [CrossRef]
- Pieters, C.M.; Besse, S.; Boardman, J.; Buratti, B.; Cheek, L.; Clark, R.N.; Combe, J.P.; Dhingra, D.; Goswami, J.N.; Green, R.O.; et al. Mg-spinel lithology: A new rock type on the lunar farside. J. Geophys. Res. Planets 2011, 116, E6. [Google Scholar] [CrossRef] [Green Version]
- Pieters, C.M.; Donaldson Hanna, K.; Cheek, L.; Dhingra, D.; Prissel, T.; Jackson, C.; Moriarty, D.; Parman, S.; A Taylor, L. The distribution of Mg-spinel across the Moon and constraints on crustal origin. Am. Mineral. 2014, 99, 1893–1910. [Google Scholar] [CrossRef]
- Sunshine, J.M.; Besse, S.; Petro, N.E.; Pieters, C.M.; Head, J.W.; Taylor, L.A.; Klima, R.L.; Isaacson, P.J.; Boardman, J.W.; Clark, R.C.; et al. Hidden in Plain Sight: Spinel-rich Deposits on the Nearside of the Moon as Revealed by Moon Mineralogy Mapper (M3). In Proceedings of the Lunar and Planetary Science Conference, The Woodlands, TX, USA, 1–5 March 2010; Volume 41, p. 1508. [Google Scholar]
- Yamamoto, S.; Nakamura, R.; Matsunaga, T.; Ogawa, Y.; Ishihara, Y.; Morota, T.; Hirata, N.; Ohtake, M.; Hiroi, T.; Yokota, Y.; et al. A new type of pyroclastic deposit on the Moon containing Fe-spinel and chromite. Geophys. Res. Lett. 2013, 40, 4549–4554. [Google Scholar] [CrossRef]
- Weitz, C.M.; Staid, M.I.; Gaddis, L.R.; Besse, S.; Sunshine, J.M. Investigation of Lunar Spinels at Sinus Aestuum. J. Geophys. Res. Planets 2017, 122, 2013–2033. [Google Scholar] [CrossRef]
- Cheek, L.; Pieters, C. Reflectance spectroscopy of plagioclase-dominated mineral mixtures: Implications for characterizing lunar anorthosites remotely. Am. Mineral. 2014, 99, 1871–1892. [Google Scholar] [CrossRef]
- NASA; JPL. Planetary Data System. 2019. Available online: https://pds-imaging.jpl.nasa.gov/volumes/m3.html (accessed on 10 June 2021).
- Hapke, B. Bidirectional Reflectance Spectroscopy: 5. The Coherent Backscatter Opposition Effect and Anisotropic Scattering. Icarus 2002, 157, 523–534. [Google Scholar] [CrossRef] [Green Version]
- Grumpe, A.; Wöhler, C. Recovery of Elevation from Estimated Gradient Fields Constrained by Digital Elevation Maps of Lower Lateral Resolution. ISPRS J. Photogramm. Remote Sens. 2014, 94, 37–54. [Google Scholar] [CrossRef]
- Speyerer, E.; Robinson, M.; Denevi, B. Lunar Reconnaissance Orbiter Camera global morphological map of the Moon. In Proceedings of the Lunar and Planetary Science Conference, The Woodlands, TX, USA, 7–11 March 2011; p. 2387. [Google Scholar]
- Shkuratov, Y.; Kaydash, V.; Korokhin, V.; Velikodsky, Y.; Opanasenko, N.; Videen, G. Optical measurements of the Moon as a tool to study its surface. Planet. Space Sci. 2011, 59, 1326–1371. [Google Scholar] [CrossRef]
- Marsland, S. Machine Learning: An Algorithmic Perspective, 2 ed.; CRC Press: Boca Raton, FL, USA, 2015. [Google Scholar]
- Fu, Z.; Robles-Kelly, A.; Caelli, T.; Tan, R.T. On Automatic Absorption Detection for Imaging Spectroscopy: A Comparative Study. IEEE Trans. Geosci. Remote Sens. 2007, 45, 3827–3844. [Google Scholar] [CrossRef]
- Rommel, D.; Grumpe, A.; Felder, M.P.; Wöhler, C.; Mall, U.; Kronz, A. Automatic endmember selection and nonlinear spectral unmixing of Lunar analog minerals. Icarus 2017, 284, 126–149. [Google Scholar] [CrossRef]
- Dhingra, D.; Pieters, C.M.; Boardman, J.W.; Head, J.W.; Isaacson, P.J.; Taylor, L.A. Compositional diversity at Theophilus Crater: Understanding the geological context of Mg-spinel bearing central peaks. Geophys. Res. Lett. 2011, 38, A11. [Google Scholar] [CrossRef] [Green Version]
- Green, R.; Pieters, C.; Mouroulis, P.; Eastwood, M.; Boardman, J.; Glavich, T.; Isaacson, P.; Annadurai, M.; Besse, S.; Barr, D.; et al. The Moon Mineralogy Mapper (M3) imaging spectrometer for lunar science: Instrument description, calibration, on-orbit measurements, science data calibration and on-orbit validation. J. Geophys. Res. Planets 2011, 116. [Google Scholar] [CrossRef] [Green Version]
- Isaacson, P.; Besse, S.; Petro, N.; Nettles, J.; the M3 Team. M3 Overview and Working with M3 Data; Technical Report; PDS; 2011. Available online: https://pds-imaging.jpl.nasa.gov/documentation/Isaacson_M3_Workshop_Final.pdf (accessed on 12 September 2021).
- Nash, D.B.; Conel, J.E. Spectral reflectance systematics for mixtures of powdered hypersthene, labradorite, and ilmenite. J. Geophys. Res. (1896–1977) 1974, 79, 1615–1621. [Google Scholar] [CrossRef]
- Lemelin, M.; Lucey, P.; Gaddis, L.; Hare, T.; Ohtake, M. Global map products from the Kaguya multiband imager at 512 ppd: Minerals, FeO, and OMAT. In Proceedings of the Lunar and Planetary Science Conference, The Woodlands, TX, USA, 21–25 March 2016; Volume 47, p. 2994. [Google Scholar]
- Taylor, L.A.; Pieters, C.; Keller, L.P.; Morris, R.V.; Mckay, D.S.; Patchen, A.; Wentworth, S. The effects of space weathering on Apollo 17 mare soils: Petrographie and chemical characterization. Meteorit. Planet. Sci. 2001, 36, 285–299. [Google Scholar] [CrossRef]
- Coman, E.O.; Jolliff, B.L.; Carpenter, P. Mineralogy and chemistry of Ti-Bearing lunar soils: Effects on reflectance spectra and remote sensing observations. Icarus 2018, 306, 243–255. [Google Scholar] [CrossRef]
- Pieters, C.M.; Stankevich, D.; Shkuratov, Y.; Taylor, L. Statistical Analysis of the Links among Lunar Mare Soil Mineralogy, Chemistry, and Reflectance Spectra. Icarus 2002, 155, 285–298. [Google Scholar] [CrossRef]
- Nelson, D.; Koeber, S.; Daud, K.; Robinson, M.; Watters, T.; Banks, M.; Williams, N. Mapping lunar maria extents and lobate scarps using LROC image products. In Proceedings of the Lunar and Planetary Science Conference, The Woodlands, TX, USA, 17–21 March 2014; Volume 45, p. 2861. [Google Scholar]
- Lemelin, M.; Lucey, P.G.; Miljković, K.; Gaddis, L.R.; Hare, T.; Ohtake, M. The compositions of the lunar crust and upper mantle: Spectral analysis of the inner rings of lunar impact basins. Planet. Space Sci. 2019, 165, 230–243. [Google Scholar] [CrossRef]
- Pieters, C.M.; Hiroi, T.; Pratt, S.F.; Patterson, B. Reflectance Experiment Laboratory (RELAB) Description and User’s Manual; 2004. Available online: https://ntrs.nasa.gov/api/citations/20040129713/downloads/20040129713.pdf (accessed on 10 September 2021).
- Cloutis, E.A.; Sunshine, J.M.; Morris, R.V. Spectral reflectance-compositional properties of spinels and chromites: Implications for planetary remote sensing and geothermometry. Meteorit. Planet. Sci. 2004, 39, 545–565. [Google Scholar] [CrossRef]
- Rossman, G.R.; Smyth, J.R. Hydroxyl contents of accessory minerals in mantle eclogites and related rocks. Am. Mineral. 1990, 75, 775–780. [Google Scholar]
- Shkuratov, Y.G.; Starukhina, L.; Kreslavsky, M.; Opanasenko, N.; Stankevich, D.; Shevchenko, V. Principle of undulatory invariance in photometry of atmosphereless celestial bodies. Icarus 1994, 109, 168–190. [Google Scholar] [CrossRef]
- Shkuratov, Y.; Kaydash, V.; Gerasimenko, S.; Opanasenko, N.; Velikodsky, Y.; Korokhin, V.; Videen, G.; Pieters, C. Probable swirls detected as photometric anomalies in Oceanus Procellarum. Icarus 2010, 208, 20–30. [Google Scholar] [CrossRef]
- Hibbitts, C.; Grieves, G.; Poston, M.; Dyar, M.; Alexandrov, A.; Johnson, M.; Orlando, T. Thermal stability of water and hydroxyl on the surface of the Moon from temperature-programmed desorption measurements of lunar analog materials. Icarus 2011, 213, 64–72. [Google Scholar] [CrossRef]
- Poston, M.J.; Grieves, G.A.; Aleksandrov, A.B.; Hibbitts, C.A.; Dyar, M.D.; Orlando, T.M. Temperature programmed desorption studies of water interactions with Apollo lunar samples 12001 and 72501. Icarus 2015, 255, 24–29. [Google Scholar] [CrossRef]
- Grumpe, A.; Mengewein, N.; Rommel, D.; Mall, U.; Wöhler, C. Interpreting spectral unmixing coefficients: From spectral weights to mass fractions. Icarus 2018, 299, 1–14. [Google Scholar] [CrossRef]
- Shkuratov, Y.G.; Starukhina, L.; Kaidash, V.; Bondarenko, N. 3 He Distribution over the Lunar Visible Hemisphere. Sol. Syst. Res. 1999, 33, 409. [Google Scholar]
- Kim, K.J.; Wöhler, C.; Berezhnoy, A.A.; Bhatt, M.; Grumpe, A. Prospective 3He-rich landing sites on the Moon. Planet. Space Sci. 2019, 177, 104686. [Google Scholar] [CrossRef]
- Milliken, R.E.; Mustard, J.F. Estimating the water content of hydrated minerals using reflectance spectroscopy: I. Effects of darkening agents and low-albedo materials. Icarus 2007, 189, 550–573. [Google Scholar] [CrossRef]
- Staid, M.; Pieters, C.M.; Besse, S.; Boardman, J.; Dhingra, D.; Green, R.; Head, J.; Isaacson, P.; Klima, R.; Kramer, G.; et al. The mineralogy of late stage lunar volcanism as observed by the Moon Mineralogy Mapper on Chandrayaan-1. J. Geophys. Res. Planets 2011, 116. [Google Scholar] [CrossRef]
- Liu, Y.; Guan, Y.; Zhang, Y.; Rossman, G.R.; Eiler, J.M.; Taylor, L.A. Direct measurement of hydroxyl in the lunar regolith and the origin of lunar surface water. Nat. Geosci. 2012, 5, 779–782. [Google Scholar] [CrossRef] [Green Version]
Figure 1.
Example spectra of high-TiO mare (blue curve) and low-TiO mare areas (red curve), reflectance factor (a) and reflectance factor with continuum (b). The blue curve spectrum was taken from Mare Tranquillitatis as an average spectrum of a area centered around (9° N, 34° E). The red curve spectrum was extracted from Mare Serenitatis as an average spectrum of a area centered around (24° N, 18° E). The continuum-removed spectra are shown in (c,d) for Mare Tranquillitatis and Mare Serenitatis, respectively. For BD1 and BD2, the continuum is defined as the convex hull of the spectrum. For the 3 m range, the continuum is a linear function fitted to the values between 2.537 and 2.657 m marked in green in (b).

Figure 2.
Studied parameters for the two images at morning and midday of the region near Mare Moscoviense examined in this study (see Section 3.2.2). (a) NLBD, (b) OHIBD, (c) BD1, (d) BD2.
Figure 2.
Studied parameters for the two images at morning and midday of the region near Mare Moscoviense examined in this study (see Section 3.2.2). (a) NLBD, (b) OHIBD, (c) BD1, (d) BD2.

Figure 3.
(a) Map of OHIBD values determined from the morning M data. (b) Map of OHIBD values determined from the midday M data. (c) Map of OHIBD difference between morning and midday.
Figure 3.
(a) Map of OHIBD values determined from the morning M data. (b) Map of OHIBD values determined from the midday M data. (c) Map of OHIBD difference between morning and midday.

Figure 4.
Density plots for TiO abundance vs. morning OHIBD, midday OHIBD, and the difference between morning and midday OHIBD. The color bar represents the decadal logarithm of the number of examples at a discrete pixel in parameter space. (a) Morning OHIBD (r = ), (b) Midday OHIBD (), (c) OHIBD difference ().

Figure 5.
Temperature maps of the borders between mare and highland, and between high-Ti and low-Ti maria at midday. The edge of Oceanus Procellarum is visible, but there is no visible difference between high-Ti basalt in the western part and low-Ti basalts in the eastern part of Oceanus Procellarum (see also Figure A1). At the border between the low-Ti Mare Serenitatis (north) and the high-Ti Mare Tranquillitatis (south), the major factor driving temperatures is the latitude. For the high-Ti mare basalt in the very east of Mare Serenitatis and the low-Ti western part of Mare Serenitatis, the temperature differences are around 1 K. (a) Western part of Oceanus Procellarum. (b) Mare Tranquillitatis and Mare Serenitatis.

Figure 6.
Density plots of plagioclase and OHIBD correlations based on the plagioclase abundance map of Lemelin et al. [58] and the OHIBD maps of Wöhler et al. [5], separately for mare and highland soil. The color bar represents the decadal logarithm of the number of examples at a discrete pixel in parameter space. (a) Highland morning (), (b) Highland midday (), (c) Highland difference (), (d) Mare morning (), (e) Mare midday (), (f) Mare difference ().

Figure 7.
Blue curve: mineral separate of ilmenite sample (spectral ID: LR-CMP-222). Red curve: Mg-spinel () with low iron content (spectral ID: SP-EAC-021). Yellow curve: hercynite () (spectral ID: SP-EAC-074). Violet curve: chromite () (spectral ID: CR-EAC-017). The spinel spectra are from terrestrial analogue materials. They were taken from Cloutis et al. [60] and downloaded from the RELAB spectral library. Green curve: ulvöspinel () (RELAB database, spectral ID: MR-MSR-004, synthetically created sample).

Figure 8.
M radiance image M3G20090203T160452 at 1.579 m. The region of interest at the central peak of the Theophilus crater is marked with a green rectangle.
Figure 8.
M radiance image M3G20090203T160452 at 1.579 m. The region of interest at the central peak of the Theophilus crater is marked with a green rectangle.

Figure 9.
Selected part of the central peak region of the Theophilus crater. The image was taken at 08:45 local time. (a) radiance, (b) NLBD, (c) OHIBD (percent), (d) Temperature (K).
Figure 9.
Selected part of the central peak region of the Theophilus crater. The image was taken at 08:45 local time. (a) radiance, (b) NLBD, (c) OHIBD (percent), (d) Temperature (K).

Figure 10.
The temperature and the OHIBD value at the Theophilus region show a moderate correlation of .
Figure 10.
The temperature and the OHIBD value at the Theophilus region show a moderate correlation of .

Figure 11.
Scatter plot of NLBD vs. OHIBD for the region at the Theophilus crater. The correlation coefficient for all pixels with an NLBD value larger than 0.3 (magenta circles) is . For the pixels with an NLBD value below 0.3 (blue circles), it is .
Figure 11.
Scatter plot of NLBD vs. OHIBD for the region at the Theophilus crater. The correlation coefficient for all pixels with an NLBD value larger than 0.3 (magenta circles) is . For the pixels with an NLBD value below 0.3 (blue circles), it is .

Figure 12.
Selected spectra from the Theophilus region. The spectra in (b) were averaged over M pixels. At the spinel-rich locations 1–3, the typical signature of the spinel with a deep absorption band at around 2 m is visible. Spectra (c,d) illustrate how the OHIBD parameter is calculated at locations 2 and 5, respectively. After the continuum is fitted to the values between 2.537 and 2.657 m, the integral is determined, as shown in (c,d). (a) Position on the NLBD map, (b) Spectra, (c) Spectrum 2, (d) Spectrum 5.

Figure 13.
Location of the selected region of interest near the western basin ring of Mare Moscoviense. M spectral radiance image M3G20081229T101650 at 1.579 m wavelength.
Figure 13.
Location of the selected region of interest near the western basin ring of Mare Moscoviense. M spectral radiance image M3G20081229T101650 at 1.579 m wavelength.

Figure 14.
Scatter plots of the NLBD value vs. OHIBD value for the region of interest in Figure 15b. The correlation coefficients listed in the sub-captions are calculated for the cluster assumed to contain spinel, corresponding to all pixels with NLBD values exceeding (magenta circles). The correlation coefficients for the regions not containing spinel (blue circles) are and for morning and midday, respectively. (a) At 09:20 local time. , (b) at 11:15 local time. .

Figure 15.
Region of interest near the western Mare Moscoviense basin ring. High NLBD values coincide with low OHIBD values at lunar midday, but at lunar morning, the high-NLBD areas blend into the surrounding areas. (a) Radiance image, (b) NLBD parameter map, (c) OHIBD at 09:20 (percent), (d) Temperature at 09:20 (K), (e) OHIBD at 11:15 (percent), (f) Temperature at 11:15 (K).

Figure 16.
Spectra of the Mare Moscoviense region of interest in the morning and at midday, and their corresponding positions in the NLBD map. The second set of spectra is normalized to the reflectance at 2.617 m ( channel 76). (a) Positions of example spectra, (b) at 09:20 local time, (c) at 11:15 local time, (d) at 09:20 local time, normalized, (e) at 11:15 local time, normalized.


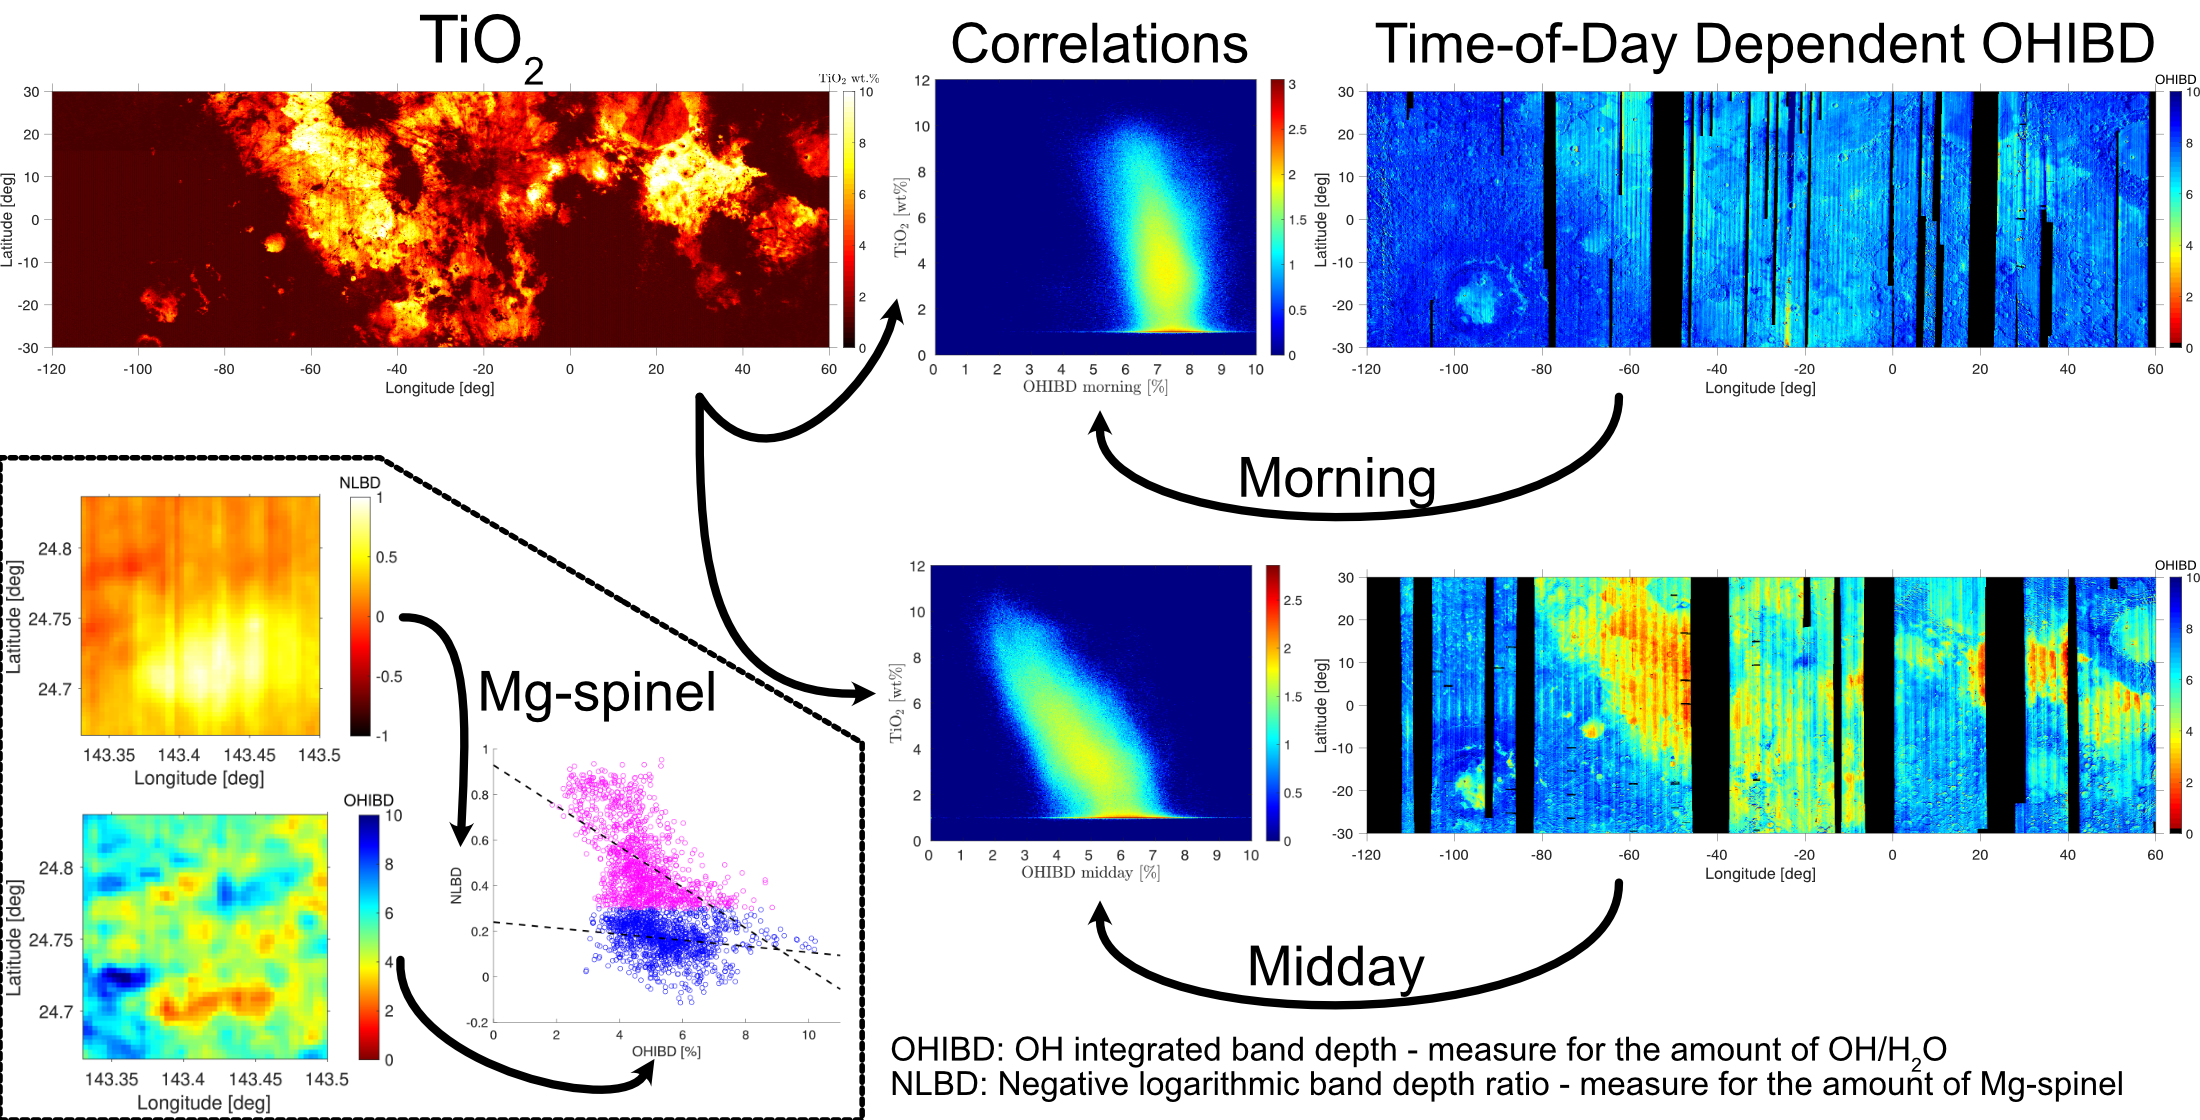
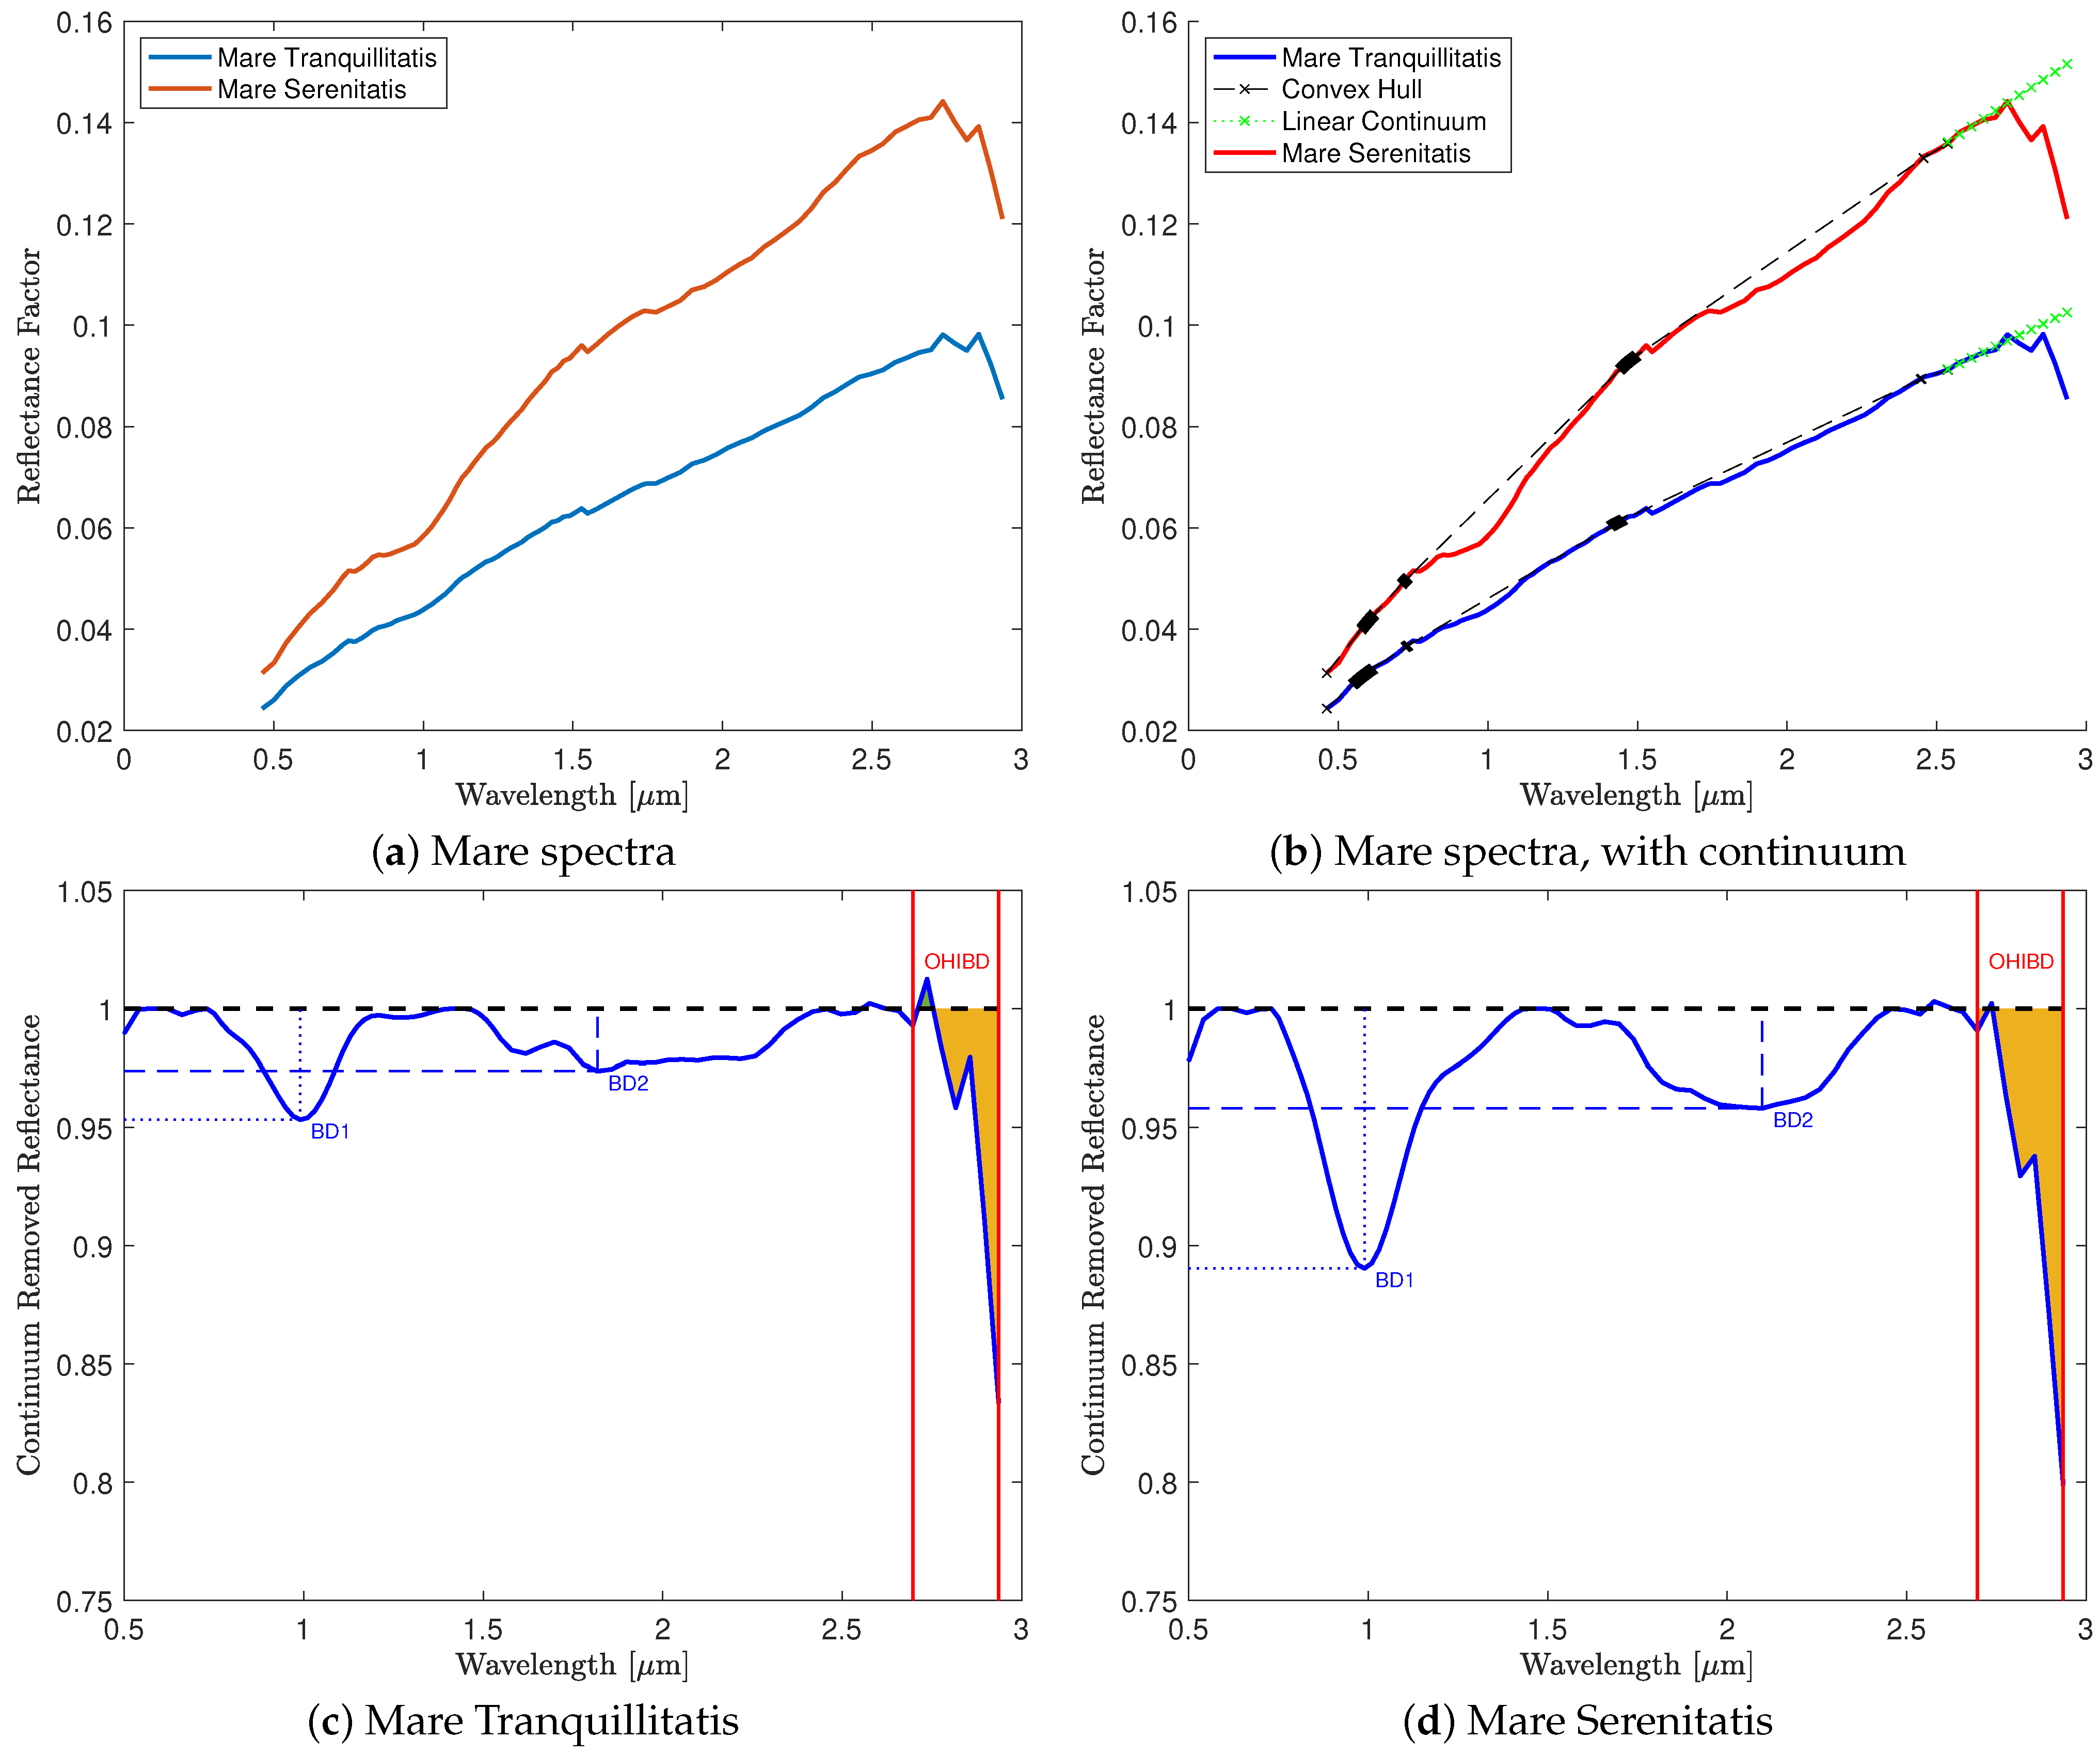
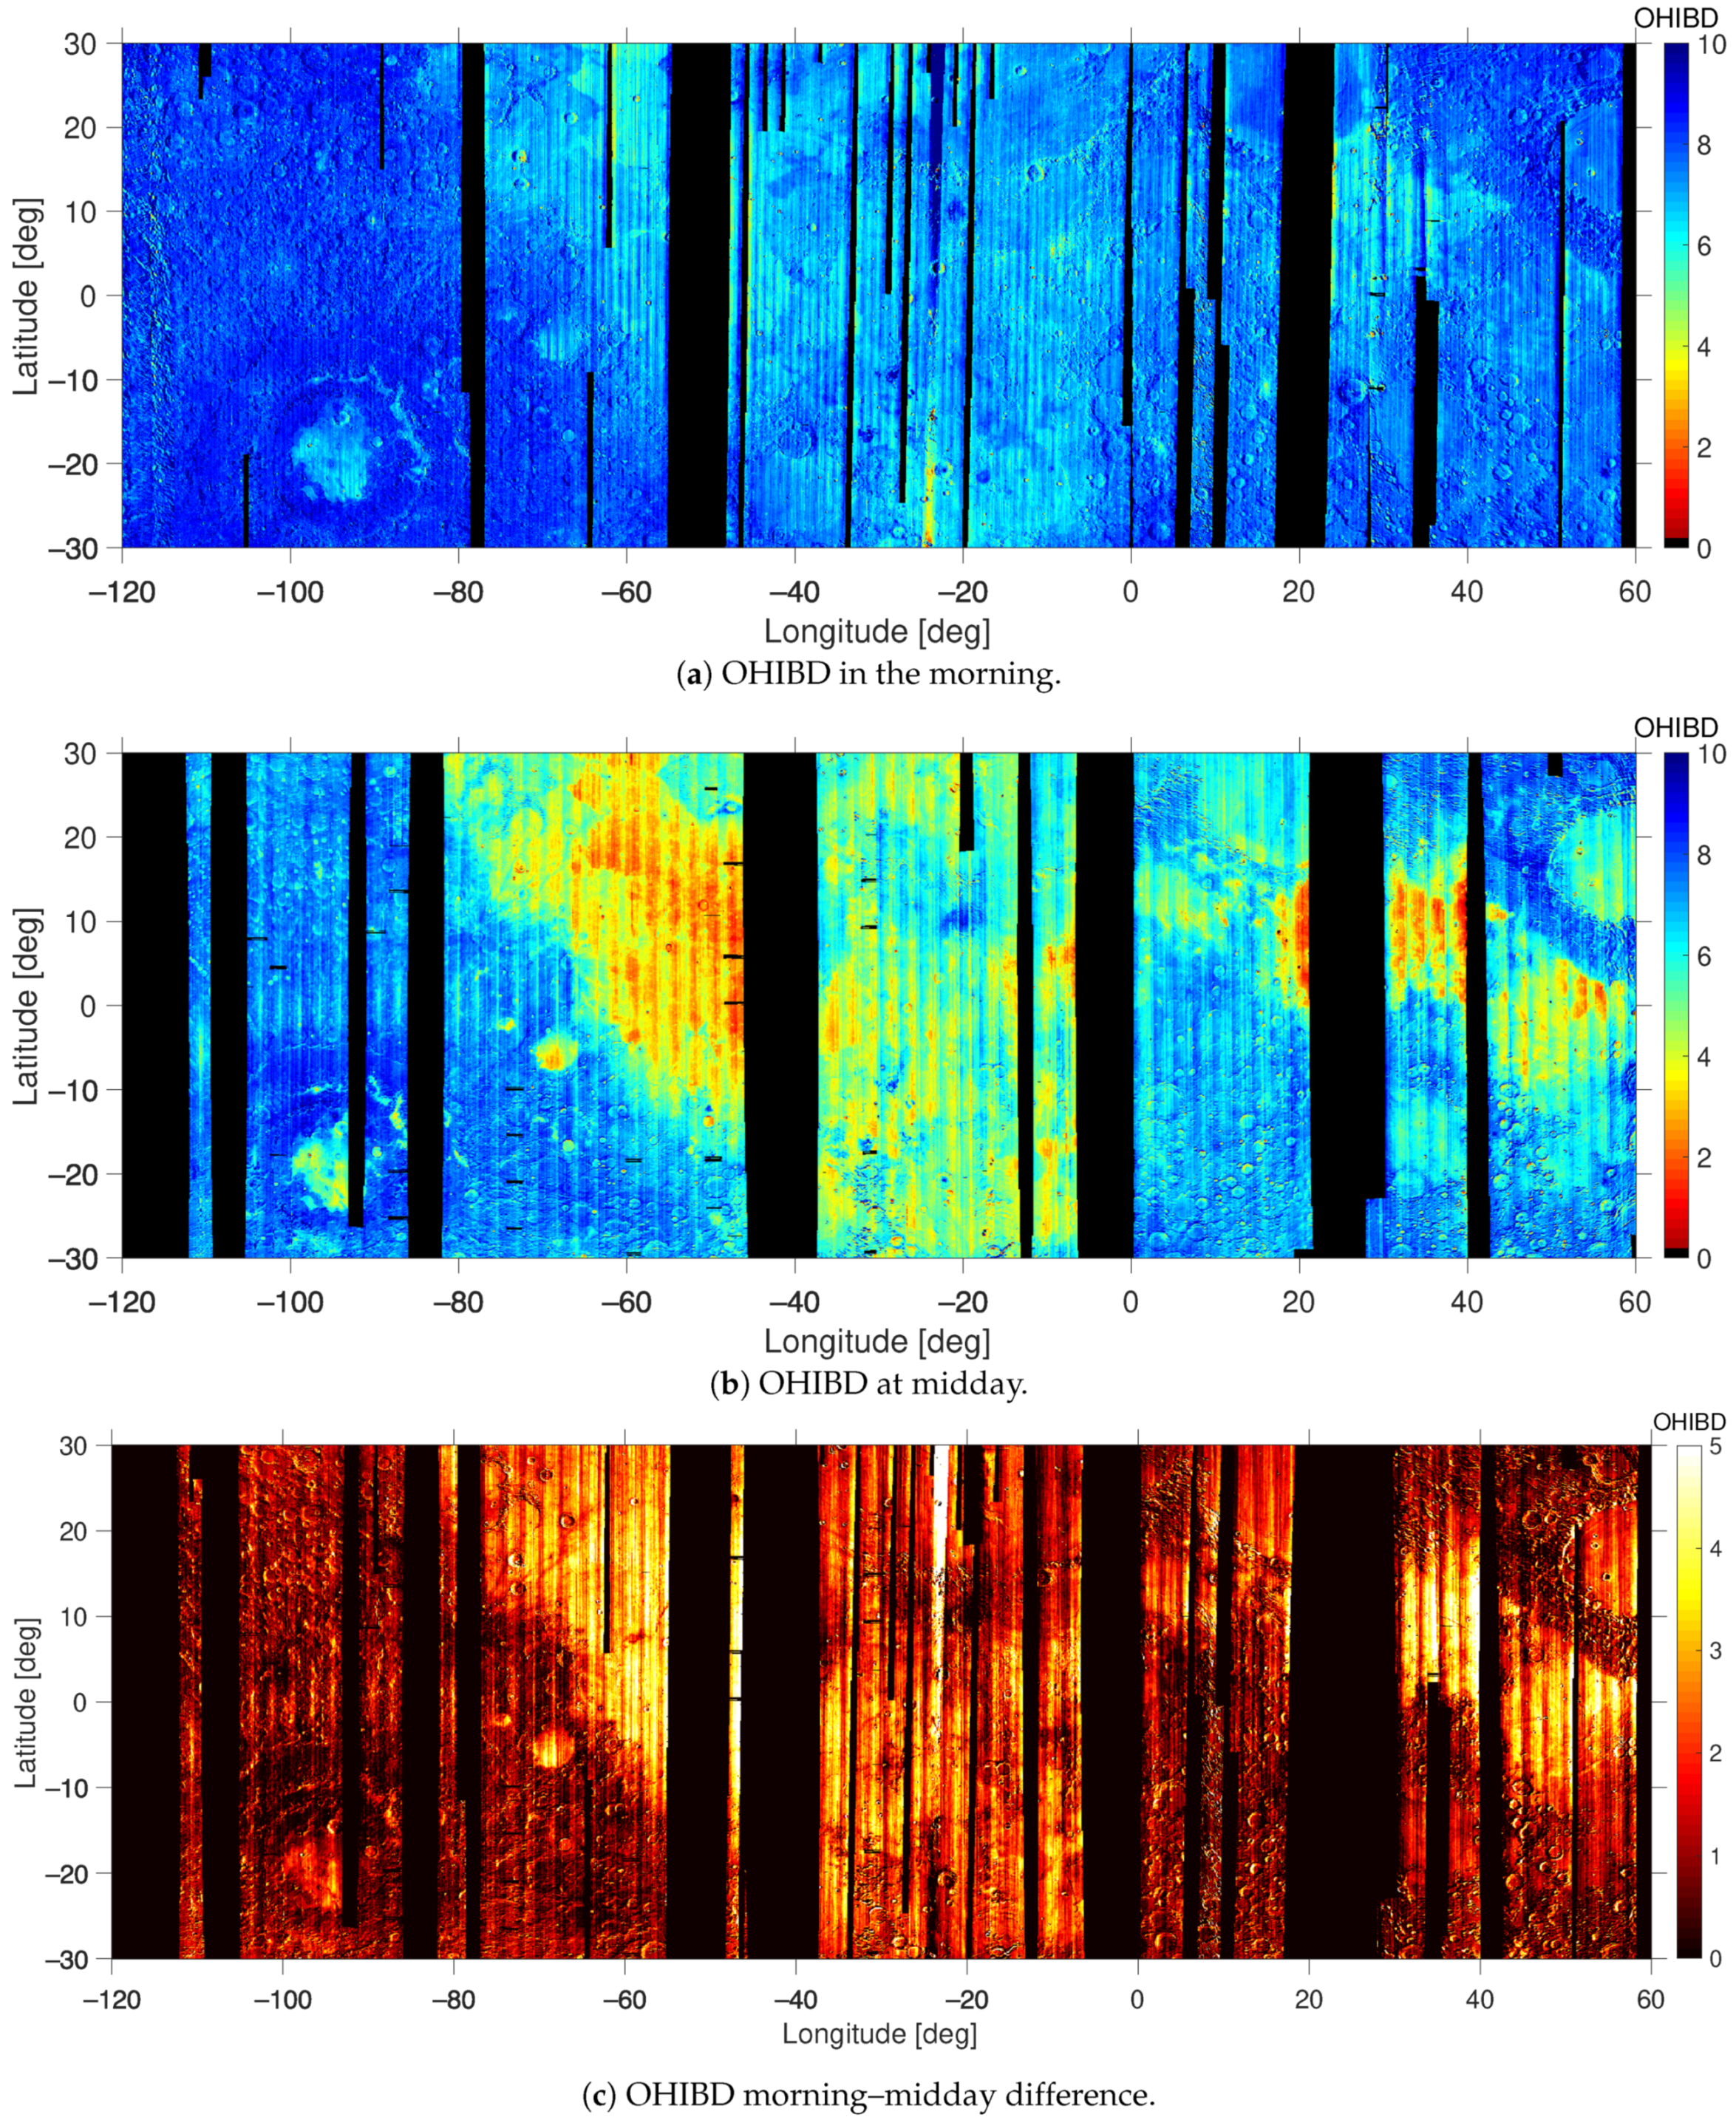
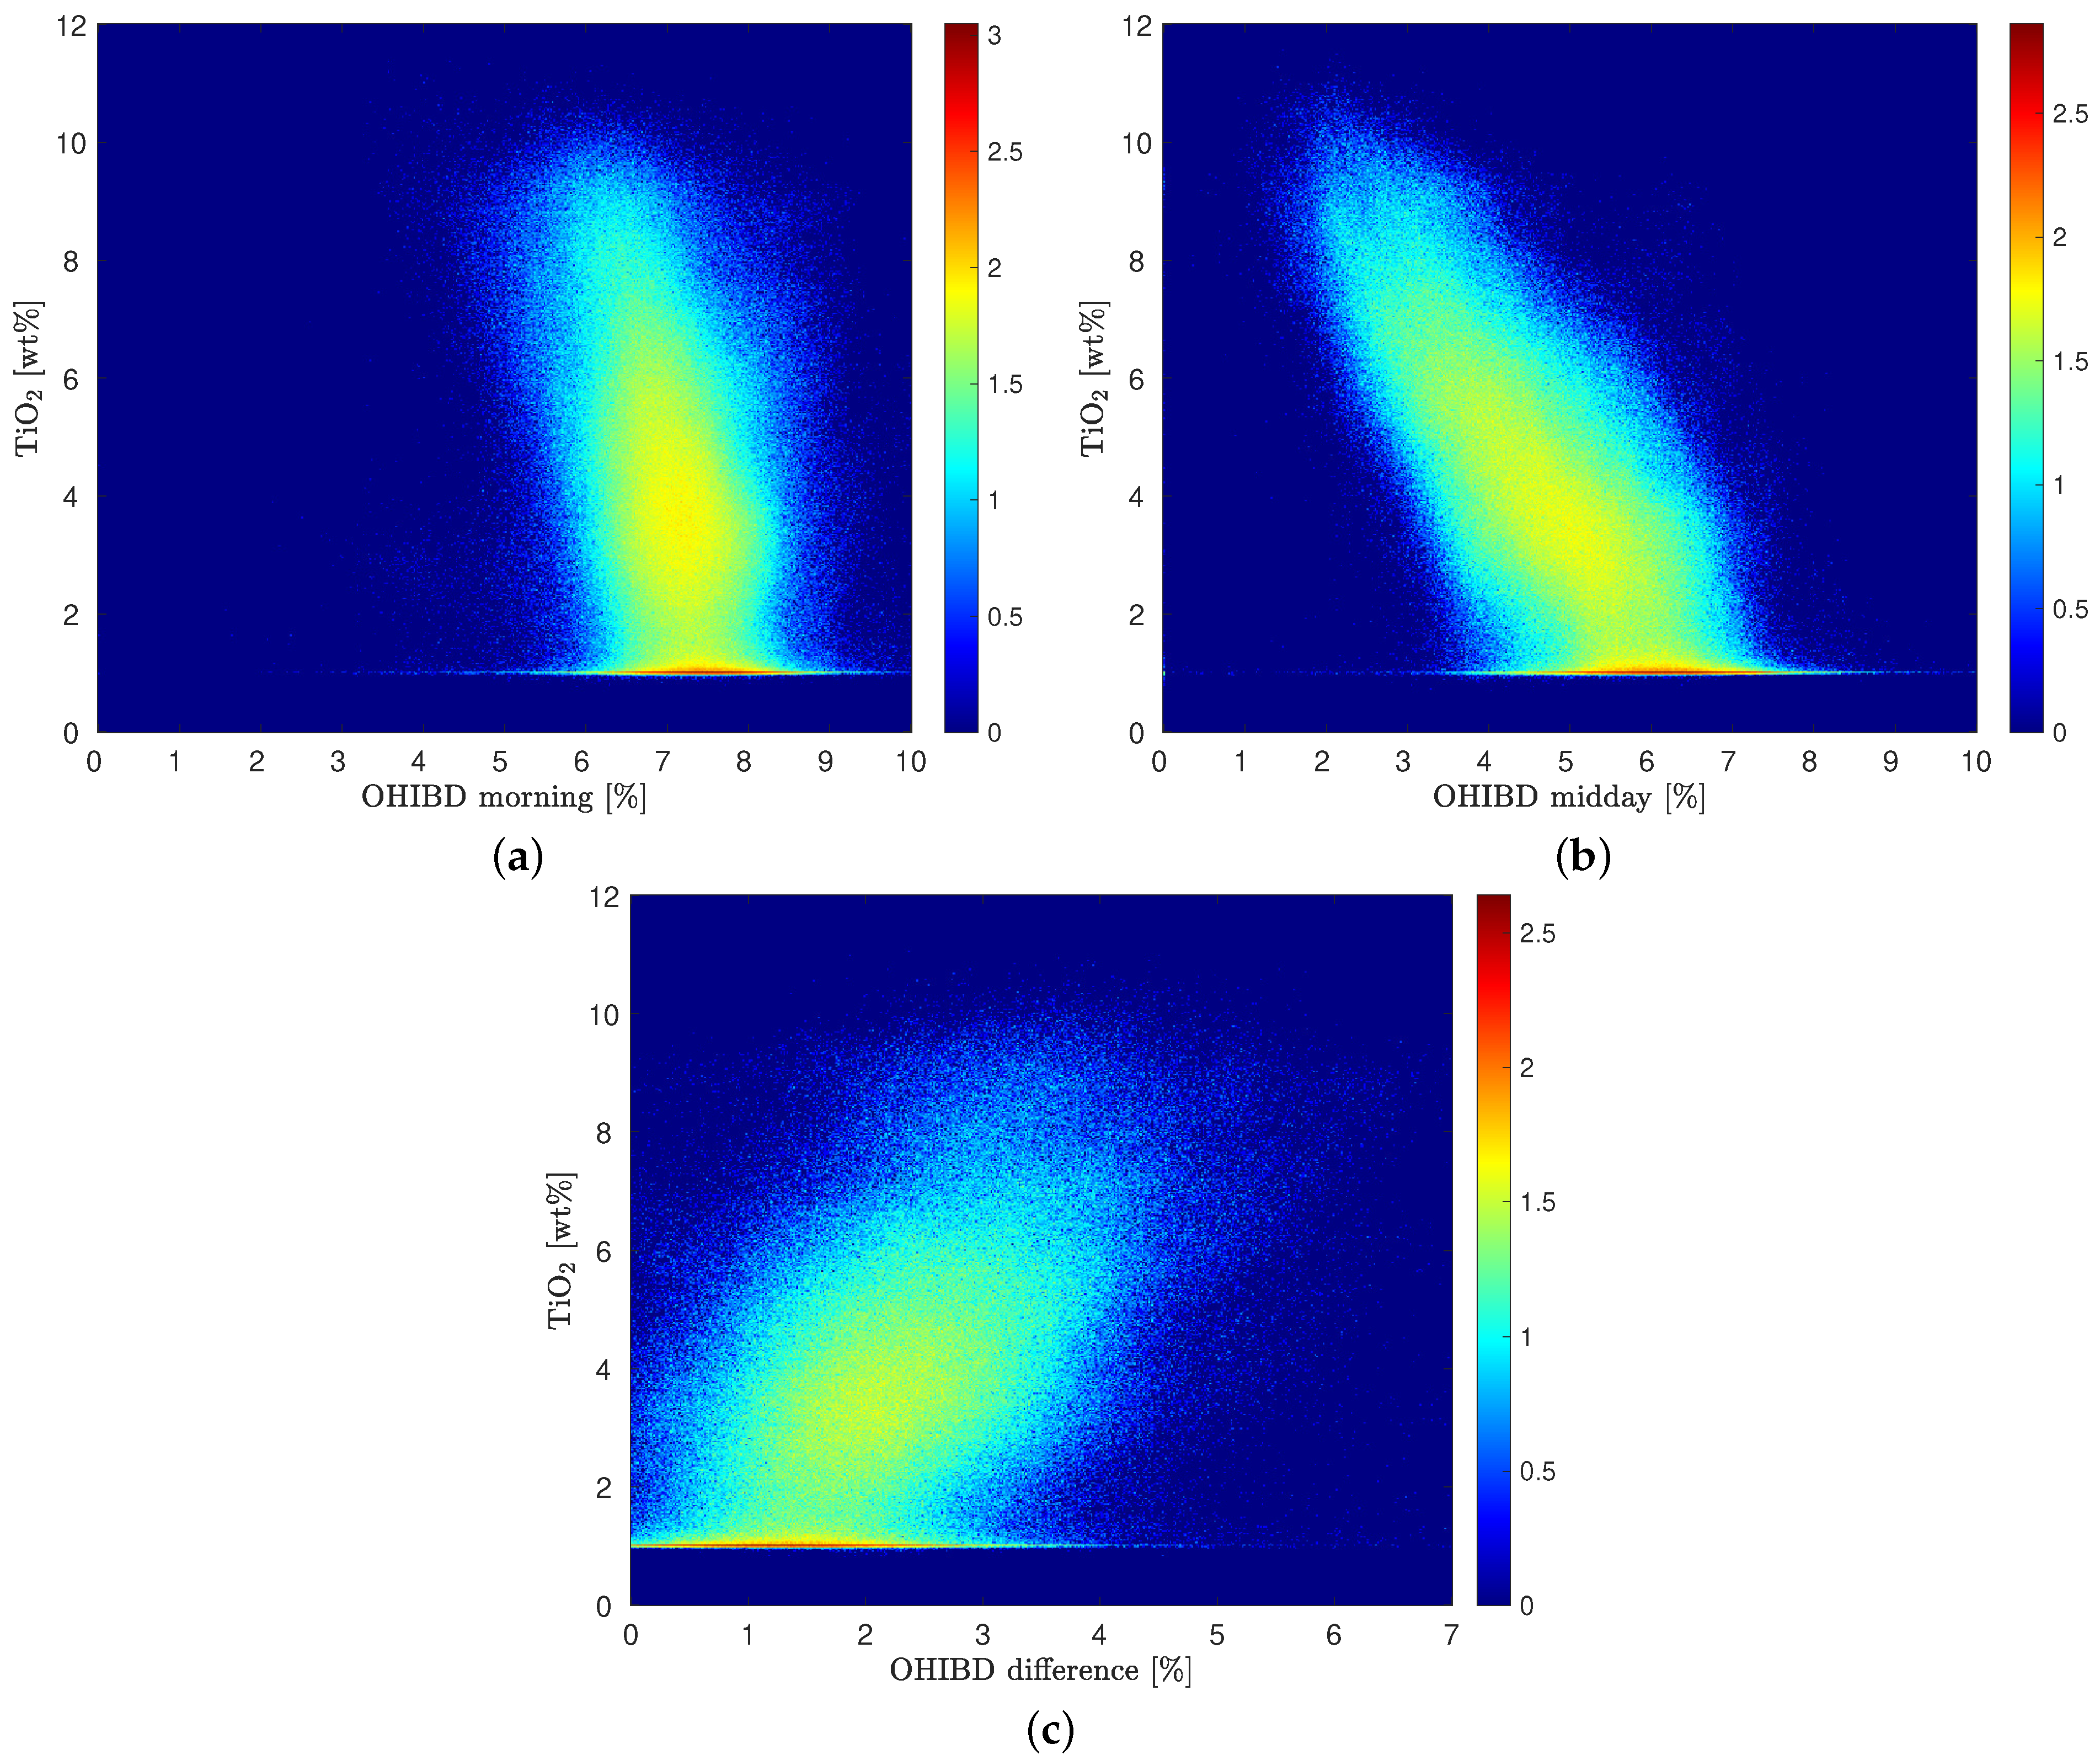
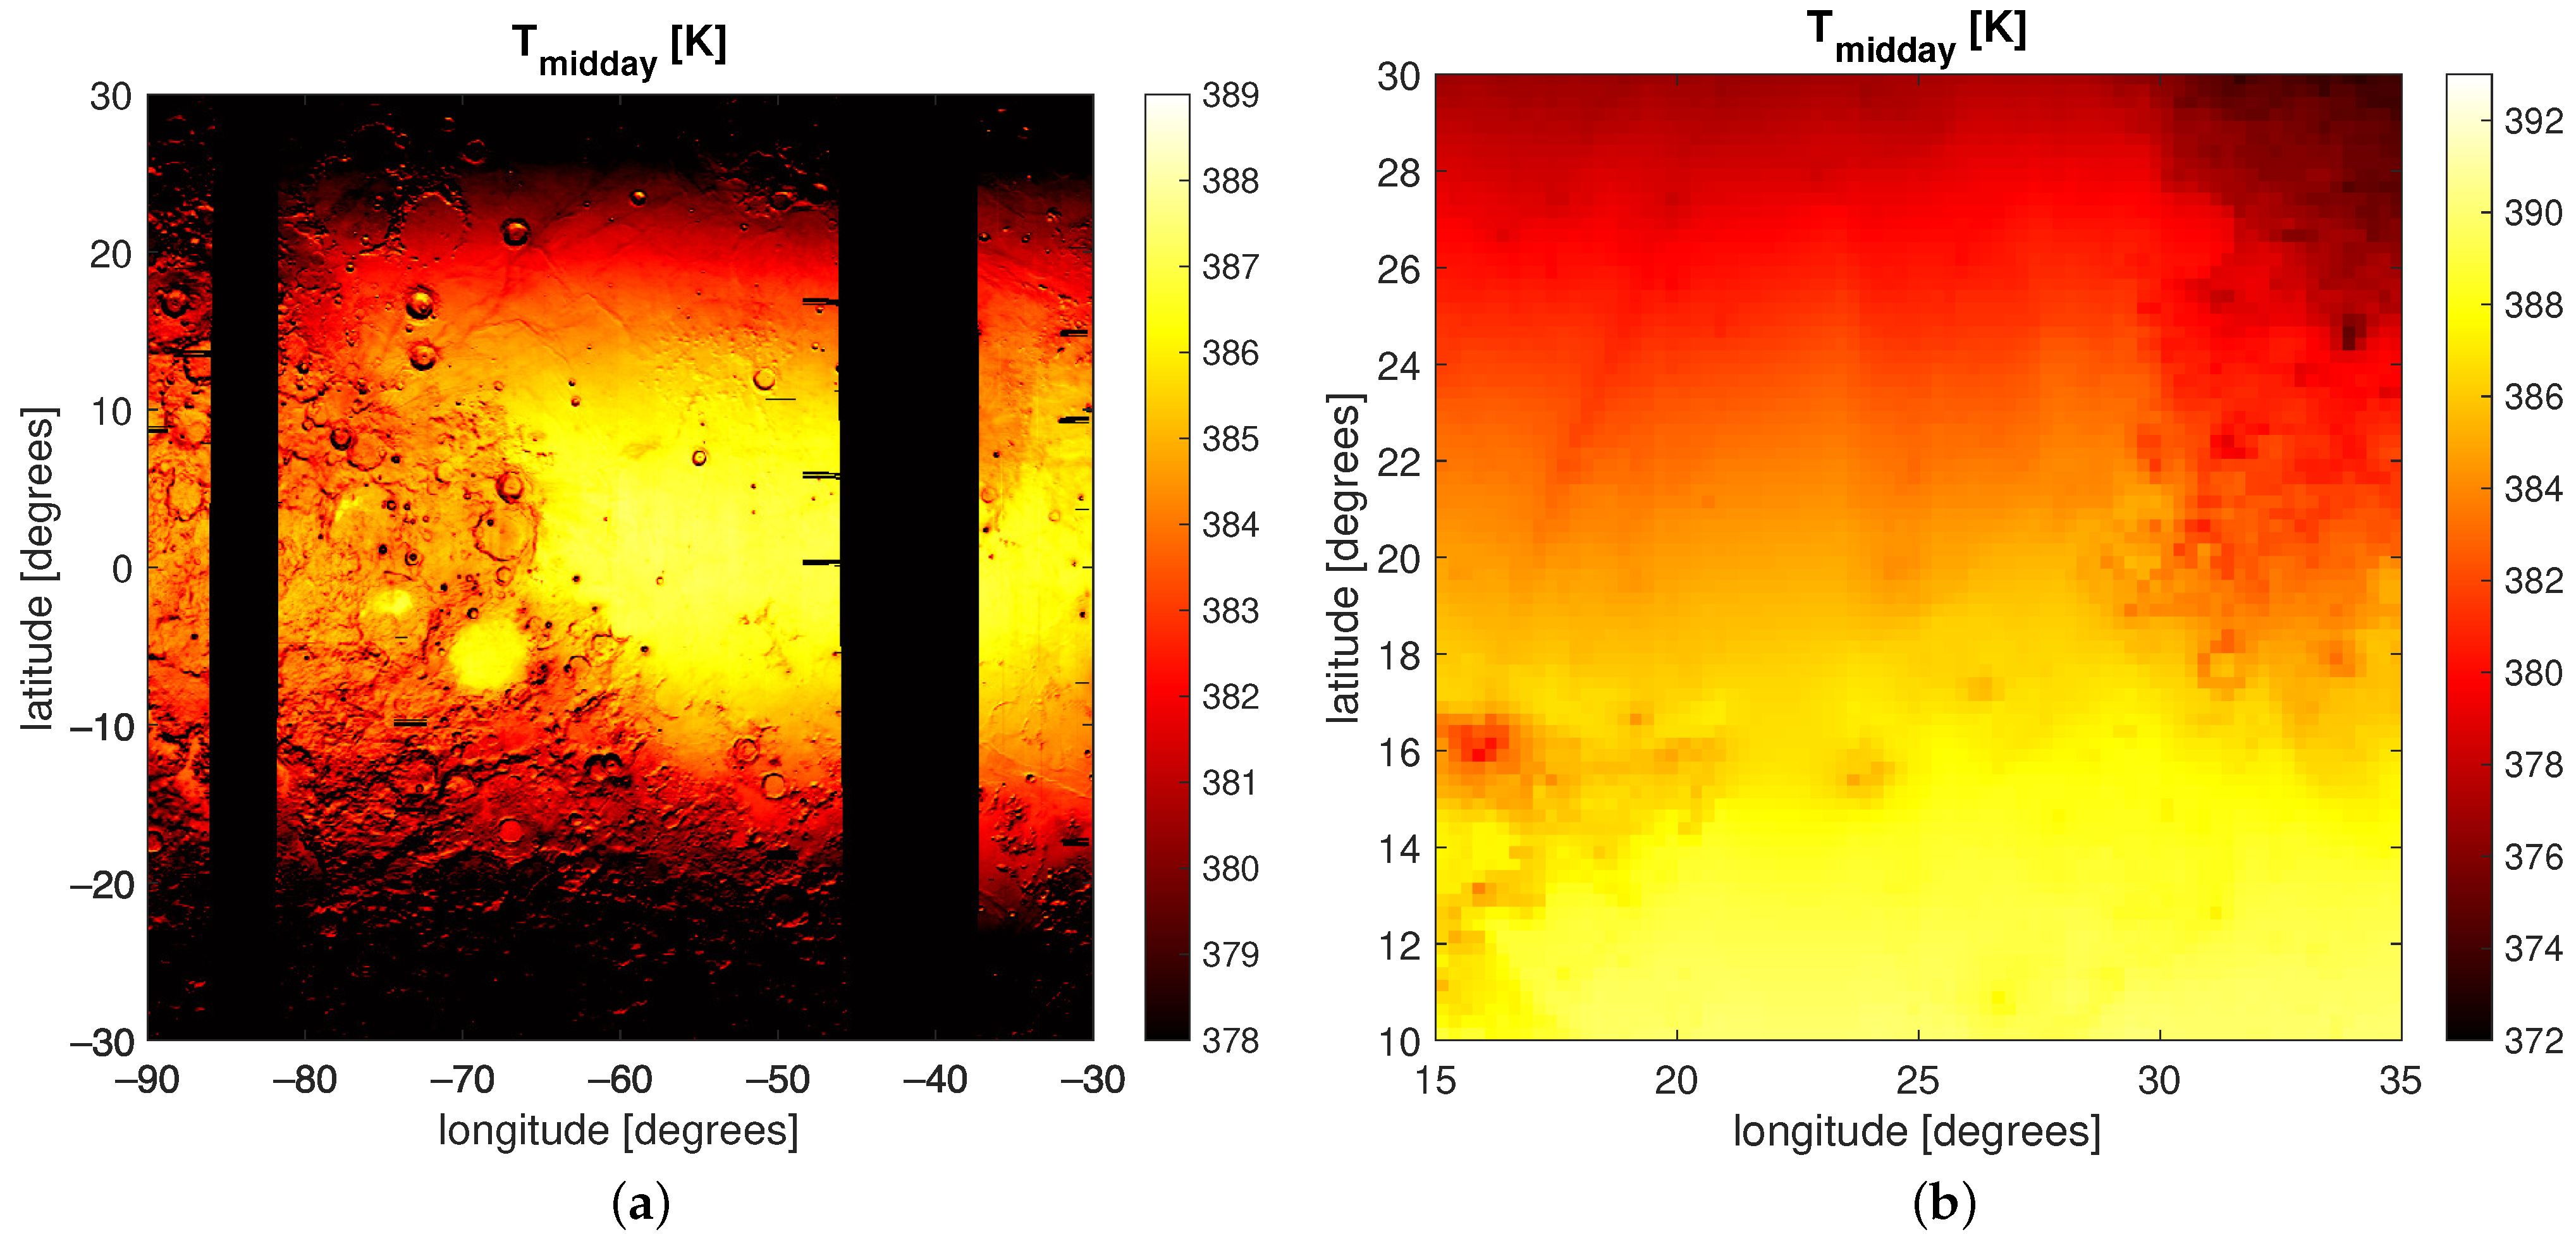
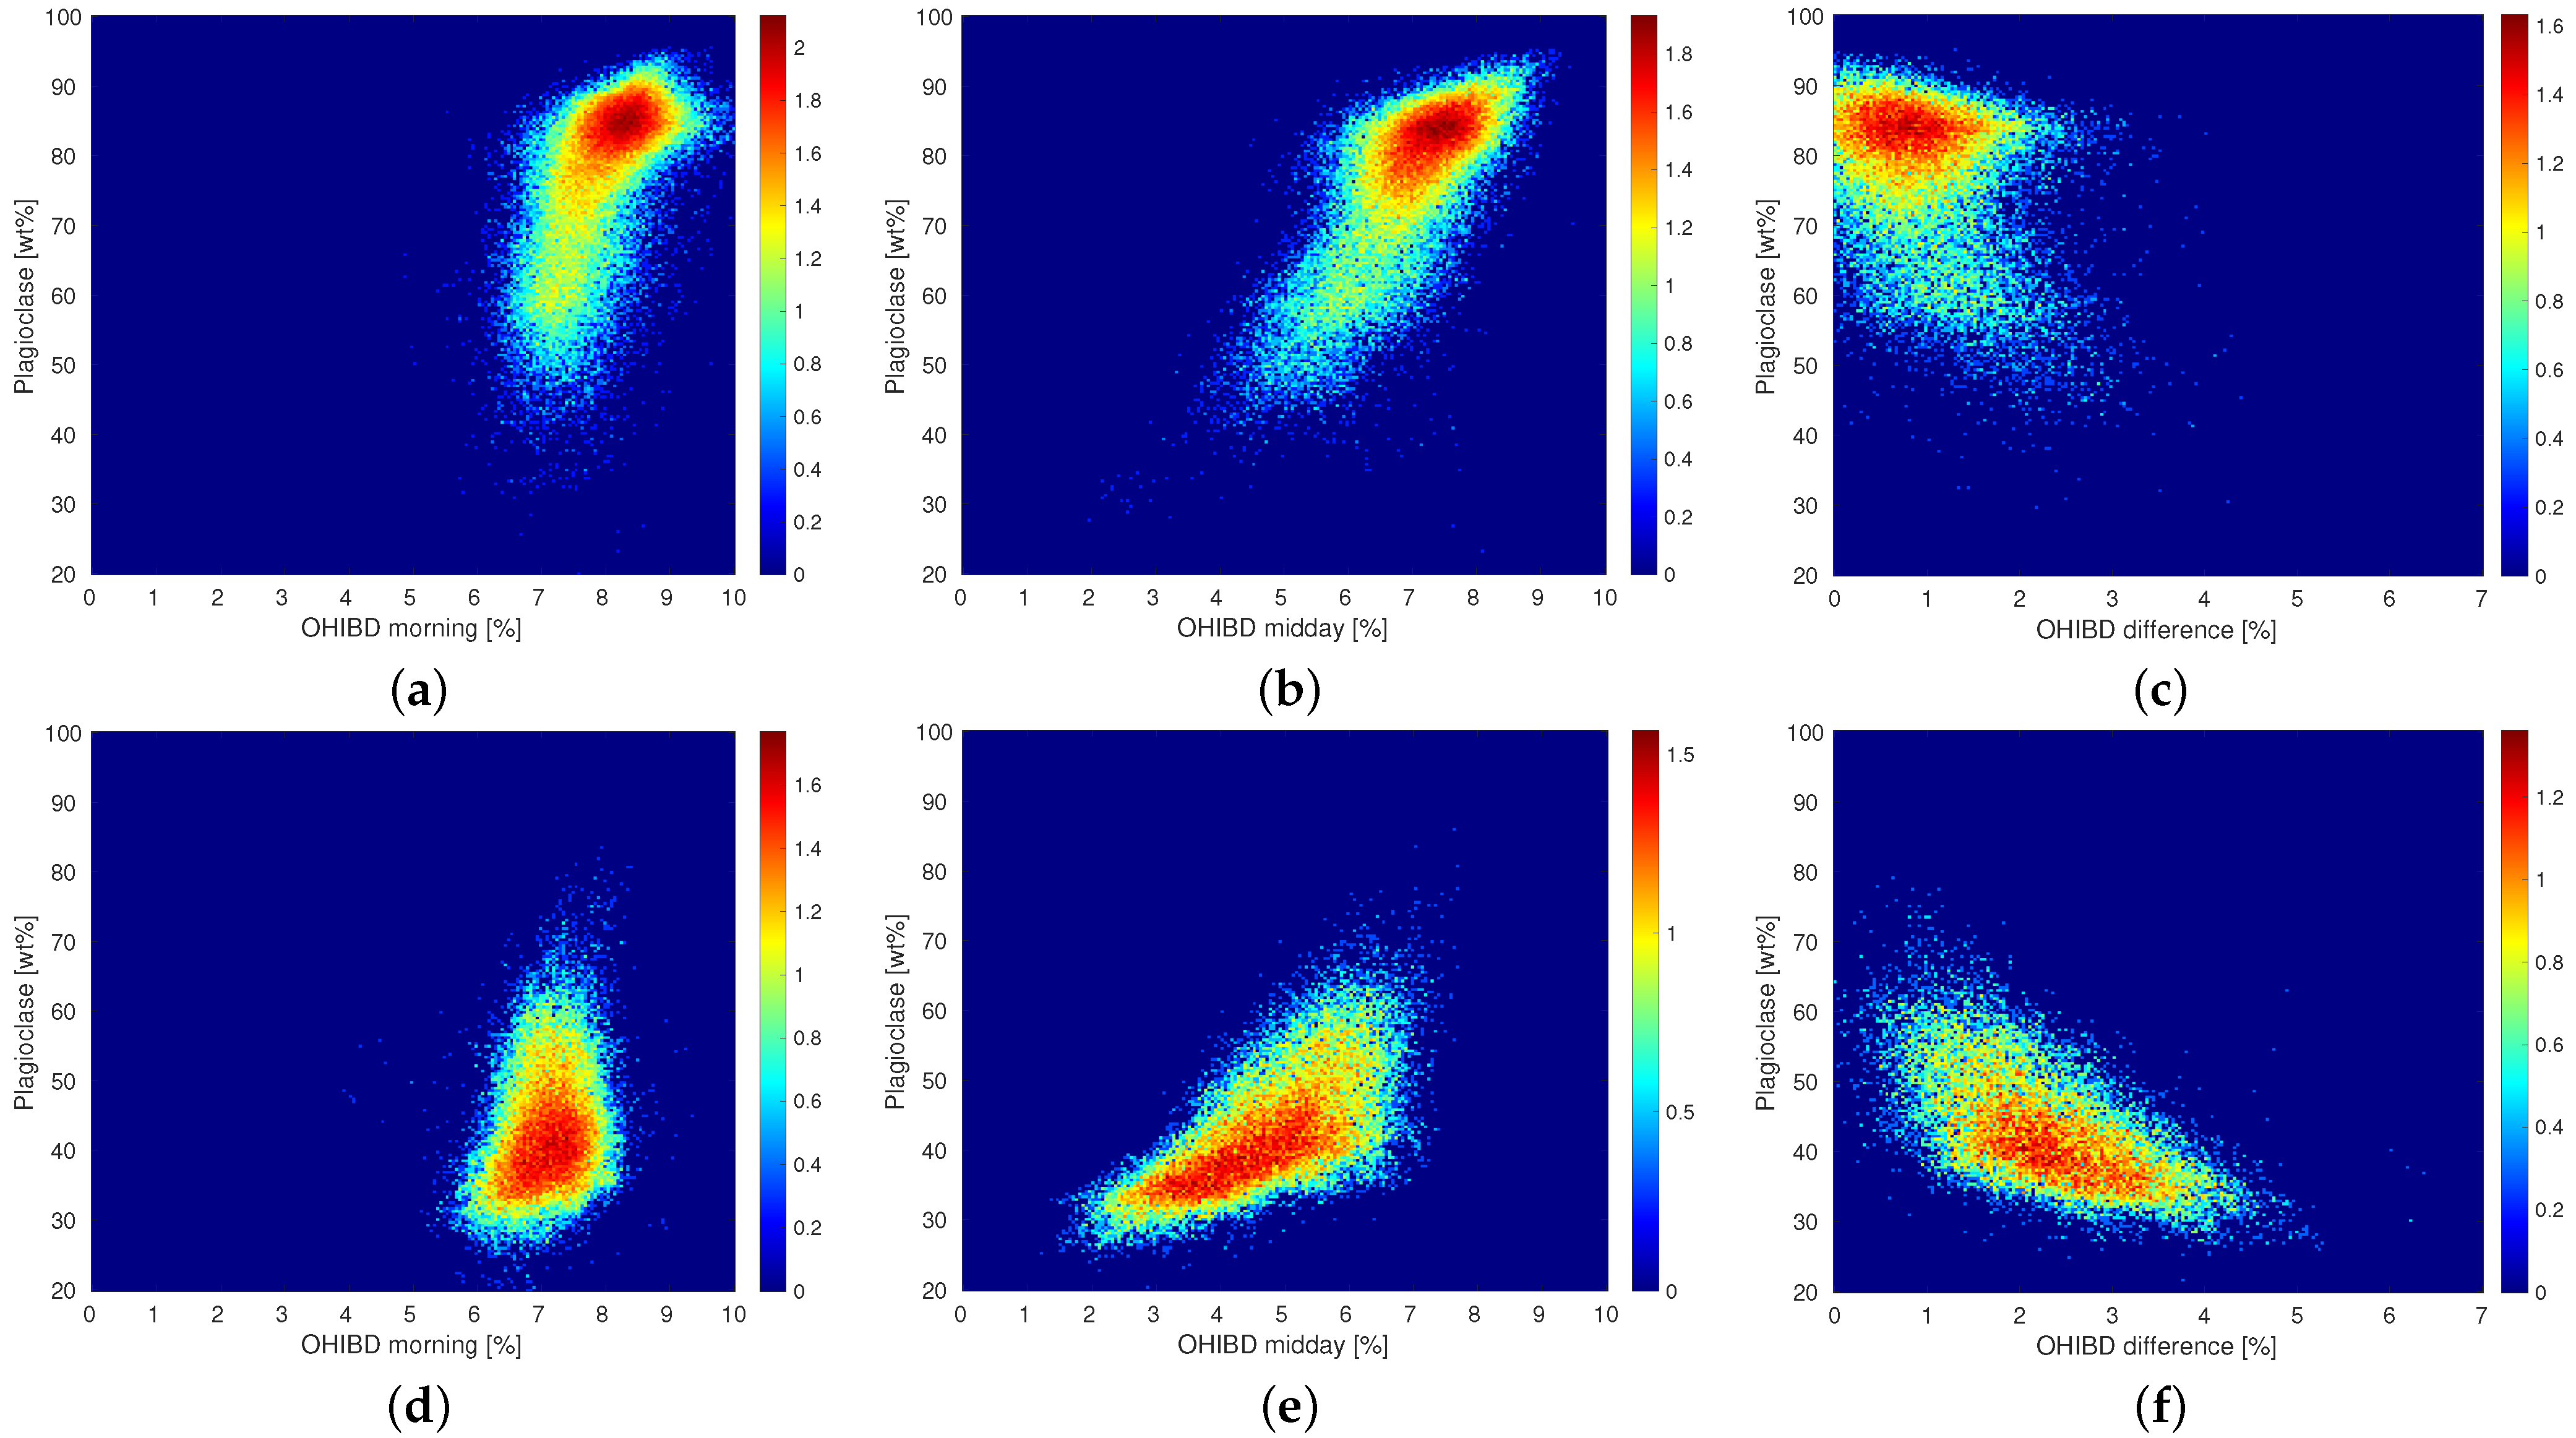
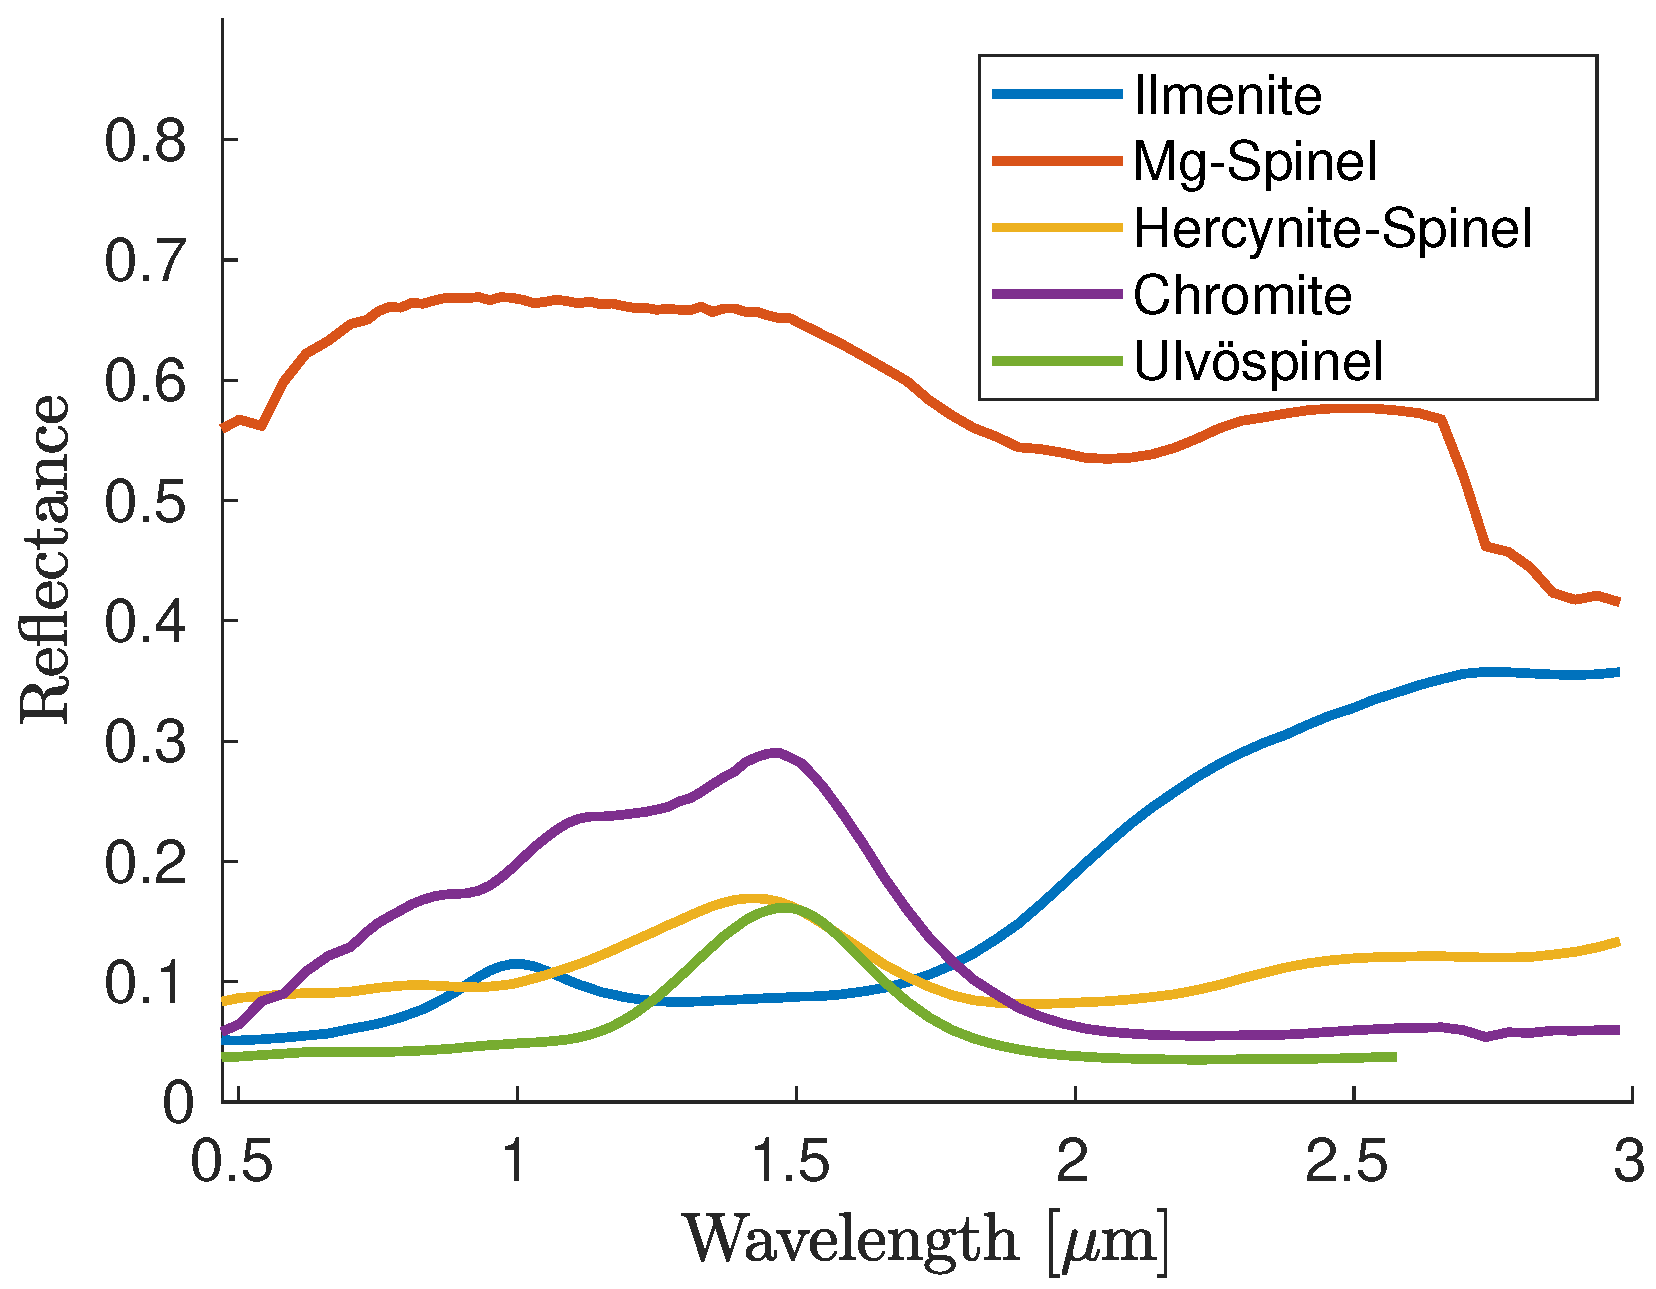
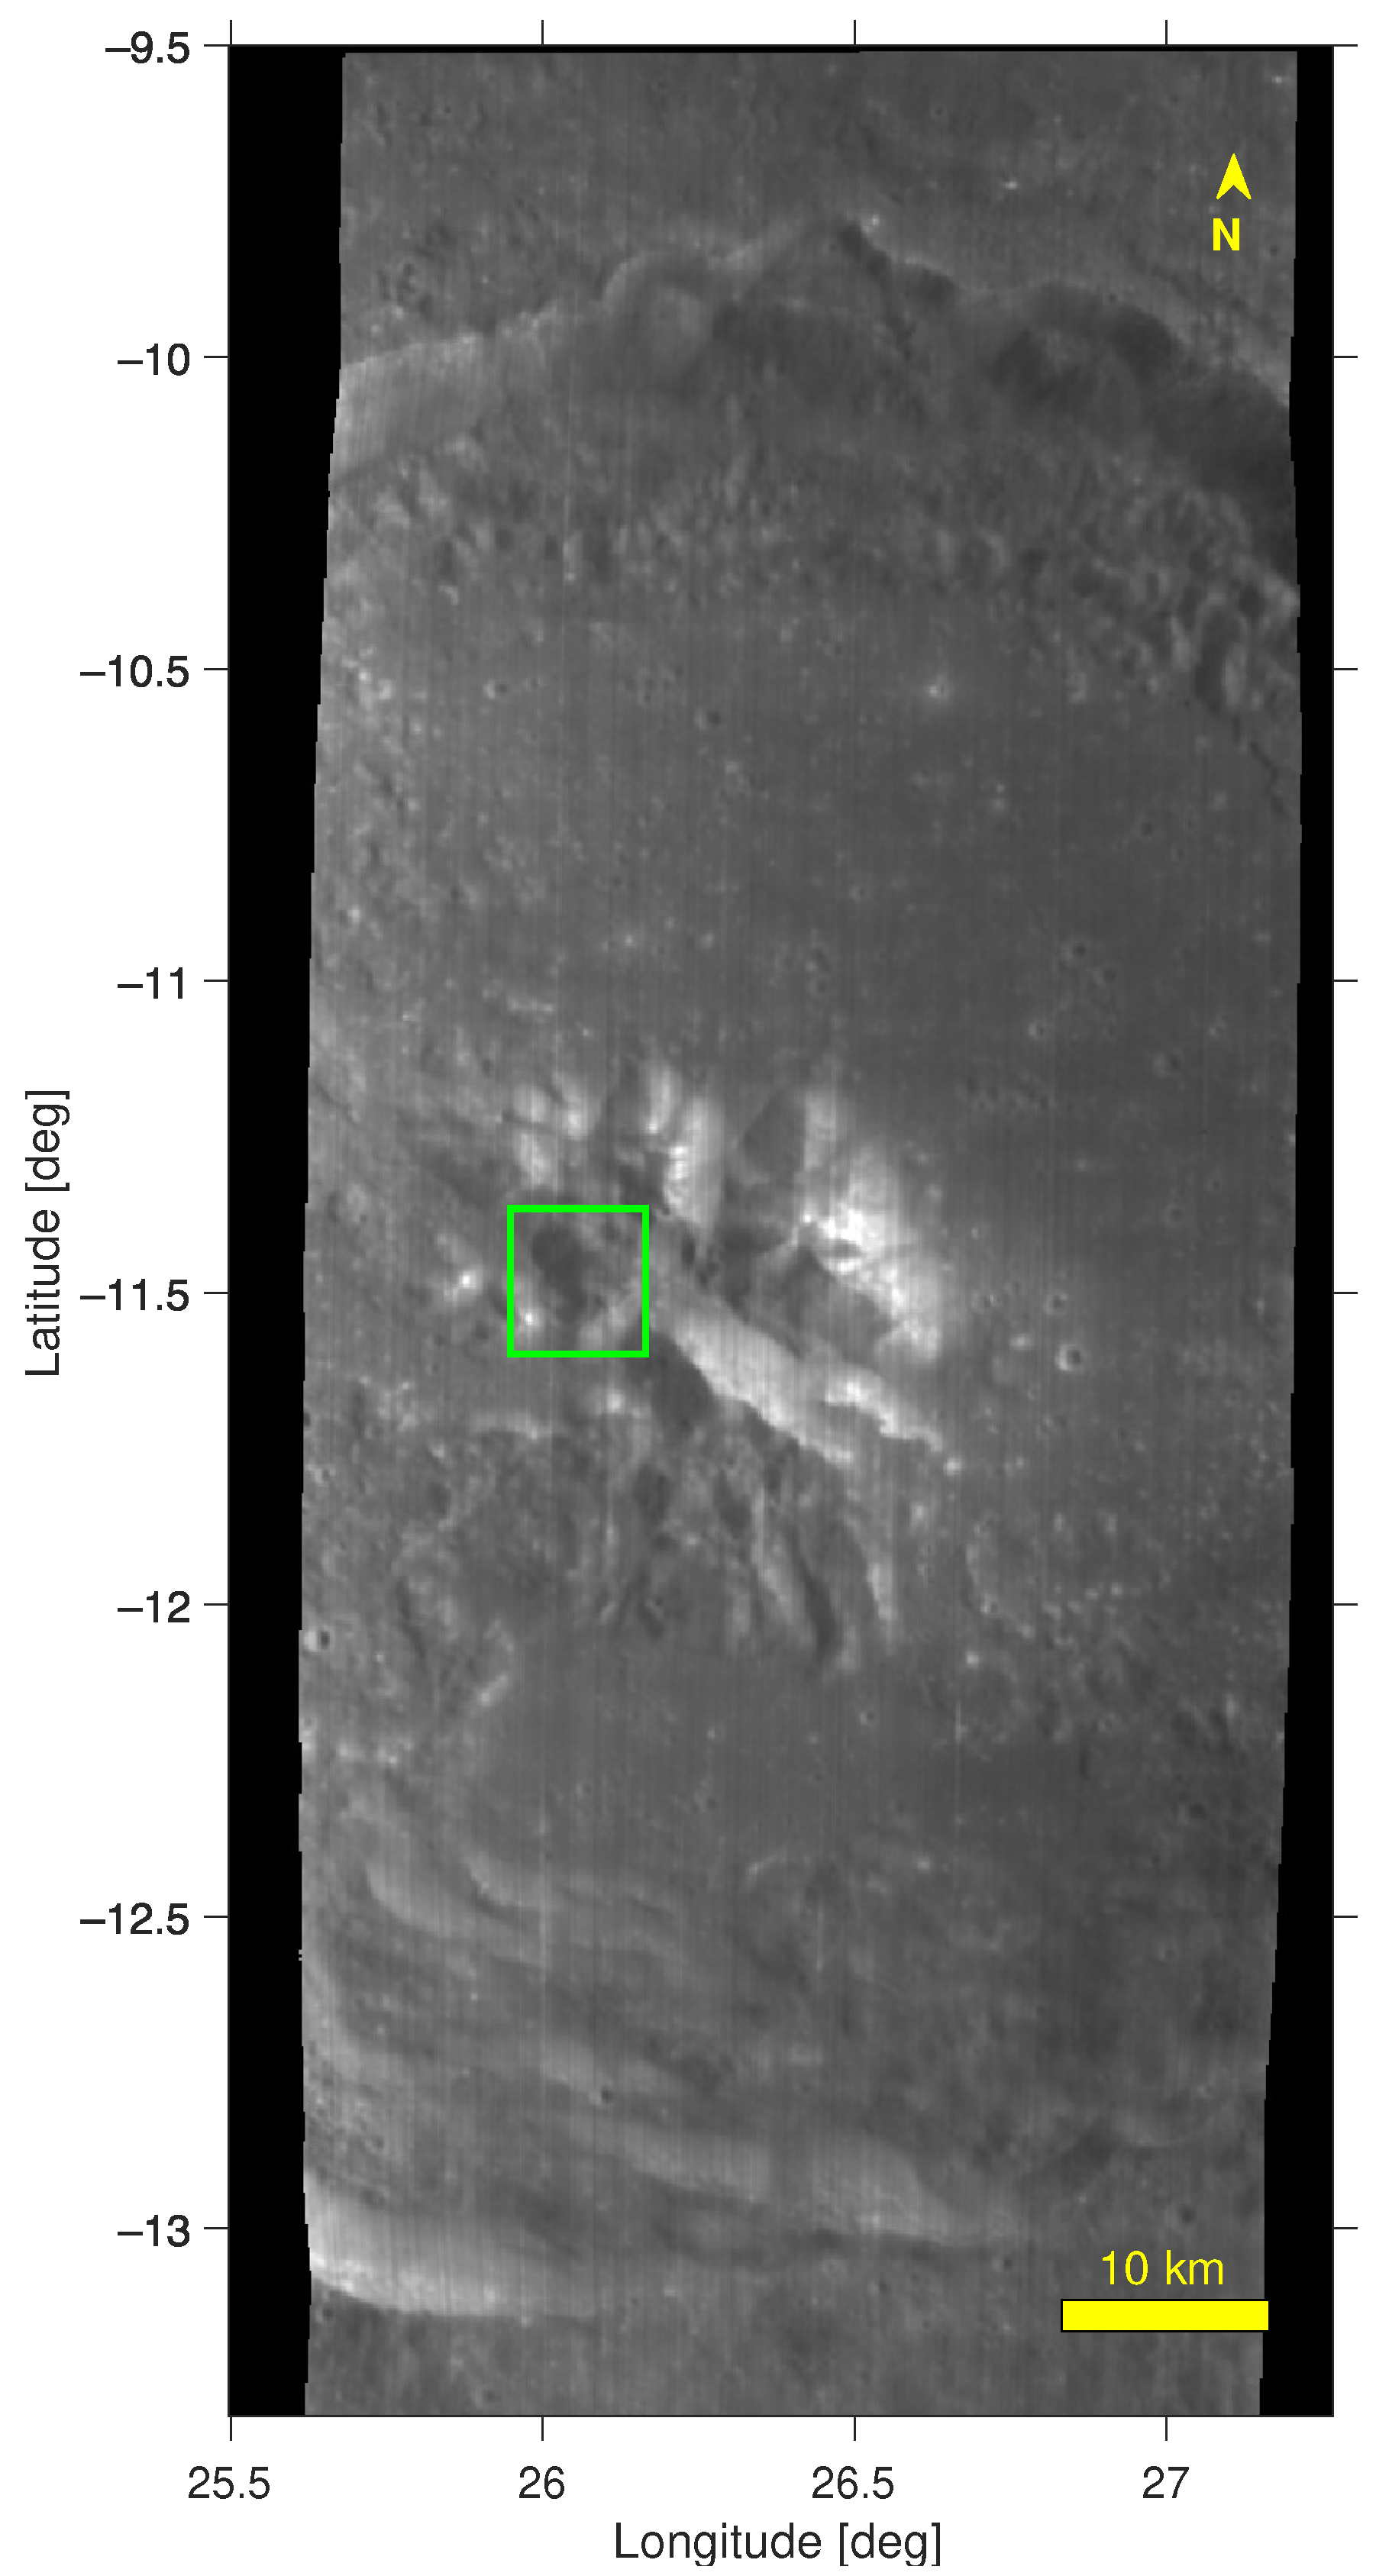
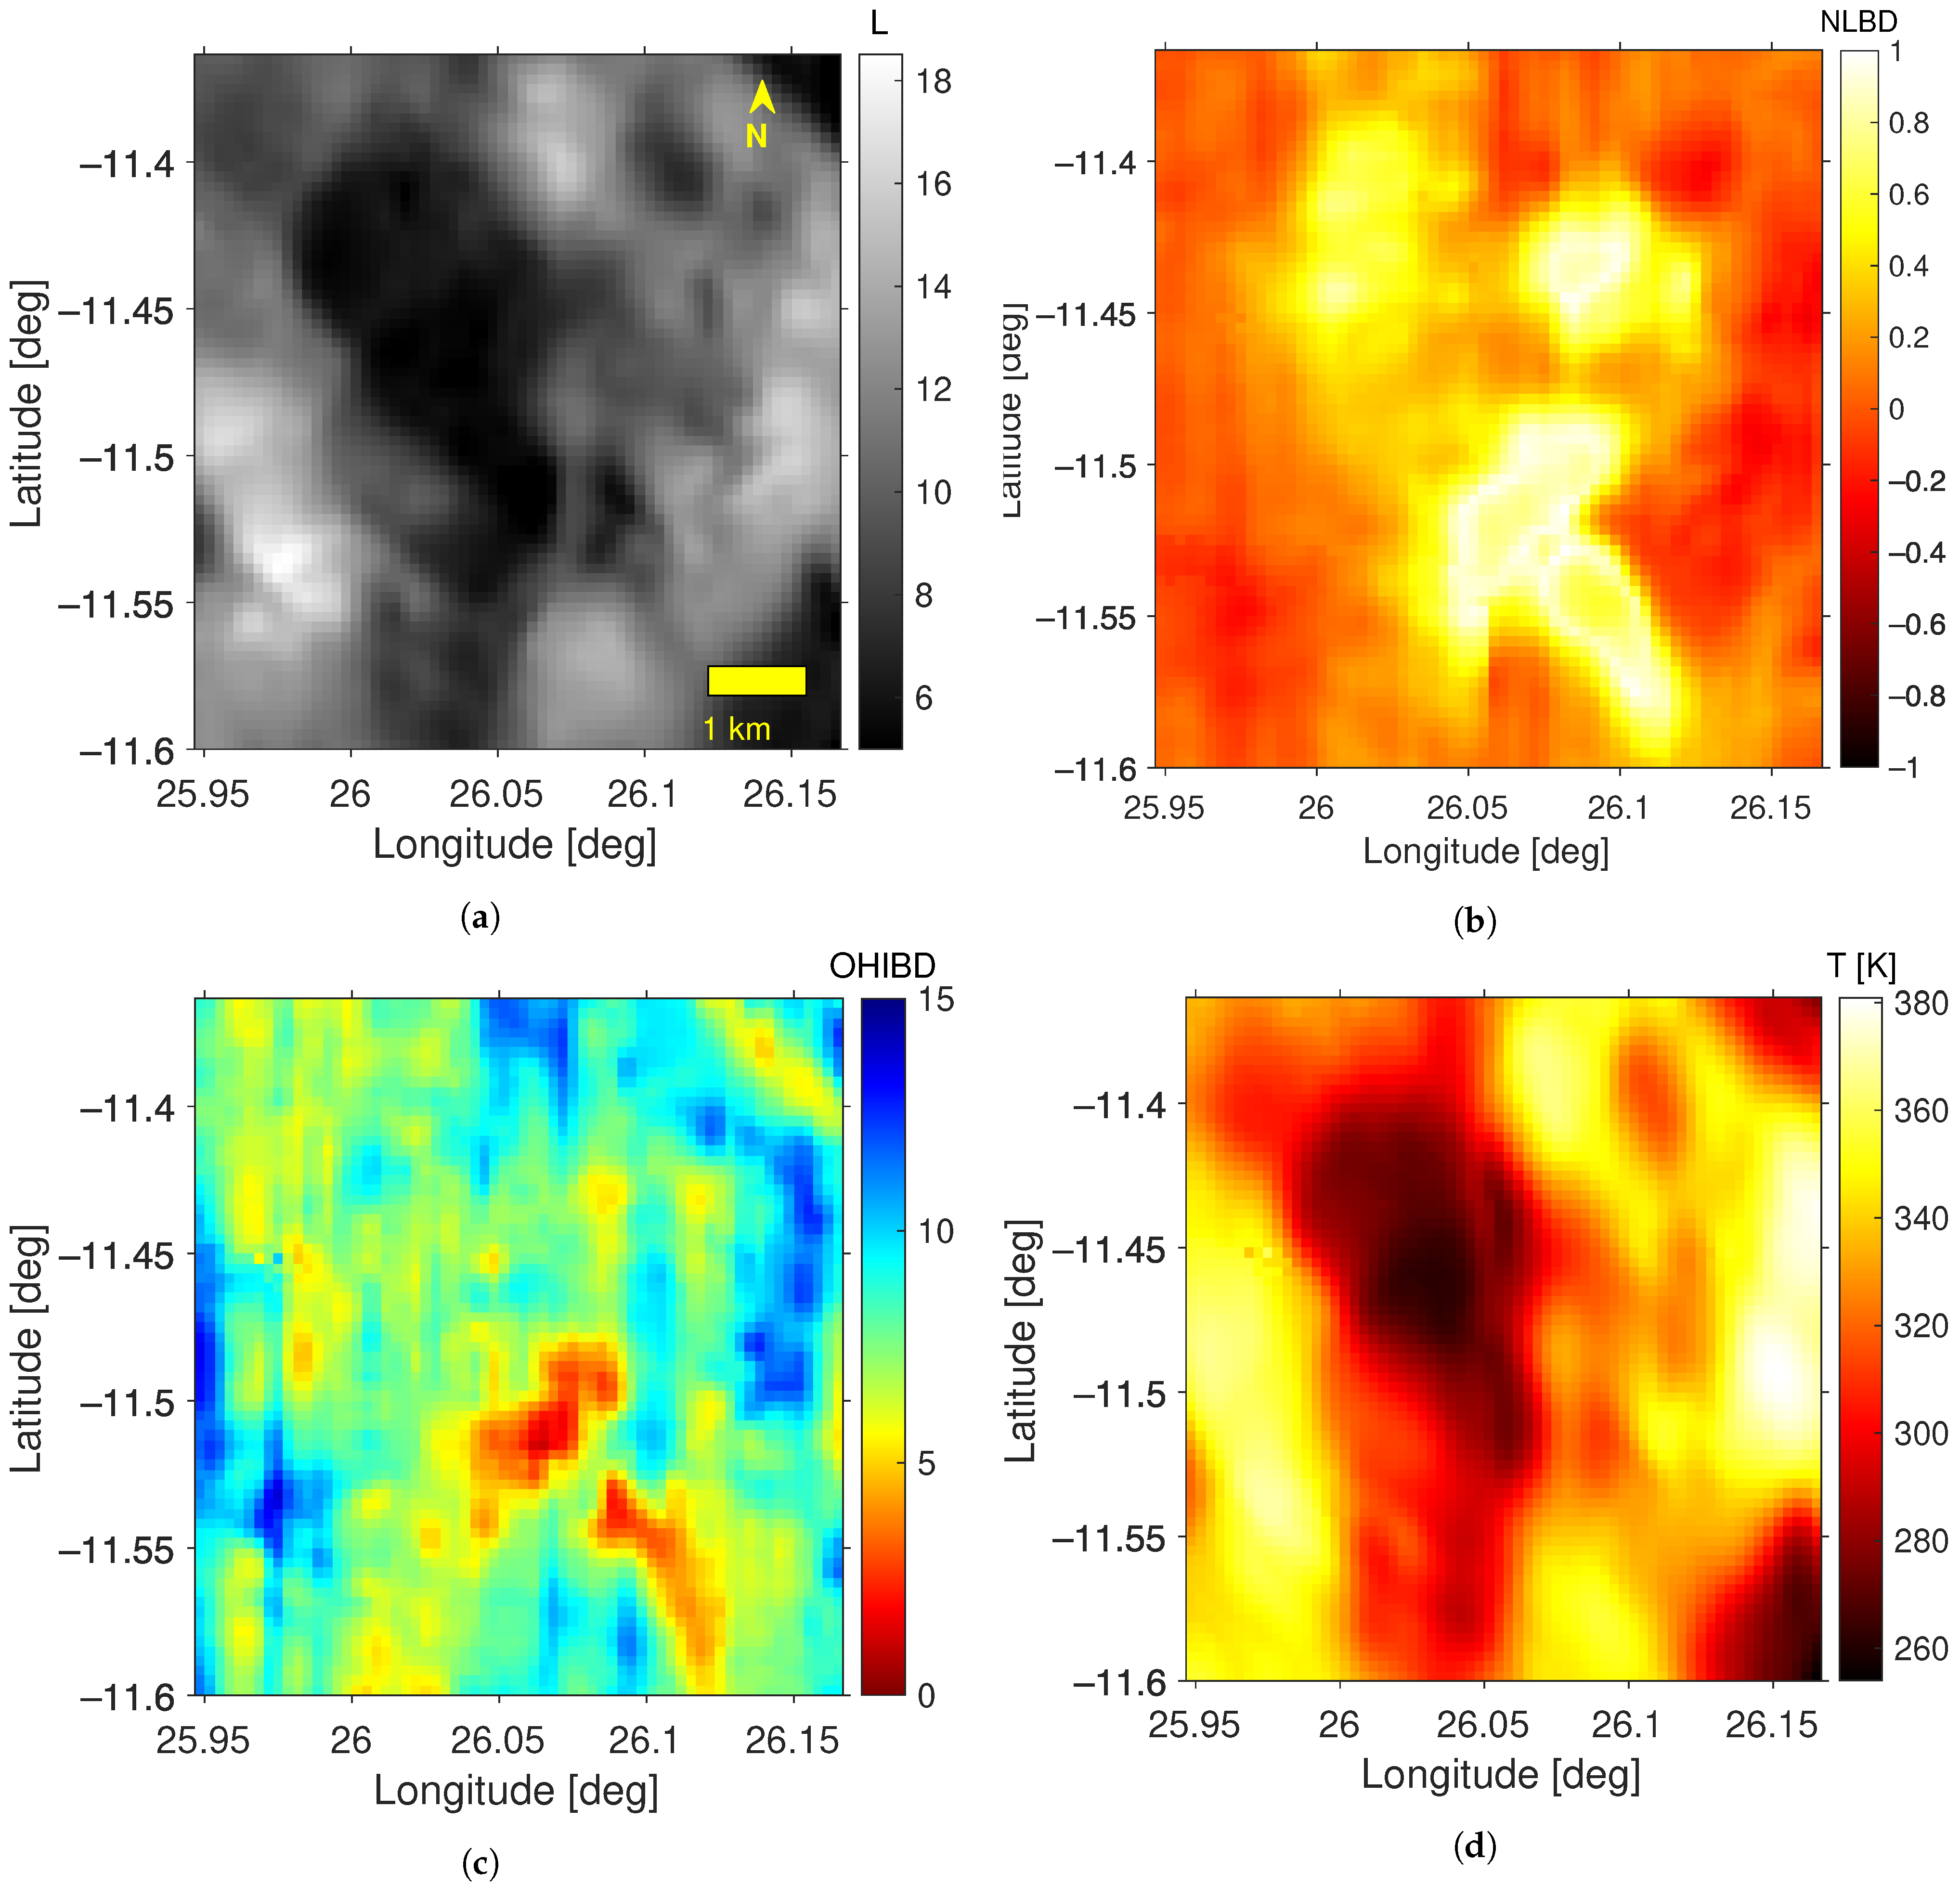
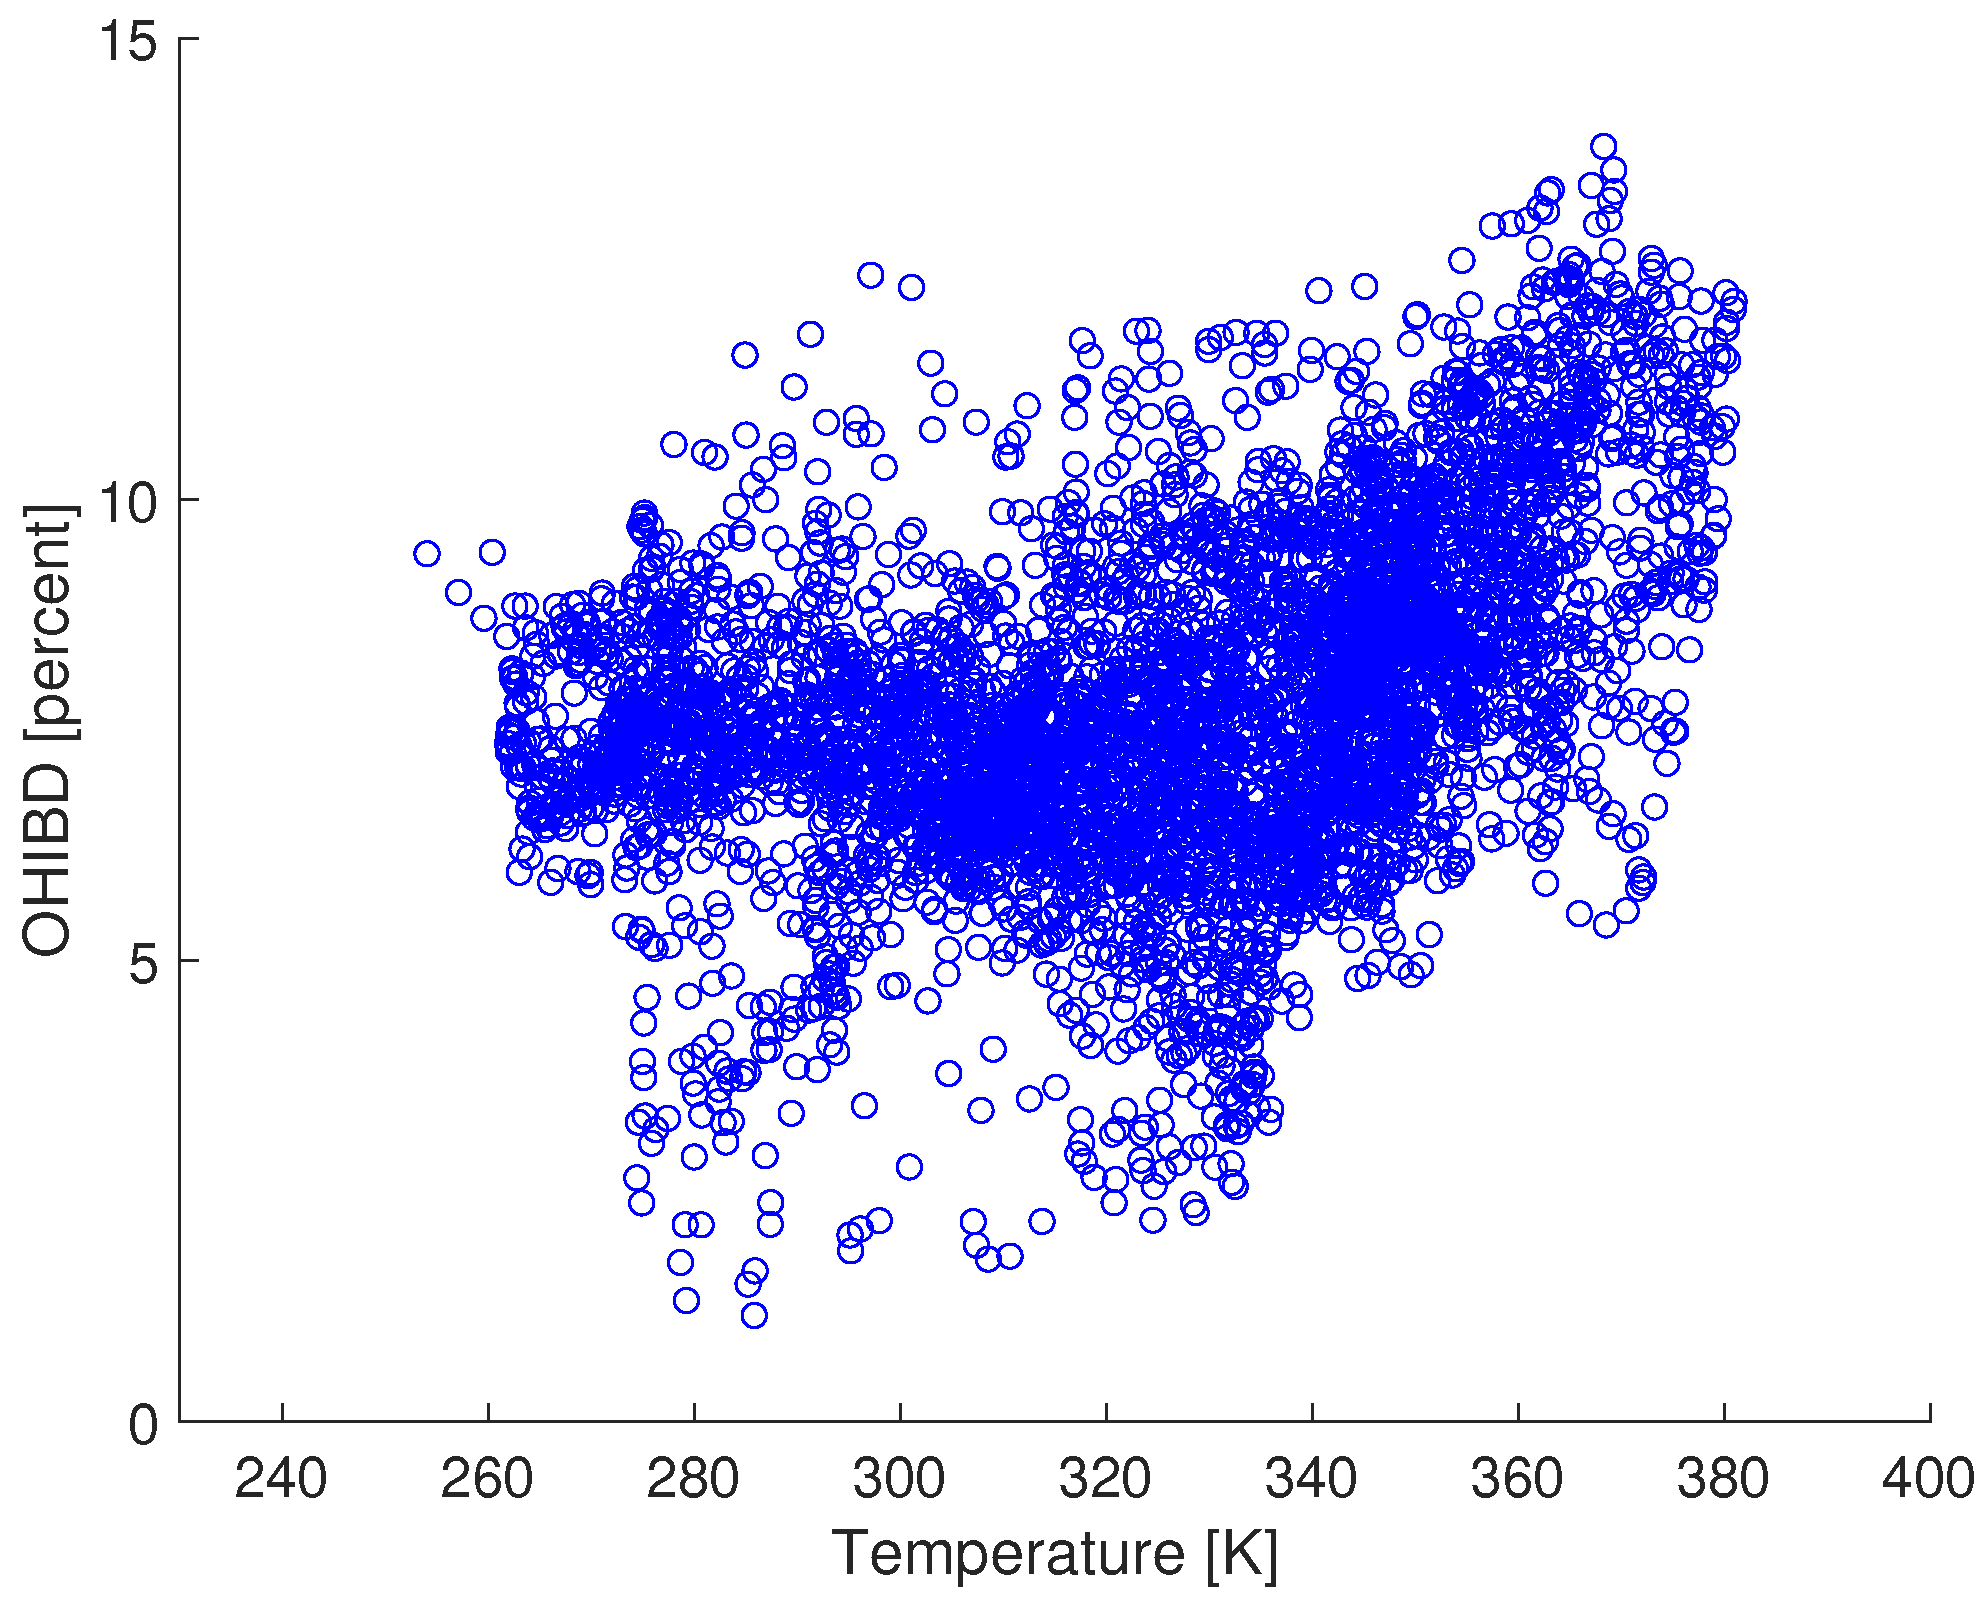
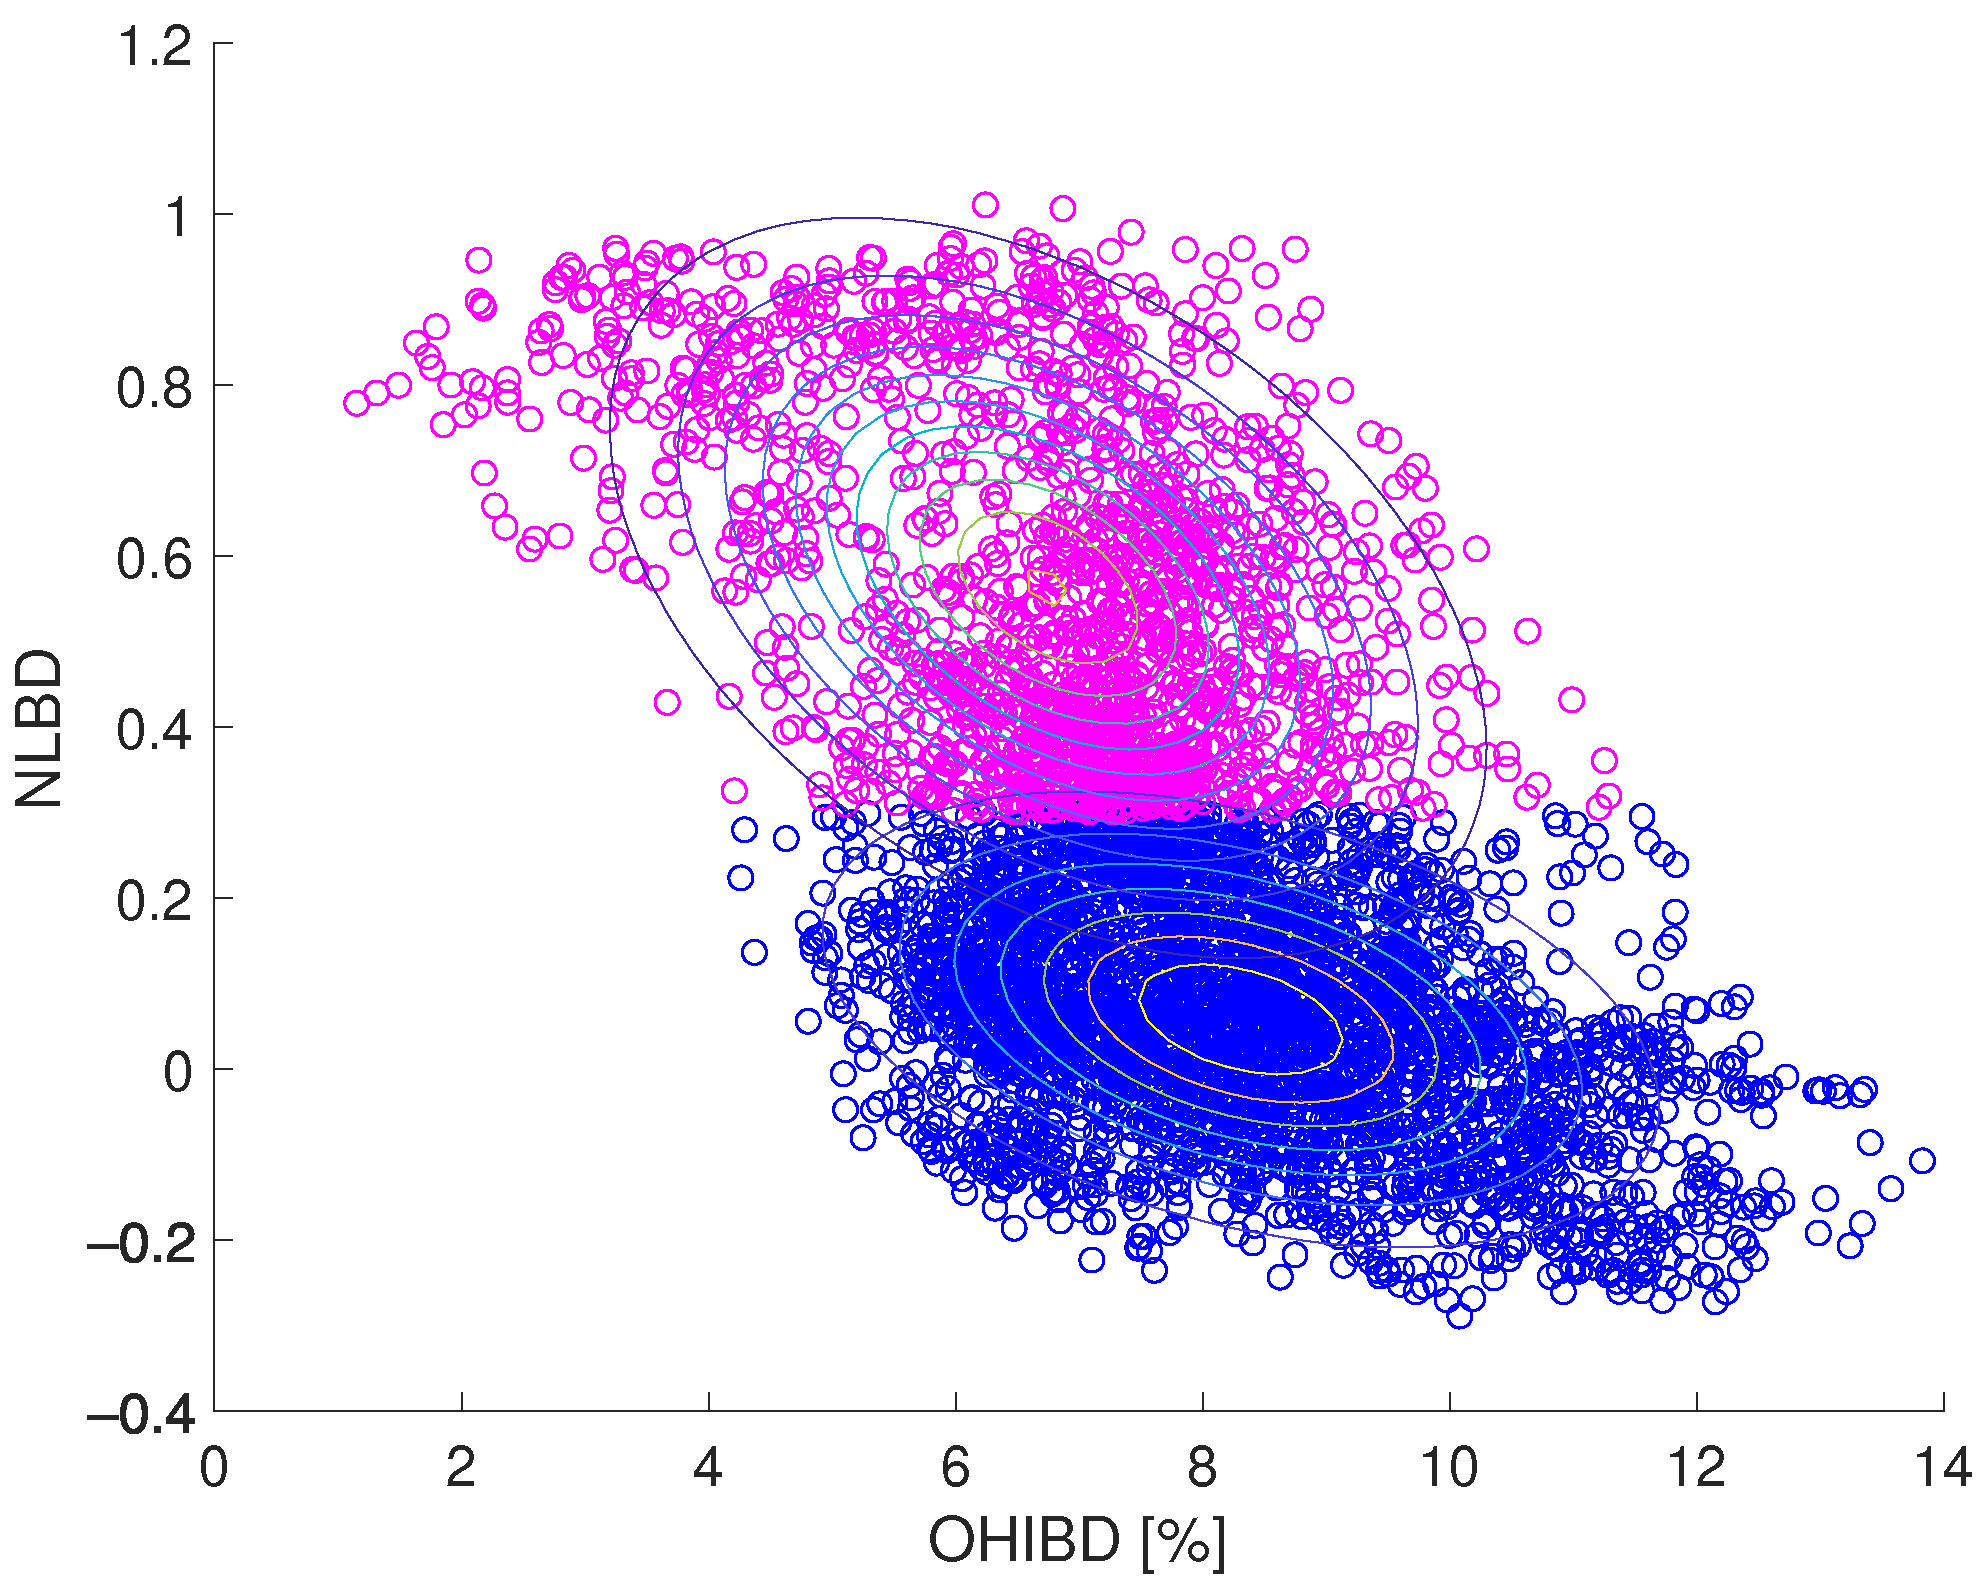
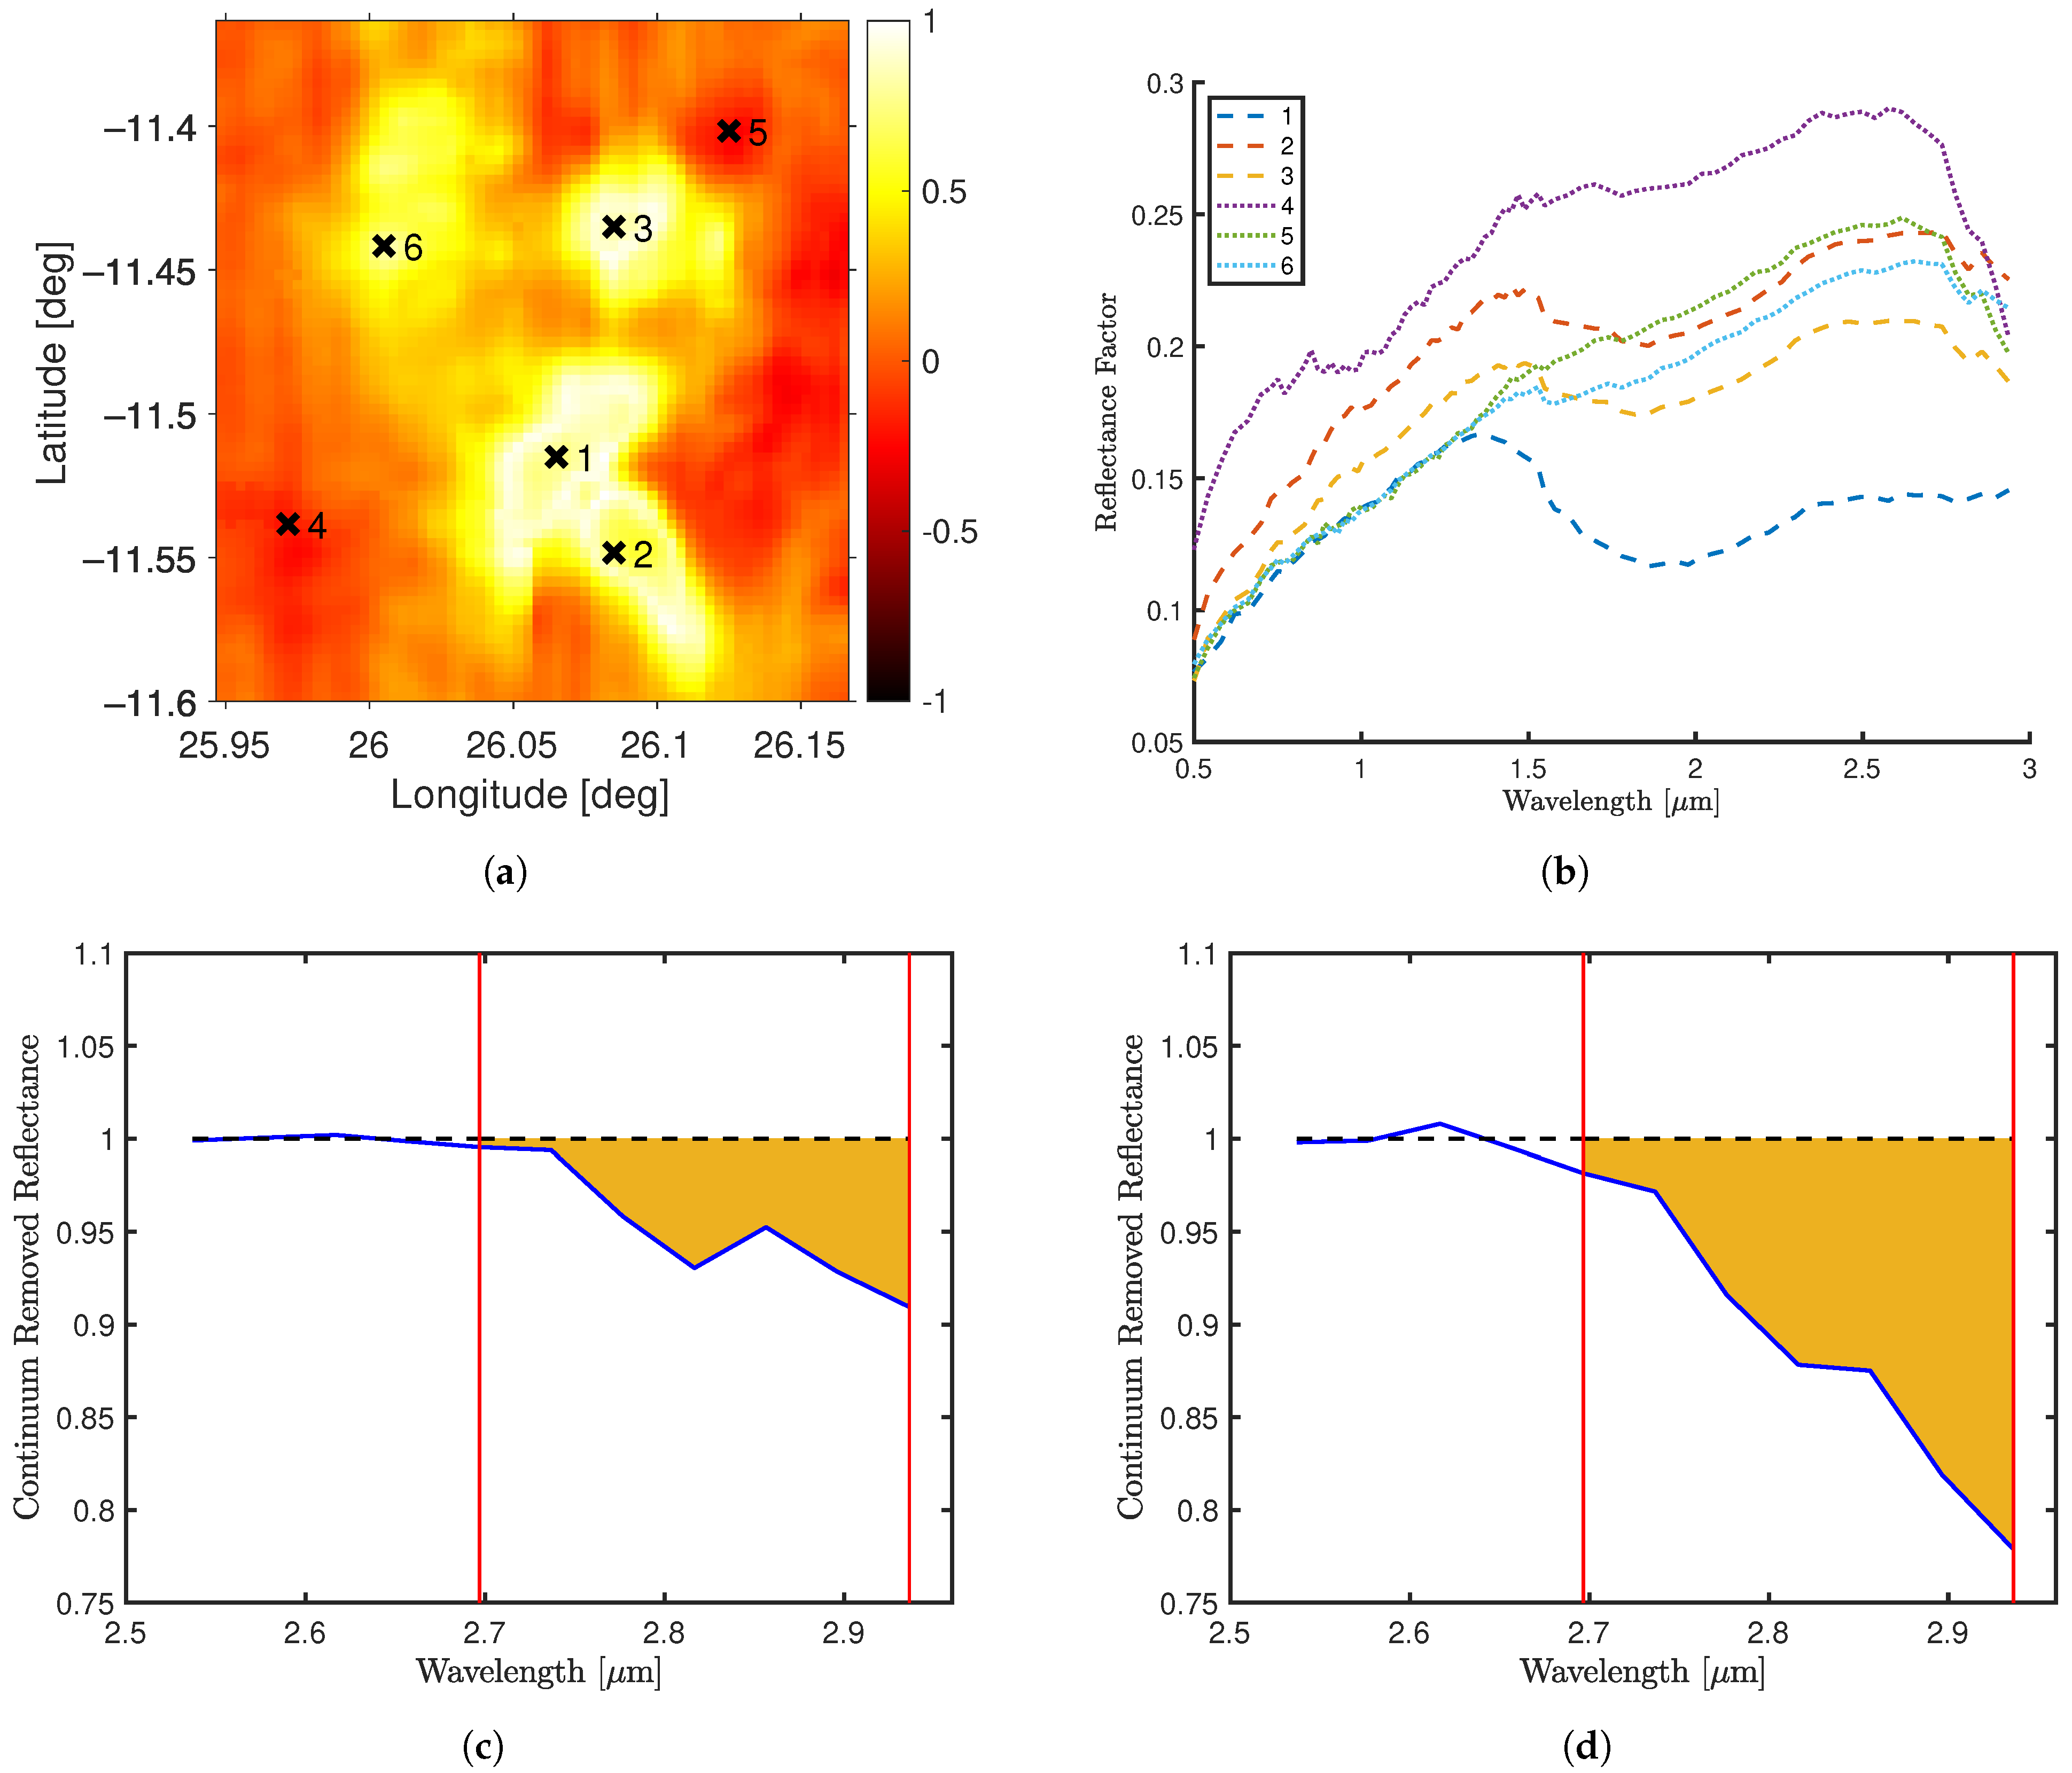
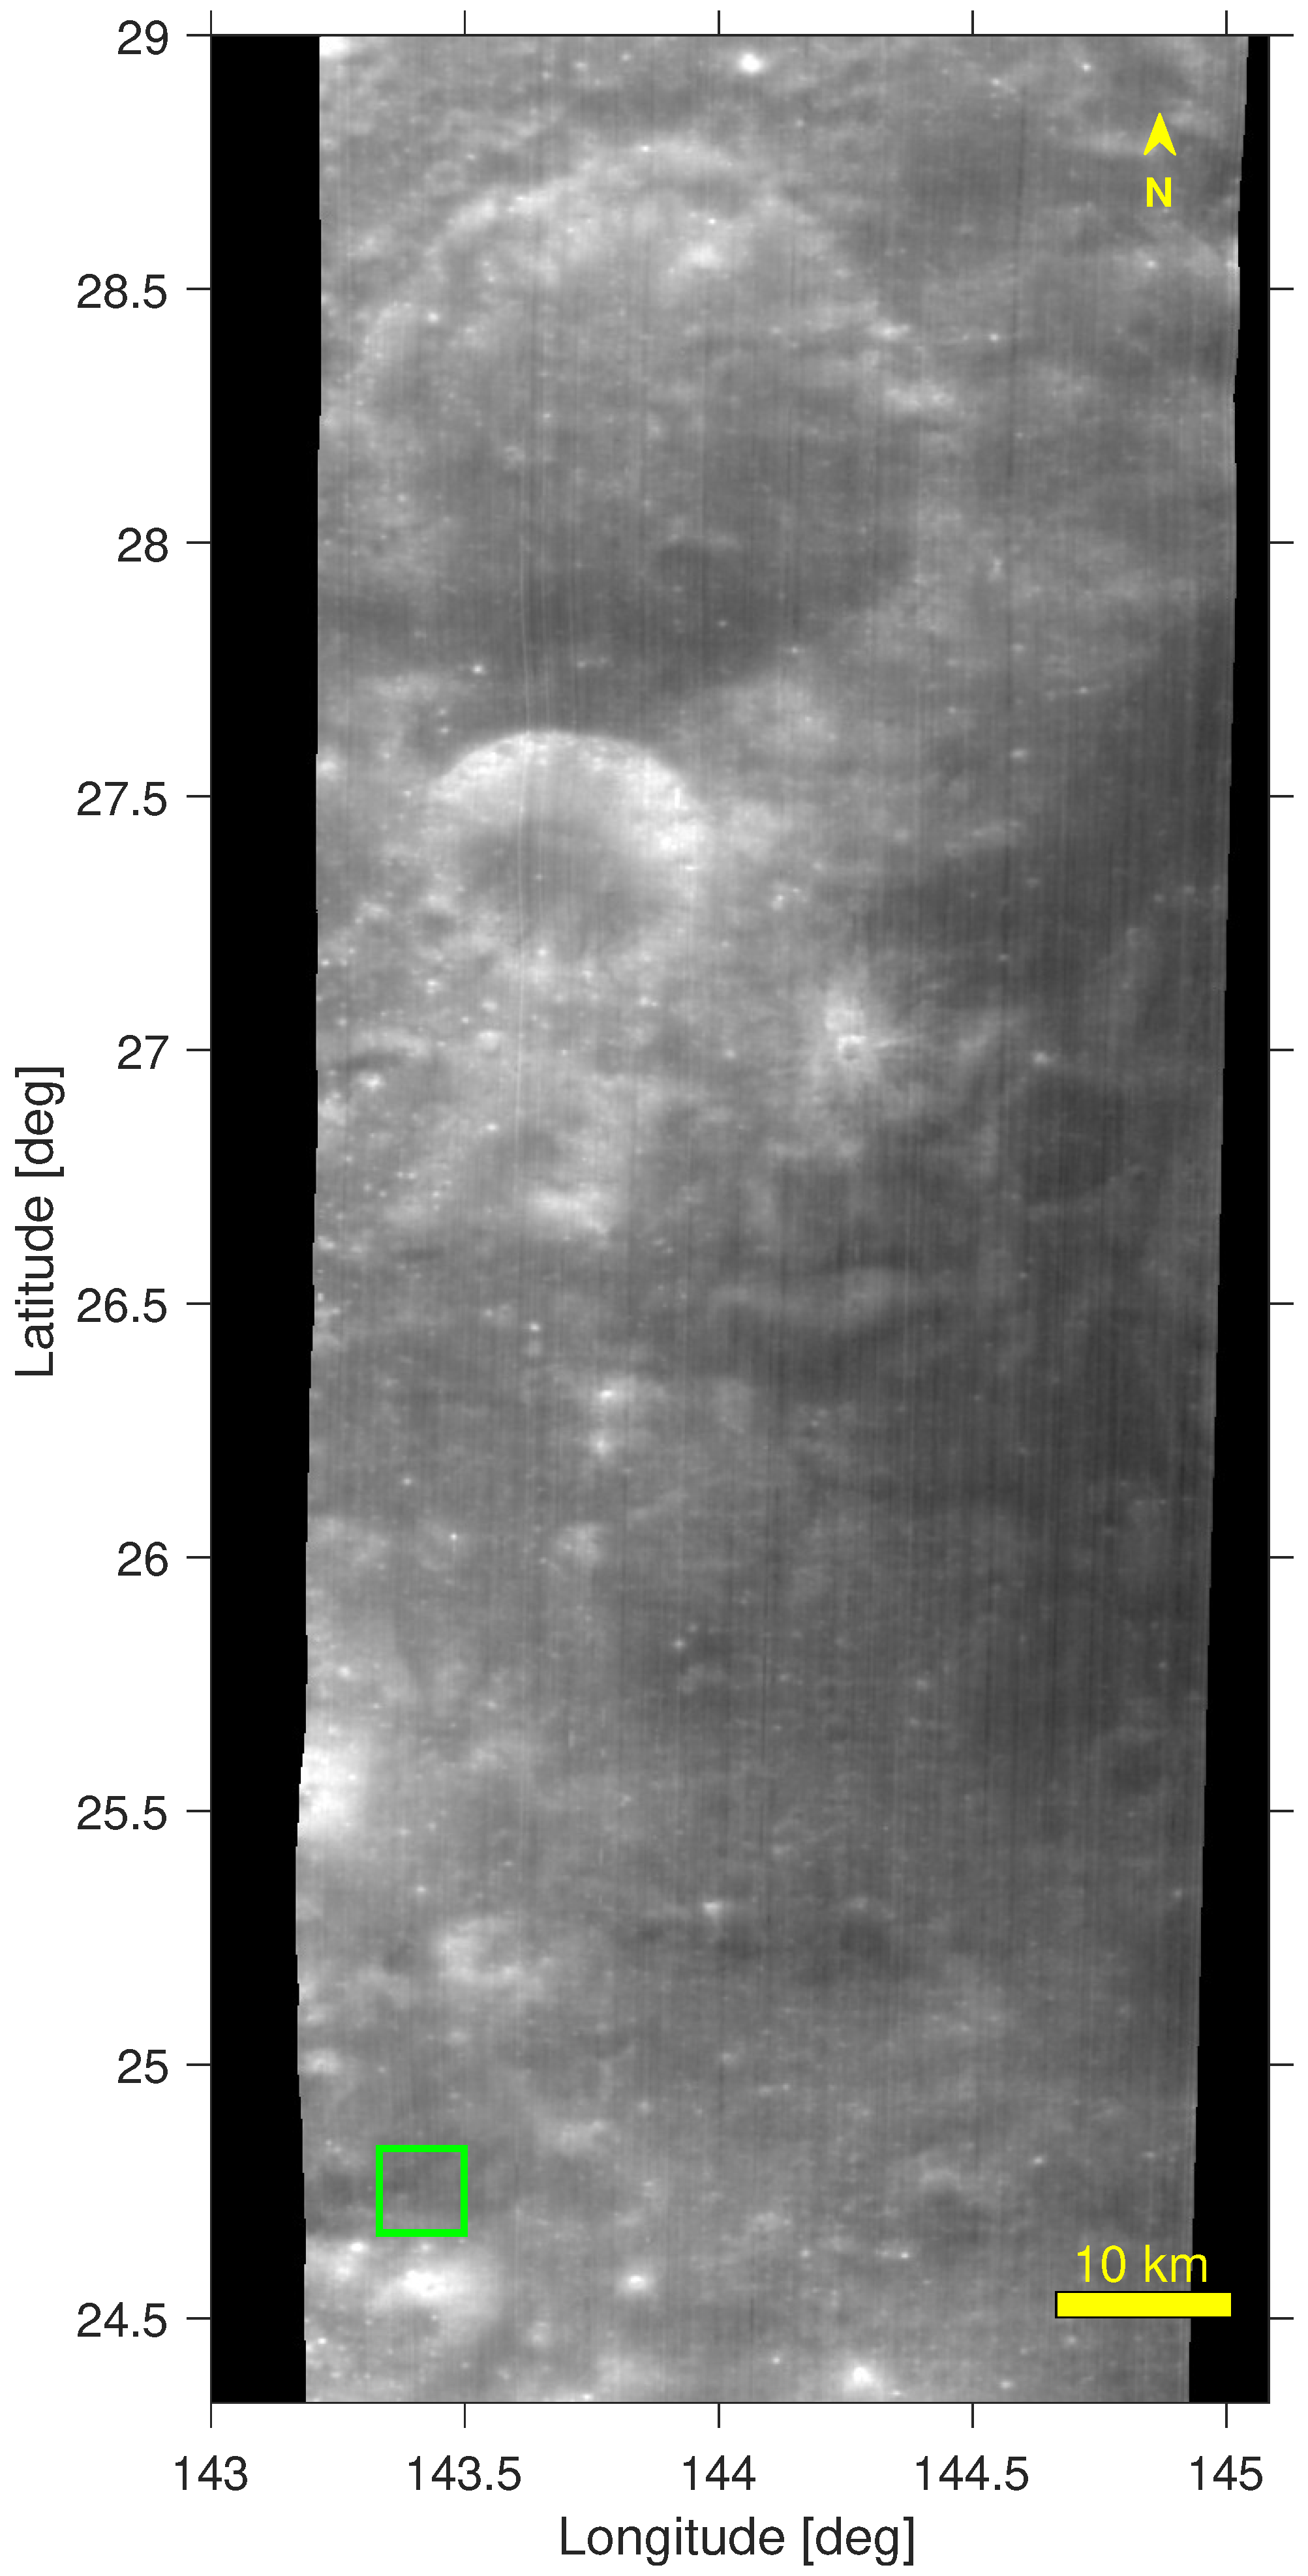
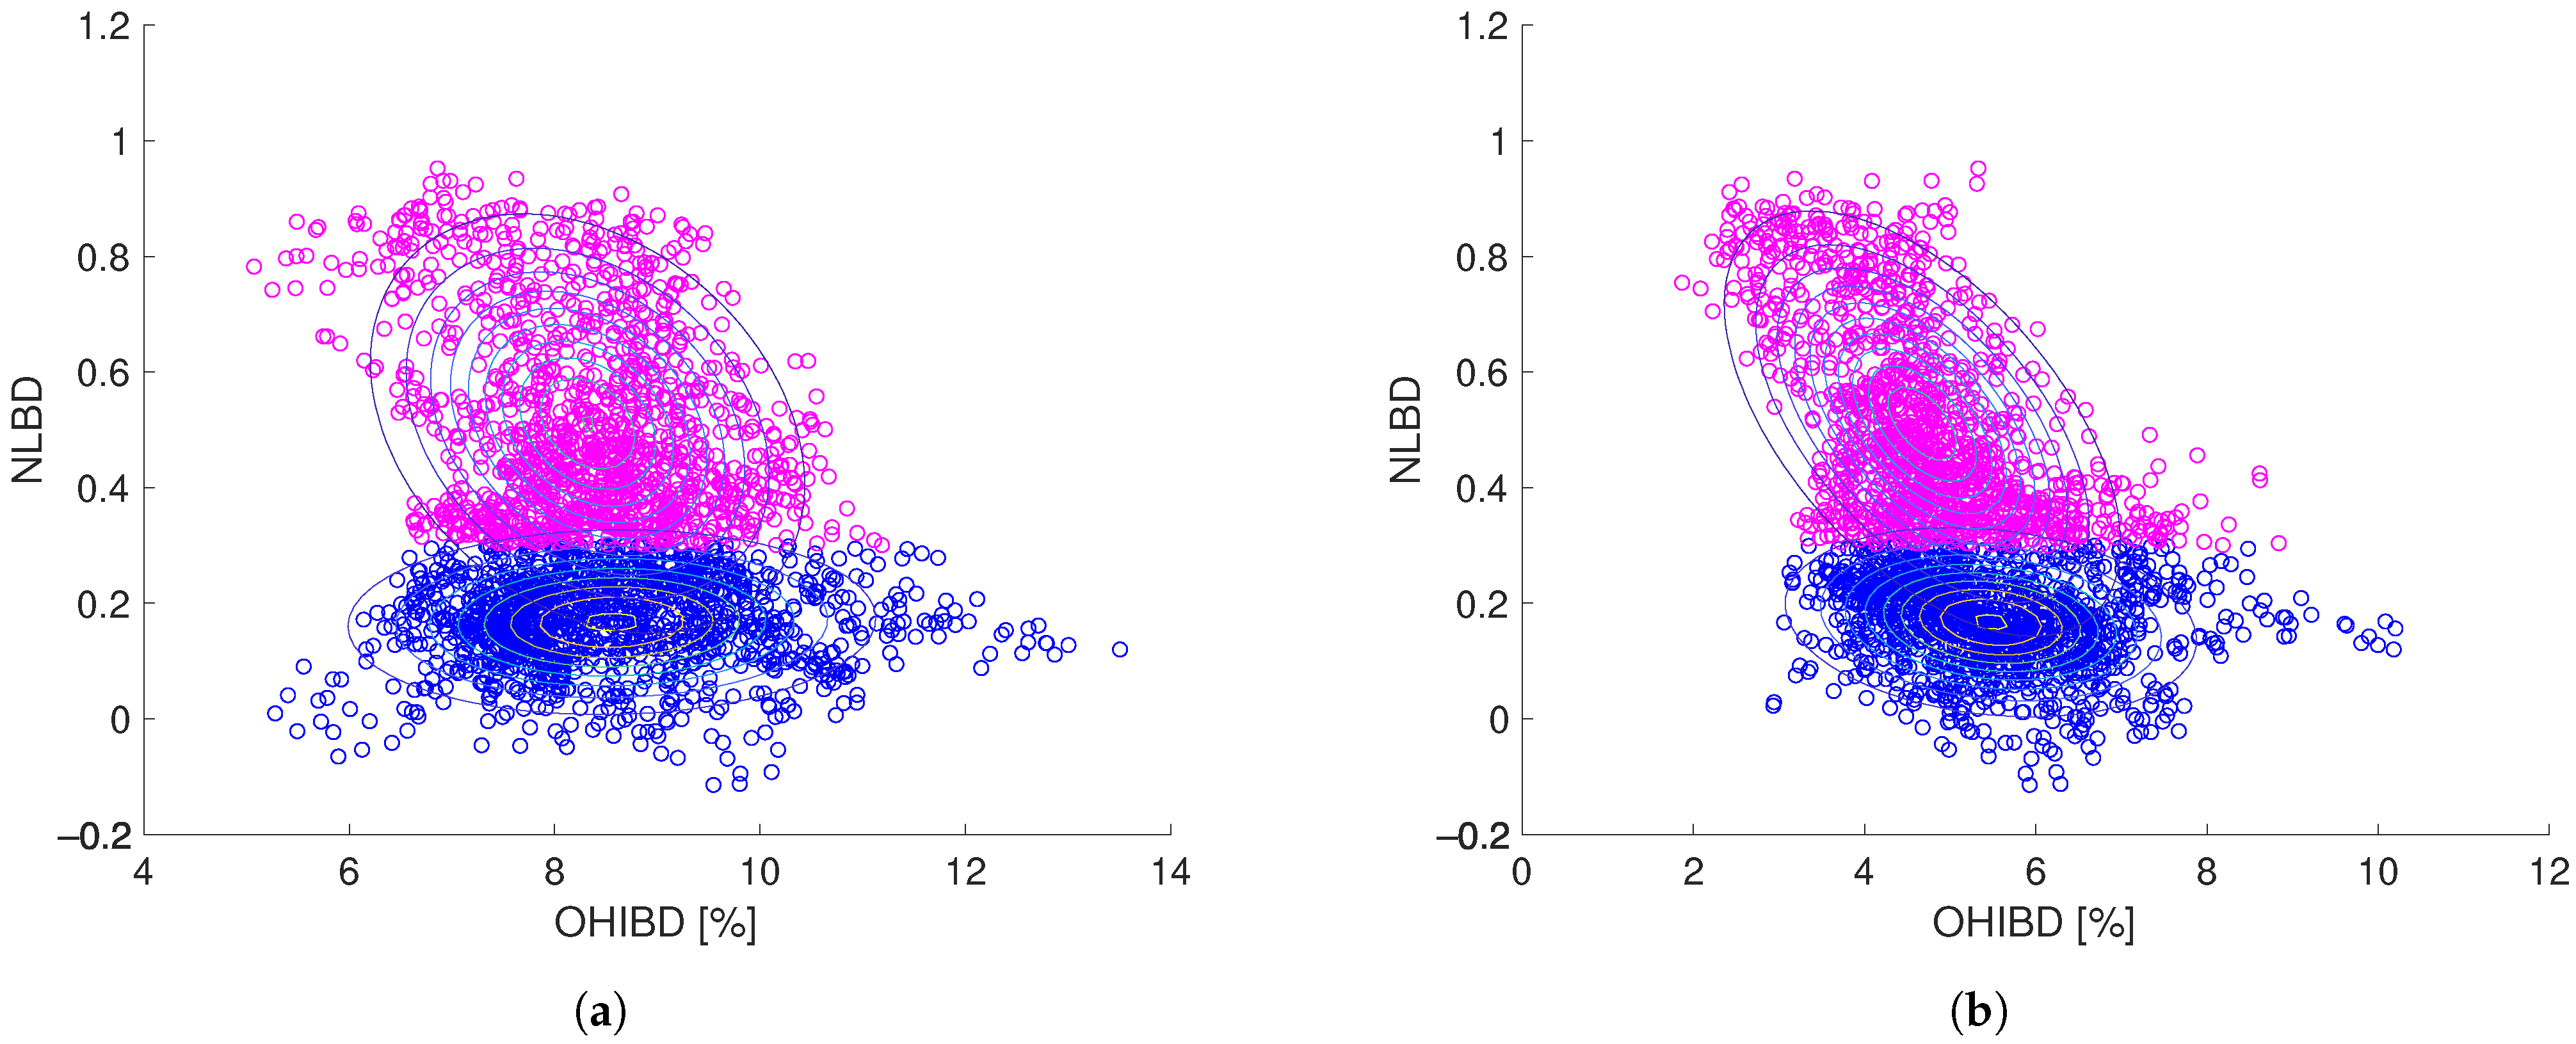
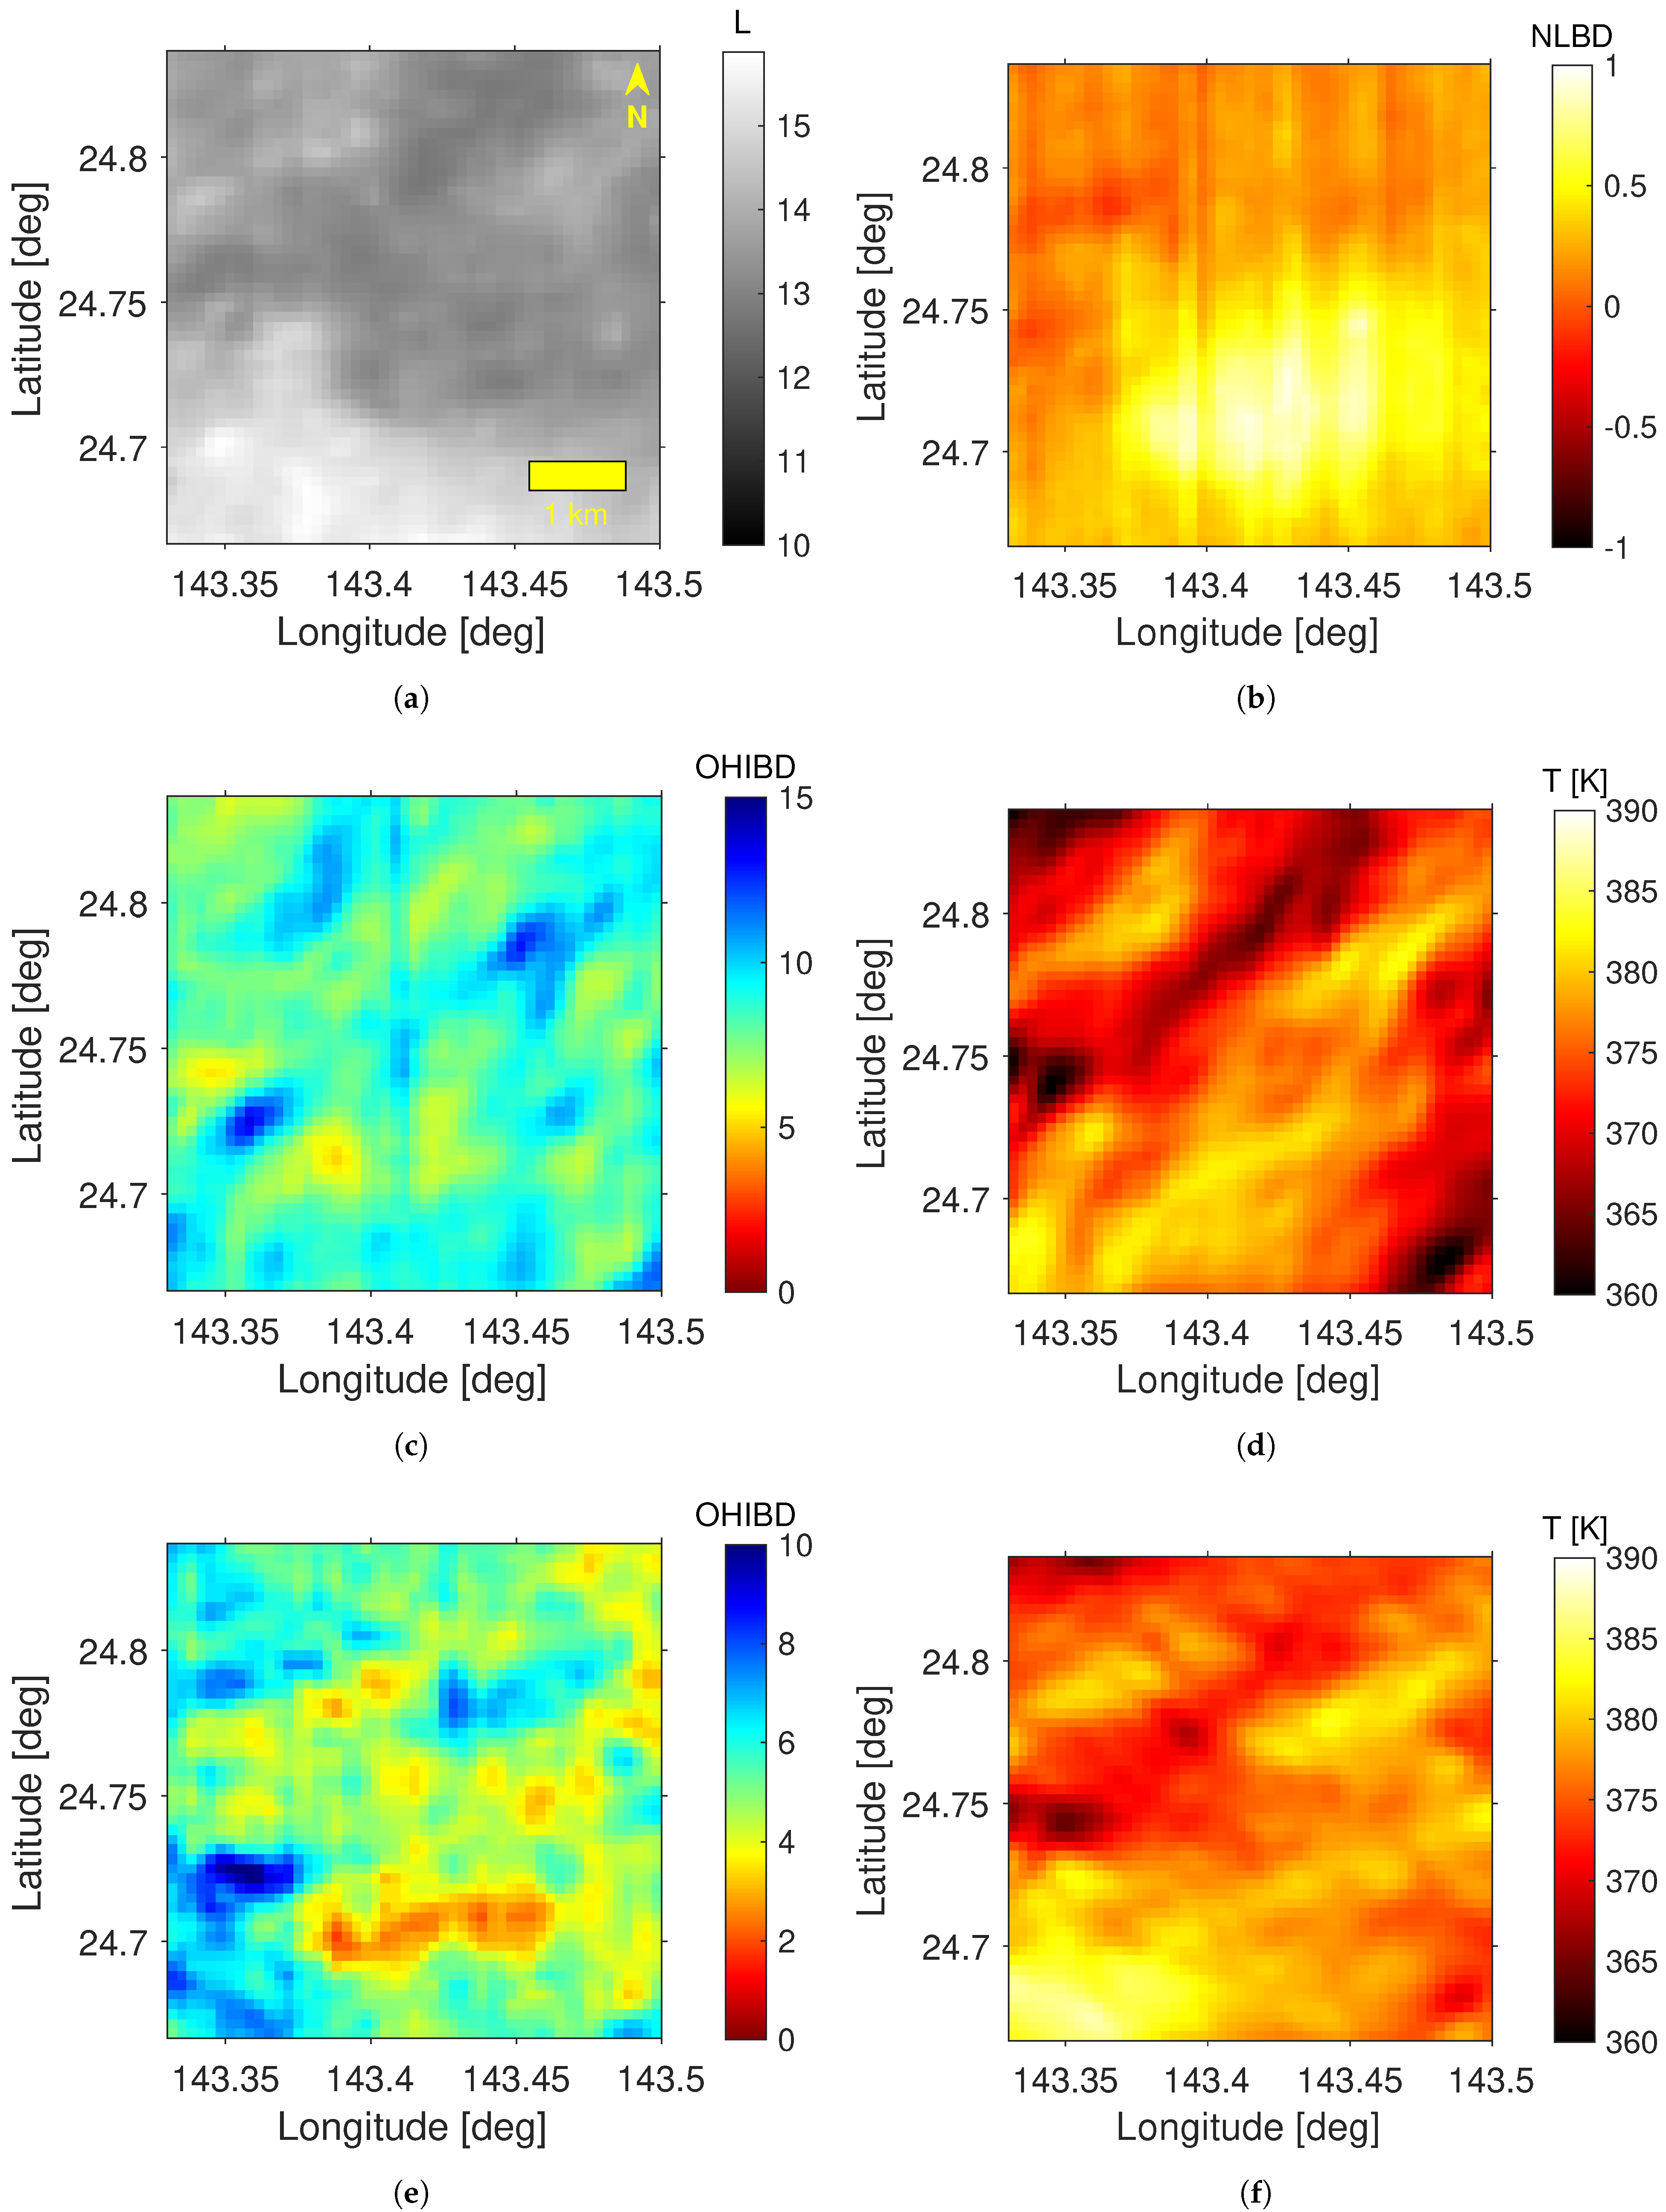
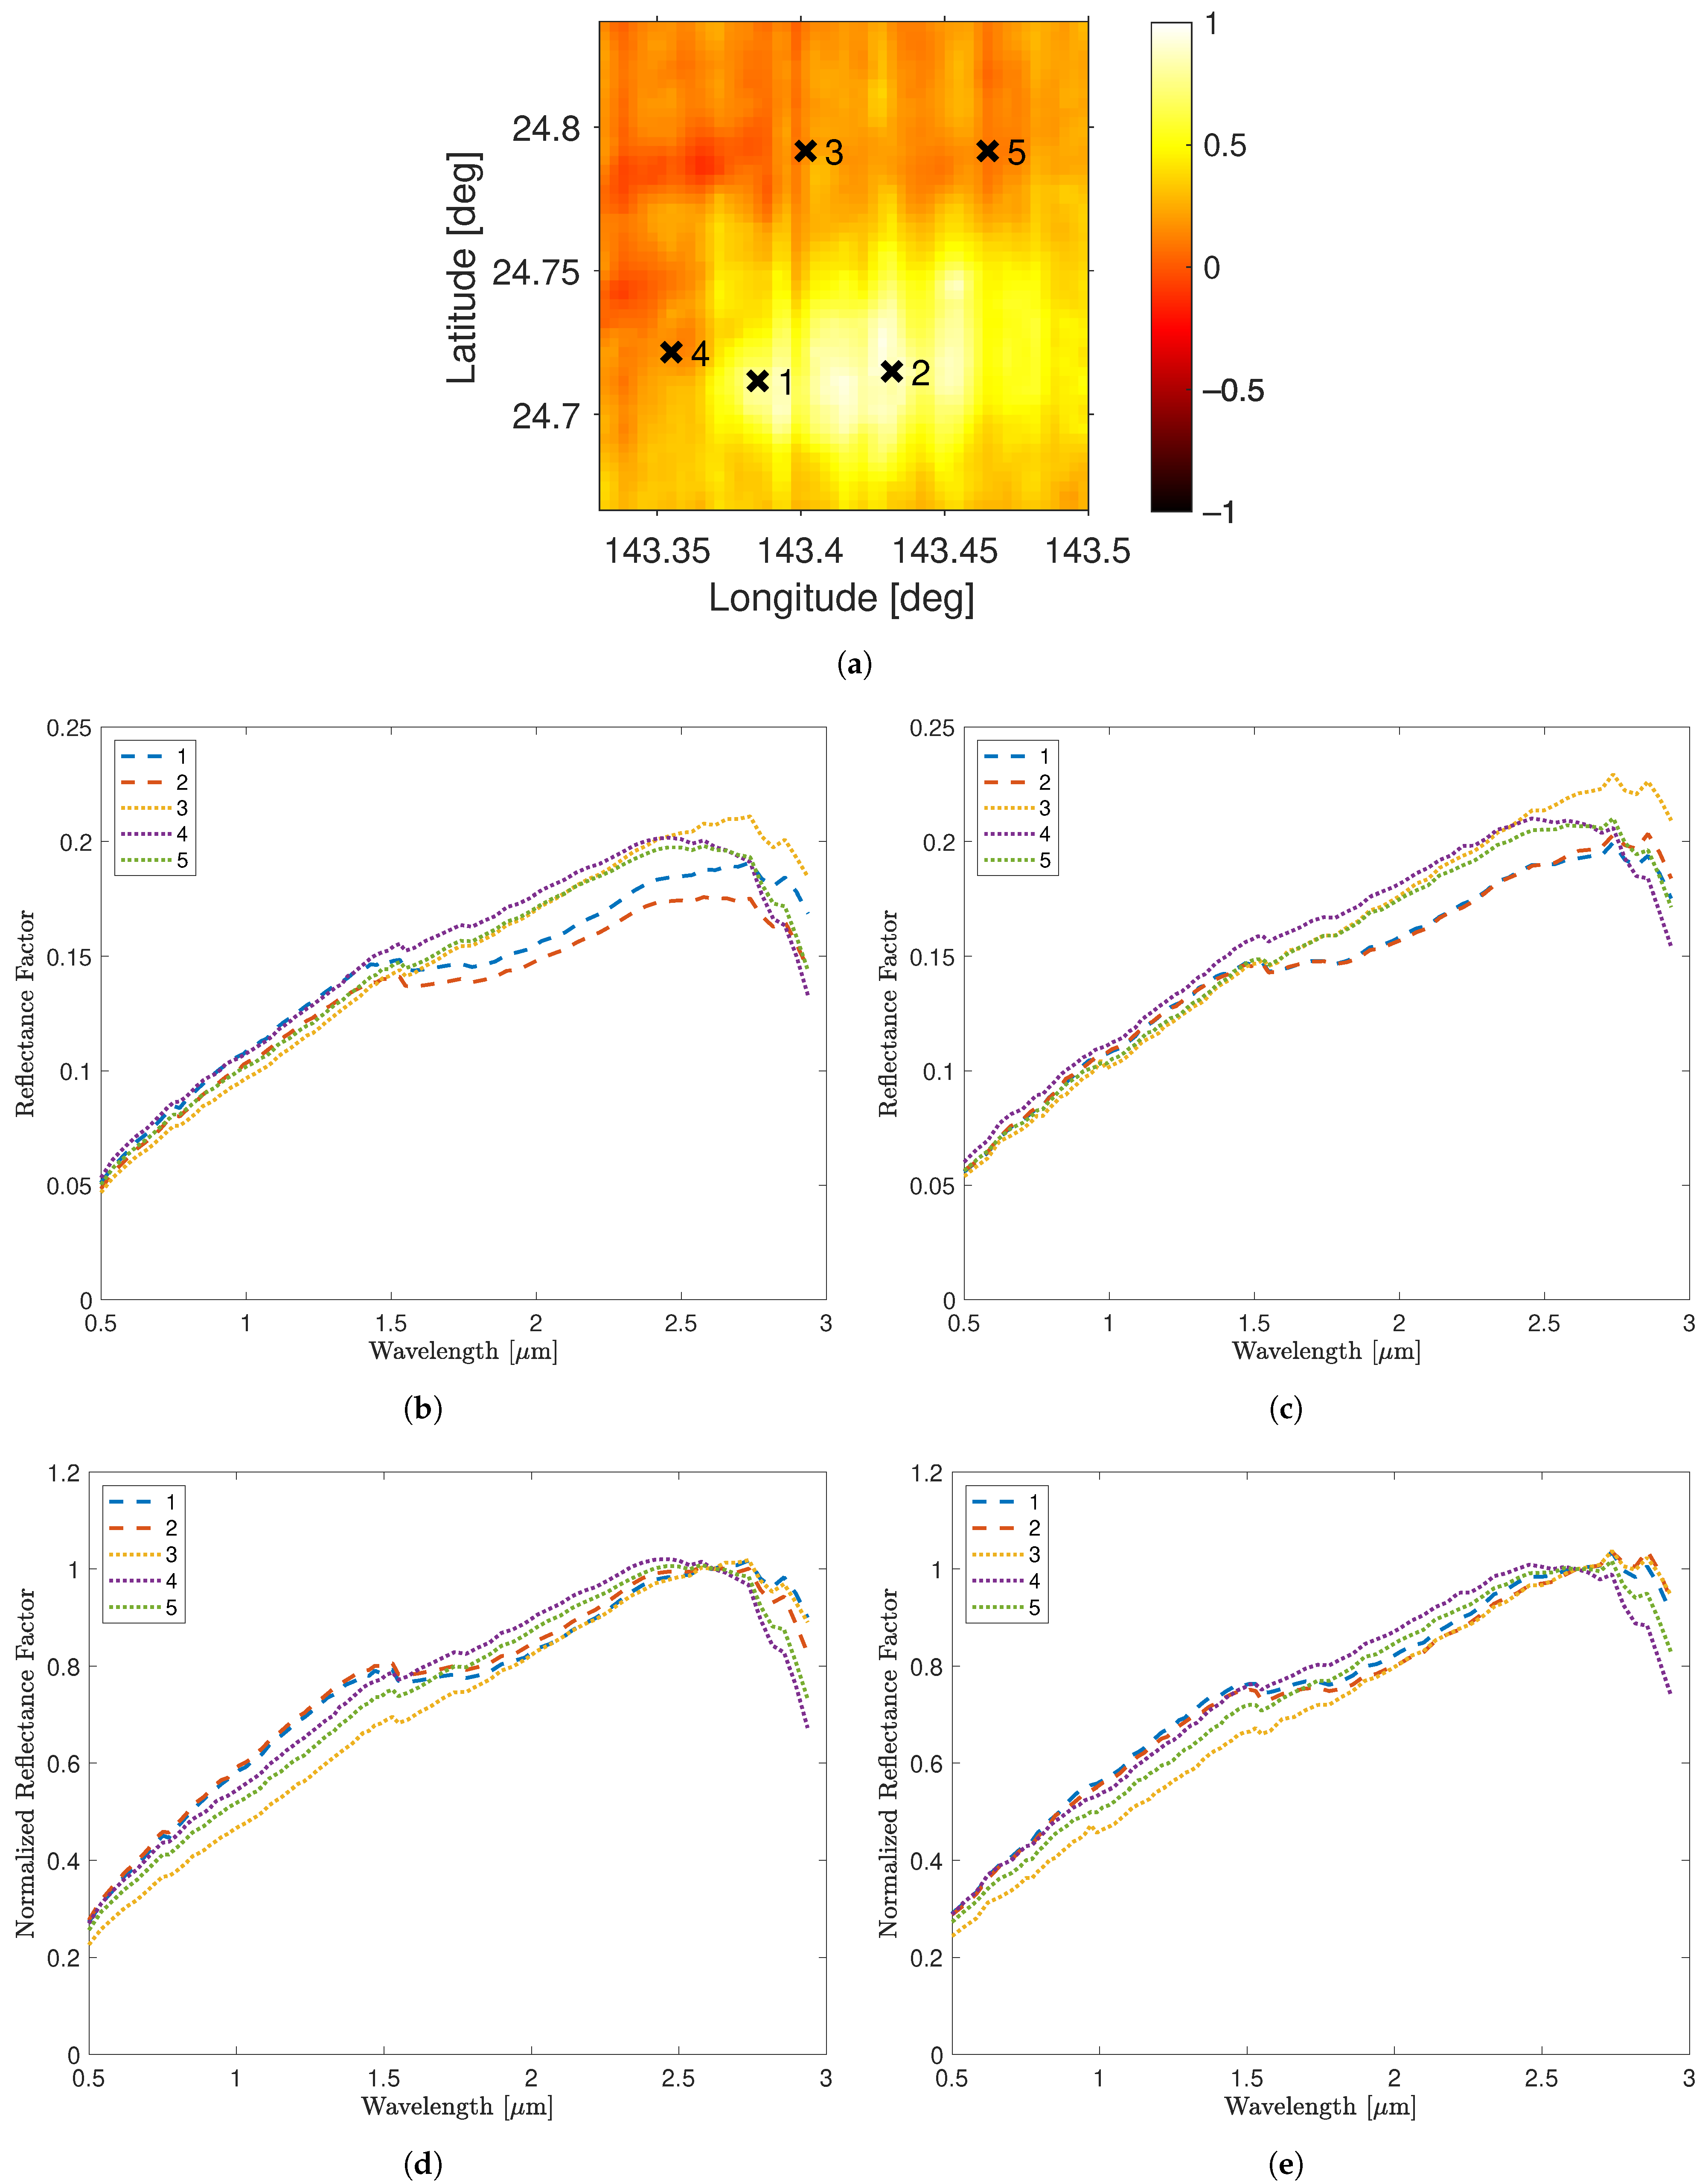
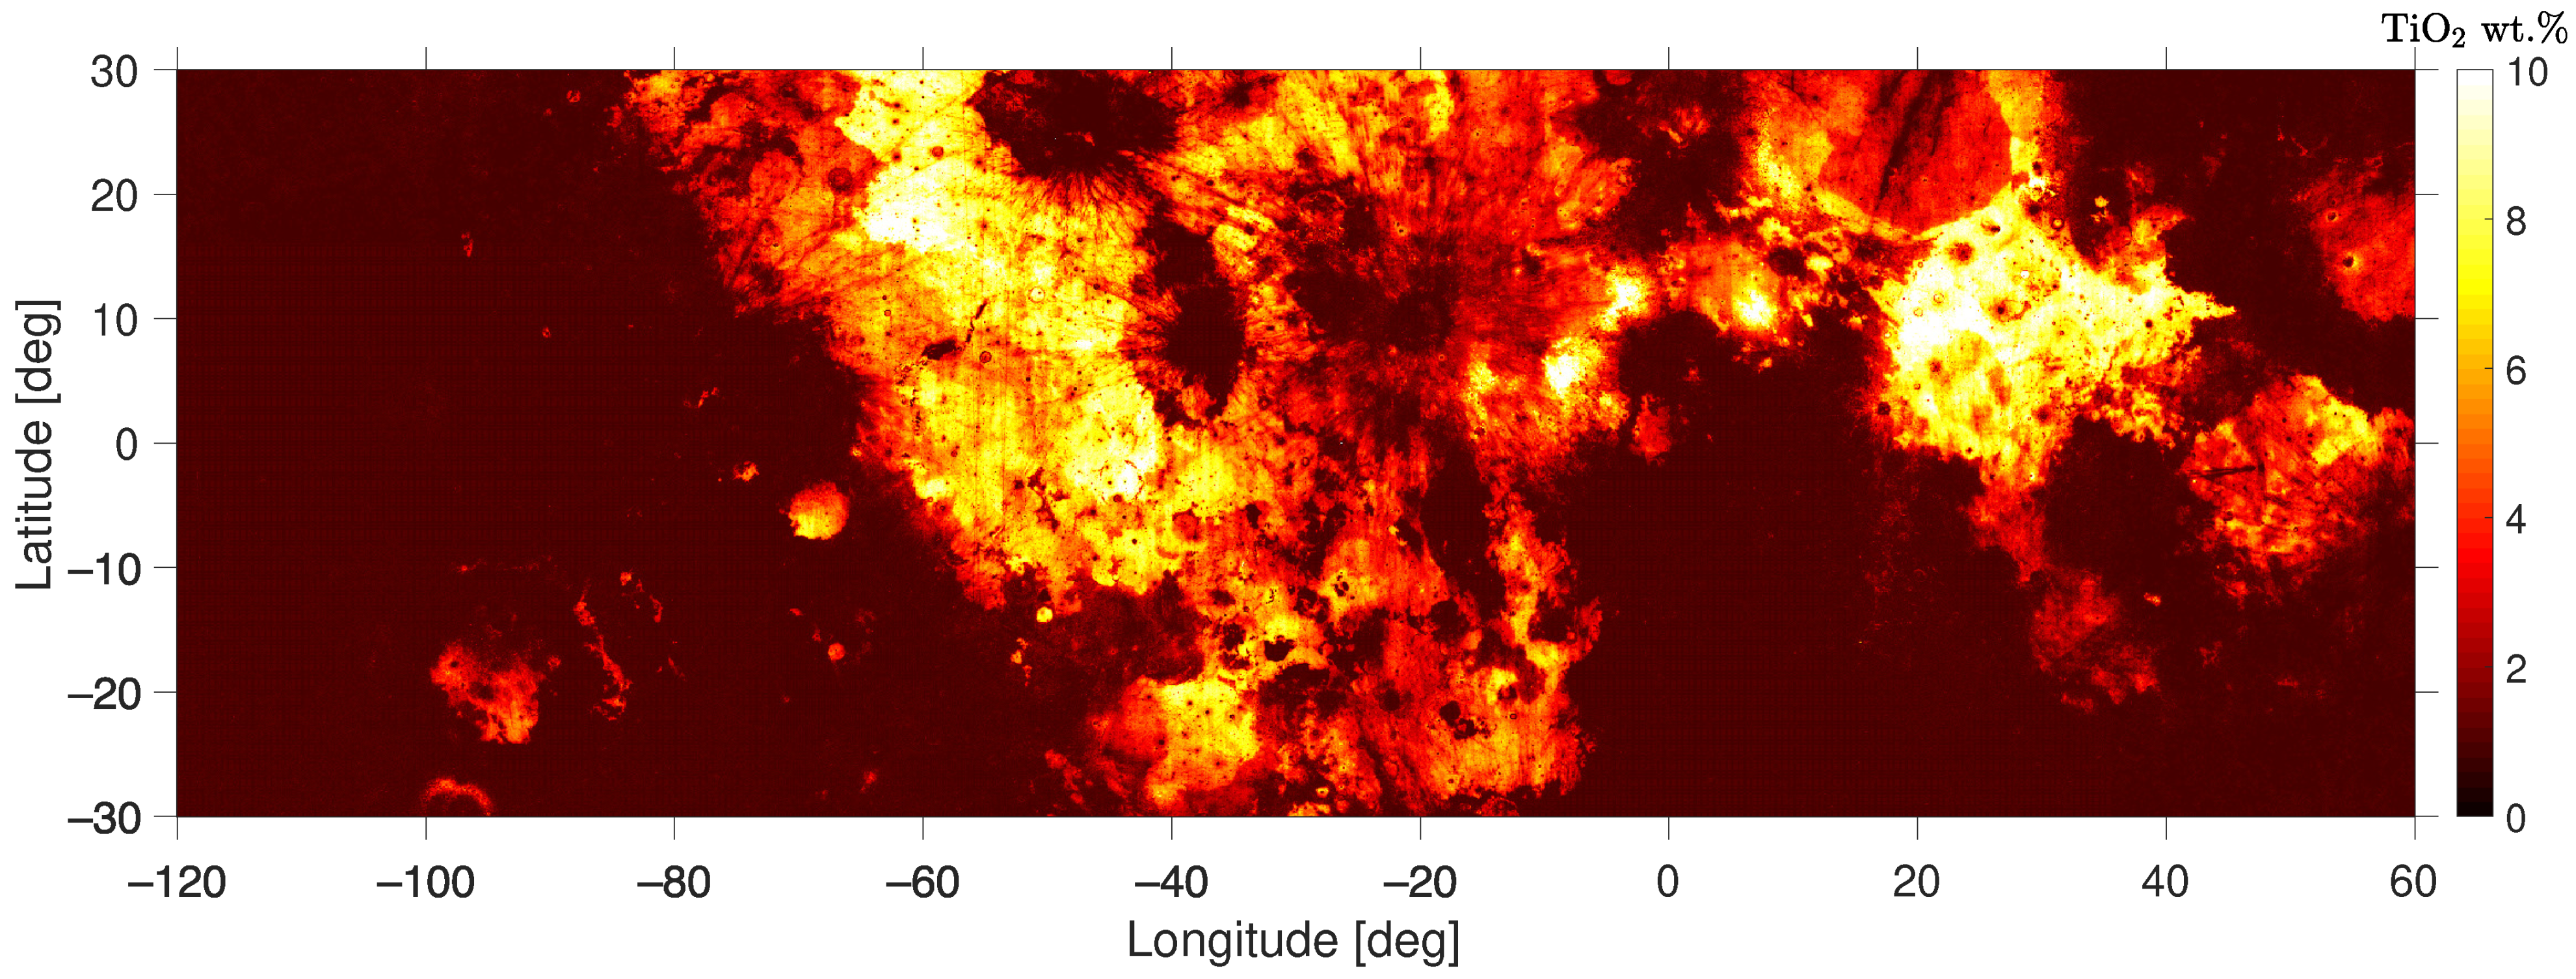
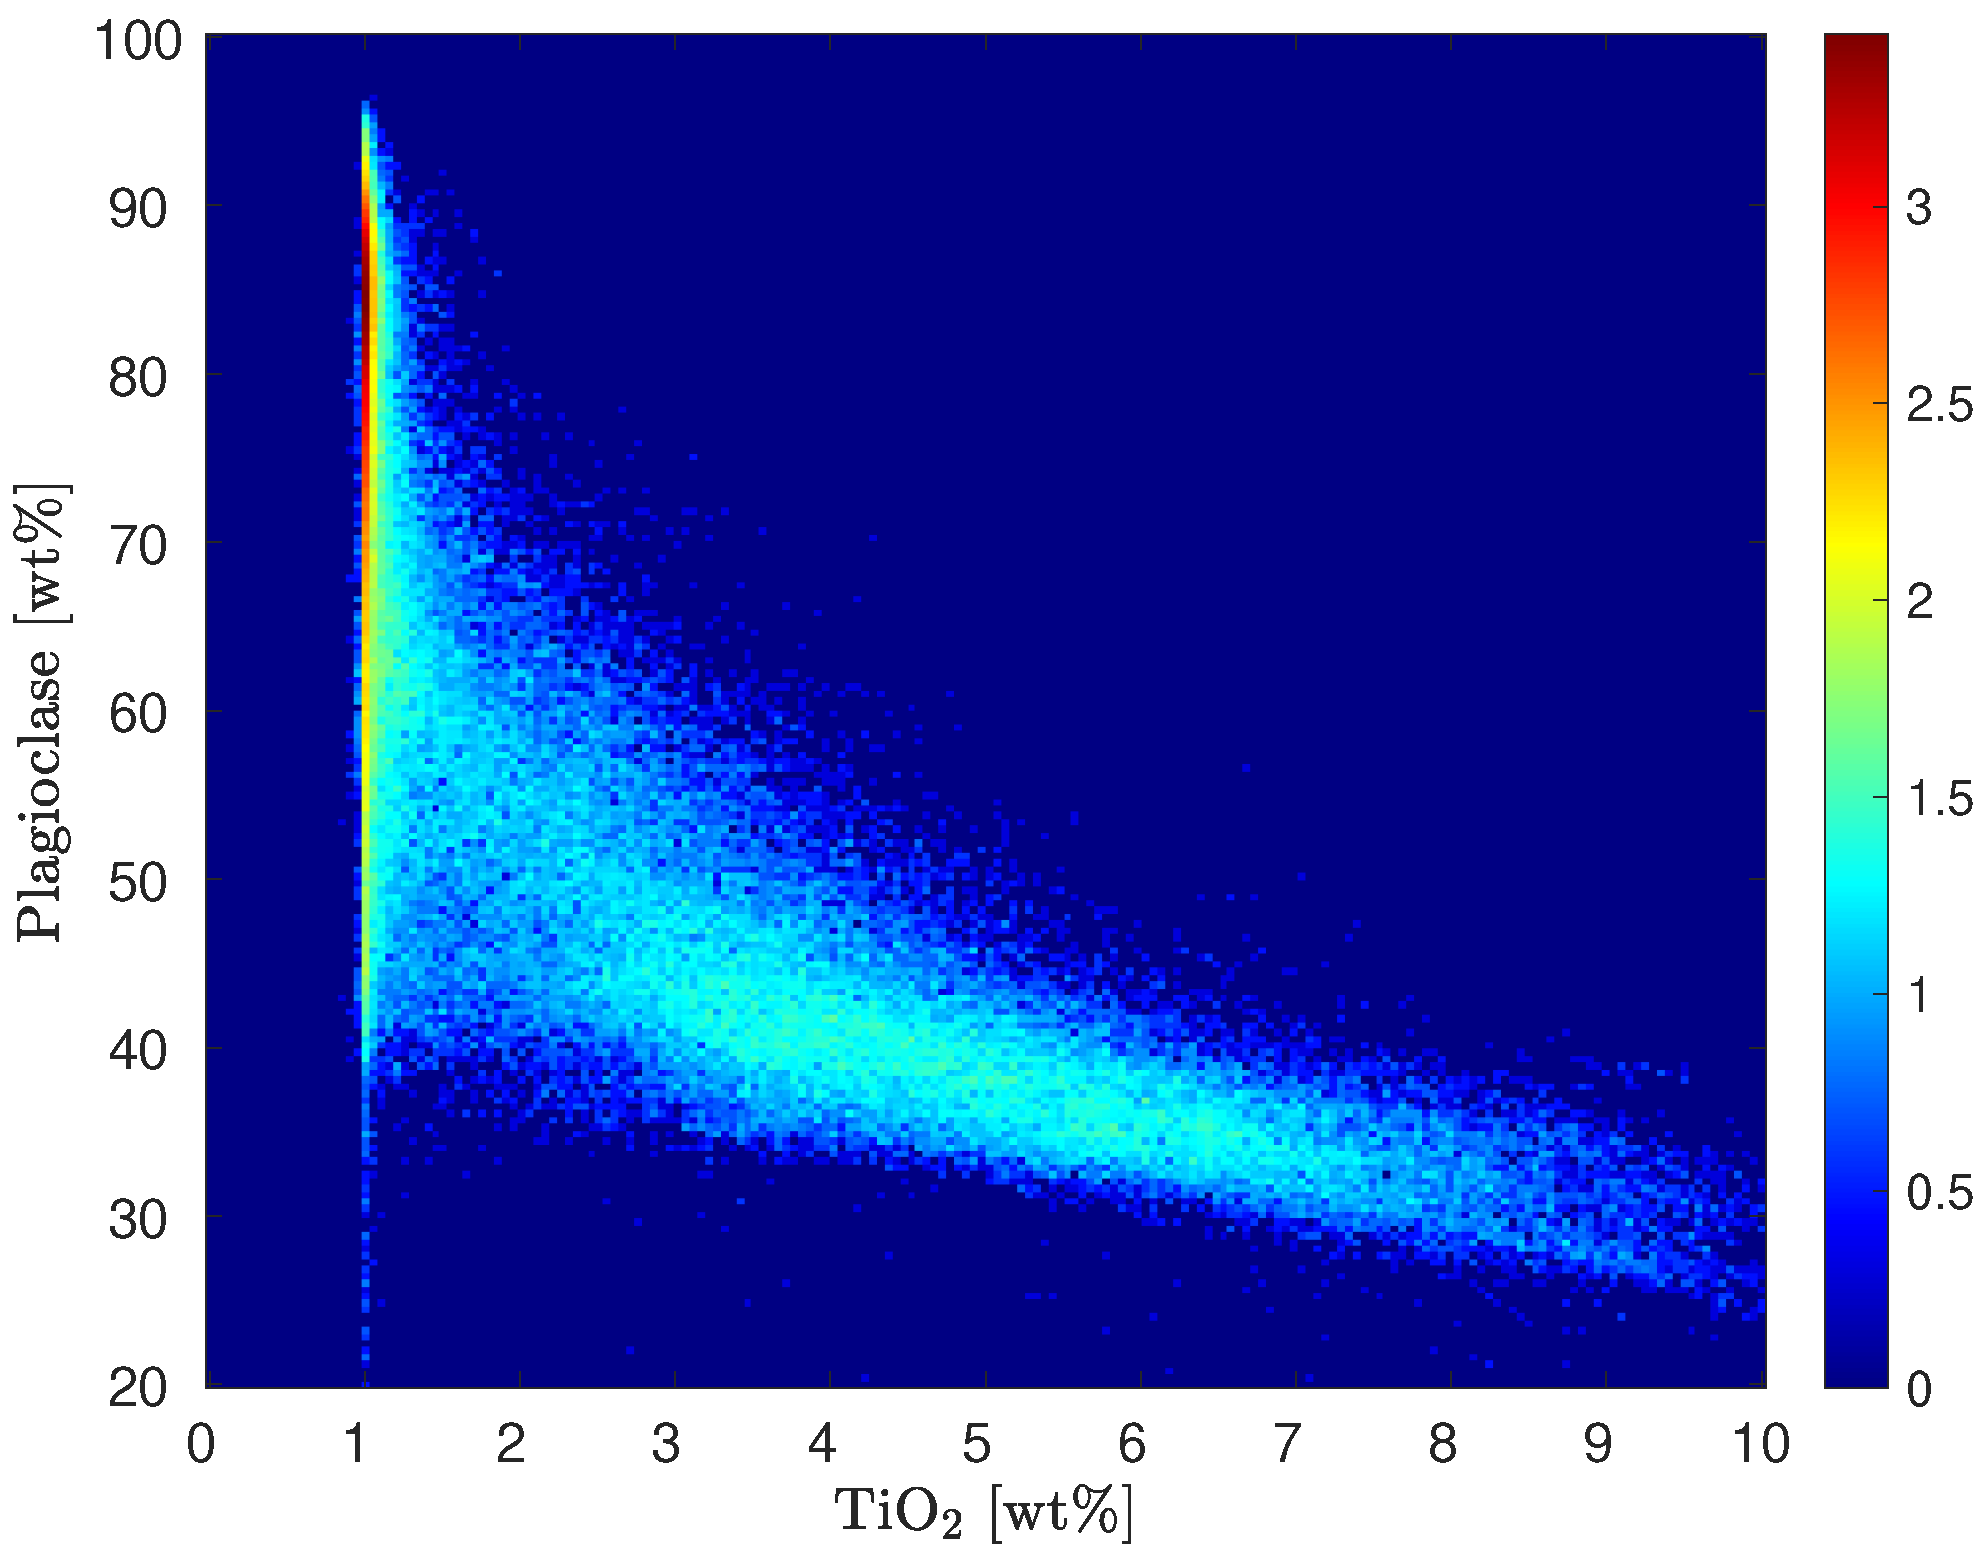
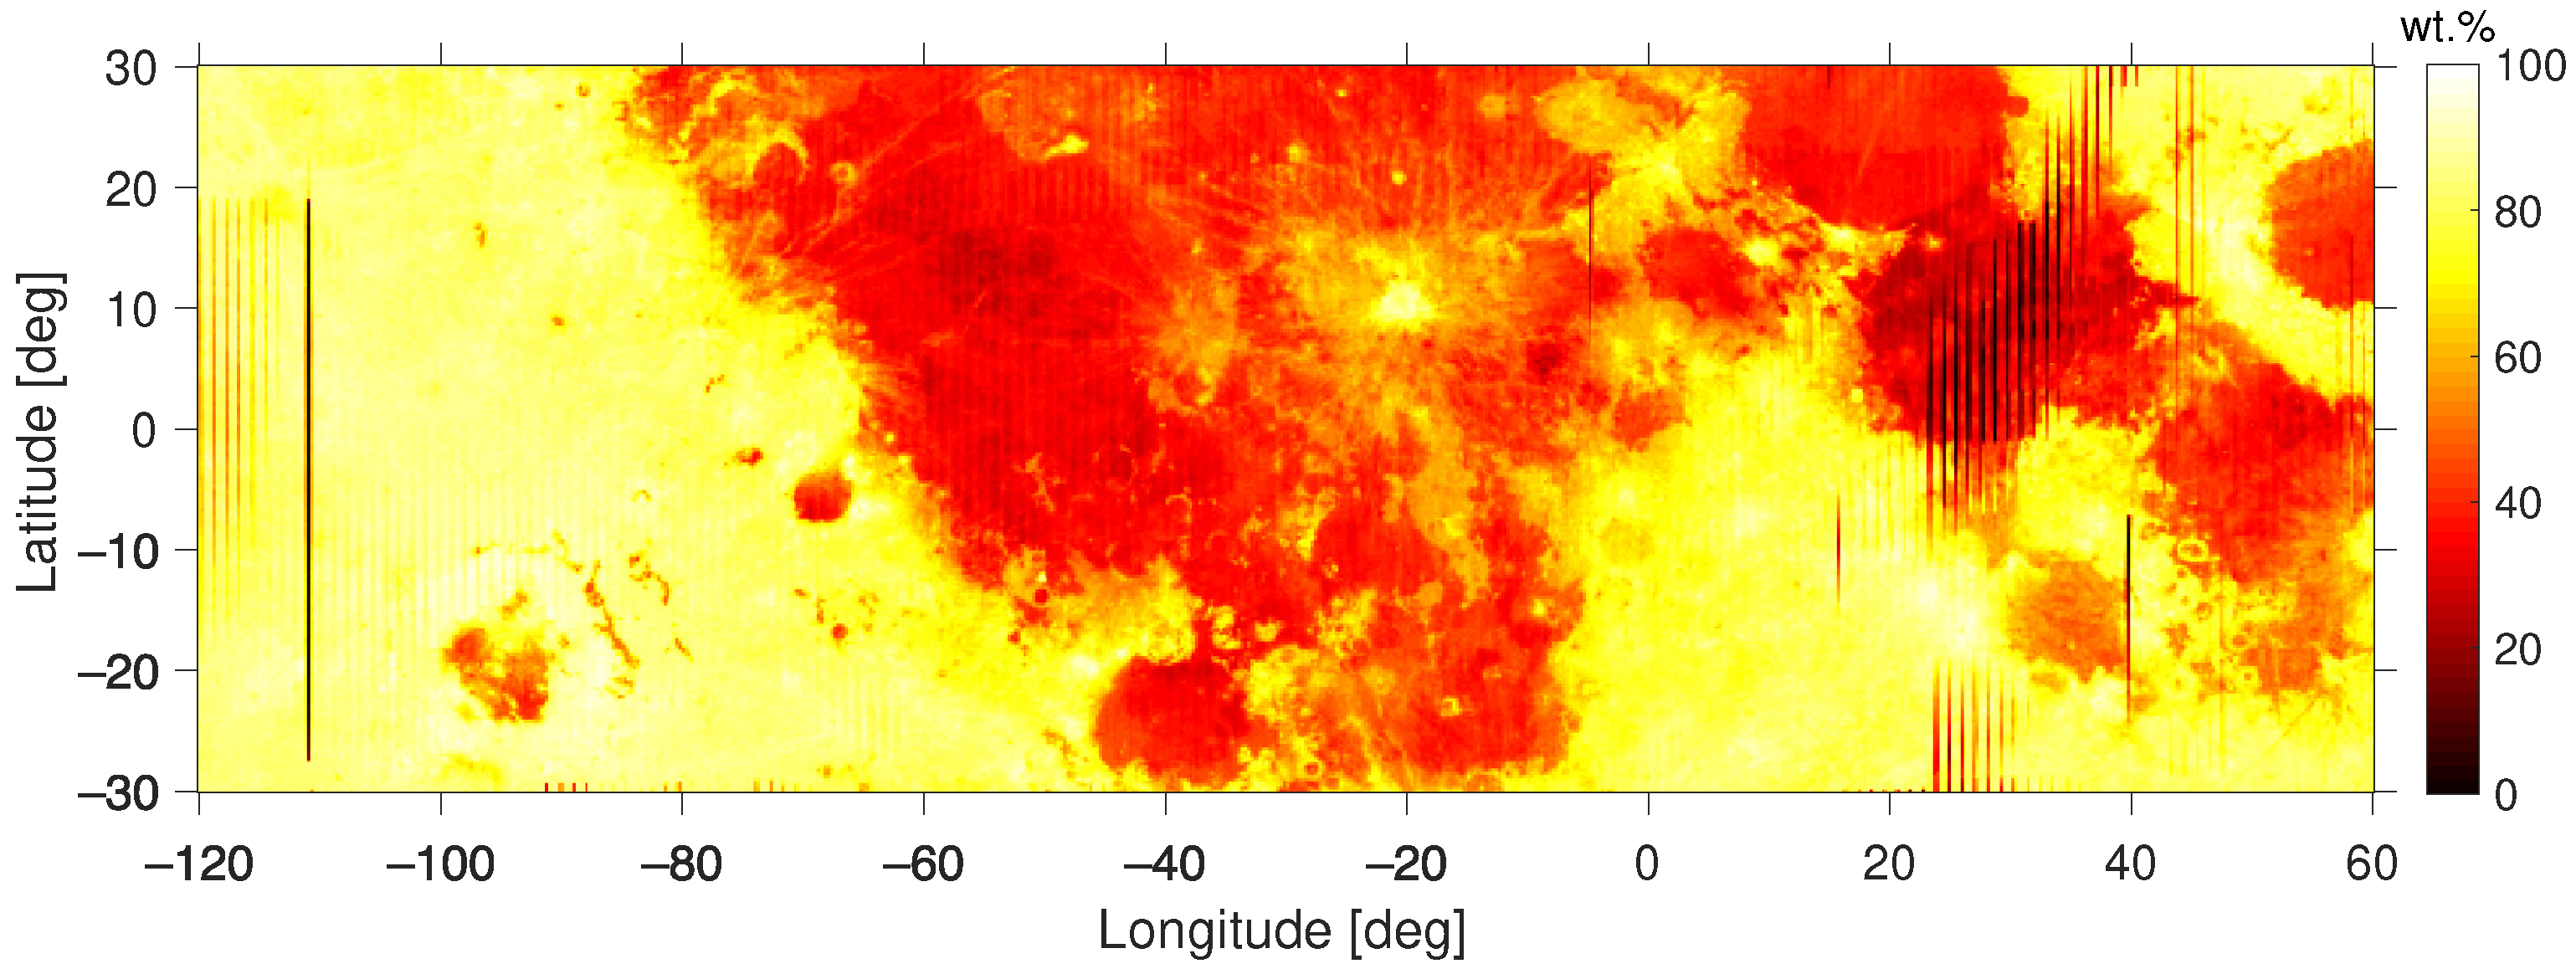
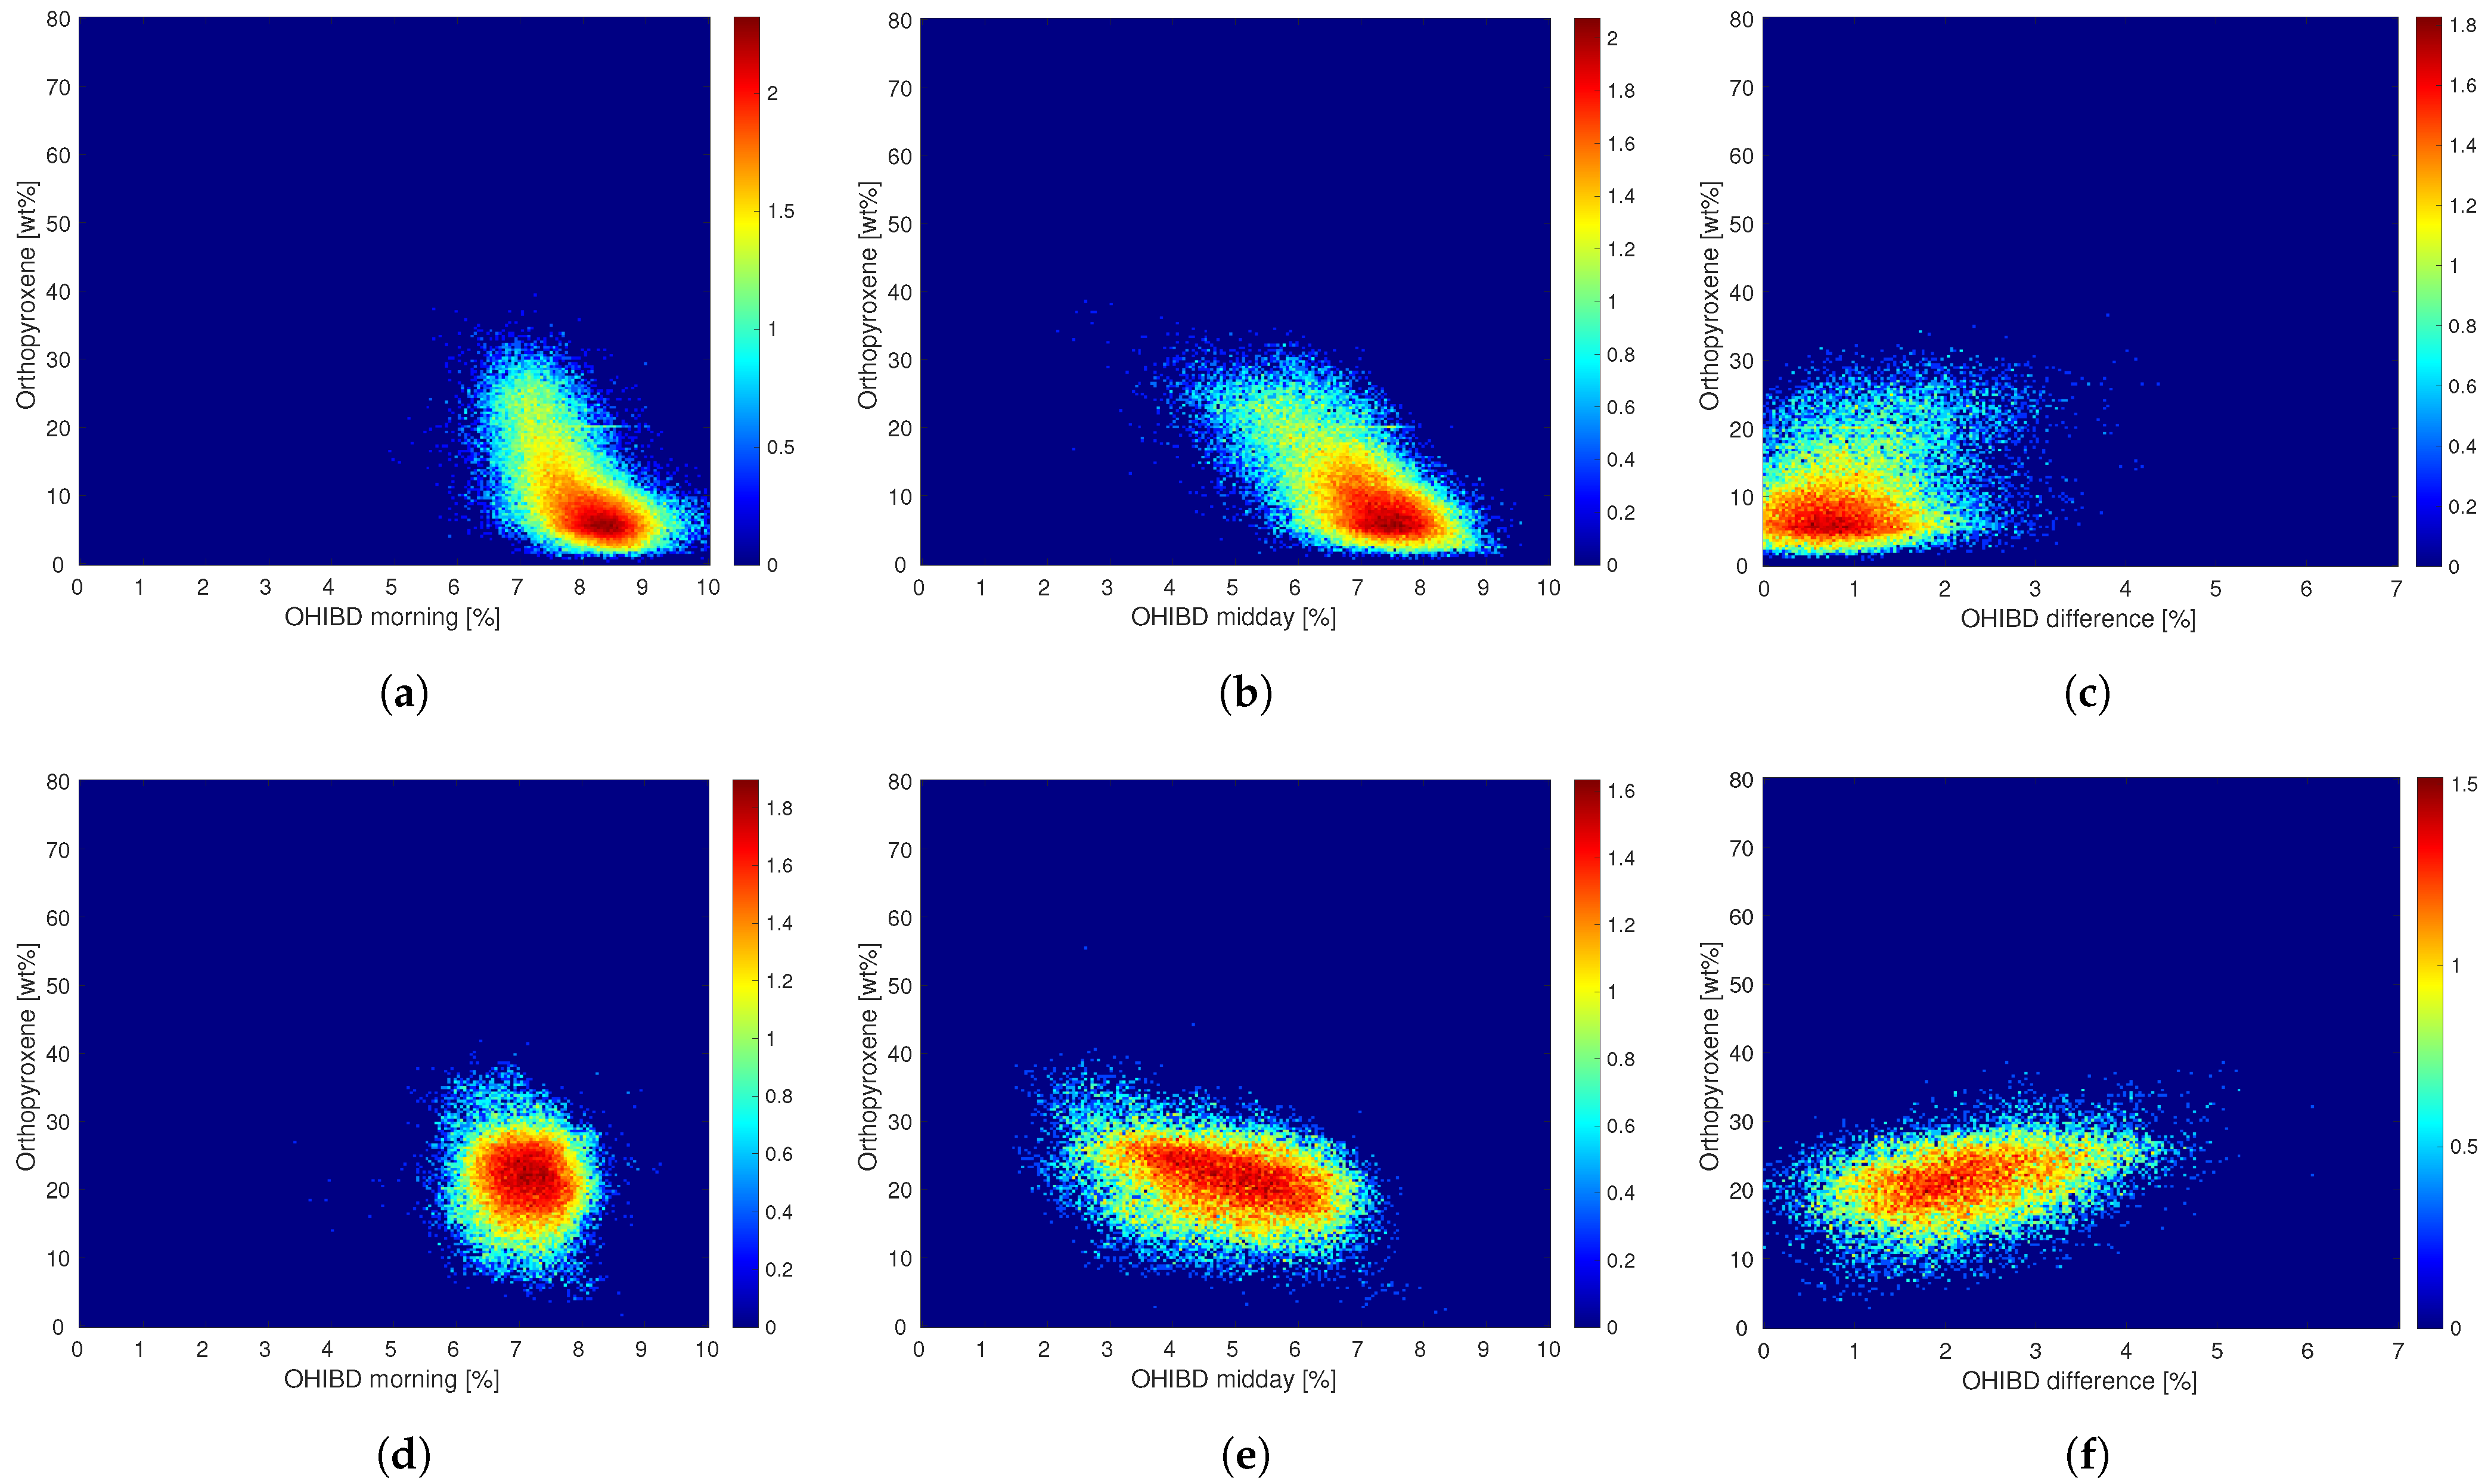
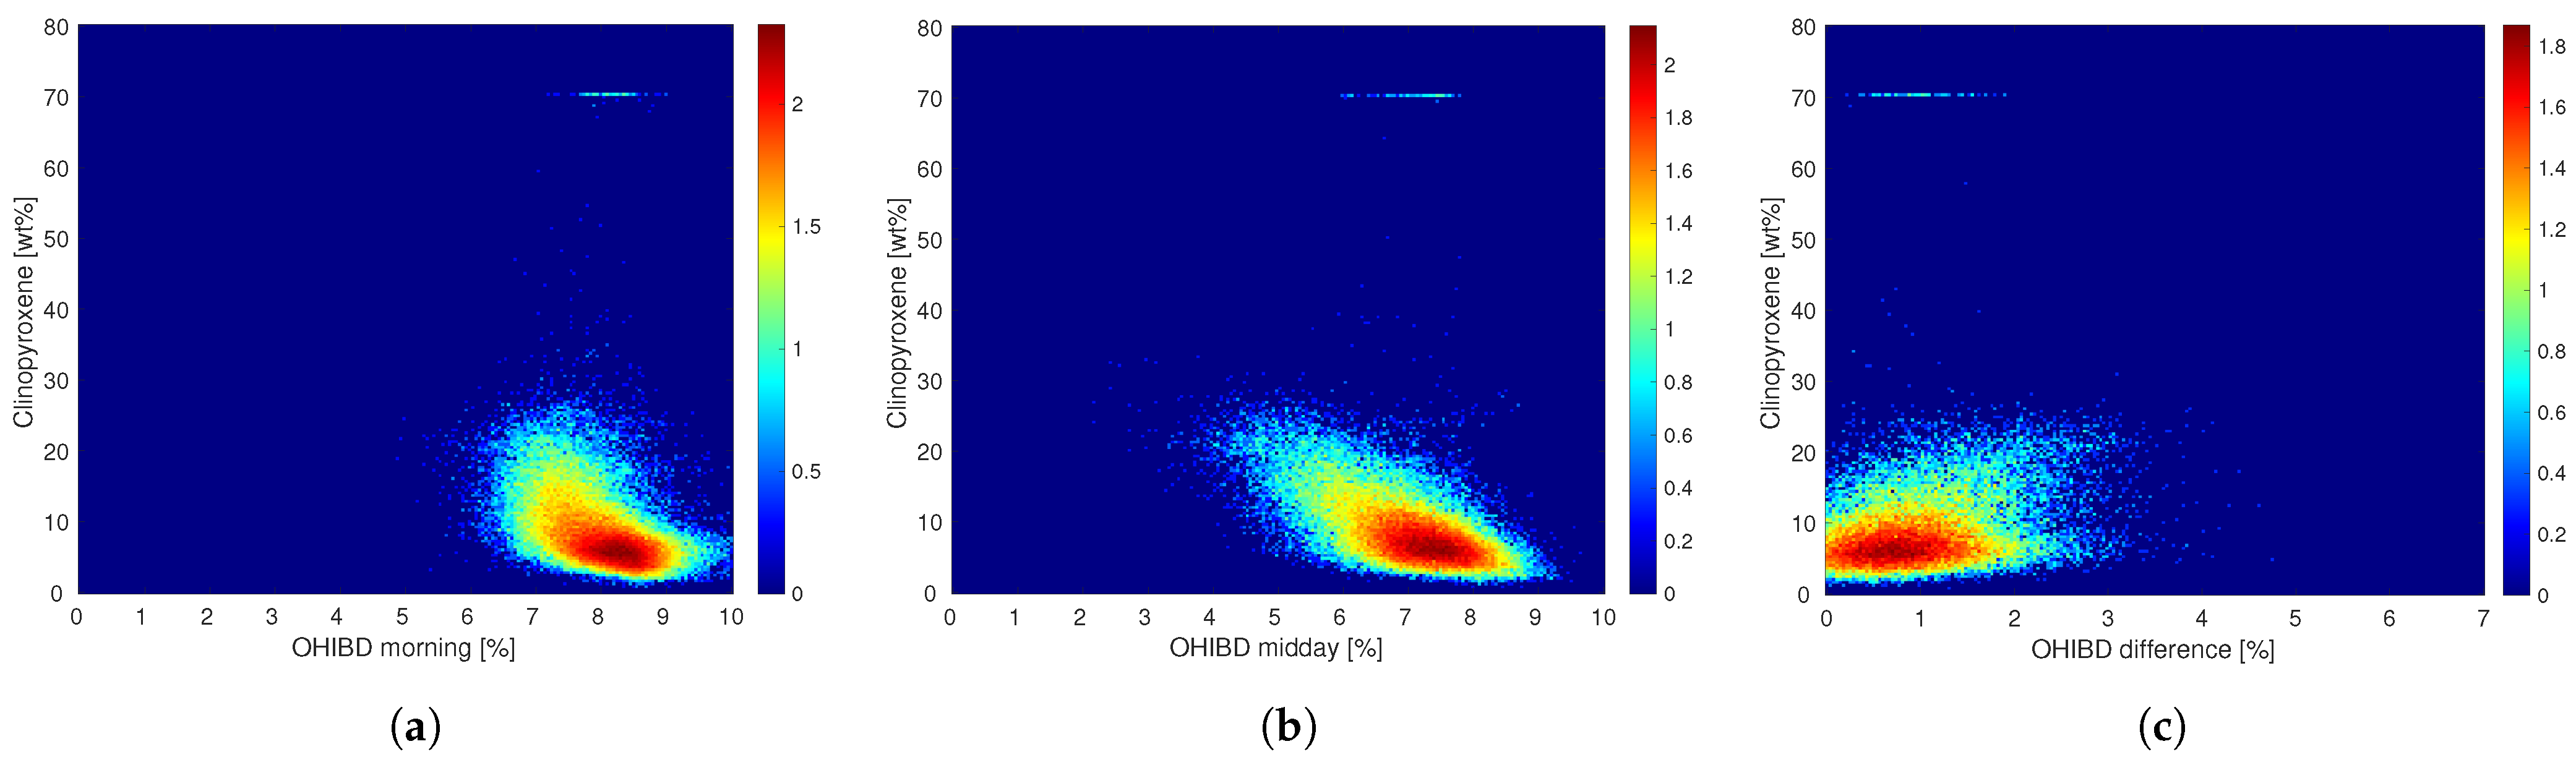
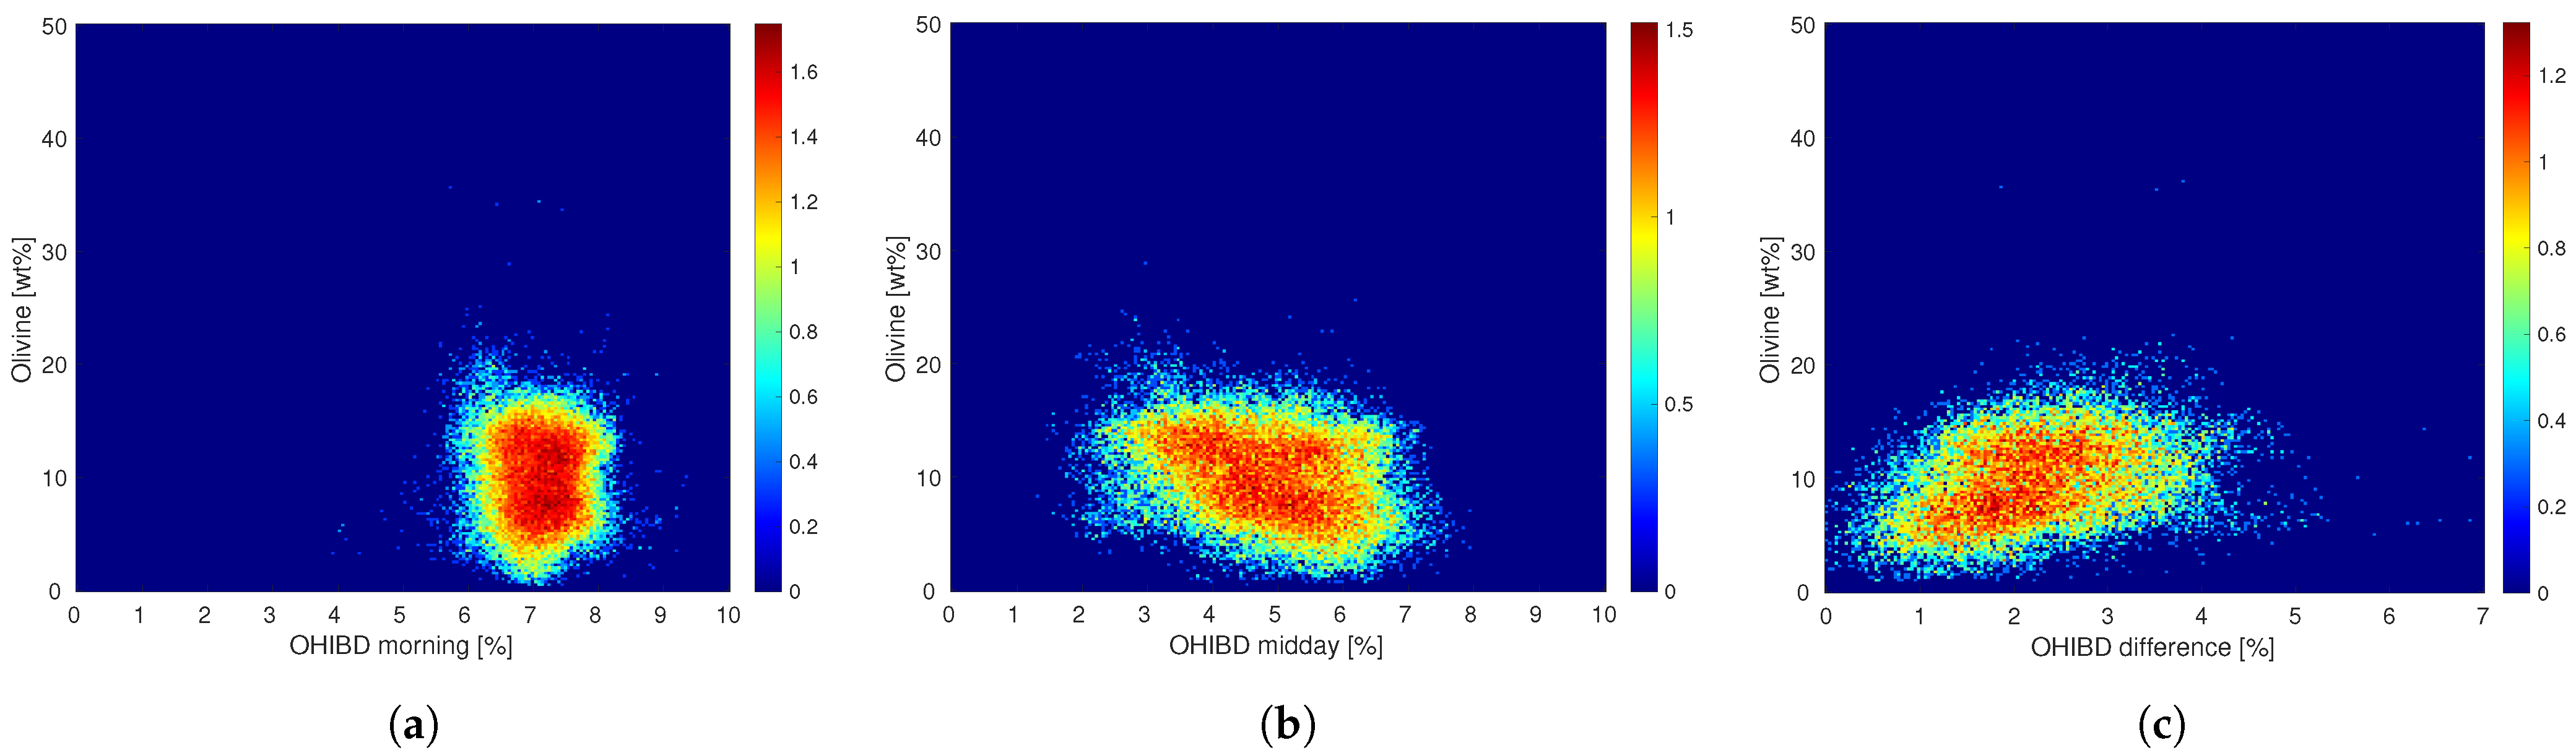
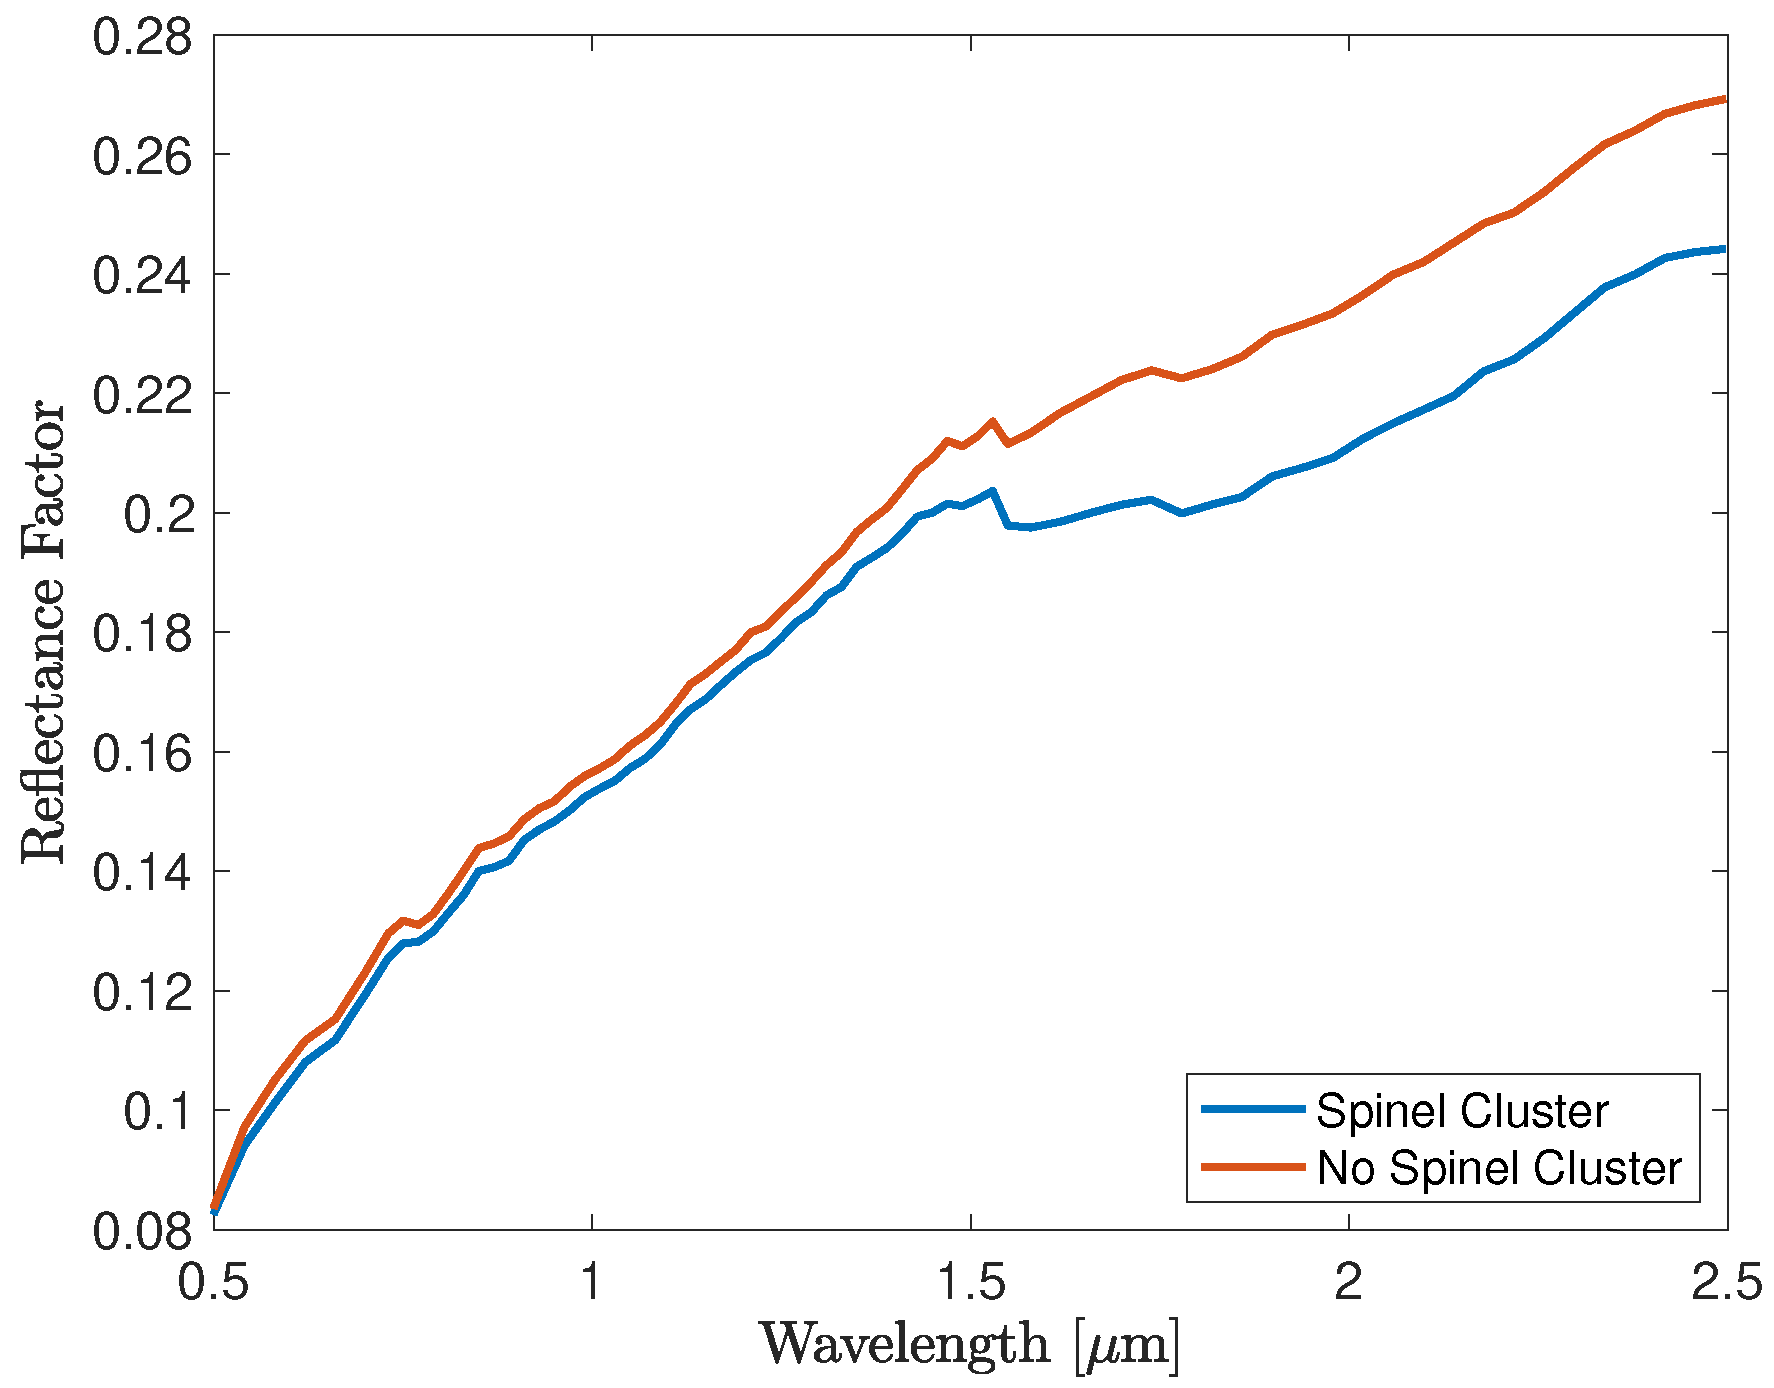
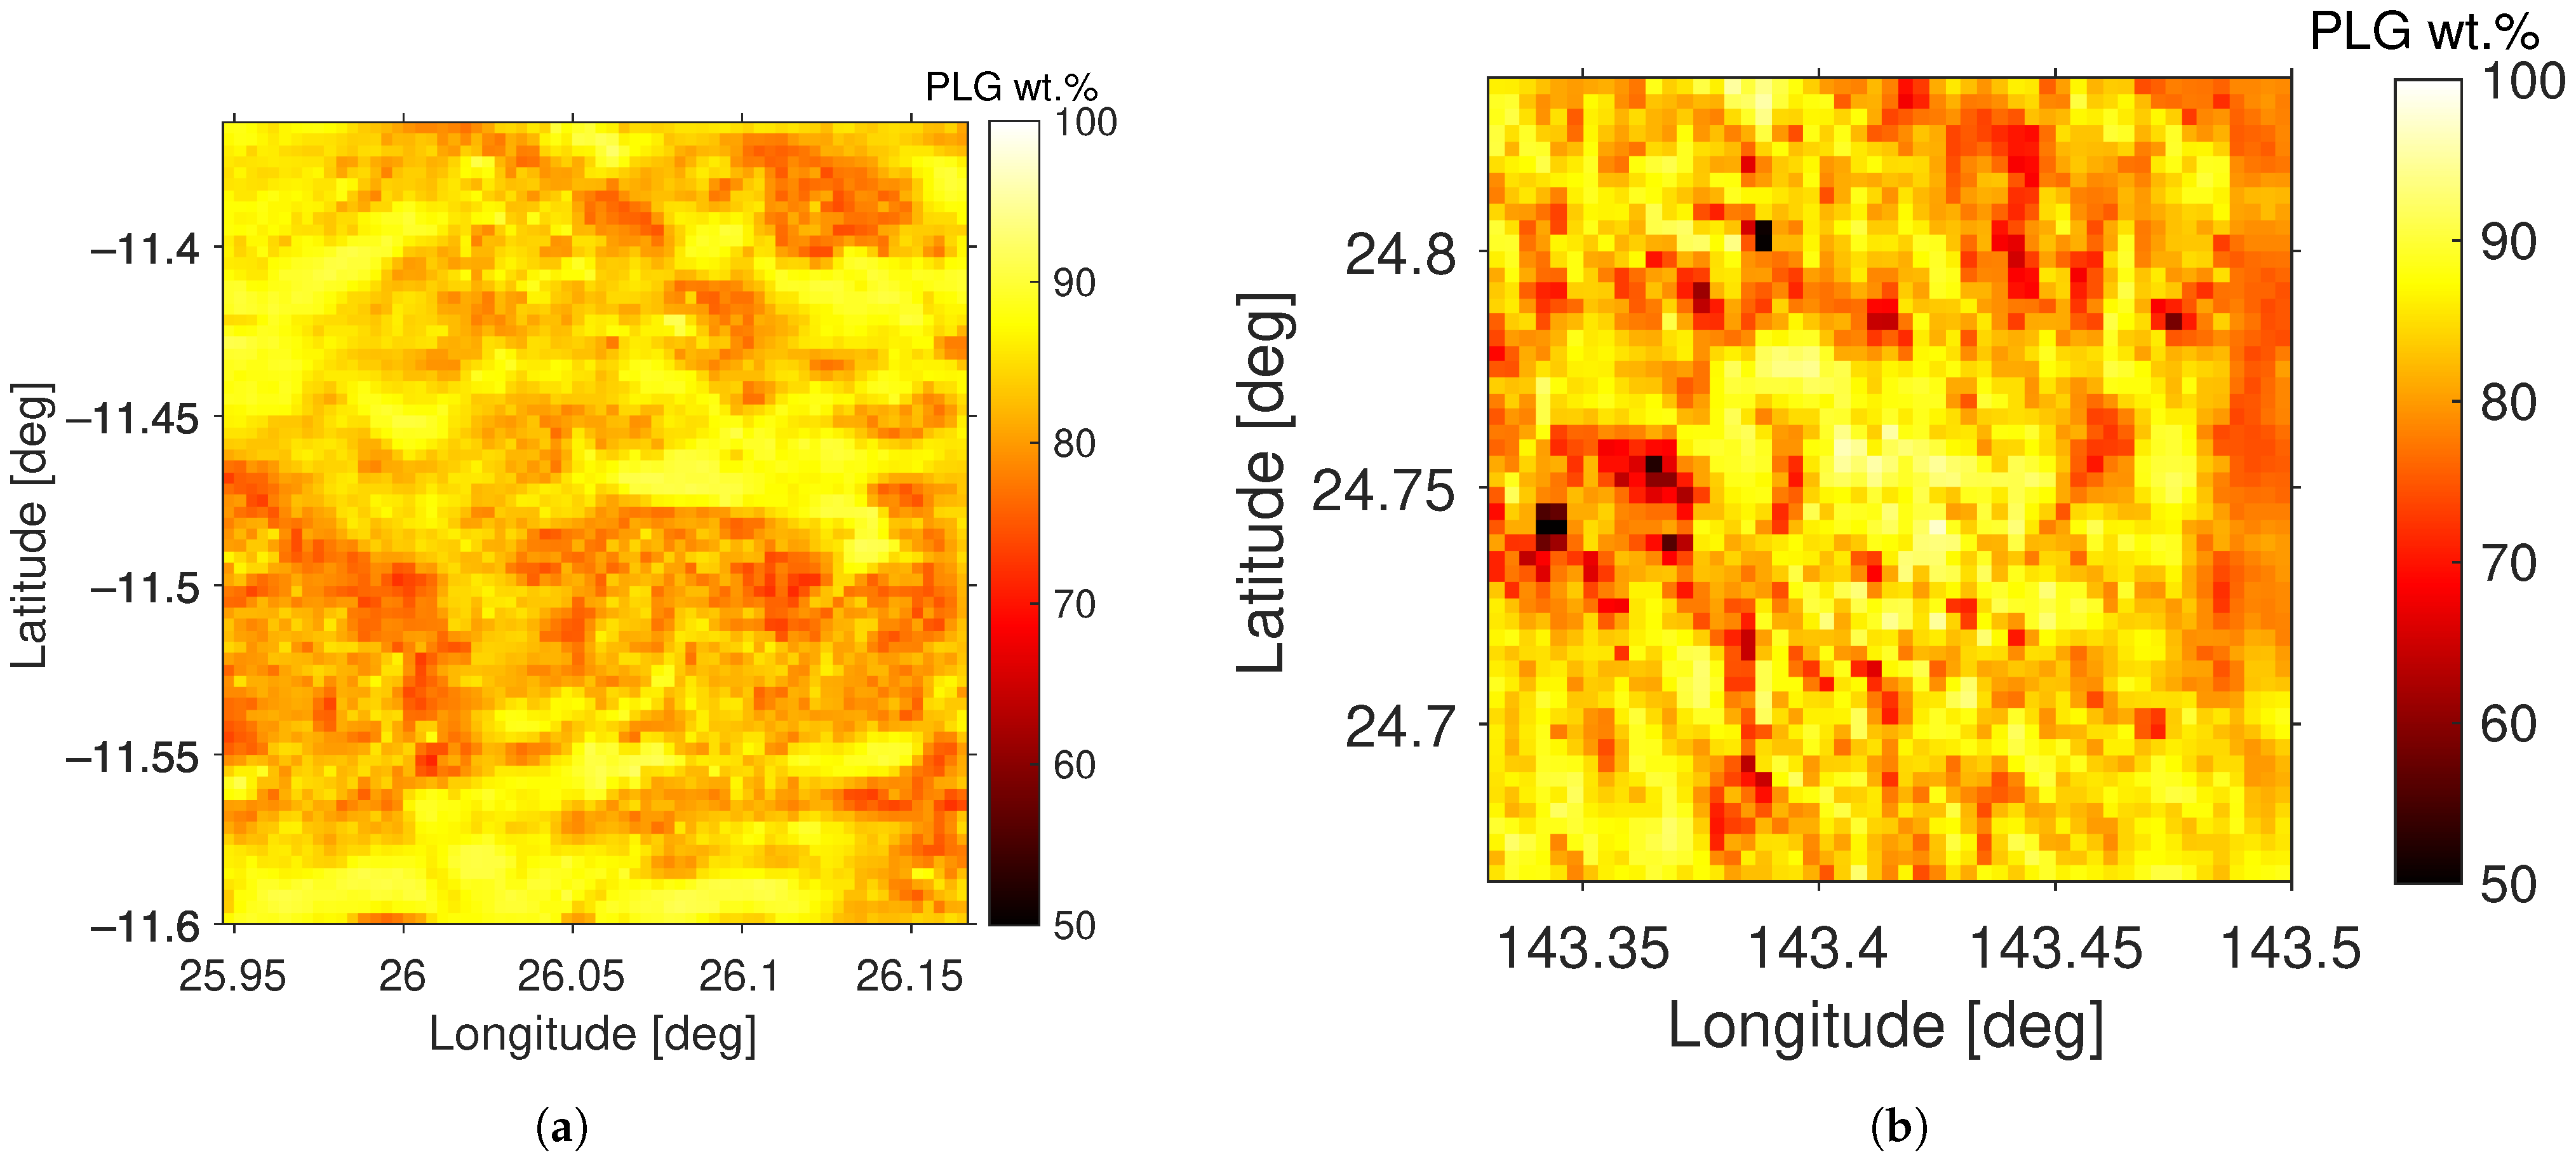
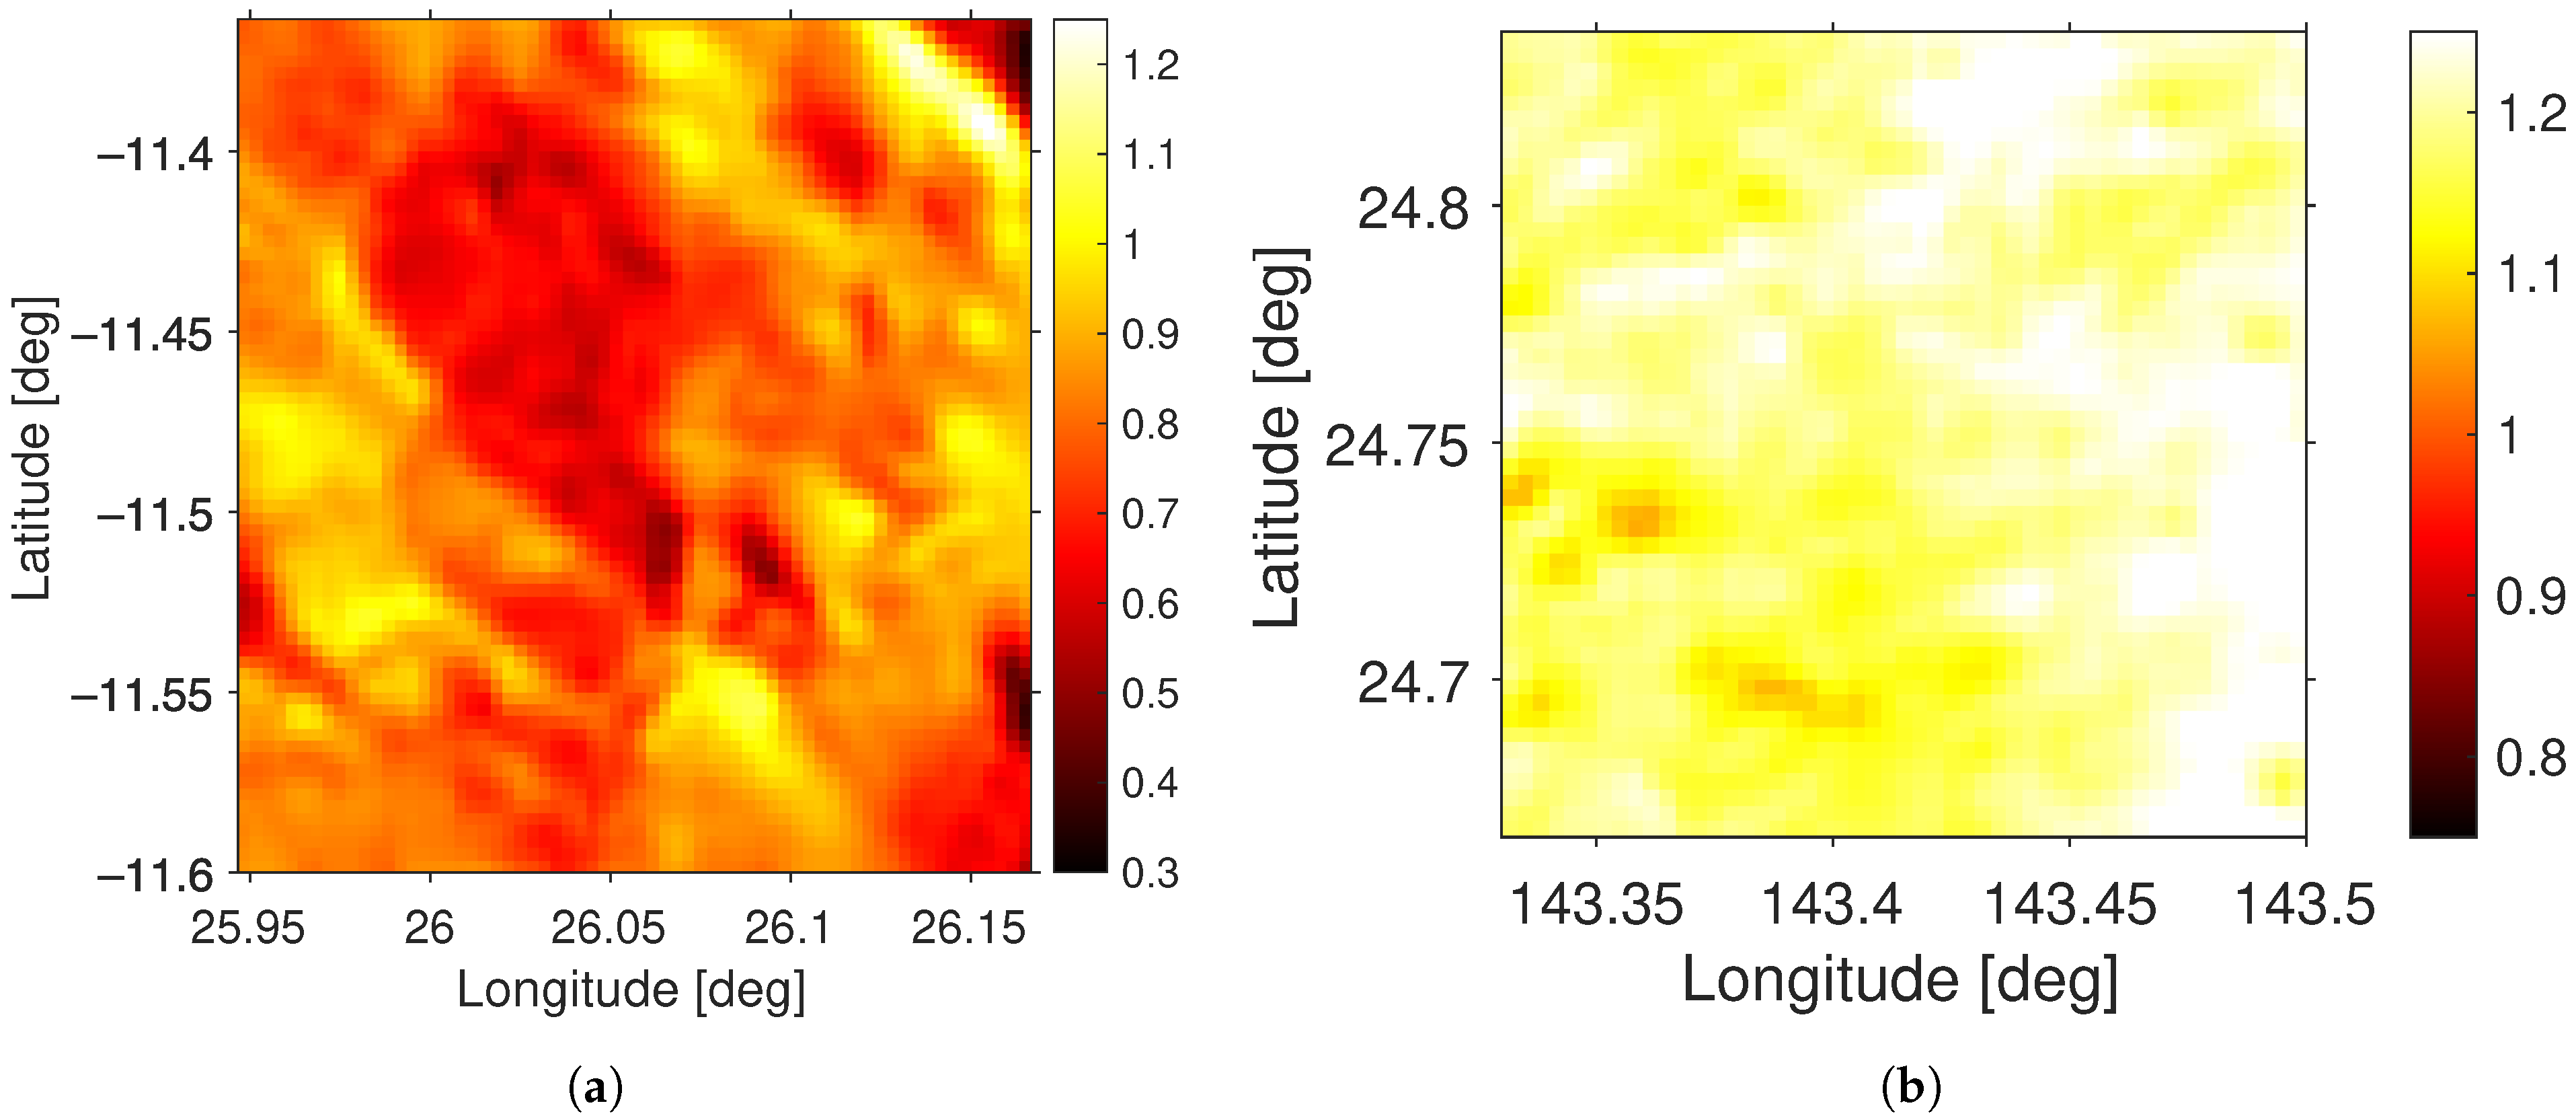
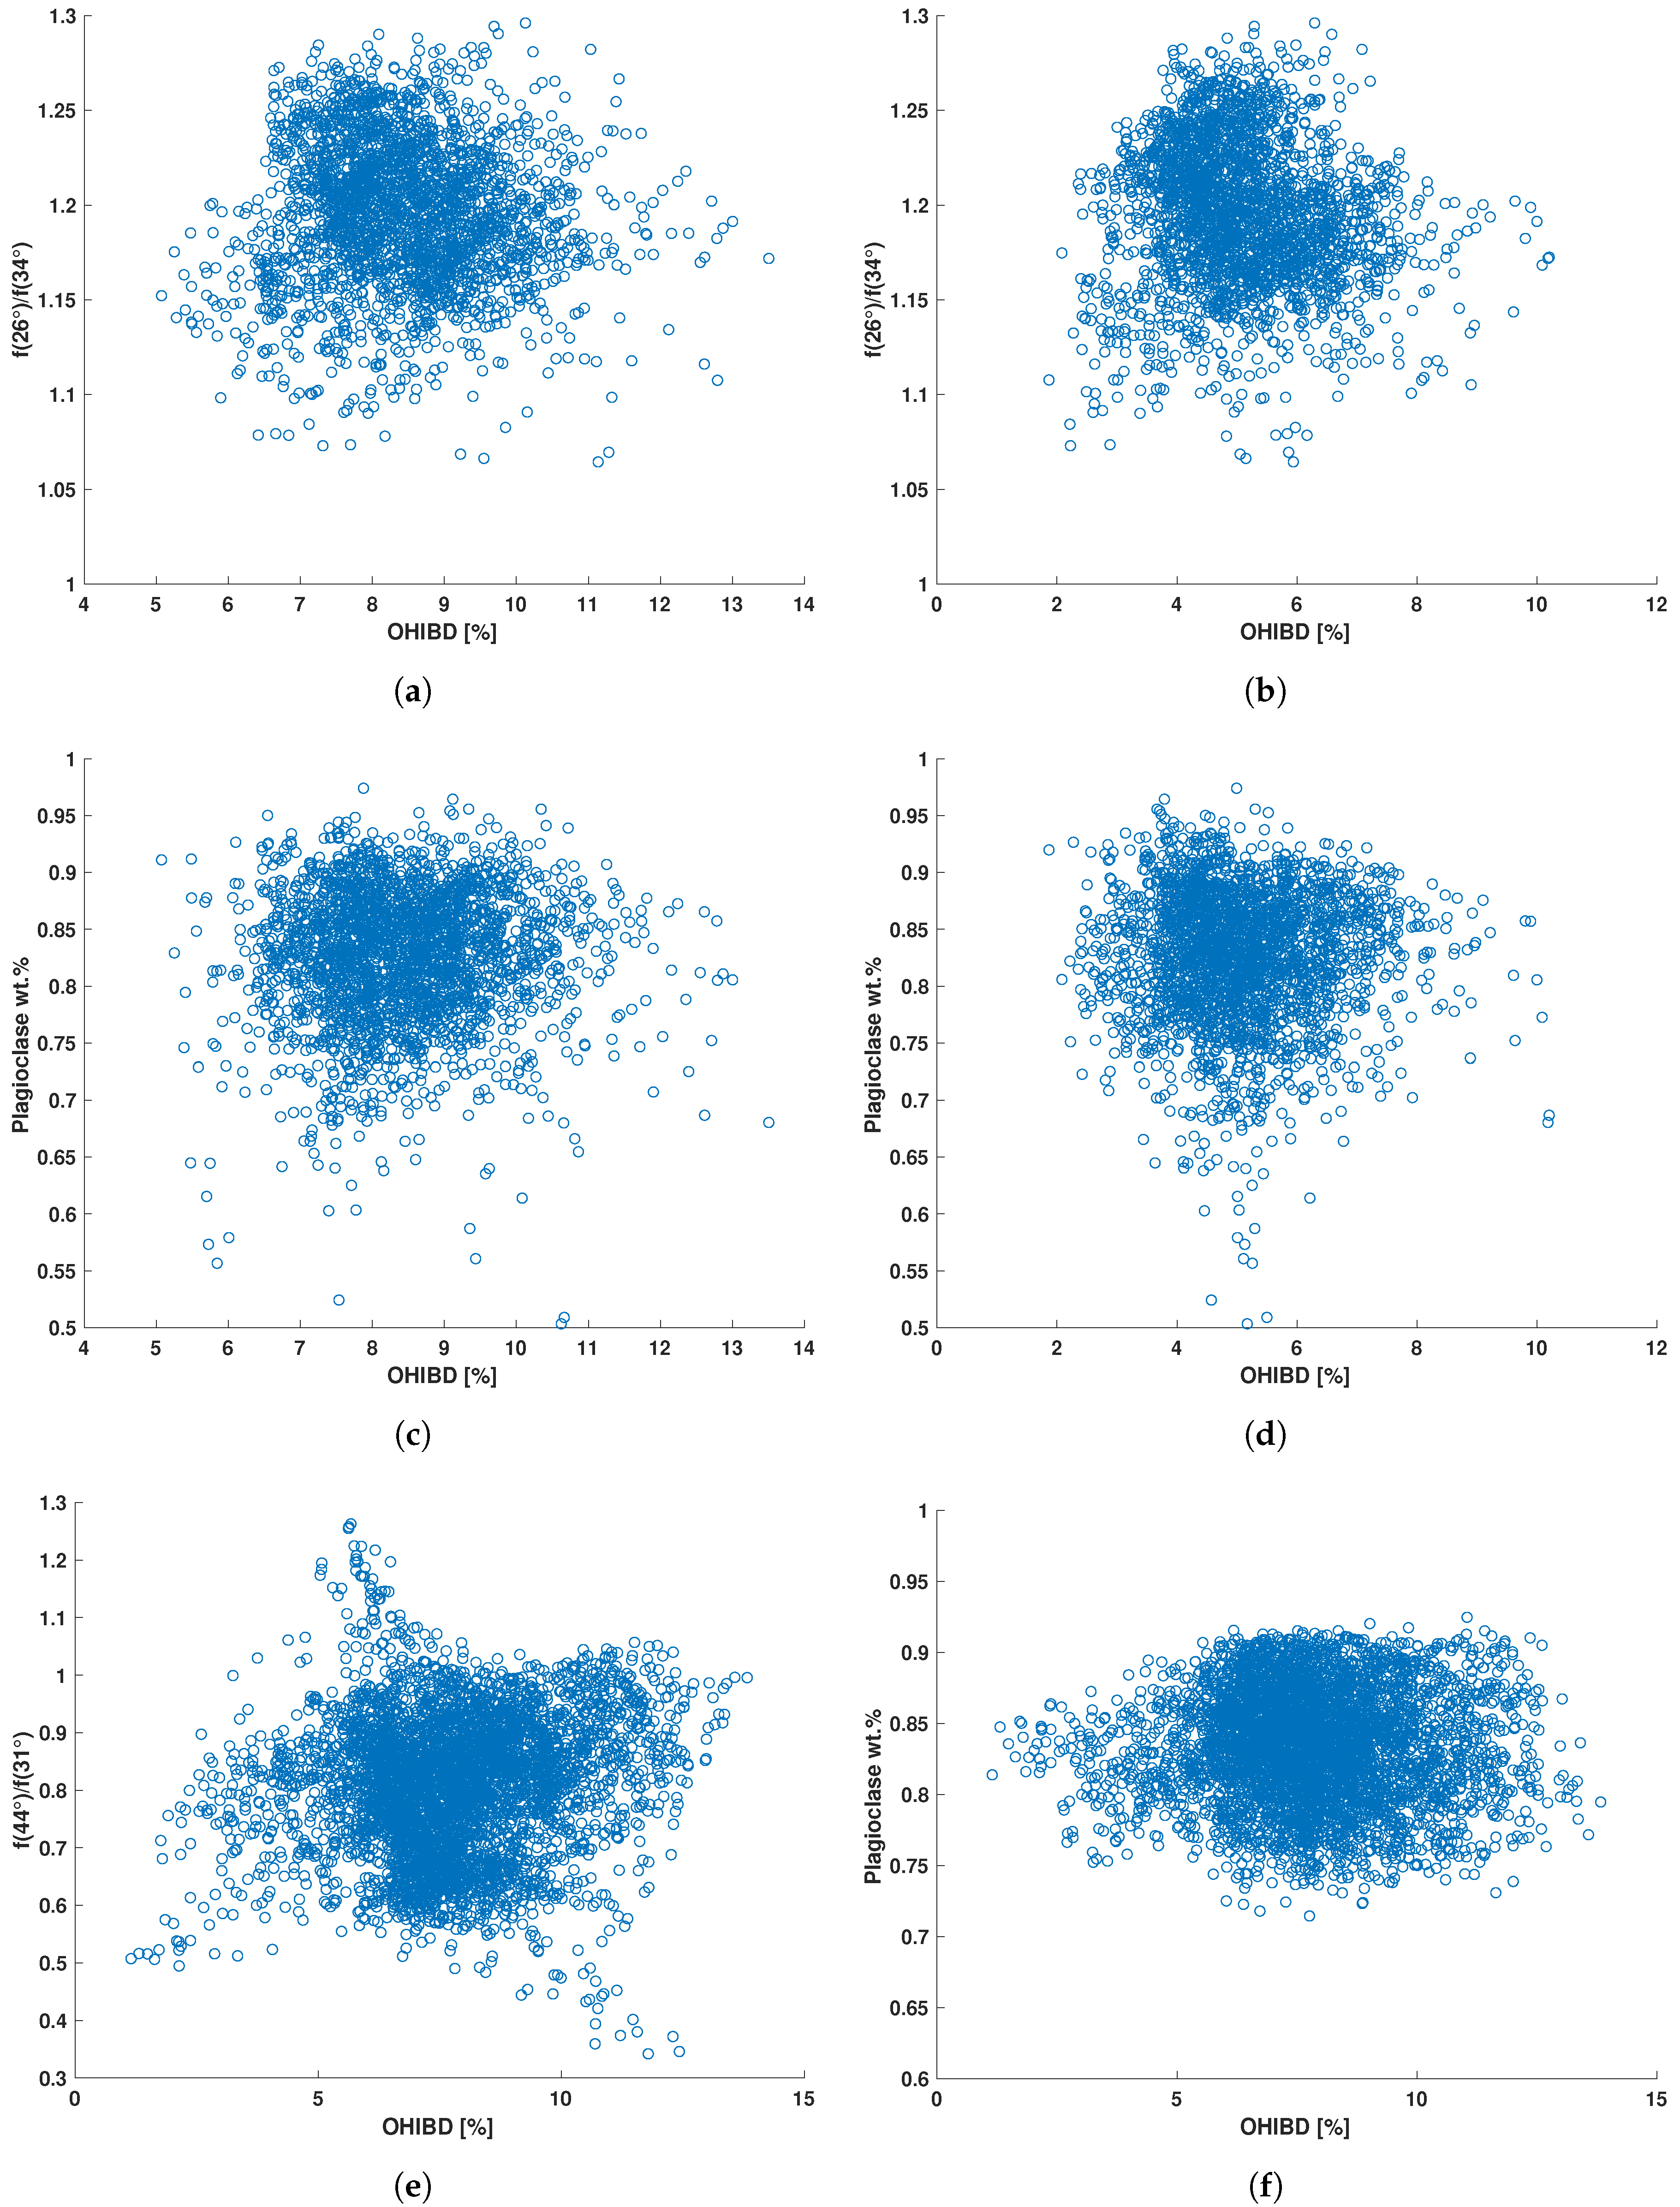
Table 1.
Correlation coefficients r for the dependence of OHIBD on the abundances of the major minerals on the surface of the Moon.
Table 1.
Correlation coefficients r for the dependence of OHIBD on the abundances of the major minerals on the surface of the Moon.
| Mineral | Mare | Highland | ||||
|---|---|---|---|---|---|---|
| Morning | Midday | Difference | Morning | Midday | Difference | |
| TiO (Ilmenite) | −0.30 | −0.71 | 0.43 | |||
| Plagioclase | 0.20 | 0.65 | −0.54 | 0.49 | 0.65 | −0.34 |
| Olivine | −0.08 | −0.33 | 0.29 | |||
| Orthopyroxene | −0.07 | −0.36 | 0.33 | −0.55 | −0.67 | 0.30 |
| Clinopyroxene | −0.22 | −0.50 | 0.37 | −0.34 | −0.46 | 0.24 |
Table 2.
Correlation coefficients r for the spinel-rich regions. Dependence of the OHIBD value on the different factors.
Table 2.
Correlation coefficients r for the spinel-rich regions. Dependence of the OHIBD value on the different factors.
| Theophilus | Mare Moscoviense | ||
|---|---|---|---|
| 08:45 Local Time | 09:20 Local Time | 11:15 Local Time | |
| NLBD > 0.3 (spinel) | −0.436 | −0.295 | −0.563 |
| NLBD < 0.3 (no spinel) | −0.385 | 0.043 | −0.195 |
| Phase ratio | 0.126 | 0.043 | 0.096 |
| Plagioclase | 0.022 | 0.055 | 0.019 |
Publisher’s Note: MDPI stays neutral with regard to jurisdictional claims in published maps and institutional affiliations. |
© 2021 by the authors. Licensee MDPI, Basel, Switzerland. This article is an open access article distributed under the terms and conditions of the Creative Commons Attribution (CC BY) license (https://creativecommons.org/licenses/by/4.0/).
Share and Cite
MDPI and ACS Style
Hess, M.; Wöhler, C.; Berezhnoy, A.A.; Bishop, J.L.; Shevchenko, V.V. Dependence of the Hydration of the Lunar Surface on the Concentrations of TiO2, Plagioclase, and Spinel. Remote Sens. 2022, 14, 47. https://doi.org/10.3390/rs14010047
AMA Style
Hess M, Wöhler C, Berezhnoy AA, Bishop JL, Shevchenko VV. Dependence of the Hydration of the Lunar Surface on the Concentrations of TiO2, Plagioclase, and Spinel. Remote Sensing. 2022; 14(1):47. https://doi.org/10.3390/rs14010047
Chicago/Turabian StyleHess, Marcel, Christian Wöhler, Alexey A. Berezhnoy, Janice L. Bishop, and Vladislav V. Shevchenko. 2022. "Dependence of the Hydration of the Lunar Surface on the Concentrations of TiO2, Plagioclase, and Spinel" Remote Sensing 14, no. 1: 47. https://doi.org/10.3390/rs14010047
Note that from the first issue of 2016, this journal uses article numbers instead of page numbers. See further details here.