Technical Note

Evidence of Climate Change Based on Lake Surface Temperature Trends in South Central Chile

by
Arnaldo Collazo Aranda
1,
Daniela Rivera-Ruiz
2,
Lien Rodríguez-López
3,*,
Pablo Pedreros
1,4,
José Luis Arumí-Ribera
2,4,
Luis Morales-Salinas
5,
Guillermo Fuentes-Jaque
5 and
Roberto Urrutia
1,4
1
Faculty of Environmental Sciences and EULA Chile Centre, Department of Aquatic Systems, Universidad de Concepción, Concepción 4089100, Chile
2
Department of Water Resources, Faculty of Agricultural Engineering, Universidad de Concepción, Chillan 3780000, Chile
3
Facultad de Ingeniería y Tecnología, Universidad San Sebastián, Lientur 1457, Concepción 4030000, Chile
4
Centro de Recursos Hídricos para la Agricultura y la Minería (CRHIAM), Universidad de Concepción, Concepción 4089100, Chile
5
Agriculture Sciences Faculty, University of Chile, Av. Santa Rosa, Santiago 11315, Chile
*
Author to whom correspondence should be addressed.
Remote Sens. 2021, 13(22), 4535; https://doi.org/10.3390/rs13224535
Submission received: 29 September 2021 / Revised: 29 October 2021 / Accepted: 5 November 2021 / Published: 11 November 2021
(This article belongs to the Section Environmental Remote Sensing)

Abstract

:
Lake temperature has proven to act as a good indicator of climate variability and change. Thus, a surface temperature analysis at different temporal scales is important, as this parameter influences the physical, chemical, and biological cycles of lakes. Here, we analyze monthly, seasonal, and annual surface temperature trends in south central Chilean lakes during the 2000–2016 period, using MODIS satellite imagery. To this end, 14 lakes with a surface area greater than 10 km2 were examined. Results show that 12 of the 14 lakes presented a statistically significant increase in surface temperature, with a rate of 0.10 °C/decade (0.01 °C/year) over the period. Furthermore, some of the lakes in the study present a significant upward trend in surface temperature, especially in spring, summer, and winter. In general, a significant increase in surface water temperature was found in lakes located at higher altitudes, such as Maule, Laja and Galletué lakes. These results contribute to the provision of useful data on Chilean lakes for managers and policymakers.

Graphical Abstract

1. Introduction

Inland water ecosystems provide multiple ecosystem services and are vital for human consumption, irrigation, sanitation, transportation, recreation, culture, and industry [1]. In recent decades, these ecosystems have experienced high stress from various human impacts as well as climate change [2,3]. Researchers around the world have evaluated lake surface water temperature (LSWT) trends and have found variable increases in water temperatures. In many cases, these changes have been attributed to global warming and increases in air temperatures [4,5,6,7,8]. Recently, Jane et al. [9], studied the deoxygenation of temperate lakes, using more than 45,000 oxygen and temperature profiles collected from nearly 400 lakes. The main results indicated that oxygen levels declined by 5.5% at the surface and that surface temperatures increased by 0.38 °C/decade [9]. These studies have mainly used data records from the Northern Hemisphere; there are fewer observational records or satellite-based studies related to LSWT trends in the Southern Hemisphere, such that they are less well understood than LSWT trends in Northern Hemisphere lakes.
Water temperature is a key factor in aquatic ecosystems, as it directly or indirectly regulates physicochemical processes and reactions that occur within them [10,11]. This abiotic factor sets constraints on the type of organisms that can exist in each ecosystem, as the biotic components of the environment, from microorganisms to larger animals, such as fish, have adapted to thrive at varying temperature levels [12,13]. In lake systems, surface temperature dynamics and variability are controlled by heat exchange at the air–water interface, since it regulates the radiative balance between the atmosphere and the lake surface [8,14]. Climatic forcing also influences this process through solar radiation, cloud cover, wind speed, and air temperature, as do specific geomorphological factors for each lake such as, depth, mixing layer depth, surface area, and light attenuation in the water column [15,16,17]. Nevertheless, Sharma et al. [18], reports that climatic factors and a wide spatial scale play a more significant role than morphological parameters in regulating LSWT. In this context and considering that air temperature patterns have changed over time due to global warming, this study proposes that LSWT has also changed, due to the high correlation between the two variables [19].
LSWT data is usually obtained through traditional in situ monitoring, which is often impeded by geographically complex locations, and limited human and economic resources. Furthermore, traditional methods impose spatial and temporal limitations, which complicate the study of climate change, the hydrological cycle, habitats of aquatic organisms, aquiculture, fishing, and water quality management practices [20,21]. However, in recent decades, the observation of Earth though satellite imagery has offered a complementary and alternative method for the monitoring of LSWT at a higher spatial and temporal resolution. Thus, the Moderate Resolution Imaging Spectroradiometer (MODIS) has proven to be a valuable satellite product for estimating LSWT due to its temporal, spatial, spectral, and radiometric resolution [22]. Several studies [5,22,23,24], have shown that MODIS thermal bands allow for successful measurement of LSWT in inland water systems. Although, historical data is available for a limited number of lakes in Chile, many have not been monitored continuously, making these observations inadequate for climate modelling [25]. The General Water Directorate has a monitoring network covering only 20 of the 375 lakes in the country [26], therefore, MODIS satellite imagery can be an important resource to fill the information gap, amid a lack of continuous historical data [6,27,28].
Considering the potential of satellite-based observations, LSWT trends can serve in the monitoring, assessment, and implementation of adaptation practices in vulnerable lentic ecosystems. This study recognizes the benefits of satellite imagery products for local, regional, and national scale development and growth [6,8,29]. The aim of this investigation was to analyze the spatial and temporal trends and behavior of LSWT in 14 south central Chilean lakes, between 2000 and 2016, using MODIS satellite imagery. This research will contribute to the provision of useful data on Chilean lakes for managers and policy-makers.

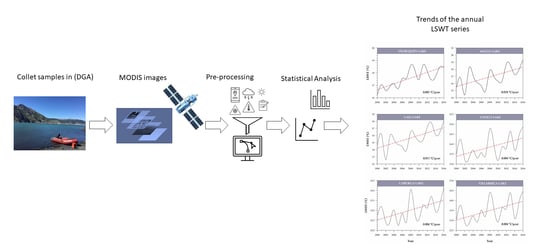
2. Materials and Methods
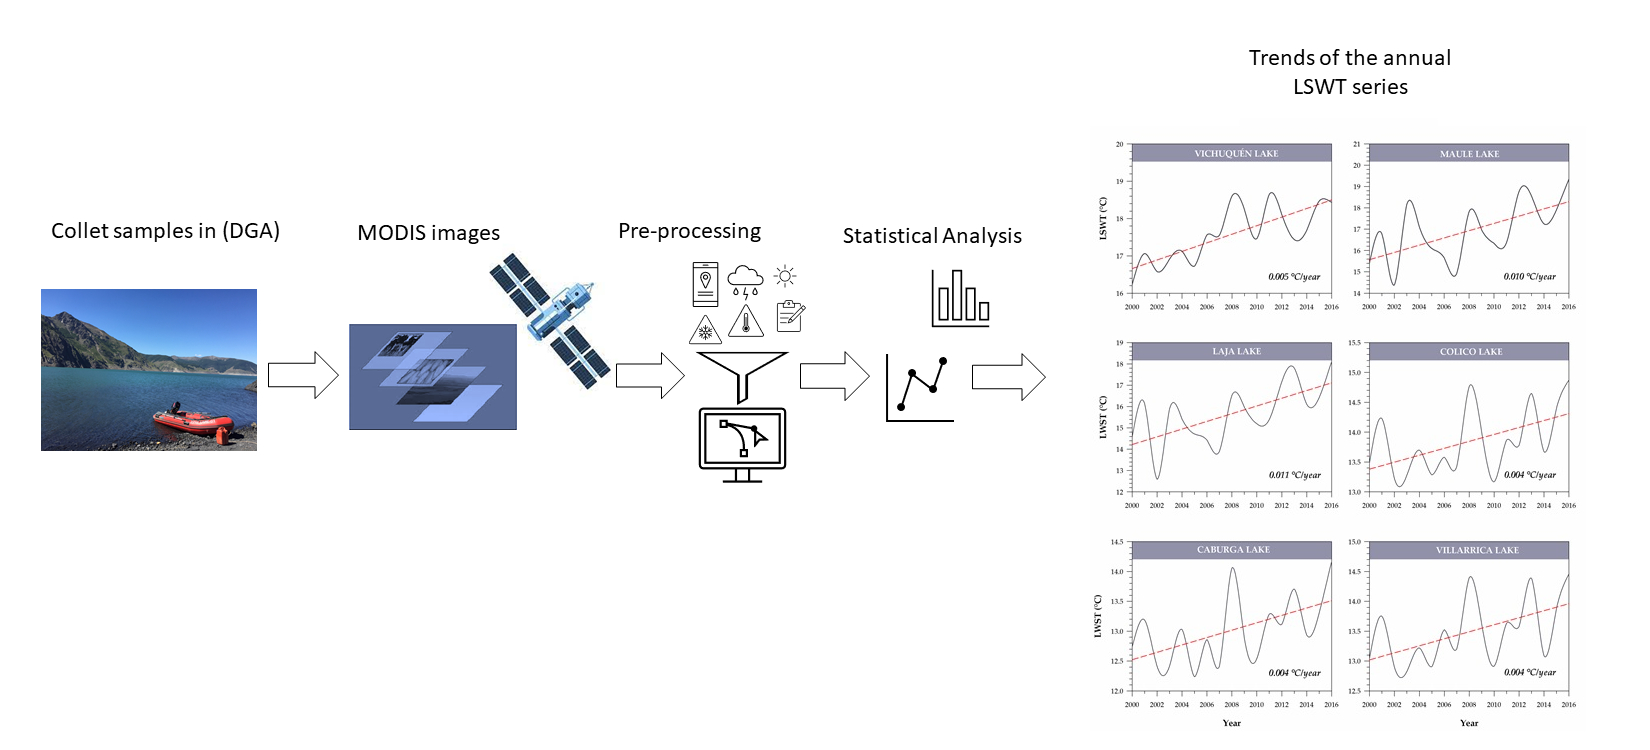
2.1. Study Area

The study area is distributed across four regions: Maule, Bío-Bío, Araucanía, and Los Ríos, located between latitudes 34° and 40° and longitudes 70° and 73° in south central Chile. The total area of these regions is approximately 104,500 km2, of which 860 km2 (18%) comprises the inland water bodies selected in this study (Figure 1). The climate in this area is Mediterranean, with drought during the summer season, and a progressive increase in precipitations towards the South. The ecological regions in south central Chile are Mediterranean, arid, semi-arid, and sub-humid, humid, and hyper-humid [30]. In accord with the Köppen–Geiger classification [31], south central Chile has a predominantly Mediterranean climate with winter rains (Csb-Csb), and a Mediterranean climate with winter rains and coastal influence (Csb). Summers are hot, arid, and clear, and winters are cold. The average annual temperature is 12.7 °C, the warmest month is January, with a temperature of 18.8 °C, and the coldest month is July, with a temperature of 7 °C, according to mean data provided by the Climate and Resilience Research Center (CR2, http://www.cr2.cl/ accessed on 25 November 2020). The central region is characterized as semi-arid, with average annual precipitation of 100–500 mm in the central valley, concentrated in the austral winter (June–August) [32]. It has a long dry season of 7–8 months with high global radiation [33], low relative humidity and high temperatures from September to April.
Lakes with a surface area ≥10 km2 were selected based on [6]. The 14 selected lakes present a temperate monomictic circulation pattern, with thermal stratification during summer [34,35,36,37]. At present, 11 of the lakes chosen in this study are oligotrophic, while Villarrica has been classified as meso-oligotrophic, and Vichuquén and Lanalhue, as eutrophic [38]. Geographical and morphometric characteristics that affect LSWT, such as, location, elevation, surface area, perimeter, volume and mean and maximum depth, are presented in Table 1 [39].

2.2. In Situ Parameters

The lake surface temperature was obtained through the free web-based hydrometeorological service made available online (http://www.dga.cl/servicioshidrometeorologicos/access) (accessed on 15 October 2020) by the Dirección General de Aguas (DGA) (accessed on 15 October 2020). This downloadable database is available for 16 lakes that are part of the Red Mínima de Lagos (RML), in which Laja, Lanalhue, Caburga, Villarrica, Calafquén, Panguipulli and Riñihue lakes are included, and measured seasonally for the 2000–2014 period, while for Riñihue lake, data is available until 2015 [25]. The database was validated by POCH Ambiental S.A. in the report Redefinición de la Red Mínima de Lagos [40]. Colico, Lleulleu and Vichuquén lakes were later incorporated into the RML in 2013 [25]. The surface temperature of all lakes was obtained in situ used a portable multiparameter device Hydrolab DS5x. This measurement was taken between 09:00 and 15:00 at a depth of ~50 cm.

2.3. MODIS Satellite Imagery

2.3.1. Acquisition of Images

A total of 774 MODIS images were processed from 18 February 2000 (Julian day 49) to 26 December 2016 (Julian day 361). This study used the database of thermal infrared imagery with high spatial resolution (1 km) using a split-window algorithm designed for a wide variety of land cover types including inland water surfaces, satellite viewing angles, and atmospheric conditions from sensors aboard the TERRA satellite, specifically, version 6 of the MOD11A2_LST product from the Land Processes Distributed Active Archive Center (LP DAAC) available at: https://lpdaac.usgs.gov/dataset_discovery/modis/modis_products_table, which was downloaded from the NASA Earth Observing System Data and Information System (EOSDIS) [41] (accessed on 10 October 2020).

2.3.2. Pre-Processing of MODIS Images

For the pre-processing, daytime images (local time for the MODIS satellite overpass is approximately 10:30 a.m.) were reprojected to WSG84 19S using R Studio, which was achieved through an original sinusoidal reprojection (R Development Core Team 2016) [42]. In total, from a spatial resolution of 1 km and a temporal resolution of 8 days, 46 samples were attained for 8 days. The original scenes in HDF format were converted to raster GeoTIFF format and the pixels contaminated by cloud cover were replaced by null values and then visual inspection was used to remove cloud-contaminated images. Consequently, there are large LST spatial-temporal gaps over the studied lakes especially during winter due to the high percentage of cloud cover. We used images with less than 9% cloud cover. Monthly mean values from the pixel centroids for each lake were obtained to produce LSWT the time_series for the study area and period.

2.4. Statistical Analysis

2.4.1. Linear Fit between MODIS and In Situ Data

For the validation process, a least squares linear fit was applied to find the relationship between the surface water temperature acquired by processing MODIS images and in situ data. Errors in satellite derived LSWT may arise from instrument noise and drift, sun glint, residual cloud contamination (e.g., thin cirrus), misspecification of atmospheric attenuation and surface emissivity effects [43]. There are two important components of the skin–water temperature differences: the cool skin and the warm layer. The cool skin is always present at the air–water interface and refers to a systematic cool bias of the water skin temperature (0.1–0.6 °C) compared to that of the water less than 1 cm below [44]. Data was analysis in three temporal resolutions: monthly, seasonally, and annually measured temperatures. To quantify estimation errors, basic statistical analysis such as the coefficient of determination (R2), root mean square error (RMSE) and mean absolute error (MAE) were used.

2.4.2. Trend Analysis of Time Series

To estimate LSWT trends in the time series (2000–2016), the Mann–Kendall non-parametric test was applied [45,46]. The Mann–Kendall test is a statistical test widely used for the analysis of trend in climatology and in hydrologic time series. One benefit of this test is that the data need not conform to any distribution [47].
Trend were tested using the slope estimator based on Kendall’s Tau ( τ ) coefficient [48], and to assess the point of change of the series, the Pettitt test was applied [49]. The Pettitt test identifies whether the historical temperature series are homogenous. It is a non-parametric test that does not require a hypothesis on data distribution. The Pettitt test is adapted from the Mann–Whitney test and based on a range that identifies the moment of a transition (rupture) in the series (Pettitt 1979). The test consists of cutting the main series of N elements into two sets at each time t between 1 and N-1. The main series has a break at time t if the two sub-series have different distributions. This approach has been suggested by the World Meteorological Organization (WMO) of the United Nations [50], for analyzing trends in climatological and hydrological timeseries, and has been applied to an array of studies addressing climate change and variability [46,51,52,53]. Statistical analysis was carried out using R software (R package version 1.1.0. on https://cran.r-project.org/package=trend (accessed on 20 December 2020) [42,54]. Finally, all tests shown in this paper were considered statistically significant at the 5% level.

3. Results

3.1. Validated Results for the Relationship between MODIS LSWT and In Situ LSWT

The MODIS-derived one-meter below surface temperature is essential to validate the MODIS-derived skin temperature against the one-meter below surface temperature from the in situ measurements. Satellite infrared sensors during completely cloud-free conditions only observed the temperature from the immediate surface or “skin” of the water rather than the surface temperature as measured from the in situ in monitoring campaign. The results of the validation between daily MODIS-derived skin temperature and the one-meter below surface temperature measure during satellite overpass in 2000–2016 are presented here. Although not all the lakes had an equal number of in situ data, the results show a high correlation between MODIS LSWT and in situ LSWT, with an R2 coefficient ranging from 0.85 to 0.94 for six of the 14 lakes analyzed in this study (Table 2). The best correlations were obtained for Villarrica lake, with R2 = 0.94. There are currently no studies of LSWT using satellite imagery for most of the lakes. However, [55] and [56] studied the temporal variation of water characteristics of Panguipulli lake using Landsat 5 TM+, Landsat 7 ETM+ and Landsat 8 OLI/TIRS for surface water temperature and other parameters. The LSWT for Panguipulli lake found in this study are similar (R2 = 0.86, RMSE = 1.61 °C and n = 43), as [55] achieved a R2 = 0.86, although with the RMSE = 2.77 °C and n = 21. The results suggest that the processing of MODIS LSWT images and a larger dataset (possibly n = 30 to n = 40), and thus a greater temporal resolution, might be a better alternative for future observations. Furthermore, the results obtained from the MODIS LSWT data in this study expressed in root mean square error (RMSE) were between 1.07 and 1.88 °C. These results are similar to those obtained by Oesch et al. [54], who used AVHRR and MODIS to estimate LSWT in Swiss lakes (RMSE = 0.90–1.60 °C) and Moukomla and Blenken 2016 [57] for Great Lakes in North America (RMSE = 1.24–2.06 °C). Another study [27] using AVHRR, and multiple NOAA satellites achieved an RMSE < 1.50 °C.

3.2. Annual Trend Analysis of MODIS LSWT Timeseries

The trend analysis of the annual MODIS LSWT timeseries detected that only six of the 14 lakes present a significative increase (p < 0.05) (Figure 2). Particular attention should be paid to remote mountain lakes, as they are sensitive recorders of global change, and temperatures in these regions are increasing faster than in adjacent lowland sites [58]. The results of this study are yet another observation of this pattern, as Maule and Laja lakes, which are found at higher altitudes (2166 m a.s.l. and 1390 m a.s.l., respectively) had higher warming rates (0.010 °C/year) than lakes found at lower altitudes. Colico, Caburga and Villarrica lakes, with altitudes between 230 m a.s.l. and 505 m a.s.l., presented an approximate warming rate of 0.004 °C/year. Schneider et al. [5] used ATSR and SST data derived from the AVHRR sensor to observe the rapid warming of inland water bodies globally. The results of this study are similar to those obtained through other methods, including studies using data only available for the Northern Hemisphere.

3.3. Monthly Trend Analysis of MODIS LSWT Time Series

At a monthly scale, significant warming trends in most lakes were found in January, which corresponds to summer in the Southern Hemisphere (Table 3). Warming rates were between 0.007 °C/year to 0.016 °C/year, although Lanalhue and Huilipilún Lakes presented an increasing warming trend, these results were not significant (p-values > 0.05) and were therefore excluded from the results. It bears mentioning that evident warming trends in LSWT in January are consistent with studies of climate change in Chile. New climate trends in Chile are already evident, mainly manifested in changes in rainfall and temperatures across the country. According to [59,60], changes in temperature present upward trends on the ocean and the coast, while there are downward trends in the central valley and the Andes Mountains. A recent study by Vuille et al. [58], identified a similar contrast, highlighting a significant warming trend at inland sites, which is generalized in spring, summer, and autumn in recent decades. As with the annual results, a positive trend in LSWT was observed, particularly in lakes located at higher altitudes (Maule and Laja lakes). Contrasting results were observed in lakes at lower altitudes, consistent with the coastal cooling pattern reported by Chilean climatic studies [59,61,62]. Statistically significant results for the change point were obtained for the month of January for Vichuquén, Maule and Laja lakes (change point in 2011), while Galletué Lake reached the change point in 2007. According to the Pettitt test, change point in Villarrica Lake occurred in 2011. However, p-values obtained are >0.069. Nevertheless, it is interesting that around that time, much attention was given to the lake due to an increased frequency of algal blooms [63,64], the main causes of which were attributed to anthropogenic factors that influenced the water quality of the lake, which resulted in Decree 19 (2013) to protect the environmental quality of the lakes waters [65]. Recent studies indicate that warming trends in lakes, due to global warming, result in increasing oxygen loss that lead to higher phosphorous release from sediments; increasing oxygen depletion in deeper zones of lakes with thermal stratification patters [9]. The same article reported that some lakes present rising oxygen concentration near the surface with increased temperatures, particularly in lakes that have undergone nutrient enrichment from agriculture and urbanization, resulting in algal growth. As both nitrogen and phosphorous are important drivers of cyanobacterial blooms in terms of abundance and dominance, it is possible that the combined effect of higher temperatures and land use/change surrounding the lake is causing blooms. Most studies have focused on the role of nutrient loadings due to human and agricultural activities in water bodies [66]. Based on the results of this study, it can be concluded that the increase in LSWT has contributed to the potentially toxic cyanobacterial blooms in Villarrica Lake. The possible direct links between LSWT and land use and cyanobacterial blooms, need further research.

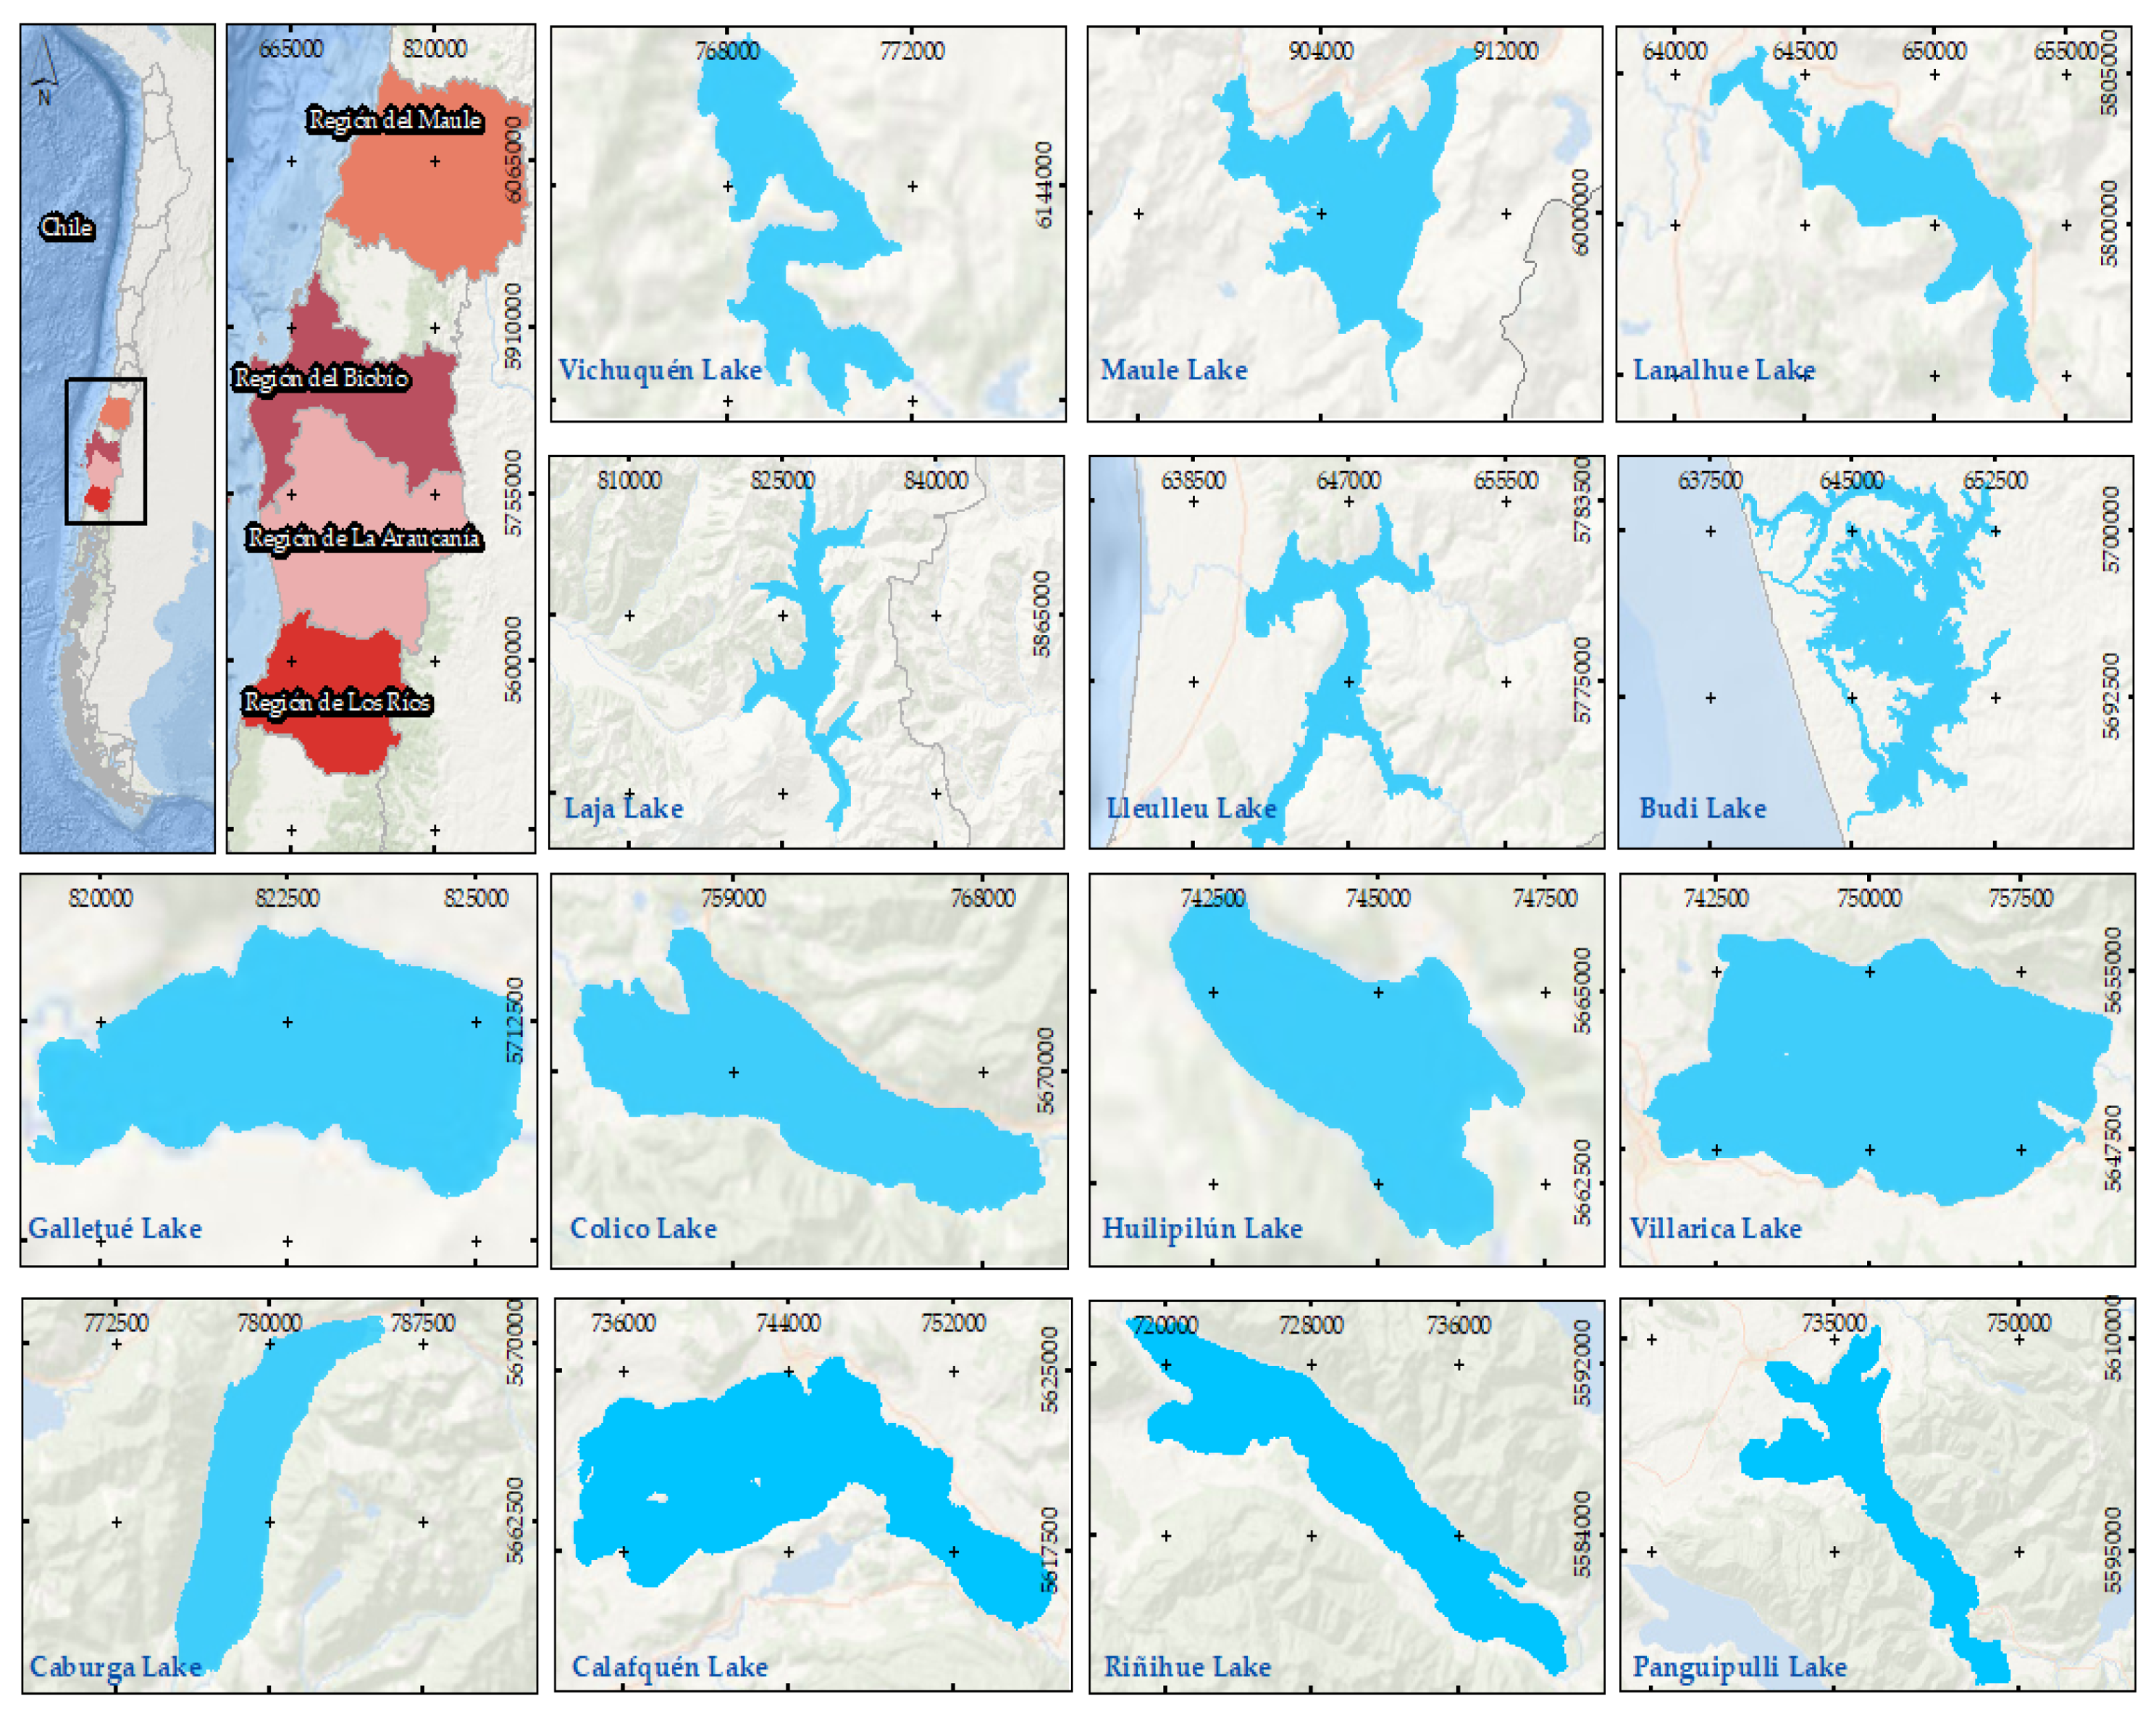
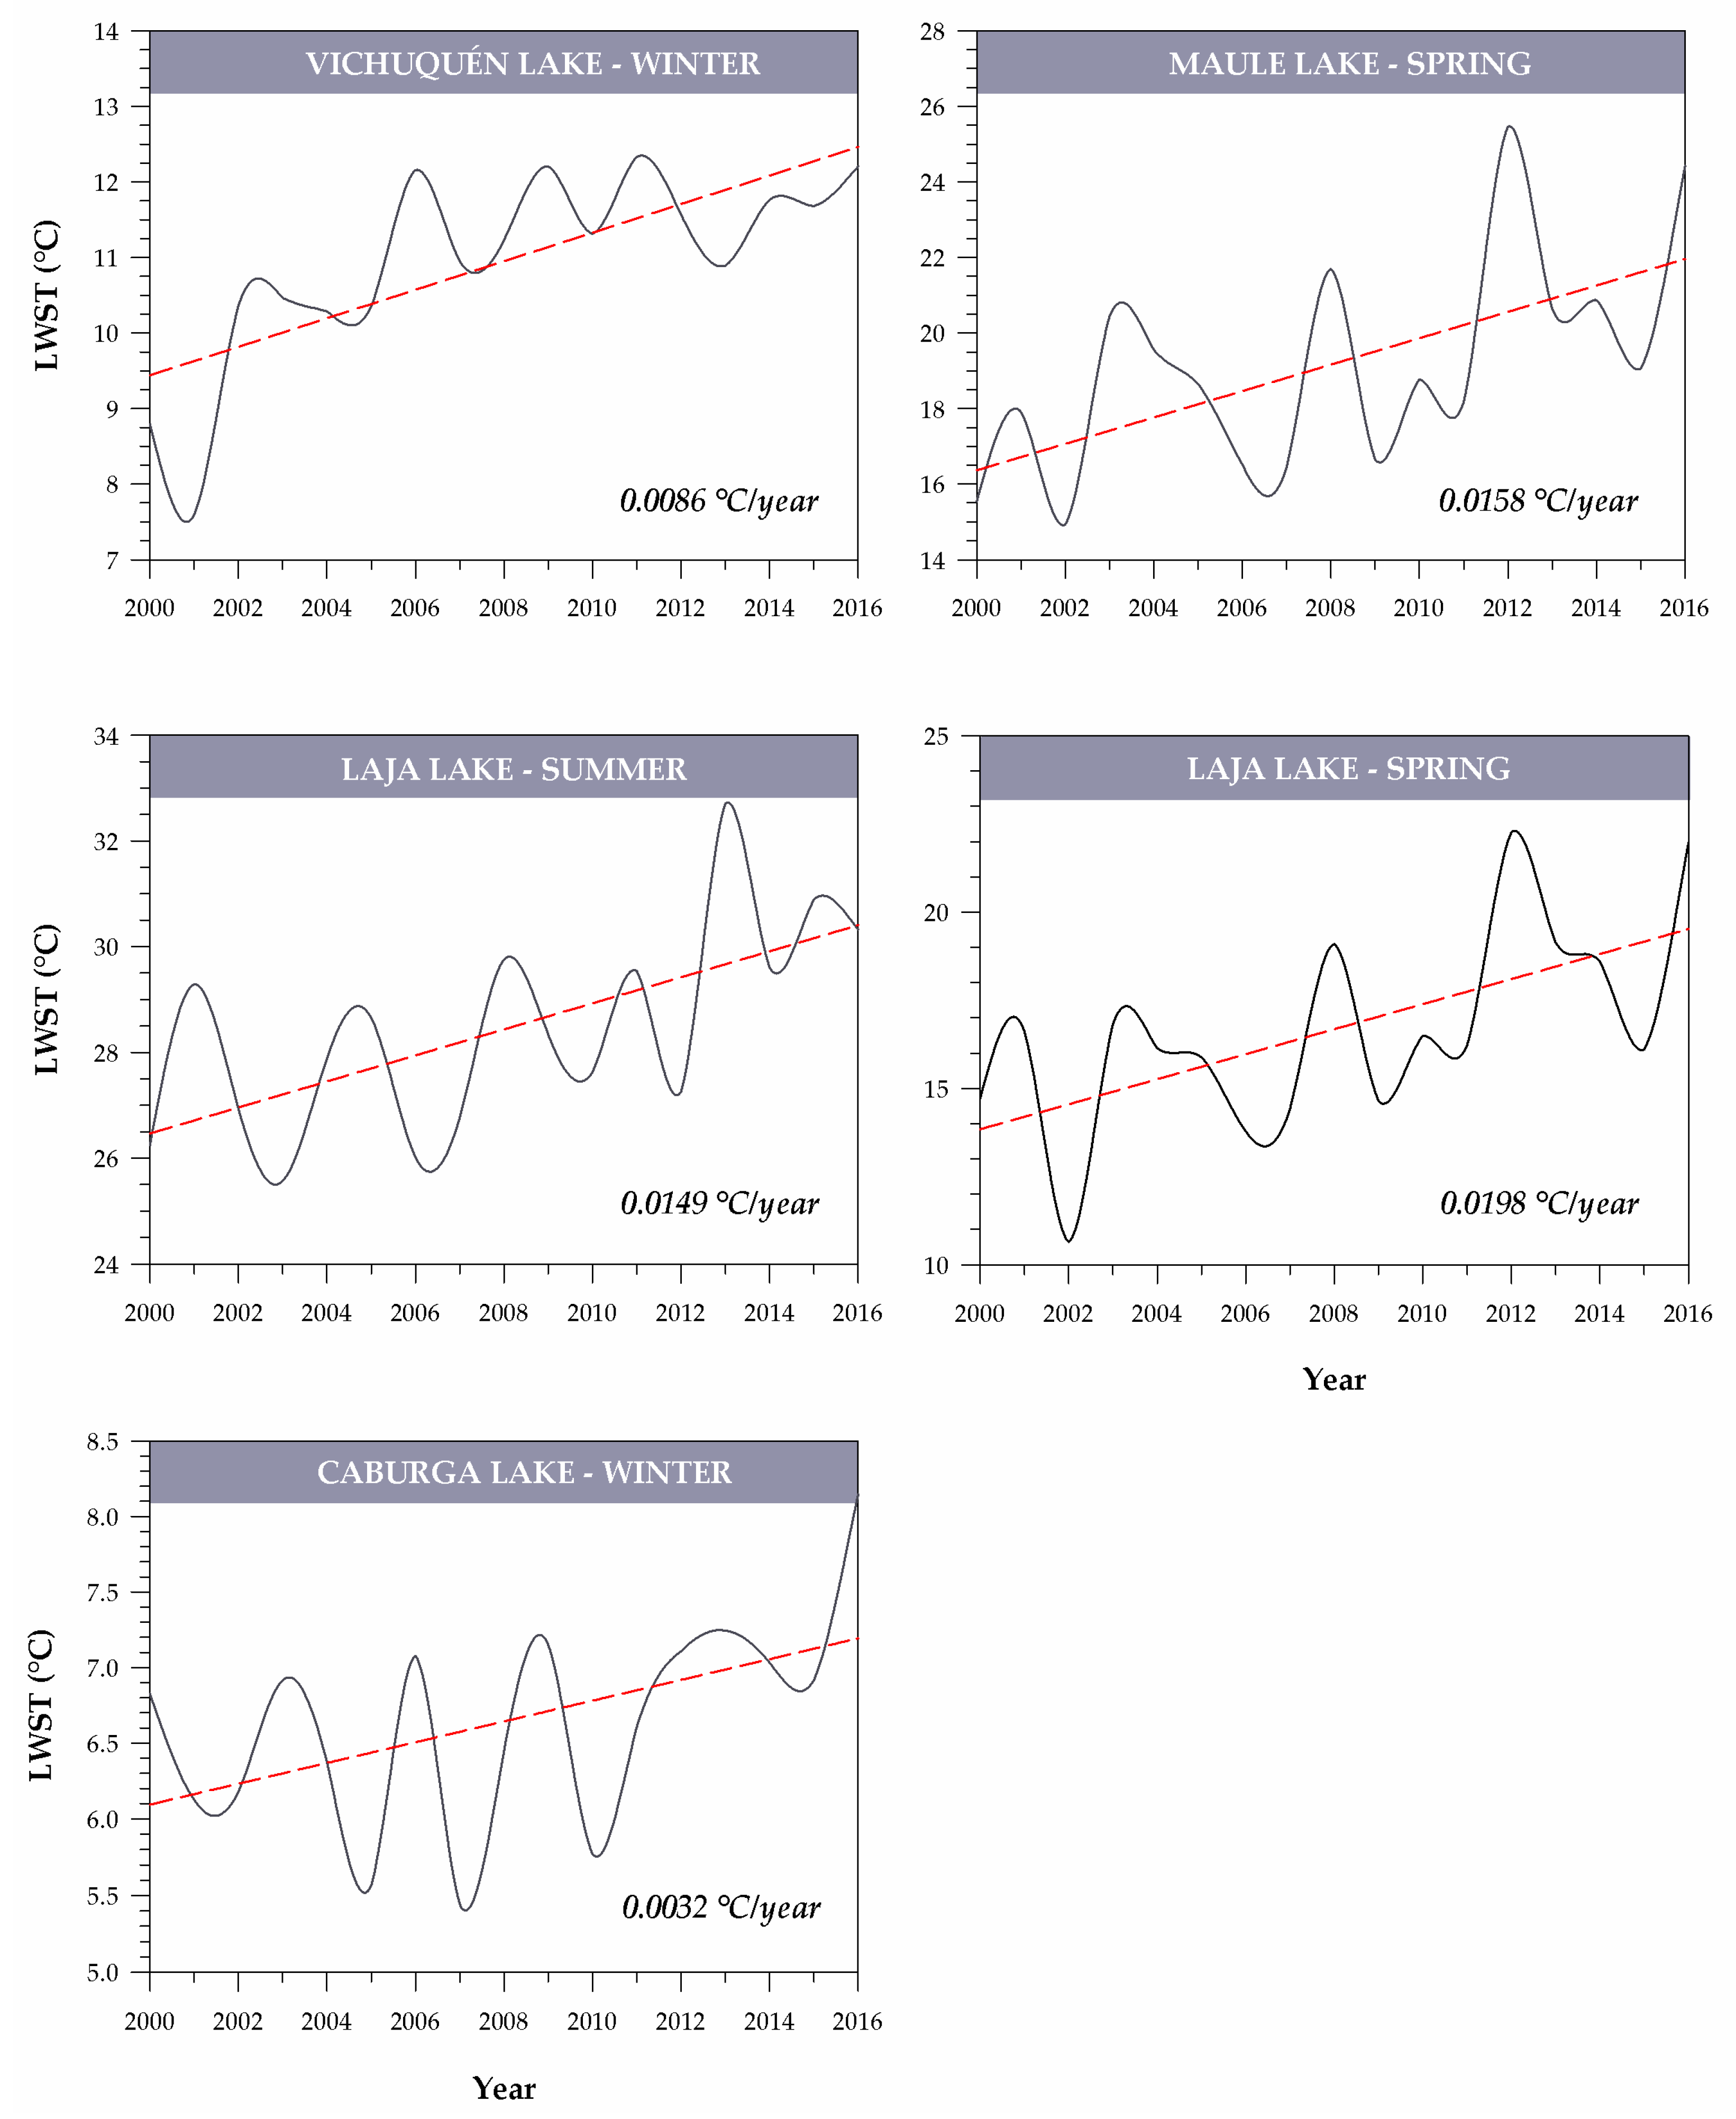
3.4. Seasonal Trend Analysis of MODIS LSWT Timeseries

At the seasonal scale, no significant trends were observed; however, significant trends in temperature data in spring for Maule and Laja lakes, summer for Laja Lake, and winter for Vichuquén and Caburga lakes were observed, with Caburga Lake presenting a warming rate between 0.003 °C/year and 0.020 °C/year (Figure 3). In Europe, multiple studies confirmed the late spring/summer warming of European lakes [67], central European lakes [68], and lakes south of the Alps [69]. In addition, regional studies have evidenced the rapid warming of the Great Lakes of North America and lakes in Europe using satellite derived LSWT, such as [5] and [27]. O’Reilly et al. [6] used a combination of in situ and satellite observations to estimate the long-term LSWT trends and found an average summer increase rate of 0.03–0.04 °C/year. Using a different approach [4,68,69] reported warming at similar rates using in situ LSWT data for European lakes and the Great Lakes of North America. A more recent study by Jane et al. [9] achieved similar results, estimating rates of 0.036 °C/year using in situ data on surface temperatures of lakes worldwide.
Although most studies have shown that lakes are warming during summer [6,70,71], it is no less important that lakes are showing some warming during winter. In this context, the increasing trend found in Vichuquén and Caburga during winter could suggest that these systems tend to reduce the extent of the mixing period or extend their thermal stratification period. According to Straile et al. [72], a reduction of the mixing period could alter the transport of dissolved oxygen and nutrients through the water column. In addition, this winter increase could have a positive and/or negative effect on habitat availability for aquatic species. Positive because it would favor the emergence of cyanobacteria [64], and negative because stenothermal species would tend to migrate towards more favorable thermal conditions that allow them to survive [73,74].
Break points or positive direction change (increase in temperature) were reached for Vichuquén, Maule, Laja, Galletué, Caburga and Villarrica lakes. Additionally, at the seasonal time scale, Laja Lake reached a statistically significant change point in 2007. Maule Lake experienced another change point during spring 2009, while Vichuquén and Caburga lakes reached one during the winters of 2005 and 2011, respectively (Table 4).
The rate obtained indicate that the seasonal trends are similar to those found in other studies, but they present lower rates of change, as mean summer values obtained by O’Reilly et al. [6], 0.030–0.040 (°C/year), were almost double those found in this study. However, this difference might be due to the limited set of historical data on the studied lakes.

4. Conclusions

The aim of this investigation was to analyze monthly, seasonal, and annual surface temperature trends in 14 south central Chilean lakes during the 2000–2016 period using MODIS satellite imagery. The results of this study suggest that the processing of MODIS LSWT images is appropriate and show excellent agreement with in situ LSWT, making it a viable alternative for future observations of lakes >10 km2. Furthermore, 12 of the 14 lakes presented a statistically significant increase in surface temperature, with a rate of 0.10 °C/decade (0.01 °C/year) over the study period. At a seasonal scale, some of the lakes in the study area present a significant upward trend in surface temperatures, especially in spring, summer, and winter. In general, significant increase in surface water temperatures are found in lakes located at higher altitudes, such as Maule and Laja lakes. The increase in surface temperature and the change point obtained by the Pettitt test are consistent with site observations and an increased frequency of potentially toxic cyanobacterial blooms in Villarrica Lake. This suggests direct links between LSWT, dissolved oxygen at the surface of the lake and land use/change.

Author Contributions

Conceptualization, A.C.A. and R.U.; methodology, L.R.-L.; software, A.C.A.; validation, A.C.A., D.R.-R., G.F.-J. and R.U.; formal analysis, A.C.A.; investigation, A.C.A.; resources, R.U.; data curation, D.R.-R.; writing—original draft preparation, A.C.A.; writing—review and editing, D.R.-R., L.R.-L. and P.P.; visualization, P.P.; supervision, R.U., J.L.A.-R. and L.M.-S.; project administration, R.U.; funding acquisition, R.U. All authors have read and agreed to the published version of the manuscript.

Funding

This research was funded by Centro de Recursos Hídricos para la Agricultura y la Minería (CRHIAM), grant number: Proyecto FONDAP/ANID/15130015.

Institutional Review Board Statement

Not applicable.

Informed Consent Statement

Not applicable.

Data Availability Statement

The data presented in this study are available on request from the corresponding author.

Acknowledgments

The authors thank the National Agency for Research and Development of Chilean Government (ANID) and (CRHIAM) Water Center, FONDAP/ANID/15130015. In addition, Pablo Pedreros thanks the project Fondecyt Postdoctoral N° 3180356.

Conflicts of Interest

The authors declare no conflict of interest.

References

  1. Giardino, C.; Brando, V.E.; Gege, P.; Pinnel, N.; Hochberg, E.; Knaeps, E.; Reusen, I.; Doerffer, R.; Bresciani, M.; Braga, F.; et al. Imaging Spectrometry of Inland and Coastal Waters: State of the Art, Achievements and Perspectives. Surv. Geophys. 2019, 40, 401–429. [Google Scholar] [CrossRef] [Green Version]
  2. Schröter, M.; Bonn, A.; Klotz, S.; Seppelt, R.; Baessler, C. Atlas of Ecosystem Services; Springer: Berlin/Heidelberg, Germany, 2019. [Google Scholar]
  3. Wu, D.; Zhou, A.; Zhang, J.; Chen, J.; Li, G.; Wang, Q.; Chen, L.; Madsen, D.; Abbott, M.; Cheng, B.; et al. Temperature-Induced Dry Climate in Basins in the Northeastern Tibetan Plateau during the Early to Middle Holocene. Quat. Sci. Rev. 2020, 237, 106311. [Google Scholar] [CrossRef]
  4. Coats, R.; Perez-Losada, J.; Schladow, G.; Richards, R.; Goldman, C. The Warming of Lake Tahoe. Clim. Chang. 2006, 76, 121–148. [Google Scholar] [CrossRef]
  5. Schneider, P.; Hook, S.J. Space Observations of Inland Water Bodies Show Rapid Surface Warming since 1985. Geophys. Res. Lett. 2010, 37, L22405. [Google Scholar] [CrossRef] [Green Version]
  6. O’Reilly, C.M.; Sharma, S.; Gray, D.K.; Hampton, S.E.; Read, J.S.; Rowley, R.J.; Schneider, P.; Lenters, J.D.; Mcintyre, P.B.; Kraemer, B.M.; et al. Rapid and Highly Variable Warming of Lake Surface Waters around the Globe. Geophys. Res. Lett. 2015, 42, 10–773. [Google Scholar] [CrossRef] [Green Version]
  7. Song, K.; Wang, M.; Du, J.; Yuan, Y.; Ma, J.; Wang, M.; Mu, G. Spatiotemporal Variations of Lake Surface Temperature across the Tibetan Plateau Using MODIS LST Product. Remote Sens. 2016, 8, 854. [Google Scholar] [CrossRef] [Green Version]
  8. Luo, Y.; Zhang, Y.; Yang, K.; Yu, Z.; Zhu, Y. Spatiotemporal Variations in Dianchi Lake’s Surface Water Temperature from 2001 to 2017 under the Influence of Climate Warming. IEEE Access 2019, 7, 115378–115387. [Google Scholar] [CrossRef]
  9. Jane, S.F.; Hansen, G.J.A.; Kraemer, B.M.; Leavitt, P.R.; Mincer, J.L.; North, R.L.; Pilla, R.M.; Stetler, J.T.; Williamson, C.E.; Woolway, R.I.; et al. Widespread Deoxygenation of Temperate Lakes. Nature 2021, 594, 66–70. [Google Scholar] [CrossRef]
  10. Ptak, M.; Sojka, M.; Choiński, A.; Nowak, B. Effect of Environmental Conditions and Morphometric Parameters on Surface Water Temperature in Polish Lakes. Water 2018, 10, 580. [Google Scholar] [CrossRef] [Green Version]
  11. Yang, K.; Yu, Z.; Luo, Y.; Zhou, X.; Shang, C. Spatial-Temporal Variation of Lake Surface Water Temperature and Its Driving Factors in Yunnan-Guizhou Plateau. Water Resour. Res. 2019, 55, 4688–4703. [Google Scholar] [CrossRef]
  12. Öğlü, B.; Bhele, U.; Järvalt, A.; Tuvikene, L.; Timm, H.; Seller, S.; Haberman, J.; Agasild, H.; Noges, P.; Slim, M.; et al. Is Fish Biomass Controlled by Abiotic or Biotic Factors? Results of Long-Term Monitoring in a Large Eutrophic Lake. J. Great Lakes Res. 2020, 46, 881–890. [Google Scholar] [CrossRef]
  13. Zhang, Z.; Fan, X.; Peijnenburg, W.J.G.M.; Zhang, M.; Sun, L.; Zhai, Y.; Yu, Q.; Wu, J.; Lu, T.; Qian, H. Alteration of Dominant Cyanobacteria in Different Bloom Periods Caused by Abiotic Factors and Species Interactions. J. Environ. Sci. 2021, 99, 1–9. [Google Scholar] [CrossRef]
  14. Peeters, F.; Livingstone, D.M.; Goudsmit, G.-H.; Kipfer, R.; Forster, R. Modeling 50 years of historical temperature profiles in a large central European lake. Limnol. Oceanogr. 2002, 47, 186–197. [Google Scholar] [CrossRef] [Green Version]
  15. Shuter, B.J.; Schlesinger, D.A.; Zimmerman, A.P. Empirical Predictors of Annual Surface Water Temperature Cycles in North American Lakes. Can. J. Fish. Aquat. Sci. 1983, 40, 1838–1845. [Google Scholar] [CrossRef]
  16. Oswald, C.J.; Rouse, W.R. Thermal Characteristics and Energy Balance of Various-Size Canadian Shield Lakes in the Mackenzie River Basin. J. Hydrometeorol. 2004, 5, 129–144. [Google Scholar] [CrossRef]
  17. Aaron-Morrison, A.P.; Ackerman, S.A.; Adams, N.G.; Adler, R.F.; Albanil, A.; Alfaro, E.J.; Allan, R.; Alves, L.M.; Amador, J.A.; Andreassen, L.M.; et al. State of the Climate in 2016. Bull. Am. Meteorol. Soc. 2017, 98, Si-S280. [Google Scholar] [CrossRef] [Green Version]
  18. Sharma, S.; Walker, S.C.; Jackson, D.A. Empirical Modelling of Lake Water-Temperature Relationships: A Comparison of Approaches. Freshw. Biol. 2008, 53, 897–911. [Google Scholar] [CrossRef]
  19. Toffolon, M.; Piccolroaz, S.; Majone, B.; Soja, A.M.; Peeters, F.; Schmid, M.; Wüest, A. Prediction of Surface Temperature in Lakes with Different Morphology Using Air Temperature. Limnol. Oceanogr. 2014, 59, 2185–2202. [Google Scholar] [CrossRef] [Green Version]
  20. Ekercin, S.; Örmeci, C. Evaluating Climate Change Effects on Water and Salt Resources in Salt Lake, Turkey Using Multitemporal SPOT Imagery. Environ. Monit. Assess. 2010, 163, 361–368. [Google Scholar] [CrossRef] [PubMed]
  21. Rani, N.; Sinha, R.K.; Prasad, K.; Kedia, D.K. Assessment of Temporal Variation in Water Quality of Some Important Rivers in Middle Gangetic Plains, India. Monit. Assess. 2010, 174, 401–415. [Google Scholar] [CrossRef]
  22. Reinart, A.; Reinhold, M. Mapping Surface Temperature in Large Lakes with MODIS Data. Remote Sens. Environ. 2008, 112, 603–611. [Google Scholar] [CrossRef]
  23. Alcântara, E.H.; Stech, J.L.; Lorenzzetti, J.A.; Bonnet, M.P.; Casamitjana, X.; Assireu, A.T.; de Moraes Novo, E.M.L. Remote Sensing of Water Surface Temperature and Heat Flux over a Tropical Hydroelectric Reservoir. Remote Sens. Environ. 2010, 114, 2651–2665. [Google Scholar] [CrossRef]
  24. Hook, S.J.; Vaughan, R.G.; Tonooka, H.; Schladow, S.G. Absolute Radiometric In-Flight Validation of Mid Infrared and Thermal Infrared Data from ASTER and MODIS on the Terra Spacecraft Using the Lake Tahoe, CA/NV, USA, Automated Validation Site. IEEE Trans. Geosci. Remote Sens. 2007, 45, 1798–1807. [Google Scholar] [CrossRef]
  25. DGA, Dirección General de Agua. (DGA, 2016). Red Hidrométrica. 2016. Available online: Http:Dga.Cl (accessed on 25 November 2020).
  26. Dirección General de Aguas Dirección General de Aguas. (DGA, 2016a) Atlas Del Agua, Chile. 2016. Available online: Http:Www.Dga.Cl (accessed on 29 October 2021).
  27. Riffler, M.; Lieberherr, G.; Wunderle, S. Lake Surface Water Temperatures of European Alpine Lakes (1989–2013) Based on the Advanced Very High Resolution Radiometer (AVHRR) 1 Km Data Set. Earth Syst. Sci. Data 2015, 7, 1–17. [Google Scholar] [CrossRef] [Green Version]
  28. Thiery, W.; Davin, E.L.; Panitz, H.J.; Demuzere, M.; Lhermitte, S.; van Lipzig, N. The Impact of the African Great Lakes on the Regional Climate. J. Clim. 2015, 28, 4061–4085. [Google Scholar] [CrossRef]
  29. Austin, J.A.; Colman, S.M. Lake Superior Summer Water Temperatures Are Increasing More Rapidly than Regional Temperatures: A Positive Ice-Albedo Feedback. Geophys. Res. Lett. 2007, 34, L06604. [Google Scholar] [CrossRef] [Green Version]
  30. Dirección General de Agua. (DGA, 2018). Red Hidrométrica. Available online: www.Dga.Cl (accessed on 29 October 2021).
  31. Köppen, W.; Geiger, R. Klimate Der Erde. Gotha Verlag. Justus Perthes 1928, 91–102. [Google Scholar]
  32. Viale, M.; Garreaud, R. Orographic Effects of the Subtropical and Extratropical Andes on Upwind Precipitating Clouds. J. Geophys. Res. 2015, 120, 4962–4974. [Google Scholar] [CrossRef]
  33. González-Rodríguez, L.; Pérez, L.; Fissore, A.; Rodríguez-López, L.; Jimenez, J. Tilt and Orientation of a Flat Solar Collector to Capture Optimal Solar Irradiation in Chilean Latitudes. In Proceedings of the 2nd International Conference on BioGeoSciences; Springer International Publishing: Cham, Switzerland, 2019; pp. 215–228. [Google Scholar]
  34. Valdovinos, C.; Pedreros, P. Geographic Variations in Shell Growth Rates of the Mussel Diplodon Chilensis from Temperate Lakes of Chile: Implications for Biodiversity Conservation. Limnologica 2007, 37, 63–75. [Google Scholar] [CrossRef] [Green Version]
  35. Parra, O.; Valdovinos, C.; Urrutia, R.; Cisternas, M.; Habit, E.; Mardones, M. Caracterización y Tendencias Tróficas de Cinco Lagos Costeros de Chile Central. Limnetica 2003, 22, 51–83. [Google Scholar] [CrossRef]
  36. Fuentealba, C.; Figueroa, R.; González, F.; Palma, M. Variabilidad Genetica Local Del Bivalvo Dulceacuícola Diplodon Chilensis (Gray 1828) Proveniente de Tres Lagos Nahuelbutanos. Gayana 2010, 74, 113–124. [Google Scholar] [CrossRef] [Green Version]
  37. Karrasch, B.; Woelfl, S.; Urrutia, R.; Nny González, J.E.; Valdovinos, C.; Cid, H.; Parra, O. Lake Laja: Ecomicrobiology and Microbial Assimilative Capacity of the Oligotrophic Andean Lake Laja, Chile. Rev. Chil. Hist. Nat. 2011, 84, 433–450. [Google Scholar] [CrossRef] [Green Version]
  38. Briceño, I.; Pérez, W.; San, M.D.; Ramos, S. Determination of Water Quality Vichuquén Lake, Using Satellite Images Landsat 8, Sensor OLI, Year 2016, Chile. Rev. Teledetec. 2018, 52, 67–78. [Google Scholar] [CrossRef] [Green Version]
  39. Schmid, M.; Hunziker, S.; Wüest, A. Lake Surface Temperatures in a Changing Climate: A Global Sensitivity Analysis. Clim. Chang. 2014, 124, 301–315. [Google Scholar] [CrossRef]
  40. Dirección General de Aguas (DGA). Redefinición de La Red Mínima de Lagos; POCH Ambiental SA: Santiago, Chile, 2009. [Google Scholar]
  41. Wan, Z.; Hook, S.; Hulley, G. MOD11A2 MODIS/Terra Land Surface Temperature/Emissivity 8-Day L3 Global 1 Km SIN Grid V006, NASA EOSDIS Land Processes DAAC. USGS Earth Resour. Observ. Sci. (EROS) Center 2015. [Google Scholar] [CrossRef]
  42. Team, R. R: A Language and Environment for Statistical Computing; R Foundaion for Statistical Computing: Vienna, Austria, 2016. [Google Scholar]
  43. Crosman, E.T.; Horel, J.D. MODIS-Derived Surface Temperature of the Great Salt Lake. Remote Sens. Environ. 2009, 113, 73–81. [Google Scholar] [CrossRef]
  44. Oesch, D.C.; Jaquet, J.M.; Hauser, A.; Wunderle, S. Lake Surface Water Temperature Retrieval Using Advanced Very High Resolution Radiometer and Moderate Resolution Imaging Spectroradiometer Data: Validation and Feasibility Study. J. Geophys. Res. Ocean. 2005, 110, 1–17. [Google Scholar] [CrossRef] [Green Version]
  45. Kendall, M.G. The Advanced Theory of Statistics, 2nd ed.; Hafner Publishing Company: New York, NY, USA, 1946. [Google Scholar]
  46. Wambua, R.M.; Mutua, B.M.; Raude, J.M. Detection of Spatial, Temporal and Trend of Meteorological Drought Using Standardized Precipitation Index (SPI) and Effective Drought Index (EDI) in the Upper Tana River Basin, Kenya. Open J. Mod. Hydrol. 2018, 8, 83–100. [Google Scholar] [CrossRef] [Green Version]
  47. Alhaji, U.U.; Yusuf, A.S.; Edet, C.O.; Oche, C.O.; Agbo, E.P. Trend Analysis of Temperature in Gombe State Using Mann Kendall Trend Test. J. Sci. Res. Rep. 2018, 20, 1–9. [Google Scholar] [CrossRef]
  48. Sen, P.K. Estimates of the Regression Coefficient Based on Kendall’s Tau. n. J. Am. Stat. Assoc. 1968, 63, 1379–1389. [Google Scholar] [CrossRef]
  49. Pettitt, A.N. A Non-parametric Approach to the Change-point Problem. J. R. Stat. Soc. Ser. C 1979, 28, 126–135. [Google Scholar] [CrossRef]
  50. Sneyers, R. Technical Note No 143 on the Statistical Analysis of Series of Observations; World Meteorological Organization: Geneva, Switzerland, 1990. [Google Scholar]
  51. Hunziker, S.; Brönnimann, S.; Calle, J.; Moreno, I.; Andrade, M.; Ticona, L.; Huerta, A.; Lavado-Casimiro, W. Effects of Undetected Data Quality Issues on Climatological Analyses. Clim. Past 2018, 14, 1–20. [Google Scholar] [CrossRef] [Green Version]
  52. Cortés, G.; Vargas, X.; McPhee, J. Climatic Sensitivity of Streamflow Timing in the Extratropical Western Andes Cordillera. J. Hydrol. 2011, 405, 93–109. [Google Scholar] [CrossRef]
  53. Rodrigo, F.S.; Trigo, R.M. Trends in Daily Rainfall in the Iberian Peninsula from 1951 to 2002. Int. J. Climatol. 2007, 27, 513–529. [Google Scholar] [CrossRef]
  54. Pohlert, T. Non-Parametric Trend Tests and Change-Point Detection; R package version 0.2. 0. 2017. Available online: https://cran.microsoft.com/snapshot/2017-11-08/web/packages/trend/vignettes/trend.pdf (accessed on 29 October 2021).
  55. Huovinen, P.; Ramírez, J.; Caputo, L.; Gómez, I. Mapping of Spatial and Temporal Variation of Water Characteristics through Satellite Remote Sensing in Lake Panguipulli, Chile. Sci. Total Environ. 2019, 679, 196–208. [Google Scholar] [CrossRef]
  56. Rodríguez-López, L.; Duran-Llacer, I.; González-Rodríguez, L.; Cardenas, R.; Urrutia, R. Retrieving Water Turbidity in Araucanian Lakes (South-Central Chile) Based on Multispectral Landsat Imagery. Remote Sens. 2021, 13, 3133. [Google Scholar] [CrossRef]
  57. Wan, W.; Li, H.; Xie, H.; Hong, Y.; Long, D.; Zhao, L.; Han, Z.; Cui, Y.; Liu, B.; Wang, C.; et al. A Comprehensive Data Set of Lake Surface Water Temperature over the Tibetan Plateau Derived from MODIS LST Products 2001–2015. Sci. Data 2017, 4, 170095. [Google Scholar] [CrossRef]
  58. Moser, K.A.; Baron, J.S.; Brahney, J.; Oleksy, I.A.; Saros, J.E.; Hundey, E.J.; Sadro, S.A.; Kopáček, J.; Sommaruga, R.; Kainz, M.J.; et al. Mountain Lakes: Eyes on Global Environmental Change. Glob. Planet. Chang. 2019, 178, 77–95. [Google Scholar] [CrossRef] [Green Version]
  59. Falvey, M.; Garreaud, R.D. Regional Cooling in a Warming World: Recent Temperature Trends in the Southeast Pacific and along the West Coast of Subtropical South America (1979–2006). J. Geophys. Res. Atmos. 2009, 114, 114. [Google Scholar] [CrossRef]
  60. Carrasco, J.F. Evidencia de Cambio Climático En Chile Sus Proyecciones y Consecuencias. 2017. Available online: https://www.researchgate.net/profile/Jorge-Carrasco-8/publication/314421068_EVIDENCIA_DE_CAMBIO_CLIMATICO_EN_CHILE_SUS_PROYECCIONES_Y_CONSECUENCIAS/links/590e3142a6fdccad7b10ddf6/EVIDENCIA-DE-CAMBIO-CLIMATICO-EN-CHILE-SUS-PROYECCIONES-Y-CONSECUENCIAS.pdf (accessed on 29 October 2021).
  61. Burger, F.; Brock, B.; Montecinos, A. Seasonal and Elevational Contrasts in Temperature Trends in Central Chile between 1979 and 2015. Glob. Planet. Chang. 2018, 162, 136–147. [Google Scholar] [CrossRef]
  62. Vuille, M.; Franquist, E.; Garreaud, R.; Lavado Casimiro, W.S.; Cáceres, B. Impact of the Global Warming Hiatus on Andean Temperature. J. Geophys. Res. 2015, 120, 3745–3757. [Google Scholar] [CrossRef] [Green Version]
  63. Nimptsch, J.; Woelfl, S.; Osorio, S.; Valenzuela, J.; Moreira, C.; Ramos, V.; Castelo-Branco, R.; Leão, P.N.; Vasconcelos, V. First Record of Toxins Associated with Cyanobacterial Blooms in Oligotrophic North Patagonian Lakes of Chile-a Genomic Approach. Int. Rev. Hydrobiol. 2016, 101, 57–68. [Google Scholar] [CrossRef]
  64. Almanza, V.; Pedreros, P.; Dail Laughinghouse, H.; Félez, J.; Parra, O.; Azócar, M.; Urrutia, R. Association between Trophic State, Watershed Use, and Blooms of Cyanobacteria in South-Central Chile. Limnologica 2019, 75, 30–41. [Google Scholar] [CrossRef]
  65. Establece Normas Secundarias de Calidad Ambiental Para La Protección de Aguas Continentales Superficiales Del; Chile. 2003.
  66. Lu, J.; Zhu, B.; Struewing, I.; Xu, N.; Duan, S. Nitrogen–Phosphorus-Associated Metabolic Activities during the Development of a Cyanobacterial Bloom Revealed by Metatranscriptomics. Sci. Rep. 2019, 9, 1–11. [Google Scholar] [CrossRef] [Green Version]
  67. Adrian, R.; O’reilly, C.M.; Zagarese, H.; Baines, S.B.; Hessen, D.O.; Keller, W.; Livingstone, D.M.; Sommaruga, R.; Straile, D.; van Donk, E.; et al. Lakes as Sentinels of Climate Change. Limnol. Oceanogr. 2009, 54, 2283–2297. [Google Scholar] [CrossRef]
  68. Dokulil, M.T.; Jagsch, A.; George, G.D.; Anneville, O.; Jankowski, T.; Wahl, B.; Lenhart, B.; Blenckner, T.; Teubner, K. Twenty Years of Spatially Coherent Deepwater Warming in Lakes across Europe Related to the North Atlantic Oscillation. Limnol. Oceanogr. 2006, 51, 2787–2793. [Google Scholar] [CrossRef] [Green Version]
  69. Salmaso, N.; Mosello, R. Limnological Research in the Deep Southern Subalpine Lakes: Synthesis, Directions and Perspectives. Adv. Oceanogr. Limnol. 2010, 1, 29–66. [Google Scholar] [CrossRef]
  70. Iestyn Woolway, R.; Merchant, C.J. Amplified Surface Temperature Response of Cold, Deep Lakes to Inter-Annual Air Temperature Variability. Sci. Rep. 2017, 7, 4130. [Google Scholar] [CrossRef] [PubMed] [Green Version]
  71. Woolway, R.I.; Merchant, C.J. Intralake Heterogeneity of Thermal Responses to Climate Change: A Study of Large Northern Hemisphere Lakes. J. Geophys. Res. Atmos. 2018, 123, 3087–3098. [Google Scholar] [CrossRef]
  72. Straile, D.; Jöhnk, K.; Rossknecht, H. Complex Effects of Winter Warming on the Physicochemical Characteristics of a Deep Lake. Limnol. Oceanogr. 2003, 48, 1432–1438. [Google Scholar] [CrossRef]
  73. Penk, M.; Donohue, I.; Récoules, V.; Irvine, K. Elevated Temperatures Interact with Habitat Quality to Undermine Survival of Ectotherms in Climatic Refugia. Divers. Distrib. 2015, 21, 200–210. [Google Scholar] [CrossRef]
  74. Woolway, R.I.; Merchant, C.J. Worldwide Alteration of Lake Mixing Regimes in Response to Climate Change. Nat. Geosci. 2019, 12, 271–276. [Google Scholar] [CrossRef]
Figure 1. The Maule, Bío-Bío, Araucanía and Los Ríos regions, located in south central Chile and the lakes analyzed in this study.
Remotesensing 13 04535 g001
Figure 2. Temporal behavior and trends of the annual MODIS LSWT series.
Remotesensing 13 04535 g002
Figure 3. Temporal behavior and trends of the seasonal MODIS LSWT series.
Remotesensing 13 04535 g003
Table 1. Morphometric parameters that influence LSWT: location, elevation, surface area, perimeter, volume, mean depth and maximum depth for the 14 inland lakes selected in this study.
Study LakesLatitudeLongitudeAltitudeSurface AreaPerimeterVolumeMean DepthMaximum
Depth
Trophic State
(°S)(°W)m a.s.l.km2kmkm3mm
Vichuquén 34°49′72°04′512.6835.120.212.56.3Eutrophic
Maule 36°05′70°50′216658.2878.98170NRNROligotrophic
Lanalhue 37°55′73°19′1232.6064.760.42 13.126Eutrophic
Laja 37°19′71°18′136077.90142.95.5975120Oligotrophic
Lleulleu 38°09′73°19′538.9698.510.9323.546.9Oligotrophic
Budi 37°19′71°19′273.29328.80.224.415Oligotrophic
Galletué 38°41′71°17′135013.0820.610.40NR50Oligotrophic
Colico 39°05′71°58′50054.9652.28NR416NROligotrophic
Huilipilún 39°08′72°10′34311.3318.74NRNR212Oligotrophic
Villarrica 39°18′72°05′230176.071.2021120165Meso-oligotrophic
Caburga 39°07′71°45′50552.2751.738.88117327Oligotrophic
Calafquén 39°32′72°09′203114.9122.38NR115212Oligotrophic
Riñihue 39°50′72°20′11777.5077.0012.8162323Oligotrophic
Panquipulli 39°43′71°13′140117124.05NR126268Oligotrophic
NR = not reported.
Table 2. Validated results for the comparison between MODIS LSWT and in situ LSWT for the six lakes that presented p-values ≤ 0.05.
Study LakesR2RMSEMAESlopen
(°C)(°C)
Caburga 0.851.881.500.8734
Villarrica 0.941.070.830.9431
Lanalhue 0.941.040.770.8734
Calafquén 0.851.791.240.8529
Panguipulli 0.861.611.200.8043
Riñihue0.881.341.010.8140
Table 3. Test results of Mann–Kendall and Pettitt tests for the month of January of the MODIS LSWT series (2000–2016).
Study LakesMann-KendallPettitt
SZMKPSenTrend
(°C/Year)
Confidence Interval (95%)KtPChange
Vichuquén783.310.0010.150.009[−0.467; 0.895]600.0052007
Maule482.020.0480.270.016[−1.509; 1.896]580.0082011
Laja542.280.0260.270.016[−1.342; 1.929]580.0092011
Lleulleu562.360.0210.160.010[−0.766; 1.314]480.0532007
Galletehué482.020.0480.190.011[−1.301; 1.910]500.0352011
Budi502.110.0390.170.010[−1.712; 1.155]380.0202007
Colico522.190.0320.170.010[−0.972; 1.278]440.0942011
Caburga542.280.0260.110.007[−0.741; 1.220]460.0752007
Villarrica602.530.0140.160.010[−0.705; 1.194]460.0692011
Calafquén662.790.0070.190.011[−0.652; 1.591]460.0702011
Panguipulli662.790.0070.180.011[−0.712; 1.350]440.0962007
Riñihue622.620.0110.190.011[−0.843; 1.248]460.0712010
S: S–statistic of Mann–Kendall; ZMK: Z-statistic of Mann–Kendall; P: p-value; Sen: Sen’s slope; Kt: statistic of Pettitt’s test.
Table 4. Test results of Mann–Kendall and Pettitt tests for the seasonal MODIS LSWT series (2000–2016).
Study Lakes Mann-KendallPettitt
SeasonSZMKPSenTrend
(°C/year)
Confidence Interval (95%)KtPChange
VichuquénWinter803.390.000.150.009[−0.363; 0.902]660.0012005
MauleSpring562.360.020.270.016[−1.837; 2.638]580.0082009
LajaSummer642.710.010.250.015[−1.884; 2.569]560.0212007
LajaSpring482.020.050.340.020[−1.141; 1.610]480.0522007
CaburgaWinter542.280.030.060.003[−0.346; 0.676]500.0412011
S: S—statistic of Mann–Kendall; ZMK: Z-statistic of Mann Kendall; P: p-value; Sen: Sen’s slope; Kt: statistic of Pettitt’s test.
Publisher’s Note: MDPI stays neutral with regard to jurisdictional claims in published maps and institutional affiliations.

