
European Space Agency (ESA) Calibration/Validation Strategy for Optical Land-Imaging Satellites and Pathway towards Interoperability

 ,
,
Abstract
:
1. Introduction
2. Background and International Context
2.1. ESA/Copernicus Current and Future Land-Focused Optical Sensors
- Sentinel-2 is a two-satellite constellation operational since March 2017 and ensuring a 5-day repeat cycle at the Equator in a sun-synchronous orbit at 786 km altitude with a local time at the descending node of 10:30 AM [5]. The Multi-Spectral Imager (MSI) on board S2 is a push-broom instrument and has a wide swath of 290 km with 13 spectral bands, covering the Visible (VIS), Near-Infrared (NIR) and Short-Wave Infrared (SWIR) domains at different spatial resolutions at the ground, ranging from 10 m to 60 m. The four bands at 10 m resolution in the VIS and NIR range ensure compatibility with SPOT 4 and 5 and meet the user requirements for land cover classification. The 20 m bands include the spectrally narrow red-edge bands for vegetation status monitoring, and the two SWIR bands for improving snow/ice/cloud discrimination. The bands at 60 m resolution are mainly dedicated to atmospheric correction and cloud screening.
- Sentinel-3 is a twin-satellite constellation operational since April 2018 in a sun-synchronous, near-polar orbit at 814 km with a local time at the descending node of 10:00 AM [6]. The Ocean and Land Colour Instrument (OLCI) on board S3 is a spectrometer imaging in push-broom mode and consisting of five cameras in a fan-shaped arrangement. OLCI provides a native 300 m resolution across a swath of 1270 km with 21 spectral bands in the 400–1020 nm spectral range. S3 also carries the Sea and Land Surface Temperature Radiometer (SLSTR) on board, a dual view conical scanning imaging radiometer designed to retrieve global coverage sea and land surface temperature, active fire monitoring, ice surface temperature, clouds and atmospheric aerosols in support of various Copernicus services. SLSTR provides six solar VIS/NIR/SWIR reflectance bands at 500 m resolution and three thermal infrared bands and two dedicated fire bands at 1 km resolution.
- The Proba-V satellite was launched in March 2013 in a quasi-sun-synchronous orbit at 820 km, with a mean local time in the range of 10:45 AM +/−15 min [7]. The VEGETATION instrument on board Proba-V consists of three overlapping cameras covering a 2250 km swath for near-daily global coverage of landmasses and coastal zones. The Proba-V cameras acquire data into four spectral bands: Blue, Red, NIR and SWIR. The Proba-V operational phase was terminated in June 2020 to limit the impact of orbital drift on mission’s archive multi-temporal consistency [10]. By 1 July 2020, the Proba-V mission entered an Experimental Phase scenario with reduced acquisition planning but with the perspective to expand its observation capabilities thanks to the launch of a series of Cubesat Companion satellites [11].
- The Fluorescence Explorer (FLEX) mission [13,14], which aims at providing global maps of vegetation fluorescence for studying photosynthetic activity and plant health and stress. The FLEX satellite will orbit in tandem with one of the Sentinel-3 satellites, taking advantage of its optical and thermal sensors to provide complementary measurements, in particular for atmospheric correction and cloud screening. The FLEX satellite will carry on board the FLuORescence Imaging Spectrometer (FLORIS), a high-resolution spectrometer acquiring data in the 500–780 nm spectral range, with a sampling of 0.1 nm in the oxygen bands (759–769 nm and 686–697 nm) and 0.5–2.0 nm in the red edge, chlorophyll absorption and PRI (Photochemical Reflectance Index) bands.
- The Copernicus Hyperspectral Imaging Mission (CHIME) [15] will carry a unique visible to shortwave infrared spectrometer to provide routine hyperspectral observations to support new and enhanced services for sustainable agricultural and biodiversity management, as well as soil property characterisation. The mission will complement Sentinel-2 for applications such as land cover mapping.
- The Copernicus Land Surface Temperature Monitoring (LSTM) [16] mission will carry a high-spatiotemporal-resolution thermal infrared sensor to provide observations of the land surface temperature. Land surface temperature measurements and the derived evapotranspiration are key variables to understand and respond to climate variability, manage water resources for agricultural production, predict droughts and to address land degradation, natural hazards, coastal and inland water management as well as urban heat island issues.

| Mission | Sensor | Level | Description | Reference |
|---|---|---|---|---|
| Sentinel-2 | MSI | L1-C | Top-Of-Atmosphere (TOA) reflectances radiometric and geometrically corrected | [17] |
| L2-A | Bottom-Of-Atmosphere (BOA) reflectances1 corrected for atmospheric effects | [17,18] | ||
| Sentinel-3 | OLCI | L1-B | TOA radiances in the instrument grid radiometrically corrected | [19] |
| SLSTR | L1-B | TOA radiances (VIS, NIR, SWIR channels) and TOA brightness temperatures (thermal infrared channels) | [20] | |
| OLCI | L2 Land | OLCI Global Vegetation Index (OGVI renamed in the future as GI-FAPAR, Green Instantaneous-fAPAR) providing the Fraction of Absorbed Photosynthetically Active Radiation (fAPAR) | [21,22] | |
| OLCI | L2 Land | OLCI Terrestrial Chlorophyll Index (OTCI) providing indication of the content of Chlorophyll in the canopy | [23,24] | |
| OLCI + SLSTR | L2 | S3 Synergy Surface Directional Reflectances1 product (SY_2_SYN), atmospherically corrected surface reflectances over land provided in SLSTR solar reflective bands (except S4 dedicated to cloud detection) and OLCI channels (except for oxygen absorption bands Oa13, Oa14, Oa15 and water vapour bands Oa19 and Oa20) | [25] | |
| Proba-V | Vegetation | L1-C | TOA reflectances in instrument grid unprojected, but radiometrically and geometrically corrected. | [26] |
| L3 | Top-Of-Canopy (TOC) atmospherically corrected reflectances1, provided as multi days composite products (S1, S5, S10) at different spatial resolution (1 km, 333 m and 100 m). | [26] |
2.2. International Context
2.2.1. Inter-Agencies Working Groups
- The Global Space-based Inter-Calibration System (GSICS) [28] is an international collaborative effort, initiated and promoted by the World Meteorological Organization (WMO), aiming at monitoring, improving and harmonising the quality of observations from operational weather and environmental satellites. The GSICS delivers calibration corrections needed for accurately integrating data from multiple observing systems into products, applications and services. ESA is an active contributor to the GSICS working groups’ objectives in the advances and consolidation of best practices for cross-sensor intercalibration.
- The CEOS Infrared and Visible Optical Sensors Subgroup (CEOS-IVOS) [29] is a sub-level working group of the CEOS-WGCV (Working Group on Calibration and Validation) aiming at fostering international collaborations in the frame of Cal/Val for optical sensors and proposing and agreeing on methodologies and standards, identifying test sites and sharing Cal/Val data among the various agencies. The ESA has been an active member of the CEOS-IVOS group for many years and actively supported the definition and implementation of advanced practices and networks for optical sensors Cal/Val.
- The CEOS Land Surface Imaging Virtual Constellation (CEOS-LSI-VC) [30] is a sub-group of the CEOS Virtual Constellations (CEOS-VC), which is responsible for promoting the efficient and comprehensive collection, distribution and application of space-acquired image data of the global land surface. The CEOS-LSI-VC leads the CEOS Analysis Ready Data for Land (CARD4L) initiative [31], including the definition of the individual product family specifications, as well as the assessment process and outreach. ESA is active member of the LSI-VC working group and is currently contributing to the CARD4L initiative.
- CEOS Land Product Validation (CEOS-LPV) [32] is a sub-group of the CEOS-WGCV, which is responsible for coordinating the quantitative validation of satellite-derived land products. The main objective of CEOS-LPV is to establish standardised guidelines and best practice protocols for the validation of a wide range of terrestrial Essential Climate Variables (ECVs). ESA is actively supporting CEOS-LPV activities in the various focus areas and is promoting the series of Land Products Validation Workshops [3,33], gathering the CEOS-LPV teams for discussing on common issues and collecting recommendations for improvements in Cal/Val best practices for land.
2.2.2. Sentinels Validation Teams
- The Sentinel-2 Validation Team (S2VT) [34] is responsible for coordinating and overseeing the quantitative validation of satellite data products derived from the Sentinel-2 mission. S2VT brings together, on an annual basis, leading Cal/Val experts addressing all S2 validation requirements, encompassing a large range of domains from radiometric and geometric calibration to land and water products validation. The recommendations gathered during a series of annual meetings are used to further reshape and improve Cal/Val methodologies, as well as easing the exchange of Cal/Val data among the various scientific teams.
- The Sentinel-3 Validation Team (S3VT) [35] is jointly convened by the ESA and the European Organisation for the Exploitation of Meteorological Satellites (EUMETSAT) to promote and coordinate the involvement of the international community in the domain of Cal/Val activities for the Sentinel-3 mission. The S3VT is divided in different sub-groups focusing on Land, Ocean Colour, Sea Surface Temperature, Altimetry and Atmosphere. The S3VT meets on a regular basis to review the status of the Cal/Val activities and the quality of the S3 core products, as well as to support the exchanges of ideas and collaboration among the various members and to discuss potential product evolutions.
3. Underlying Terminology and Concepts
3.1. Calibration and Validation
3.2. Traceability and Uncertainty
- Measurement error is the measured quantity value minus a reference quantity value. The measurement error can contain both a random and a systematic component. While the random component averages out over multiple measurements, the systematic component does not. On the other hand, the systematic error, also called bias, if significant in size compared to required measurement accuracy and should be carefully estimated and ideally corrected through the use of an appropriate correction factor.
- Measurement uncertainty is a non-negative parameter describing the dispersion of the quantity values attributed to a measurand, where the measurand is the quantity being measured. The methods for evaluating measurement uncertainty are classified in two main categories: Type A and Type B. Type A uncertainty evaluation is based on the statistical analysis of a series of independent observations of the same quantity. Type B includes all other methods, which do not rely on the analysis of a series of observations but are based on a prior and reliable knowledge about the measurement, e.g., previous data, knowledge about the instrument’s properties and behaviour and calibration certificates.
3.3. Validation Metrics
3.4. Spatiotemporal Sampling
- Reference measurement—Since the truth is, strictly speaking, unknown, the general validation process consists in assessing the accuracy of the satellite data against a chosen reference measurement. The basic assumption is that the uncertainty associated to the reference is better constrained than the one of the satellite data. For instance, ground-based sensors can be regularly calibrated (pre- and post-deployment) and closely characterised in laboratory conditions, which is not the case in satellite-borne sensors. In the ideal case, the reference measurement should be traceable to SI unit. In reality, reference data are rarely traceable to a standard and can be affected by various sources of uncertainties, which are very often neglected.
- Spatial sampling—The ideal reference data should provide a meaningful estimate of the investigated geophysical quantity to a level, which is comparable to the satellite measurement scale that is subject of the validation process. This generic requirement drives the choice of the validation sites and the location of in situ observations within each site (spatial sampling). The adoption of community-agreed best practices for in situ data collection allows to address this generic issue in satellite validation. In the land community, and specifically for the validation of bio-geophysical products, the most widely used approach consists in repeating the in situ measurements over the representative sampling unit, the so-called Elementary Sampling Unit (ESU), and upscaling the data averaged over this ESU to a larger scale using empirical transfer functions, based on a combination of high and coarse resolution sensors [51].
- Temporal sampling—In the ideal case, Cal/Val data should be acquired continuously, such as by using automated devices, to increase the number of collocation opportunities (match-ups) with satellite overpasses, as well as to enhance the monitoring of dynamic bio-geophysical processes over the considered ecosystem. The increase of match-up opportunities is essential for improving the reliability of the derived validation results by providing more robust statistical metrics. In reality, a large fraction of available Cal/Val data for land are gathered during ad-hoc field campaigns with limited temporal sampling.
- Spatiotemporal mismatch—Despite the effort in defining an optimised sampling in the spatiotemporal domain, the intrinsic difference between the measurement scale for the satellite and the reference in situ data directly translates into a collocation mis-match error ( in Equation (2)), which can be the most significant source of errors for highly dynamic geophysical parameters [48]. For the specific case of terrestrial variables, the temporal mismatch is a second order issue with respect to the spatial sampling, since surface properties change slowly with time. On the other hand, the short-term variability in aerosol and cloud contamination can induce a mismatch temporal collocation error in the derived land bio-geophysical parameters.
- Geographical coverage—The uncertainty budget of satellite EO data should ideally be assessed at global scale in order to verify the accuracy of the used retrieval algorithms over a wide range of biomes and eco-climate conditions. This translates into the need of a network of globally distributed sites, providing continuous, representative and consistent measurements of the same geophysical quantity. The fulfilment of this requirement has some non-negligible costs, which are difficult to cover as part of a single mission or Agency’s budget. At the present time, except for the Aerosol Robotic Network (AERONET) [52], there are no operational Land Cal/Val networks entirely fulfilling this need. The pragmatic approach to this problem consists in reinforcing international collaborations, leveraging on existing regional and continental infrastructures, with the objective to build a network-of-networks system. This approach is now being considered in the frame of the Copernicus Ground-Based Observations for Validation (GBOV) [53].
3.5. Fiducial Reference Measurements
- FRM measurements are independent from the satellite geophysical retrieval process.
- An uncertainty budget for all FRM instruments and derived measurements is available and maintained.
- FRM measurement protocols, procedures and community-wide management practices (measurement, processing, archive, documents, etc.) are defined, published openly and adhered to by FRM instrument deployments.
- FRM are accessible to other researchers, allowing for the independent verification of processing systems.
3.6. Validation Stage and Maturity Matrix
- CEOS LPV validation stage [59]—One of the most appropriate and suitable definitions of confidence level for terrestrial ECVs is the validation stage concept, defined and put forward by the CEOS-LPV sub-group. The increase in the stage, from 0 to 4, is driven by the use of more representative sets of reference data and by the adoption of rigorous approaches for the uncertainty estimate. The validation stage should be confirmed and endorsed by the scientific community through peer-reviewed publication, and the validation result should be periodically reviewed and maintained as long as new versions of satellite EO data become available.
- CCI Maturity Matrix [60]—The Maturity Matrix (MM) concept, tailored in the frame of ESA Climate Change Initiative (CCI) [61], is a systematic approach for assessing the usability of any CDR. The CCI MM offers a standard and efficient way to quantify for a given climate dataset six attributes: software readiness, data format, documentation, uncertainty characterisation, accessibility and usability. The maturity level is rated via a score (from 1 to 6), which is assigned on each aspect of the data record. The CCI MM provides an overview on the status of climate datasets, highlighting areas for further improvement and allowing to compare the fitness for purpose of different products.
- GAIA CLIM Maturity Matrix [62]—The GAIA-CLIM MM was specifically designed for assessing the level of maturity of ground-based atmospheric composition networks. The assessment is based on the following aspects: metadata, documentation, uncertainty characterisation, public access, feedback and update, usage, sustainability and software. The MM can be used both to aid user decision making as to which measurement series are suitable for particular use cases and support networks’ owners in improving the maturity of their measurements, facilitating interoperability across existing ground-based measurement systems.
- EDAP Product Quality Evaluation Matrix [63]—The Earthnet Data Assessment Pilot (EDAP) matrix, which is an evolution of the QA4ECV matrix [40], aims at providing to the users a readily accessible overview of the relevant EO satellite data products quality and fitness for purpose. The quality assessment addresses specifically the following main EO products characteristics: format and accessibility, products and algorithm documentation and quality flags, uncertainty characterisation and validation results. For each feature of the identified product, a ranking is provided with colour coding, providing easy and quick information on the overall quality of the considered EO data. While the previous definitions are mainly focusing on bio-geophysical variables, the EDAP quality matrix is a cross-cutting concept, which can be equally applied to any satellite-based product level. This matrix contributes to the effort of standardisation in the quality assessment procedures for EO satellite data. The EDAP matrix is therefore pivotal in moving towards enhanced interoperability in the EO domain.
3.7. Analysis Ready Data
- Radiometric and geometric calibration issues should be solved following best practices approaches.
- A minimum level of processing should be applied in order to lower the bar of expertise on the user side. For optical sensors, this typically includes cloud screening and atmospheric correction.
- Spatially explicit per-pixel quality flags should be provided to enable users to perform informative processing on suitable good quality data.
3.8. Multi-Sensor Data Harmonisation
- Harmonisation in a climate context—Harmonisation has a strong relevance for the generation of CDR, when multi-sensors datasets are merged to derive a consistent series of observations, spanning a time frame relevant for climate studies, typically more than 20 years. In this context, special attention is given to rigorous estimation of uncertainties to reliably disentangled sensor-related artefacts from climate-relevant trends [55]. A generic framework for harmonising the series of AVHRR (Advanced Very-High-Resolution Radiometer) radiance observations was developed in the frame of the Fiduceo project [67,68]. This project has further developed its own terminology, distinguishing between “harmonisation” and “homogenisation” of satellite data series. Following Fiduceo’s terminology, a harmonised satellite series is one where all the calibrations of the sensors have been made consistent with a reference dataset, which can be traced back to known reference sources, in an ideal case back to SI. Unlike harmonisation, homogenisation consists in adding the constraint that all satellites would give the exact same signal when looking at the same location at the same time. According to Fiduceo’s recommendations, homogenisation should be avoided for CDR generation, since the application of adjustment factors can induce scene-dependent biases that are difficult to characterise a-posteriori.
- Harmonisation in an application context—In addition to climate studies, harmonisation is increasingly relevant for regional applications, where observations from a virtual constellation of similar sensors are blended with the primary goal to enhance revisit time. The most obvious examples of such a strategy are the NASA Harmonised Landsat and Sentinel-2 (HLS) product [69] and the ESA Sen2Like project [10], aiming at similar objectives of harmonising and fusing the Sentinel-2 and Landsat-8 data streams. Harmonisation within these two projects means providing a seamless stream of sensor-agnostic data from the two missions to the users, gridded to a common map projection, atmospherically corrected and cloud screened using a single algorithm, normalised to a fixed sun-viewing geometry and spectrally adjusted.
4. Current Status and Identified Needs
4.1. Level 1 TOA Radiometry and Geometry
4.1.1. Pre-Flight Calibration
4.1.2. In-Orbit Calibration
4.1.3. Vicarious Calibration with Desert Targets
4.1.4. Vicarious Calibration with Deep Convective Clouds
4.1.5. Vicarious Calibration with the Moon
4.1.6. Cross-Sensors Intercalibration and Tandem Phase
4.1.7. Instrumented Sites for TOA Radiometric Calibration
4.1.8. SI-Traceability in Space
| ID | Status and Needs | Recommendations |
|---|---|---|
| IDN-01 | Pre-launch calibration is critical for ensuring accurate satellite observations, meeting the requirements of the science community. Though additional effort should be spent in fostering the adoption of metrological practices during pre-launch characterisation activities. | Space Agencies should embrace metrological practices in the early phase of the mission design by including relevant requirements in Mission and System Requirement Documents (MRD, SRD) and allocating appropriate budget to pre-launch calibration activities. |
| IDN-02 | Pre-launch calibration database is most of the time undisclosed to users or protected by property rights with resulting difficulty in applying a full traceability tree in the Level 1 processing. | Space Agencies should ease traceability of calibration processing by: requiring instrument providers to identify measurement equation and develop traceability chain, archiving, maintaining and making accessible to users the relevant pre-launch characterisation database. |
| IDN-03 | While radiometric uncertainty is well characterised, theoretical advances needs to be made for fully characterising geometric errors and spatial correlation induced by interpolation and regridding. | Space Agencies should foster advances of theoretical approaches for fully characterising geometric and spatially correlated errors in Level 1 products, such as those induced by orthorectification, regridding, projection. |
| IDN-04 | There is currently a need for providing per-pixel uncertainty estimates at Level 1. This is a critical input for consistently assimilating satellite observations into geophysical and weather forecast models. | Space Agencies should work towards the provision of uncertainty information at pixel-level in Level 1 products for optical imaging sensors. |
| IDN-05 | PICS are invaluable targets for assessing radiometric accuracy and temporal stability and for cross-calibration. Though, used RTMs should be improved in order to meet the accuracy requirement set by the climate community (1%). | Space Agencies, in coordination with CEOS-WGCV, should work towards improving accuracy of current RTM simulations for Cal/Val applications with initial focus on TOA radiometric assessment over PICS. |
| IDN-06 | The Moon is the best vicarious target for optical sensor stability monitoring and inter-calibration. However, the accuracy of the current (ROLO) lunar irradiance model still prevents its use for absolute calibration. New observations are urgently required for using the Moon as an absolute radiometric target. | Space Agencies, in coordination with GSICS and CEOS-WGCV, should support improvements in Lunar irradiance models and inter-comparison exercises with the target of using the Moon as absolute target for radiometric calibration, reaching the target of 1% in radiometric accuracy. |
4.2. Level 2 Land Surface Reflectances
4.2.1. SR Assessment within ACIX Initiative
4.2.2. Cloud Mask Assessment within CMIX
4.2.3. HYPERNETS Project
| ID | Status and Needs | Recommendations |
|---|---|---|
| IDN-07 | The lack of ground-based surface reflectance measurements over land is currently limiting our capability to validate SR products and assess the quality of AC algorithms. Such measurements should ideally be: continuous (increase match-up), hyper-spectral (multi-mission) and multi-angular (for BRDF characterisation). | Space Agencies, in coordination with CEOS-LPV, should support on-going efforts (e.g., HYPERNETS) working towards setting up a globally representative network of ground-based measurements for supporting the validation of satellite-derived land SR products. |
| IDN-08 | Validation of cloud masks is currently based on the use of manually labelled reference ground-truth data with an obvious lack of an objective and a physically based approach. | Space Agencies, in coordination with CEOS-WGCV, should develop advanced methods for cloud mask validation using ground-based independent measurements, working towards the set-up of an autonomous globally representative network for both medium and coarse resolution sensors. |
| IDN-09 | There are inconsistencies among the publicly available manually labelled databases for S2 and L8 pixel classification, owing to the bias introduced by the photo-interpretation process. These inconsistencies are currently limiting their synergistic use for cloud mask validation. | Space Agencies, in coordination with CEOS-WGCV, should develop a reference of the manually labelled database specifically tailored to cloud mask validation. The database should include optically thick, semi-transparent and cloud shadow classes. |
| IDN-10 | There is a lack of unanimously agreed definition of cloud in the optical land community, notably for optically thin or semi-transparent clouds. Furthermore, this definition is generally application-dependent or related to the sensitivity of the downstream algorithm to residual cloudy-contaminated pixels. | Space Agencies, in coordination with CEOS-WGCV, should agree on a common and physically based definition of clouds, for easing inter-comparison of different cloud mask algorithms for optical sensors. |
| IDN-11 | The presence of undetected clouds or adjacency effects at the cloud edges can strongly impact accuracy of downstream products. On the other hand, there have been few theoretical studies to understand this problem and to quantitatively estimate the uncertainty associated to cloud screening in higher level land products. | Space Agencies, in coordination with the science community, should foster theoretical advances in order to rigorously estimate the uncertainty associated to the cloud mask, both for partially cloudy pixels and for clear pixels nearby a cloud. |
| IDN-12 | Terrestrial vegetated surfaces are generally highly anisotropic and heterogeneous at the medium resolution pixel scale. The two effects combine when assessing the quality of satellite-based SR products and it is difficult to disentangle the spatial and directional contribution. | Space Agencies, in coordination with the science community, should support theoretical advances, to fully understand the uncertainty associated to the validation of directional surface reflectance over typical land heterogenous vegetated surfaces. |
4.3. Level 2 Bio-Geophysical Land Products
- Land Surface Albedo is defined as the ratio of the radiant flux reflected from a unit surface area into the whole hemisphere to the incident radiant flux of hemispherical angular extent. Albedo measures include black-sky albedo, defined in the absence of a diffuse component (no atmospheric scattering), white-sky albedo, under isotropic illumination, and blue-sky albedo, under ambient conditions. Long-term historical observations from the Proba-V mission and the current S3 measurements from OLCI and SLSTR are being used within the C3S to derive coarse resolution global land surface albedo products [142].
- Fraction of absorbed photosynthetically active radiation (fAPAR) is defined as the fraction of solar photosynthetically active radiation (PAR) reaching the surface in the 400–700 nm spectral region that is absorbed by vegetation. fAPAR can be considered at a given time (e.g., instantaneous fAPAR) or daily integrated. All vegetation elements contribute to PAR absorption, both green elements, as well as other non-green elements such as trunks, senescent material and flowers. Satellite-based estimates of fAPAR currently differ in terms of the adopted definition (green, total, instantaneous, integrated), and this lack of a common definition is inducing discrepancies when inter-comparing products from different missions, although the largest source of differences is caused by the different underlying RTMs [143]. OLCI OGVI products (in the future to be renamed as GI-FAPAR), based on the legacy MERIS algorithm [21,22], provide a measure of instantaneous green fAPAR in the plant canopy.
- Leaf Area Index (LAI) is defined as one half of the total green (i.e., photosynthetically active) leaf area per unit horizontal ground surface area. Different definitions of LAI can be considered: the GAI (Green Area Index) has the same definition as LAI but includes only green elements, and the PAI (Plant Area Index) includes all elements, green and non-green. Similar to fAPAR the lack of consistent definition may cause discrepancies when inter-comparing satellite-based LAI products generated using different algorithms. The CGLS systematically provides global estimation of LAI at 1/3 km resolution derived from Proba-V [144] and now from Sentinel-3 observations.
- Terrestrial Chlorophyll Content. Chlorophyll is one of the most important foliar biochemicals, where the content within a vegetation canopy is related positively to both the productivity of the vegetation and the depth and width of the chlorophyll absorption feature in the reflectance spectra [23]. The S3 OTCI product, which is based on the legacy MERIS Terrestrial Chlorophyll Index (MTCI) algorithm, provide information on the chlorophyll content of vegetation (amount of chlorophyll per unit area of ground). This is a combination of information on area of leaves per unit area on ground (LAI) and the chlorophyll concentration of those leaves [23,24].
- Sun-Induced Fluorescence (SIF) is considered the most direct remote sensing signal to track photosynthetic activity and its dynamics [145,146]. The ESA FLEX mission aims to observe SIF in order to monitor the photosynthetic activity of different biomes and their interannual changes related to climate variability [13,14]. There is currently no active network to support systematic and global validation of SIF. ESA has been supporting the development of dedicated ground-based instrument for this purpose, called Fluorescence Box (Flox) [147,148], and is planning to deploy these instruments in various locations in order to properly support FLEX Cal/Val activities.
4.3.1. CEOS-LPV Best Practices
4.3.2. FRM4VEG Best Practices
4.3.3. CEOS-LPV Supersites
4.3.4. Existing Land Ground-Based Networks
- The AERONET network [52] is providing globally-spread, continuous and readily accessible Cal/Val data of aerosol optical, microphysical and radiative properties. Despite the fact that AERONET is focused on atmospheric measurements, it has been largely used in the land community, both as ancillary data as well as for indirect validation of SR products, as proposed within ACIX [118]. The major strength of AERONET is its spatiotemporal and geographical coverage and the consistency across the whole network, allowing to perform unbiased, comprehensive and statistically robust validation of satellite-based EO data at global scale.
- The National Science Foundation’s National Ecological Observatory Network (NEON) [156,157] provides open data from 81 field sites located in different ecosystems across the United States (US). Data collection methods are standardised across the sites and include automated measurements, observational field sampling and airborne remote sensing surveys. The NEON data catalogue includes over 175 data products, providing key information about plants, soil, freshwater and the atmosphere. The validation of vegetation variables, i.e., fAPAR, LAI, fraction of vegetation cover (fCover), within GBOV [53] (c.f. Section 4.3.5) mostly relies on NEON data, with clear limitation in terms of global coverage, since NEON observations are only representative of US biomes.
- The Surface Radiation Budget Network (SURFRAD) [158,159] was established with the primary objective to support climate research with accurate, continuous, long-term measurements of the surface radiation budget over US. Independent measures of upwelling and downwelling, solar and infrared radiation are the primary SURFRAD products. Observations from SURFRAD have been used for evaluating satellite-based estimates of surface radiation, as in GBOV [53], and for validating hydrologic, weather prediction and climate models.
- The Integrated Carbon Observation System (ICOS) [160] is a pan-European network aiming at quantifying and understanding the greenhouse gas balance of Europe and neighbouring regions. ICOS infrastructure includes more than 100 measurement stations in twelve European countries. These stations measure greenhouse gas concentrations in the atmosphere and fluxes over the terrestrial and marine ecosystems [161]. ICOS measurements are used within GBOV [53] to validate surface reflectance and albedo products. Inclusion of ICOS data for fAPAR, LAI and fCover, as well as LST, is currently under investigation within GBOV, although some adaptation of the measurement protocols will be required [3].
- FLUXNET [162] is a global network of micrometeorological tower sites, providing information for validating remote sensing products for net primary productivity (NPP), evaporation, and energy absorption. The network includes more than 800 active and historic flux measurement sites, dispersed across most of the world’s climate space and representative biomes [163]. At each FLUXNET tower site, the eddy covariance method is applied to quantify water, carbon and energy fluxes between the biosphere and atmosphere. FLUXNET data are used to complement the GBOV [53] database for validation of surface reflectance and albedo variables.
- The Terrestrial Ecosystem Research Network (TERN) [164] is Australia’s infrastructure for long-term ecosystem observations. The TERN database includes a large ensemble of validation data gathered during field campaigns (>1000 sites) [165]. In addition, as part of the TERN network, 10 sites were identified, which were intensively characterised (super sites) and are suitable for multi-instrumental land product validation and algorithm development. TERN data are used in the frame of GBOV [53] to expand geographical coverage in Australia continent for energy budget and soil moisture validation.
4.3.5. Ground-Based Observations for Validation (GBOV)
4.3.6. Field Campaigns and Advanced Technological Solutions
4.3.7. Validation Tools and Database
| ID | Status and Needs | Recommendations |
|---|---|---|
| IDN-13 | There is a clear geographical data gap, over the African, South American and Asian continents in the availability of Cal/Val data for vegetation parameters, notably fAPAR and LAI. | Space Agencies, in coordination with CEOS-LPV, should work towards filling the geographical gap for validation of vegetation parameters, mainly in Africa, Asia and South America. |
| IDN-14 | For some variables, notably for vegetation parameters (FAPAR, LAI), current validation capacity in Europe solely relies on non-European networks, particularly NEON, which is representative of only North America biomes. | ESA should support and promote a European funded network with long-term perspective for validation of satellite-based vegetation parameters. Leveraging of existing facilities (ICOS) should be explored for setting up such network |
| IDN-15 | Existing networks are not primarily designed for validation purposes; as a matter of fact, the lack of uncertainty information and the disparity of used protocols still limit their synergistic use for satellite-products validation. | Space Agencies, in coordination with CEOS-LPV, should foster adoption of community-endorsed Cal/Val best practices across existing networks and support the adaptation of these networks (upgrade protocols, improve uncertainty estimation) for meeting Cal/Val needs. |
| IDN-16 | The heterogeneity in data format, documentation, quality information and metadata availability in existing networks is still limiting their integrated usage for satellite products Cal/Val | Space Agencies, in coordination with CEOS-LPV, should support on-going effort (GBOV) in requesting Cal/Val data providers to meet community agreed standards for quality information, metadata, and documentation. |
| IDN-17 | Assessing maturity of existing networks to support Cal/Val needs is a laborious work. Moreover, this assessment should ideally be reported to networks’ owners for helping them to converge to common quality standards, so that to facilitate inter-operability. | Space Agencies, in coordination with CEOS-LPV, should promote adoption of Maturity Matrix concept across existing and future ground-based networks for Cal/Val for enhancing interoperability. |
| IDN-18 | Sustainability long-term still represents a major concern for existing and future Cal/Val networks. The lack of sustained funding is particularly urgent for operation and maintenance. | ESA should reinforce cooperation with national networks and promote within the EC the need for long-term sustainability. ESA to consider this need in the early phases of the mission design. |
| IDN-19 | ESA, in collaboration with EC, is developing a suite of innovative space-borne sensors focusing on land, mainly: FLEX and CHIME. There is a need to enhance preparedness to support Cal/Val needs for these new missions. | ESA, in cooperation with CEOS-LPV, should improve readiness of ground-based infrastructure to support Cal/Val needs of current and future optical land missions. The strategy should exploit synergies across missions, such as using super-sites for measuring multiple variables, and work towards filling the gaps, such as for SIF measurements. |
| IDN-20 | There is currently a lack of an integrated solution addressing Cal/Val needs of current Copernicus Sentinels. Synergies are under exploited with risk of duplicating the efforts and increasing cost in validation activities. | ESA should support on-going activities [180], working towards an integrated solution for sustaining Copernicus Sentinels Cal/Val needs. This includes promoting and exploiting synergies across existing and planned ESA and EC Cal/Val projects. |
| IDN-21 | Provision of FRM in a sustainable way over a globally representative network of FRM sites is necessary for an operational land Cal/Val system (to reach stage 4 in CEOS-LPV terms) and could be built based on contribution from Agencies and EO programmes. | ESA should continue support FRM4VEG project, working in the transition from research to an operational system of permanent FRM sites and to further expand their geographical coverage in the longer term. |
| IDN-22 | Community-agreed-upon protocols need to be developed for some terrestrial ECVs, notably for SR, fAPAR and phenology. | Space Agencies, in coordination with CEOS-LPV, should contribute in filling this gap in Cal/Val protocols and promote wide adoption by scientific community. |
| IDN-23 | CEOS-LPV protocols are living documents, this entails periodic revision to keep pace with evolution of methodologies and technological solutions, notably UAV-based systems, automated sensors and LiDAR systems. | Space Agencies, in coordination with CEOS-LPV, should work towards revising existing protocols, in particular for LAI, to include recent technological advances, such as, UAV-based, automated sensors, and LiDAR systems. |
| IDN-24 | Advanced technological solutions, such as UAV-based or automated systems, allow for addressing the issue of spatiotemporal upscaling. LiDAR systems allow for detailed characterisation of the site as well as for estimation of vegetation parameters. Yet, the accuracy of these systems needs to be carefully characterised and benchmarked against traditional methods. | Space Agencies, in coordination with CEOS-LPV, should promote inter-comparison exercises and evaluation studies to better characterise the accuracy of advanced technological solutions (UAV-based, low-cost automated sensors, LiDAR) against traditional methods, both for Cal/Val and for vegetation parameters estimation (fAPAR, LAI). |
| IDN-25 | Concerning bio-geophysical retrievals, progresses still need to be made to better resolve the contribution of the different elements of the canopy, e.g., green and senescent parts, to the LAI, PAI and fAPAR estimation. Furthermore, there is often inconsistency in the variable definition (e.g., fAPAR/LAI green vs. total), and this should be carefully taken into account when inter-comparing different products. | Space Agencies, in coordination with CEOS-LPV, should sustain progress in vegetation variables retrieval and modelling approaches (LAI, fAPAR) and promote inter-comparison exercises to advance in understanding the discrepancies in the currently used retrieval algorithms. |
| IDN-26 | The uptake of Cal/Val data from the EO satellite community is strongly limited by the difficulty in discovering, accessing, and using the available measurements, in particular for field campaigns. The adoption of FAIR (Findability, Accessibility, Interoperability, and Reusability) guiding principles [181] and the setting up of a centralised repository will greatly ease uptake of Cal/Val data. | Space Agencies, in coordination with CEOS-LPV, should sustain the effort in setting up a centralised repository of Cal/Val data for Land, following the FAIR guiding principles [181], to collect data acquired within current and future initiatives, such as FRM4VEG, the Joint Experiment for Crop Assessment and Monitoring (JECAM) [182], or FLEX Cal/Val campaigns. |
| IDN-27 | Online validation tools based on community-agreed protocols are needed to allow transparent and standardised validation. The OLIVE tool [175] was a valuable example in this respect, but it is currently not maintained and needs to be updated. | Space Agencies, in coordination with CEOS-LPV, should support the upgrade and secure the maintenance of the OLIVE tool. |
| IDN-28 | BELMANIP-2 collection of sites should be updated/improved. The updates should include using more recent land cover maps and optimising the sampling for S2 resolution. | Space Agencies, in coordination with CEOS-LPV, should support the evolution of BELMANIP-2 sites collection to optimise the sampling for S2 resolution. |
| IDN-29 | A dedicated cloud-based platform with focus on Land Cal/Val would ease the validation process by providing a centralised access to Cal/Val reference data, satellite match-up and analytics to perform quality assessment. | Space Agencies, in coordination with CEOS-LPV, should prepare the ground for a Cal/Val platform for Land, providing centralised access to reference datasets, satellite match-up and tools to assess the uncertainties of the relevant EO products. |
5. Overall Strategy and Readiness Level
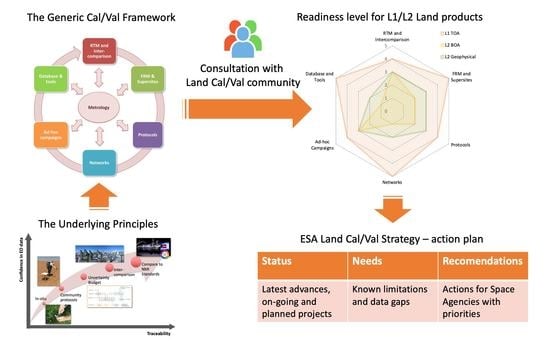
5.1. Overall Land Cal/Val Strategy
- Metrology—The application of metrological best practices is the central pillar underpinning the overall ESA Land Cal/Val strategy, since metrology provides the generic guidelines and community-agreed standards to achieve full traceability of the measurements and detailed characterisation of the uncertainty budget. The metrological practices shall be used as underlying principles for developing all other elements of the Cal/Val strategy.
- RTM and Inter-comparison—The use of RTM simulations allows advancing our understanding of the uncertainty budget associated to the validation, since instrument-related error sources can be fully characterised and decoupled from modelling and retrieval errors. Inter-comparison exercises are key to understand the discrepancies between the various algorithms used within the community, to address the current limitations and, in the longer-term, to converge to a community-agreed solution. RTM simulations are often essential to support algorithm inter-comparison, notably for building reference datasets, as in the case of ACIX [118].
- FRM and supersites—In order to properly assess the accuracy of satellite EO products, we need to have an initial set of “golden” sites that represent our best knowledge of the geophysical parameter(s) under validation. These sites are super-characterised and the in situ measurements are carried out using community-endorsed best practices. Both the FRM and CEOS-LPV supersites share these basic underlying principles, although they are addressed with different, yet complementary viewpoints. While the CEOS-LPV supersites concept stems from the need to assess inter-variables’ physical consistency, the FRM concept builds upon the fundamental requirement of adopting metrological practices in EO, ensuring traceability of the measurements and detailed uncertainty budget characterisation.
- Protocols—The availability of standard protocols is an essential element in establishling a common approach to the validation problem. When protocols are endorsed at CEOS-LPV level and widely accepted within the community, Cal/Val data from different networks and campaigns can be reliably merged, enhancing spatio-temporal sampling.
- Networks—Once the protocols and requirements for setting up a Cal/Val site are consolidated, they shall be replicated in a network of sites to enhance global coverage. The global network shall have sustained funding and ensure continuous operations, as well as possibly providing data in quasi-real time to support services, such as for GBOV [53], and guarantee that data are generated in a consistent manner across the sites with common approach for calibration and measurements and with harmonised data content, format definition and quality information.
- Ad-hoc campaigns—While networks are the foremost step for moving towards an operational Cal/Val system, the scientific and technological solutions will continue in parallel to evolve, for example, UAV-based and low-cost automated sensors. It is therefore critical to continue supporting ad-hoc Cal/Val campaigns for in-depth validation and for keeping pace with the evolutions in the science and technology domains. The outcomes of such campaigns are advanced protocols and devices, which can be injected into the overall Cal/Val cycle, quality certified following metrological practices and inter-comparison exercises. As these solutions will enhance their maturity level, they could be potentially considered for complementing and expanding the overall Cal/Val solution.
- Database and tools—The final stage of an operational Cal/Val system consists of providing the users with a consistent and fully automated tool, including satellite sub-settings, and embedded analytics for satellite products comparison with reference data using standardised procedures. This is the framework originally developed by CEOS-LPV with the OLIVE tool [175], which is now being replicated to other terrestrial ECVs [178]. A centralised database with associated tools is key to enhance uptake of Cal/Val data within the community and for fostering the adoption of community-agreed standardised procedures.
5.2. Readiness Level
| Element | Readiness | Comment |
|---|---|---|
| RTM and Intercomparison | 4/5 | Good understanding of radiometric uncertainties, though progress should be made to embed metrological practices in the mission design phase [IDN-01], to enhance discoverability of pre-launch characterisation data [IDN-02] and to improve characterisation of geometric mismatch errors [IDN-03]. |
| FRM and supersites | 5/5 | RadCalNet [107] sites are compliant to FRM guidelines since SI-traceability and metrological practices are fully embedded in the design. The TRUTHS mission [114] will allow reaching full SI-traceability in space. |
| Protocols | 4/5 | Community-agreed protocols have been developed in the past decades and consolidated in the frame of CEOS-IVOS and GSICS. Yet, there is a need to provide uncertainty per-pixel at Level 1 [IDN-04] and to enhance the accuracy of RTMs [IDN-05] and of the Lunar irradiance models [IDN-06]. |
| Networks | 5/5 | The RadCalNet network [107] is fully operational and will be expanded with additional new sites to increase geographical coverage. New technological solutions are also being successfully tested [183]. |
| Ad-hoc campaigns | 4/5 | Several ad-hoc campaigns and inter-comparison exercises were run in the past and there is a very good understanding of the required methodologies. |
| Database and Tools | 5/5 | Various databases are available, on ESA side, the DIMITRI tool, operationally used for S2 and S3 radiometric assessment [74]. |
| Element | Readiness | Comments |
|---|---|---|
| RTM and Intercomparison | 3/5 | Significant progresses were made thanks to ACIX [118], although there are still gaps in fully understanding the discrepancies between the AC algorithms and in characterising SR products’ uncertainties [IDN-12]. These challenges will be addressed within RAMI4ATM [125]. Similar knowledge and data gaps were identified for cloud mask validation [IDN-09, IDN-10, IDN-11]. |
| FRM and supersites | 3/5 | An initial set of super-sites has been defined as part of FRM4VEG following metrological practices. The SRIX4VEG [154] will build on that by consolidating best-practices with a focus on the use of UAV-based hyperspectral measurements. The readiness level for this element is therefore expected to rise in the next 2 years as a result of these activities. |
| Protocols | 2/5 | There are no community-endorsed protocols for SR validation, this is currently on-going work in the frame of FRM4VEG [152] and SRIX4VEG [154]. The readiness level is therefore expected to rise in the next 2 years. |
| Networks | 1/5 | No network is currently available for validating SR [IDN-07]. HYPERNETS project [136] aims to fulfil this need. Likewise, there is a lack of a global network for cloud mask validation [IDN-08]. |
| Ad-hoc campaigns | 3/5 | Several campaigns have been carried out in the past years using field spectrometry, airborne, and recently UAV-based spectrometry. The use of UAV platforms is today considered a very flexible and cost-effective solution. |
| Database and Tools | 1/5 | No database and tools are currently available for SR validation. |
| Element | Readiness | Comments |
|---|---|---|
| RTM and Intercomparison | 3/5 | Inter-comparisons of retrieval algorithms are recommended for quantifying cross-mission biases as well as for better assessing the discrepancies due to inconsistent variable definition (e.g., green Vs. total fAPAR) [IDN-25]. |
| FRM and supersites | 3/5 | FRM4VEG and CEOS-LPV supersites are the essential first step. Yet, there is a need to move towards sustained operations of permanent FRM sites [IDN-21]. In the Copernicus domain, there is a lack of an integrated solution to support Cal/Val needs of current and future missions [IDN-19, IDN-20]. |
| Protocols | 3/5 | Community-endorsed protocols have recently been published by CEOS-LPV for key ECVs, e.g., LST, Albedo, Soil moisture. However, there is a lack of protocols for SR, fAPAR and phenology [IDN-22] and a need to update and maintain protocols to keep pace with science and technological evolutions [IDN-23]. This is currently on-going work within CEOS-LPV. |
| Networks | 2/5 | A large number of regional and continental networks are currently available. However, the majority of them were not primarily designed for Cal/Val purposes. There is a need to embed Cal/Val practices across these networks and work towards harmonisation [IDN-15, IDN-16, IDN-17]. The MM concept, as in GAIA-CLIM, can facilitate network interoperability. Though, some gaps remain in terms of geographical coverage [IDN-13, IDN-14], and there is a need to ensure sustainability in the long-term [IDN-18]. |
| Ad-hoc campaigns | 3/5 | There is a deluge of Cal/Val data acquired as part of ad-hoc campaigns and new devices are being tested, in particular UAV-based. Yet, the accuracy of these new methods needs to be properly assessed [IDN-24]. |
| Database and Tools | 2/5 | There is an urgent need to upgrade and secure maintenance of the OLIVE tool [175] and update the used reference database [IDN-27, IDN-28]. Overall, there is an urgent need to enhance the discoverability and accessibility of Cal/Val data following FAIR guiding principles [IDN-26] and of a dedicated cloud-based platform for land Cal/Val [IDN-29]. |
6. Conclusions and Outlook
Author Contributions
Funding
Institutional Review Board Statement
Informed Consent Statement
Acknowledgments
Conflicts of Interest
References
- Quality Assurance Framework for Earth Observation (QA4EO) Web Portal. Available online: http://www.qa4eo.org/ (accessed on 31 May 2021).
- Global Earth Observation System of Systems (GEOSS) Web Portal. Available online: https://www.earthobservations.org/geoss.php (accessed on 31 May 2021).
- ESA GMQ Session, “ESA Workshop on Land Validation Strategy (30/11–1/12/2020): Highlights and Recommendations”; Report from Land Cal/Val WS 2020. Available online: https://earth.esa.int/eogateway/documents/20142/37627/LPV2020_Report_v1.3.pdf (accessed on 31 May 2021).
- European Copernicus Programme Web Portal. Available online: https://www.copernicus.eu/en (accessed on 31 May 2021).
- Drusch, M.; Del Bello, U.; Carlier, S.; Colin, O.; Fernandez, V.; Gascon, F.; Hoersch, B.; Isola, C.; Laberinti, P.; Martimort, P.; et al. Sentinel-2: ESA’s optical high-resolution mission for GMES operational services. Remote Sens. Environ. 2012, 120, 25–36. [Google Scholar] [CrossRef]
- Donlon, C.; Berruti, B.; Buongiorno, A.; Ferreira, M.H.; Féménias, P.; Frerick, J.; Goryl, P.; Klein, U.; Laur, H.; Mavrocordatos, C.; et al. The global monitoring for environment and security (GMES) sentinel-3 mission. Remote Sens. Environ. 2012, 120, 37–57. [Google Scholar] [CrossRef]
- Dierckx, W.; Sterckx, S.; Benhadj, I.; Livens, S.; Duhoux, G.; Van Achteren, T.; Francois, M.; Mellab, K.; Saint, G. PROBA-V mission for global vegetation monitoring: Standard products and image quality. Int. J. Remote Sens. 2014, 35, 2589–2614. [Google Scholar] [CrossRef]
- Copernicus Global Land Service (CGLS) Web Portal. Available online: https://land.copernicus.eu/global/index.html (accessed on 31 May 2021).
- Copernicus Climate Change Service (C3S) Web Portal. Available online: https://climate.copernicus.eu/ (accessed on 31 May 2021).
- Niro, F. Evaluation of orbital drift effect on Proba-V surface reflectances time series. Remote Sens. 2021, 13, 2250. [Google Scholar] [CrossRef]
- ESA Web Page. Available online: https://www.esa.int/Enabling_Support/Space_Engineering_Technology/Proba_Missions/Ending_global_plant_tracking_Proba-V_assigned_new_focus (accessed on 31 May 2021).
- Saunier, S.; Louis, J.; Debaecker, V.; Beaton, T.; Cadau, E.G.; Boccia, V.; Gascon, F. Sen2like, a tool to generate sentinel-2 harmonised surface reflectance products-first results with Landsat-8. In Proceedings of the IGARSS 2019 IEEE International Geoscience and Remote Sensing Symposium, Yokohama, Japan, 28 July 28–2 August 2019; pp. 5650–5653. [Google Scholar]
- Moreno, J.F.; Goulas, Y.; Huth, A.; Middleton, E.; Miglietta, F.; Mohammed, G.; Nedbal, L.; Rascher, U.; Verhoef, W.; Drusch, M. Very high spectral resolution imaging spectroscopy: The Fluorescence Explorer (FLEX) mission. In Proceedings of the 2016 IEEE International Geoscience and Remote Sensing Symposium, Beijing, China, 10–15 July 2016; pp. 264–267. [Google Scholar]
- Drusch, M.; Moreno, J.; Del Bello, U.; Franco, R.; Goulas, Y.; Huth, A.; Kraft, S.; Middleton, E.M.; Miglietta, F.; Mohammed, G.; et al. The fluorescence explorer mission concept—ESA’s earth explorer 8. IEEE Trans. Geosci. Remote Sens. 2016, 55, 1273–1284. [Google Scholar] [CrossRef]
- Nieke, J.; Rast, M. Towards the copernicus hyperspectral imaging mission for the environment (CHIME). In Proceedings of the IGARSS 2018 IEEE International Geoscience and Remote Sensing Symposium, Valencia, Spain, 22–27 July 2018; pp. 157–159. [Google Scholar]
- Koetz, B.; Bastiaanssen, W.; Berger, M.; Defourney, P.; Del Bello, U.; Drusch, M.; Drinkwater, M.; Duca, R.; Fernandez, V.; Ghent, D.; et al. High spatio-temporal resolution land surface temperature mission—A Copernicus candidate mission in support of agricultural monitoring. In Proceedings of the IGARSS 2018–2018 IEEE International Geoscience and Remote Sensing Symposium, Valencia, Spain, 22–27 July 2018; pp. 8160–8162. [Google Scholar]
- Sentinel-2 Product Specifications Document. Available online: https://sentinel.esa.int/documents/247904/685211/Sentinel-2-Products-Specification-Document (accessed on 31 May 2021).
- Sentinel-2 MSI-Level-2A Algorithm Theoretical Basis Document (ATBD). Available online: https://earth.esa.int/c/document_library/get_file?folderId=349490&name=DLFE-4518.pdf (accessed on 31 May 2021).
- Sentinel-3 OLCI Level 1 Products Specifications. Available online: https://sentinels.copernicus.eu/web/sentinel/user-guides/sentinel-3-olci/processing-levels/level-1 (accessed on 31 May 2021).
- Sentinel-3 SLSTR Level 1 Products Specifications. Available online: https://sentinels.copernicus.eu/web/sentinel/user-guides/Sentinel-3-slstr/product-types/level-1b (accessed on 31 May 2021).
- Gobron, N.; Pinty, B.; Mélin, F.; Taberner, M.; Verstraete, M.M.; Robustelli, M.; Widlowski, J.L. Evaluation of the MERIS/ENVISAT FAPAR product. Adv. Space Res. 2007, 39, 105–115. [Google Scholar] [CrossRef]
- Gobron, N.; Pinty, B.; Aussedat, O.; Taberner, M.; Faber, O.; Mélin, F.; Lavergne, T.; Robustelli, M.; Snoeij, P. Uncertainty estimates for the FAPAR operational products derived from MERIS—Impact of top-of-atmosphere radiance uncertainties and validation with field data. Remote Sens. Environ. 2008, 112, 1871–1883. [Google Scholar] [CrossRef]
- Dash, J.; Curran, J. The MERIS Terrestrial Chlorophyll Index. Int. J. Remote Sens. 2004, 25, 5403–5413. [Google Scholar] [CrossRef]
- Pastor-Guzman, J.; Brown, L.; Morris, H.; Bourg, L.; Goryl, P.; Dransfeld, S.; Dash, J. The Sentinel-3 OLCI Terrestrial Chlorophyll Index (OTCI): Algorithm Improvements, Spatiotemporal Consistency and Continuity with the MERIS Archive. Remote Sens. 2020, 12, 2652. [Google Scholar] [CrossRef]
- Sentinel-3 SYN Algorithm Theoretical Basis Document (ATBD). Available online: https://earth.esa.int/documents/247904/349589/SYN_L2-3_ATBD.pdf (accessed on 31 May 2021).
- Wolters, E.; Dierckx, W.; Iordache, M.D.; Swinnen, E. PROBA-V Products User Manual. VITO, 2014. Available online: http://proba-v.vgt.vito.be/sites/default/files/Product_User_Manual.pdf (accessed on 31 May 2021).
- Schaepman-Strub, G.; Schaepman, M.E.; Painter, T.H.; Dangel, S.; Martonchik, J.V. Reflectance quantities in optical remote sensing—Definitions and case studies. Remote Sens. Environ. 2006, 103, 27–42. [Google Scholar] [CrossRef]
- GSICS Web Site. Available online: https://gsics.wmo.int (accessed on 31 May 2021).
- CEOS Infrared and Visible Optical Sensors Subgroup (CEOS-IVOS) Web Site. Available online: http://ceos.org/ourwork/workinggroups/wgcv/subgroups/ivos/ (accessed on 31 May 2021).
- CEOS Land Surface Imaging Virtual Constellation (LSI-VC) Web Site Site. Available online: http://ceos.org/ourwork/virtual-constellations/lsi/ (accessed on 31 May 2021).
- Lewis, A.; Lacey, J.; Mecklenburg, S.; Ross, J.; Siqueira, A.; Killough, B.; Szantoi, Z.; Tadono, T.; Rosenavist, A.; Goryl, P.; et al. CEOS analysis ready data for Land (CARD4L) overview. In Proceedings of the IGARSS 2018 IEEE International Geoscience and Remote Sensing Symposium, Valencia, Spain, 22–27 July 2018; pp. 7407–7410. [Google Scholar]
- CEOS Land Products Validation (LPV) Group Web Site. Available online: https://lpvs.gsfc.nasa.gov/ (accessed on 31 May 2021).
- Land Product Validation Workshop 2018 Web Site. Available online: https://earth.esa.int/eogateway/events/lpve-2018-land-product-validation-and-evolution-workshop?text=LPV+2018 (accessed on 31 May 2021).
- ESA Sentinel-2 Validation Team Meeting 4th. Available online: https://nikal.eventsair.com/NikalWebsitePortal/4th-sentinel-2-validation-team-meeting/esa (accessed on 31 May 2021).
- ESA-EUMETSAT Sentinel-3 Validation Team Web Site. Available online: https://www.s3vt.org/QuickEventWebsitePortal/sentinel-3-validation-team-s3vt/esa (accessed on 31 May 2021).
- CEOS Terms and Definition Web Page. Available online: http://calvalportal.ceos.org/t-d_wiki (accessed on 31 May 2021).
- Justice, C.; Belward, A.; Morisette, J.; Lewis, P.; Privette, J.; Baret, F. Developments in the ’validation’ of satellite sensor products for the study of the land surface. Int. J. Remote Sens. 2000, 21, 3383–3390. [Google Scholar] [CrossRef]
- Joint Committee for Guides in Metrology (JCGM). International Vocabulary of Metrology—Basic and General Concepts and Associated Terms, BIPM, Sèvres, France. Available online: https://www.bipm.org/utils/common/documents/jcgm/JCGM_200_2012.pdf (accessed on 31 May 2021).
- Bojinski, S.; Verstraete, M.; Peterson, T.C.; Richter, C.; Simmons, A.; Zemp, M. The concept of essential climate variables in support of climate research, applications, and policy. Bull. Am. Meteorol. Soc. 2014, 95, 1431–1443. [Google Scholar] [CrossRef]
- Nightingale, J.; Boersma, K.F.; Muller, J.; Compernolle, S.; Lambert, J.C.; Blessing, S.; Giering, R.; Gobron, N.; De Smedt, I.; Coheur, P.; et al. Quality assurance framework development based on six new ECV data products to enhance user confidence for climate applications. Remote Sens. 2018, 10, 1254. [Google Scholar] [CrossRef] [Green Version]
- Nightingale, J.; Mittaz, J.; Douglas, S.; Dee, D.; Ryder, J.; Taylor, M.; Old, C.; Dieval, C.; Fouron, C.; Duveau, G.; et al. Ten priority science gaps in assessing climate data record quality. Remote Sens. 2019, 11, 986. [Google Scholar] [CrossRef] [Green Version]
- JCGM. Evaluation of Measurement Data—Guide to the Expression of Uncertainty in Measurement JCGM 100:2008, GUM 1995 with Minor Corrections, First Edition September 2008. Available online: http://www.bipm.org/utils/common/documents/jcgm/JCGM_100_2008_E.pdf (accessed on 31 May 2021).
- Gorroño, J.; Fomferra, N.; Peters, M.; Gascon, F.; Underwood, C.I.; Fox, N.; Kirches, G.; Brockmann, C. A radiometric uncertainty tool for the Sentinel 2 mission. Remote Sens. 2017, 9, 178. [Google Scholar] [CrossRef] [Green Version]
- Gorroño, J.; Hunt, S.; Scanlon, T.; Banks, A.; Fox, N.; Woolliams, E.; Underwood, C.; Gascon, F.; Peters, M.; Fomferra, N.; et al. Providing uncertainty estimates of the Sentinel-2 top-of-atmosphere measurements for radiometric validation activities. Eur. J. Remote Sens. 2018, 51, 650–666. [Google Scholar] [CrossRef] [Green Version]
- S2 RUT GitHub Tool Repository. Available online: https://github.com/senbox-org/snap-rut (accessed on 31 May 2021).
- Smith, D.; Hunt, S.E.; Etxaluze, M.; Peters, D.; Nightingale, T.; Mittaz, J.; Woolliams, E.R.; Polehampton, E. Traceability of the Sentinel-3 SLSTR Level-1 Infrared Radiometric Processing. Remote Sens. 2021, 13, 374. [Google Scholar] [CrossRef]
- Immler, F.J.; Dykema, J.; Gardiner, T.; Whiteman, D.N.; Thorne, W.; Vömel, H. Reference quality upper-air measurements: Guidance for developing GRUAN data products. Atmos. Meas. Tech. 2010, 3, 1217–1231. [Google Scholar] [CrossRef] [Green Version]
- Loew, A.; Bell, W.; Brocca, L.; Bulgin, C.E.; Burdanowitz, J.; Calbet, X.; Donner, R.V.; Ghent, D.; Gruber, A.; Kaminski, T.; et al. Validation practices for satellite-based Earth observation data across communities. Rev. Geophys. 2017, 55, 779–817. [Google Scholar] [CrossRef] [Green Version]
- Vermote, E.F.; Kotchenova, S. Atmospheric correction for the monitoring of land surfaces. J. Geophys. Res. Atmos. 2008, 113, D23S90. [Google Scholar] [CrossRef]
- Nappo, C.J.; Caneill, J.Y.; Furman, R.W.; Gifford, F.A.; Kaimal, J.C.; Kramer, M.L.; Lockhart, T.J.; Pendergast, M.M.; Pielke, R.A.; Randerson, D.; et al. The Workshop on the Representativeness of Meteorological-Observations, June 1981, Boulder, Colorado. Bull. Am. Meteorol. Soc. 1982, 63, 761–764. [Google Scholar]
- Baret, F.; Weiss, M.; Allard, D.; Garrigue, S.; Leroy, M.; Jeanjean, H.; Fernandes, R.; Myneni, R.; Privette, J.; Morisette, J. VALERI: A Network of Sites and a Methodology for the Validation of Medium Spatial Resolution Land Satellite Products. Remote Sens. Environ. 2005, 76, 36–39. [Google Scholar]
- Holben, B.N.; Eck, T.F.; Slutsker, I.A.; Tanre, D.; Buis, J.; Setzer, A.; Vermote, E.; Reagan, J.A.; Kaufman, Y.J.; Nakajima, T.; et al. AERONET—A federated instrument network and data archive for aerosol characterization. Remote Sens. Environ. 1998, 66, 1–16. [Google Scholar] [CrossRef]
- Ground-Based Observations for Validation (GBOV) web site. Available online: https://gbov.acri.fr/ (accessed on 31 May 2021).
- Hollmann, R.; Merchan, C.J.; Saunders, R.; Downy, C.; Buchwitz, M.; Cazenave, A.; Chuvieco, E.; Defourny, P.; de Leeuw, G.; Forsberg, R.; et al. The ESA climate change initiative: Satellite data records for essential climate variables. Bull. Amer. Meteor. Soc. 2013, 94, 1541–1552. [Google Scholar] [CrossRef] [Green Version]
- Merchant, C.J.; Paul, F.; Popp, T.; Ablain, M.; Bontemps, S.; Defourny, P.; Hollmann, R.; Lavergne, T.; Laeng, A.; Leeuw, G.D.; et al. Uncertainty information in climate data records from Earth observation. Earth Syst. Sci. Data 2017, 9, 511–527. [Google Scholar] [CrossRef] [Green Version]
- Donlon, C.J.; Wimmer, W.; Robinson, I.; Fisher, G.; Ferlet, M.; Nightingale, T.; Bras, B. A second-generation blackbody system for the calibration and verification of seagoing infrared radiometers. J. Atmos. Ocean. Technol. 2014, 31, 1104–1127. [Google Scholar] [CrossRef]
- Theocharous, E.; Usadi, E.; Fox, N. CEOS comparison of IR brightness temperature measurements in support of satellite validation. In Part I: Laboratory and Ocean Surface Temperature Comparison of Radiation Thermometers; National Physical Laboratory: Teddington, UK, 2010; p. 130. [Google Scholar]
- Fox, N.; Greening, M.C. A Guide to Comparisons-Organisation, Operation and Analysis to Establish Measurement Equivalence to Underpin the Quality Assurance Requirements of Geo, Versio-4, QA4EO-QAEO-GEN-DQK-004. 2010. Available online: http://qa4eo.org/docs/QA4EO-QAEO-GEN-DQK-004_v4.0.pdf (accessed on 31 May 2021).
- Nightingale, J.; Schaepman-Strub, G.; Nickeson, J.; Baret, F.; Herold, M. Assessing Satellite-Derived Land Product Quality for Earth System Science Applications: Results from the CEOS-LPV Sub-Group. In Proceedings of the International Symposium on Remote Sensing of Environment, Sydney, Australia, 10–15 April 2011. [Google Scholar]
- CCI Holtzer-Popp Maturity Matrix. Available online: http://cci.esa.int/sites/default/files/content/docs/Holzer-Popp_maturity_matrix_022014.pdf (accessed on 31 May 2021).
- ESA Climate Change Initiative Web Site. Available online: https://climate.esa.int/en/ (accessed on 31 May 2021).
- GAIA-CLIM Maturity Matrix. Available online: http://www.gaia-clim.eu/page/maturity-matrix-assessment (accessed on 31 May 2021).
- ESA Earthnet Data Assessment Pilot (EDAP) Project’s Web-Site. Available online: https://earth.esa.int/eogateway/activities/edap (accessed on 31 May 2021).
- ESA VH-RODA Workshop 2021. Available online: https://earth.esa.int/eogateway/events/vh-roda-workshop-2021 (accessed on 31 May 2021).
- CEOS Analysis Ready Data Web Site. Available online: http://ceos.org/ard/ (accessed on 31 May 2021).
- USGS Landsat Collection 2 Web Site. Available online: https://www.usgs.gov/core-science-systems/nli/landsat/landsat-collection-2?qt-science_support_page_related_con=1#qt-science_support_page_related_con (accessed on 31 May 2021).
- Ralf, G.; Quast, R.; Mittaz, J.D.; Hunt, S.E.; Harris, M.; Woolliams, E.R.; Merchant, C.J. A novel framework to harmonise satellite data series for climate applications. Remote Sens. 2019, 11, 1002. [Google Scholar] [CrossRef] [Green Version]
- EC Fiduceo Project’s Web Site. Available online: https://cordis.europa.eu/project/id/638822 (accessed on 31 May 2021).
- Claverie, M.; Ju, J.; Masek, J.G.; Dungan, J.L.; Vermote, E.F.; Roger, J.C.; Skakun, S.V.; Justice, C. The Harmonized Landsat and Sentinel-2 surface reflectance data set. Remote Sens. Environ. 2018, 219, 145–161. [Google Scholar] [CrossRef]
- Delwart, S.; Preusker, R.; Bourg, L.; Santer, R.; Ramon, D.; Fischer, J. MERIS in-flight spectral calibration. Int. J. Remote Sens. 2007, 28, 479–496. [Google Scholar] [CrossRef] [Green Version]
- XIONG, X.J.; Angal, A.; Sun, J.; Choi, T.J.; Johnson, E. On-orbit performance of MODIS solar diffuser stability monitor. J. Appl. Remote Sens. 2014, 8, 083514. [Google Scholar] [CrossRef] [Green Version]
- Sterckx, S.; Adriaensen, S.; Dierckx, W.; Bouvet, M. In-orbit radiometric calibration and stability monitoring of the PROBA-V instrument. Remote Sensing 2016, 8, 546. [Google Scholar] [CrossRef] [Green Version]
- Chander, G.; Hewison, T.J.; Fox, N.; Wu, X.; Xiong, X.; Blackwell, W.J. Overview of intercalibration of satellite instruments. IEEE Trans. Geosci. Remote Sens. 2013, 51, 1056–1080. [Google Scholar] [CrossRef]
- Database for Imaging Multi-spectral Instruments and Tools for Radiometric Intercomparison (DIMITRI) Web Portal. Available online: https://dimitri.argans.co.uk/ (accessed on 31 May 2021).
- Cosnefroy, H.; Leroy, M.; Briottet, X. Selection and characterization of Saharan and Arabian desert sites for the calibration of optical satellite sensors. Remote Sens. Environ. 1996, 58, 101–114. [Google Scholar] [CrossRef]
- CEOS Endorsed PICS Sites List Provided within the CEOS Cal/Val Portal. Available online: http://calvalportal.ceos.org/ca/pics_sites;jsessionid=8199EA6A87B6423AC217D19B9E2F2347 (accessed on 31 May 2021).
- Govaerts, Y.M. Sand dune ridge alignment effects on surface BRF over the Libya-4 CEOS calibration site. Sensors 2015, 15, 3453–3470. [Google Scholar] [CrossRef] [PubMed] [Green Version]
- Cedric, B.; Briottet, X.; Bréon, F.-M.; Viallefont-Robinet, F.; Bouvet, M. Revisiting pseudo invariant calibration sites (PICS) over sand deserts for vicarious calibration of optical imagers at 20 km and 100 km scales. Remote Sens. 2019, 11, 1166. [Google Scholar]
- PICSCAR Web Portal. Available online: https://picscar.magellium.com/ (accessed on 31 May 2021).
- Govaerts, Y.M. “Estimating the Accuracy of 1D Radiative Transfer Models over the Libya-4 Site”. Available online: https://www.eradiate.eu/site/post/20191210-rtm_accuracy/ (accessed on 31 May 2021).
- Eradiate Web Site. Available online: http://eradiate.eu/site/ (accessed on 31 May 2021).
- Doelling, D.R.; Morstad, D.; Scarino, B.R.; Bhatt, R.; Gopalan, A. The characterization of deep convective clouds as an invariant calibration target and as a visible calibration technique. IEEE Trans. Geosci. Remote Sens. 2012, 51, 1147–1159. [Google Scholar] [CrossRef]
- Doelling, D.; Haney, C.; Bhatt, R.; Scarino, B.; Gopalan, A. Geostationary visible imager calibration for the CERES SYN1deg edition 4 product. Remote Sens. 2018, 10, 288. [Google Scholar] [CrossRef] [Green Version]
- Vermote, E.; Kaufman, Y.J. Absolute calibration of AVHRR visible and near infrared channels using ocean and cloud views. Int. J. Remote Sens. 1995, 16, 2317–2340. [Google Scholar] [CrossRef]
- Lamquin, N.; Bruniquel, V.; Gascon, F. Sentinel-2 L1C radiometric validation using deep convective clouds observations. Eur. J. Remote Sens. 2018, 51, 11–27. [Google Scholar] [CrossRef]
- Lamquin, N.; Bourg, L.; Clerc, S.; Donlon, C. OLCI A/B tandem phase analysis, part 3: Post-tandem monitoring of cross-calibration from statistics of Deep Convective Clouds observations. Remote Sens. 2020, 12, 3105. [Google Scholar] [CrossRef]
- Stone, T.C. Radiometric calibration stability and inter-calibration of solar-band instruments in orbit using the moon. In Proceedings of the SPIE Earth Observing Systems XIII, San Diego, CA, USA, 11–13 August 2008. [Google Scholar]
- Meygret, A.; Latry, C.; Kelbert, A.; Blanchet, G. PLEIADES high resolution optical sensors radiometric and spatial calibration based on stars. In Earth Observing Systems XXIV. Int. Soc. Opt. Photonics 2019, 11127, 1112720. [Google Scholar]
- Sun, J.; Angal, A.; Xiong, X.; Chen, H.; Geng, X.; Wu, A.; Choi, T.; Chu, M. MODIS reflective solar bands calibration improvements in Collection 6. In Earth Observing Missions and Sensors: Development, Implementation, and Characterization II. Int. Soc. Opt. Photonics 2012, 8528, 85280N. [Google Scholar]
- Morfitt, R.; Barsi, J.; Levy, R.; Markham, B.; Micijevic, E.; Ong, L.; Scaramuzza, P.; Vanderwerff, K. Landsat-8 Operational Land Imager (OLI) radiometric performance on-orbit. Remote Sens. 2015, 7, 2208–2237. [Google Scholar] [CrossRef] [Green Version]
- Wilson, N.; Greenberg, J.; Jumpasut, A.; Collison, A.; Weichelt, H. Absolute Radiometric Calibration of Planet Dove Satellites, Flocks 2p & 2e; Planet: San Francisco, CA, USA, 2017; 2p. [Google Scholar]
- Stone, T.C.; Kieffer, H.H. Assessment of uncertainty in ROLO lunar irradiance for on-orbit calibration. In Earth Observing Systems IX. Int. Soc. Opt. Photonics 2004, 5542, 300–310. [Google Scholar]
- Stone, T.C.; Kieffer, H.; Lukashin, C.; Turpie, K. The moon as a climate-quality radiometric calibration reference. Remote Sens. 2020, 12, 1837. [Google Scholar] [CrossRef]
- Wagner, S.C.; Hewison, T.; Stone, T.; Lacherade, S.; Fougnie, B.; Xiong, X. A summary of the joint GSICS–CEOS/IVOS lunar calibration workshop: Moving towards intercalibration using the Moon as a transfer target. In Sensors, Systems, and Next-Generation Satellites XIX. Int. Soc. Opt. Photonics 2015, 9639, 96390Z. [Google Scholar]
- EUMETSAT Lunar Model. Available online: https://www.eumetsat.int/lunar-calibration (accessed on 31 May 2021).
- Choi, T.; Shao, X.; Cao, C. On-orbit radiometric calibration of Suomi NPP VIIRS reflective solar bands using the Moon and solar diffuser. Appl. Opt. 2018, 57, 9533–9542. [Google Scholar] [CrossRef] [PubMed]
- Lunar Irradiance Model ESA (LIME). Available online: http://calvalportal.ceos.org/lime;jsessionid=D4529A9DCB79ABBDD2CE4187D45557CB (accessed on 31 May 2021).
- Taylor, S.; Adriaensen, S.; Toledano, C.; Barreto, Á.; Woolliams, E.; Bouvet, M. LIME: The Lunar Irradiance Model of the European Space Agency. In Proceedings of the EGU General Assembly 2021, Online Event, 19–30 April 2021. [Google Scholar]
- Neneman, M.; Wagner, S.; Bourg, L.; Blanot, L.; Bouvet, M.; Adriaensen, S.; Nieke, J. Use of Moon Observations for Characterization of Sentinel-3B Ocean and Land Color Instrument. Remote Sens. 2020, 12, 2543. [Google Scholar] [CrossRef]
- Presentation of the Lunar Irradiance Model Inter-Comparison Exercise Made by T. Stone (USGS) during GSICS 2021 Annual Meeting, See Lunar Session within the GSICS Web Portal. Available online: http://gsics.atmos.umd.edu/bin/view/Development/Annual2021 (accessed on 30 June 2021).
- Chander, G.; Mishra, N.; Helder, D.L.; Aaron, D.B.; Angal, A.; Choi, T.; Xiong, X.; Doelling, D.R. Applications of spectral band adjustment factors (SBAF) for cross-calibration. IEEE Trans. Geosci. Remote Sens. 2012, 51, 1267–1281. [Google Scholar] [CrossRef]
- Cao, C.; Xiong, X.; Wu, A.; Wu, X. Assessing the consistency of AVHRR and MODIS L1B reflectance for generating fundamental climate data records. J. Geophys. Res. Atmos. 2008, 113. [Google Scholar] [CrossRef] [Green Version]
- Clerc, S.; Donlon, C.; Borde, F.; Lamquin, N.; Hunt, S.E.; Smith, D.; McMillan, M.; Mittaz, J.; Woolliams, E.; Hammond, M.; et al. Benefits and lessons learned from the Sentinel-3 tandem phase. Remote Sens. 2020, 12, 2668. [Google Scholar] [CrossRef]
- Lamquin, N.; Clerc, S.; Bourg, L.; Donlon, C. OLCI A/B tandem phase analysis, part 1: Level 1 homogenisation and harmonisation. Remote Sens. 2020, 12, 1804. [Google Scholar] [CrossRef]
- Lamquin, N.; Déru, A.; Clerc, S.; Bourg, L.; Donlon, C. OLCI A/B tandem phase analysis, part 2: Benefits of sensors harmonisation for Level 2 products. Remote Sens 2020, 12, 2702. [Google Scholar] [CrossRef]
- Hunt, S.E.; Mittaz, J.; Smith, D.; Polehampton, E.; Yemelyanova, R.; Woolliams, E.R.; Donlon, C. Comparison of the Sentinel-3A and B SLSTR Tandem Phase Data using metrological principles. Remote Sens. 2020, 12, 2893. [Google Scholar] [CrossRef]
- Bouvet, M.; Thome, K.; Berthelot, B.; Bialek, A.; Czapla-Myers, J.; Fox, N.; Goryl, P.; Henry, P.; Ma, L.; Marcq, S.; et al. RadCalNet: A radiometric calibration network for Earth observing imagers operating in the visible to shortwave infrared spectral range. Remote Sens. 2019, 11, 2401. [Google Scholar] [CrossRef] [Green Version]
- RadCalNet Web Portal. Available online: https://www.radcalnet.org/ (accessed on 31 May 2021).
- Sterckx, S.; Wolters, E. Radiometric top-of-atmosphere reflectance consistency assessment for landsat 8/OLI, Sentinel-2/MSI, PROBA-V, and DEIMOS-1 over Libya-4 and RadCalNet calibration sites. Remote Sens. 2019, 11, 2253. [Google Scholar] [CrossRef] [Green Version]
- Banks, A.C.; Hunt, S.E.; Gorroño, J.; Scanlon, T.; Woolliams, E.R.; Fox, N. A comparison of validation and vicarious calibration of high and medium resolution satellite-borne sensors using RadCalNet. In Sensors, Systems, and Next-Generation Satellites XXI. Int. Soc. Opt. Photonics 2017, 10423, 10423A. [Google Scholar]
- Jing, X.; Leigh, L.; Teixeira Pinto, C.; Helder, D. Evaluation of RadCalNet Output Data Using Landsat 7, Landsat 8, Sentinel 2A, and Sentinel 2B Sensors. Remote Sens. 2019, 11, 541. [Google Scholar] [CrossRef] [Green Version]
- Alhammoud, B.; Jackson, J.; Clerc, S.; Arias, M.; Bouzinac, C.; Gascon, F.; Cadau, E.G.; Iannone, R.Q.; Boccia, V. Sentinel-2 Level-1 Radiometry Assessment Using Vicarious Methods from DIMITRI Toolbox and Field Measurements From RadCalNet Database. IEEE J. Sel. Top. Appl. Earth Obs. Remote Sens. 2019, 12, 3470–3479. [Google Scholar] [CrossRef]
- TRUTHS Web Portal at NPL. Available online: https://www.npl.co.uk/earth-observation/truths (accessed on 31 May 2021).
- Fox, N.; Green, P. Traceable radiometry underpinning terrestrial-and helio-studies (TRUTHS): An element of a space-based climate and calibration observatory. Remote Sens. 2020, 12, 2400. [Google Scholar] [CrossRef]
- Wielicki, B.A.; Young, D.F.; Mlynczak, M.G.; Thome, K.J.; Leroy, S.; Corliss, J.; Anderson, J.G.; Ao, C.O.; Bantges, R.; Best, F.; et al. Achieving climate change absolute accuracy in orbit. Bull. Am. Meteorol. Soc. 2013, 94, 1519–1539. [Google Scholar] [CrossRef] [Green Version]
- Shea, Y.; Fleming, G.; Kopp, G.; Lukashin, C.; Pilewskie, P.; Smith, P.; Thome, K.; Wielicki, B.; Liu, X.; Wu, W. Clarreo Pathfinder: Mission Overview and Current Status. In Proceedings of the IGARSS 2020 IEEE International Geoscience and Remote Sensing Symposium, Virtual Symposium, 26 September–2 October 2020; pp. 3286–3289. [Google Scholar]
- Bréon, F.M.; Vermote, E. Correction of MODIS surface reflectance time series for BRDF effects. Remote Sens. Environ. 2012, 125, 1–9. [Google Scholar] [CrossRef]
- Doxani, G.; Vermote, E.; Roger, J.C.; Gascon, F.; Adriaensen, S.; Frantz, D.; Hagolle, O.; Hollstein, A.; Kirches, G.; Li, F.; et al. Atmospheric correction inter-comparison exercise. Remote Sens. 2018, 10, 352. [Google Scholar] [CrossRef] [Green Version]
- Kotchenova, S.Y.; Vermote, E.F.; Matarrese, R.; Klemm, F.J., Jr. Validation of a vector version of the 6S radiative transfer code for atmospheric correction of satellite data. Part I: Path radiance. Opt. Soc. Am. Appl. Opt. 2006, 45, 6762–6774. [Google Scholar]
- Vermote, E.; Doxani, G.; Roger, J.C.; Gascon, F.; Skakun, S. Atmospheric Correction Inter-Comparison Exercise II. In Proceedings of the American Geophysical Union (AGU) Fall Meeting 2019, San Francisco, CA, USA, 9–13 December 2019. [Google Scholar]
- Pahlevan, N.; Mangin, A.; Balasubramanian, S.V.; Smith, B.; Alikas, K.; Arai, K.; Barbosa, C.; Bélanger, S.; Binding, C.; Bresciani, M.; et al. ACIX-Aqua: A global assessment of atmospheric correction methods for Landsat-8 and Sentinel-2 over lakes, rivers, and coastal waters. Remote Sens. Environ. 2021, 258, 112366. [Google Scholar] [CrossRef]
- Emde, C.; Buras-Schnell, R.; Kylling, A.; Mayer, B.; Gasteiger, J.; Hamann, U.; Kylling, J.; Richter, B.; Pause, C.; Dowling, T.; et al. The libradtran software package for radiative transfer calculations. Geosci. Model Dev. 2016, 9, 1647–1672. [Google Scholar] [CrossRef] [Green Version]
- Berk, A.; Conforti, P.; Kennett, R.; Perkins, T.; Hawes, F.; van den Bosch, J. MODTRAN® 6: A major upgrade of the MODTRAN® radiative transfer code. In Proceedings of the 2014 6th Workshop on Hyperspectral Image and Signal Processing: Evolution in Remote Sensing (WHISPERS), Lausanne, Switzerland, 24–27 June 2014; pp. 1–4. [Google Scholar] [CrossRef]
- Kotchenova, S.Y.; Vermote, E.F.; Levy, R.; Lyapustin, A. Radiative transfer codes for atmospheric correction and aerosol retrieval: Intercomparison study. Appl. Opt. 2008, 47, 2215–2226. [Google Scholar] [CrossRef] [PubMed] [Green Version]
- RAdiation Transfer Model Intercomparison for Atmosphere (RAMI4ATM) Web Portal. Available online: https://rami-benchmark.jrc.ec.europa.eu/_www/RAMI4ATM.php (accessed on 31 May 2021).
- RAdiation transfer Model Intercomparison-V (RAMI-V) Web Portal. Available online: https://rami-benchmark.jrc.ec.europa.eu/_www/index.php (accessed on 31 May 2021).
- Web portal of the ACIX II—CMIX 2Nd WS. Available online: https://earth.esa.int/eogateway/events/ceos-wgcv-acix-ii-cmix-atmospheric-correction-inter-comparison-exercise-cloud-masking-inter-comparison-exercise-2nd-workshop?text=CMIX (accessed on 31 May 2021).
- Tarrio, K.; Tang, X.; Masek, J.G.; Claverie, M.; Ju, J.; Qiu, S.; Zhu, Z.; Woodcock, C.E. Comparison of cloud detection algorithms for Sentinel-2 imagery. Sci. Remote Sens. 2020, 2, 100010. [Google Scholar] [CrossRef]
- Zekoll, V.; Main-Knorn, M.; Louis, J.; Frantz, D.; Richter, R.; Pflug, B. Comparison of masking algorithms for sentinel-2 imagery. Remote Sens. 2021, 13, 137. [Google Scholar] [CrossRef]
- Baetens, L.; Desjardins, C.; Hagolle, O. Validation of copernicus Sentinel-2 cloud masks obtained from MAJA, Sen2Cor, and FMask processors using reference cloud masks generated with a supervised active learning procedure. Remote Sens. 2019, 11, 433. [Google Scholar] [CrossRef] [Green Version]
- Frantz, D. FORCE—Landsat+ Sentinel-2 analysis ready data and beyond. Remote Sens. 2019, 11, 1124. [Google Scholar] [CrossRef] [Green Version]
- Glossary of NOAA Weather Service. Available online: https://forecast.weather.gov/glossary.php?word=CLD (accessed on 31 May 2021).
- Hollstein, A.; Segl, K.; Guanter, L.; Brell, M.; Enesco, M. Ready-to-use methods for the detection of clouds, cirrus, snow, shadow, water and clear sky pixels in Sentinel-2 MSI images. Remote Sens. 2016, 8, 666. [Google Scholar] [CrossRef] [Green Version]
- Foga, S.; Scaramuzza, L.; Guo, S.; Zhu, Z.; Dilley, R.D., Jr.; Beckmann, T.; Schmidt, G.L.; Dwyer, J.L.; Hughes, M.J.; Laue, B. Cloud detection algorithm comparison and validation for operational Landsat data products. Remote Sens. Environ. 2017, 194, 379–390. [Google Scholar] [CrossRef] [Green Version]
- Skakun, S.; Vermote, E.F.; Artigas, A.E.S.; Rountree, W.H.; Roger, J.C. An experimental sky-image-derived cloud validation dataset for Sentinel-2 and Landsat 8 satellites over NASA GSFC. Int. J. Appl. Earth Obs. Geoinf. 2021, 95, 102253. [Google Scholar] [CrossRef]
- HYPERNETS Web Portal. Available online: https://www.hypernets.eu/ (accessed on 31 May 2021).
- Presentation of Hypernets Project Made by K. Ruddick (RBINS) during ESA Very-High-Resolution (VHR-RODA) WS. Available online: https://earth.esa.int/eogateway/documents/20142/37627/1B3+HYPERNETS%40ESA-VHRODA_2021-04-21-FINAL-Distribution.pdf/dba957ee-dc39-e90d-4bdf-f73100078c6e (accessed on 31 May 2021).
- Zibordi, G.; Mélin, F.; Berthon, J.F.; Holben, B.; Slutsker, I.; Giles, D.; D’Alimonte, D.; Vandemark, D.; Feng, H.; Schuster, G.; et al. AERONET-OC: A network for the validation of ocean color primary products. J. Atmos. Ocean. Technol. 2009, 26, 1634–1651. [Google Scholar] [CrossRef]
- Mélin, F.; Sclep, G. Band shifting for ocean color multi-spectral reflectance data. Optics Express 2015, 23, 2262–2279. [Google Scholar] [CrossRef] [PubMed]
- Pahlevan, N.; Smith, B.; Binding, C.; O’Donnell, D.M. Spectral band adjustments for remote sensing reflectance spectra in coastal/inland waters. Opt. Express 2017, 25, 28650–28667. [Google Scholar] [CrossRef]
- Vanhellemont, Q. Sensitivity analysis of the dark spectrum fitting atmospheric correction for metre-and decametre-scale satellite imagery using autonomous hyperspectral radiometry. Opt. Express 2020, 28, 29948–29965. [Google Scholar] [CrossRef]
- Sánchez-Zapero, J.; Camacho, F.; Martínez-Sánchez, E.; Lacaze, R.; Carrer, D.; Pinault, F.; Benhadj, I.; Muñoz-Sabater, J. Quality Assessment of PROBA-V Surface Albedo V1 for the Continuity of the Copernicus Climate Change Service. Remote Sens. 2020, 12, 2596. [Google Scholar] [CrossRef]
- D’Odorico, P.; Gonsamo, A.; Pinty, B.; Gobron, N.; Coops, N.; Mendez, E.; Schaepman, M.E. Intercomparison of fraction of absorbed photosynthetically active radiation products derived from satellite data over Europe. Remote Sens. Environ. 2014, 142, 141–154. [Google Scholar] [CrossRef]
- Fuster, B.; Sánchez-Zapero, J.; Camacho, F.; García-Santos, V.; Verger, A.; Lacaze, R.; Weiss, M.; Baret, F.; Smets, B. Quality assessment of PROBA-V LAI, fAPAR and fCOVER collection 300 m products of copernicus global land service. Remote Sens. 2020, 12, 1017. [Google Scholar] [CrossRef] [Green Version]
- Cendrero-Mateo, M.; Wieneke, S.; Damm, A.; Alonso, L.; Pinto, F.; Moreno, J.; Guanter, L.; Celesti, M.; Rossini, M.; Sabater, N.; et al. Sun-induced chlorophyll fluorescence III: Benchmarking retrieval methods and sensor characteristics for proximal sensing. Remote Sens. 2019, 11, 962. [Google Scholar] [CrossRef] [Green Version]
- Porcar-Castell, A.; Tyystjärvi, E.; Atherton, J.; Van der Tol, C.; Flexas, J.; Pfündel, E.E.; Moreno, J.; Frankenberg, C.; Berry, J.A. Linking chlorophyll a fluorescence to photosynthesis for remote sensing applications: Mechanisms and challenges. J. Exp. Bot. 2014, 65, 4065–4095. [Google Scholar] [CrossRef]
- Schüttemeyer, D.; Burba, M.; Drusch, M.; Elfving, A.; Mecklenburg, S. ESA’s campaign activities in support of the FLEX mission. In Proceedings of the IGARSS 2018 IEEE International Geoscience and Remote Sensing Symposium, Valencia, Spain, 22–27 July 2018; pp. 3924–3926. [Google Scholar]
- Fluorescence Box Web Portal. Available online: https://www.jb-hyperspectral.com/products/flox/ (accessed on 31 May 2021).
- Fernandes, R.; Plummer, S.; Nightingale, J.; Frederic, B.; Camacho de Coca, F.; Fang, H.; Garrigues, S.; Gobron, N.; Lang, M.; Lacaze, R.; et al. CEOS Global LAI Product Validation Good Practices; CEOS: Washington, DC, USA, 2014. [Google Scholar]
- CEOS-LPV Document Repository. Available online: https://lpvs.gsfc.nasa.gov/documents.html (accessed on 31 May 2021).
- Bayat, B.; Camacho, F.; Nickeson, J.; Cosh, M.; Bolten, J.; Vereecken, H.; Montzka, C. Toward operational validation systems for global satellite-based terrestrial essential climate variables. Int. J. Appl. Earth Obs. Geoinf. 2021, 95, 102240. [Google Scholar] [CrossRef]
- ESA FRM4VEG Web Portal. Available online: https://frm4veg.org/ (accessed on 31 May 2021).
- Origo, N.; Gorroño, J.; Ryder, J.; Nightingale, J.; Bialek, A. Fiducial Reference Measurements for validation of Sentinel-2 and Proba-V surface reflectance products. Remote Sens. Environ. 2020, 241, 111690. [Google Scholar] [CrossRef]
- ESA SRIX4VEG Web Portal. Available online: https://frm4veg.org/srix4veg/ (accessed on 31 May 2021).
- CEOS LPV Supersites. Available online: https://lpvs.gsfc.nasa.gov/LPV_Supersites/LPVsites.html (accessed on 31 May 2021).
- National Science Foundation’s National Ecological Observatory Network (NEON) Web Site. Available online: https://neonscience.org (accessed on 31 May 2021).
- Kampe, T.U.; Johnson, B.R.; Kuester, M.A.; Keller, M. NEON: The first continental-scale ecological observatory with airborne remote sensing of vegetation canopy biochemistry and structure. J. Appl. Remote Sens. 2010, 4, 043510. [Google Scholar] [CrossRef] [Green Version]
- Surface Radiation Budget Network (SURFRAD) Web Site. Available online: https://www.esrl.noaa.gov/gmd/grad/surfrad/index.html (accessed on 31 May 2021).
- Augustine, J.A.; DeLuisi, J.J.; Long, C.N. SURFRAD–A national surface radiation budget network for atmospheric research. Bull. Am. Meteorol. Soc. 2000, 81, 2341–2358. [Google Scholar] [CrossRef] [Green Version]
- Integrated Carbon Observation System (ICOS) Web Site. Available online: https://www.icos-ri.eu/icos-research-infrastructure (accessed on 31 May 2021).
- Gielen, B.; de Beeck, M.O.; Loustau, D.; Ceulemans, R.; Jordan, A.; Papale, D. Integrated carbon observation system (icos): An infrastructure to monitor the european greenhouse gas balance. In Terrestrial Ecosystem Research Infrastructures: Challenges and Opportunities; Chabbi, A., Loescher, H.W., Eds.; CRC Press, Taylor & Francis Group: Boca Raton, FL, USA, 2017; pp. 506–520. ISBN 9781498751315. [Google Scholar]
- Baldocchi, D.; Falge, E.; Gu, L.; Olson, R.; Hollinger, D.; Running, S.; Anthoni, P.; Bernhofer, C.; Davis, K.; Evans, R.; et al. FLUXNET: A new tool to study the temporal and spatial variability of ecosystem-scale carbon dioxide, water.vapor, and energy flux densities. Bull. Am. Meteorol. Soc. 2001, 82, 2415–2434. [Google Scholar] [CrossRef]
- FLUXNET Web-Site. Available online: https://fluxnet.fluxdata.org/ (accessed on 31 May 2021).
- Terrestrial Ecosystem Research Network (TERN). Available online: https://www.tern.org.au/ (accessed on 31 May 2021).
- Cleverly, J.; Eamus, D.; Edwards, W.; Grant, M.; Grundy, M.J.; Held, A.; Karan, M.; Lowe, A.J.; Prober, S.M.; Sparrow, B.; et al. TERN, Australia’s land observatory: Addressing the global challenge of forecasting ecosystem responses to climate variability and change. Environ. Res. Lett. 2019, 14, 095004. [Google Scholar] [CrossRef]
- Roosjen, P.P.; Brede, B.; Suomalainen, J.M.; Bartholomeus, H.M.; Kooistra, L.; Clevers, J.G. Improved estimation of leaf area index and leaf chlorophyll content of a potato crop using multi-angle spectral data–potential of unmanned aerial vehicle imagery. Int. J. Appl. Earth Obs. Geoinf. 2018, 66, 14–26. [Google Scholar] [CrossRef]
- Arroyo-Mora, J.; Kalacska, M.; Inamdar, D.; Soffer, R.; Lucanus, O.; Gorman, J.; Naprstek, T.; Schaaf, E.S.; Ifimov, G.; Elmer, K.; et al. Implementation of a UAV–hyperspectral pushbroom imager for ecological monitoring. Drones 2019, 3, 12. [Google Scholar] [CrossRef] [Green Version]
- Arroyo-Mora, J.; Kalacska, M.; Løke, T.; Schläpfer, D.; Coops, N.C.; Lucanus, O.; Leblanc, G. Assessing the impact of illumination on UAV pushbroom hyperspectral imagery collected under various cloud cover conditions. Remote Sens. Environ. 2021, 258, 112396. [Google Scholar] [CrossRef]
- Brown, L.A.; Ogutu, B.O.; Dash, J. Tracking forest biophysical properties with automated digital repeat photography: A fisheye perspective using digital hemispherical photography from below the canopy. Agric. For. Meteorol. 2020, 287, 107944. [Google Scholar] [CrossRef]
- Brown, L.A.; Meier, C.; Morris, H.; Pastor-Guzman, J.; Bai, G.; Lerebourg, C.; Gobron, N.; Lanconelli, C.; Clerici, M.; Dash, J. Evaluation of global leaf area index and fraction of absorbed photosynthetically active radiation products over North America using Copernicus Ground Based Observations for Validation data. Remote Sens. Environ. 2020, 247, 111935. [Google Scholar] [CrossRef]
- Wilkes, P.; Lau, A.; Disney, M.; Calders, K.; Burt, A.; de Tanago, J.G.; Bartholomeus, H.; Brede, B.; Herold, M. Data acquisition considerations for terrestrial laser scanning of forest plots. Remote Sens. Environ. 2017, 196, 140–153. [Google Scholar] [CrossRef]
- Lovell, J.L.; Jupp, D.L.; Culvenor, D.S.; Coops, N.C. Using airborne and ground-based ranging lidar to measure canopy structure in Australian forests. Can. J. Remote Sens. 2003, 29, 607–622. [Google Scholar] [CrossRef]
- Pimont, F.; Soma, M.; Dupuy, J.L. Accounting for wood, foliage properties, and laser effective footprint in estimations of leaf area density from multiview-LiDAR data. Remote Sens. 2019, 11, 1580. [Google Scholar] [CrossRef] [Green Version]
- Brede, B.; Calders, K.; Lau, A.; Raumonen, P.; Bartholomeus, H.M.; Herold, M.; Kooistra, L. Non-destructive tree volume estimation through quantitative structure modelling: Comparing UAV laser scanning with terrestrial LIDAR. Remote Sens. Environ. 2019, 233, 111355. [Google Scholar] [CrossRef]
- Weiss, M.; Baret, F.; Block, T.; Koetz, B.; Burini, A.; Scholze, B.; Lecharpentier, P.; Brockmann, C.; Fernandes, R.; Plummer, S.; et al. On Line Validation Exercise (OLIVE): A web based service for the validation of medium resolution land products. Appl. FAPAR Products Remote Sens. 2014, 6, 4190–4216. [Google Scholar] [CrossRef] [Green Version]
- Baret, F.; Morissette, J.; Fernandes, R.; Champeaux, J.L.; Myneni, R.; Chen, J.; Plummer, S.; Weiss, M.; Bacour, C.; Garrigues, S.; et al. Evaluation of the representativeness of networks of sites for the validation and inter-comparison of land biophysical products. IEEE Trans. Geosc. Remote Sens. 2006, 44, 1794–1803. [Google Scholar] [CrossRef]
- Camacho, F.; Cernicharo, J.; Lacaze, R.; Baret, F.; Weiss, M. GEOV1: LAI, FAPAR essential climate variables and FCOVER global time series capitalizing over existing products. Part 2: Validation and intercomparison with reference products. Remote Sens. Environ. 2013, 137, 310–329. [Google Scholar] [CrossRef]
- Sanchez-Zapero, J.; Madrid, L.; dela Camacho, F. SALVAL: A semi-automatic surface albedo validation tool. In Proceedings of the V International Symposium on Recent Advances in Quantitative Remote Sensing (RAQRS), Valencia, Spain, 18–22 September 2017. [Google Scholar]
- ESA EVDC Web Portal. Available online: https://evdc.esa.int/ (accessed on 31 May 2021).
- Copernicus Calibration and Validation Solution Web Portal. Available online: https://ccvs.eu/ (accessed on 31 May 2021).
- Wilkinson, M.D.; Dumontier, M.; Aalbersberg, I.J.; Appleton, G.; Axton, M.; Baak, A.; Blomberg, N.; Boiten, J.W.; da Silva Santos, L.B.; Bourne, E.; et al. The FAIR Guiding Principles for scientific data management and stewardship. Sci. Data 2016, 3, 1–9. [Google Scholar] [CrossRef] [Green Version]
- Joint Experiment for Crop Assessment and Monitoring (JECAM) Web Portal. Available online: http://jecam.org/ (accessed on 31 May 2021).
- The FLARE Network Web Portal. Available online: https://flare-network.com/ (accessed on 31 May 2021).


Publisher’s Note: MDPI stays neutral with regard to jurisdictional claims in published maps and institutional affiliations. |
© 2021 by the authors. Licensee MDPI, Basel, Switzerland. This article is an open access article distributed under the terms and conditions of the Creative Commons Attribution (CC BY) license (https://creativecommons.org/licenses/by/4.0/).
Share and Cite
Niro, F.; Goryl, P.; Dransfeld, S.; Boccia, V.; Gascon, F.; Adams, J.; Themann, B.; Scifoni, S.; Doxani, G. European Space Agency (ESA) Calibration/Validation Strategy for Optical Land-Imaging Satellites and Pathway towards Interoperability. Remote Sens. 2021, 13, 3003. https://doi.org/10.3390/rs13153003
Niro F, Goryl P, Dransfeld S, Boccia V, Gascon F, Adams J, Themann B, Scifoni S, Doxani G. European Space Agency (ESA) Calibration/Validation Strategy for Optical Land-Imaging Satellites and Pathway towards Interoperability. Remote Sensing. 2021; 13(15):3003. https://doi.org/10.3390/rs13153003
Chicago/Turabian StyleNiro, Fabrizio, Philippe Goryl, Steffen Dransfeld, Valentina Boccia, Ferran Gascon, Jennifer Adams, Britta Themann, Silvia Scifoni, and Georgia Doxani. 2021. "European Space Agency (ESA) Calibration/Validation Strategy for Optical Land-Imaging Satellites and Pathway towards Interoperability" Remote Sensing 13, no. 15: 3003. https://doi.org/10.3390/rs13153003