Article

Effect of Consecutive Application of Phosphorus-Enriched Biochar with Different Levels of P on Growth Performance of Maize for Two Successive Growing Seasons

1
Institute of Soil and Environmental Sciences, University of Agriculture, Faisalabad 38040, Pakistan
2
Institute of Horticultural Sciences, University of Agriculture, Faisalabad 38040, Pakistan
3
Department of Agronomy, College of Agriculture and Natural Resources, Sanandaj Branch, Islamic Azad University, Sanandaj 6616935391, Iran
4
Soil Fertility Institute, Lahore 53700, Pakistan
5
Institute of Chemistry and Technology of Environmental Protection, Faculty of Chemistry, Brno University of Technology, Purkynova 118, 612 00 Brno, Czech Republic
6
Department of Agrochemistry, Soil Science, Microbiology and Plant Nutrition, Faculty of AgriSciences, Mendel University in Brno, Zemedelska 1, 613 00 Brno, Czech Republic
7
Institute for Environmental Studies, Faculty of Science, Charles University in Prague, Benatska 2, CZ128 00 Praha, Czech Republic
*
Authors to whom correspondence should be addressed.
Sustainability 2022, 14(4), 1987; https://doi.org/10.3390/su14041987
Submission received: 25 December 2021 / Revised: 31 January 2022 / Accepted: 7 February 2022 / Published: 10 February 2022

Abstract

:
Sustainable management of phosphorus (P) is one of the burning issues in agriculture because the reported P losses, when applied in the form of mineral fertilizer, give rise to another issue of water pollution as P is considered one of the limiting nutrients for eutrophication and so results in costly water treatments. In the present study, the enrichment of biochar with mineral P fertilizer was supposed to reduce such losses from the soil. Additionally, P can also be recycled through this technique at the same time as biochar is derived from biomass. Biochar was prepared using wheat straw followed by its enrichment with di-ammonium phosphate (DAP) at the ratio of 1:1 on a w/w basis. The first pot trial for spring maize (cv. Neelam) was conducted using phosphorus-enriched biochar (PEB) at 0% and 1% with different levels of recommended P (0%, 25%, 50%, and 100%). The treatments were arranged factorially under a complete randomized design (CRD) with three replications. After harvesting the spring maize, pots were kept undisturbed, and a second pot trial was conducted for autumn maize in the same pots to assess the residual impact of 1% PEB. In the second pot trial, only inorganic P was applied to respective treatments because the pots contained 1% PEB supplied to spring maize. The results revealed that the application of 1% PEB at P level 50% significantly increased all the recorded plant traits (growth, yield, and physiological and chemical parameters) and some selected properties of post-harvest soil (available P, organic matter, and EC) but not soil pH. In terms of yield, 1% PEB at 50% P significantly increased both the number of grains and 100-grain weight by around 30% and 21% in spring and autumn maize, respectively, as compared to 100% P without PEB. It is therefore recommended that P-enriched biochar should be used to reduce the inorganic P fertilizer inputs; however, its application under field conditions should be assessed in future research.

1. Introduction

Sustainable soil management is one of the crucial challenges as it plays several important functions in the ecosystem besides providing food, fibre, and shelter. From the life in water bodies to the atmospheric composition of gasses, the soil plays a significant role in deciding what enters or leaves these systems. In other words, anthropogenic activities, with the aim of managing soil resources, particularly for agriculture, impact the environment negatively if not managed properly. For example, excessive use of phosphorus (P) in agriculture is one of the leading causes of eutrophication in aquatic environments, giving rise to algal blooms which eventually harm aquatic life [1,2]. Similarly, the burning of biomass is aggravating the phenomena of climate change as it emits nitrogenous oxide (NOx), carbon monoxide (COx), sulfur oxide (SOx), particulate matter (PM), polycyclic aromatic hydrocarbons (PAHs), and volatile organic compounds (VOCs) [3,4]. Thus, future practices should be devised while considering their implications on the environment in the long run. This is especially true for agricultural soils in order to ensure future food security.
In view of the above environmental implications of mismanagement, both P sustainability and bio-waste management are pressing issues for global food security, water sustainability, and climate change mitigation [5,6] because both P supply and waste generation are part and parcel of farming systems. P is an essential component of crop production that has no alternative; thus, its continuous supply is key to global food security but likely disturbs agriculture because phosphate rock is non-renewable, and its current use pattern is not efficient, i.e., its reported losses are much greater in case of inorganic application resulting in the loss of this resource in addition to pollution of water bodies [7,8,9]. Moreover, an increase in the world population has increased the demand for P fertilizer. Its consumption was 47.4 million tonnes in 2015 and is increasing at the rate of 2% annually. Unfortunately, only small amounts (5–25%) of applied P are available to crops [10,11] because its availability is limited due to its reactions with soil constituents [12,13,14]. Consequently, the risk of losses through erosion, leaching, and runoff is much greater [15,16]. Therefore, techniques should be devised to minimize the P inputs while maintaining the optimum yields to reduce the burden on rock phosphate reserves and to curtail the entry of P into water bodies.
To counter issue of P loss from the soil, scientists have been working to introduce high-efficiency P fertilizers [17] either by producing slow-release fertilizers or by stabilizing their chemical transformations in the soil [18]. Similarly, coating mineral P fertilizer with anionic polymers is one of the effective techniques for increasing efficiency by complexing the P fixing ions found in soil [19,20]. However, the aim of the current study was to utilize bio-waste to enhance P use efficiency by converting it into biochar followed by its impregnation with DAP. Through this technique P can be managed sustainably, and the management of organic waste, which otherwise has a significant role in global carbon emissions, will be possible. However, the use of biochar has certain potential risks [21]; for example, it may contain contaminants including polycyclic aromatic hydrocarbons [22] that are harmful to both plants and microbial communities. The presence of such contaminants is dependent on the type of feedstock and the conditions under which pyrolysis is to be carried out [23], thus offering enough flexibility to form contaminant-free biochar.
The conversion of organic waste into biochar followed by its enrichment with inorganic P fertilizer not only renders it a slow-release fertilizer, but it also has a positive impact on biological, chemical, and physical properties of soil. Biochar is a carbon-rich material obtained through the thermal decomposition of biomass under anoxic conditions [24,25] that plays several key roles in refining the properties of soil [26]; for example, the application of biochar has increased the moisture retention in soil [27], enhanced soil aeration [28], and boosted soil microbial activity [29]. Consequently, it has improved the yield of crops [30] and crop-nutrient profiles [31]. Furthermore, due to its porous nature, biochar can be used as a carrier for nutrients [32,33]. The application of biochar as a matrix for slow-release fertilizer has been demonstrated using several nutrients in previous studies such as those involving potassium (K) [34], nitrate-nitrogen (NO3-N) [35], phosphorus (P) [36], and ammonical nitrogen (NH4-N) [35]. However, this field is not fully explored, and systematic studies should be conducted to optimize the dose of mineral fertilizer with enriched biochar to obtain optimum results in terms of crop yield, growth, and quality for a specific crop. Therefore, the aim of the current study was to prepare enriched biochar, followed by application with different levels of inorganic phosphorus to improve P use efficiency and reduction in the use of synthetic P fertilizer.
It was therefore hypothesized that the impregnation of biochar using DAP renders it a slow-release fertilizer, consequently lowering the requirement of mineral P fertilizer without affecting the crop performance. The specific objectives of the study include the optimization of mineral fertilizer dose with enriched biochar for maize and assessing its residual impact using the same crop in the next growing season.

2. Materials and Methods

2.1. Analysis of Experimental Soil

The soil of the experimental area at the Institute of Soil and Environmental Sciences, University of Agriculture Faisalabad, Pakistan, was used for the pot trials. The soil of this site falls in the category of Lyallpur series with Typic Calciargid as a great group (USDA taxonomic system). The soil sample was taken randomly from the plow layer (15–20 cm). Before the analysis, it was air-dried and ground enough to pass through a <2 mm sieve. A soil–water suspension at 1:1 (w/v) was used for the estimation of pH and EC (dS m−1) with the help of a portable pH and EC meter. Organic matter (%) was determined after calculating organic carbon following the titration method [37]. Total nitrogen was estimated following the protocol defined by [38]. Extractable phosphorus (mg kg−1) was calculated spectrophotometrically at the wavelength of 882 nm [39], and soil CaCO3 contents were estimated following the protocol of [40] (Table 1).

2.2. Feedstock Collection, Preparation of Biochar, and Its Analysis

For the preparation of biochar, wheat straw was used as feedstock. It was obtained from the agronomy farm, the University of Agriculture Faisalabad, Pakistan. Before pyrolysis, feedstock was air-dried, and all physical impurities were removed. Then, it was oven-dried and ground to uniform mesh size. Wheat straw was pyrolyzed in an automated furnace at a temperature of 350–400 °C with a residence time of 1 h and a constant heat rate of 10 °C min−1 [41]. For the determination of pH and EC (dS m−1), biochar was added to distilled water at a ratio of 1:20 (w/v), then the suspension was placed on a mechanical shaker for 90 min [42]. Furthermore, a sample of biochar was digested using hydrogen peroxide (H2O2) and sulfuric acid (H2SO4), for the estimation of P, potassium (K), Calcium (Ca), and magnesium (Mg) [43]. Ca and Mg were calculated using an atomic absorption spectrometer (AAnalyst, PerkinElmer, Norwalk, CT, USA). P and K were calculated using UV–visible spectrophotometer (UV-1201, Shimadzu, Tokyo, Japan) and flame photometer (PFP7, Jenway, Essex, UK), respectively. Furthermore, a CHN analyzer (Carlo-Erba NA-1500) was used for the determination of nitrogen (Table 1).

2.3. Enrichment of Biochar
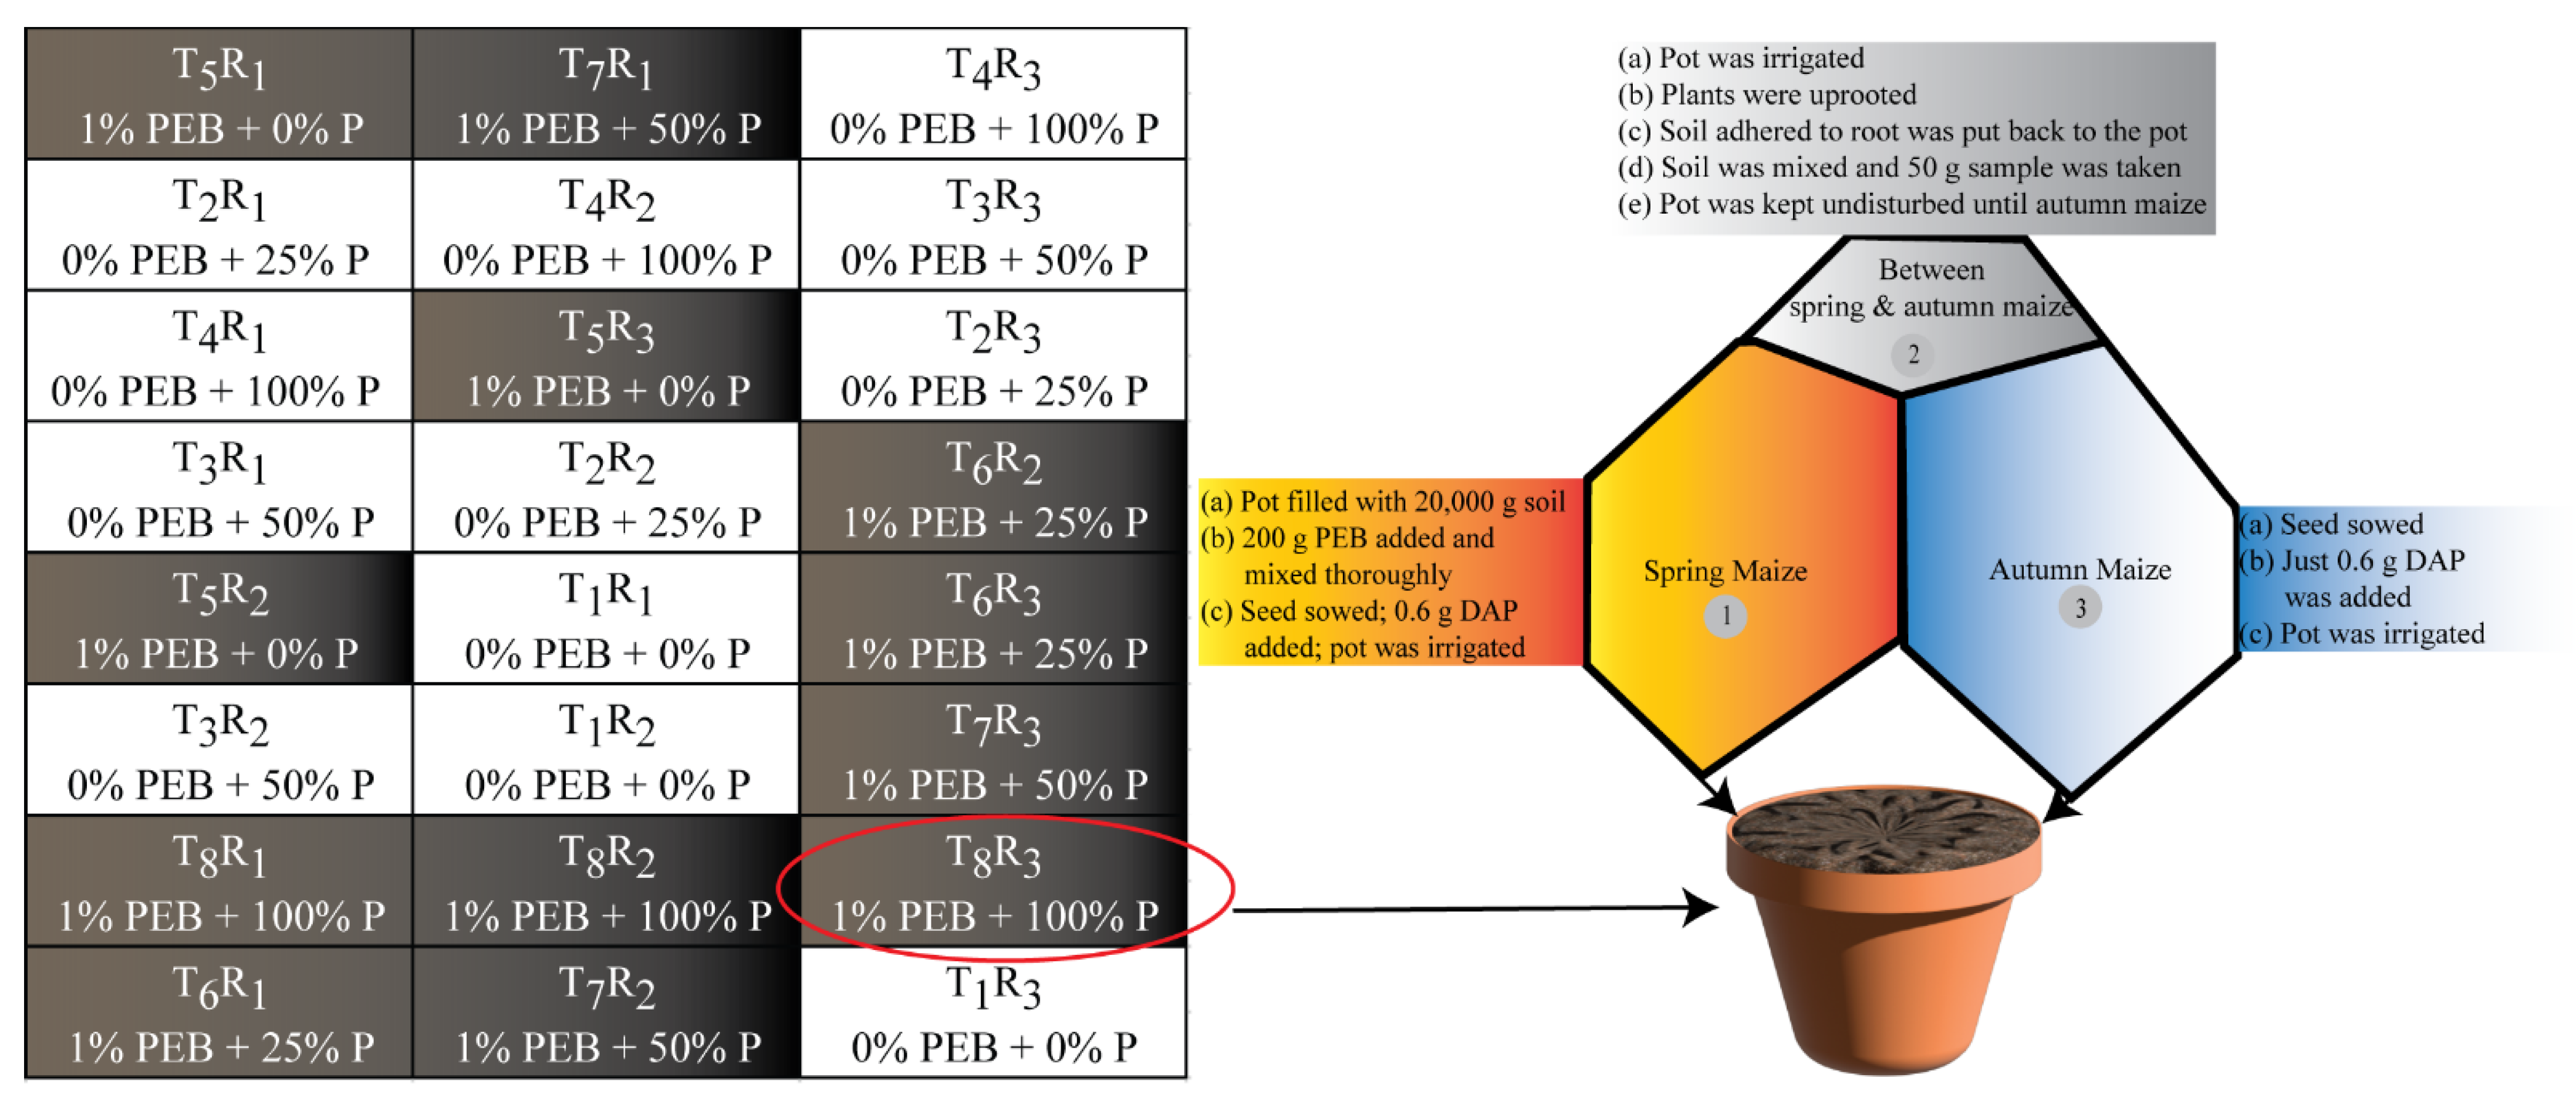
For the enrichment of the resultant biochar, the cold method was followed wherein DAP was ground to powder and added to biochar at 1:1 on a w/w basis, then distilled water was sprinkled over the mixture [36]. After preparation, the P-enriched biochar (PEB) was air-dried and stored in a plastic bag for future use.

2.4. Spring Maize

Using PEB, the first experiment was conducted on spring maize (Zea mays) during February at the wirehouse of the Institute of Soil and Environmental Science, University of Agriculture Faisalabad, Pakistan. Treatments were arranged factorially under a CRD with three replicates. The factors include PEB with two levels (0% and 1%) and inorganic fertilizer (DAP) with four levels P (0%, 25%, 50%, and 100%) comprising a total of eight treatments (four with 0% PEB for each level of P and another four with 1% PEB for each level of P). In both factors, level 0 (no application) serves as a control. The P levels were determined by dividing the recommended dose (60 kg ha−1) of inorganic P fertilizer into four levels. The application of PEB was carried out in respective pots at the rate of 1% of dry soil on a w/w basis, and thorough mixing was performed before seed sowing. Then, different levels of P (0%, 25%, 50%, and 100%) were added to their respective treatments at sowing, and the recommended N and K (15 kg ha−1) were also added to all the treatments at sowing. Maize (cv. Neelam) seeds were sown manually at 10 seeds pot−1, and after germination, the plant density was kept at three plants pot−1. After sowing all the pots were irrigated using tap water on a visual need basis, and the same practice was used in future irrigation (Figure 1). Moreover, all other management practices (hoeing, weeding, etc.) were kept constant for all the treatments.

2.5. Determination of Crop Parameters and Analysis of Post-Harvest Soil

Chlorophyll contents were measured using a chlorophyll content meter (CCM-200 PLUS, Opti-Sciences, Tyngsboro, MA, USA). At harvest, the pots were irrigated to uproot the entire plant, and then shoots were separated using a sickle, and shoot length (cm) was determined. After detaching the shoots, the root part was returned to its respective pot to obtain the adhered dry soil. Then, root length (cm) was recorded using a measuring scale after returning the adhered soil to its respective pot. Root and shoot fresh weights (g) were determined using a digital balance. For the determination of root and shoot dry weight (g), the samples were oven-dried at 60 °C until a constant weight, then the dry weight was recorded using a digital balance. The number of grains plant−1 was determined by threshing the cobs manually followed by a manual count, and 100-grain weight (g) was determined by selecting 100 gains for each treatment randomly using a digital balance. Protein (%) in grain was determined following the protocol described by [44]. Ash (%) in grain was determined through the protocol as described in [45]. Similarly, fat (%) in grain was determined following the protocol described by [46]. For the determination of nitrogen (%) in shoots, Kjeldahl apparatus was used [47], and for P (%) in maize shoots, samples were digested in di-acid mixture (HNO3 and HClO4) followed by spectrophotometric measurement of P at the wavelength of 410 nm [48]. The post-harvest soil was analyzed for electrical conductivity (EC), pH, organic matter, and soil extractable P.

2.6. Second Pot Trial

The pots used in the first pot trial were kept undisturbed until the second pot trial. In autumn maize was again sowed in the same pots to assess the residual impact of 1% PEB supplied to spring maize. Thus, all the treatments including the four treatments containing 1% PEB (not applied afresh but containing 1% PEB added to spring maize) were treated only with their respective P level (0%, 25%, 50%, and 100%). All other practices (hoeing, weeding, etc.) were the same as those of the first pot trial (Figure 1).

2.7. Statistical Analysis

The data were analyzed statistically through the analysis of variance for finding the variation among treatments’ mean. All statistical analyses were performed using computer-based software (Statistix Version 8.1). Mean values of treatments were compared using Tukey’s HSD test at a significance level of <5% [49].

3. Results

An interaction between the mean values (plant traits and properties of post-harvest soil) and different levels of P (0%, 25%, 50%, and 100%) with and without PEB (0% and 1%) was recorded for both spring and autumn maize. The results indicated that soil properties (except for soil pH) and plant traits were significantly influenced by 1% PEB at the level of 50% P in the spring maize. A similar trend was observed for autumn maize (mean significant values at 1% PEB + 50% P) even though PEB was not added to autumn maize. The application of PEB therefore reduced the recommended dose of P for maize by half for two successive growing seasons.

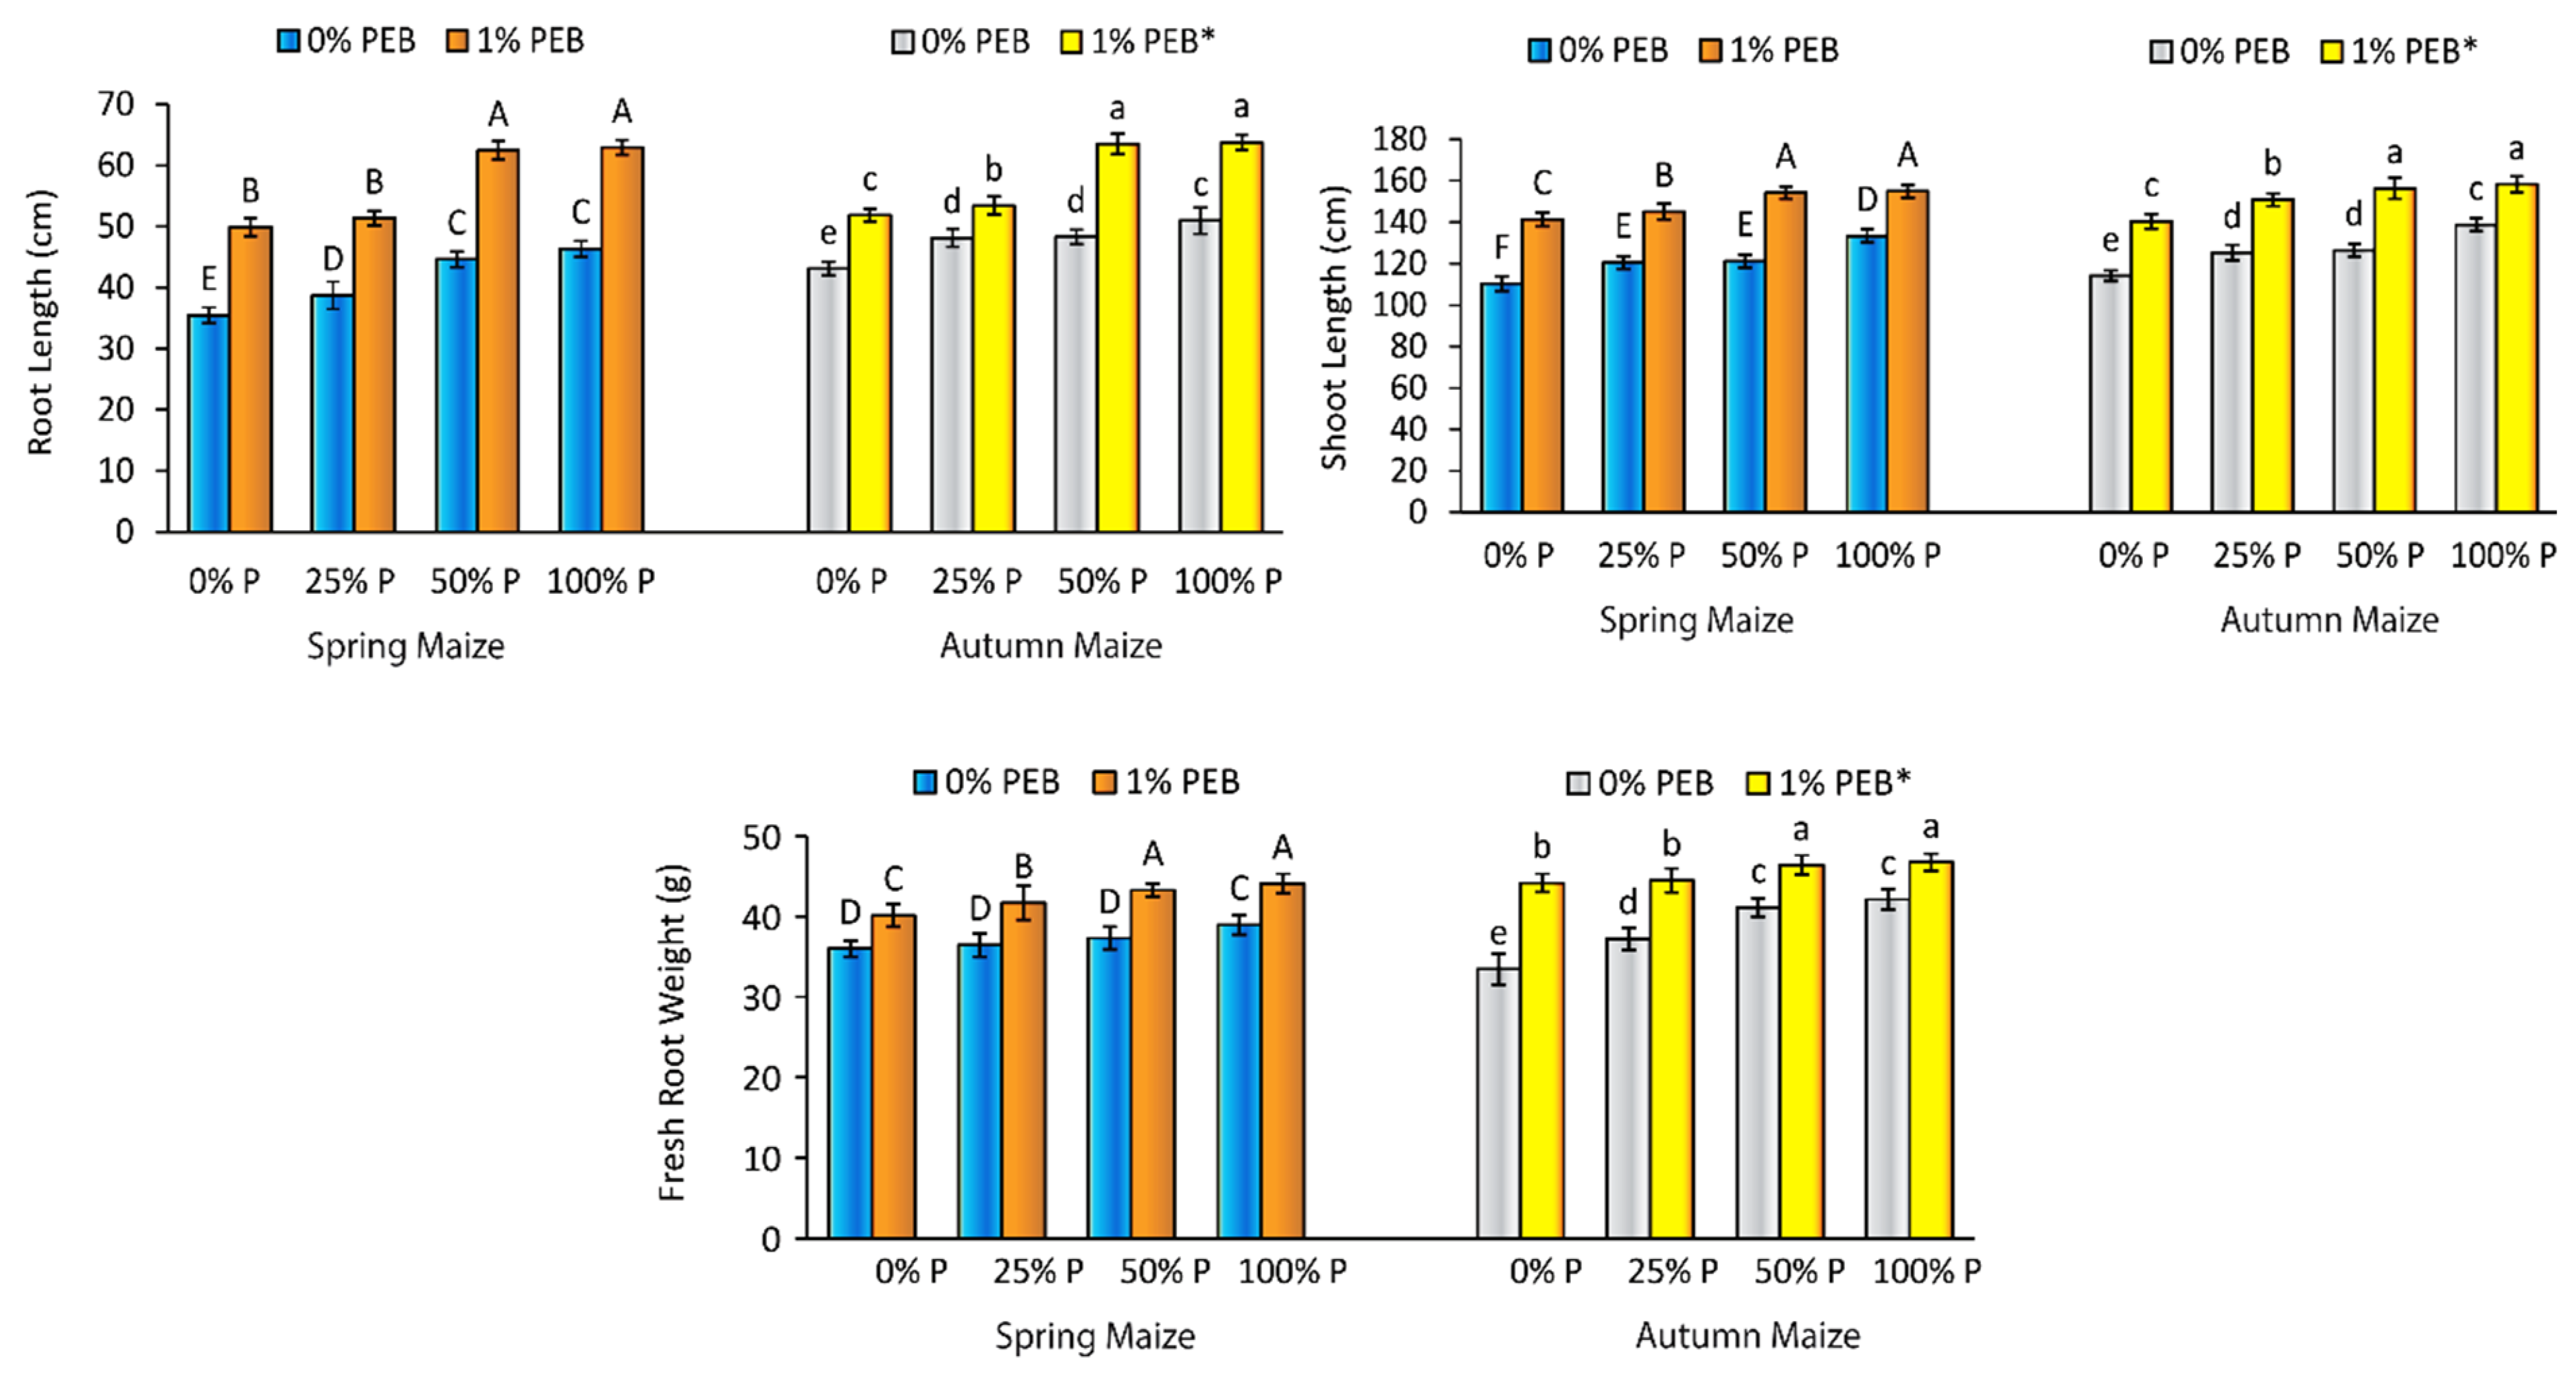
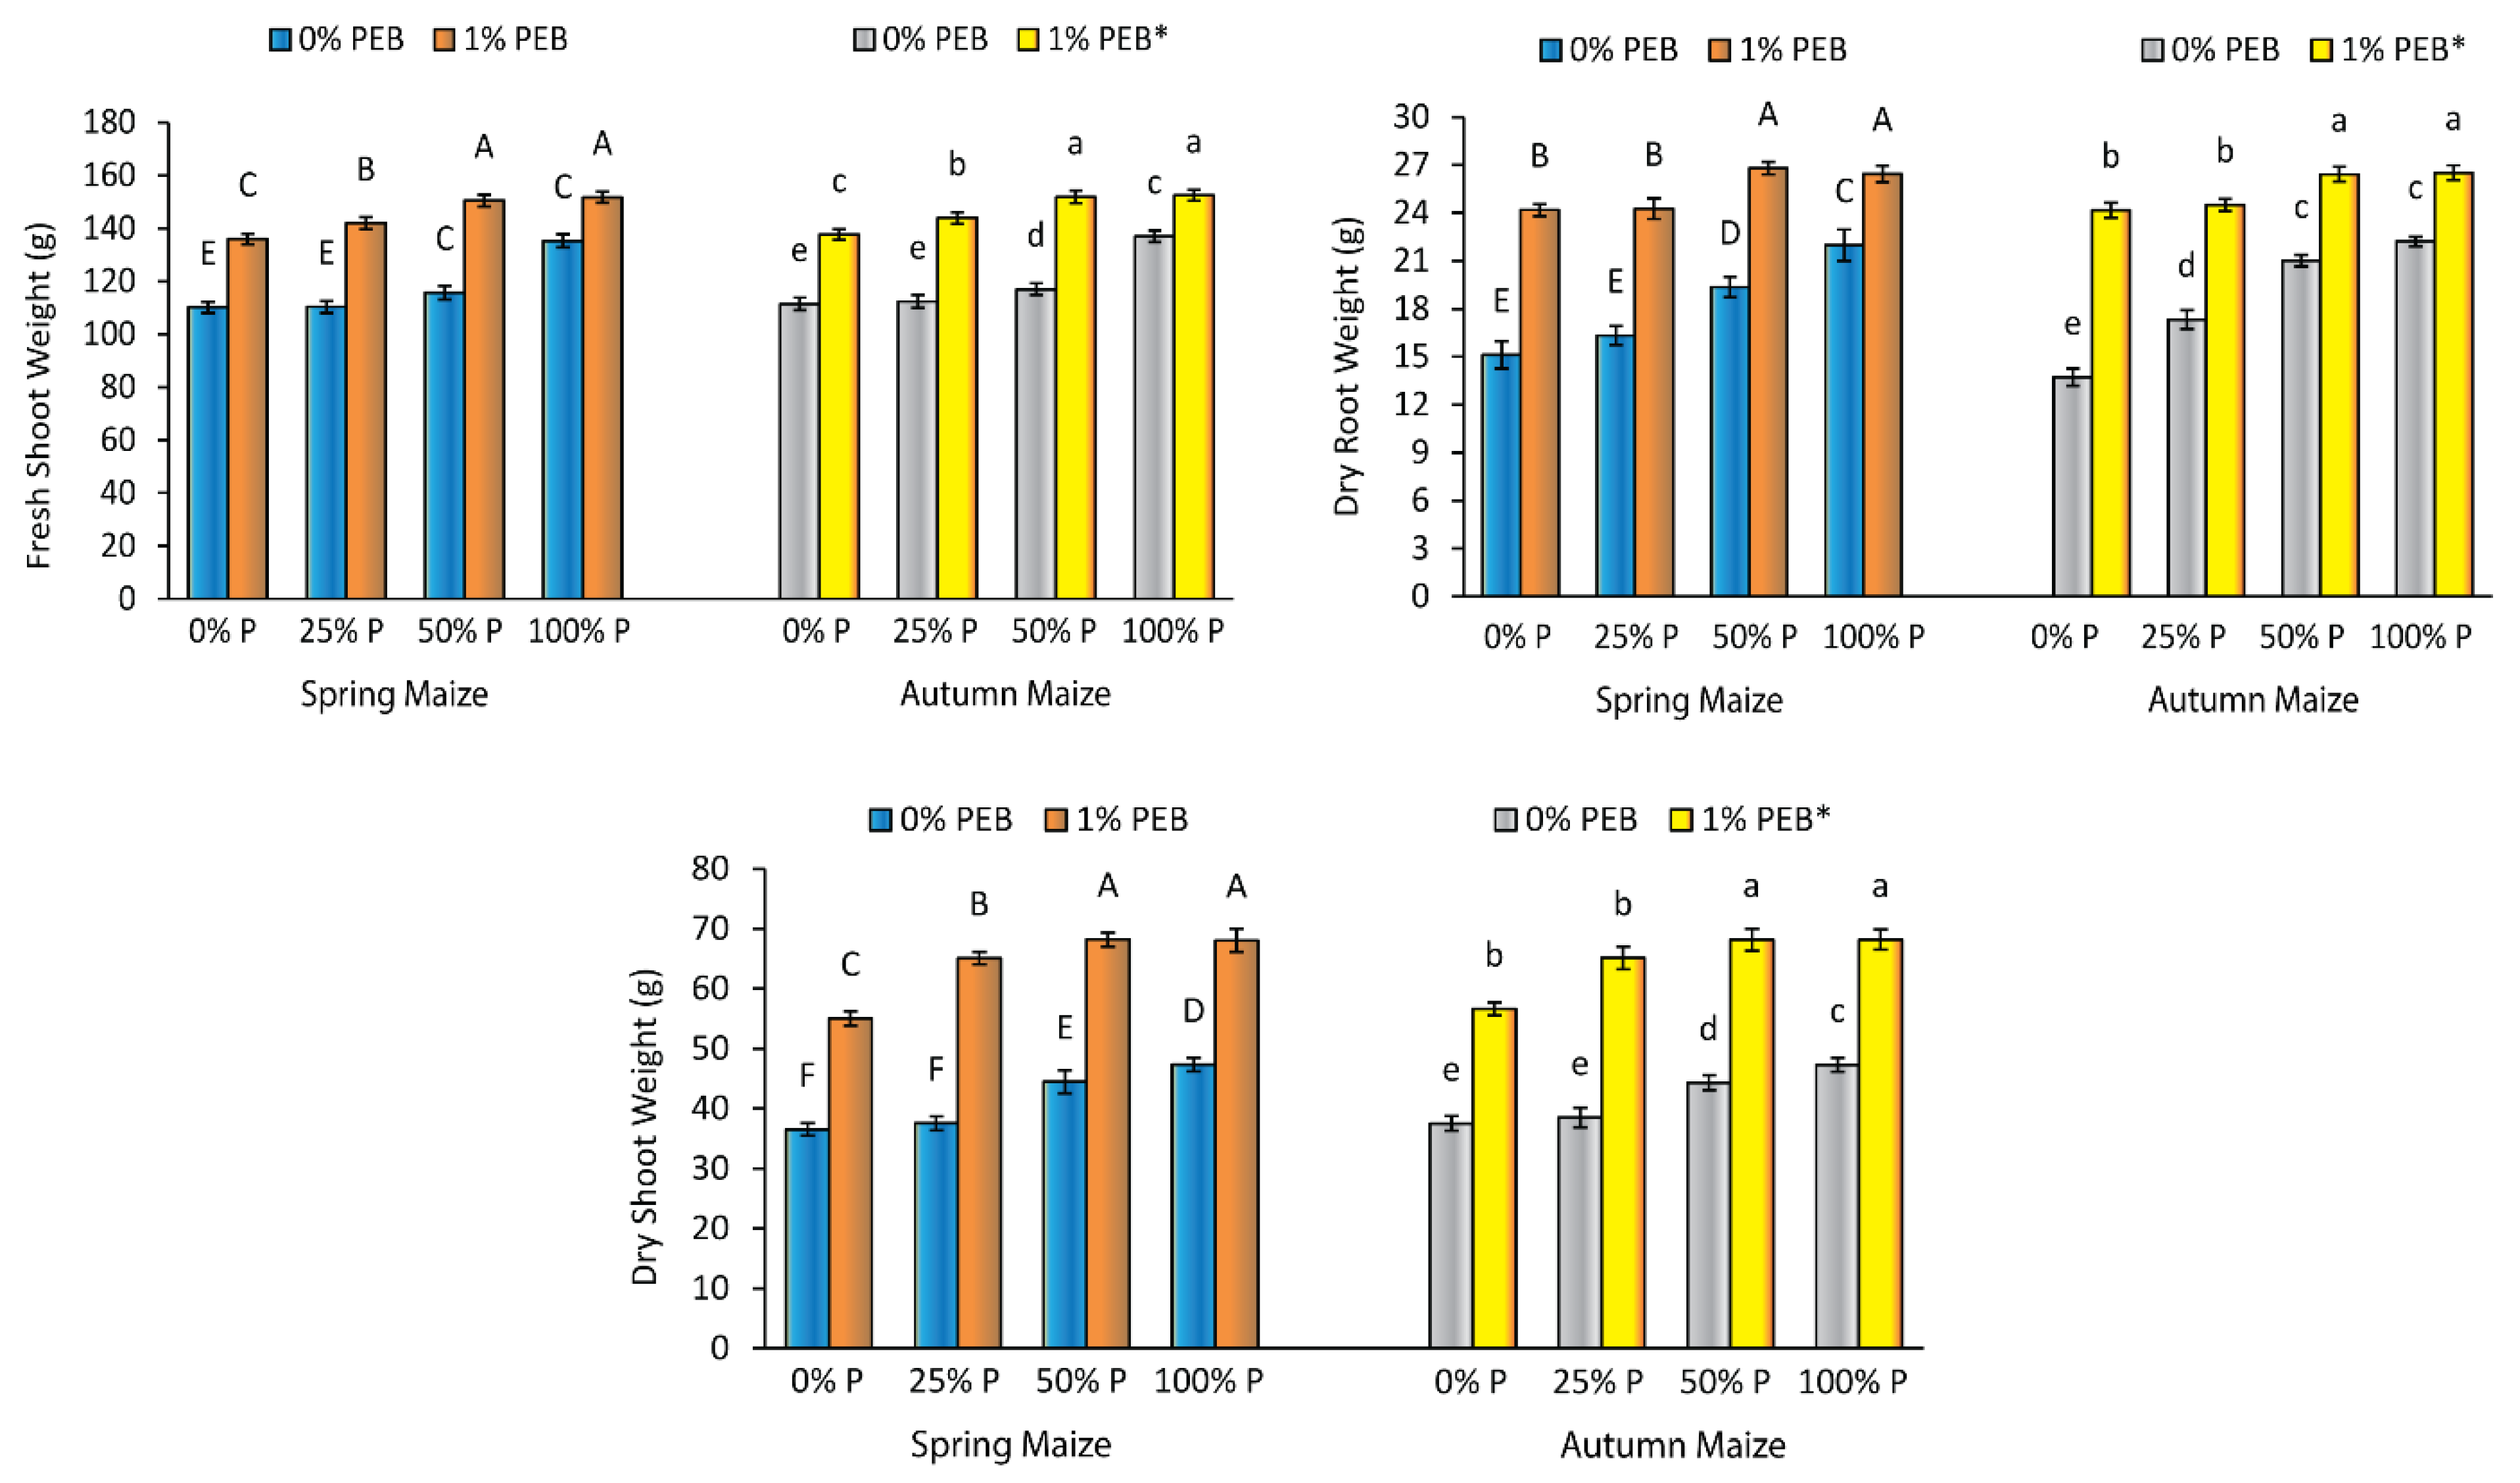
3.1. Effects of Application of PEB and Different Levels of P on Growth

For both spring and autumn maize, the minimum value for root length was recorded at P level 0% (Figure 2). An increasing trend in root length was observed with the increase in the level of P (25%, 50%, and 100%). In the case of spring maize, application of 1% PEB with P level 0% significantly improved the root length as compared to all the levels of P (0%, 25%, 50%, and 100% P without PEB), whereas, in the case of autumn maize, the treatment 1% PEB + 0% P was not significantly different from 100% P (Figure 2). With the increase in the level of P (25%, 50%, and 100% P) at 1% PEB, an increasing trend in root length was observed, and the maximum value was recorded at 1% PEB + 100% P; however, it was not significantly different from 1% PEB + 50% P. In the case of the shoot length, a similar trend was observed. In spring maize, the application of 1% PEB at 0% P significantly improved the shoot length as compared to all the tested levels of P (0%, 25%, 50%, and 100% P), while it increased the shoot length up to three levels of P (0%, 25%, and 50% P) in autumn maize (Figure 2). The maximum significant value for shoot length was recorded at 1% PEB + 50% P for both spring and autumn maize, and the further increase in the level of P did not yield any significant difference in terms of shoot length.
Furthermore, for both spring and autumn maize, an increasing trend in root fresh weight was recorded with the increase in P levels (25%, 50%, and 100% P) at 1% PEB, but up to 50% P (1% PEB + 50% P) and a further increase in P did not yield any significant difference in terms of root fresh weight (Figure 2).
Moreover, for both spring and autumn maize, a positive interaction was recorded between 1% PEB and different levels of P for fresh shoot weight (Figure 3). In spring maize, application of 1% PEB at 0% P significantly increased fresh shoot weight as compared to 0% and 25% P at 0% PEB; however, no significant difference was recorded as compared to 50% and 100% P, while in autumn maize 1% PEB at 0% P significantly increased fresh shoot weight as compared to 0%, 25%, and 50% P. The maximum significant increase in fresh shoot weight was recorded at 1% PEB + 50% P for both spring and autumn maize. The further increase in P level (1% PEB + 100% P) did not yield any significant difference in terms of fresh shoot weight (Figure 3).
Similarly, in both spring and autumn maize, the minimum value for dry root weight was recorded at P level 0% (Figure 3). In spring maize, no significant difference was recorded when 0% P was compared with 25% P; however, the further increase in P level (25%, 50%, and 100%) significantly enhanced the dry root weight. In autumn maize the three P levels (25%, 50%, and 100% P) significantly increased dry root weight as compared to 0% P. Furthermore, in both spring and autumn maize, a significant increase in dry root weight was recorded for 1% PEB at 0% P as compared to all the levels of P (0%, 25%, 50%, and 100% P) with 0% PEB. With the increase in P level at 1% PEB, an increasing trend was recorded for dry root weight up to 1% PEB + 50% P, and the further increase in P level (1% PEB + 100% P) did not show any significant difference for dry root weight (Figure 3).
Furthermore, in both spring and autumn maize, dry shoot weight was significantly increased with the application of 1% PEB (Figure 3). For both the experiments the maximum mean value for dry shoot weight was recorded at 1% PEB + 100% P; however, there was no significant difference between 1% PEB + 100% P and 1% PEB + 50%. Thus, the optimum P level for 1% PEB was 50% P (Figure 3).

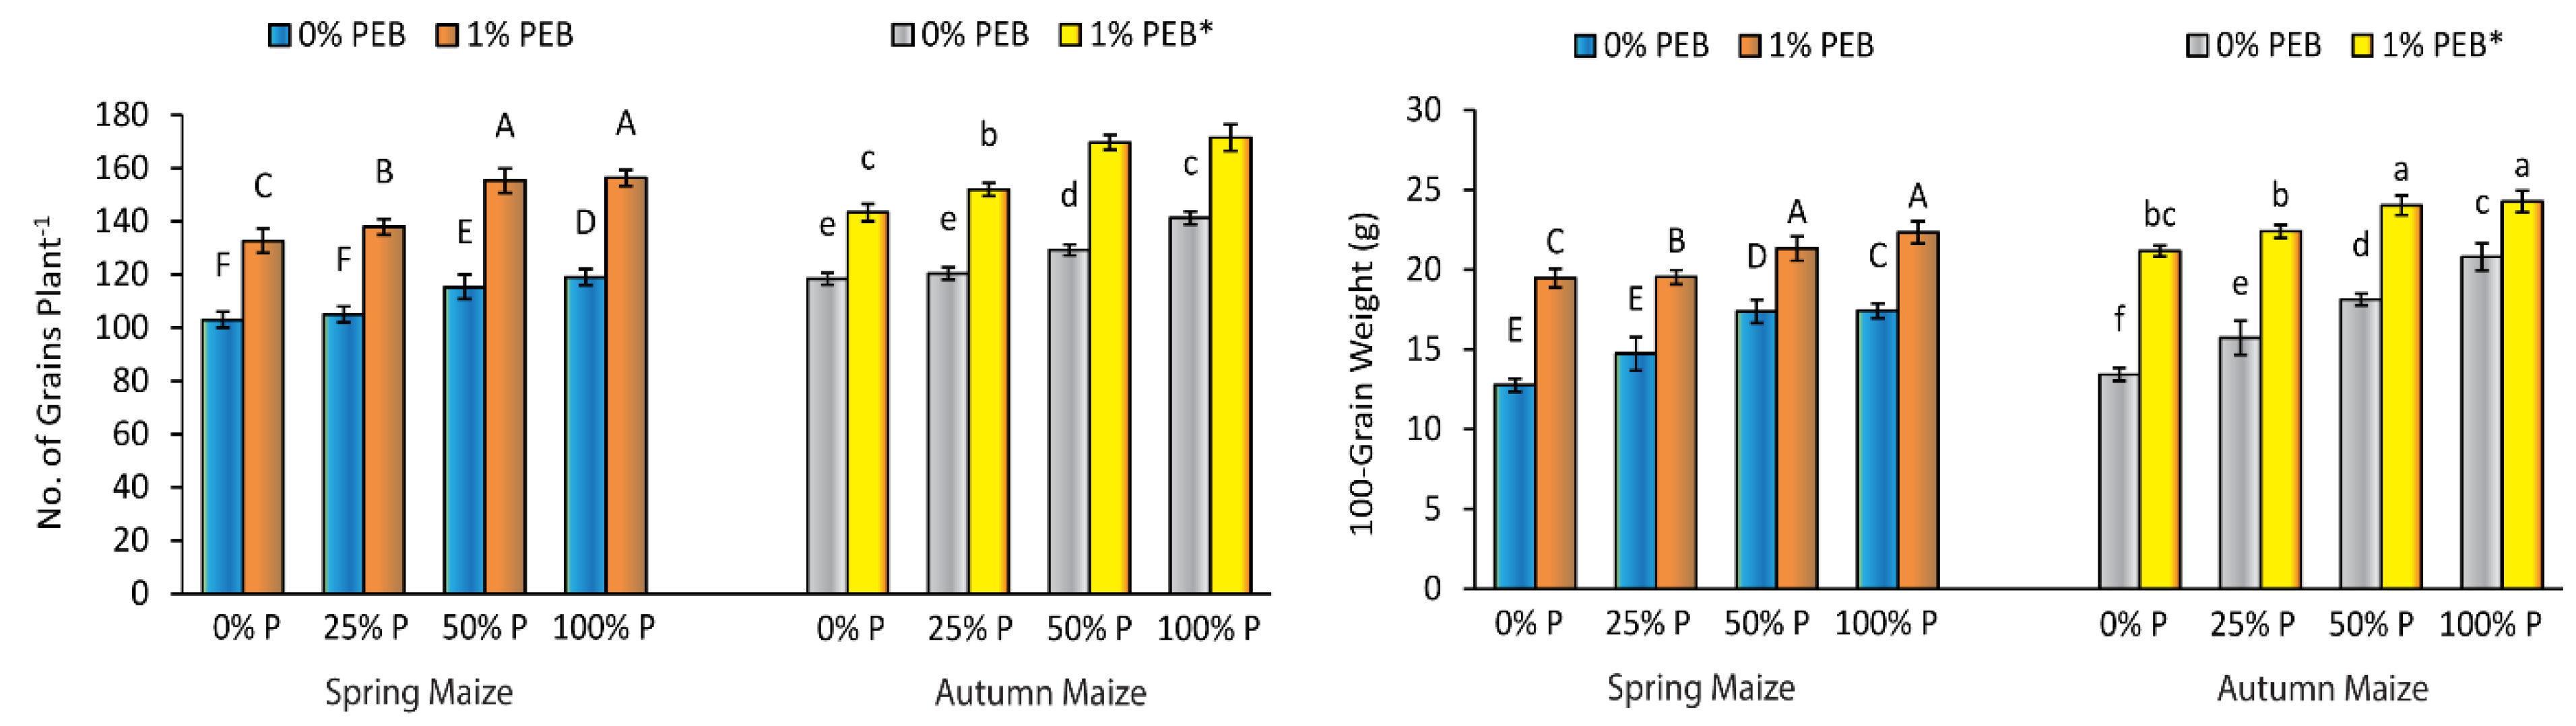
3.2. Effects of Application of PEB and the Split Dose of P on Yield

In both spring and autumn maize, the application of 1% PEB significantly improved both the recorded yield parameters as compared to the application of 100% P at 0% PEB (Figure 4). For both trials, the number of grains was significantly increased by 1% PEB at 0% P as compared to 100% P at 0% PEB. An increasing trend was recorded with the further increase in the level of P, but up to 50% P and a further increase in P level (1% PEB + 100% P) did not exhibit any significant difference in terms of the number of grains. Similarly, in both spring and autumn maize, 100-grain weight was recorded at maximum at 1% PEB + 50% P as the further increase in P level (1% PEB + 100% P) did not show any significance (Figure 4).

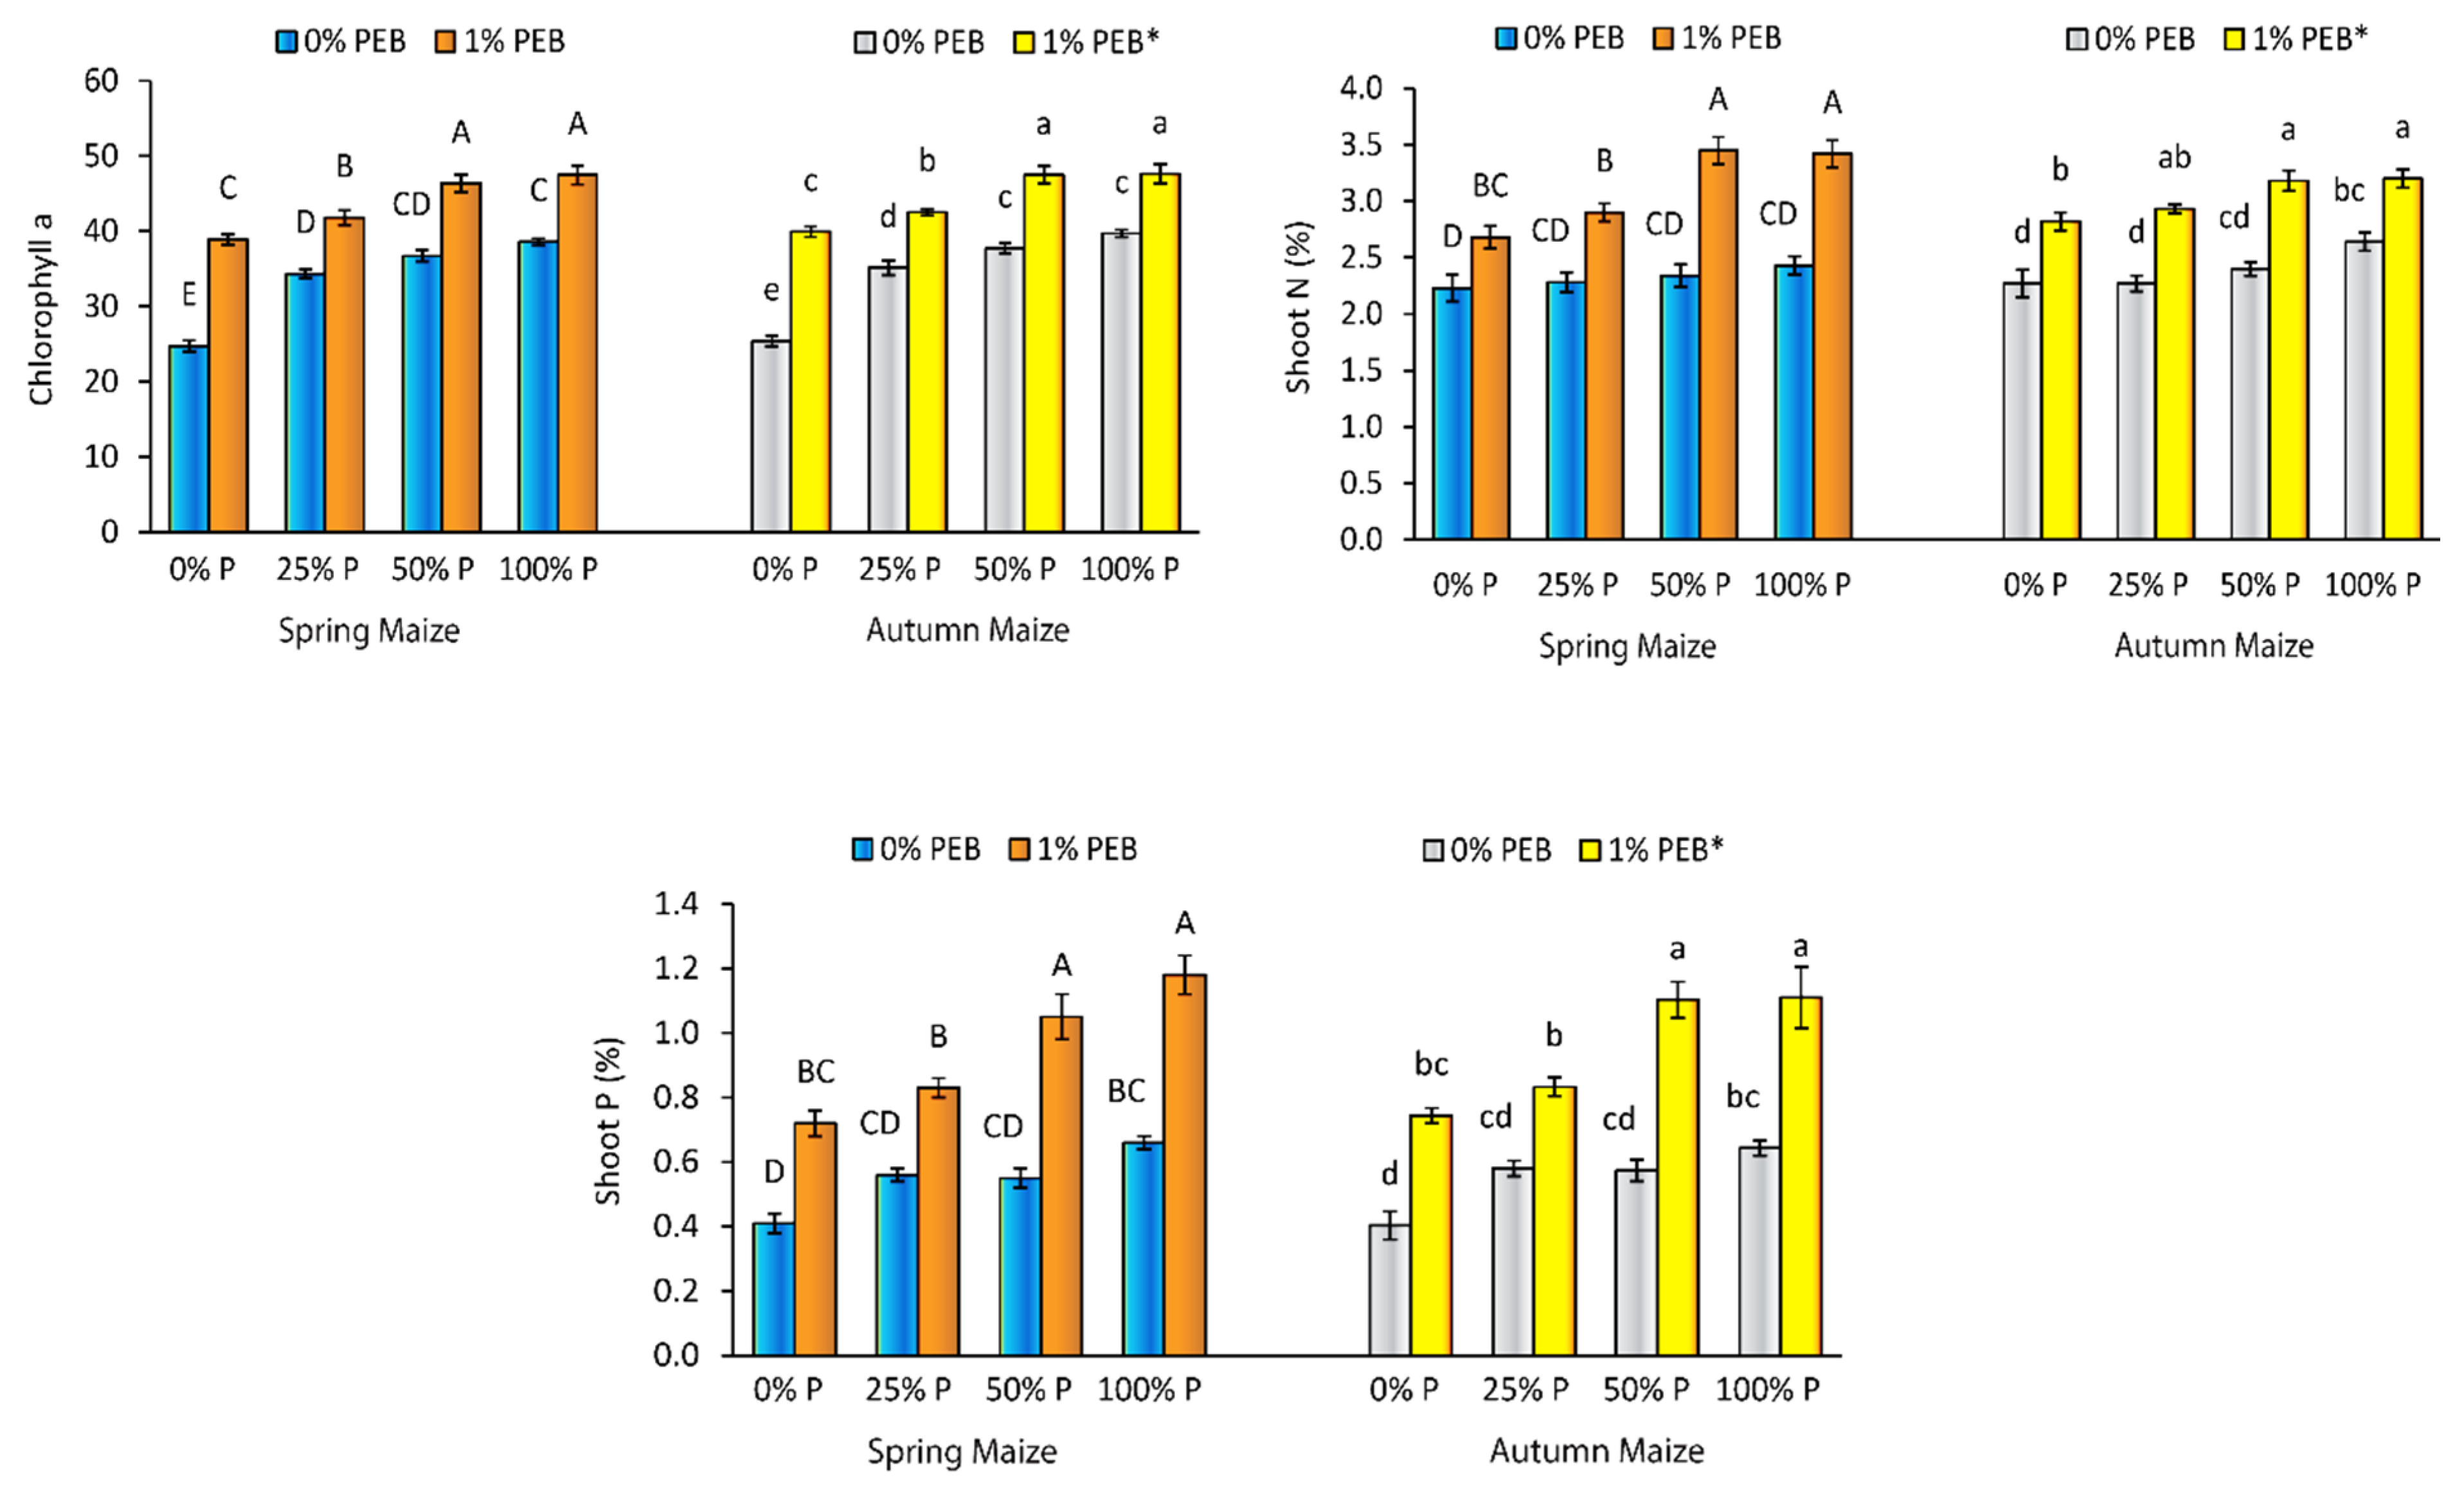
3.3. Effect of Application of PEB and the Split Dose of P on Physiological and Chemical Parameters

In both trials, the application of 1% PEB significantly improved chlorophyll-a as compared to 100% P at 0% PEB (Figure 5). For both spring and autumn maize, the combined application of 1% PEB with P levels significantly enhanced chlorophyll-a up to 1% PEB + 50% P as compared to all other treatments. Similarly, in both spring and autumn maize, both shoot N and P contents reached a significant maximum at the treatment 1% PEB + 50% P as further addition in P level with PEB did not yield any significant difference (Figure 5).

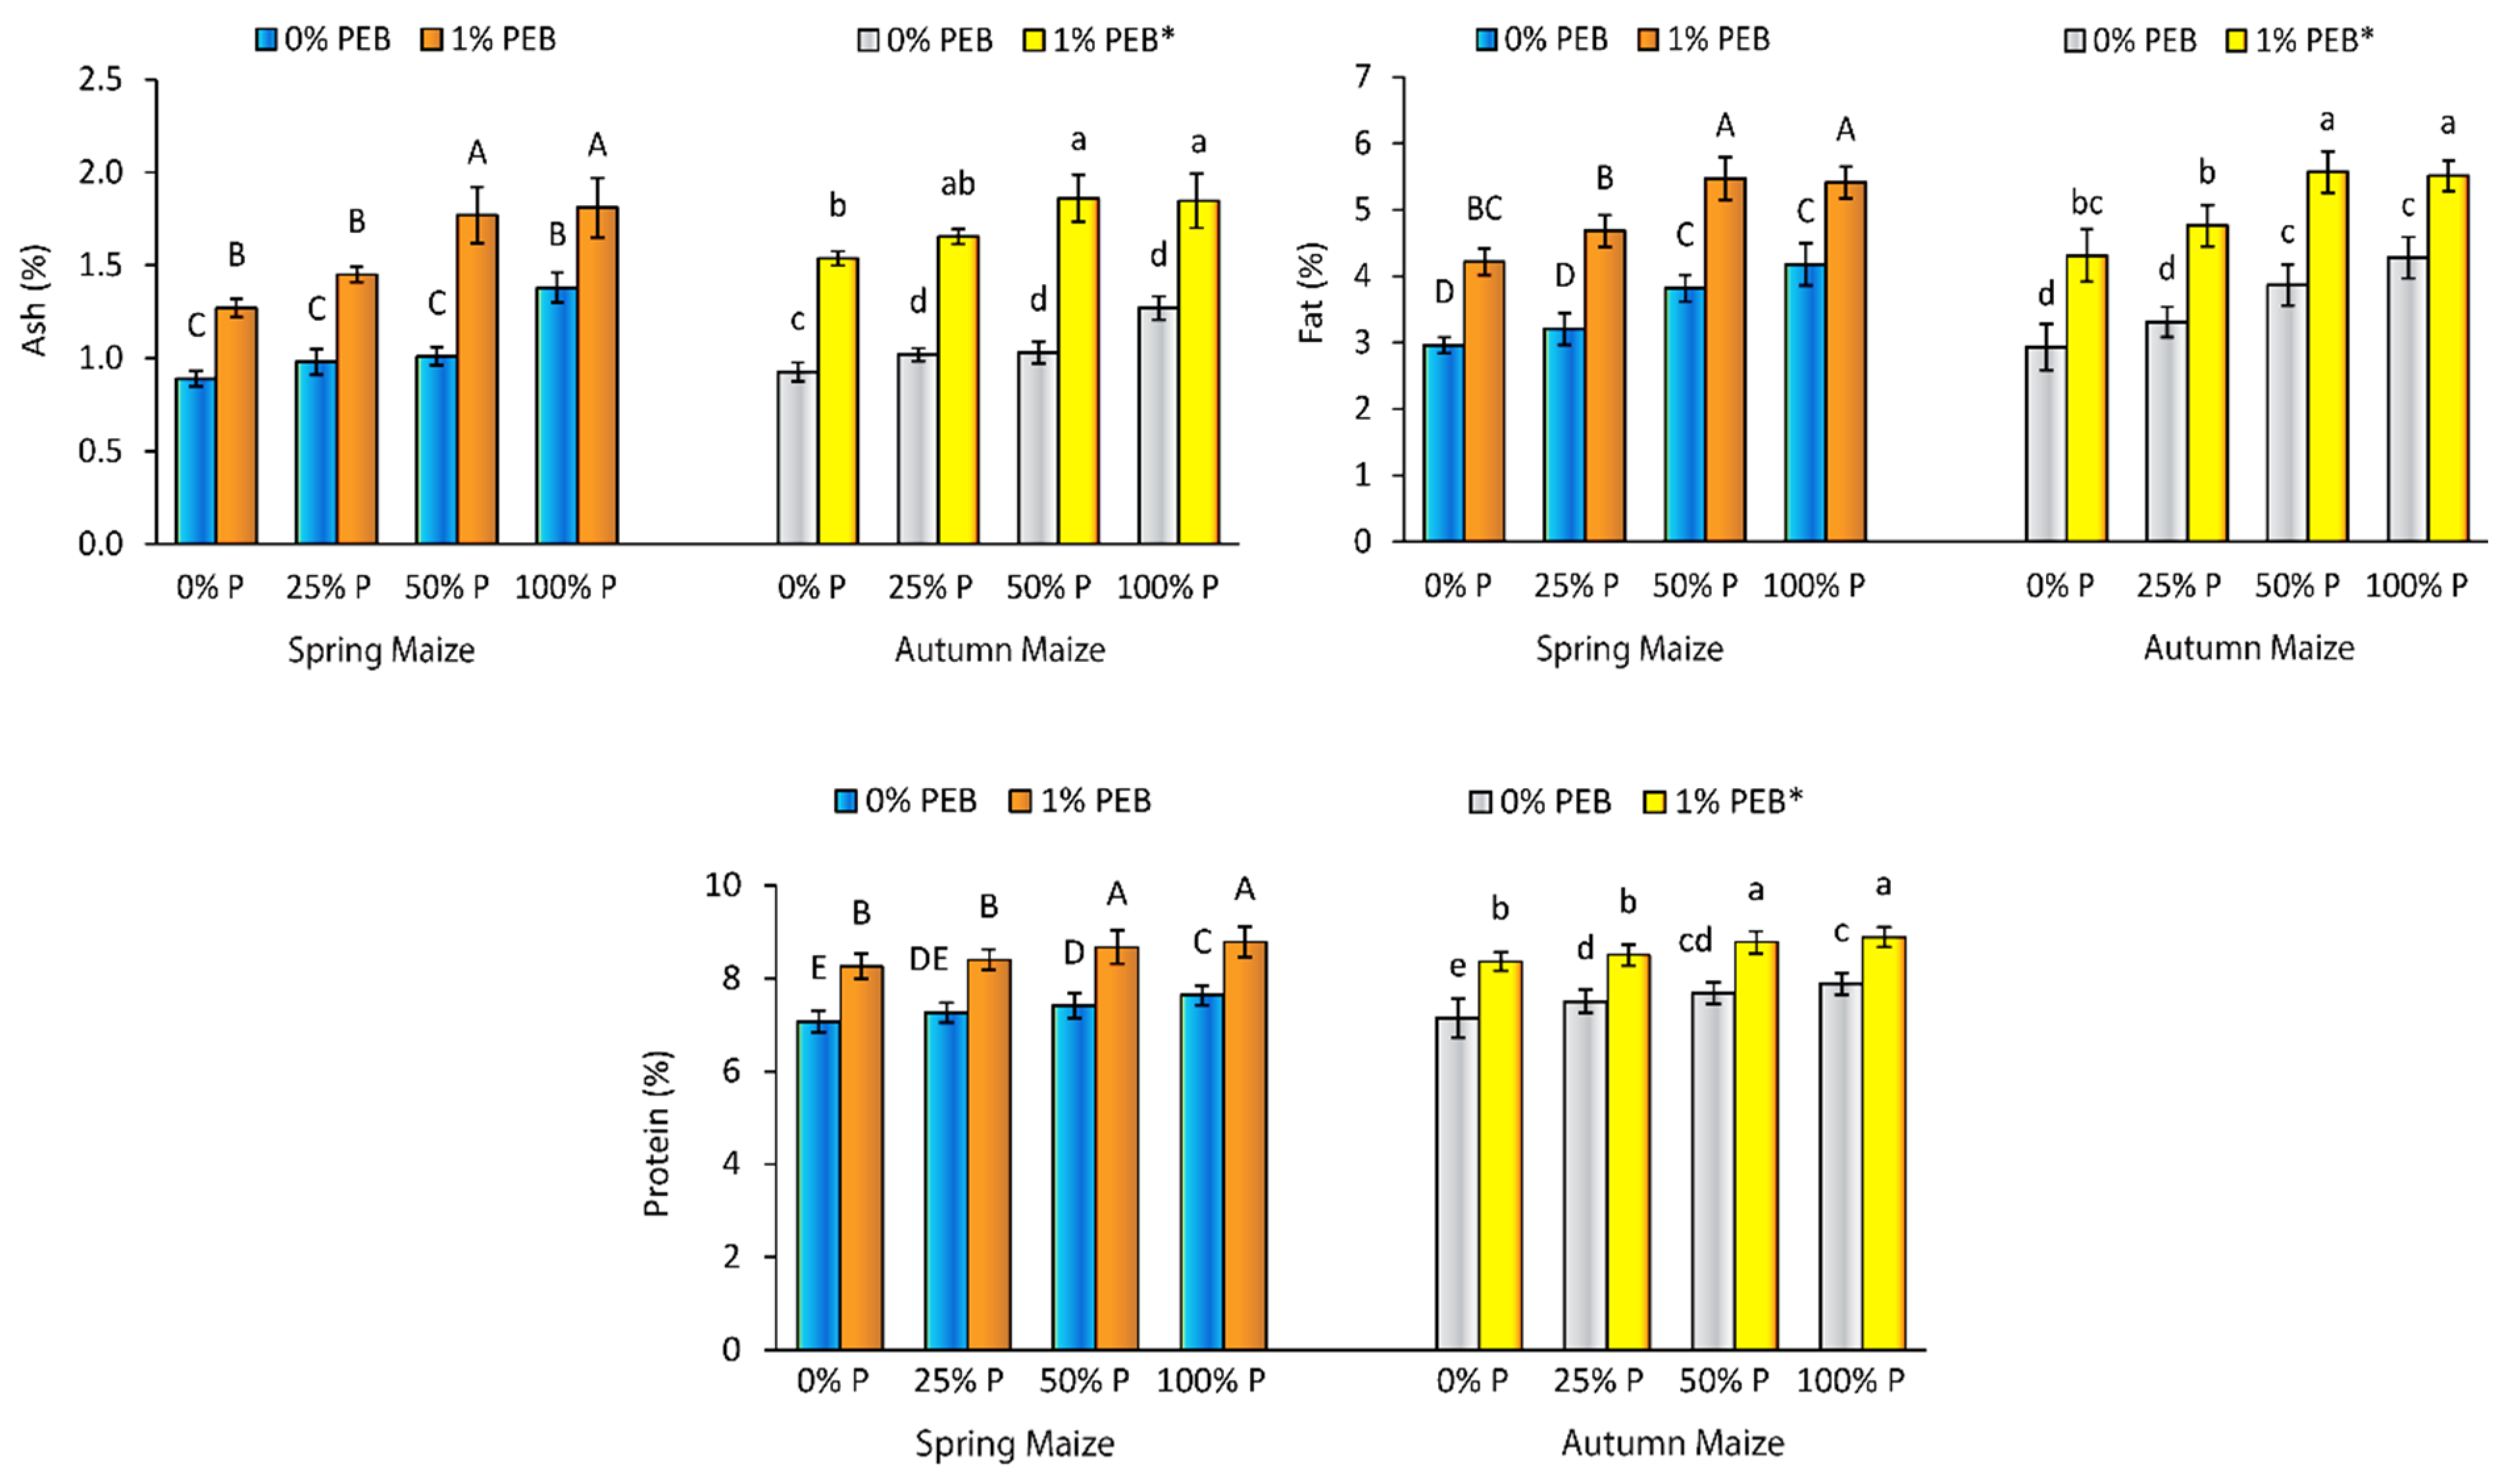
3.4. Effect of Application of PEB and Split Dose of P on Grain Quality

For both spring and autumn maize, the combined application of 1% PEB with P significantly improved grain quality parameters (Figure 6). An increasing trend in ash (%) was recorded at 1% PEB with the increase in the level of P (from 0 to 100% P); however, the maximum significant value was recorded at 1% PEB + 50% P. Furthermore, in terms of fat (%) in grains for both trials, the maximum significant value was recorded at 1% PEB + 50% P (Figure 6). Similar findings were observed in the case of protein (%) in grains with the maximum value at 1% PEB + 50% P (Figure 6).

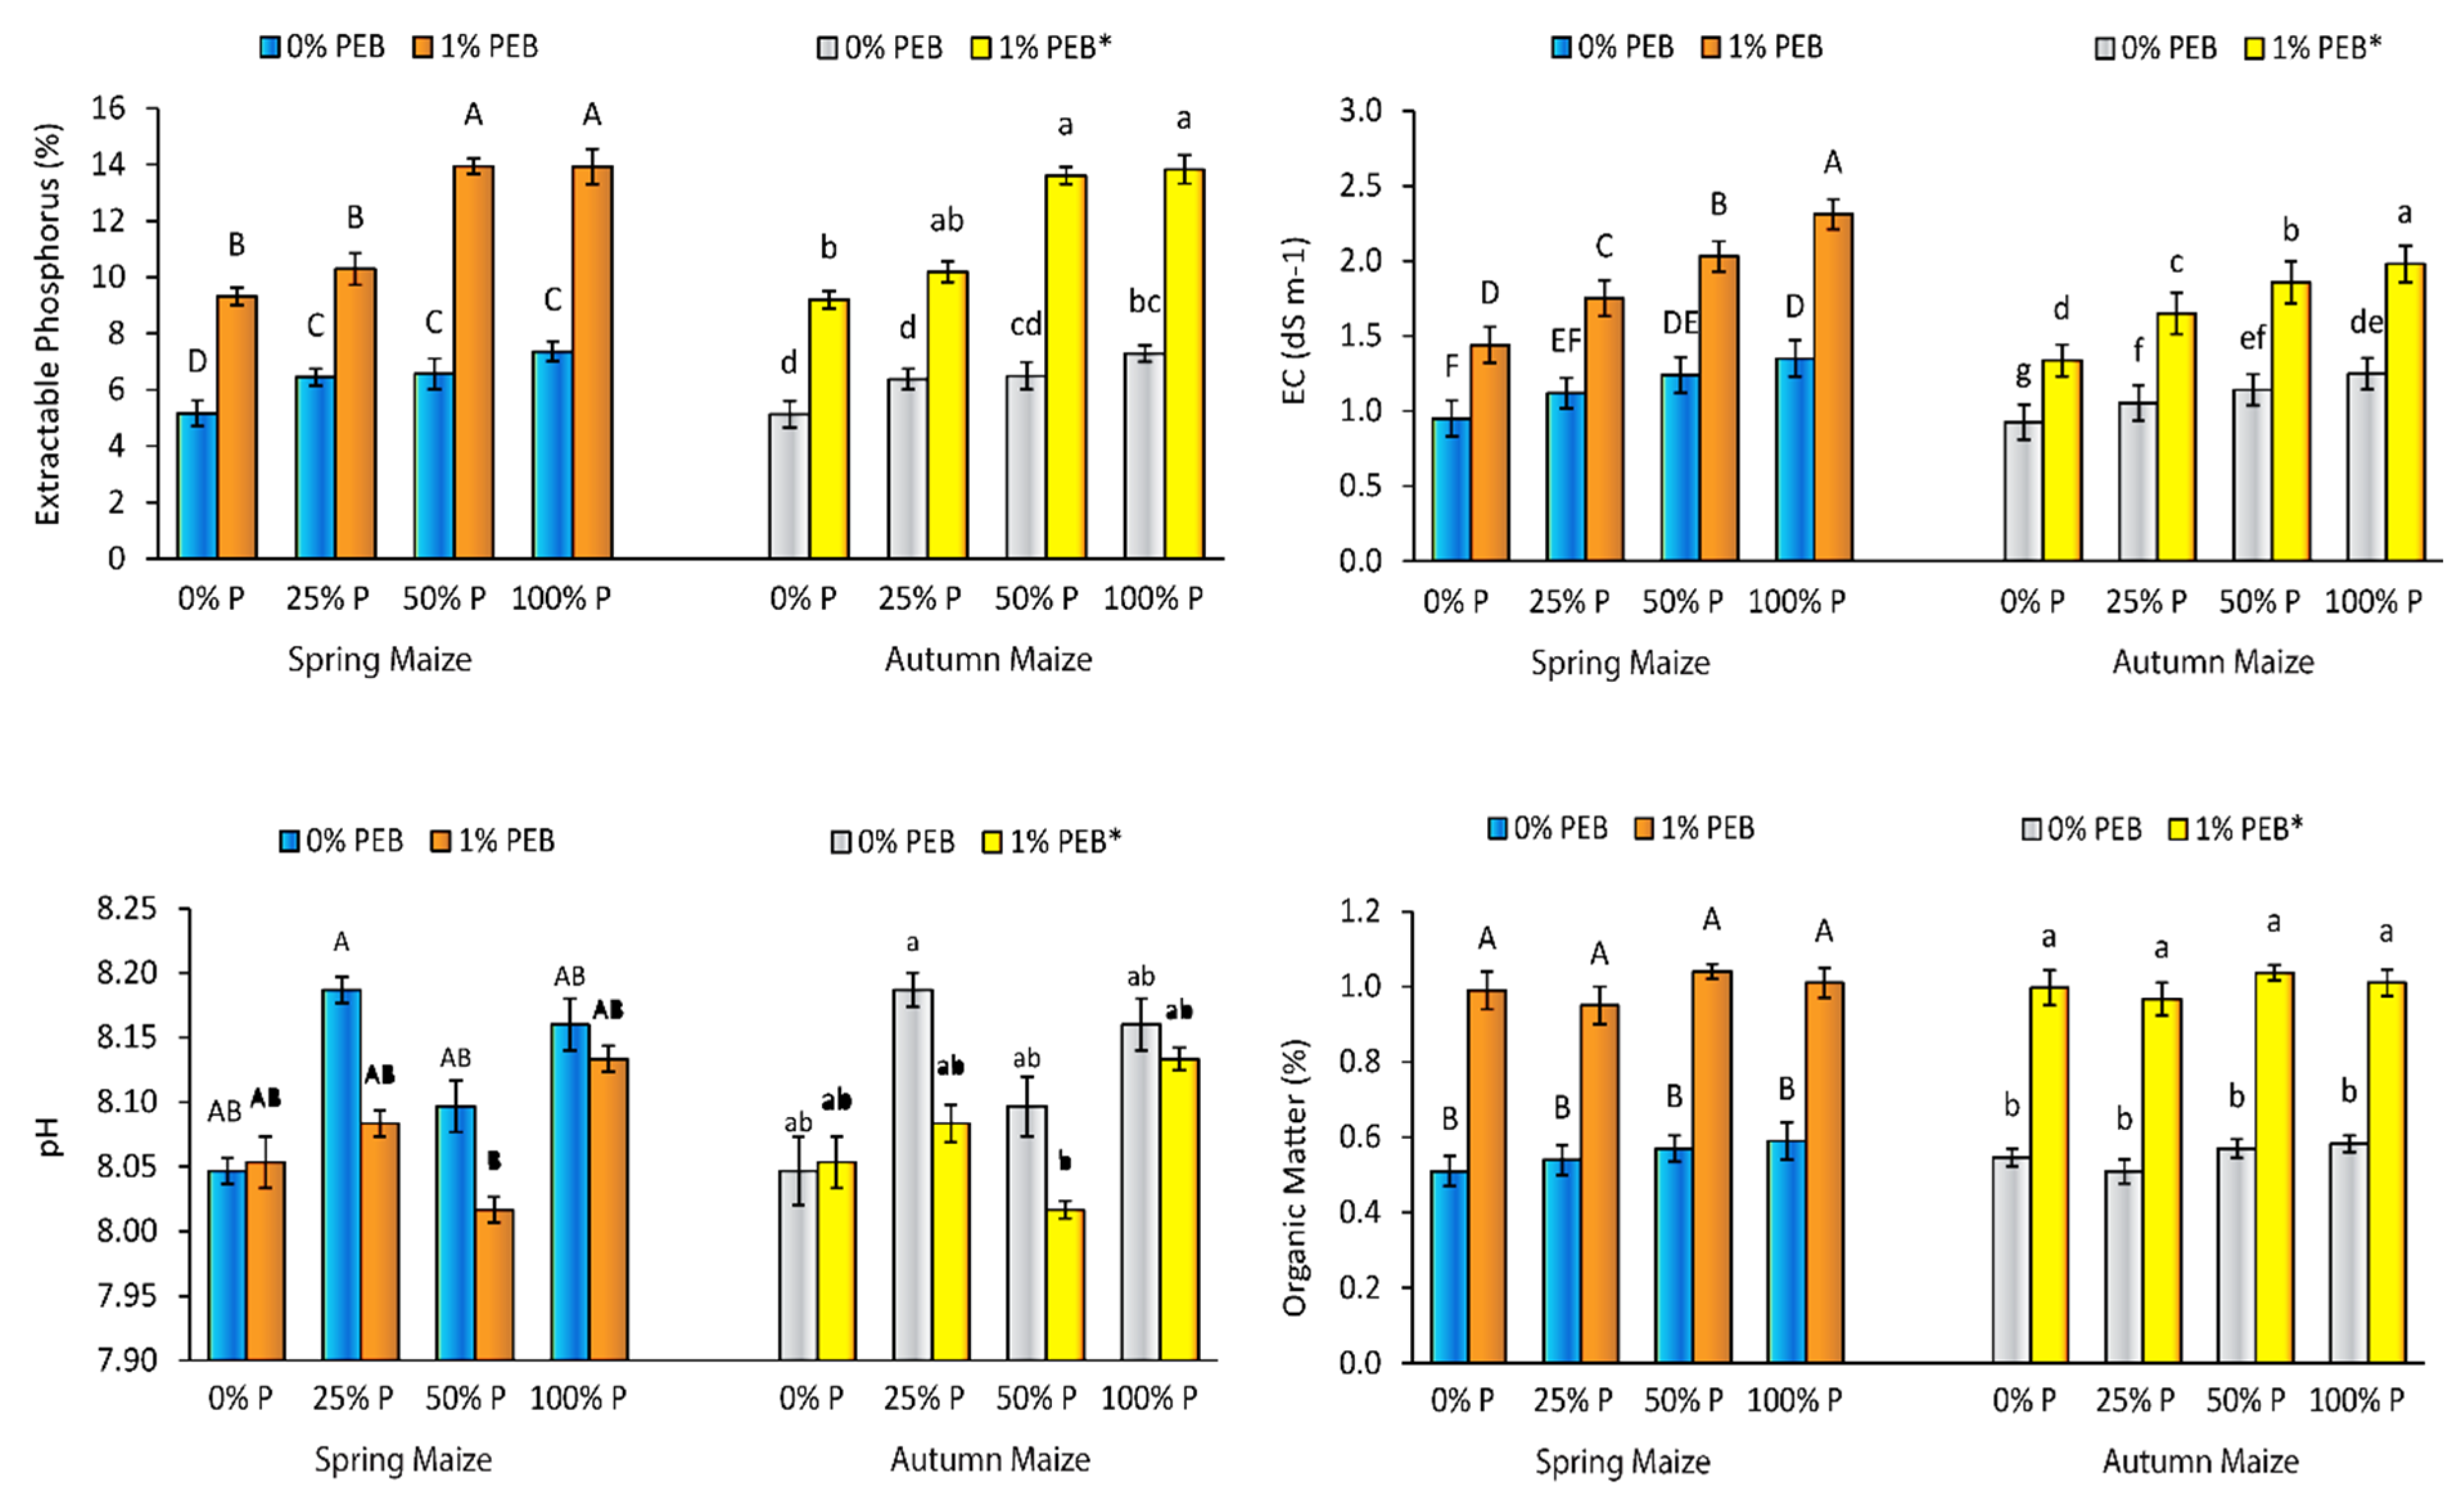
3.5. Post-Harvest Soil Analysis

Comparison of means for post-harvest soil revealed that the application of PEB has a significant impact on the selected properties of the experimental soil (Figure 7). A two-fold increase in soil extractable P was recorded where PEB was used as compared to the maximum level of P (100% P) with the maximum significant value at PEB + 50% P. In the case of EC, a slight difference was found with the increase in the split dose of P (0% P to 100% P); however, PEB + 25% P significantly increased the EC of post-harvest soil as compared to 0%, 25%, and 100% P. An increasing trend was recorded with the increase in the split dose of P with PEB with the highest value recorded at PEB + 100% P. Soil pH is one of the least affected parameters as no significant difference was recorded between all the treatments; however, a small decrease in pH was recorded where PEB was used. Furthermore, PEB has significantly improved soil organic matter as compared to the application of the split dose of P (0% to 100% P), but no significant difference was recorded with the increase in the split dose of P (PEB + 0% P to PEB + 100% P) in the case where it was applied with PEB.

4. Discussion

Phosphorus is an essential constituent of crop production. The majority of soils are deficient in P, so its continuous supply is necessary to ensure desired growth and yield. The soil used in the present study is also deficient in available P (Table 1) and so needs the continuous supply of P in crop production; however, mineral P fertilizer losses are great in the case of inorganic application. Accordingly, biochar enriched using DAP was used in the experiment along with different levels of inorganic P fertilizer to record the difference in terms of plant traits (growth, yield, grain quality, and physiological and chemical parameters) and soil properties (pH, EC, organic matter, and available P).

4.1. Impact of Application of PEB and Split Dose of P on Growth of Maize

In spring maize, the results revealed that the recommended dose of P (100% P at 0% PEB) did not improve the growth of maize as compared to its combined application (1% PEB + 50% P) with PEB (Figure 2 and Figure 3). This is probably due to the limited mobility and bioavailability of P as the experimental soil was of calcareous nature (Table 1) in which soluble P reacts with soil constituents to form insoluble phosphates. It was found previously that the solubility of P was reduced due to its reaction with Ca2+ in calcareous soil [50]. The combined application of the different levels of P with 1% PEB improved the growth of maize as it had supplied P throughout the crop stand in sufficient quantities (Figure 2 and Figure 3). Several factors may have played a role in the promotion of growth in the case of 1% PEB such as the adsorption of p-complexing ions by biochar. It was previously determined that biochar application reduced the P sorption capacity of the soil thus increasing its availability to the crop [51,52]. Secondly, the slow disintegration of biochar may have resulted in the release of organic compounds that compete for soil exchange sites thus increasing the availability of P to the crop [53,54]. However, the finding that biochar application reduces the P sorption in the soil is not consistent as the application of biochar increased the P sorption in the acidic soils [55]. Lastly, the increase in maize growth may be due to the ability of biochar to stimulate microbial growth, thus affecting the solubility of P [56,57].
In the autumn maize, 1% PEB was not added as the treatments contained 1% PEB added to spring maize. The 1% PEB was not applied afresh during autumn maize to assess the residual impact of enriched biochar. The results indicated a significant improvement in crop growth at 1% PEB* + 50% P (Figure 2 and Figure 3). This result implies that the impregnation of DAP into biochar has stimulated the availability of P so that it was available for the second crop in a sufficient quantity even without the application of PEB. It can be observed in Figure 7 that the post-harvest soil contains extractable P in the sufficient range. This finding is in line with a previous study that the P loaded on the biochar was released only when the P already found in the solution became depleted due to the uptake of crop roots, thus serving as a slow-release fertilizer [6].

4.2. Impact of Application of PEB and Split Dose of P on Yield of Maize

Similarly, in both spring and autumn maize, it is clear from Figure 4 that the application of 1% PEB with different P levels (25%, 50%, and 100%) significantly improved the yield as compared to the recommended dose of P (0% PEB + 100% P). This is probably due to the ability of enriched biochar to supply other nutrients in addition to P. Since biochar is prepared using biomass it contains nutrients (Table 1) that might be available to plants resulting in more yield. It is well established that biochar contains several important nutrients such as N, P, K, Ca, and Mg that can be taken up by the crop directly [58]. The second probability of yield increase is that enriched biochar might have altered the physical environment for maize roots resulting in better root growth which in turn contributes to yield increase. It was previously determined that the application of biochar improved the water holding capacity of the soil, soil porosity, and nutrient holding [59]. Lastly, the yield increase may be due to the ability of biochar to release growth regulators as many studies had reported the promotion of root growth and crop yield upon release of hormones from biochar [60,61,62]. However, it is not conclusively demonstrated that biochar increases maize yield as it was found in a previous study that the application of biochar did not improve the maize yield in sandy loam soil [63]. This variation may be due to the difference in soil types, biochar types, rate of application, and different agronomic practices [58].

4.3. Impact of Application of PEB and Split Dose of P on Chlorophyll Contents and Shoot N and P Contents

Furthermore, leaf chlorophyll-a was increased upon the addition of 1% PEB with 50% P in both spring and autumn maize and so reduced the inorganic P supply to 50% of the recommended dose in the form of inorganic P fertilizer (Figure 5). This was probably due to the ability of enriched biochar to increase the uptake of N by promoting root growth and improvement in the soil physical environment as discussed previously. It is well established that N is the fundamental part of the chlorophyll in plants, so the increased supply of N increased chlorophyll-a. An increase in N uptake upon the application of biochar was also investigated previously [64,65]. Similarly, the application of 1% PEB significantly increased shoot N (%) in maize (Figure 5). The increase in shoot N (%) might be associated with the ability of biochar to enhance the supply of N to crops because of the more available N in the soil. The additional N might come from the mineralization of biochar since it contains N (Table 1). As biochar is an organic amendment, upon addition of organic matter a significant increase in soil N was recorded previously. It was found that the soil N was increased by 3.68 and 5.37 g kg−1 for wheat and maize, respectively, upon each gram increase in the organic matter [66]. However, it should be kept in mind that the application of biochar alone could result in net immobilization due to a higher C/N ratio [67,68], but with the incorporation of chemical or organic fertilizer into biochar the process of mineralization may overcome immobilization resulting in more available N for crops [69].
Furthermore, the application of 1% PEB significantly improved shoot P contents (Figure 5). This is due to the potential of biochar to add P to the soil solution. It was also determined in the previous studies that the application of biochar enhanced the supply of soil P [70,71,72]. In addition, it can also improve soil physical properties as discussed, which may increase P uptake leading to higher shoot P. Similarly, the application of enriched biochar can also mobilize the microbial communities that can increase P uptake, resulting in higher shoot P [57].

4.4. Impact of Application of PEB and Split Dose of P on the Grain Quality

It was observed in both experiments that the application of 1% PEB with different levels of P (25%, 50%, and 100%) significantly improved the grain quality of maize (Figure 6). This enhancement in the grain quality of maize may be due to the ability of the enriched biochar to provide a balanced supply of nutrients. The cell constituents are the products of several metabolic processes, and for such processes to take place a balanced supply of nutrients is required for the plants [73,74,75]. In this context, the improvement of protein (%) in maize grains may be due to the potential of enriched biochar to supply nutrients in ample amounts, particularly N in sufficient quantities [76,77]. Similarly, ash (%) in grains is simply a measure of the minerals found in the grains, so the addition of enriched biochar may have increased the availability and uptake of minerals resulting in higher ash (%) in maize gains (Figure 6). A positive relation between available nutrients and ash (%) in maize grains was also investigated previously [78]. It was also found previously that the application of organic amendments increased ash in maize grains [79,80], so the application of enriched biochar increased ash contents in both experiments. This is also the reason for the improvement in fat (%) in gains (Figure 6) as soil application of enriched biochar increased available nutrients, their uptake, and consequently increased the formation of glycosides [81]. Additionally, being an organic compound, enriched biochar also stimulated the formation of fats, resulting in more fats in the treatments where it was used as compared to the full dose of inorganic P. This finding is in line with previous studies that the application of organic amendments increased fat (%) [75,82].

4.5. Impact of Application of PEB and Split Dose of P on Some Selected Properties of Post-Harvest Soil

The analysis of post-harvest soil revealed that the treatments containing 1% PEB with different levels of P (0%, 25%, 50%, and 100% P) had more available P as compared to the recommended dose of P (Figure 7). This finding has suggested that the incorporation of DAP into biochar might have rendered it a slow-release fertilizer, i.e., the ability to release it when the soil solution becomes depleted of available P. This finding is in line with a previous investigation showing that P was released into the soil solution only when it became depleted when it was applied in combination with biochar [6]. Secondly, enriched biochar might have addressed the issue of P fixation by adsorbing P-complexing metallic ions and resulting in more available P in post-harvest soil. The reduction in P-complexing ions (Ca2+ and Mg2+) with the biochar application was also recorded previously [83]. Moreover, being an excellent porous material with a high surface area and cation exchange capacity, biochar may alter the equilibrium between soil solution and soil solid for the exchange of nutrients. It may thus have increased P availability even after the second pot trial by holding and exchanging P for much longer periods. Biochar was also previously found to affect soil P dynamics [84,85]. The application of inorganic P even at its full dose did not increase post-harvest soil available P (Figure 7). It is understood that P fixations are much higher in the case of inorganic application especially in calcareous soils of high pH as in the experimental soil (Table 1), leading to no improvement. Hence, the application of inorganic fertilizer is not as long-lasting as that of enriched biochar and is prone to losses, so no improvement was recorded in post-harvest soil. These losses are well documented, and almost 80–90% of applied P was reported to be lost in previous studies [86].
Similarly, the application of 1% PEB significantly improved the organic matter of the soil (Figure 7). Since biochar is the product obtained through burning biomass in little or no oxygen, resulting in a carbon-rich compound, its application would ultimately increase the soil carbon and thereby soil organic matter. This finding is in line with the previous studies showing that the application of biochar had increased the soil organic carbon [87,88,89].
Furthermore, the EC of soil was increased by the addition of 1% PEB with different levels of P (Figure 7); however, the increase in the EC was not to such an extent that it hampered the growth of maize. The increase in EC might be due to the discharge of loosely bound components found in biochar. It was previously observed that the release of loosely bound compounds from biochar increased the soil EC [90,91]. The second possibility in the rise in soil EC is the high K content found in the biochar (Table 1) as a positive relation between K contents and soil EC was recorded previously [92,93].
The soil pH is the sole parameter that is least affected by the application of enriched biochar, but a small decrease in pH was recorded where enriched biochar was used as compared to other treatments (Figure 7), though this change was not significant. It has been reported in previous studies that biochar increased soil pH, but no significant increase in pH was recorded in both spring and autumn maize. This is probably because biochar was prepared at a comparatively lower temperature (350–400 °C) as the increase in temperature increases the pH of biochar. It was previously found that biochar prepared at higher temperatures tends to be more basic due to the loss of acidic functional groups [94,95]. The slight reduction in the pH with enriched biochar may be due to the mobilization of microbial communities as discussed and/or the release of acidic constituents from biochar, as it was previously found that the discharge of carboxylic groups from the biochar reduced the soil pH [96,97].

5. Conclusions

Based on the findings of both experiments, the impregnation of DAP with biochar was found to be a promising strategy in reducing the P inputs in the form of inorganic fertilizer. It has not only reduced the P dose by half but also served as a slow-release fertilizer providing P to the crop at the second experiment with its residual effect being pronounced. Additionally, the one-time application of enriched biochar can supply P for multiple growing seasons, which clarifies reduction in input cost associated with inorganic P fertilizer and at the same time maintains the soil health by improving its physical properties and by stimulating microbial communities. Furthermore, the application of enriched biochar uses bio-waste as raw material for its production. Therefore, its application not only provides room for waste management but also plays a role in carbon sequestration. Future research should focus on testing the efficiency of PEB in field trials so that its real-time application can be assessed.

Author Contributions

Conceptualization, M.N. and F.W.; methodology, F.W. and S.S.; software, F.W.; validation, M.T.K.N., M.A. and M.B.; formal analysis, S.S.; investigation, M.B. and M.T.K.N.; resources, K.S.B. and M.A.; data curation, F.W.; writing—original draft preparation, F.W.; writing—review and editing, F.W.; visualization, M.A. and M.B.; supervision, M.N., K.S.B. and A.M.; project administration, M.N., K.S.B. and A.M.; funding acquisition, M.N., K.S.B. and A.M. All authors have read and agreed to the published version of the manuscript.

Funding

This research received financial support from Higher Education (HEC) Pakistan via NRPU Project No. 6443/Punjab/NRPU/R&D/HEC/2016 and Ministry of Education, Youth and Sports of the Czech Republic, grant number FCH-S-21-7398.

Acknowledgments

The authors would like to extend their appreciation to the researchers supporting project number No. 6443/Punjab/NRPU/R&D/HEC/2016 and Ministry of Education, Youth and Sports of the Czech Republic, grant number FCH-S-21-7398. This research work was conducted with the technical assistance of Soil and Environmental Microbiology Laboratory, Institute of Soil and Environmental Science, University of Agriculture Faisalabad, Pakistan.

Conflicts of Interest

The authors declare no conflict of interest.

References

  1. Pei, G.; Wang, Q.; Liu, G. The role of periphyton in phosphorus retention in shallow lakes with different trophic status, China. Aquatic Bot. 2015, 125, 17–22. [Google Scholar] [CrossRef] [Green Version]
  2. Li, R.; Wang, J.J.; Zhou, B.; Awasthi, M.K.; Ali, A.; Zhang, Z.; Lahori, A.H.; Mahar, A. Recovery of phosphate from aqueous solution by magnesium oxide decorated magnetic biochar and its potential as a phosphate-based fertilizer substitute. Bioresour. Technol. 2016, 215, 209–214. [Google Scholar] [CrossRef] [PubMed] [Green Version]
  3. Chung, C.E.; Ramanathan, V.; Decremer, D. Observationally constrained estimates of carbonaceous aerosol radiative forcing. Proc. Natl. Acad. Sci. USA 2012, 109, 11624–11629. [Google Scholar] [CrossRef] [PubMed] [Green Version]
  4. Jacobson, M.Z. Effects of biomass burning on climate, accounting for heat and moisture fluxes, black and brown carbon, and cloud absorption effect. J. Geophys. Res. Atmos. 2014, 119, 8980–9002. [Google Scholar] [CrossRef]
  5. Steffen, W.; Richardson, K.; Rockström, J.; Cornell, S.E.; Fetzer, I.; Bennett, E.M.; Biggs, R.; Carpenter, S.R.; De Vries, W.; De Wit, C.A.; et al. Planetary boundaries: Guiding human development on a changing planet. Science 2015, 347, 1259855. [Google Scholar] [CrossRef] [Green Version]
  6. Li, H.; Li, Y.; Xu, Y.; Lu, X. Biochar phosphorus fertilizer effects on soil phosphorus availability. Chemosphere 2020, 244, 125471. [Google Scholar] [CrossRef]
  7. Cordell, D.; Turner, A.; Chong, J. The hidden cost of phosphate fertilizers: Mapping multi-stakeholder supply chain risks and impacts from mine to fork. Glob. Chang. Peace Secur. 2015, 27, 323–343. [Google Scholar] [CrossRef]
  8. Reitzel, K.; Bennett, W.W.; Berger, N.; Brownlie, W.J.; Bruun, S.; Christensen, M.L.; Cordell, D.; Van Dijk, K.; Egemose, S.; Eigner, H.; et al. New training to meet the global phosphorus challenge. Environ. Sci. Technol. 2019, 53, 8479–8481. [Google Scholar] [CrossRef]
  9. Withers, P.J.A.; Forber, K.G.; Lyon, C.; Rothwell, S.; Doody, D.G.; Jarvie, H.P.; Martin-Ortega, J.; Jacobs, B.; Cordell, D.; Patton, M.; et al. Towards resolving the phosphorus chaos created by food systems. Ambio 2020, 49, 1076–1089. [Google Scholar] [CrossRef] [Green Version]
  10. Johnston, A.E.; Poulton, P.R. Phosphorus in Agriculture: A Review of Results from 175 Years of Research at Rothamsted, UK. J. Environ. Qual. 2019, 48, 1133–1144. [Google Scholar] [CrossRef] [Green Version]
  11. Zanao, L.A.; Arf, O.; Reis, R.A., Jr.; Pereira, N. Phosphorus fertilization with enhanced efficiency in soybean and corn crops. Aus. J. Crop Sci. 2020, 14, 78–84. [Google Scholar] [CrossRef]
  12. Hinsinger, P.; Brauman, A.; Devau, N.; Gérard, F.; Jourdan, C.; Laclau, J.P.; Le Cadre, E.; Jaillard, B.; Plassard, C. Acquisition of phosphorus and other poorly mobile nutrients by roots. Where do plant nutrition models fail? Plant Soil 2011, 348, 29–61. [Google Scholar] [CrossRef]
  13. DeLonge, M.; Vandecar, K.L.; D’Odorico, P.; Lawrence, D. The impact of changing moisture conditions on short-term P availability in weathered soils. Plant Soil 2013, 365, 201–209. [Google Scholar] [CrossRef]
  14. Fink, J.R.; Inda, A.V.; Bavaresco, J.; Sánchez-Rodríguez, A.R.; Barrón, V.; Torrent, J.; Bayer, C. Diffusion and uptake of phosphorus, and root development of corn seedlings, in three contrasting subtropical soils under conventional tillage or no-tillage. Biol. Fertil. Soils 2015, 52, 203–210. [Google Scholar] [CrossRef]
  15. Sharma, R.; Bella, R.W.; Wong, M.T.F. Dissolved reactive phosphorus played a limited role in phosphorus transport via runoff, throughflow and leaching on contrasting cropping soils from southwest Australia. Sci. Total Environ. 2017, 577, 33–44. [Google Scholar] [CrossRef]
  16. Simmonds, B.; McDowell, R.W.; Condron, L.M. The effect of soil moisture extremes on the pathways and forms of phosphorus lost in runoff from two contrasting soil types. Soil Res. 2017, 55, 19–27. [Google Scholar] [CrossRef]
  17. Weeks, J.J.; Hettiarachchi, G.M. A review of the latest in phosphorus fertilizer technology: Possibilities and pragmatism. J. Environ. Qual. 2019, 48, 1300–1313. [Google Scholar] [CrossRef] [Green Version]
  18. Pela, A.; Bento, R.U.; Crispim, L.B.R.; Reis, R.A., Jr. Enhanced efficiency of phosphorus fertilizer in soybean and maize. Aust. J. Crop Sci. 2019, 13, 1638–1642. [Google Scholar] [CrossRef]
  19. Chagas, W.F.T.; Guelfi, D.R.; Emrich, E.B.; Silveira, M.T.P.; Caputo, A.L.C.C.; Andrade, A.B.; Soares, L.S. Agronomic characteristics of lettuce grown with monoammonium phosphate in sandy soil. Commun. Soil Sci. Plant Anal. 2017, 48, 1–8. [Google Scholar] [CrossRef]
  20. Guelfi, D.R.; Chagas, W.F.T.; Lacerda, J.R.; Chagas, R.M.R.; Souza, T.L.; Andrade, A.B. Monoammonium phosphate coated with polymers and magnesium for coffee plants. Ciência E Agrotecnologia 2018, 42, 261–270. [Google Scholar] [CrossRef] [Green Version]
  21. Ndirangu, S.M.; Liu, Y.; Xu, K.; Song, S. Risk Evaluation of pyrolyzed biochar from multiple wastes. J. Chem. 2019, 2019, 4506314. [Google Scholar] [CrossRef] [Green Version]
  22. Schimmelpfennig, S.; Glaser, B. One step forward toward characterization: Some important material properties to distinguish biochars. J. Environ. Qual. 2012, 41, 1001–1013. [Google Scholar] [CrossRef] [PubMed] [Green Version]
  23. Verheijen, F.G.; Jones, R.J.; Rickson, R.J.; Smith, C.J. Tolerable versus actual soil erosion rates in Europe. Earth-Sci. Rev. 2009, 94, 23–38. [Google Scholar] [CrossRef] [Green Version]
  24. Wang, J.; Wang, S. Preparation, modification and environmental application of biochar: A review. J. Clean. Prod. 2019, 227, 1002–1022. [Google Scholar] [CrossRef]
  25. Wang, S.; Dai, G.; Yang, H.; Luo, Z. Lignocellulosic biomass pyrolysis mechanism: A state-of-the-art review. Prog. Energy Combust. Sci. 2017, 62, 33–86. [Google Scholar] [CrossRef]
  26. Kavitha, B.; Reddy, P.V.L.; Kim, B.; Lee, S.S.; Pandey, S.K.; Kim, K.H. Benefits and limitations of biochar amendment in agricultural soils: A review. J. Environ. Manag. 2018, 227, 146–154. [Google Scholar] [CrossRef]
  27. El-Naggar, A.; Lee, S.S.; Rinklebe, J.; Farooq, M.; Song, H.; Sarmah, A.K.; Zimmerman, A.R.; Ahmad, M.; Shaheen, S.M.; Ok, Y.S. Biochar application to low fertility soils: A review of current status, and future prospects. Geoderma 2019, 337, 536–554. [Google Scholar] [CrossRef]
  28. Malyan, S.K.; Kumar, S.S.; Fagodiya, R.K.; Ghosh, P.; Kumar, A.; Singh, R.; Singh, L. Biochar for environmental sustainability in the energy-water-agroecosystem nexus. Renew. Sustain. Energy Rev. 2021, 149, 111379. [Google Scholar] [CrossRef]
  29. Mona, S.; Malyan, S.K.; Saini, N.; Deepak, B.; Pugazhendhi, A.; Kumar, S.S. Towards sustainable agriculture with carbon sequestration, and greenhouse gas mitigation using algal biochar. Chemosphere 2021, 275, 129856. [Google Scholar] [CrossRef]
  30. Shen, Y.; Song, S.; Thian, B.W.Y.; Fong, S.L.; Ee, A.W.L.; Arora, S.; Ghosh, S.; Li, S.F.Y.; Tan, H.T.W.; Dai, Y.; et al. Impacts of biochar concentration on the growth performance of a leafy vegetable in a tropical city and its global warming potential. J. Clean. Prod. 2020, 264, 121678. [Google Scholar] [CrossRef]
  31. Song, S.; Arora, S.; Laserna, A.K.C.; Shen, Y.; Thian, B.W.Y.; Cheong, J.C.; Tan, J.K.N.; Chiam, Z.; Fong, S.L.; Ghosh, S.; et al. Biochar for urban agriculture: Impacts on soil chemical characteristics and on Brassica rapa growth, nutrient content and metabolism over multiple growth cycles. Sci. Total Environ. 2020, 727, 138742. [Google Scholar] [CrossRef] [PubMed]
  32. Kizito, S.; Luo, H.; Lu, J.; Bah, H.; Dong, R.; Wu, S. Role of nutrient-enriched biochar as a soil amendment during maize growth: Exploring practical alternatives to recycle agricultural residuals and to reduce chemical fertilizer demand. Sustainability 2019, 11, 3211. [Google Scholar] [CrossRef] [Green Version]
  33. Weichen, L.; Ling, Q.; Weiwei, L.; Xin, Z.; Qi, W.; Haiyang, J.; Beijiu, C.; Huan, M.; Zhengyan, W. A potential Mg-enriched biochar fertilizer: Excellent slow-release performance and release mechanism of nutrients. Sci. Total Environ. 2021, 768, 144454. [Google Scholar] [CrossRef]
  34. González, M.E.; Cea, M.; Medina, J.; González, A.; Diez, M.C.; Cartes, P.; Monreal, C.; Navia, R. Evaluation of biodegradable polymers as encapsulating agents for the development of a urea controlled-release fertilizer using biochar as support material. Sci. Total Environ. 2015, 505, 446–453. [Google Scholar] [CrossRef] [PubMed]
  35. Gwenzi, W.; Nyambishi, T.J.; Chaukura, N.; Mapope, N. Synthesis and nutrient release patterns of a biochar-based N–P–K slow-release fertilizer. Int. J. Environ. Sci. Technol. 2015, 15, 405–414. [Google Scholar] [CrossRef]
  36. Wali, F.; Naveed, M.; Bashir, M.A.; Asif, M.; Ahmad, Z.; Alkahtani, J.; Alwahibi, M.S.; Elshikh, M.S. Formulation of biochar-based phosphorus fertilizer and its impact on both soil properties and chickpea growth performance. Sustainability 2020, 12, 9528. [Google Scholar] [CrossRef]
  37. Walkley, A. A critical examination of a rapid method for determining organic carbon in soils: Effect of variations in digestion conditions and of organic soil constituents. Soil Sci. 1947, 63, 251–263. [Google Scholar] [CrossRef]
  38. Keeney, D.R.; Nelson, D.N. Nitrogen-Inorganic Forms. In Methods of Soil Analysis; Page, A.L., Miller, R.H., Keeney, D.R., Eds.; SSSA/ASA: Madison, WI, USA, 1982; pp. 643–698. [Google Scholar]
  39. Olsen, S.R.; Cole, C.V.; Watanabe, F.S.; Dean, L.A. Estimation of Available Phosphorus in Soils by Extraction with Sodium Bicarbonate; US Department of Agriculture: Washington, DC, USA, 1954. [Google Scholar]
  40. Leoppert, R.H.; Hallmark, C.T.; Koshy, M.M. Routine procedure for rapid determination of soil carbonates. Soil Sci. Soc. Am. J. 1984, 48, 1030–1033. [Google Scholar] [CrossRef]
  41. da Silva Veiga, P.A.; Schultz, J.; da Silva Matos, T.T.; Fornari, M.R.; Costa, T.G.; Meurer, L.; Mangrich, A.S. Production of high-performance biochar using a simple and low-cost method: Optimization of pyrolysis parameters and evaluation for water treatment. J. Anal. Appl. Pyrolysis 2020, 148, 2370. [Google Scholar] [CrossRef]
  42. Rajkovich, S.; Enders, A.; Hanley, K.; Hyland, C.; Zimmerman, A.R.; Lehmann, J. Corn growth and nitrogen nutrition after additions of biochars with varying properties to a temperate soil. Biol. Fertil. Soils 2012, 48, 271–284. [Google Scholar] [CrossRef]
  43. Wolf, B. The comprehensive system of leaf analysis and its use for diagnosing crop nutrient status. Commun. Soil Sci. Plant Anal. 1982, 13, 1035–1059. [Google Scholar] [CrossRef]
  44. Bradford, M.M. A rapid and sensitive method for quantification of microgram quantities of protein utilizing the principle of dye binding. Anal. Chem. 1995, 72, 248–254. [Google Scholar]
  45. AOAC. Official Methods of Analysis of the Association of Official’s Analytical Chemists, 17th ed.; Association of Official Analytical Chemists: Arlington, VA, USA, 2003. [Google Scholar]
  46. James, G.S. Analytical Chemistry of Foods; Blackie Academic and Professional: London, UK, 1995; pp. 117–120. [Google Scholar]
  47. Jackson, M.L. Soil Chemical Analysis; Prentice-Hall Inc.: Englewood Clips, NJ, USA, 1958; Volume 85, pp. 251–252. [Google Scholar]
  48. Rashid, A. Mapping Zinc Fertility of Soils Using Indicator Plants and Soils-Analyses. Ph.D. Thesis, University of Hawaii, Honolulu, HI, USA, 1986. [Google Scholar]
  49. Little, T.M.; Hills, F.J. Agricultural Experimentation: Design and Analysis (No. 630.72 L5); Wiley & Sons: New York, NY, USA, 1978. [Google Scholar]
  50. Bell, L.C.; Black, C.A. Transformation of dibasic calcium phosphate di-hydrate and octa-calcium phosphate in slightly acid and alkaline soils. Soil Sci. Soc. Am. J. 2013, 34, 583–587. [Google Scholar] [CrossRef]
  51. Jiang, J.; Yuan, M.; Xu, R.; Bish, D.L. Mobilization of phosphate in variable-charge soils amended with biochars derived from crop straws. Soil Tillage Res. 2015, 146, 139–147. [Google Scholar] [CrossRef]
  52. Qayyum, M.F.; Ashraf, I.; Abid, M.; Steffens, D. Effect of biochar, lime, and compost application on phosphorus adsorption in a ferralsol. J. Plant Nutr. Soil Sci. 2015, 178, 576–581. [Google Scholar] [CrossRef]
  53. Hiemstra, T.; Mia, S.; Duhaut, P.B.; Molleman, B. Natural and pyrogenic humic acids at goethite and natural oxide surfaces interacting with phosphate. Environ. Sci. Technol. 2013, 47, 9182–9189. [Google Scholar] [CrossRef]
  54. Schneider, F.; Haderlein, S.B. Potential effects of biochar on the availability of phosphorus –mechanistic insights. Geoderma 2016, 277, 83–90. [Google Scholar] [CrossRef]
  55. Zhang, H.; Chen, C.; Gray, E.M.; Boyd, S.E.; Yang, H.; Zhang, D. Roles of biochar in improving phosphorus availability in soils: A phosphate adsorbent and a source of available phosphorus. Geoderma 2016, 276, 1–6. [Google Scholar] [CrossRef]
  56. Fox, A.; Kwapinski, W.; Griffiths, B.S.; Schmalenberger, A. Biochar-induced growth promotion of Lolium perenne. F.E.M.S. Microbiol. Ecol. 2014, 90, 78–91. [Google Scholar] [CrossRef] [Green Version]
  57. Deb, D.; Kloft, M.; Lässig, J.; Walsh, S. Variable effects of biochar and P solubilizing microbes on crop productivity in different soil conditions. Agroecol. Sustain. Food Syst. 2016, 40, 145–168. [Google Scholar] [CrossRef]
  58. Liu, X.; Zhang, A.; Ji, C.; Joseph, S.; Bian, R.; Li, L.; Pan, G.; Paz-Ferreiro, J. Biochar’s effect on crop productivity and the dependence on experimental conditions-A meta-analysis of literature data. Plant Soil 2013, 377, 583–594. [Google Scholar] [CrossRef]
  59. Omondi, M.O.; Xia, X.; Nahayo, A.; Liu, X.; Korai, P.K.; Pan, G. Quantification of biochar effects on soil hydrological properties using meta-analysis of literature data. Geoderma 2016, 274, 28–34. [Google Scholar] [CrossRef]
  60. Graber, E.; Harel, Y.M.; Kolton, M.; Cytryn, E.; Silber, A.; David, D.R.; Tsechansky, L.; Borenshtein, M.; Elad, Y. Biochar impact on development and productivity of pepper and tomato grown in fertigated soilless media. Plant Soil 2010, 337, 481–496. [Google Scholar] [CrossRef]
  61. Viger, M.; Hancock, R.D.; Miglietta, F.; Taylor, G. More plant growth but less plant defense? First global gene expression data for plants grown in soil amended with biochar. Gcb Bioenergy 2015, 7, 658–672. [Google Scholar] [CrossRef]
  62. Lou, Y.; Joseph, S.; Li, L.; Graber, E.R.; Liu, X.; Pan, G. Water extract from straw biochar used for plant growth promotion: An initial test. Bio. Res. 2016, 11, 249–266. [Google Scholar] [CrossRef] [Green Version]
  63. Niu, Y.; Luo, J.; Liu, D.; Müller, C.; Zaman, M.; Lindsey, S.; Ding, W. Effect of biochar and nitrapyrin on nitrous oxide and nitric oxide emissions from a sandy loam soil cropped to maize. Biol. Fertil. Soils 2018, 54, 645–658. [Google Scholar] [CrossRef]
  64. Rizwan, M.; Ali, S.; Qayyum, M.F.; Ibrahim, M.; Zia-Ur-Rehman, M.; Abbas, T.; Ok, Y.S. Mechanisms of biochar-mediated alleviation of toxicity of trace elements in plants: A critical review. Environ. Sci. Pollut. Res. 2016, 23, 2230–2248. [Google Scholar] [CrossRef]
  65. Lyu, P.; Wang, J.; Geng, S.; Sun, H.; Wang, X. Effects of nitrogen application on photosynthetic characteristics and nitrogen use efficiency in wheat after rice. Agric. Sci. Technol. 2017, 18, 771–776. [Google Scholar]
  66. Cui, Z.L.; Zhang, F.S.; Chen, X.P.; Miao, Y.X.; Li, J.L.; Shi, L.W.; Xu, J.F.; Ye, Y.L.; Liu, C.S.; Yang, Z.P. On-farm estimation of indigenous nitrogen supply for site-specific nitrogen management in the North China plain. Nutr. Cycl. Agroecosyst. 2008, 81, 37–47. [Google Scholar] [CrossRef]
  67. Lehmann, J.; Joseph, S. Biochar for environmental management: An introduction. In Biochar for Environmental Management: Science and Technology; Lehmann, J., Joseph, S., Eds.; Earthscan: London, UK, 2009; pp. 1–12. [Google Scholar]
  68. Riaz, M.; Roohi, M.; Arif, M.S.; Hussain, Q.; Yasmeen, T.; Shahzad, T.; Shahzad, S.M.; Muhammad, H.F.; Arif, M.; Khalid, M. Corncob-derived biochar decelerates mineralization of native and added organic matter (AOM) in organic matter depleted alkaline soil. Geoderma 2017, 294, 19–28. [Google Scholar] [CrossRef]
  69. Arif., M.; Ilyas, M.; Riaz, M.; Ali, K.; Shahd, K.; Haq, I.; Fahad., S. Biochar improves phosphorus use efficiency of organic-inorganic fertilizers, maize-wheat productivity and soil quality in a low fertility alkaline soil. Field Crops Res. 2017, 214, 25–37. [Google Scholar] [CrossRef]
  70. Glaser, B.; Lehmann, J.; Zech, W. Ameliorating physical and chemical properties of highly weathered soils in the tropics with charcoal: A review. Biol. Fertil. Soils 2002, 35, 219–230. [Google Scholar] [CrossRef]
  71. Lehmann, J.; Pereira da Silva, J.; Steiner, C.; Nehls, T.; Zech, W.; Glaser, B. Nutrient availability and leaching in an archaeological anthrosol and a ferralsol of the central Amazon Basin: Fertilizer, manure and charcoal amendments. Plant Soil 2003, 249, 343–357. [Google Scholar] [CrossRef]
  72. Xu, G.; Wei, L.L.; Sun, J.N.; Shao, H.B.; Chang, S.X. What is more important for enhancing nutrient bioavailability with biochar application into a sandy soil: Direct or indirect mechanism? Ecol. Eng. 2013, 52, 119–124. [Google Scholar] [CrossRef]
  73. Castro, G.S.A.; Crusciol, C.A.C. Effects of surface application of dolomitic limestone and calcium-magnesium silicate on soybean and maize in rotation with green manure in a tropical region. Bragantia 2015, 74, 311–321. [Google Scholar] [CrossRef] [Green Version]
  74. Fadlalla, H.A.; Abukhlaif, H.A.A.; Mohamed, S.S. Effects of chemical and bio-fertilizers on yield, yield components and grain quality of maize (Zea mays L.). Afr. J. Agric. Res. 2016, 11, 4654–4660. [Google Scholar]
  75. Chauhan, N.; Sankhyan, N.K.; Sharma, R.P.; Singh, J.; Gourav. Effect of long-term application of inorganic fertilizers, farmyard manure and lime on wheat (Triticum aestivum L.) productivity, quality and nutrient content in an acid alfisol. J. Plant Nutr. 2020, 43, 2569–2578. [Google Scholar] [CrossRef]
  76. Zafar, M.; Rahim, N.; Shaheen, A.; Khaliq, A.; Arjamand, T.; Jamil, M. Effect of combining poultry manure, inorganic phosphorus fertilizers and phosphate solubilizing bacteria on growth, yield, protein content and P uptake in maize. Adv. Agric. Bot. 2011, 3, 46–58. [Google Scholar]
  77. Liu, J.; Liang, B.; Liu, S.; Zhang, G.; Yuan, M. Effects of long-term fertilization on grain quality of summer maize. Adv. J. Food Sci. Technol. 2016, 11, 33–39. [Google Scholar] [CrossRef]
  78. Thakur, A.; Sharma, R.P.; Sankhyan, N.K.; Sepehya, S.; Kumar, R. Long-term effect of fertilizers and amendments on maize productivity and relationship of soil health parameters with quality traits of maize grains under mid hills sub humid conditions of Himachal Pradesh. Him. J. Agric. Res. 2019, 45, 25–30. [Google Scholar]
  79. Karforma, J.; Ghosh, M.; Ghosh, D.C.; Mandal, S. Effect of integrated nutrient management on growth, yield, quality and economics of fodder maize in rainfed upland of Terai region of West Bengal. Int. J. Agric. Environ. Biotechnol. 2012, 5, 419–427. [Google Scholar]
  80. Nwite, J.C.; Nwafor, S.O.; Nwangwu, A.O.; Olejeme, O.C. Enhancing soil fertility, maize grain yield and nutrients composition through different planting time and manure sources in farmers’ fields of Southeastern Nigeria. Asian Res. J. Agric. 2018, 10, 1–12. [Google Scholar] [CrossRef]
  81. Aldalin, H.K.H. Effect of poultry litter on protein, oil and mineral contents of maize (Zea mays L). Adv. Environ. Biol. 2017, 11, 90–94. [Google Scholar]
  82. Chen, J.; Liu, S.; Jiang, W. Effects of long-term positioning of straw returning on the quality and yield of summer maize. Afr. J. Agric. Res. 2017, 12, 3569–3576. [Google Scholar]
  83. Mendes, D.O.; Zafra, D.L.; Vassilev, N.B.; Silva, I.R.; Ribeiro, J.I.; Costaa, M.D. Biochar enhances Aspergillus niger rock phosphate solubilization by increasing organic acid production and alleviating fluoride toxicity. Appl. Environ. Microbiol. 2014, 80, 3081–3085. [Google Scholar] [CrossRef] [Green Version]
  84. Soinne, H.; Hovi, J.; Tammeorg, P.; Turtola, E. Effect of biochar on phosphorus sorption and clay soil aggregate stability. Geoderma 2014, 219, 162–167. [Google Scholar] [CrossRef]
  85. Gao, S.; Hoffman-Krull, K.; Bidwell, A.L.; DeLuca, T.H. Locally produced wood biochar increases nutrient retention and availability in agricultural soils of the San Juan Islands, USA. Agric. Ecosyst. Environ. 2016, 233, 43–54. [Google Scholar] [CrossRef]
  86. Naderi, M.; Danesh, S. Nano-fertilizers and their roles in sustainable agriculture. Int. J. Agric. Crop Sci. 2013, 5, 2229–2232. [Google Scholar]
  87. Atkinson, C.J.; Fitzgerald, J.D.; Hipps, N.A. Potential mechanisms for achieving agricultural benefits from biochar application to temperate soils: A review. Plant Soil 2010, 337, 1–18. [Google Scholar] [CrossRef]
  88. Abel, S.; Peters, A.; Trinks, S.; Schonsky, H.; Facklam, M. Impact of biochar and hydrochar addition on water retention and water repellency of sandy soil. Geoderma 2013, 202, 183–191. [Google Scholar] [CrossRef]
  89. Biederman, L.A.; Harpole, W.S. Biochar and its effects on plant productivity and nutrient cycling: A meta-analysis. Glob. Chang. Biol. Bioener. 2013, 5, 202–214. [Google Scholar] [CrossRef]
  90. Warnock, D.D.; Lehmann, J.; Kuyper, T.W.; Rillig, M.C. Mycorrhizal responses to biochar in soil concepts and mechanisms. Plant Soil 2007, 300, 9–20. [Google Scholar]
  91. Chan, K.; Zwieten, L.V.; Meszaros, I.; Downie, A.; Joseph, S. Agronomic values of green-waste biochar as a soil amendment. Soil Res. 2008, 45, 629–634. [Google Scholar] [CrossRef]
  92. Steven, F.V.; Kenar, J.A.; Thompson, A.R.; Peterson, S.C. Comparison of biochars derived from wood pellets and pelletized wheat straw as replacements for peat in potting substrate. Ind. Crops Prod. 2013, 51, 437–443. [Google Scholar]
  93. Jose., A.A.; Calero, J.M.; Barrón, V.; Torrent, J.; Carmen del Campillo, M.; Gallardo, A.; Villar, R. Effects of biochars produced from different feedstocks on soil properties and sunflower growth. J. Plant Nutr. Soil Sci. 2014, 177, 16–25. [Google Scholar]
  94. Ahmad, M.; Lee, S.S.; Dou, X.; Mohan, D.; Sung, J.; Yang, J.E. Effects of pyrolysis temperature on soybean stover- and peanut shell-derived biochar properties and TCE adsorption in water. Bioresour. Technol. 2012, 118, 536–544. [Google Scholar] [CrossRef]
  95. Cantrell, K.B.; Hunt, P.G.; Uchimiya, M.; Novak, J.M.; Ro, K.S. Impact of pyrolysis temperature and manure source on physicochemical characteristics of biochar. Bioresour. Technol. 2012, 107, 419–428. [Google Scholar] [CrossRef]
  96. Brodowski, S.; John, B.; Flessa, H.; Amelung, W. Aggregate-occulated black carbon in soil. Eur. J. Soil Sci. 2006, 57, 539–546. [Google Scholar] [CrossRef]
  97. Chang, C.H.; Lehmann, J.; Thies, J.E.; Burton, S.D.; Engelhard, M.H. Oxidation of black carbon by biotic and antibiotic processes. Org. Geochem. 2006, 37, 1477–1488. [Google Scholar] [CrossRef]
Figure 1. Layout of experiment and schematic diagram of a single pot illustrating the procedure adopted during both spring and autumn maize. The figure contains 24 boxes on the left-hand side, and each box represents a pot with its respective treatment (8T × 3R). Pots containing 1% PEB are filled in black; T = treatment; R = replication.
Sustainability 14 01987 g001
Figure 2. Means of plant root length (cm), shoot length (cm), and fresh root weight (g) with standard error represented by bars. Means with different letters are significantly different from one another at the significance level of < 0.05 (Tukey’s HSD test), represented by capital letters (A) in spring and small letters (a) in autumn maize. In spring maize, pots were treated with PEB (0% and 1%) for each level of P (0%, 25%, 50%, and 100% P); in autumn maize, all pots were treated only with their respective P level. PEB* indicates pots containing 1% PEB added to spring maize.
Sustainability 14 01987 g002
Figure 3. Means of plant fresh shoot weight (g), dry root weight (g), and dry shoot weight (g) with standard error represented by bars. Means with different letters are significantly different from one another at the significance level of < 0.05 (Tukey’s HSD test), represented by capital letters (A) in spring and small letters (a) in autumn maize. In spring maize, pots were treated with PEB (0% and 1%) for each level of P (0%, 25%, 50%, and 100% P); in autumn maize, all pots were treated only with their respective P level. PEB* indicates pots containing 1% PEB added to spring maize.
Sustainability 14 01987 g003
Figure 4. Means of yield traits with standard error represented by bars. Means with different letters are significantly different from one another at the significance level of < 0.05 (Tukey’s HSD test), represented by capital letters (A) in spring and small letters (a) in autumn maize. In spring maize, pots were treated with PEB (0% and 1%) for each level of P (0%, 25%, 50%, and 100% P); in autumn maize, all pots were treated only with their respective P level. PEB* indicates pots containing 1% PEB added to spring maize.
Sustainability 14 01987 g004
Figure 5. Means of chlorophyll-a, shoot N (%), and shoot P (%) with standard error represented by bars. Means with different letters are significantly different from one another at the significance level of <0.05 (Tukey’s HSD test), represented by capital letters (A) in spring and small letters (a) in autumn maize. In spring maize, pots were treated with PEB (0% and 1%) for each level of P (0%, 25%, 50%, and 100% P); in autumn maize, all pots were treated only with their respective P level. PEB* indicates pots containing 1% PEB added to spring maize.
Sustainability 14 01987 g005
Figure 6. Means of grain quality traits with standard error represented by bars. Means with different letters are significantly different from one another at the significance level of < 0.05 (Tukey’s HSD test), represented by capital letters (A) in spring and small letters (a) in autumn maize. In spring maize, pots were treated with PEB (0% and 1%) for each level of P (0%, 25%, 50%, and 100% P); in autumn maize, all pots were treated only with their respective P level. PEB* indicates pots containing 1% PEB added to spring maize.
Sustainability 14 01987 g006
Figure 7. Means of post-harvest soil chemical traits with standard error represented by bars. Means with different letters are significantly different from one another at the significance level of < 0.05 (Tukey’s HSD test), represented by capital letters (A) in spring and small letters (a) in autumn maize. In spring maize, pots were treated with PEB (0% and 1%) for each level of P (0%, 25%, 50%, and 100% P); in autumn maize, all pots were treated only with their respective P level. PEB* indicates pots containing 1% PEB added to spring maize.
Sustainability 14 01987 g007
Table 1. Some selected properties of both experimental soil and the biochar used in enrichment.
PropertiesUnitValue/Description
Experimental soil used in pot trialsSand%35.6
Silt%38.3
Clay%25.3
Textural class-Sandy clay loam
pH-8.10
ECdS m−10.61
CaCO3%3.34
Total N%0.08
Organic Matter%0.56
Extractable Pmg kg−14.01
Biochar used for the enrichmentECdS m−11.98
pH-7.97
Cag kg−17.20
Mgg kg−15.08
Ng kg−111.4
Pg kg−13.04
Kg kg−130.03
Publisher’s Note: MDPI stays neutral with regard to jurisdictional claims in published maps and institutional affiliations.

