
Development of a Low-Cost Remote Fault Detection System for a Photovoltaic Power Plant

Department of Electrical Engineering, National Chin-Yi University of Technology, Taichung 41170, Taiwan
*
Author to whom correspondence should be addressed.
Sustainability 2022, 14(24), 16596; https://doi.org/10.3390/su142416596
Submission received: 15 September 2022
/
Revised: 1 December 2022
/
Accepted: 5 December 2022
/
Published: 11 December 2022
(This article belongs to the Special Issue Electric Power Equipment Sustainable Development)
Abstract
:The main purpose of this study is to develop a cost-effective photovoltaic module array (PVMA) fault detection system. The system installs a fault detection module in the junction box at the back of each photovoltaic module (PVM), connects it to the Wi-Fi on the case site, and transfers data and information to the server for data analysis. The PVM outputs the voltage to the isolated DC-DC power module as the power supply of the overall circuits. The fault detection module sends data to the message queuing telemetry transport (MQTT) broker through the protocol in MQTT. As for the server host end, the visualization IoT development tool Node-RED is set up to display complex data sent by the fault detection module by means of data visualization. At the same time, it is linked to the open source time series database (OSTSDB) to process time series data. Finally, the results of the PVM are instantly sent to the maintenance personnel through an exception alert notification in order to inform the maintenance personnel to quickly rule out the failure. As the developed fault detection system hardware is more cost-effective than existing detection systems, the cost-effectiveness is favorable for mass production with market competitiveness.
1. Introduction
Among the forms of renewable energy promoted in recent years, the photovoltaic power generation system (PVPGS) has achieved the most extensive development. In addition to setting up large power plants to supply power, the photovoltaic power generation system is also set up on high-rise buildings or on the rooftop of small residential houses as the power supply source. However, photovoltaic modules (PVMS) are often affected by factors in the external environment, resulting in damage and the system’s greatly reduced power output. Some common factors include stains, contact point aging, cracks, diode short circuit causing the module to heat up, snail trails, building or tree shade, etc. When the above fault factors occur, the repair and exclusion of a faulty module will be more difficult and cumbersome as the capacity of PVM set increases. Therefore, the development of a real-time fault detection system for wireless PV power generation plants [1,2,3,4] not only facilitates fault detection when the system is operating but can also immediately locate the faulty module and replace it, thereby reducing output power loss.
The current PVMA fault detection involves the adoption of different methods based on the size of the PV power plant. The hardware costs, degree of complexity, accuracy, and data reception method also vary. However, the PVM fault detection systems mentioned in the literature mostly require large and complex circuits, which not only have no combination of wireless transmission [5,6,7,8] and control functions, but also require manpower and time-consuming on-site inspections. Conversely, some scholars have adopted the surface thermal image data of unmanned aerial vehicles (UAV) [9,10] and have combined image processing technology in order to identify the location of the faulty module without the need for additional circuits. UAVs are overly costly, and operators are required to have related operational knowledge and licenses. Other scholars adopt the total-cross-tied (TCT) [11,12] for the PVMA. Through the direction of the cross-tied line segment current across the modules, the location of the faulty module can be found. However, this method involves installing a current sensor for each line segment to ensure the work of the PVMA is at the maximum power point in order to correctly determine the location of the faulty module. In view of this, the PVM fault detection method with hardware costs and wireless transmission as the main consideration factors is proposed in this study. The hardware cost of a fault sensing module developed only accounts for 10% of the cost of a PVM. It is not only easy to install, but the interval of data reading can also be set by a program. The minimum setting is sending data every 10 s, with fault detection accuracy reaching 100%.
The fault module detection method employed in this study has the advantages of having a simple structure, low cost [13,14] and not needing presence on-site for detection. Through Node-RED [14,15,16,17], a visualization user interface (UI) can be set to access the protocol port frame specified by the server host from an external network, with an encrypted connection function. That is, even if connected to the mobile internet or a cross-domain network outside the case site, the data can still be accessed. As for data storage, the traditional relational database management system MySQL is not used, because a traditional interface makes monitoring and data analysis of a large amount of PVM data complex. Therefore, the InfluxDB 2.0 [18,19,20] open source time series database (OSTSDB) was adopted, so as to perform corresponding analysis and handling, focusing on the timeline of insolation on the day.
2. Fault Detection System Structure
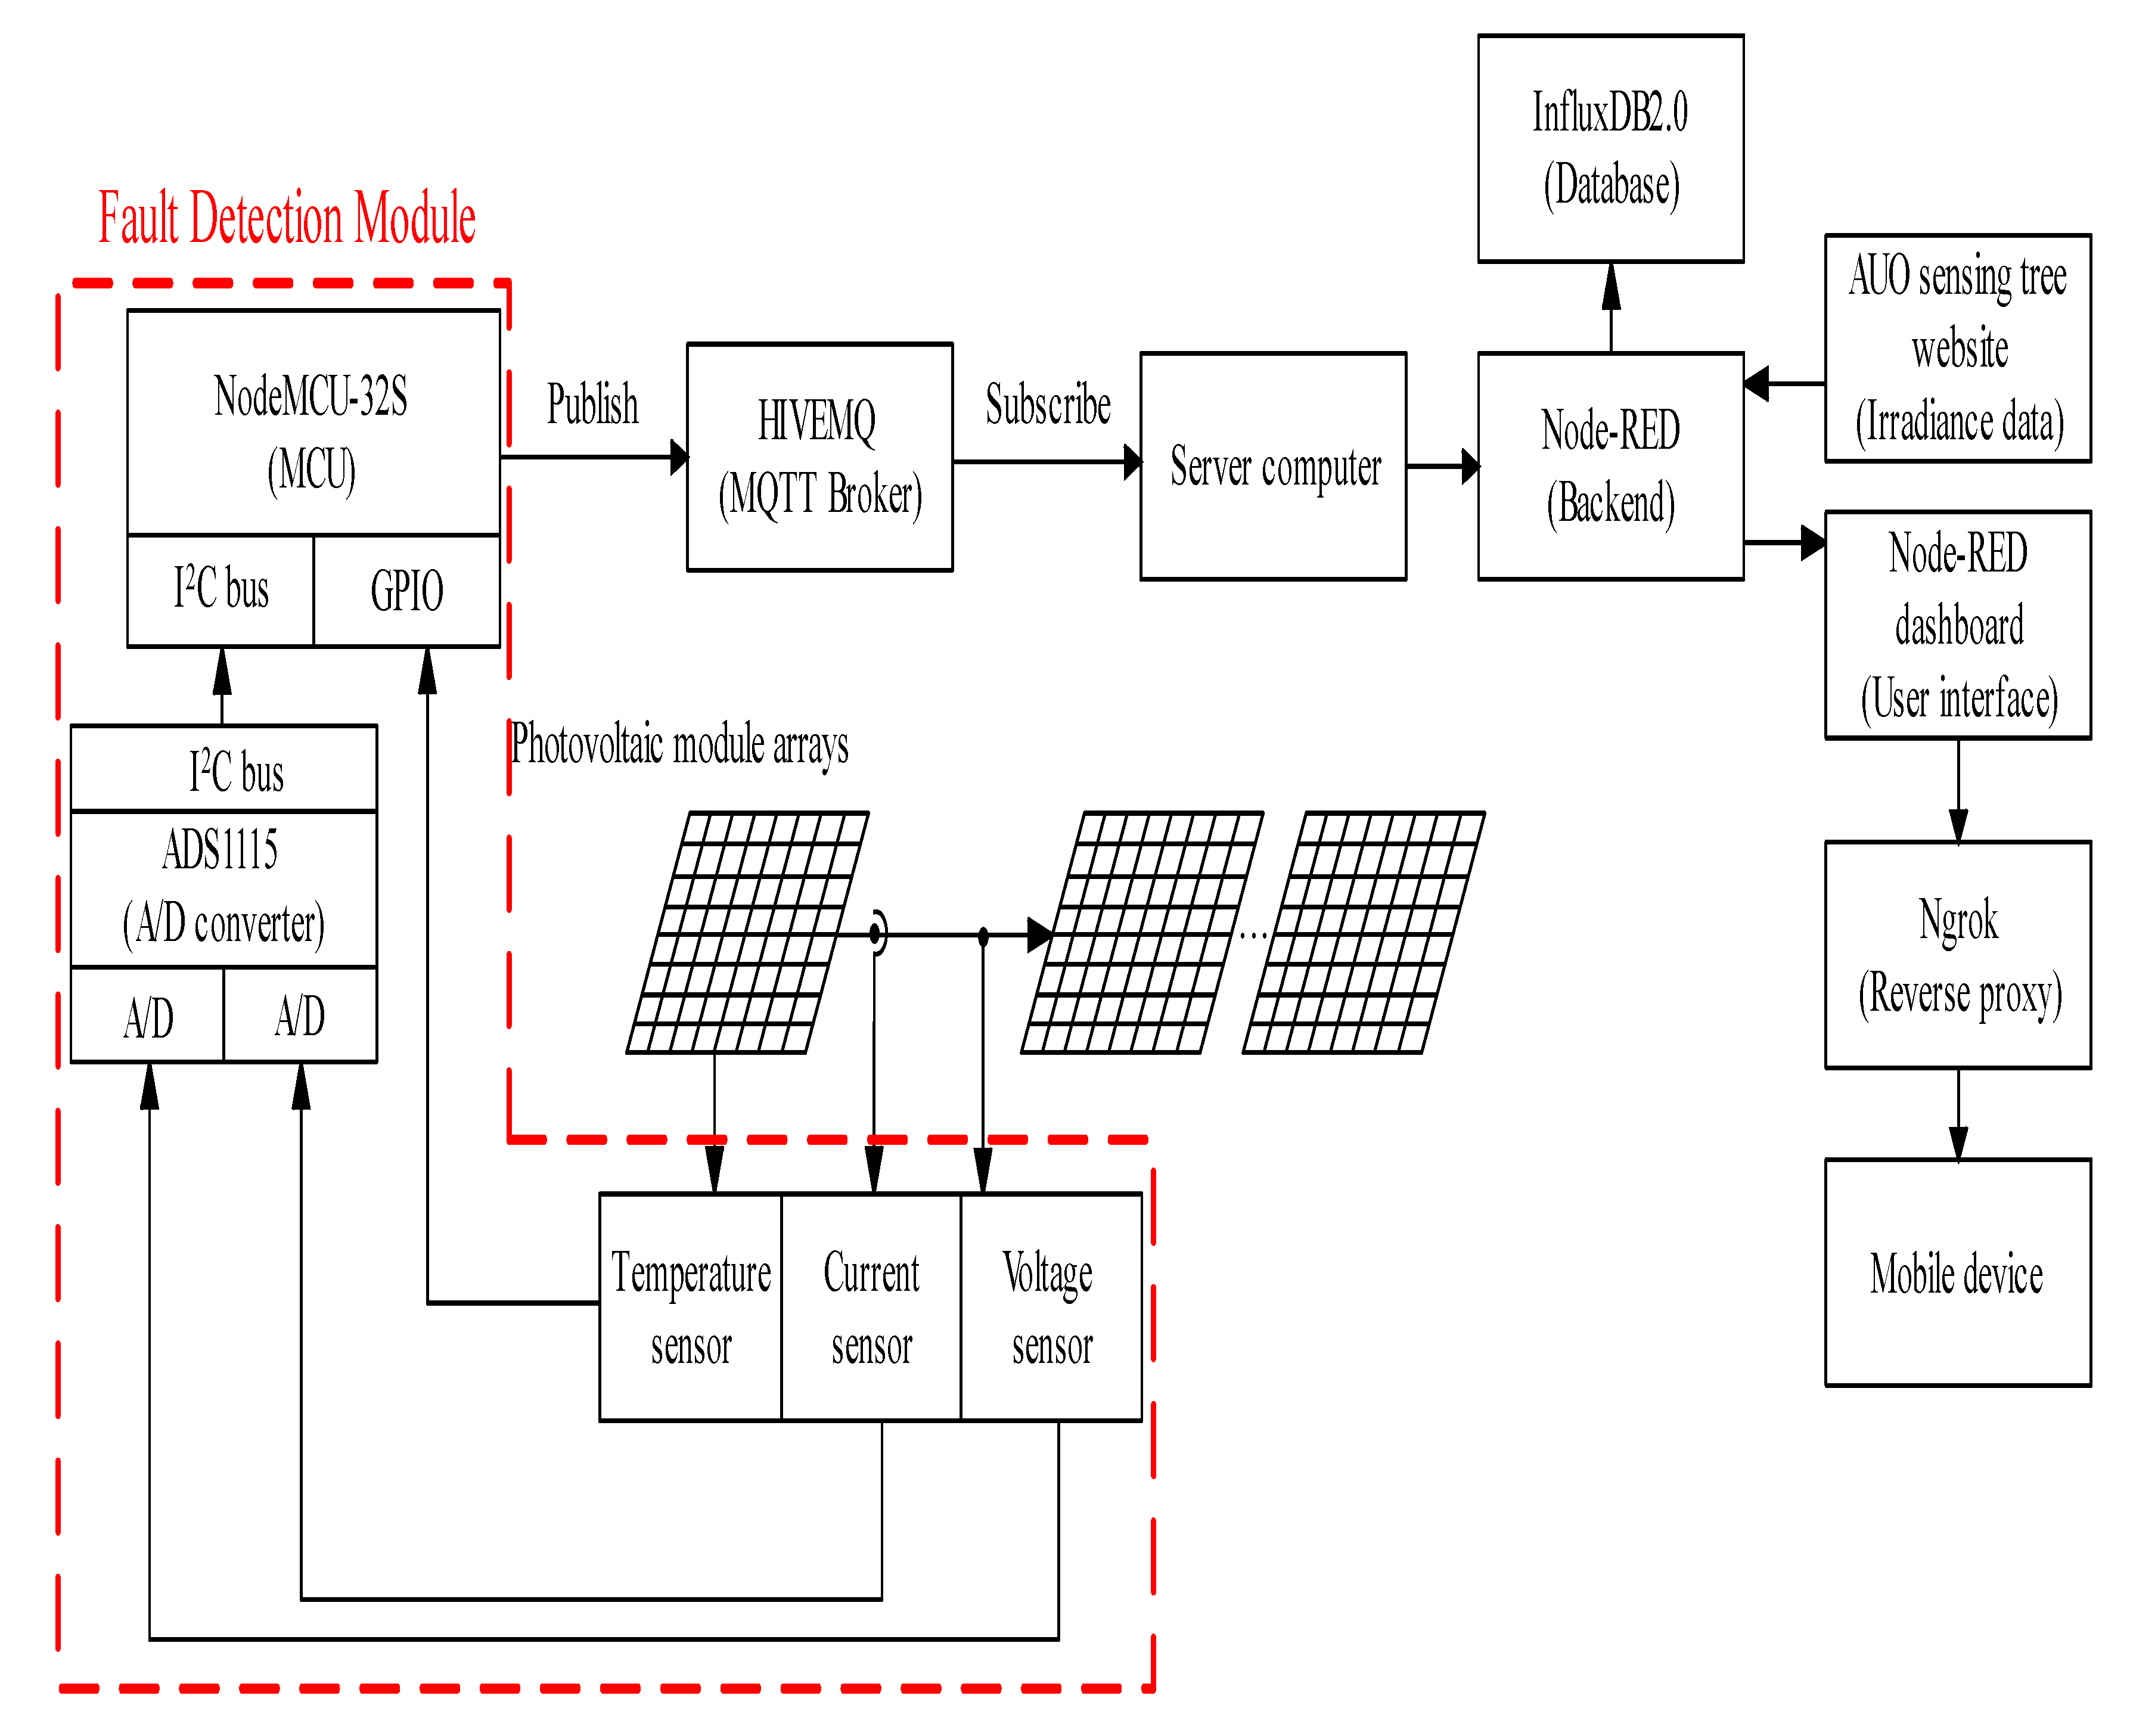
The wireless fault detection system structure of PVMS include hardware and software. For the hardware part, the experiment equipment includes four 300 W PVMS, a server computer, and four fault detection modules. Among them, the fault detection modules each include a voltage sensing circuit, a temperature sensing module, NodeMCU-32S [13,21,22] microcontroller unit, and an isolation-type DC-DC power module. Since the current flow through the serial modules is the same, the entire module arrays only require one current sensor to be installed. For the software part, a NodeMCU-32S (V1.2) microcontroller unit adopted the Visual Studio Code [23] developed by Microsoft for program writing. For the server computer, the Node-RED [14,15,16,17] visualized development tool, InfluxDB 2.0 open source time series database [18,19,20], and Ngrok reverse proxy tools (Think Vision Investments Ltd, Laucala Beach Estate, Fiji) [24,25] developed by were installed. The overall structure is as shown in Figure 1.
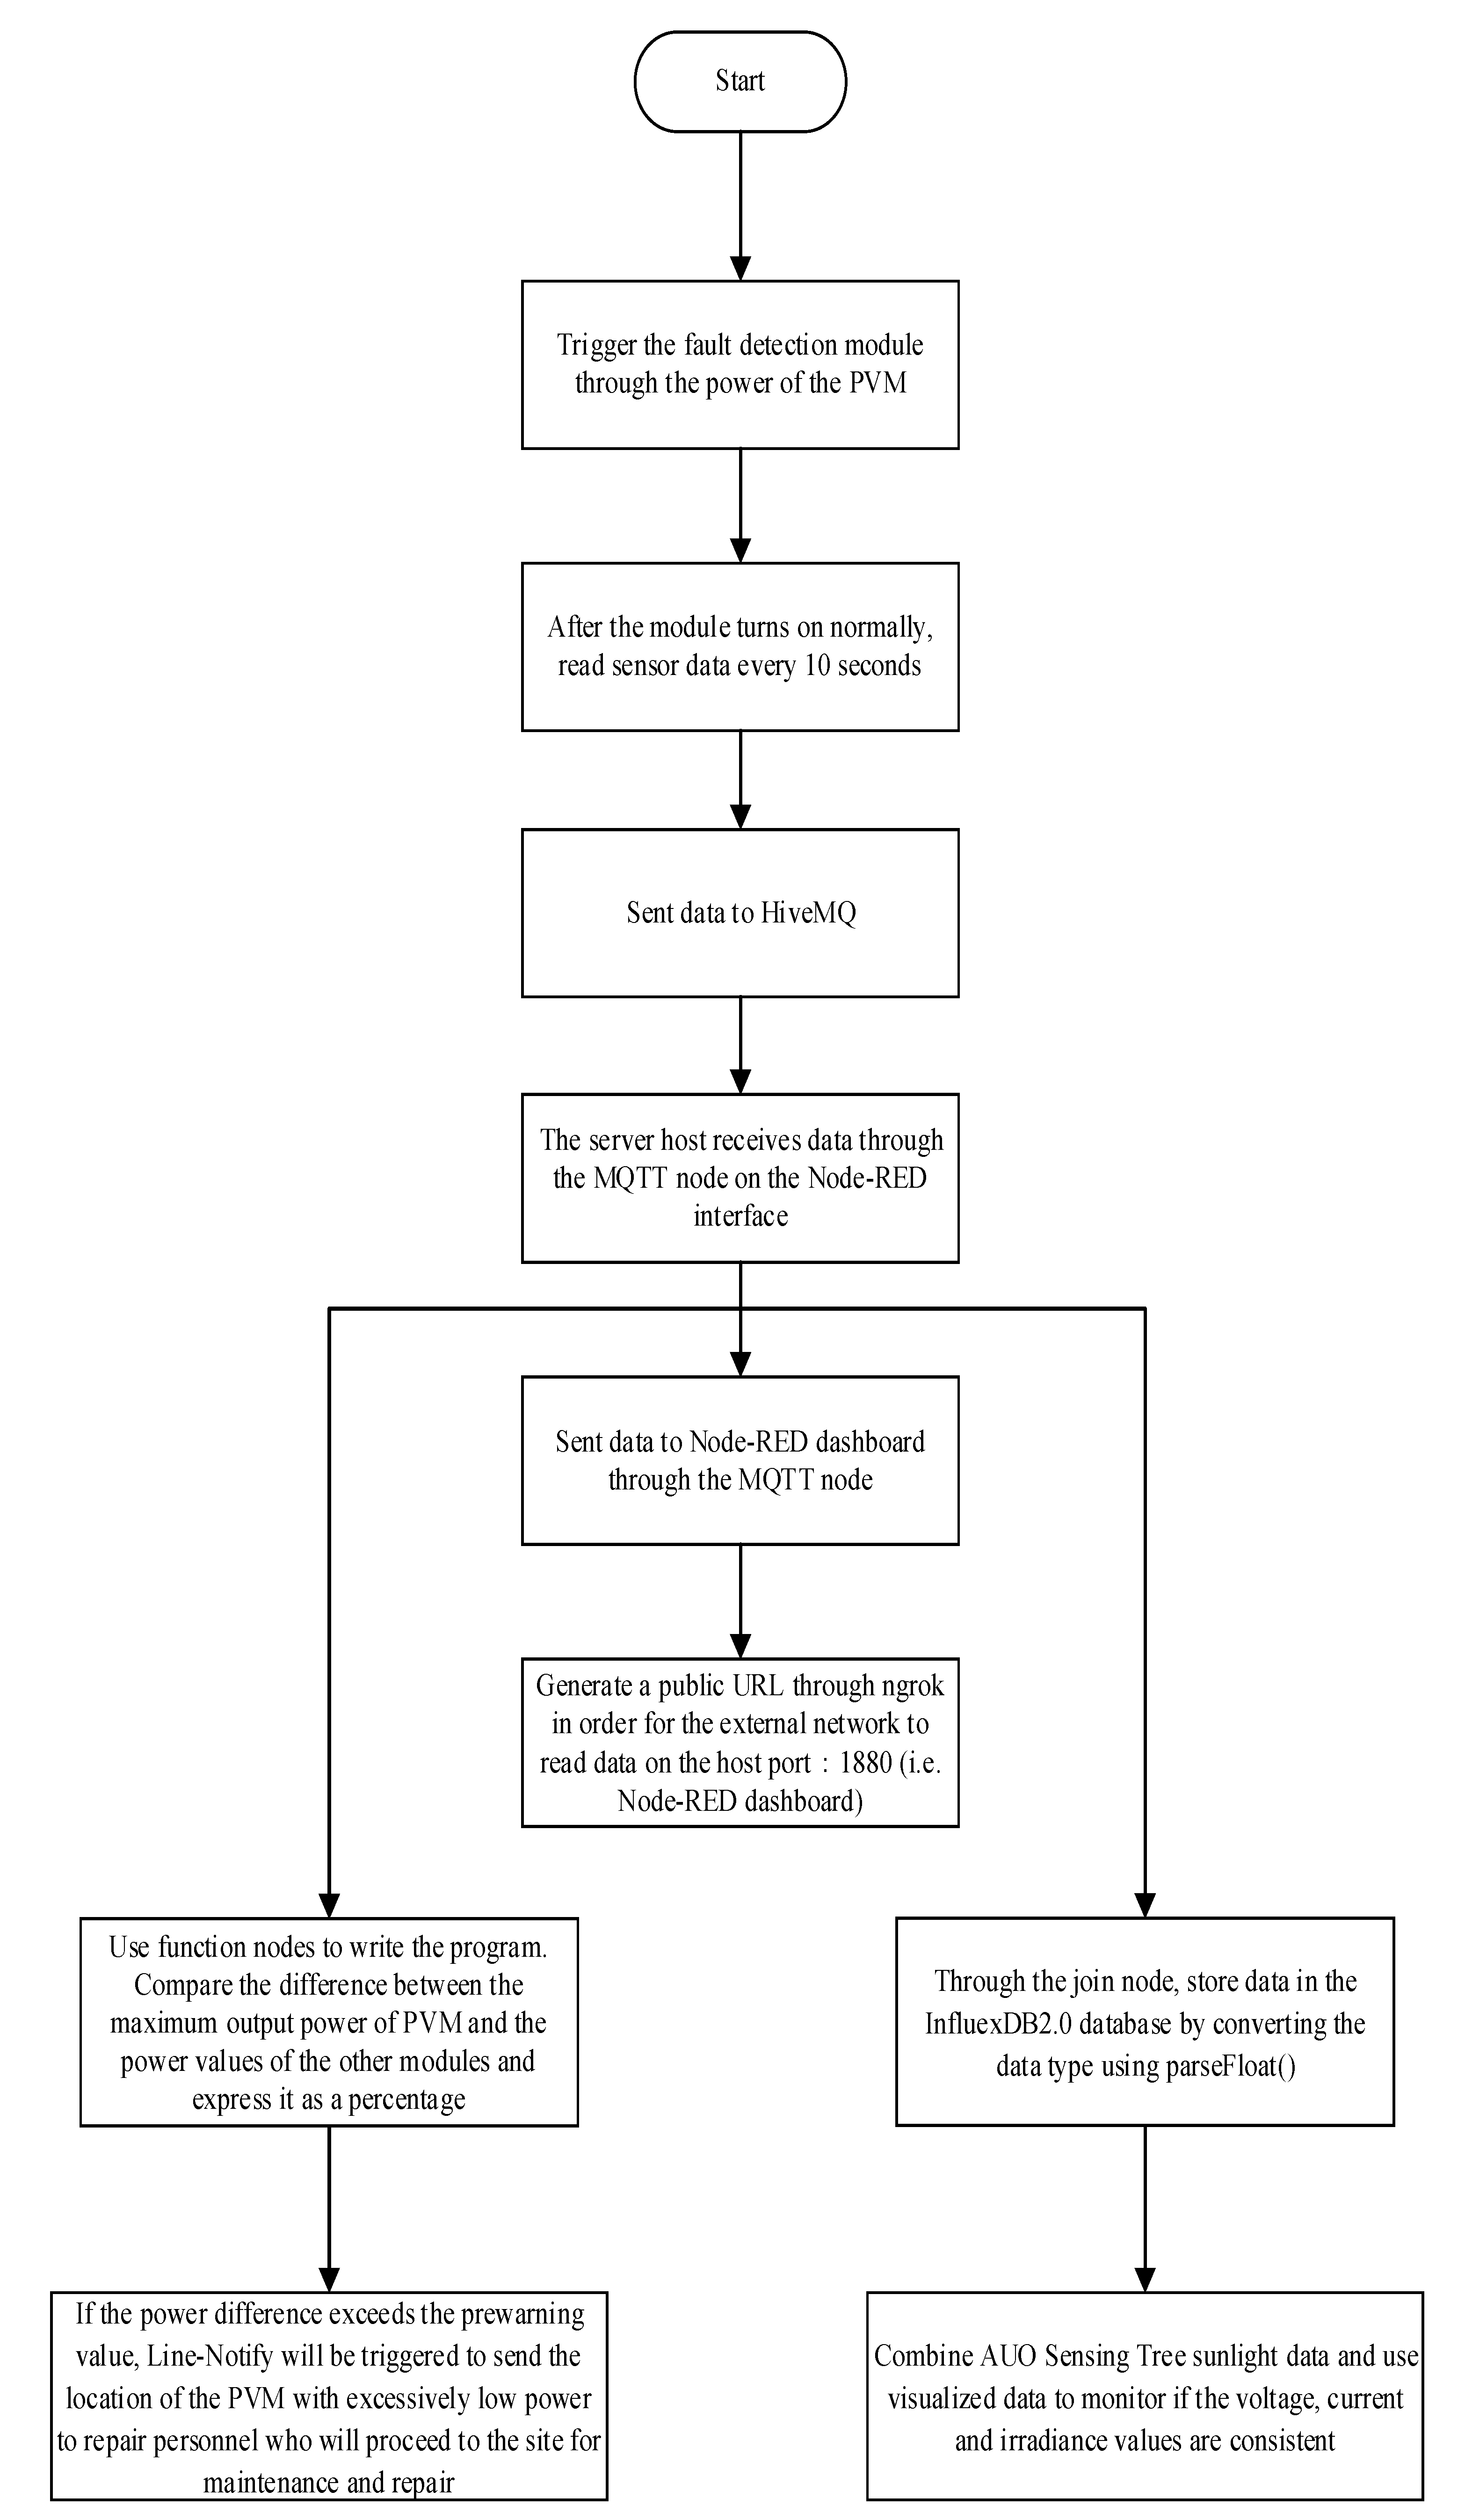
Figure 2 shows the flowchart of PVM wireless fault detection. The main processes are divided into five parts, including: (1) The PV fault detection module sends data; (2) The server host receives and processes data; (3) Data is updated every 10 s and is displayed on the Node-RED dashboard [16] webpage; (4) Data is written into the database every 10 s; (5) If determined to be a faulty PVM, immediately send a warning message of abnormality to repair personnel via Line-Notify. This system used the power sent by the PVM to trigger fault detection module work. However, if the sunlight is too low, the detection module cannot start normally. Then, the fault detection module connected to HiveMQ [6,7,8,26] (MQTT broker) via Wi-Fi and sent back test data. The server computer then automatically received data sent back through Node-RED [14,15,16,17]. In addition, the Node-RED dashboard was used to instantly inspect the voltage, currents, powers, and temperatures sent back by the respective fault detection modules. The data received by the Node-RED was written into the InfluxDB 2.0 [18,19,20] open source time series database (OSTSDB). Then, based on the powers of the PVMS calculated, the PVM with apparently lower power output was determined as a faulty module. A fault warning alert was then sent to notify repair personnel.
2.1. Hardware Circuit Design and Workflow of Fault Detection Modules
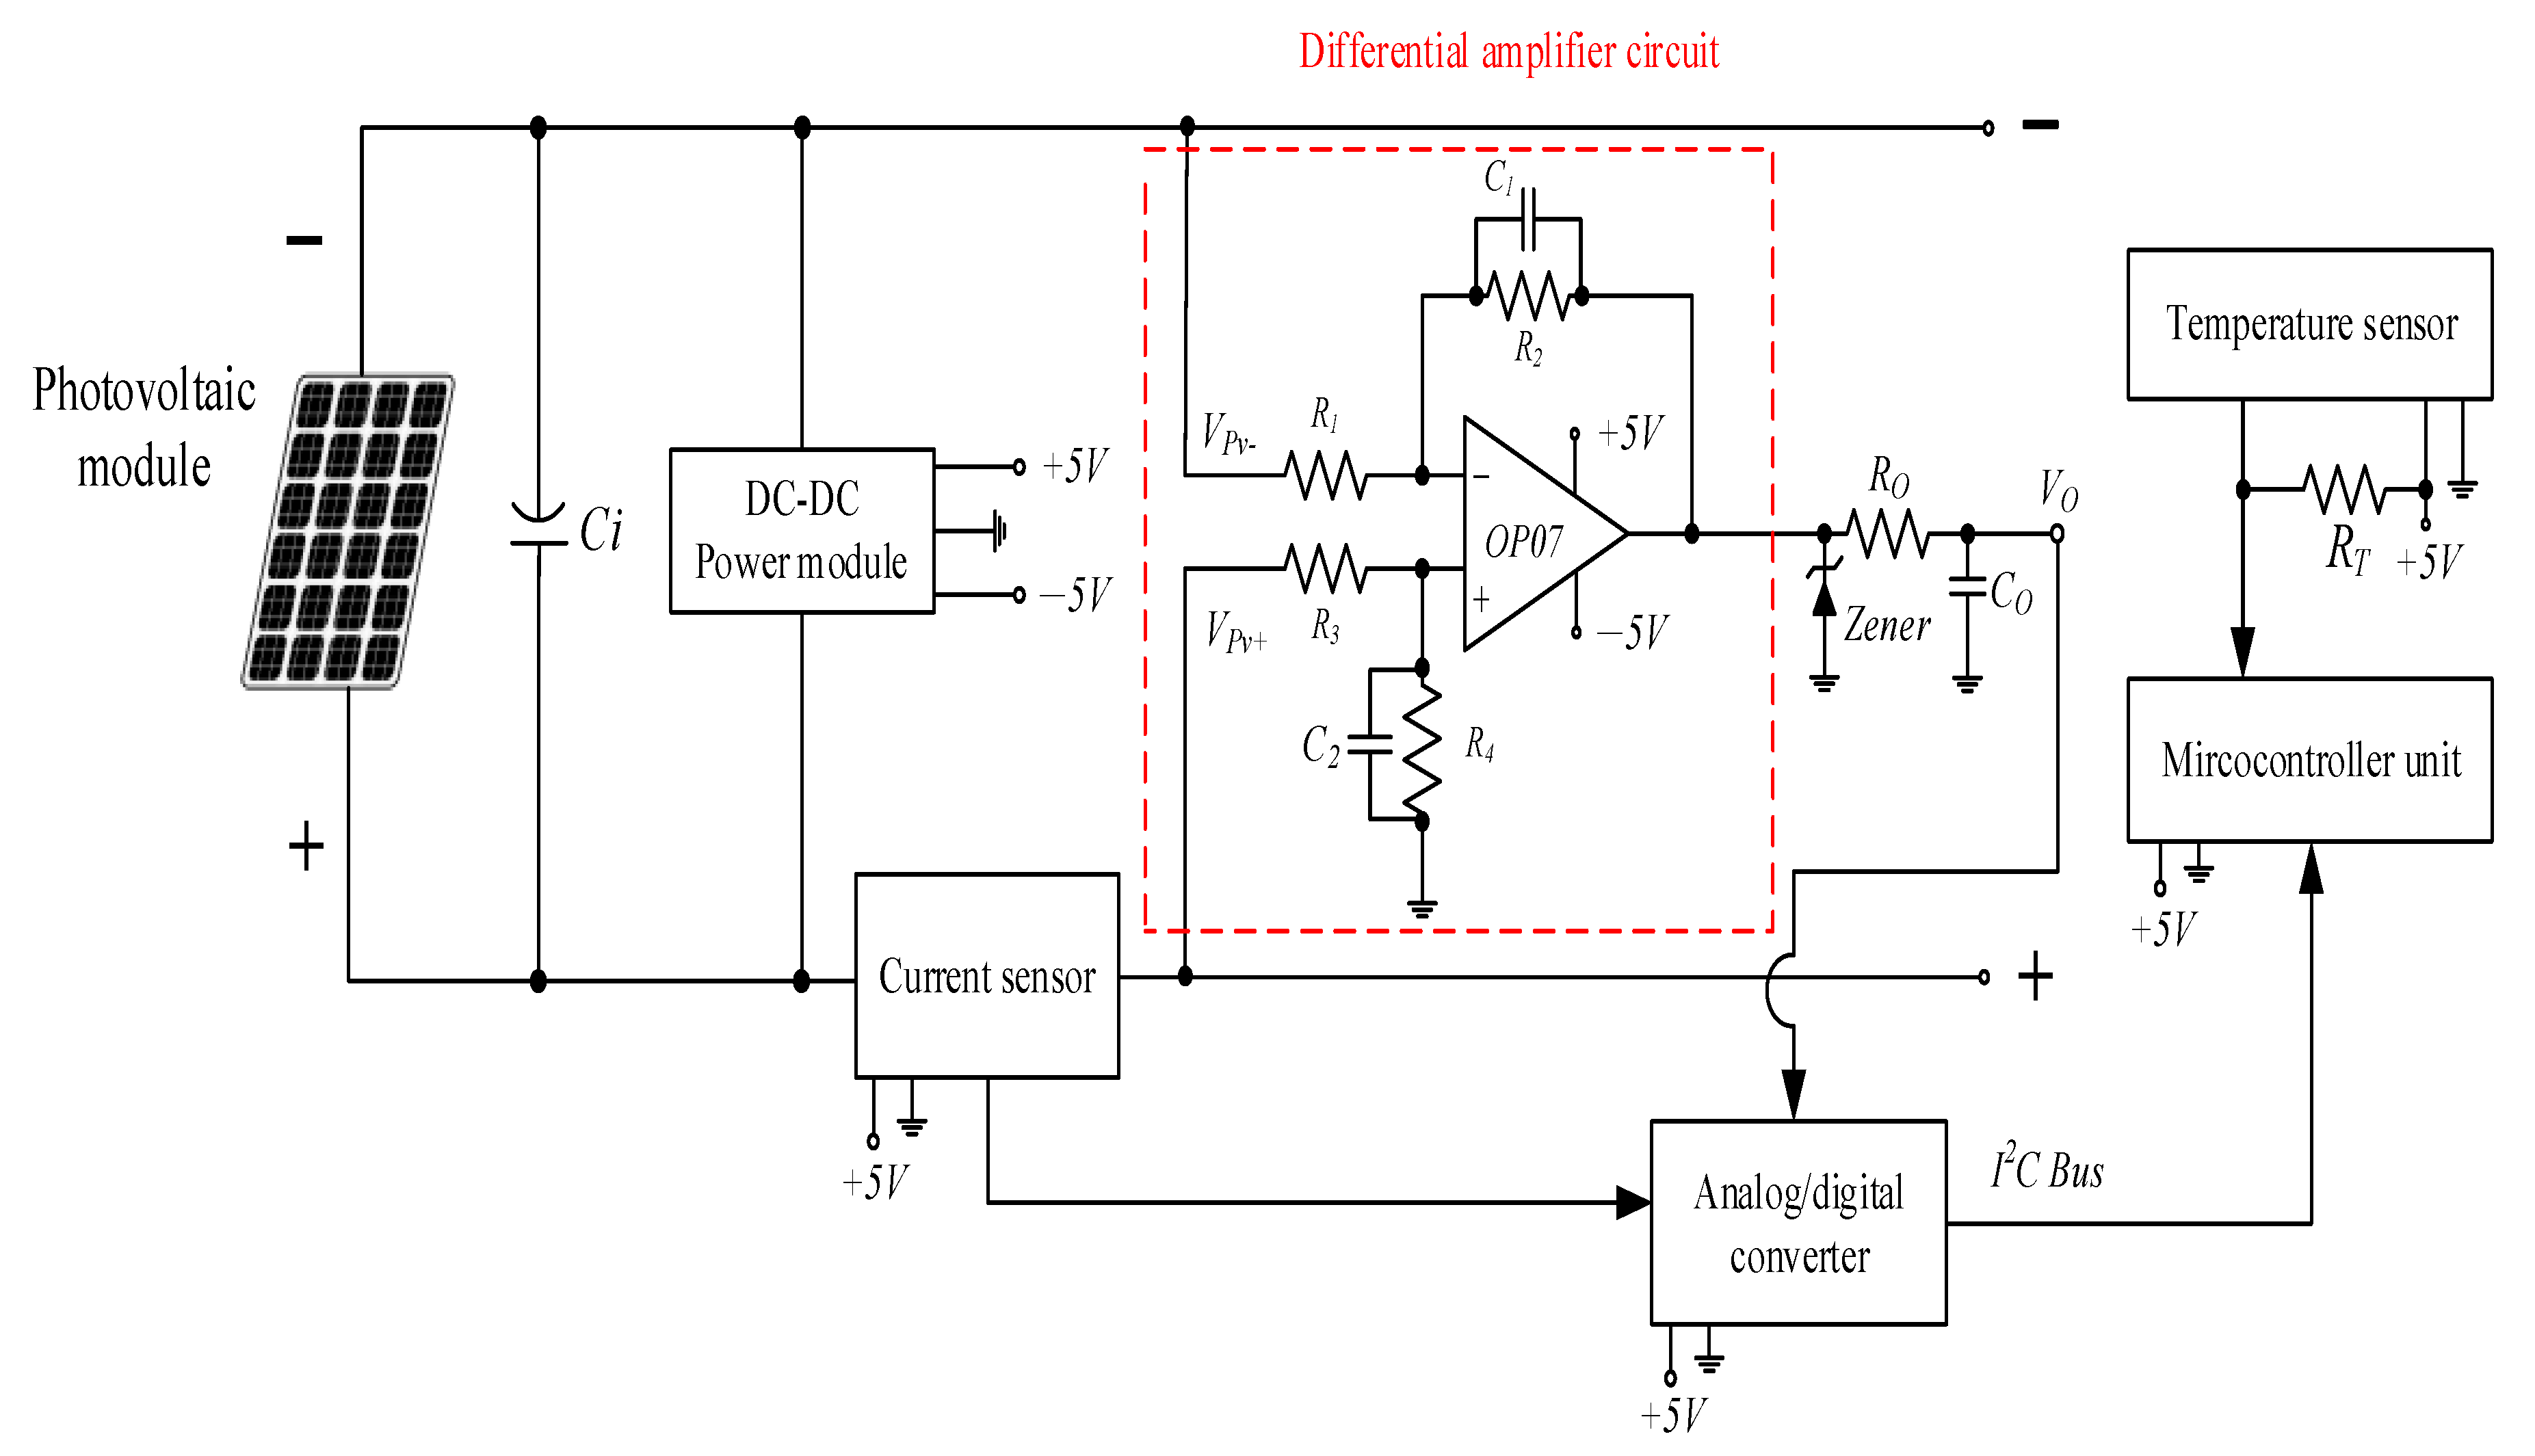
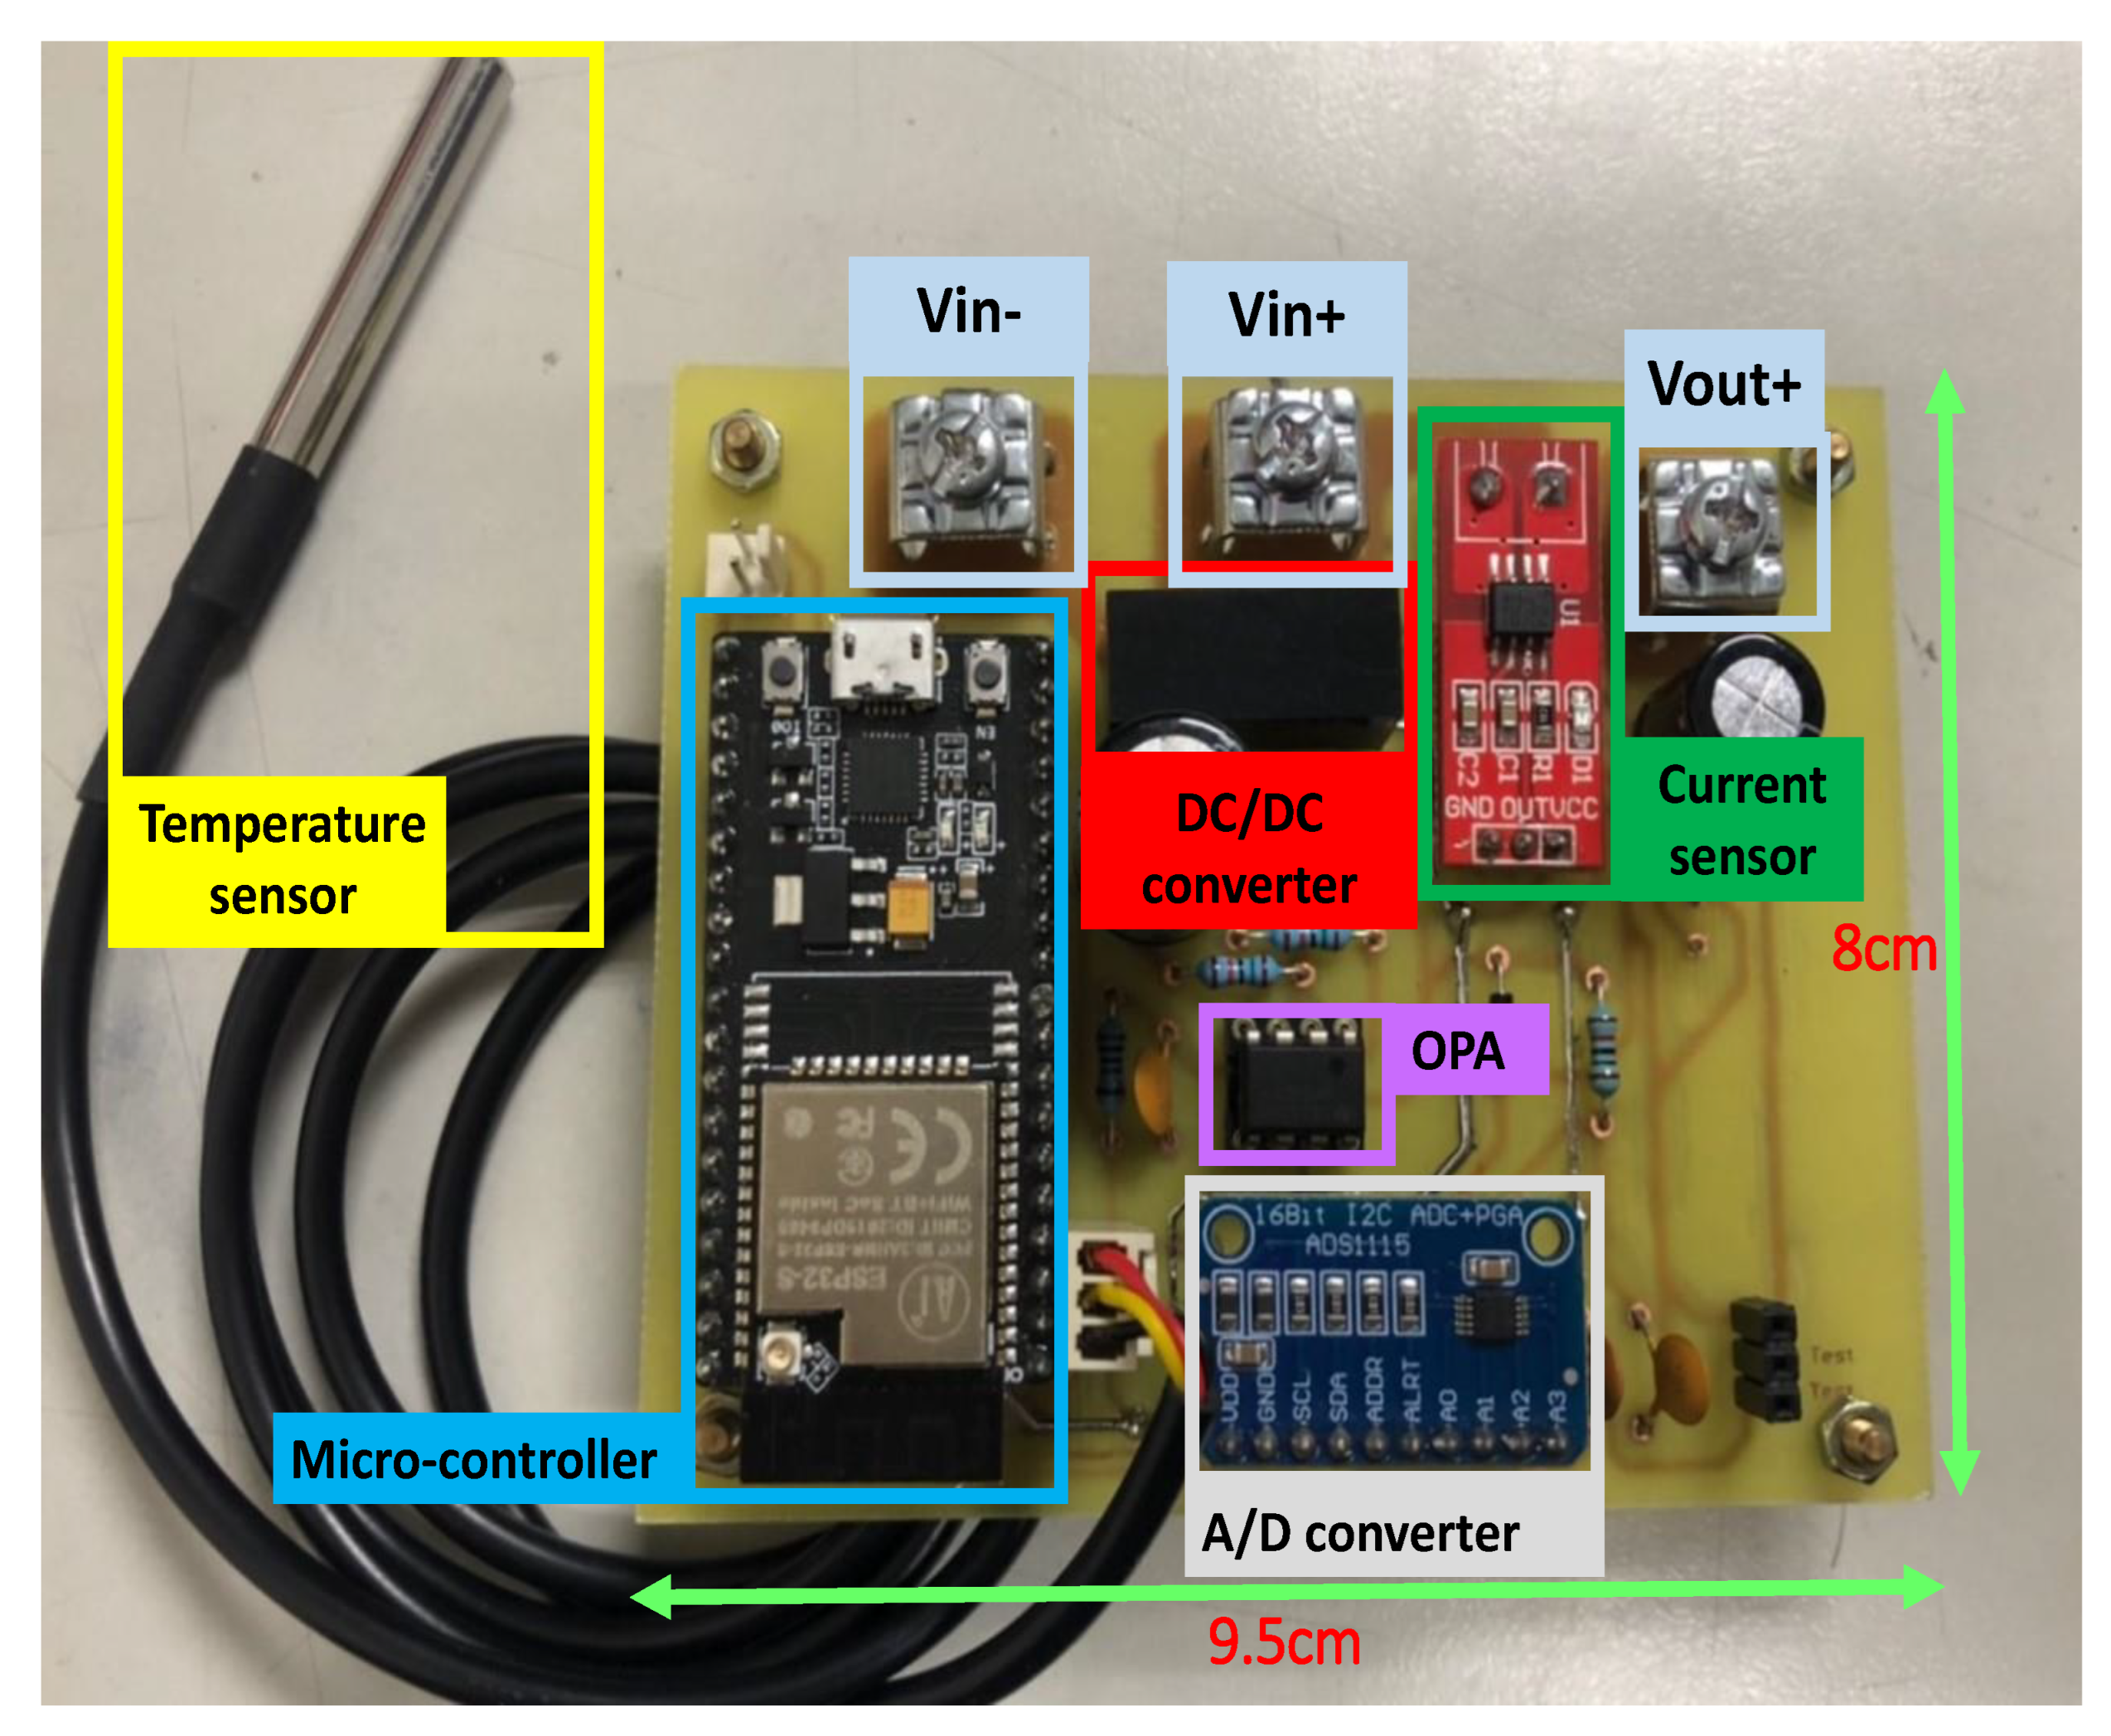
Figure 3 shows the hardware circuit structure of the fault detection module. Figure 4 shows the physical appearance of the hardware. In order to utilize unstable DC power generated from the PVM to trigger the hardware circuit, the isolation-type DC-DC power module DPBW06F-05 [27] was used in order to convert the output voltage into stable ±5 V and supply power to the operational amplifier [28], microcontroller unit [21,22], and all of the sensors. The isolation-type DC-DC power module has a wide-range input voltage of 9~36 V. This enables the PVM module to provide stable ±5 V that triggers the fault detection module under lower sunshine status. The current sensor used by the faulty module detection system was ACS712-20A [29,30]. The current sensor was able to measure the current range of ±20 amperes. The corresponding current and voltage output relationship was 100 mV/A. Since the same series of PVMS in the PVMA had the same current, the same serial module array only required one of the modules to be connected to the current sensor. As for the temperature sensor, DS18B20 [31,32] with a waterproof function was selected. The working temperature range was −55 °C to +125 °C. Since the temperature sensor output was in digital signals, the 1-wire bus transmission method [33] was adopted, which involved using a single GPIO interface from the microprocessor to receive and send data. Then, through I2C Bus (inter-integrated circuit bus), the signals were sent to the microcontroller unit, while the temperature signals were transmitted to MCU using 1-wire bus. Subsequently, the fault detection module sent data to the MQTT broker through the protocol in message queuing telemetry transport (MQTT) [6,8,26]. Additionally, since voltage signals were extracted using a voltage divider, in order to produce isolation effects and avoid the load effect, an operational amplifier was needed to form a differential amplifier whose voltage signals were lowered to a maximum voltage of 5 V to facilitate reading by the analog digital converter [19].
The open circuit voltage of the PVM used was 39.90V, and the was not to exceed 5V. If R1 = R3, R2 = R4 were selected, the output voltage VO. was inferred from Figure 3, as shown in Equation (1). After compilation and simplification, Equation (2) was obtained. Therefore, to achieve ≤ 5 V was required to meet R2/R1 ≤ 1/7.98. Therefore, the resistance values easier to obtain, including R1 = R3 = 15 kΩ and R2 = R4 = 1 kΩ, were selected. Therefore, the voltage ratio of the actual voltage and the voltage detected by the sensor was 15:1.
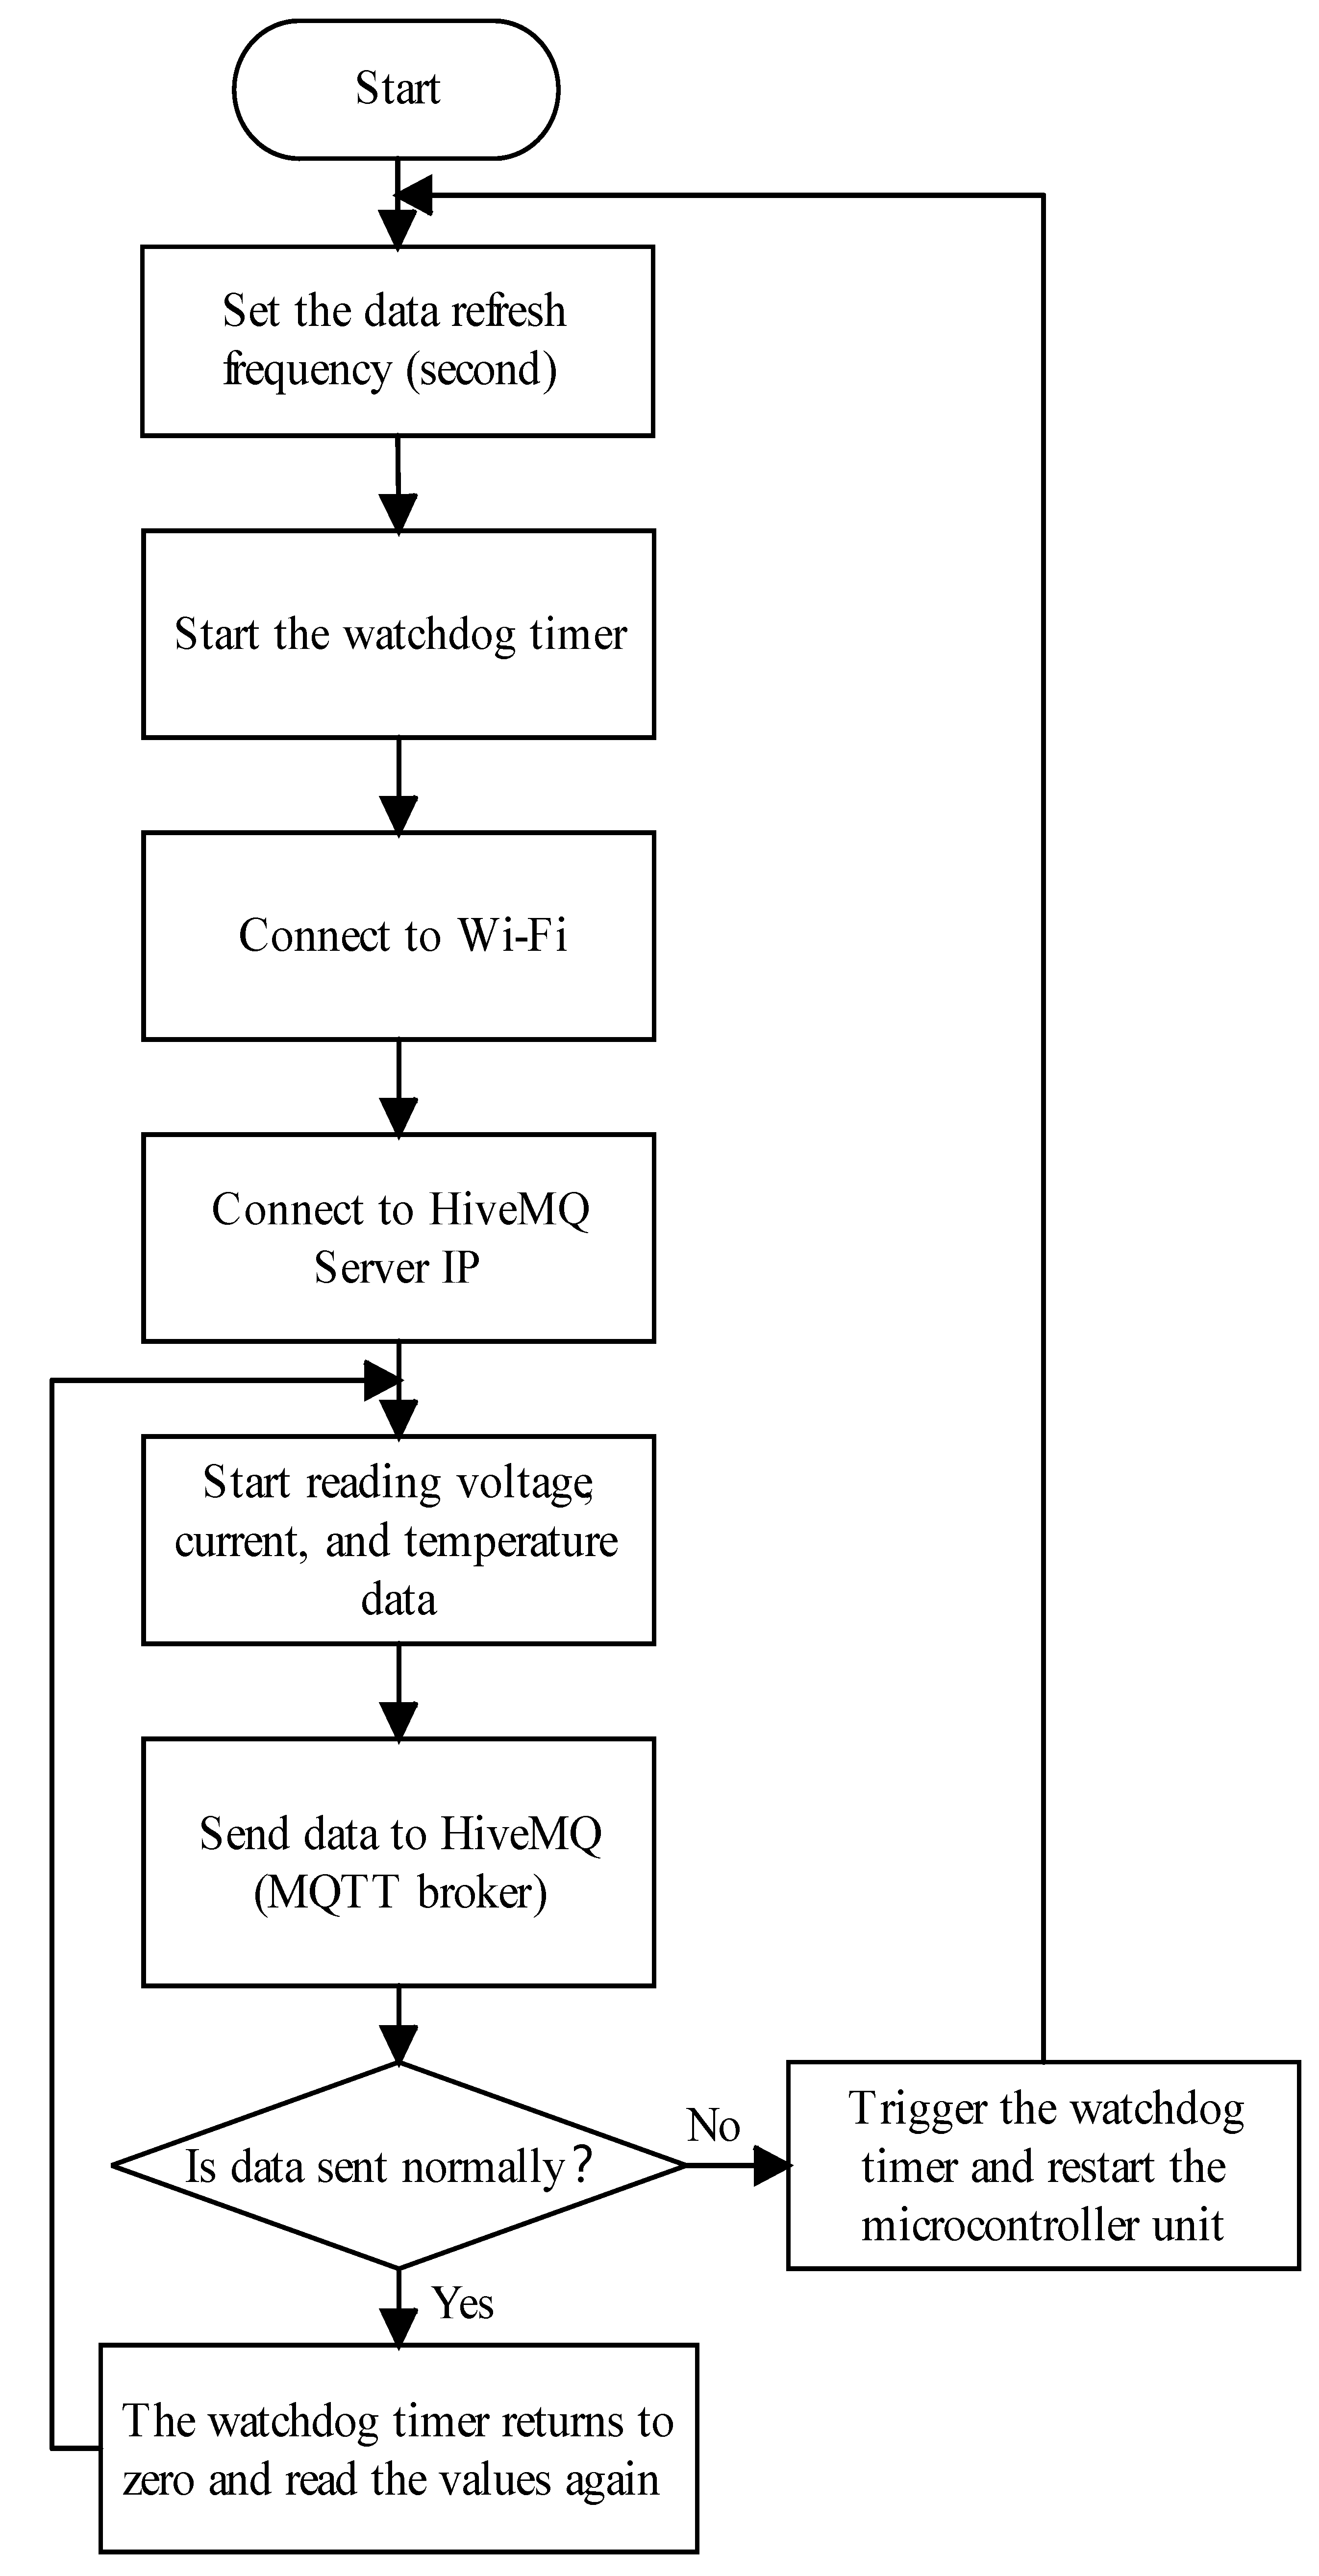
Figure 5 shows the workflow of the fault detection module. After the module was turned on normally, the data reading frequency was first set. Different second, minute, and hour intervals were set as needed. In this paper, the sampling interval was set as 10 s. The watchdog timer program was then launched. If the output voltage of the PVM was too low, the microcontroller unit [13,21,22] would start undervoltage protection to ensure that the Wi-Fi on the microcontroller unit could not operate normally. This caused the fault detection module to fail to transmit data normally. The watchdog timer program, on the other hand, repeatedly tested if the voltage of the PVM was within the normal range. If the program execution time exceeded the time limit set in the watchdog timer, it would jump outside the program execution loop and automatically re-start. When all of the voltages, currents, and temperatures of the PVMS were within the normal range, the microcontroller unit returned the watchdog timer to zero. Then, based on the sampling interval set, the voltage, current, and temperature values continued to be sampled. The microcontroller unit is then connected to the preset Wi-Fi and connected to the MQTT proxy URL [26] of HiveMQ. With the reading frequency set, various data underwent testing, and data was sent to HiveMQ. Furthermore, in order to avoid loss or repetition of data packets causing data chaos, the data quality of service, QoS, was set as level 2 (exactly once) [33] in order to ensure the same data entry was received only once. Every time data sending was complete, the watchdog timer reset the counter to read the next data.
The fault detection module developed must be installed on each PVM. Therefore, cost control is a considerably important consideration factor for actual applications in the future. The total price of hardware equipment required by the fault detection module is compiled in Table 1. As for the development environment for software such as Visual Studio Code [23], Node-RED [14,15,16,17], InfluxDB 2.0 [18,19,20], HiveMQ, Ngrok, and cloud servers and tools, they are open sources or free to use. Therefore, they were not included in the costs. Table 1 shows that the cost of developing the fault detection module was about US$21.73, accounting for about 10% of a single PVM used in the test. The prices in Table 1 are based on information provided on the world.taobao.com website, with the currency unit converted into US dollars.
2.2. Data Transmission
In order to ensure the wireless transmission of sensing data on-site, the message queuing telemetry transport (MQTT) [6,8,26] was selected. It is a type of TCP/IP protocol and targets machine to machine (M2M) light protocols. It requires a low network broadband to transmit data without additional hardware development module costs. Hence, it is suitable for environments with low network requirements and low power consumption. Message queuing telemetry transport (MQTT) is a protocol among the broker/publisher/subscriber. The broker refers to the relay server of message queuing telemetry transport (F) responsible for sending topics released by the publisher to users that subscribe to the topics. The publisher is the message sender. Data containing the topic is released to the broker. On the other hand, the subscriber is the message receiver who subscribes to topic data required from the broker. A topic in message queuing telemetry transport (MQTT) is a UTF-8 coding string. “/” is used to layer each topic name. This name is the identified name of data sent.
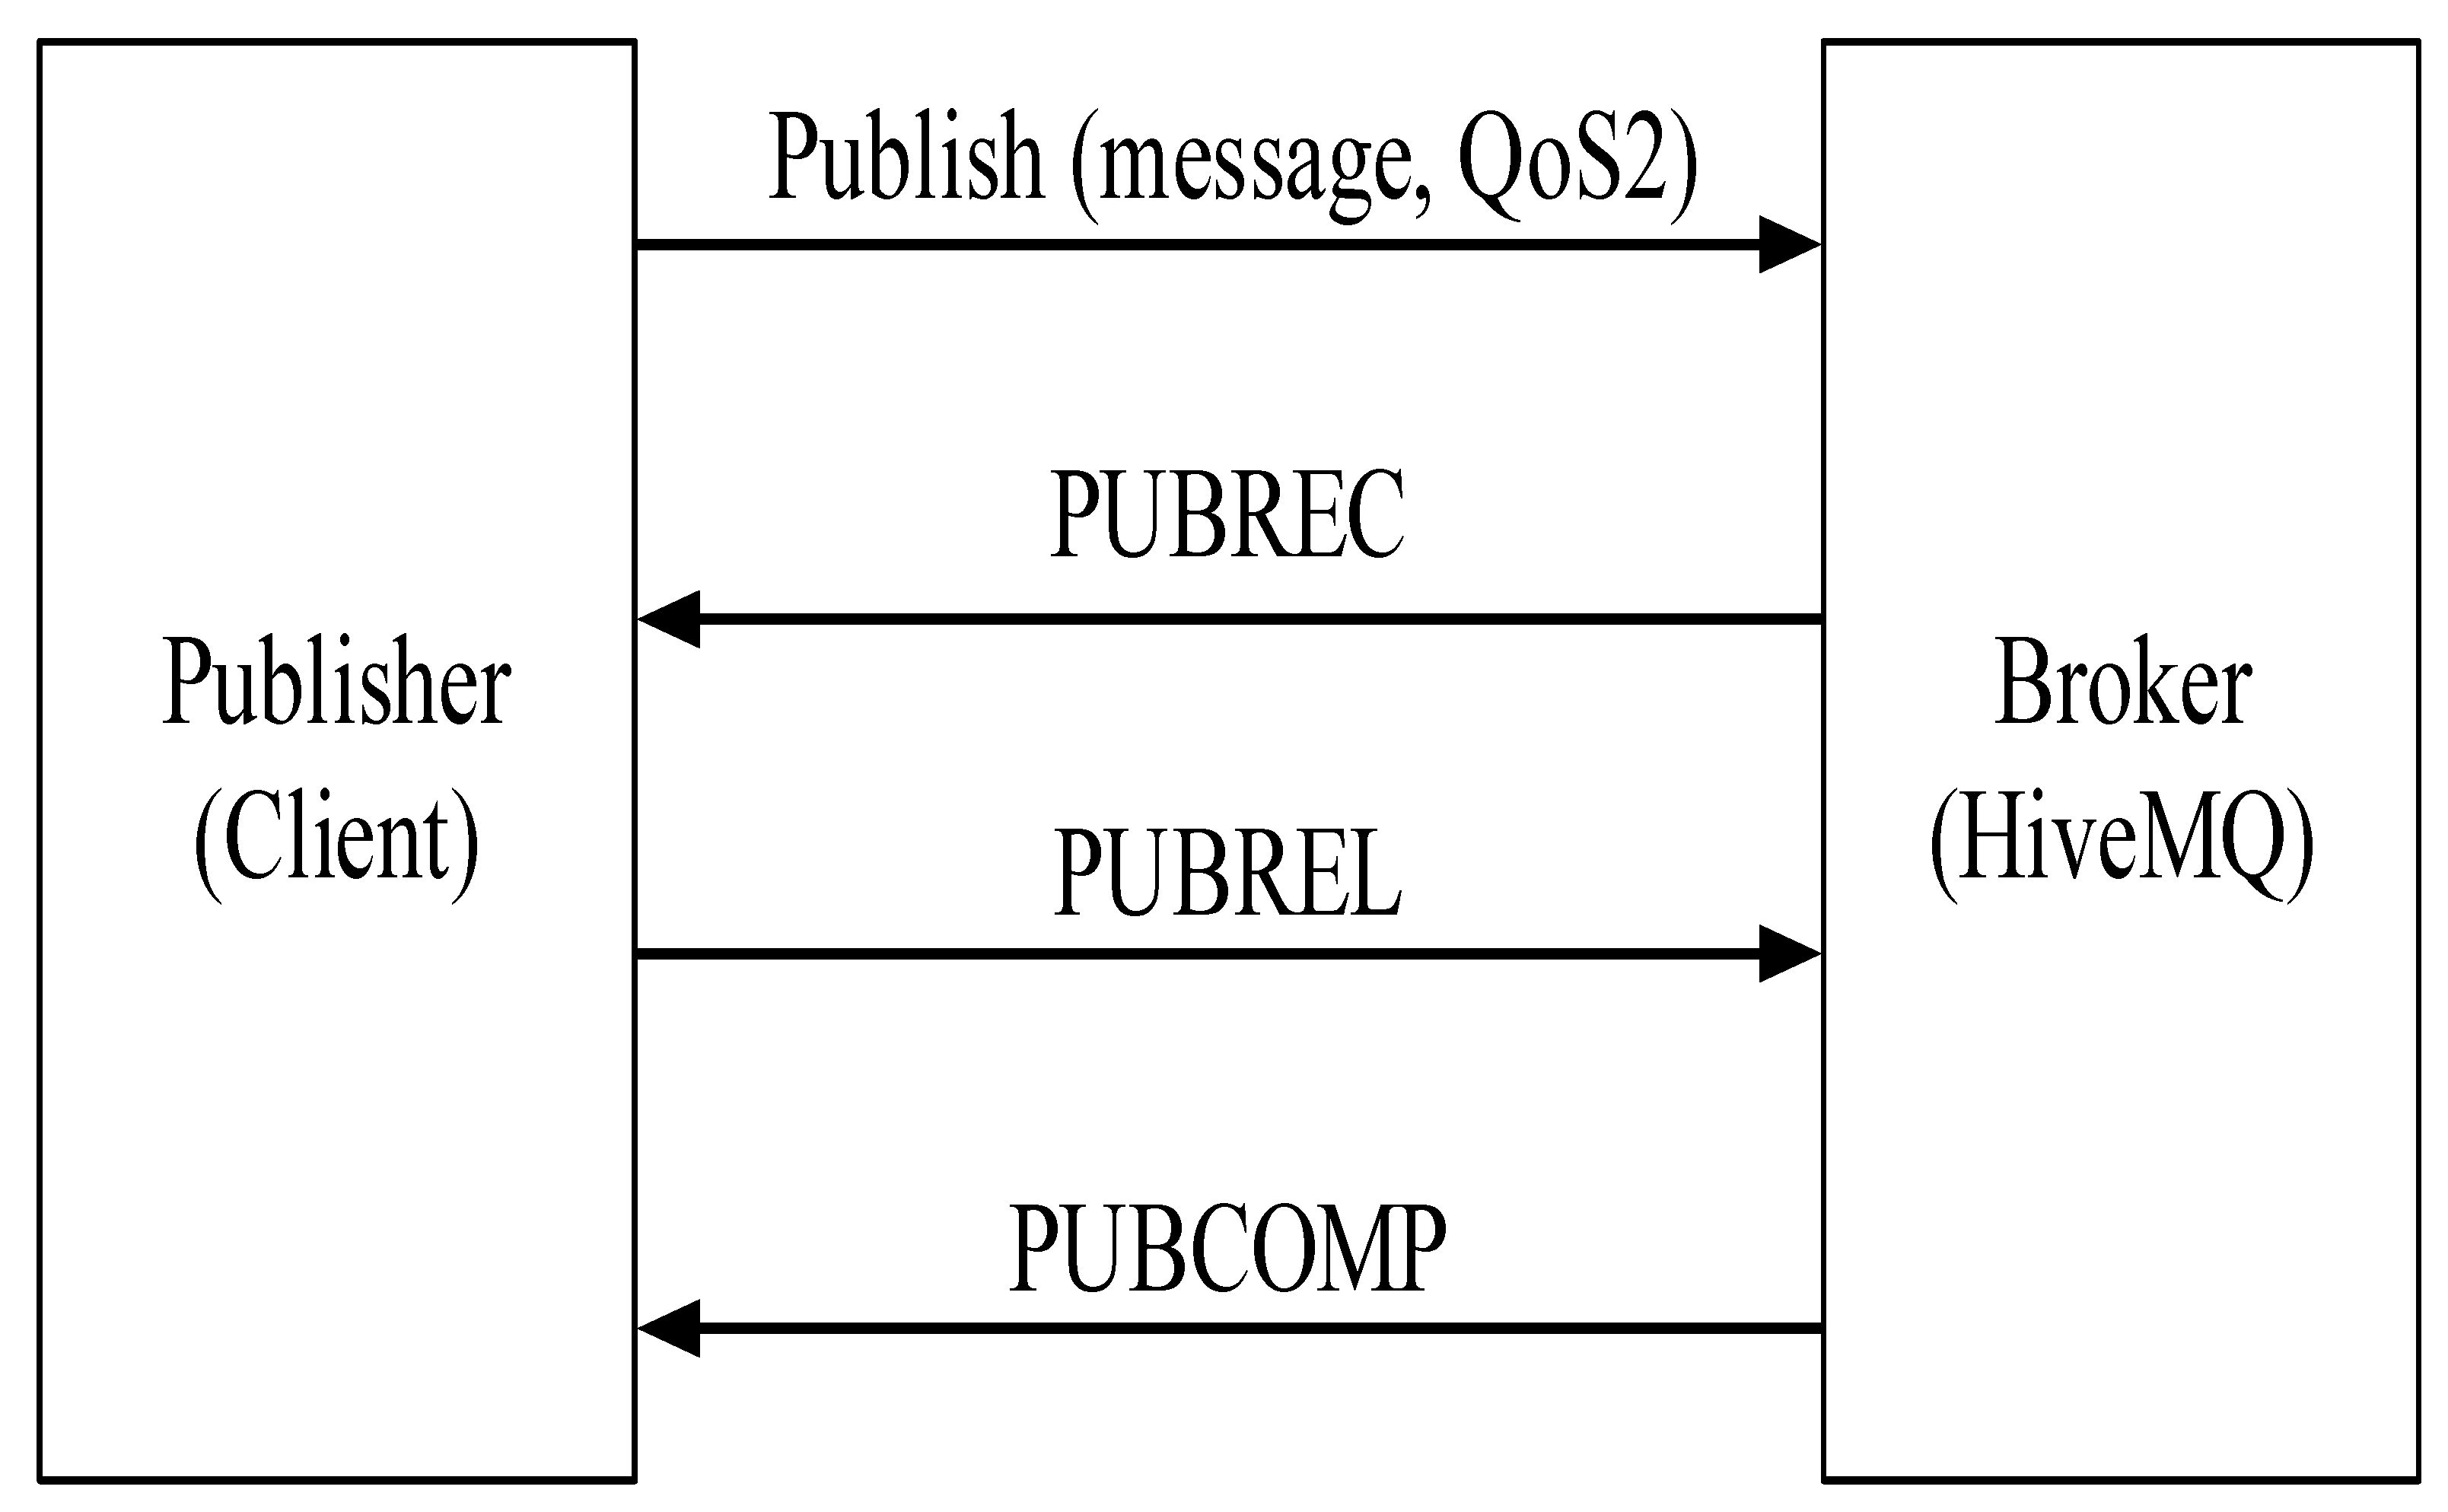
The message queuing telemetry transport (MQTT) has an important function: quality of service (QoS). It represents the quality of message information at the sending end and the receiving end. It is divided into levels 0~2. In this paper, level 2 was adopted, which represented receiving the data exactly once. That is, single data can only be sent once between the publisher and the subscriber. Data cannot disappear or be repeatedly sent. The transmission process is as shown in Figure 6. The publisher adopted QoS level 2 to release messages (i.e., fault detection module data). In other words, messages released were first stored until the broker replied to the PUBREC message. Once the publisher received a PUBREC message, the previously released messages were safely deleted, which confirmed the receiver successfully received the message. The publisher then kept the PUBREC message, replied to a PUBREL message to the receiver, and waited for the receiver to reply to the PUBCOMP message. When the PUBCOMP message was received, the publisher cleared the previous retention stage. The message transmission method is as shown in Figure 6.
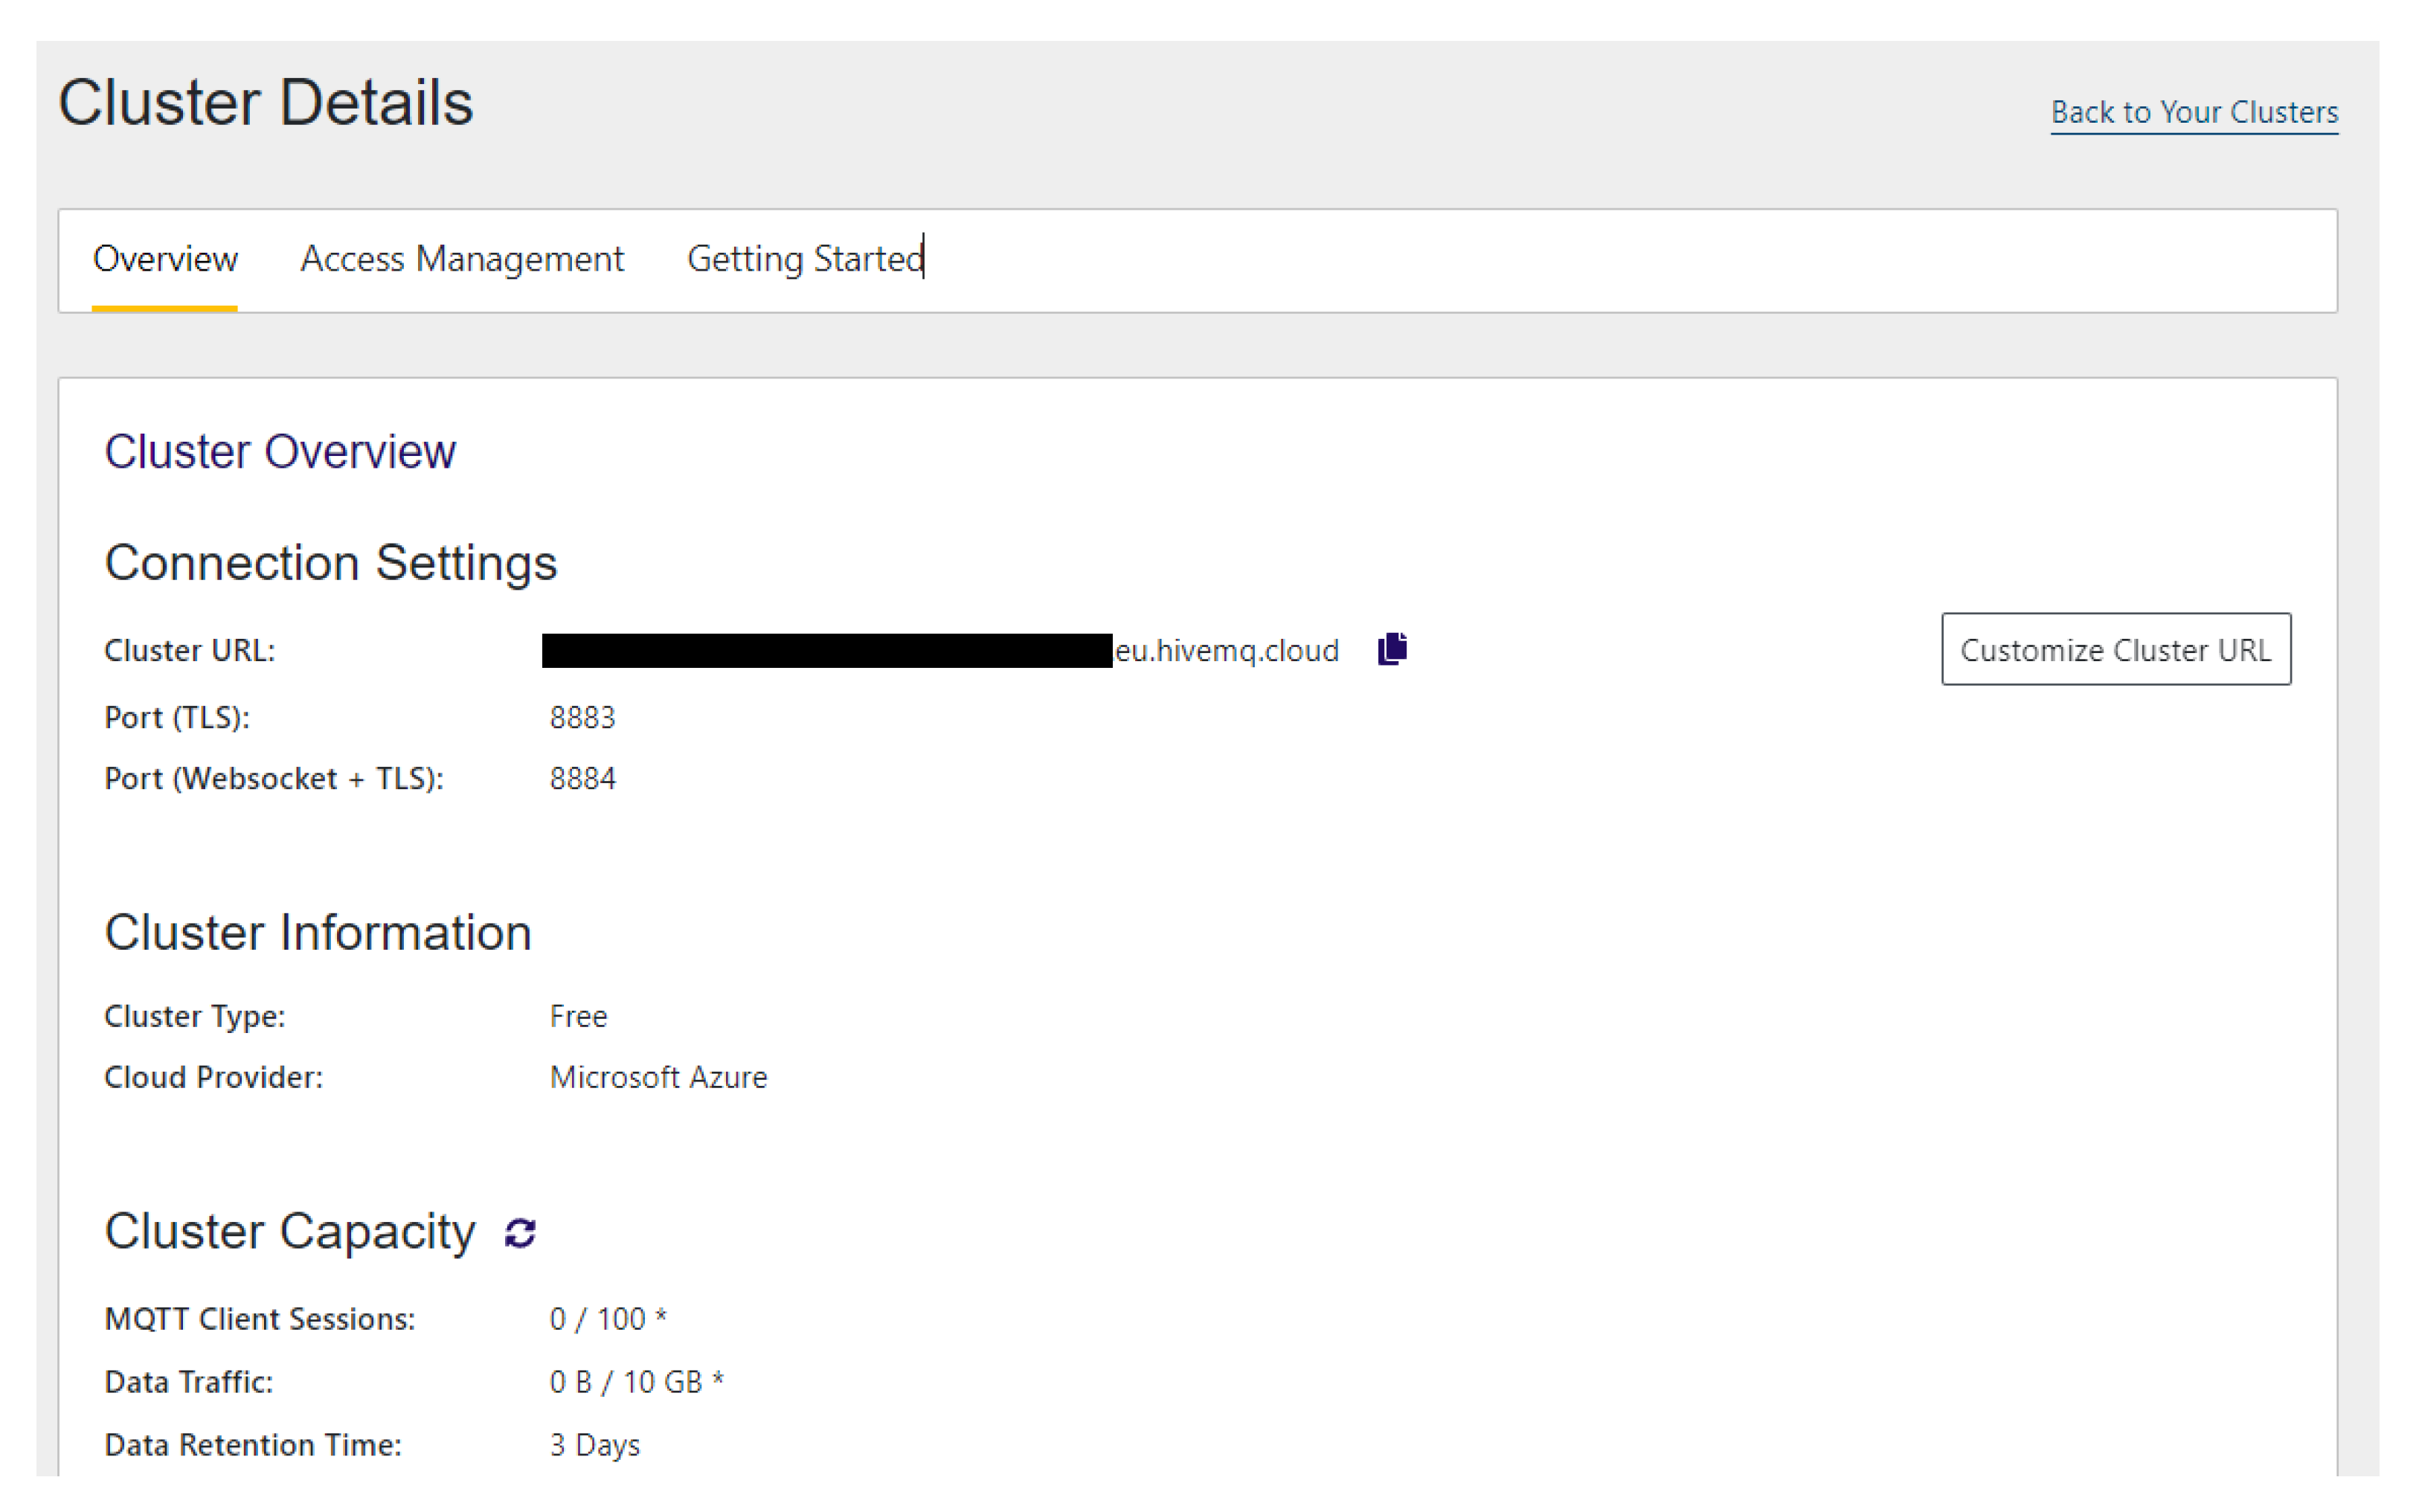
As for the message broker, the enterprise-level HiveMQ [26] was selected. The account functions in the free package include: (1) Create up to two clusters. The frame of the cluster management created by each HiveMQ cloud is as shown in Figure 7; (2) Single clusters can connect to up to 100 devices; (3) 10GB transmission every month; (4) Data retention for 3 days. In terms of data security, the port is 8883, which supports transport layer security (TLS). The account and password for this cluster can also be set.
2.3. Software Development
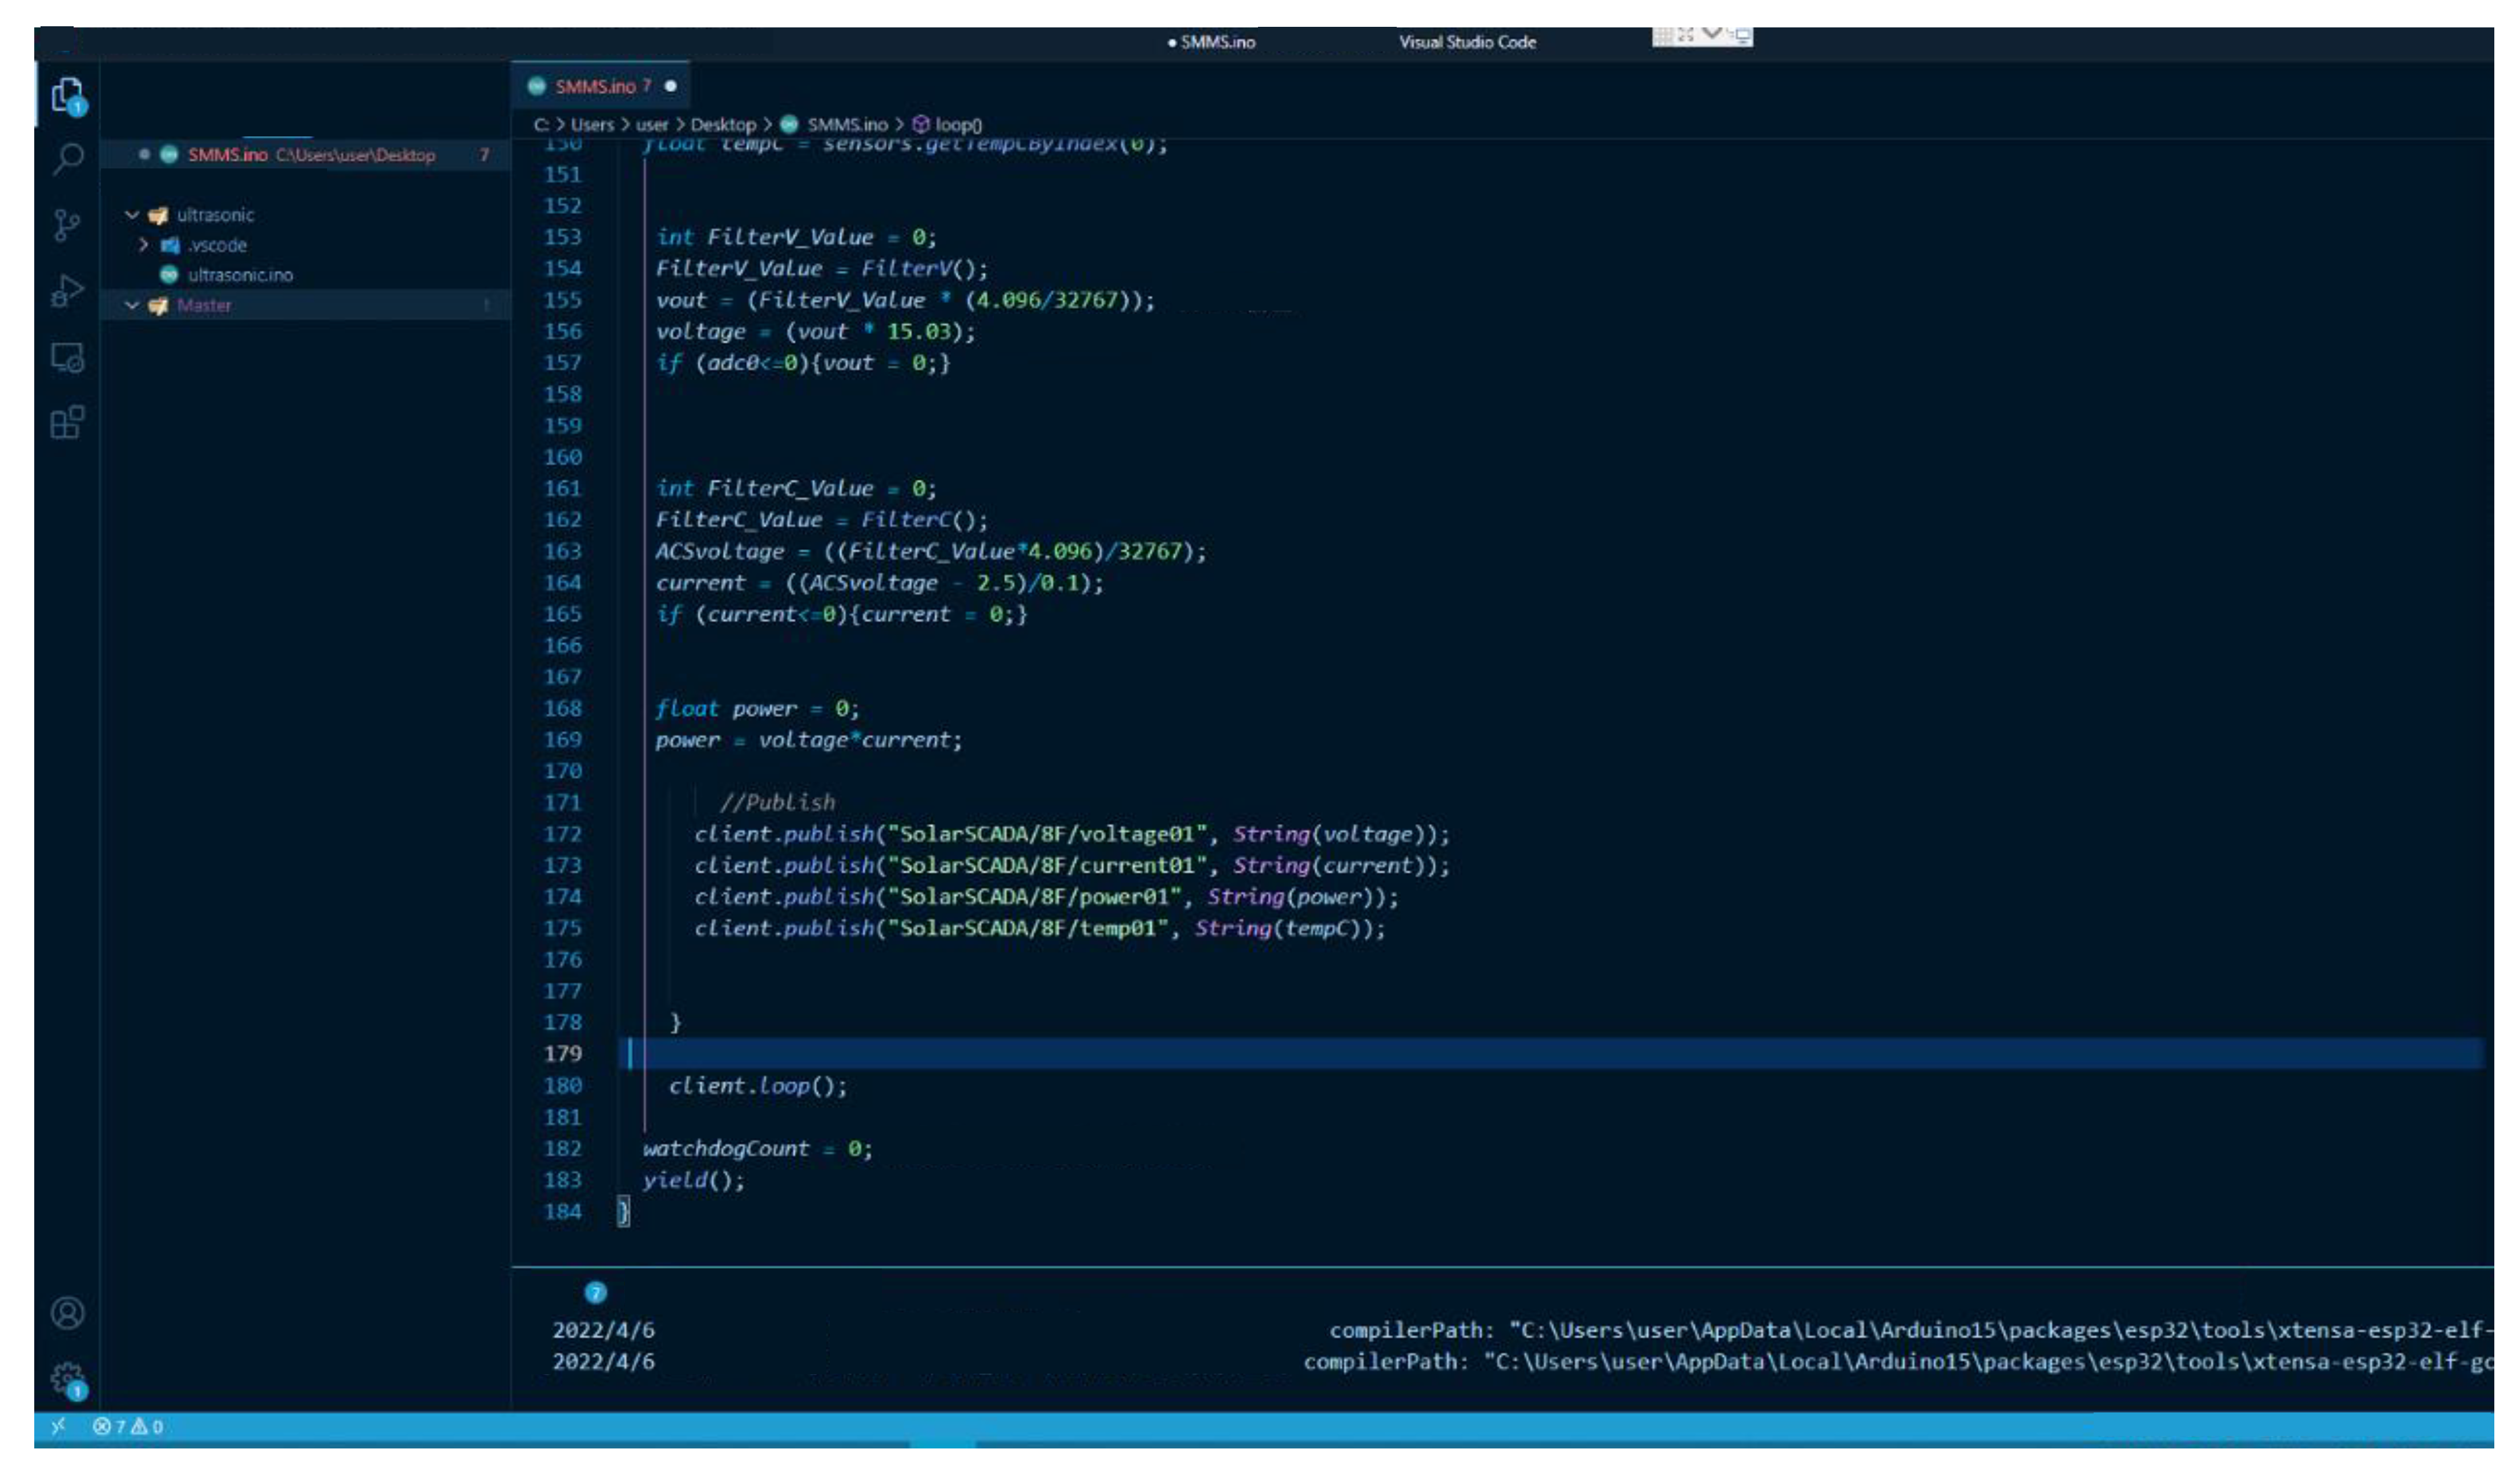
Software development is divided into two parts. The first is the sensing and data transmission program on NodeMCU-32S [21,22]. The free source code editor Visual Studio Code [23] developed by Microsoft is the development environment (Figure 8). The program contents generally consist of four parts, including: (1) Connect Wi-Fi and HiveMQ; (2) A filter program for converting analog to digital (A/D); (3) Read voltage, current, and temperature data; (4) Send sensor data. When connecting HiveMQ, the required parameter inputs include: MQTT broker server IP [26], user account and password, and client name and port on the identified device. As for the ADS1115 analog/digital converter, the resolution is 15 bit. Through the program setting, the voltage gain can be read. In this paper, it was set as GAIN_ONE. However, since the upper voltage limit was 4.096 V, the least significant bit (LSB) was 0.000125V. In order to enhance the accuracy of reading values, the median average filter method was applied to the value filter. Using this method, N values were obtained. After eliminating the maximum value and the minimum value, N-2 data arithmetic average was calculated. The advantage is that occasional sampling deviation values caused by pulse interferences can be eliminated.
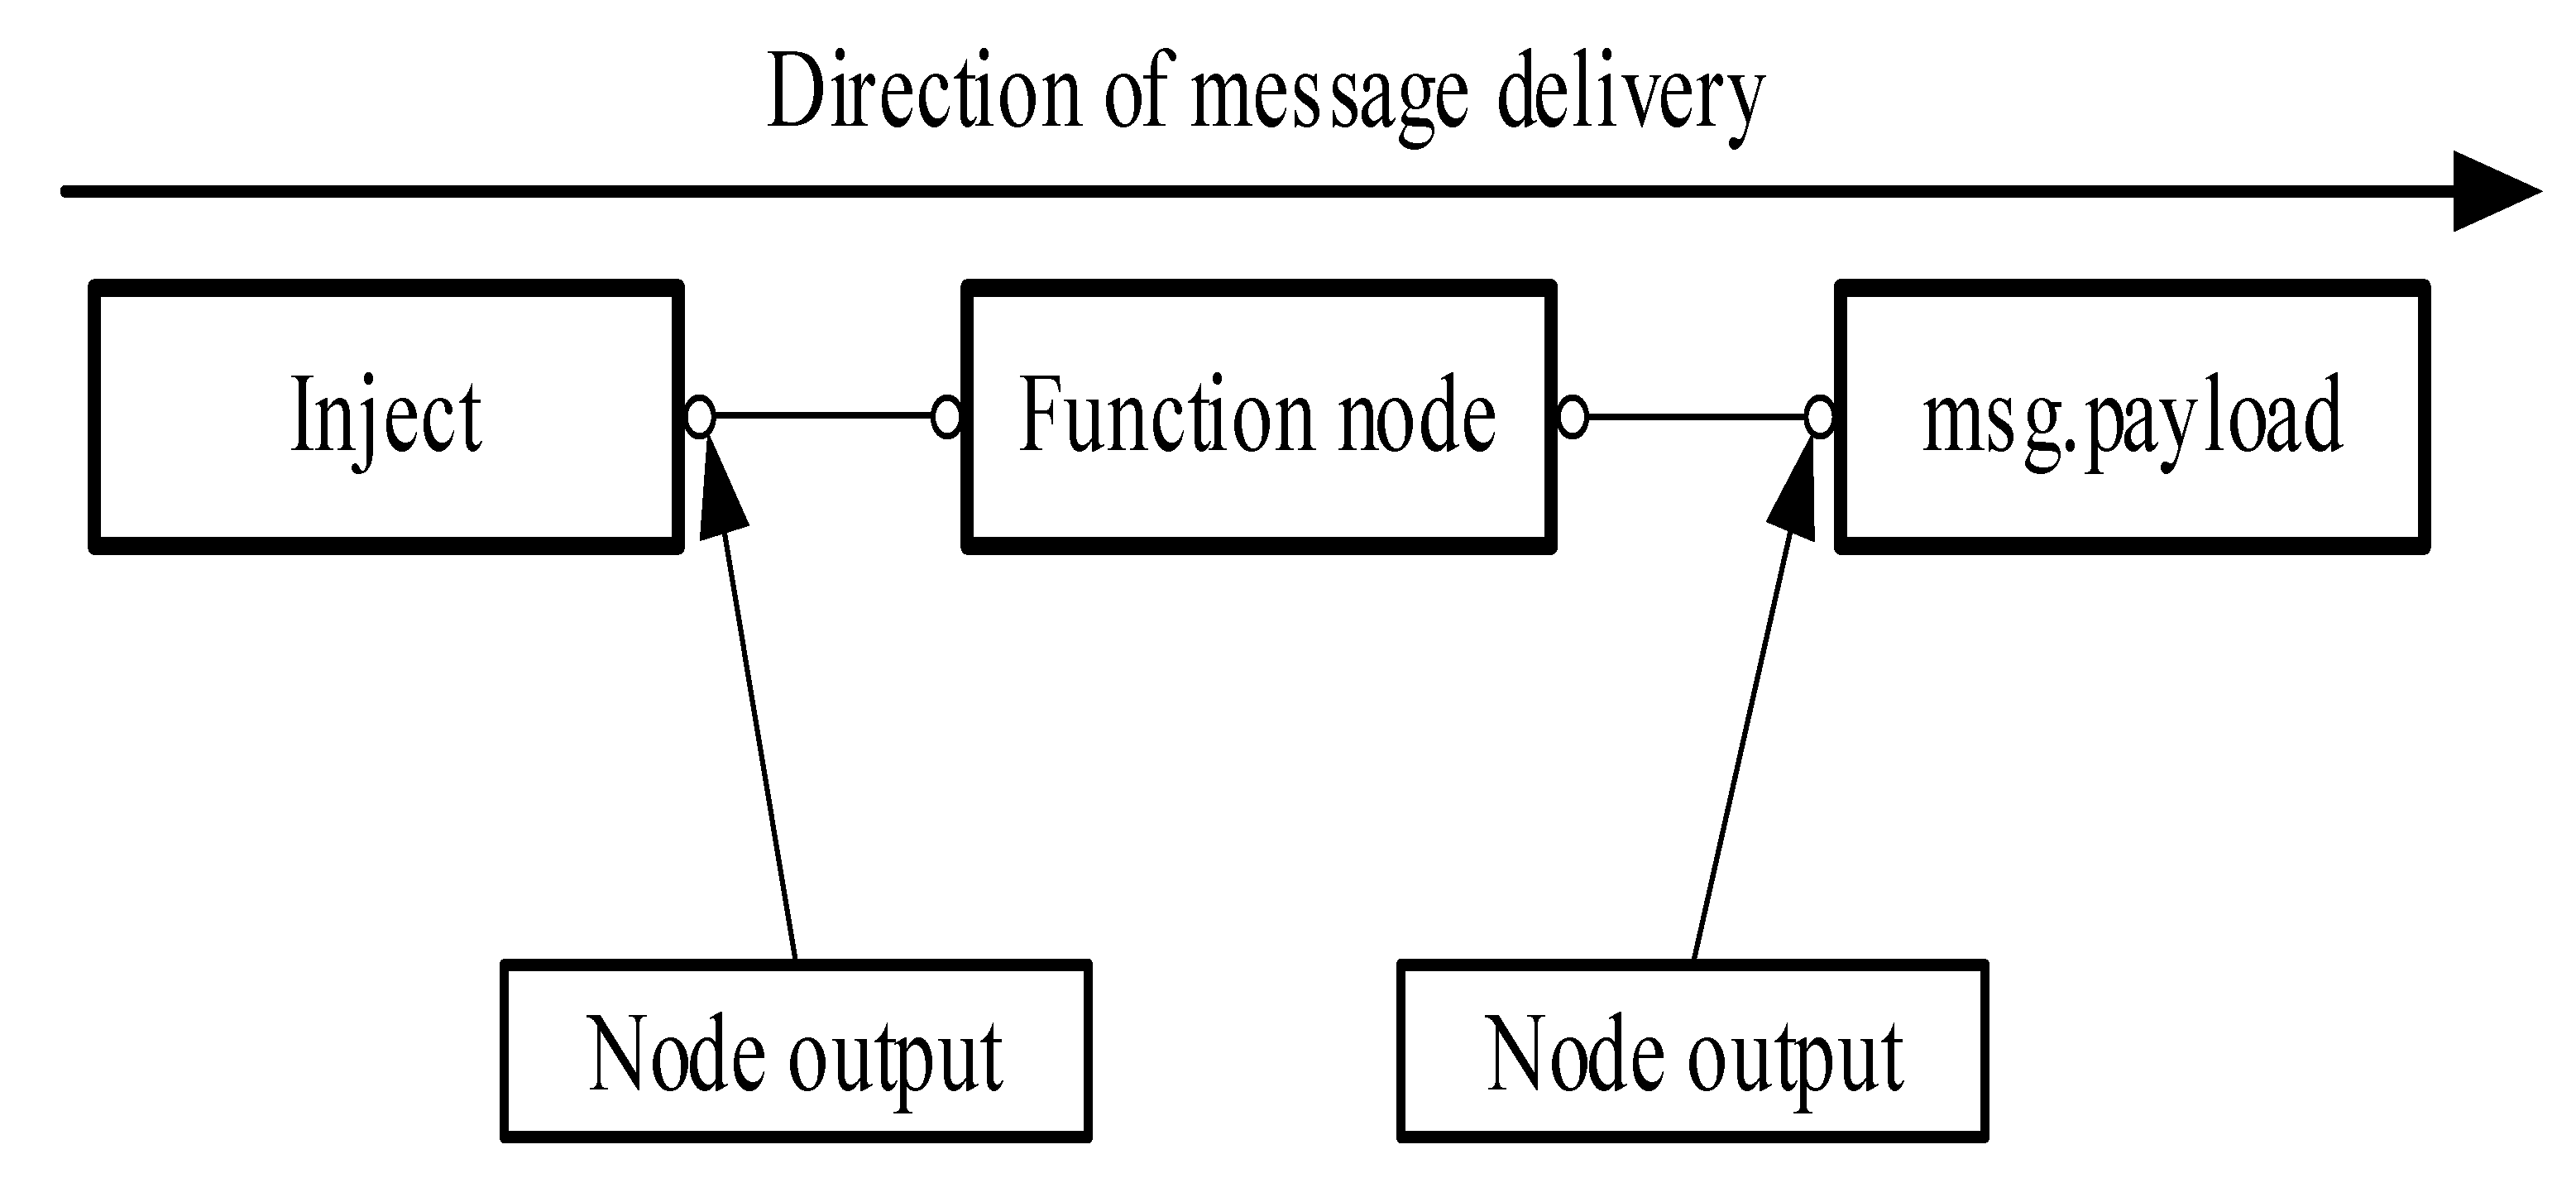
The Node-RED [14,15,16,17] used is an open-source visualized development kit set up on Node.js. Through the browser interface web, the website was set up and the IoT was developed. The flow-based programming (FBP) dataflow [15] was used to establish a visualized flow program. The program logic is presented in graphic nodes and connection lines. The connection lines are used between nodes to define the direction of message delivery. The program operation flowchart is as shown in Figure 9.
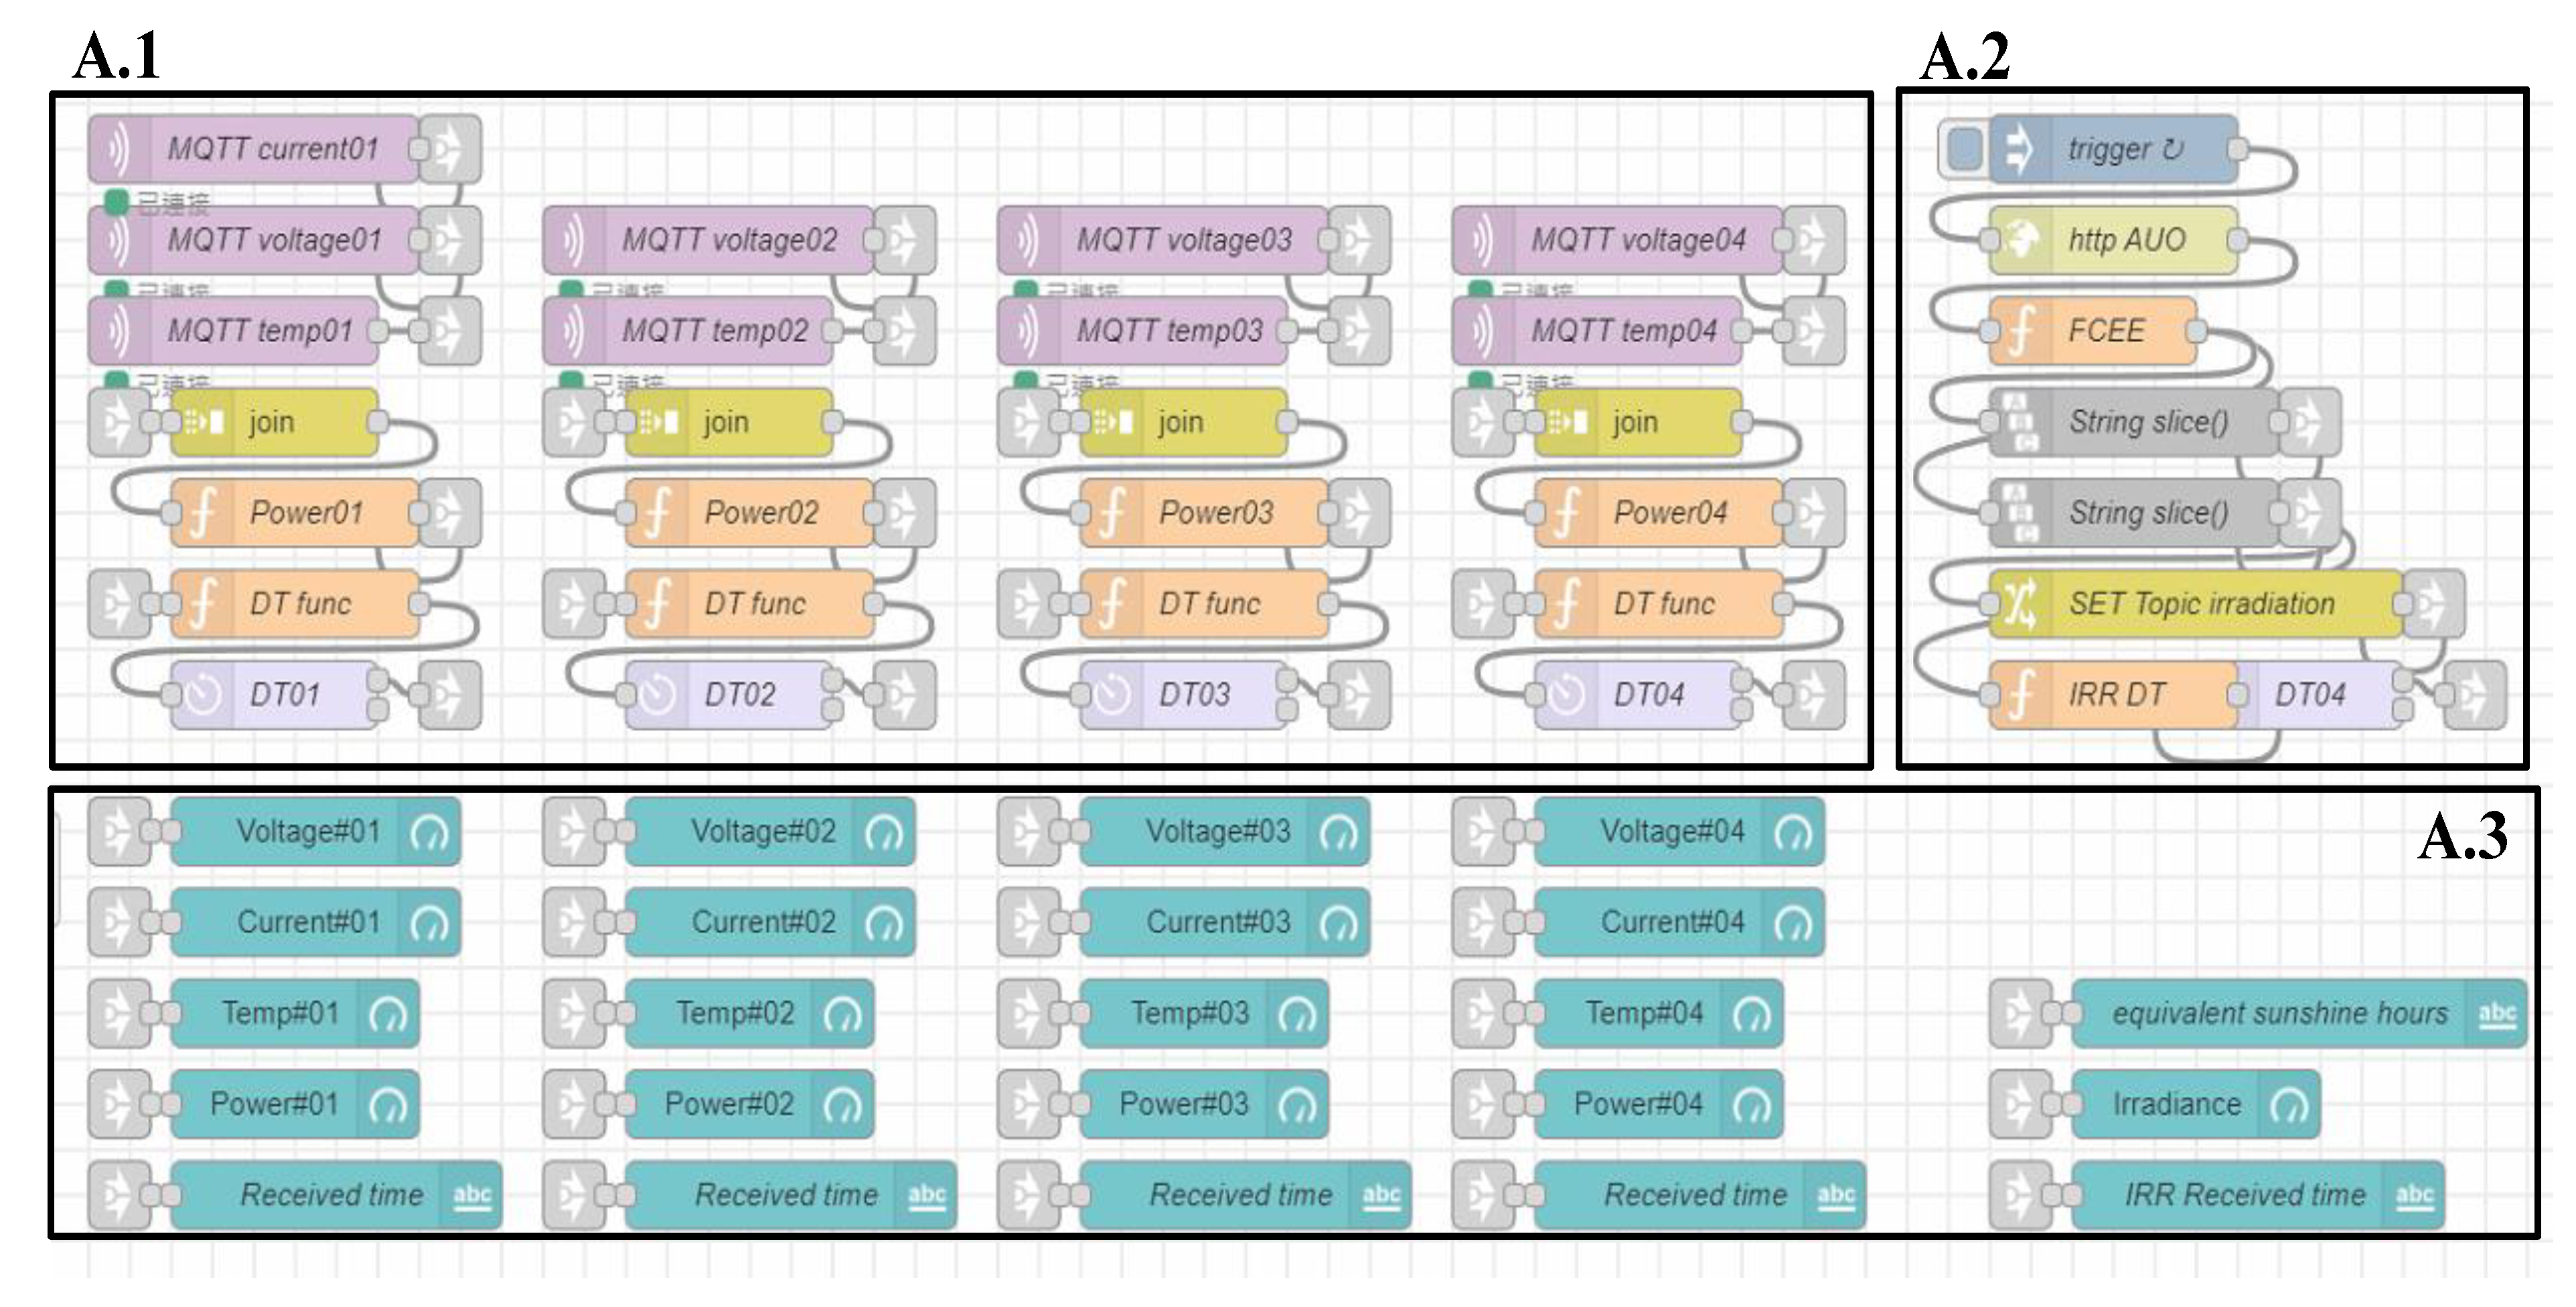
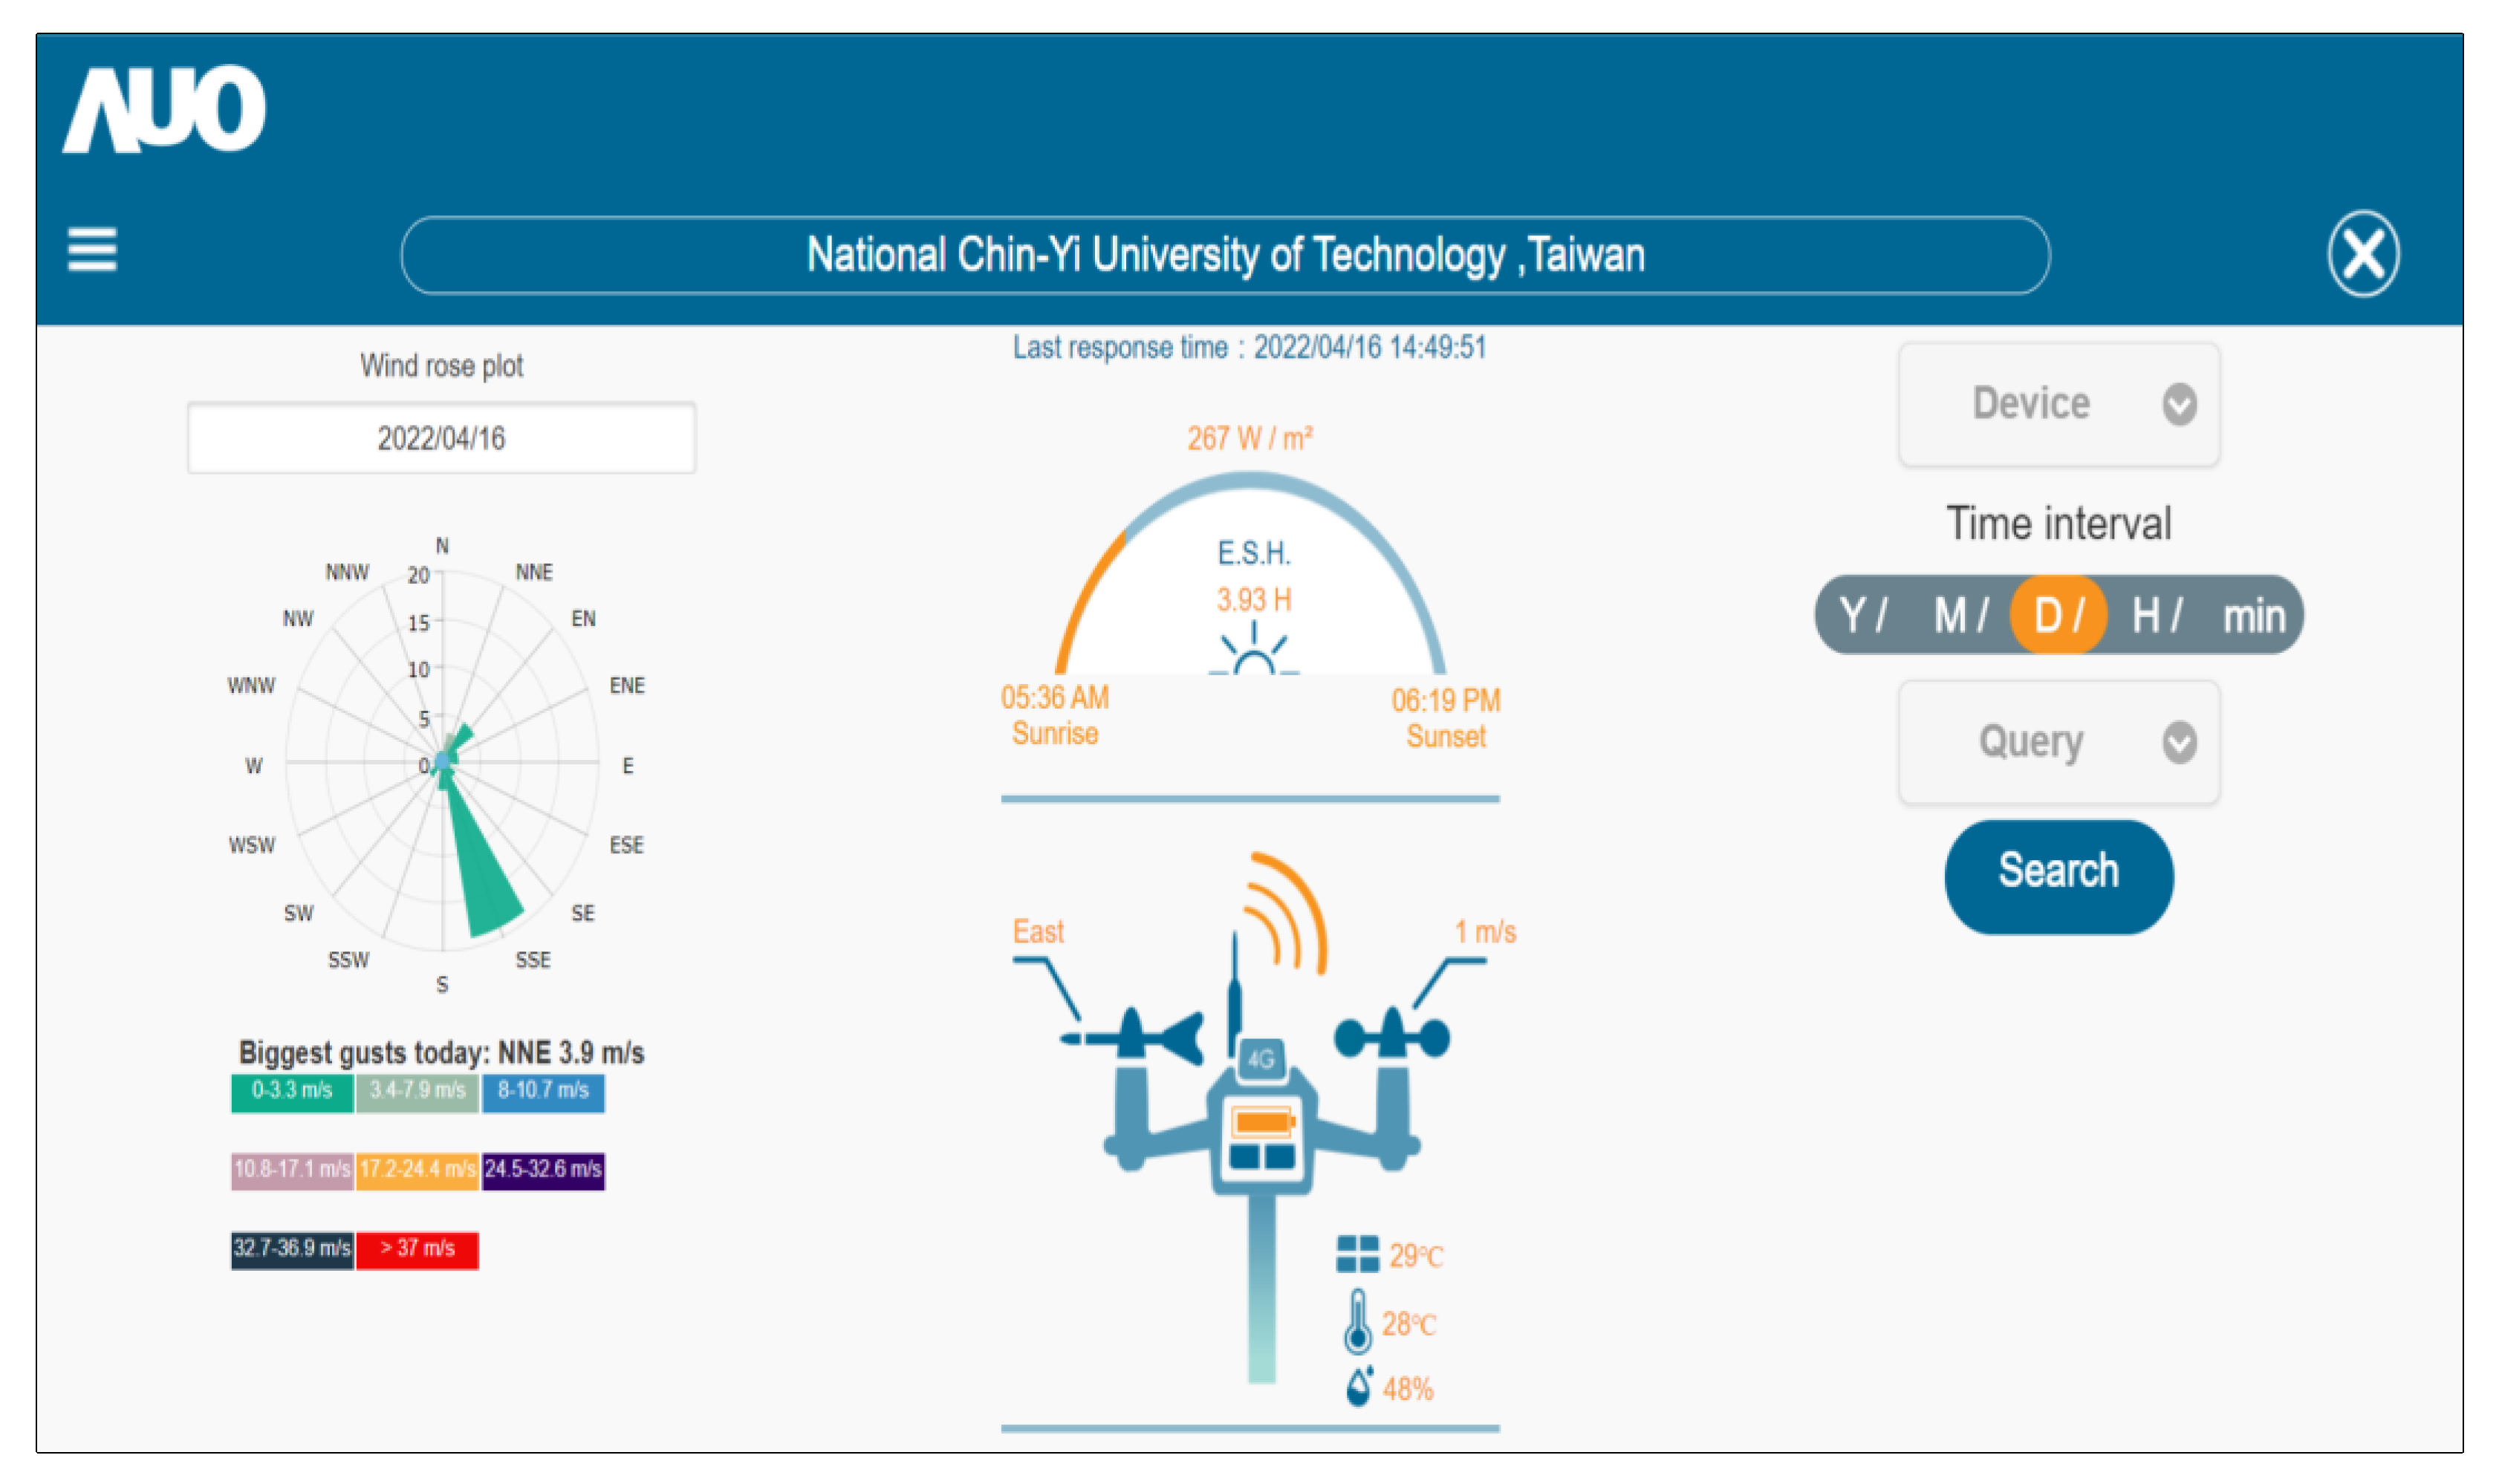
The Node-RED [15] program design is divided into three blocks. As shown in Figure 10, the A.1 area, the A.2 area, and the A.3 area are responsible for receiving data and displaying data on the Node-RED dashboard [16] page. The functions include the following: the A.1 area receives data sent back by the fault detection module; the A.2 area extracts case site setting sensing tree [34] page information shown in Figure 11 through the web crawler method. The information extracted include irradiance, equivalent sunshine hours (E.S.H.), temperature, humidity, etc.; the A.3 area displays data collected from the fault detection module and web crawler on the webpage as nodes in the dashboard kit.
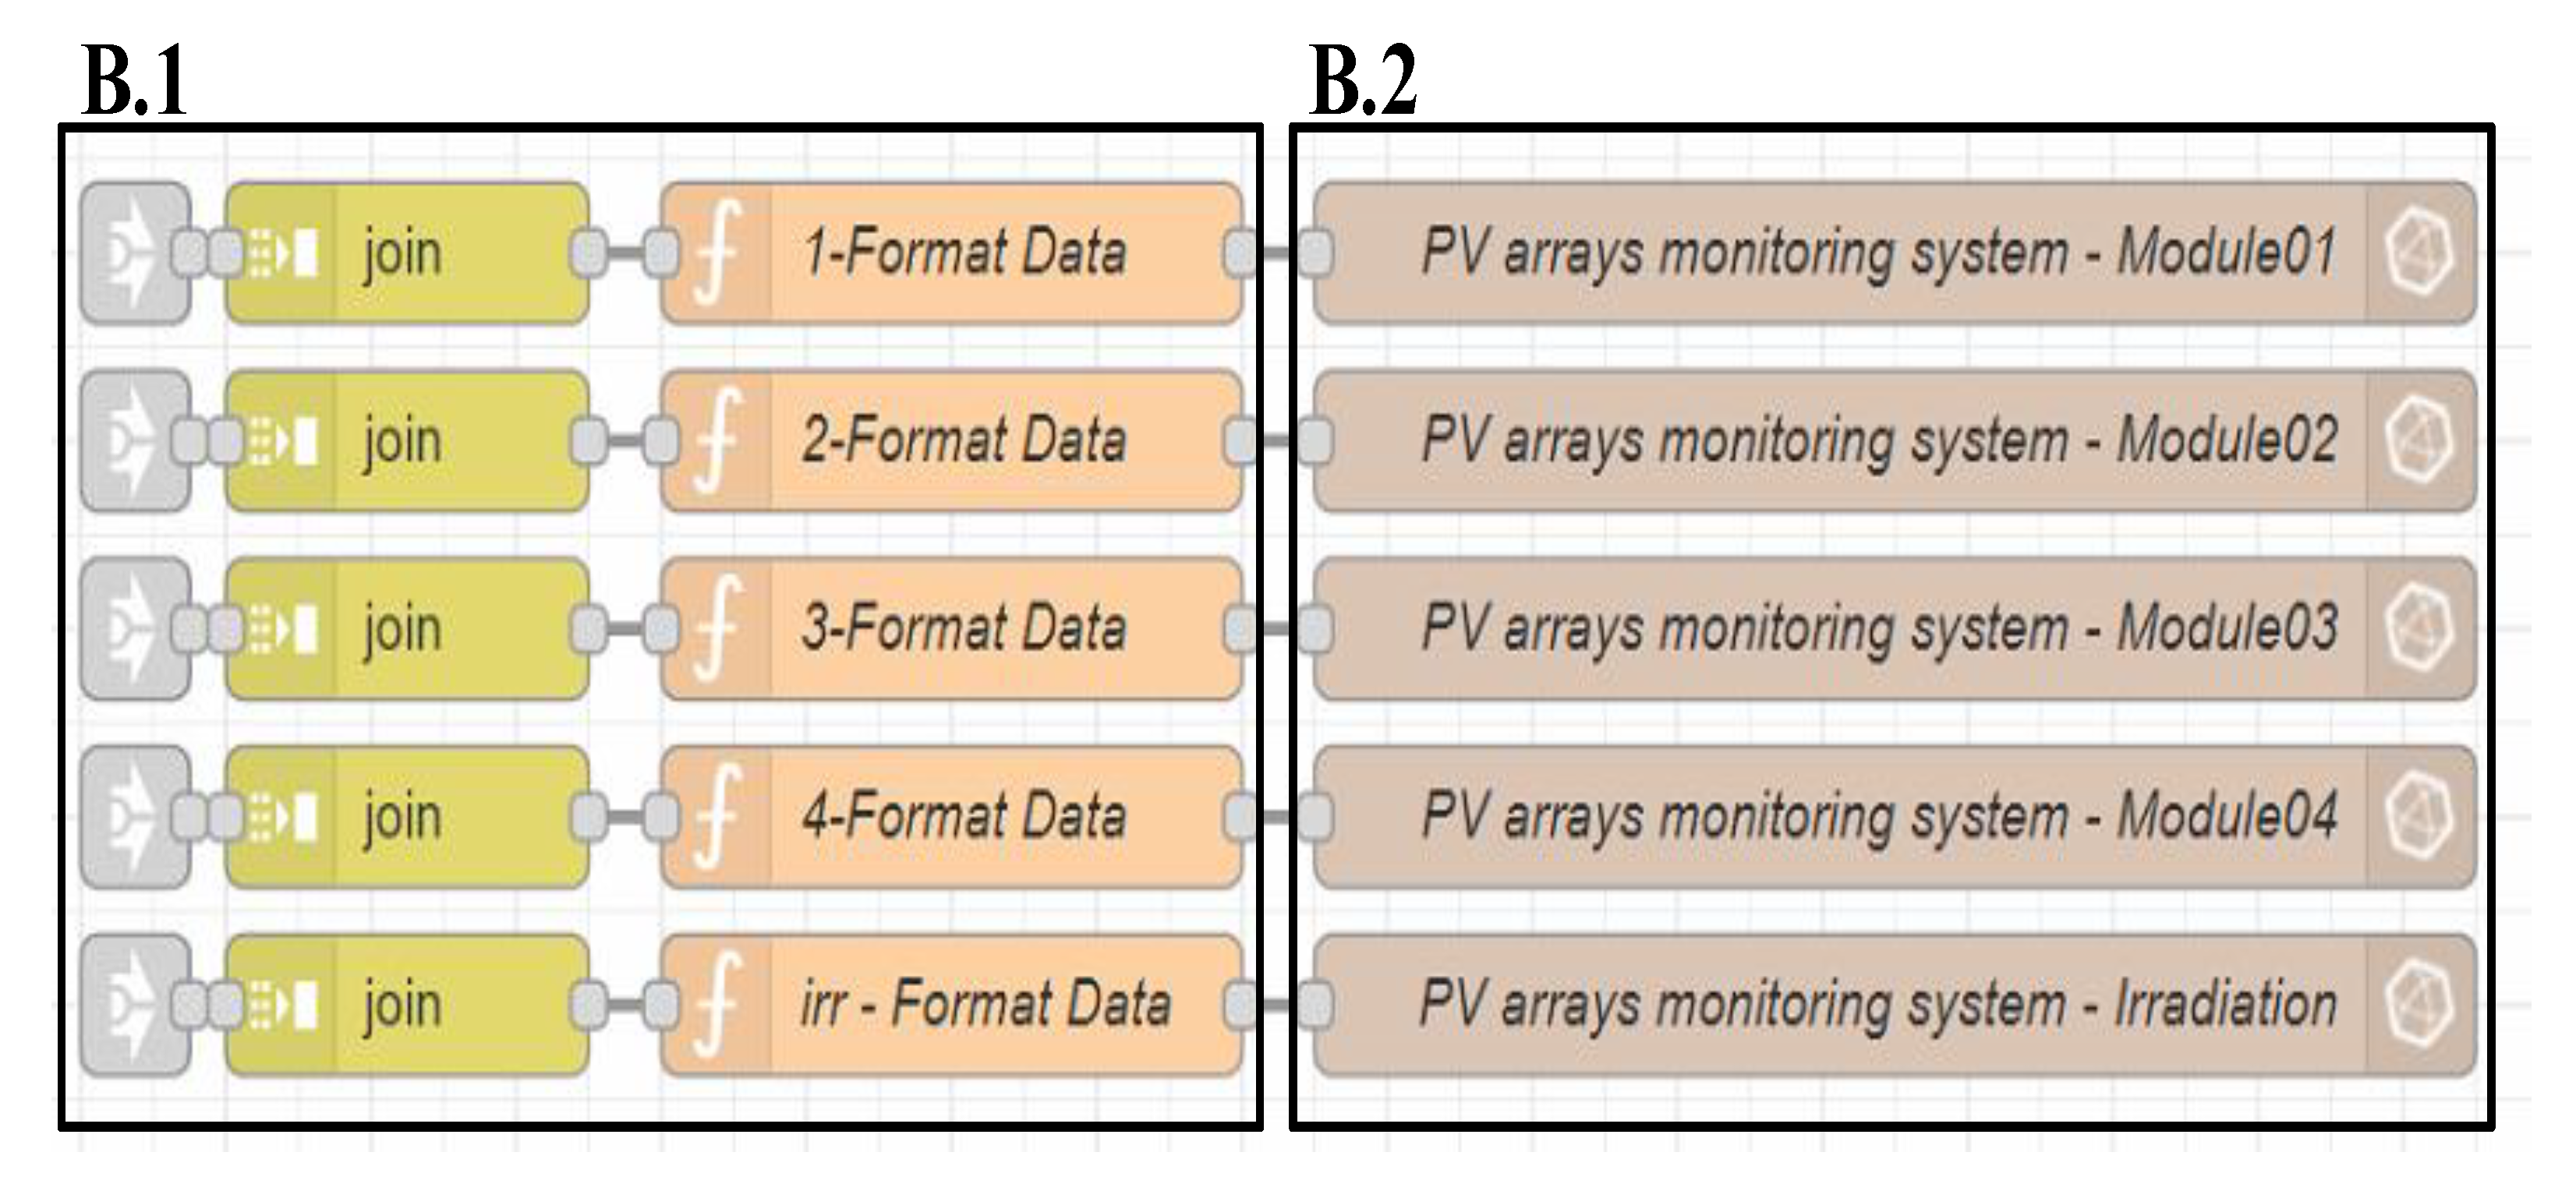
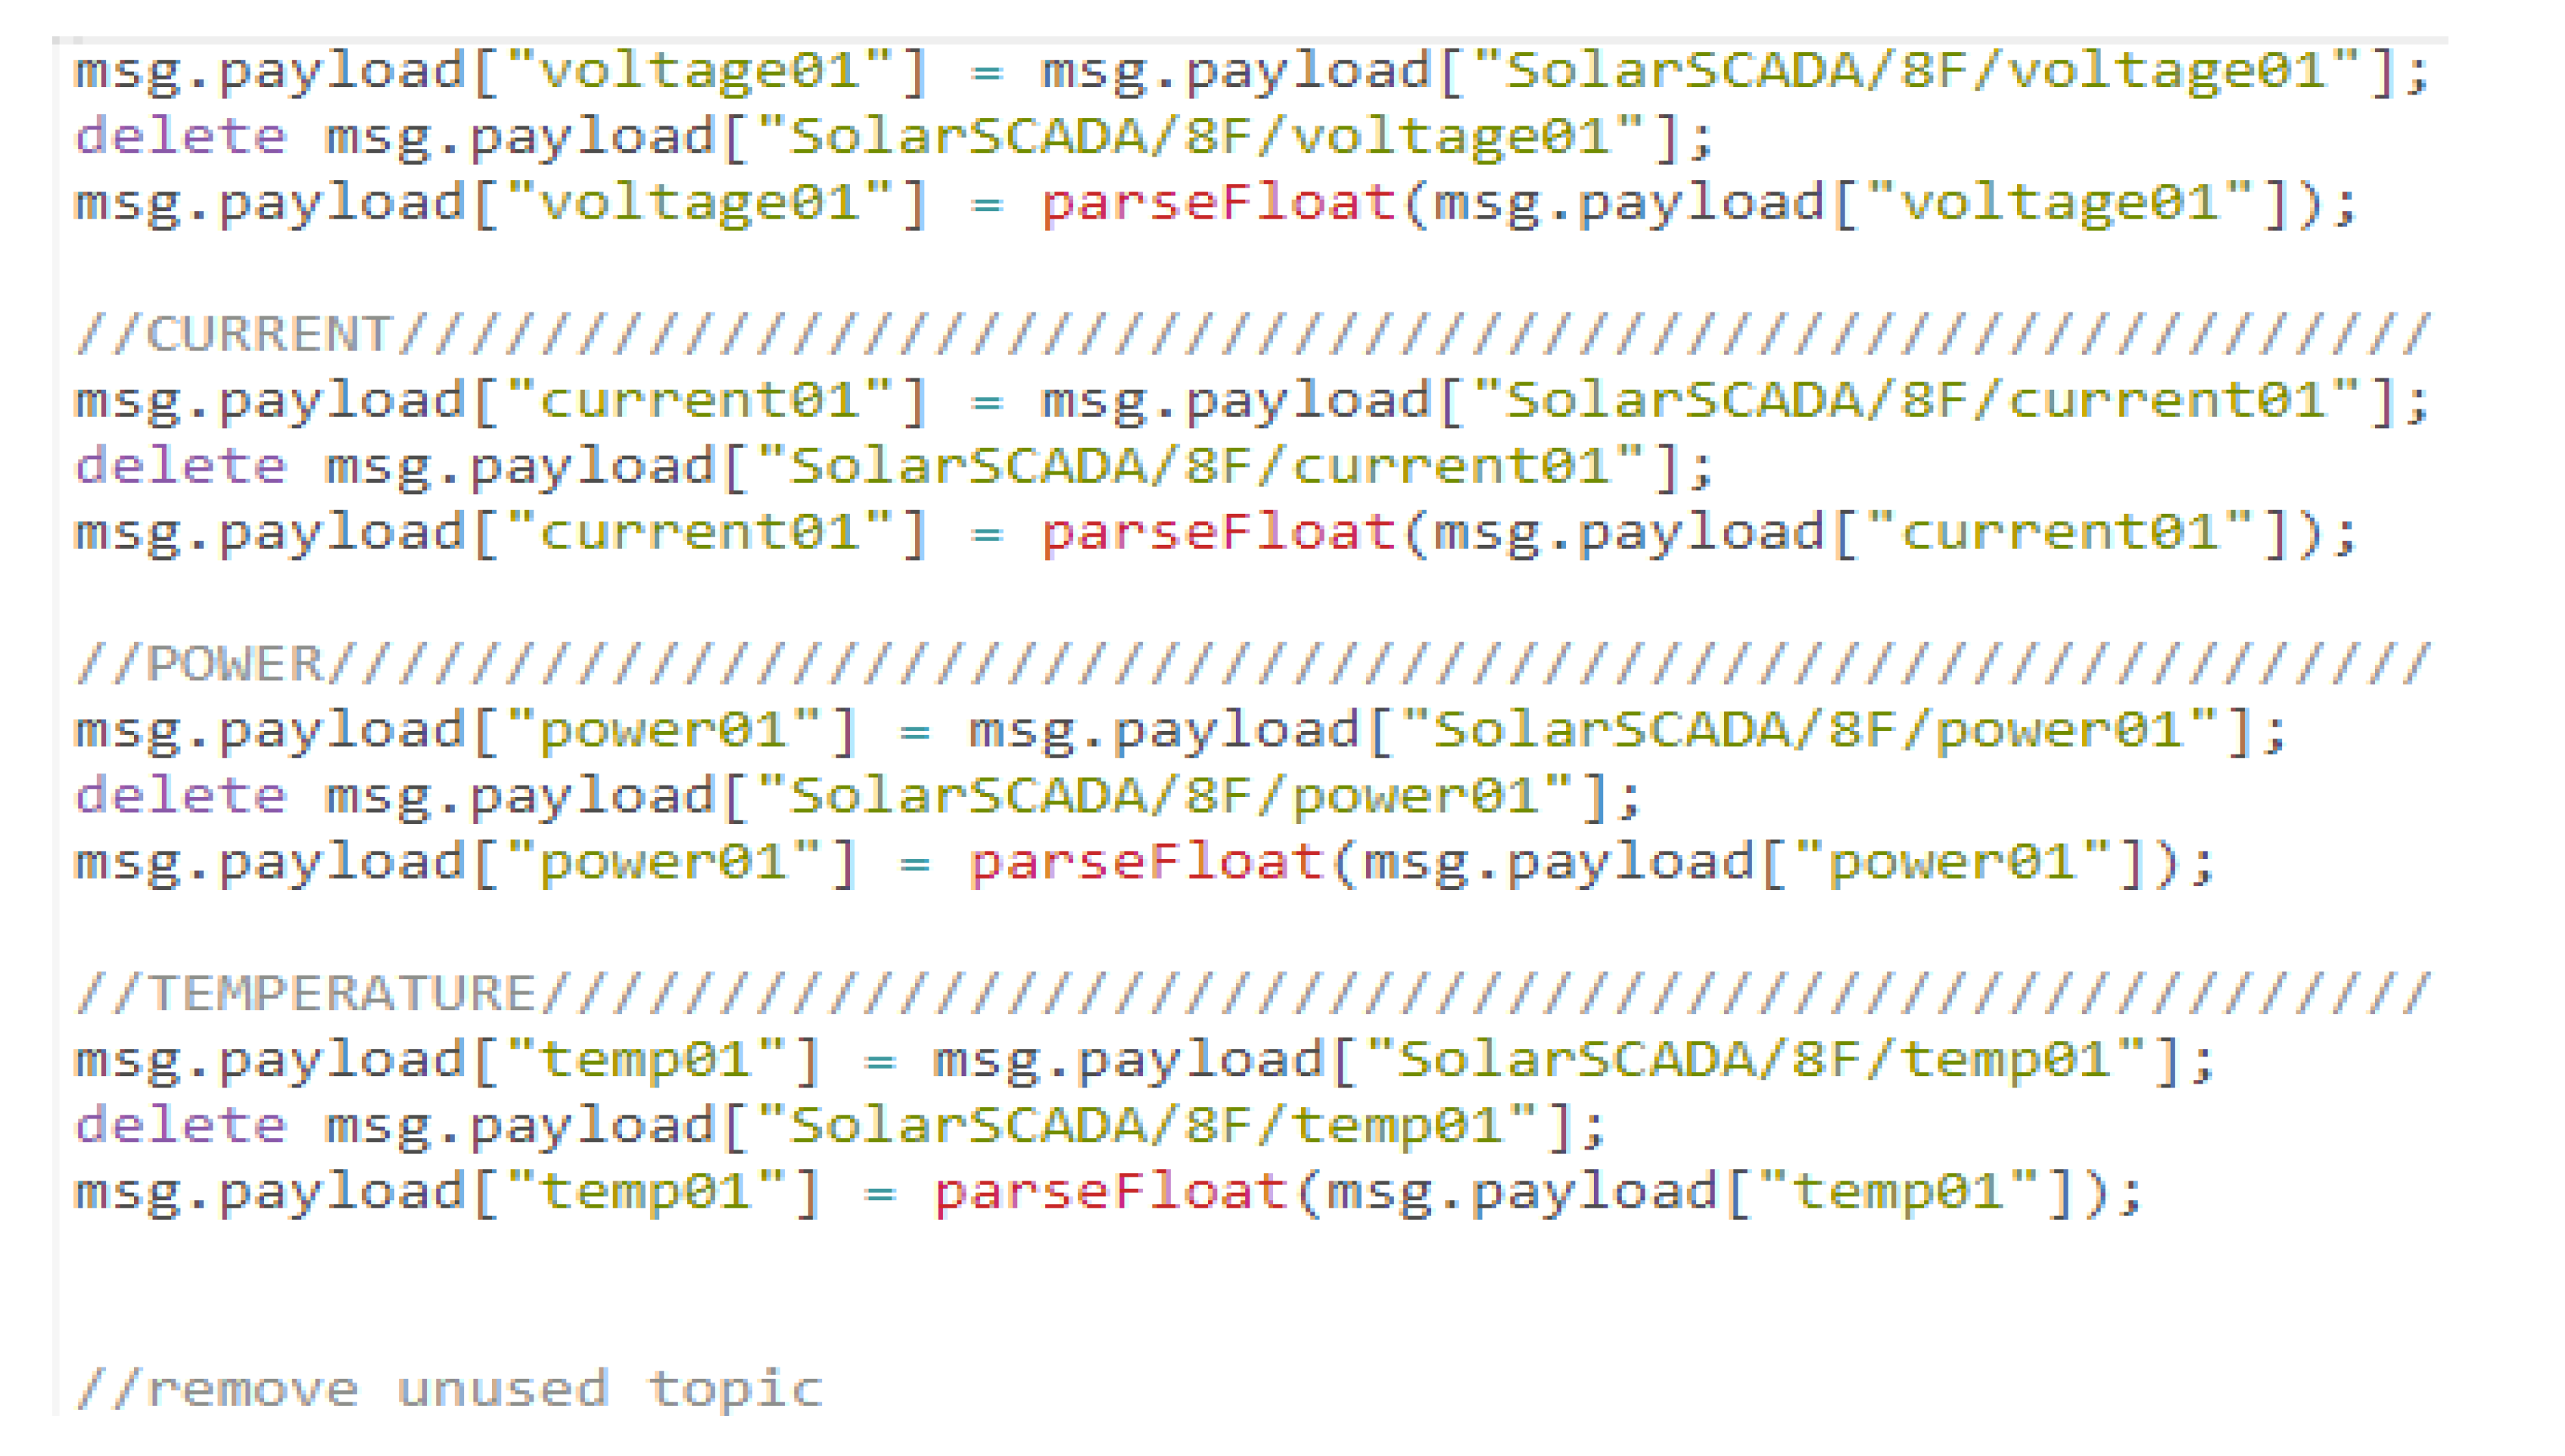
The job content in Figure 12 involves storing data in the InfluxDB 2.0 [18,19,20] database system. In particular, the B.1 area used the join node to the concentrate data collected from the A.1 area and the A.2 area into one output. However, the data sent by the join node was an object data type, so it could not be written into InfluxDB 2.0. Therefore, the B.1 area converted the data type from Object into Floating-Point Number in order to write data into the database. The data conversion program is as shown in Figure 13. In the B.2 area, the protocol port connecting to the database in the host was set as 8086, and the authentication token for reading and writing data was set.
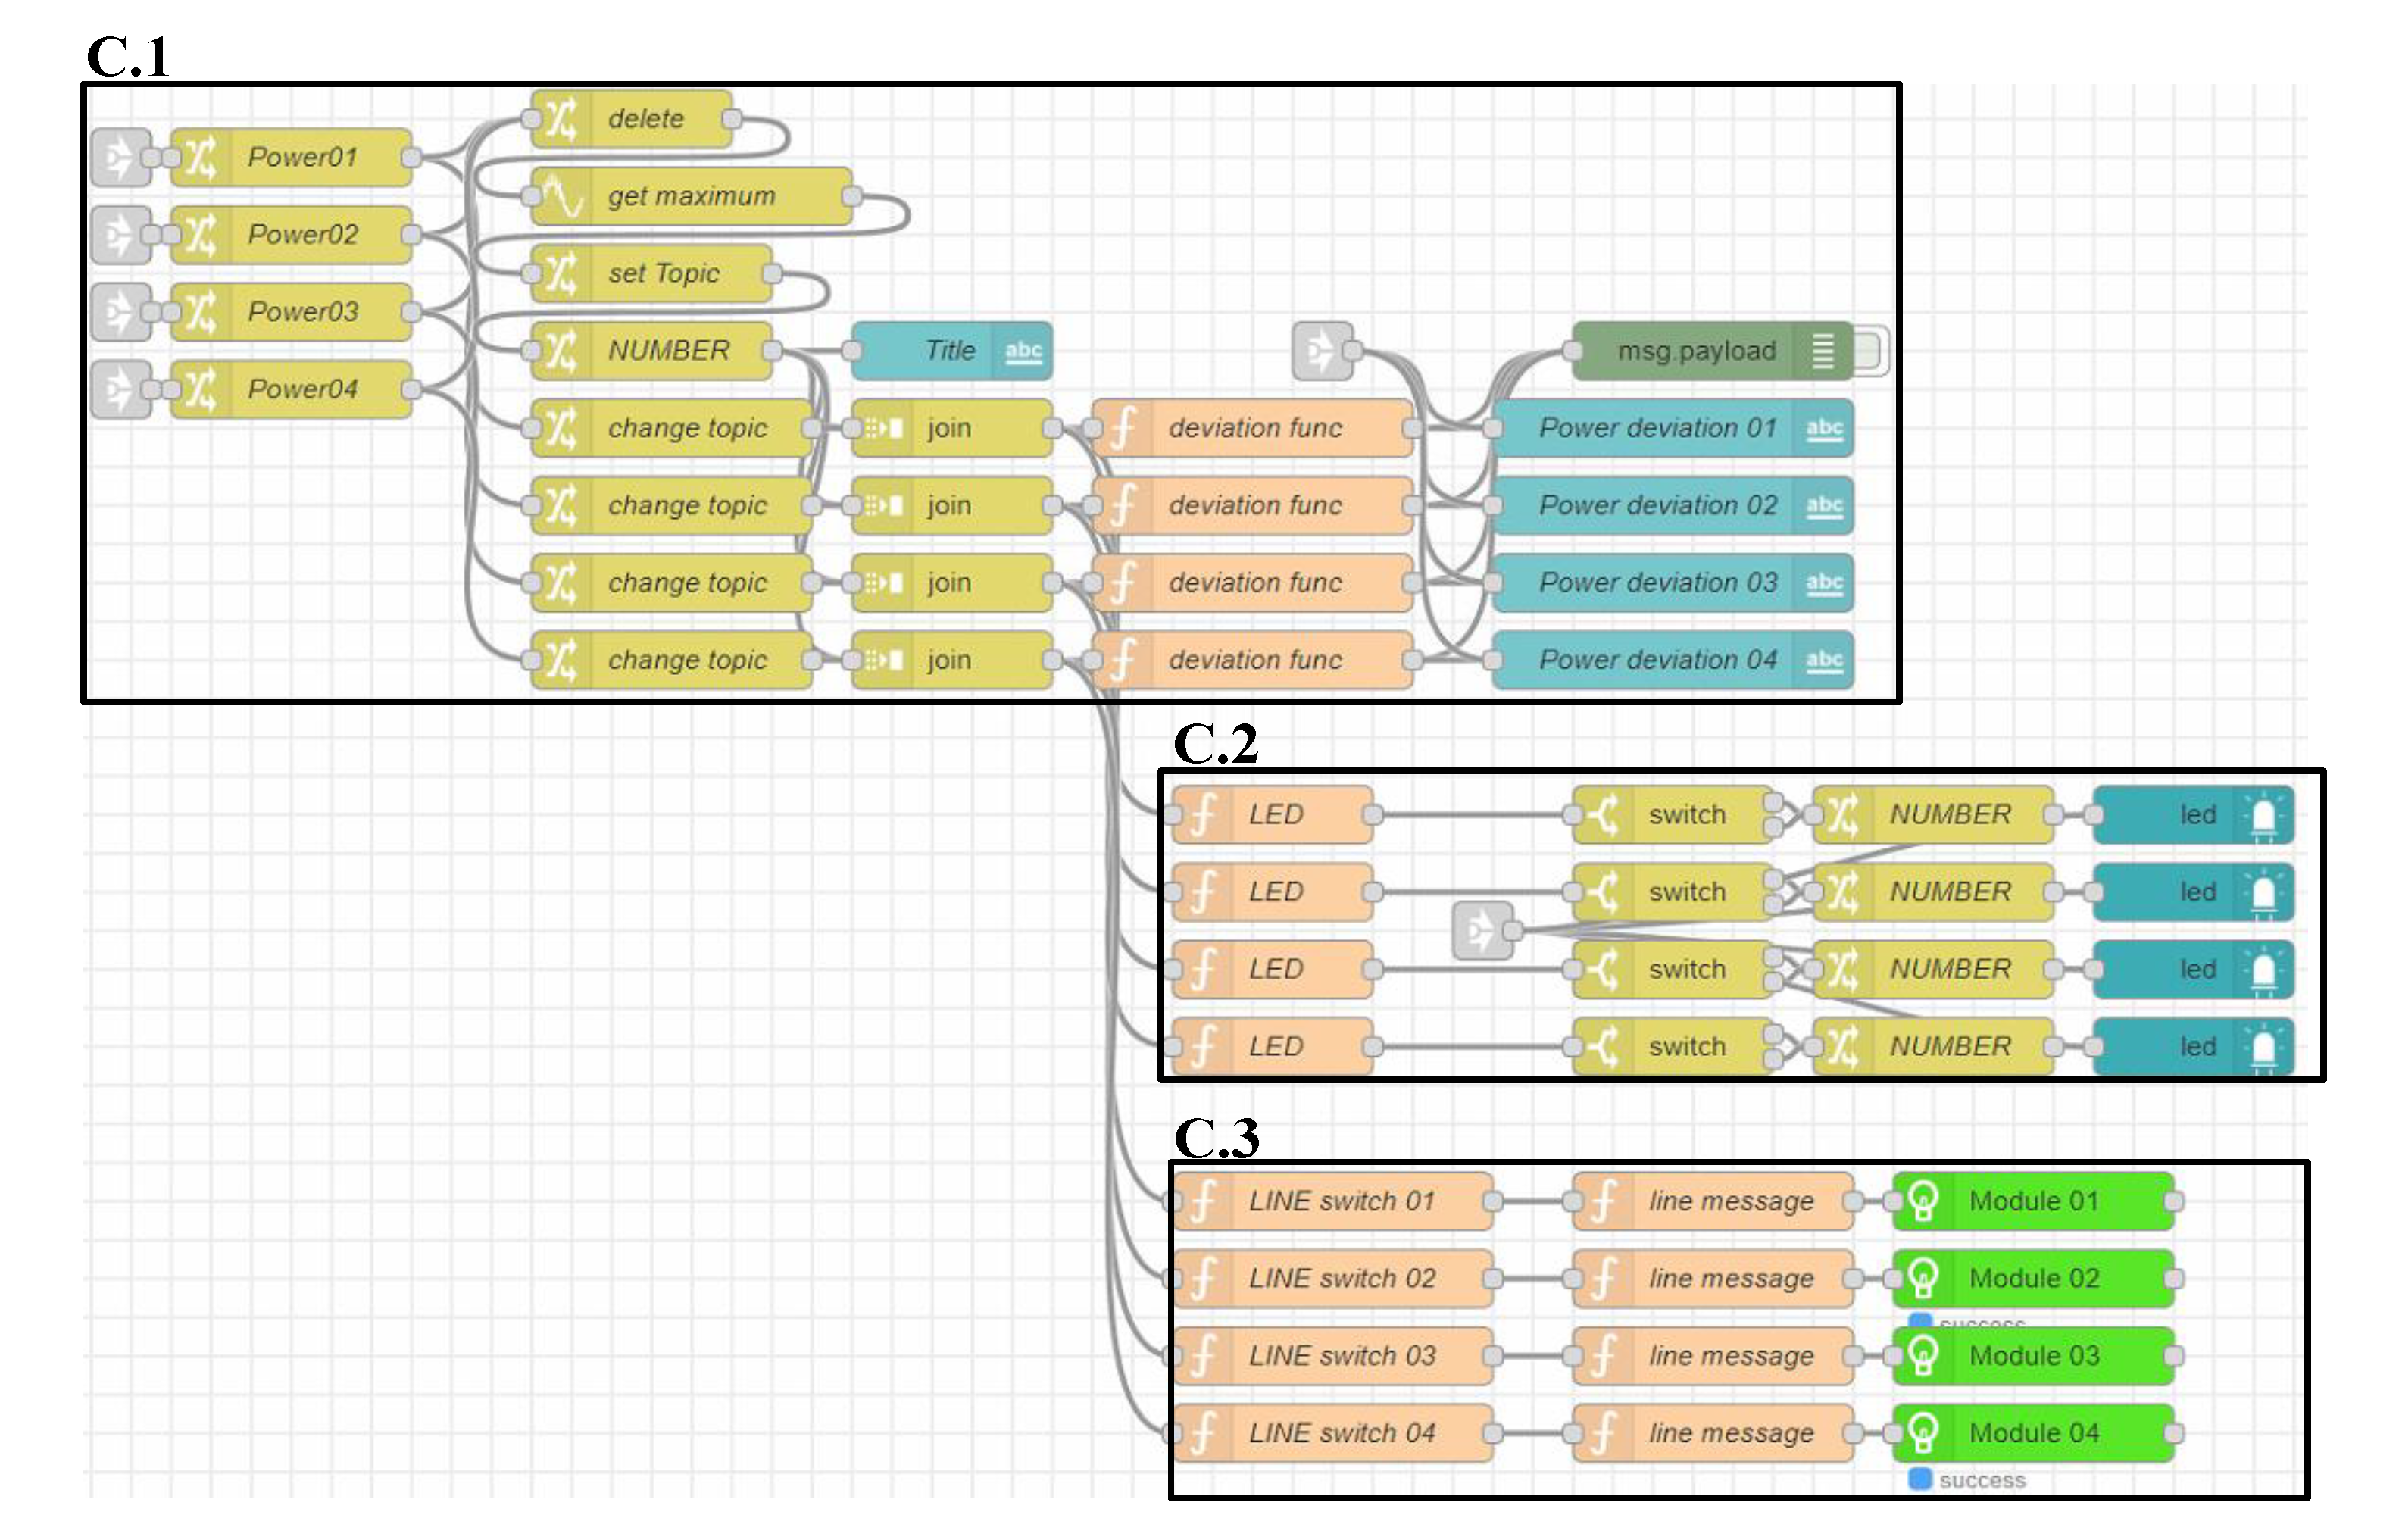
The function in Figure 14 is the PV module pre-warning notification function. In order to determine if the four PV modules show power generation abnormality, the powers , , , of the four PV modules in the C.1 area were compared to find the maximum power ratio . If the difference ratio between the powers of the other modules and the maximum power ratio exceeded 5%, the power generation statuses of the PV modules were determined as abnormal, as expressed in Equation (3).
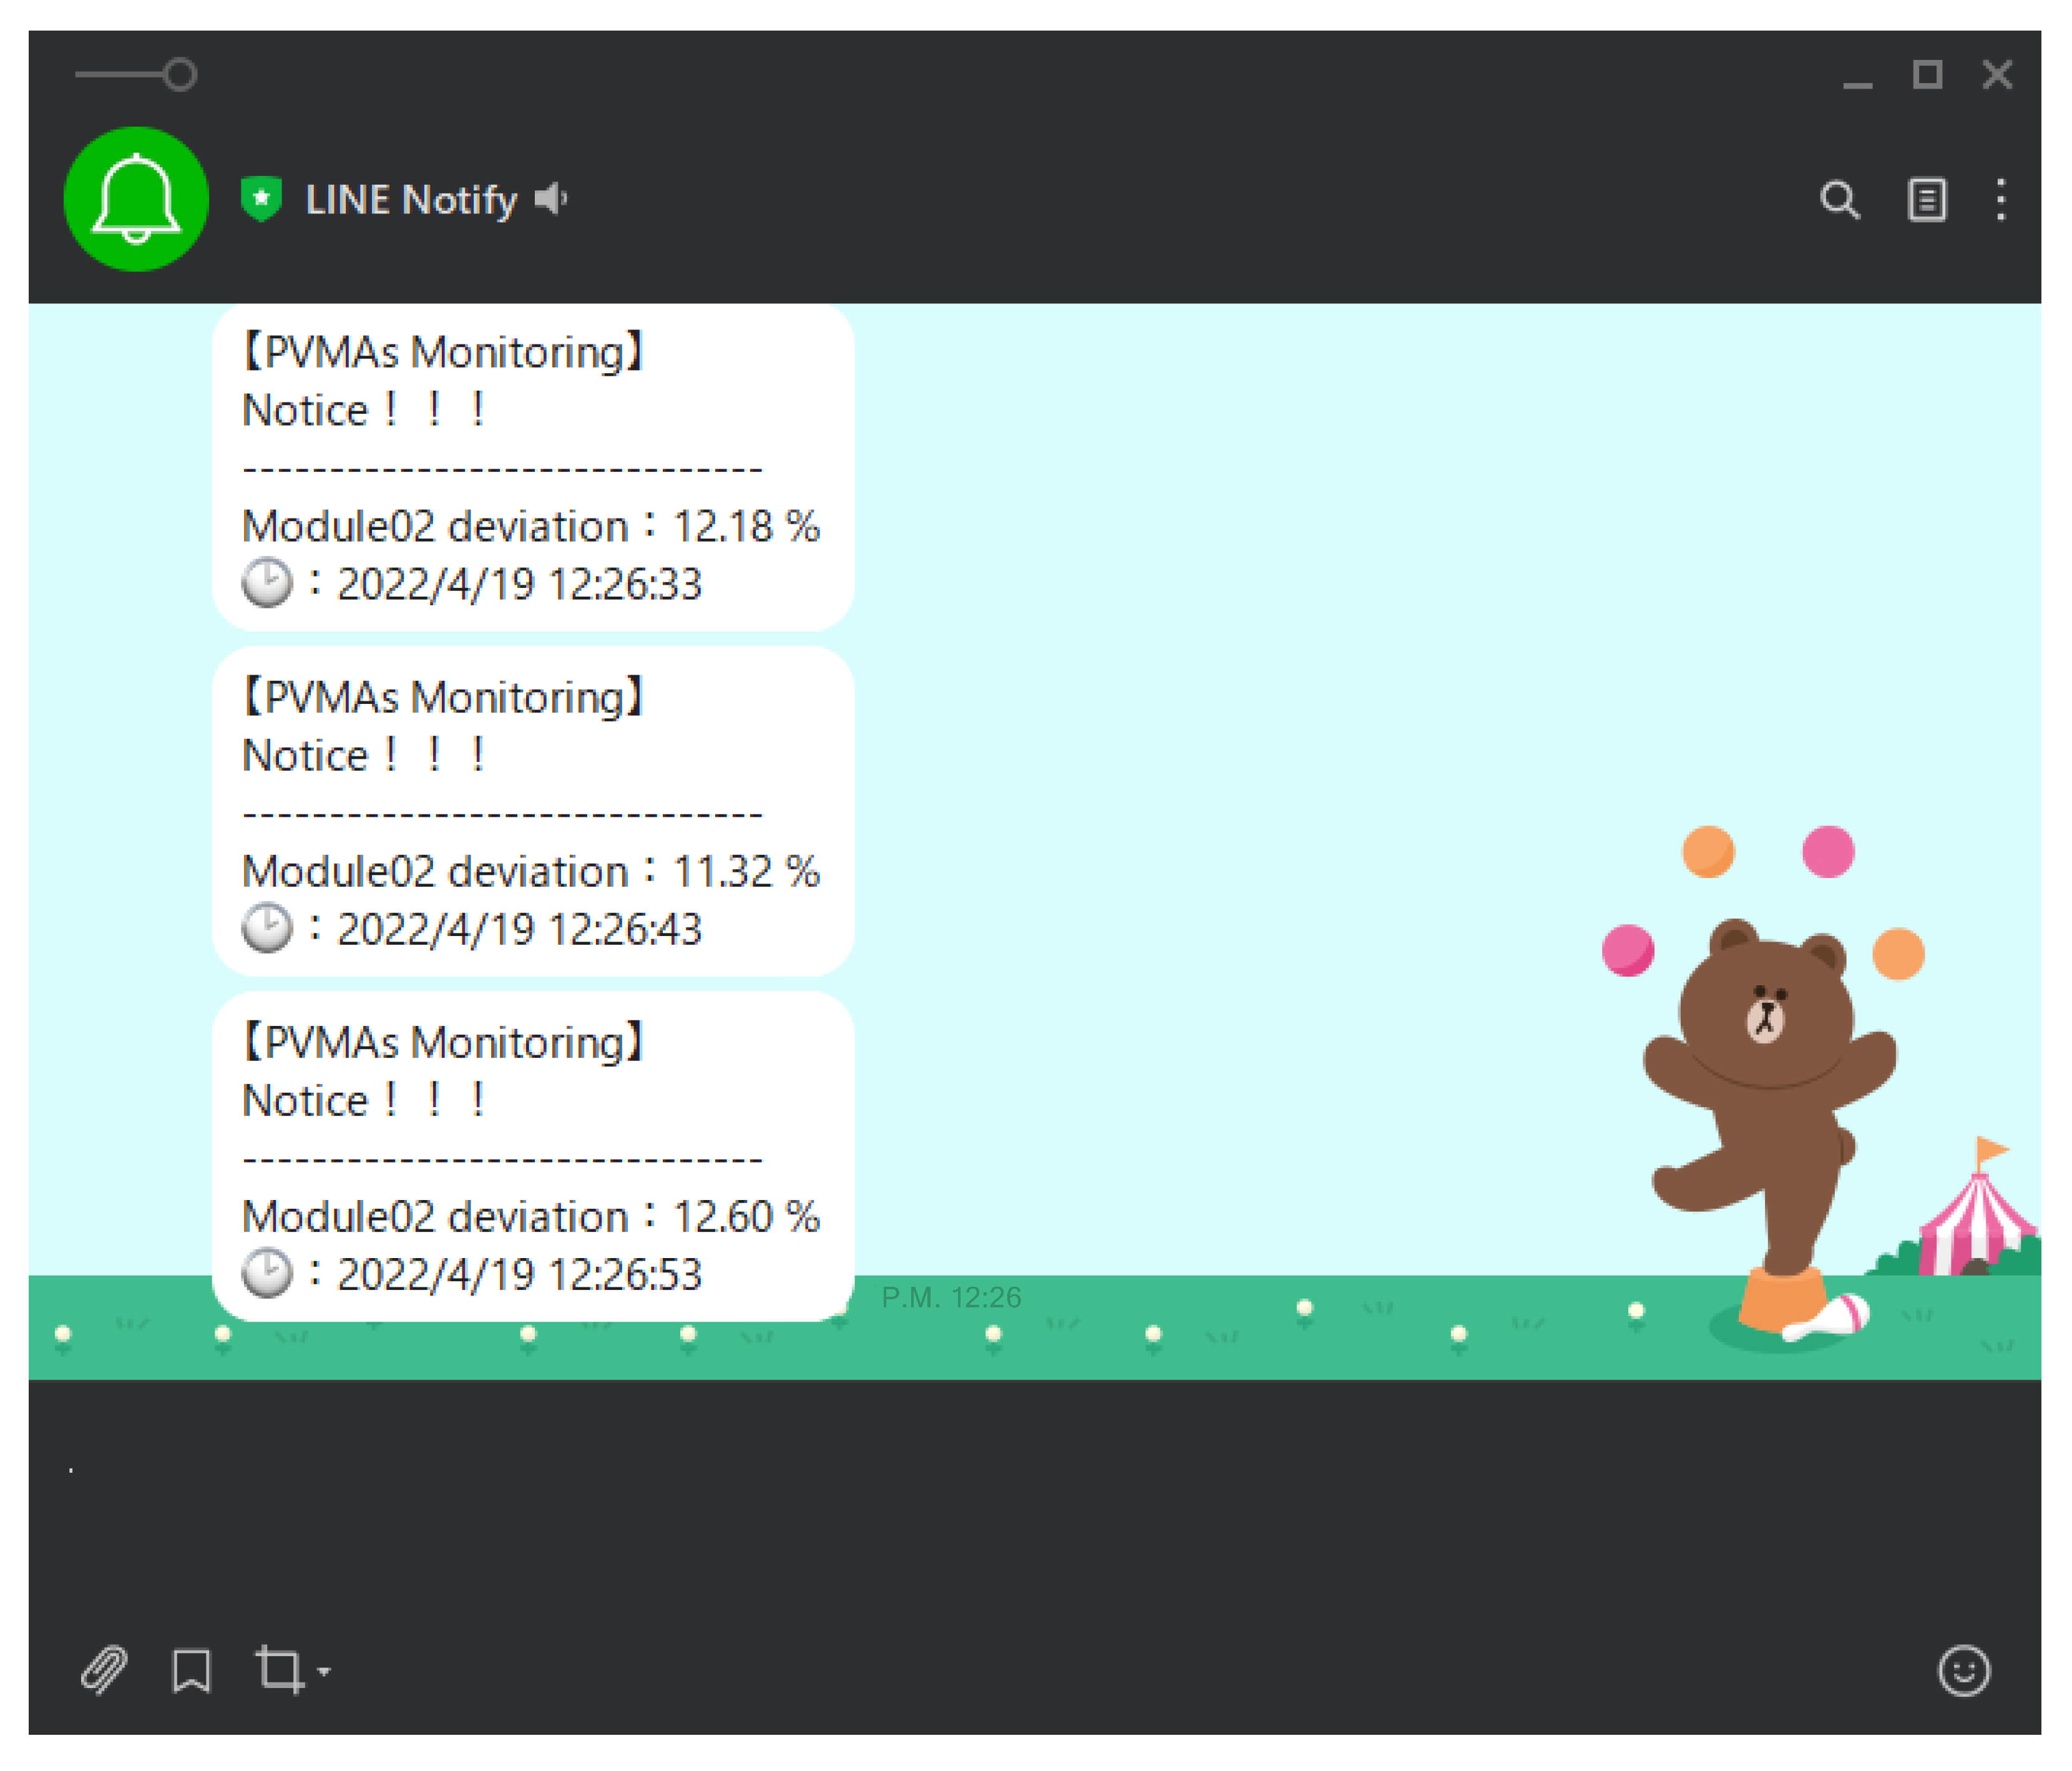
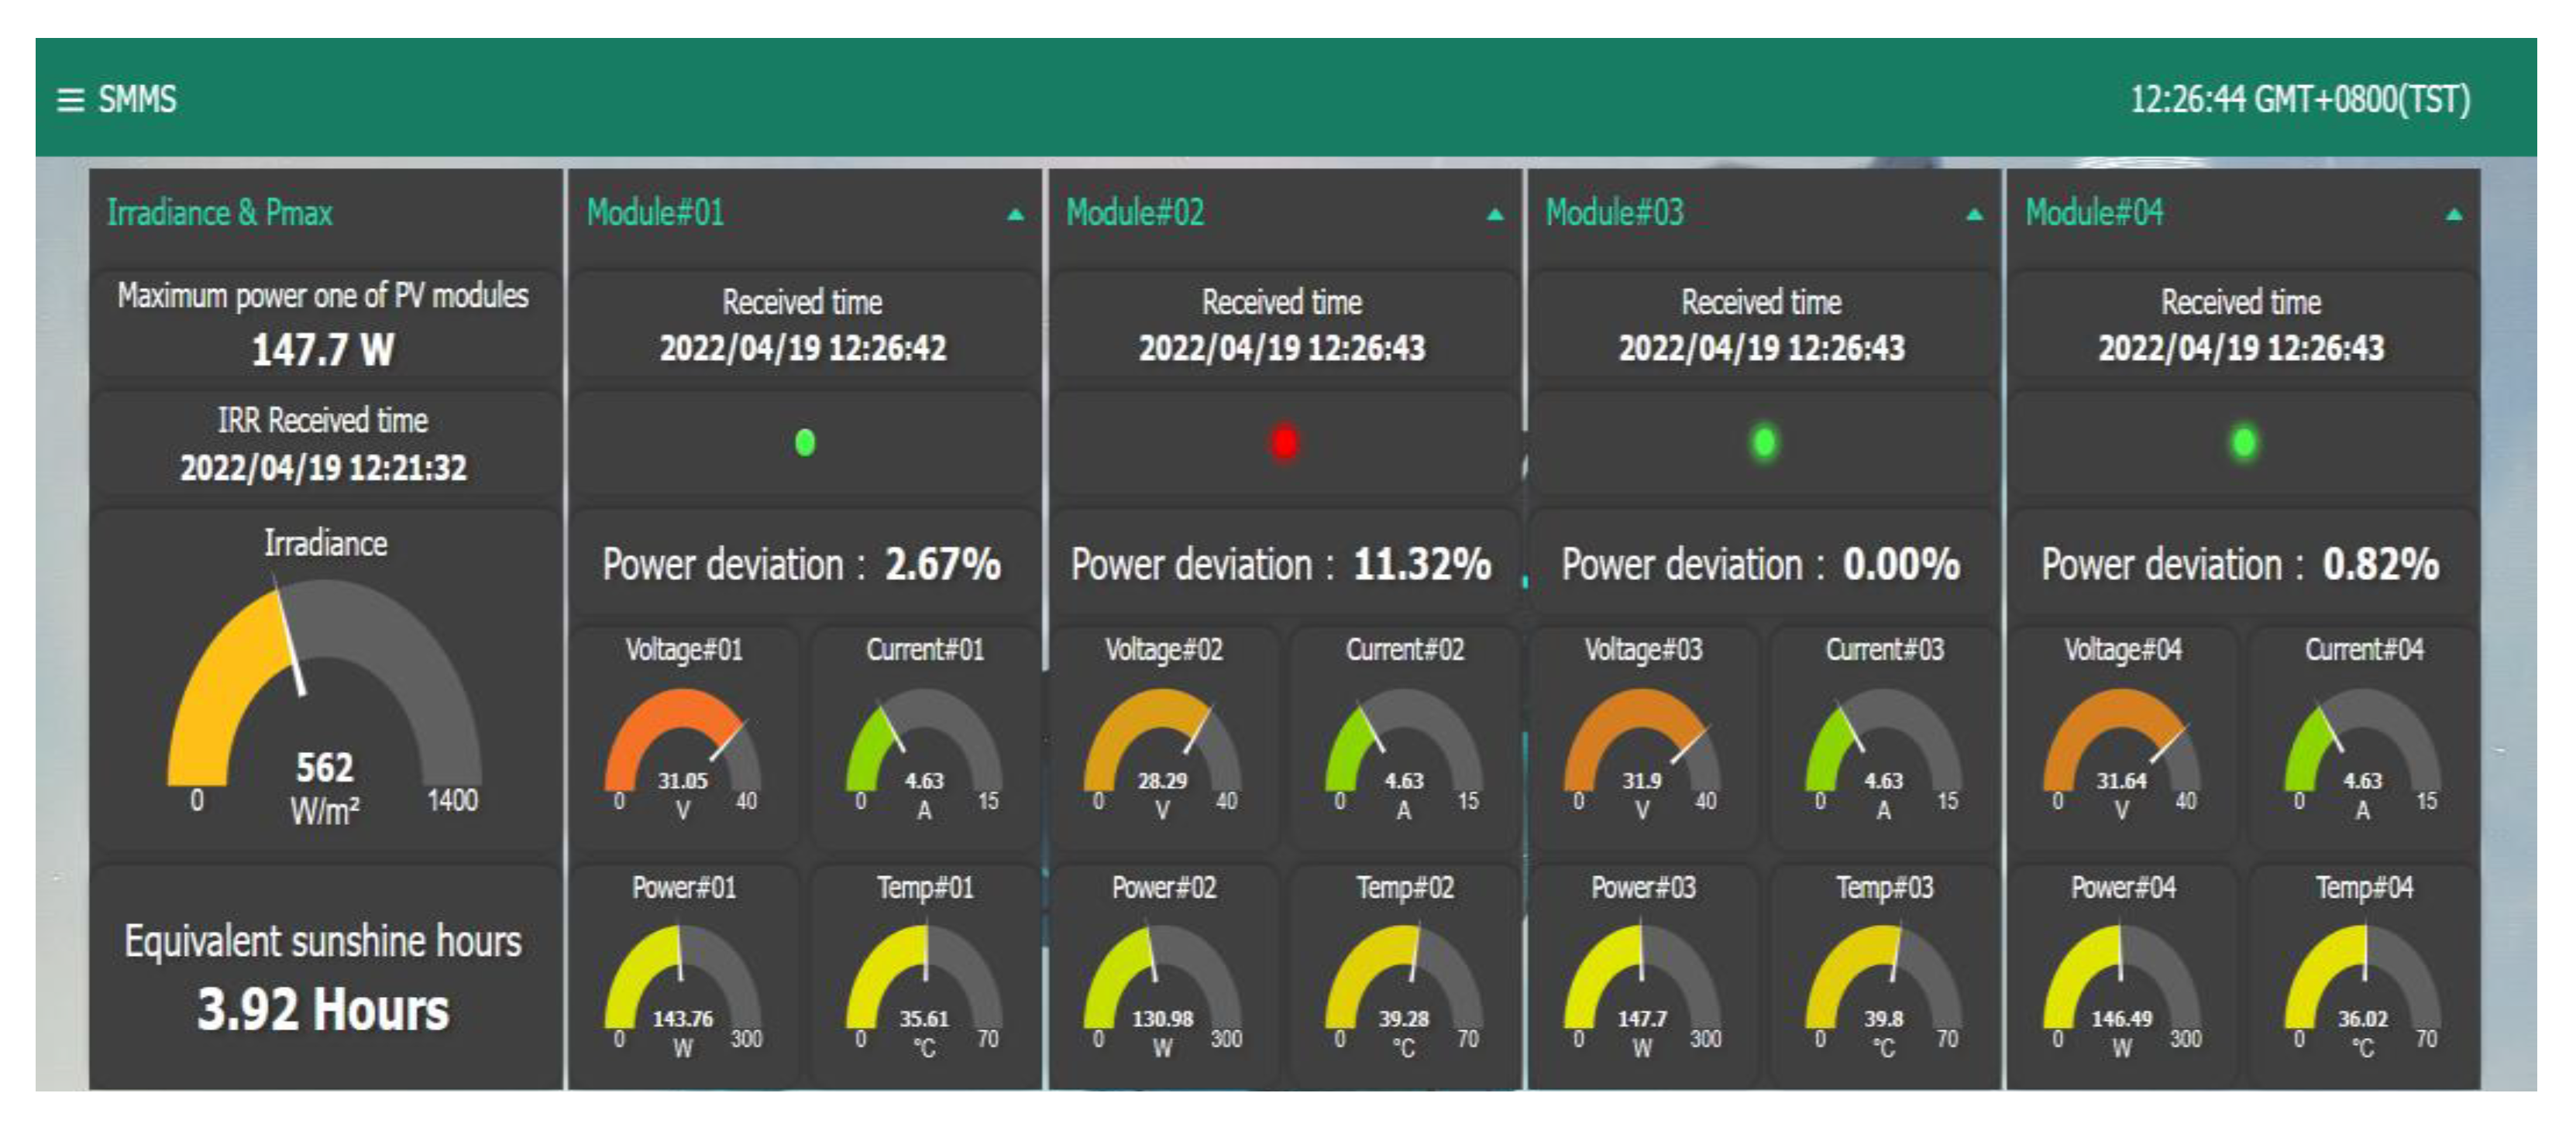
If = 1, the switch node in the C.2 area used the red indicator light to show whether PV module abnormality occurred. The C.3 area then sent a warning alert message via Line-Notify to notify repair personnel. The notification display frame is as shown in Figure 15. The power difference ratio between the power of the solar PV module and the module with the maximum power ratio, as well as the warning indicator lights in the C.2 area, are as shown on the Node-RED dashboard [16] interface in Figure 16. It can be seen from Figure 15 and Figure 16 that the output deviation value of module#2 reached 11.32%, which was thus determined to be working abnormally. Then, through the C.2 area function, the warning light of Module #2 is in red alert. Subsequently, through the function in the C.3 area, the warning alert message shown in Figure 15 was sent after the node for sending Line-Notify was triggered to notify repair personnel.
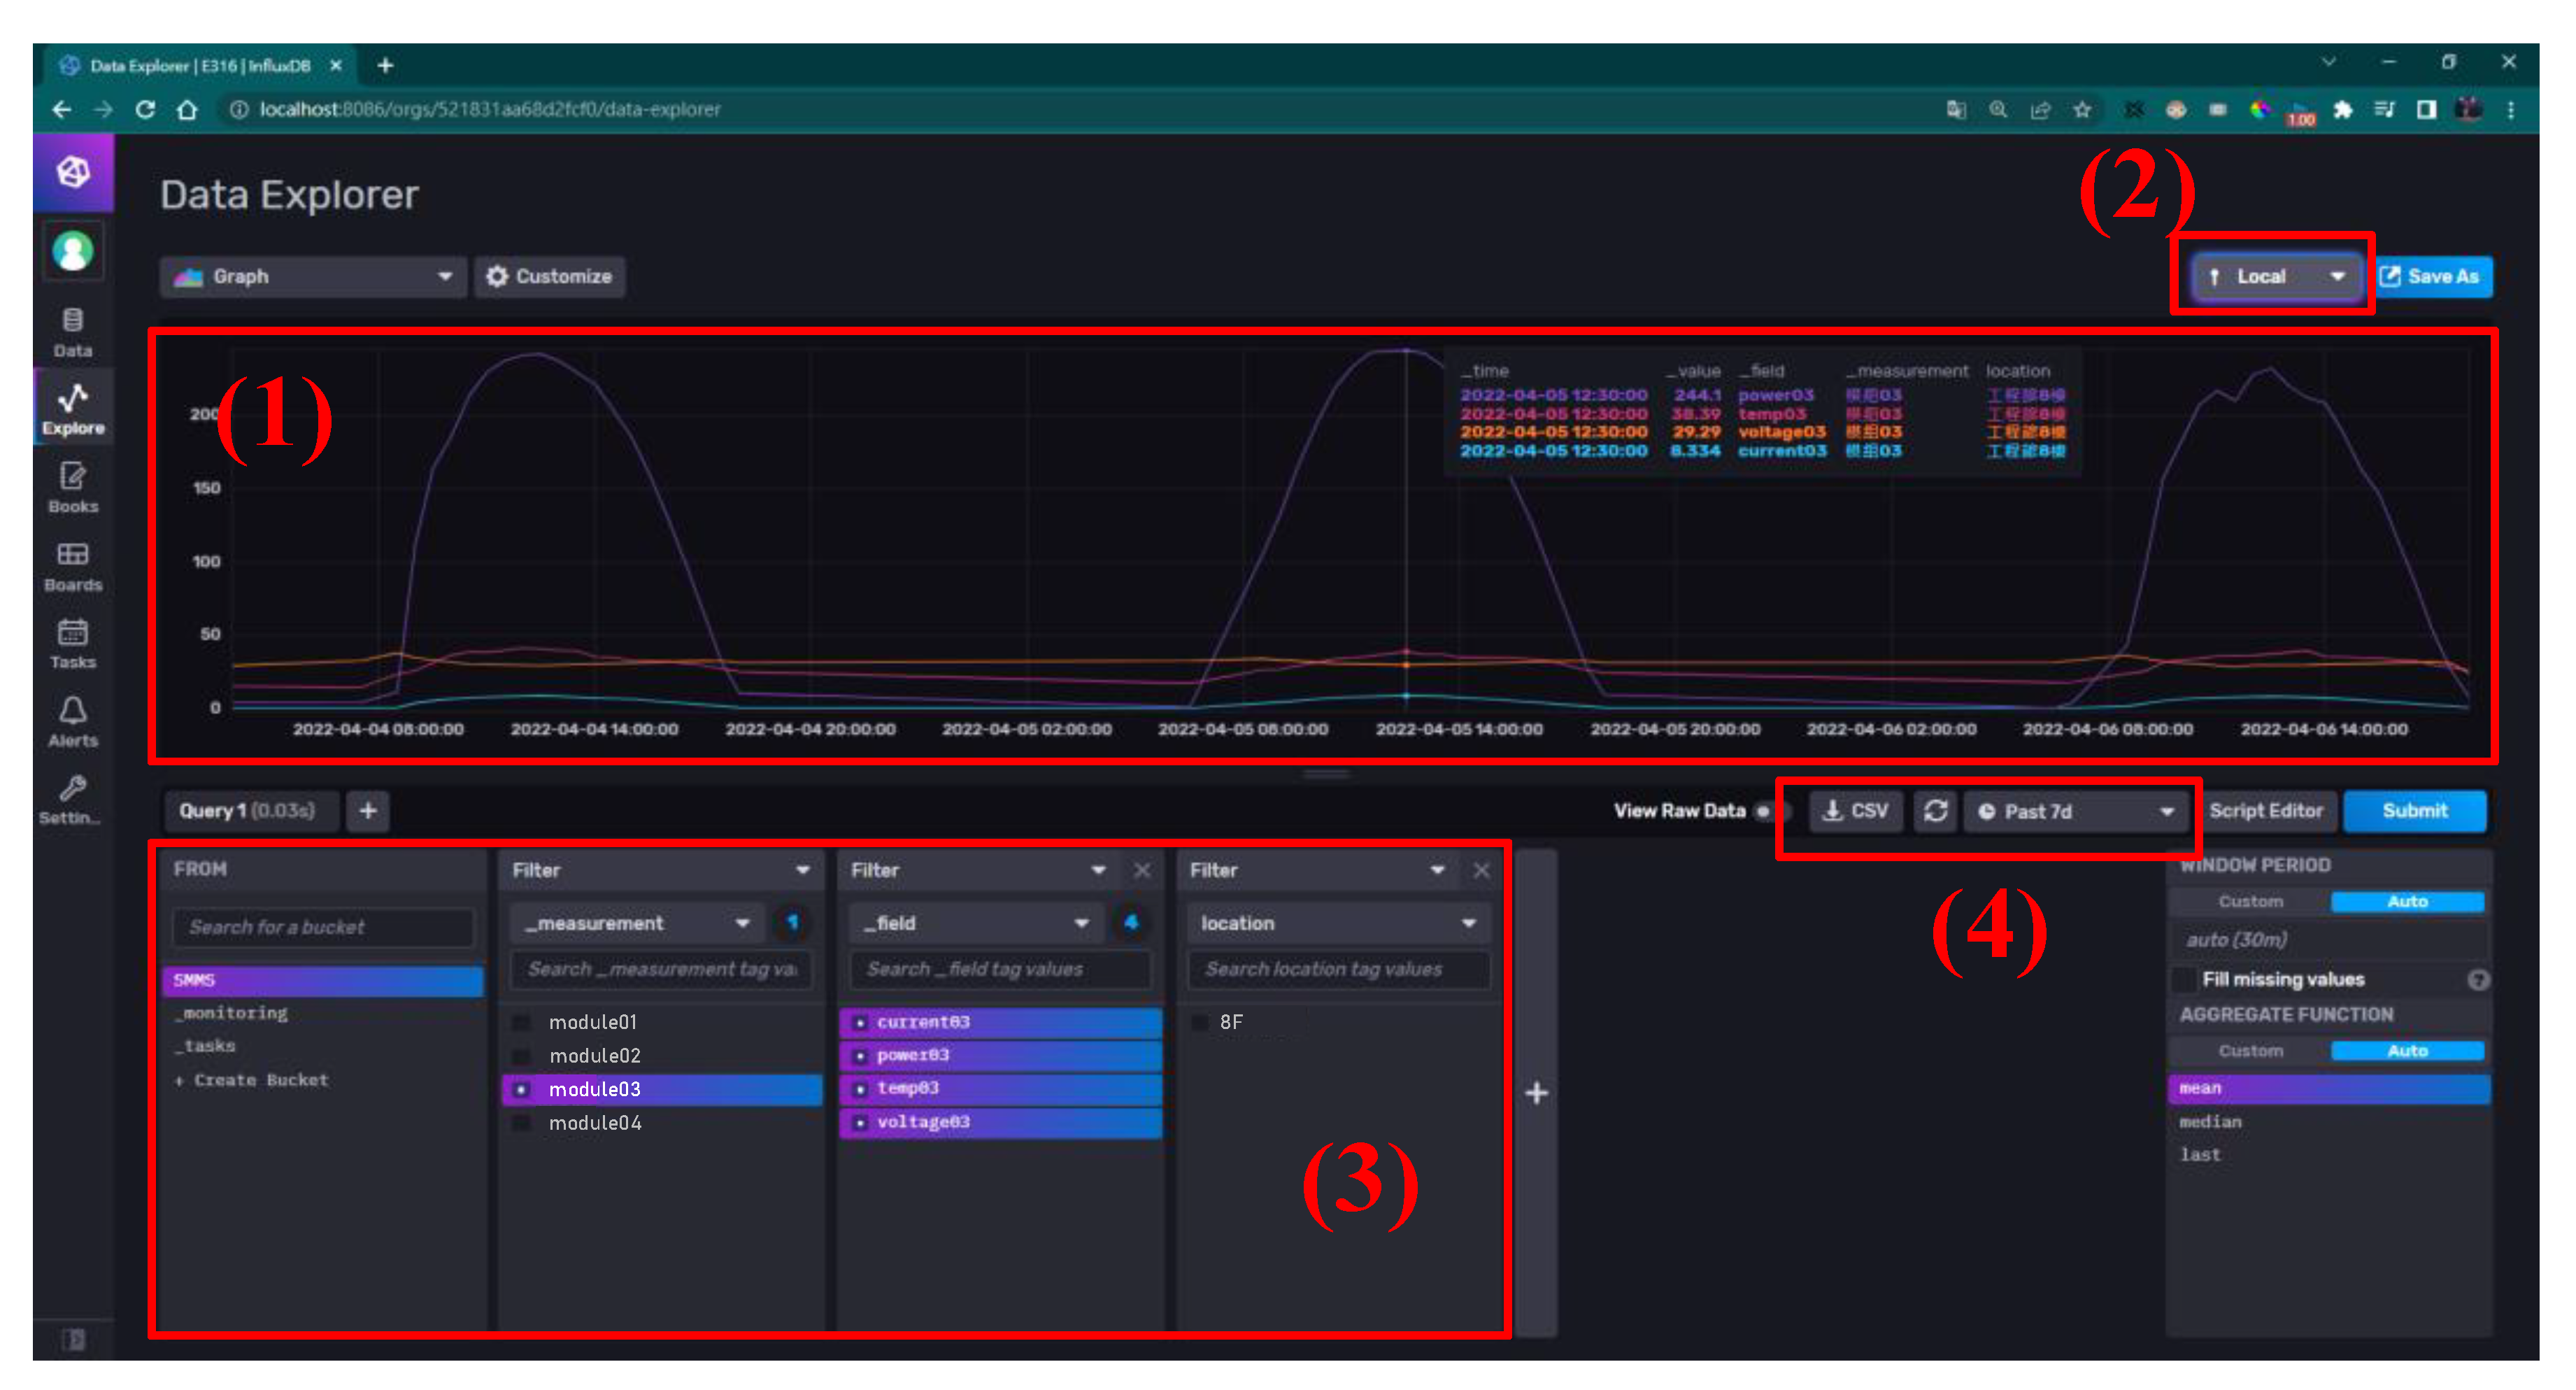
The database system operation interface used is as shown in Figure 17 InfluxDB 2.0 [18,19,20]. The advantages include full compatibility with time InfluxDB read-write protocol, which provides data migration function, monitoring of storage space, visualized data inspection frames, direct data output into Excel format, etc. In terms of the examination of collected data, the following four functions are used: (1) Time series visualized data ensures every data entry displays the corresponding receiving time; (2) Adjust the time format of data, which is divided into the user’s local time and Coordinated Universal Time (UTC); (3) Select the data type to read; (4) Select the Excel file (CSV file format) of selected data and adjust the data inspection time. Data for the last 30 days can be accessed at a time.
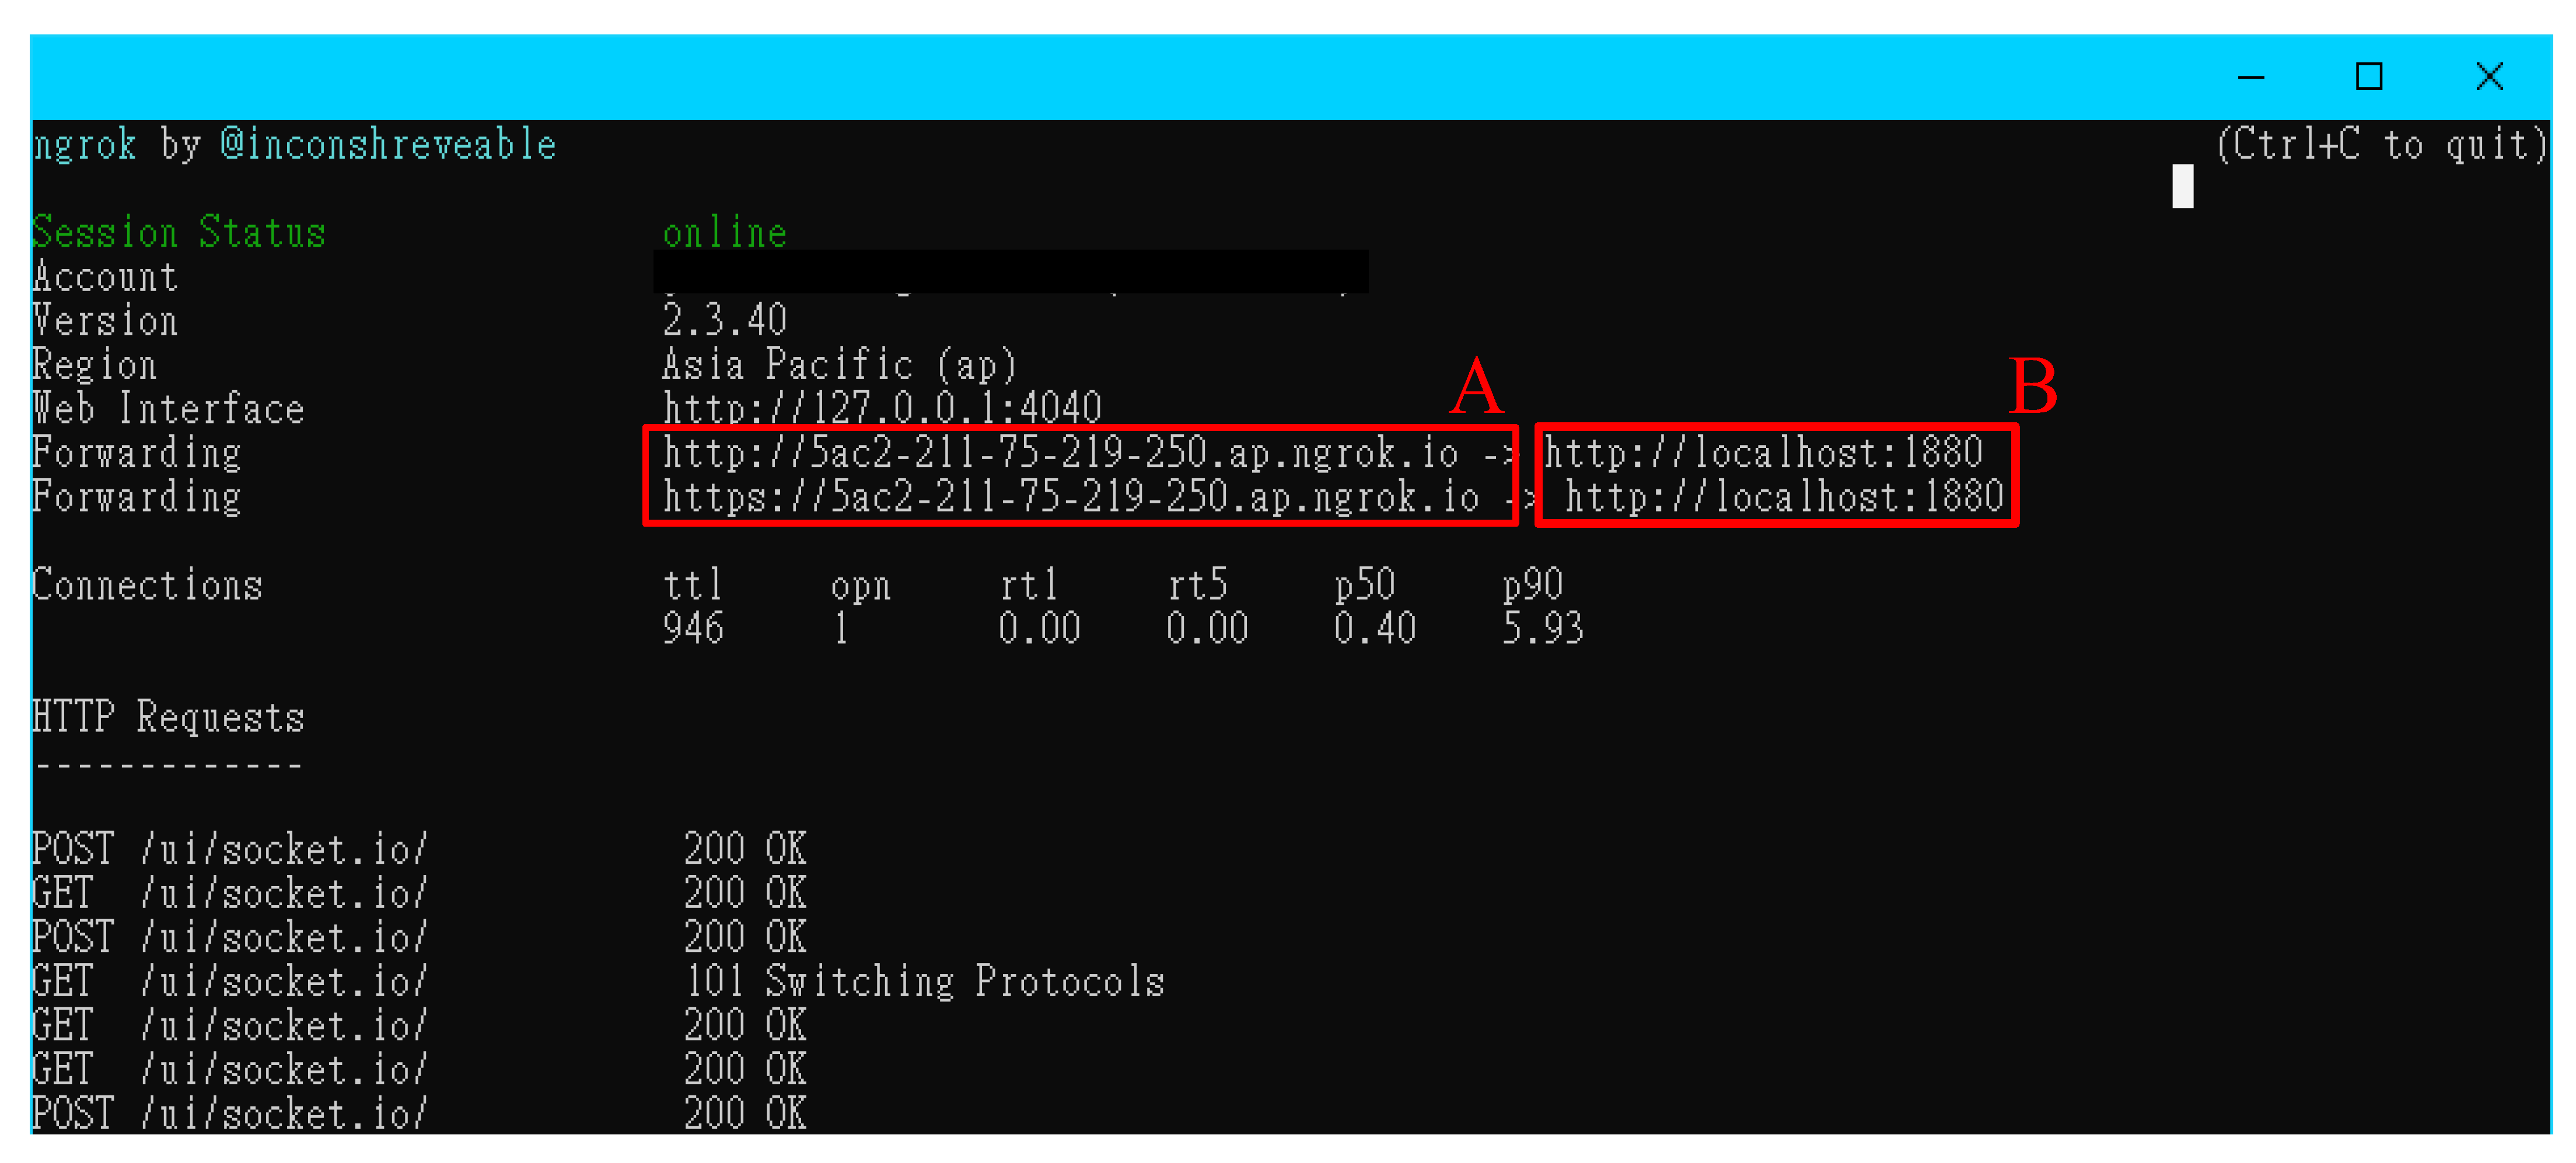
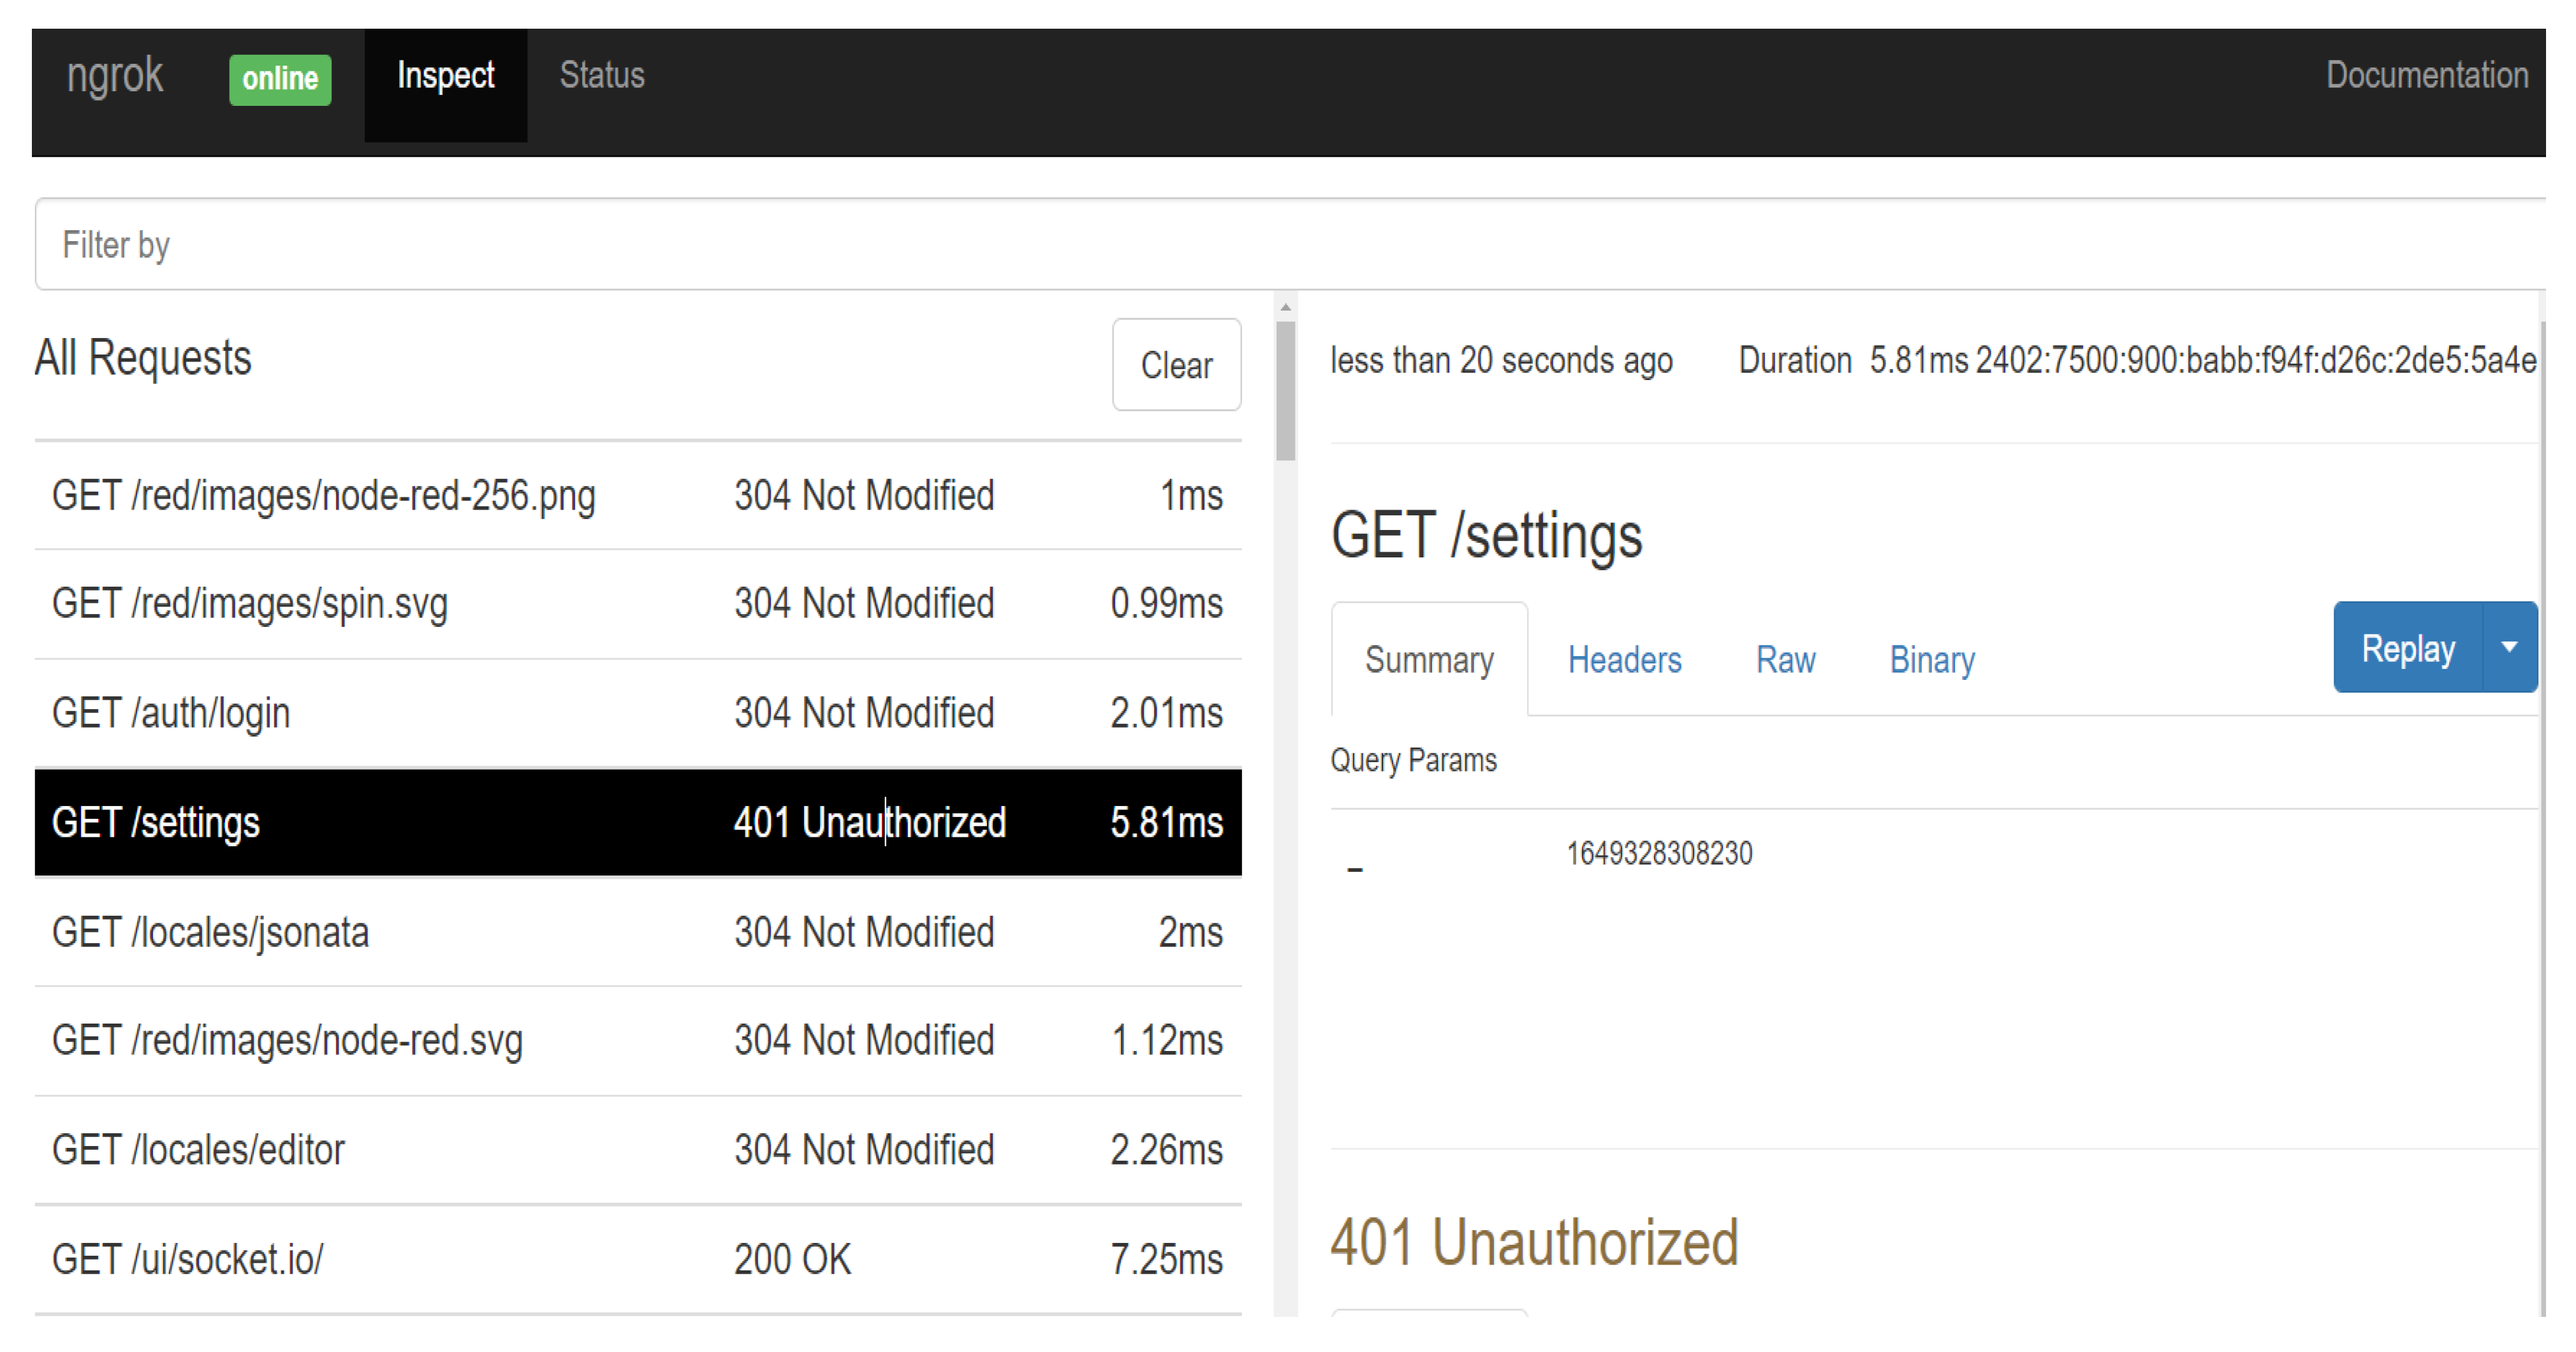
Node-RED [15] and InfluxDB 2.0 [20] databases used involve setting up the program in a local server computer. If other users are allowed to monitor data locally from a non-server computer, the Ngrok [24,25] is required. The programming interface is as shown in Figure 18. This programming falls under reverse proxy services. An external network may cross the firewall to access a specific port on local server computers by the URL generated by the system. The box marked A is the URL that re-directs the port of a local server computer through Ngrok. By connecting to this URL, the external network will be able to log-in to the Node-RED interface of the local server host; the box marked B is the internal protocol port: 1880 provided to Ngrok by the local server computer. The Ngrok monitoring window interface in Figure 19 can also be used to monitor the status of the connected user, if the user has passed password verification, and connection status.
3. Experimental Results
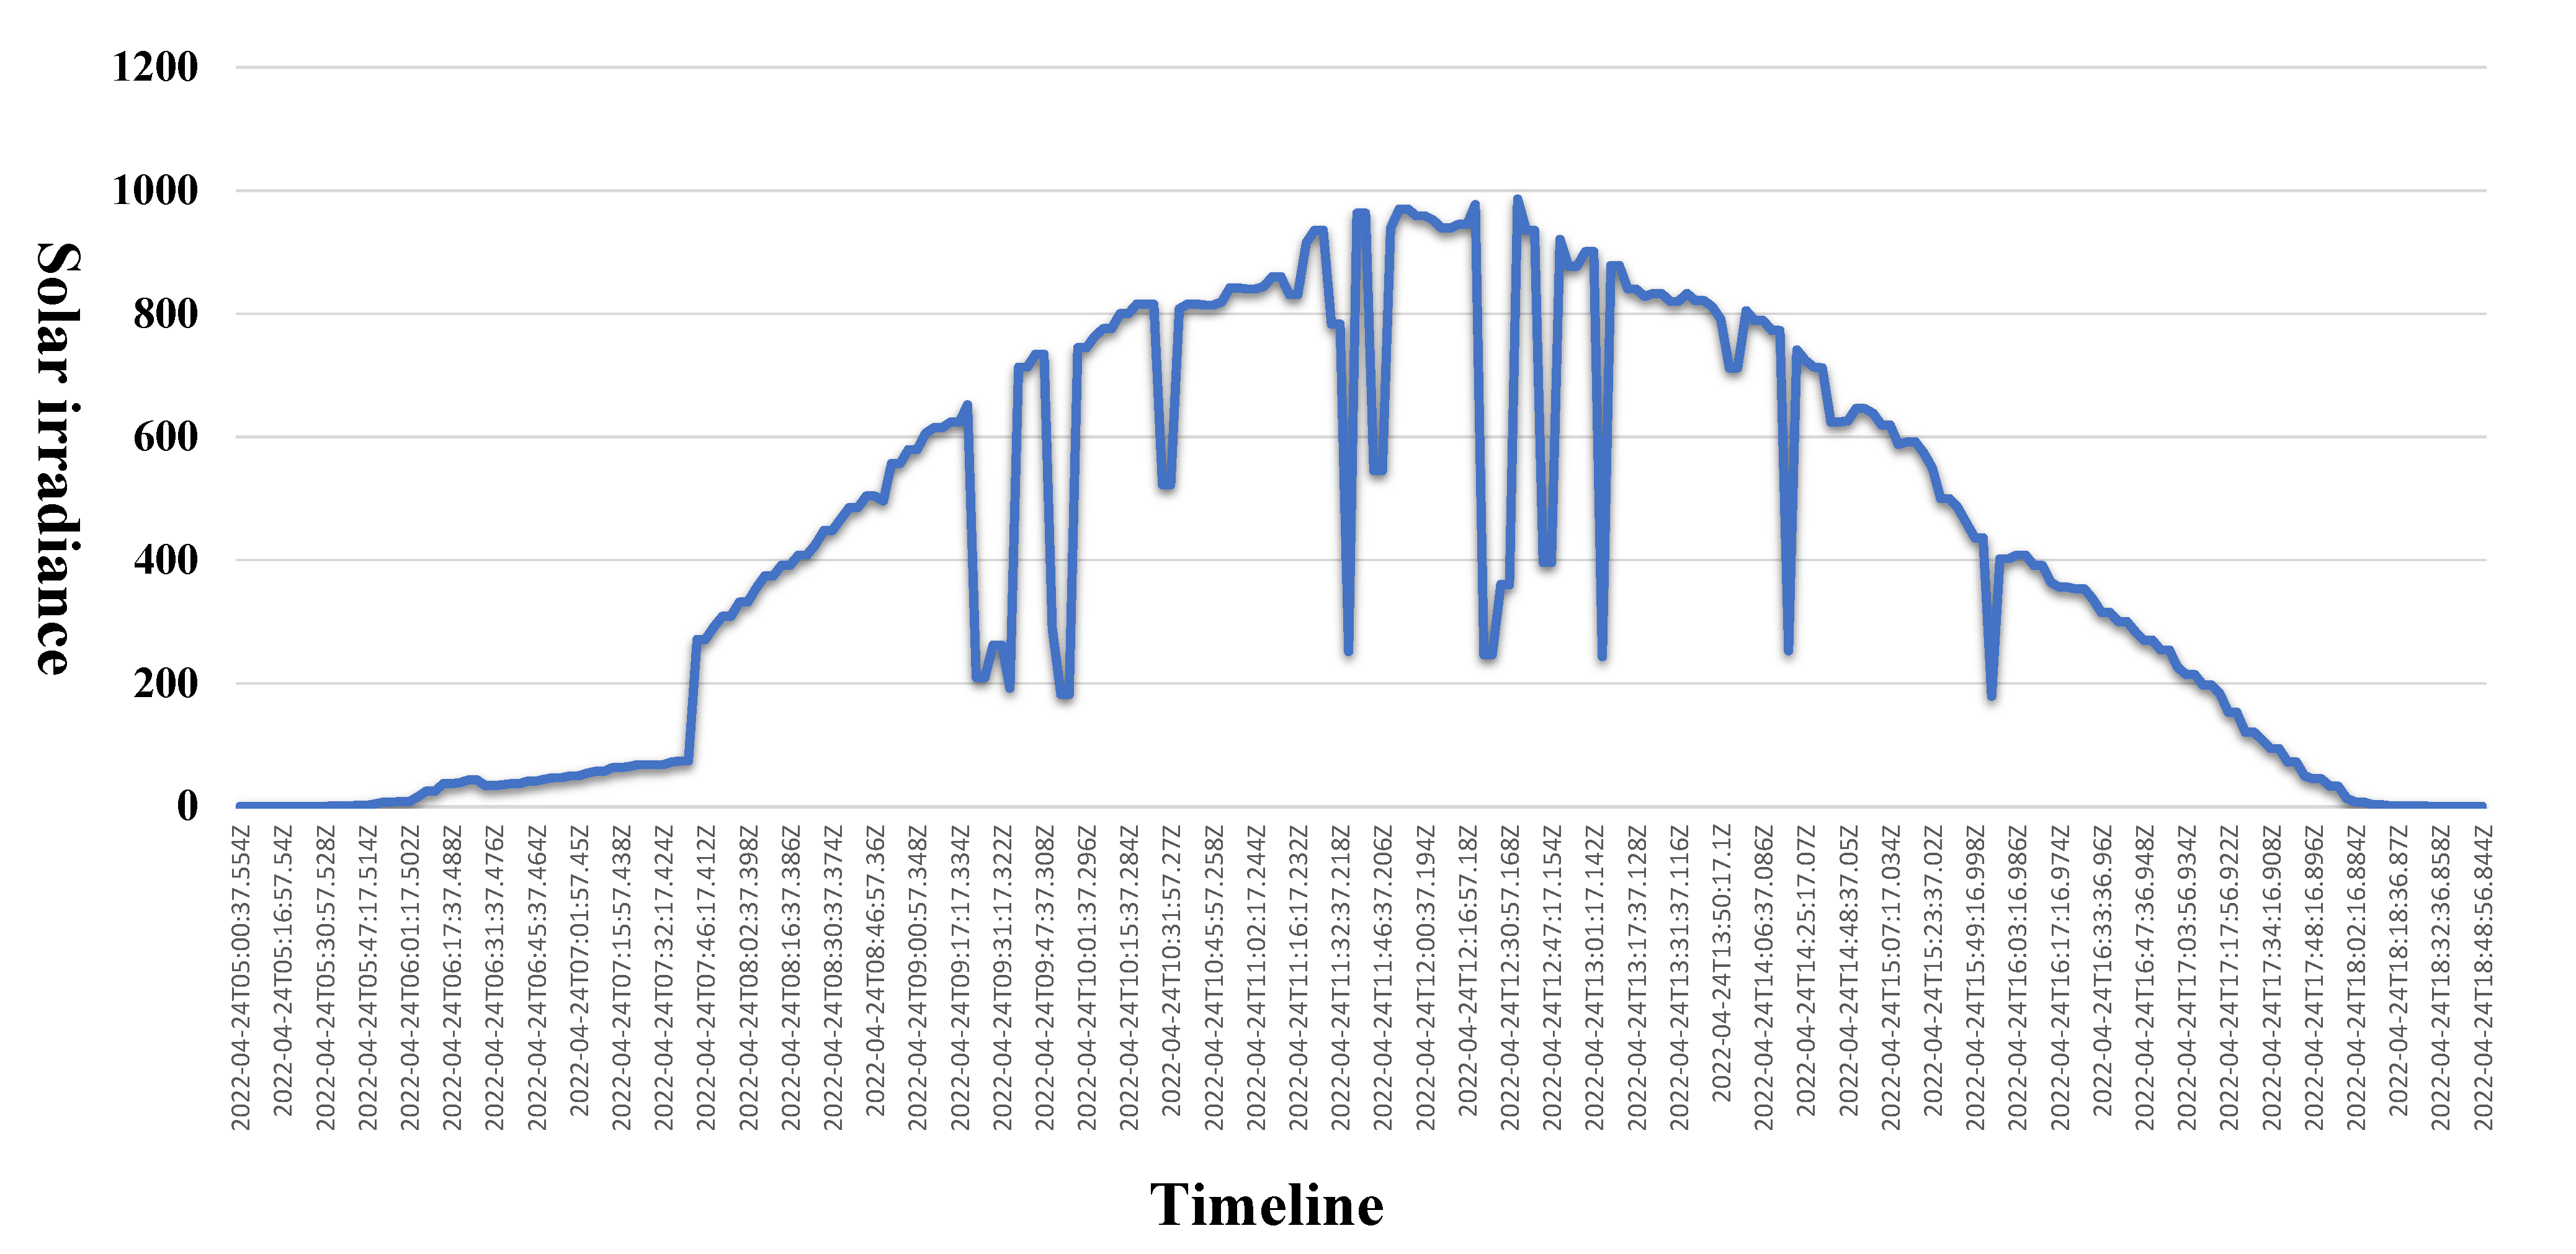
In case some modules in the photovoltaic module array are shaded or faulty, the P-V output characteristic curve will show a multi-peak phenomenon [35]. In order to verify the precision measured by the fault detection module and the reliability of data sent back by the system, the three different shading conditions shown in Table 2 were tested. The PM060MW2_300 PV module produced by AU Optronics Corporation (AUO) was adopted, which was connected in four series and one parallel. Then, the first and second PV modules under shaded conditions were tested. The parameter values of the PV modules under the standard test conditions (STC) are as shown in Table 3. The waveform in Figure 20 shows the changes in the amount of sunshine on the day of the test. The diagram shows intense changes in irradiance within a short period of time.
- (1)
- Case 1: four series and one parallel (0% shading + 0% shading + 0% shading + 0% shading)
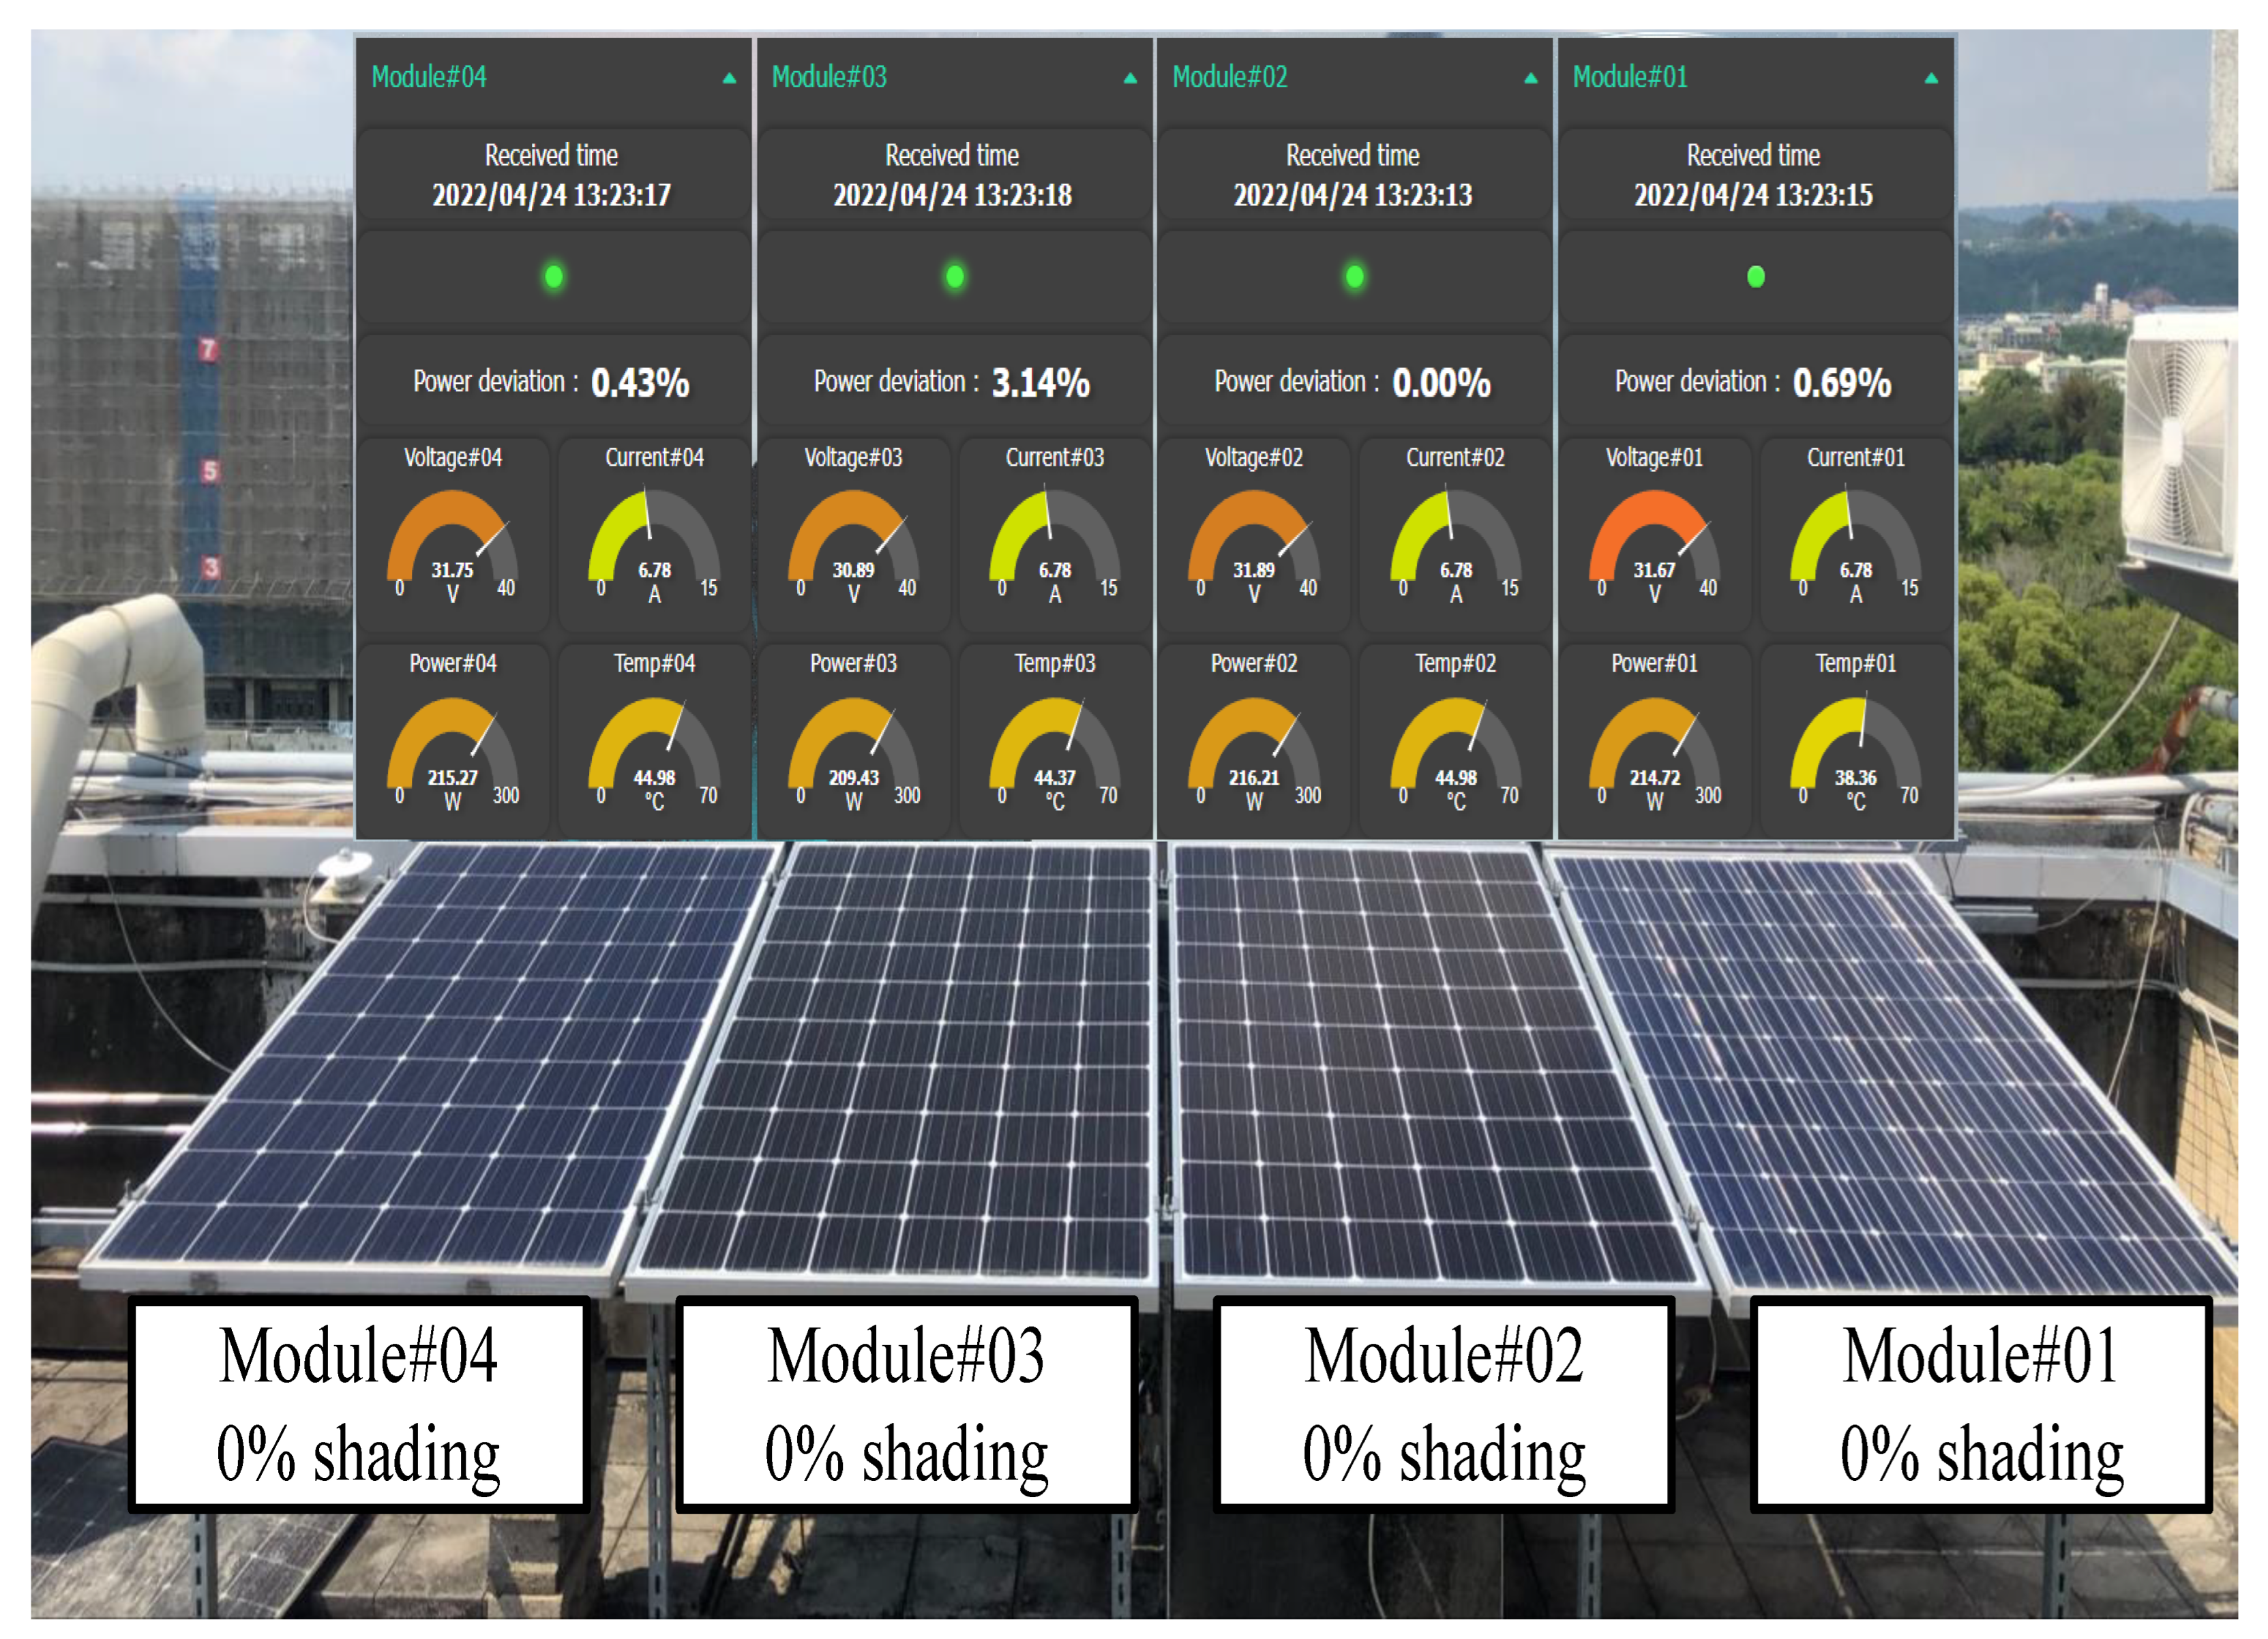
Case 1 shows four PV modules operating normally with no shading. Figure 21 shows the situational diagram of the PV module case site and the comparison diagram of data measured in the same time frame displayed on the Node-RED dashboard. The data displayed on the Node-RED dashboard shows four indicator lights were green, indicating the respective modules were operating normally.
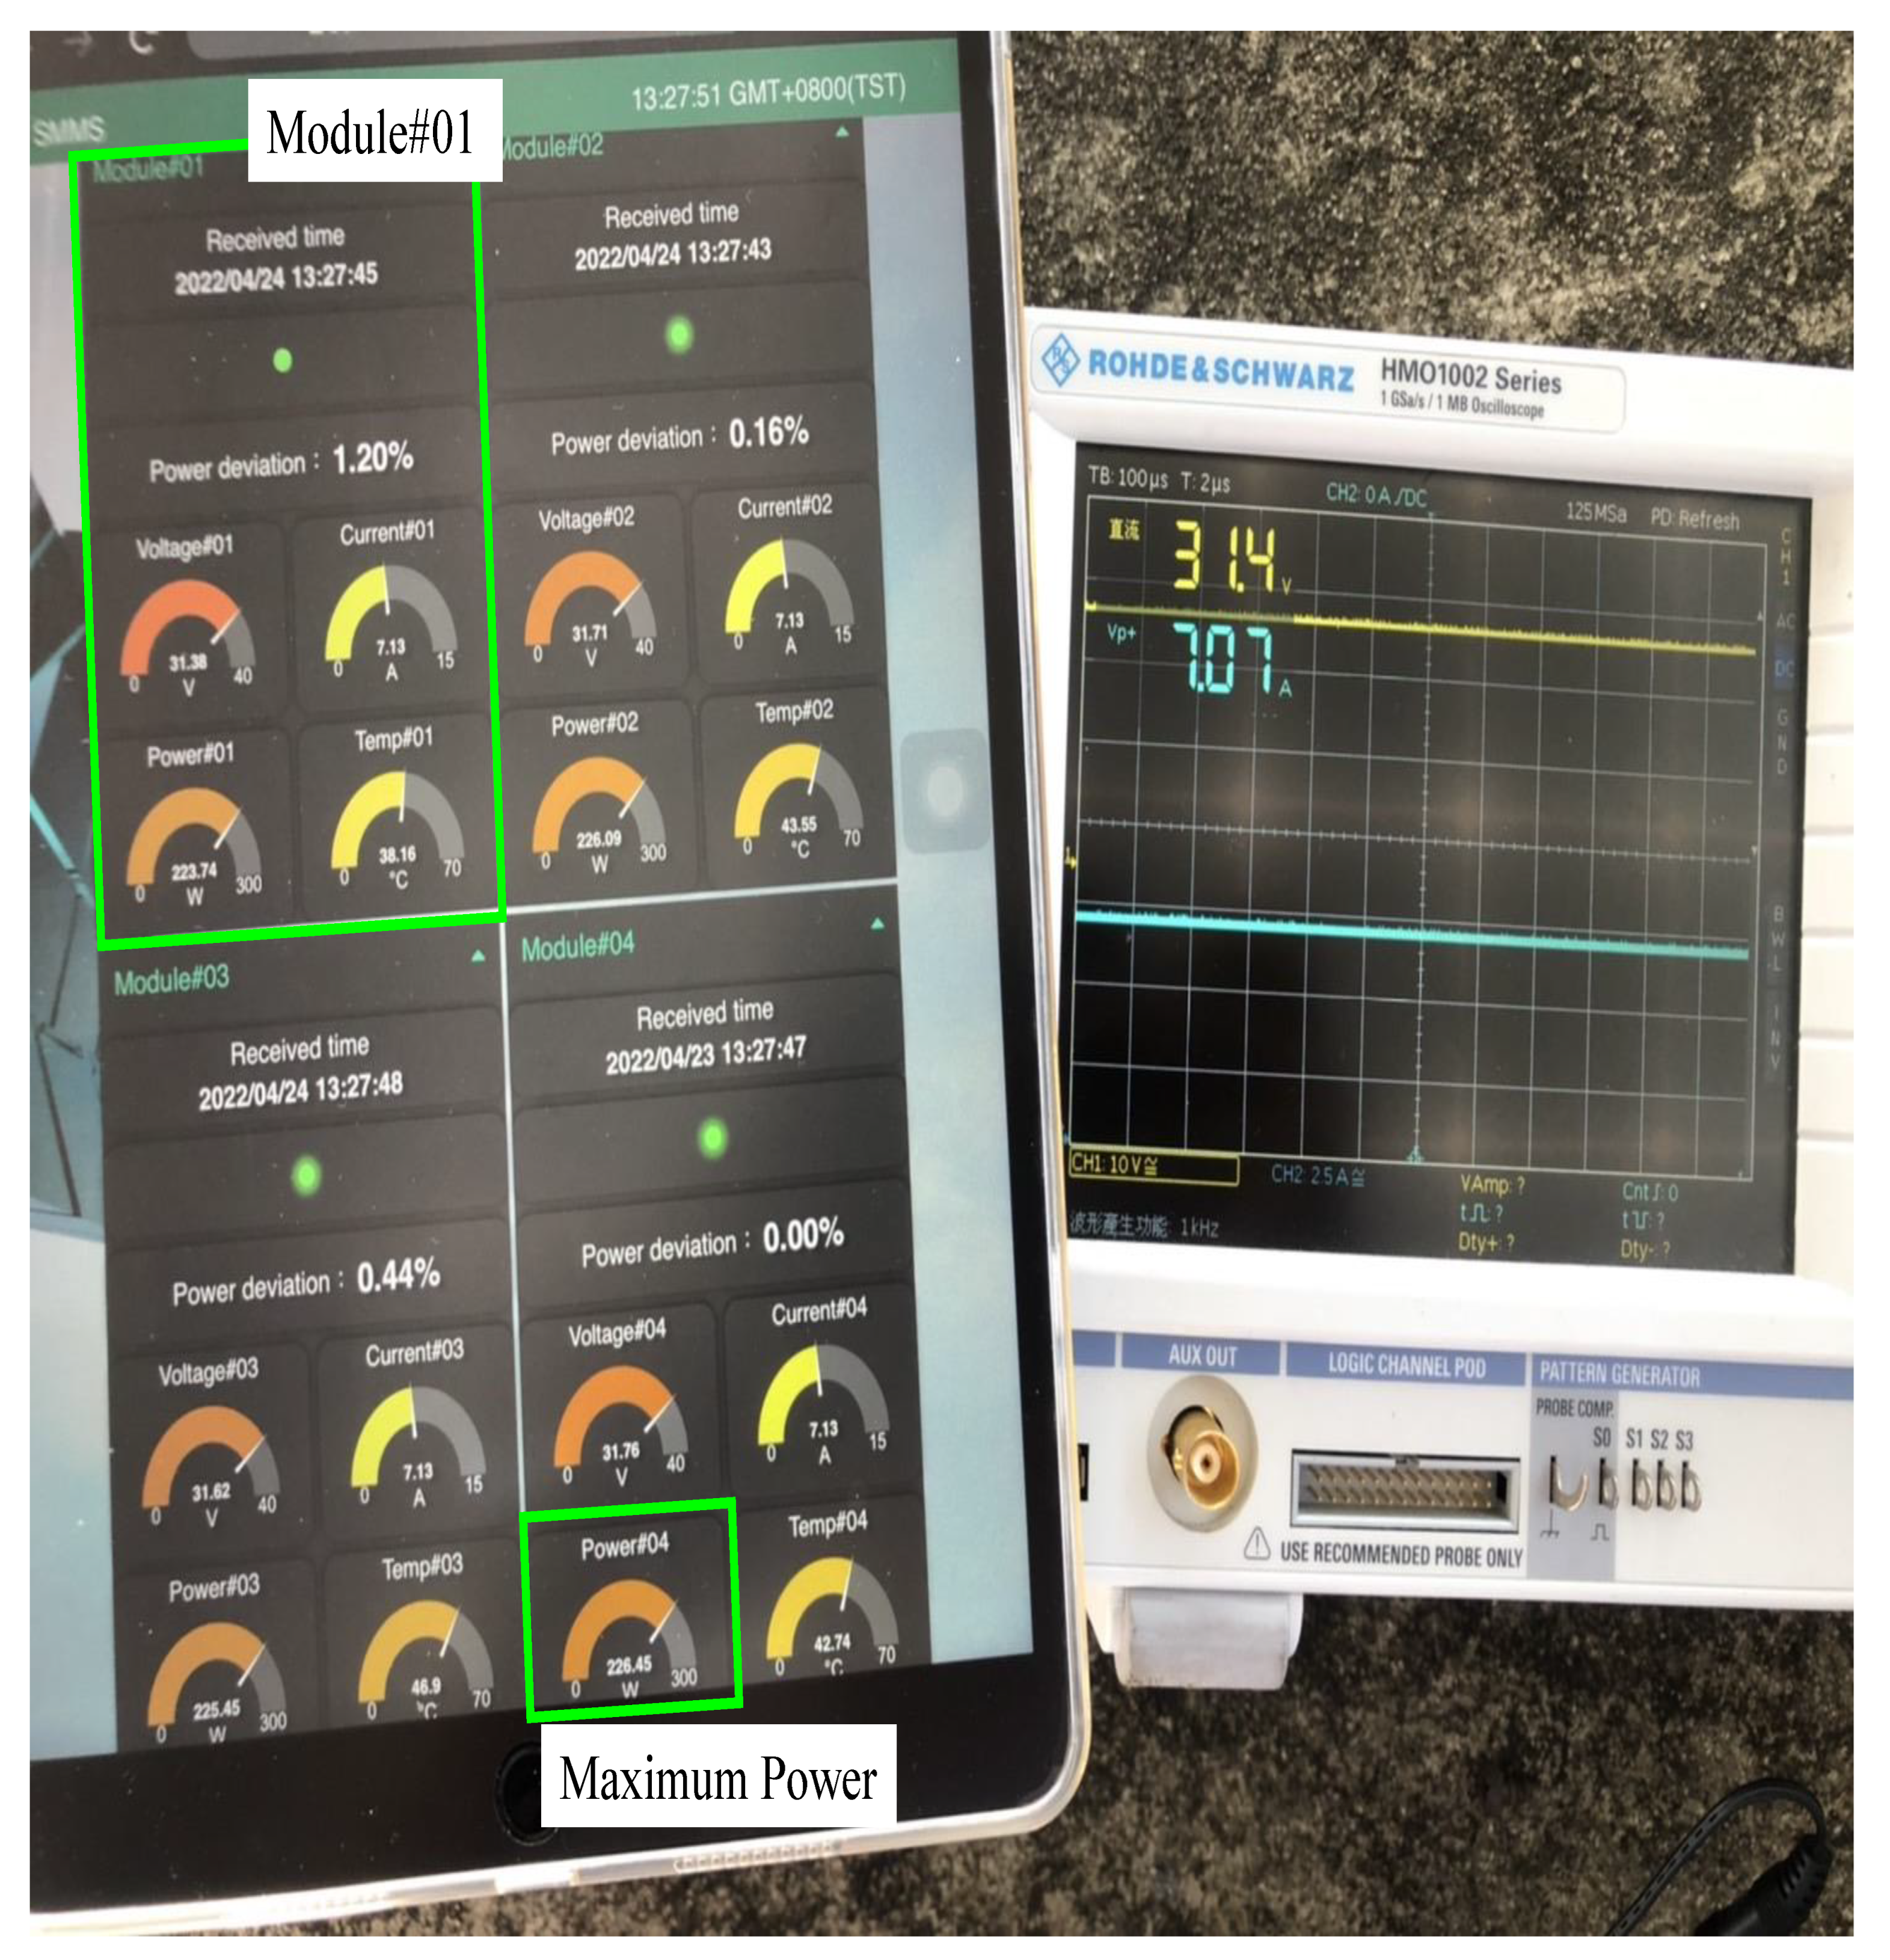
In order to compare the accuracy of the values sent back by the fault detection module, Figure 22 shows data in the PV module, Module#01, measured through an oscilloscope and the values displayed by the Node-RED dashboard in the same time frame. The Module#01 voltage displayed on the Node-RED dashboard was 31.38 V, the current was 7.13 A, and the power was 223.74 W. The power difference ratio of 1.20% was calculated from the module with the maximum output power of 226.45 W among the four modules by Equation (3). The displayed voltage directly measured through the oscilloscope was 31.4 V, and the current was 7.07 A. The data measured by the fault detection module and the data directly measured by the oscilloscope had a voltage error of only 0.064% and the current error of 0.849%. This indicates that the sensor of the fault detection module, the analog/digital converter of the microcontroller unit, and the data transmission system possessed a high degree of accuracy and reliability.
- (2)
- Case 2: four series one parallel (30% shading + 0% shading + 0% shading + 0% shading)
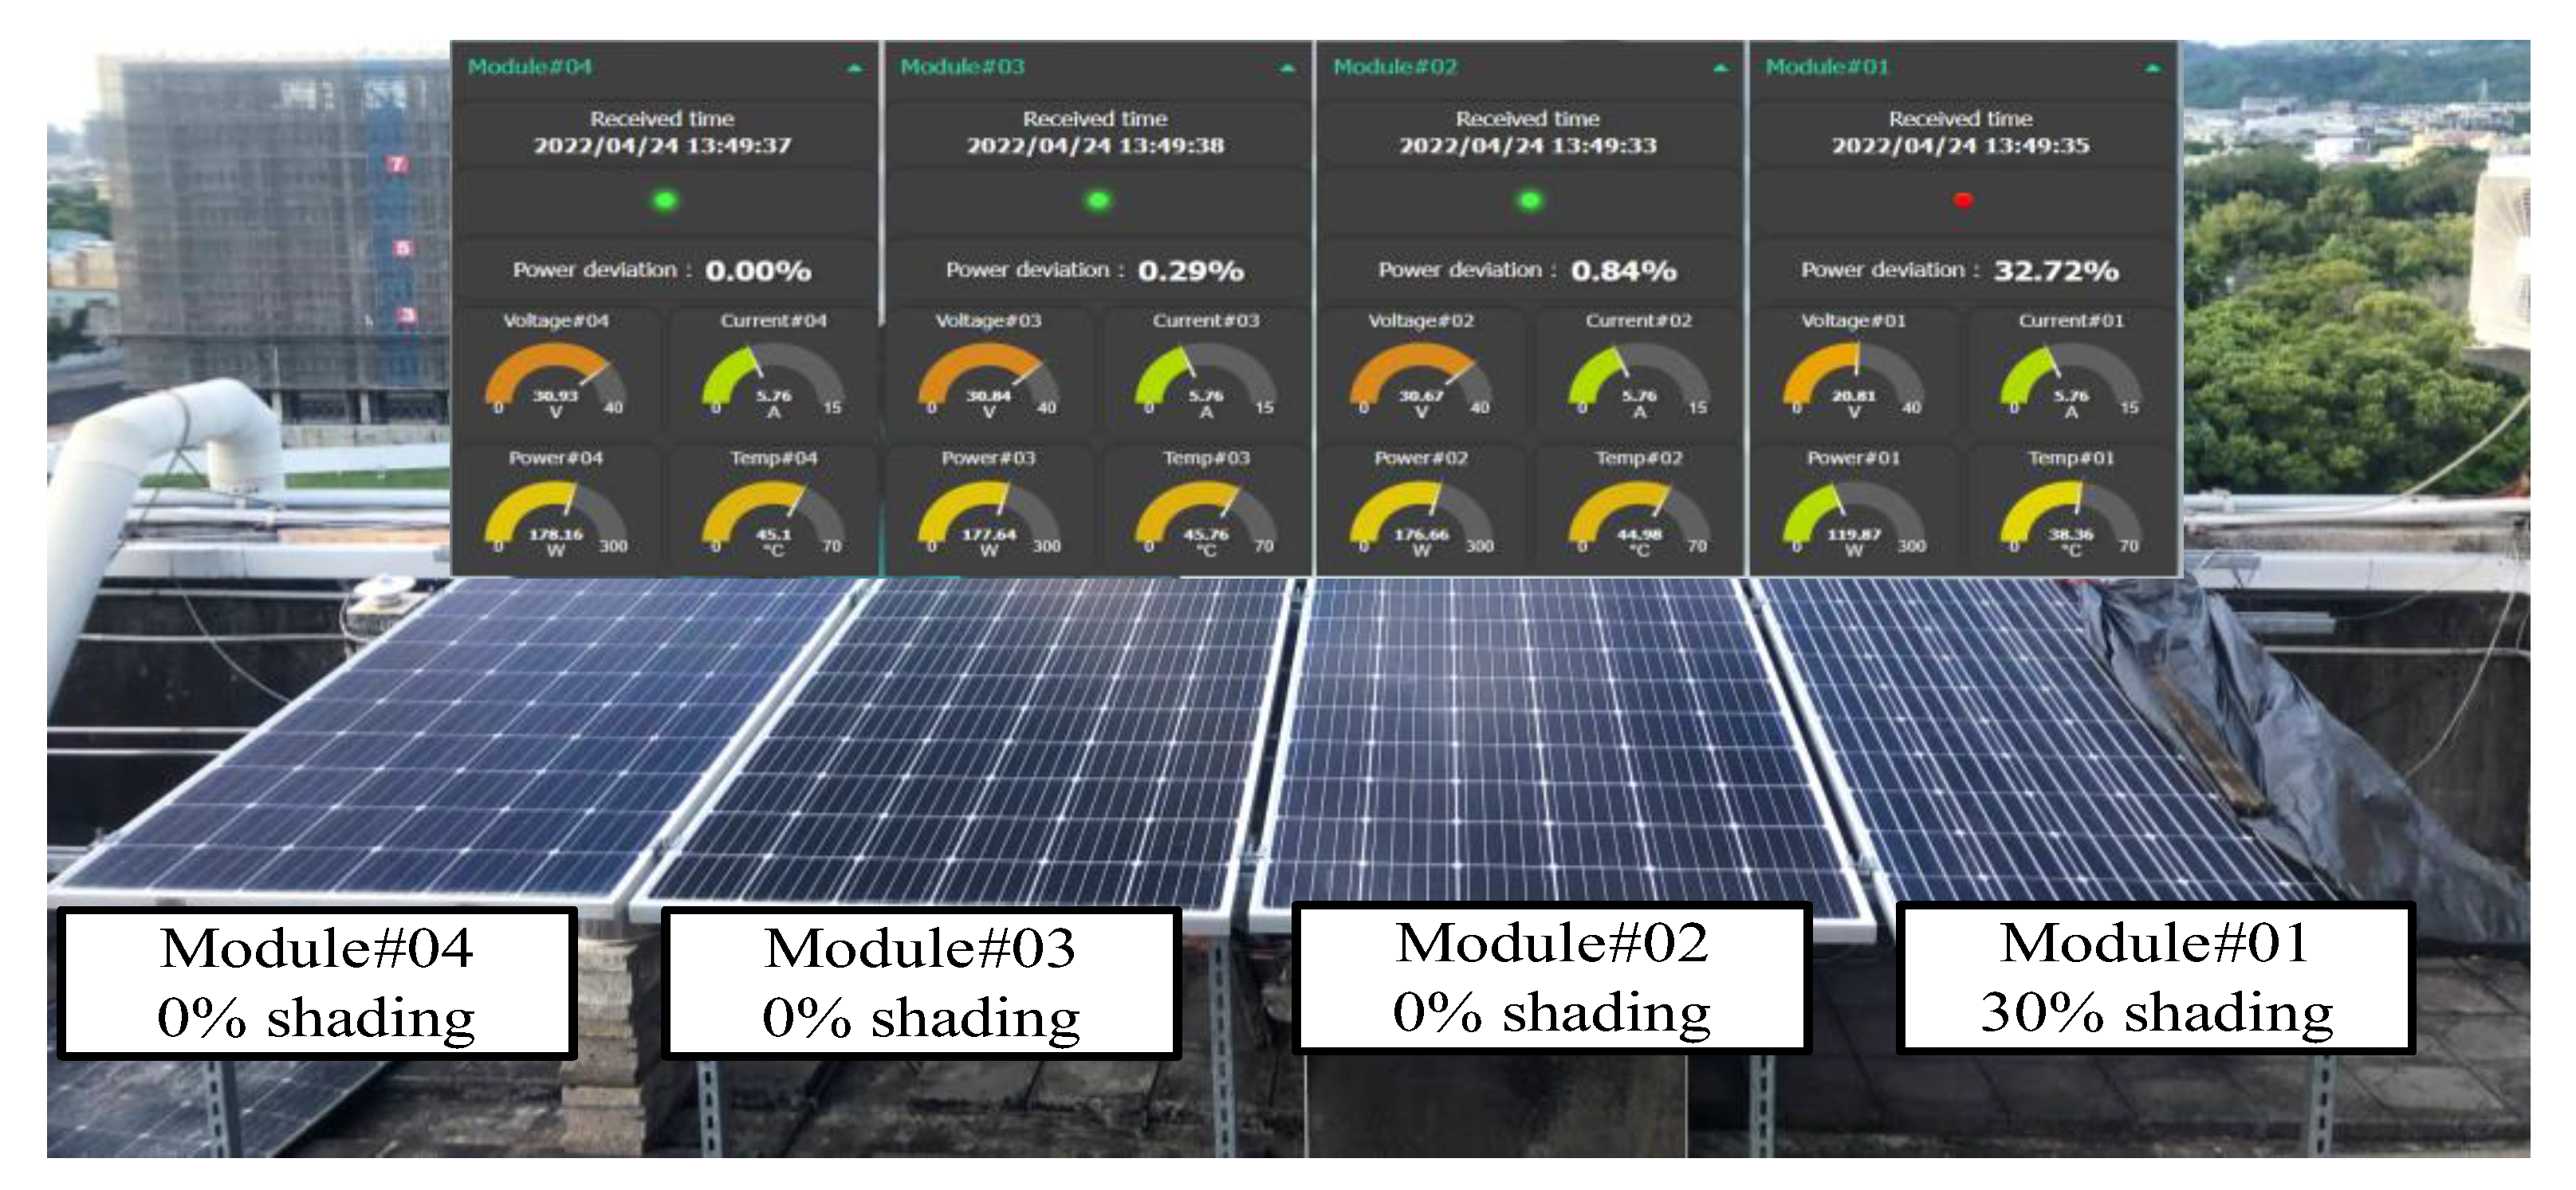
Case 2 shows the situation of Module#01 with 30% shading in the PV module series. During the test, black plastic was used to cover one-third of the area of a single PV module in order to simulate 30% shading of the PV module. From the data observed in Figure 23 Node-RED dashboard frame, Module#01 had a red indicator light, which represented the module’s power error value at the time exceeded 5%. A warning alert was sent via Line-Notify at the same time to notify repair personnel.
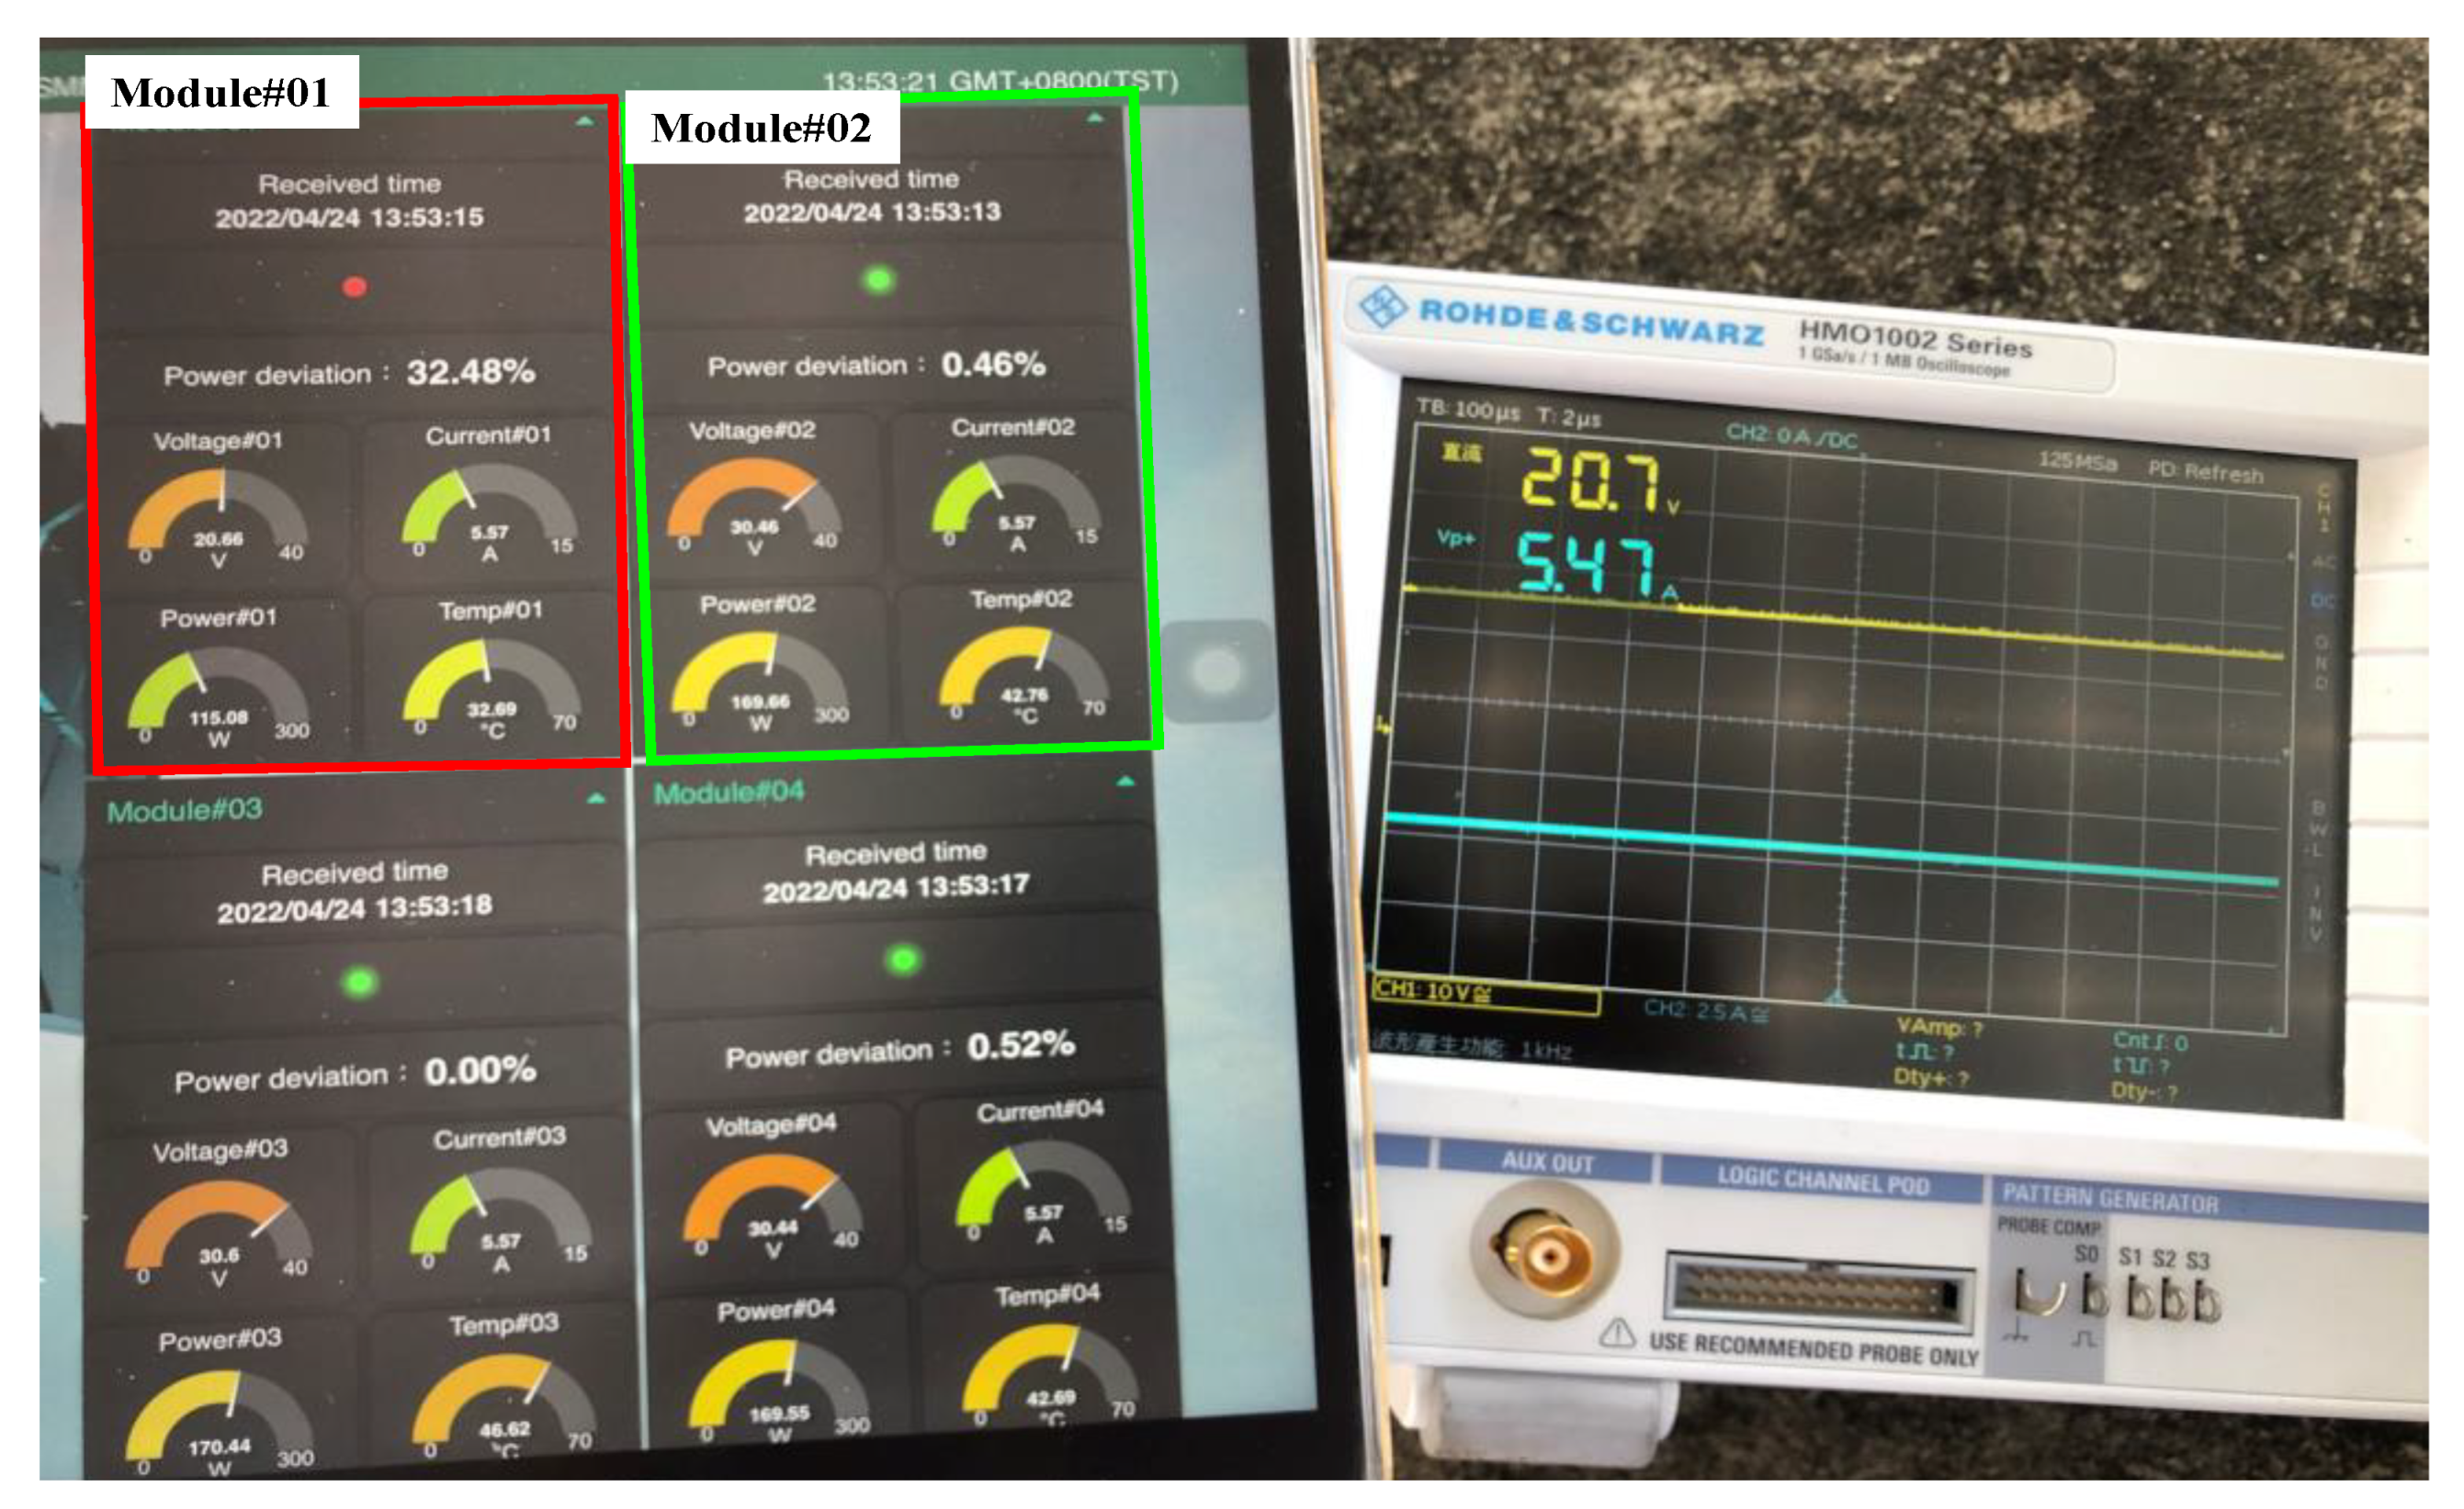
Figure 24 shows the comparison of 30% shaded Module#01 and unshaded Modue#2 through direct measurement using an oscilloscope and the values displayed by the Node-RED dashboard in the same time frame. From Figure 24, it can be observed that the 30% shaded Module#01 displayed on the Node-RED dashboard had a voltage of 20.66 V, a current of 5.57 A, and a power of 115.08 W. In Module#03, the output power and output maximum power were 170.44 W, and the power difference ratio calculated through Equation (3) was 32.48%. The difference ratio was greater than the set value of 5%. Thus, it was determined that Module#01 was the module working abnormally. The power difference ratios of Module#02 and Module#04 only accounted for 0.46% and 0.52%, which were both lower than the set value of 5%. Thus, it was determined that both were modules working normally. In Module#01, through direct measurement using the oscilloscope, the voltage was 20.7V and the current was 5.47A. From the data measured by the fault detection module and data directly measured using the oscilloscope, the voltage error was only 0.193%, and the current error was only 1.795%. The four modules were connected in series. Hence, the current of all of the unshaded modules obtained from the Node-RED dashboard in Figure 24 was 5.57 A, which was the same as that of Module#01.
- (3)
- Case 3: four series one parallel (30% shading + 100% shading + 0% shading + 0% shading)
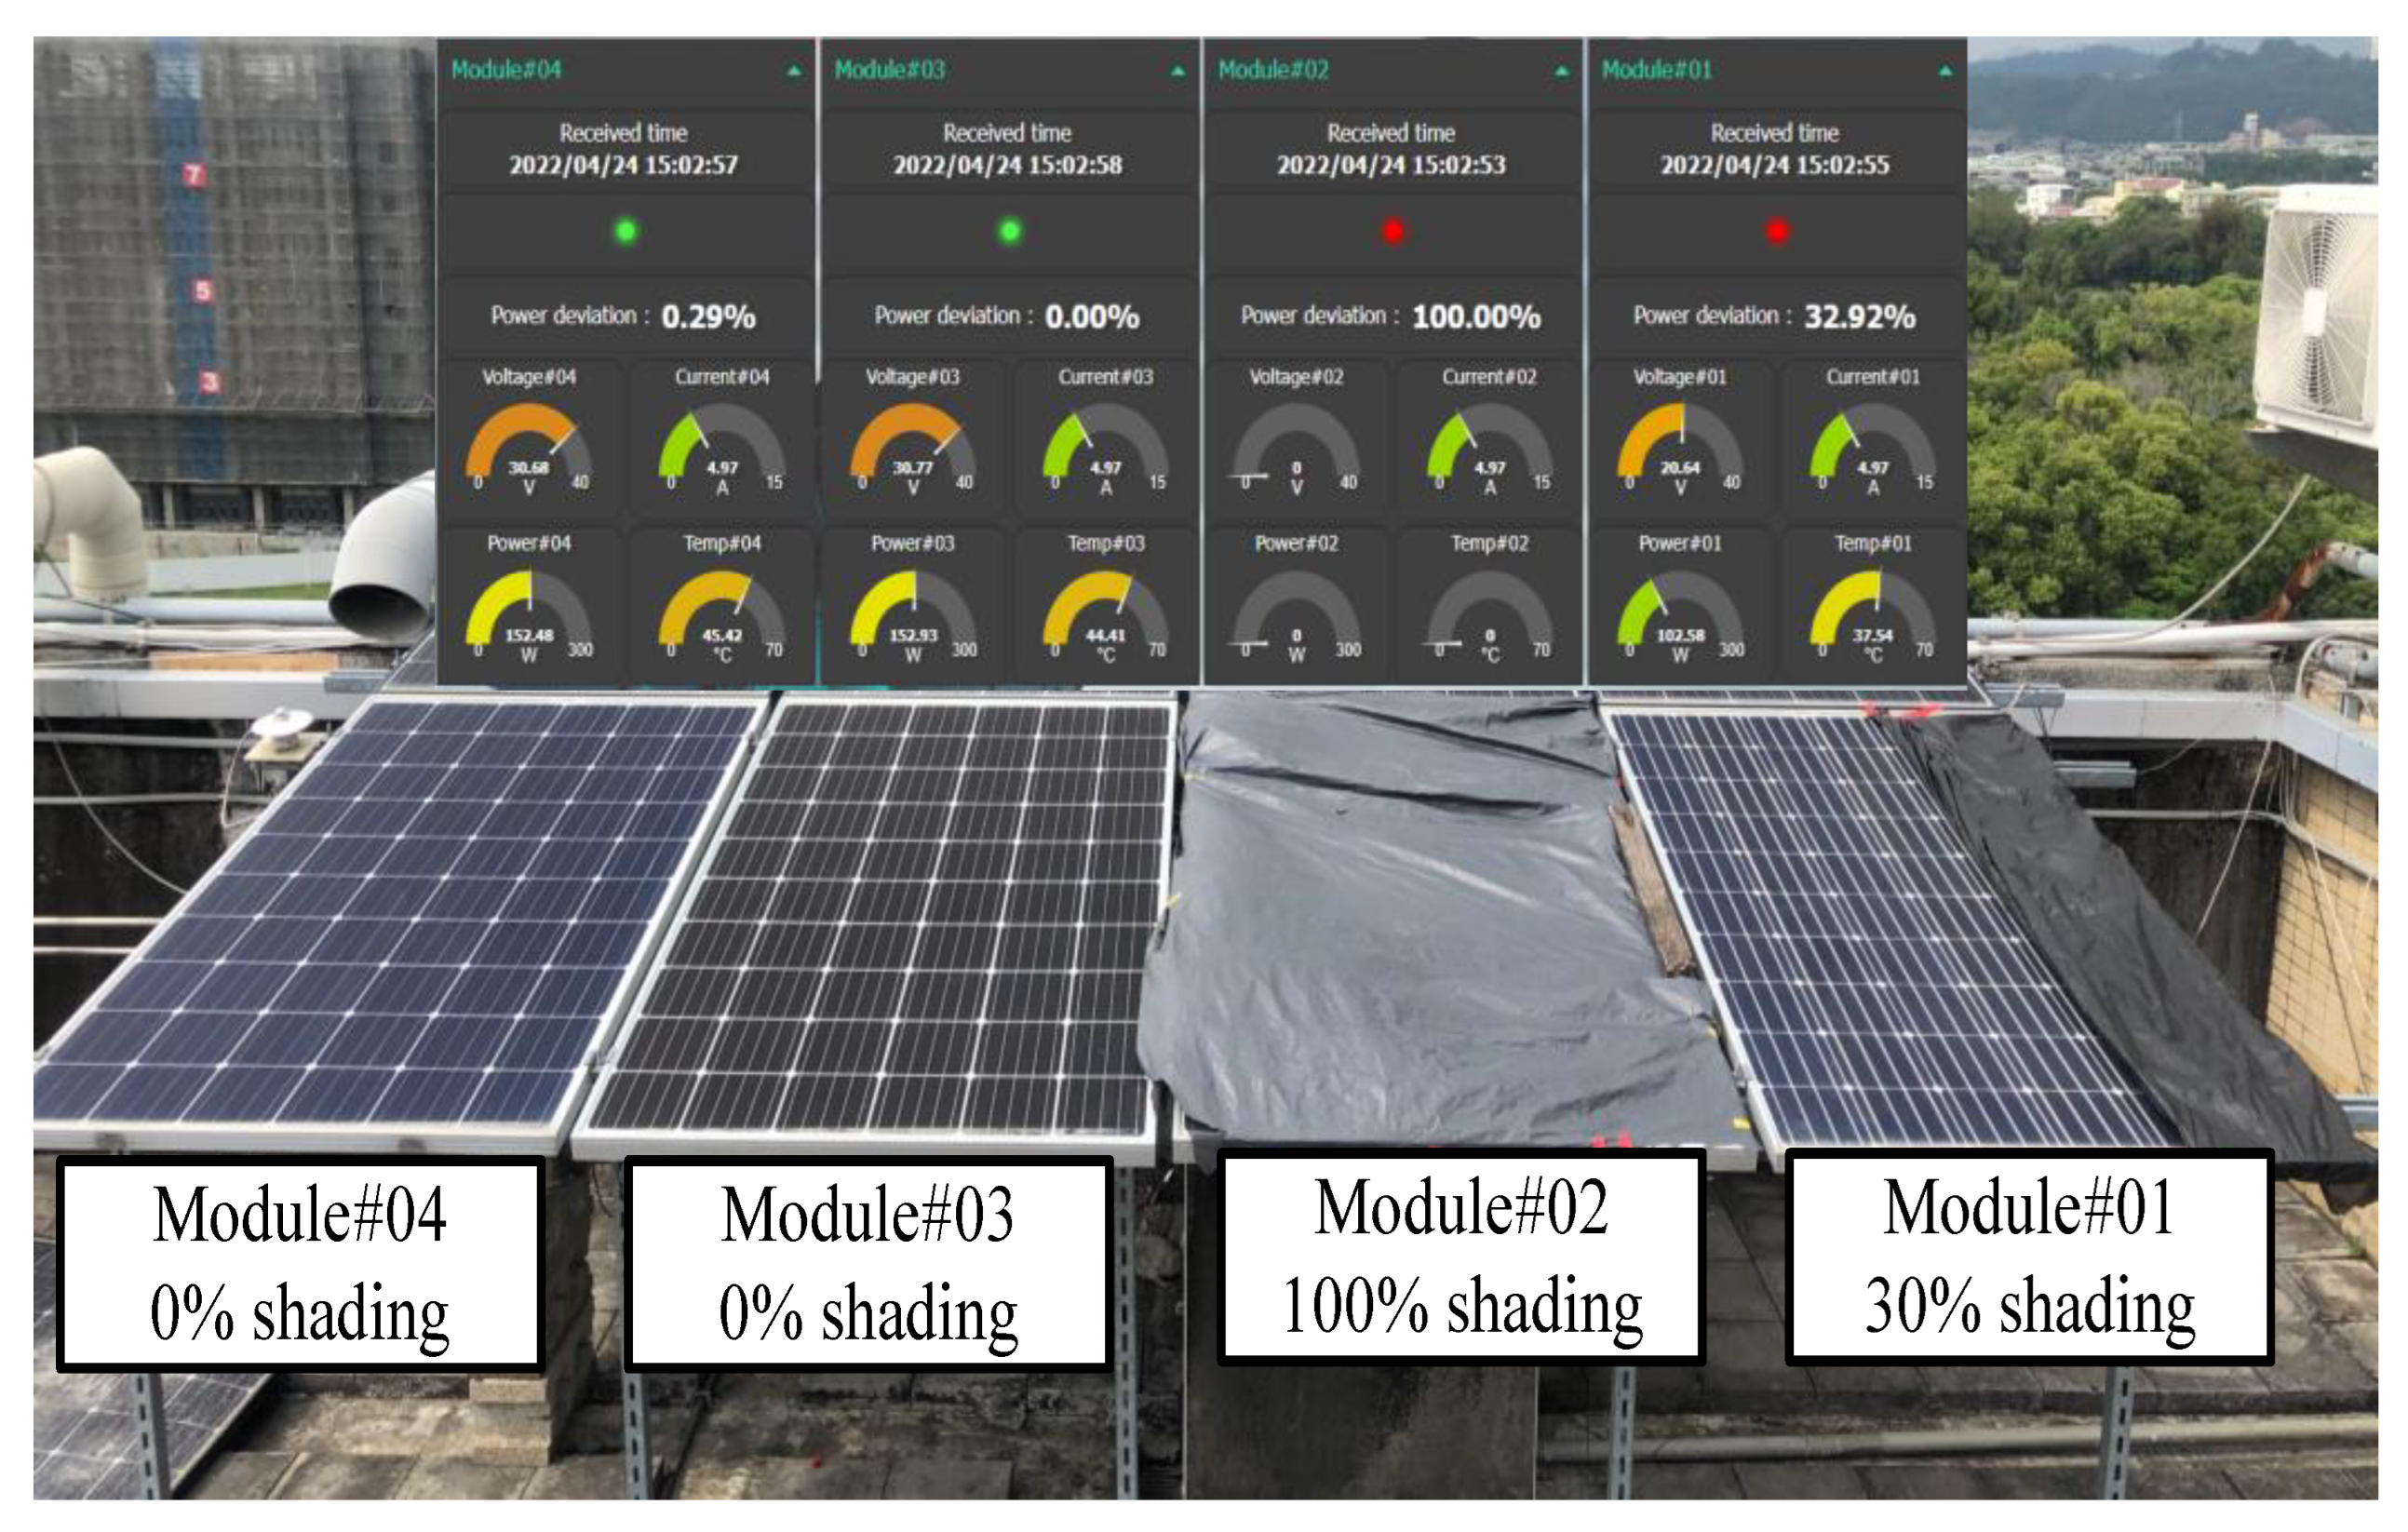
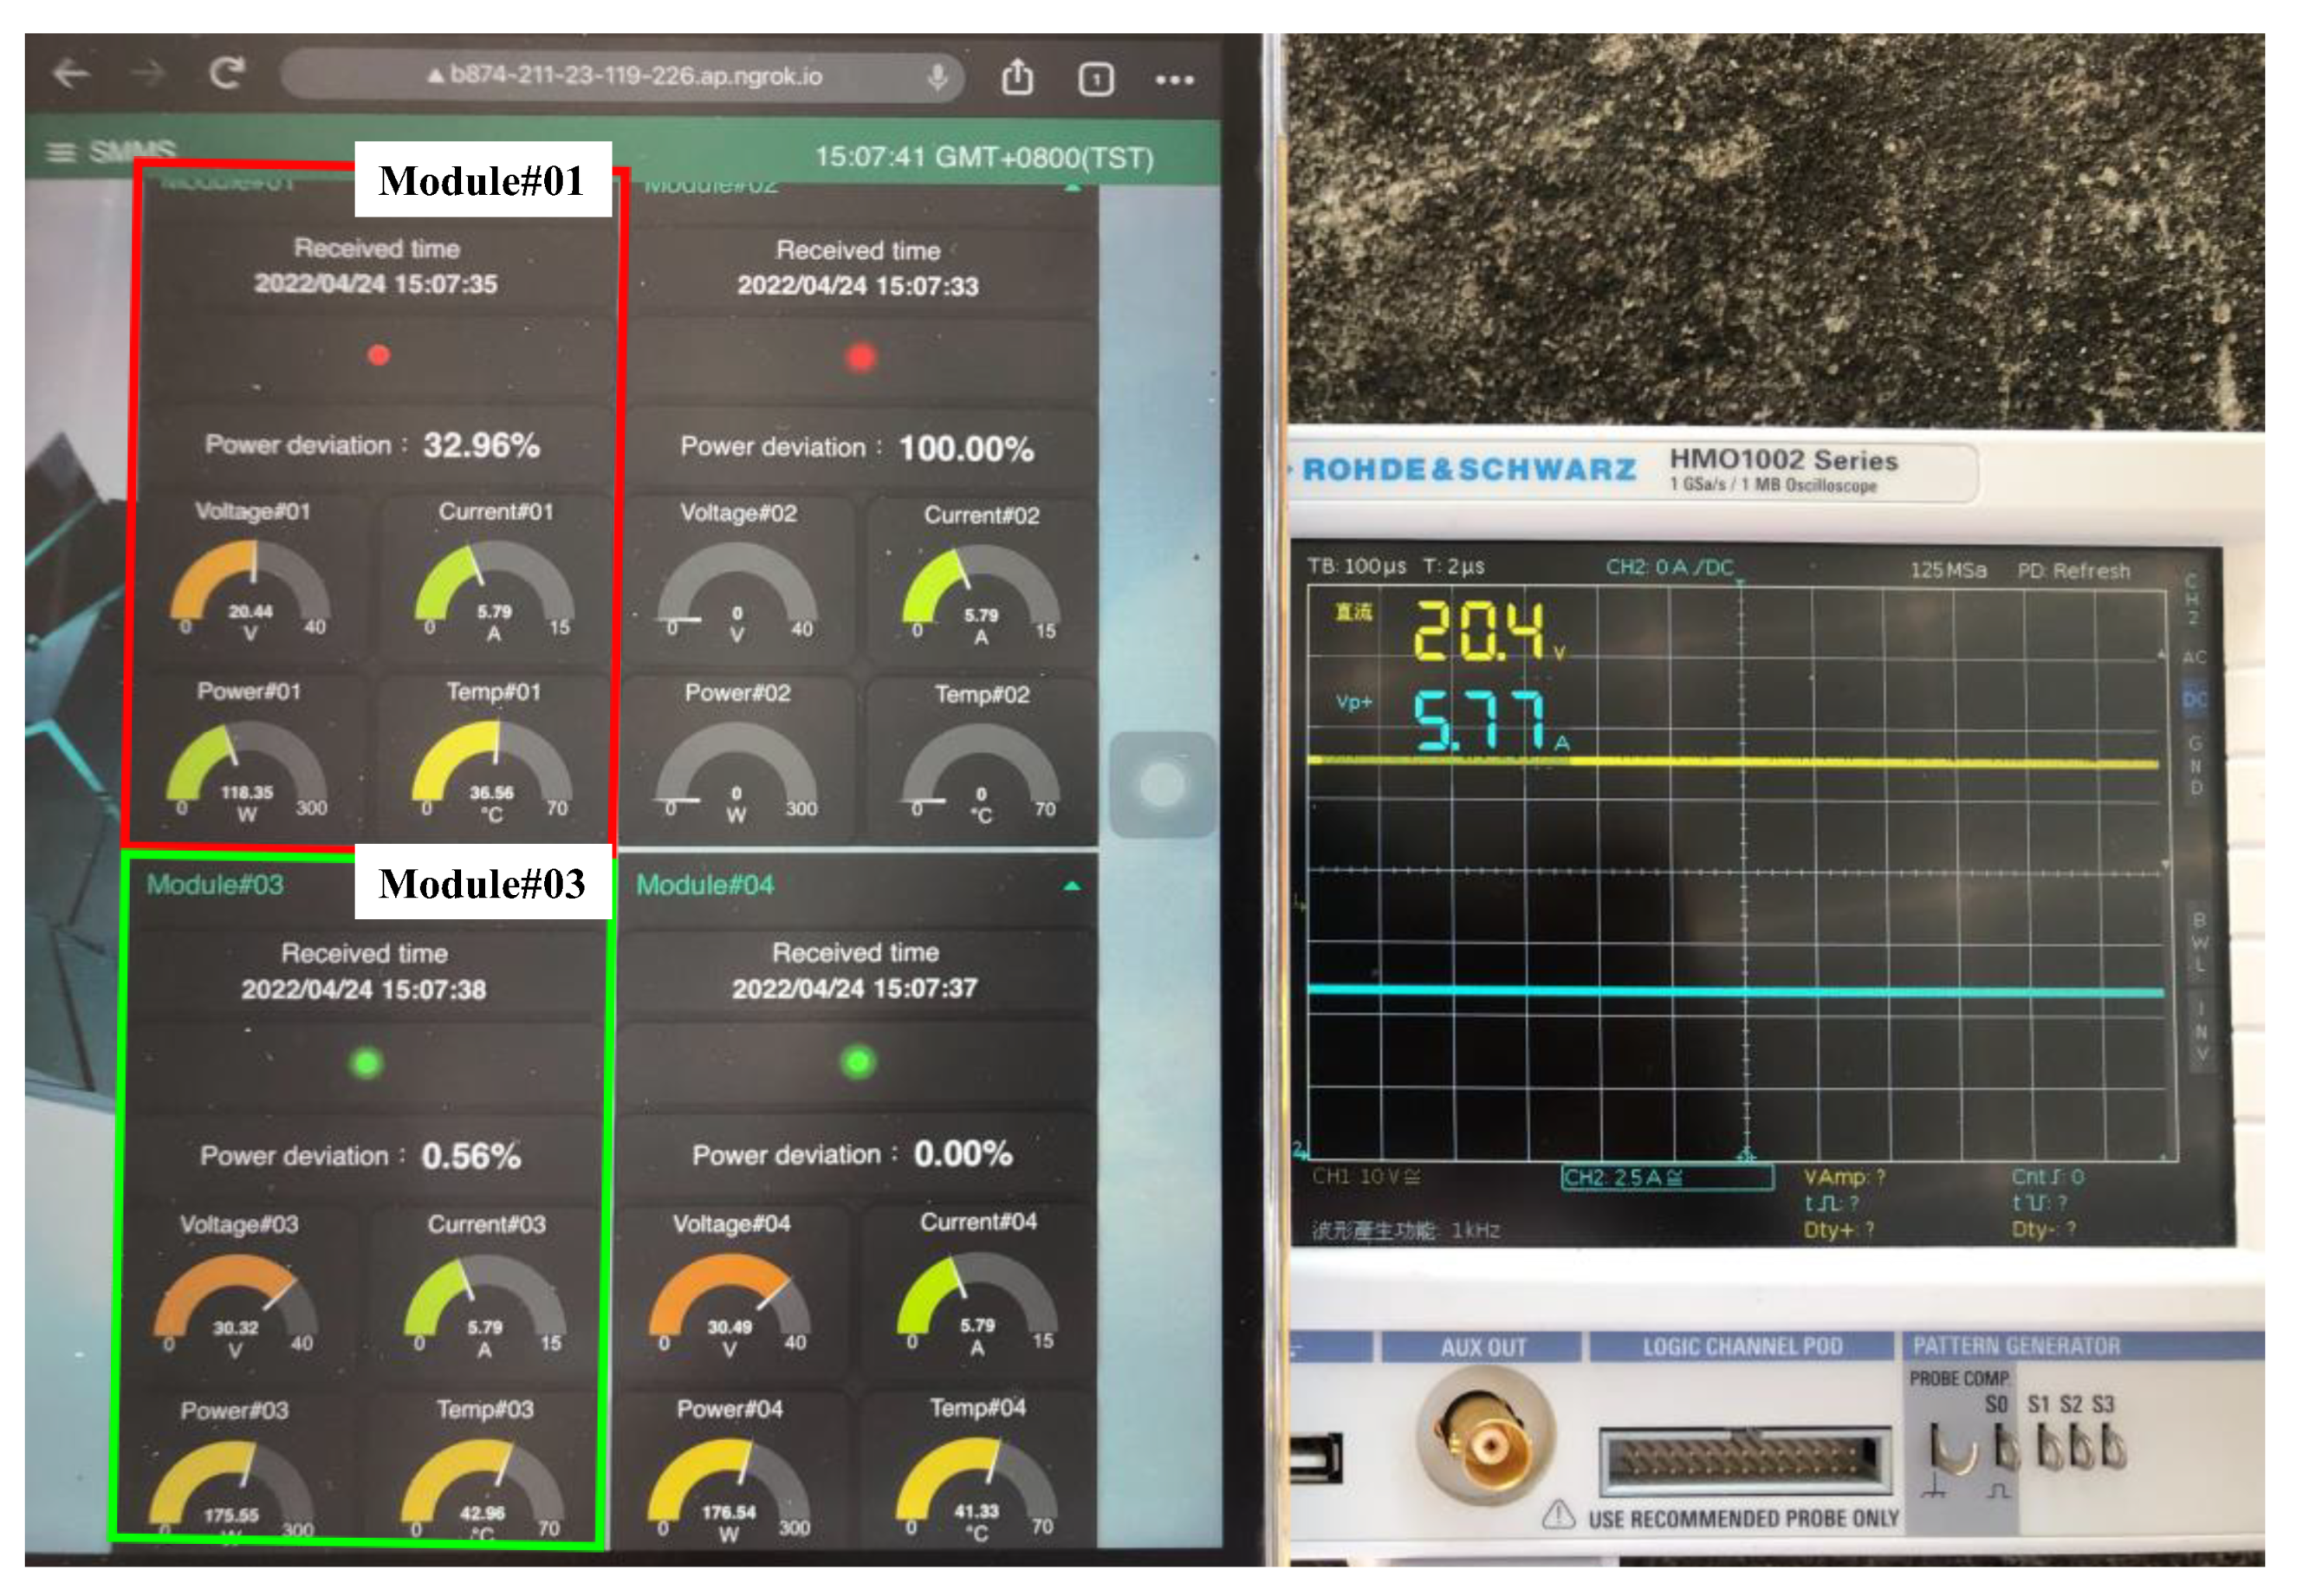
In Case 3, simulation of PV module series, two modules were shaded 30% and 100%, respectively. Figure 25 shows the entity diagram of the PV module series test and display frame of the Node-RED dashboard, with Moduel#01 and Module#02 shaded 30% and 100%. From the Node-RED dashboard, it was observed from the frame that Module#01 and Module#02 have red fault lights, indicating both Module#01 and Module#02 were working abnormally. Two Line-Notify messages were sent at the same time to notify the repair personnel.
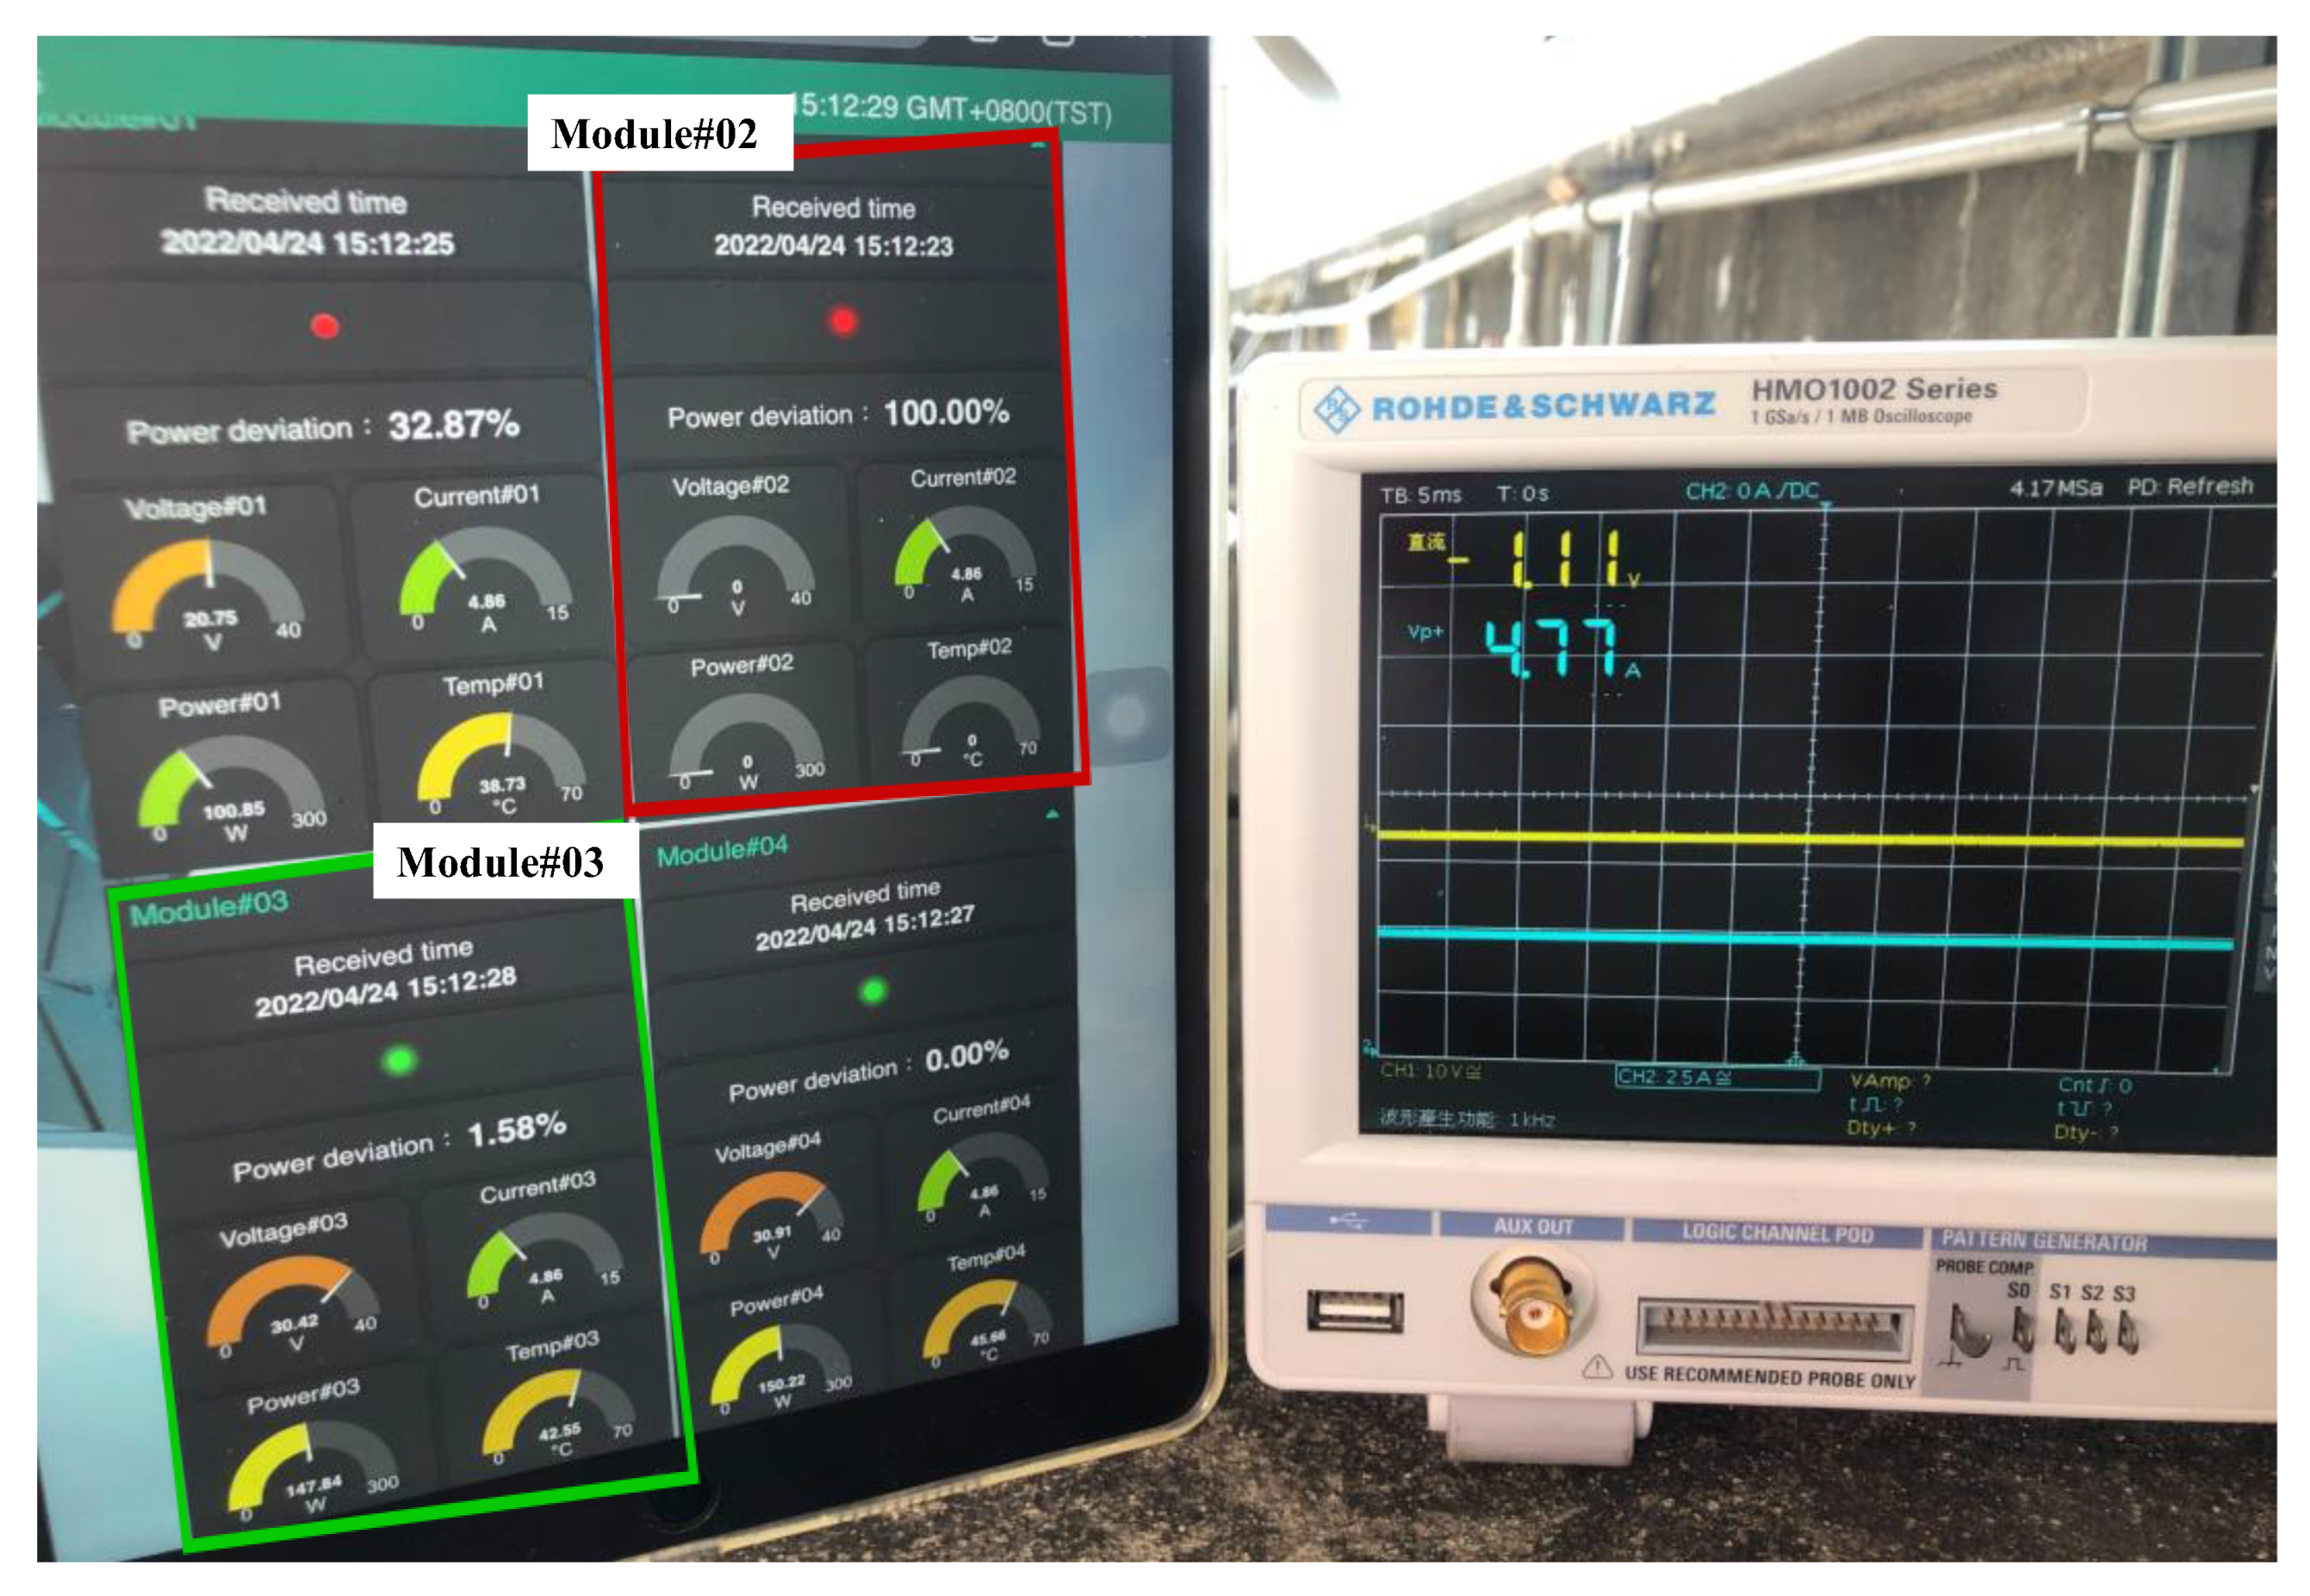
Figure 26 shows the Module#01 direct measurement using an oscilloscope and comparison diagram of test results displayed by a Node-RED dashboard. The shaded range of the PV module was 30%. The Module#01 voltage displayed on the Node-RED dashboard at the time was 20.44V, the current was 5.79A, and the power was 118.35W. In Module#04, with the power differential output power and the maximum output power of 176.54W, the power difference ratio calculated from Equation (3) was 32.96%, the voltage directly measured and displayed by the oscilloscope was 20.4V, the current was 5.77A. From the data measured by the fault detection module and the data directly measured by the oscilloscope, the voltage error was only 0.196%, and the current error was only 0.347%. In addition, in Figure 26, the Node-RED dashboard shows the unshaded Module #03 voltage was 30.32 V, the current was 5.79A, which was the same as that of Module#01, the power was 175.55W, and the power difference ratio was 0.56%. The difference ratio was less than the set value of 5%. Therefore, it was determined that Module#03 was operating normally.
Figure 27 shows the comparison diagram of 100% shaded PV module test results between Module#02 direct measurement using an oscilloscope and test results displayed by the Node-RED dashboard. The test time and irradiance in this case differed from those in Figure 26. Thus, the disparity in the current sizes displayed. However, since the shaded range of Module#02 was 100%, the PV module under this state was similar to a load. Therefore, when the module serial current passed through, the entire module heated up, with 0 W power output. Thus, the output power failed to trigger the action of the fault detection module. On the other hand, data displayed on the Node-RED dashboard was determined by a program. Given that no data was sent back by the module within five minutes, the module was determined to be in its abnormal state, while voltages, power, and temperature of 0 were automatically sent at 10-s intervals. Further, since the modules were connected in series, the current values passing through different modules remained the same. Therefore, a current sensor was only installed in Module#04 fault detection module. All of the current data of modules was sent back by Module#04 fault detection module.
In Figure 27, the unshaded PV module Module#03 voltage displayed on the Node-RED dashboard was 30.42 V, the current was 4.86A, the power was 147.84 W, the power difference ratio was 1.58%, and the error was less than the set value of 5%. Therefore, the module was operating normally. In addition, the displayed current directly measured by the oscilloscope was 4.77 A. The data detected by the fault detection module and the data directly measured by the oscilloscope only had the current error of only 1.886%.
From the above experimental data, the PV module series under three different shade conditions was observed. The data sent back by the fault detection module and the data obtained from direct measurement using the oscilloscope showed minor value differences. Moreover, the system was able to identify the location of the faulty PV module in the series and was able to immediately send a pre-warning notification to the repair personnel via Line-Notify. Therefore, the reliability of the remote fault detection system developed was validated.
4. Discussion
The criteria for detecting defective modules in this study consist of using the Equation (3) to compare the output power of each PVM to the output power of the module with the highest output power in the same string of modules. The offset difference ratio between the two is calculated. If the power offset ratio exceeds 5%, the module is considered to be shaded or defective. The criteria for evaluating PVM failure in this study are the relative comparisons of output power under any climatic conditions and the climatic factors are irrelevant. The output powers of the individual PVMs are calculated by multiplying the voltage and current sensor values returned to the MCU. The experimental results validated the voltage and current sensors’ accuracy. As a result, the power calculation value matched the actual value and there were no errors in fault detection.
As the temperature sensor is located on the rear of the photovoltaic module (PVM), it is not visible from the front. In contrast, when the ratio of shades reaches 100 percent, it indicates the failure of the whole module. During this time, the series current passes via the bypass diode of the defective module, causing the voltage between the module’s two ends to approach zero. As a result, the voltage, power, temperature, and other sensor output values are all zero, as the fault detection module cannot receive power for normal operation. In this study, just one current sensor is put in a series of PVMs and each PVM displays the same current value. Moreover, in this study, a fault detection module is put on each PVM and is powered by the power production of each PVM. Nevertheless, as shown in Table 1, the cost of each fault detection module accounts for less than 10% of the cost of each PVM. Consequently, the cost of installation remains within an acceptable range.
The designed fault detection module is mostly used for online, real-time fault detection of the photovoltaic module (PVM). Therefore, there is no correlation between detection precision and test duration. In addition, fault detection experiments were conducted on three types of PVM cases in various locations and with varying shading ratios. Consequently, it is analogous to testing under various climatic circumstances.
5. Conclusions
A new PV module remote fault detection method with low cost and low power consumption was proposed in this paper. It requires no additional power supply; it can generate power through the PV module itself to trigger the fault detection module. Moreover, no periodic maintenance and repair is needed after installation. In case of abnormalities when receiving data, the PV module can be quickly replaced on-site. In order to ensure more precise fault detection, median average filter method was adopted to ensure a more stable output of conversion values. From the test results, it was found that the various sensor test values in the hardware circuit of the fault detection module and the PV module voltages and current values directly measured by the oscilloscope showed minor errors. Additionally, as proven by the tests by different modules under different shade conditions, the remote fault detection system accurately detected the location of the faulty PV module, and repair personnel was immediately notified via Line-Notify to proceed with the repair. Furthermore, the software program installation was also quickly completed. In case of additional required functions in the future, the Node-RED program featuring high matching adaptability with other software can extend more diverse applications. Different from other methods, when there is a PV module failure, the user does not need to go to the field to find the faulty PV module and can see it at a glance from the Node-RED interface. The cost of each fault detection module is only 10% of the cost of each PVM, and the working conditions of each PVM can be detected simultaneously. This significantly improves the speed and precision of fault detection. As a result, the built-in fault detection module continues to provide economic benefits.
Author Contributions
K.-H.C., planned the project and did the writing, editing and review. W.-C.P. evaluated the performance of the whole remote fault detection system. H.-H.C. was responsible for design the whole system structure and develop the remote fault detection module. K.-H.C., administered the project. All authors have read and agreed to the published version of the manuscript.
Funding
The authors gratefully acknowledge the support and funding of this project by Ministry of Science and Technology, Taiwan, under the Grant Number MOST 110-2221-E-167-007-MY2.
Institutional Review Board Statement
Not applicable.
Informed Consent Statement
Not applicable.
Data Availability Statement
This study did not report any data.
Conflicts of Interest
The authors of the manuscript declare no conflict of interest.
References
- Yinxiang, C.; Juping, G.; Jingfeng, M.; Laiwu, L.; Kaian, C.; Yangyang, M.; Xuan, L. Wireless Monitor System of the Focusing and Tracking Photovoltaic Generation System Based on LabVIEW. In Proceedings of the 31st Chinese Control Conference, Hefei, China, 25–27 July 2012; pp. 5595–5600. [Google Scholar]
- Ayesh, S.; Ramesh, P.; Ramakrishnan, S. Design of Wireless Sensor Network for Monitoring the Performance of Photovoltaic Panel. In Proceedings of the Trends in Industrial Measurement and Automation (TIMA), Chennai, India, 6–8 January 2017. [Google Scholar]
- Rashidi, Y.; Moallem, M.; Vojdani, S. Wireless Zigbee System for Perormance Monitoring of Photovoltaic Panels. In Proceedings of the 37th IEEE Photovoltaic Specialists Conference, Seattle, WA, USA, 19–24 June 2011; pp. 3205–3207. [Google Scholar]
- Deshmukh, N.S.; Bhuyar, D.L. A Smart Solar Photovoltaic Remote Monitoring and Controlling. In Proceedings of the Second International Conference on Intelligent Computing and Control Systems (ICICCS), Madurai, India, 14–15 June 2018; pp. 67–71. [Google Scholar]
- Iskandar, H.R.; Sambasri, S.; Saputra, D.I.; Heryana, N.; Purwadi, A.; Marsudiono, M. IoT Application for On-Line Monitoring of 1 kWp Photovoltaic System Based on NodeMCU ESP8266 and Android Application. In Proceedings of the 2nd International Conference on High Voltage Engineering and Power Systems (ICHVEPS), Denpasar, Indonesia, 1–4 October 2019; pp. 230–234. [Google Scholar]
- Chanthakit, S.; Rattanapoka, C. MQTT Based Air Quality Monitoring System using Node MCU and Node-RED. In Proceedings of the Seventh ICT International Student Project Conference (ICT-ISPC), Nakhonpathom, Thailand, 11–13 July 2018; pp. 1–5. [Google Scholar]
- Yang, K.; Zhang, B.; Zhang, J.; Zhu, J. Design of Remote Control Inverter Based on MQTT Communication Protocol. In Proceedings of the IEEE International Conference on Mechatronics and Automation (ICMA), Takamatsu, Japan, 8–11 August 2021; pp. 1374–1378. [Google Scholar]
- Eridani, D.; Widianto, E.D. Performance of Sensors Monitoring System using Raspberry Pi through MQTT Protocol. In Proceedings of the International Seminar on Research of Information Technology and Intelligent Systems (ISRITI), Yogyakarta, Indonesia, 21–22 November 2018; pp. 587–590. [Google Scholar]
- Quater, P.B.; Grimaccia, F.; Leva, S.; Mussetta, M.; Aghaei, M. Light Unmanned Aerial Vehicles (UAVs) for Cooperative Inspection of PV Plants. IEEE J. Photovolt. 2014, 4, 1107–1113. [Google Scholar] [CrossRef] [Green Version]
- Li, J.Y. An Affordable and Rapid Fault Diagnosis System for Photovoltaic Modules. Master’s Thesis, National Chin-Yi University of Technology, Taichung, Taiwan, 23 July 2020. [Google Scholar]
- Reddy, S.S.; Yammani, C. Fault Diagnosis in TCT Configuration of PV Array Using I–V Characteristics. In Proceedings of the National Power Electronics Conference (NPEC), Bhubaneswar, India, 15–17 December 2021; pp. 1–6. [Google Scholar]
- Wu, M.C. An On-Line Fault Diagnosis System with Power Generation Promotion for Photovoltaic Module Arrays. Master’s Thesis, National Chin-Yi University of Technology, Taichung, Taiwan, 3 August 2017. [Google Scholar]
- Allafi, I.; Iqbal, T. Design and Implementation of a Low Cost Web Server Using ESP32 for Real-Time Photovoltaic System Monitoring. In Proceedings of the IEEE Electrical Power and Energy Conference (EPEC), Saskatoon, SK, Canada, 22–25 October 2017; pp. 22–25. [Google Scholar]
- Zare, A.; Iqbal, M.T. Low-Cost ESP32, Raspberry Pi, Node-RED, and MQTT Protocol Based SCADA System. In Proceedings of the IEEE International IOT, Electronics and Mechatronics Conference (IEMTRONICS), Vancouver, BC, Canada, 9–12 September 2020; pp. 1–5. [Google Scholar]
- Node-RED Official Website, IBM Emerging Technology. Available online: https://nodered.org/ (accessed on 2 May 2022).
- Node-RED Dashboard Information. Available online: https://flows.nodered.org/node/node-red-dashboard (accessed on 2 May 2022).
- Prasetyo, H.; Nugroho, A. On-Grid Photovoltaic System Power Monitoring with a Responsive Dashboard Design. In Proceedings of the International Conference on ICT for Smart Society (ICISS), Bandung, Indonesia, 19–20 November 2020; pp. 1–5. [Google Scholar]
- Di Martino, S.; Fiadone, L.; Peron, A.; Riccabone, A.; Vitale, V.N. Industrial Internet of Things: Persistence for Time Series with NoSQL Databases. In Proceedings of the IEEE 28th International Conference on Enabling Technologies: Infrastructure for Collaborative Enterprises (WETICE), Napoli, Italy, 12–14 June 2019; pp. 340–345. [Google Scholar]
- Zhang, Z.; Jin, Y. Design of Temperature Remote Monitoring System Based on STM32. In Proceedings of the IEEE International Conference on Artificial Intelligence and Computer Applications (ICAICA), Dalian, China, 27–29 June 2020; pp. 757–759. [Google Scholar]
- InfluxDB Official Website. Available online: https://www.influxdata.com/ (accessed on 2 May 2022).
- Ai-Thinker Co., Ltd. NodeMCU-32S Datasheet. Available online: https://docs.ai-thinker.com/_media/esp32/docs/nodemcu-32s_product_specification.pdf (accessed on 2 May 2022).
- ESPRESSIF Systems Co., Ltd. ESP32 Data Manual. Available online: https://www.espressif.com/sites/default/files/documentation/esp32_technical_reference_manual_cn.pdf (accessed on 5 May 2022).
- Visual Studio Code Official Website. Available online: https://code.visualstudio.com/ (accessed on 9 May 2022).
- Ngrok Official Website. Available online: https://ngrok.com/ (accessed on 7 May 2022).
- Sarah, A.; Ghozali, T.; Giano, G.; Mulyadi, M.; Octaviani, S.; Hikmaturokhman, A. Learning IoT: Basic Experiments of Home Automation Using ESP8266, Arduino and XBee. In Proceedings of the IEEE International Conference on Smart Internet of Things (SmartIoT), Beijing, China, 14–16 August 2020; pp. 290–294. [Google Scholar]
- HiveMQ Company. HiveMQ Cloud. Available online: https://www.hivemq.com/mqtt-cloud-broker/ (accessed on 7 May 2022).
- Isolated DC/DC Converters DPBW06F-05 Datasheet. Available online: http://www.meanwell.com.tw/webapp/product/search.aspx?prod=DPBW06 (accessed on 9 May 2022).
- OP07 Datasheet. Available online: https://www.analog.com/media/en/technical-documentation/data-sheets/op07.pdf (accessed on 7 May 2022).
- Rahhman, K.A.; Khan, M.A.M.; Rahman, M.H. Implementing a data acquisition system for solar PV modules with a variable load. In Proceedings of the 2nd International Conference on Innovation in Engineering and Technology (ICIET), Dhaka, Bangladesh, 23–24 December 2019; pp. 1–6. [Google Scholar]
- Allegro MicroSystems. ACS712 Datasheet. Available online: https://www.allegromicro.com/en/products/sense/current-sensor-ics/zero-to-fifty-amp-integrated-conductor-sensor-ics/acs712 (accessed on 7 May 2022).
- DS18B20 Tempurature Sensor Datasheet. Available online: https://datasheets.maximintegrated.com/en/ds/DS18B20.pdf (accessed on 9 May 2022).
- Macheso, P.S.B.; Manda, T.D.; Meela, A.G.; Mlatho, J.S.; Taulo, G.T.; Phiri, J.C. Industrial Temperature Monitor Based on NodeMCU ESP8266, MQTT and Node-RED. In Proceedings of the 3rd International Conference on Advances in Computing, Communication Control and Networking (ICAC3N), Greater Noida, India, 17–18 December 2021; pp. 740–743. [Google Scholar]
- 1-wire Bus Datasheet. Available online: https://www.maximintegrated.com/en/design/technical-documents/tutorials/1/1796.html (accessed on 9 May 2022).
- Sensing Tree User Interface, AU Optronics Corporation. Available online: https://solar.auo.com/zh-TW/Solar_Products_System_Solutions/index (accessed on 7 May 2022).
- Yang, Y.; Yang, Y.; Wang, J.; Zhang, G.; Huang, S. Research on Multi-Peak Output Characteristics of Photovoltaic (PV) System Based on Piecewise Model. In Proceedings of the 29th Chinese Control and Decision Conference (CCDC), Chongqing, China, 28–30 May 2017; pp. 2322–2327. [Google Scholar]
Figure 1.
The overall system structure of PVM wireless fault detection mentioned.

Figure 2.
Flowchart of PVM remote fault detection mentioned.

Figure 3.
Hardware circuit structure of the developed fault detection module.

Figure 4.
Physical appearance of the remote fault detection module hardware.

Figure 5.
Wireless fault detection module work flowchart.

Figure 6.
QoS2 message transmission method.

Figure 7.
Frame of cluster management created by HiveMQ cloud [26].
Figure 7.
Frame of cluster management created by HiveMQ cloud [26].

Figure 8.
Diagram of Visual Studio Code development environment [23].
Figure 8.
Diagram of Visual Studio Code development environment [23].

Figure 9.
Node-RED program operation flowchart.

Figure 10.
Functional block diagram of Node-RED program work A area.

Figure 11.
The sensing tree interface adopted [34].
Figure 11.
The sensing tree interface adopted [34].

Figure 12.
Functional block diagram of Node-RED program work B area.

Figure 13.
Data type conversion program.

Figure 14.
Functional block diagram of Node-RED program work C area.

Figure 15.
The status of warning alert message notification after the node for sending Line-Notify was triggered.
Figure 15.
The status of warning alert message notification after the node for sending Line-Notify was triggered.

Figure 16.
The Node-RED dashboard shows the power difference ratio between modules and output maximum power modules and working abnormality warning indicator lights [16].
Figure 16.
The Node-RED dashboard shows the power difference ratio between modules and output maximum power modules and working abnormality warning indicator lights [16].

Figure 17.
InfluxDB2.0 open-source time series database operation interface.

Figure 18.
Ngrok reverse proxy programming interface.

Figure 19.
Ngrok users visiting the monitoring window interface.

Figure 20.
Diagram of changes in the amount of sunshine on 04/24/2022.

Figure 21.
Case 1 entity diagram of PV module series test and display frame of the Node-RED dashboard.
Figure 21.
Case 1 entity diagram of PV module series test and display frame of the Node-RED dashboard.

Figure 22.
Case 1 Module#01 direct measurement using an oscilloscope and comparison diagram of test results displayed by the Node-RED dashboard.
Figure 22.
Case 1 Module#01 direct measurement using an oscilloscope and comparison diagram of test results displayed by the Node-RED dashboard.

Figure 23.
Case 2 entity diagram of solar PV module series test and display frame of the Node-RED dashboard.
Figure 23.
Case 2 entity diagram of solar PV module series test and display frame of the Node-RED dashboard.

Figure 24.
Case 2 Module#01 direct measurement using an oscilloscope and comparison diagram of test results displayed by the Node-RED dashboard.
Figure 24.
Case 2 Module#01 direct measurement using an oscilloscope and comparison diagram of test results displayed by the Node-RED dashboard.

Figure 25.
Case 3 entity diagram of solar PV module series test and display frame of the Node-RED dashboard.
Figure 25.
Case 3 entity diagram of solar PV module series test and display frame of the Node-RED dashboard.

Figure 26.
Case 3 Module#01 direct measurement using an oscilloscope and comparison diagram of test results displayed by the Node-RED dashboard.
Figure 26.
Case 3 Module#01 direct measurement using an oscilloscope and comparison diagram of test results displayed by the Node-RED dashboard.

Figure 27.
Case 3 Module#02 direct measurement using an oscilloscope and comparison diagram of test results displayed by the Node-RED dashboard.
Figure 27.
Case 3 Module#02 direct measurement using an oscilloscope and comparison diagram of test results displayed by the Node-RED dashboard.


Table 1.
Total cost of fault detection module hardware circuits.
| Item (Model) | Quantity | Unit Price (USD) |
|---|---|---|
| Microcontroller (NodeMCU-32S) | 1 | 4.09 |
| DC-DC converter (DPBW06F-05) | 1 | 6.6 |
| Operational amplifier (OP07) | 1 | 0.86 |
| Temperature sensor (DS18B20) | 1 | 1.09 |
| Current sensor (ACS712-20A) | 1 | 2.64 |
| A/D converter (ADS1115) | 1 | 3.12 |
| PCB board | 1 | 1.34 |
| Precision resistor | 6 | 0.21 |
| Ceramic capacitors | 4 | 0.14 |
| Electrolytic capacitor | 2 | 0.68 |
| Zener diode | 1 | 0.04 |
| Terminal block | 3 | 0.92 |
| Total cost: | 21.73 USD | |
Table 2.
PV module in series test cases under three shading conditions.
| Case | Different Shading Conditions of PV Modules in Series |
|---|---|
| 1 | 0% shading + 0% shading + 0% shading + 0% shading |
| 2 | 30% shading + 0% shading + 0% shading + 0% shading |
| 3 | 30% shading + 100% shading + 0% shading + 0% shading |
Table 3.
Electrical parameter specifications of PM060MW2_300 PV module.
| Parameter | Value |
|---|---|
| Rated maximum output power (Pmp) | 300 W |
| Open circuit voltage (Voc) | 39.90 V |
| Short circuit current (Isc) | 9.80 A |
| Current at maximum output power point (Imp) | 9.18 A |
| Voltage at maximum output power point (Vmp) | 32.7 V |
| Length and width of module | 1640 mm × 992 mm |
| Conformity with the provisions in the internationaltest standards | IEC/EN 61,215, IEC/EN 61,730 |
Publisher’s Note: MDPI stays neutral with regard to jurisdictional claims in published maps and institutional affiliations. |
© 2022 by the authors. Licensee MDPI, Basel, Switzerland. This article is an open access article distributed under the terms and conditions of the Creative Commons Attribution (CC BY) license (https://creativecommons.org/licenses/by/4.0/).
Share and Cite
MDPI and ACS Style
Chao, K.-H.; Pu, W.-C.; Chen, H.-H. Development of a Low-Cost Remote Fault Detection System for a Photovoltaic Power Plant. Sustainability 2022, 14, 16596. https://doi.org/10.3390/su142416596
AMA Style
Chao K-H, Pu W-C, Chen H-H. Development of a Low-Cost Remote Fault Detection System for a Photovoltaic Power Plant. Sustainability. 2022; 14(24):16596. https://doi.org/10.3390/su142416596
Chicago/Turabian StyleChao, Kuei-Hsiang, Wen-Cheng Pu, and Hsuan-Hao Chen. 2022. "Development of a Low-Cost Remote Fault Detection System for a Photovoltaic Power Plant" Sustainability 14, no. 24: 16596. https://doi.org/10.3390/su142416596
Note that from the first issue of 2016, this journal uses article numbers instead of page numbers. See further details here.