Integrating Qualitative Comparative Analysis and Support Vector Machine Methods to Reduce Passengers’ Resistance to Biometric E-Gates for Sustainable Airport Operations


Abstract
:1. Introduction
2. Theoretical Background
2.1. Biometrics for Passenger Service Quality
2.2. Underlying Theory: Resistance to Innovation
2.3. Crisp Set Qualitative Comparative Analysis (csQCA)
2.4. Support Vector Machine (SVM) and Kernels
2.5. Synthesis of Recent SVM Literature
2.6. Ensemble Classifiers
3. Methodology
3.1. csQCA Procedure
3.2. SVM Procedure
3.3. Dataset
3.4. Constructing Classifiers
4. Results
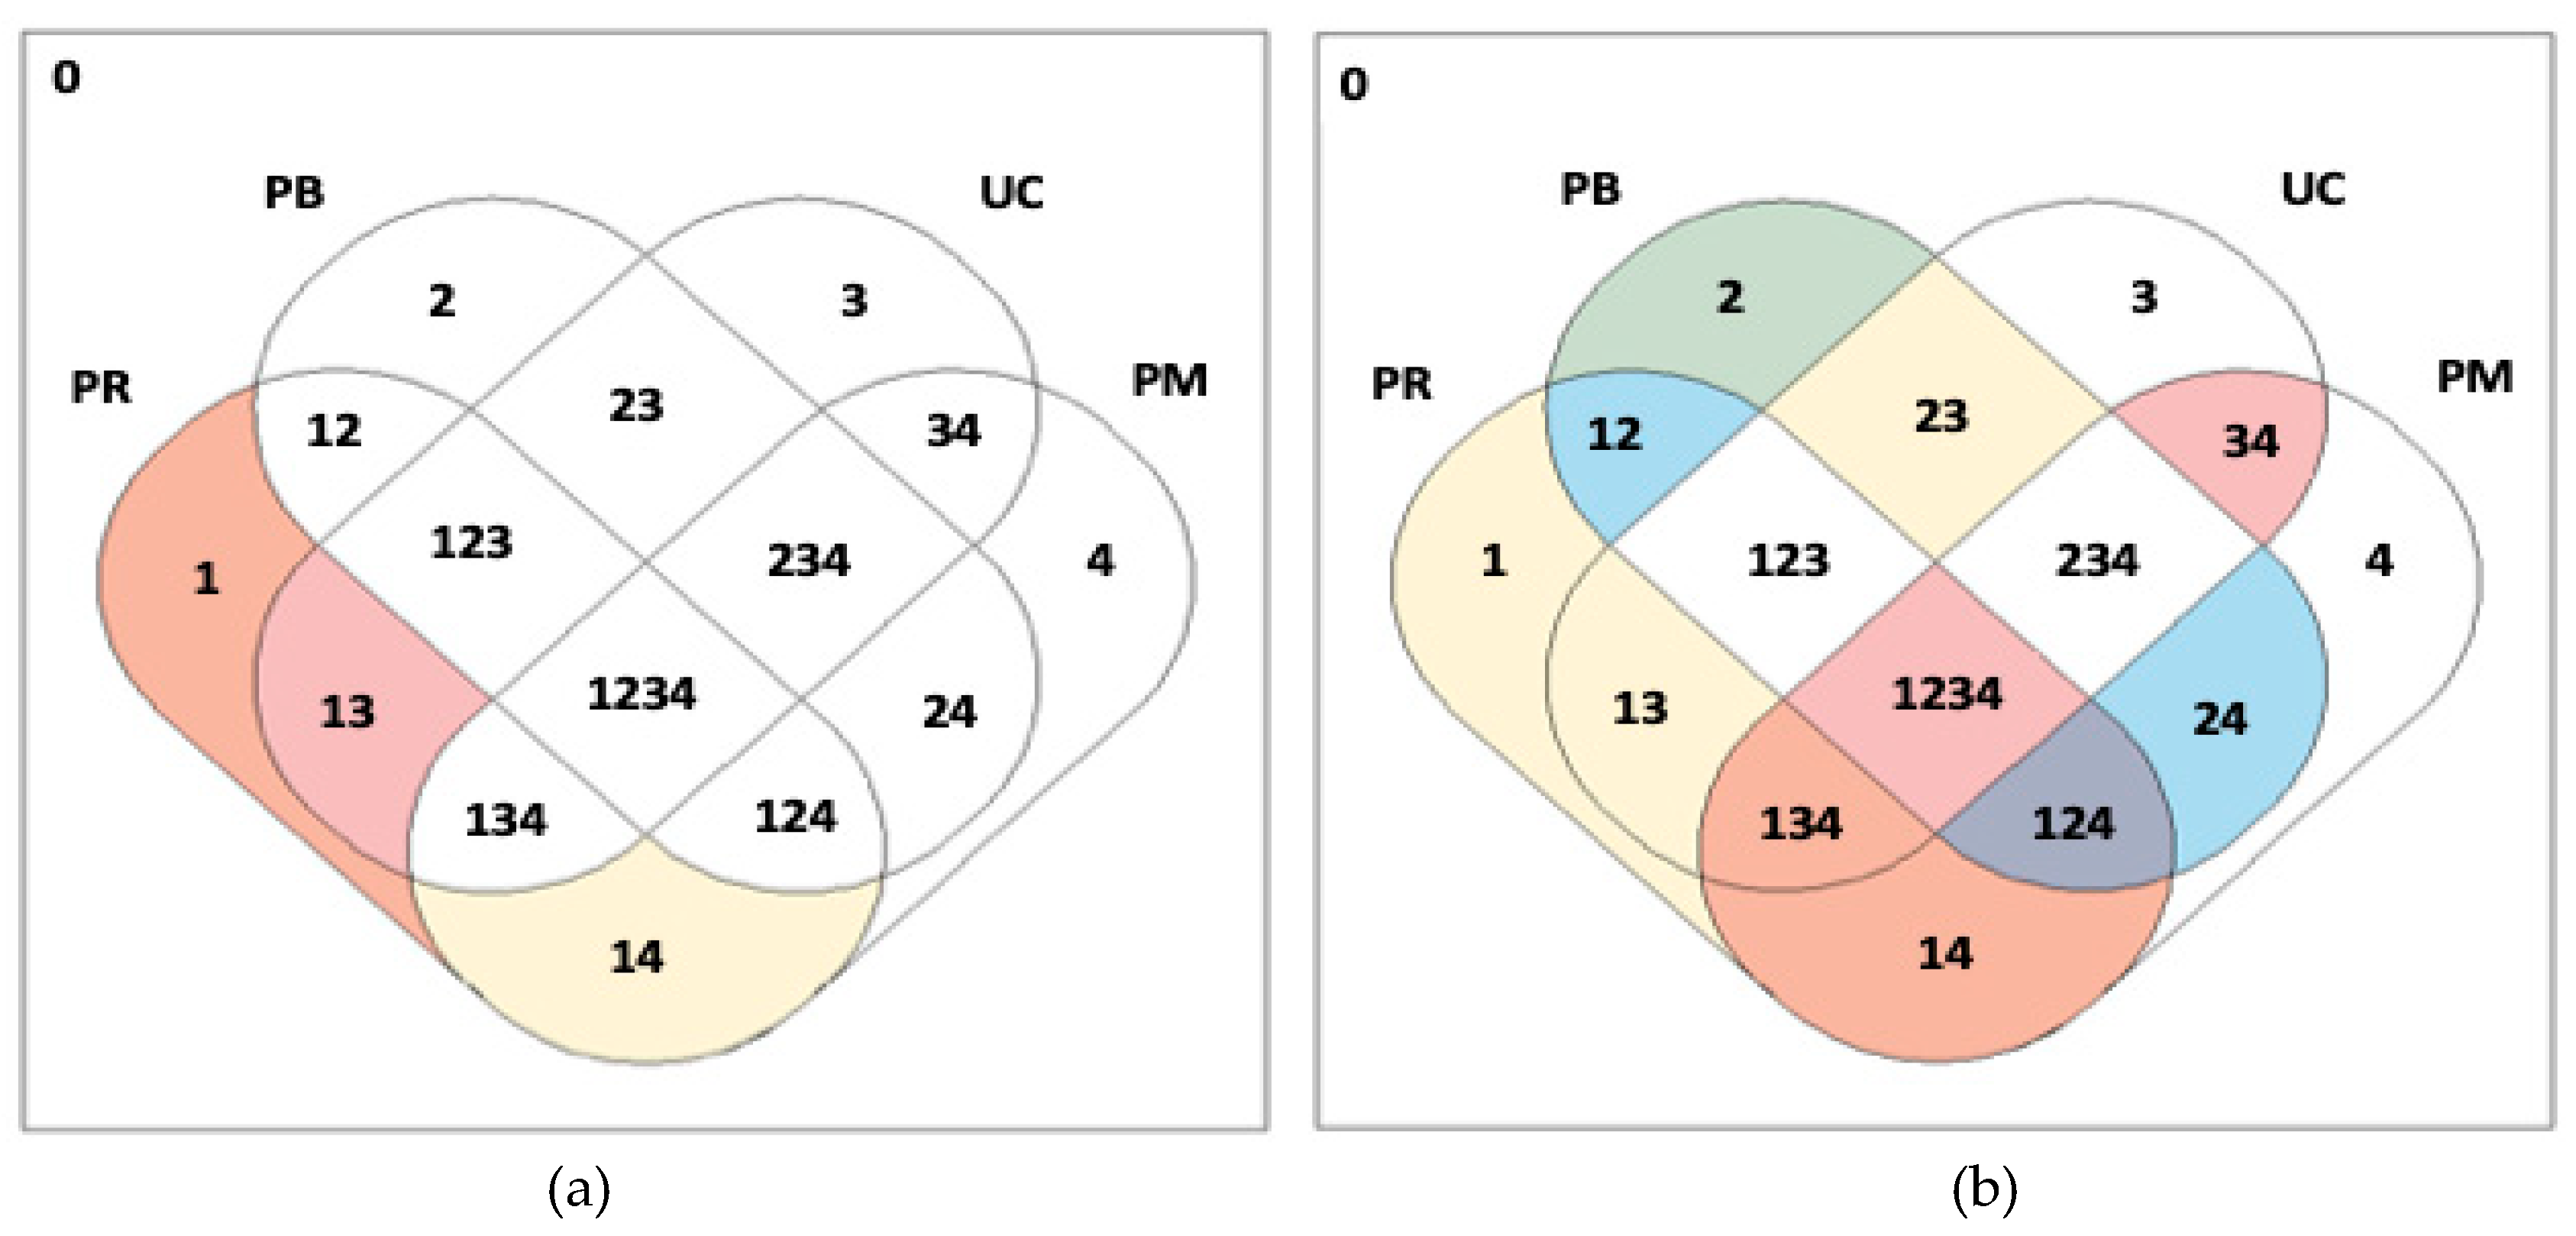
4.1. csQCA
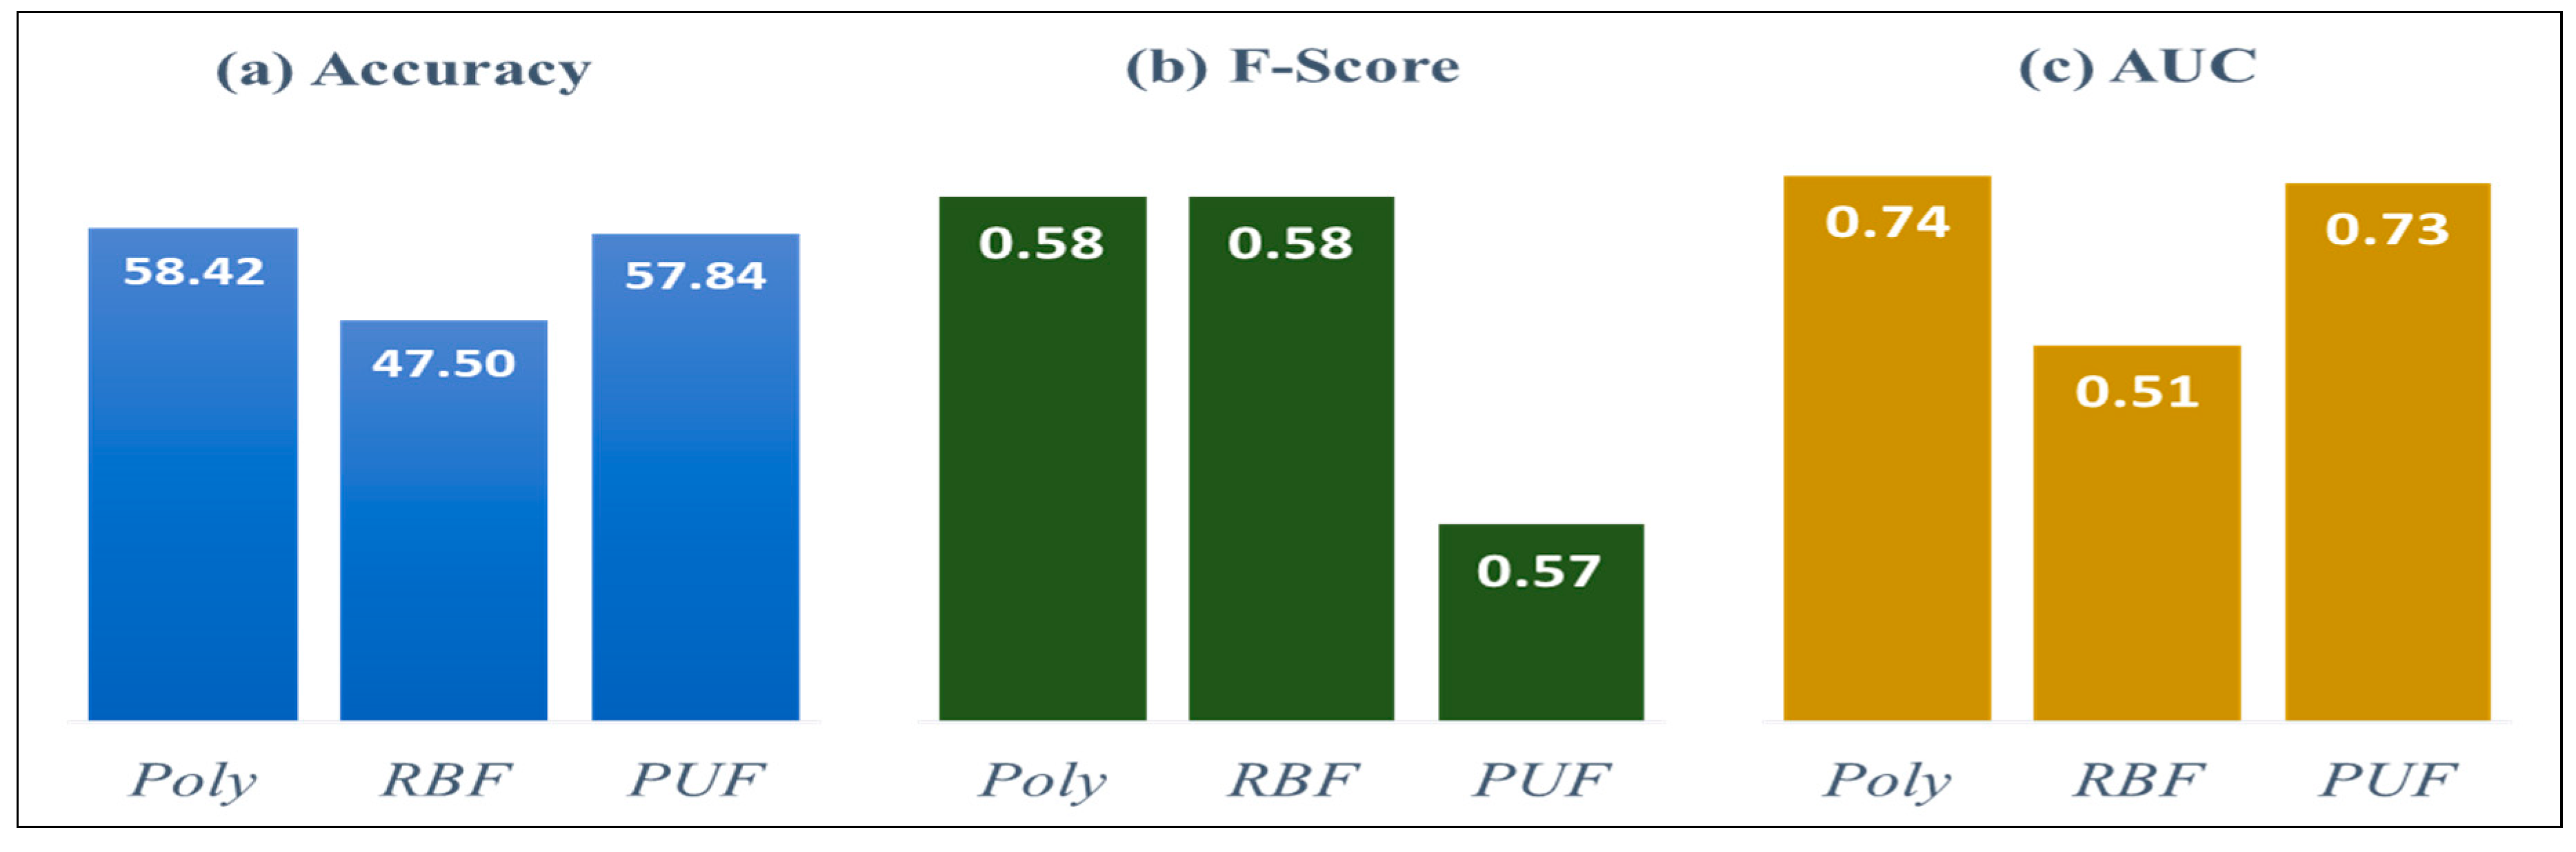
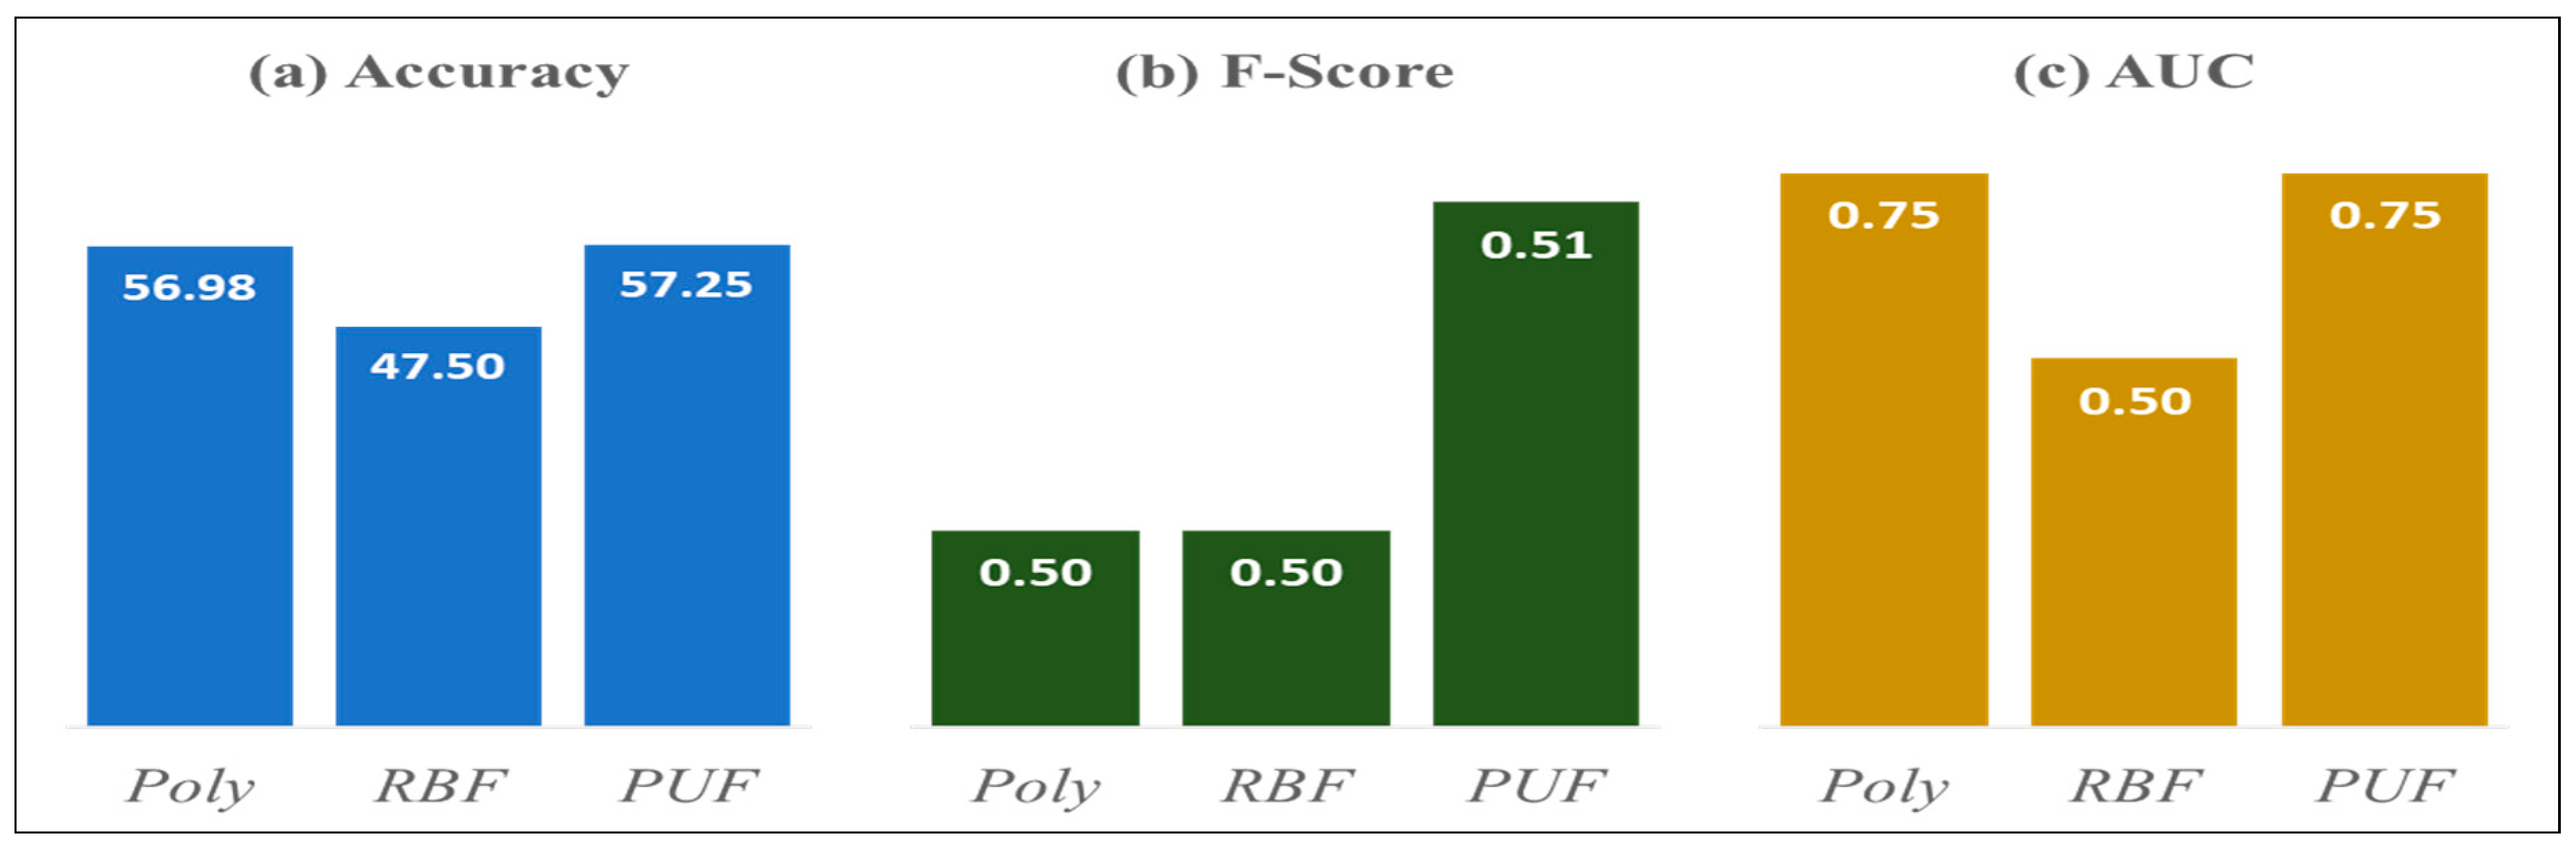
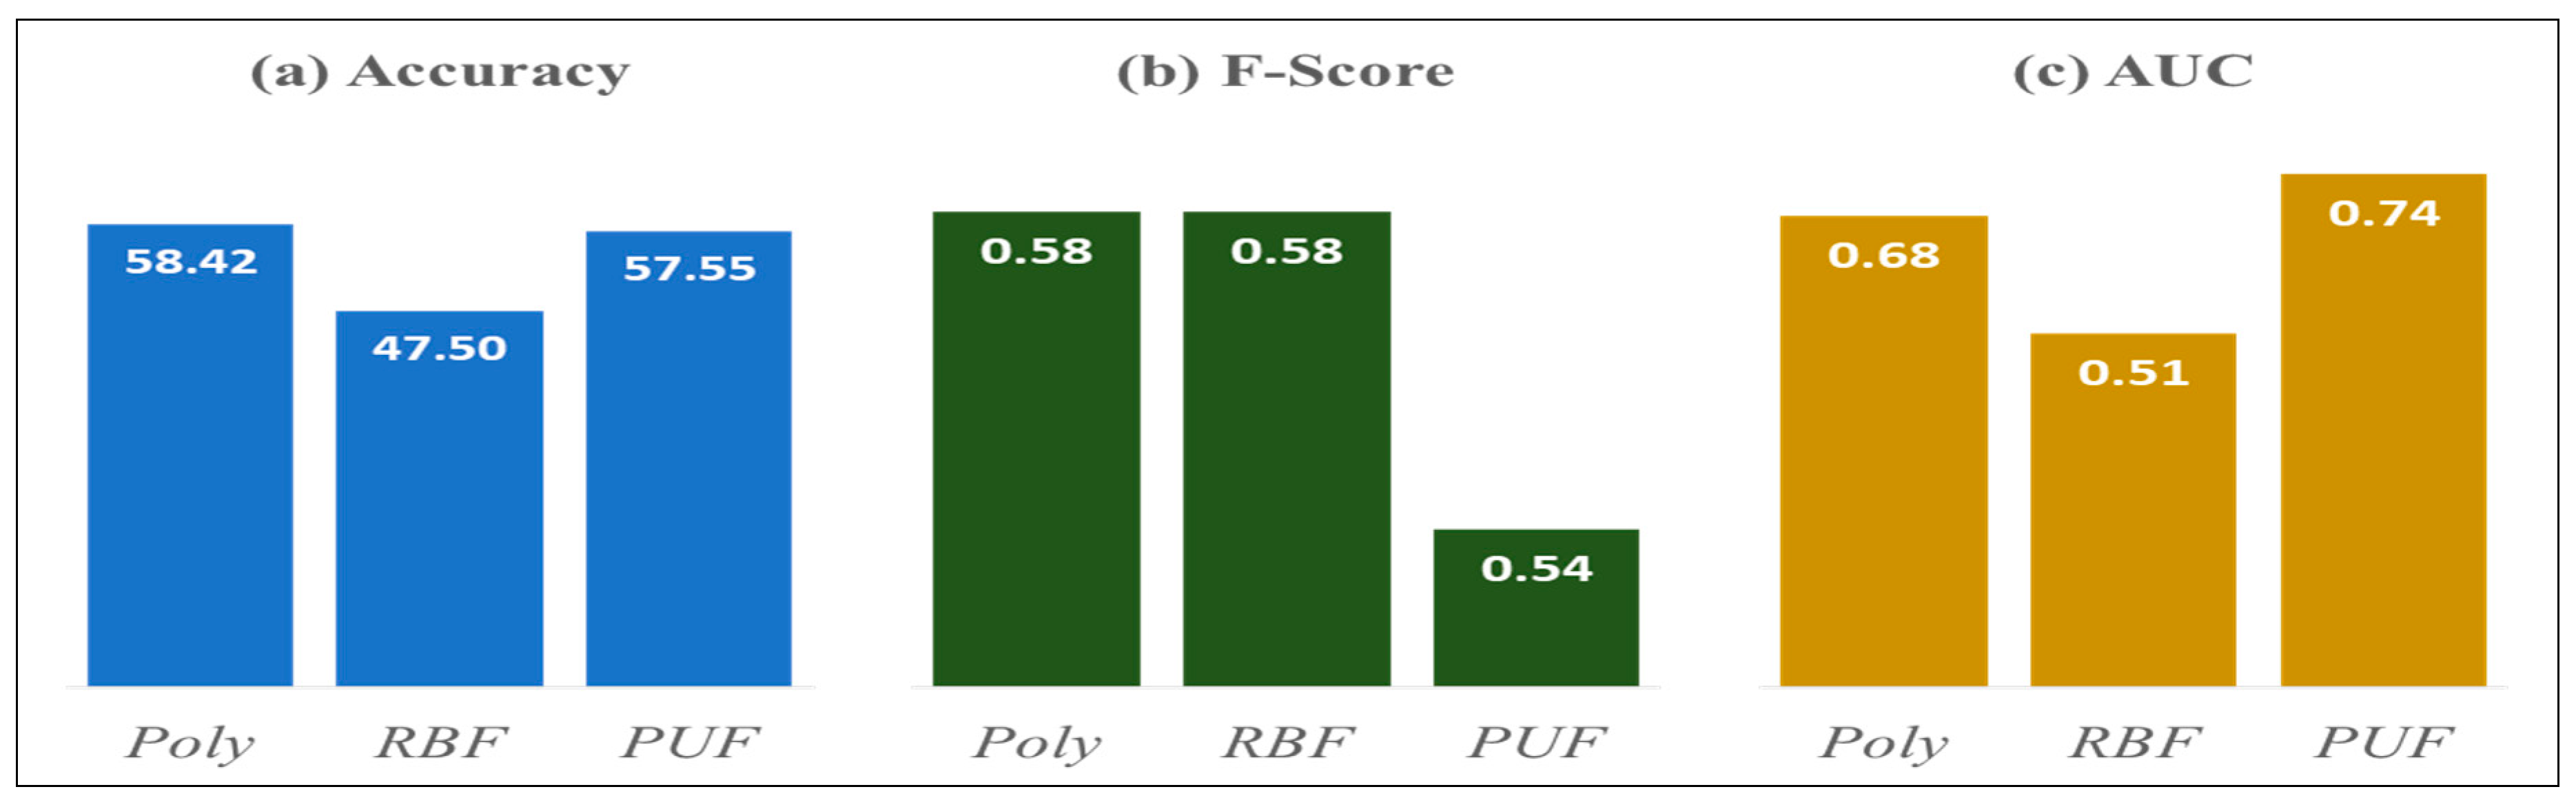
4.2. Single SVM Classifiers
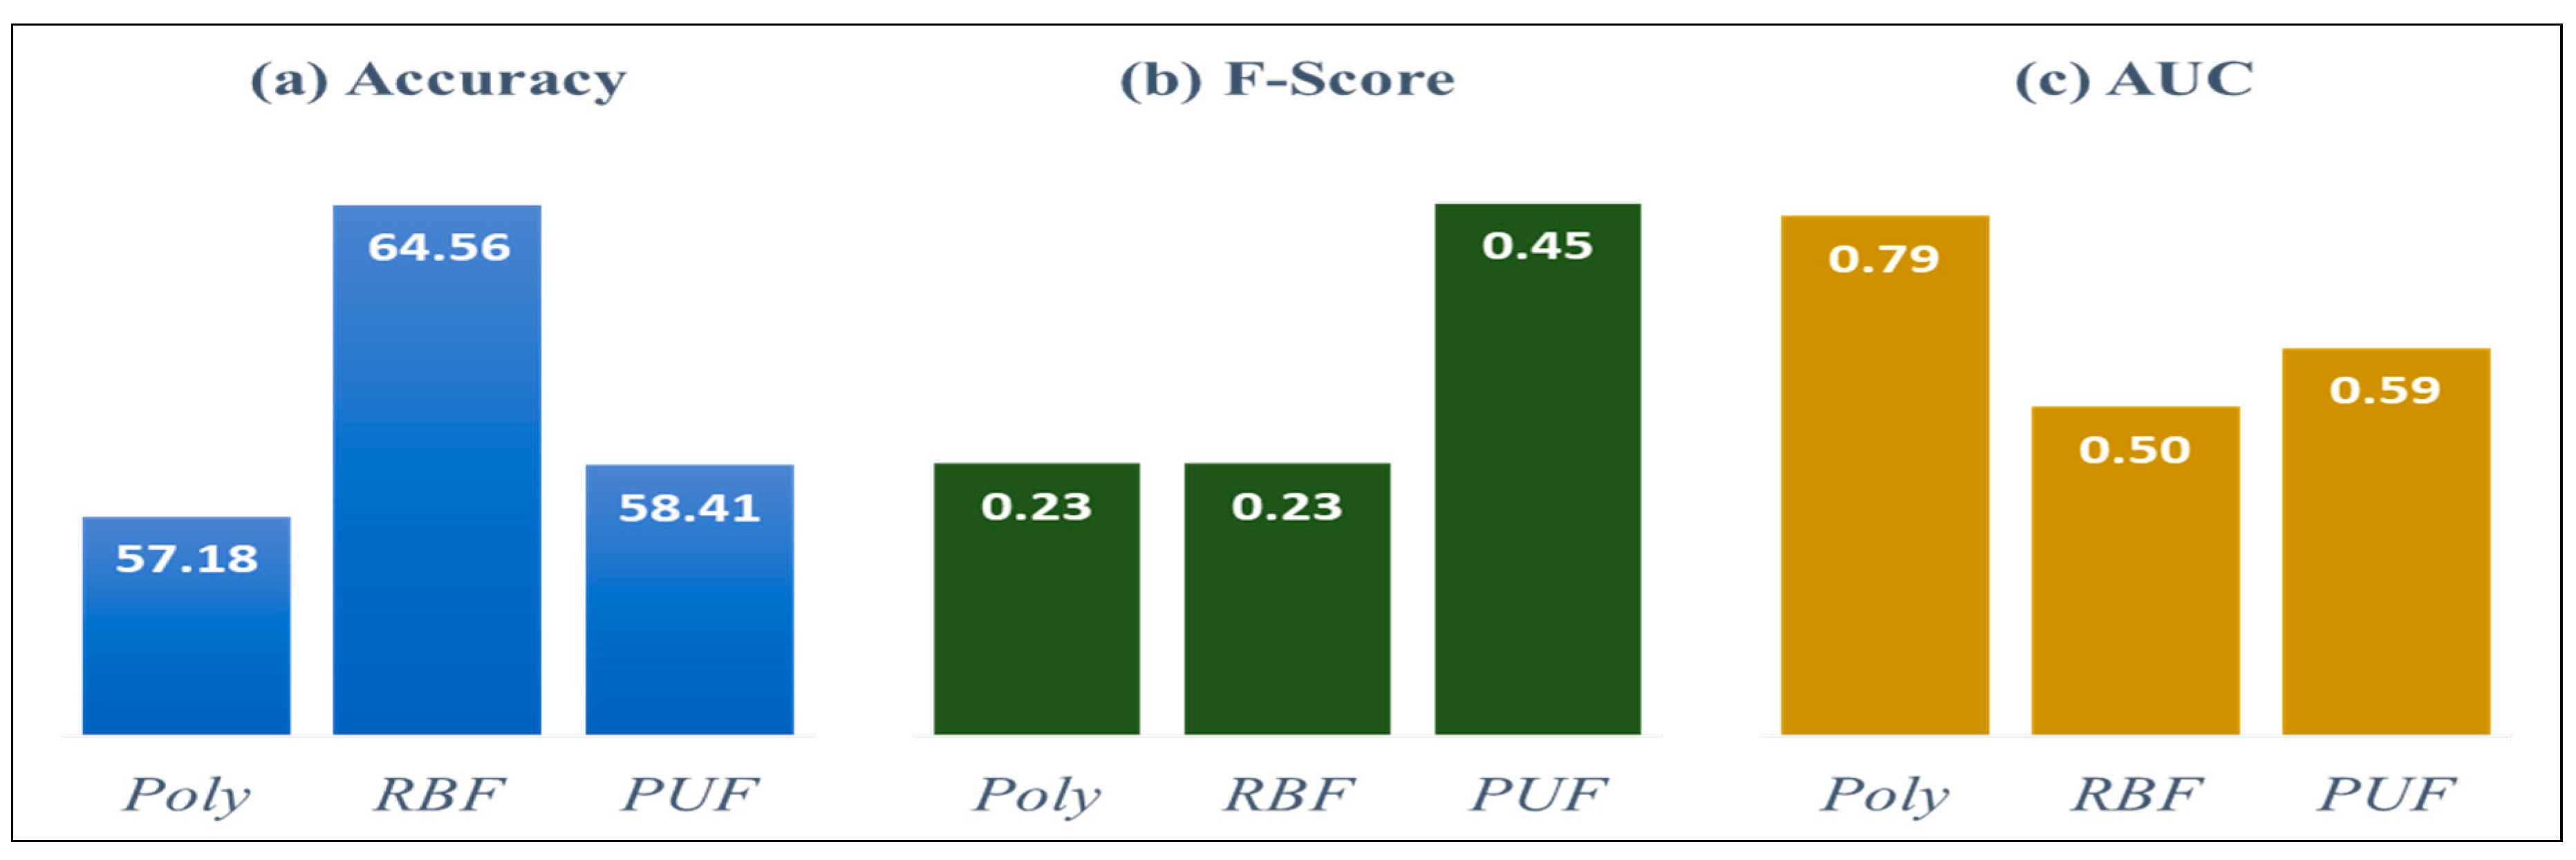
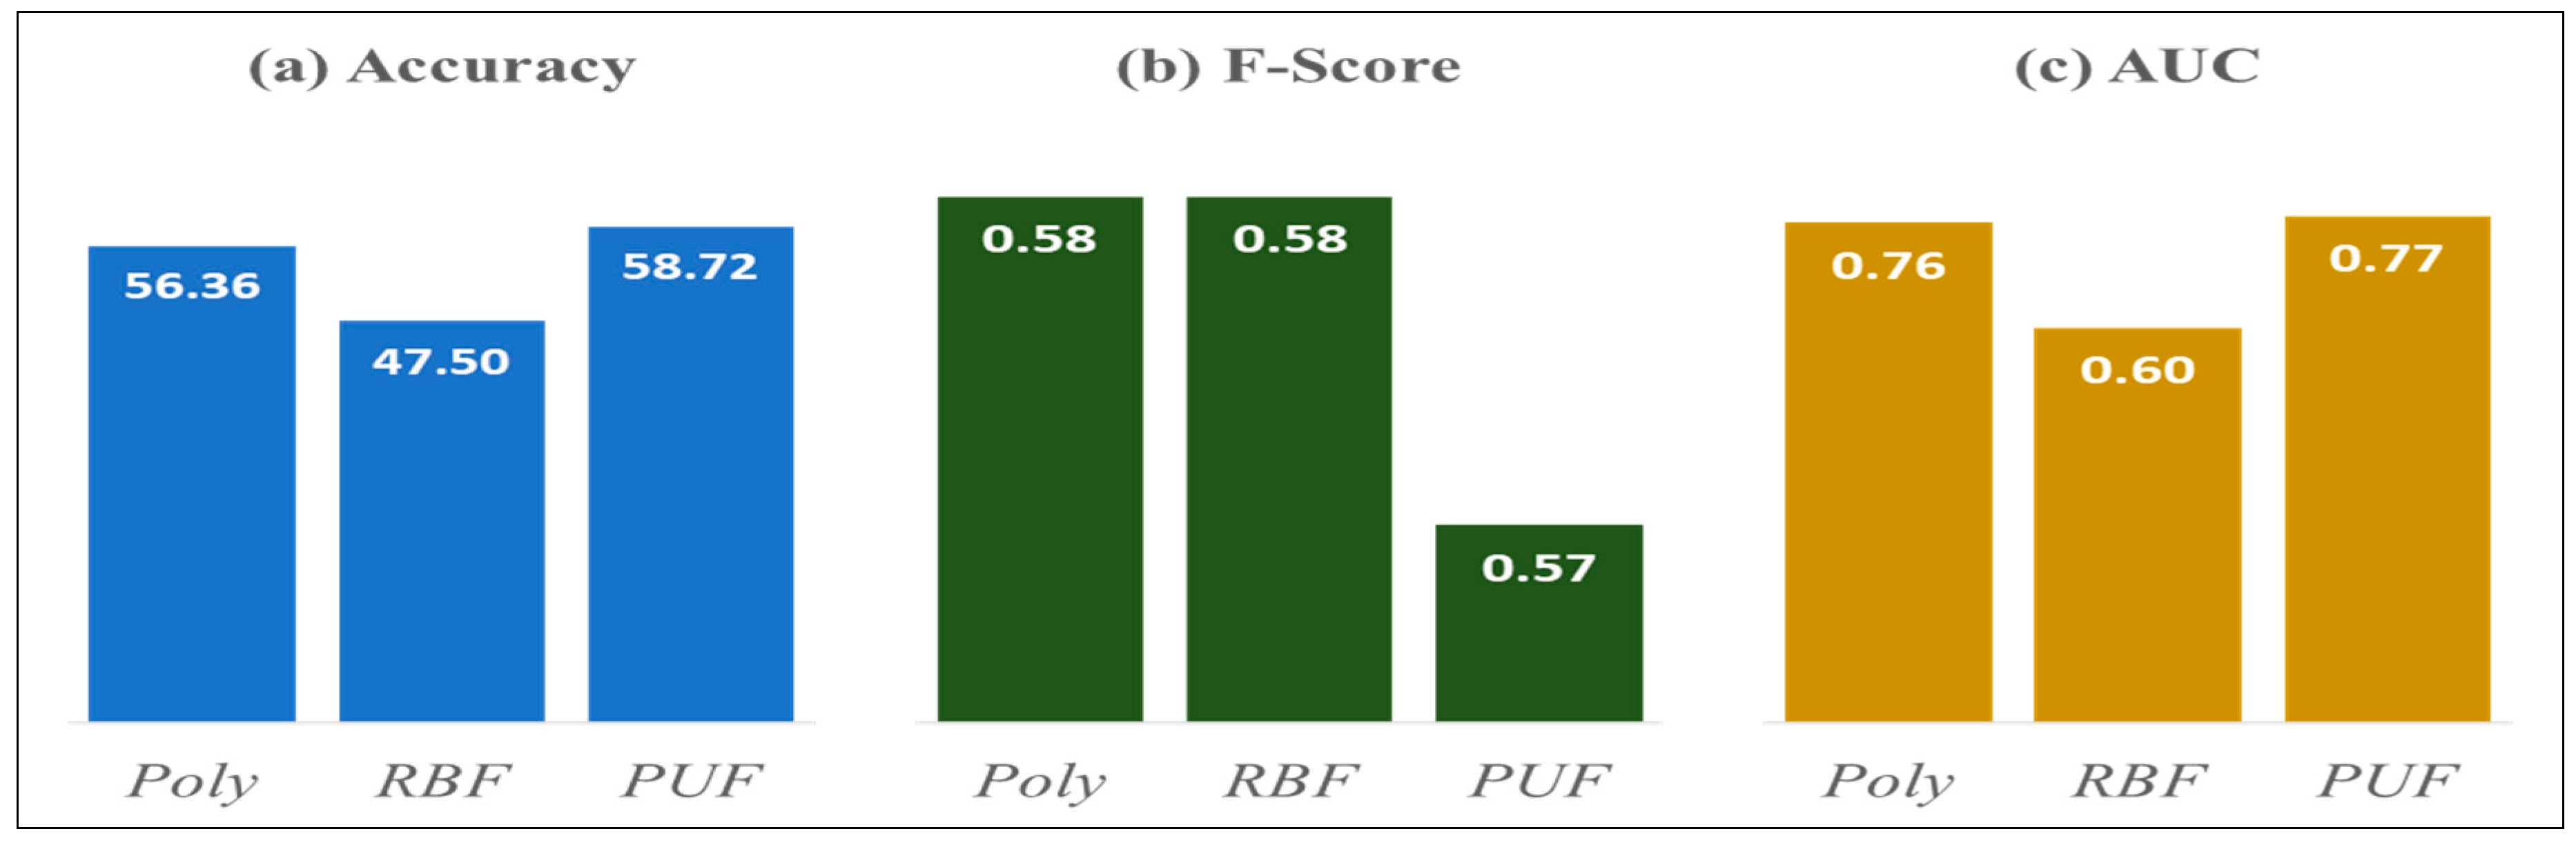
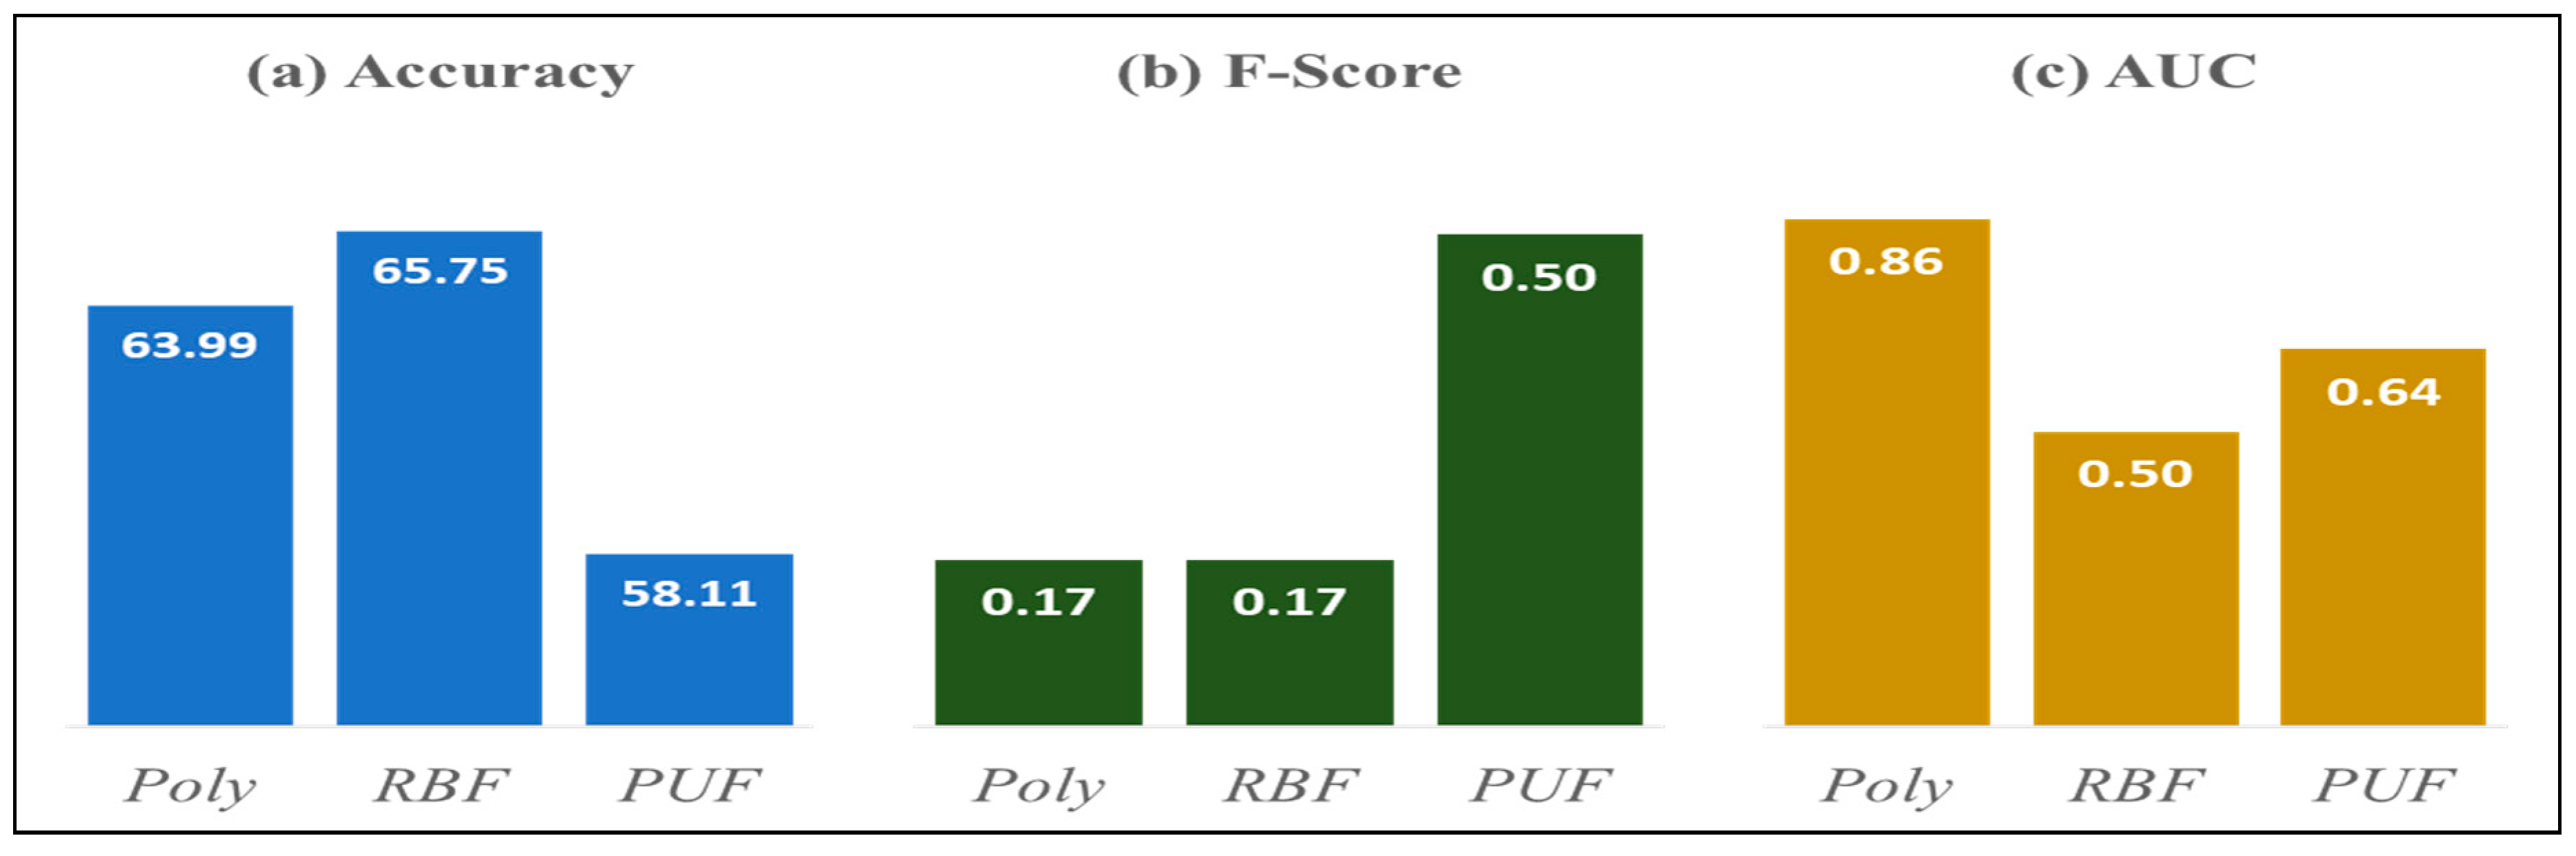
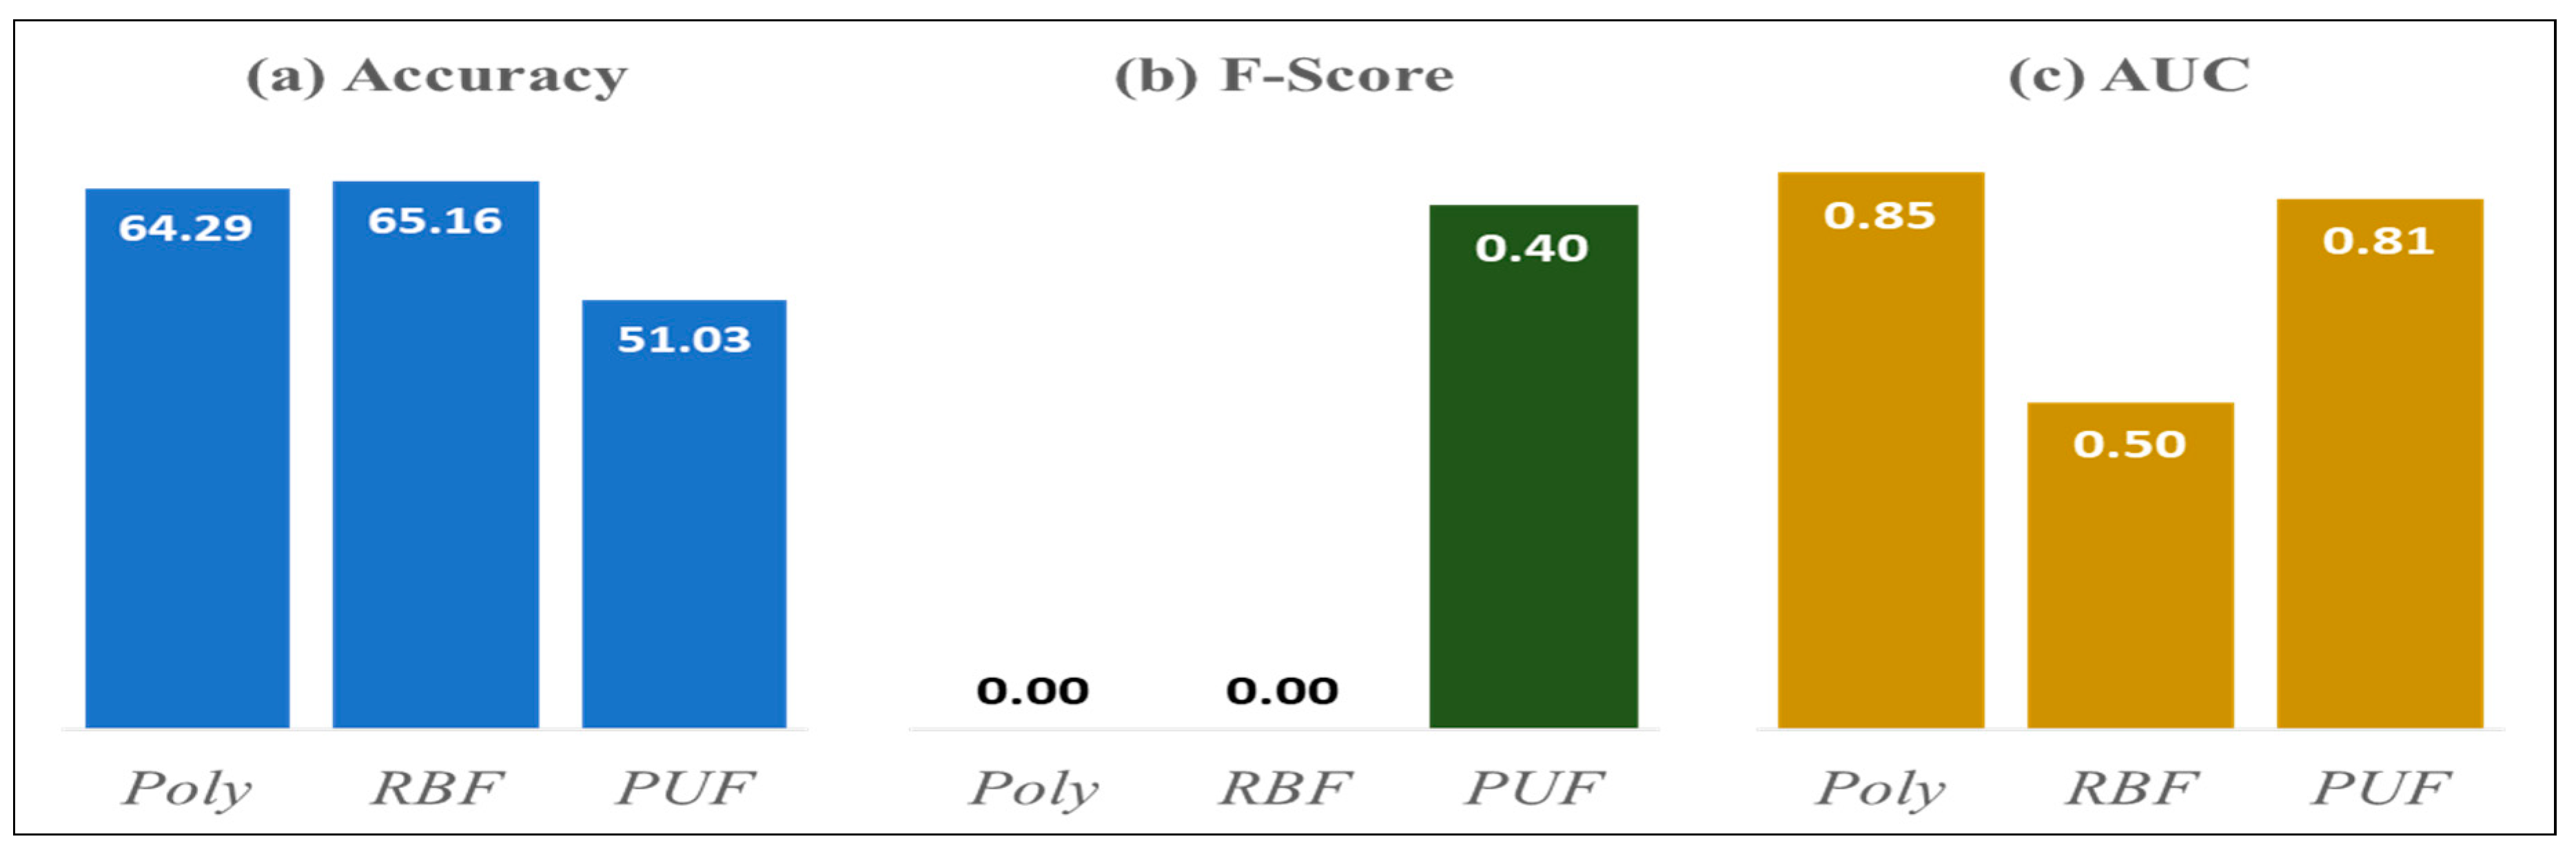
4.3. Ensemble SVM Classifiers
5. Discussion
5.1. Key Findings
5.2. Theoretical Implications
5.3. Limitations and Future Research
Author Contributions
Funding
Conflicts of Interest
References
- Park, J.-W.; Ryu, Y.K. Investigating the Effects of Airport Servicescape on Airport Users’ Behavioral Intentions: A Case Study of Incheon International Airport Terminal 2 (T2). Sustainability 2019, 11, 4171. [Google Scholar] [CrossRef]
- Wensveen, J. Air Transportation: A Management Perspective; Routledge: London, UK, 2018. [Google Scholar]
- Xu, X.; Zhou, Z.; Dou, Y.; Tan, Y.; Liao, T. Sustainable Queuing-Network Design for Airport Security Based on the Monte Carlo Method. Sustainability 2018, 10, 1. [Google Scholar] [CrossRef]
- Morosan, C. An empirical examination of US travelers’ intentions to use biometric e-gates in airports. J. Air Trans. Manag. 2016, 55, 120–128. [Google Scholar] [CrossRef]
- Ali, A.B. Travel and Trourism Management; Delhi: PHI Learning Private Limited: Delhi, India, 2015. [Google Scholar]
- Kim, M.W. Social Responsibility Report 2018; Korea Airports Corporation: Seoul, Korea, 2018. [Google Scholar]
- Marx, A.; Rihoux, B.; Ragin, C. The origins, development, and application of Qualitative Comparative Analysis: The first 25 years. Eur. Political Sci. Rev. 2014, 6, 115–142. [Google Scholar] [CrossRef]
- Zu, X.; Wu, Y.; Zhang, Z.; Yu, L. Prediction of Consumption Choices of Low-Income Groups in a Mixed-Income Community Using a Support Vector Machine Method. Sustainability 2019, 11, 3981. [Google Scholar] [CrossRef]
- Alimi, O.A.; Ouahada, K.; Abu-Mahfouz, A.M. Real Time Security Assessment of the Power System Using a Hybrid Support Vector Machine and Multilayer Perceptron Neural Network Algorithms. Sustainability 2019, 11, 3586. [Google Scholar] [CrossRef]
- Xue, Y.; Ren, J.; Bi, X. Impact of Influencing Factors on CO2 Emissions in the Yangtze River Delta during Urbanization. Sustainability 2019, 11, 4183. [Google Scholar] [CrossRef]
- Mrówczyńska, M.; Sztubecka, M.; Skiba, M.; Bazan-Krzywoszańska, A.; Bejga, P. The Use of Artificial Intelligence as a Tool Supporting Sustainable Development Local Policy. Sustainability 2019, 11, 4199. [Google Scholar] [CrossRef]
- Olivares-Mercado, J.; Toscano-Medina, K.; Sánchez-Perez, G.; Hernandez-Suarez, A.; Perez-Meana, H.; Sandoval Orozco, A.L.; García Villalba, L.J. Early Fire Detection on Video Using LBP and Spread Ascending of Smoke. Sustainability 2019, 11, 3261. [Google Scholar] [CrossRef]
- Huang, M.; Chen, C.; Lin, W.; Ke, S.; Tsai, C. SVM and SVM Ensembles in Breast Cancer Prediction. PLoS ONE 2017, 12, 1–14. [Google Scholar] [CrossRef]
- Sasikala, B.S.; Biju, V.G.; Prashanth, C.M. Kappa and accuracy evaluations of machine learning classifiers. In Proceedings of the 2nd IEEE International Conference on Recent Trends in Electronics, Information & Communication Technology, Bangalore, India, 19–20 May 2017. [Google Scholar]
- Abdelaal, M.M.A.; Sena, H.A.; Farouq, M.W.; Salem, A.-B.M. Using data mining for assessing diagnosis of breast cancer. In Proceedings of the IEEE International Multiconference on Computer Science and Information Technology, Wisła, Poland, 18–20 October 2010; pp. 11–17. [Google Scholar]
- Ahmad, L.G.; Eshlaghy, A.T.; Poorebrahimi, A.; Ebrahimi, M.; Razavi, A.R. Using three machine learning techniques for predicting breast cancer recurrence. J. Health Med. Inform. 2013, 4, 124. [Google Scholar]
- Huang, C.L.; Liao, H.C.; Chen, M.C. Prediction model building and feature selection with support vector machines in breast cancer diagnosis. Expert Syst. Appl. 2008, 34, 578–587. [Google Scholar] [CrossRef]
- Salama, G.I.; Abdelhalim, M.B.; Zeid, M.A.E. Experimental comparison of classifiers for breast cancer diagnosis. In Proceedings of the 2012 Seventh International Conference on Computer Engineering & Systems (ICCES), Cairo, Egypt, 27–29 November 2012; pp. 180–185. [Google Scholar]
- Senturk, Z.K.; Kara, R. Breast cancer diagnosis via data mining: Performance analysis of seven different algorithms. Comput. Sci. Eng. 2014, 4, 35–46. [Google Scholar] [CrossRef]
- You, H.; Rumbe, G. Comparative study of classification techniques on breast cancer FNA biopsy data. Int. J. Artif. Intell. Interact. Multimed. 2010, 1, 6–13. [Google Scholar] [CrossRef]
- Kittler, J.; Hatef, M.; Duin, R.P.W.; Matas, J. On combining classifiers. IEEE Trans. Pattern Anal. Mach. Intell. 1998, 20, 226–239. [Google Scholar] [CrossRef] [Green Version]
- Blalock, G.; Kadiyali, V.; Simon, D.H. The Impact of Post-9/11 Airport Security Measures on the Demand for Air Travel. J. Law Econ. 2007, 50, 731–755. [Google Scholar] [CrossRef]
- Farrell, S. How airports can fly to self-service biometrics. Biom. Technol. Today 2016, 2016, 5–7. [Google Scholar] [CrossRef]
- Wayman, J.; Jain, A.; Maltoni, D.; Maio, D. An Introduction to Biometric Authentication Systems; Springer: London, UK, 2005. [Google Scholar]
- Byun, S. Perceptions towards High-tech Service among its Early Adopters: In the Case of Fingerprint-enabled ATMs. Mark. Manag. Res. 2010, 15, 43–69. [Google Scholar]
- Rogers, E.M. Diffusion of Innovations; Free Press: New York, NY, USA, 2003. [Google Scholar]
- Sheth, J.N. Psychology of innovation resistance: The less developed concept. Res. Mark. 1981, 4, 273–283. [Google Scholar]
- Garner, S.J. Perceived risk and information sources in services purchasing. Mid-Atl. J. Bus. 1986, 24, 49–58. [Google Scholar]
- Kaplan, L.B.; Szybillo, G.J.; Jacoby, J. Components of perceived risk in product purchase: A cross-validation. J. Appl. Psychol. 1974, 59, 287–291. [Google Scholar] [CrossRef]
- Ko, H.; Jung, J.; Kim, J.; Shim, S.W. Cross-cultural differences in perceived risk of online shopping. J. Interact. Advert. 2004, 4, 20–29. [Google Scholar] [CrossRef]
- Shimp, T.A.; Bearden, W.O. Warranty and other extrinsic cue effects on consumers’ risk perceptions. J. Consum. Res. 1982, 9, 38–46. [Google Scholar] [CrossRef]
- Song, H.Y.; Jung, J.M.; Kim, Y. Factors affecting postponement, rejection, and opposition to 3DTV adoption. Media Econ. Cult. 2013, 11, 7–50. [Google Scholar]
- Stone, R.N.; Grønhaug, K. Perceived risk: Further considerations for the marketing discipline. Eur. J. Mark. 1993, 27, 39–50. [Google Scholar] [CrossRef]
- Featherman, M.S.; Pavlou, P.A. Predicting e-services adoption: A perceived risk facets perspective. Int. J. Hum.-Comput. Stud. 2003, 59, 451–474. [Google Scholar] [CrossRef]
- Moon, D.Y. Diffusion Factors of STEAM Education-Based on Rogers’ Diffusion of Innovations. Theory-J. Korean Pract. Arts Educ. 2016, 29, 133–150. [Google Scholar] [CrossRef]
- Mintrom, M. Policy Entrepreneurs and the Diffusion of Innovation. Am. J. Political Sci. 1997, 41, 738–770. [Google Scholar] [CrossRef]
- Rogers, E.M.; Shoemaker, F.F. Communication of Innovations: A Cross-Cultural Approach; Free Press: New York, NY, USA, 1971. [Google Scholar]
- Ram, S. A model of innovation resistance. Adv. Consum. Res. 1987, 14, 208–212. [Google Scholar]
- Bearden, W.O.; Netemeyer, R.G.; Teel, J.E. Measurement of consumer susceptibility to interpersonal influence. J. Consum. Res. 1989, 15, 473–481. [Google Scholar] [CrossRef]
- van Rijnsoever, F.J.; Oppewal, H. Predicting early adoption of successive video player generations. Technol. Forecast. Soc. Chang. 2011, 79, 558–569. [Google Scholar] [CrossRef]
- Fain, D.; Roberts, M.L. Technology vs. consumer behavior: The battle for the financial services customer. J. Direct Mark. 1997, 11, 44–54. [Google Scholar] [CrossRef]
- Laukkanen, T.; Kiviniemi, V. The role of information in mobile banking resistance. Int. J. Bank Mark. 2010, 28, 372–388. [Google Scholar] [CrossRef]
- Laukkanen, T.; Sinkkonen, S. Consumer resistance to internet banking: Postponers, opponents and rejectors. Int. J. Bank Mark. 2008, 26, 440–455. [Google Scholar] [CrossRef]
- Haas, E.P. Back to the Future-The Use of Biometrics, Its Impact of Airport Security, and How This Technology Should Be Governed. J. Air Law Commer. 2004, 69, 459–489. [Google Scholar]
- Szmigin, I.; Foxall, G. Three forms of innovation resistance: The case of retail payment methods. Technovation 1998, 18, 459–468. [Google Scholar] [CrossRef]
- Ragin, C.C. The Comparative Method: Moving beyond Qualitative and Quantitative Strategies; Univercity of California Press: Berkeley, CA, USA, 2014. [Google Scholar]
- Duşa, A. QCA with R: A Comprehensive Resource; Springer: Berlin, Germany, 2018. [Google Scholar]
- Rihoux, B.; Ragin, C.C. Configurational Comparative Methods: Qualitative Comparative Analysis (QCA) and Related Techniques; Sage Publications: Thousand Oaks, CA, USA, 2008. [Google Scholar]
- Schneider, C.Q.; Wagemann, C. Set-Theoretic Methods for the Social Sciences: A Guide to Qualitative Comparative Analysis; Cambridge University Press: Cambridge, UK, 2012. [Google Scholar]
- Liu, H.; Subramanian, A.M.; Hang, C. In Search of the Perfect Match: A Configurational Approach to Technology Transfer in Singapore. IEEE Trans. Eng. Manag. 2019, 1–12. [Google Scholar] [CrossRef]
- Byun, H.; Lee, S.W. A survey on pattern recognition applications of support vector machines. Int. J. Pattern Recognit. Artif. Intell. 2003, 17, 459–486. [Google Scholar] [CrossRef]
- Tsai, C.F.; Cheng, K.C. Simple instance selection for bankruptcy prediction. Knowl.-Based Syst. 2012, 27, 333–342. [Google Scholar] [CrossRef]
- Yekkehkhany, B.; Safari, A.; Homayouni, S.; Hasanlou, M. A comparison study of different kernel functions for SVM-based classification of multi-temporal polarimetry SAR data. Int. Arch. Photogram Rem. Sens. Spatial Inform. Sci. 2014, 2, W3. [Google Scholar] [CrossRef]
- Das, S.R.; Das, K.; Mishra, D.; Shaw, K.; Mishra, S. An empirical comparison study on kernel based support vector machine for classification of gene expression data set. Procedia Eng. 2012, 38, 1340–1345. [Google Scholar] [CrossRef]
- Buck, T.A.E.; Zhang, B. SVM kernels optimization: An example in yeast protein subcellular localization prediction. Project Report, School of Computer Science, Carnegie Mellon University, Pittsburgh, USA. Available online: https://pdfs.semanticscholar.org/0671/da2cf0d288d526a17aa2d7eddebe489429ff.pdf (accessed on 8 June 2018).
- Mezghani, D.B.A.; Boujelbene, S.Z.; Ellouze, N. Evaluation of SVM kernels and conventional machine learning algorithms for speaker identification. Int. J. Hybrid Inform. Tech. 2010, 3, 23–34. [Google Scholar]
- Baten, A.K.M.A.; Chang, B.C.H.; Halgamuge, S.K.; Li, J. Splice site identification using probabilistic parameters and SVM classification. BMC Bioinformatics 2006, 7, S15. [Google Scholar] [CrossRef]
- Zhang, G.; Ge, H. Support vector machine with a Pearson VII function kernel for discriminating halophilic and non-halophilic proteins. Comput. Biol. Chem. 2013, 46, 16–22. [Google Scholar] [CrossRef] [Green Version]
- Joshi, J.; Doshi, R.; Patel, J. Diagnosis and prognosis breast cancer using classification rules. International J. Eng. Res. Gen. Sci. 2014, 2, 315–323. [Google Scholar]
- Aruna, S.; Rajagopalan, S.P.; Nandakishore, L.V. Knowledge based analysis of various statistical tools in detecting breast cancer. In Proceedings of the International Conference on Computer Science, Engineering and Applications, Chennai, India, 15–17 July 2011; pp. 37–45. [Google Scholar]
- Happel, B.L.M.; Murre, J.M.J. The design and evolution of modular neural network architectures. Neural Netw. 1994, 7, 985–1004. [Google Scholar] [CrossRef]
- Schapire, R.E. The strength of weak learnabilty. Mach. Learn. 1990, 5, 197–227. [Google Scholar] [CrossRef]
- Breiman, L. Bagging predictors. Mach. Learn. 1996, 24, 123–140. [Google Scholar] [CrossRef] [Green Version]
- Bryll, R. Attribute bagging: Improving accuracy of classifier ensembles by using random feature subsets. Pattern Recognit. 2003, 36, 1291–1302. [Google Scholar] [CrossRef]
- Ho, T.K. The Random Subspace Method for Constructing Decision Forests. IEEE Trans. Pattern Anal. Mach. Intell. 1998, 20, 832–844. [Google Scholar]
- Bellman, R.E. Dynamic Programming; Courier Dover Publications: New York, NY, USA, 2003. [Google Scholar]
- Freund, Y.; Schapire, R.E. Experiments with a New Boosting Algorithm; International Conference on Machine Learning: Bari, Italy, 1996; pp. 148–156. [Google Scholar]
- Kohavi, R. A study of cross-validation and bootstrap for accuracy estimation and model selection. In Proceedings of the 14th International Joint Conference on Artificial Intelligence, Montreal, QC, Canada, 20–25 August 1995; pp. 1137–1143. [Google Scholar]
- Kim, Y. Incheon Airport Welcomed 100 Million Passengers with 72 Automatic Immigration Control; Edaily: Seoul, Korea, 2017. [Google Scholar]


| Studies | Kernels | Evaluation |
|---|---|---|
| Zu et al. [8] | Optimal | Precision |
| Alimi et al. [9] | Linear, Poly, RBF | Precision, Recall, F-Score |
| Xue et al. [10] | RBF | Accuracy |
| Olivares-Mercado et al. [12] | RBF | Precision, Recall, Accuracy, F-Score |
| Joshi et al. [59] | RBF | Accuracy |
| Ahmad et al. [16] | RBF | Accuracy |
| Aruna et al. [60] | RBF | Accuracy |
| Abdelaal et al. [15] | RBF | AUC |
| You and Rumbe [20] | Poly, RBF, Sigmoid | Accuracy |
| Huang et al. [17] | RBF | Accuracy |
| Variables | Type | N | % |
|---|---|---|---|
| Gender | Male | 168 | 49.6 |
| Female | 171 | 50.4 | |
| Age | 20s | 84 | 24.8 |
| 30s | 84 | 24.8 | |
| 40s | 84 | 24.8 | |
| 50s | 87 | 25.7 | |
| Frequency of Airport Use | 1~3 Times | 297 | 87.6 |
| 4~6 Times | 30 | 8.8 | |
| 6~9 Times | 6 | 1.8 | |
| Over 10 Times | 6 | 1.8 |
| Type (the Number of Questions) | Avg. (SD) | Question | Source | |
|---|---|---|---|---|
| Perceived Risk | Temporal Risk (3) | 3.27 (0.879) | Biometric e-gates will take too much time to learn how to use. | Stone and Grønhaug [33] |
| 3.40 (0.899) | If I use biometric e-gates, I think it will require more unnecessary procedures. It will take more time. | |||
| 3.33 (0.885) | I think I will waste even more time since I have to learn how to use biometric e-gates. | |||
| Socia Risk (3) | 3.45 (0.874) | Using biometric e-gates will have a negative impact on my perception/reputation. | Featherman and Pavlou [34] | |
| 3.82 (0.884) | If I use biometric e-gates, I’m sure that other people will find me strange. | |||
| 2.65 (0.848) | I’ll use biometric e-gates after seeing other people using it without going through any trouble. | |||
| Physical Risk (3) | 3.43 (0.925) | I am concerned about the physical fatigue caused by the use of biometric e-gates. | Stone and Grønhaug [33] | |
| 3.27 (0.976) | I’m worried that biometric e-gates might cause physical discomfort or other physical side effects. | |||
| 2.96 (0.966) | Since biometric e-gates has yet to be verified as safe, I am concerned about the physical risks using the system. | |||
| Functional Risk (3) | 2.53 (0.904) | I’m not sure whether the biometric e-gates system will work as well as it is said. | ||
| 2.86 (0.870) | I’m not sure if biometric e-gates will provide me with as much convenience and benefits as I’d expect. | |||
| 2.86 (0.877) | I’m not sure if the speed and convenience offered by biometric e-gates will be practical enough. | |||
| Perceived Benefits | Relative Advantage (3) | 2.43 (0.838) | Biometric e-gates will be more interesting compared to the conventional boarding system. | Rogers [26] |
| 3.09 (0.864) | If I use biometric e-gates, other people will think of me as being smart. | |||
| 2.36 (0.758) | The use of biometric e-gates will require less work from my side compared to the conventional boarding procedure. | |||
| Compatibility (3) | 2.92 (0.788) | Using biometric e-gates is in line with my values. | ||
| 3.03 (0.837) | Biometric e-gates is not much different from the conventional boarding system. | |||
| 2.65 (0.787) | Introducing the biometric e-gates procedure to the current boarding system is not a big problem. | |||
| Trialability (3) | 2.40 (0.776) | If I could try biometric e-gates right now, I think it would make me more open to the idea of using it in the future. | ||
| 2.41 (0.842) | If airlines or airports hold events about using biometric e-gates, it would definitely motivate me to use the system in the future. | |||
| 2.27 (0.793) | If there are more types of biometric e-gates in the future, it would be helpful for us to use the system with ease. | |||
| User Characteristics | Openness to Innovation (3) | 2.71 (0.776) | I tend to pursue new ideas or experiences. | Bearden, Netemeyer [39] |
| 2.67 (0.841) | I like to experience new things and make changes in my daily life. | |||
| 2.73 (0.856) | I am more interested in using new products or services than other people. | |||
| Independent Decision Making (3) | 2.42 (0.751) | Before using a new product or service, I tend to look for information provided by others. | van Rijnsoever and Oppewal [40] | |
| 2.50 (0.719) | I decide whether to use a new product or service after hearing the opinions from others who have already adopted them. | |||
| 2.48 (0.715) | I tend to be influenced by the evaluation from existing users when using new products or services. | |||
| Propagation Mechanism | Provision of Online Information (3) | 2.65 (0.775) | Online information such as an Internet article or a SNS event gave me good information about biometric e-gates. | Song et al. [32] |
| 2.82 (0.787) | I was able to understand the biometric e-gates process through the Internet articles or SNS. | |||
| 3.32 (0.880) | I have often heard and read about biometric e-gates through the Internet articles or SNS. | |||
| Provision of Offline Information (3) | 3.04 (0.821) | Newspaper articles, TV reports gave me good information about biometric e-gates. | ||
| 2.95 (0.812) | I was able to understand the newspaper articles, TV reports and installation ads about biometric e-gates. | |||
| 3.45 (0.856) | I have often been approached with newspaper articles, TV reports and installation ads about biometric e-gates. | |||
| Resistance | Weak Resistance (3) | 2.71 (0.835) | I’ll postpone my decision on using biometric e-gates until it turns out to be beneficial to me. | Szmigin and Foxall [45] |
| 2.84 (0.889) | I won’t use biometric boarding until I’m sure I need biometric e-gates. | |||
| 2.88 (0.879) | I won’t use biometric e-gates until I reach the conclusion that biometric boarding is a great system for me. | |||
| Strong Resistance (3) | 3.40 (0.869) | I don’t want to use biometric e-gates. | ||
| 3.24 (0.813) | Biometric e-gates isn’t for me. | |||
| 3.35 (0.810) | I don’t need biometric e-gates. | |||
| Model | incIN * | RoN ** | covN *** | |
|---|---|---|---|---|
| Weak Resistance is Present (WR) | ~PR + ~PB | 0.921 | 0.208 | 0.670 |
| PR + UC | 0.930 | 0.211 | 0.676 | |
| PR + PM | 0.921 | 0.246 | 0.681 | |
| UC + ~PM | 0.921 | 0.208 | 0.670 | |
| Weak Resistance is not present (~WR) | ~PR + PB | 0.955 | 0.224 | 0.373 |
| ~PR + ~PM | 0.902 | 0.231 | 0.356 | |
| Strong Resistance is present (SR) | ~PR + ~PB | 0.922 | 0.491 | 0.910 |
| PR + UC | 0.922 | 0.491 | 0.910 | |
| PR + PM | 0.916 | 0.561 | 0.919 | |
| UC + ~PM | 0.919 | 0.482 | 0.907 | |
| ~PR + PB + ~UC + ~PM | 0.906 | 0.483 | 0.900 | |
| Strong Resistance is not present (~SR) | ~PR | 0.903 | 0.254 | 0.108 |
| PB + ~UC + ~PM | 0.903 | 0.273 | 0.110 | |
| Weak Resistance | Strong Resistance | ||||||
|---|---|---|---|---|---|---|---|
| Construct | Configuration | ||||||
| 1 | 2 | 1 | 2 | 3 | 4 | 5 | |
| PR | • | • | • | • | × | ||
| PB | × | × | × | • | • | × | |
| UC | × | × | • | ||||
| PM | × | • | × | • | |||
| Consistency | 1.000 | 0.952 | 1.000 | 0.964 | 0.952 | 1.000 | 0.965 |
| PRI | 1.000 | 0.952 | 1.000 | 0.964 | 0.952 | 1.000 | 0.965 |
| Raw Coverage | 0.026 | 0.088 | 0.169 | 0.172 | 0.065 | 0.032 | 0.266 |
| Unique coverage | 0.009 | 0.070 | 0.068 | 0.062 | 0.049 | 0.026 | 0.172 |
| Overall solution consistency | 0.957 | 0.962 | |||||
| Overall solution coverage | 0.097 | 0.494 | |||||
| Dependent Variable | Accuracy | F-Score | AUC |
|---|---|---|---|
| Weak Resistance | Polynomial | Polynomial, RBF | Polynomial |
| Strong Resistance | RBF | PUF | Polynomial |
| Dependent Variable | Accuracy | F-Score | AUC |
|---|---|---|---|
| Weak Resistance | PUF | Polynomial, RBF | PUF |
| Strong Resistance | RBF | PUF | Polynomial |
| Dependent Variable | Accuracy | F-Score | AUC |
|---|---|---|---|
| Weak Resistance | PUF | PUF | Polynomial, PUF |
| Strong Resistance | RBF | PUF | Polynomial |
| Dependent Variable | Accuracy | F-Score | AUC |
|---|---|---|---|
| Weak Resistance | Polynomial | Polynomial, RBF | PUF |
| Strong Resistance | RBF | RBF, PUF | PUF |
| Weak Resistance | Single SVM | BA SVM | RSS SVM | ADA SVM |
| Accuracy | Polynomial | PUF | PUF | Polynomial |
| 58.42% | 58.72% * | 57.25% | 58.42% | |
| F-Score | Polynomial, RBF | Polynomial, RBF | PUF | Polynomial, RBF |
| 0.58 * | 0.58 * | 0.51 | 0.58 * | |
| AUC | Polynomial | PUF | Polynomial, PUF | PUF |
| 0.74 | 0.77 * | 0.75 | 0.74 | |
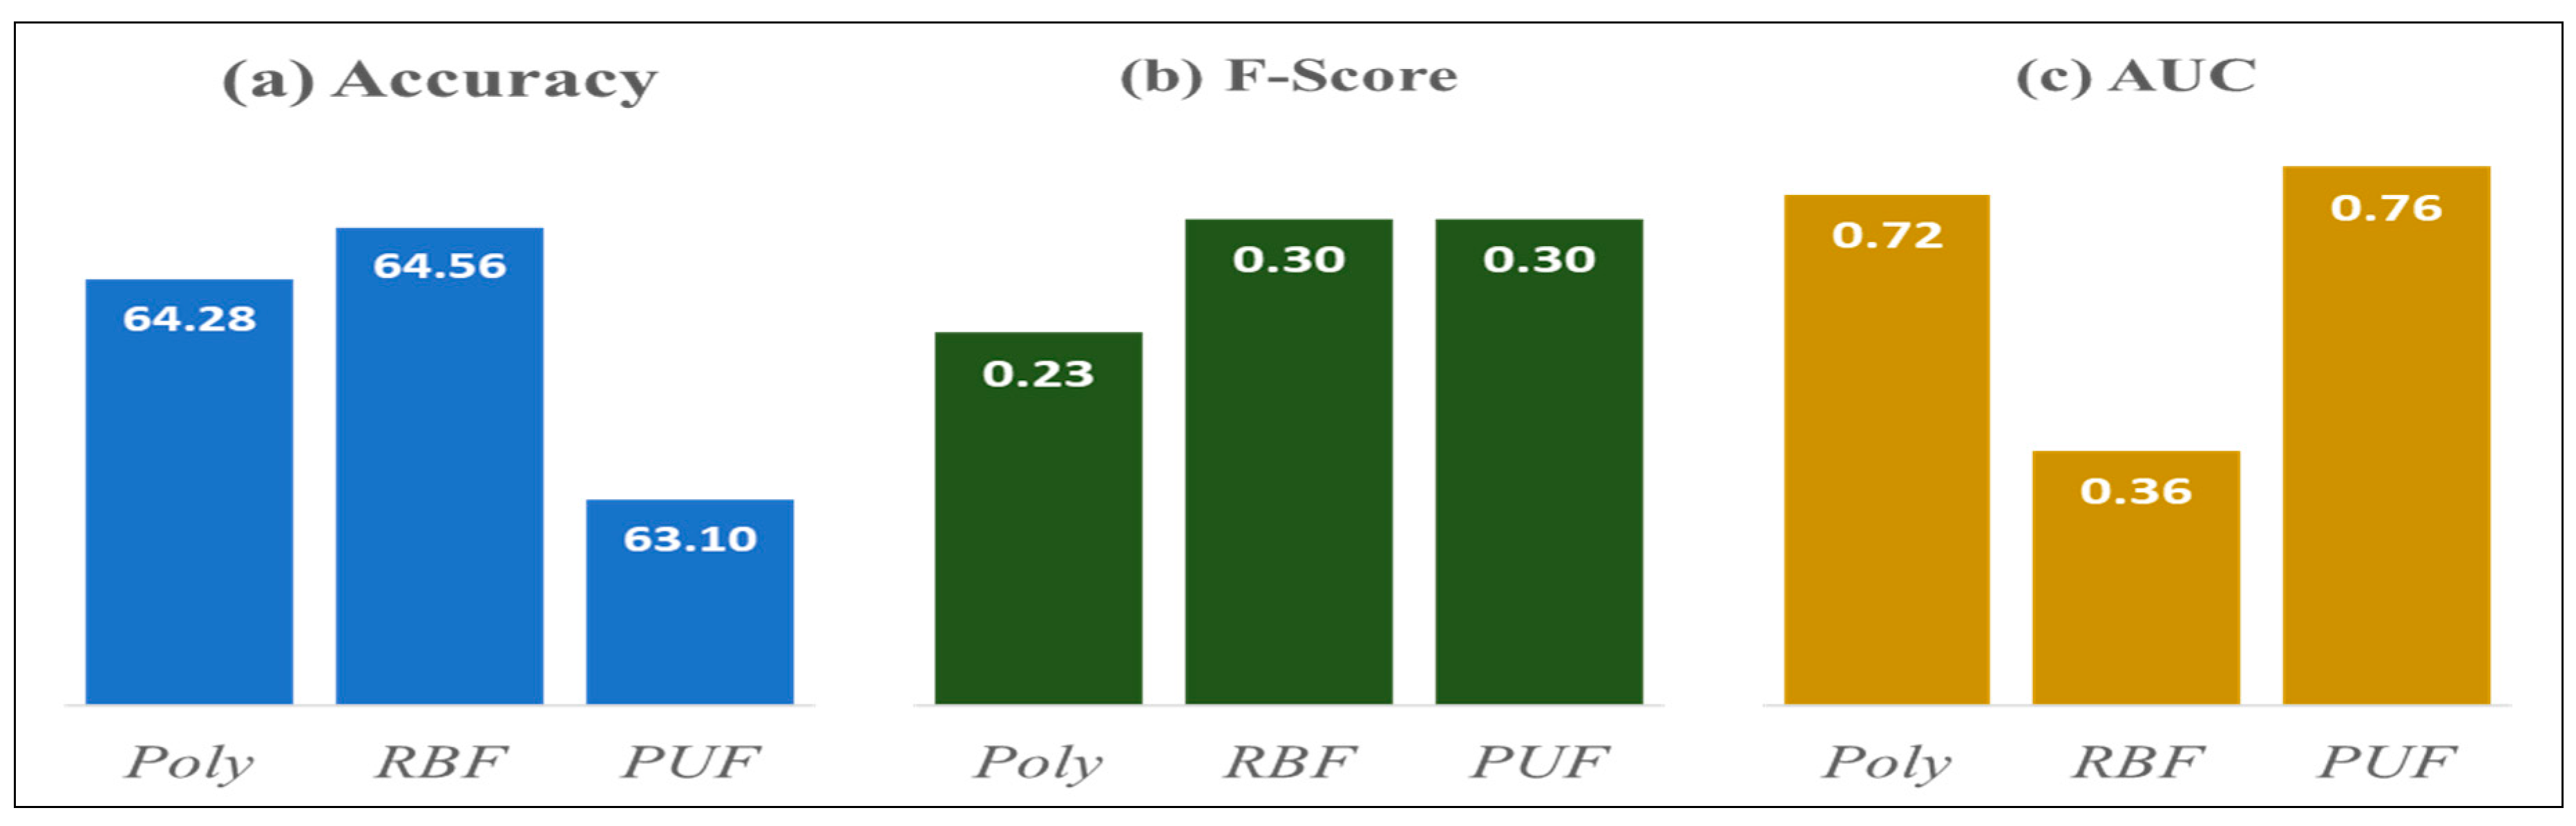
| Strong Resistance | Single SVM | BA SVM | RSS SVM | ADA SVM |
| Accuracy | RBF | RBF | RBF | RBF |
| 64.56% | 65.75% * | 65.16% | 64.56% | |
| F-Score | PUF | PUF | PUF | RBF, PUF |
| 0.45 | 0.50 * | 0.40 | 0.30 | |
| AUC | Polynomial | Polynomial | Polynomial | PUF |
| 0.79 | 0.86 * | 0.85 | 0.76 |
© 2019 by the authors. Licensee MDPI, Basel, Switzerland. This article is an open access article distributed under the terms and conditions of the Creative Commons Attribution (CC BY) license (http://creativecommons.org/licenses/by/4.0/).
Share and Cite
Kim, C.; Costello, F.J.; Lee, K.C. Integrating Qualitative Comparative Analysis and Support Vector Machine Methods to Reduce Passengers’ Resistance to Biometric E-Gates for Sustainable Airport Operations. Sustainability 2019, 11, 5349. https://doi.org/10.3390/su11195349
Kim C, Costello FJ, Lee KC. Integrating Qualitative Comparative Analysis and Support Vector Machine Methods to Reduce Passengers’ Resistance to Biometric E-Gates for Sustainable Airport Operations. Sustainability. 2019; 11(19):5349. https://doi.org/10.3390/su11195349
Chicago/Turabian StyleKim, Cheong, Francis Joseph Costello, and Kun Chang Lee. 2019. "Integrating Qualitative Comparative Analysis and Support Vector Machine Methods to Reduce Passengers’ Resistance to Biometric E-Gates for Sustainable Airport Operations" Sustainability 11, no. 19: 5349. https://doi.org/10.3390/su11195349