
Leveraging User Preferences to Develop Profitable Business Models for Electric Vehicle Charging †

Fraunhofer Institute for Industrial Engineering IAO, Nobelstr. 12, 70569 Stuttgart, Germany
*
Author to whom correspondence should be addressed.
†
This article is based on a conference paper with the same title that has been submitted to the International Electric Vehicle Symposium & Exhibition EVS 33 in 2020.
World Electr. Veh. J. 2021, 12(2), 60; https://doi.org/10.3390/wevj12020060
Submission received: 18 March 2021
/
Revised: 1 April 2021
/
Accepted: 9 April 2021
/
Published: 12 April 2021
(This article belongs to the Special Issue Selected Papers from The 33rd International Electric Vehicles Symposium and Exhibition (Portland, Oregon, USA))
Abstract
:To design profitable business models for electric vehicle (EV) charging it is necessary to understand user preferences. For this purpose, prior literature is analyzed to develop a conceptual framework linking a company’s assets, the surrounding value network, and user preferences. Then, survey insights from two EV charging projects (ultra-E, SLAM) are summarized to illustrate user preferences in this area. Based on this data, the framework is eventually visualized by applying it to four case studies from the EV charging market. Based on the case studies, the following six key findings are derived: 1. Companies that have a very strong position in one of the three resource classes that define the quality-of-service provision (physical assets, digital assets, brand image) demand a higher price for fast charging. 2. Utility companies leverage their existing customer base. 3. New to the industry firms leverage their brand image to enter the market. 4. Selling below cost is not sustainable. 5. Sharp price distinctions reflect the power balance within the value network. 6. Power plays may result in a fragmented market.
1. Introduction
1.1. Motivation & Prior Research
Despite the implementation of several measures to harmonize the market for electric vehicle (EV) charging in Germany, e.g., the Verification Act (Eichrecht) and the Price Indication Ordinance (Preisangabenverordnung), users have until recently faced an inhomogeneous landscape of charging tariffs and prices [1]. Almost two years after the final directives regarding the Verification Act came into effect the tariffs are mostly kWh-based, but inhomogeneities in charging prices remain [2]. At the same time, providers of charging services struggle to establish profitable business models [3,4,5,6]. Several studies have addressed user preferences concerning the usage and pricing of charging services [7,8,9,10]. However, only a few studies connect these results to how the charging ecosystem for electric mobility shall be designed.
1.2. Objectives
The paper aims to outline the critical user preferences and decision criteria relevant for designing a profitable business model for electric vehicle charging, users being defined as individual end-users or consumers (in contrast to e.g., fleet operators having contracts with e-mobility service providers). Building on these insights, the paper in hand will help companies to define their “play” in a network of interrelated actors.
This research pays special attention to the focal company’s situation in a network of interrelated actors [11] and its user-oriented influencing factors on charging services’ acceptance and attractivity. Based on the analysis of users’ likings and the comparison with established sectors, it is the goal to develop a conceptual framework that connects a company’s resources or assets, the value network it is embedded in, and user preferences. For this purpose, the paper builds upon an approach suggested by Rüger and Fischer [12]. In Section 2, the state of the art is analyzed and, concurrently, a conceptual framework is developed. Section 3 focuses on user preferences, one of the easily observable elements of the framework. In Section 4, the framework is exemplarily applied to understand observable business model choices of four companies that are active in the EV charging market. Finally, the results are summarized, and paths for further research are illustrated in Section 5.
1.3. EV Charging as One Example for an Emerging Mobility Ecosystem: Cooperation and Interaction of Actors for Joint Service Provision
Value is not always created in a linear process by a single firm but often results from cooperation and interaction. Stabell and Fjeldstad identified three different value configurations: the value chain, the value shop, and the value network, the latter describing the value created by a firm offering mediating technologies. The firm creates a network by linking other firms and/or customers thus enabling cooperation and interaction. According to Stabell and Fjeldstad, “examples of firms that rely on a mediating technology are telephone companies, retail banks, insurance companies, and postal services” [13].
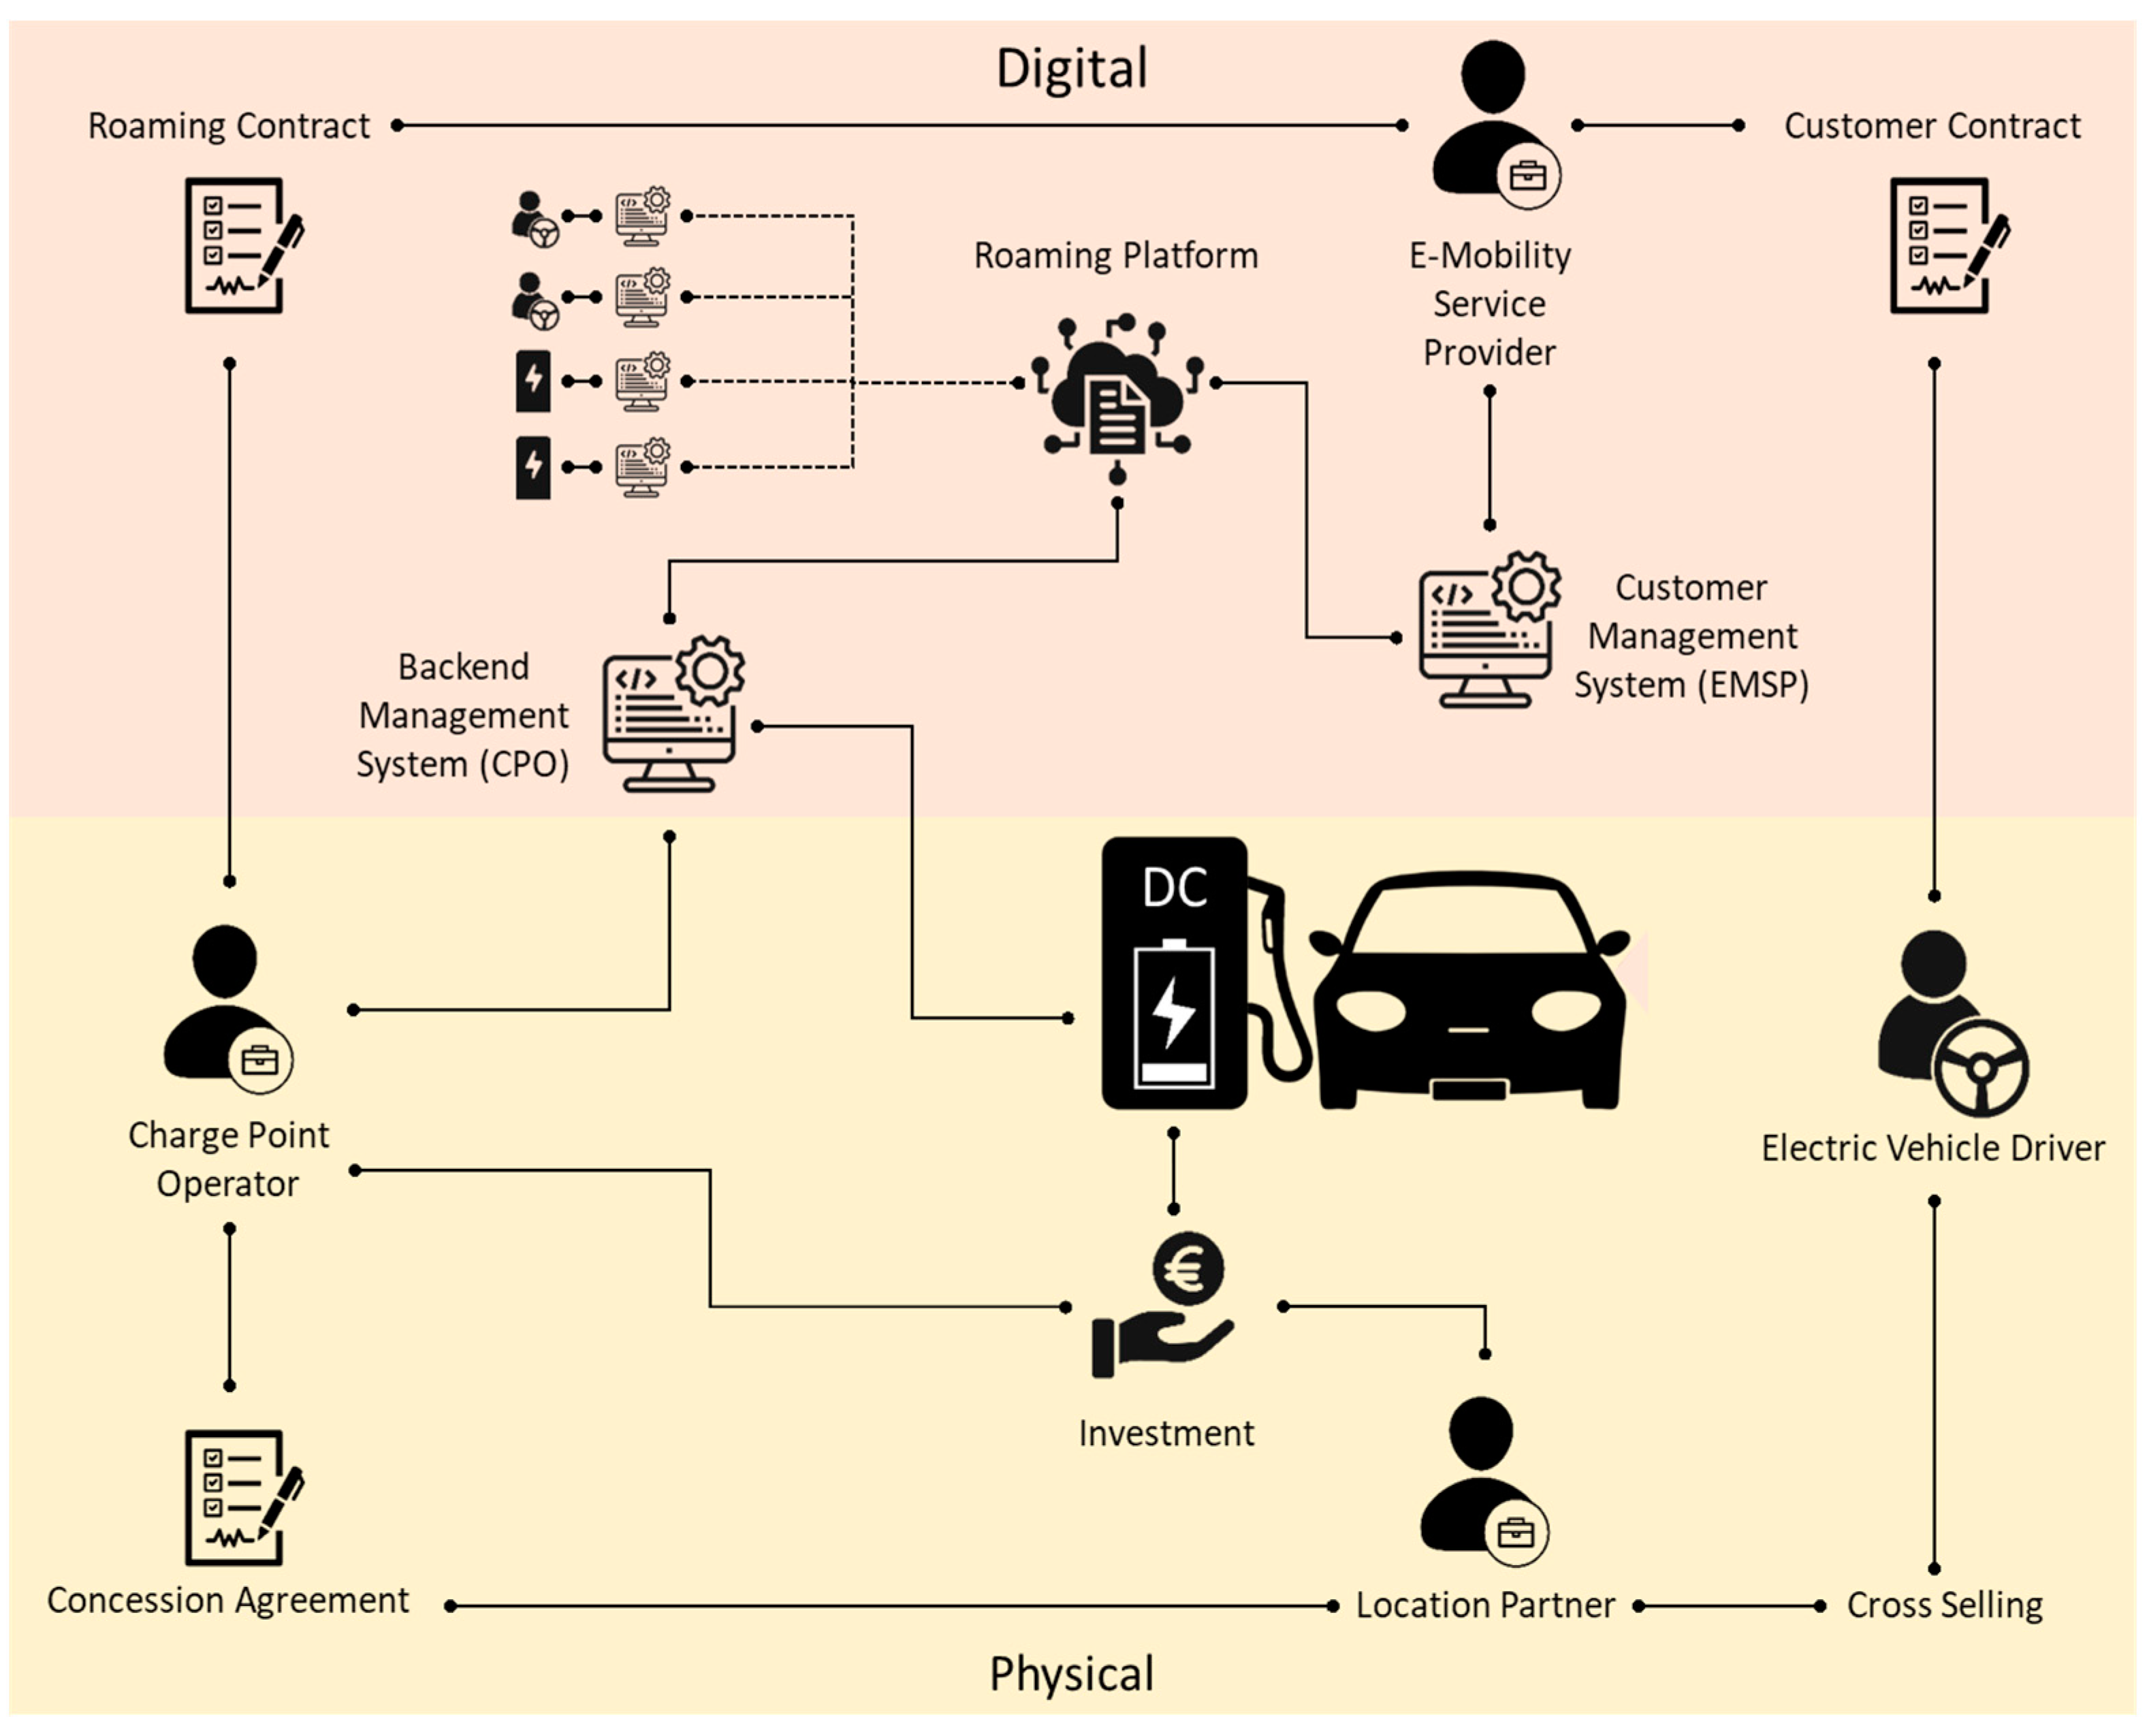
The value creation in the case of electric vehicle charging is also based on cooperation and interactions between multiple actors. Figure 1 provides an overview of the actors and their cooperation in the electric vehicle charging process with its key roles electric mobility service provider (EMSP), charge point operator (CPO), location partner, and electric vehicle driver.
In accordance with Stabell and Fjelstad’s model of value networks, mediators link electric vehicle drivers and CPO on a physical and digital level. In the physical world, the location partner is connecting the electric vehicle driver to the CPO by building or permitting charging infrastructure on its premises. In the (digital) service world, the EMSP is connecting EV drivers (through a smartphone/in-car app or an RFID-card) to the backend management system of the CPO, which allows unlocking the charging station and the payment of the charging session. Thus, in most cases, this “value network” involves several actors that bring different resources to the “joint value sphere” [13,14].
2. Materials and Methods: State of the Art Used to Develop a Conceptual Framework
2.1. Quality-of-Service Provision Defined by Digital and Physical Assets and Brand Image
Before assessing business models and their influencers it is helpful to classify the process of EV charging. Both Moore’s concept of “business ecosystems” [15] as well as Tukker’s model of product-service systems [16] seems to be helpful in this context. Moore is focusing the cooperation of “actors whose individual business activities share in some large measure the fate of the whole community”, while Tukker describes an interplay of both product and service dimensions for value creation (Figure 2). For EV charging both theories apply: Usually, a more tangible component (the charging station) provided by one actor (the CPO) is used together with a more intangible service component (access to charging station) provided by another actor (the EMSP).
McNaughton, Osborne, and Imrie developed a model that includes the relation between firm assets, competitive advantage, and perceived customer value in service firms. Customer value can be created by gaining competitive advantages which in turn result from largely intangible market-based assets (e.g., knowledge about the market, relations, and their interaction) and other asset types [17]. Following the resource-based view (RBV), a company can gain a competitive advantage by having valuable, rare, imperfectly imitable, and not substitutable resources and assets [18]. Even though the RBV implies a positive impact of resources with said characteristics on the firm’s competitiveness, this does not necessarily grant a superior performance. If advantages are only discrete, not fully exploited or a firm has many but misses a critical advantage a superior performance can fail to appear [19]. Thus, it can be assumed that the right physical assets can have a positive impact on competitiveness and hence on the service quality.
While the RBV could also be applied to digital assets, the impact is, in this case, more sensitive to the actual use process. A synthesis by Soh and Markus focuses on how IT influences a firm’s competitiveness and performance. It is stated that the IT assets gain their impact through usage. Appropriate use leads to positive impacts on competitiveness and performance [20]. Despite referring to internal IT assets, these findings can also be transferred to more customer-oriented digital assets. Bharadawi et al. describe value creation through digital assets as “multilayered where a company gives away certain products or services in one layer to capture value at a different layer” [21]. Furthermore, Keen and Williams identify the interface to customers, partners, and suppliers as a key role of digital businesses [22].
A study by Malik et al. found that brand image has a positive impact on customer satisfaction [23], which suggests considering the brand image as a component of service provision. Davis states that through a strong brand higher margins and customer lifetime can be achieved. It attracts better employees and thus leads to better management, product, and service quality [24]. In the service sector, brand equity relies on the brand attitude and image, the former having a bigger impact. Brand equity also has a positive influence on brand preference which finally leads to higher purchase intention [25].
Thus, the overall performance of service provision is mainly determined by the resource configuration consisting of physical and digital assets as well as the brand image. As EV charging relies on the cooperation and interaction of multiple actors [5], it is possible for a firm to only obtain some of the described assets and exploit other firms’ assets which are accessible through the value network. Figure 3 visualizes the influence of cooperation and interaction on the performance of service provision.
2.2. Power Balance in the Value Network
As the value creation in the case of EV charging is carried out by a network, respectively through cooperation, the question arises how a focal company can gain a power position. Regarding horizontal cooperation, Bleeke and Ernst identified the initial strengths and weaknesses of the partners, as well as those over time and, additionally, the potential for competitive conflicts as main factors for relative bargaining power [26]. Gomes-Casseres presents two further approaches to how advantage can be attained. The first is of gaining power over partners through the position in the network, which is also supported by Nohria and Garcia-Pont [27], Burt [28], and Lorenzoni and Baden-Fuller [29]. The second approach based on the works of Pfeffer and Salancik [30], Brandenberger and Nalebuff [31], and Ghemawat et al. [32] explain the possibility of extracting profit from partners by adding scarce resources to the network. As both approaches are important and often interdependent, Gomes-Casseres’ synthesis elaborates factors that may lead to competitive advantages and increase a firm’s claim on value (Table 1) [33]. For further understanding, the factors are exemplarily applied to the electric vehicle charging market: A firm can gain bargaining power from owning valued assets like fast-charging stations or a large customer base. Moreover, the focal firm, e.g., an EMSP, profits from competition among its suppliers, e.g., several charge point operators in the same area. Moreover, a company profits from participating in multiple constellations, i.e., being connected to a high number of other EMP or CPO players. Finally, occupying structural holes, “disconnections or nonequivalences between players in the [competitive] arena” [28], can provide a benefit, for instance when a specific CPO does operate charging infrastructure in a certain area that is not served by other CPO players.
Although there is no need for a firm with a competitive advantage in a network, every network needs lead firms that are effectively communicating the business ideas’ attractiveness and thereby attracting valuable partners [34,35]. In general, it can be assumed that larger firms have more power as they can benefit from a better bargaining position [36], and thereby have better prerequisites for taking a leadership position. It becomes clear that not the sheer size of a firm but their contribution to the network, such as controlling valued assets or playing a central role in the network, defines the bargaining position and thus the power balance.
The general effect of market power on firms’ profitability was examined by Mann. According to Bain, market power is determined by an industry’s concentration ratio as well as its barriers to entry. Regarding 30 industries independent influences of concentration ratio and entry barriers on the average profit rate were determined [37]. Furthermore, Church and Ware explain the positive correlation between market power and profitability [38]. Therefore, it can be assumed that a profitable business model is related to the power position of a firm (cf. Figure 4).
2.3. Customer Satisfaction: Antecedents and Its Impact on Business Model Profitability
In general, customer satisfaction has a large impact on a company’s profitability [39,40], which is why it should be considered for the development of business models. Compared to a somewhat satisfied or dissatisfied customer, a totally satisfied customer contributes between 2.6 and 17 times more to a company’s revenue which makes the satisfied customer essential for profitable business models [40].
While customer satisfaction can be highly affected by the characteristics of a company’s employees [41] this is not directly applicable for EV charging as this does not necessarily require customer-employee-contact. Other models regard the value/price relationship of a product or the product quality as satisfaction dimensions [42]. Due to the charging infrastructure’s bilateral product-service composition, a comparison to the telecommunications sector is possible. There, customer satisfaction is influenced by the service quality as well as by price and brand image. Service quality and price can be seen as parts of the performance of service provision with the brand image as a mediating factor [23]. Following Tukker’s notion of user-oriented product-service systems [16], the process of EV charging can be considered as the “product sold” with its quality/performance determined by factors like location, charging speed, tariffs, and payment methods.
One way of assessing user satisfaction is to compare customers’ predicted and acquired value [43]. For business model development, instead of predicted value, the customer’s desired value can be taken into consideration, which focuses on needs and desires [44] and can hence be described as preferences. Therefore, user preferences are moderating the relationship between the performance of service provision and customer satisfaction, meaning only if the performance of service provision matches the respective user’s preferences, customer satisfaction and eventually, business model profitability, can be achieved (cf. Figure 5).
2.4. Overall Hypothesis
Putting the three pieces described above together, an extensive set of presumed correlations emerges (cf. Figure 6). While the resource configuration as well as the corresponding contribution to the value network vary from firm to firm and cannot be easily observed, others can be assessed. User preferences, for instance, can be surveyed and are thus exemplarily presented in the following chapter.
3. Results: Examining User Preferences as One Observable Element of the Framework
As described above, to develop a profitable business model, it is important to have a clear picture of what users of EV charging infrastructure want, need, or expect. In past projects, the authors have analyzed user preferences through online surveys. As part of the study “Market and Business Model” of the European TEN-T infrastructure project “ultra-E”, the ultra-E survey (n = 2977) focused on potential user behavior regarding high power charging stations located in city centers and along highways. The SLAM survey, part of a German infrastructure rollout and research project, addressed potential business models in the context of user attitudes.
Compared to fueling an ICEV, the market for EV charging exhibits much heterogeneity: Users can charge their car at different locations, e.g., at home or a variety of public charge points, and at different power levels, e.g., slow charging at 3.7 kW or fast charging at 100 kW. EV charging is not as homogenous of a service as fueling an ICE vehicle. Instead, it consists of many different use cases. Prior studies on the topic have taken this into account. In the ultra-E survey, participants had to choose one out of three charging options. On the one hand, they had to cover their primary charging need, assuming they could charge their car neither at home nor at work, and on the other hand they should choose one option for recharging during a long-distance trip. Figure 7 displays preferences to cover primary charging needs while choices for range increase are shown in Figure 8. The relatively slow 50 kW charging is less attractive on long-distance trips (54% vs. 43%) than for primary charging needs [8].
The SLAM survey addresses the reasons for choosing or not choosing various types of charging infrastructure. Apparently, if users are aware of the charging speed, they can expect from a certain type of charging infrastructure, the charging speed is not much of a reason for not choosing a charging option. As shown in Figure 9, less than 15% of the people who rarely use a charging option have stated the slow charging speed as a cause. This also pertains to charging at home, charging at work, and streetside charging, which are usually considered relatively slow charging options. However, for 87% respectively 79% of the frequent users of charging stations at on- and nearby-highway service stations, the high charging speed is decisive. Thus, fast charging could be considered the main decision driver in favor of a charging option, while a slow charging speed not necessarily has a negative impact. In contrast, the price seems to influence the attractiveness of a charging option in both ways: “Charging is more expensive than elsewhere” is a reason for rare use, “Charging is cheaper than elsewhere” a reason for frequent use [9]. A look at the mobile communications, domestic power supply, and petrol services sector shows a clear dominance of the price as the main decision driver [45,46,47], which is attributable to the low differentiation of respective products. And even if there are heterogeneous products like green electricity in the domestic power supply market, its influence on users’ preferences is insignificant. Indeed, the willingness to pay is even lower for green power than for the normal electricity mix [48]. However, despite the price’s dominance, other factors still play a role, for instance, brand awareness (see above). Given equal tariffs and a selection of domestic power suppliers as well as big brands (from other markets) more than a fourth of respondents could imagine switching to a big brand that is currently not active in the energy market [49].
Regarding different billing options for EV charging the SLAM survey queried the attractivity of five billing options using a five-point Likert scale. The results, divided into drivers of battery electric vehicles and non-drivers, are displayed in Figure 10. Billing via EC/credit card is the most attractive option. The other mostly known billing option, a digital payment service provider such as “PayPal”, is overall still attractive but not as much as EC and credit card. The results of a survey measuring the attractivity of paying via smartphone in 2016 show similar levels of attractivity [50] with a slight shift towards positive appraisal. This and the development of the actual usage of smartphones or tablets as means of payment (12% in 2016 [51] vs. 25% in 2019 [52]) belay a change in user preferences and suggest further increase of digital payment attractivity. These findings also apply to the billing via a (new kind of) third-party provider (=EMSP) as they offer digital payment but also include RFID cards. This option was given a mediocre evaluation but with a more detailed view, distinct differences between BEV users and non-users can be observed. While non-users rate billing via third-party providers as a rather unattractive payment method, BEV users have a more positive attitude in this regard. A possible reason for this differentiation could be that BEV users are generally more open-minded towards innovations—after all, they rely on new technology, at least in the area of mobility.
While payment via the house electricity contract is almost as attractive as payment via EC/credit card, payment via the vehicle manufacturer is considered the least attractive option. Nevertheless, both options are more likely to be evaluated positively by BEV users than by non-users.
To make a statement regarding the differences between BEV users and non-users, as well as differences between the billing options, it is necessary to consider significances rather than just descriptive statistics. Due to statistical reasons, a different split of the sample at hand is created: the group “mostly BEV users” consists of 481 experienced BEV drivers that have been sampled from existing contacts and through an e-mobility focused newsletter (electrive.net). The group “mostly ICEV users” is a representative sample of 669 German car drivers.
Concerning the variation between the groups of “mostly BEV users” and “mostly ICEV users”, the Levene test indicates variance inhomogeneity for the billing scenarios one to three. For this reason, a Welch test is used for detecting significant differences between the two stated groups. As shown in Table 2, significant differences (p < 0.01) can be observed for all billing options but the car manufacturer.
Besides the differences between the two samples, the differences between the ratings of the individual billing options can be validated. Therefore, a variance analysis is conducted. Due to a significant Mauchly-test, sphericity cannot be assumed. Thus, a Greenhouse–Geisser correction is used. Table 3 contains the results of the variance analysis which indicate a strong difference (p < 0.001) between the individual billing options’ ratings.
To better assess the diversity between the individual options, a pair-wise comparison exhibits significant differences in the ratings. As shown in Table 4 and Table 5 the differences between the billing options are significant in both samples except between digital payment service provider and EC/credit card in the group “mostly ICEV users”.
The findings from above can now be converted into a ranking of the different billing options. As presented in Figure 11, the billing via credit card is rated best in both samples (alongside digital service provider among “mostly ICEV users”) while car manufacturer and third-party provider rank last.
At this point, the question arises why billing via the house electricity contract is that much more attractive than via the car manufacturer. One possible reason is that charging at home is already billed via the house electricity contract for which reason a consolidation of the payment for all charging processes is seen as attractive. Billing the car’s energy cost via the car manufacturer is not very common yet, especially in the case of ICEV. It is also conceivable that providers of house electricity are more trustworthy than car manufacturers. A study on the trustworthiness of different branches of industry in Germany, however, shows that businesses in the car manufacturing business are trusted by over 60% of its customers whilst electricity providers are only seen as trustworthy by 37% if they operate regionally and by 48% if they operate nationwide [53]. Nonetheless, it can be assumed that the trustworthiness of a brand has a positive impact. This is supported by a study on conceivable electricity providers which indicates that over a fourth could imagine obtaining their electricity from (familiar) companies outside the power sector [49].
Besides billing via the house electricity contract the option of achieving lower prices by choosing a specific house electricity provider has been queried. Regarding public charging with a charging time of 30 min for 100 km, 30% would choose a specific house electricity provider while for fast charging with a charging time of 5 min per 100 km, 25% would do this for cheaper charging [9].
4. Discussion—Case Studies Exemplifying the Framework
As mentioned before, it is quite difficult to observe and objectively measure the brand image or brand strength as well as the quality and quantity of digital and physical assets. The same applies to the power position of the focal company and business model profitability in each case. Therefore, publicly available information is used as an approximate value for determining these three factors that define the quality-of-service provision and, thereby, customer satisfaction. For instance, an existing customer base is assumed to reflect the strength of a brand or the brand image. Each case is summarized in Table 6, Table 7, Table 8 and Table 9 below (rating according to values shown in the right column).
This simplified multiple case study provides the following insights:
- Companies that have a very strong position (+++) in one of the three resource classes that define the quality-of-service provision demand a higher price for fast charging. They do this even though a high price is one of the main drivers for not choosing a charging option. However, the main reason for (fast) charging at highway service stations (cf. Figure 9) is “charging is fast”. Thus, price is not a dealbreaker.
- Utility companies (EnBW, Maingau) leverage their existing customer base (and indirectly their brand image) and offer special rates for house electricity customers (10 ct cheaper per kWh). This step is well in line with user preferences. As shown in Figure 10, a majority of current and potential EV drivers consider this an attractive or very attractive option.
- New to the industry firms leverage their brand image to enter the market. Deutsche Telekom, originating from the telecommunications industry, has entered the market with an aggressive price policy in December 2018 [73]. This approach is easily comprehensible: The differentiation between EMSP apps is marginal and more importantly, switching costs are extremely low (=downloading and setting up another app). In this case, consumers are generally open to trying new service providers—even if the tariffs are similar. Telekom’s brand strength thus could explain the price difference to Maingau, another “discount EMSP” (29 ct vs. 25 ct).
- Selling below cost is not sustainable. Both Deutsche Telekom and Maingau have (at least partially) raised their prices in the past year [74,75]. As both companies only have a limited network of fast charging stations or no fast-charging stations at all (physical assets), their service provision heavily depends on (other) charge point operators. The price increase is an indicator that both “discount EMSP” have been selling below cost to gain market share.
- Sharp price distinctions reflect the power balance within the value network. Both Ionity and Deutsche Telekom vary their pricing scheme depending on which other players are involved in the interaction. Ionity is asking for a comparably high price but offers special rates to drivers that use the EMSP service provided by the carmakers that jointly own Ionity (e.g., Audi e-Tron Charging Service) [76]. It seems that Ionity is using its bargaining power provided by brand strength and huge existing customer base to overcome the limited interest of users in billing models that involve the car manufacturer (cf. Figure 10). Deutsche Telekom, in turn, is used to distinguish the charging prices depending on the charging infrastructure that is being used. Fast charging stations by EnBW, for instance, are being classified as “other charging stations” and priced at 89 ct per kWh—more than twice the price that is asked for “preferred charging stations” (39 ct per kWh) [74]. Most likely this is because EnBW, due to their power position (resulting from physical assets: approaching 1000 fast-charging locations), did not accept the prices that Deutsche Telekom asked for and/or because EnBW did not want to cannibalize their own EMSP service (offering fast charging at 39–49 ct per kWh).
- Power plays may result in a fragmented market. Ionity, as CPO, is asking a comparably high price if downstream services (EMSP) provided by non-affiliated companies are used. This policy has led to the situation that Ionity charging stations cannot be used with EnBW’s EMSP service anymore. A similar observation can be made for the charging stations of “Fastned”, which (as of February 2020) cannot be used with EMSP services by “EWE Go” [2].
5. Conclusions
This paper provides the theoretical background for the understanding observed behavior of actors in the EV charging market. Key roles in this emerging mobility ecosystem are charge point operators (CPO), electric mobility service providers (EMSP), and location partners. These actors form a value network that is providing charging services to electric vehicle drivers. Each company involved in the network contributes different resources to the joint service provision: brand image, digital assets, physical assets. The cooperation and interaction of companies are presumed to affect both the quality-of-service provision and the power balance in the network. If service provision is matching the (target) users’ preferences, it should positively affect customer satisfaction. The latter and the focal company’s power position in the network are supposed to eventually impact business model profitability.
The theoretical framework and case studies presented above should only be considered the first step to a better understanding of market-driven business model design in emerging markets. Empirical research is needed to assess the actual relationship between resource configuration, user needs, and business model profitability. This work can be used to define hypotheses for testing. Moreover, the user preferences outlined above are subject to change, especially when more mainstream customers (early adopters and early majority) switch to electric vehicles. In this context, it is also likely to be relevant how frequently the fast-charging infrastructure will be used by different customer segments in the future, as this will have a direct impact on the utilization rate of this comparatively expensive asset. In this context, the associated adoption rate will not only be influenced by macro factors, such as a change in travel behavior following the COVID-19 pandemic, but also by micro factors, such as the perceived convenience and user-friendliness of said charging stations. Future research could address these topics. Another aspect that has not been explicitly analyzed in this work, but which presumably also plays a major role in the profitability of a business model, is the question of operating costs for IT back-end systems. Since these systems are highly important for the trouble-free operation of charging infrastructure, the highest data protection, and cybersecurity standards must be met, which is just one of the drivers for the high costs of developing or operating a backend system. Further research could, for instance, analyze whether companies that rely on their own software have a competitive advantage over companies that rely on SaaS solutions.
Author Contributions
F.R. was responsible for the overall conception and design of the paper. T.S. was responsible for data collection and data analysis. Both authors contributed to the literature review, summarizing their findings and drafting the paper. A critical revision was done by F.R. before final approval of the version to be published has been provided by both authors. All authors have read and agreed to the published version of the manuscript.
Funding
This research received no external funding.
Institutional Review Board Statement
Not applicable.
Data Availability Statement
No new data were created or analyzed in this study. Data sharing is not applicable to this article.
Conflicts of Interest
The authors declare no conflict of interest.
References
- Emobly. Der Emobly Ladekarten-Kompass September 2019. Available online: https://emobly.com/de/laden/der-emobly-ladekarten-kompass-sept-2019/ (accessed on 4 March 2021).
- Emobly. Der Emobly Ladekarten-Kompass Februar 2021. Available online: https://emobly.com/de/news/der-emobly-ladekarten-kompass-februar-2021/ (accessed on 4 March 2021).
- Schroeder, A.; Traber, T. The economics of fast charging infrastructure for electric vehicles. Energy Policy 2012, 43, 136–144. [Google Scholar] [CrossRef]
- Morrissey, P.; Weldon, P.; O’Mahony, M. Future standard and fast charging infrastructure planning: An analysis of EV charging behavior. Energy Policy 2016, 89, 257–270. [Google Scholar] [CrossRef]
- Madina, C.; Zamora, I.; Zabala, E. Methodology for assessing EV charging infrastructure business models. Energy Policy 2016, 89, 284–293. [Google Scholar] [CrossRef] [Green Version]
- Pagani, M.; Korosec, W.; Chokani, N.; Abhari, R.S. User behaviour and electric vehicle charging infrastructure: An agent-based model assessment. Appl. Energy 2019, 254, 113680. [Google Scholar] [CrossRef]
- Röckle, F.; Marquardt, M.; Wichern, P. Fast-E: Study 1—Market Integration & Innovative Business Orientation; Allego GmbH: Berlin, Germany, 2017. [Google Scholar]
- Costa, E.; Hufnagl, C.; Arndt, M.; Meier-Witty, B.; Mertens, A.; Wildburger, B.; Röckle, F. ultra-E: Study 1—Market and Business Models for Ultra Charging; Allego GmbH: Berlin, Germany, 2018. [Google Scholar]
- Röckle, F.; Schmitt, G. Forschungsvorhaben zur Etablierung Eines Bundesweiten Schnellladenetzes für Achsen und Metropolen (SLAM): Verbund-Abschlussbericht; Universität Stuttgart: Stuttgart, Germany, 2019. [Google Scholar]
- Röckle, F.; Litauer, R. Current and Potential Future EV Driver Charging Needs. In Proceedings of the 30th International Electric Vehicle Symposium (EVS 2017), Stuttgart, Germany, 9–11 October 2019; Red Hook: Curran, NY, USA, 2018; pp. 3445–3457. [Google Scholar]
- Röckle, F.; Weinmann, M.; Horn, D.; Schmidt, A. Integration of Roles vs. Specialization. In Proceedings of the 30th International Electric Vehicle Symposium (EVS 2017), Stuttgart, Germany, 9–11 October 2019; Red Hook: Curran, NY, USA, 2018; pp. 3431–3444. [Google Scholar]
- Bullinger, H.J.; Bauer, W.; Rüger, M. Geschäftsmodell-Innovationen Richtig Umsetzen. Vom Technologiemarkt zum Markterfolg; Fraunhofer-Institut für Arbeitswirtschaft und Organisation IAO: Stuttgart, Germany, 2018. [Google Scholar]
- Stabell, C.B.; Fjeldstad, O.D. Configuring Value for Competitive Advantage: On Chains, Shops, and Networks. Strateg. Manag. J. 1998, 19, 413–437. [Google Scholar] [CrossRef]
- Grönroos, C.; Voima, P. Critical service logic: Making sense of value creation and co-creation. J. Acad. Mark. Sci. 2013, 41, 133–150. [Google Scholar] [CrossRef]
- Moore, J.F. Business ecosystems and the view from the firm. Antitrust Bull. 2006, 51, 31–75. [Google Scholar] [CrossRef] [Green Version]
- Tukker, A. Eight types of product–service system: Eight ways to sustainability? Experiences from SusProNet. Bus. Strategy Environ. 2004, 13, 246–260. [Google Scholar] [CrossRef]
- McNaughton, R.B.; Osborne, P.; Imrie, B.C. Market-oriented value creation in service firms. Eur. J. Mark. 2002, 39, 990–1002. [Google Scholar] [CrossRef] [Green Version]
- Barney, J. Firm resources and sustained competitive advantage. J. Manag. 1991, 17, 99–120. [Google Scholar] [CrossRef]
- Ma, H. Competitive advantage and firm performance. Compet. Rev. Int. Bus. J. 2000, 10, 15–32. [Google Scholar] [CrossRef]
- Soh, C.; Markus, M.L. How IT creates business value: A process theory synthesis. In Proceedings of the ICIS 1995 Proceedings, Amsterdam, The Netherlands, 10–13 December 1995; Volume 4, pp. 29–41. [Google Scholar]
- Bharadwaj, A.; El Sawy, O.A.; Pavlou, P.A.; Venkatraman, N. Digital Business Strategy: Towards a Next Generation of Insights. Mis. Q. 2013, 37, 471–482. [Google Scholar] [CrossRef]
- Keen, P.; Williams, R. Value Architectures for Digital Business: Beyond the Business Model. Mis. Q. 2013, 37, 643–647. [Google Scholar]
- Malik, M.E.; Ghafoor, M.M.; Hafiz, K.I. Impact of Brand Image, Service Quality and price on customer satisfaction in Pakistan Telecommunication sector. Int. J. Bus. Soc. Sci. 2012, 3, 123–129. [Google Scholar]
- Davis, S. Brand Asset Management: How business can profit from the power of brand. J. Consum. Mark. 2002, 19, 351–358. [Google Scholar] [CrossRef]
- Chang, H.H.; Liu, Y.M. The impact of brand equity on brand preference and purchase intentions in the service industries. Serv. Ind. J. 2009, 29, 1687–1706. [Google Scholar] [CrossRef]
- Bleeke, J.; Ernst, D. Is your strategic alliance really a sale? Harv. Bus. Rev. 1995, 73, 97–105. [Google Scholar]
- Nohria, N.; Garcia-Pont, C. Global strategic linkages and industry structure. Strateg. Manag. J. 1991, 12, 105–124. [Google Scholar] [CrossRef]
- Burt, R.S. Structural Holes: The Social Structure of Competition; Harvard University Press: Cambridge, MA, USA, 1992. [Google Scholar]
- Lorenzoni, G.; Baden-Fuller, C. Creating a strategic center to manage a web of partners. Calif. Manag. Rev. 1995, 37, 146–163. [Google Scholar] [CrossRef]
- Pfeffer, J.; Salancik, G.R. The External Control of Organizations: A Resource Dependence Perspective; Stanford University Press: Stanford, CA, USA, 2003. [Google Scholar]
- Brandenburger, A.M.; Nalebuff, B.J. Co-Opetition; Doubleday: New York, NY, USA, 1996. [Google Scholar]
- Ghemawat, P.; Collis, D.J.; Pisano, G.P.; Rivkin, J.W. Strategy and the Business Landscape: Text and Cases; Addison-Wesley: Reading, MA, USA, 1999. [Google Scholar]
- Gomes-Casseres, B. Competitive advantage in alliance constellations. Strateg. Organ. 2003, 1, 327–335. [Google Scholar] [CrossRef]
- Cattani, G.; Ferriani, S.A. core/periphery perspective of individual creative performance: Social networks and cinematic achievements in the Hollywood film industry. Organ. Sci. 2008, 29, 824–844. [Google Scholar] [CrossRef] [Green Version]
- Human, S.; Provan, K.G. Legitimacy building in the evolution of small-firm multilateral networks: A comparative study of success and demise. Adm. Sci. Q. 2000, 45, 327–365. [Google Scholar] [CrossRef]
- Chae, S.; Heidhues, P. Buyers’ alliances for bargaining power. J. Econ. Manag. Strategy 2004, 13, 731–754. [Google Scholar] [CrossRef]
- Mann, H. Seller Concentration, Barriers to Entry, and Rates of Return in Thirty Industries, 1950–1960. Rev. Econ. Stat. 1966, 48, 296–307. [Google Scholar] [CrossRef]
- Church, J.R.; Ware, R. Industrial Organization: A Strategic Approach; McGraw-Hill: New York, NY, USA, 2000. [Google Scholar]
- LaBarbera, P.A.; Mazursky, D.A. Longitudal assessment of consumer satisfaction/dissatisfaction: The dynamic aspect of the cognitive process. J. Mark. Res. 1983, 20, 393–404. [Google Scholar] [CrossRef] [Green Version]
- Coldwell, J. Characteristics of a good customer satisfaction survey. In Customer Relationship Management: Emerging Concepts, Tools, and Applications; Tata McGraw-Hill Education: New Delhi, India, 2001; pp. 193–199. [Google Scholar]
- Hokanson, S. The deeper you analyze, the more you satisfy customers. Mark. News 1995, 29, 16. [Google Scholar]
- Homburg, C.; Rudolph, B. Customer Satisfaction in industrial markets: Dimensional and multiple role issues. J. Bus. Res. 2001, 52, 15–33. [Google Scholar] [CrossRef]
- Woodall, T. Conceptualising ‘Value for the Customer’: An Attributional, Structural and Dispositional Analysis. Acad. Mark. Sci. Rev. 2003, 13, 1–42. [Google Scholar]
- Graf, A.; Maas, P. Customer value from a customer perspective: A comprehensive review. J. Betr. 2008, 58, 1–20. [Google Scholar] [CrossRef] [Green Version]
- The Nielsen Company. Connecting with the Consumer. The Importance of Integrating Marketing Promises with Service Delivery. Available online: https://www.nielsen.com/wp-content/uploads/sites/3/2019/04/Nielsen_Connecting20with20the20Consumer.pdf (accessed on 10 April 2021).
- PricewaterhouseCoopers GmbH. Bevölkerungsbefragung Stromanbieter 2015. Available online: https://www.pwc.de/de/energiewirtschaft/assets/pwc-umfrage-energie.pdf (accessed on 10 April 2021).
- Bundeskartellamt. Sektoruntersuchung Kraftstoffe. Zwischenbericht gemäß § 32e GWB. Juni 2009. Available online: https://www.bundeskartellamt.de/SharedDocs/Publikation/DE/Sektoruntersuchungen/Sektoruntersuchung%20Kraftstoffe%20-%20Zwischenbericht.pdf;jsessionid=D5F7069F28D4674896BC4366B0D3F0E8.1_cid371?__blob=publicationFile&v=5 (accessed on 10 April 2021).
- Frondel, M.; Sommer, S. Schwindende Akzeptanz für die Energiewende? Ergebnisse einer wiederholten Bürgerbefragung. Z. Energ. 2018, 124, 27–38. [Google Scholar] [CrossRef] [Green Version]
- GMK Markenberatung, Aktuelle Umfrage. Markenrelevanz in der Energiewirtschaft. Available online: https://www.gmk-markenberatung.de/files/inhalte/wissen/pdf_markenpublikationen/05-140904_gmk_umfrage_markenrelevanz_von_stromanbietern.pdf (accessed on 10 April 2021).
- Statista. Umfrage zur Attraktivität/Relevanz von Mobile Payment in Deutschland Nach Alter 2016. Available online: https://de.statista.com/statistik/daten/studie/568933/umfrage/umfrage-zur-attraktivitaet-relevanz-von-mobile-payment-nach-alter/ (accessed on 16 March 2021).
- Statista. Umfrage zur Nutzung von Mobile Payment in Deutschland Nach Alter 2016. Available online: https://de.statista.com/statistik/daten/studie/568411/umfrage/umfrage-zur-nutzung-von-mobile-payment-in-deutschland-nach-alter/ (accessed on 16 March 2021).
- Beutin, N.; Harmsen, M. Mobile Payment Report 2019. Available online: https://www.pwc.de/de/digitale-transformation/pwc-studie-mobile-payment-2019.pdf (accessed on 10 April 2021).
- ServiceValue GmbH. Studie VERTRAUENSRANKING 2020. Available online: https://servicevalue.de/app/uploads/2020/10/Studieninformation-Vertrauensranking-2020.pdf (accessed on 10 April 2021).
- EnBW. Unternehmensportrait. Available online: https://www.enbw.com/unternehmen/konzern/ueber-uns/unternehmensportrait/ (accessed on 16 March 2020).
- CHECK24. EnBW Energie. Available online: https://www.check24.de/strom-gas/enbw/ (accessed on 16 March 2020).
- VERIVOX. EnBW Energie Baden-Württemberg AG. Available online: https://www.verivox.de/power/carriers.aspx?id=3542 (accessed on 16 March 2020).
- Google Play. ENBW Mobility Elektroautos im Vergleich; GET CHARGE; EinfachStromLaden—MAINGAU; IONITY. Available online: https://play.google.com/store (accessed on 16 March 2020).
- GoingElectric. Ladekarten/Angebote für Ladesäulen. Available online: https://www.goingelectric.de/stromtankstellen/anbieter/ (accessed on 16 March 2020).
- EnBW. Ausbau Schnellladenetz. Available online: https://www.enbw.com/elektromobilitaet/ausbau-schnellladenetz (accessed on 16 March 2020).
- EnBW. EnBW Mobility + App. Available online: https://www.enbw.com/elektromobilitaet/produkte/mobilityplus-app/laden-und-bezahlen (accessed on 16 March 2020).
- Fuchs, A. Geschäftszahlen 2018—Deutsche Telekom Setzt Wachstumskurs im Rekordjahr fort und Übertrifft Finanzziele. Available online: https://www.telekom.com/de/medien/medieninformationen/detail/geschaeftszahlen-2018-563878 (accessed on 16 March 2020).
- CHECK24. Telekom: Bewertungen und Erfahrungen der CHECK24-Kunden. Available online: https://www.check24.de/dsl/kundenbewertung/telekom/ (accessed on 16 March 2020).
- Schaal, S. Telekom Errichtet 100. Schnellladestation. Available online: https://www.electrive.net/2019/12/16/telekom-errichtet-100-schnellladestation/ (accessed on 16 March 2020).
- MAINGAU Energie. ÜBER UNS. Available online: https://www.maingau-energie.de/unternehmen (accessed on 16 March 2020).
- CHECK24. MAINGAU Energie. Available online: https://www.check24.de/strom-gas/maingau-energie/ (accessed on 16 March 2020).
- VERIVOX. Erfahrungen Mit MAINGAU Energie GmbH. Available online: https://www.verivox.de/erfahrungen/maingau-energie-1-2968.aspx (accessed on 16 March 2020).
- MAINGAU Energie. EinfachStromLaden—Wir Bewegen Elektrofahrer. Available online: https://www.maingau-energie.de/e-mobilit%C3%A4t/Autostrom-Tarif (accessed on 16 March 2020).
- Kraftfahrtbundesamt. Pressemitteilung Nr. 07/2020—Fahrzeugzulassungen im Februar 2020. Available online: https://www.kba.de/DE/Presse/Pressemitteilungen/2020/Fahrzeugzulassungen/pm07_2020_n_02_20_pm_komplett.html?nn=2562684 (accessed on 16 March 2020).
- IONITY. ÜBER UNS. Available online: https://ionity.eu/de/about.html (accessed on 16 March 2020).
- IONITY. Status Tracker for IONITY HPC. Available online: https://ionity.ev-info.eu/statistics (accessed on 16 March 2020).
- IONTIY. IAA 2019: IONITY Stellt Neue High Power Charging Ladesäule vor und Begrüßt Neuen Shareholder Hyundai Motor Group. Available online: https://ionity.eu/_Resources/Persistent/9190b854b955c5de3bea1f4b6ae4241b07e132ac/20190910_IONITY-IAA-CHARGER-DE_f.pdf (accessed on 16 March 2020).
- Schaal, S. Wirbel um Ionity-Preise Geht Weiter. Available online: https://www.electrive.net/2020/01/28/wirbel-um-ionity-preise-geht-weiter/ (accessed on 16 March 2020).
- Werwitzke, C. Ladenetze: Telekom Steigt in den Preiskampf um Kunden ein. Available online: https://www.electrive.net/2018/12/03/ladenetze-telekom-steigt-in-preiskampf-um-kunden-ein/ (accessed on 16 March 2020).
- Bönnighausen, D. Deutsche Telekom Führt Abrechnung nach Kilowattstunde ein. Available online: https://www.electrive.net/2019/03/20/deutsche-telekom-fuehrt-abrechnung-nach-kilowattstunde-ein/ (accessed on 16 March 2020).
- Ecomento. “EinfachStromLaden”: Maingau Erhöht Preise, Angebot Soll Ausgebaut Warden. Available online: https://ecomento.de/2019/07/23/einfachstromladen-maingau-erhoeht-preise-35-cent-kwh/ (accessed on 16 March 2020).
- Schaal, S. Ionity Ändert Preismodell—Auf 79 Cent pro kWh. Available online: https://www.electrive.net/2020/01/16/ionity-aendert-preismodell-auf-79-cent-pro-kwh/ (accessed on 16 March 2020).
Figure 1.
Actors involved in electric vehicle (EV) charging processes (own diagram based on [9]).
Figure 1.
Actors involved in electric vehicle (EV) charging processes (own diagram based on [9]).

Figure 2.
Classification of EV charging according to Moore and Tukker (own diagram based on [15,16]).

Figure 3.
Presumed relationship between actors’ cooperation and performance of service provision (own figure).
Figure 3.
Presumed relationship between actors’ cooperation and performance of service provision (own figure).

Figure 4.
Presumed relationship between a company’s power position and business model profitability (own figure).
Figure 4.
Presumed relationship between a company’s power position and business model profitability (own figure).

Figure 5.
Presumed relationship between the performance of service provision and business model profitability (own figure).
Figure 5.
Presumed relationship between the performance of service provision and business model profitability (own figure).

Figure 6.
Conceptual framework (own figure).

Figure 7.
Preferences for primary charging (n = 2977; own diagram based on [8]).
Figure 7.
Preferences for primary charging (n = 2977; own diagram based on [8]).

Figure 8.
Preferences for range increase (n = 2977; own diagram based on [8]).
Figure 8.
Preferences for range increase (n = 2977; own diagram based on [8]).

Figure 9.
Reasons for the frequent and rare use of charging infrastructure (n = 403; own diagram based on [9]).
Figure 9.
Reasons for the frequent and rare use of charging infrastructure (n = 403; own diagram based on [9]).

Figure 10.
Attractivity of different billing models (n = 1151; own diagram based on [9]).
Figure 10.
Attractivity of different billing models (n = 1151; own diagram based on [9]).

Figure 11.
Ranking of different billing options (own figure).


Table 1.
Relevant factors shaping an EV charging firm’s claim on value [33].
Table 1.
Relevant factors shaping an EV charging firm’s claim on value [33].
| Value-Added Perspective: What is the bargaining power of the firm within the group? The firm controls scarce, valued, and well-protected assets Competition among the firm’s suppliers of complements |
| Structural Perspective: What is the position of the firm within the network of allies? The firm participates in multiple constellations The firm occupies structural holes |
Table 2.
Welch test—billing options.
| Billing Via… | T | df | Sig. (2-Sided) | 95% Confidence Interval for the Difference | |
|---|---|---|---|---|---|
| Lower | Upper | ||||
| House electricity contract * | −8.628 | 1076.824 | 0.000 | −0.715 | −0.450 |
| Car manufacturer | −0.760 | 926.012 | 0.447 | −0.198 | 0.087 |
| Digital payment provider * | 2.731 | 940.668 | 0.006 | 0.053 | 0.322 |
| Third-party provider * | −10.359 | 1149 | 0.000 | −0.770 | −0.524 |
| EC/credit card * | −7.373 | 1149 | 0.000 | −0.537 | −0.312 |
* The mean distance is significant (p < 0.01).
Table 3.
Greenhouse–Geisser corrected tests of billing options’ within subject factors.
| df | F | Sig. | Partial Eta Squared | |
|---|---|---|---|---|
| Billing options “mostly ICEV users” * | 3.558 | 233.524 | 0.000 | 0.259 |
| Billing options “mostly BEV users” * | 3.879 | 141.923 | 0.000 | 0.228 |
* Significant differences between the ratings of the billing options (p < 0.001).
Table 4.
Bonferroni-corrected post-hoc test of the billing options’ ratings—“mostly ICEV users”.
| Mean Distance (I–J) | Billing Option I | |||||
|---|---|---|---|---|---|---|
| 1 | 2 | 3 | 4 | 5 | ||
| Billing option J | 1 | n/a | −0.658 * | 0.332 * | −0.822 * | 0.417 * |
| 2 | 0.658 * | n/a | 0.990 * | −0.164 * | 1.075 * | |
| 3 | −0.332 * | −0.990 * | n/a | −1.154 * | 0.085 | |
| 4 | 0.822 * | 0.164 * | 1.154 * | n/a | 1.239 * | |
| 5 | −0.417 * | −1.075 * | −0.085 | −1.239 * | n/a | |
* The mean distance is significant (p < 0.001).
Table 5.
Bonferroni-corrected post-hoc test of the billing options’ ratings—“mostly BEV users”.
| Mean Distance (I–J) | Billing Option I | |||||
|---|---|---|---|---|---|---|
| 1 | 2 | 3 | 4 | 5 | ||
| Billing option J | 1 | n/a | −1.185 * | −0.438 * | −0.757 * | 0.259 * |
| 2 | 1.185 * | n/a | 0.747 * | 0.427 * | 1.444 * | |
| 3 | 0.438 * | −0.747 * | n/a | −0.320 * | 0.697 * | |
| 4 | 0.757 * | −0.427 * | 0.320 * | n/a | 1.017 * | |
| 5 | −0.259 * | −1.444 * | −0.697 * | −1.017 * | n/a | |
* The mean distance is significant (p < 0.001).
| Brand image | ++ | 5.5 million customers (electricity, gas, and water); 4.3/5 stars rating on check 24 and customer loyalty rating of 80% on Verivox (online consumer portals) |
| Digital assets | +++ | Charging app with ≥100,000 downloads and 4.7/5 stars rating; access to 47,000 charge points |
| Physicalassets | +++ | 1000 fast-charging locations (target for year-end 2020) |
| Pricing (fast charging) | €€€ €€ €€ | 49 ct/kWh for general customers 39 ct/kWh for intensive users that pay a monthly fee of 5€ 39 ct/kWh for customers that also have a house electricity contract |
| Brand image | +++ | ≥43 million customers (mobile, landline, and TV); 4/5 stars rating on check 24 (online consumer portal); survey: 27% of survey sample (47% of people aged 18–27) could imagine having Deutsche Telekom as their energy provider |
| Digital assets | ++ | Charging app with ≥10,000 downloads and 2/5 stars rating; access to 32,000 charge points (Telekom GetCharge) |
| Physical assets | + | ≥100 fast-charging stations (Telekom Comfort Charge) |
| Pricing (fast charging) | €€ €€€€ | 39 ct/kWh at “privileged” charging stations (including own stations) 89 ct/kWh at “other” charging stations (including e.g., stations of EnBW) |
| Brand image | ++ | 300,000 customers (electricity and gas); 4.2/5 stars rating on check 24 and customer loyalty rating of 88% on Verivox (online consumer portals) |
| Digital assets | + | Charging app with ≥10,000 downloads and 2.9/5 stars rating; access to 45,000 charge points |
| Physical assets | - | None own fast-charging stations |
| Pricing (fast charging) | €€ € | 35 ct/kWh for general customers 25 ct/kWh for customers that also have a house electricity contract |
| Brand image | +++ | Market share of about 55% of newly registered vehicles in Germany (as of 02/2020—makes: Audi, BMW, Mercedes, Ford, Seat, Volkswagen) |
| Digital assets | + | Charging app with ≥10,000 downloads and 1.7/5 stars rating; access to 1000 charge points |
| Physical assets | ++ | 219 fast-charging locations (as of 03/2020, target for year-end 2020 is 400) |
| Pricing (fast charging) | €€€€ € | 79 ct/kWh for general customers 29 ct/kWh for customers of BMW, Daimler, Ford, Volkswagen |
Publisher’s Note: MDPI stays neutral with regard to jurisdictional claims in published maps and institutional affiliations. |
© 2021 by the authors. Licensee MDPI, Basel, Switzerland. This article is an open access article distributed under the terms and conditions of the Creative Commons Attribution (CC BY) license (https://creativecommons.org/licenses/by/4.0/).
Share and Cite
MDPI and ACS Style
Röckle, F.; Schulz, T. Leveraging User Preferences to Develop Profitable Business Models for Electric Vehicle Charging. World Electr. Veh. J. 2021, 12, 60. https://doi.org/10.3390/wevj12020060
AMA Style
Röckle F, Schulz T. Leveraging User Preferences to Develop Profitable Business Models for Electric Vehicle Charging. World Electric Vehicle Journal. 2021; 12(2):60. https://doi.org/10.3390/wevj12020060
Chicago/Turabian StyleRöckle, Felix, and Thimo Schulz. 2021. "Leveraging User Preferences to Develop Profitable Business Models for Electric Vehicle Charging" World Electric Vehicle Journal 12, no. 2: 60. https://doi.org/10.3390/wevj12020060