
Amphipathic Small Molecule AZT Compound Displays Potent Inhibitory Effects in Cancer Cell Proliferation

 , , , and
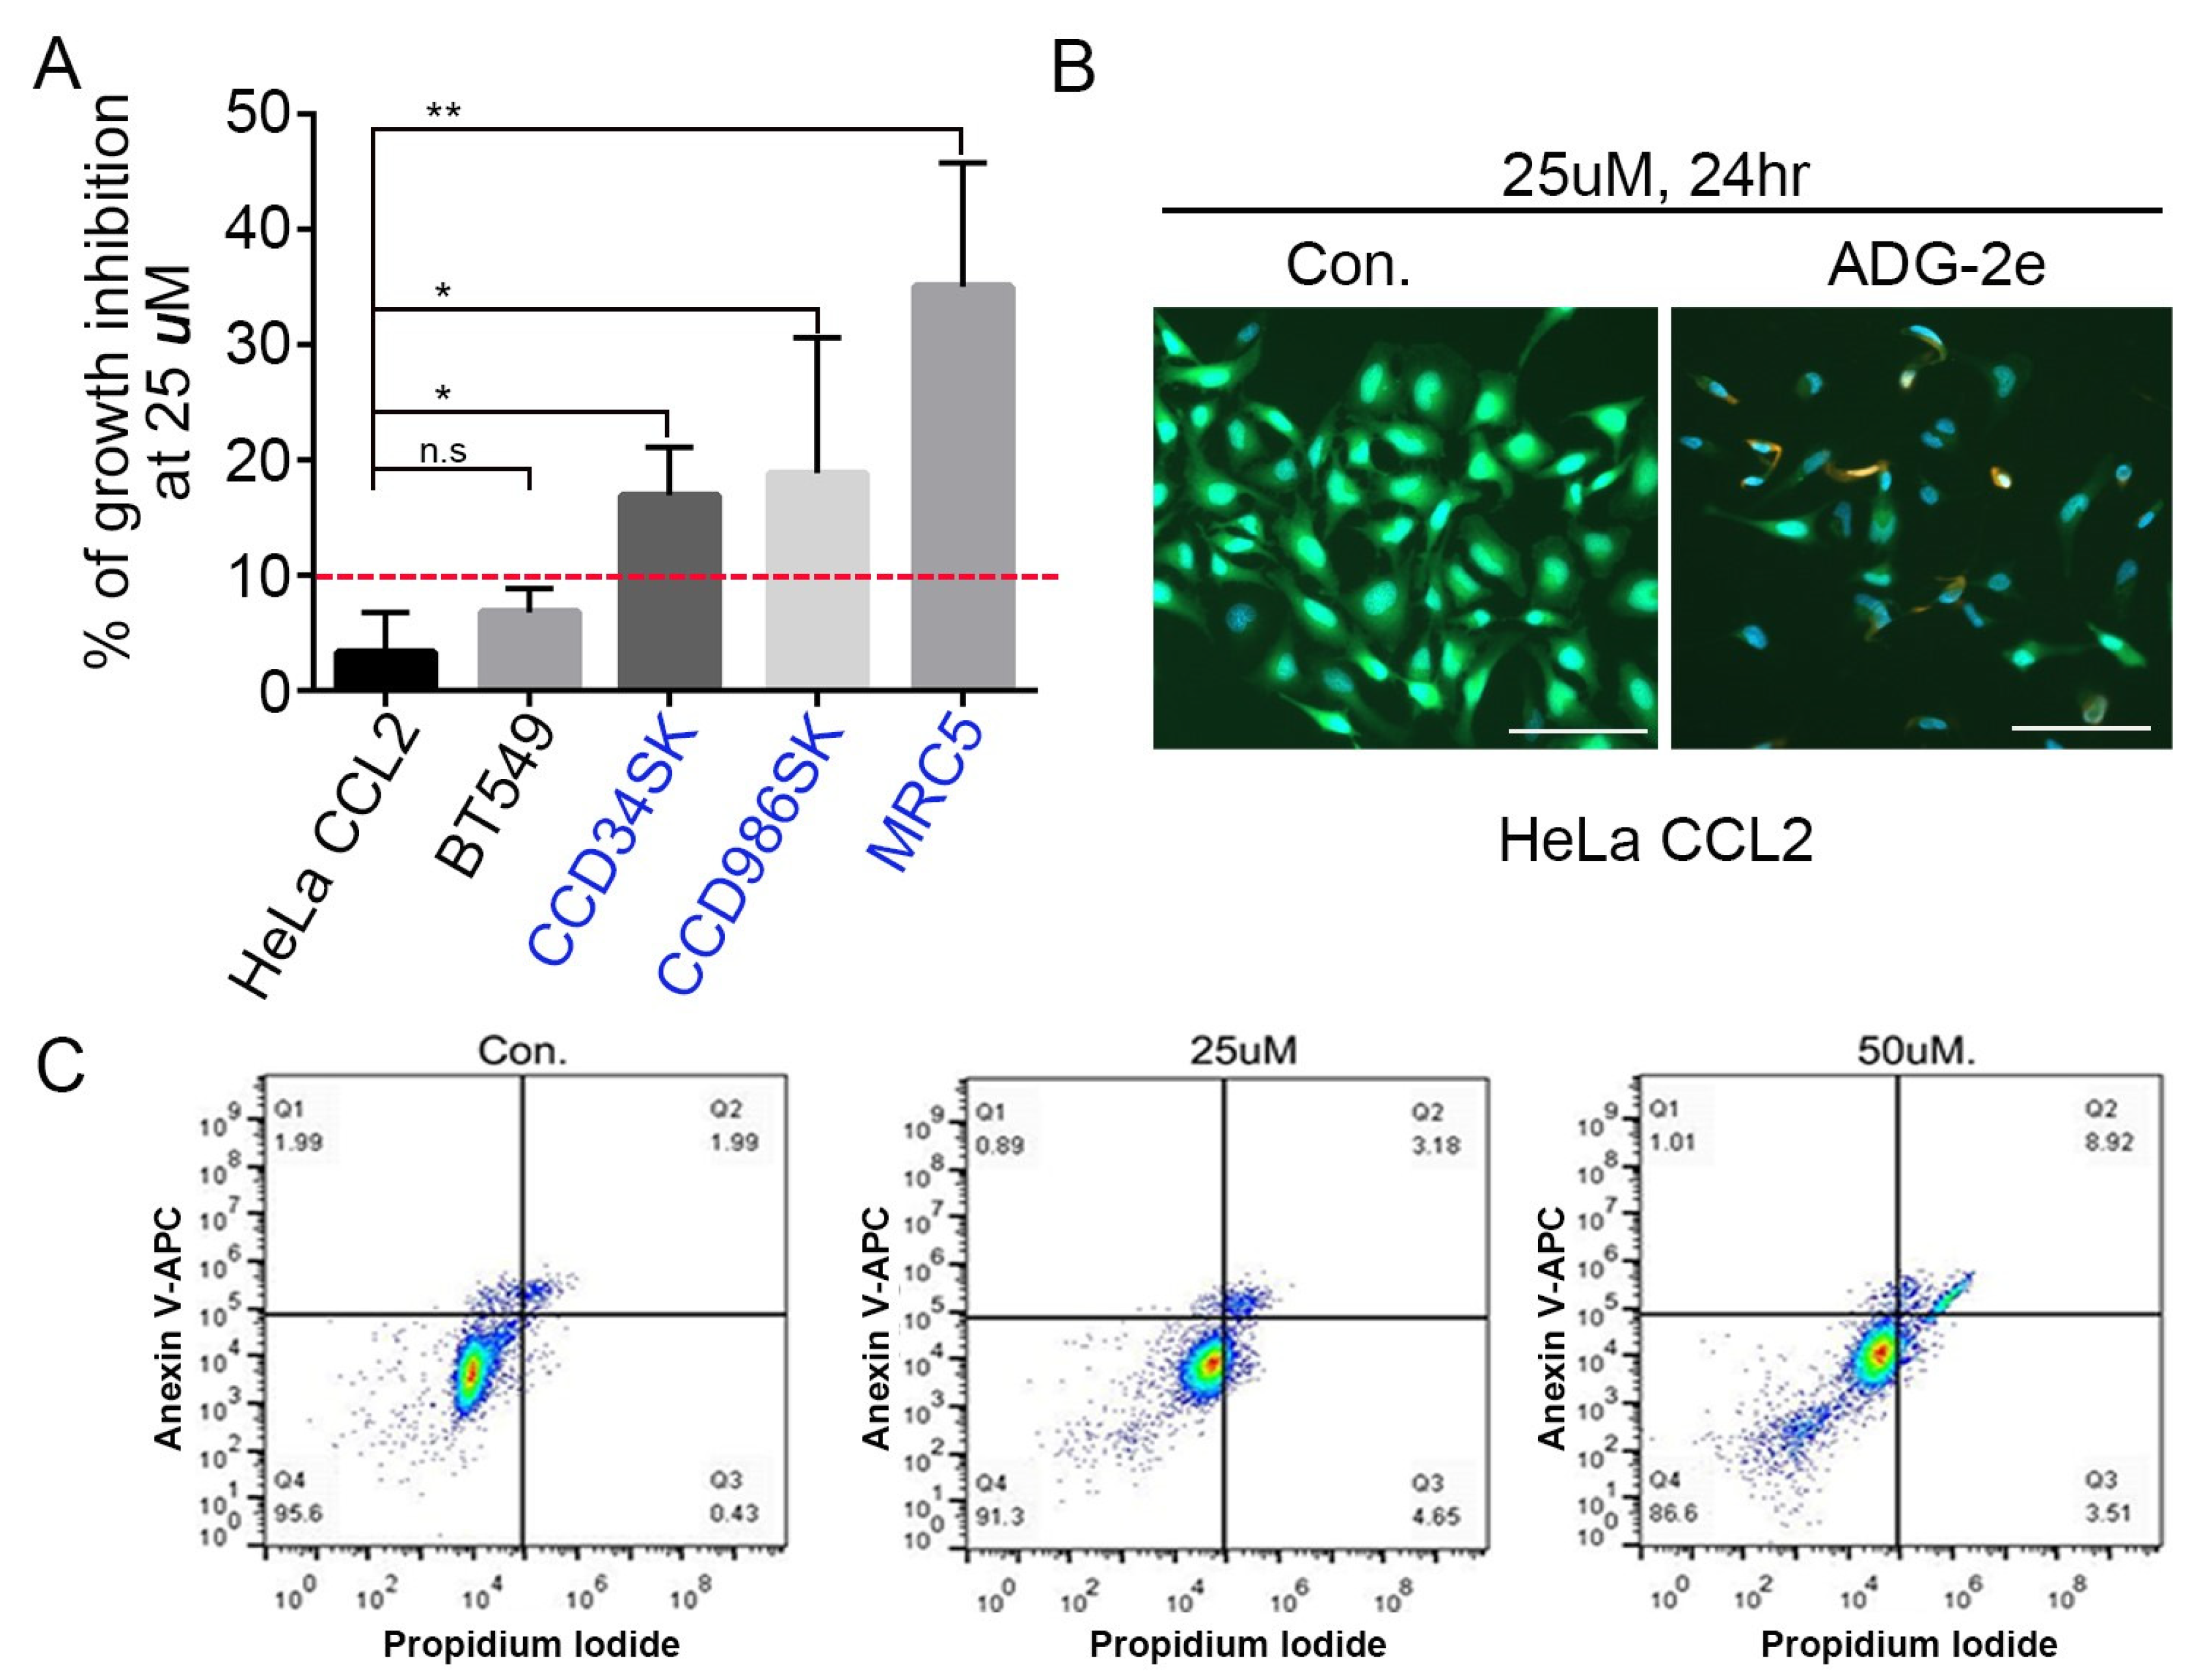
Abstract
:1. Introduction
2. Materials and Methods
2.1. Chemistry
2.2. Cell Culture and Cell Viability Assay
2.3. Live and Dead Assay
2.4. FACS Analysis
2.5. Live Image Assay
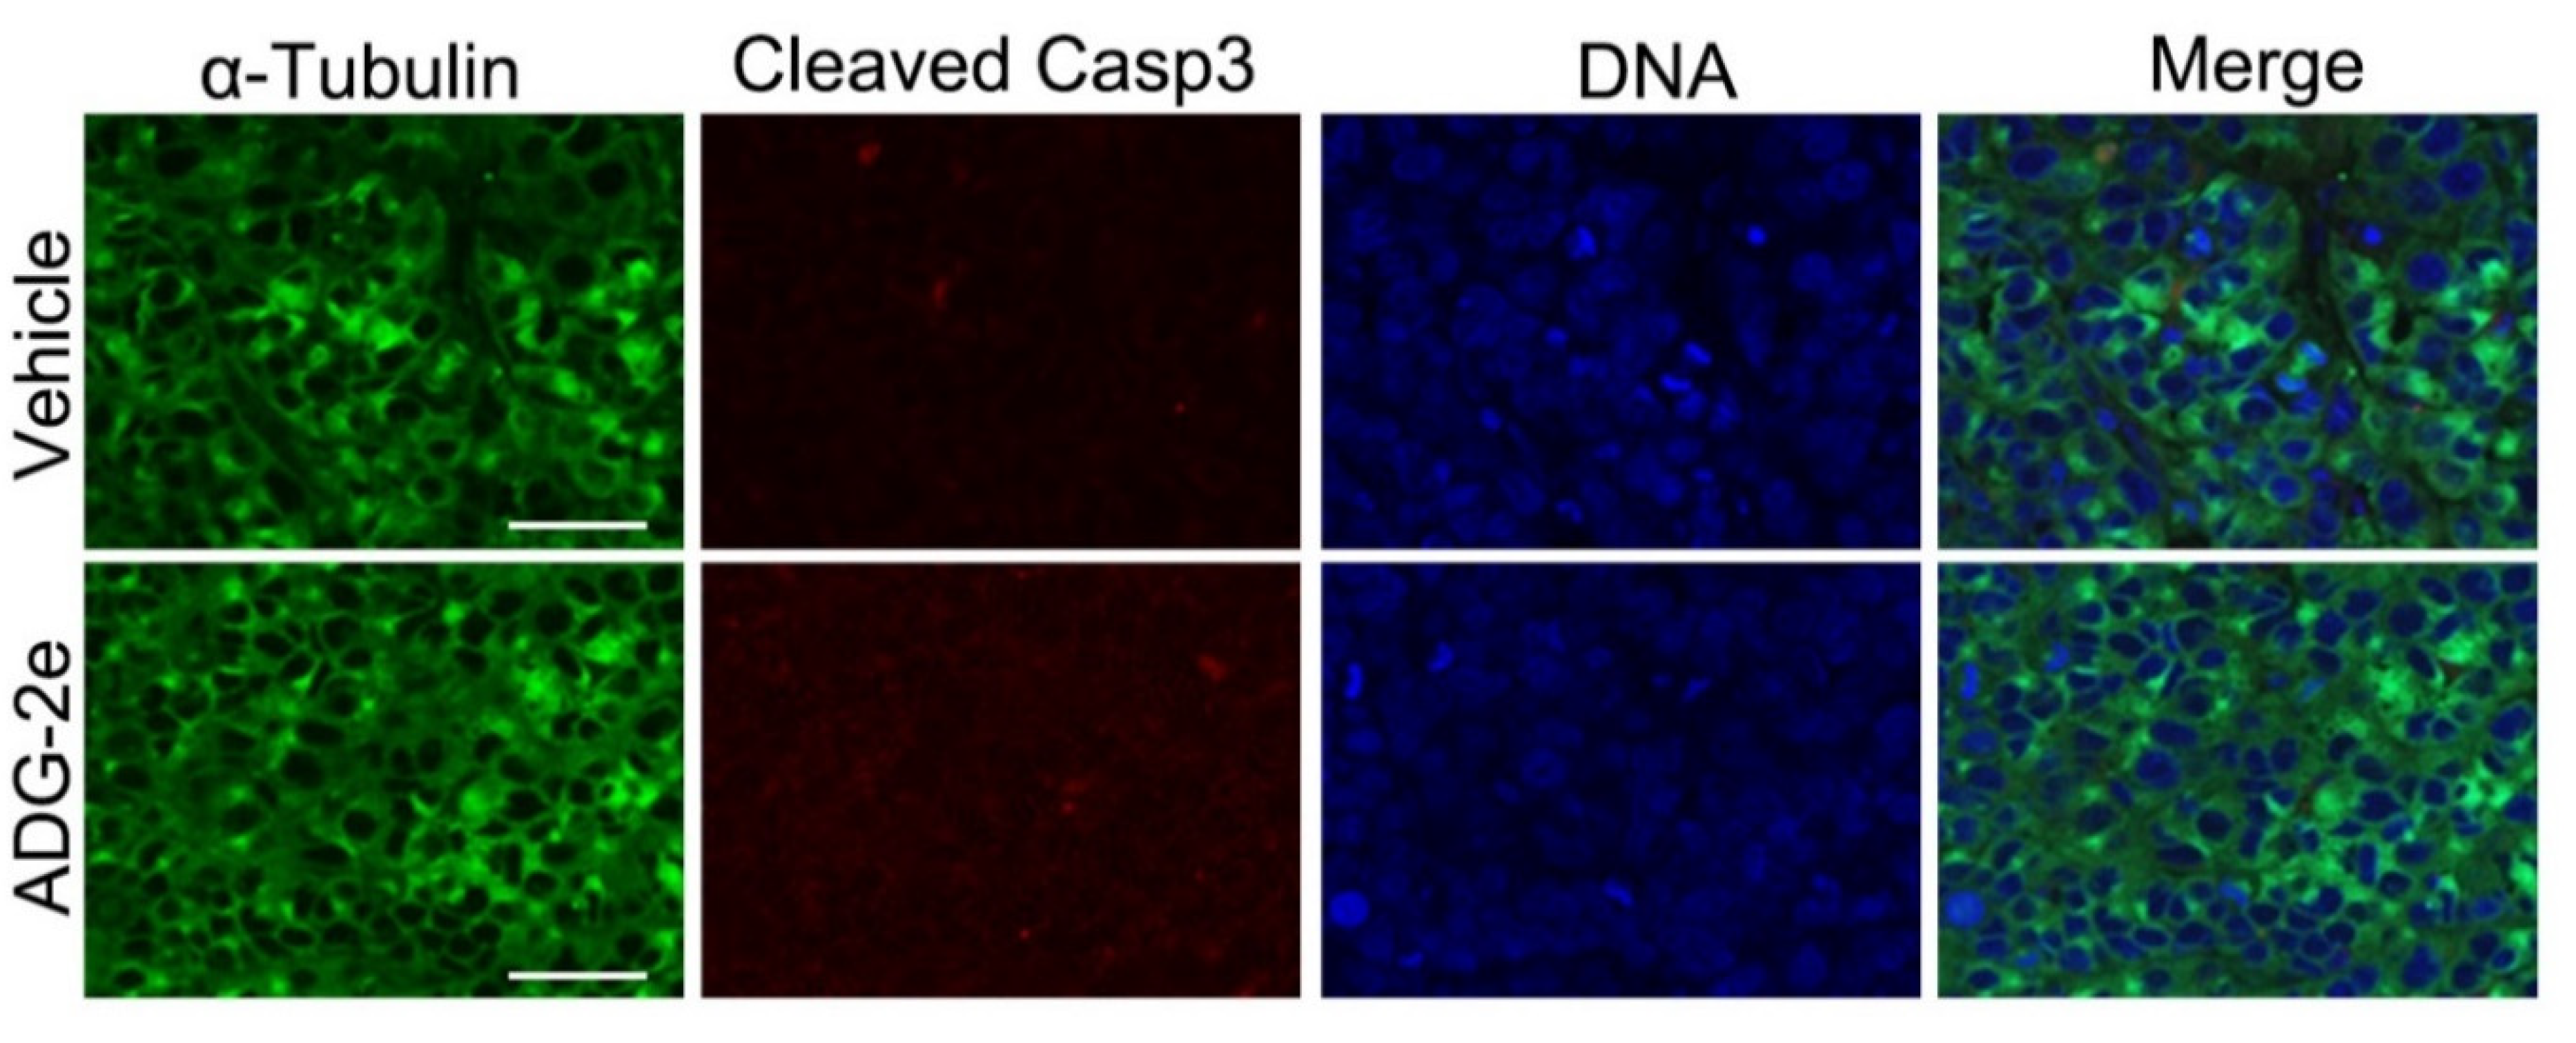
2.6. Tumor Xenograft Analysis and Immunohistochemistry
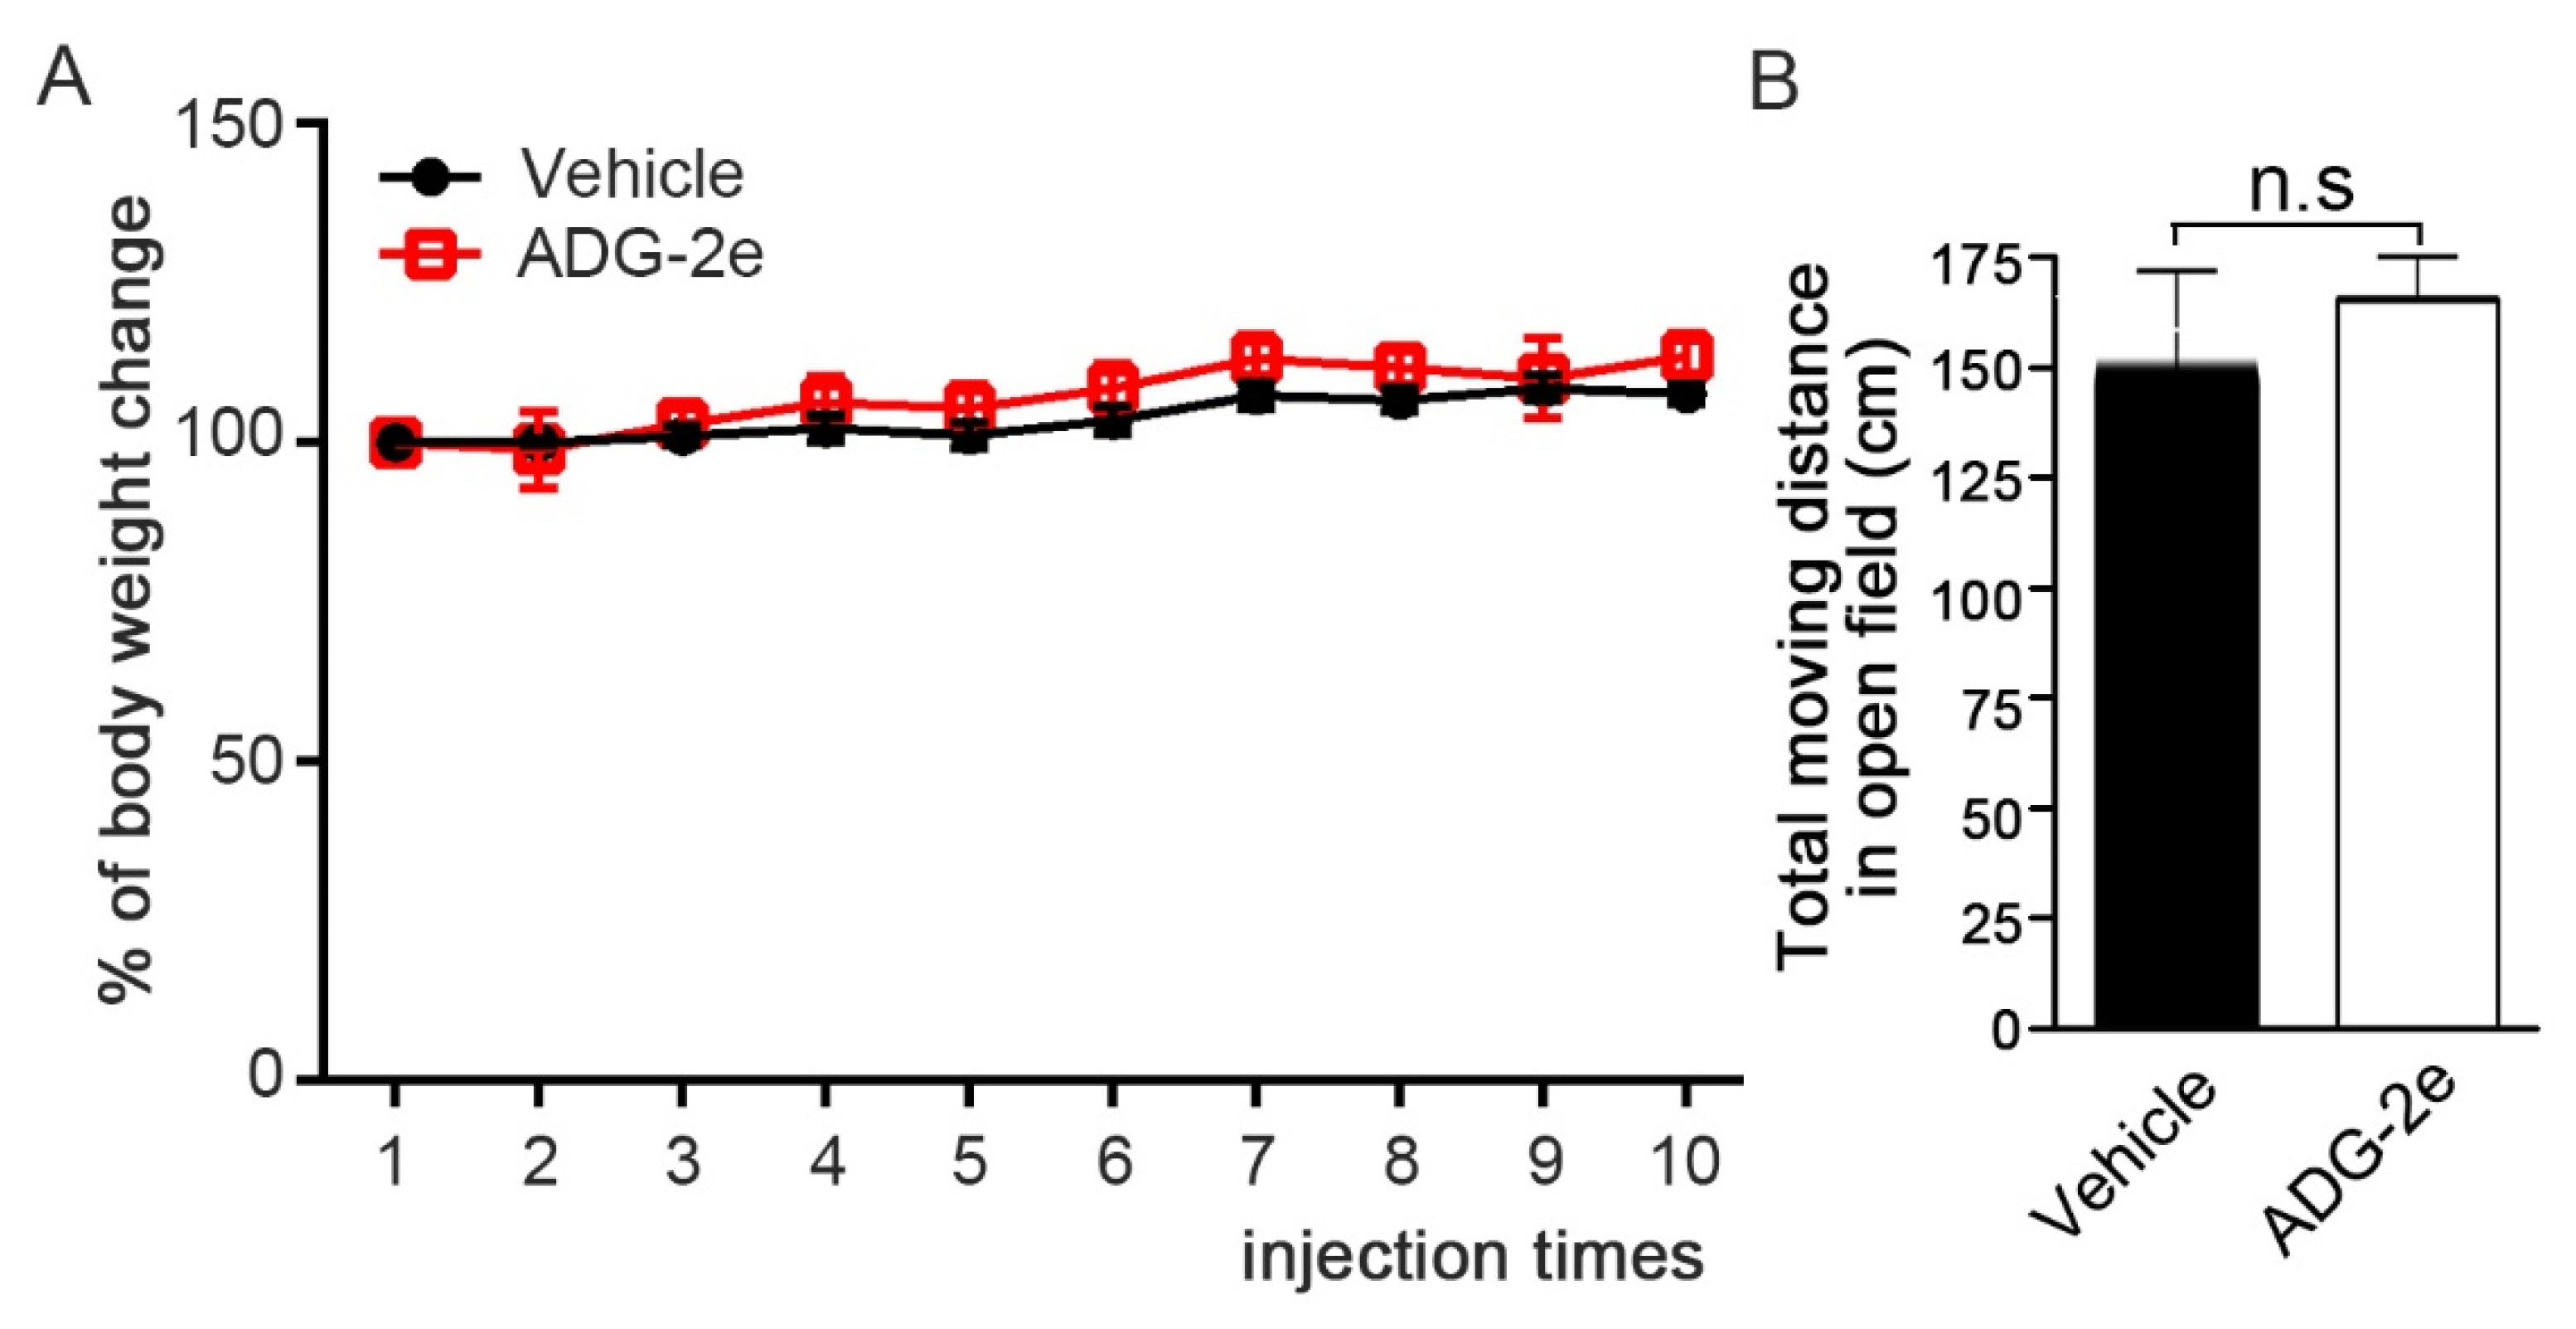
2.7. Mouse Behavior Analysis in an Open Field Cage
2.8. Statistical Analysis
3. Results
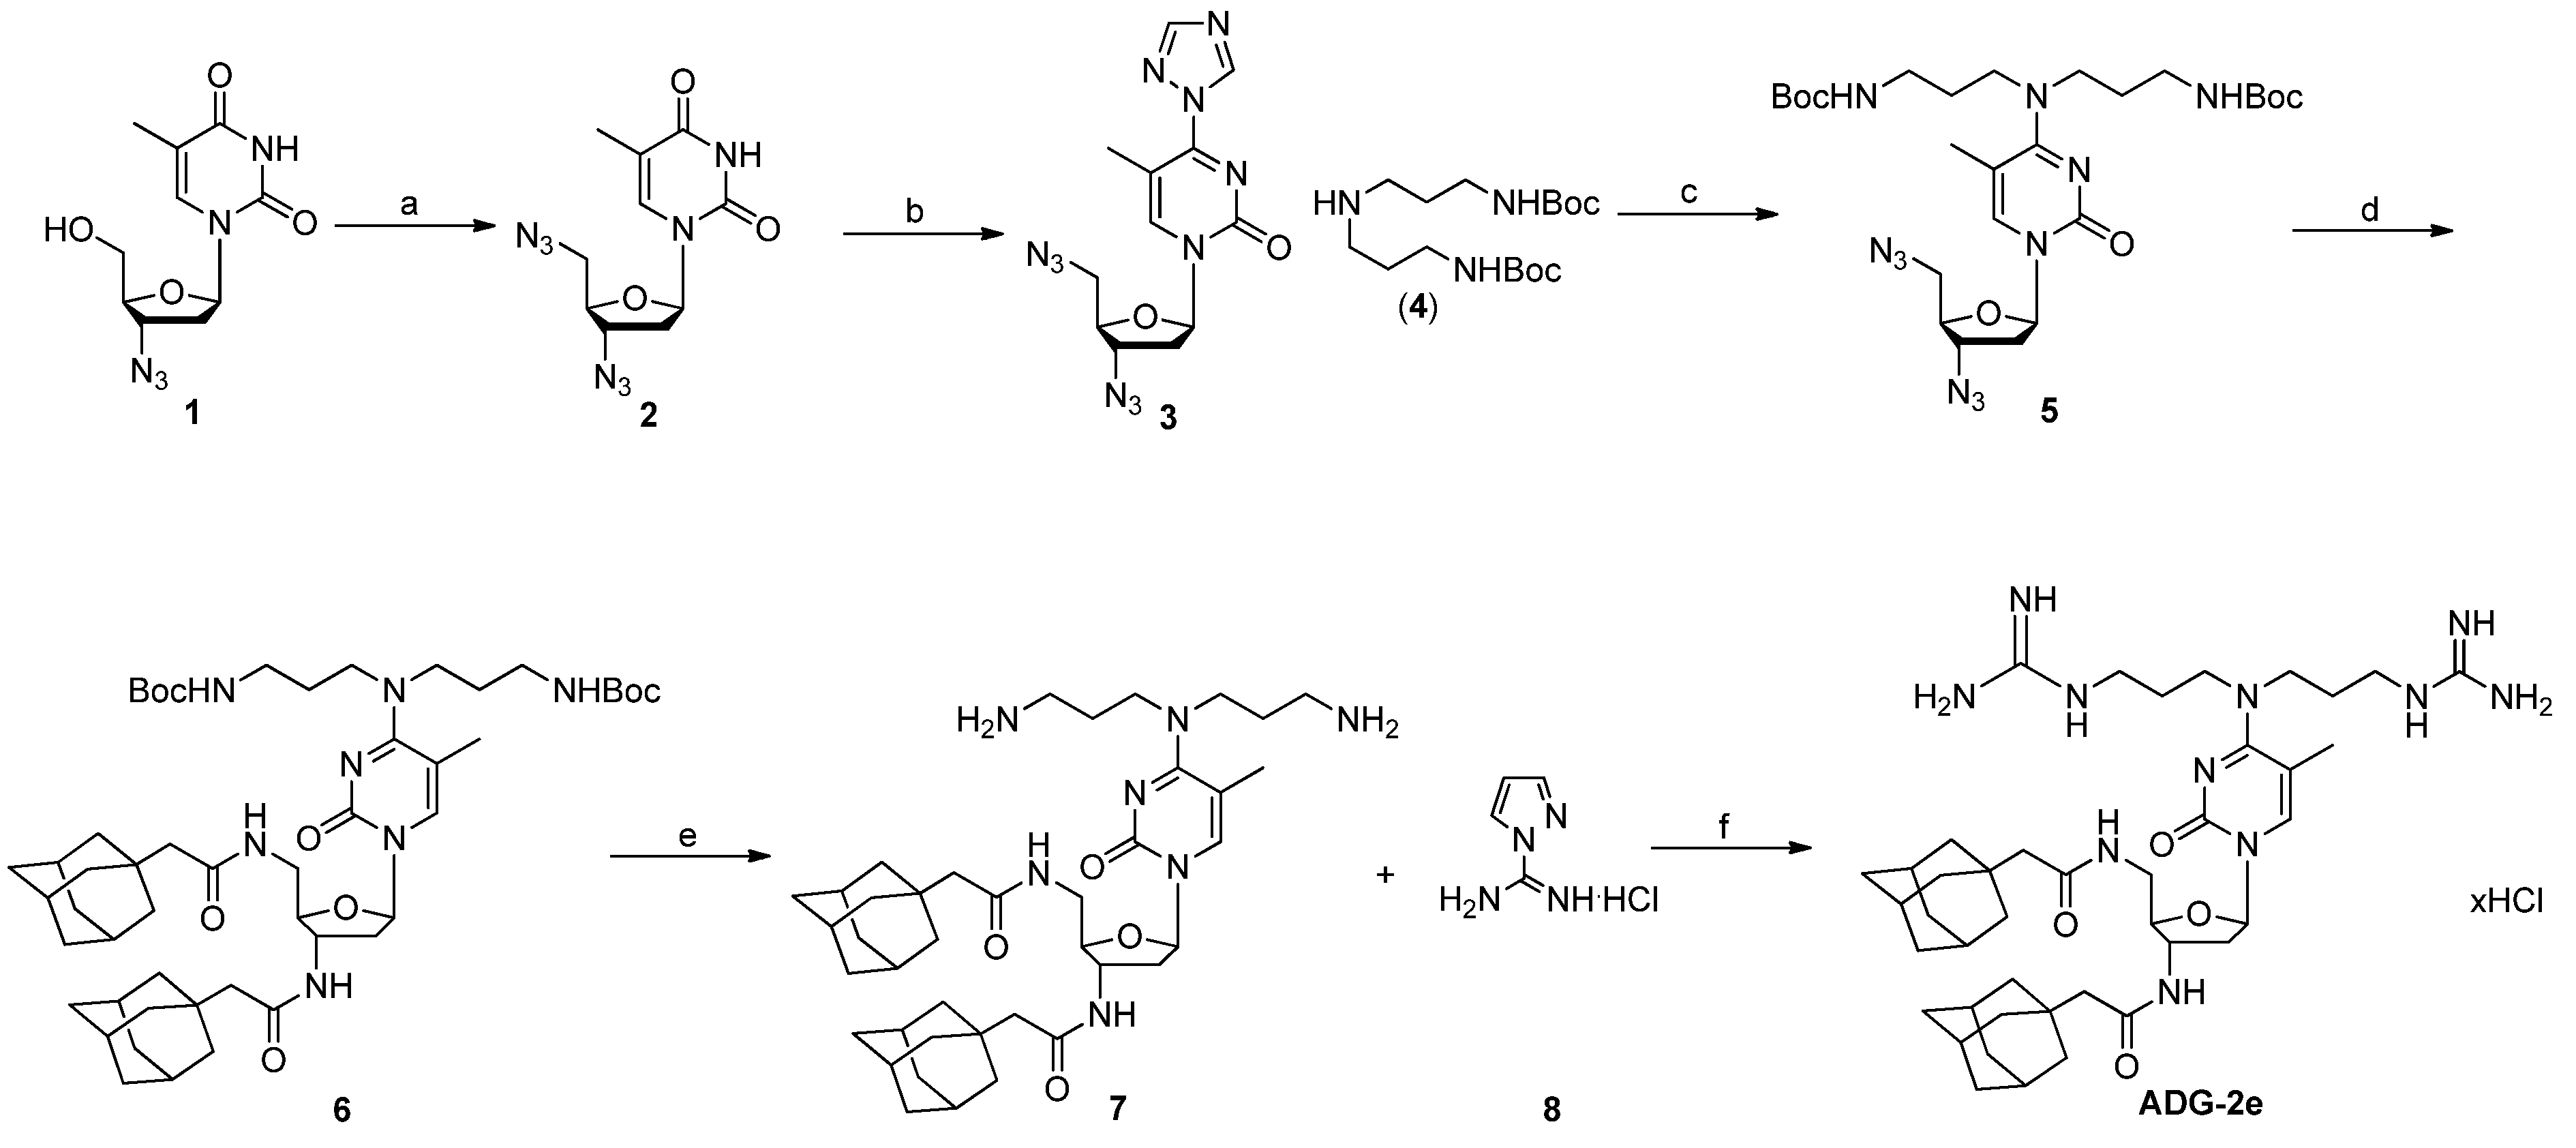
3.1. Synthesis of ADG-2e
3.2. Anticancer Effect of ADG-2e
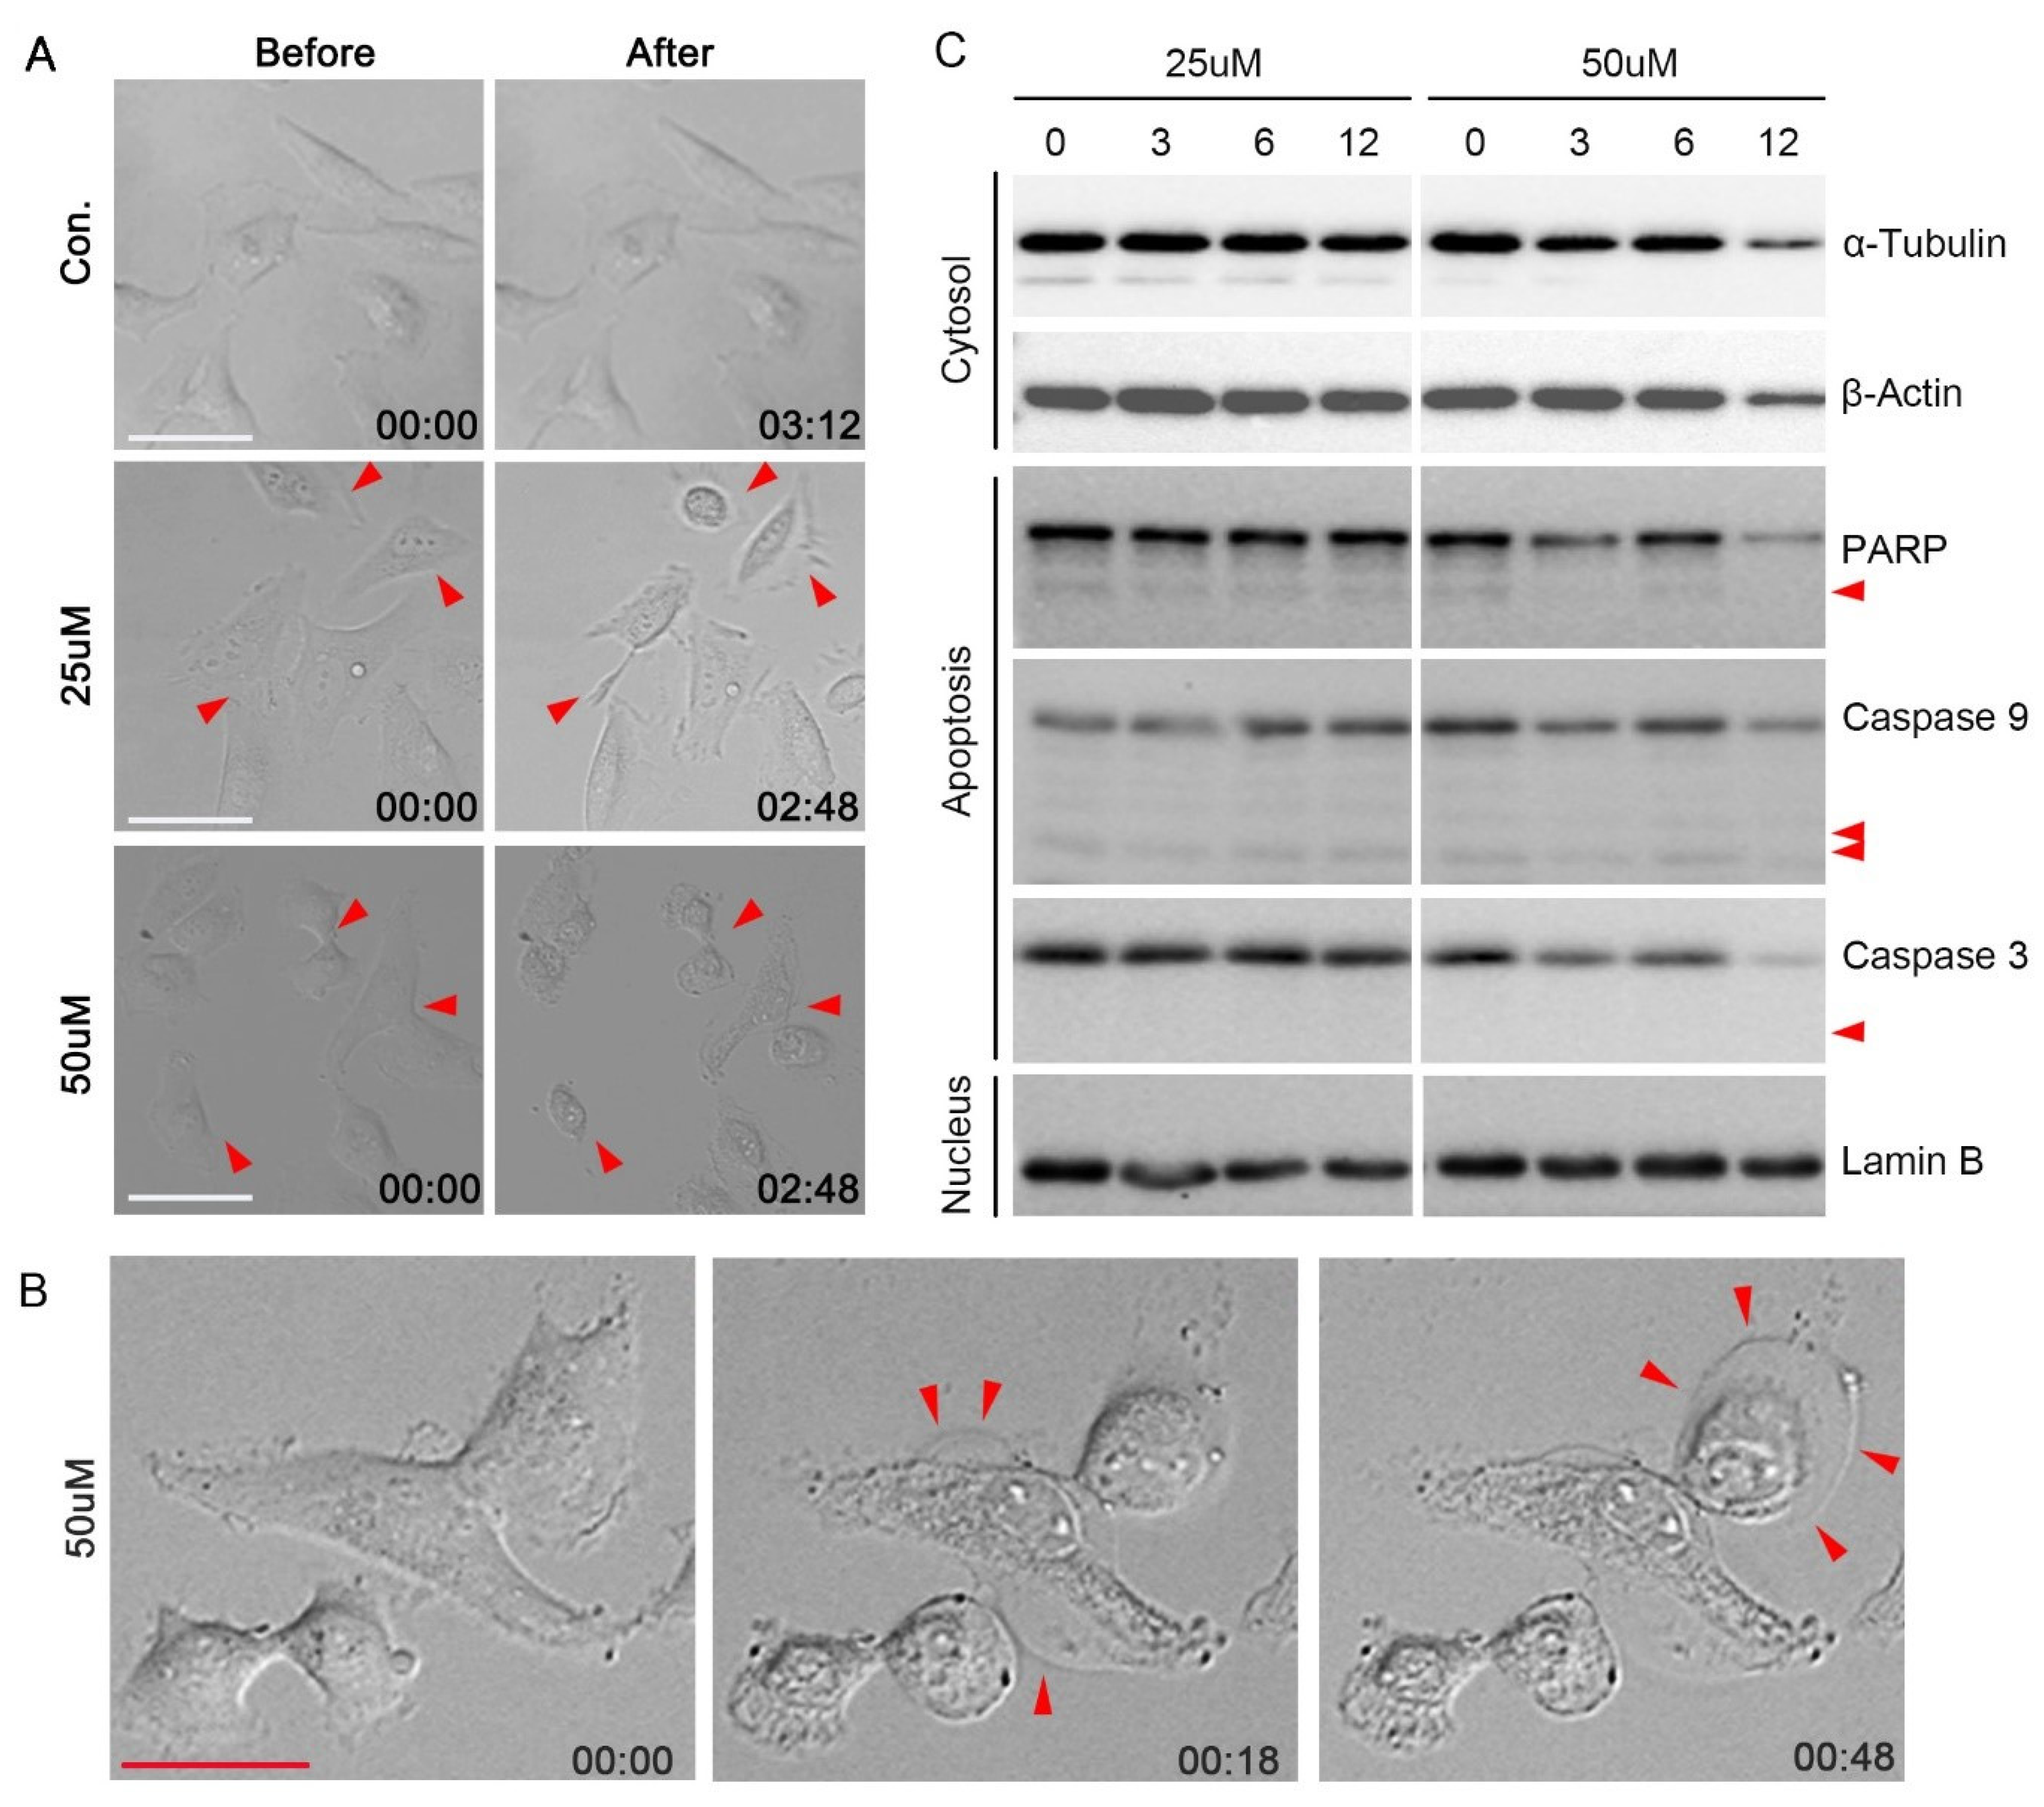
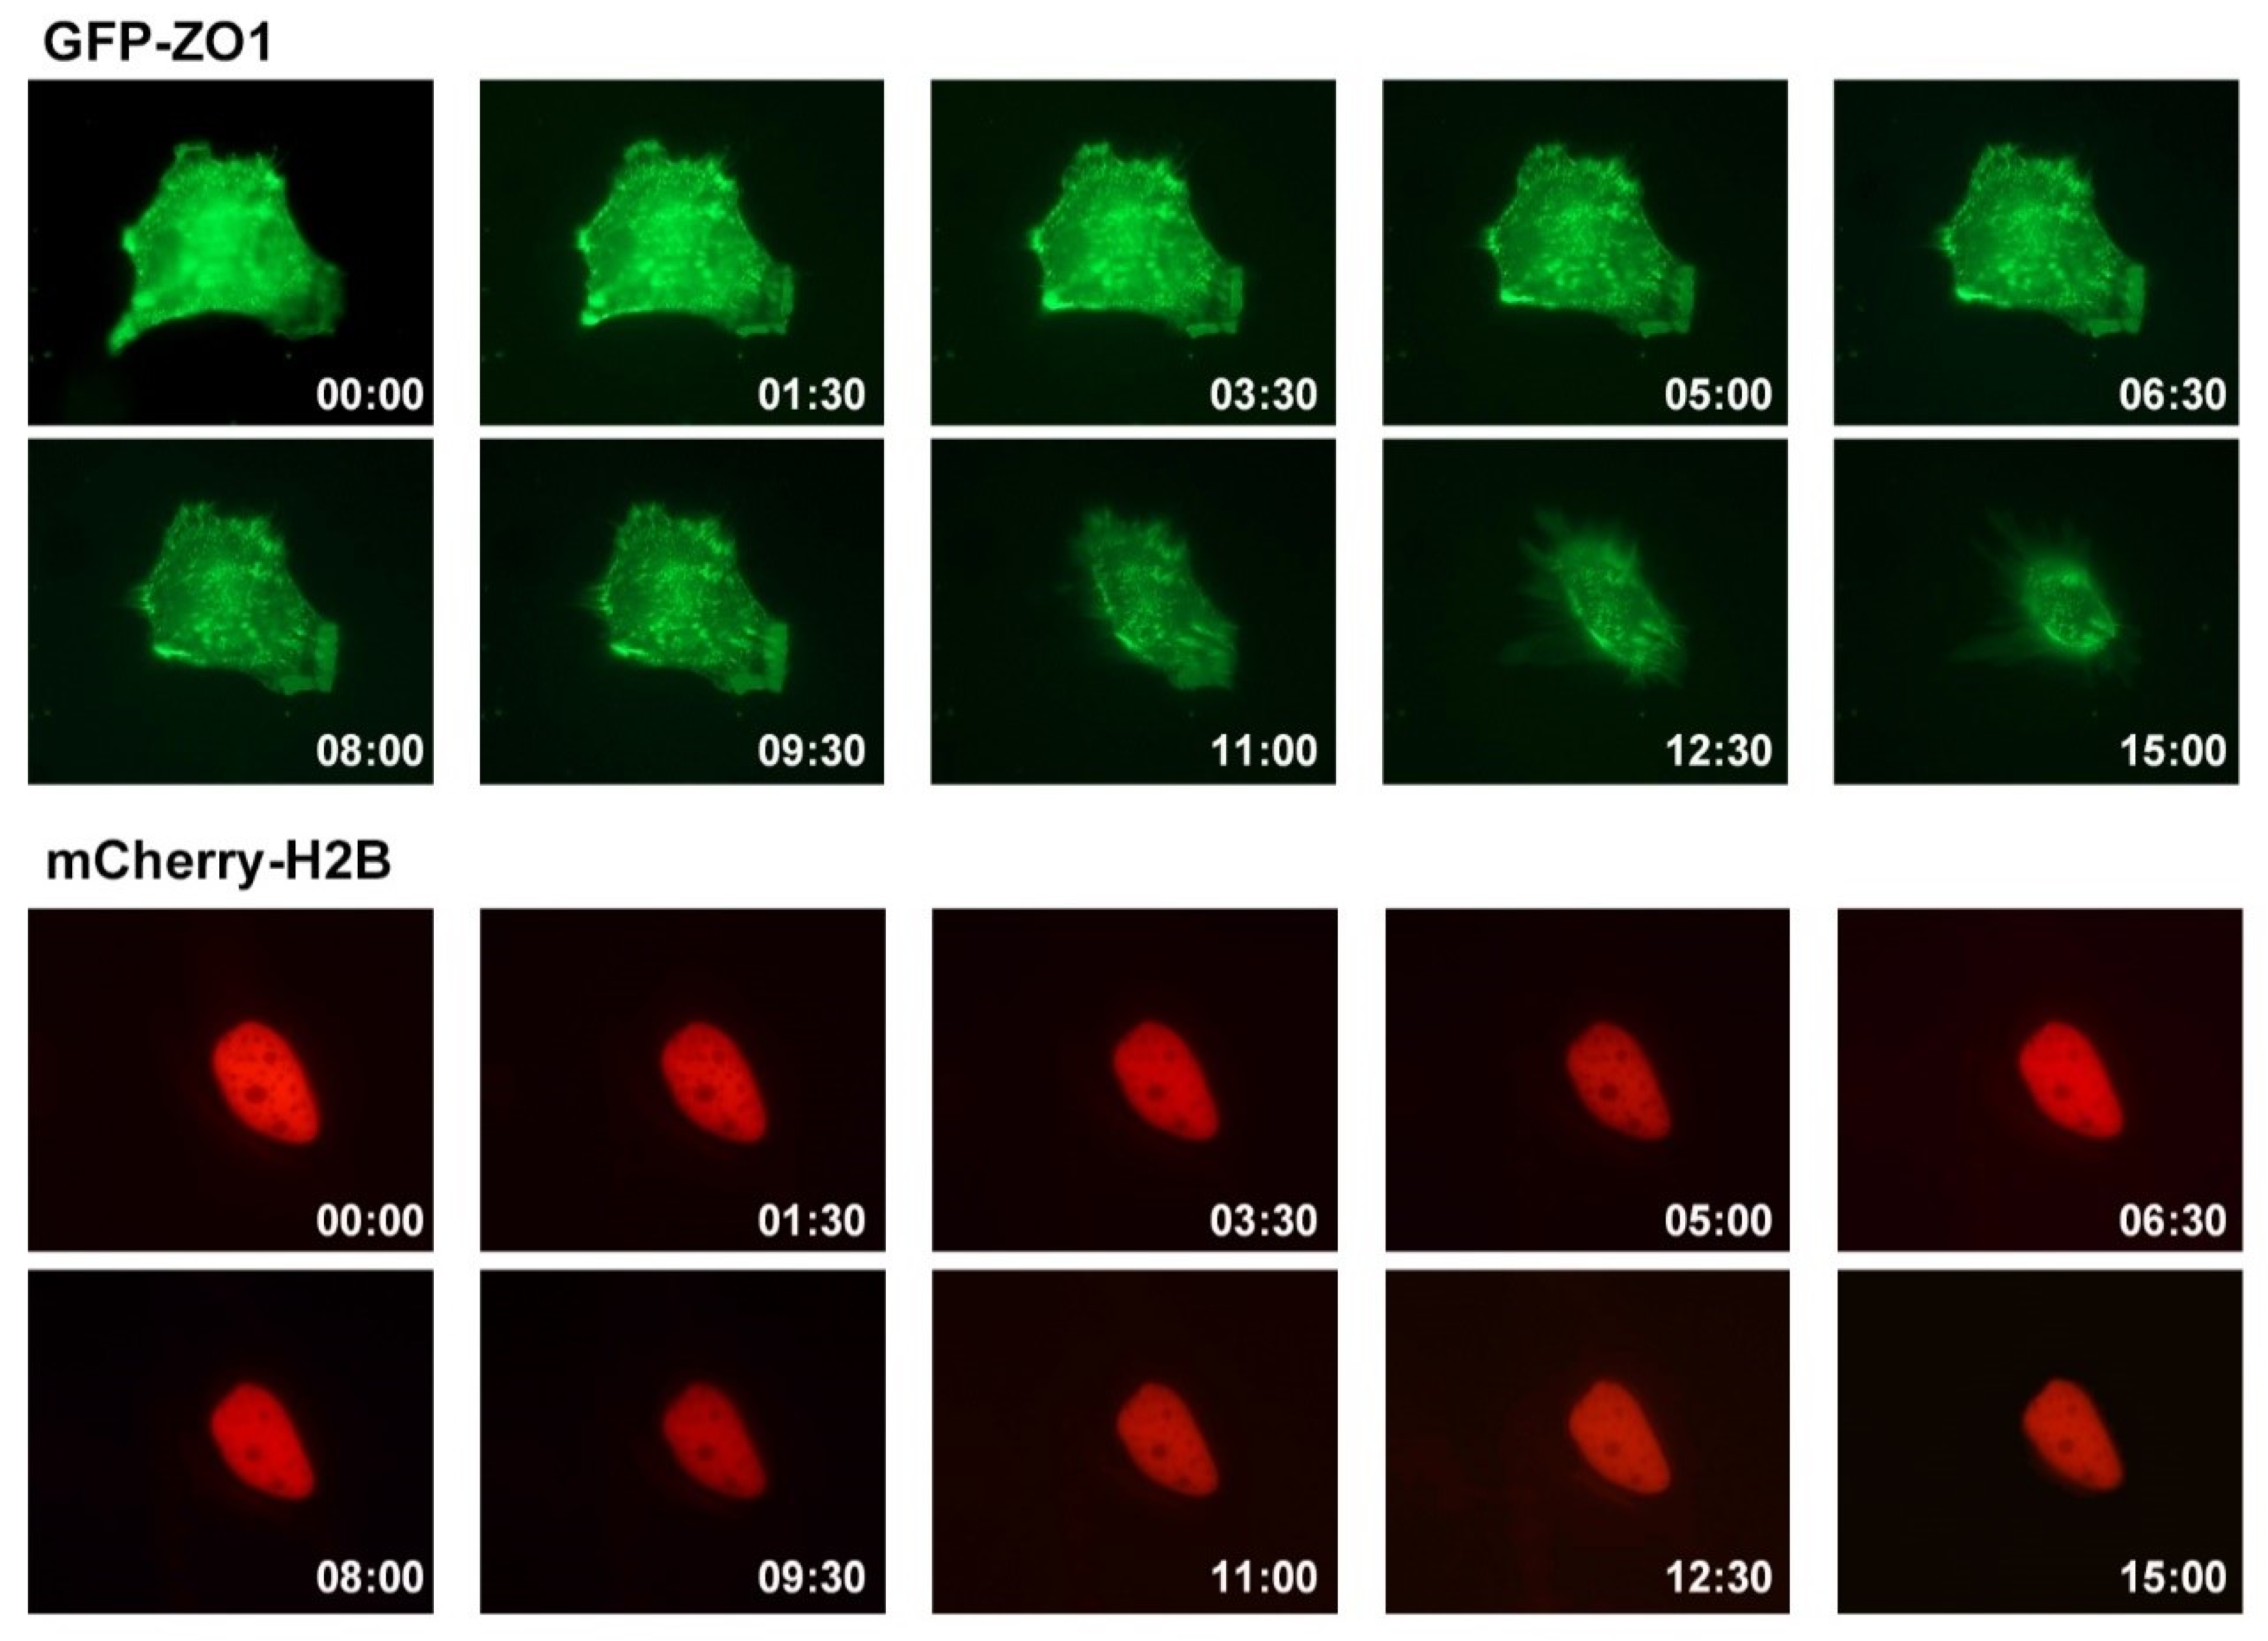
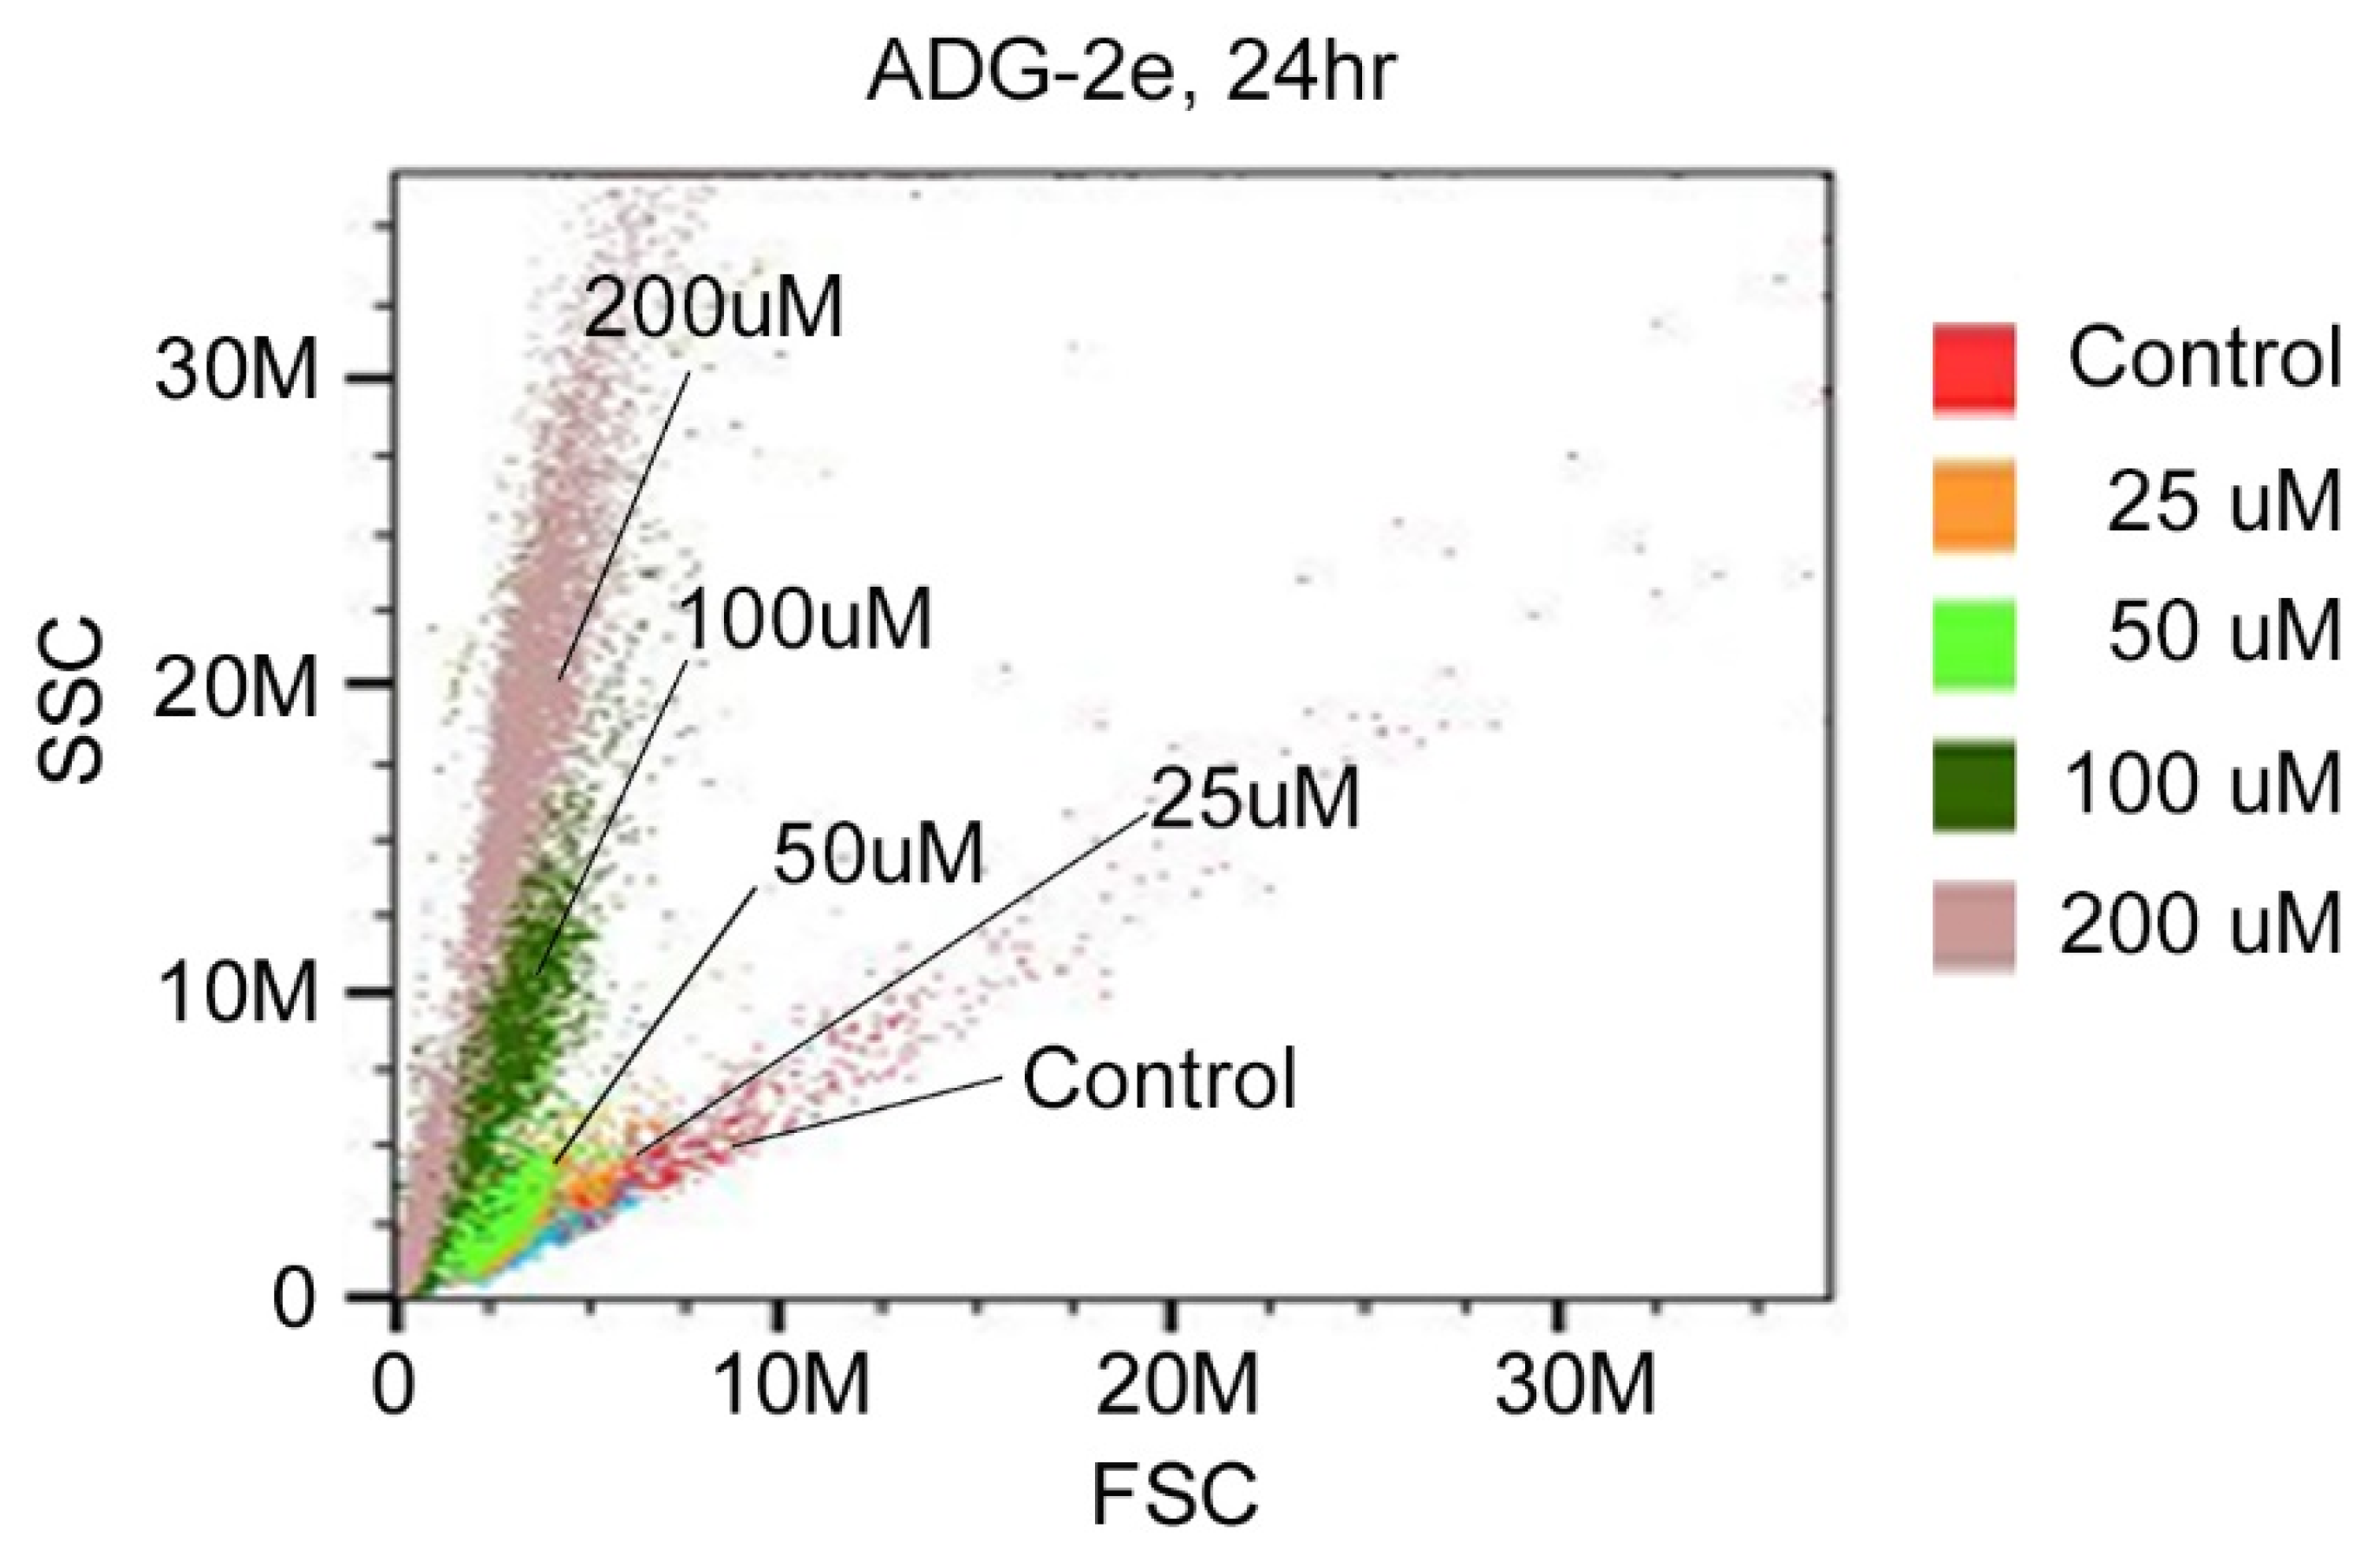
3.3. Effect of ADG-2e on the Cell Membrane
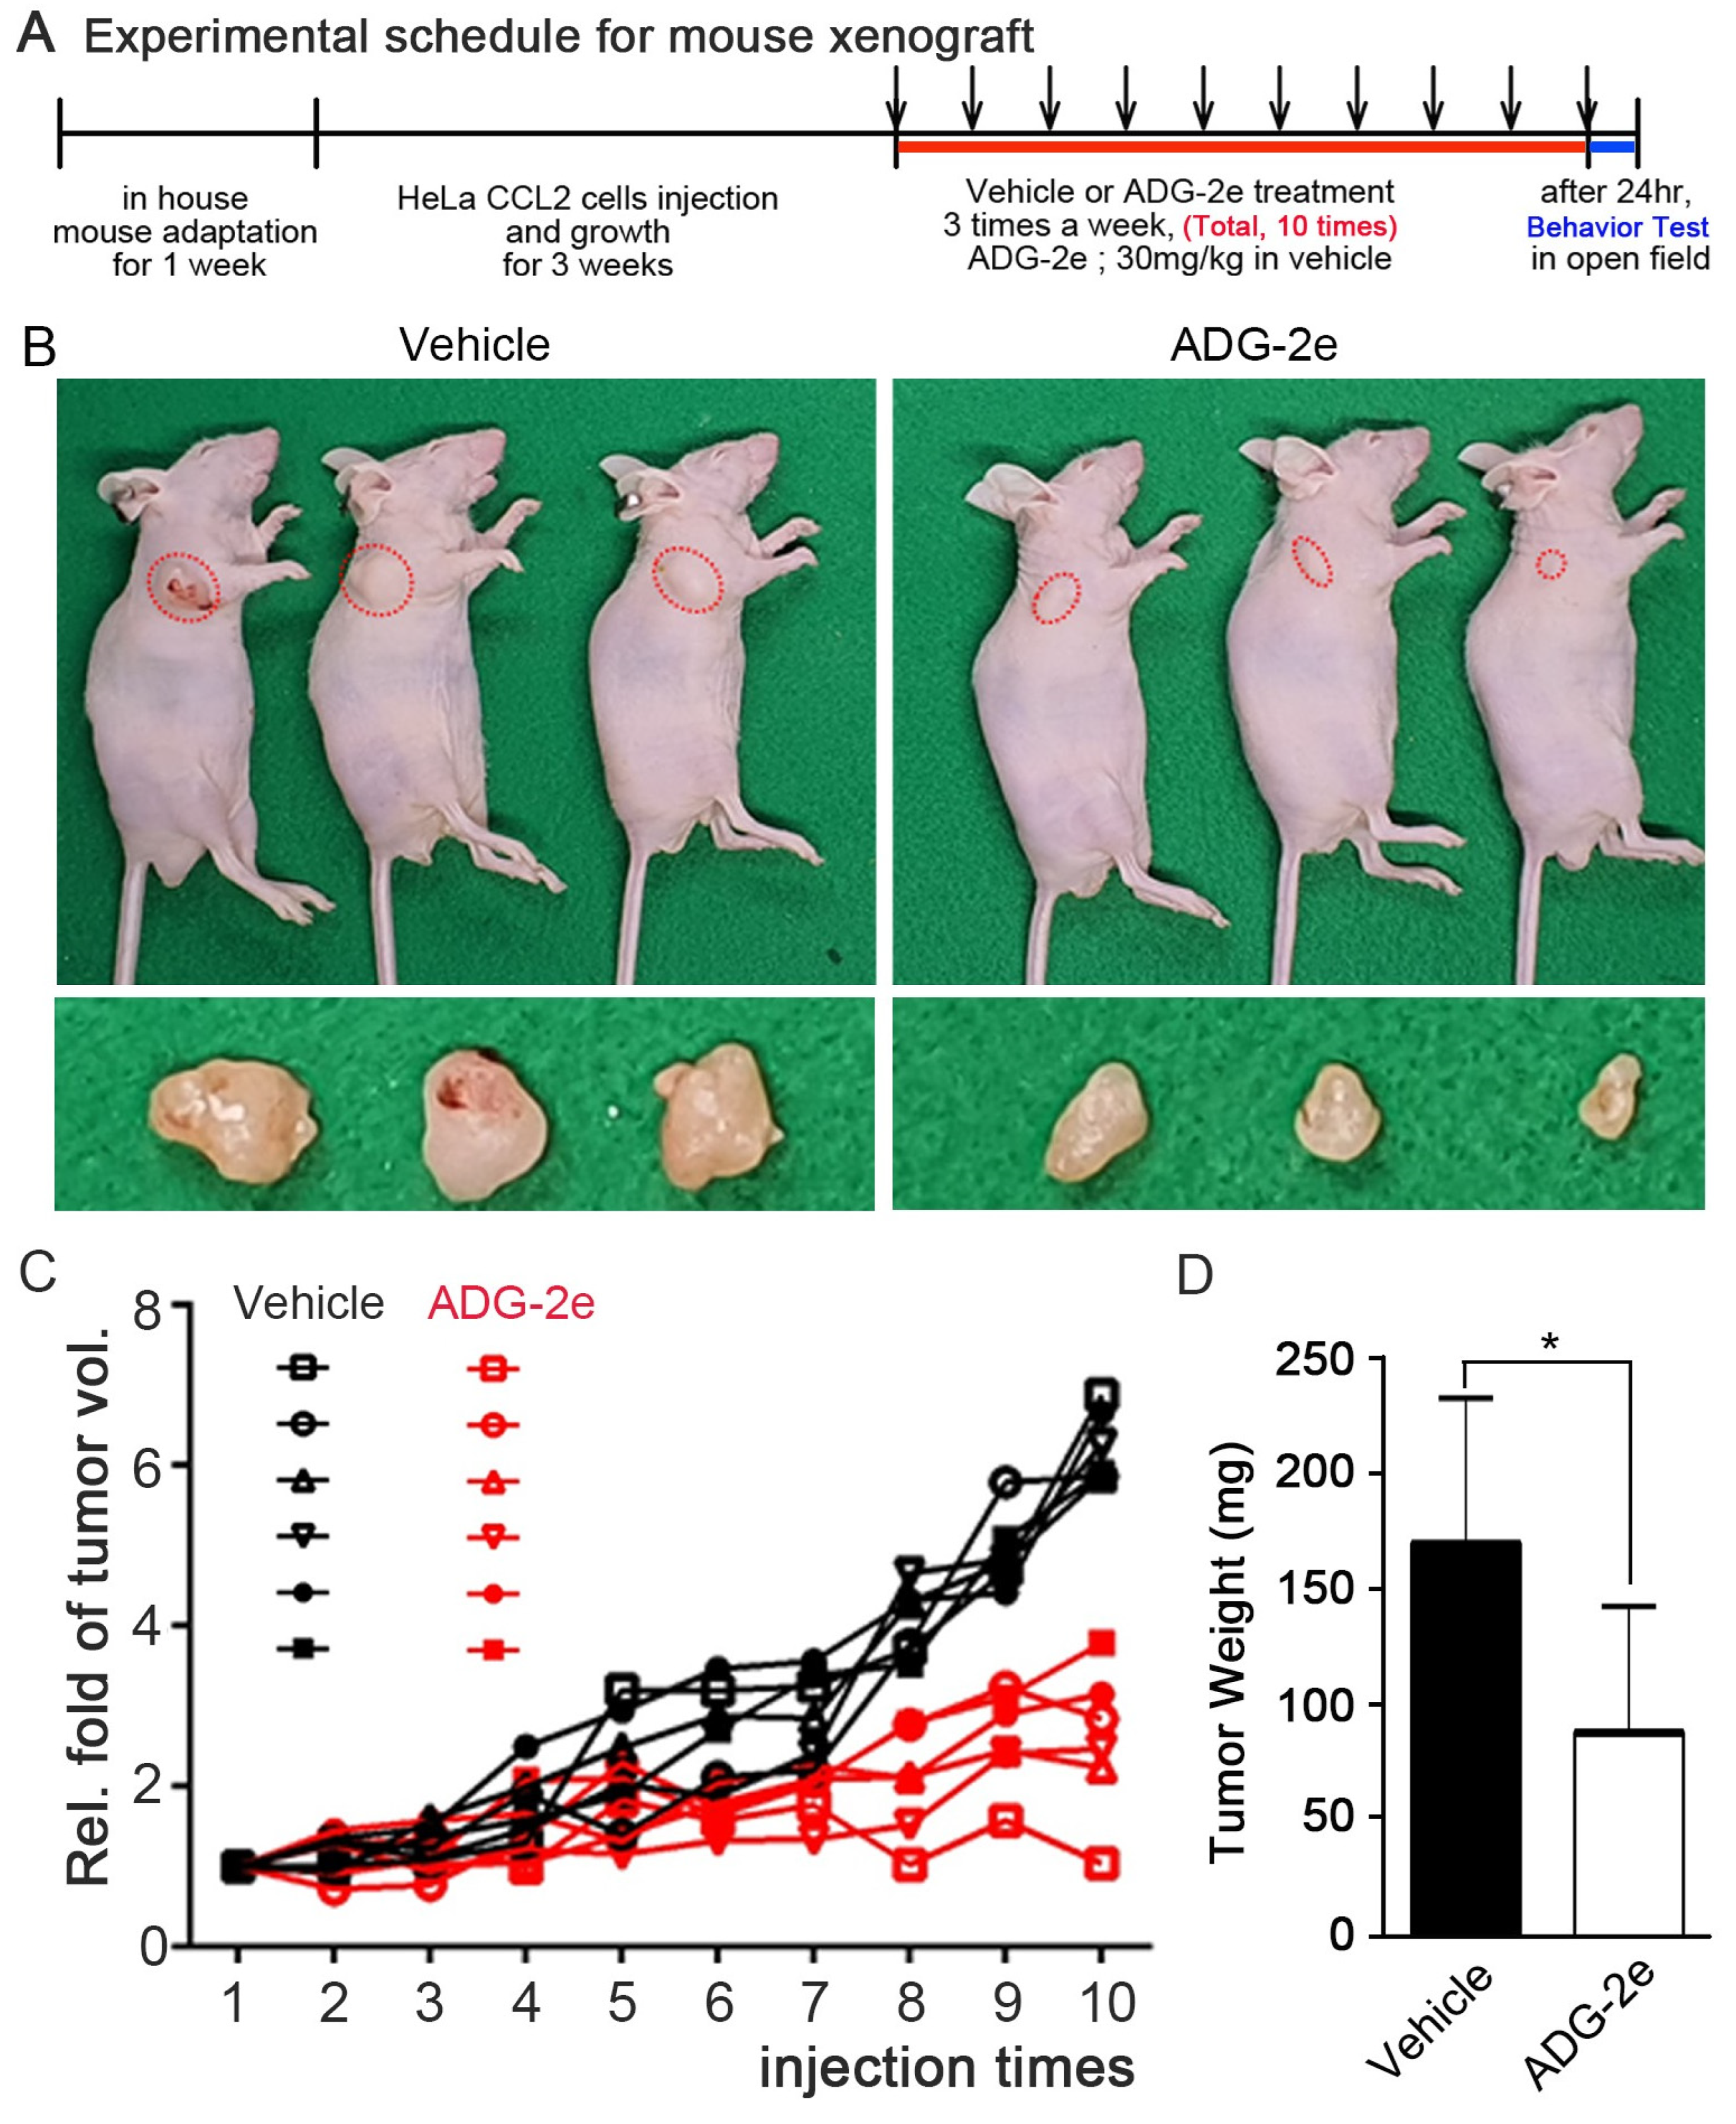
3.4. Evaluation of In Vivo Potency of ADG-2e
4. Discussion and Conclusions
Supplementary Materials
Author Contributions
Funding
Institutional Review Board Statement
Informed Consent Statement
Data Availability Statement
Conflicts of Interest
References
- Sung, H.; Ferlay, J.; Siegel, R.L.; Laversanne, M.; Soerjomataram, I.; Jemal, A.; Bray, F. Global Cancer Statistics 2020: GLOBOCAN Estimates of Incidence and Mortality Worldwide for 36 Cancers in 185 Countries. CA Cancer J. Clin. 2021, 71, 209–249. [Google Scholar] [CrossRef] [PubMed]
- Pham-Huy, L.A.; He, H.; Pham-Huy, C. Free radicals, antioxidants in disease and health. Int. J. Biomed. Sci. 2008, 4, 89–96. [Google Scholar]
- Gupta, R.K.; Patel, A.K.; Shah, N.; Choudhary, A.K.; Jha, U.K.; Yadav, U.C.; Gupta, P.K.; Pakuwal, U. Oxidative stress and antioxidants in disease and cancer: A review. Asian Pac. J. Cancer Prev. 2014, 15, 4405–4409. [Google Scholar] [CrossRef] [PubMed] [Green Version]
- Wainwright, E.N.; Scaffidi, P. Epigenetics and cancer stem cells: Unleashing, hijacking, and restricting cellular plasticity. Trends Cancer 2017, 3, 372–386. [Google Scholar] [CrossRef] [PubMed] [Green Version]
- Tsimberidou, A.M.; Fountzilas, E.; Nikanjam, M.; Kurzrock, R. Review of precision cancer medicine: Evolution of the treatment paradigm. Cancer Treat. Rev. 2020, 86, 102019. [Google Scholar] [CrossRef] [PubMed]
- Patel, T.K.; Adhikari, N.; Amin, S.A.; Biswas, S.; Jha, T.; Ghosh, B. Small molecule drug conjugates (SMDCs): An emerging strategy for anticancer drug design and discovery. New J. Chem. 2021, 45, 5291–5321. [Google Scholar] [CrossRef]
- Hait, W.N. Anticancer drug development: The grand challenges. Nat. Rev. Drug Discov. 2010, 9, 253–254. [Google Scholar] [CrossRef]
- Bevers, E.M.; Comfurius, P.; Zwaal, R.F.A. Regulatory Mechanisms in Maintenance and Modulation of Transmembrane Lipid Asymmetry: Pathophysiological Implications. Lupus 1996, 5, 480–487. [Google Scholar] [CrossRef]
- Wodlej, C.; Riedl, S.; Rinner, B.; Leber, R.; Drechsler, C.; Voelker, D.R.; Choi, J.-Y.; Lohner, K.; Zweytick, D. Interaction of two antitumor peptides with membrane lipids—Influence of phosphatidylserine and cholesterol on specificity for melanoma cells. PLoS ONE 2019, 14, e0211187. [Google Scholar] [CrossRef] [PubMed]
- Ran, S.; Downes, A.; Thorpe, P.E. Increased Exposure of Anionic Phospholipids on the Surface of Tumor Blood Vessels. Cancer Research 2002, 62, 6132–6140. [Google Scholar]
- Campbell, K.; Rossi, F.; Adams, J.; Pitsidianaki, I.; Barriga, F.M.; Garcia-Gerique, L.; Batlle, E.; Casanova, J.; Casali, A. Collective cell migration and metastases induced by an epithelial-to-mesenchymal transition in Drosophila intestinal tumors. Nat. Commun. 2019, 10, 1–10. [Google Scholar] [CrossRef] [PubMed] [Green Version]
- Seyfried, T.N.; Huysentruyt, L.C. On the Origin of Cancer Metastasis. Crit. Rev. Oncog. 2013, 18, 43–73. [Google Scholar] [CrossRef] [Green Version]
- Hoskin, D.W.; Ramamoorthy, A. Studies on anticancer activities of antimicrobial peptides. Biochim. Biophys. Biomembr. 2008, 1778, 357–375. [Google Scholar] [CrossRef] [Green Version]
- Deslouches, B.; Di, Y.P. Antimicrobial peptides with selective antitumor mechanisms: Prospect for anticancer applications. Oncotarget 2017, 8, 46635–46651. [Google Scholar] [CrossRef] [Green Version]
- Piktel, E.; Niemirowicz, K.; Wnorowska, U.; Wątek, M.; Wollny, T.; Głuszek, K.; Góźdź, S.; Levental, I.; Bucki, R. The Role of Cathelicidin LL-37 in Cancer Development. Arch. Immunol. Ther. Exp. 2016, 64, 33–46. [Google Scholar] [CrossRef] [PubMed] [Green Version]
- Haug, B.E.; Camilio, K.A.; Eliassen, L.T.; Stensen, W.; Svendsen, J.S.; Berg, K.; Mortensen, B.; Serin, G.; Mirjolet, J.-F.; Bichat, F.; et al. Discovery of a 9-mer Cationic Peptide (LTX-315) as a Potential First in Class Oncolytic Peptide. J. Med. Chem. 2016, 59, 2918–2927. [Google Scholar] [CrossRef] [PubMed] [Green Version]
- Tornesello, A.L.; Borrelli, A.; Buonaguro, L.; Buonaguro, F.M.; Tornesello, M.L. Antimicrobial Peptides as Anticancer Agents: Functional Properties and Biological Activities. Molecules 2020, 25, 2850. [Google Scholar] [CrossRef]
- Kudrimoti, M.; Curtis, A.; Azawi, S.; Worden, F.; Katz, S.; Adkins, D.; Bonomi, M.; Elder, J.; Sonis, S.T.; Straube, R.; et al. Dusquetide: A novel innate defense regulator demonstrating a significant and consistent reduction in the duration of oral mucositis in preclinical data and a randomized, placebo-controlled phase 2a clinical study. J. Biotechnol. 2016, 239, 115–125. [Google Scholar] [CrossRef] [Green Version]
- Lee, H.S.; Park, C.B.; Kim, J.M.; Jang, S.A.; Park, I.Y.; Kim, M.S.; Cho, J.H.; Kim, S.C. Mechanism of anticancer activity of buforin IIb, a histone H2A-derived peptide. Cancer Lett. 2008, 271, 47–55. [Google Scholar] [CrossRef]
- Do, N.; Weindl, G.; Grohmann, L.; Salwiczek, M.; Koksch, B.; Korting, H.C.; Schäfer-Korting, M. Cationic membrane-active peptides–anticancer and antifungal activity as well as penetration into human skin. Exp. Dermatol. 2014, 23, 326–331. [Google Scholar] [CrossRef]
- McKeown, S.T.; Lundy, F.T.; Nelson, J.; Lockhart, D.; Irwin, C.R.; Cowan, C.G.; Marley, J.J. The cytotoxic effects of human neutrophil peptide-1 (HNP1) and lactoferrin on oral squamous cell carcinoma (OSCC) in vitro. Oral Oncol. 2006, 42, 685–690. [Google Scholar] [CrossRef] [PubMed]
- Rozek, T.; Wegener, K.L.; Bowie, J.H.; Olver, I.N.; Carver, J.A.; Wallace, J.C.; Tyler, M.J. The antibiotic and anticancer active aurein peptides from the Australian Bell Frogs Litoria aurea and Litoria raniformis. Eur. J. Biochem. 2000, 267, 5330–5341. [Google Scholar] [CrossRef]
- Fosgerau, K.; Hoffmann, T. Peptide therapeutics: Current status and future directions. Drug Discov. 2015, 20, 122–128. [Google Scholar] [CrossRef] [Green Version]
- Gunasekaran, P.; Rajasekaran, G.; Han, E.H.; Chung, Y.-H.; Choi, Y.-J.; Yang, Y.J.; Lee, J.E.; Kim, H.N.; Lee, K.; Kim, J.-S.; et al. Cationic Amphipathic Triazines with Potent Anti-bacterial, Anti-inflammatory and Anti-atopic Dermatitis Properties. Sci. Rep. 2019, 9, 1–17. [Google Scholar] [CrossRef] [PubMed]
- Bray, B.L. Large-scale manufacture of peptide therapeutics by chemical synthesis. Nat. Rev. Drug Discov. 2003, 2, 587–593. [Google Scholar] [CrossRef]
- Gunasekaran, P.; Kim, E.Y.; Lee, J.; Ryu, E.K.; Shin, S.Y.; Bang, J.K. Synthesis of Fmoc-Triazine Amino Acids and Its Application in the Synthesis of Short Antibacterial Peptidomimetics. Int. J. Mol. Sci. 2020, 21, 3602. [Google Scholar] [CrossRef] [PubMed]
- De Clercq, E. Anti-HIV drugs: 25 compounds approved within 25 years after the discovery of HIV. Int. J. Antimicrob. Agents 2009, 33, 307–320. [Google Scholar] [CrossRef]
- Jagetia, G.C.; Aruna, R. Correlation of micronuclei-induction with the cell survival in HeLa cells treated with a base analogue, azidothymidine (AZT) before exposure to different doses of γ-radiation. Toxicol. Lett. 2003, 139, 33–43. [Google Scholar] [CrossRef]
- da Rosa, R.M.; Piccoli, B.C.; da Silva, F.D.A.; Dornelles, L.; Rocha, J.B.; Sonego, M.S.; Begnini, K.R.; Collares, T.; Seixas, F.K.; Rodrigues, O.E. Synthesis, antioxidant and antitumoral activities of 5′-arylchalcogeno-3-aminothymidine (ACAT) derivatives. MedChemComm 2017, 8, 408–414. [Google Scholar] [CrossRef]
- Dalpiaz, A.; Paganetto, G.; Pavan, B.; Fogagnolo, M.; Medici, A.; Beggiato, S.; Perrone, D. Zidovudine and Ursodeoxycholic Acid Conjugation: Design of a New Prodrug Potentially Able To Bypass the Active Efflux Transport Systems of the Central Nervous System. Mol. Pharm. 2012, 9, 957–968. [Google Scholar] [CrossRef]
- Jin, Y.; Xin, R.; Tong, L.; Du, L.; Li, M. Combination Anti-HIV Therapy with the Self-Assemblies of an Asymmetric Bolaamphiphilic Zidovudine/Didanosine Prodrug. Mol. Pharm. 2011, 8, 867–876. [Google Scholar] [CrossRef]
- Fang, X.; Hu, T.; Yin, H.; Yang, J.; Tang, W.; Hu, S.; Xu, X. Differences in telomerase activity and the effects of AZT in aneuploid and euploid cells in colon cancer. Int. J. Oncol. 2017, 51, 525–532. [Google Scholar] [CrossRef]
- Armando, R.G.; Gomez, D.M.; Gomez, D.E. AZT exerts its antitumoral effect by telomeric and non-telomeric effects in a mammary adenocarcinoma model. Oncol. Rep. 2016, 36, 2731–2736. [Google Scholar] [CrossRef] [PubMed]
- Munchen, T.S.; Sonego, M.S.; de Souza, D.; Dornelles, L.; Seixas, F.K.; Collares, T.; Piccoli, B.C.; da Silva, F.D.Á.; da Rocha, J.B.T.; Quoos, N.; et al. New 3′-Triazolyl-5′-aryl-chalcogenothymidine: Synthesis and Anti-oxidant and Antiproliferative Bladder Carcinoma (5637) Activity. ChemistrySelect 2018, 3, 3479–3486. [Google Scholar] [CrossRef]
- Wang, H.; Zhou, J.; He, Q.; Dong, Y.; Liu, Y. Azidothymidine inhibits cell growth and telomerase activity and induces DNA damage in human esophageal cancer. Mol. Med. Rep. 2017, 15, 4055–4060. [Google Scholar] [CrossRef] [PubMed] [Green Version]
- Chirumarry, S.; Soung, N.-K.; Han, J.; Kim, E.Y.; Ryu, E.K.; Lee, Y.-H.; Shin, S.Y.; Gunasekaran, P.; Bang, J.K. Antibacterial AZT derivative regulates metastasis of breast cancer cells. Eur J. Med. Chem. 2020, 193, 112233. [Google Scholar] [CrossRef]
- Angeli, E.; Bousquet, G. Brain Metastasis Treatment: The Place of Tyrosine Kinase Inhibitors and How to Facilitate Their Diffusion across the Blood–Brain Barrier. Pharmaceutics 2021, 13, 1446. [Google Scholar] [CrossRef]
- Qian, C.-N.; Mei, Y.; Zhang, J. Cancer metastasis: Issues and challenges. Chin. J. Cancer 2017, 36, 1–4. [Google Scholar] [CrossRef]
- Quiroz-Reyes, A.G.; Islas, J.F.; Delgado-Gonzalez, P.; Franco-Villarreal, H.; Garza-Treviño, E.N. Therapeutic Approaches for Metastases from Colorectal Cancer and Pancreatic Ductal Carcinoma. Pharmaceutics 2021, 13, 103. [Google Scholar] [CrossRef]
- Tannock, I.F.; Hickman, J.A. Limits to Personalized Cancer Medicine. N. Engl. J. Med. 2016, 375, 1289–1294. [Google Scholar] [CrossRef] [Green Version]
- Hao, E.-J.; Li, G.-X.; Liang, Y.-R.; Xie, M.-S.; Wang, D.-C.; Jiang, X.-H.; Cheng, J.-Y.; Shi, Z.-X.; Wang, Y.; Guo, H.-M. Design, Synthesis, and Activity Evaluation of Novel Acyclic Nucleosides as Potential Anticancer Agents In Vitro and In Vivo. J. Med. Chem. 2021, 64, 2077–2109. [Google Scholar] [CrossRef]
- Jordheim, L.P.; Durantel, D.; Zoulim, F.; Dumontet, C. Advances in the development of nucleoside and nucleotide analogues for cancer and viral diseases. Nat. Rev. Drug Discov. 2013, 12, 447–464. [Google Scholar] [CrossRef]
- Gunasekaran, P.; Yim, M.S.; Ahn, M.; Soung, N.-K.; Park, J.-E.; Kim, J.; Bang, G.; Shin, S.C.; Choi, J.; Kim, M.; et al. Development of a Polo-like Kinase-1 Polo-Box Domain Inhibitor as a Tumor Growth Suppressor in Mice Models. J. Med. Chem. 2020, 63, 14905–14920. [Google Scholar] [CrossRef]
- Reyes-Mendez, M.E.; Castro-Sánchez, L.A.; Dagnino-Acosta, A.; Aguilar-Martínez, I.; Pérez-Burgos, A.; Vázquez-Jiménez, C.; Moreno-Galindo, E.G.; Álvarez-Cervera, F.J.; Góngora-Alfaro, J.L.; Navarro-Polanco, R.A.; et al. Capsaicin produces antidepressant-like effects in the forced swimming test and enhances the response of a sub-effective dose of amitriptyline in rats. Physiol. Behav. 2018, 195, 158–166. [Google Scholar] [CrossRef]
- Au-Seynhaeve, A.L.B.; ten Hagen, T.L.M. Using In Vitro Live-cell Imaging to Explore Chemotherapeutics Delivered by Lipid-based Nanoparticles. JoVE 2017, 129, 55405. [Google Scholar] [CrossRef] [Green Version]
- Lee, S.Y.; Ju, M.K.; Jeon, H.M.; Jeong, E.K.; Lee, Y.J.; Kim, C.H.; Park, H.G.; Han, S.I.; Kang, H.S. Regulation of Tumor Progression by Programmed Necrosis. Oxidative Med. Cell. Longev. 2018, 2018, 1–28. [Google Scholar] [CrossRef] [PubMed] [Green Version]
- Majno, G.; Joris, I. Apoptosis, oncosis, and necrosis. An overview of cell death. Am. J. Pathol. 1995, 146, 3–15. [Google Scholar]
- Hisam, N.S.N.; Ugusman, A.; Rajab, N.F.; Ahmad, M.F.; Fenech, M.; Liew, S.L.; Anuar, N.N.M. Combination Therapy of Navitoclax with Chemotherapeutic Agents in Solid Tumors and Blood Cancer: A Review of Current Evidence. Pharmaceutics 2021, 13, 1353. [Google Scholar] [CrossRef] [PubMed]
- Suárez, Y.; González, L.; Cuadrado, A.; Berciano, M.; Lafarga, M.; Muñoz, A. Kahalalide F, a new marine-derived compound, induces oncosis in human prostate and breast cancer cells. Mol. Cancer Ther. 2003, 2, 863–872. [Google Scholar]
- Du, J.-H.; Zhang, H.-D.; Ma, Z.-J.; Ji, K.-M. Artesunate induces oncosis-like cell death in vitro and has antitumor activity against pancreatic cancer xenografts in vivo. Cancer Chemother. Pharmacol. 2010, 65, 895–902. [Google Scholar] [CrossRef] [PubMed] [Green Version]


Publisher’s Note: MDPI stays neutral with regard to jurisdictional claims in published maps and institutional affiliations. |
© 2021 by the authors. Licensee MDPI, Basel, Switzerland. This article is an open access article distributed under the terms and conditions of the Creative Commons Attribution (CC BY) license (https://creativecommons.org/licenses/by/4.0/).
Share and Cite
Gunasekaran, P.; Han, H.J.; Choi, J.h.; Ryu, E.K.; Park, N.Y.; Bang, G.; La, Y.K.; Park, S.; Hwang, K.; Kim, H.N.; et al. Amphipathic Small Molecule AZT Compound Displays Potent Inhibitory Effects in Cancer Cell Proliferation. Pharmaceutics 2021, 13, 2071. https://doi.org/10.3390/pharmaceutics13122071
Gunasekaran P, Han HJ, Choi Jh, Ryu EK, Park NY, Bang G, La YK, Park S, Hwang K, Kim HN, et al. Amphipathic Small Molecule AZT Compound Displays Potent Inhibitory Effects in Cancer Cell Proliferation. Pharmaceutics. 2021; 13(12):2071. https://doi.org/10.3390/pharmaceutics13122071
Chicago/Turabian StyleGunasekaran, Pethaiah, Ho Jin Han, Jung hoon Choi, Eun Kyoung Ryu, Nam Yeong Park, Geul Bang, Yeo Kyung La, Sunghyun Park, Kyubin Hwang, Hak Nam Kim, and et al. 2021. "Amphipathic Small Molecule AZT Compound Displays Potent Inhibitory Effects in Cancer Cell Proliferation" Pharmaceutics 13, no. 12: 2071. https://doi.org/10.3390/pharmaceutics13122071