
Genetic Diversity Revealed by Microsatellites in Genus Carya


USDA ARS Pecan Breeding and Genetics, Somerville, TX 77879, USA
*
Author to whom correspondence should be addressed.
Forests 2022, 13(2), 188; https://doi.org/10.3390/f13020188
Submission received: 16 November 2021
/
Revised: 16 January 2022
/
Accepted: 24 January 2022
/
Published: 26 January 2022
(This article belongs to the Special Issue Current Applications of Genetics to Forestry)
Abstract
:The genus Carya consists of 17 species divided into 3 sections: Carya or the true hickories, Apocarya or the pecan hickories, and Sinocarya or the Asian hickories. Interspecific hybrids exist and have been used in pecan cultivar development. Nuclear and plastid microsatellite or SSR markers have been useful in distinguishing species, sections, and populations. They provide evidence for hybridity between species and can confirm heredity within crosses. As more sophisticated methods of genomic evaluation are cooperatively developed for use in pecan breeding and selection, the use of these methods will be supplemented and informed by the lessons provided by microsatellite markers, as interpreted across broad germplasm collections. In this study, over 400 Carya accessions from diverse diploid and tetraploid taxa and their interspecific hybrids, maintained at the USDA National Collection of Genetic Resources for Carya (NCGR-Carya), were analyzed using 14 nuclear and 3 plastid microsatellite markers. Principal coordinate analysis showed clear taxonomic classifications at multiple taxonomic levels along with patterns of interspecific hybridity. Evidence was also found for genetic differences associated with geographic distribution. The results indicate that this group of markers is useful in examining and characterizing populations and hybrids in the genus Carya and may help delineate the composition of a core collection to help characterize the NCGR-Carya repository collection for use in its pecan breeding program. The SSR fingerprints of the inventories of the USDA NCGR-Carya repository can also be used as a reference for identifying unknown pecan trees for growers.
1. Introduction
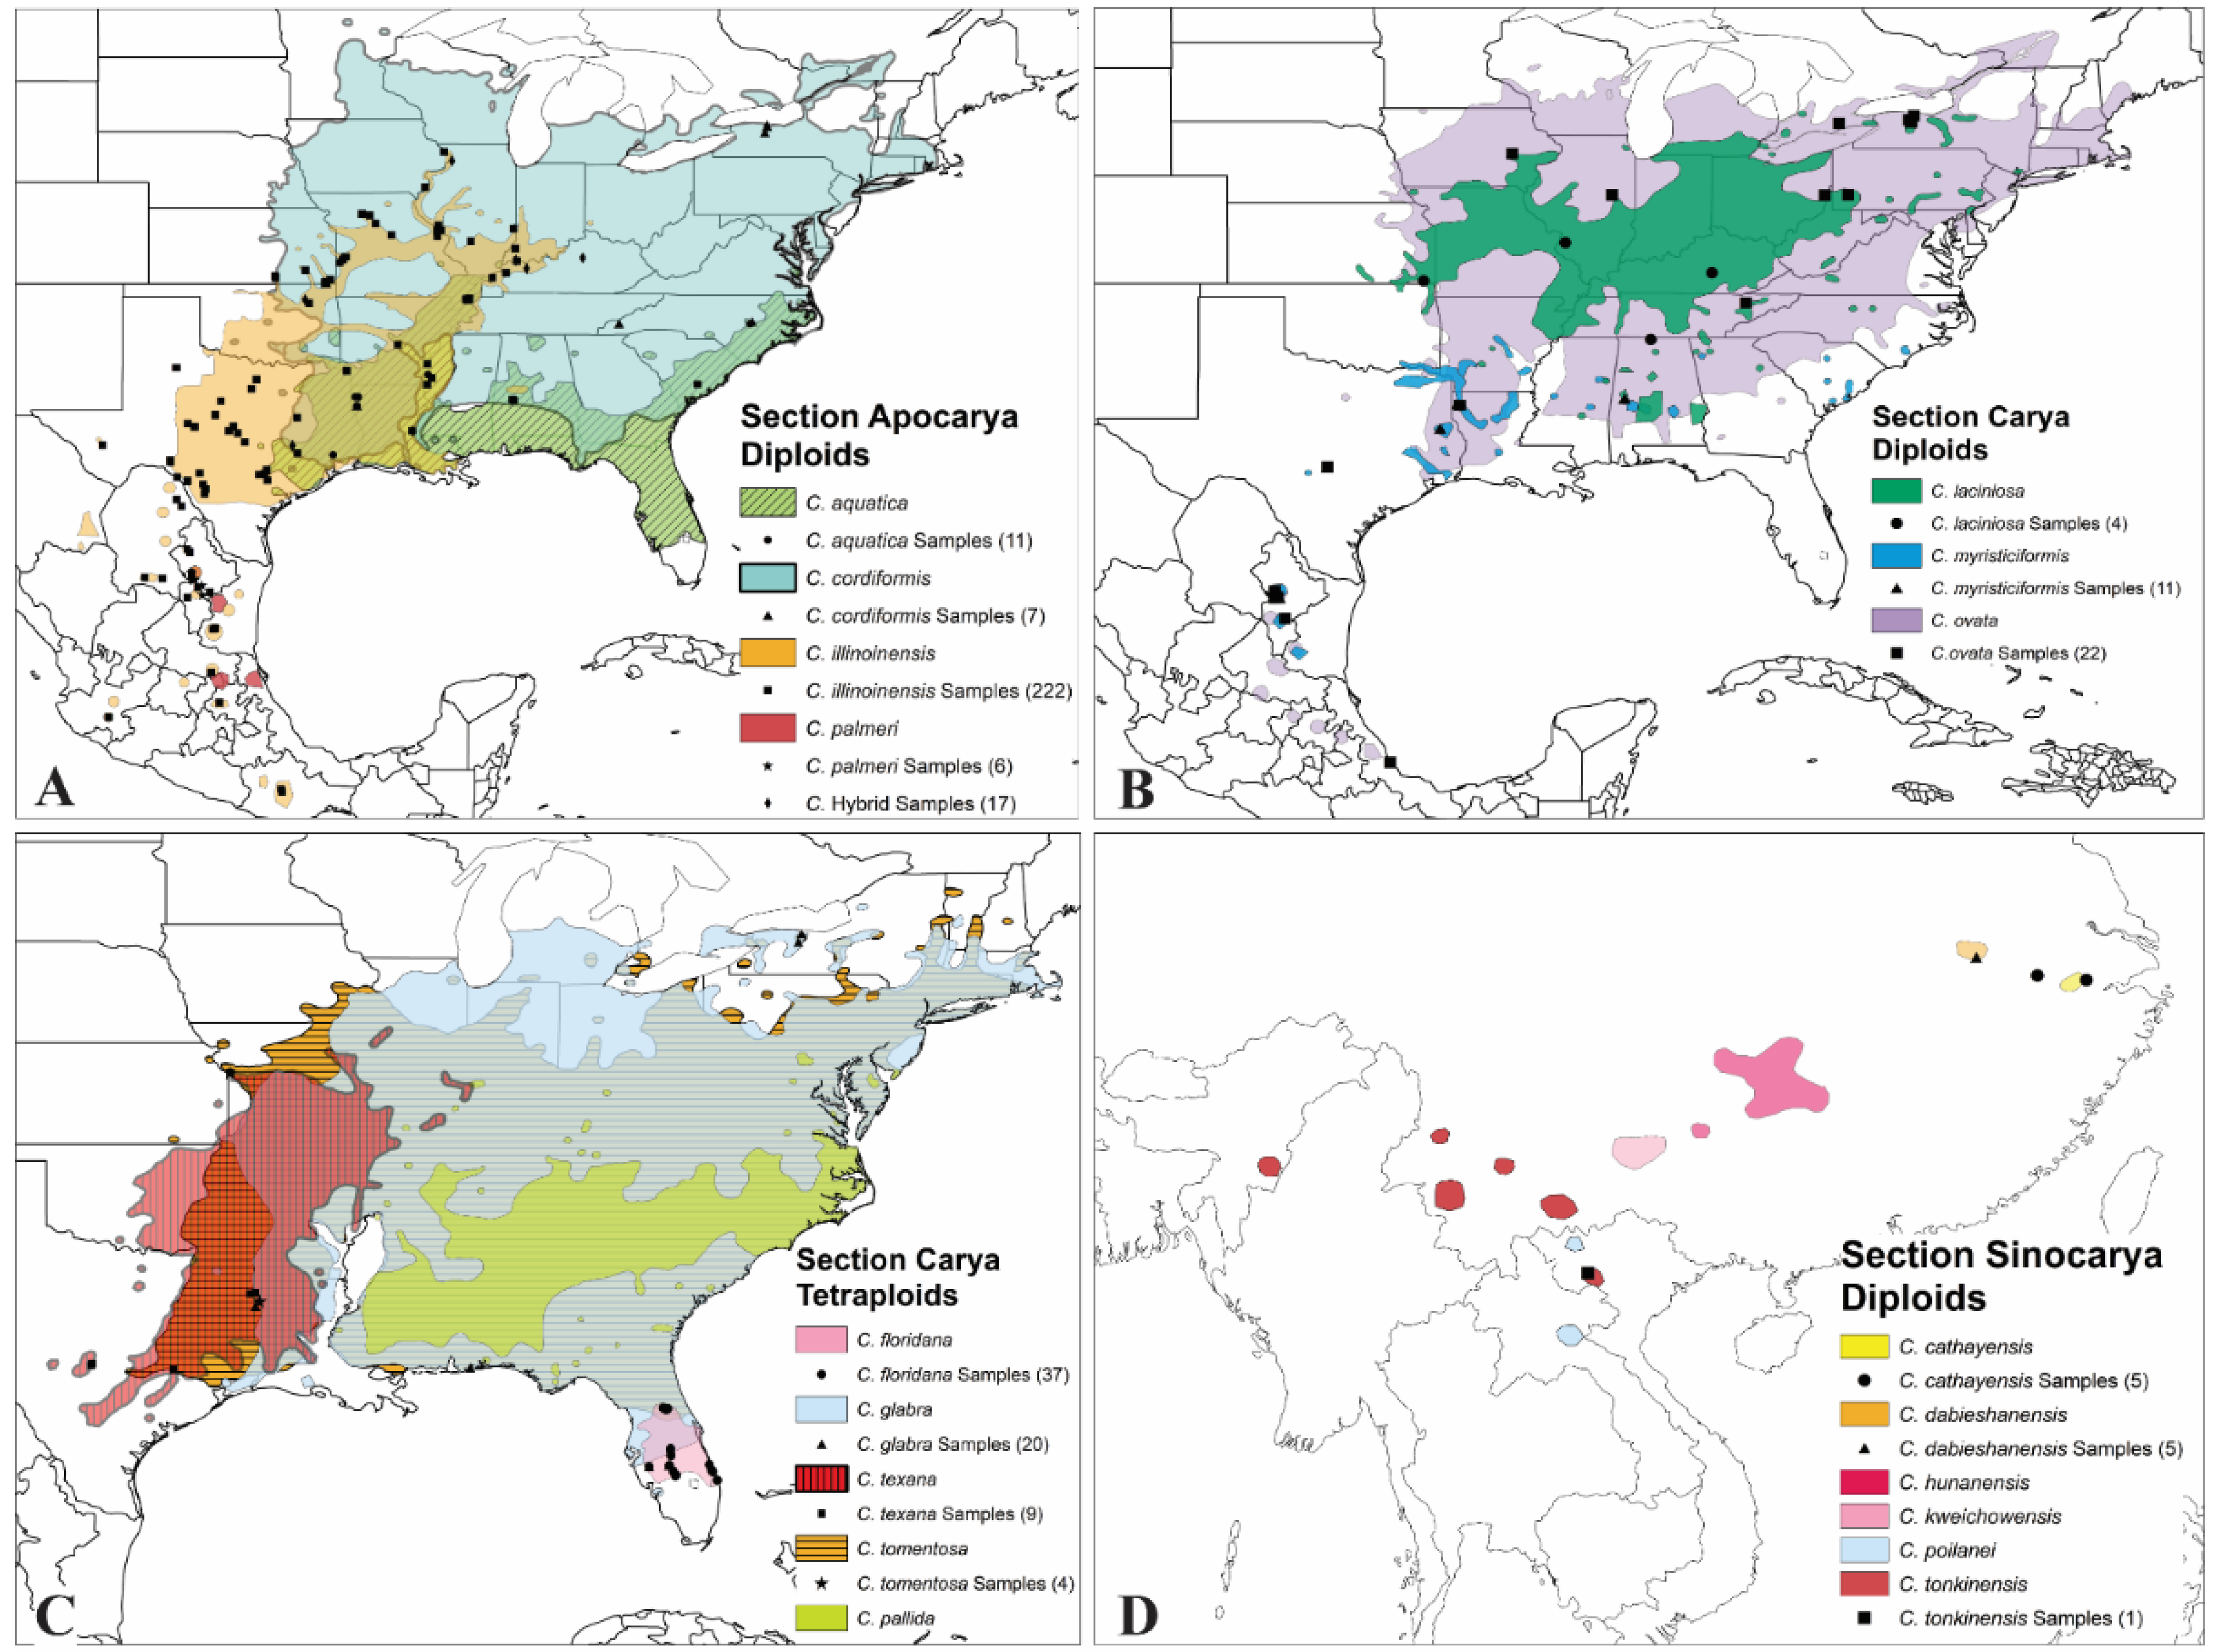
The genus Carya in the family Juglandaceae has a remarkably consistent evolutionary picture based on extensive phylogenetic studies incorporating morphology, anatomy, cytology, biochemistry, and nucleotide sequences from nuclear and chloroplast DNA [1]. The haploid chromosome number of genus Carya is x = n = 16 [2,3,4]. Taxa in this genus have been disputed for decades [1,2,4,5,6]. The USDA National Collection of Genetic Resources for Carya (NCGR-Carya), headquartered in College Station, Texas, recognized 17–18 species within three sections, distributed across the United States, Mexico, and Asia [6] (Figure 1). Thus, the genus Carya consists of 17 species worldwide, divided into 3 sections (Carya, the “true” hickories; Apocarya, the pecan hickories; and Sinocarya, the Asian hickories) [2,6].
All members of section Apocarya are diploid (2n = 2x = 32) and frequently hybridize with pecans, providing an avenue for introgression of genes between sympatric populations distributed across the southeastern United States into Mexico. The pecan hickories consist of four species mainly distributed in the South-Central states along the Mississippi River (Figure 1A). The focus of international horticultural attention has traditionally been on pecan (Carya illinoinensis), the species most widely grown internationally. Native pecans belong to section Apocarya and are primarily distributed in the well-drained soils of the Mississippi River and its tributaries, from northern Illinois and southeastern Iowa south to the Gulf Coast of Louisiana and west to the Edwards Plateau (Figure 1A) [6]. Section Carya, i.e., North American hickories, or typical hickories, include eight species that are either diploid (2n = 2x = 32) or tetraploid (2n = 4x = 64), with abundant hybrid combinations described based on phenotypic patterns. Section Carya distributes in the eastern to South Central states of the United States (Figure 1B,C). Accessions in section Sinocarya, the Asian Carya species, are poorly represented in world germplasm collections, but are noteworthy both for their distinctive morphology as a group and for their limited, isolated distributions as a species. The most valuable horticultural member of that section, Carya cathayensis, has been reported to exhibit nucellar embryony and hybridize with pecan. Asian hickories contain 5–6 species because C. cathayensis probably includes C. dabieshaneneisis [6]. Known distributions of Asian hickories are more fragmented, with no species overlap (Figure 1C).
In addition to these recognized Carya species, there are 11 interspecific hybrids among the Carya species [6]. Hybridity in sympatric species of Carya sharing the same ploidy level is evident in the abundance of known hybrids and has been examined using molecular markers [4]. Species in the genus Carya are classified by their taxonomic, botanical, and horticultural characteristics, along with their ploidy level.
A wide range of genetic diversity within crops greatly benefits plant breeding, especially the modern molecular breeding program. USDA NCGR-Carya maintains a diverse collection of Carya species, from sources worldwide, emphasizing native collections and cultivars of pecan [7]. However, owing to their large tree size and long lifespans, it can be challenging to maximize the genetic diversity within such a large collection effectively.
The development and application of molecular markers have greatly aided in collecting and maintaining the repository germplasm [8,9]. SSRs (single sequences repeats) or microsatellite markers have proven to be a valuable tool in the genetic analysis of relatedness between species or within different populations in plants and animals [10,11,12,13,14,15]. In the past two decades, SSRs have been widely used because they fulfill most of the desirable characteristics in a molecular marker, such as a good amount of polymorphism, frequency, an even distribution in the genome, co-dominant inheritance, high reproducibility, and suitability for automation [16]. However, the classic DNA-based marker system has limitations for population genotyping, genetic/genomic mapping, and parentage/hybrid identification [7,17,18,19,20]. In addition, the reproducibility of DNA-based marker genotyping is a challenge [21,22,23,24]. Next-generation sequencing technology has dramatically decreased the costs of developing SSR markers and can provide a large set of DNA-based markers for plant breeding and population genotyping [10,25,26,27]. Nevertheless, SSR markers are still valuable, especially for plant breeders who use DNA-based markers to routinely identify a few unknown plants, parentage, or hybrids in small to medium-sized labs [18,20,28].
In pecan, SSR markers have not been widely used in genetic diversity, population structure, and identification of parentage and hybrids because of limited genetic resources. NCGR-Carya evaluated 24 SSR primer pairs from a microsatellite-enriched library, and 19 SSR markers successfully produced amplification products in a group of 48 pecan and hickory accessions [8]. This team then evaluated 8 plastid markers [16,29] and found 3 were polymorphic and informative in a set of 169 Carya accessions [30]. In China, 8 SSR markers were also used to identify 77 pecan accessions, including domestic, introduced, and unknown pecan trees [31]. So far, NCGR-Carya has chosen a panel of 17 polymorphic SSR markers to screen the USDA pecan repository collections [4,9,30,32]. Of them, 14 were nuclear in origin, with 9 originating in pecan (Carya illinoinensis (Wangenh) K. Koch) [8], 1 from a pecan EST sequence (GenBank accession number EST00001) [4], and 4 from a walnut (Juglans nigra) library. These 17 SSR markers have been used to survey the nuclear and plastid genetic variation in representative samples of 80 indigenous pecan trees collected from throughout the native range of the Carya illinoinensis species [4,32]. This study evaluated these 14 nuclear and 3 plastid SSR markers for their utility in distinguishing a multi-species panel of 410 accessions in genus Carya, including interspecific hybrids. Seven accessions in the section Rhysocaryon in Juglans were selected as an outgroup principal coordinate analysis (PCoA). The USDA Pecan Breeding program has a long-term goal of maintaining a large set of repository collections and using them efficiently for new cultivar development. Hence, the species-specific and geographical differentiation identified by these SSR markers may help delineate the composition of a core collection to help accomplish that goal.
2. Materials and Methods
2.1. Materials
A total of 410 Carya trees included in this research (Table 1 and Supplementary Table S1) represent 275 accessions of section Apocarya (abbreviation apo), 108 accessions of section Carya (car), 10 accessions of section Sinocarya (sin) (C. tonkinensis in section Sinocrya had only one entry in Table 1 and was excluded from analysis), and 17 interspecific hybrids (hyb). Of the 275 accessions in apo, 251 pecan accessions (Carya illinoinensis) were analyzed for geographical diversity, representing grafted cultivars, native seedling accessions, and selected controlled cross progeny families. The population sizes and collection sites of each species are listed in Table 1 (details refer to Supplementary Table S1). As representatives of Juglans, a set of seven accessions in section Rhysocaryon of a neighboring genus of Juglandaceae, including two J. major accessions (maj), three J. macrocarpa (mac) accessions, and two J. nigra (nig) accessions, were also analyzed as an outgroup for clustering/principal analysis.
The majority of the plants used in this research were collected from across the United States, a few were from Mexico, and the only Asian hickories were from Zhejiang and Anhui provinces in China (sin). Most plants are maintained in the orchards and greenhouses of the NCGR-Carya program at Brownwood and Somerville, Texas. In addition, several accessions are maintained in the provenance orchard at the USDA ARS Southeastern Fruit and Tree Nut Research Laboratory (SEFTNL) at Byron, GA. Dr. Donald E. Stone provided tissue samples associated with the herbarium vouchers he collected from Carya across the United States and Mexico, which are maintained in the Duke University herbarium.
2.2. Georeferencing
Each accession’s decimal latitude and longitude coordinates were determined based on GPS coordinates collected with the tissue or the best location estimate based on passport information. Regional designations for pecan were based on the overlap between three zones of latitude and three of longitude, as shown in Figure 1 [4].
2.3. DNA Extraction
Immature leaflets were harvested from verified inventories, immediately rinsed with water, and placed in coded sample tubes on ice for transport to the laboratory. Genomic DNA was extracted from fresh leaves, silica gel-dried leaves, buds, or wood using methods modified from previous reports [1,2,3]. Extractions were performed using the DNeasy Plant Mini Kit (Qiagen, Hilden, Germany), following the manufacturer’s instructions. DNA quality was checked through 1% agarose gel. DNA concentration was quantified using NanoDrop 1000 spectrophotometer (ThermoFisher Scientific, MA Scientific, Waltham, MA, USA).
2.4. PCR Amplification
Seventeen SSR primers (see Table 1 in Grauke et al. 2015), including 9 from the pecan microsatellite library [8], 1 from the pecan EST library (GenBank accession CV973667), 4 from the walnut GA-enriched library [33], and 3 plastid markers [16,29], were used for PCR amplification. Of these primer pairs, a fluorescent forward primer was labeled at the 5′-end with either 6-FAM (blue color) or HEX (green color). PCR reactions were performed in 10 µL volume consisting of 3 to 5 ng of genomic DNA, 20 mM Tris-HCl (pH 8.4), 50 mM KCl, 2.5 mM MgCl2, 0.1 mM of a nucleotide mix (dATP, dGTP, dTTP, and dCTP), 0.25 mM of a mix with the forward and reverse primers, and 0.05 units of Taq Polymerase on a Perkin Elmer thermal cycler (model 9700). The PCR cycle consisted of 3 min at 94 °C followed by 35–40 cycles of 45 s at 94 °C, 45 s at 55 °C, and 1 min at 72 °C. Final elongation was 40–60 s at 72 °C [9].
2.5. Fragment Analysis
PCR products were loaded on the ABI Prism Genetic Analyzer 3130 (Applied Biosystems, Foster City, CA, USA) by mixing 0.5 µL PCR solutions with 5 µL of 2.5% 400-ROX internal size standard in deionized formamide. Relative sizes of alleles were determined using GeneScan and Genotyper software v 3.7 (Applied Biosystems). Alleles were called as a whole number in bp after binning with Flexibin V2 [34]. Sample preparation referred to the details in [4,8]. The relative size of the allele was automatically called and manually adjusted [3,8,30,32] using GeneScan and Genotyper software v 3.7 (Applied Biosystems). Allele profiles in bp were converted to binary using an Excel macro [35] and evaluated using GenAlex 6.5 [36].
2.6. Population Structure Analysis
The variation among/within the inferred populations and population structure was assessed using the program GenAlex 6.5 [36], SAS 9.3 [37], and STRUCTURE 2.3.4 [38]. Molecular profiles were converted to binary form, associated with taxonomic and geographic classification descriptors, and subjected to principal coordinate analysis (PCoA) built in the SAS 9.3 [37] and STRUCTURE 2.3.4 [38] to investigate the genetic relationships among accessions in the Carya sections. Shannon diversity index (I) and heterozygosity (He) of the species in a population were calculated using GenAlex 6.5 [36]. The binary data were run on a model-based clustering software STRUCTURE [38]. An admixture model with uncorrelated allele frequencies was used to test the subpopulation numbers (K = 2–6). Each K was run five times with a burn-in period of 100,000 steps followed by 100,000 Monte Carlo Markov chain (MCMC) replicates. After STRUCTURE, the log probability of data (LnP(D)) was estimated for each run, and an ad hoc statistic, ΔK, which was based on the rate of change in LnP(D) between successive K values, was used to determine the true number of subpopulations [39].
3. Results
3.1. Genetic Differentiation in the Three Sections of Genus Carya
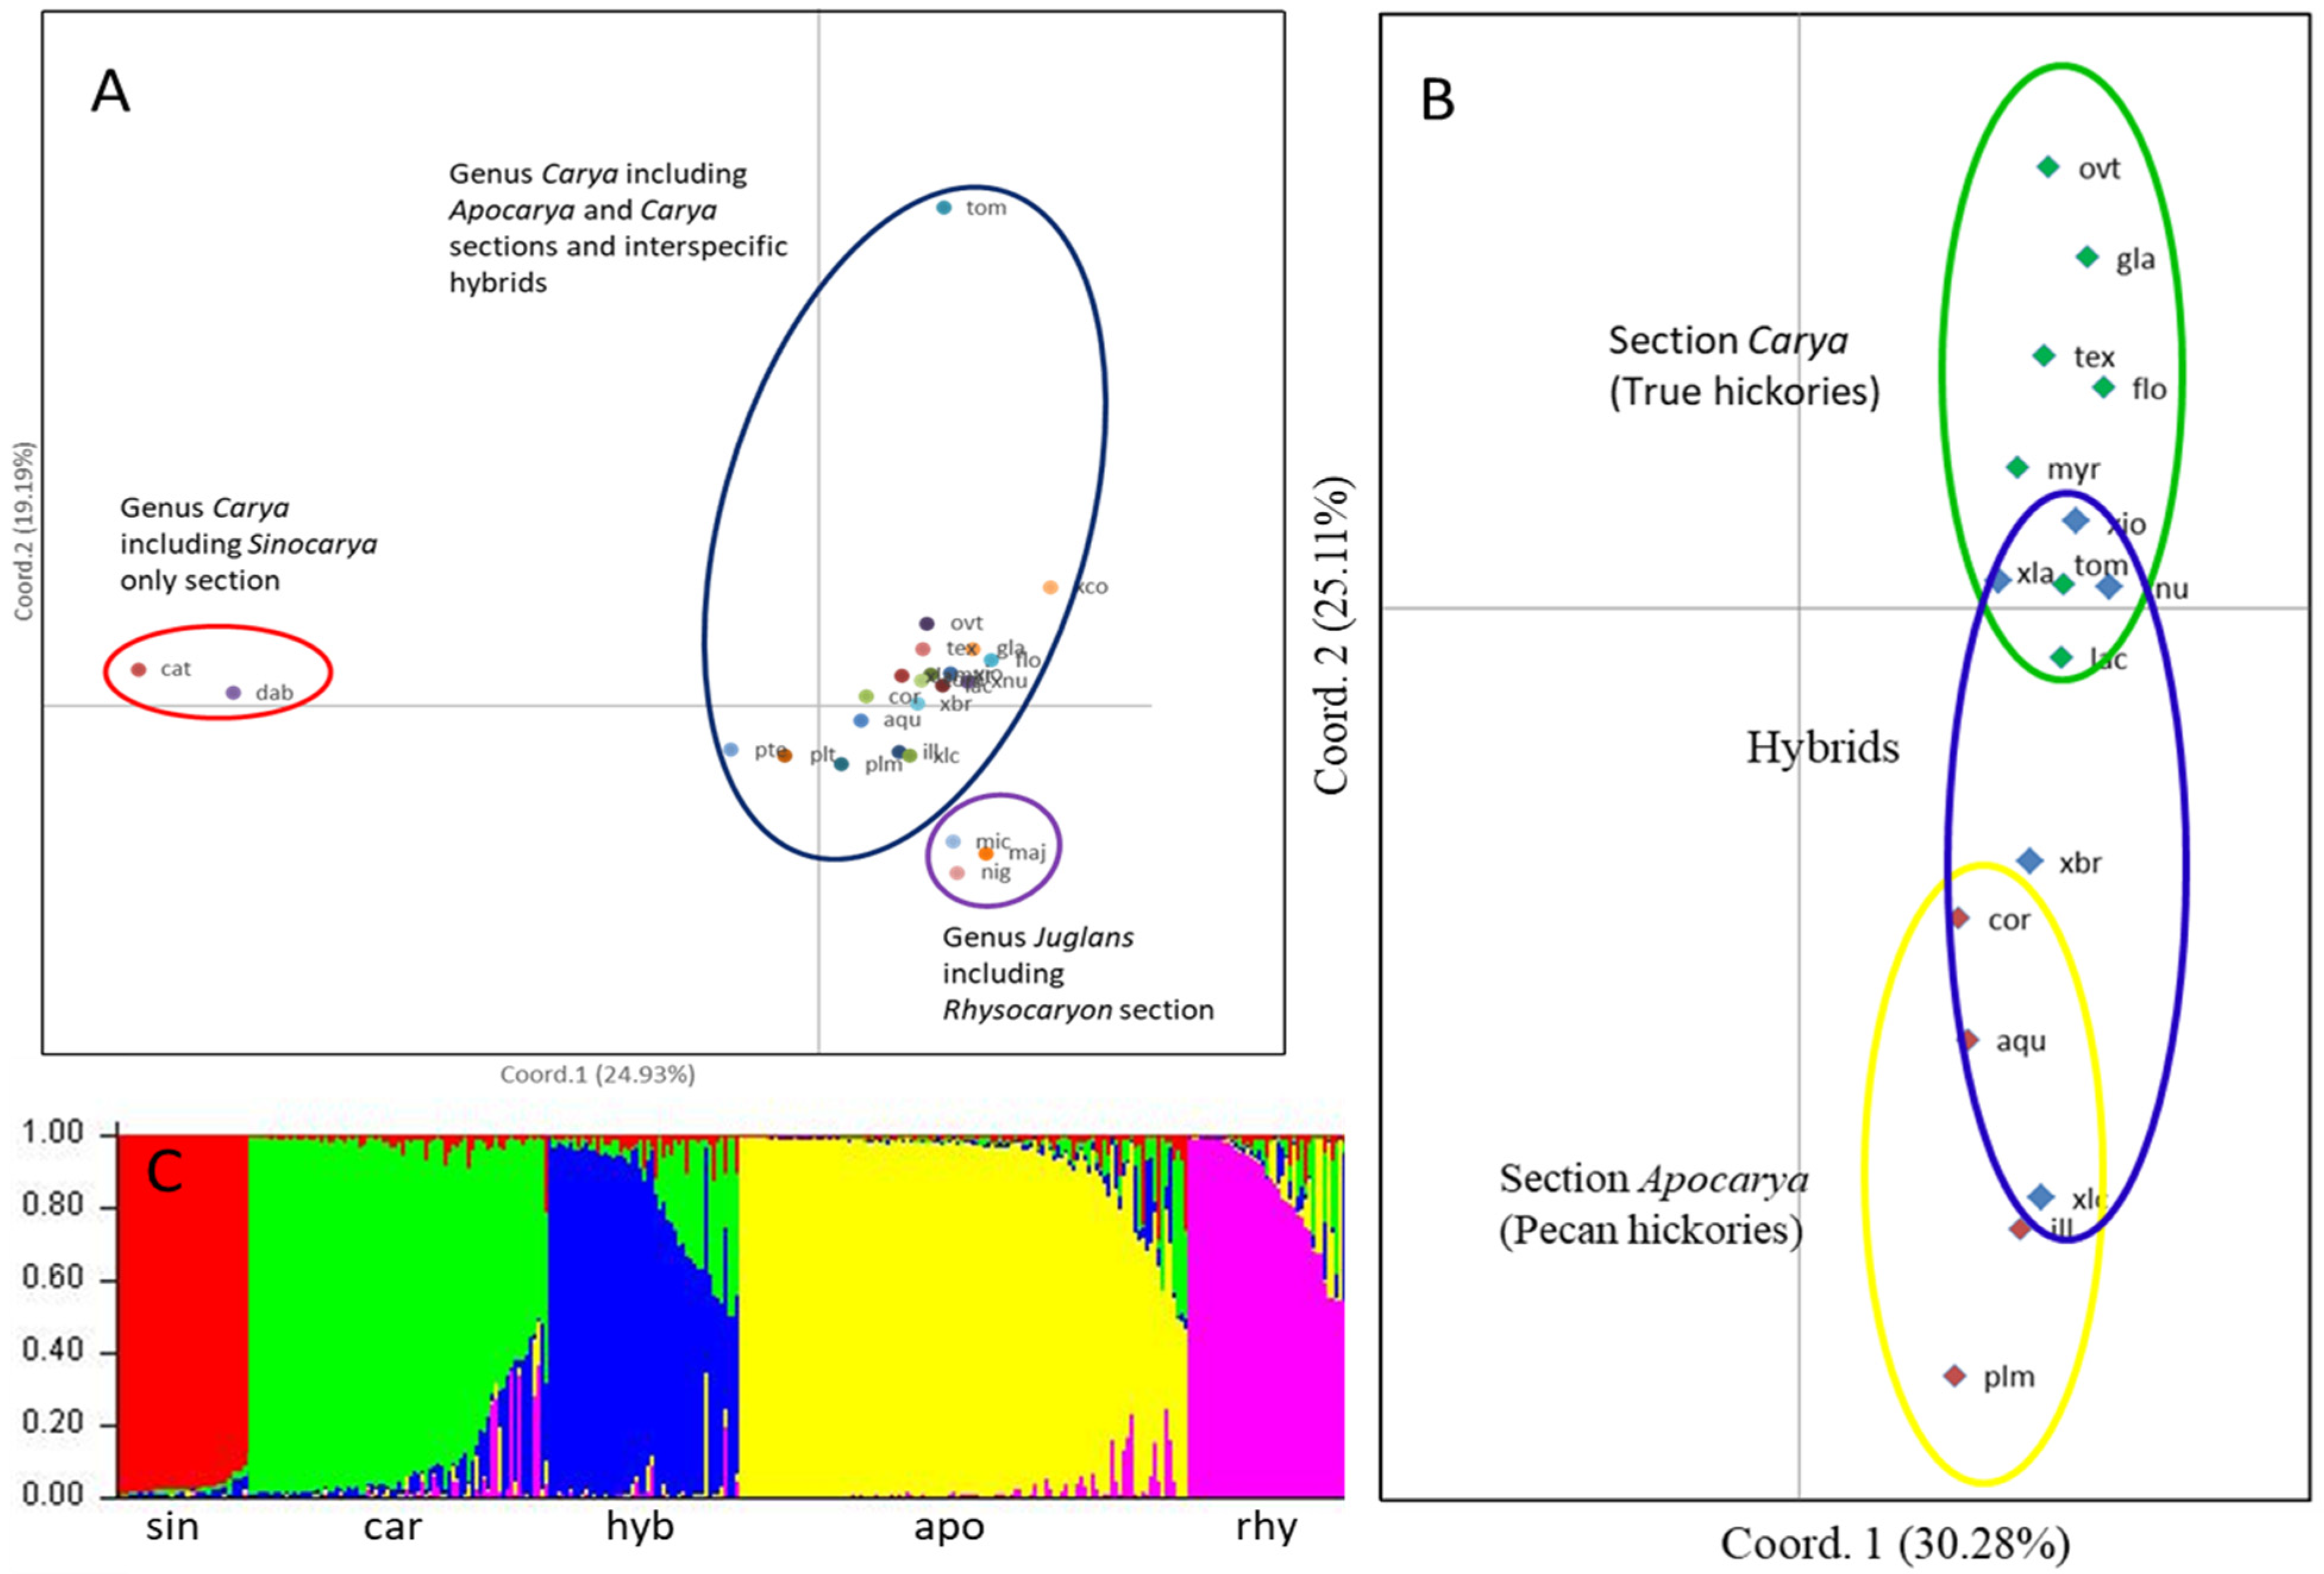
Principal coordinated analysis (PCoA) was performed to determine the genetic relationships among the three sections of genus Carya and section Rhysocaryon in Juglans. The 3 plastid and 14 nuclear SSR markers could clearly distinguish between the sections Apocarya, Carya, and Sinocarya of the genus Carya, and interspecific hybrids between species of different sections, as well as section Rhysocaryon of Juglans (Figure 2). For the sections as a whole (i.e., all accessions within sections combined), the PCoA plot separated the four sections of Cayra, interspecific hybrids, and section Rhysocaryon in Juglans with a total percentage variation of 44.1%, which was explained by the first coordinate of 24.9% and the second coordinate of 19.2%. This provides valuable insight into the genetic structure of the genus Carya and confirms taxonomic distinctions between and within sections and close association with section Rhysocaryon of Juglans (Figure 2A). When species in Juglans were included, the PCoA plots indicated that the species in sections Apocarya and Carya and their hybrids were grouped into one cluster and were distinct from the two species in Sinocarya and three species in Juglans, which were grouped into two distinct clusters (Figure 2A). C. tomentosa is a tetraploid and distinct from the other three tetraploids (tex, gla, and flo) in section Carya. These results indicate that the 3 plastid and 14 nuclear SSR markers provide valuable insight into the genetic structure of the genus Carya, confirming taxonomic distinctions between and within sections and close association with section Rhysocaryon of Juglans.
As shown in the PCoA, section Sinocarya was distinct from the other two sections in genus Carya. All accessions within sections were grouped, with a few Apocarya and Carya accessions overlapping (Figure 2A and Supplementary Figure S1A). For the accessions in section Carya, diploid and tetraploid species formed a cluster that included Apocarya hybrids. Section Sinocarya and outgroup Juglans were distinct from sections Apocarya and Carya in the PCoA results (Figure 2A). Species in sections Apocarya and Carya can be separated distinctly, with their interspecific hybrids scattered between the sections (Figure 2B). When all 417 accessions (275 apo, 108 car, 10 sin, 17 hyb, and 7 rhy entries) were included in the PCoA plot, the total variation (16.1%) was decreased, with the first coordinate of 12.3% and the second coordinate of 3.8% (Supplementary Figure S1), indicating a complex variation of the accessions among the three sections in genus Carya. The PCoA plot generally agrees with the Q plot, with which membership coefficients were estimated for each accession in a cluster (Figure 2C and Supplementary Figure S1B).
3.2. Relationships among Species within Carya Sections
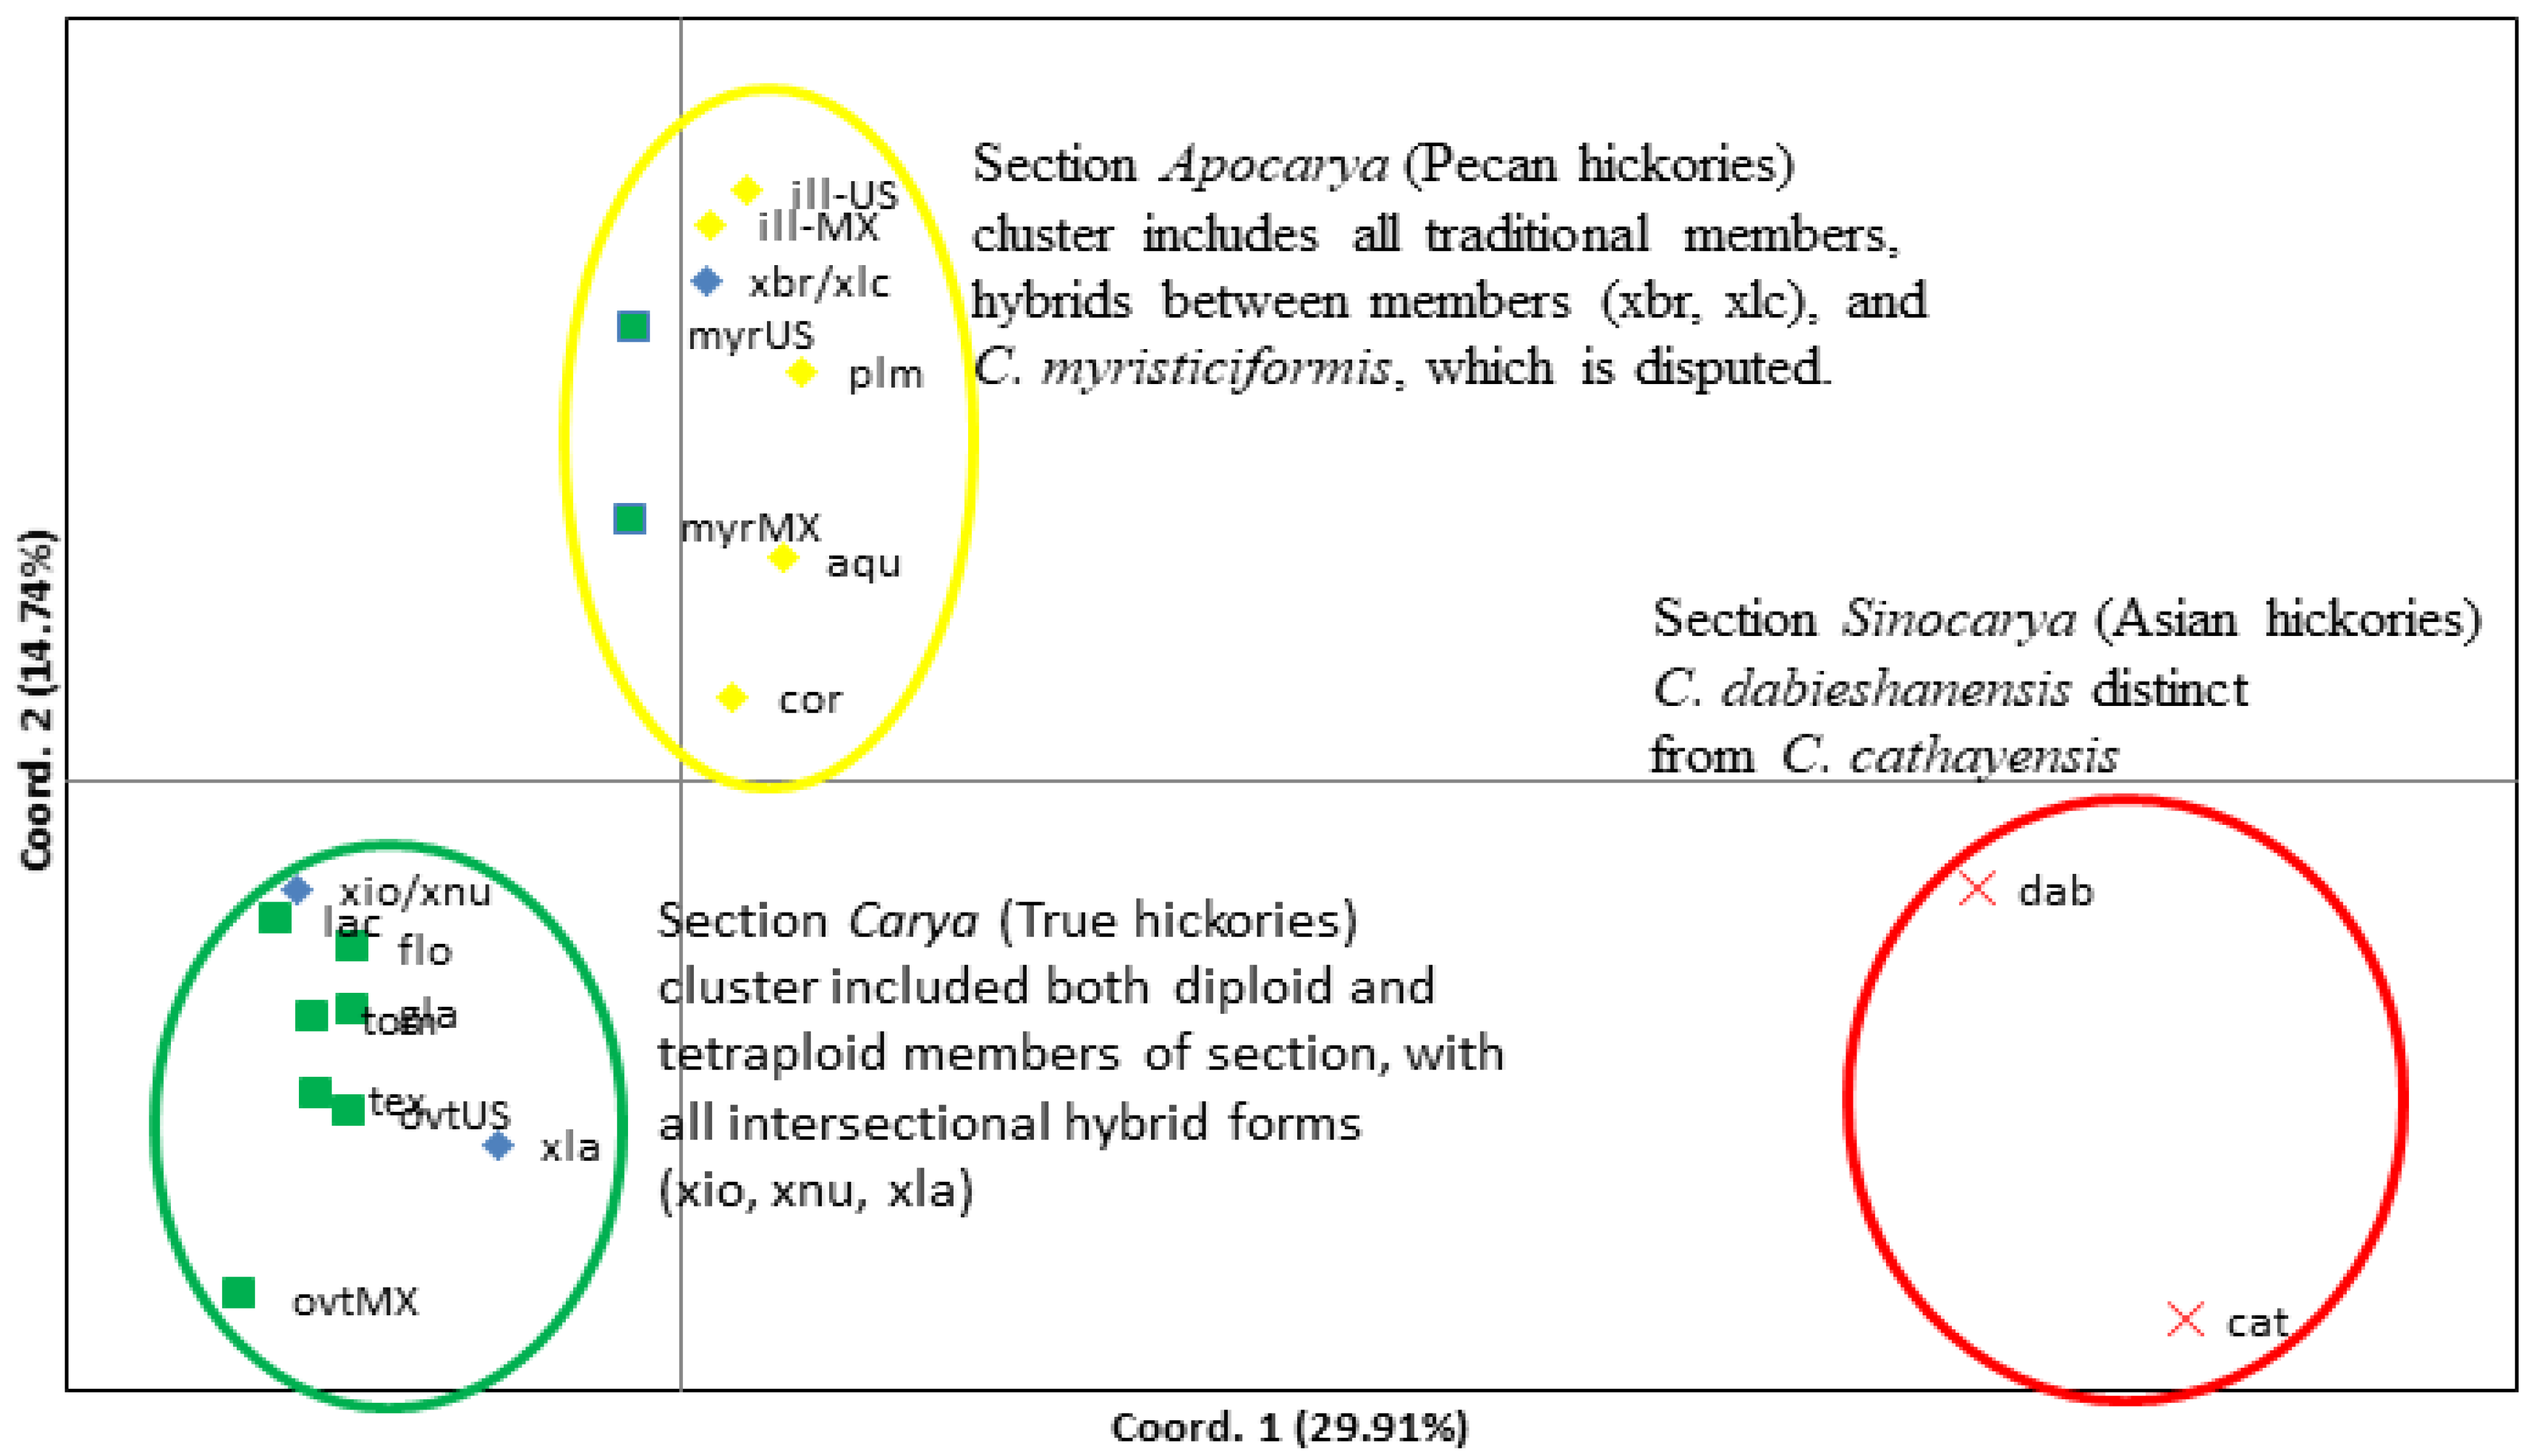
As shown in Figure 2, species in each section in genus Carya formed in one cluster, indicating a close genetic diversity within each section. The three sections are distinct from each other, indicating an extensive genetic diversity among sections (Figure 3). Hybrids between sections Apocarya and Carya are between these two sections. For example, four species (aqu, cor, ill, and plm) in section Apocarya are grouped into one cluster, and two hybrids (xbr and xlc) are close to this cluster; six species (lac, ovt, flo, gla, tex, and tom) within the section Carya are grouped in one cluster and their hybrids (xio and xnu) are close to this cluster. This PCoA plot was explained by a total variation of 44.7%, with the first and second principal components of 29.9% and 14.7%, respectively. The Asian Carya are the most threatened in the genus and have unique reproductive mechanisms [4]. The band frequency (f), allele frequency (p and q), effective allele number (Ne), Shannon diversity index (I), and heterozygosity (He) were calculated within the species populations (Table 2). The Asian Carya group (cat and dab) showed the lowest diversity value, which is indicated by a lower Shannon diversity index (I), and the lowest heterozygosity, compared with other species in the other two sections in genus Carya. This evaluation indicated that two species (cat and dab; ton has only one sample and was not included for analysis) were isolated from two other sections and were distinct from each other, although they are increasingly mixed during commercial marketing.
Two species, cat and tom, and one hybrid, xla, had higher diversity (I) (Table 2). This may be caused by the small population size (Table 1). Although two subsets of C. ovata populations from the United States (n = 15, ovt-US) and Mexico (n = 7, ovt-MX) were grouped within section Carya, they are distinct from each other (Figure 3), indicating some level of geographic differentiation. C. myristiciformis is currently classified in section Carya and has been recognized as a morphological intermediate between the sections [4]. With these 17 molecular markers, two subsets of C. myristiciformis populations from the United States (n = 5, myr-US) and Mexico (n = 6, myr-MX) were grouped with four other species in section Apocarya, but are distinct from each other (Figure 3).
Hybrids between species within the section Apocarya, such as xbr (ill × cor) and xlc (ill × aqu), were clustered with their parents in the same group. Interestingly, diploid and tetraploid species of section Carya form a cluster that includes Apocarya hybrids, such as xla (cor × ovt), xio (ovt × ill), and xnu (ill × lac) (Figure 3), meaning the cluster is not related by their ploidy, but instead by their natural characteristics. Gene flow between the sections justifies the inclusion of selected species representatives in core diversity panels and increased attention to their horticultural value in rootstocks or scion development.
3.3. Genetic Differentiation of Carya Species Based on Geographic Origins
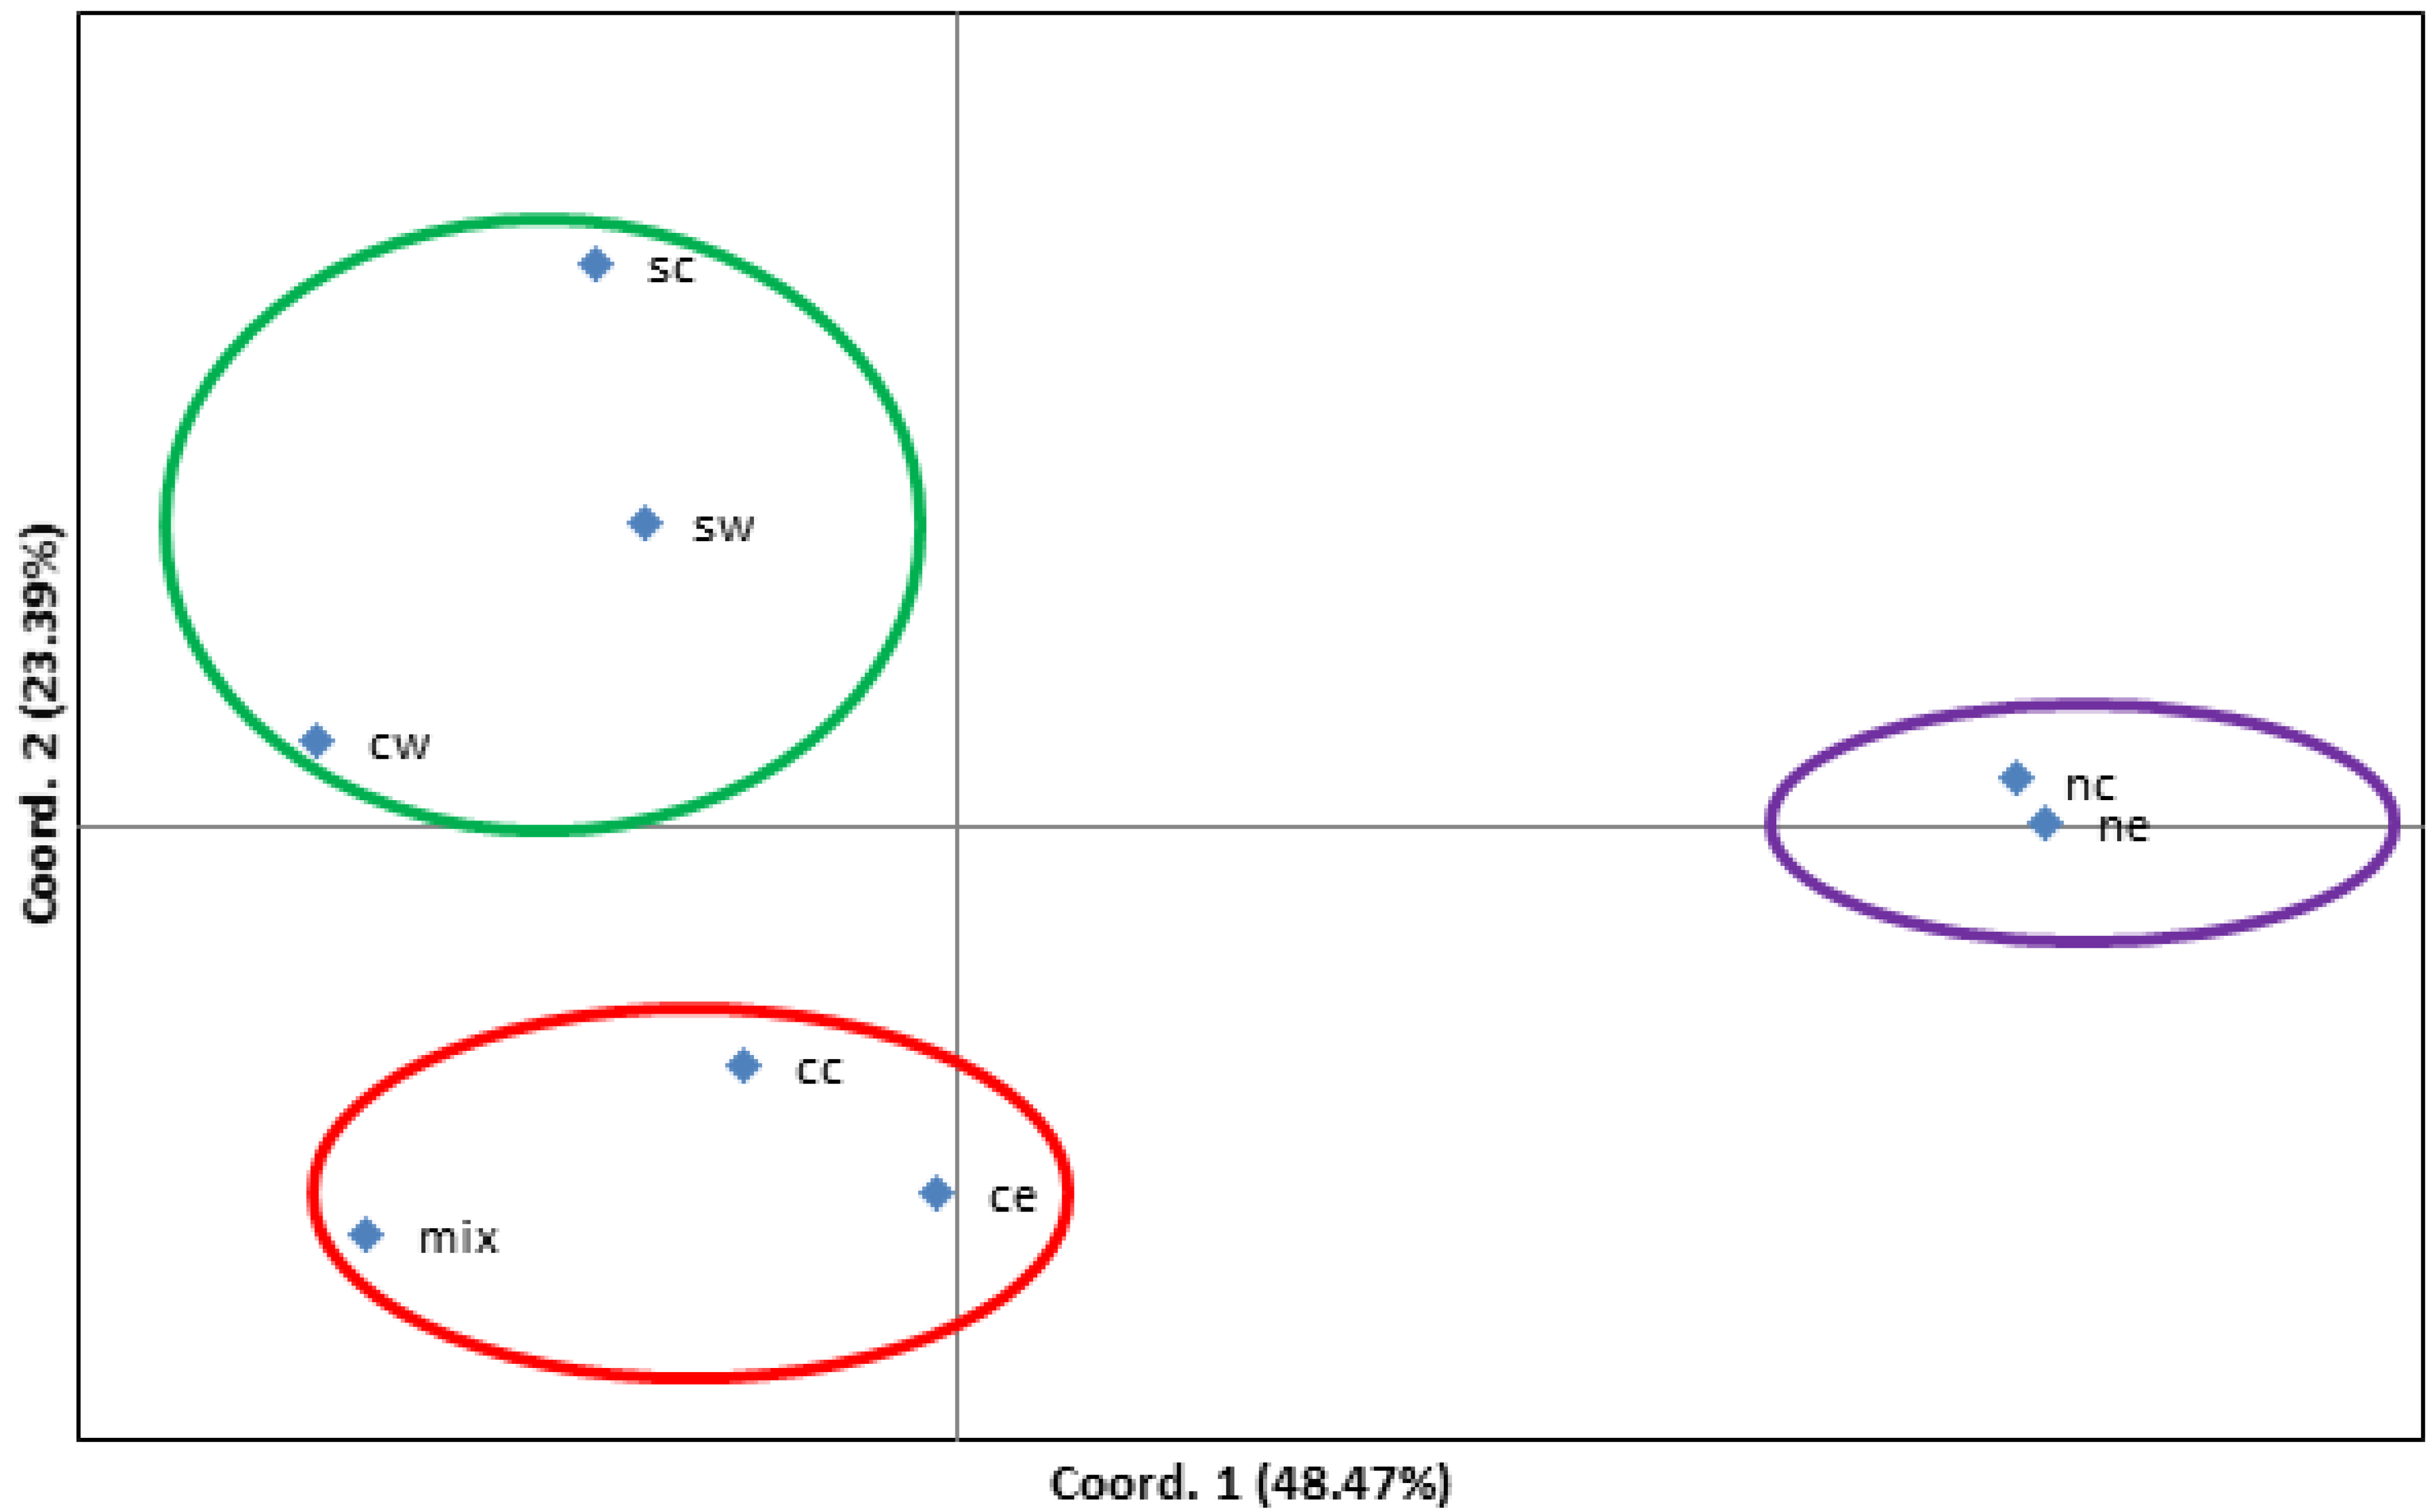
Although the population size does not determine the genetic diversity and heterozygosity within the group (Table 2), accessions in species within a close geographical location showed certain diversity. When the accessions in C. illinoinensis were analyzed by geographic origin, they were separated distinctly (Figure 4). Collections in the north-central (nc) and northeast (ne) regions of the United States were distinct from other collections. The central (cc) and central east (ce) regions were grouped, while south-central (sc), southwest (sw), and central west (cw) were in another cluster, and the mix entries were grouped into the cluster with cc and ce (Figure 4).
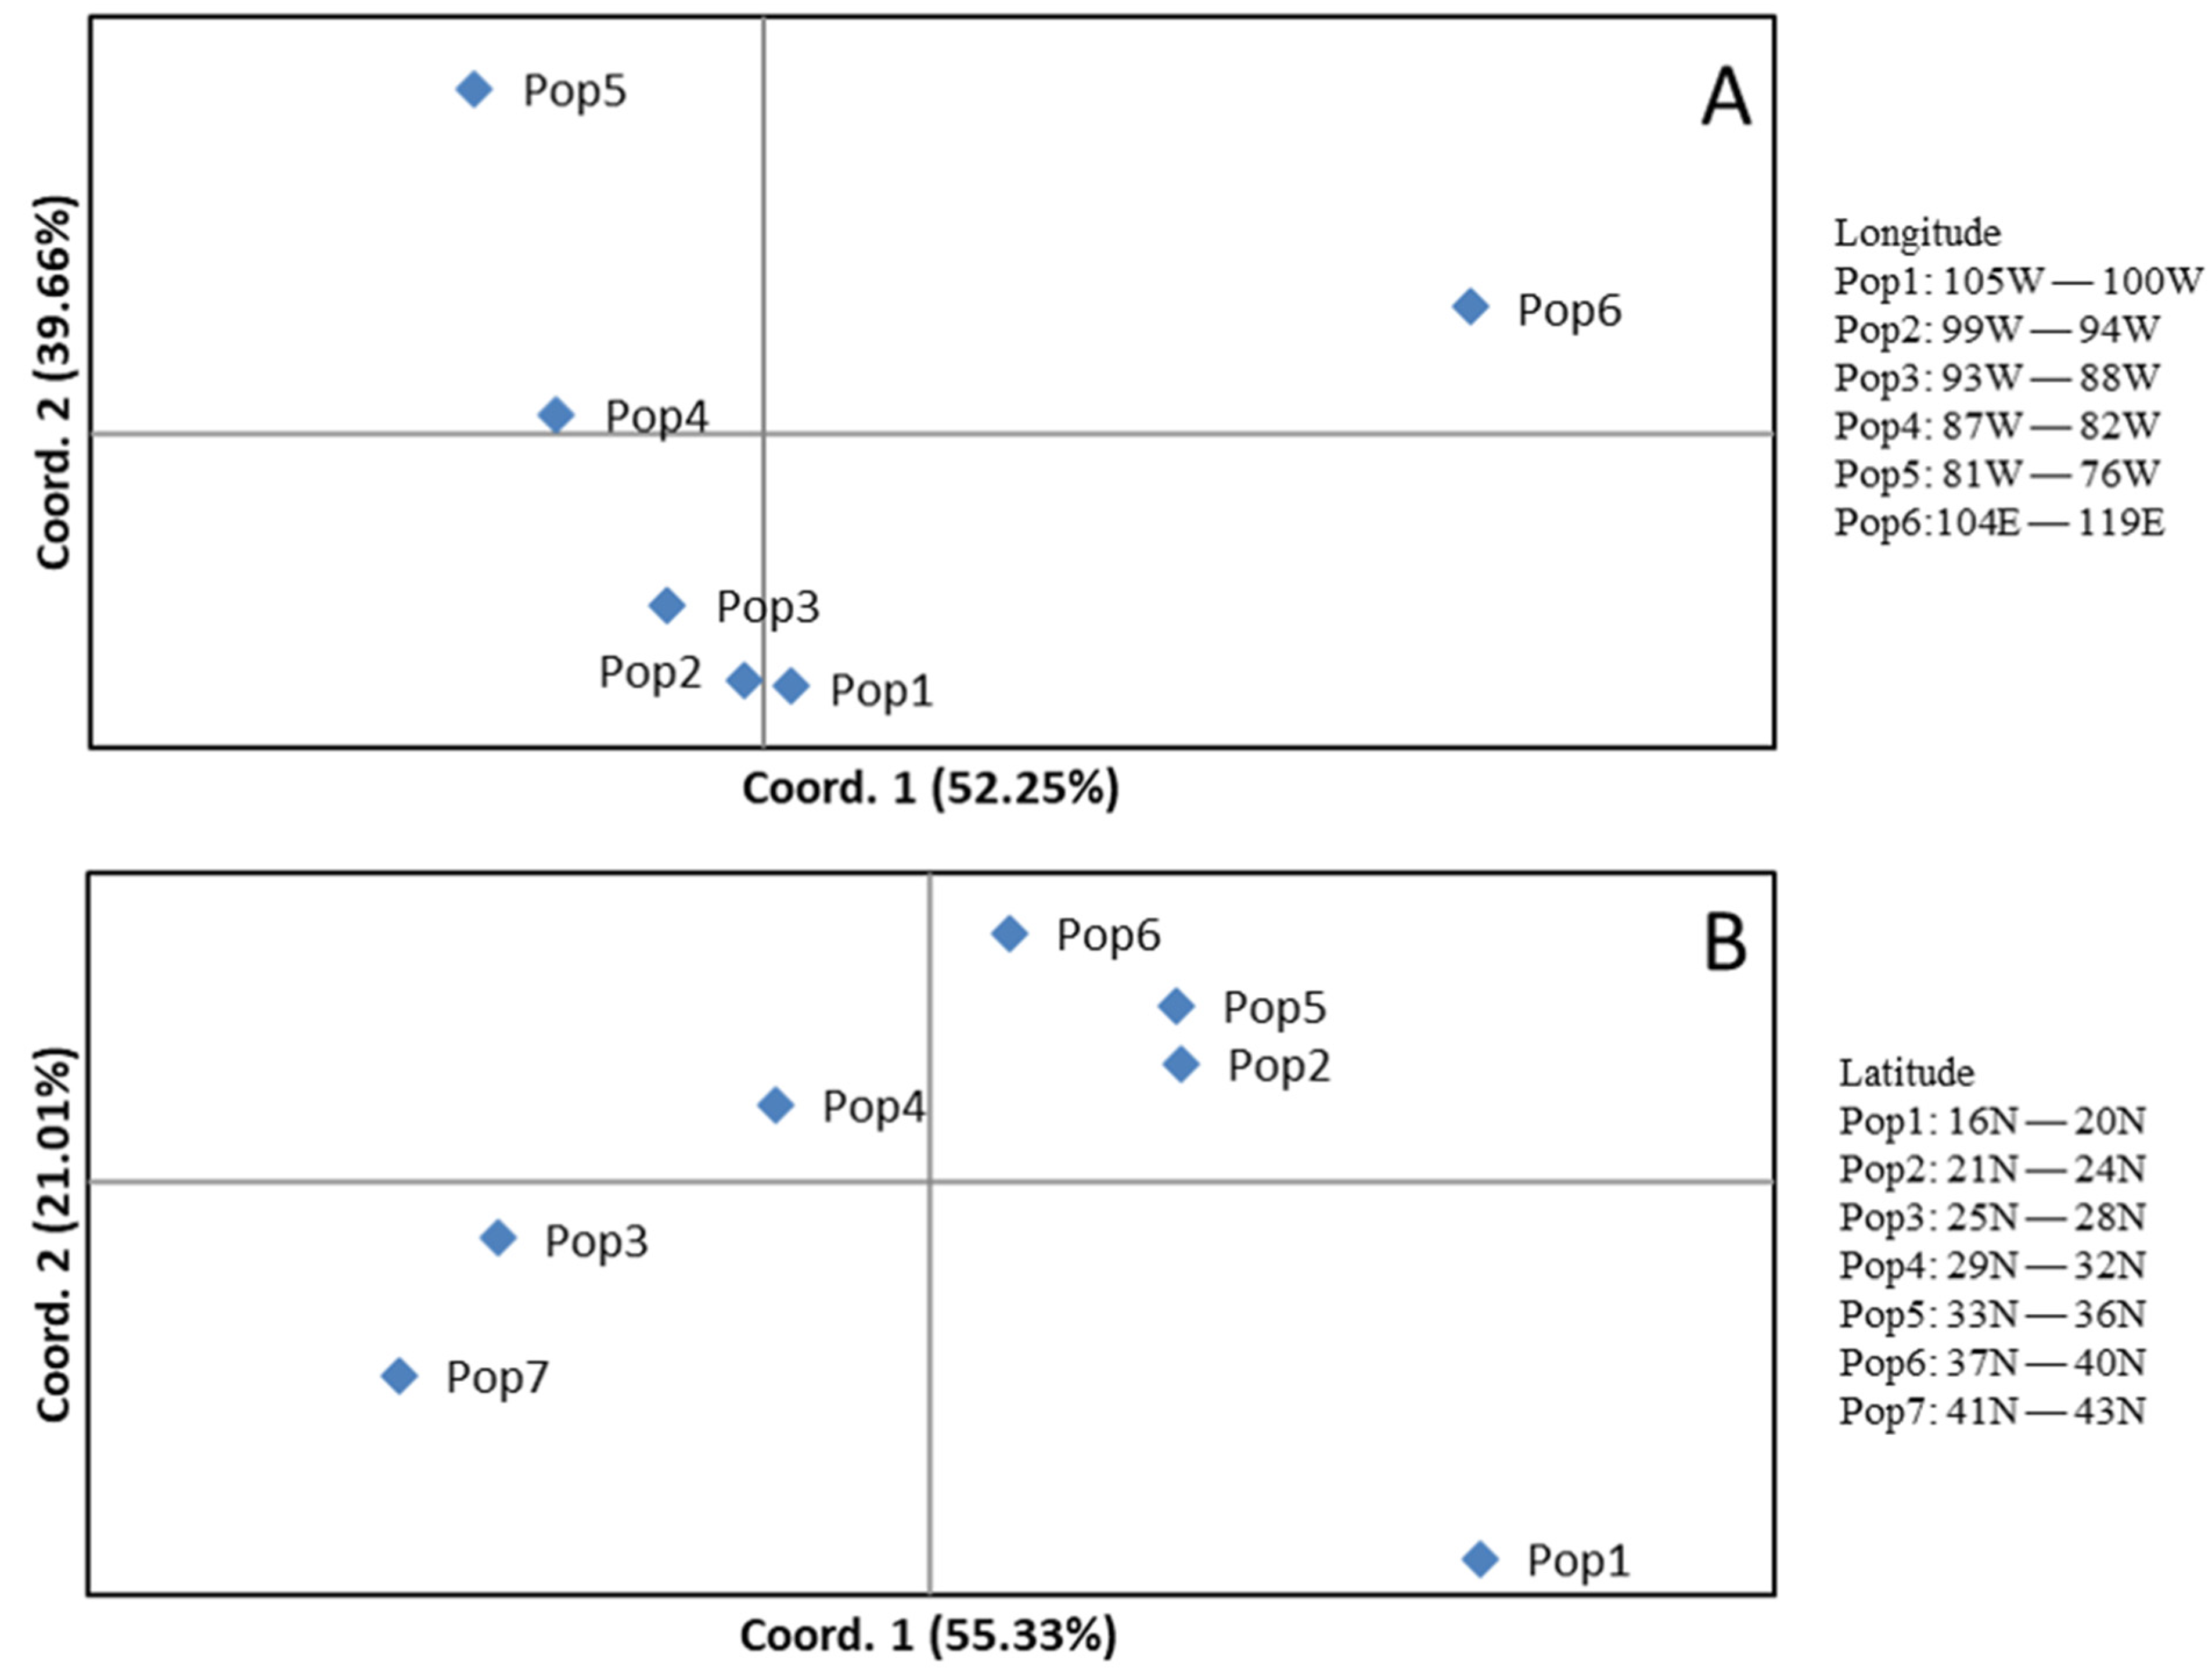
Accessions in each section in genus Carya adapted to their local climates and, therefore, differentiated genetically [4,7,32]. All accessions in this study can be divided into seven populations based on their latitudes and six populations based on their longitudes (Figure 5). When plotted by longitude based on populations, the percent variance is explained by the first coordinate of 52.3% and the second coordinate of 39.7%, respectively (Figure 5A). When plotted by latitude as populations, the percentage of variance explained by the first and second coordinates was 55.3% and 21.0%, respectively (Figure 5B). When plotted by longitude or latitude, some accessions showed overlapping across geographical locations, indicating gene flows across latitude and longitude. The genetic diversity (I) and heterozygosity (He) in a group are similar within a range by longitude and latitude (Table 3), indicating genetic differences associated with geographic distribution.
Patterns of heterozygosity observed within species populations (Table 2) and regional populations (Table 3) have indicated genetic diversity within species and geographical regions. The analysis of the pairwise population matrix of 22 regional populations in the C. illinoinensis species showed patterns of homozygosity or affinity (Table 4). Population MX4 had the highest genetic distance from 16 of the 22 populations, except for DC, MX1, MX2, MX3, MX4, and NLC. Populations MX1, MX2, MX3, and MX4, which were from Mexico, had the greatest genetic distance from the TX5 population, with the highest affinity of 30.45 (average population binary genetic distance) between MX4 and TX5 (Table 4). DC had the greatest genetic distance from IL, and NLC had the greatest genetic distance from DC. Population MX3 had the lowest genetic distance from itself, implying a level of inbreeding that contributed to its selection as the draft template genome sequence [40]. It might also have utility in breeding strategies to develop uniform seedling populations by crossing with selections from other identified inbred populations.
4. Discussion
Our previous plastid SSRs and nucleic SSRs profiles display different patterns of genetic variation, especially for those populations derived from open-pollinated seeds in diverse geographical origins [32]. The panel in this study contains a set of accessions comprising the four sections of the genus Carya and section Rhysocaryon of the genus Juglans (Figure 1). Based on the consistent allele calls (present = 1 and absent = 0), we used both plastid and nucleic SSRs to investigate the population structure. These markers provided more power to detect population structure and genetic diversity than previous studies that only used three plastid markers [4,30]. The genetic structure of the genus Carya confirms taxonomic distinctions between and within sections and a close association with section Rhysocaryon of Juglans. The distinct diversity within the hybrid populations among the sections in the genus Carya suggests the possible gene flow within and/or between sections, indicating potential utility in pecan cultivar breeding for trait improvement. The extensive genetic diversity among species in the genus Carya presented by the SSR markers, including plastid markers, has been indicated by the C. illinoinensis chloroplast genome sequences [41]. In addition, plastid SSR markers developed for Carya are informative in Juglans, and nuclear microsatellites developed for Juglans are used for Carya, indicating that some markers may be transferrable between genera Juglans and Carya [4,33]. The 17 interspecific hybrids between section Apocarya and section Carya harbored genetic traits from their parents and presented wide genetic diversity, which serve as bridges for traits’ improvements in the USDA pecan breeding program.
Patterns of homozygosity observed within some regional populations in the SSR profile for 251 accessions in C. illinoinensis (Table 4) may have future utility in breeding strategies to develop uniform seedling populations. One of them, 87MX3-2.11, has had its whole genome sequenced and has been used as reference to develop genetic tools for accelerating pecan breeding [41]. In addition, existing profiles from verified inventories will be useful in establishing additional methods of molecular verification in other identified inbred populations. Trees in the MX4 population are self-rooted seedlings grown from seeds collected from a putative native stand in Ixmiquilpan, Hidalgo, Mexico, in 1987. Like most Mexican populations (MX1-5), they break bud early in the spring, but are the last to cease growth in the fall, often continuing active growth into December. As a group, they manifest indeterminate growth, resulting in a weeping habit.
Some species, such as C. dabieshanensis and C. cathayensis, found only in Asia and isolated from each other (Figure 1D), are the most threatened in the genus. All five specimens of C. dabieshanensis are distinct from those in C. cathayensis by the 17 SSR markers in this study, in agreement with the studies by Grauke and Mendoza-Herrera [4], which used only three plastid markers. However, the specimens in Asian species (section Sinocarya) are increasingly mixed during marketing, although C. dabieshanensis is distinct from C. cathayensis (Figure 2). Efforts should be made to collect and characterize extant native populations and other Asian species not currently available. Given the potential for the hybridization seen in sympatric Carya populations in the United States and Mexico [9], the species in section Sinocarya can be used to characterize the diversity of their native populations to investigate potentially valuable reproductive strategies that have not previously been seen in other Carya species [4].
Although there are distinct separations among the Carya species based on the 17 markers, some clusters still are disputed (Figure 3). For example, C. myristiciformis is currently classified in section Carya and has been recognized as a morphological intermediate between the sections. However, our results showed that this species groups with Apocarya. Specimens in C. myristiciformis exhibit disjunct distributions between the southeastern United States (5 myr-US) and Mexico (5 myr-MX) (Figure 3), which are distinct from each other and show hybridity with pecan [4]. Similarly, 22 accessions in C. ovata separate distinctly from two populations between southeastern United States (15 ovt-US) and Mexico (7 ovt-MX) (Figure 3) and show hybridity with pecan. The limited accessions in both C. myristiciformis and C. ovata from two geographical locations show higher diversity levels (I = 0.32—0.49), suggesting that gene exchanges exist naturally if no human activity is involved. The roles of C. myristiciformis in the phylogenetic development of the genus may be explored with appropriate inclusion in core diversity panels in future experiments. This species is threatened across its disjunct range from the southeastern United States into Mexico and is included in efforts at in situ conservation.
Gene exchanges by natural selection among geographical locations result in local adaption for plant species even within the same genus [42]. Such genetic variation provides a foundation for species to respond to changes in the natural environment [43]. Previous studies indicated higher levels of genetic variation in northern and central C. illinoinensis populations and lower levels of genetic variation in southern and eastern populations based on nucleic loci [19,32]. In pecan, geographic populations still harbor distinct genetic traits to identify and conserve in ex situ collections, with some of that due to maternally inherited plastids [32]. The SSR profile here provides important insights into the geographical distribution of genetic variation in collections of the genus Carya and the species within its section. Our analyses of 394 Carya species with 17 SSR markers expanded previous contributions by identifying differences in the geographic structure of nuclear and organellar genetic variation [32]. Our SSR data showed a distinctive profile on their geographic distributions of genetic diversity among the eight ecozone populations (Figure 4). However, there was a low percentage of expected heterozygosity (~5%, data not shown) within each ecozone population. Geographical distributions of the ecozone populations of 104E–119E (pop 6 in Figure 5A) and 16N–20N (pop 1 in Figure 5B) are more distant than other ecozone populations in their respective figures, suggesting that the largest amount of genetic variation exists in distant geographic locations.
Local climate variation was observed in phenotypic patterns of leaf morphology and disease resistance. Regional populations should be represented in core collections for both genomic screening and refinement of phenotypic descriptors. The diversity in the genus Carya showed that the plastid markers were informative in separating geographically diverse Carya populations. New genomic tools that include more plastid markers should be developed because the maternally inherited plastid markers offer improved resolution between geographic regions, relative to the nuclear markers tested [30]. This can be done with the next-generation sequencing technologies developed in other plant species [41]. In pecan breeding programs, accessible markers for the confirmation of cultivar identity are needed by the nursery industry, even if their usage may be limited. The USDA-ARS Pecan Breeding program has been using these 14 nuclear and 3 plastid SSR markers to identify cultivars, hybrids, and unknown varieties. Recently, three of these SSR markers were used to identify F1 progeny in a cross of “Lakota” × 87MX3-2.11, which was used for candidate gene identification [44]. Existing profiles from verified inventories will be useful in establishing additional methods of molecular verification [18]. Additional microsatellite markers should be selected for their distribution across all chromosomes and high nucleotide repeat numbers (tri and tetra). Next-generation sequencing technology provides a more efficient tool to quickly profile tree species with a greater resolution of interspecific hybridity, especially when their markers (SNPs) are aligned to an available chromosome-scale genome sequence [27,44]. However, SSR markers still have great utility for plant breeding programs and researchers who need markers that have high reproducibility, transferability between species, and platform independence.
5. Conclusions
Accessions within the Carya species distributed between the eastern United States and northeastern Mexico are genetically diverse. Microsatellites or SSR markers provide enough resolution to distinguish these diversities in the genus Carya. Evidence from both nuclear and maternally inherited molecular markers indicates that the diversity of Carya species in the United States and Mexico results in frequent hybridizations among sympatric trees in the Carya species, which adapt to the constraints of the local environment. The hybrids bring great opportunity for new pecan cultivar development. Microsatellite profiles of the two C. myristiciformis and two C. ovata individuals from the southeastern United States and Mexico are distinct from each other and each indicates hybridity with pecan, offering increased potential for the development of pecan cultivars [4]. Although existing molecular markers provide insights into the understanding of the dynamic diversity of the repository germplasm, a strategy for long-term maintenance of these diverse germplasms should include in situ preservation. Understanding the functional diversity in wild relatives of pecan will require more efficient and powerful tools. Next-generation sequencing technology provides the solution, especially for larger trees with longevity, like pecan. Our four pan genomic sequences in Carya illinoinensis will be the foundation for the development of molecular markers by using marker-assisted breeding methods to speed up the pecan breeding process [44].
Supplementary Materials
The following are available online at https://www.mdpi.com/article/10.3390/f13020188/s1, Table S1: Summary of the plant I.D., sample I.D., collection type, sections, species, latitude and longitude, and SSR loci in this study. Figure S1. Principal coordinates analysis (PCoA) (A) via covariance matrix and neighbor-joining tree (B) by the 394 accessions of the three sections of genus Carya and 17 interspecific hybrids and 7 accessions of the section Rhysocaryon in Juglans. Abbreviations: apo—Apocarya, car—Carya, sin—Sinocarya, hyb—interspecific hybrid, and rhy—Rhysocaryaon.
Author Contributions
Conceptualization, X.W.; methodology, X.W.; formal analysis, X.W.; investigation, X.W. and K.K.; resources, K.K.; data curation, K.K. and X.W.; writing—original draft preparation, X.W.; writing—review and editing, X.W., W.C., A.H. and K.K.; funding acquisition, X.W. All authors have read and agreed to the published version of the manuscript.
Funding
This project is supported by the U.S. Department of Agriculture (USDA) Current Research Information System (CRIS) Pecan Breeding and Genetics Program (3091-21000-039-00D), the Pecan Repository Program (3091-21000-042-00D), and the USDA Specialty Crops Research Initiatives (SCRI) grant (2016-51181-25408).
Data Availability Statement
The data in this study are available from the corresponding author upon request.
Acknowledgments
The authors are immensely grateful to a recently retired USDA-ARS Horticulturist, LJ. Grauke, for establishing a fundamental collection of Carya species, developing comprehensive SSR genotyping methods, and his comments on this manuscript. Mention of trade names or commercial products in this article is solely for the purpose of providing specific information and does not imply recommendation or endorsement by the U.S. Department of Agriculture.
Conflicts of Interest
The authors declare no conflict of interest.
References
- Manos, P.S.; Stone, D.E. Evolution, Phylogeny, and Systematics of the Juglandaceae. Ann. Mo. Bot. Gard. 2001, 88, 231. [Google Scholar] [CrossRef]
- Thompson, T.E.; Grauke, L. Pecans and Other Hickories (Carya). Acta Hortic. 1991, 290, 839–906. [Google Scholar] [CrossRef]
- Grauke, L.; Price, H.; Johnston, J. Genome Size of Pecan as Determined by Flow Cytometry. HortScience 2001, 36, 814. [Google Scholar] [CrossRef] [Green Version]
- Grauke, L.; Mendoza-Herrera, M. Population Structure in the Genus Carya. Acta Hortic. 2012, 948, 143–158. [Google Scholar] [CrossRef]
- Chang, R.-H.; Lu, A.-M. A Study of the Genus Carya Nutt. in China. J. Syst. Evol. 1979, 17, 40–44. [Google Scholar]
- Grauke, L.; Wood, B.W.; Harris, M.K. Crop Vulnerability: Carya. HortScience 2016, 51, 653–663. [Google Scholar] [CrossRef] [Green Version]
- Grauke, L.; Thompson, T.E.; Marquard, R.D. Evaluation of Pecan (Carya illinoinensis (Wangenh.) K. Koch) Germplasm Collections and Designation of a Core Subset. HortScience 1995, 30, 950–954. [Google Scholar] [CrossRef]
- Grauke, L.; Iqbal, M.J.; Reddy, A.S.; Thompson, T.E. Developing Microsatellite DNA Markers in Pecan. J. Am. Soc. Hortic. Sci. 2003, 128, 374–380. [Google Scholar] [CrossRef] [Green Version]
- Grauke, L.; Klein, R.; Grusak, M.; Klein, P. The Forest and the Trees: Applications for Molecular Markers in the Repository and Pecan Breeding Program. Acta Hortic. 2015, 1070, 109–126. [Google Scholar] [CrossRef]
- Emanuelli, F.; Lorenzi, S.; Grzeskowiak, L.; Catalano, V.; Stefanini, M.; Troggio, M.; Myles, S.; Martinez-Zapater, J.M.; Zyprian, E.; Moreira, F.M.; et al. Genetic diversity and population structure assessed by SSR and SNP markers in a large germplasm collection of grape. BMC Plant Biol. 2013, 13, 39. [Google Scholar] [CrossRef] [Green Version]
- Singh, N.; Choudhury, D.R.; Singh, A.; Kumar, S.; Srinivasan, K.; Tyagi, R.K.; Singh, R. Comparison of SSR and SNP Markers in Estimation of Genetic Diversity and Population Structure of Indian Rice Varieties. PLoS ONE 2013, 8, e84136. [Google Scholar] [CrossRef] [PubMed] [Green Version]
- Montes-Borrego, M.; Lopes, J.R.S. Combined use of a new SNP-based assay and multilocus SSR markers to assess genetic diversity of Xylella fastidiosa subsp. pauca infecting citrus and coffee plants. Int. Microbiol. 2015, 18, 13–24. [Google Scholar] [CrossRef] [PubMed] [Green Version]
- Chistiakov, D.A.; Hellemans, B.; Volckaert, F.A. Microsatellites and their genomic distribution, evolution, function and applications: A review with special reference to fish genetics. Aquaculture 2006, 255, 1–29. [Google Scholar] [CrossRef]
- Varshney, R.; Graner, A.; Sorrells, M.E. Genic microsatellite markers in plants: Features and applications. Trends Biotechnol. 2005, 23, 48–55. [Google Scholar] [CrossRef] [PubMed]
- Tóth, G.; Gáspári, Z.; Jurka, J. Microsatellites in Different Eukaryotic Genomes: Survey and Analysis. Genome Res. 2000, 10, 967–981. [Google Scholar] [CrossRef] [PubMed] [Green Version]
- Weising, K.; Gardner, R.C. A Set of Conserved PCR Primers for the Analysis of Simple Sequence Repeat Polymorphisms in Chloroplast Genomes of Dicotyledonous Angiosperms. Genome 1999, 42, 9–19. [Google Scholar] [CrossRef]
- Marquard, R.D.; Grauke, L.J.; Thompson, T.E.; Janos, R.S. Identifying Pecan Cultivars by Isozymes and Inheritance of Leucine Aminopeptidase. J. Am. Soc. Hortic. Sci. 1995, 120, 661–666. [Google Scholar] [CrossRef] [Green Version]
- Grauke, L.; Mendoza-Herrera, M.A.; Loopstra, C.; Thompson, T.E. Microsatellite Markers for Verifying Parentage of Pecans. HortScience 2006, 40, 515. [Google Scholar] [CrossRef] [Green Version]
- Rüter, B.; Hamrick, J.; Wood, B. Genetic diversity within provenance and cultivar germplasm collections versus natural populations of pecan (Carya illinoinensis). J. Hered. 1999, 90, 521–528. [Google Scholar] [CrossRef]
- Conner, P.J.; Wood, B.W. Identification of Pecan Cultivars and Their Genetic Relatedness as Determined by Randomly Am-plified Polymorphic DNA Analysis. J. Am. Soc. Hortic. Sci. 2001, 126, 474–480. [Google Scholar] [CrossRef]
- Hampe, J.; Marczinek, K.; Preuss, A.; Nürnberg, P. Marker pattern instabilities as a major cause of reproducibility problems in two-dimensional DNA fingerprinting. Electrophoresis 1996, 17, 659–666. [Google Scholar] [CrossRef] [PubMed]
- Jones, C.; Edwards, K.; Castaglione, S.; Winfield, M.; Sala, F.; Van De Wiel, C.; Bredemeijer, G.; Vosman, B.; Matthes, M.; Daly, A.; et al. Reproducibility testing of RAPD, AFLP and SSR markers in plants by a network of European laboratories. Mol. Breed. 1997, 3, 381–390. [Google Scholar] [CrossRef]
- Bian, Y.; Yang, Q.; Balint-Kurti, P.J.; Wisser, R.J.; Holland, J.B. Limits on the reproducibility of marker associations with southern leaf blight resistance in the maize nested association mapping population. BMC Genom. 2014, 15, 1068. [Google Scholar] [CrossRef] [PubMed] [Green Version]
- Nadeem, M.A.; Nawaz, M.A.; Shahid, M.Q.; Doğan, Y.; Comertpay, G.; Yıldız, M.; Hatipoğlu, R.; Ahmad, F.; Alsaleh, A.; Labhane, N.; et al. DNA molecular markers in plant breeding: Current status and recent advancements in genomic selection and genome editing. Biotechnol. Biotechnol. Equip. 2018, 32, 261–285. [Google Scholar] [CrossRef] [Green Version]
- Barchi, L.; Lanteri, S.; Portis, E.; Acquadro, A.; Valè, G.; Toppino, L.; Rotino, G.L. Identification of SNP and SSR markers in eggplant using RAD tag sequencing. BMC Genom. 2011, 12, 304. [Google Scholar] [CrossRef] [PubMed] [Green Version]
- Zalapa, J.E.; Cuevas, H.; Zhu, H.; Steffan, S.; Senalik, D.; Zeldin, E.; McCown, B.; Harbut, R.; Simon, P. Using next-generation sequencing approaches to isolate simple sequence repeat (SSR) loci in the plant sciences. Am. J. Bot. 2012, 99, 193–208. [Google Scholar] [CrossRef] [Green Version]
- Bentley, N.; Grauke, L.J.; Klein, P. Genotyping by sequencing (GBS) and SNP marker analysis of diverse accessions of pecan (Carya illinoinensis). Tree Genet. Genomes 2019, 15, 8. [Google Scholar] [CrossRef]
- Cabezas, J.A.; Ibáñez, J.; Lijavetzky, D.; Vélez, D.; Bravo, G.; Rodríguez, V.; Carreño, I.; Jermakow, A.M.; Carreño, J.; Ruiz-García, L.; et al. A 48 SNP set for grapevine cultivar identification. BMC Plant Biol. 2011, 11, 153. [Google Scholar] [CrossRef] [Green Version]
- Bryan, G.J.; McNicoll, J.; Ramsay, G.; Meyer, R.C.; de Jong, W.S. Polymorphic simple sequence repeat markers in chloroplast genomes of Solanaceous plants. Theor. Appl. Genet. 1999, 99, 859–867. [Google Scholar] [CrossRef]
- Grauke, L.; Mendoza-Herrera, M.; Binzel, M. Plastid Microsatellite Markers in Carya. Acta Hortic. 2010, 859, 237–246. [Google Scholar] [CrossRef]
- Jia, X.-D.; Wang, T.; Zhai, M.; Li, Y.-R.; Guo, Z.-R. Genetic Diversity and Identification of Chinese-Grown Pecan Using ISSR and SSR Markers. Molecules 2011, 16, 10078–10092. [Google Scholar] [CrossRef] [PubMed] [Green Version]
- Grauke, L.J.; Mendoza-Herrera, M.A.; Miller, A.J.; Wood, B.W. Geographic patterns of genetic variation in native pecans. Tree Genet. Genomes 2011, 7, 917–932. [Google Scholar] [CrossRef]
- Woeste, K.; Burns, R.; Rhodes, O.; Michler, C. Thirty polymorphic nuclear microsatellite loci from black walnut. J. Hered. 2002, 93, 58–60. [Google Scholar] [CrossRef] [PubMed] [Green Version]
- Amos, W.; Hoffman, J.I.; Frodsham, A.; Zhang, L.; Best, S.; Hill, A.V.S. Automated binning of microsatellite alleles: Problems and solutions. Mol. Ecol. Notes 2006, 7, 10–14. [Google Scholar] [CrossRef]
- Rinehart, T.A. AFLP analysis using GeneMapper® software and an Excel® macro that aligns and converts output to binary. BioTechniques 2004, 37, 186–188. [Google Scholar] [CrossRef] [PubMed] [Green Version]
- Peakall, R.; Smouse, P.E. GenAlEx 6.5: Genetic analysis in Excel. Population genetic software for teaching and research—An update. Bioinformatics 2012, 28, 2537–2539. [Google Scholar] [CrossRef] [PubMed] [Green Version]
- SAS Institute Inc. SAS/STAT® 9.3 User’s Guide; SAS Institute Inc.: Cary, NC, USA, 2011. [Google Scholar]
- Pritchard, J.K.; Stephens, M.; Donnelly, P. Inference of population structure using multilocus genotype data. Genetics 2000, 155, 945–959. [Google Scholar] [CrossRef]
- Evanno, G.; Regnaut, S.; Goudet, J. Detecting the number of clusters of individuals using the software structure: A simulation study. Mol. Ecol. 2005, 14, 2611–2620. [Google Scholar] [CrossRef] [Green Version]
- Jenkins, J.; Wilson, B.; Grimwood, J.; Schmutz, J.; Grauke, L. Towards a Reference Pecan Genome Sequence. Acta Hortic. 2015, 1070, 101–108. [Google Scholar] [CrossRef]
- Wang, X.; Rhein, H.S.; Jenkins, J.; Schmutz, J.; Grimwood, J.; Grauke, L.J.; Randall, J.J. Chloroplast genome sequences of Carya illinoinensis from two distinct geographic populations. Tree Genet. Genomes 2020, 16, 48. [Google Scholar] [CrossRef]
- Moeller, D.A.; Tiffin, P. Geographic Variation in Adaptation at the Molecular Level: A Case Study of Plant Immunity Genes. Evol. Int. J. Org. Evol. 2008, 62, 3069–3081. [Google Scholar] [CrossRef] [PubMed]
- Jump, A.S.; Marchant, R.; Peñuelas, J. Environmental change and the option value of genetic diversity. Trends Plant Sci. 2009, 14, 51–58. [Google Scholar] [CrossRef] [PubMed]
- Lovell, J.T.; Bentley, N.B.; Bhattarai, G.; Jenkins, J.W.; Sreedasyam, A.; Alarcon, Y.; Bock, C.; Boston, L.B.; Carlson, J.; Cervantes, K.; et al. Four chromosome scale genomes and a pan-genome annotation to accelerate pecan tree breeding. Nat. Commun. 2021, 12, 4125. [Google Scholar] [CrossRef] [PubMed]
Figure 1.
Distribution of Carya species by ploidy level within sections. (A) Section Apocarya (diploids); (B) Section Carya (Diploids); (C) Section Carya (Tetraploids); and (D) Section Sinocarya (Diploids). Samples collected in this study were symbolized in each section.
Figure 1.
Distribution of Carya species by ploidy level within sections. (A) Section Apocarya (diploids); (B) Section Carya (Diploids); (C) Section Carya (Tetraploids); and (D) Section Sinocarya (Diploids). Samples collected in this study were symbolized in each section.

Figure 2.
Principal coordinates analysis (PCoA) via covariance matrix of genus Carya (genus Juglans as outgroup) (A) and sections Apocaya and Carya and their interspecific hybrids (B), and Q plots (membership coefficients) (C) of the species in the three sections of genus Carya and the section Rhysocaryon in Juglans. Abbreviations: apo—Apocarya, car—Carya, sin—Sinocarya, hyb—interspecific hybrid, and rhy—Rhysocaryaon. Abbreviations of species refer to Table 1 and Supplementary Table S1.

Figure 3.
Principal coordinates analysis (PCoA) via covariance matrix by the species in the genus Carya with disjunct C. myristiciformis and C. ovata populations. Xom and ton population sizes are less than 3 and are excluded in the analysis. Abbreviations of species refer to Table 1 and Supplementary Table S1.

Figure 4.
Principal coordinates analysis (PCoA) via covariance matrix by 251 the accessions in C. illinoinensis based on their ecozones. Abbreviations: cc—central, ce—central east, cw—central west, nc—north central, ne—northeast, sc—south central, sw—southwest, and mix—mixed. The accessions of each population can be found from column I (Ecozone) of Supplementary Table S1.

Figure 5.
Principal coordinates analysis (PCoA) via covariance matrix of the 394 accessions in the genus Carya based on their longitudes (A) and latitude (B). The accessions of each population can be found from column K (Latpop) and L (Lonpop) in Supplementary Table S1.
Figure 5.
Principal coordinates analysis (PCoA) via covariance matrix of the 394 accessions in the genus Carya based on their longitudes (A) and latitude (B). The accessions of each population can be found from column K (Latpop) and L (Lonpop) in Supplementary Table S1.


Table 1.
Section, species, common name, ploidy level, number of accessions, and abbreviation by sections and species.
Table 1.
Section, species, common name, ploidy level, number of accessions, and abbreviation by sections and species.
| Section/Species | Common Name | Genus | Ploidy | Number | Abbrev. | Origin/Collection Site * |
|---|---|---|---|---|---|---|
| Section Apocarya | Pecan Hickories | 275 | apo | |||
| C. aquatica (F. Michx.) Nutt. | Water hickory | Carya | 2n = 2x = 32 | 11 | aqu | Louisiana, Mississippi, and Texas |
| C. cordiformis (Wangenh.) K. Koch | Bitternut hickory | Carya | 2n = 2x = 32 | 7 | cor | Kansas, Louisiana, New York, and North Carolina |
| C. illinoinensis (Wangenh.) K. Koch | Pecan | Carya | 2n = 2x = 32 | 251 | ill | 185 from across US (ill-US) and 66 from Mexico (ill-MX) |
| C. palmeri (Manning) | Mexican hickory | Carya | 2n = 2x = 32 | 6 | plm | Mexico |
| Section Carya | True Hickories | 108 | car | |||
| C. floridana Sarg. | Scrub hickory | Carya | 2n = 4x = 64 | 37 | flo | Florida |
| C. glabra (Mill.) Sweet | Pignut hickory | Carya | 2n = 4x = 64 | 20 | gla | Florida, Louisiana, and New York |
| C. laciniosa (F. Michx.) Loudon | Shellbark hickory | Carya | 2n = 2x = 32 | 5 | lac | Kansas, Ohio, and West Virginia |
| C. myristiciformis (F. Michx.) Nutt. | Nutmeg hickory | Carya | 2n = 2x = 32 | 11 | myr | 5 from Alabama, Louisiana, and Texas (myr-US) and 6 from Mexico (myr-MX) |
| C. ovata (Mill.) K. Koch | Shagbark hickory | Carya | 2n = 2x = 32 | 22 | ovt | 15 from Alabama, Louisiana, and Texas (ovt-US) and 7 from Mexico (ovt-MX) |
| C. texana (Buckley) | Black hickory | Carya | 2n = 4x = 64 | 9 | tex | Louisiana and Texas |
| C. tomentosa (Poir.) Nutt. | Mockernut | Carya | 2n = 4x = 64 | 4 | tom | Louisiana, Missouri, Ohio, and South Carolina |
| Section Sinocarya | Asian Hickories | Carya | 11 | sin | ||
| C. cathayensis Sarg. | Chinese hickory | Carya | 2n = 2x = 32 | 5 | cat | Zhejiang Province, PRC |
| C. dabieshanensis Liu & Li | Dabie Mountain hickory | Carya | 2n = 2x = 32 | 5 | dab | Anhui Province, PRC |
| C. tonkinensis LeComte | Vietnam hickory | Carya | 2n = 2x = 32 | 1 | ton | Vietnam |
| Hybrids | 17 | hyb | ||||
| C. ovata × C. illinoinensis | Carya | 2n = 2x = 32 | 3 | xio | Kentucky, Texas, and Mexico | |
| C. ovata × mex × mysristiformis? | Carya | 2n = 2x = 32 | 2 | xom | ||
| C. × brownii (C. illinoinensis x C. cordiformis) | Carya | 2n = 2x = 32 | 4 | xbr | Illinois, Oklahoma, Texas | |
| C. × laneyi (C. cordiformis × C.ovata) | Carya | 2n = 2x = 32 | 3 | xla | Iowa, New York Kentucky, Arkansas | |
| C. × lecontei (C. illinoinensis × C. aquatica) | Carya | 2n = 2x = 32 | 3 | xlc | Louisiana, Mississippi, Texas, | |
| C. × nussbaumeri (C. illinoinensis × C. laciniosa) | Carya | 2n = 2x = 32 | 2 | xnu | Georgia, Indiana, Iowa, Missouri, Mississippi, | |
| Rhysocaryon | Black walnuts | 7 | rhy | |||
| J. major | Arizona black walnut | Juglans | 2n = 2x = 32 | 2 | maj | Texas |
| J. microcarpa | Texas black walnut | Juglans | 2n = 2x = 32 | 3 | mic | Texas |
| J. nigra | Eastern black walnut | Juglans | 2n= 2x = 32 | 2 | nig | Texas |
* Geographical coordinates refer to Supplementary Table S1.
Table 2.
Samples size (N), band frequency (f), estimated allele frequency (p and q), no. alleles (Na), no. effective alleles (Ne), Shannon diversity index (I), expected (He), and unbiased expected heterozygosity (uHe) for Carya species and its hybrids.
Table 2.
Samples size (N), band frequency (f), estimated allele frequency (p and q), no. alleles (Na), no. effective alleles (Ne), Shannon diversity index (I), expected (He), and unbiased expected heterozygosity (uHe) for Carya species and its hybrids.
| Population | N | f | p | q | Na | Ne | I | He | uHe | Polymorphic Loci (%) |
|---|---|---|---|---|---|---|---|---|---|---|
| aqu | 11 | 0.687 ± 0.104 | 0.524 ± 0.080 | 0.967 ± 0.029 | 1.951 ± 0.065 | 1.172 ± 0.103 | 0.339 ± 0.053 | 0.576 ± 0.092 | 0.607 ± 0.096 | 23.692 |
| cor | 7 | 0.308 ± 0.087 | 0.534 ± 0.099 | 0.964 ± 0.036 | 1.972 ± 0.062 | 1.077 ± 0.073 | 0.392 ± 0.058 | 0.240 ± 0.047 | 0.260 ± 0.053 | 21.538 |
| ill-MX | 66 | 0.368 ± 0.035 | 0.521 ± 0.034 | 0.962 ± 0.014 | 1.993 ± 0.0102 | 1.166 ± 0.032 | 0.390 ± 0.022 | 0.327 ± 0.028 | 0.325 ± 0.029 | 44.308 |
| ill-US | 185 | 0.397 ± 0.018 | 0.421 ± 0.017 | 0.958 ± 0.009 | 2.000 ± 0.000 | 1.213 ± 0.019 | 0.355 ± 0.016 | 0.379 ± 0.017 | 0.360 ± 0.015 | 53.231 |
| plm | 6 | 0.373 ± 0.107 | 0.618 ± 0.127 | 0.964 ± 0.037 | 1.926 ± 0.3107 | 1.081 ± 0.084 | 0.431 ± 0.062 | 0.267 ± 0.051 | 0.291 ± 0.056 | 19.385 |
| flo | 37 | 0.389 ± 0.039 | 0.398 ± 0.044 | 0.941 ± 0.018 | 1.995 ± 0.012 | 1.253 ± 0.048 | 0.370 ± 0.035 | 0.354 ± 0.034 | 0.367 ± 0.036 | 60.308 |
| gla | 20 | 0.332 ± 0.045 | 0.353 ± 0.048 | 0.935 ± 0.026 | 1.994 ± 0.017 | 1.211 ± 0.056 | 0.314 ± 0.037 | 0.458 ± 0.062 | 0.487 ± 0.064 | 53.846 |
| lac | 5 | 0.394 ± 0.113 | 0.288 ± 0.105 | 0.964 ± 0.042 | 1.921 ± 0.121 | 1.078 ± 0.090 | 0.451 ± 0.060 | 0.285 ± 0.051 | 0.365 ± 0.039 | 17.846 |
| myrMX | 6 | 0.381 ± 0.097 | 0.546 ± 0.130 | 0.966 ± 0.035 | 1.937 ± 0.100 | 1.082 ± 0.086 | 0.457 ± 0.062 | 0.286 ± 0.049 | 0.311 ± 0.054 | 18.154 |
| myrUS | 5 | 0.439 ± 0.113 | 0.313 ± 0.105 | 0.966 ± 0.044 | 1.922 ± 0.120 | 1.074 ± 0.093 | 0.488 ± 0.062 | 0.316 ± 0.054 | 0.389 ± 0.042 | 14.462 |
| ovtMX | 7 | 0.390 ± 0.110 | 0.526 ± 0.114 | 0.971 ± 0.033 | 1.881 ± 0.122 | 1.062 ± 0.067 | 0.413 ± 0.057 | 0.256 ± 0.047 | 0.278 ± 0.052 | 16.000 |
| ovtUS | 15 | 0.427 ± 0.067 | 0.408 ± 0.058 | 0.961 ± 0.027 | 1.979 ± 0.037 | 1.134 ± 0.066 | 0.324 ± 0.044 | 0.370 ± 0.055 | 0.391 ± 0.057 | 28.308 |
| tex | 9 | 0.319 ± 0.081 | 0.398 ± 0.072 | 0.937 ± 0.042 | 1.974 ± 0.053 | 1.133 ± 0.082 | 0.397 ± 0.057 | 0.288 ± 0.036 | 0.264 ± 0.049 | 35.077 |
| tom | 4 | 0.424 ± 0.119 | 0.276 ± 0.114 | 0.958 ± 0.052 | 1.939 ± 0.119 | 1.101 ± 0.120 | 0.496 ± 0.067 | 0.315 ± 0.055 | 0.360 ± 0.063 | 19.077 |
| cat | 5 | 0.958 ± 0.063 | 0.941 ± 0.087 | 0.998 ± 0.011 | 1.083 ± 0.124 | 1.004 ± 0.025 | 0.596 ± 0.028 | 0.407 ± 0.026 | 0.452 ± 0.029 | 0.615 |
| dab | 5 | 0.883 ± 0.118 | 0.865 ± 0.135 | 0.998 ± 0.009 | 1.167 ± 0.167 | 1.005 ± 0.020 | 0.435 ± 0.044 | 0.269 ± 0.036 | 0.343 ± 0.020 | 1.231 |
| xbr/xlc | 7 | 0.321 ± 0.093 | 0.524 ± 0.107 | 0.960 ± 0.036 | 1.941 ± 0.089 | 1.085 ± 0.072 | 0.389 ± 0.054 | 0.236 ± 0.044 | 0.257 ± 0.049 | 24.615 |
| xio/xnu | 5 | 0.441 ± 0.118 | 0.320 ± 0.109 | 0.961 ± 0.048 | 1.915 ± 0.125 | 1.083 ± 0.099 | 0.481 ± 0.064 | 0.311 ± 0.055 | 0.386 ± 0.044 | 16.615 |
| xla | 3 | 0.511 ± 0.126 | 0.341 ± 0.135 | 0.965 ± 0.059 | 1.911 ± 0.164 | 1.080 ± 0.132 | 0.556 ± 0.058 | 0.373 ± 0.053 | 0.448 ± 0.064 | 12.615 |
Note: Na = no. of different alleles; Ne = no. of effective alleles = 1/(p2 + q2); I = Shannon diversity index = −1× (p × Ln (p) + q × Ln(q)); He = expected heterozygosity = 2 × p × q; uHe = unbiased expected heterozygosity = (2N/(2N−1)) × He, where for diploid binary data and assuming Hardy–Weinberg equilibrium, q = (1 − band freq.)0.5 and p = 1 − q. Species ‘xom’ and ‘ton’ have only 1–2 collections and are excluded for analysis. The sample size in the populations tom and xla is less than 5 and the results should be treated with caution.
Table 3.
Sample size (N), band frequency (f), estimated allele frequency (p and q), no. alleles (Na), no. effective alleles (Ne), Shannon diversity index (I), expected (He), and unbiased expected heterozygosity (uHe) for the 251 collections in C. illinoinensis from the United States and Mexico.
Table 3.
Sample size (N), band frequency (f), estimated allele frequency (p and q), no. alleles (Na), no. effective alleles (Ne), Shannon diversity index (I), expected (He), and unbiased expected heterozygosity (uHe) for the 251 collections in C. illinoinensis from the United States and Mexico.
| Population | N | f | p | q | Na | Ne | I | He | uHe | Polymorphic Loci (%) |
|---|---|---|---|---|---|---|---|---|---|---|
| cc | 45 | 0.393 ± 0.038 | 0.356 ± 0.037 | 0.962 ± 0.016 | 1.977 ± 0.022 | 1.160 ± 0.038 | 0.358 ± 0.029 | 0.349 ± 0.030 | 0.354 ± 0.030 | 39.077 |
| ce | 27 | 0.424 ± 0.049 | 0.441 ± 0.051 | 0.960 ± 0.023 | 1.990 ± 0.020 | 1.134 ± 0.049 | 0.494 ± 0.056 | 0.368 ± 0.037 | 0.377 ± 0.038 | 29.538 |
| cw | 48 | 0.427 ± 0.037 | 0.388 ± 0.038 | 0.959 ± 0.017 | 1.982 ± 0.019 | 1.142 ± 0.037 | 0.393 ± 0.027 | 0.364 ± 0.030 | 0.375 ± 0.030 | 33.231 |
| nc | 19 | 0.425 ± 0.057 | 0.411 ± 0.058 | 0.967 ± 0.023 | 1.940 ± 0.055 | 1.120 ± 0.052 | 0.275 ± 0.040 | 0.343 ± 0.039 | 0.361 ± 0.039 | 28.923 |
| ne | 41 | 0.445 ± 0.045 | 0.351 ± 0.041 | 0.959 ± 0.019 | 1.975 ± 0.024 | 1.140 ± 0.037 | 0.413 ± 0.034 | 0.387 ± 0.038 | 0.393 ± 0.038 | 36.615 |
| sc | 41 | 0.406 ± 0.042 | 0.374 ± 0.042 | 0.965 ± 0.016 | 1.973 ± 0.025 | 1.126 ± 0.035 | 0.362 ± 0.032 | 0.352 ± 0.035 | 0.366 ± 0.037 | 33.846 |
| sw | 23 | 0.450 ± 0.049 | 0.358 ± 0.049 | 0.964 ± 0.023 | 1.990 ± 0.021 | 1.146 ± 0.053 | 0.302 ± 0.036 | 0.397 ± 0.039 | 0.407 ± 0.040 | 30.462 |
| mix | 7 | 0.356 ± 0.110 | 0.598 ± 0.101 | 0.968 ± 0.034 | 1.899 ± 0.115 | 1.068 ± 0.070 | 0.388 ± 0.061 | 0.237 ± 0.050 | 0.257 ± 0.055 | 19.077 |
Note: Na = no. of different alleles; Ne = no. of effective alleles = 1/(p2 + q2); I = Shannon diversity index = −1 × (p × Ln (p) + q × Ln(q)); He = expected heterozygosity = 2 × p × q; uHe = unbiased expected heterozygosity = (2N/(2N − 1)) × He, where for diploid binary data and assuming Hardy–Weinberg equilibrium, q = (1 − band freq.)0.5 and p = 1 − q. Abbreviations of the populations: cc—central, ce—central east, cw—central west, nc—north central, ne—northeast, sc—south central, sw—southwest, and mix—mixed. The accessions of each population can be found from column I (Ecozone) of Supplementary Table S1.
Table 4.
Pairwise population unbiased Nei genetic identity (diagonal) and unbiased Nei genetic distance (above or below the diagonal).
Table 4.
Pairwise population unbiased Nei genetic identity (diagonal) and unbiased Nei genetic distance (above or below the diagonal).
| Code | ALM | DC | IL | KS | KY | mix | MO | MX1 | MX2 | MX3 | MX4 | MX5 | NLC | Se | TN | TX1 | TX2 | TX3 | TX4 | TX5 | TX6 | TXSD | N |
|---|---|---|---|---|---|---|---|---|---|---|---|---|---|---|---|---|---|---|---|---|---|---|---|
| ALM | 24.27 | 29.10 | 24.15 | 23.95 | 23.65 | 27.23 | 23.18 | 25.14 | 22.84 | 25.31 | 29.00 | 24.33 | 26.25 | 25.26 | 23.45 | 26.19 | 25.80 | 27.28 | 26.42 | 27.77 | 23.87 | 26.68 | 10 |
| DC | 29.10 | 15.49 | 28.81 | 28.18 | 28.70 | 27.91 | 27.60 | 26.38 | 23.83 | 23.77 | 27.44 | 28.17 | 28.21 | 27.36 | 29.69 | 26.97 | 27.87 | 28.55 | 27.04 | 28.65 | 27.72 | 27.33 | 25 |
| IL | 24.15 | 28.81 | 23.77 | 23.05 | 23.03 | 27.89 | 22.41 | 25.25 | 23.82 | 26.51 | 30.01 | 24.01 | 26.60 | 25.53 | 22.40 | 26.29 | 26.61 | 27.71 | 27.38 | 28.17 | 23.61 | 27.11 | 13 |
| KS | 23.95 | 28.18 | 23.05 | 22.77 | 22.03 | 27.20 | 21.72 | 25.62 | 23.52 | 26.03 | 29.54 | 23.53 | 26.41 | 25.47 | 21.99 | 25.60 | 25.78 | 26.83 | 27.03 | 27.37 | 23.34 | 26.94 | 13 |
| KY | 23.65 | 28.70 | 23.03 | 22.03 | 20.04 | 25.84 | 21.61 | 25.52 | 22.10 | 26.88 | 29.90 | 23.48 | 26.11 | 23.97 | 21.88 | 24.64 | 25.59 | 26.08 | 26.33 | 26.72 | 23.01 | 25.88 | 8 |
| mix | 27.23 | 27.91 | 27.89 | 27.20 | 25.84 | 23.52 | 26.77 | 27.47 | 24.56 | 26.16 | 29.26 | 26.40 | 26.19 | 21.98 | 28.21 | 24.38 | 24.05 | 25.40 | 25.11 | 25.87 | 27.02 | 22.69 | 7 |
| MO | 23.18 | 27.60 | 22.41 | 21.72 | 21.61 | 26.77 | 20.00 | 25.10 | 21.82 | 25.87 | 28.91 | 22.97 | 25.62 | 24.95 | 21.44 | 25.59 | 26.18 | 26.72 | 26.43 | 27.43 | 22.75 | 26.03 | 13 |
| MX1 | 25.14 | 26.38 | 25.25 | 25.62 | 25.52 | 27.47 | 25.10 | 15.33 | 17.48 | 19.59 | 22.55 | 24.93 | 26.87 | 25.81 | 25.57 | 26.73 | 25.84 | 26.66 | 25.43 | 28.62 | 24.16 | 27.49 | 7 |
| MX2 | 22.84 | 23.83 | 23.82 | 23.52 | 22.10 | 24.56 | 21.82 | 17.48 | 11.44 | 19.13 | 22.19 | 21.44 | 24.35 | 23.54 | 23.46 | 24.81 | 24.26 | 24.53 | 24.47 | 26.50 | 22.98 | 25.93 | 9 |
| MX3 | 25.31 | 23.77 | 26.51 | 26.03 | 26.88 | 26.16 | 25.87 | 19.59 | 19.13 | 8.29 | 17.64 | 24.58 | 25.35 | 25.54 | 26.81 | 25.57 | 24.95 | 26.20 | 25.00 | 28.04 | 25.52 | 26.91 | 7 |
| MX4 | 29.00 | 27.44 | 30.01 | 29.54 | 29.90 | 29.26 | 28.91 | 22.55 | 22.19 | 17.64 | 16.06 | 28.24 | 28.00 | 28.53 | 29.81 | 28.51 | 28.33 | 29.23 | 28.10 | 30.45 | 28.06 | 29.73 | 12 |
| MX5 | 24.33 | 28.17 | 24.01 | 23.53 | 23.48 | 26.40 | 22.97 | 24.93 | 21.44 | 24.58 | 28.24 | 20.80 | 24.11 | 24.67 | 24.11 | 24.73 | 24.73 | 25.50 | 25.19 | 27.04 | 23.29 | 26.04 | 14 |
| NLC | 26.25 | 28.21 | 26.60 | 26.41 | 26.11 | 26.19 | 25.62 | 26.87 | 24.35 | 25.35 | 28.00 | 24.11 | 24.04 | 23.97 | 26.72 | 24.63 | 23.76 | 25.29 | 24.40 | 26.56 | 25.35 | 24.74 | 17 |
| se | 25.26 | 27.36 | 25.53 | 25.47 | 23.97 | 21.98 | 24.95 | 25.81 | 23.54 | 25.54 | 28.53 | 24.67 | 23.97 | 19.44 | 25.85 | 22.16 | 21.04 | 23.42 | 21.90 | 23.89 | 24.11 | 21.16 | 18 |
| TN | 23.45 | 29.69 | 22.40 | 21.99 | 21.88 | 28.21 | 21.44 | 25.57 | 23.46 | 26.81 | 29.81 | 24.11 | 26.72 | 25.85 | 20.91 | 26.82 | 26.42 | 27.07 | 27.88 | 28.05 | 23.11 | 27.30 | 12 |
| TX1 | 26.19 | 26.97 | 26.29 | 25.60 | 24.64 | 24.38 | 25.59 | 26.73 | 24.81 | 25.57 | 28.51 | 24.73 | 24.63 | 22.16 | 26.82 | 22.12 | 22.17 | 24.85 | 24.06 | 24.15 | 24.88 | 23.08 | 16 |
| TX2 | 25.80 | 27.87 | 26.61 | 25.78 | 25.59 | 24.05 | 26.18 | 25.84 | 24.26 | 24.95 | 28.33 | 24.73 | 23.76 | 21.04 | 26.42 | 22.17 | 20.75 | 22.13 | 20.93 | 23.82 | 24.07 | 22.48 | 8 |
| TX3 | 27.28 | 28.55 | 27.71 | 26.83 | 26.08 | 25.40 | 26.72 | 26.66 | 24.53 | 26.20 | 29.23 | 25.50 | 25.29 | 23.42 | 27.07 | 24.85 | 22.13 | 23.00 | 22.20 | 25.49 | 26.42 | 23.40 | 5 |
| TX4 | 26.42 | 27.04 | 27.38 | 27.03 | 26.33 | 25.11 | 26.43 | 25.43 | 24.47 | 25.00 | 28.10 | 25.19 | 24.40 | 21.90 | 27.88 | 24.06 | 20.93 | 22.20 | 19.33 | 24.46 | 25.20 | 22.56 | 10 |
| TX5 | 27.77 | 28.65 | 28.17 | 27.37 | 26.72 | 25.87 | 27.43 | 28.62 | 26.50 | 28.04 | 30.45 | 27.04 | 26.56 | 23.89 | 28.05 | 24.15 | 23.82 | 25.49 | 24.46 | 26.10 | 26.94 | 23.88 | 13 |
| TX6 | 23.87 | 27.72 | 23.61 | 23.34 | 23.01 | 27.02 | 22.75 | 24.16 | 22.98 | 25.52 | 28.06 | 23.29 | 25.35 | 24.11 | 23.11 | 24.88 | 24.07 | 26.42 | 25.20 | 26.94 | 22.06 | 25.42 | 9 |
| TXSD | 26.68 | 27.33 | 27.11 | 26.94 | 25.88 | 22.69 | 26.03 | 27.49 | 25.93 | 26.91 | 29.73 | 26.04 | 24.74 | 21.16 | 27.30 | 23.08 | 22.48 | 23.40 | 22.56 | 23.88 | 25.42 | 21.40 | 5 |
Note: Pecan populations were labeled as sampled within the state of origin (Supplementary Table S1). Populations with the highest affinity between populations are shown in green and those with the greatest distance in orange. MX3 showed the lowest affinity and is highlighted in yellow.
Publisher’s Note: MDPI stays neutral with regard to jurisdictional claims in published maps and institutional affiliations. |
© 2022 by the authors. Licensee MDPI, Basel, Switzerland. This article is an open access article distributed under the terms and conditions of the Creative Commons Attribution (CC BY) license (https://creativecommons.org/licenses/by/4.0/).
Share and Cite
MDPI and ACS Style
Wang, X.; Chatwin, W.; Hilton, A.; Kubenka, K. Genetic Diversity Revealed by Microsatellites in Genus Carya. Forests 2022, 13, 188. https://doi.org/10.3390/f13020188
AMA Style
Wang X, Chatwin W, Hilton A, Kubenka K. Genetic Diversity Revealed by Microsatellites in Genus Carya. Forests. 2022; 13(2):188. https://doi.org/10.3390/f13020188
Chicago/Turabian StyleWang, Xinwang, Warren Chatwin, Angelyn Hilton, and Keith Kubenka. 2022. "Genetic Diversity Revealed by Microsatellites in Genus Carya" Forests 13, no. 2: 188. https://doi.org/10.3390/f13020188
Note that from the first issue of 2016, this journal uses article numbers instead of page numbers. See further details here.