

Integral Thermal Management Studies in Winter Conditions with a Global Model of a Battery-Powered Electric Bus

CMT-Motores Térmicos, Universitat Politècnica de València, 46022 Valencia, Spain
*
Author to whom correspondence should be addressed.
Energies 2023, 16(1), 168; https://doi.org/10.3390/en16010168
Submission received: 14 November 2022
/
Revised: 13 December 2022
/
Accepted: 19 December 2022
/
Published: 23 December 2022
(This article belongs to the Special Issue Advances in Design, Modeling and Analysis of Electrified and Sustainable Transport Systems II)
Abstract
:The potential of e-bus transportation to improve air quality and reduce noise pollution in cities is significant. In order to improve efficiency and extend the useful life of these vehicles, there is a growing need to investigate improvements for the thermal management system of electric city buses. In electric vehicles, there are several systems whose thermal behaviors need to be regulated, such as batteries, electric machines, power electronics, air conditioning, and cabin. In this study, a 0D/1D model of an electric city bus is developed that integrates all sub-models of the powertrain, auxiliaries, and thermal management system. This model is used to evaluate different configurations and thermal management strategies of the electric urban bus by simulating public transport driving cycles in Valencia, Spain, under winter conditions. First, the original thermal–hydraulic circuit of the bus was modified, resulting in an improvement in the battery energy consumption with savings of 11.4% taking advantage of the heat produced in the electric motors to heat the battery. Then, the original PTC heating system of the bus was compared with a proposed heat pump system in terms of battery power consumption. The heat pump system achieved an energy savings of 3.9% compared to the PTC heating system.
1. Introduction
The transport sector is one of the largest consumers of fossil fuels, especially the land transport subsector, which was responsible for 11.9% of greenhouse gas emissions in 2020 [1]. For this reason, decarbonization of this sector can be of great importance in combating global warming, air pollution, and ecosystem degradation [2,3]. To address this problem, several alternatives have been proposed and evaluated [4]. The most reliable and promising one seems to be the electrification of vehicles [5]. In addition to reducing pollutant and CO2 tailpipe emissions, electric vehicles have other advantages such as lower noise pollution. However, the high cost of the technology, slow battery charging speed, and low autonomy are cited as the main challenges [6,7].
Public bus transportation is an excellent candidate for powertrain electrification, which could solve many land transportation problems. Buses alone account for more than 80% of all public transport passenger trips worldwide; thus, bus electrification can have a direct impact on the quality of life in cities [8]. In particular, bus transport is very suitable for the introduction of electrified propulsion technologies due to its fixed and scheduled routes [9]. Problems related to autonomy and battery charging are less relevant, as they can be solved by equipping the bus with a set of batteries large enough to run for a full day and then that slowly charge overnight [10]. Furthermore, policies adopted by many countries are leading to increased demand for electric buses. Measures such as purchase subsidies and tax incentives have played important roles in accelerating the adoption of electric buses in public transport bus fleets [11,12,13,14,15,16].
Nevertheless, the problem of autonomy of electric vehicles also applies to battery-powered electric buses, and much effort has been made to address this problem. A review of the literature shows that, recently, there have been studies mainly on energy management [8]. This research topic mainly focuses on developing energy demand forecasts for electric buses. Several studies propose optimization and artificial intelligence methods to find solutions for energy scheduling [17,18,19,20]. However, few studies focus on technological improvements that can achieve energy consumption reduction for electric city buses, such as improvements in integrated thermal management systems.
Thermal management systems in a vehicle are mainly concerned with various subsystems: battery cooling/preheating, power electronics and electric machines cooling, and heating, ventilation, and air conditioning (HVAC) systems [21]. In recent years, many advances have been made in each of the subsystems of an electric vehicle, but most focus on a single subsystem. These subsystems, which are complexly coupled with each other, are studied separately, so that the analysis of the performance of the thermal management system at the vehicle level is neglected [22]. For this reason, it is imperative to look at the latest literature on integrated thermal management systems (ITMS) for electric vehicles from a global perspective. Shelly et al. [23] compares six integrated thermal management system architectures for long-range battery electric vehicles and evaluates them in an ambient temperature range of −20–40 °C. One of the main conclusions of this study was that the waste heat release of electronics provides unique benefits and increases the range by 13.5% at extremely low ambient temperatures. In the experimental work of Jing Ma et al. [24], a novel ITMS for electric vehicles was proposed. In this work, multi-channel valves were used to connect the circuits of the whole system. It was found that the vehicle’s ITMS is essential to achieve energy savings, even at normal temperatures under regular operating conditions. Jian Guo et al. [25] proposes a novel refrigerant-based thermal management system for electric vehicles that can independently regulate the temperature of the cabin and the battery. The system can also directly cool and heat the battery; thus, a positive temperature coefficient (PTC) heater or an additional coolant circuit is not required. However, aforementioned studies do not suggest better solutions for heating the cabin and the battery in winter. Usually, the cabin is heated via heat pump and the battery via heat pump or PTC. The waste heat from electronic components such as the motor is not fully used [22]. Furthermore, the studies mentioned above focus on ITMS for light-duty electric vehicles. Heavy-duty vehicles, such as buses, have different requirements for which their ITMS must be studied.
In an electric bus, the critical elements are the lithium-ion batteries, whose operating temperature has a significant impact on safety, performance, and aging. Therefore, a battery thermal management system is essential to maintain the battery temperature between 15 and 35 °C [26]. Some studies have been published on the thermal behavior of electric bus batteries. Lajunen et al. [27] evaluated the heat loss and heat transfer between powertrain components of an electric city bus under four different driving cycles and ambient temperatures. Wu et al. [28] investigated the thermal problems that may occur in a battery pack of an electric city bus. For this purpose, a validated lumped thermal model was used, and three different driving cycles were simulated, which allowed them to determine a correlation of the heat transfer coefficient required for the battery thermal management system. Angermeier et al. [29] proposes a transient computational method to study the temperature control of liquid-based battery cells in electric buses as a function of standard and actual driving operation. The obtained results show the high thermal inertia of the system and suggest a sufficient control of the battery temperature by a quasi-steady-state cooling strategy. The above works focus on the bus battery pack; however, none of these considered all elements of the powertrain and auxiliaries, which is necessary to make accurate predictions that match real operation. Moreover, a model that includes all subsystems required for an electric bus can help evaluate different components and analyze the synergies among them.
In this study, a novel global 0D/1D model of a battery electric bus was developed. This model includes sub-models of the main powertrain components and those that play a role in the thermal management system, such as the battery pack, electric motor, HVAC system, and thermo-hydraulic circuits. Once the model was developed, it was configured to perform studies under cold operating conditions to achieve energy consumption savings. In this model, different configurations of the thermal management system were evaluated, modifying the thermohydraulic circuits to take advantage of the synergies between the different thermal components of the bus. Cabin heating systems such as electric PTC heaters and heat pumps were also compared. All simulations were performed following real driving cycles on public transport routes in Valencia, Spain.
2. Model Description
2.1. Numerical Models
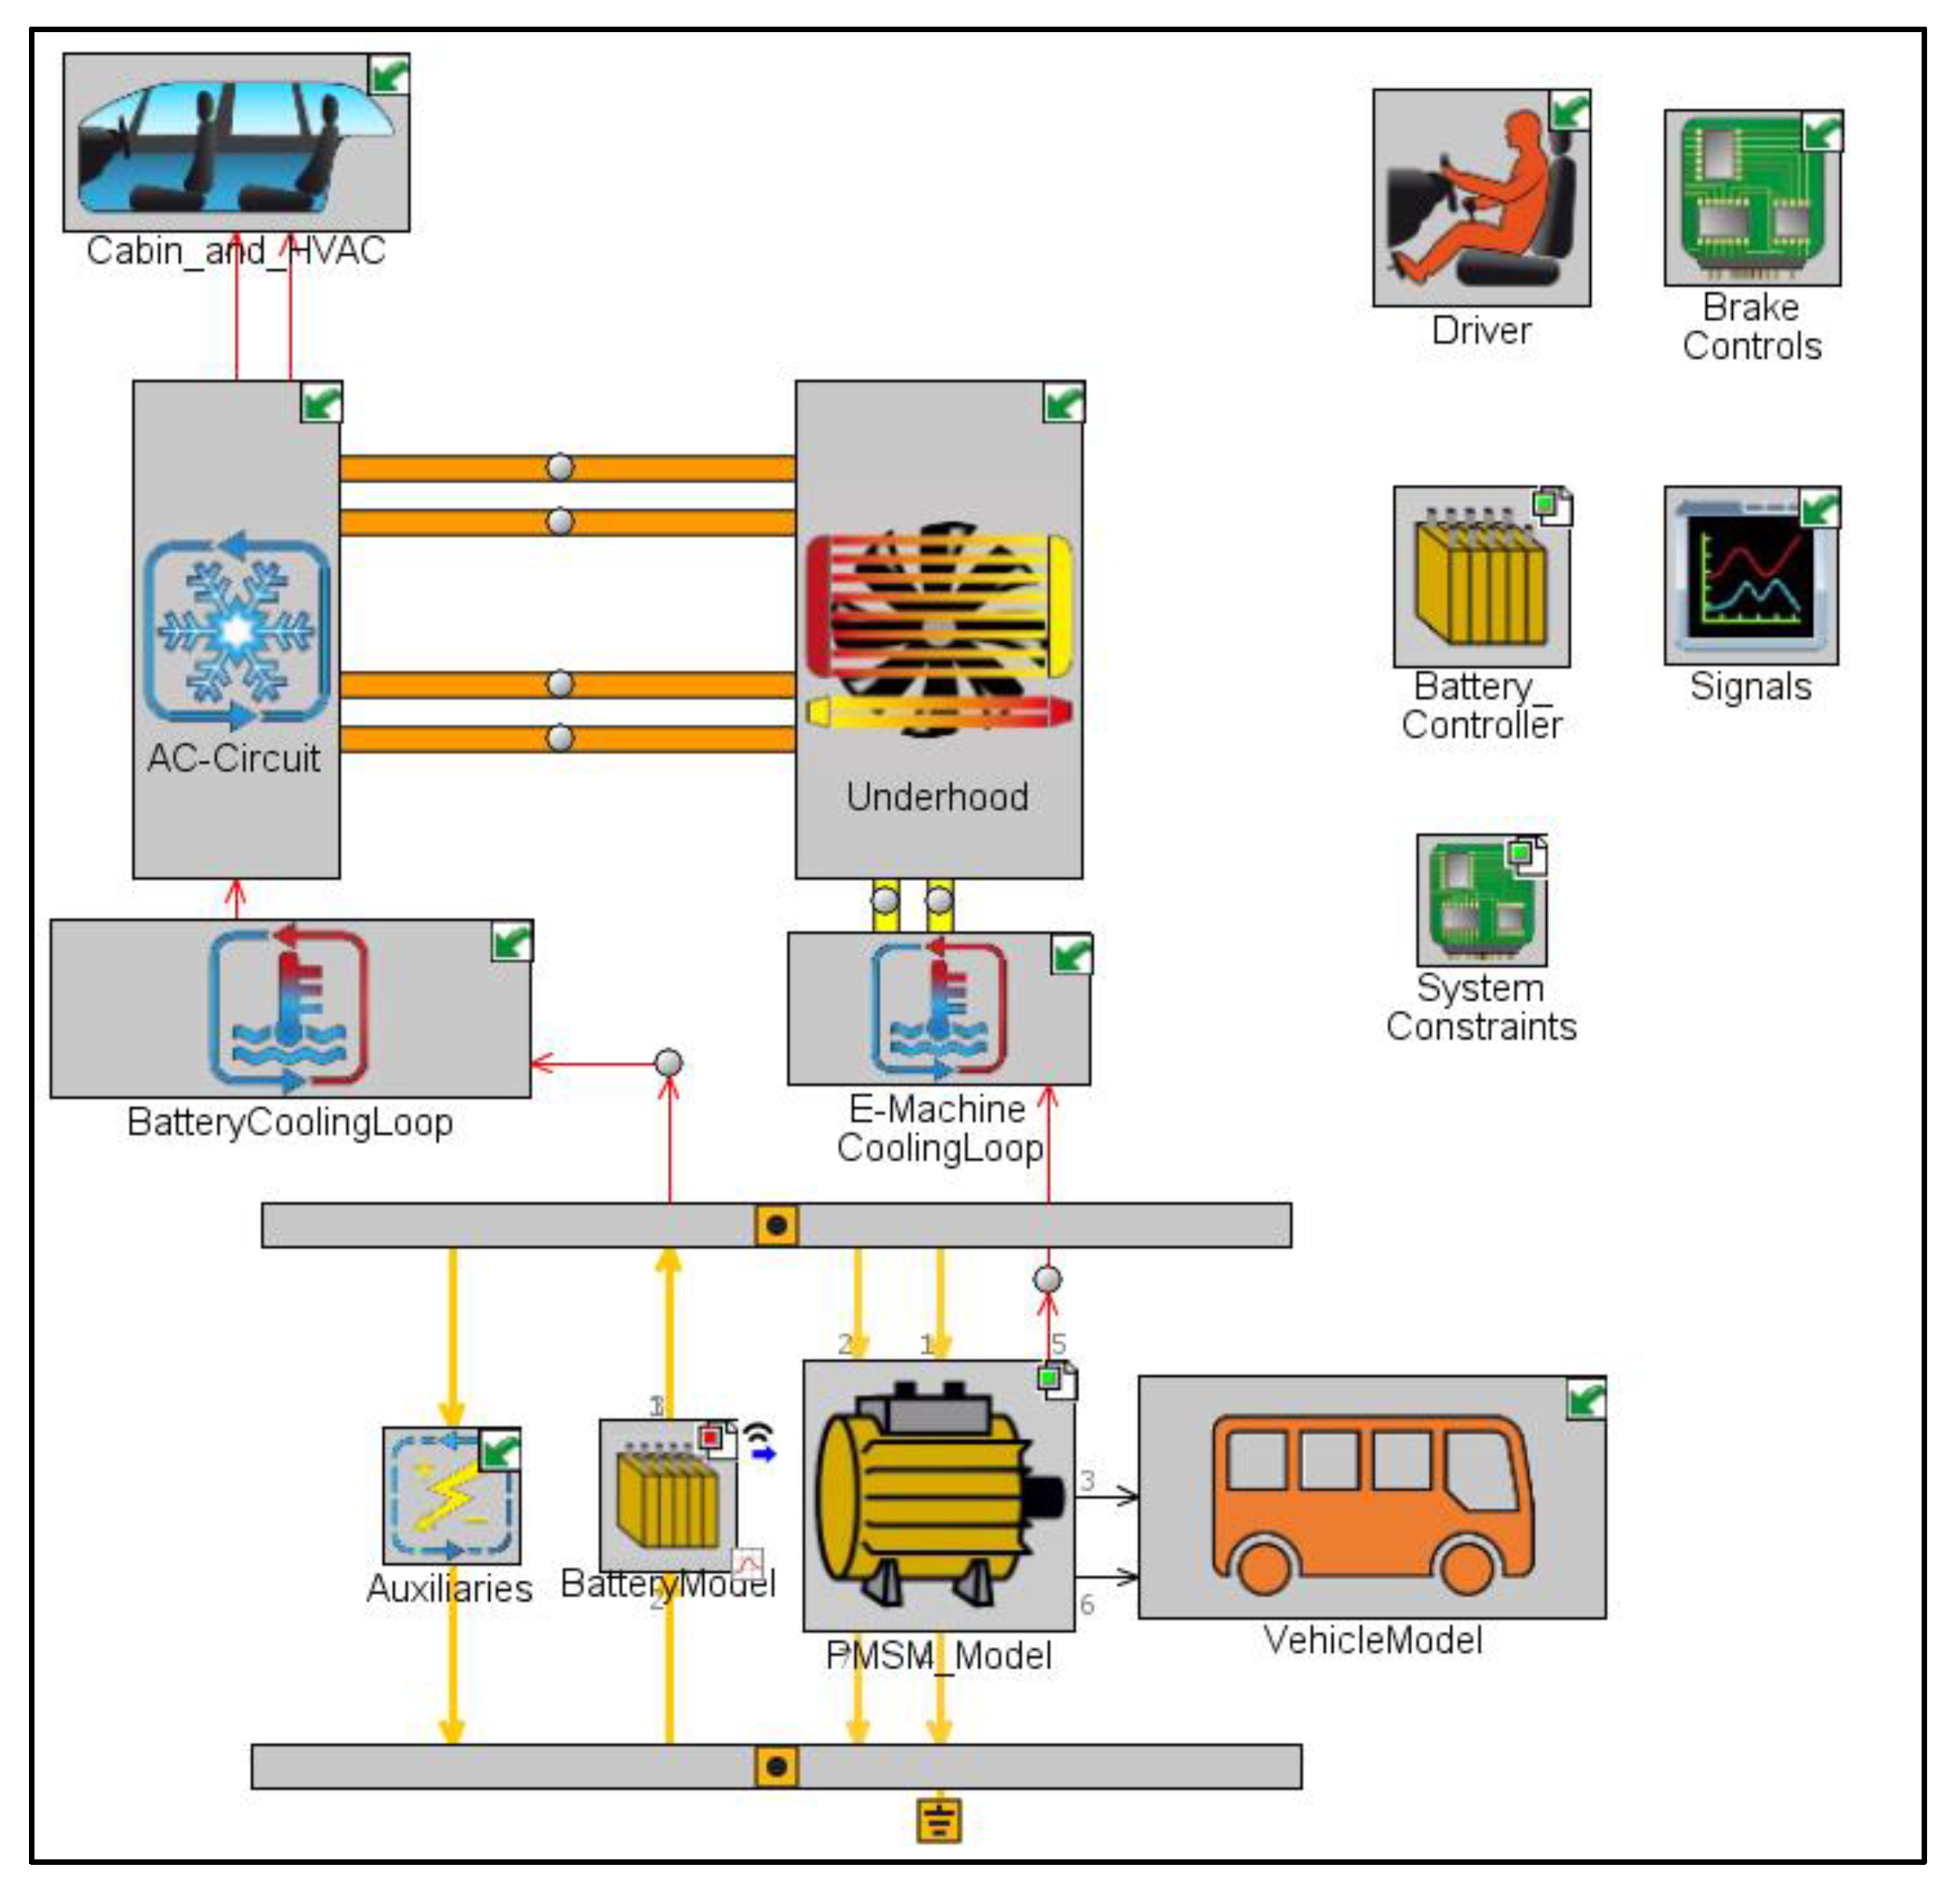
There exist several simulation environments for determining the performance of electric vehicles, hybrid electric vehicles and fuel cell electric vehicles [30,31]. However, for the integration of all the models of the electric bus components, the GT-Suite commercial software (v2020, Gamma Technologies, Westmont, IL, USA) was used. The GT-Suite package enables the simulation of the entire vehicle. This includes models of the transmission, tires, axles, clutches, etc. Moreover, the software has the necessary elements for modeling an electric vehicle, such as various electric motors, batteries, and control units. Additionally, the software has templates to model thermal management systems with their respective circuits, pumps, heat exchangers, valves, etc. Finally, the software also allows for the integration of driving cycles. Figure 1 shows the overall model of the electric bus, which contains the individual sub-models that correspond to the essential components of the battery electric bus. This model was inspired by a preloaded example of the GT-Suite library, from which the model skeleton was taken as a starting point for the final model developed in this study.
2.1.1. Considered City Bus
For this study, the bus was modeled with the characteristics of the BYD K9UB-DW model. This is a 12-meter-long city bus with a capacity of up to 88 passengers. It is powered by lithium-ion batteries and has two permanent magnet synchronous motors (PMSM), each coupled to a wheel on the rear of the bus. Table 1 shows additional details of the aforementioned bus.
2.1.2. Thermohydraulic Circuits Models
The main objective of thermal management is to ensure that all components of a system operate within optimal temperature ranges. In an electric vehicle, each component has different thermal requirements. In the case of electric motors, the thermal management system must ensure that the temperature in the various elements of the motor does not exceed a certain limit for safety and aging reasons [32].
For batteries, the upper-temperature limit is lower than the motor because of the risk of thermal runaway, which is why thermal management of this element is important [33,34]. In addition, the performance of batteries is dependent on the operating temperature; thus, at lower temperatures, the internal resistance of the battery is greater, resulting in degraded performance [35]. Furthermore, the life of the batteries is significantly shortened by operating at very low temperatures due to lithium plating effects [36].
In a mass transport vehicle such as a city bus, the thermal comfort of the passengers is especially important, and this requires an air conditioning system represented by the thermal management system for the air in the cabin and operates at different temperatures than the other vehicle thermal systems mentioned above.
In addition to component safety and performance, the second major goal of thermal management systems is to minimize the energy consumption of the auxiliary units and, thus, improve the overall efficiency of the vehicle.
Taking all this into account, in the present study, two thermal management systems for an electric city bus were considered. The first is the original and the most straightforward configuration for the considered bus. It consists of two independent hydraulic circuits, one for cooling the battery and the other for cooling the electric motor. In this paper, this configuration is referred to as “Baseline”. The second configuration has a single water–glycol hydraulic circuit responsible for cooling the electric motor and the battery. In this study, this configuration is called “Connected”.
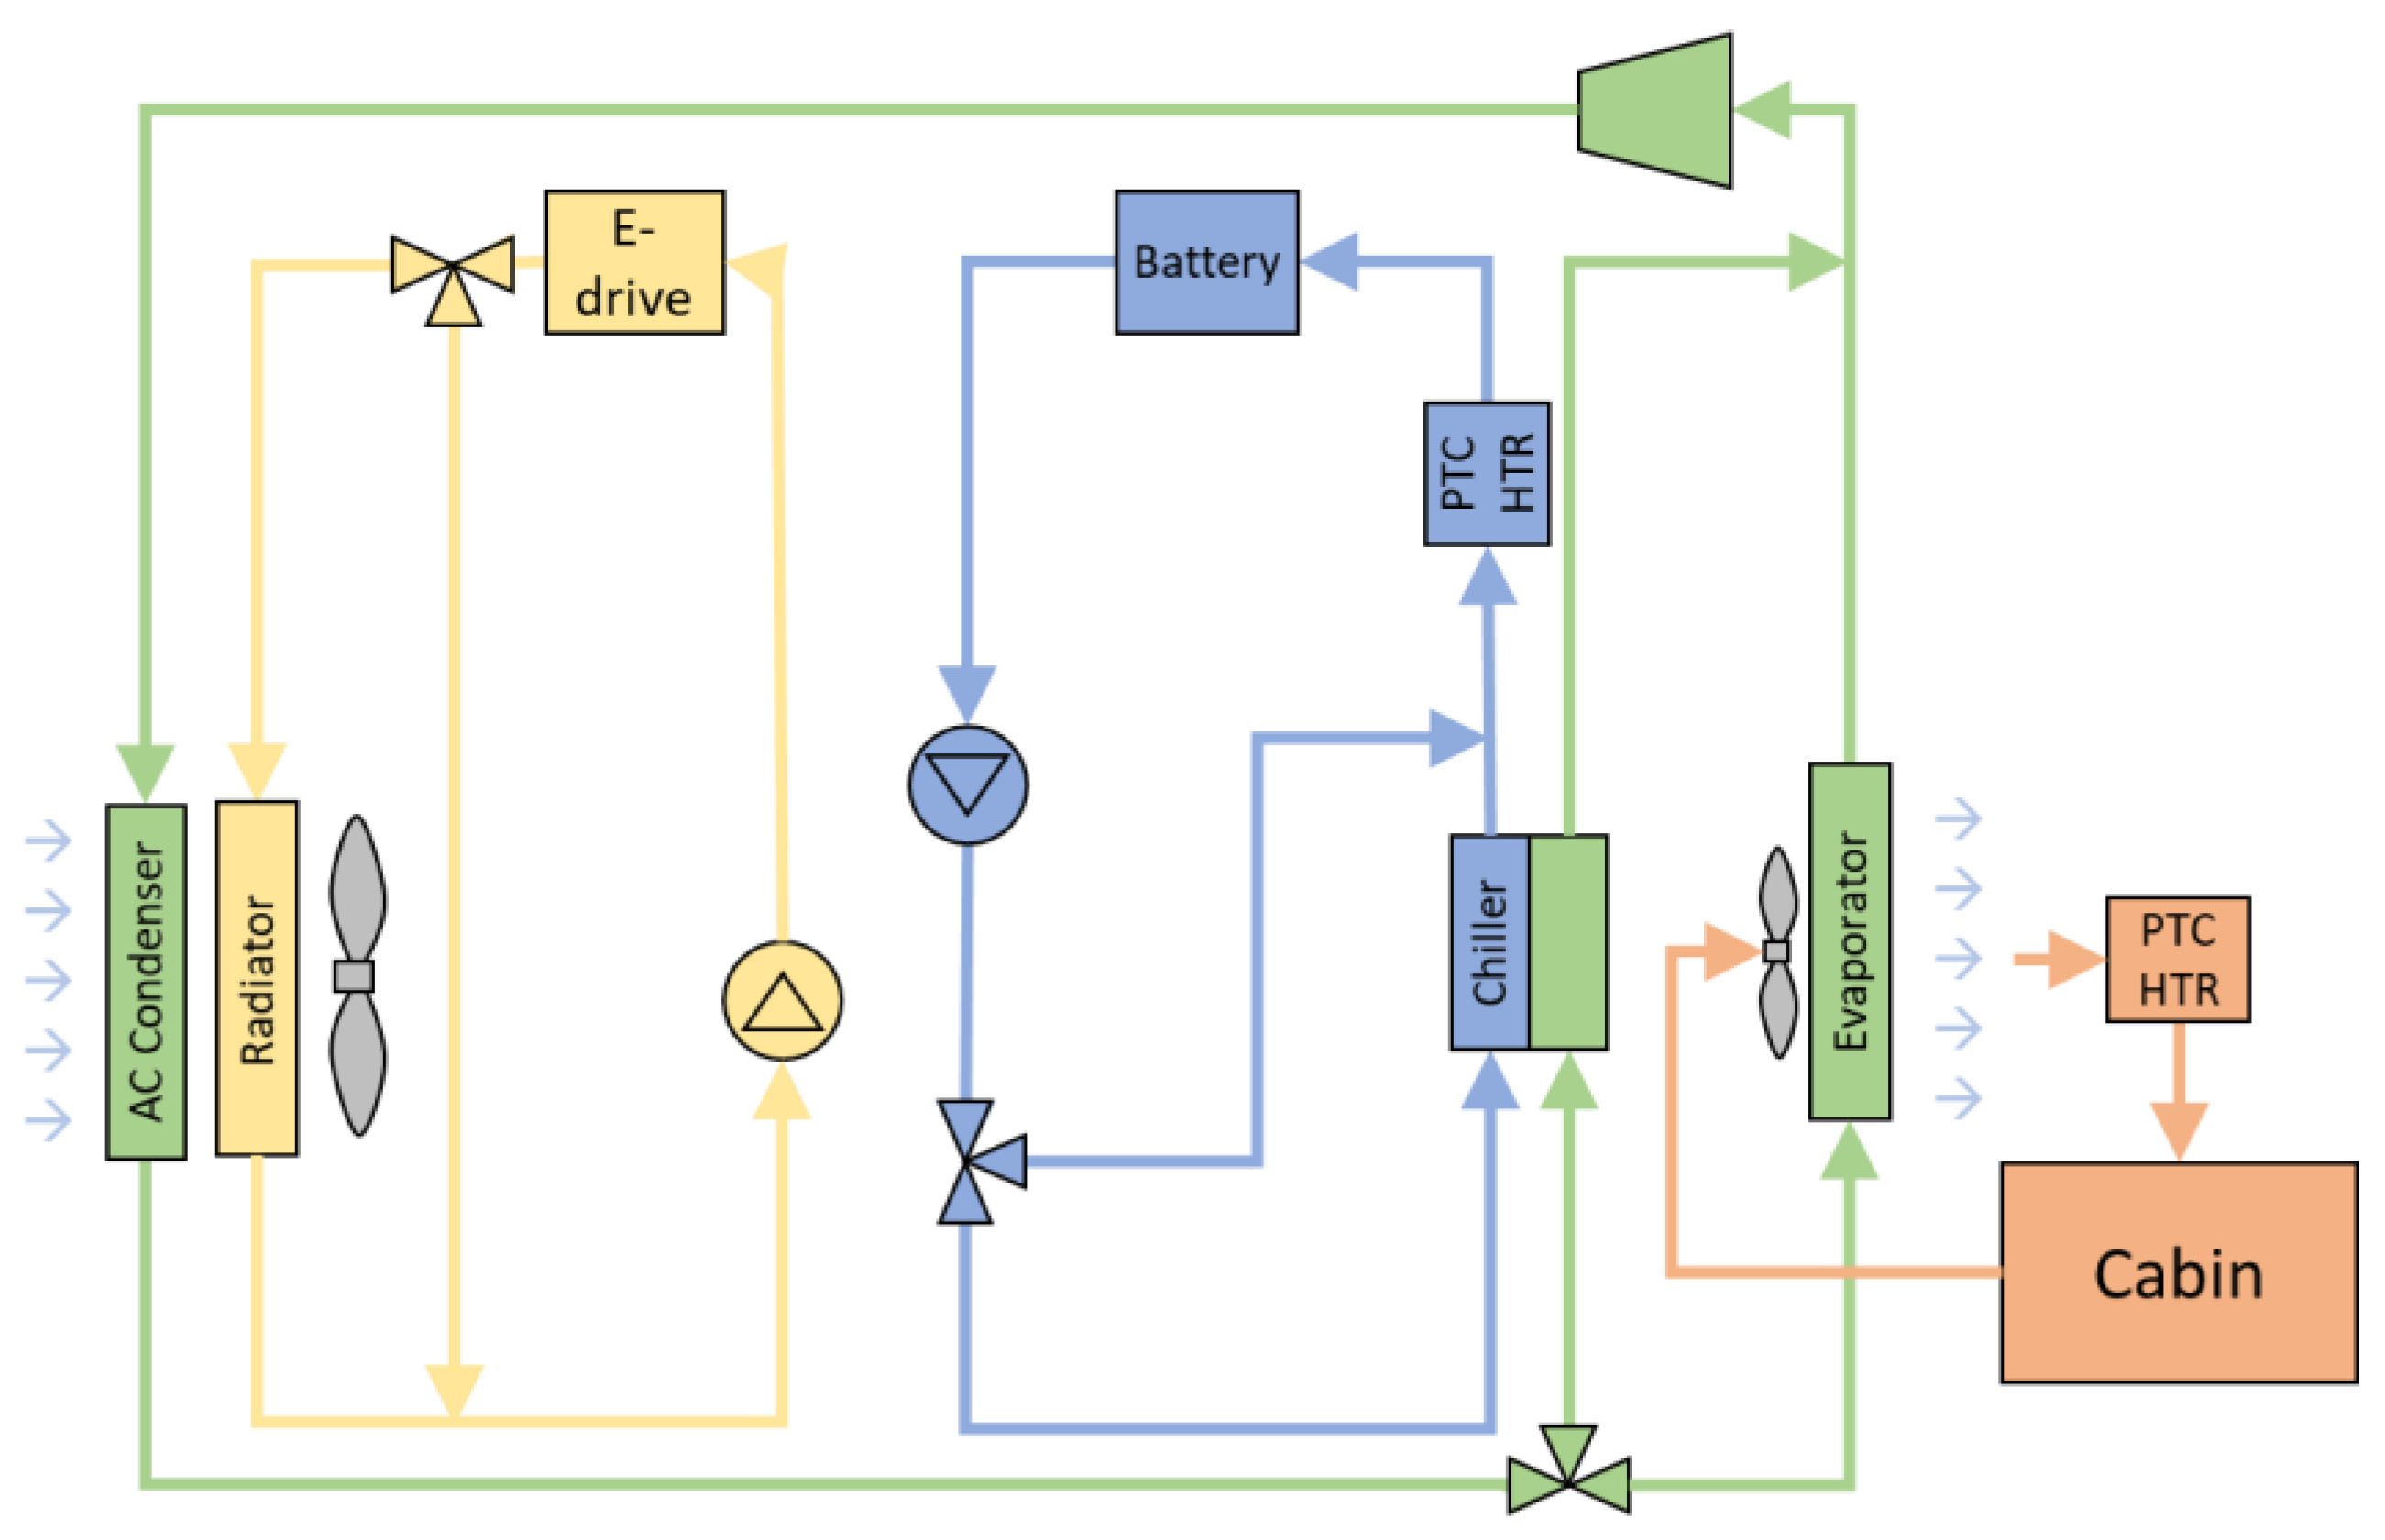
Figure 2 shows a schematic representation of the Baseline configuration, which consists of four circuits represented by colors: yellow is the circuit for cooling the electric motor, blue is the circuit for cooling the battery, green is the refrigerant circuit of air conditioning system, and orange is the air circuit of the cabin.
The water–glycol circuit for cooling the electric motor consists of a pump that regulates the flow rate and a three-way valve at the outlet of the electric motor that directs the fluid to a radiator when it is necessary to lower the temperature of the electric machine or bypass the flow when it is not needed. Initially, the valve is closed and the coolant circulates through the bypass. If the motor casing temperature reaches 45 °C, the valve allows the coolant to flow to the radiator.
The battery cooling circuit, such as that of the electric motor, is a water–glycol circuit with a hydraulic pump and a three-way valve that directs the fluid to a chiller that exchanges heat with the air conditioning system when the battery needs to be cooled and bypasses it in any other case. Initially, the valve is closed, and the coolant circulates through the bypass. If the battery temperature reaches a temperature of 35 °C, the valve allows for the flow of coolant to the chiller. In addition, this circuit has an electric PTC heater to preheat the battery in wintry weather conditions. As long as the battery temperature is less than 15 °C, the PTC electric heater will be on, constantly operating at a power of 15 kW.
The air-conditioning circuit uses R134a as refrigerant and has the typical components of a refrigeration cycle: compressor, condenser, expansion valve and evaporator. The only customized feature is that it consists of an additional branch with an expansion valve and a shell-and-tube heat exchanger, which, as already mentioned, exchanges heat with the battery cooling circuit. The compressor rotation speed is controlled by a PID controller, which senses the cabin temperature and regulates it to reach the target cabin temperature. The thermal expansion valve (TXV) is configured to ensure a superheated state at the evaporator outlet, maintaining a temperature difference of 5 K between the saturation temperature and the temperature measured at the evaporator outlet. This circuit will be discussed in more detail later in the section on the HVAC model.
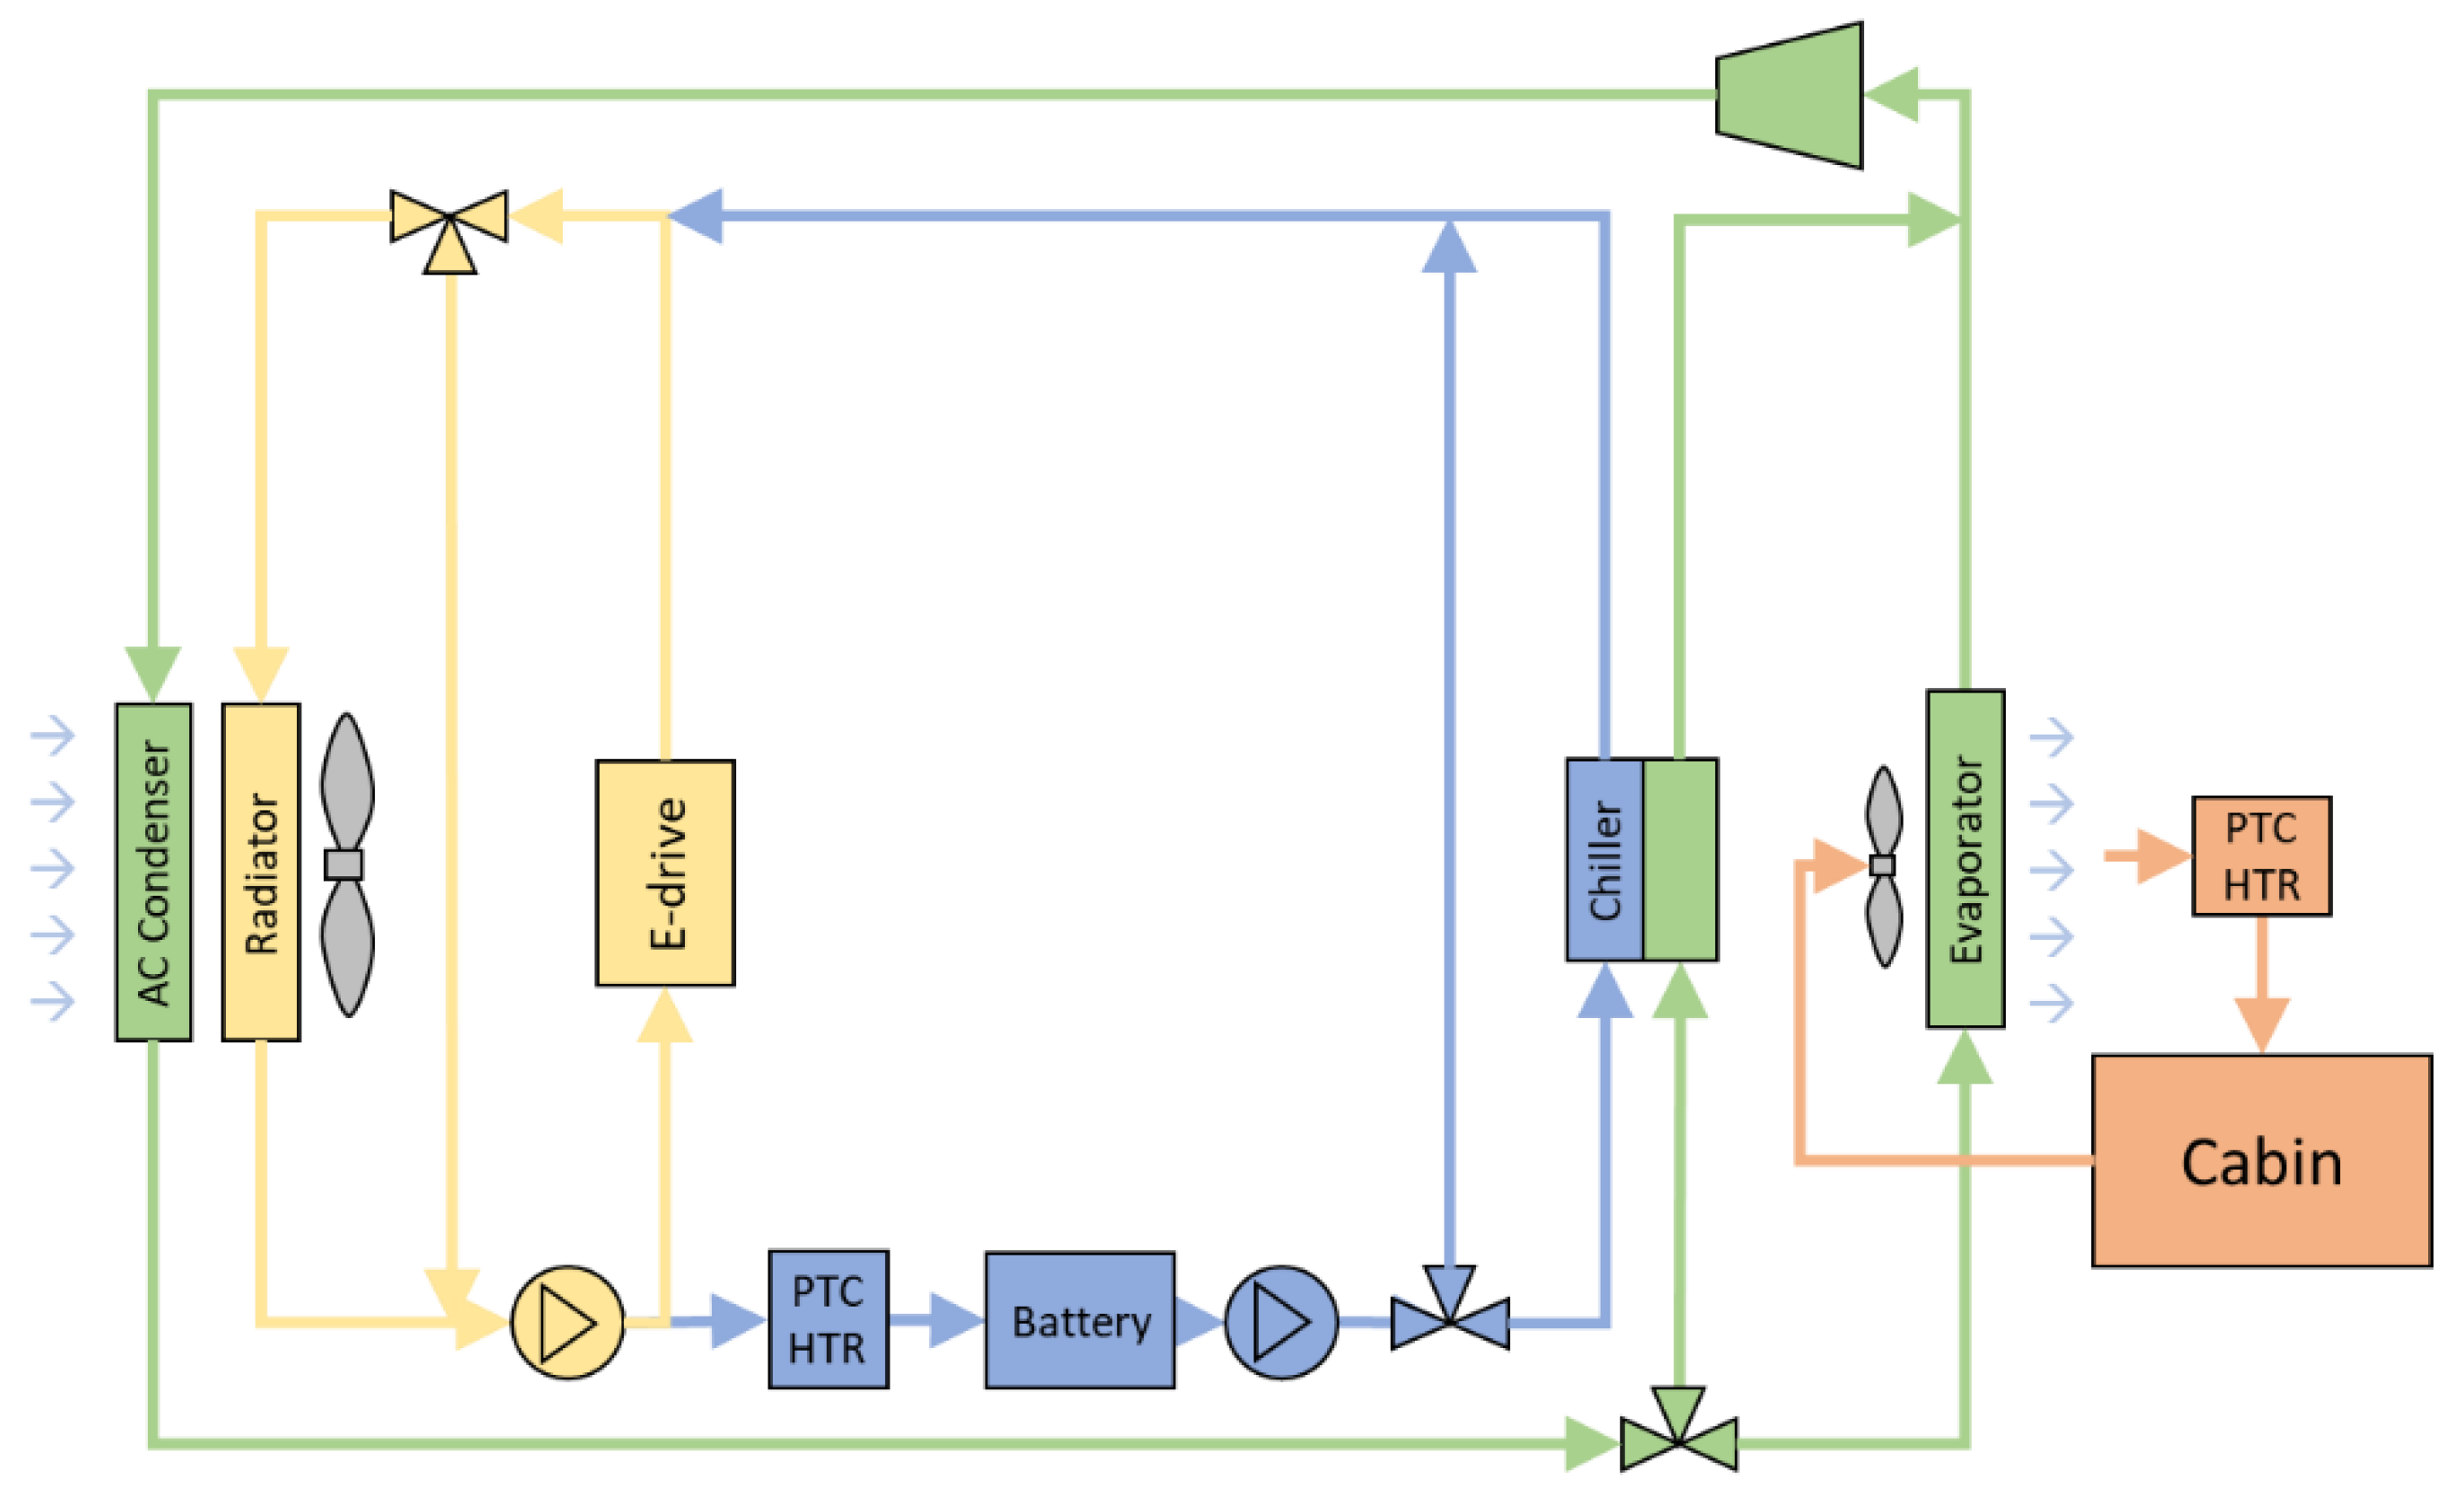
In order to exploit the synergies between different thermal systems such as the electric motor and the batteries, the Connected configuration shown in Figure 3 was developed. In this configuration, both thermal–hydraulic circuits are connected. In this concept, the heat generated by the electric motor can be used to preheat the bus battery in winter. Control of this configuration works similarly to the Baseline configuration. This configuration only achieves advantages in cold weather conditions, when it is necessary to heat the subsystems and quickly reach their optimum operating point.
2.1.3. Vehicle Model
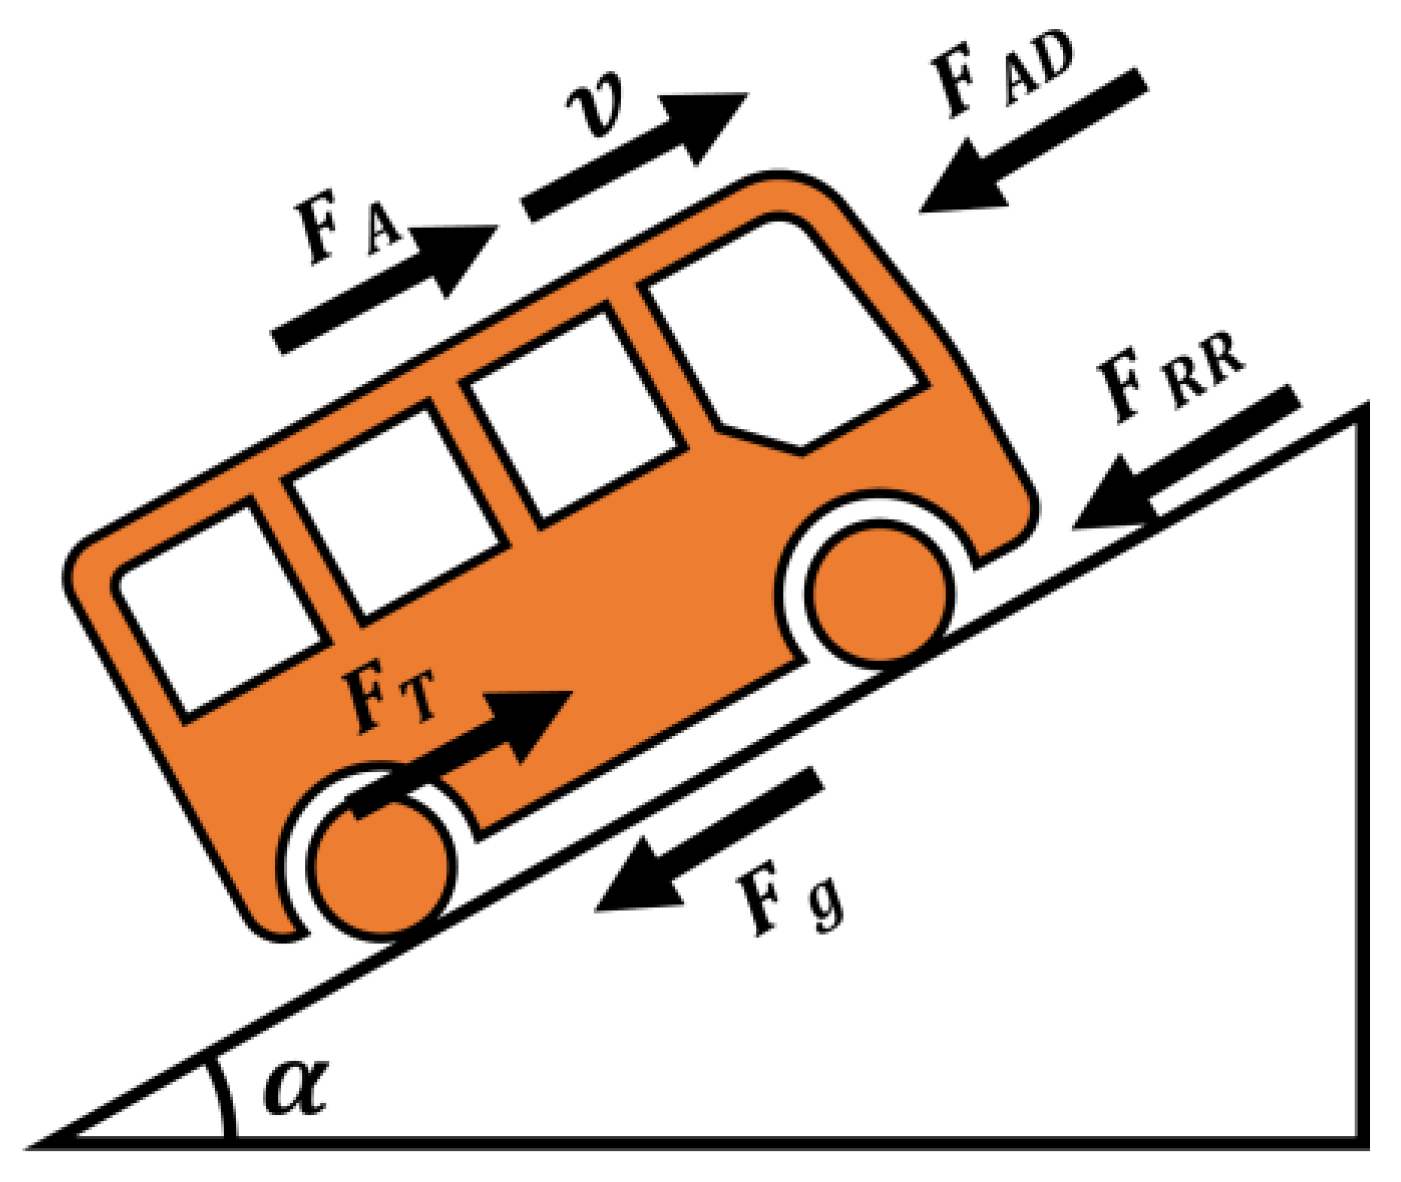
The physical model of the vehicle consists of mathematical expressions for determining the required tractive force based on a one-dimensional movement. This allows for the calculation of the power required by the electric motor at each second for the specified driving cycle. Figure 4 shows the forces acting on the body of the bus as it moves.
The calculation of the tractive force () as a function of the other forces acting on the body of the bus is described in Equation (1), where corresponds to the acceleration and deceleration forces of the vehicle; represents the aerodynamic drag force; represents the rolling resistance; and represents the gravitational force.
The acceleration or deceleration force is determined from Equation (2).
where and are the mass and acceleration of the vehicle, respectively.
The aerodynamic drag force is determined from Equation (3).
where is the drag coefficient of the bus (-); is the frontal area of the vehicle (m2); is the air density (kg/m3); and is the speed of the bus (m/s).
The rolling resistance is calculated with Equation (4).
where is the acceleration due to gravity; is the rolling resistance coefficient; and is the slope of the path.
The gravitational force is determined by Equation (5).
The torque generated by the electric motor () is the source of the tractive force transmitted by the differential and the axle to the wheels of the vehicle and is determined with Equation (6).
where is the radius of the wheel; is the gear ratio between the electric motor and the wheel; and is the mechanical efficiency. Table 2 summarizes the values to model the vehicle dynamics of the bus.
2.1.4. Battery Model
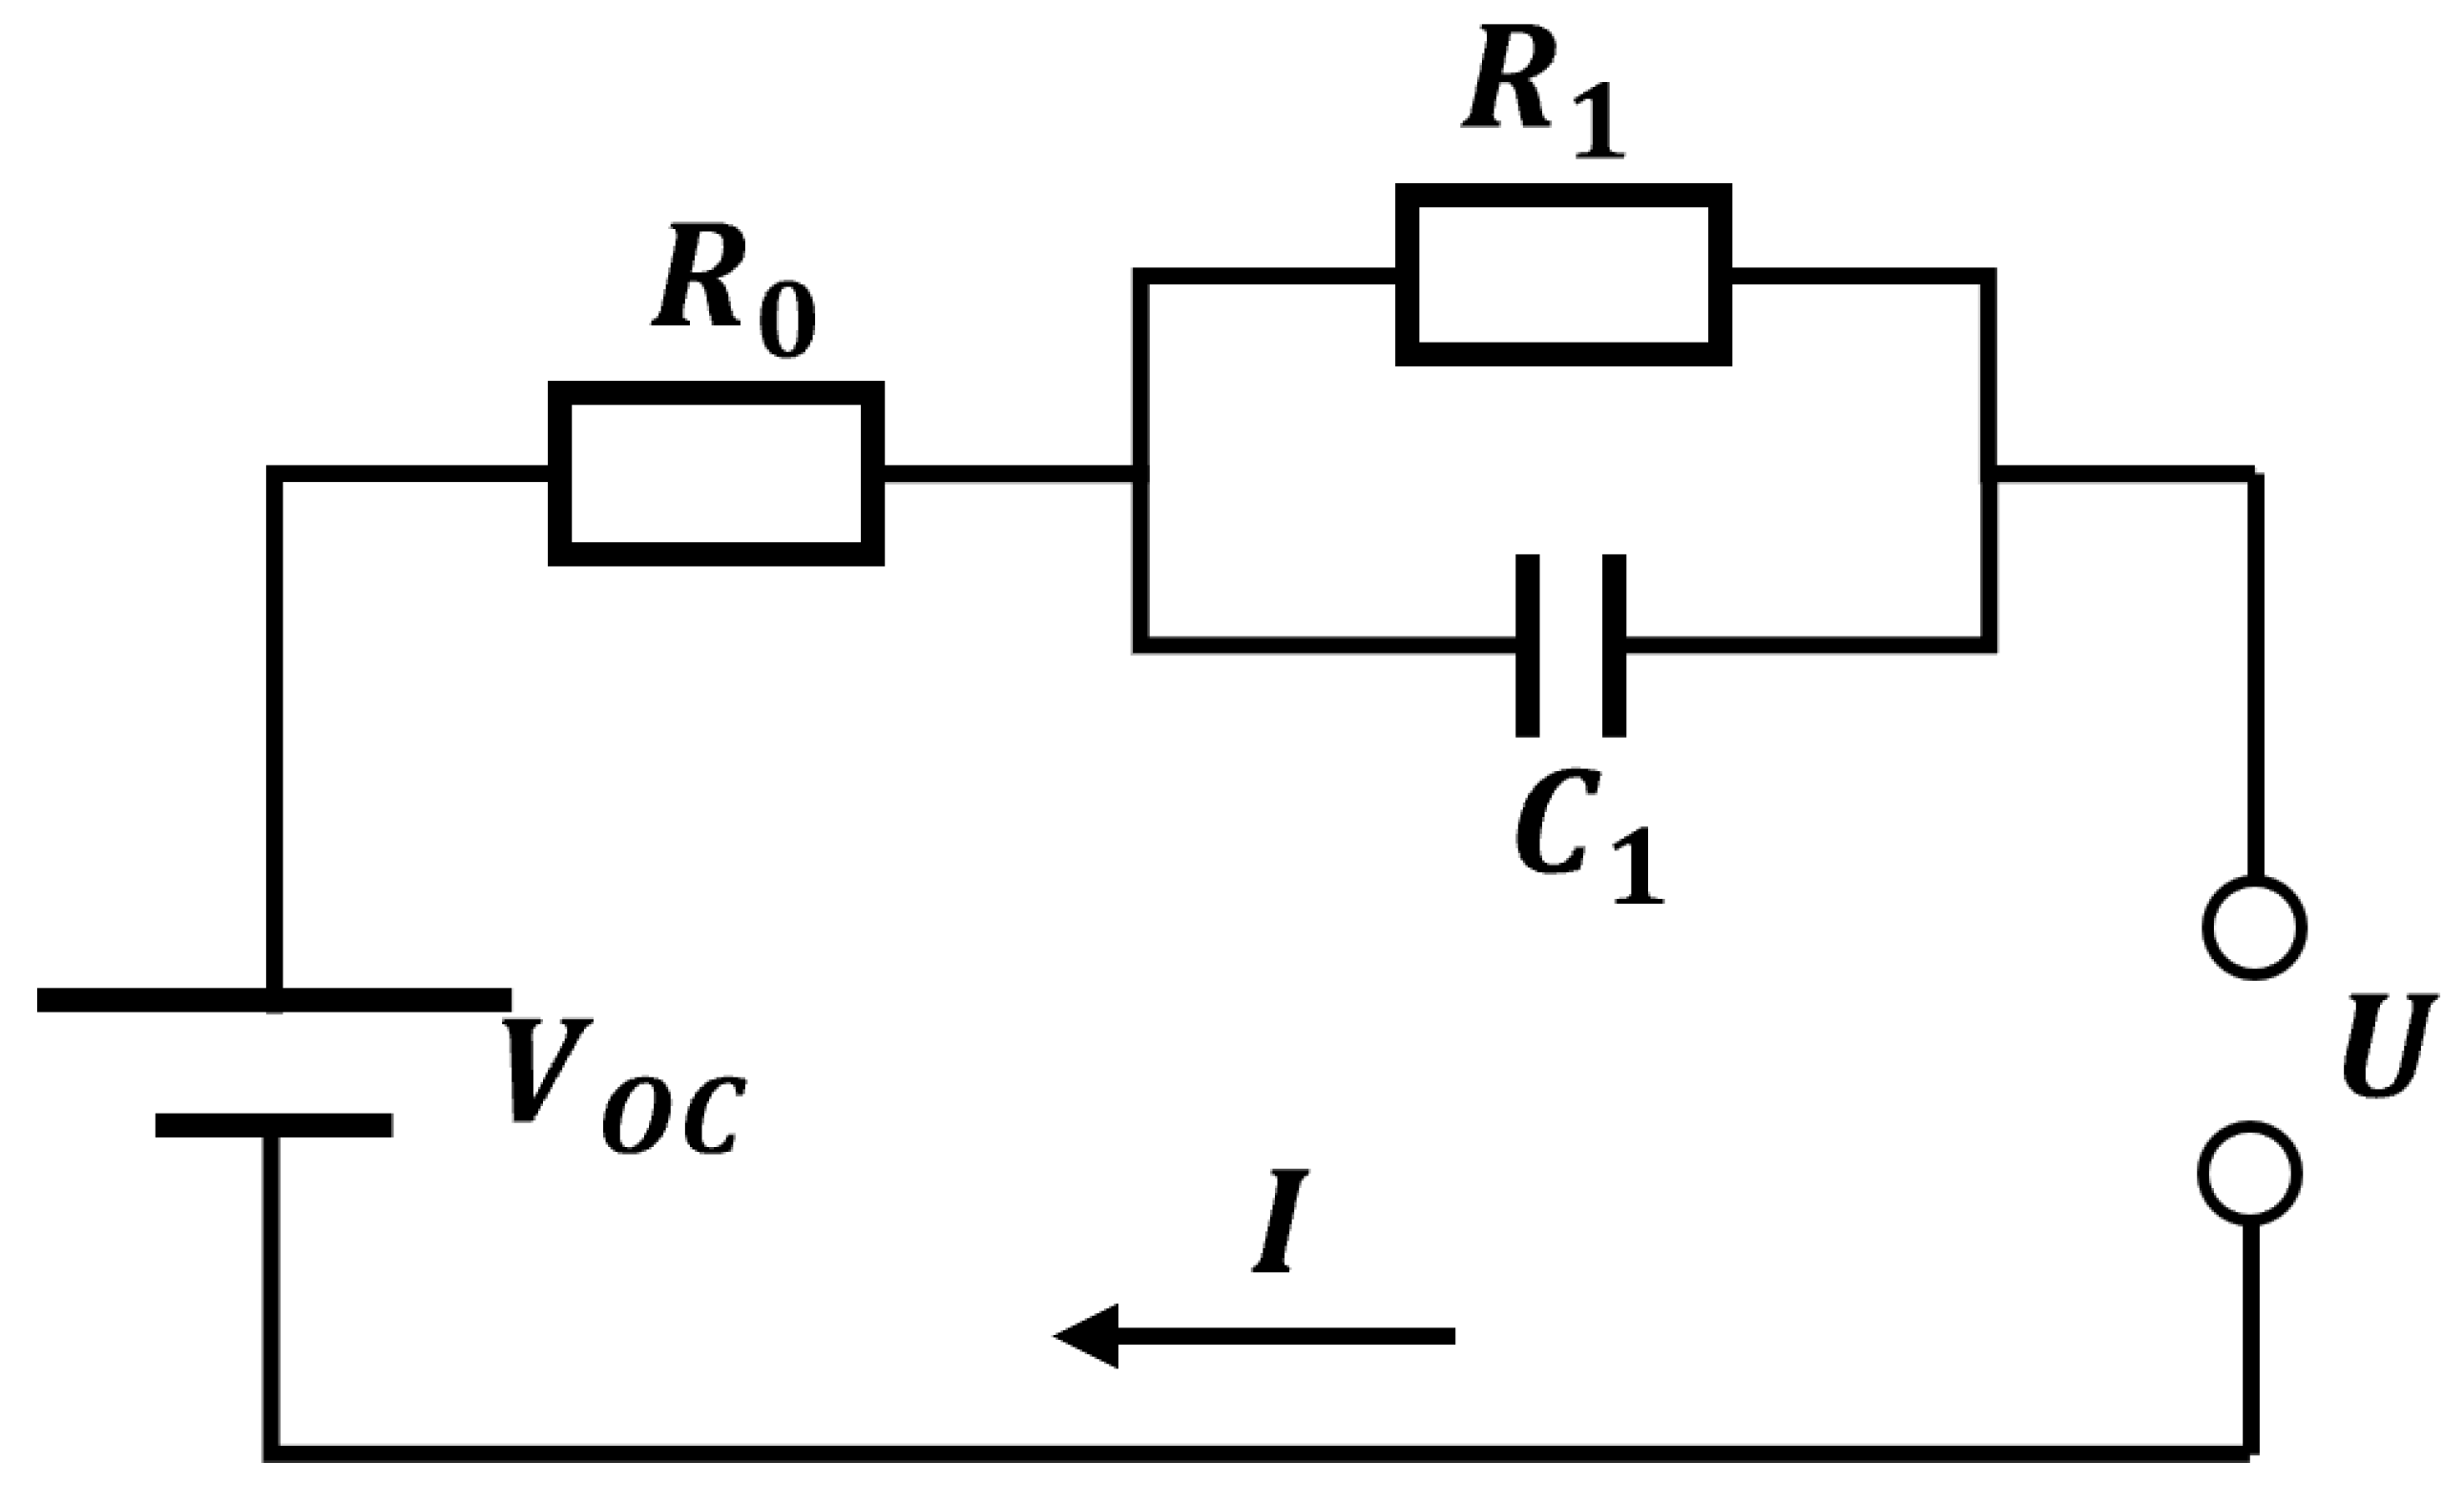
The lithium-ion battery pack was modeled in GT-Suite through available lithium-ion battery model libraries using a first-order equivalent circuit model. It was decided to use a first-order model, as it is simple and gives good results. Higher-order models would provide more accurate estimates; however, for our case study, a first-order model is sufficient to model the bus battery. In addition, the first-order model is ideal for integration into the global model, as using more complex models would require more computational cost [37].
This model electrically represents the battery as an electrical circuit containing a voltage source, resistors and capacitors that simulate the dynamic behavior of a battery [38]. Figure 5 shows a schematic of a first-order equivalent circuit model where represents the open circuit voltage of the lithium-ion battery, is associated with the ohmic resistance of the lithium-ion battery, and denote the polarization resistance and capacitance, respectively, represents the current flowing through the load, which can be measured directly, and is the terminal voltage of the battery and can also be measured directly.
Since the bus was not available, and the specific model of the battery cells was not known, the following methodology was established to develop and validate the battery model:
- (1)
- An experimental campaign was conducted to characterize an available battery cell.
- (2)
- After the characterization, the model was validated electrically and thermally under transient operating conditions with experimental measurements.
- (3)
- Finally, an arrangement of cells was defined to form a battery pack with similar characteristics to the reference bus.
The battery cell available for measurement was a 100 Ah nominal capacity prismatic aluminum shell lithium-ion battery (details in Table 3). In addition, the battery is a lithium iron phosphate battery (LFP), using lithium iron phosphate (LiFePO4) as the cathode material and a graphitic carbon electrode with a metallic backing as the anode.
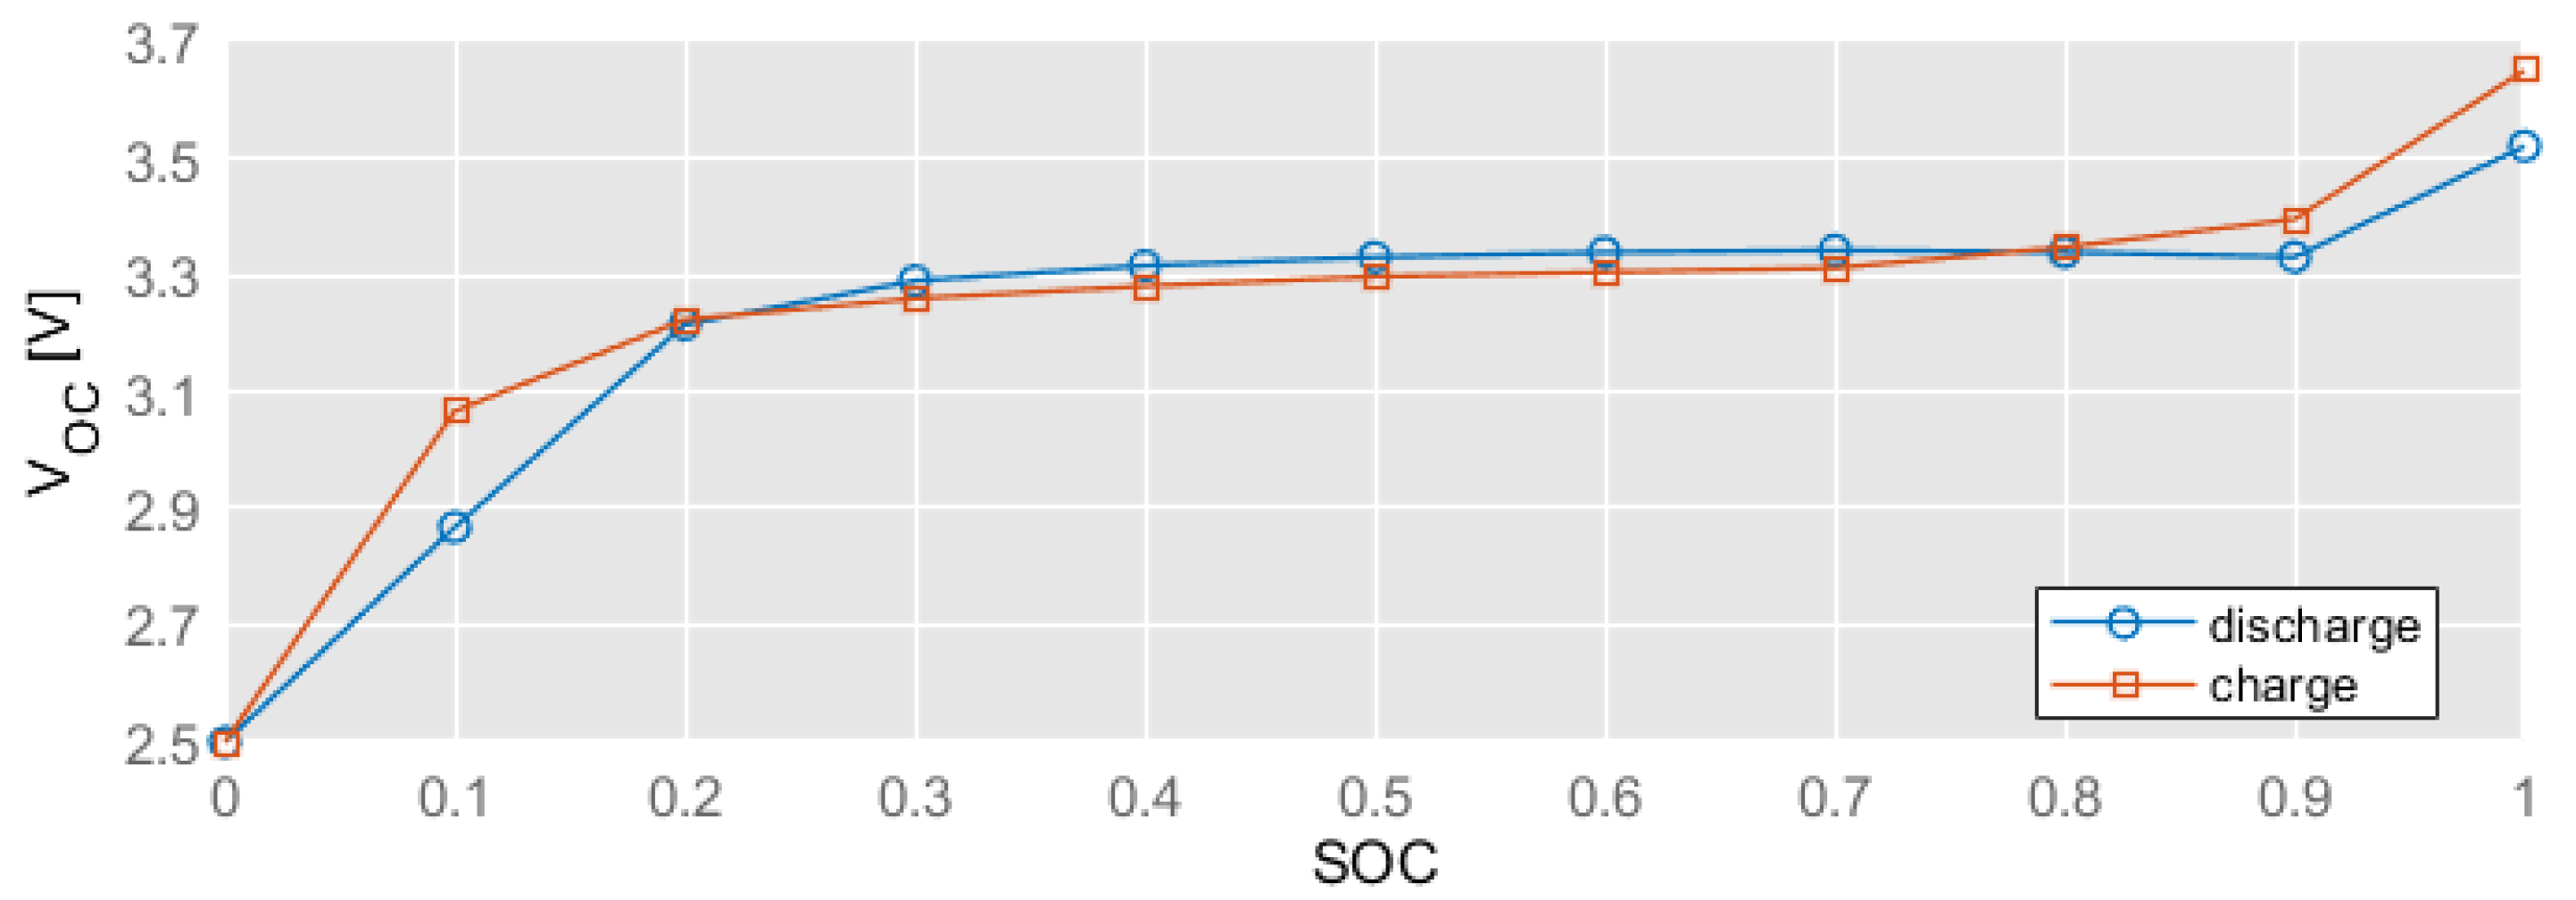
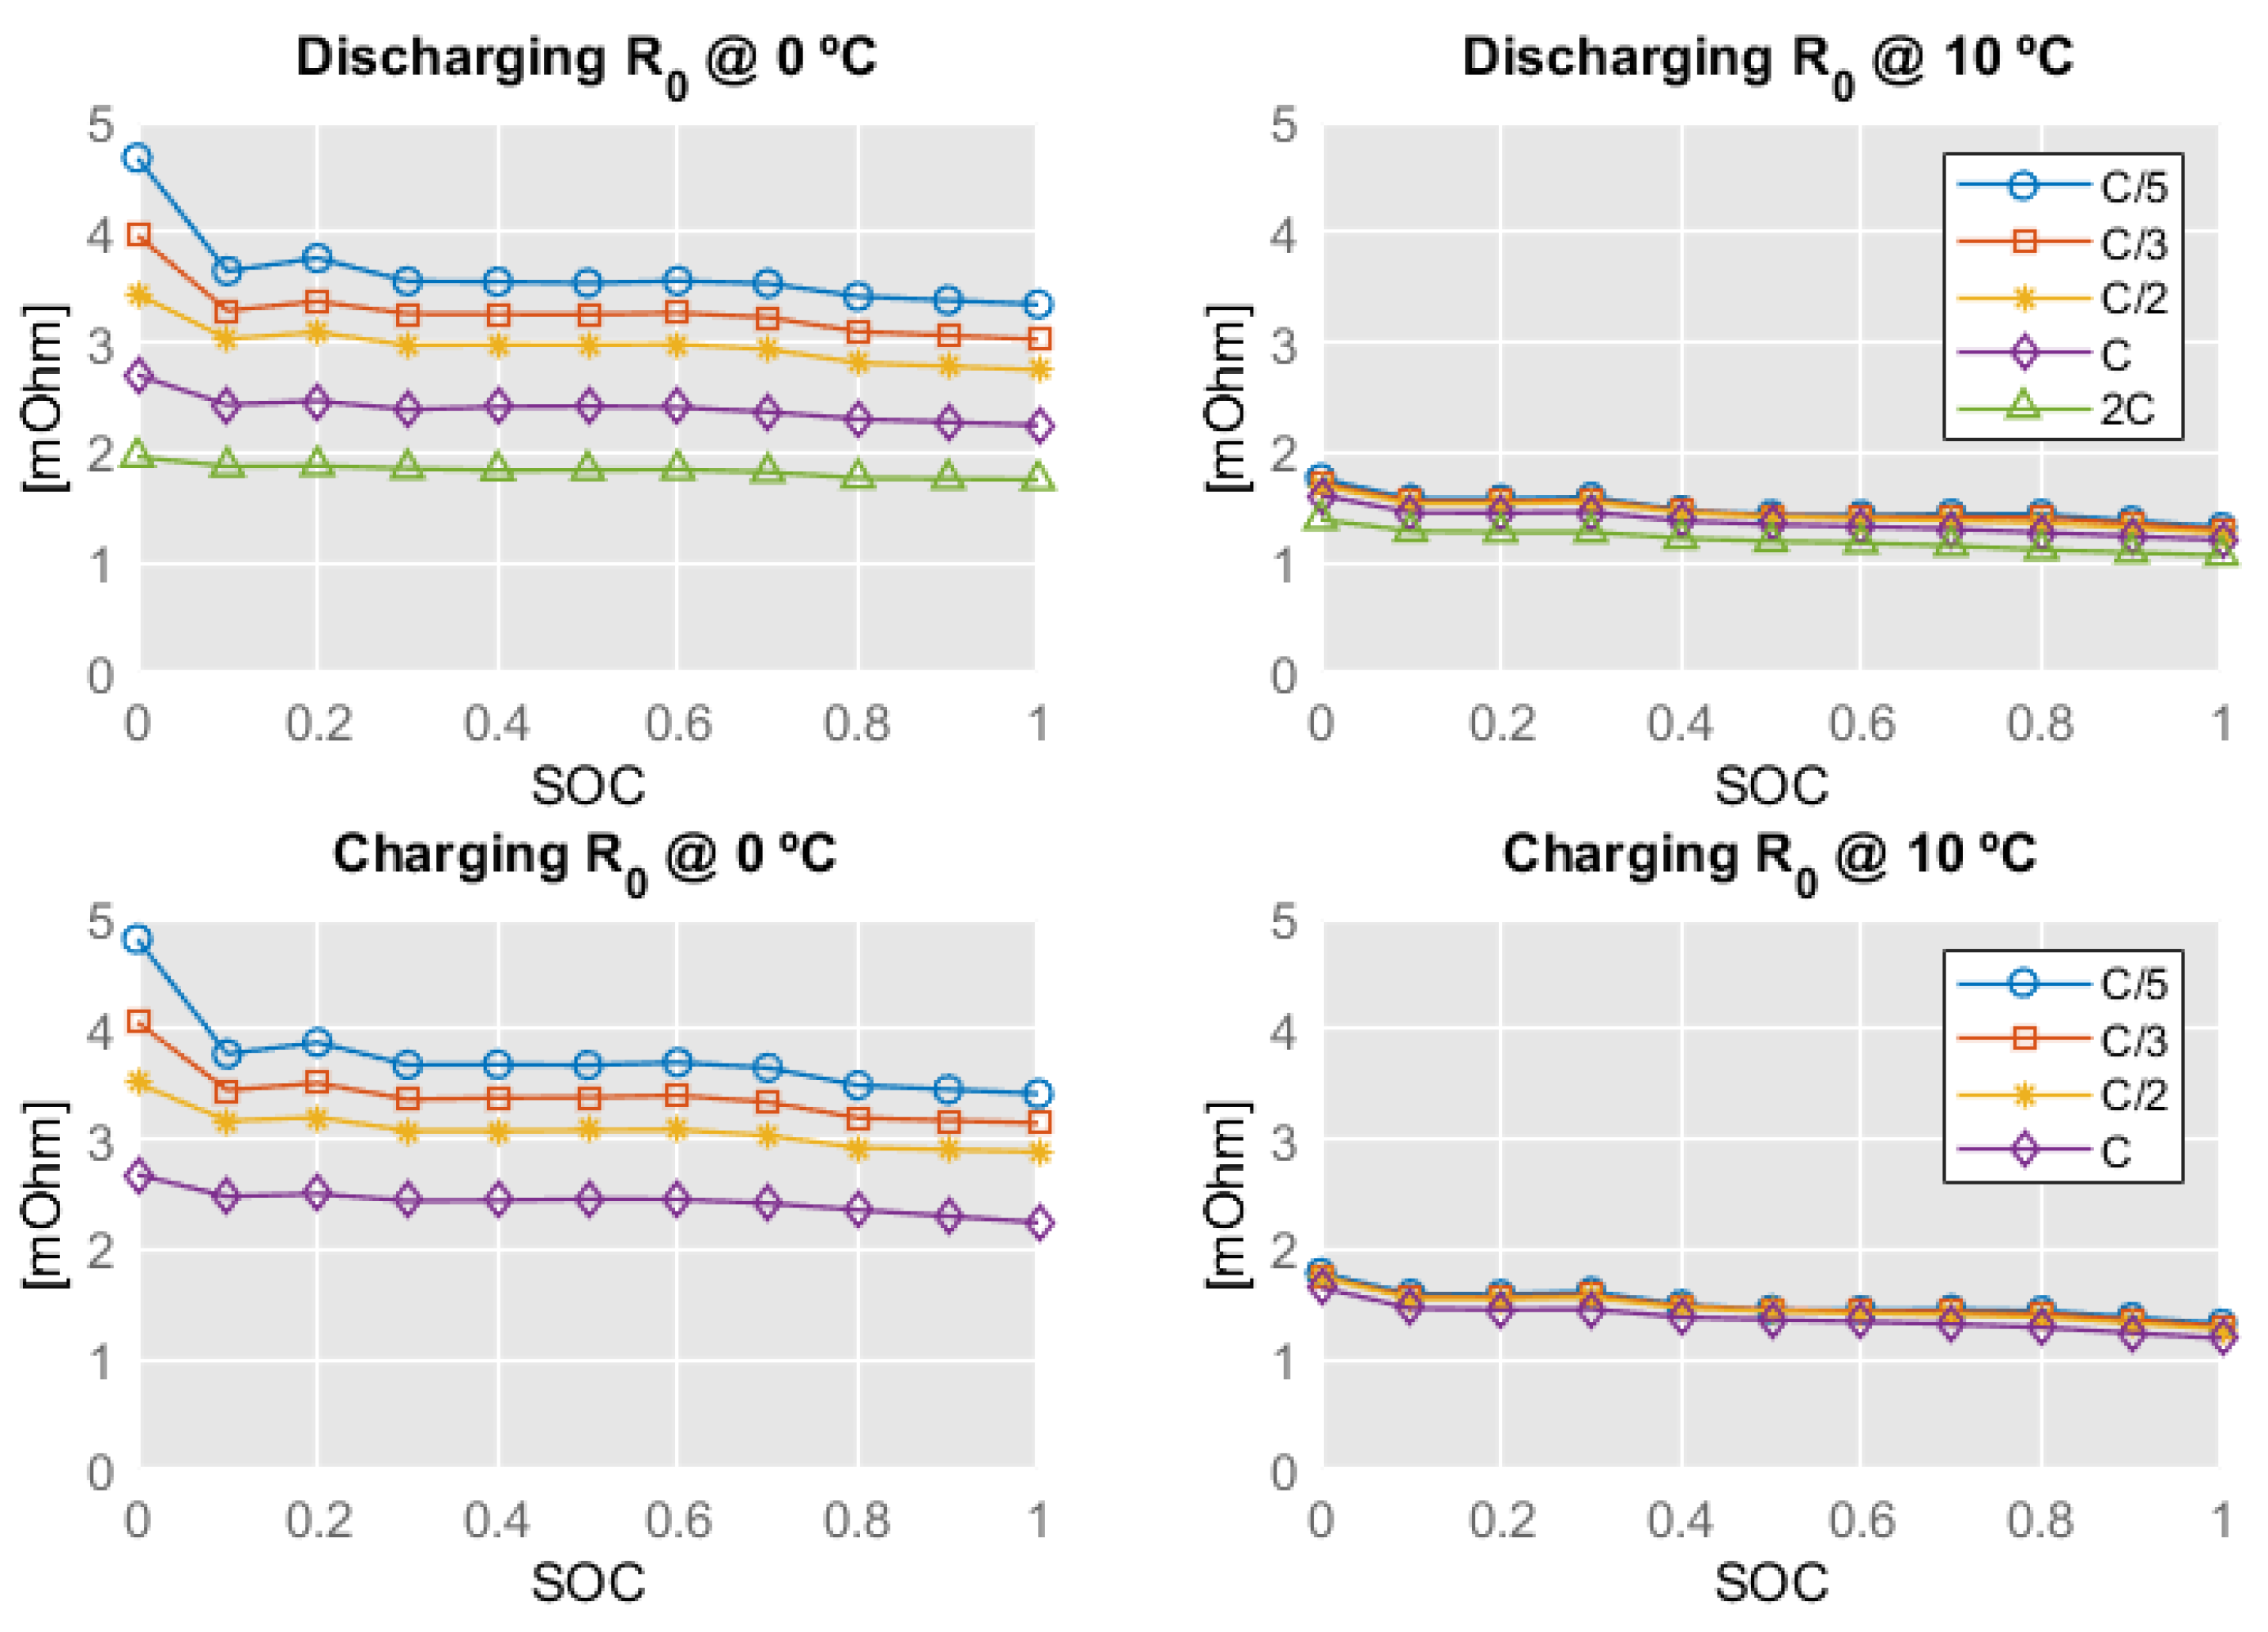
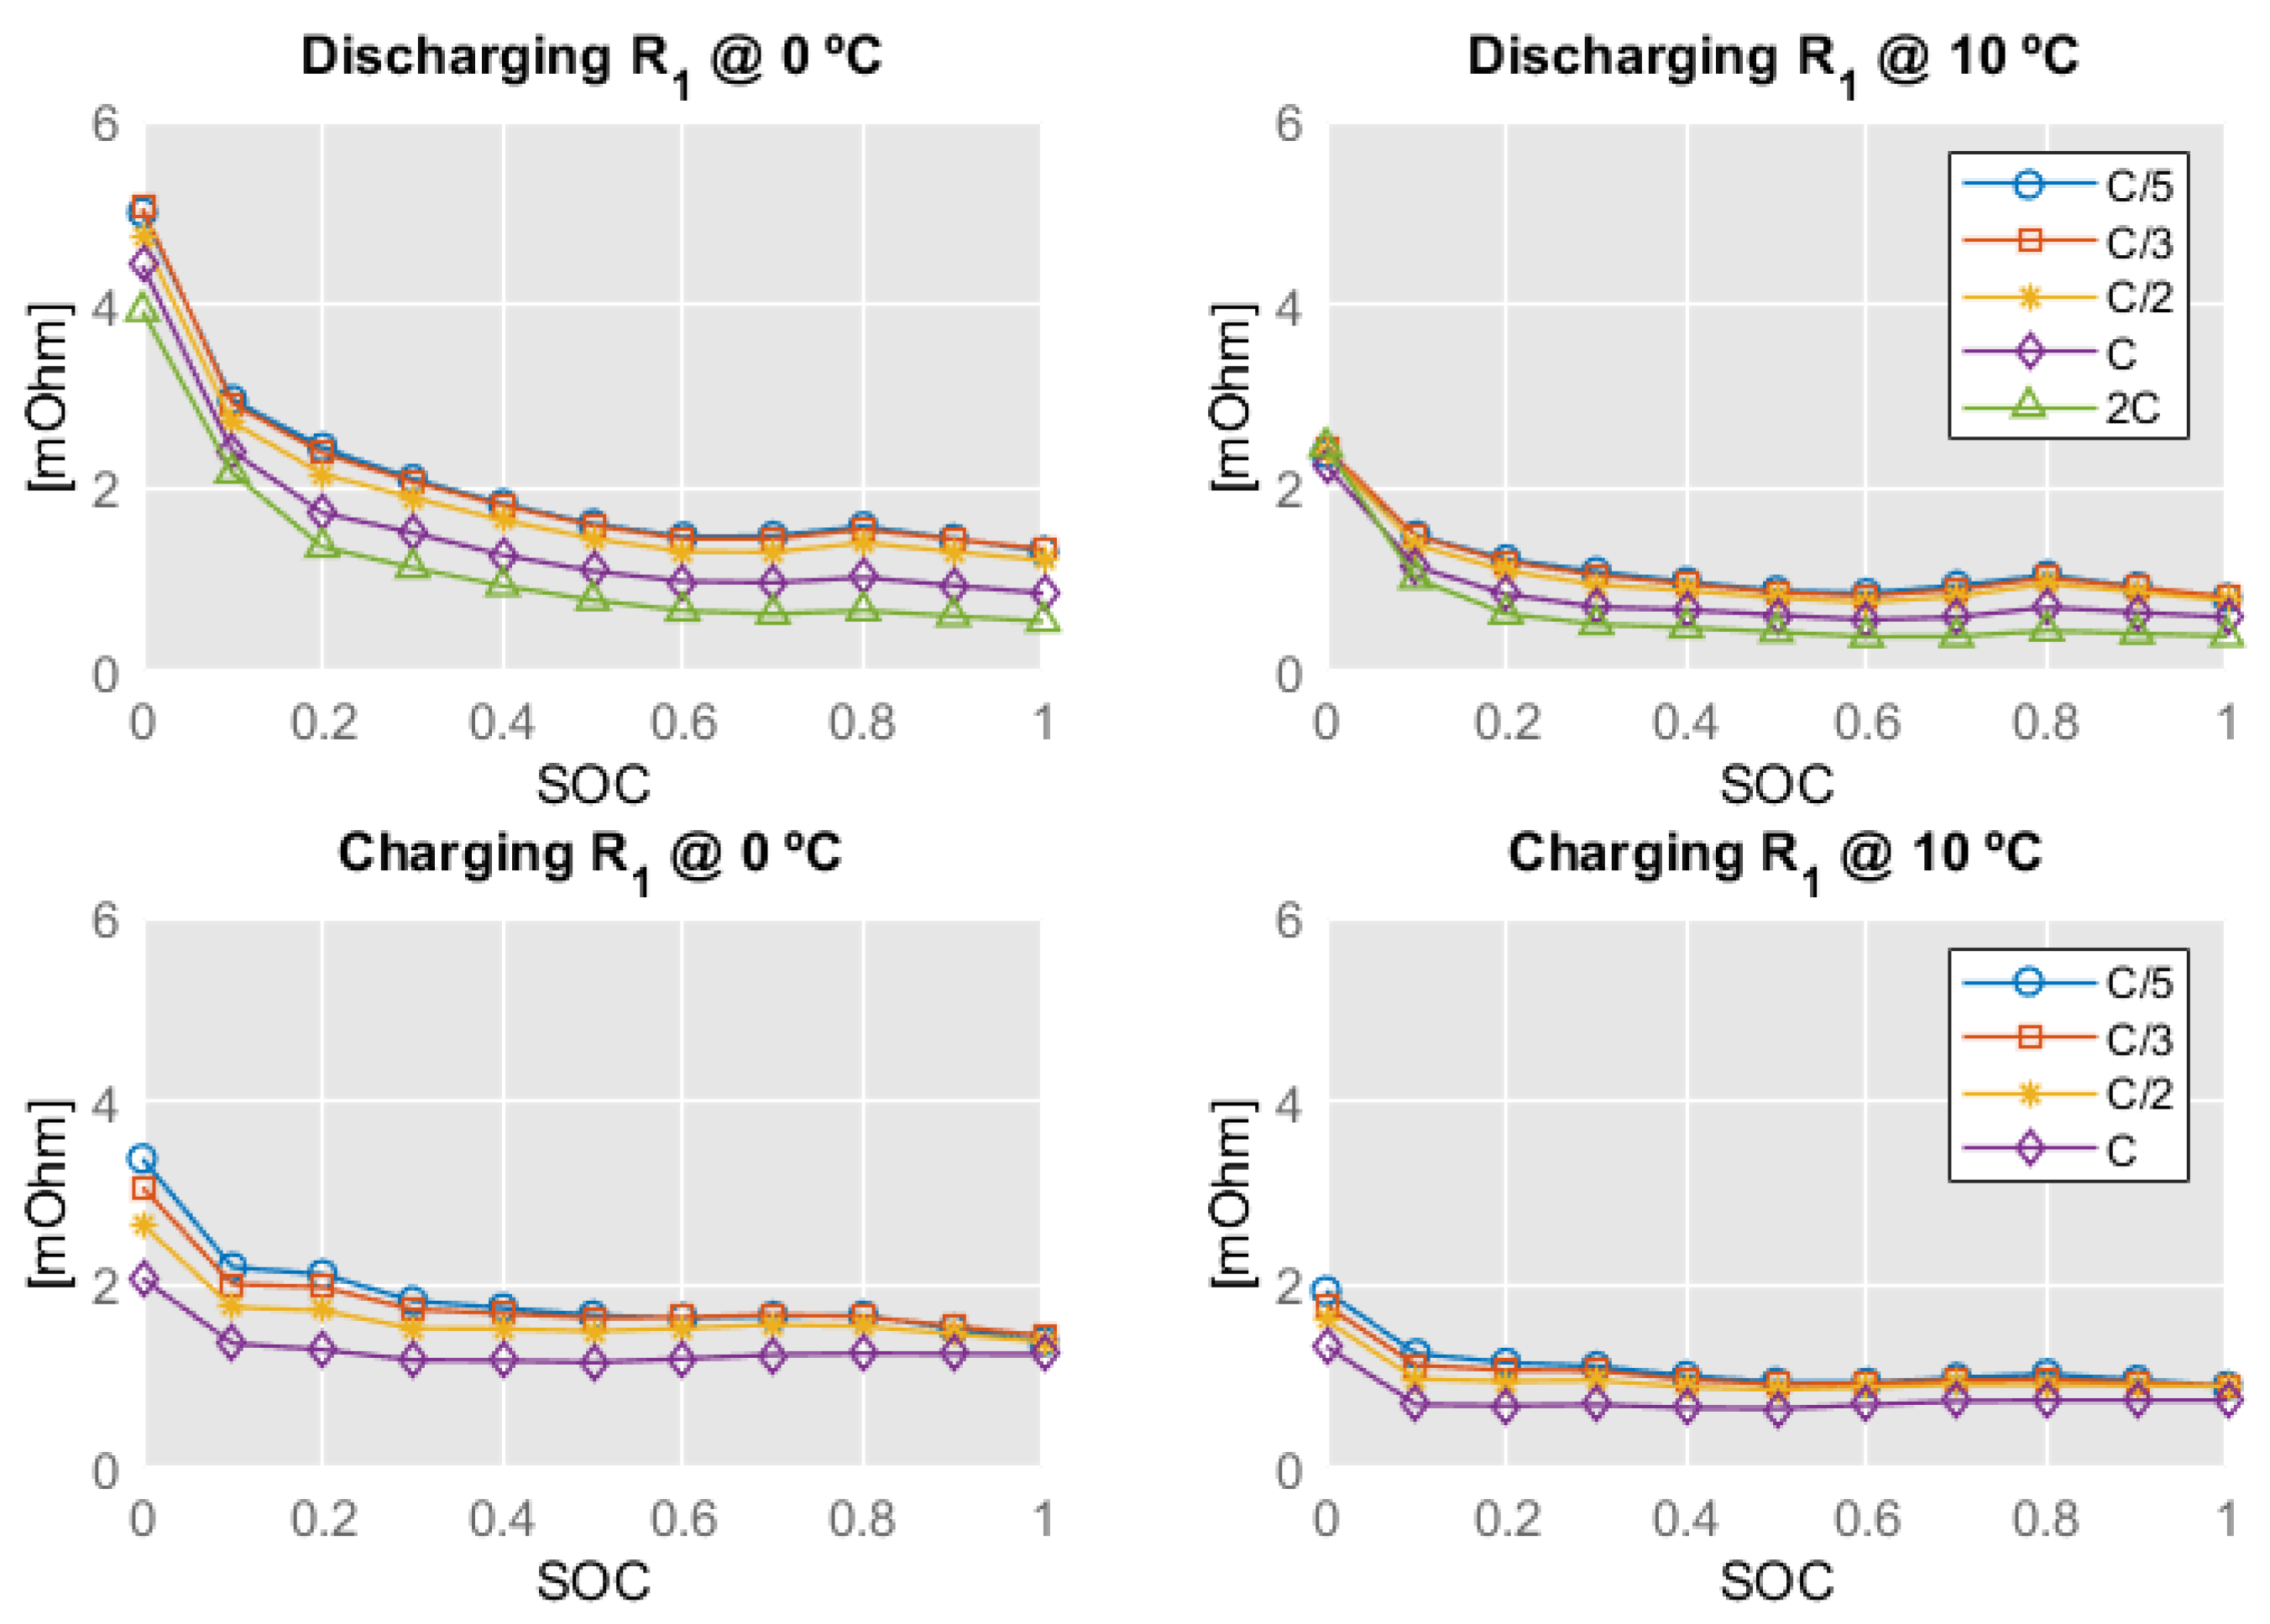
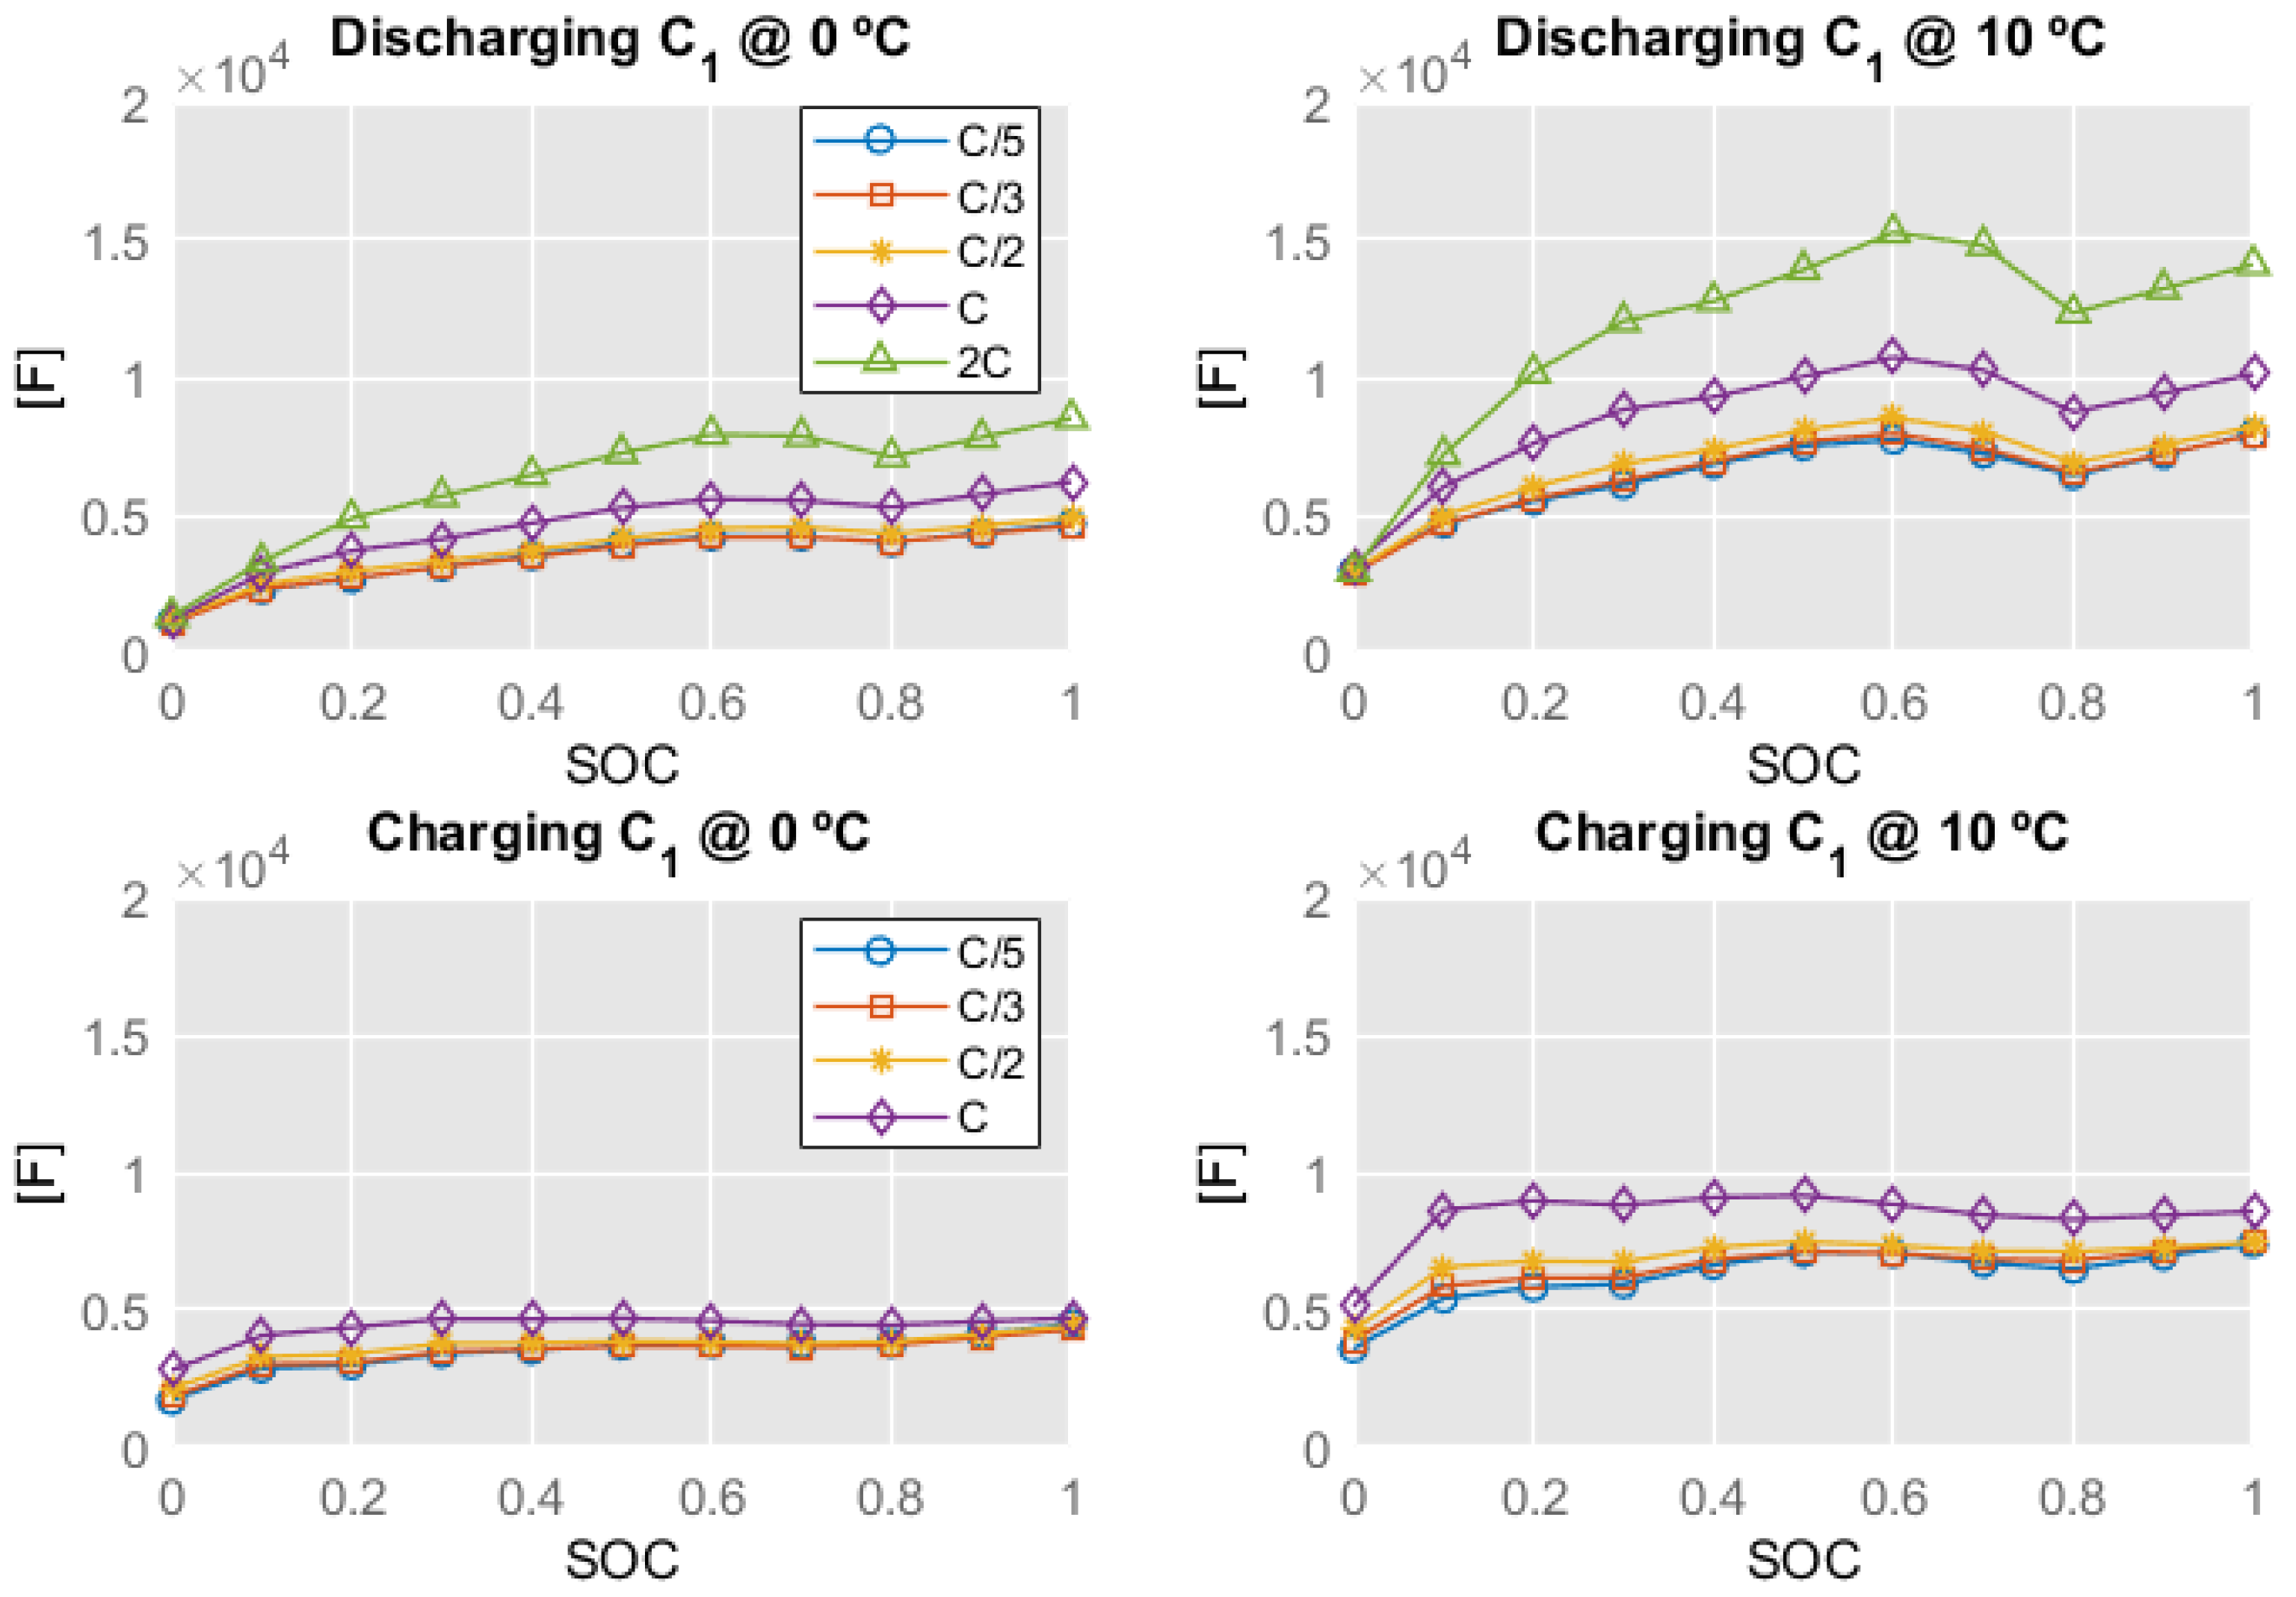
The methodology explained in the work of A. Broatch et al. was followed to determine all parameters of the equivalent circuit [39]. Figure 6 shows the curves of the open circuit voltage during charging and discharging as a function of state of charge (SOC). Figure 7 shows the curves of the ohmic resistance during charging and discharging for different operating temperatures and c-rates as a function of SOC. Similarly, the values of the charge-transfer resistance are shown in Figure 8. Finally, Figure 9 shows the values of the double-layer capacitance .
Once these parameters have been obtained and the SOC has been estimated at each instant of time as Equation (7) shows [40], the terminal voltage of the battery can be calculated by applying Kirchhoff’s second law (Equation (8)) [41].
where is the initial state of charge; is the nominal capacity of the battery; represents columbic efficiency; represents current, which is negative in charge and positive in discharge; is the voltage drop caused by the ohmic resistance; is the voltage drop caused by polarization process. Furthermore, with this model, it is possible to estimate the losses due to the Joule effect () with Equation (9) [42]:
All the heat generated is allocated to a single lumped mass representing the entire battery pack, since the main issue would be the transfer of heat transfer to the coolant and not the spatial distribution of its heat. Furthermore, the model could be used for control strategies in real conditions. This fact implies the use of fast and simple models to have a fast answer to changes in boundary conditions. The lumped mass exchanges heat by convection with the environment. The battery also exchanges heat by convection with the cooling fluid that flows through its cooling plate, in the case of the bus battery pack model.
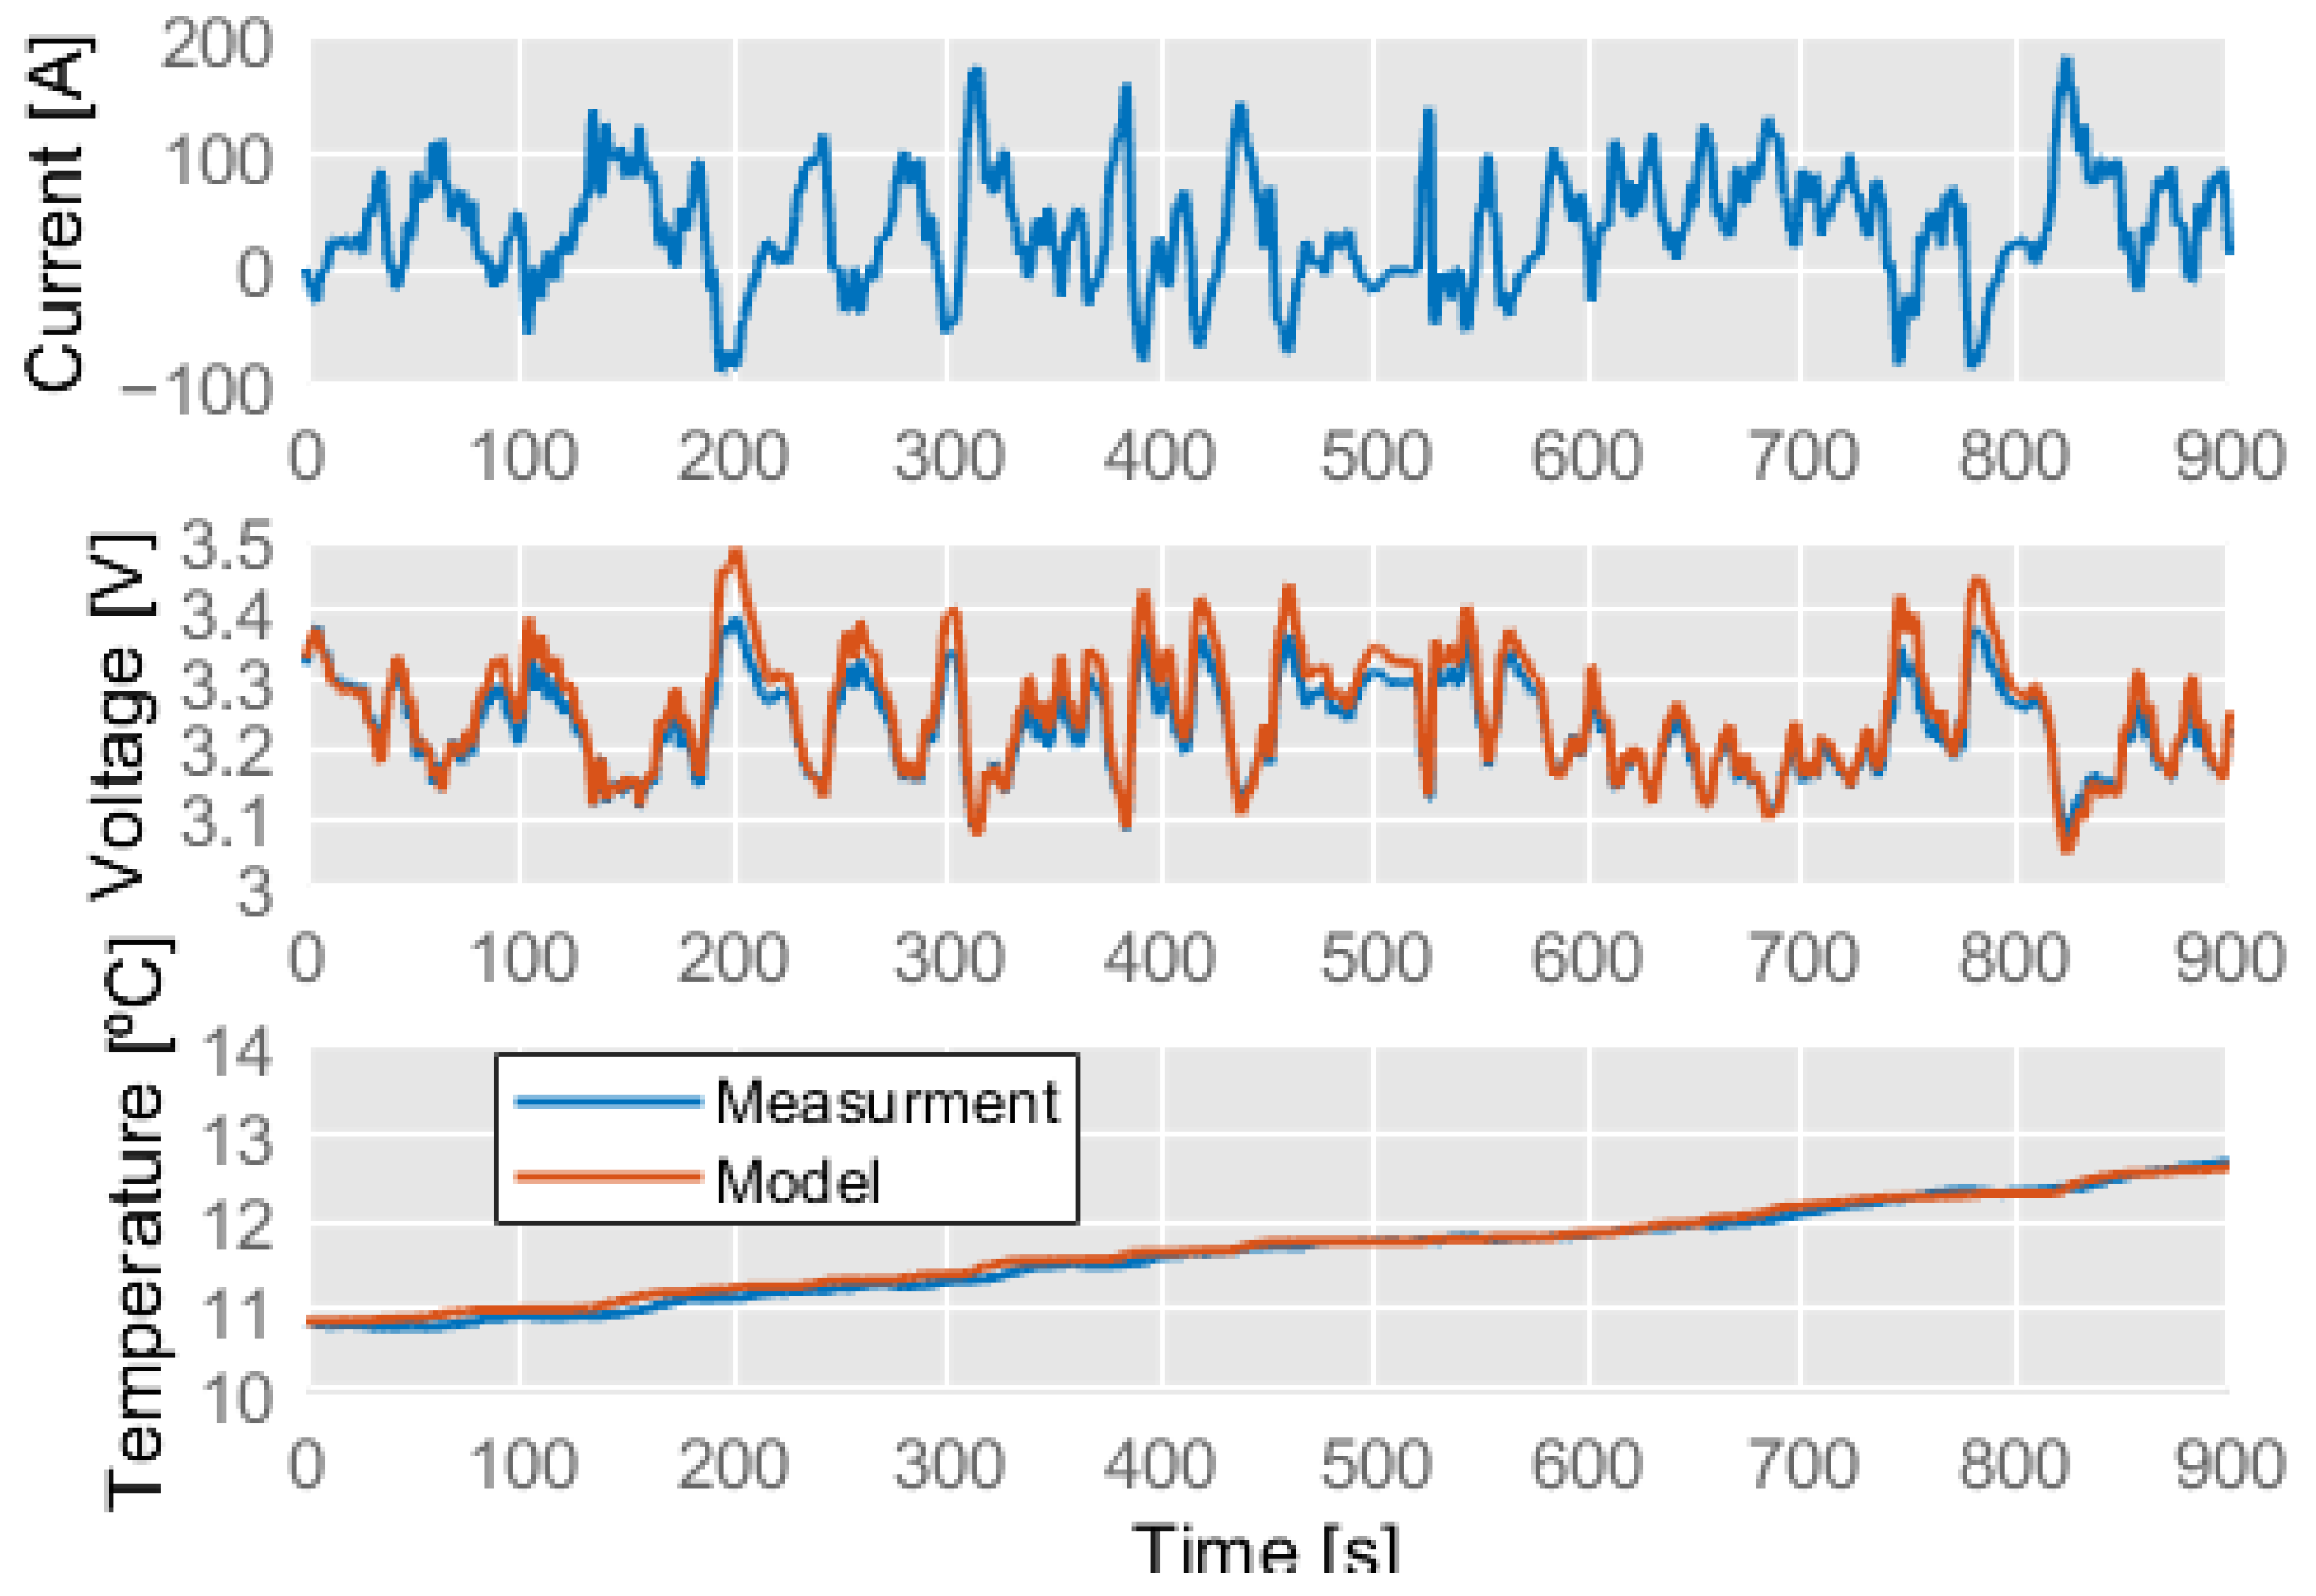
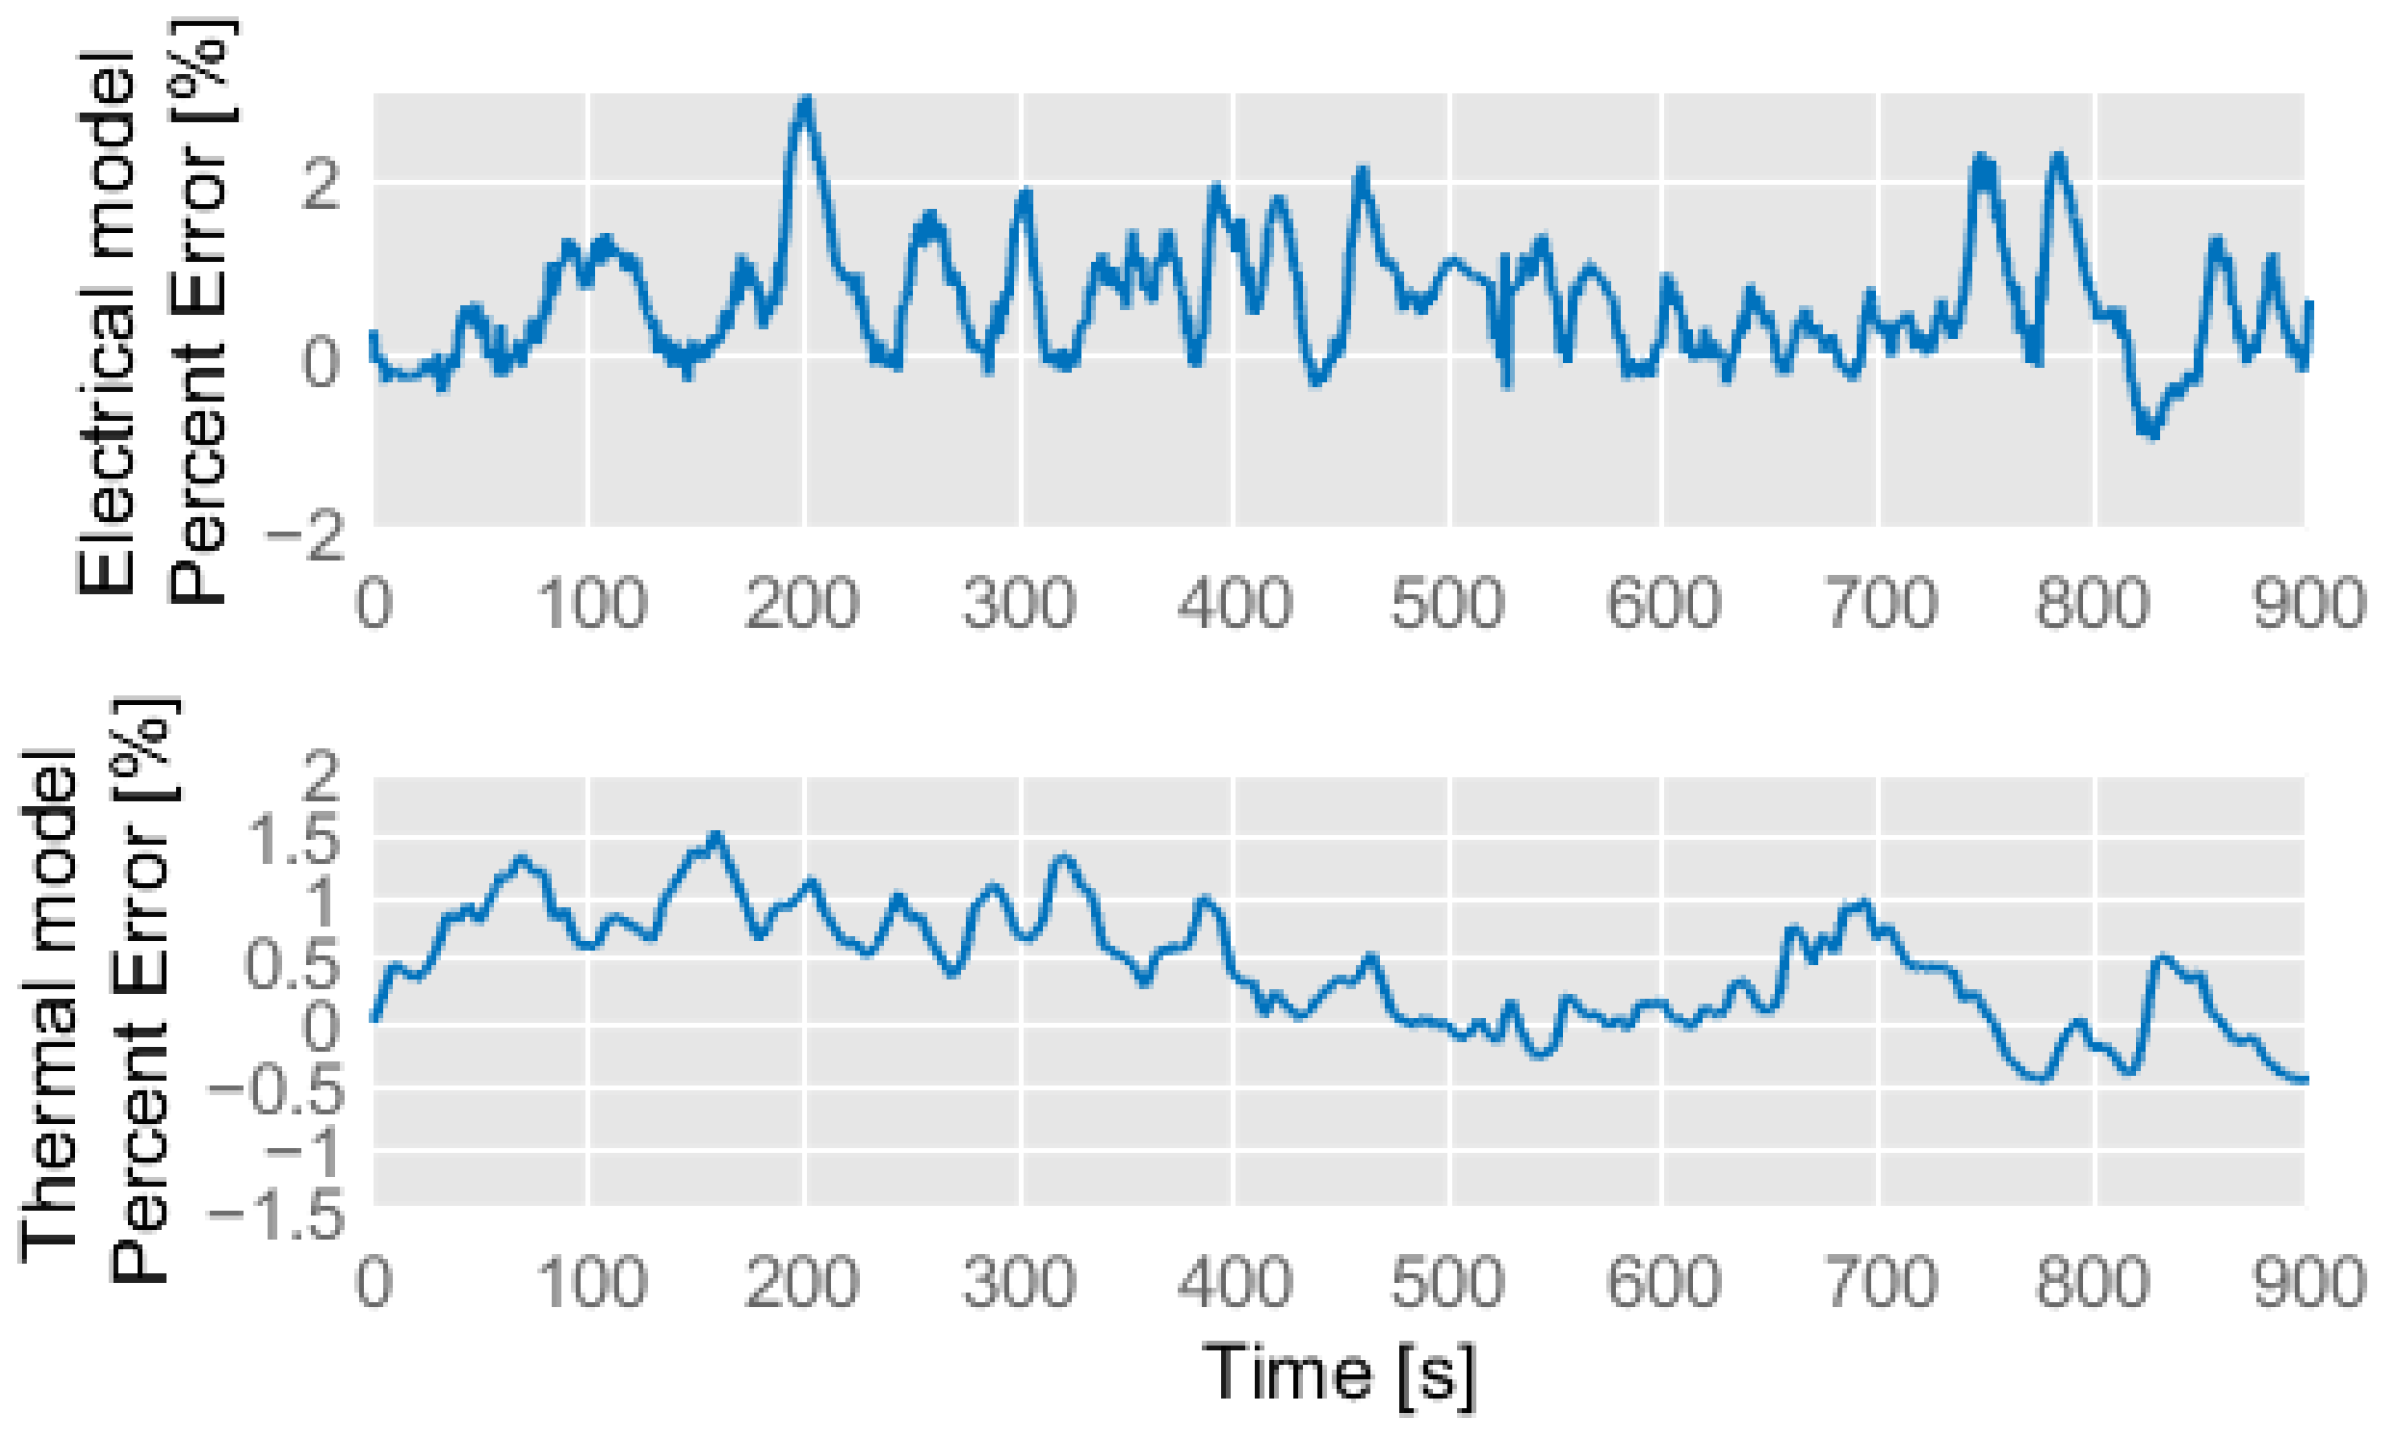
To validate the electrical and thermal models, a transient current profile was imposed on the battery cell test bench and in the model. Figure 10 shows the current demanded in the test; the experimental and simulated voltages; and the experimental and simulated cell temperatures. At first glance, the result of the model matches quite well with the experimental data in both voltages and temperatures. However, to quantify the error of the models, a statistical value must be determined. Figure 11 shows the percent error of the electrical and thermal models, which reach maximum values of 3% and 1.53%, respectively. Furthermore, the average percent error of the electrical and thermal models is 0.53% and 0.11%, respectively, which is considered an acceptable error for our study.
To model a pack that has similar characteristics to the BYD K9UB-DW bus battery pack, an arrangement of 160 cells in series and 6 in parallel was defined, resulting in a pack of 600 Ah rated capacity, 512 V rated voltage and 2016 kg. Regarding the thermal modeling section, it was stated that the battery pack is cooled with a single cooling plate. The contact area with the battery cooling plate is 10 m2, and a constant water flow of 10 L/min flows through it. The Colburn analogy was used to estimate the convection coefficient in the cooling plate. The area of the battery pack that exchanges heat with the environment is 12 m2. The specific heat of the battery was determined following the methodology of a previous work [39], estimating a value of 1400 J/kgK.
2.1.5. E-Machine Model
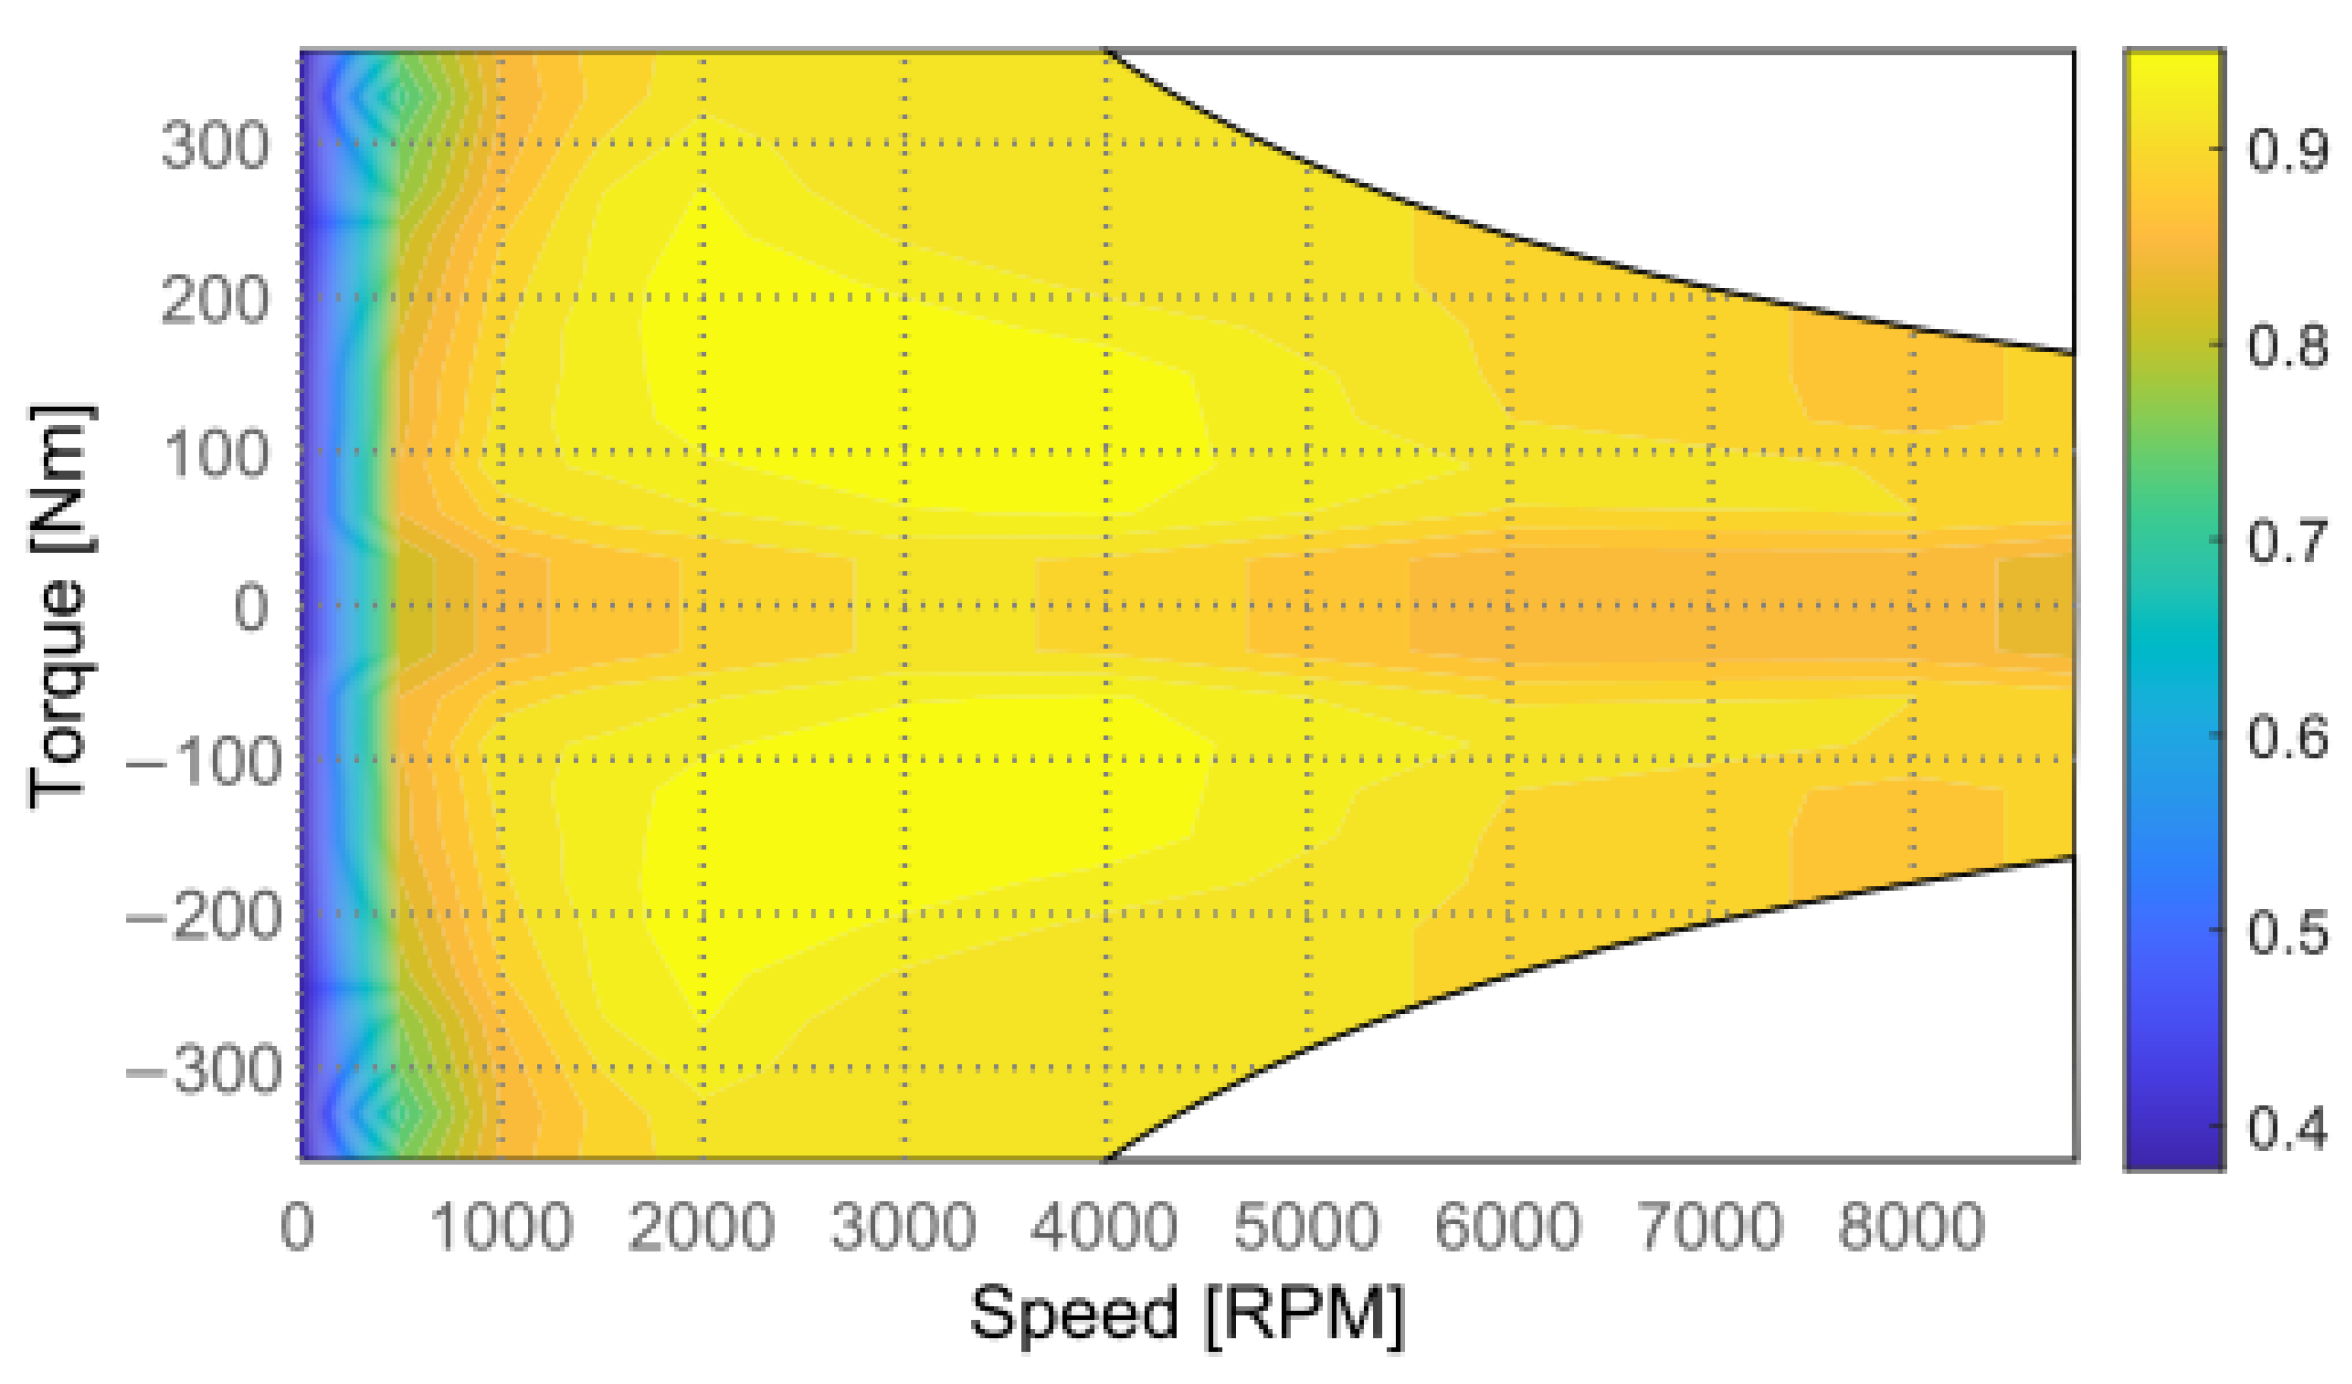
To electromechanically model the electrical machine, efficiency maps of a 150 kW water jacket cooled PMSM available in the GT-Suite library were used (Figure 12). Depending on the operating conditions of the bus—torque and speed—it is possible to estimate the efficiency of the electrical machine and, therefore, the necessary electrical power. Additionally, the remaining power is equivalent to the total losses of the electrical machine, which is the heat generated. Figure 12 shows that the efficiency of the electric machine is exceptionally low at speeds below 500 rpm. Moreover, it shows that the maximum torque curve falls at high speeds, which is common in electric motors. Regenerative breaking is also included when negative torque is demanded. Regenerative braking improves the electrical energy consumption along a route, specially in urban areas [43].
In a PMSM, the losses are classified as: iron losses, copper losses, mechanical losses, and stray losses. Iron losses are divided into hysteresis and eddy current losses, located in the core of the stator and rotor. These losses depend on the frequency and the maximum flux density. The copper losses are also called losses because they occur due to the winding resistance, in the case of a PMSM, in the stator winding. The mechanical losses take place in the rotor side and are also divided into two: windage and friction losses. Finally, the losses that occur because of other reasons are called stray losses [44]. The distribution of normalized heat sources was obtained from simulations and experimental data obtained in a previous study by Cavazzuti et al. [45].
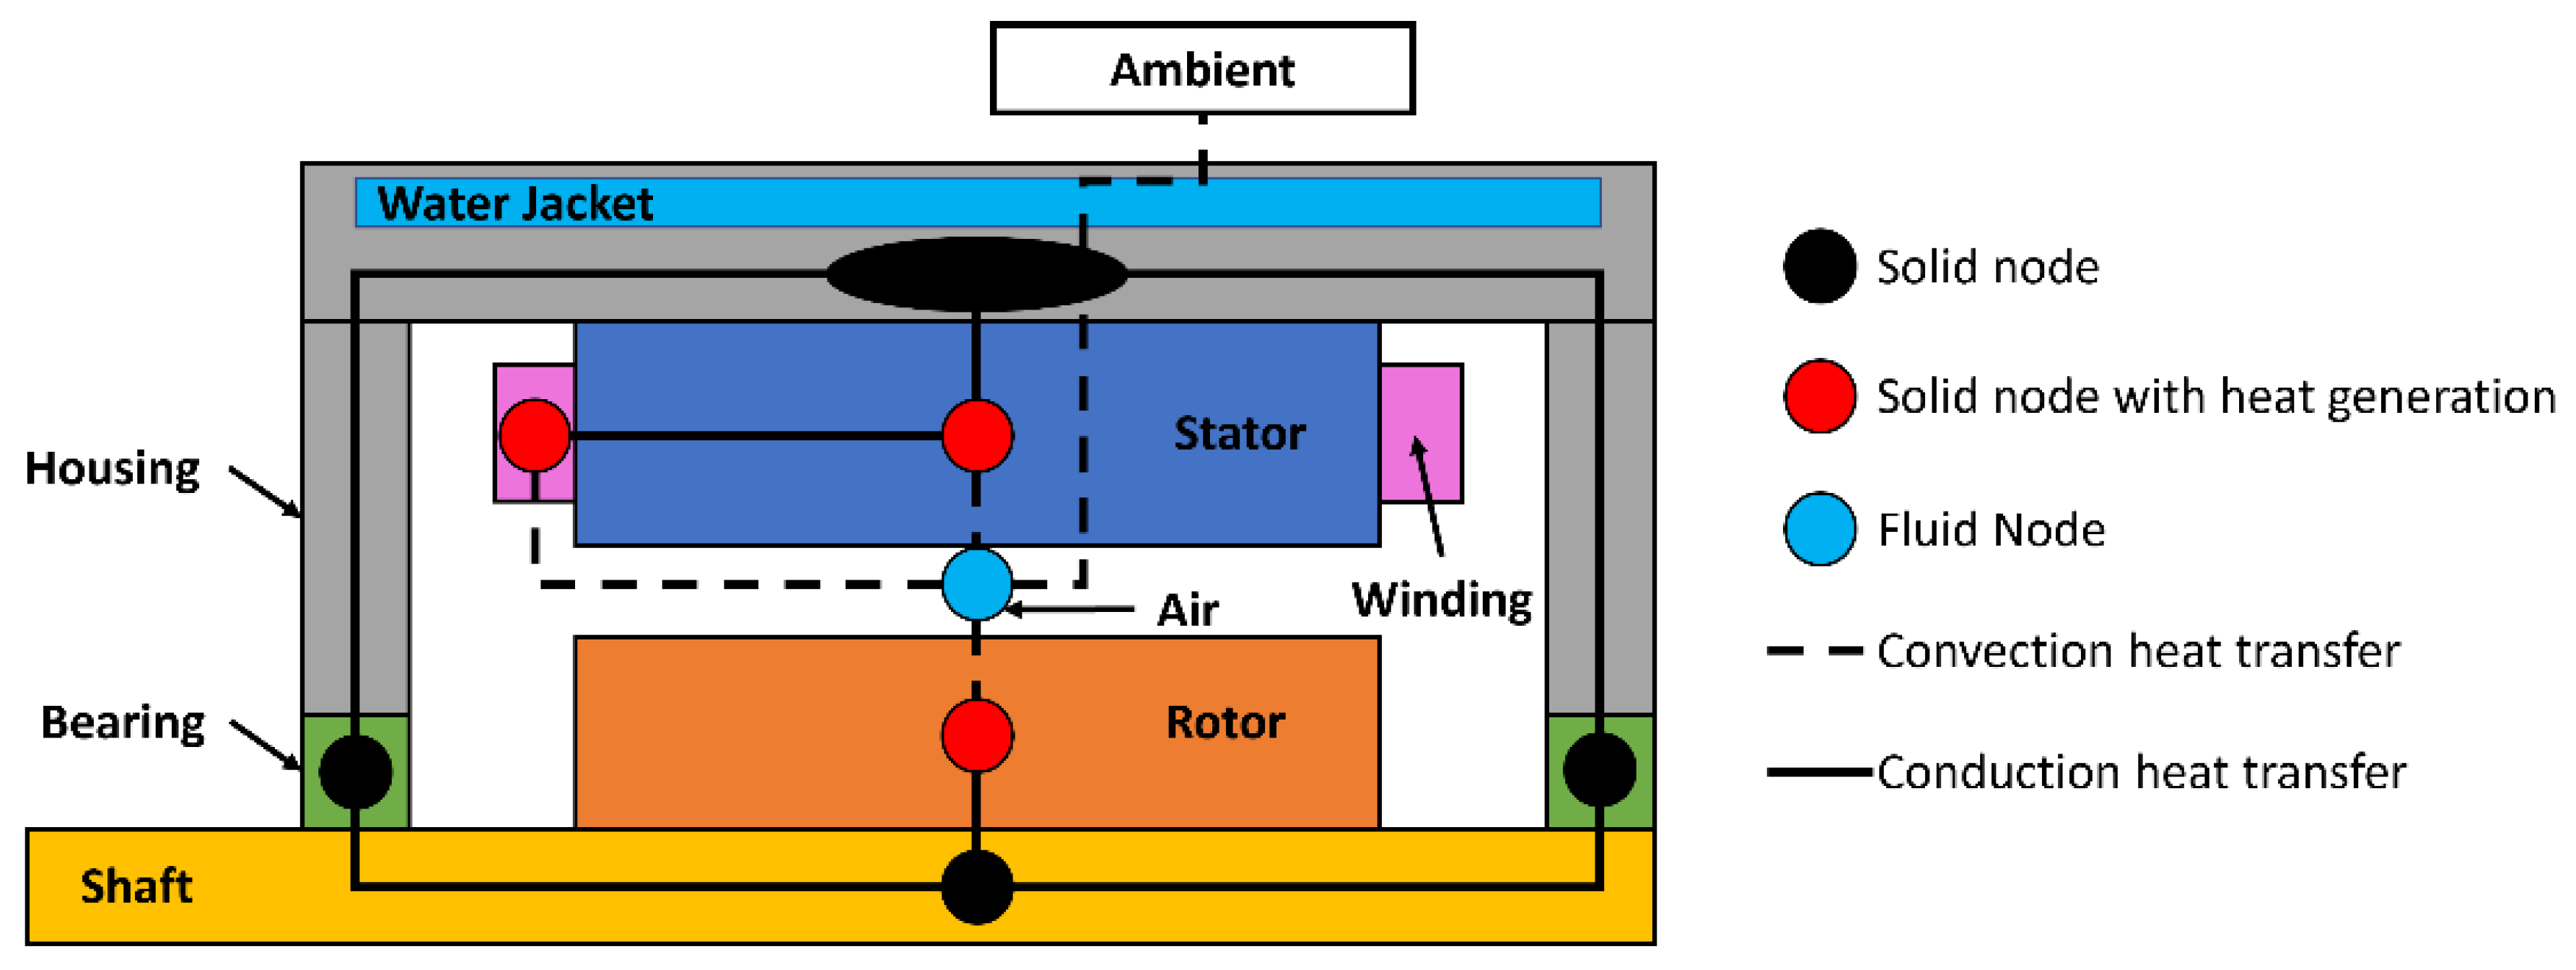
Due to the importance of knowing and controlling the temperature of the different components of the PMSM in operation, especially the temperature of the copper windings, a lumped thermal model (LTM) of the PMSM was designed and developed. The LTM represents the PMSM as a thermal network that consists of a finite number of nodes, with heat sources and temperatures imposed as boundary conditions as appropriate. The different nodes are connected by thermal resistances configured according to the type of contact between them, and their value derives from input data such as geometry and material properties. In addition, the thermal capacitance of each node is considered as a function of its mass and specific heat.
Applying the first law of thermodynamics to each node, a system of equations is obtained with which it is possible to determine the temperature of each node at any time, as well as the thermal flows between nodes. Equation (10) shows the energy balance of a node [46].
where the term on the left side of the equation corresponds to the thermal inertia of the node; the first term on the right-hand side of the equation corresponds to heat transfer by conduction; the second term corresponds to the heat generated; and the last term corresponds to the heat transfer by convection.
Figure 13 shows the 9-node LTM of the PMSM proposed in this study. Each color corresponds to a different component of the electrical machine such as stator, rotor, shaft, windings, housing, bearings, and water jacket. The solid lines correspond to heat exchange by conduction and the dashed lines to heat exchange by convection.
2.1.6. Cabin and HVAC Model
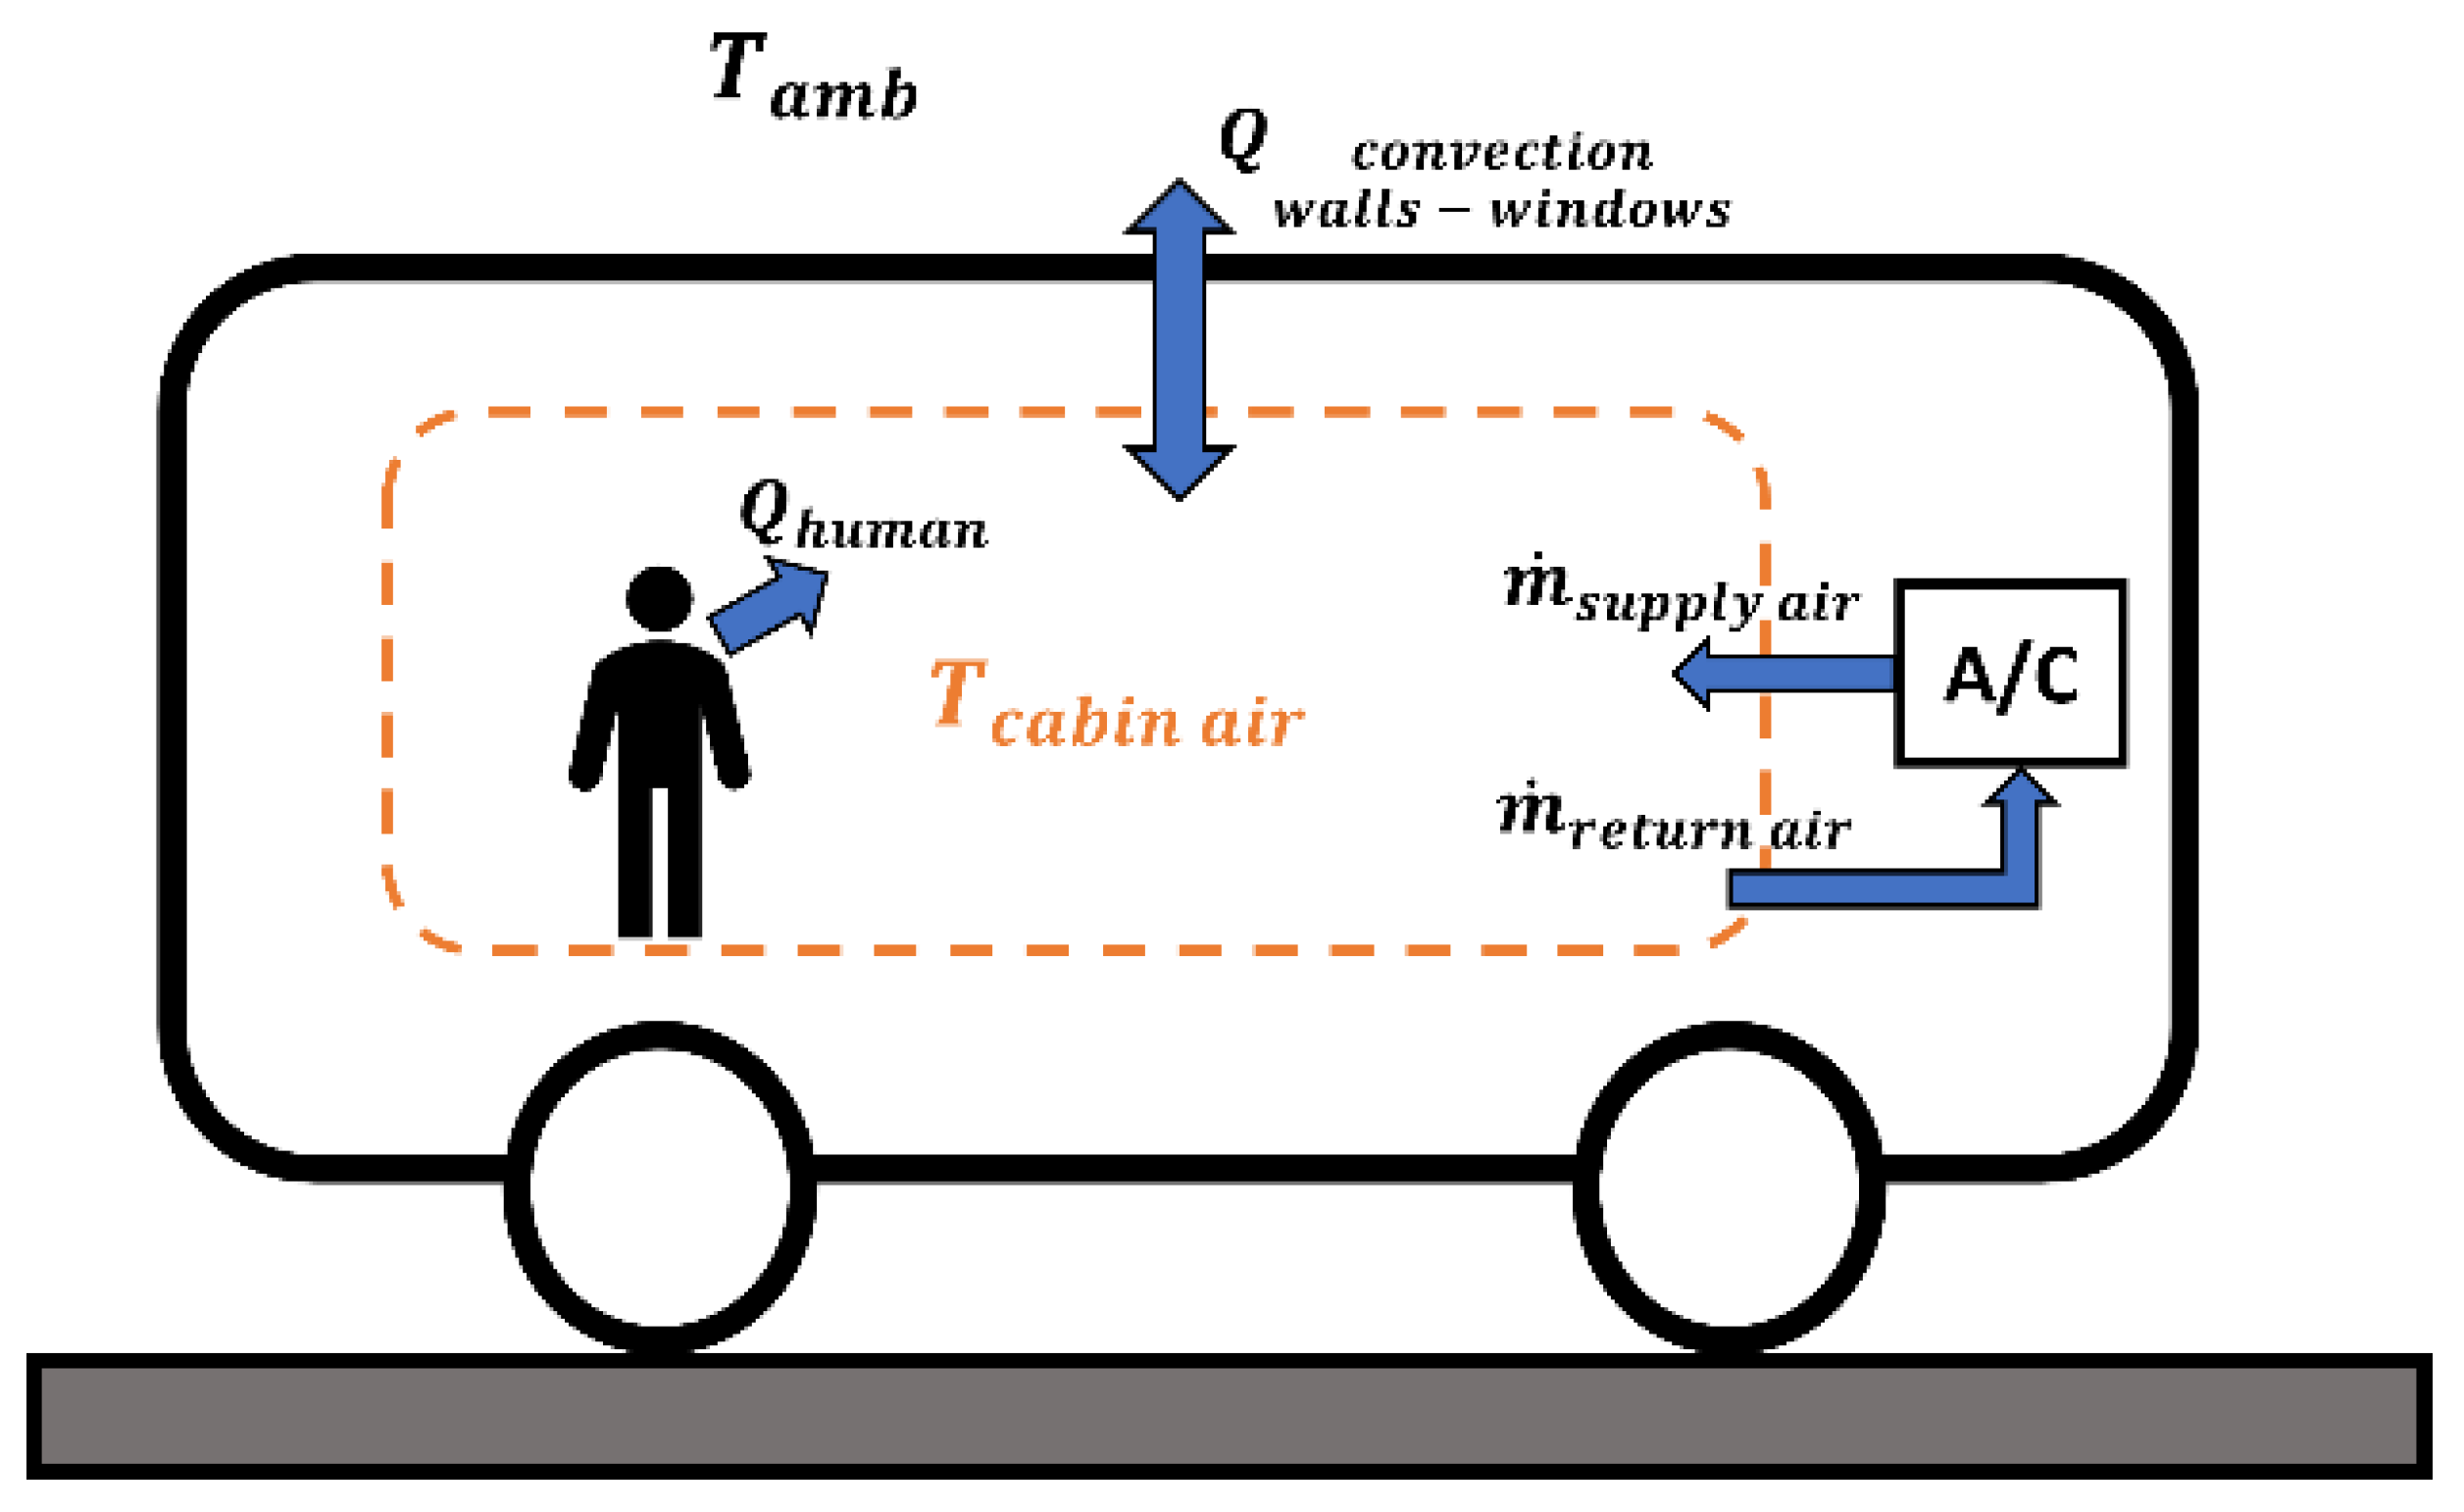
A key factor for electric vehicles is cabin climatization, especially for city buses, which have high energy consumption due to the number of passengers and the large volume and surface area of the cabin. For this study, the bus cabin was modeled considering three effects:
- Heat transfer by convection through walls and windows.
- The heat generated by the passengers.
- The flow of conditioned air delivered by the HVAC system.
Heat transfer by solar radiation was not considered, because the simulations were performed for winter climatic conditions, when the effect of the Sun is negligible. The renewal of fresh air by opening doors and windows in the bus was also not considered.
Convection heat transfer is estimated based on geometric data and material properties of bus walls, doors, roof, floor, and windows. Table 4 summarizes some geometric data of the bus. Convection heat transfer depends on the temperature difference between the air inside the cabin and the outside air, as well as on the insulation of the bus walls.
The heat generated by the passengers is due to the metabolic system of humans. For this study, it was determined that the heat generated by a passenger is equivalent to 100 W, which according to ASHRAE, is equivalent to the heat generated by an adult at rest [47]. The total heat generated by bus passengers is equal to the heat generated by one passenger multiplied by the number of passengers.
The conditions of the air entering the bus cabin depend on the requirements in the bus cabin, and the HVAC system is responsible for air conditioning. The HVAC system is also responsible for ventilating and renewing the air in the vehicle. For this case study, the fans were determined to supply the cabin with an airflow rate of 3.5 L/s per passenger, which is within the ranges recommended by ASHRAE [48] for this type of vehicle. Figure 14 shows a schematic diagram of the bus cabin model.
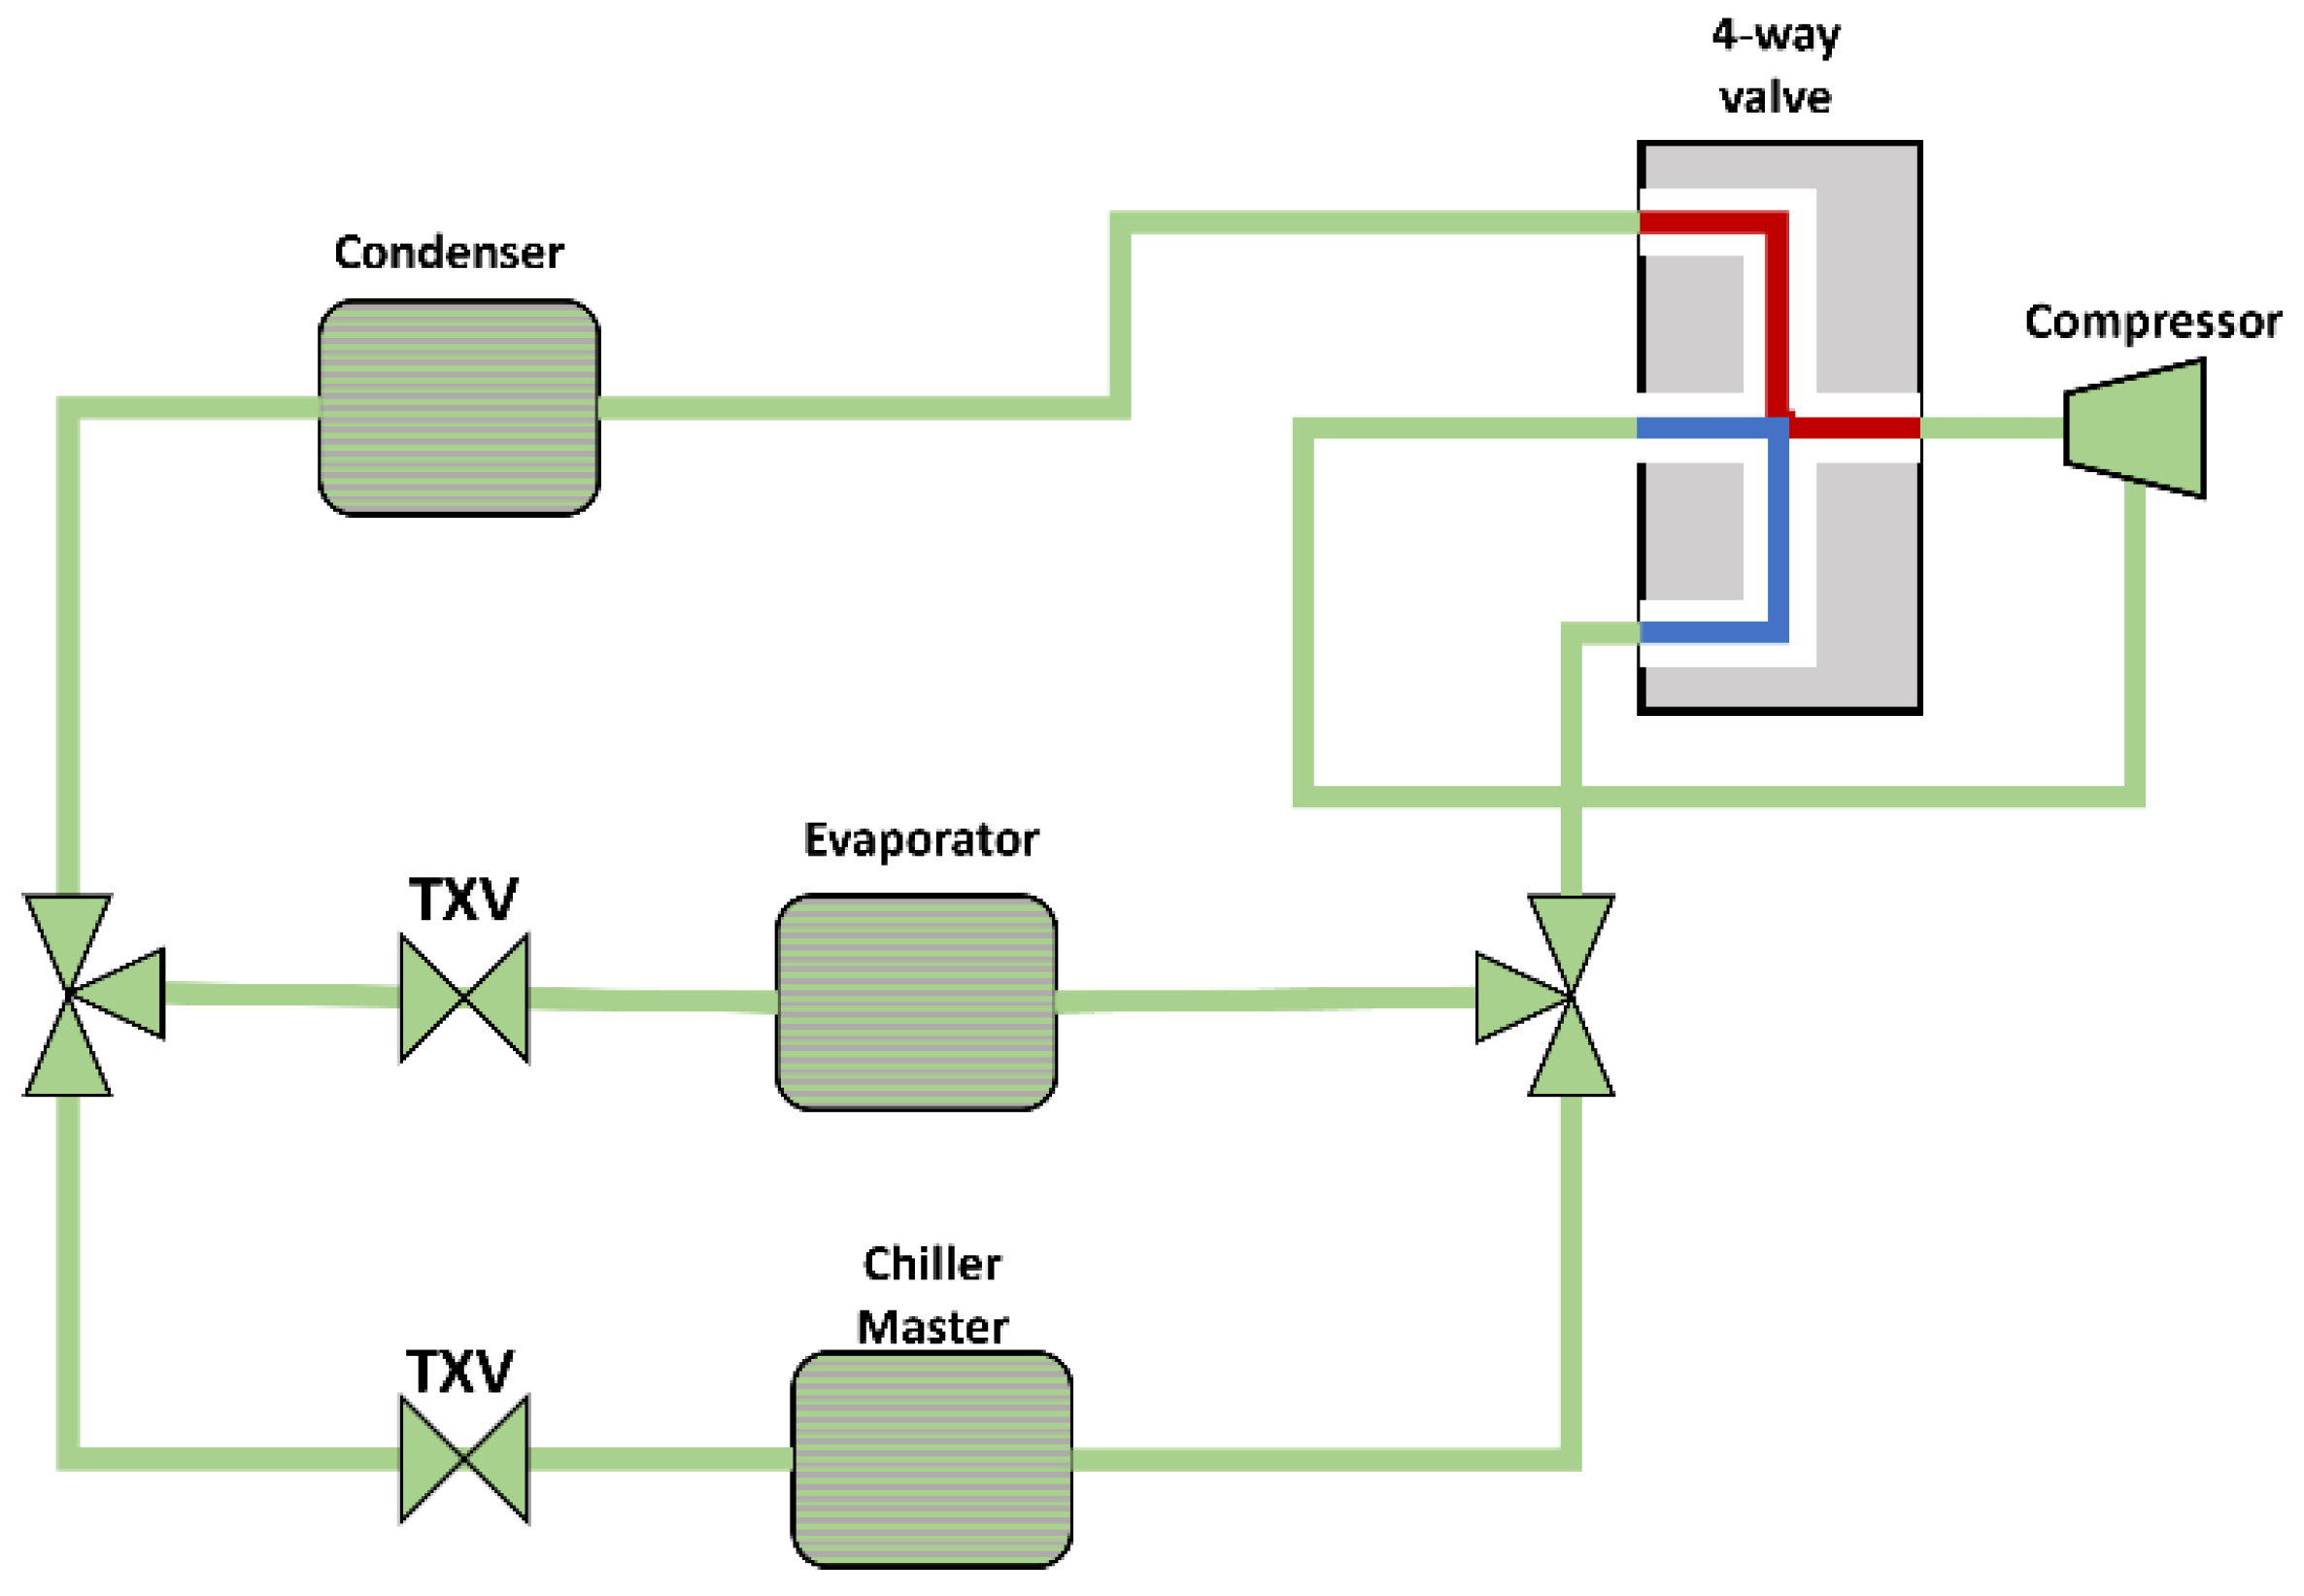
As for temperature control, the HVAC system must have the technology to control the cabin’s temperature and keep it within a comfortable range for humans. In the case of the reference bus, it has PTC electric heaters that heat the air supplied to the cabin in winter conditions. In hot weather conditions, the HVAC system has compression cooling circuits where the evaporator is responsible for cooling the air entering the cabin. The air conditioning system of the reference bus consists of four refrigeration circuits with R134a refrigerant. Each circuit has an expansion valve, a compressor, a condenser, and an evaporator. Table 5 lists some features of the HVAC system. The HVAC model was configured from these data, replicating the original configuration of the reference bus.
In addition, a four-way valve was modeled that makes it possible to reverse the direction of refrigerant flow and operate the system as a heat pump in this way. This valve is not found in the real bus, but it has been included to study the possible benefits. This allows for different cabin heating systems such as electric heaters and heat pumps to be compared with the model. A schematic representation of the air conditioning system circuit is shown in Figure 15.
2.2. Driving Cycles and Operating Conditions
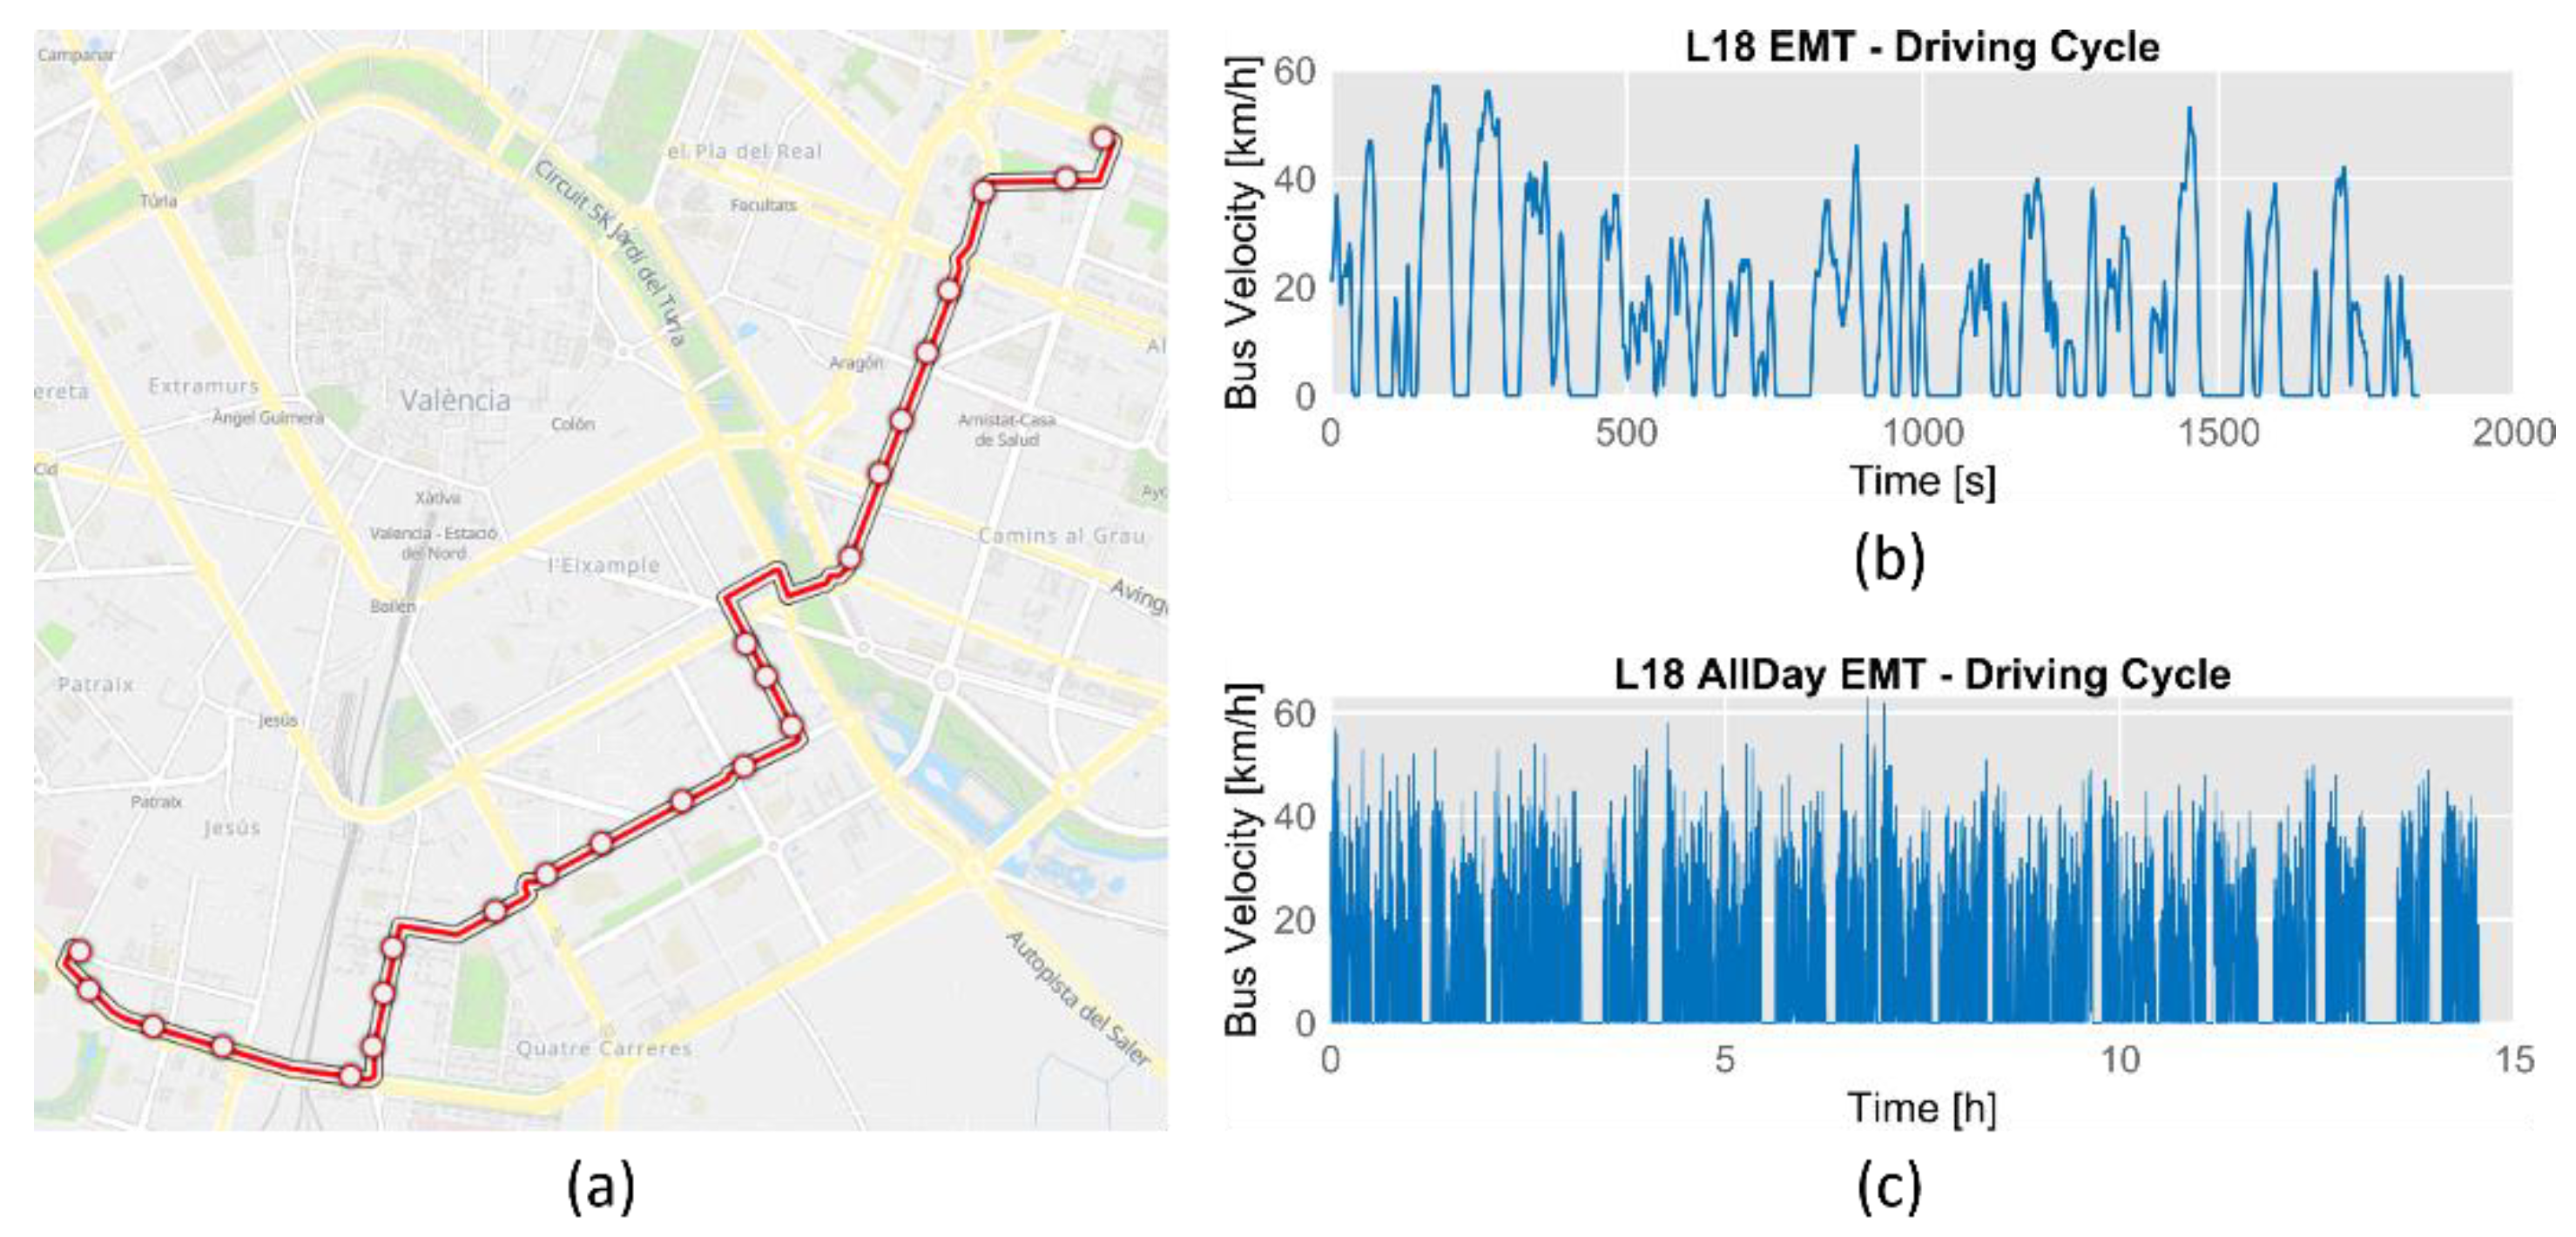
In this study, the simulations were performed under the most realistic conditions possible in order to identify the design problems that may arise and to evaluate possible improvements. For this purpose, driving cycles corresponding to two routes used by Valencia Municipal Transport Company (EMT) buses were considered. Test data provided by EMT were available, in which the speed profile of the vehicle was recorded on different routes. The routes selected were lines 18 and 24, the first being less demanding than the second.
Figure 16 shows route 18 of the EMT and the driving cycle of a bus traveling such a route. It is a route with 24 stops, and the bus rarely goes faster than 60 km/h. Another aspect in Figure 16 is that the bus covers the same route 21 times per day and takes almost 15 h to do so. This is important to mention because the electric bus must have sufficient autonomy to function correctly all day.
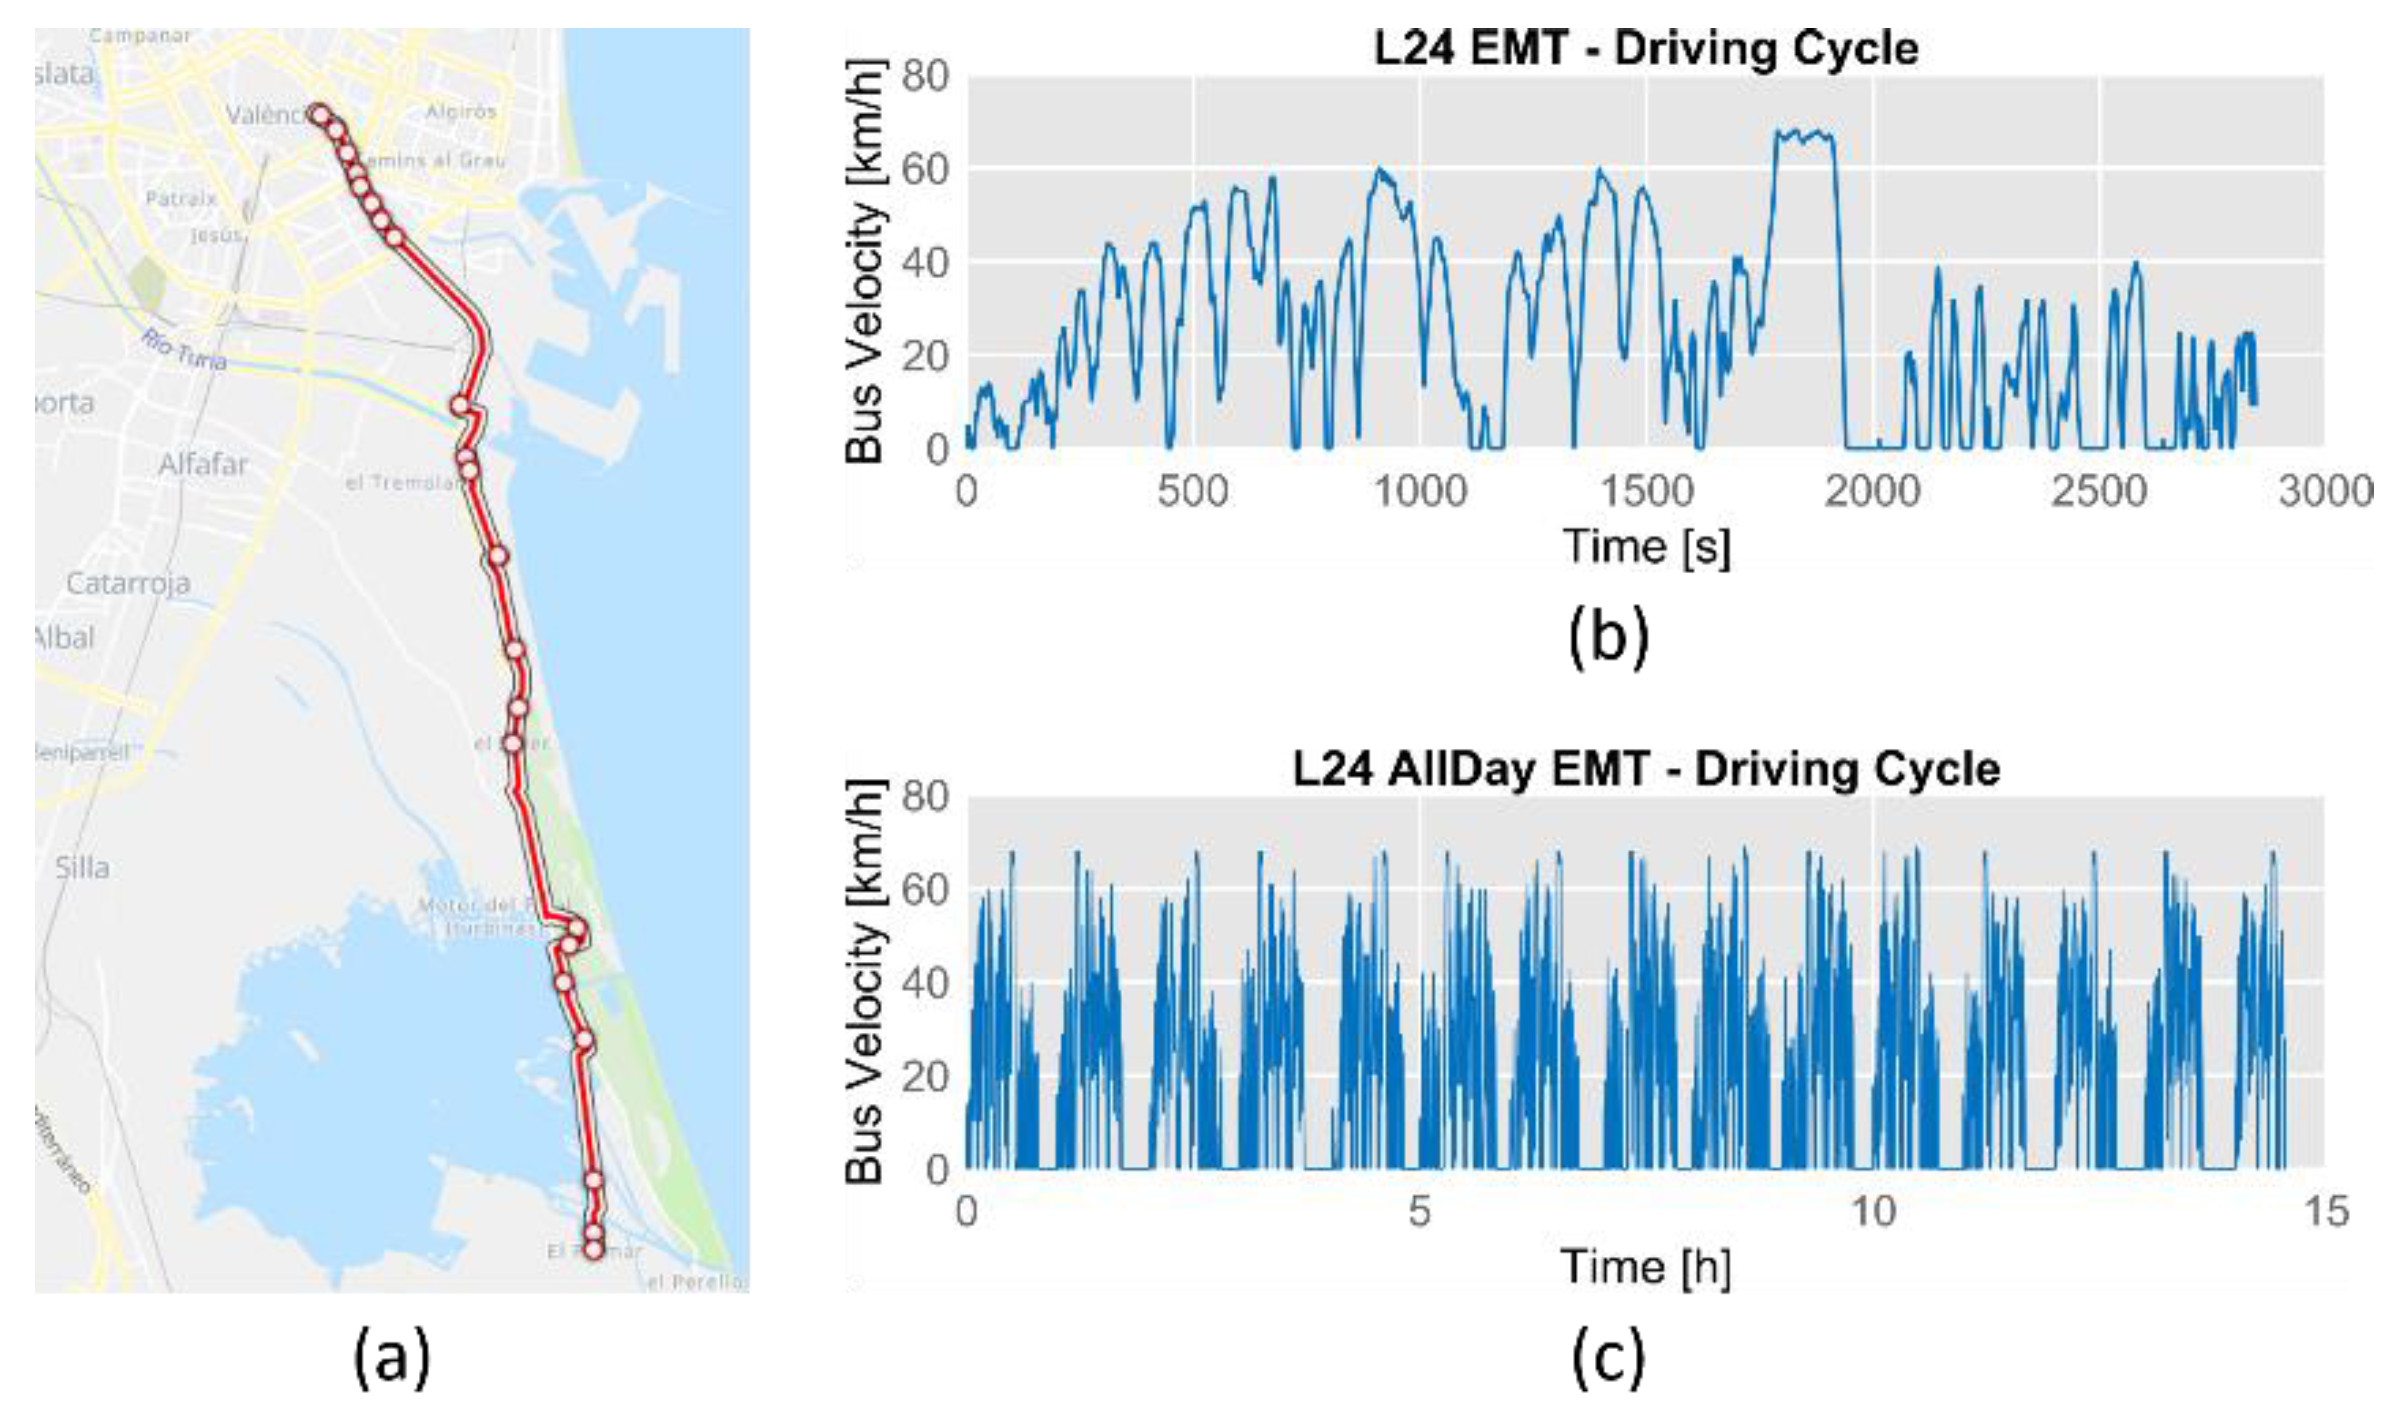
In addition, simulations were carried out along another route of the EMT, as shown in Figure 17. This route was chosen because the stops are farther from each other, allowing the bus to reach higher speeds. In this way, driving cycles with quite different speed and torque requirements can be evaluated with the model.
All simulations were carried out in cold weather conditions. The simulations were performed with the two proposed hydraulic circuit configurations for both driving cycles. The simulations were also performed with the different heating systems (PTC heater and heat pump). Due to the routes and driving cycles of the buses in Valencia, a constant ambient temperature of 5 °C was set for all simulations, as this is a typical minimum winter temperature in this city (information acquired by the State Meteorological Agency AEMET). This value was also set as the initial temperature for all vehicle components. For all simulations, it was assumed that the bus has half the maximum number of passengers allowed (40 passengers). Finally, a target temperature of 19 °C was set in the bus cabin. Before running this series of simulations, a simulation was first run without the PTC heater for the battery pack to check the performance of the battery without preheating.
3. Results and Discussion
3.1. Impact of Battery Heater
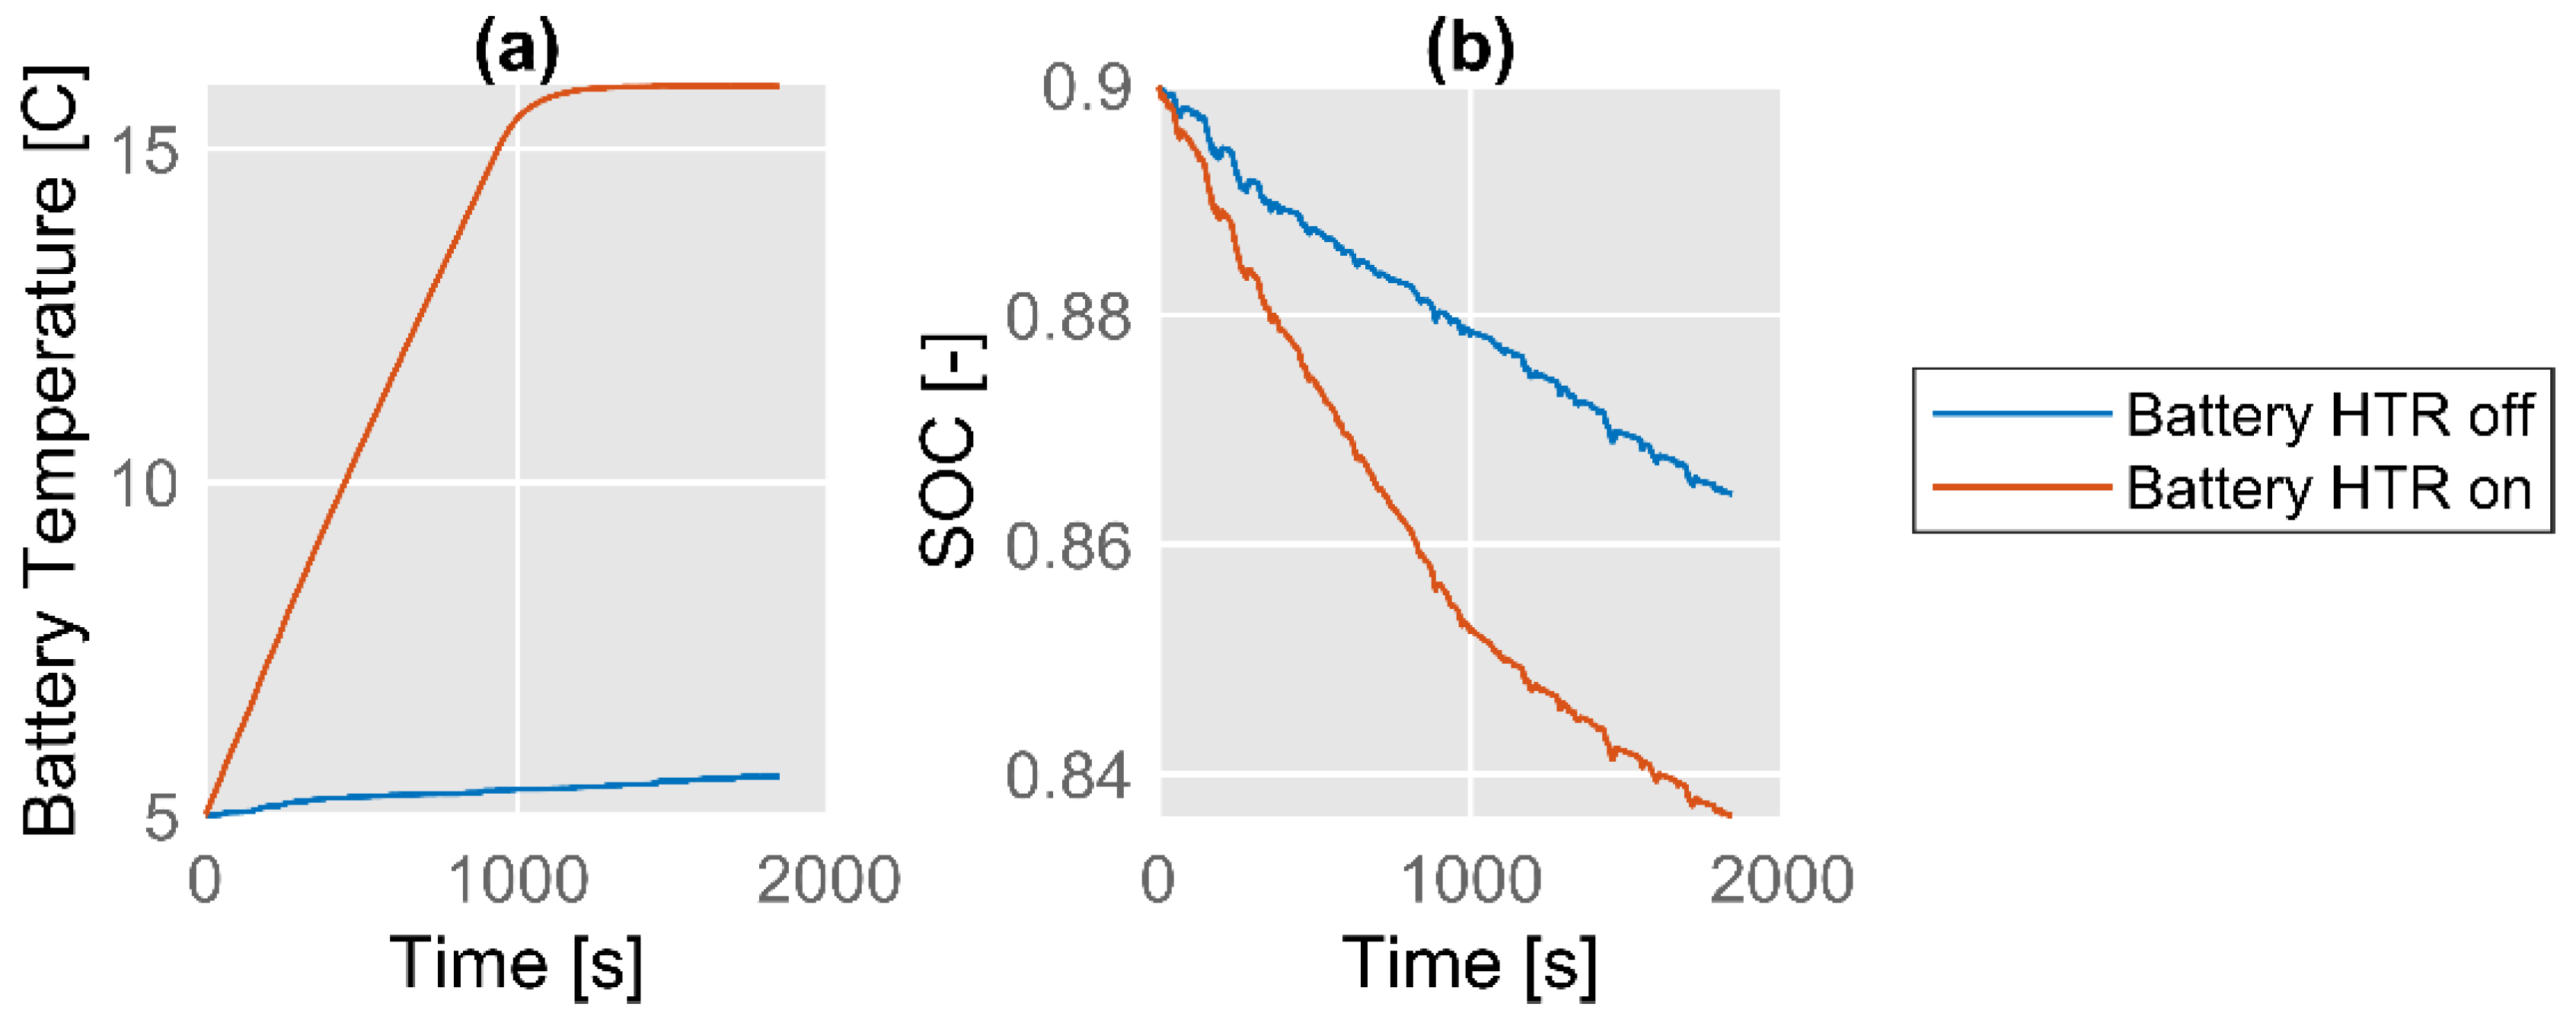
Figure 18 shows a multivariable comparison between a bus with battery heater on and off, simulating only one-way of the L18 driving cycle. Several interesting aspects can be highlighted from this figure, which will be used later in the further analysis of the results. First, the temperature barely changes during the entire cycle with the battery heater off. This is mainly due to two reasons: the thermal inertia of the battery and the oversizing of the battery power.
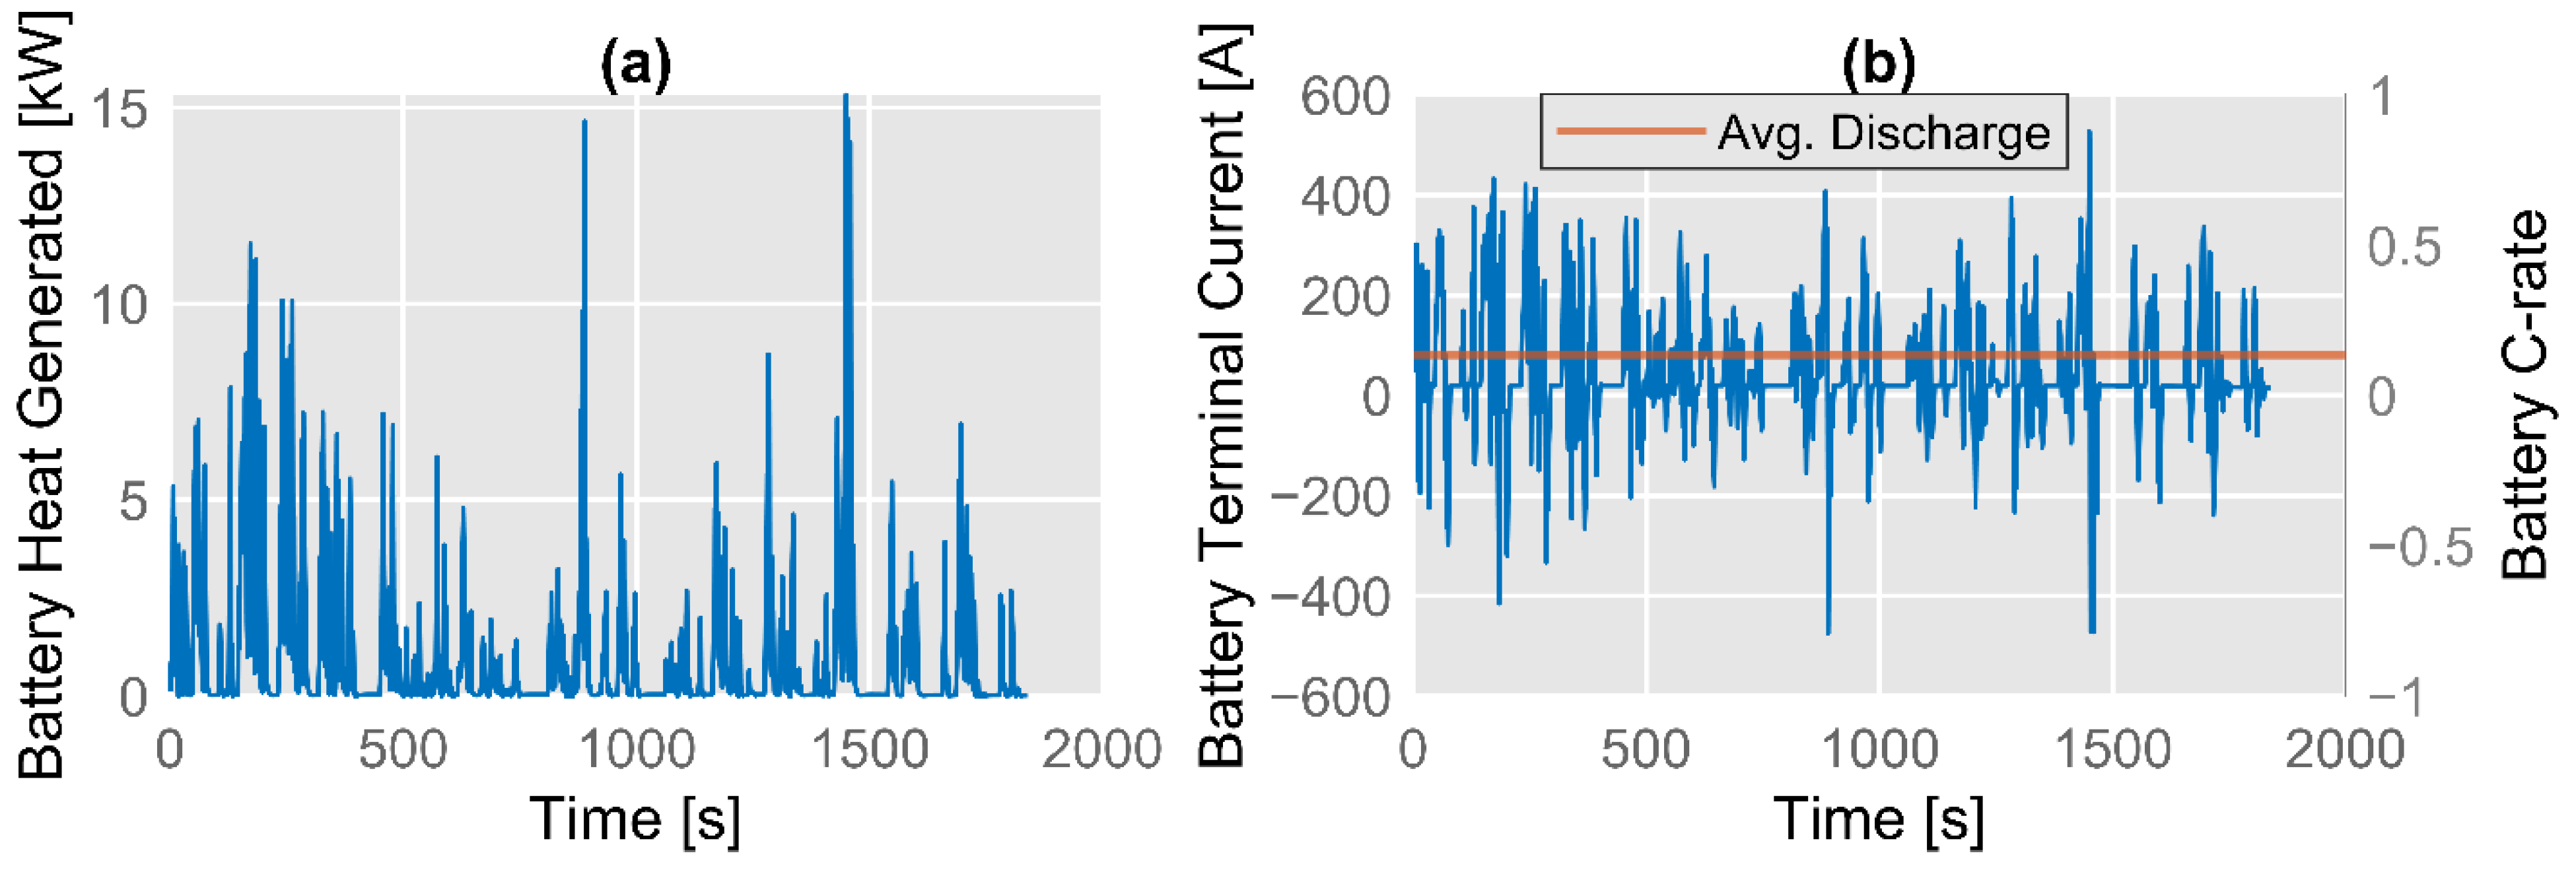
Since the bus must have high autonomy, its power capability is implicitly increased, even if this is not necessary to meet the required power demands. This fact leads to an array of cells weighing more than 2 tons, hence great thermal inertia. To increase the temperature by one degree Celsius in ten minutes, the battery must constantly absorb about 5 kW of heat during this period. Figure 19a shows that the battery generates more than 5 kW of heat, but only for noticeably short periods, due to the transient nature of the driving cycle.
The other reason is the small amount of electrical power the battery gives off or takes in during the cycle compared to its power capability. In Figure 19b, it is observed that at no point during the entire drive cycle does the battery charge or discharge at a rate of 1 C; rather, the average discharge current is 80 A, which corresponds to a slightly higher C-rate of C/8. At such low C-rates, it is difficult to achieve a temperature rise.
In Figure 18, another aspect that emerges is the obvious difference in SOC between the two curves. It is known that a battery operating at low temperatures is less efficient because the internal resistance of the battery is higher. Nevertheless, the battery operated without heating has a higher SOC, and thus, it seems inconvenient to use a heater from an energy-saving perspective. However, the rapid heating by the heater is not justified for performance reasons, but for aging reasons. It has already been mentioned that at low temperatures, the effect of lithium plating occurs, which shortens the useful life of the battery. For this reason, in all the cases studied, an electric heater is used to raise the battery’s temperature to more than 15 °C as quickly as possible.
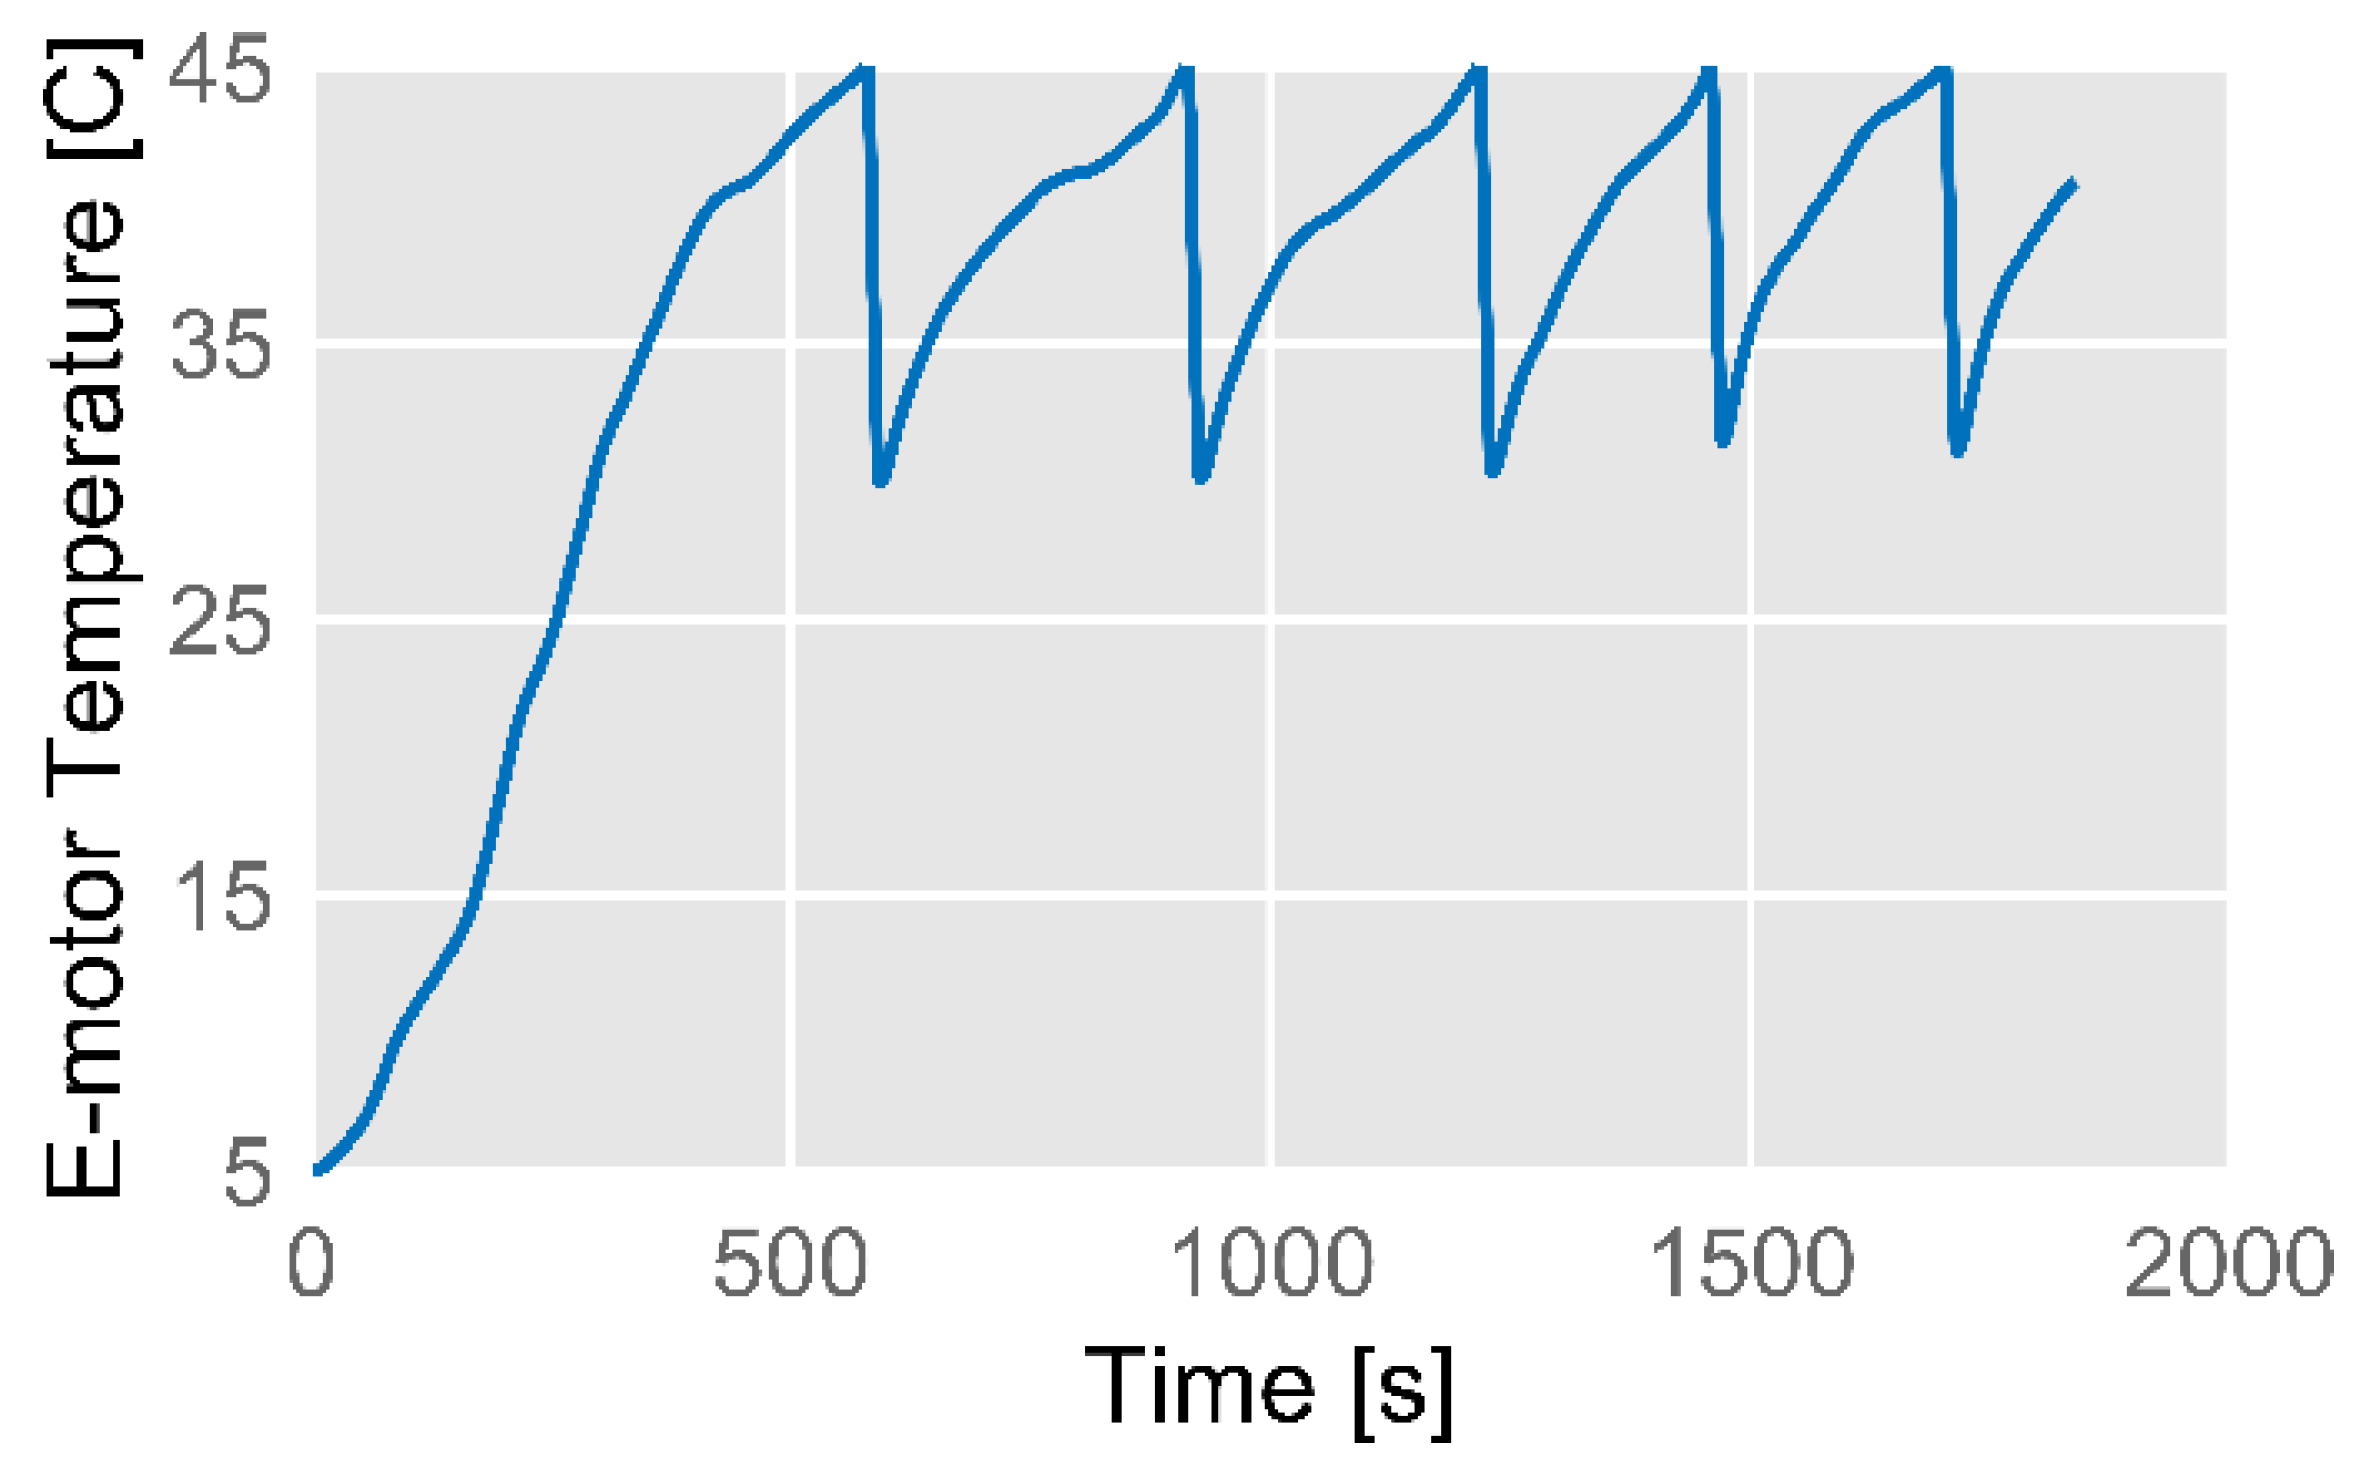
Figure 20 shows the temperature of the motor housing during the entire drive cycle. These sudden temperature fluctuations are due to the control of the electric motor’s thermal management system. When the motor reaches a temperature of more than 45 °C, a three-way valve directs the coolant to the radiator, causing the temperature of the coolant and thus the motor to drop abruptly. In the Connected configuration, the goal is to use the heat exchanged between this element and the coolant to heat the battery instead of dissipating it through the radiator.
3.2. Utilization of the Heat Dissipated by the e-Motor
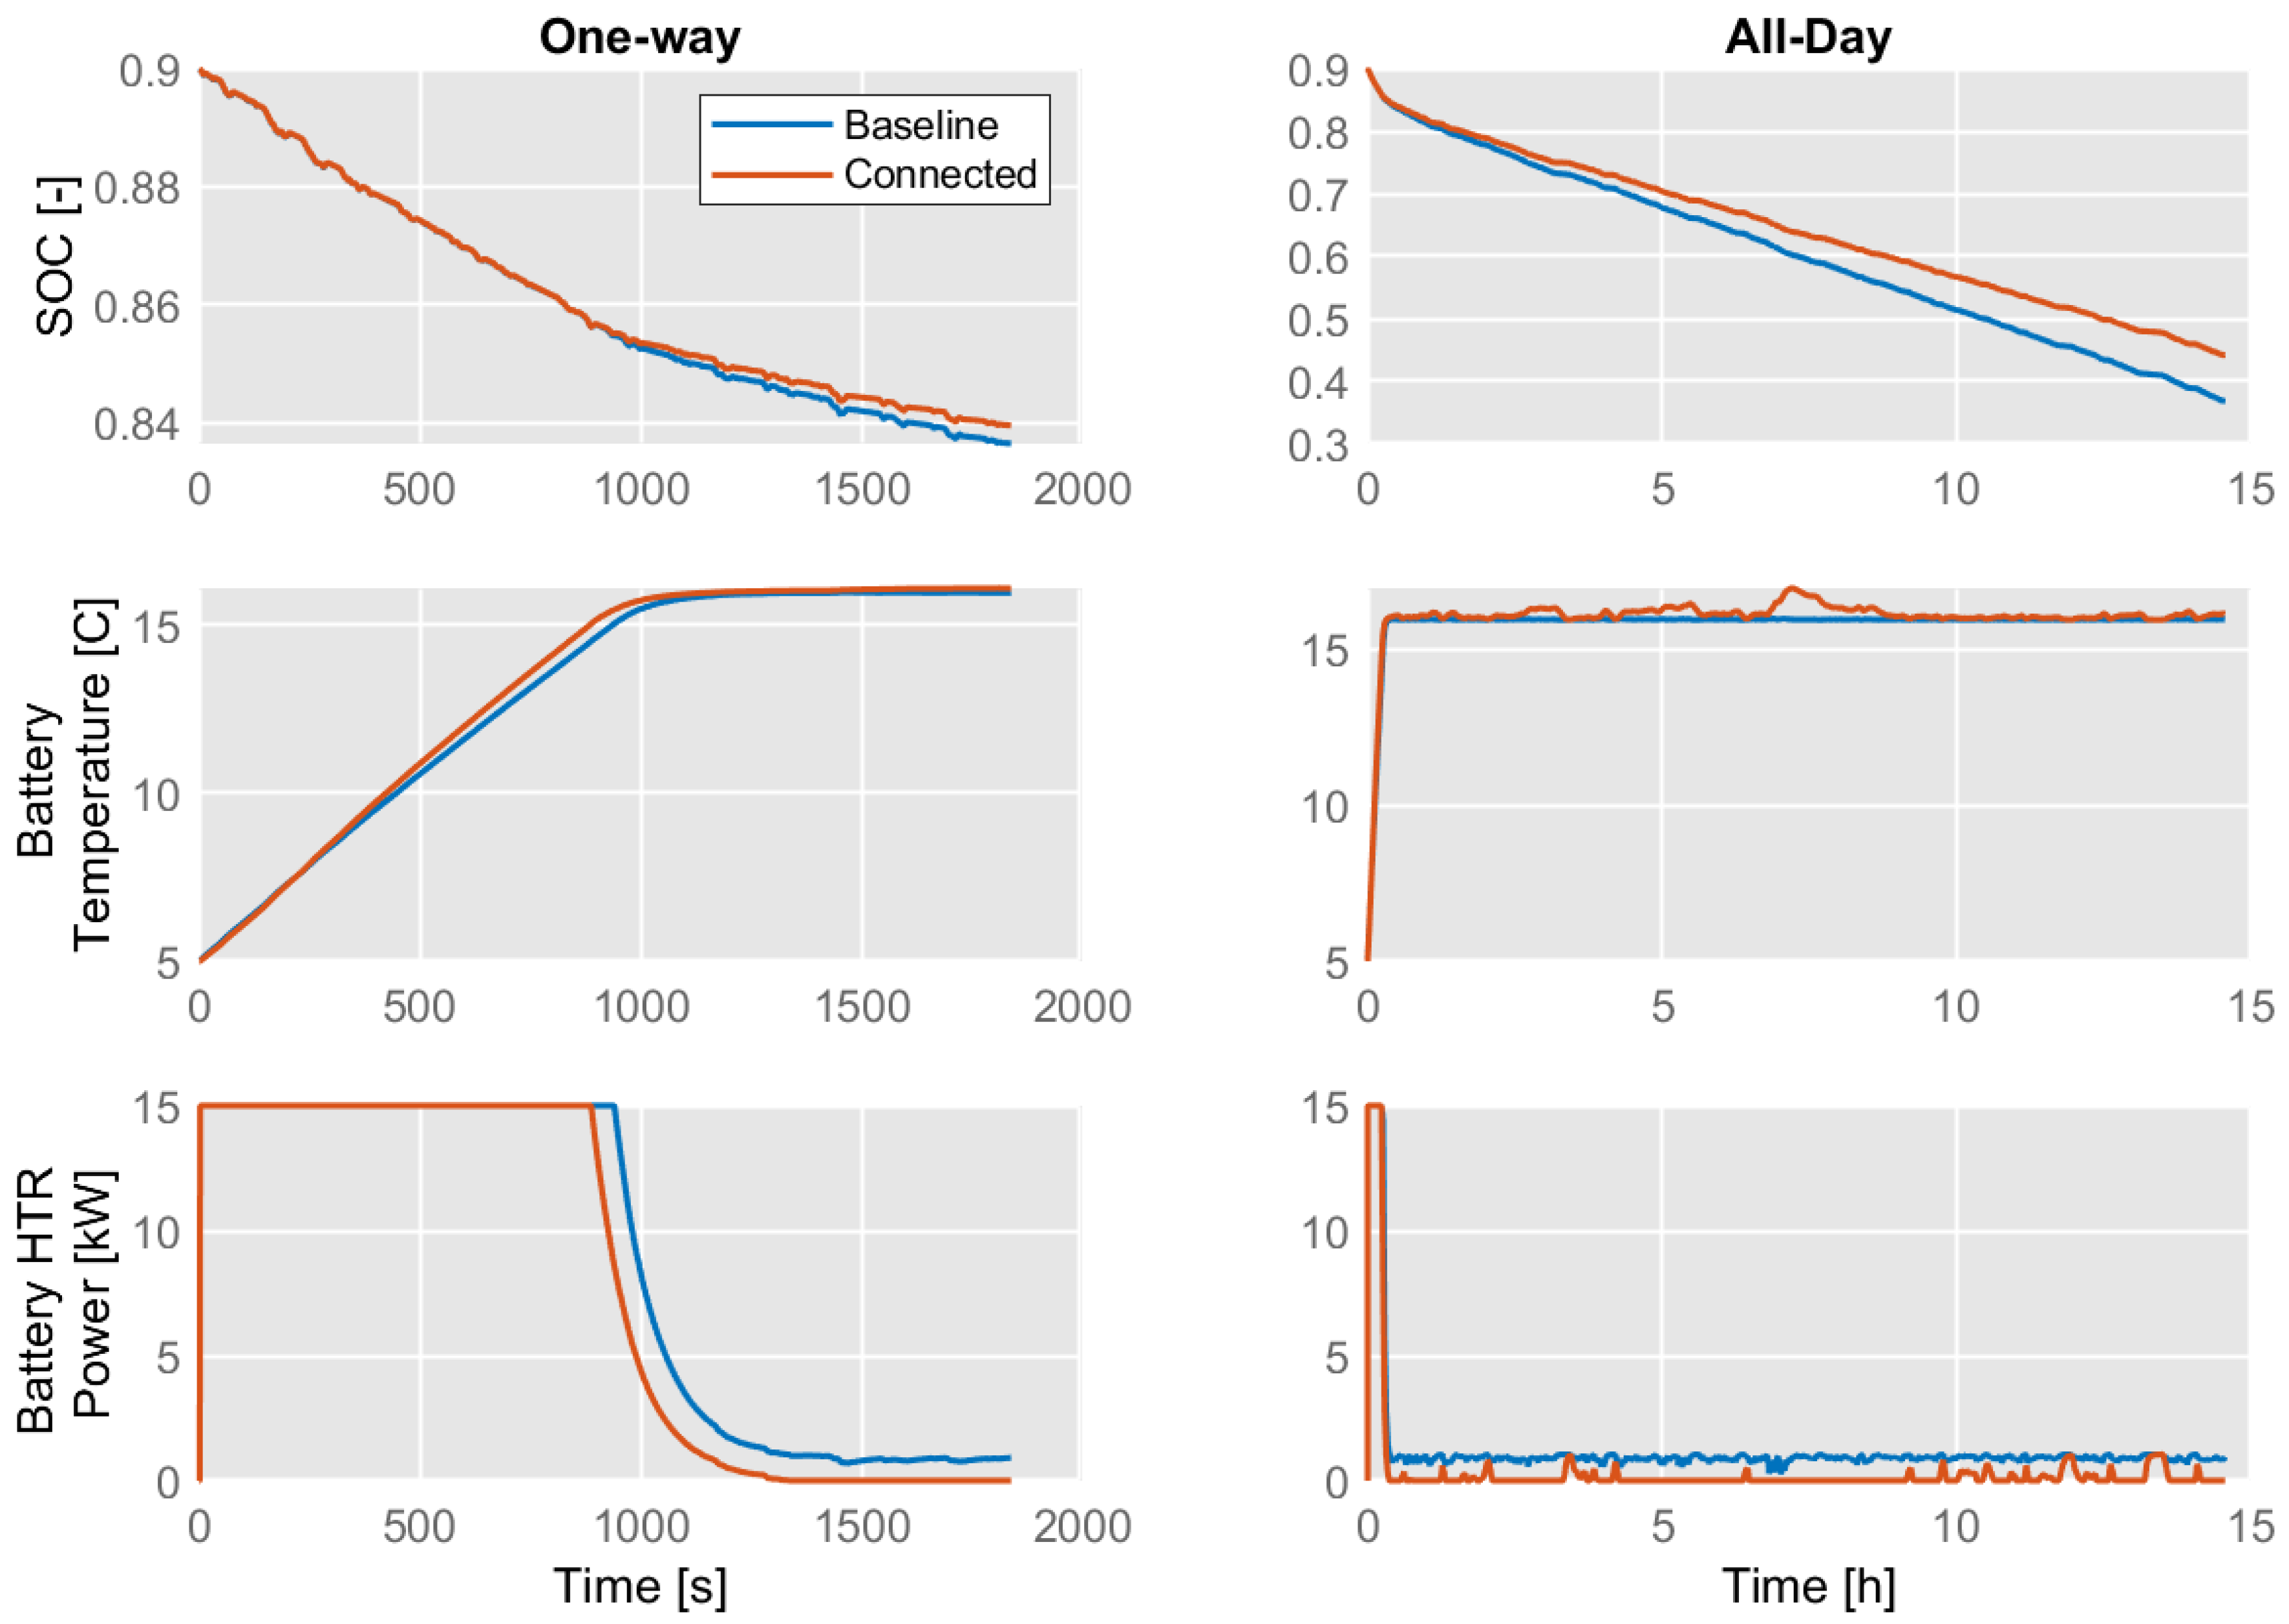
Figure 21 shows the change in battery SOC, temperature, and heater power over time in an L18 driving cycle, comparing both hydraulic circuit configurations. Looking at the one-way results, there is a slight improvement in the Connected configuration, as it has 0.31% more SOC than the Baseline configuration at the end of the drive. Analyzing the behavior of the two SOC curves, it can be seen that they overlap until about 900 s after the beginning of the trip, and then, they start to diverge.
The inflection point occurs when the battery reaches the target temperature of 16 °C almost one minute earlier in the Connected configuration, which is due to the heat supply from the motor. This can also be seen in the heater power curves, as the curve in the Connected configuration drops before the curve in the Baseline configuration. Furthermore, the change in the slope of the SOC curves is justified when looking at the heater power curves after the battery has reached the set temperature. The heater power curve of the Baseline setting remains between 0.8 and 1 kW. Since the battery exchanges heat with the environment by convection, which has a temperature of 5 °C, the heater must be operated at low power so that the battery does not cool down. In the Connected configuration, the heat supplied by the motor is responsible for counteracting the cooling of the environment.
Looking at the figures on the right-hand side of Figure 21, a similar analysis can be performed, but for a full journey of bus route 18. As expected, the Connected configuration was able to save more battery energy, resulting in 7.37% more SOC than the Baseline configuration. The slope of the SOC curve of the Connected configuration is lower than that of the Baseline configuration during almost the entire driving cycle, which can be explained by looking at the power curves of the electric heater, which stays on during the whole journey in the case of the Baseline configuration. As for the battery temperature, it is noted that the Connected curve shows small fluctuations. These temperature rises coincide with the moments when the bus reaches its highest speeds during the day, resulting in greater heat generation by the electric motor. However, these small temperature fluctuations at a maximum of 1 °C do not affect the battery’s performance or aging.
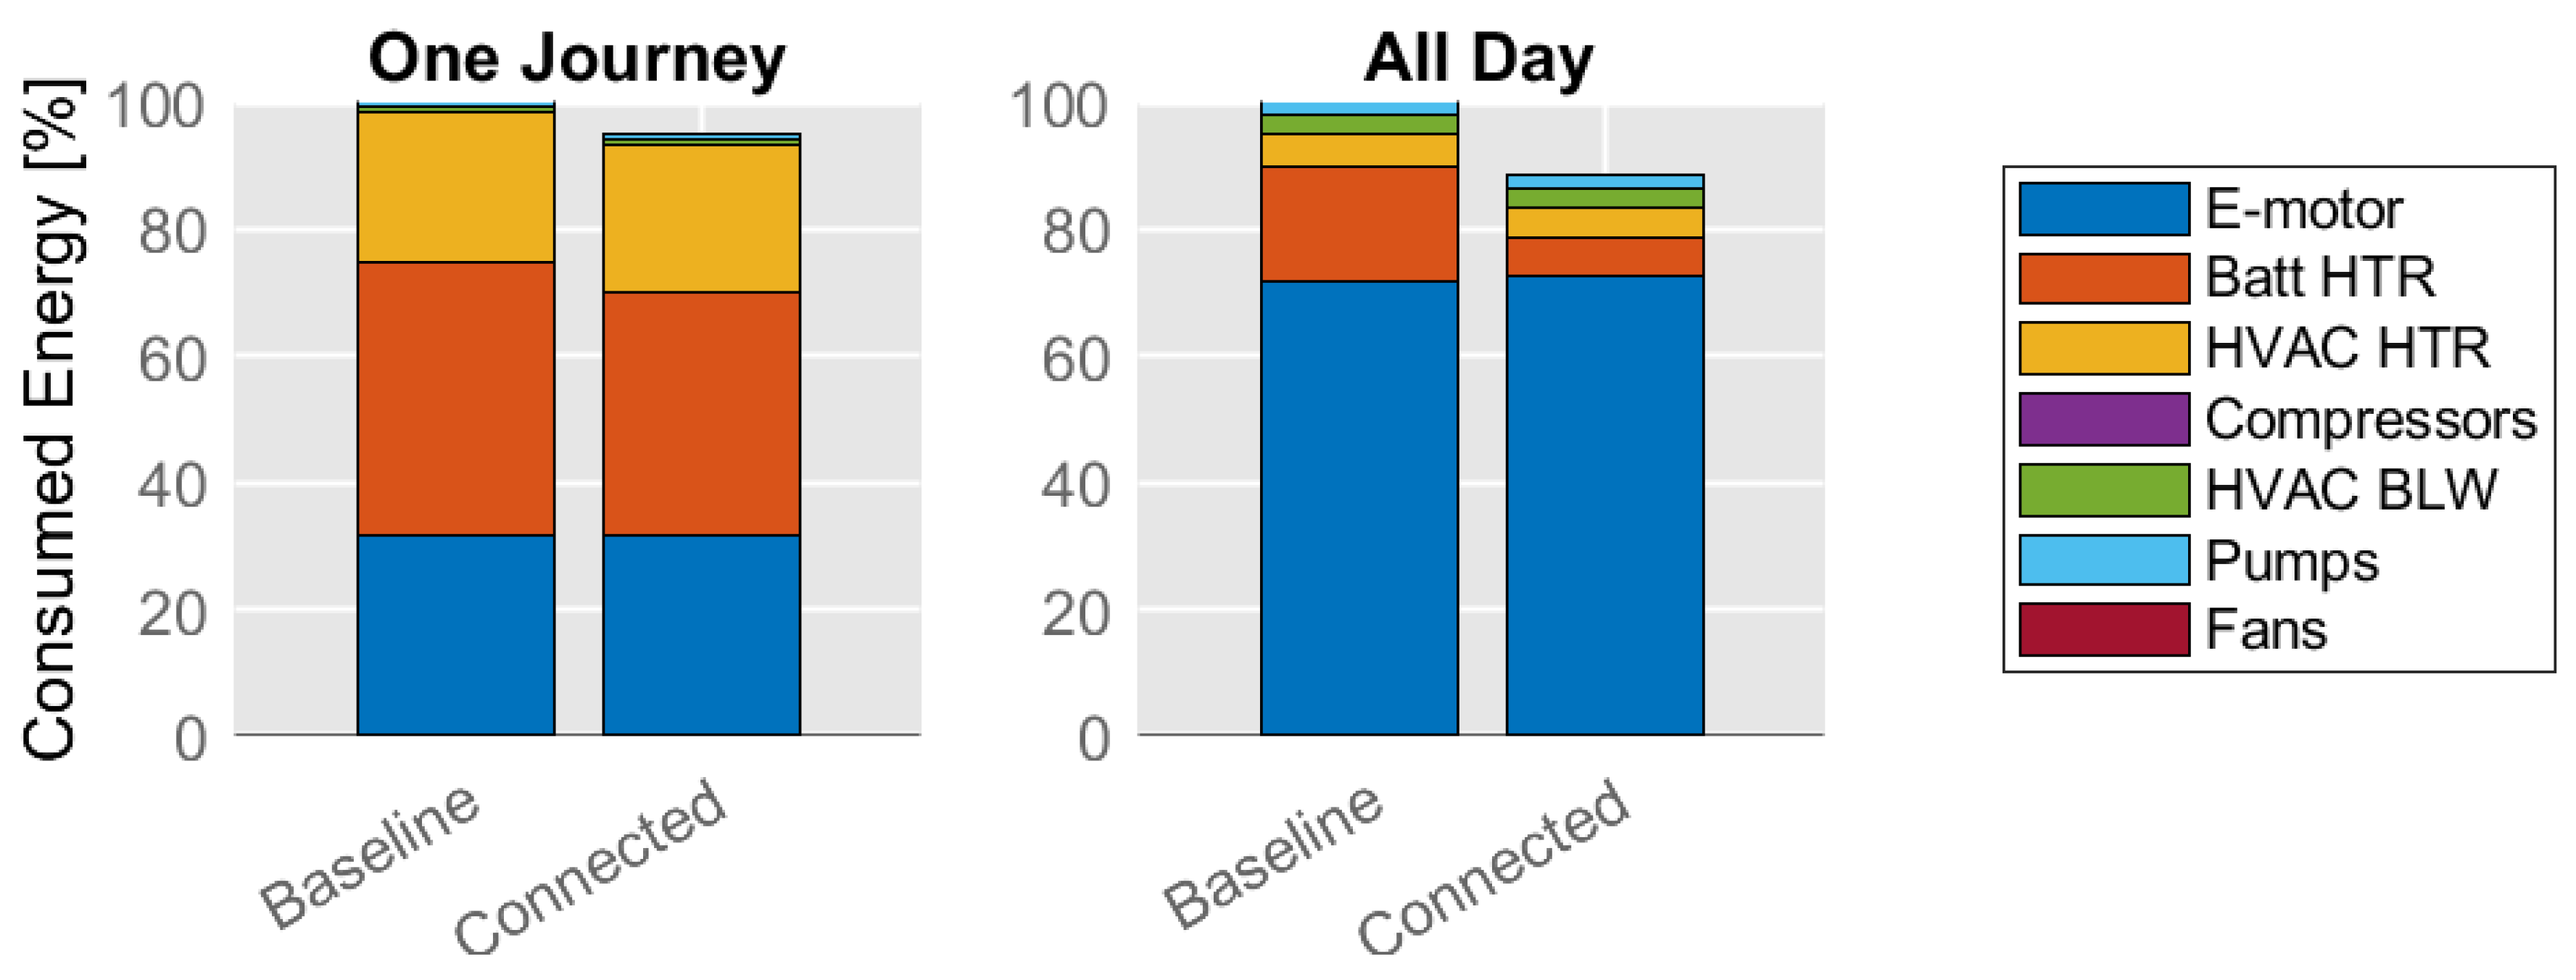
Figure 22 shows the global energy consumption balance of the electric bus. Looking at the chart on the left, which corresponds to a one-way journey of route 18, several aspects can be analyzed. Firstly, it confirms the aforementioned fact that the Connected configuration has the greatest energy saving with a 5% lower energy consumption compared to the Baseline configuration. Figure 22 also shows the distribution of energy of the bus, where the electric heaters of the battery and the cabin are the components that consume the most energy, even more than the electric motor. For this reason, it is justified to study how to reduce the consumption of these electrical elements, for example, by developing new thermohydraulic configurations or by using alternative heating systems that are more efficient.
Looking at the all-day chart, it is concluded that the electric motor consumes the most energy, with more than 70% of the consumption, while the heaters take a smaller share compared to the results of a one-way trip, since the heaters require more power at the beginning of the cycle to reach the optimal battery and cabin temperature. In addition, there is the impact on the consumption of elements such as the fans of the HVAC system and the pumps of the hydraulic circuits, which have low power but are in constant operation during the entire driving cycle and eventually account for a not insignificant part of the total energy consumption.
3.3. Heating the Cabin with Heat Pump System
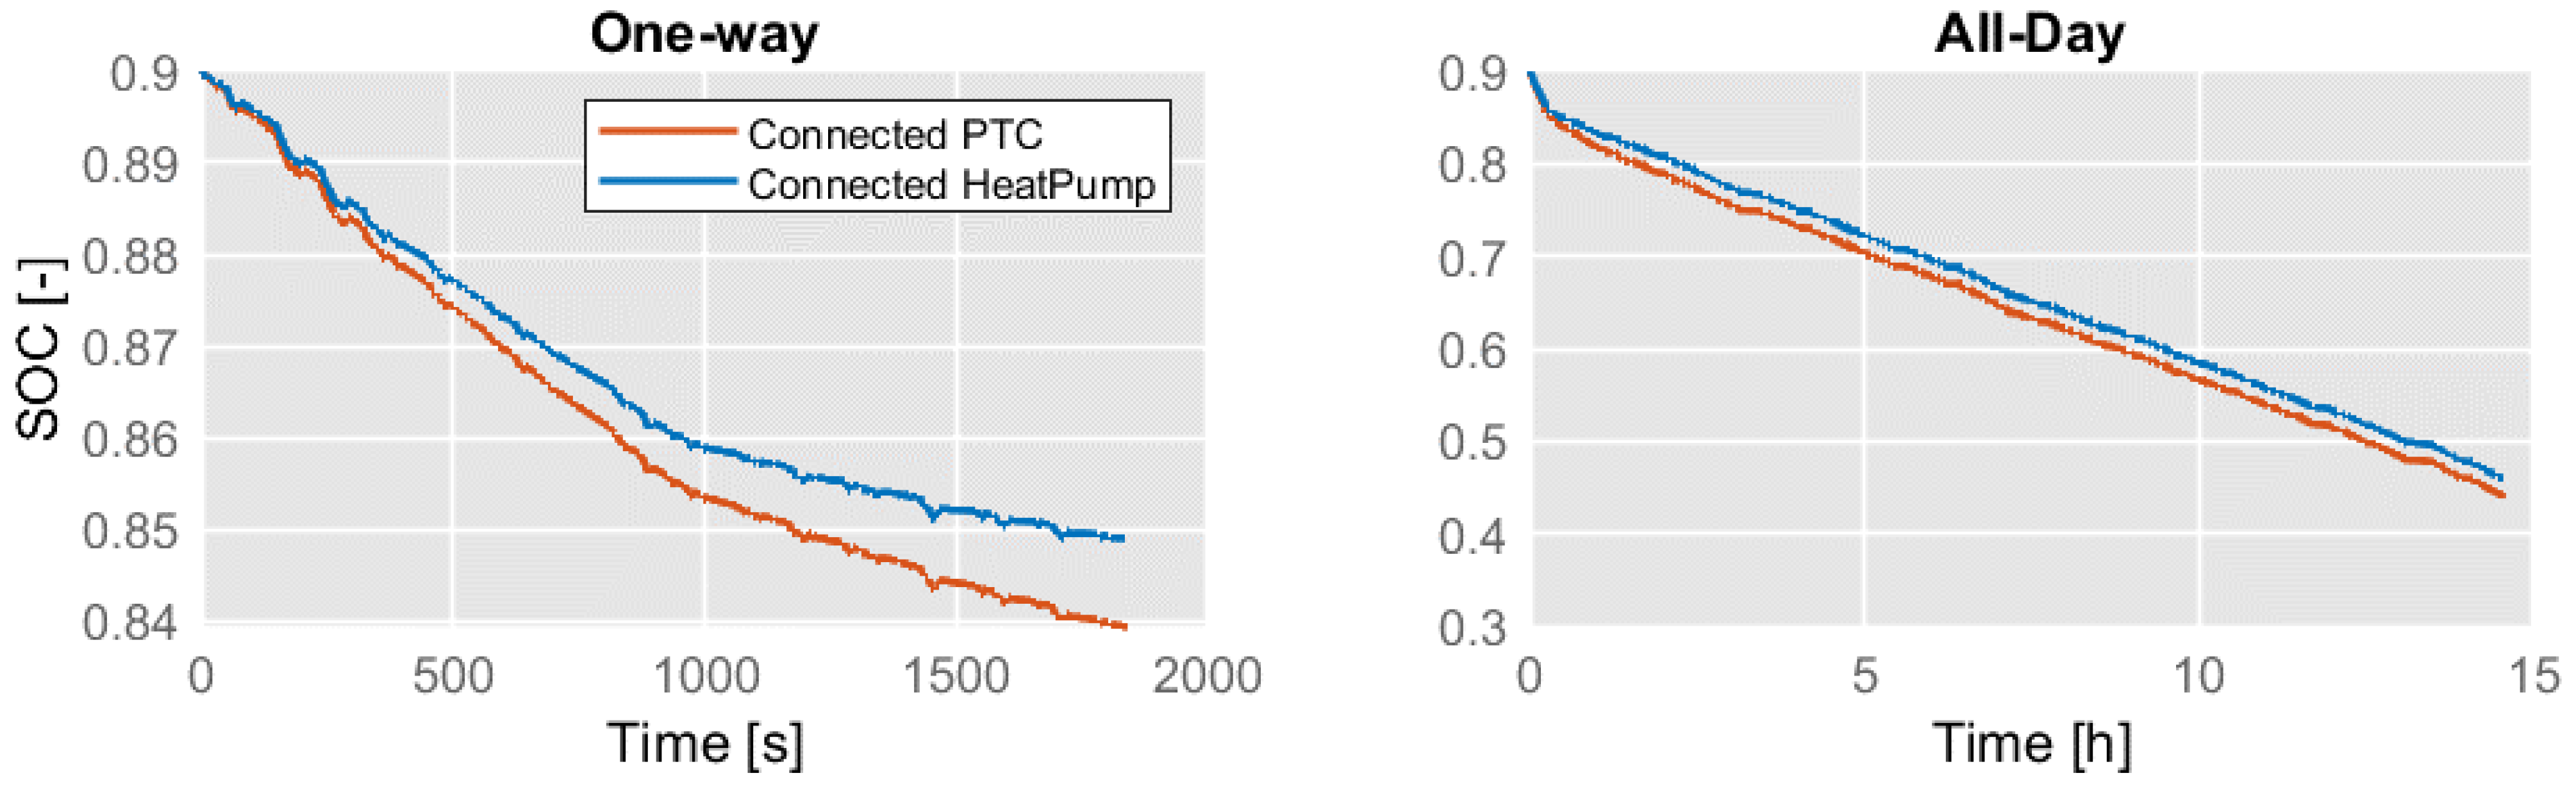
Besides analyzing different configurations of hydraulic systems, other alternatives to improve the energy efficiency of an electric bus may be to replace systems or elements with more efficient ones. In this study, the electric heater was replaced by a heat pump system to heat the cabin of the electric bus. Figure 23 shows the curves of the state of charge of the battery for the different cabin heating systems during the driving cycle of route 18. For a one-way journey of route 18, the heat pump heating system saves more SOC than the PTC electric heating system. This is because heat pump systems have a higher coefficient of performance than electric heaters. Although the heat pump system is more complex and expensive than electric heating, an electric bus also needs air conditioning in summer to cool the interior. It would be best to take advantage of this system and use it as a heat pump when needed. Looking at the all-day graph, we can conclude that the Connected configuration with a heat pump system gives the best results, as it saves the most SOC.
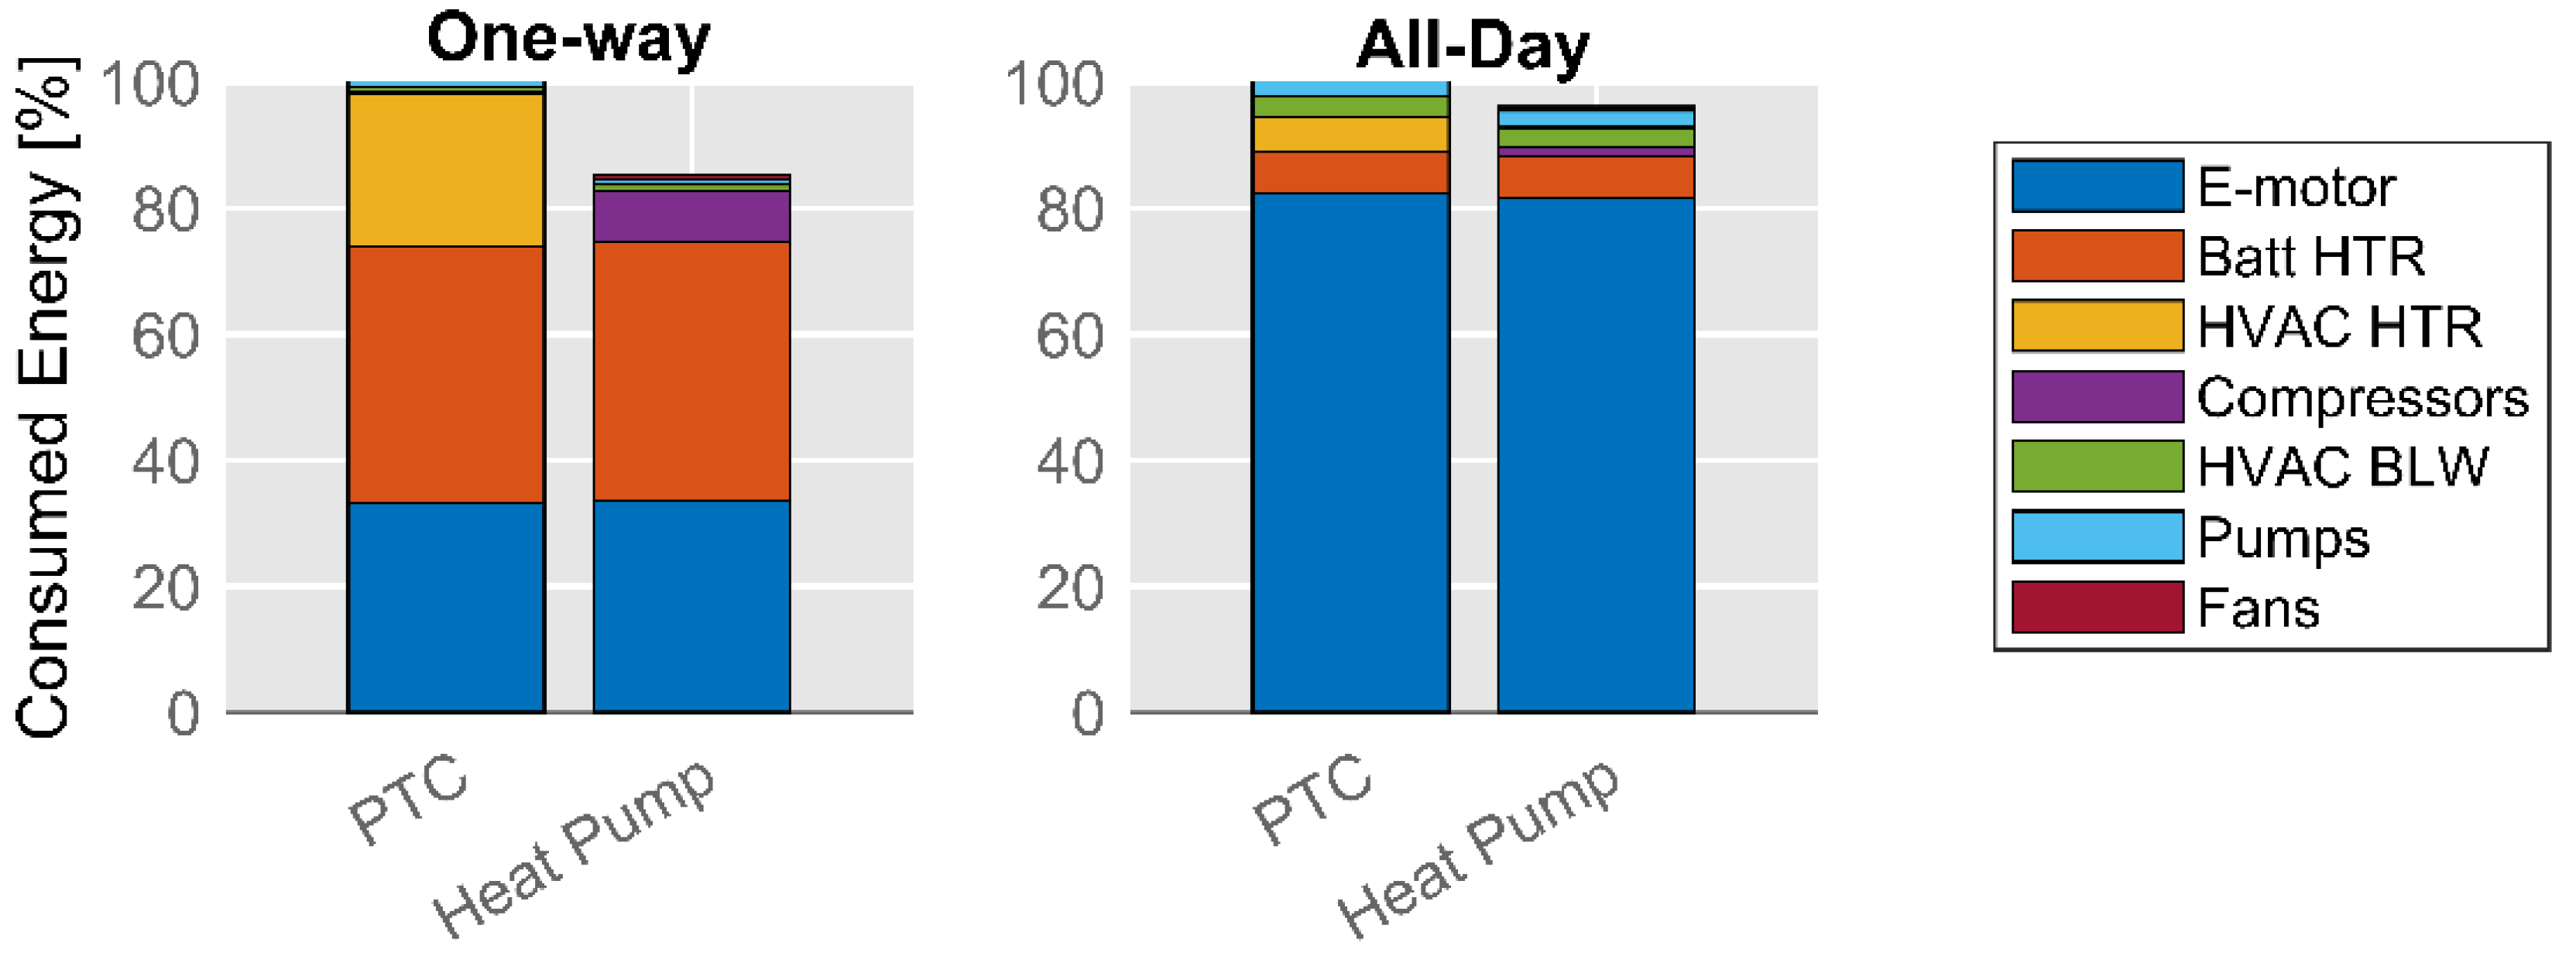
As with the comparison of the thermohydraulic circuits, Figure 24 shows the global energy balance of the bus with the Connected configuration using PTC and heat pump after the driving cycle of route 18. Looking at the bar chart of a one-way journey, a consumption reduction with the heat pump system of almost 15% can be seen compared to the PTC heating. The consumption of the heat pump system is due to the electricity consumption of the compressors, which is shown in purple. Looking at the results of an entire day on route 18, it is concluded that the heat pump system saves almost 3.9% of the consumed energy compared to the PTC electric heater. In this case, the difference in percentage energy savings compared to the one-way chart is large because the heating systems were only in operation during the first journey, when the comfort temperature in the cabin was reached. This model does not take into account the infiltration of air into the cabin, nor the renewal of non-air-conditioned air from outside by opening doors and windows, such that the air is constantly circulating and there are no heat losses other than those caused by convection through the walls and windows of the bus.
3.4. Simulations with Demanding Driving Cycle
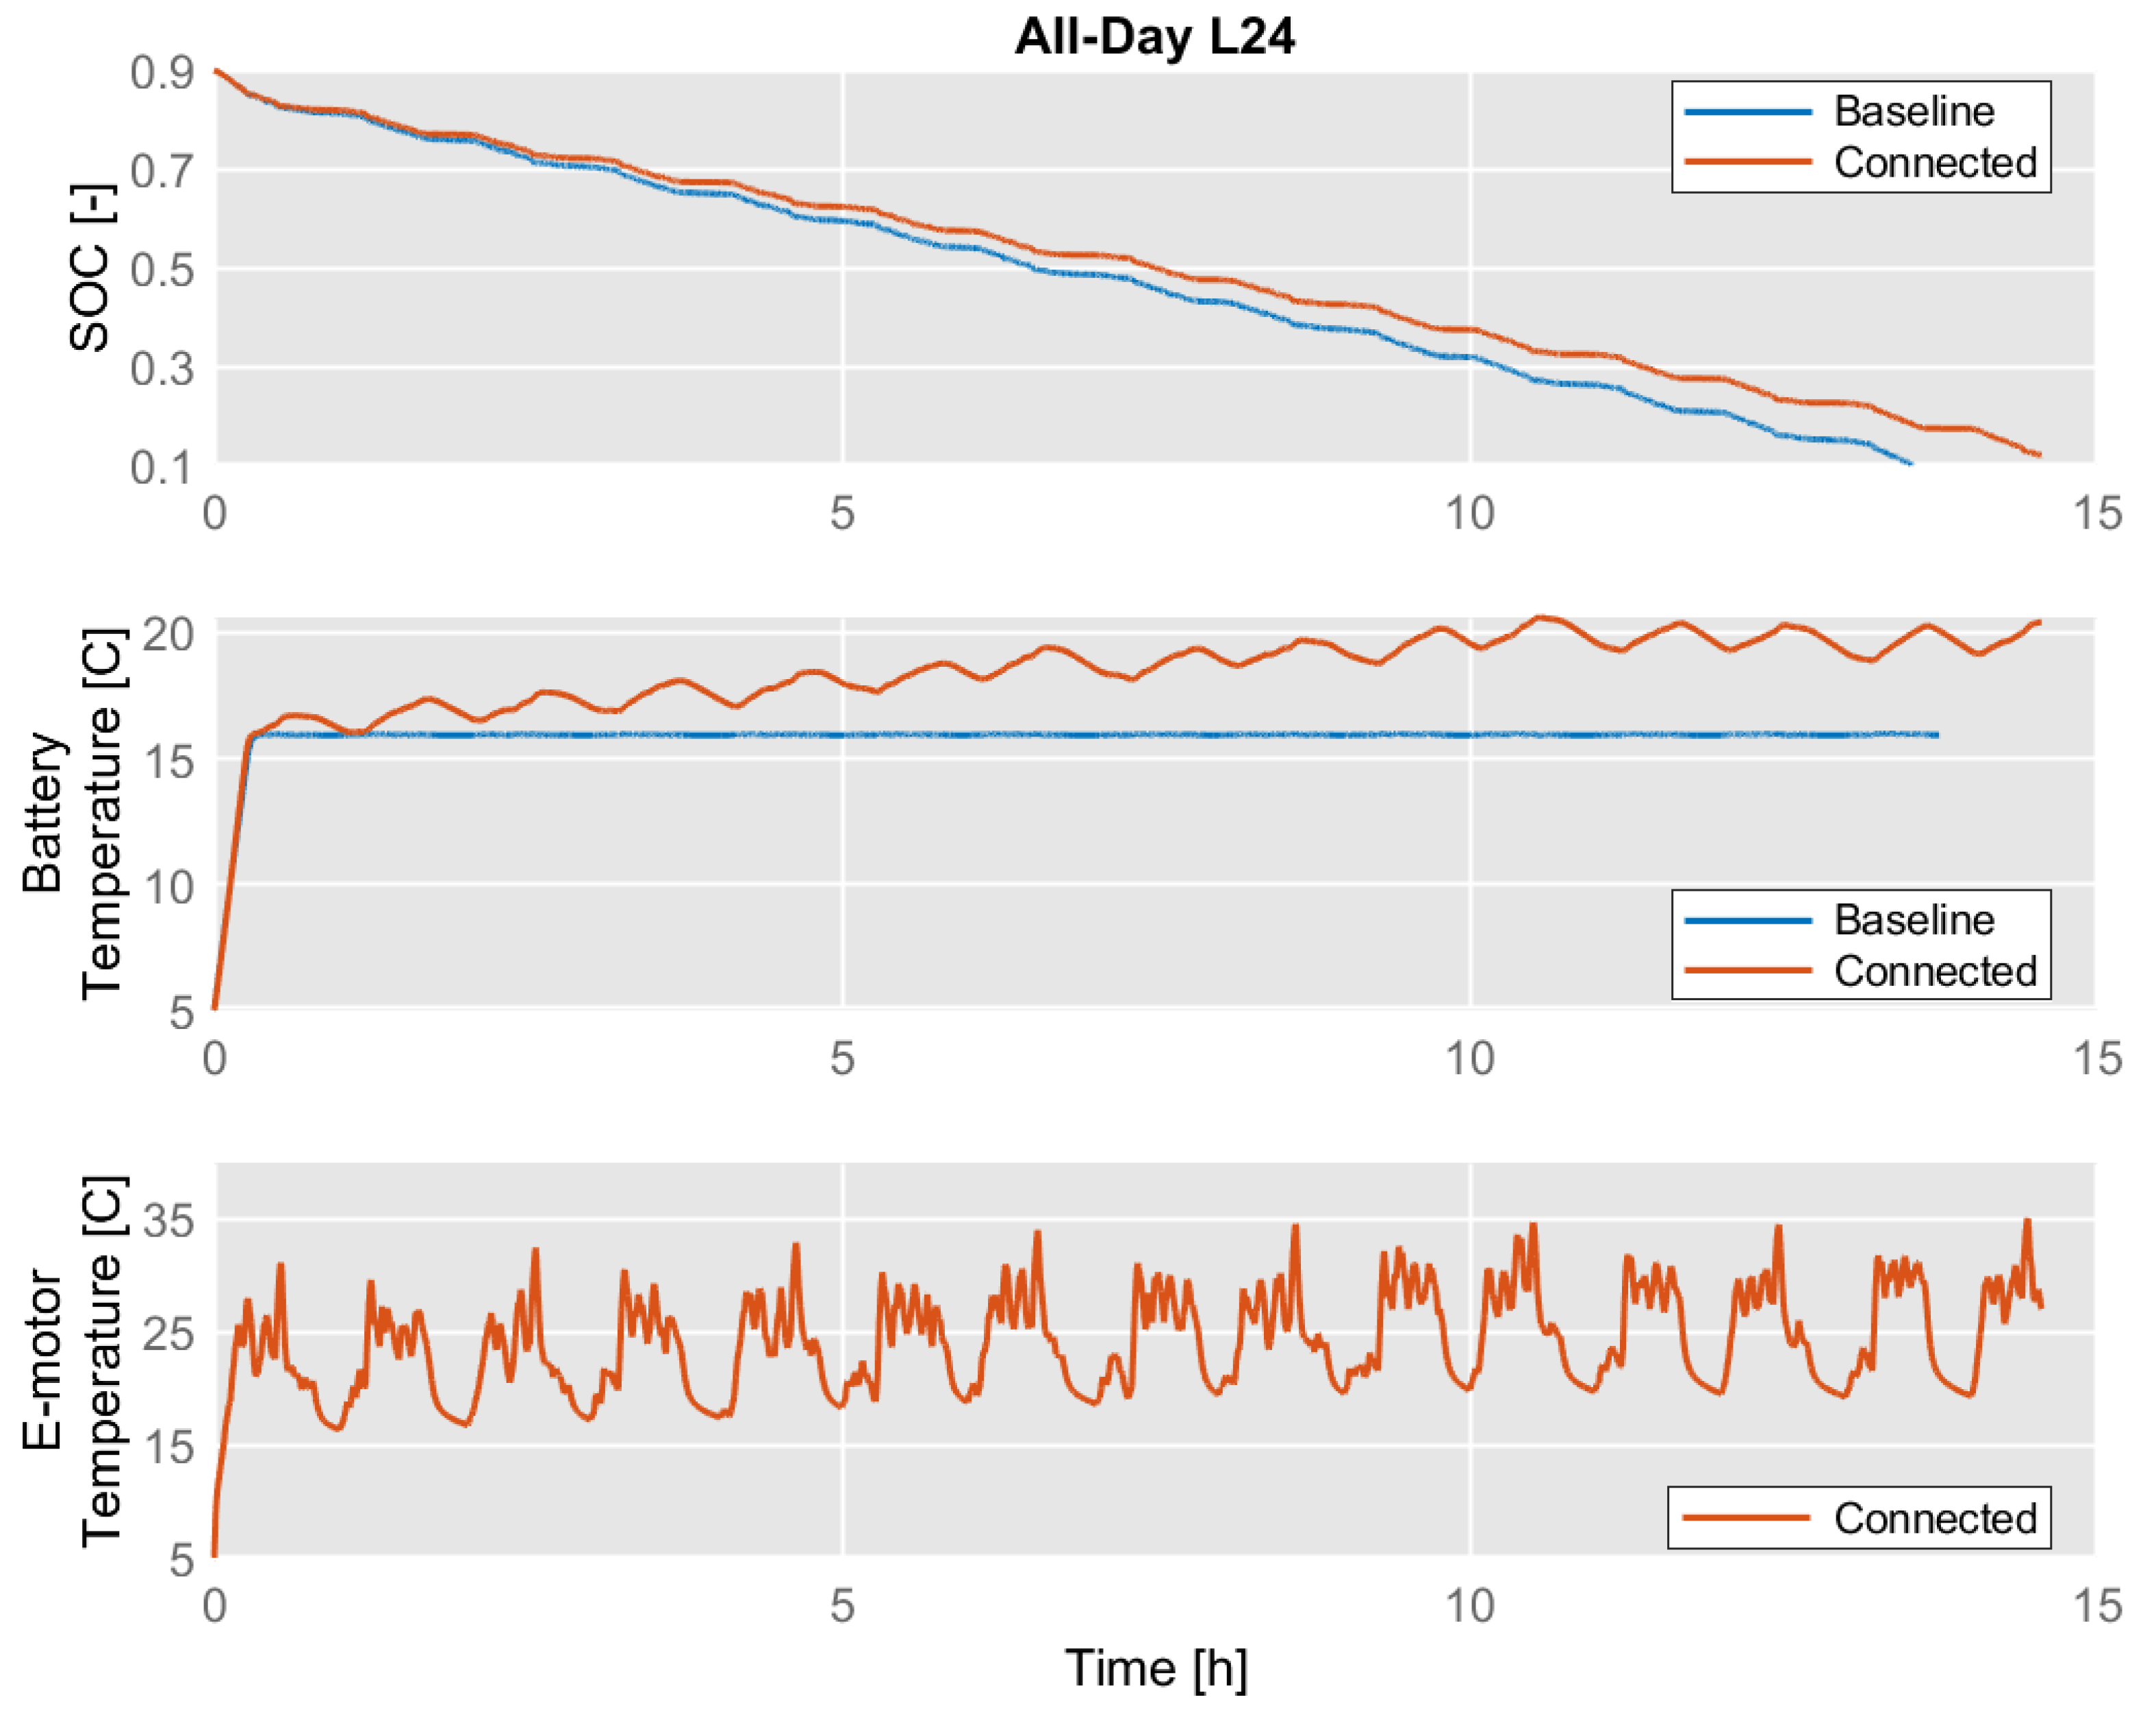
Finally, simulations were carried out with a driving cycle of EMT route 24, which is much more demanding in terms of torque and speed compared to that of route 18, but with very similar duration of the whole journey. Figure 25 shows SOC and battery temperature curves with both configurations and the electric motor temperature curve with the Connected configuration during the driving cycle of route 24. The upper graph shows that with the Baseline configuration, the bus cannot end the driving cycle because it exceeds the lower limit of SOC, which has been set to 0.1. In contrast, the Connected configuration can complete the cycle with 0.12 SOC. This result is interesting, as it is a driving cycle currently performed by the EMT bus fleet, which consists of conventional or hybrid buses that do not have these autonomy constraints. In view of this, less demanding routes should be set up for fully electric buses so that they do not have autonomy problems. Another solution would be to develop buses with higher-capacity battery packs, which would mean higher battery costs, weight and volume.
Another aspect of these results is the temperature of the battery in the Connected configuration, which continues to rise throughout the driving cycle. This can be explained by looking at the temperature curve of the motor, which is extremely sensitive to the driving cycle; thus, with this faster cycle, the motor temperature increases dramatically and so does the temperature of the battery. In wintry weather conditions, the temperature of the battery is kept within a safe and optimal temperature range, but in hotter weather conditions, this temperature rise could be problematic; thus, this Connected configuration would not be the preferred option. Therefore, the most convenient configuration would be to consider a hybrid solution. Depending on the requirements, it is possible to transition between both configurations using thermostat valves.
4. Conclusions
In this study, a comprehensive and novel 0D/1D model of an electric city bus was developed in GT-Suite using submodels preloaded in GT-Suite library, configured with experimental or characterized data, and with our own submodels integrated into the interface. The bus model was used to evaluate different operating conditions, configurations, and strategies for thermal management systems to achieve greater autonomy. For this purpose, simulations of real driving cycles of the public transport bus network in Valencia under wintry weather conditions were considered. Two driving cycles were chosen: route 18, which is an intercity service with medium/low speeds, and route 24, which has higher speeds for longer periods. Initially, a simulation was carried out in which no device was used to heat the bus battery. Based on these results, it was found that the lithium-ion batteries of this type of vehicle, which have such a high nominal capacity to achieve the required autonomy, are very weighty and therefore have an extremely high thermal inertia. For this reason, it is difficult for them to warm up quickly to optimal operating temperatures in cold weather conditions. Therefore, the use of electric heaters in the battery pack’s cooling system, which can increase the battery temperature to optimal ranges in a matter of minutes, is justified. In addition, it has been found that the heat dissipated by the electric motor can be used to preheat the battery.
The two thermal hydraulic circuit proposals defined for the study were then compared. It was found that for route 18 in wintry weather conditions, the “Connected” configuration was the most favorable, as it achieved a savings of 11.4% in energy consumption compared to the “Baseline” configuration during a full day of driving. In addition, the electric heaters account for a large part of the vehicle’s total energy consumption, especially during the first journey when it is necessary to quickly raise the temperature of the battery and the cabin to optimal levels.
Systems for heating bus cabins such as PTC electric heaters and heat pump systems were also compared. It was found that the heat pump system achieves a savings of 3.9% at the end of a full day of operation on route 18 compared to PTC electric heating. Furthermore, the choice of this type of system is justified, as the reverse operation is used to cool the cabin air when conditions require it.
Finally, simulations were carried out with a more demanding driving cycle, such as that of route 24 of the EMT. Based on these results, it was found that the model with the Baseline configuration could not complete the driving cycle, as it exceeded the lower limit of SOC, which is 10%. With the Connected configuration, the driving cycle was barely completed, leaving the battery with 12% of SOC. The analysis of these results leads to the conclusion that the problem of autonomy is particularly important for this type of vehicle; thus, despite the improvements that can be made in terms of efficiency, the choice of driving cycles for this type of vehicle must be very well studied. Additionally, this study verifies the importance of thermal management in electric buses and highlights the need to study integrated thermal management solutions.
Author Contributions
Conceptualization, A.B.; methodology, A.B., P.O. and S.A.; software, S.A.; formal analysis, P.O., P.B. and S.A.; investigation, S.A.; writing—original draft preparation, S.A.; writing—review and editing, P.O., P.B. and S.A.; supervision, A.B., P.O. and P.B. All authors have read and agreed to the published version of the manuscript.
Funding
This work was supported by Generalitat Valenciana within the framework of the PROMETEO 2020 project “Contribution to the decarbonization of transport by optimizing the thermal management of vehicle batteries electrified” with reference number PROMETEO/2020/042.
Institutional Review Board Statement
Not applicable.
Informed Consent Statement
Not applicable.
Data Availability Statement
Not applicable.
Acknowledgments
The authors gratefully acknowledge the support of EMT Valencia for providing the driving cycles of its fleet on routes 18 and 24.
Conflicts of Interest
The authors declare no conflict of interest.
References
- Ritchie, H.; Roser, M.; Rosado, P. CO₂ and Greenhouse Gas Emissions. 2020. Available online: https://ourworldindata.org/co2-and-other-greenhouse-gas-emissions (accessed on 7 June 2022).
- Nanaki, E.A.; Koroneos, C.J. Climate change mitigation and deployment of electric vehicles in urban areas. Renew. Energy 2016, 99, 1153–1160. [Google Scholar] [CrossRef]
- Densing, M.; Turton, H.; Bäuml, G. Conditions for the successful deployment of electric vehicles—A global energy system perspective. Energy 2012, 47, 137–149. [Google Scholar] [CrossRef]
- Pla, B.; Piqueras, P.; Bares, P.; Aronis, A. Simultaneous NOx and NH3 slip prediction in a SCR catalyst under real driving conditions including potential urea injection failures. Int. J. Engine Res. 2022, 23, 1213–1225. [Google Scholar] [CrossRef]
- Keller, V.; Lyseng, B.; Wade, C.; Scholtysik, S.; Fowler, M.; Donald, J.; Palmer-Wilson, K.; Robertson, B.; Wild, P.; Rowe, A. Electricity system and emission impact of direct and indirect electrification of heavy-duty transportation. Energy 2019, 172, 740–751. [Google Scholar] [CrossRef]
- Das, H.S.; Rahman, M.M.; Li, S.; Tan, C.W. Electric vehicles standards, charging infrastructure, and impact on grid integration: A technological review. Renew. Sustain. Energy Rev. 2020, 120, 109618. [Google Scholar] [CrossRef]
- Galindo, J.; Climent, H.; la Morena J de González-Domínguez, D.; Guilain, S.; Besançon, T. Assessment of air-management strategies to improve the transient performance of a gasoline engine under high EGR conditions during load-decrease operation. Int. J. Engine Res. 2021, 1–15. [Google Scholar] [CrossRef]
- Manzolli, J.A.; Trovão, J.P.; Antunes, C.H. A review of electric bus vehicles research topics—Methods and trends. Renew. Sustain. Energy Rev. 2022, 159, 112211. [Google Scholar] [CrossRef]
- Mahmoud, M.; Garnett, R.; Ferguson, M.; Kanaroglou, P. Electric buses: A review of alternative powertrains. Renew. Sustain. Energy Rev. 2016, 62, 673–684. [Google Scholar] [CrossRef]
- Teichert, O.; Chang, F.; Ongel, A.; Lienkamp, M. Joint Optimization of Vehicle Battery Pack Capacity and Charging Infrastructure for Electrified Public Bus Systems. IEEE Trans. Transp. Electrif. 2019, 5, 672–682. [Google Scholar] [CrossRef]
- Zhang, X.; Xie, J.; Rao, R.; Liang, Y. Policy incentives for the adoption of electric vehicles across countries. Sustainability 2014, 6, 8056–8078. [Google Scholar] [CrossRef]
- Carroll, P.; Caulfield, B.; Ahern, A. Measuring the potential emission reductions from a shift towards public transport. Transp. Res. Part D Transp. Environ. 2019, 73, 338–351. [Google Scholar] [CrossRef]
- Santos, G.; Davies, H. Incentives for quick penetration of electric vehicles in five European countries: Perceptions from experts and stakeholders. Transp. Res. Part A Policy Pract. 2020, 137, 326–342. [Google Scholar] [CrossRef]
- Liu, D.; Xiao, B. Exploring the development of electric vehicles under policy incentives: A scenario-based system dynamics model. Energy Policy 2018, 120, 8–23. [Google Scholar] [CrossRef]
- Lévay, P.Z.; Drossinos, Y.; Thiel, C. The effect of fiscal incentives on market penetration of electric vehicles: A pairwise comparison of total cost of ownership. Energy Policy 2017, 105, 524–533. [Google Scholar] [CrossRef]
- Hardman, S.; Chandan, A.; Tal, G.; Turrentine, T. The effectiveness of financial purchase incentives for battery electric vehicles—A review of the evidence. Renew. Sustain. Energy Rev. 2017, 80, 1100–1111. [Google Scholar] [CrossRef]
- Abdelaty, H.; Mohamed, M. A prediction model for battery electric bus energy consumption in transit. Energies 2021, 14, 2824. [Google Scholar] [CrossRef]
- Topić, J.; Soldo, J.; Maletić, F.; Škugor, B.; Deur, J. Virtual simulation of electric bus fleets for city bus transport electrification planning. Energies 2020, 13, 3410. [Google Scholar] [CrossRef]
- An, K. Battery electric bus infrastructure planning under demand uncertainty. Transp. Res. Part C Emerg. Technol. 2020, 111, 572–587. [Google Scholar] [CrossRef]
- Gao, Y.; Yang, J.; Yang, M.; Li, Z. Deep Reinforcement Learning Based Optimal Schedule for a Battery Swapping Station Considering Uncertainties. IEEE Trans. Ind. Appl. 2020, 56, 5775–5784. [Google Scholar] [CrossRef]
- Wang, Y.; Gao, Q.; Zhang, T.; Wang, G.; Jiang, Z.; Li, Y. Advances in integrated vehicle thermal management and numerical simulation. Energies 2017, 10, 1636. [Google Scholar] [CrossRef]
- Liang, K.; Wang, M.; Gao, C.; Dong, B.; Feng, C.; Zhou, X.; Liu, J. Advances and challenges of integrated thermal management technologies for pure electric vehicles. Sustain. Energy Technol. Assess. 2021, 46, 101319. [Google Scholar] [CrossRef]
- Shelly, T.J.; Weibel, J.A.; Ziviani, D.; Groll, E.A. Comparative analysis of battery electric vehicle thermal management systems under long-range drive cycles. Appl. Therm. Eng. 2021, 198, 117506. [Google Scholar] [CrossRef]
- Ma, J.; Sun, Y.; Zhang, S.; Li, J.; Li, S. Experimental study on the performance of vehicle integrated thermal management system for pure electric vehicles. Energy Convers. Manag. 2022, 253, 115183. [Google Scholar] [CrossRef]
- Guo, J.; Jiang, F. A novel electric vehicle thermal management system based on cooling and heating of batteries by refrigerant. Energy Convers. Manag. 2021, 237, 114145. [Google Scholar] [CrossRef]
- Xia, G.; Cao, L.; Bi, G. A review on battery thermal management in electric vehicle application. J. Power Sources 2017, 367, 90–105. [Google Scholar] [CrossRef]
- Lajunen, A.; Kalttonen, A. Investigation of thermal energy losses in the powertrain of an electric city bus. In Proceedings of the IEEE Transportation Electrification Conference and Expo (ITEC), Dearborn, MI, USA, 14–17 June 2015. [Google Scholar] [CrossRef]
- Wu, X.; Lv, S.; Chen, J. Determination of the optimum heat transfer coefficient and temperature rise analysis for a lithium-ion battery under the conditions of Harbin city bus driving cycles. Energies 2017, 10, 1723. [Google Scholar] [CrossRef] [Green Version]
- Angermeier, S.; Ketterer, J.; Karcher, C. Liquid-Based Battery Temperature Control of Electric Buses. Energies 2020, 13, 4990. [Google Scholar] [CrossRef]
- Sandrini, G.; Gadola, M.; Chindamo, D. Longitudinal dynamics simulation tool for hybrid apu and full electric vehicle. Energies 2021, 14, 1207. [Google Scholar] [CrossRef]
- Zecchi, L.; Sandrini, G.; Gadola, M.; Chindamo, D. Modeling of a Hybrid Fuel Cell Powertrain with Power Split Logic for Onboard Energy Management Using a Longitudinal Dynamics Simulation Tool. Energies 2022, 15, 6228. [Google Scholar] [CrossRef]
- Yang, Y.; Bilgin, B.; Kasprzak, M.; Nalakath, S.; Sadek, H.; Preindl, M.; Cotton, J.; Schofield, N.; Emadi, A. Thermal management of electric machines. IET Electr. Syst. Transp. 2017, 7, 104–116. [Google Scholar] [CrossRef] [Green Version]
- García, A.; Monsalve-Serrano, J.; Lago Sari, R.; Fogué Robles, Á. Numerical analysis of kinetic mechanisms for battery thermal runaway prediction in lithium-ion batteries. Int. J. Engine Res. 2021, 23, 1691–1707. [Google Scholar] [CrossRef]
- Zhang, J.; Zhang, L.; Sun, F.; Wang, Z. An Overview on Thermal Safety Issues of Lithium-ion Batteries for Electric Vehicle Application. IEEE Access 2018, 6, 23848–23863. [Google Scholar] [CrossRef]
- Zhang, S.S.; Xu, K.; Jow, T.R. The low temperature performance of Li-ion batteries. J. Power Sources 2003, 115, 137–140. [Google Scholar] [CrossRef]
- Petzl, M.; Kasper, M.; Danzer, M.A. Lithium plating in a commercial lithium-ion battery—A low-temperature aging study. J. Power Sources 2015, 275, 799–807. [Google Scholar] [CrossRef]
- Nemes, R.; Ciornei, S.; Ruba, M.; Hedesiu, H.; Martis, C. Modeling and simulation of first-order Li-Ion battery cell with experimental validation. In Proceedings of the International Conference on Modern Power Systems (MPS), Cluj, Romania, 21–23 May 2019. [Google Scholar] [CrossRef]
- Zhang, L.; Peng, H.; Ning, Z.; Mu, Z.; Sun, C. Comparative research on RC equivalent circuit models for lithium-ion batteries of electric vehicles. Appl. Sci. 2017, 7, 1002. [Google Scholar] [CrossRef] [Green Version]
- Broatch, A.; Olmeda, P.; Margot, X.; Agizza, L. A generalized methodology for lithium-ion cells characterization and lumped electro-thermal modelling. Appl. Therm. Eng. 2022, 217, 119174. [Google Scholar] [CrossRef]
- Meng, J.; Boukhnifer, M.; Diallo, D. Lithium-ion battery monitoring and observability analysis with extended equivalent circuit model. In Proceedings of the Mediterranean Conference on Control and Automation (MED), Saint-Raphaël, France, 15–18 September 2020; pp. 764–769. [Google Scholar] [CrossRef]
- Lu, L.; Han, X.; Li, J.; Hua, J.; Ouyang, M. A review on the key issues for lithium-ion battery management in electric vehicles. J. Power Sources 2013, 226, 272–288. [Google Scholar] [CrossRef]
- Balasundaram, M.; Ramar, V.; Yap, C.; Lu, L.; Tay, A.A.O.; Palani, B. Heat loss distribution: Impedance and thermal loss analyses in LiFePO4/graphite 18650 electrochemical cell. J. Power Sources 2016, 328, 413–421. [Google Scholar] [CrossRef]
- Sandrini, G.; Chindamo, D.; Gadola, M. Regenerative Braking Logic That Maximizes Energy Recovery Ensuring the Vehicle Stability. Energies 2022, 15, 5846. [Google Scholar] [CrossRef]
- Iqbal, A.; Moinoddin, S.; Reddy, B.P. Electrical Machine Fundamentals with Numerical Simulation using MATLAB/SIMULINK; John Wiley & Sons Ltd.: Hoboken, NJ, USA, 2021; ISBN 9781119682639. [Google Scholar] [CrossRef]
- Cavazzuti, M.; Gaspari, G.; Pasquale, S.; Stalio, E. Thermal management of a Formula E electric motor: Analysis and optimization. Appl. Therm. Eng. 2019, 157, 113733. [Google Scholar] [CrossRef]
- Torregrosa, A.J.; Broatch, A.; Olmeda, P.; Dreif, A. Assessment of the improvement of internal combustion engines cooling system using nanofluids and nanoencapsulated phase change materials. Int. J. Engine Res. 2021, 22, 1939–1957. [Google Scholar] [CrossRef]
- ASHRAE. 2020 ASHRAE Handbook SI Edition; ASHRAE: Atlanta, GA, USA, 2020; ISBN 1931862710. [Google Scholar]
- ASHRAE. 2019 ASHRAE Handbook—HVAC Applications, Chapter 35; ASHRAE: Atlanta, GA, USA, 2019; ISBN 9781947192133. [Google Scholar]
Figure 1.
The global model of the battery electric bus in GT-ISE.

Figure 2.
Integral thermal management system of the electric bus: Baseline configuration.

Figure 3.
Integral thermal management system of the electric bus: Connected configuration.

Figure 4.
Diagram of forces on the bus.

Figure 5.
First-order equivalent circuit model of a lithium-ion battery.

Figure 6.
Open circuit voltage test results.

Figure 7.
Ohmnic resistance () in charge and discharge from HPPC test @ 0–10 °C.

Figure 8.
Charge transfer resistance () in charge and discharge from HPPC test @ 0–10 °C.

Figure 9.
Double-layer capacitance () in charge and discharge from HPPC test @ 0–10 °C.

Figure 10.
Electrical and thermal model validation.

Figure 11.
Electrical and thermal model errors.

Figure 12.
Efficiency map of the 150 kW PMSM.

Figure 13.
PMSM lumped thermal model.

Figure 14.
Bus cabin model.

Figure 15.
Scheme of the air conditioning system circuit.

Figure 16.
Route 18 (EMT Valencia): (a) route, (b) one-way driving cycle, (c) all-day driving cycle.
Figure 16.
Route 18 (EMT Valencia): (a) route, (b) one-way driving cycle, (c) all-day driving cycle.

Figure 17.
Route 24 (EMT Valencia): (a) route, (b) one-way driving cycle, (c) all-day driving cycle.
Figure 17.
Route 24 (EMT Valencia): (a) route, (b) one-way driving cycle, (c) all-day driving cycle.

Figure 18.
(a) Battery temperature and (b) SOC variation throughout time for a one-way journey of the L18.
Figure 18.
(a) Battery temperature and (b) SOC variation throughout time for a one-way journey of the L18.

Figure 19.
(a) Battery heat losses and (b) battery terminal current variation throughout time for a one-way journey of the L18.
Figure 19.
(a) Battery heat losses and (b) battery terminal current variation throughout time for a one-way journey of the L18.

Figure 20.
Motor temperature variation throughout time for a one-way journey of the L18.

Figure 21.
Multivariable comparation between both thermohydraulic configuration throughout time for a one-way journey and all day of bus route 18.
Figure 21.
Multivariable comparation between both thermohydraulic configuration throughout time for a one-way journey and all day of bus route 18.

Figure 22.
Global energy balance of the electric bus for both configurations of thermo-hydraulic circuits.
Figure 22.
Global energy balance of the electric bus for both configurations of thermo-hydraulic circuits.

Figure 23.
SOC variation throughout time comparing the heating systems for the driving cycle of route 18.
Figure 23.
SOC variation throughout time comparing the heating systems for the driving cycle of route 18.

Figure 24.
Global energy balance of the electric bus for both cabin heater systems.

Figure 25.
Multivariable comparation between both thermohydraulic configuration throughout time for an all-day driving cycle of bus route 24.
Figure 25.
Multivariable comparation between both thermohydraulic configuration throughout time for an all-day driving cycle of bus route 24.


Table 1.
Characteristics of the modeled bus.
| Parameter | Value |
|---|---|
| Max. Vehicle Speed (km/h) | 70 |
| Operating Voltage (V) | 512 |
| Battery Capacity (Ah) | 680 |
| Max. PMSM Power (kW) | 150 |
| Max. PMSM Torque (Nm) | 550 |
| Max. Number of Passengers | 80 |
Table 2.
Vehicle parameters.
| Parameter | Value |
|---|---|
| Curb Weight (kg) | 13,200 |
| Frontal Area (m2) | 7.24 |
| Nominal Tire Width (mm) | 275 |
| Diameter of Wheel (in) | 22.5 |
| Gear Ratio | 21.779 |
| Drag Coefficient, Cd (-) | 0.79 |
| Rolling Resistance Coefficient, Cr (-) | 0.0094 |
Table 3.
Characteristics of the cell under study.
| Parameter | Value |
|---|---|
| Nominal Capacity (Ah) | 100 |
| Nominal Voltage (V) | 3.2 |
| Recommended SOC Window (%) | 10–90 |
| Weight (kg) | 2.1 |
| Length (mm) | 173.9 |
| Width (mm) | 28.8 |
| Height (mm) | 207.6 |
Table 4.
Bus geometric data summary.
| Description | Total Area (m2) | Thickness (mm) |
|---|---|---|
| Roof | 30 | 40 |
| Walls | 64 | 40 |
| Floor | 30 | 40 |
| Windows | 10 | 4 |
Table 5.
HVAC system features.
| Description | Value |
|---|---|
| Maximum PTC heater power (kW) | 30 |
| Nominal capacity of each evaporator (kW) | 9 |
| Nominal capacity of each condenser (kW) | 22 |
| Compressor max speed (rpm) | 7000 |
| Compressor displacement (L) | 0.028 |
Disclaimer/Publisher’s Note: The statements, opinions and data contained in all publications are solely those of the individual author(s) and contributor(s) and not of MDPI and/or the editor(s). MDPI and/or the editor(s) disclaim responsibility for any injury to people or property resulting from any ideas, methods, instructions or products referred to in the content. |
© 2022 by the authors. Licensee MDPI, Basel, Switzerland. This article is an open access article distributed under the terms and conditions of the Creative Commons Attribution (CC BY) license (https://creativecommons.org/licenses/by/4.0/).
Share and Cite
MDPI and ACS Style
Broatch, A.; Olmeda, P.; Bares, P.; Aceros, S. Integral Thermal Management Studies in Winter Conditions with a Global Model of a Battery-Powered Electric Bus. Energies 2023, 16, 168. https://doi.org/10.3390/en16010168
AMA Style
Broatch A, Olmeda P, Bares P, Aceros S. Integral Thermal Management Studies in Winter Conditions with a Global Model of a Battery-Powered Electric Bus. Energies. 2023; 16(1):168. https://doi.org/10.3390/en16010168
Chicago/Turabian StyleBroatch, Alberto, Pablo Olmeda, Pau Bares, and Sebastián Aceros. 2023. "Integral Thermal Management Studies in Winter Conditions with a Global Model of a Battery-Powered Electric Bus" Energies 16, no. 1: 168. https://doi.org/10.3390/en16010168
Note that from the first issue of 2016, this journal uses article numbers instead of page numbers. See further details here.