
Characterization of Sampled Value Streams in Non Real-Time Calibration Systems †

Laboratory of Electrical Energy and Power, Swiss Federal Institute of Metrology METAS, Lindenweg 50, 3003 Bern-Wabern, Switzerland
*
Author to whom correspondence should be addressed.
†
Any mention of commercial products within this paper is for information only; it does not imply recommendation or endorsement by METAS.
Energies 2022, 15(9), 3245; https://doi.org/10.3390/en15093245
Submission received: 13 April 2022
/
Revised: 25 April 2022
/
Accepted: 25 April 2022
/
Published: 28 April 2022
Abstract
:The digital transformation of electrical substations relies on the communication protocols introduced in the IEC Std 61850. In particular, the Sampled Value data format is expected to be employed in an ever-increasing number of measurement applications and devices. In this context, National Metrological Institutes are required to develop calibration infrastructures capable of dealing with synchronous analog and digital input and output channels. In this paper, we characterize the performance of the METAS calibrator in terms of transmission latency and publishing rate stability. In particular, we discuss the feasibility of meeting the stringent requirements of meterological applications even in a non real-time operating system. To this end, an enhanced software library and measurement procedure are introduced. The proposed results confirm the quasi-deterministic behavior of the calibrator and proves its refined precision and stability with respect to commercial devices.
1. Introduction
Modern power systems are characterized by an ever-increasing penetration of distributed generation and renewable energy sources [1,2]. In this scenario, the measurement infrastructure is expected to play a crucial role to improve the reliability and efficiency in both transmission and distribution networks [3,4]. In particular, the electrical substations represent the system backbone, as they control the proper power interchange between grid sections at different voltage levels.
In order to cope with multi-function grid equipment and more stringent operating requirements, the electrical substations are rapidly transitioning from cabled point-to-point connections to entirely digital streams of measured data and corresponding control actions (e.g., the opening of a circuit breaker) [5]. This technological revolution would allow for an easier concentration of the measurements coming from different sources as Phasor Measurement Units (PMUs) or Intelligent Electrical Devices (IEDs), as well as a smarter integration of distributed resources [6,7,8].
In this context, the IEC Std 61850 defines the communication networks and protocols for power utility automation [9], and the IEEE Std 2030.100 provides useful recommendations to implement an IEC Std-based substation [10]. In particular, the first one defines a wide range of possible messages and data formats to be employed in different monitoring and control applications. Among them, the IEC Std 61850-9-2 (briefly, IEC Std) [11] introduces the Sampled Values (SVs), which allow for transmitting digitized instantaneous values of power system quantities, e.g., the primary currents and voltages of a transformer. Typically, the SVs are published by Stand Alone Merging Units (SAMUs) in the substation network and are then subscribed by any connected device to store or further process the information [12].
In order to facilitate such digital transition, the National Metrological Institutes (NMIs) have developed calibration infrastructures for the instruments and measuring devices implementing the SV communication protocol [13,14,15]. It should be noticed that an IEC Std calibrator is required to combine analog and digital input and output channels. As a consequence, a rigorous uncertainty budget shall take into account several aspects. From the analog point of view, the generated test waveforms are characterized in terms of gain and ratio error throughout the entire measurement chain [16]. In this sense, a crucial role is played by the precise synchronization of analog acquisition and generation stages with respect to the absolute time reference [17].
From the digital point of view, instead, it is important to evaluate the quality of the SV data stream in terms of transmission latency and publishing rate stability that might result in packet losses or non-uniform sampling distortions. In digital electrical substations, many monitoring and control applications rely directly on SV data stream and provide stringent requirements in terms of maximum transmission latency. For instance, the Annex E of the IEC/IEEE Std 60255-118-1 defines a maximum latency of 2 ms for the SV data stream supplied to a PMU [18]. Similar requirements for different kinds of applications are also provided in the IEC Std 61869-9 [19]. Therefore, the rigorous characterization of the transmission latency is not only interesting from a methodological point of view but also relevant in order to facilitate a full digitalization of the measurement procedures in electrical substations.
In this article, we present an analysis that focuses on the rigorous characterization of the transmission latency that affects the SV publisher part of the calibrator system. Because of the fact that the SV packets are time-stamped and their latency has no impact on the informative content, this aspect has not yet been investigated in detail. Nevertheless, the operation of many SV-based applications and devices (e.g., PMUs based on digital inputs [8]) might be severely compromised by latency issues. Moreover, some commercial instruments, e.g., the DANEO 400 (Omicron, Klaus, Austria) or the SEL-451 (Schweitzer Engineering Laboratories, Pullman, WA, USA) integrate the SV transmission latency measurement feature, thus showing the interest of the electrical power industry in this topic.
2. The IEC Std Calibrator
In this Section, we describe the hardware and software architecture of the measurement setup, with specific focus on the synchronization and Ethernet communication aspects.
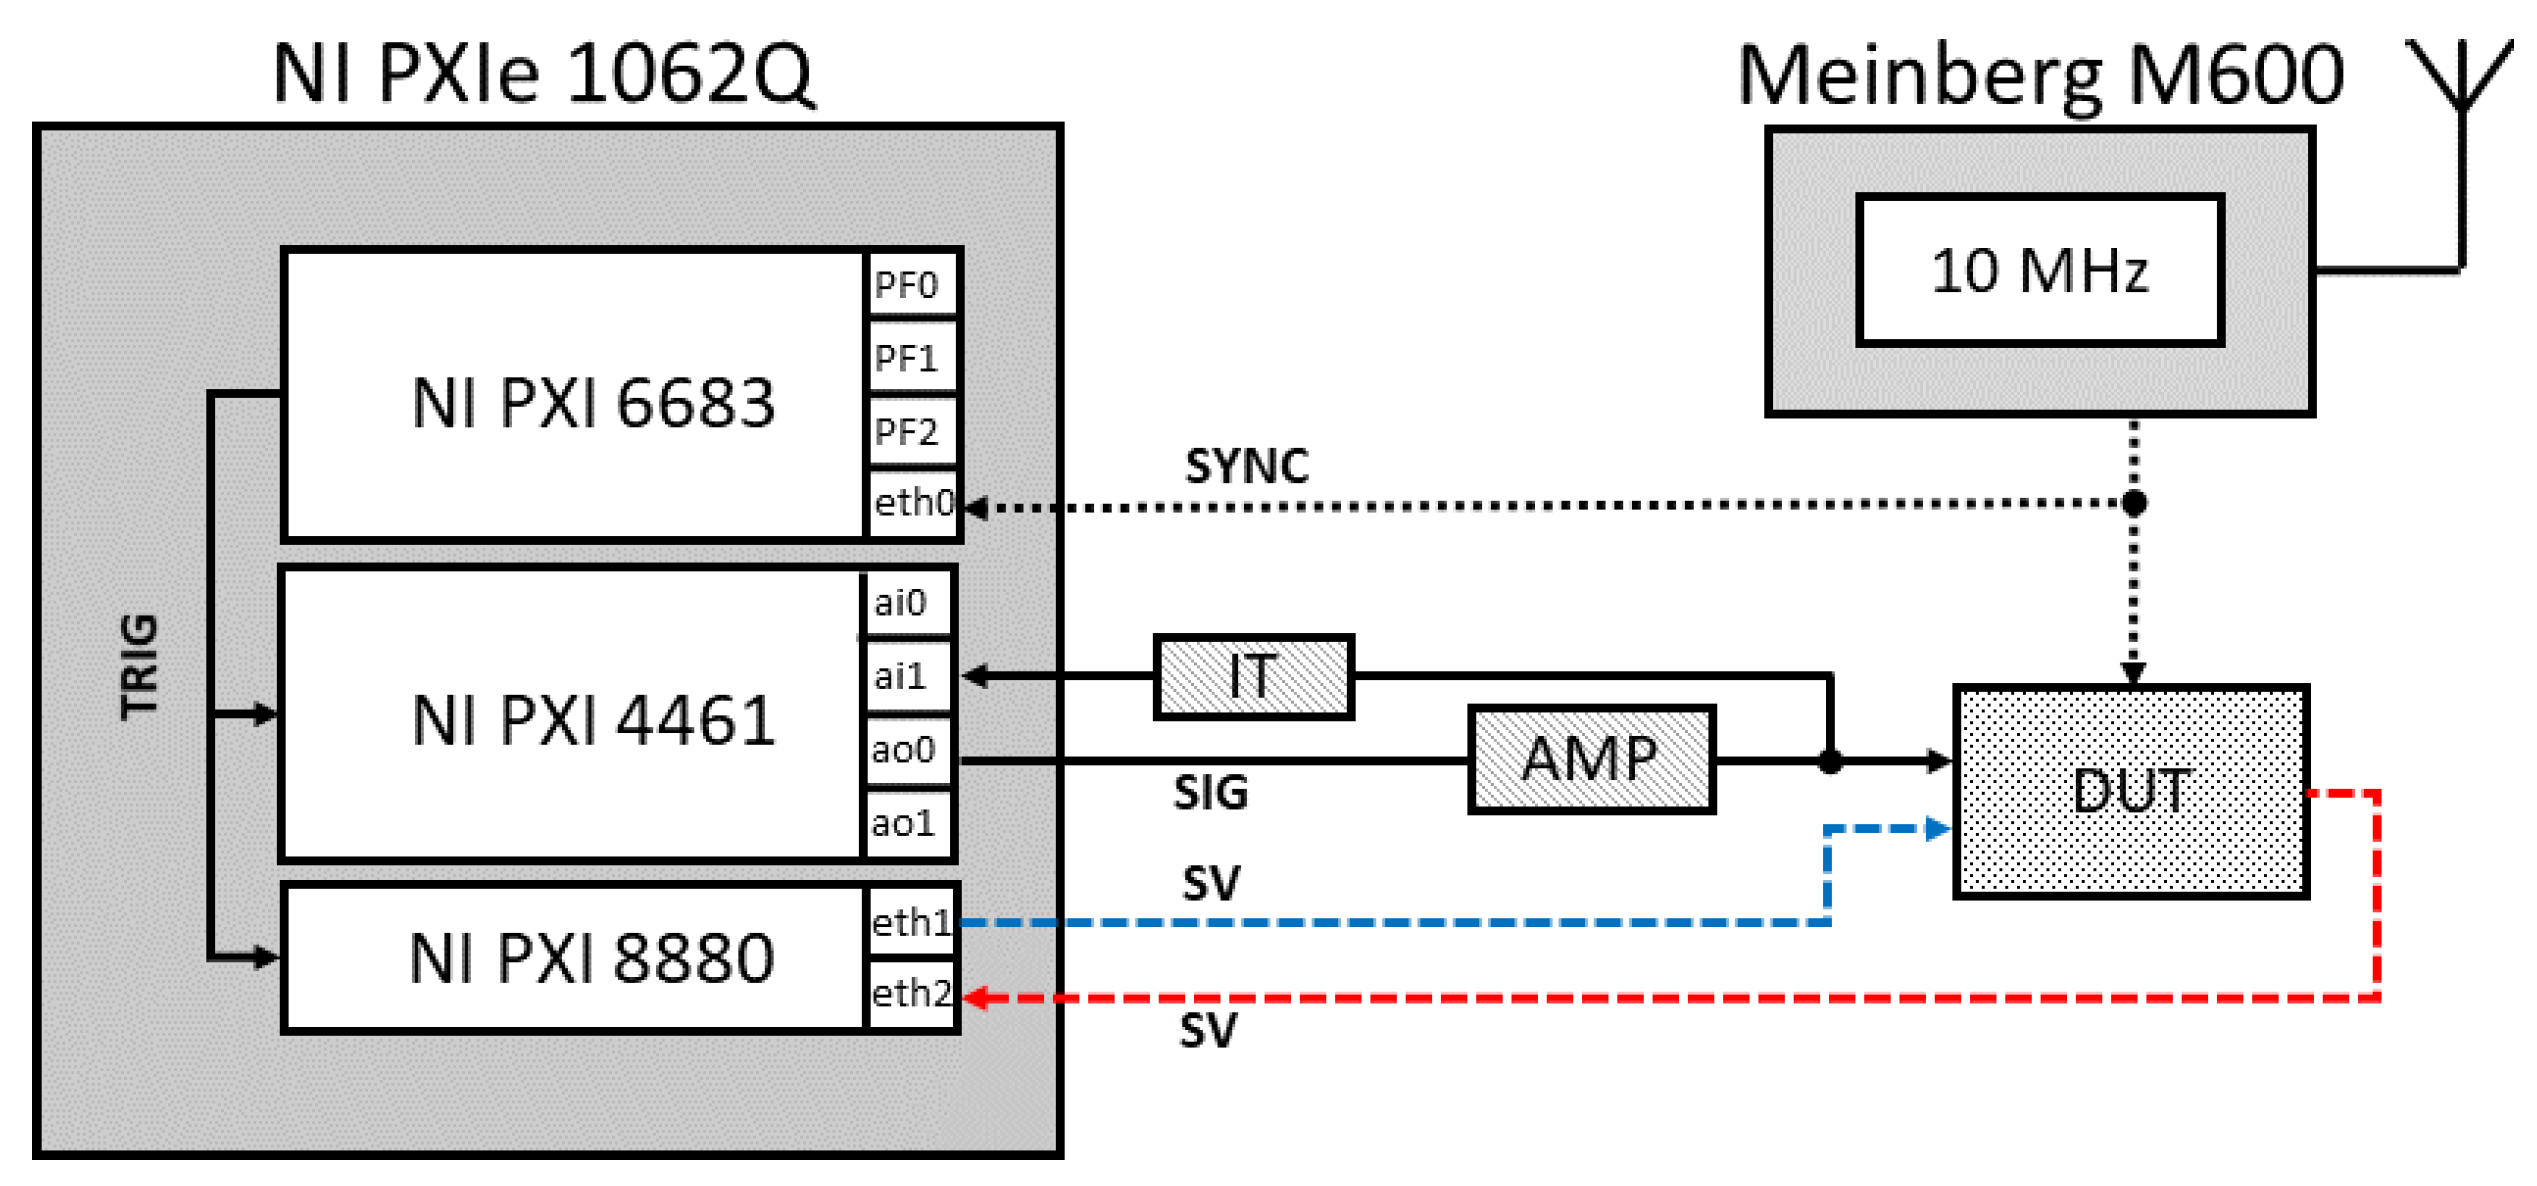
As shown in Figure 1, the measurement setup consists of two main components: a high-stability time reference and an IEC Std calibrator capable of producing simultaneous analog and digital outputs in compliance with the SV protocol [13].
The time reference consists of a Meinberg LANTIME M600 Time Server (Meinberg Funkuhren, Bad Pyrmont, Germany): a GPS-disciplined 10-MHz clock that guarantees a time accuracy and frequency stability of 50 ns and 0.5 nHz/Hz over an averaging time of 1800 s, respectively. It is worth noticing that the GPS disciplining allows for a better long-term accuracy and stability than any free-running oscillator [20].
The calibrator relies on a NI PXIe 1062 chassis (National Instruments, Austin, TX, USA) equipped with three modules: the NI PXI 6683 timing and synchronization module, the NI PXIe 8880 controller module, and the NI PXI 4461 dynamic signal acquisition module. The NI PXI 6683 is disciplined by the external time reference and is responsible for distributing the 10-MHz time-base and triggers the different tasks in the other modules. In this way, we improve the stability of the internal time-base (from which the sampling rates are derived), and we guarantee a more precise alignment of the trigger rising edges with respect to the UTC second.
The NI PXIe 8880 is an Intel Xeon embedded controller (2.4 GHz, eight cores) equipped with two 10/100/1000 BASE-TX (Gigabit) Ethernet ports, used for the publishing and reading of the SV data streams. The controller is programmed in LabVIEW 2020 with the addition of ad hoc linked dynamic libraries (dlls) for the capture, treatment, and generation of SV packets. Such dlls represent an extension of the open source code originally developed at the University of Strathclyde [21] (more details are provided in Section III.A). The NI PXI 4461 is a data acquisition module with two input and two output channels. Each channel can be selected and programmed independently. Both input and output channels provide a remarkable 24-bit resolution but rely on Sigma-Delta converters, whose non-constant group delay might represent an issue in terms of timing accuracy and determinism. On the other hand, in the considered application, the channels operate in simultaneous mode, sharing the same sampling rate and vertical range. In such conditions, it is possible to characterize with sufficient accuracy the phase offset introduced by the analog front-end and suitably compensate it. In this regard, a recent publication has proven that the uncertainty on such phase offset is not larger than 4μrad, corresponding to few tens of ns at 50 Hz [17].
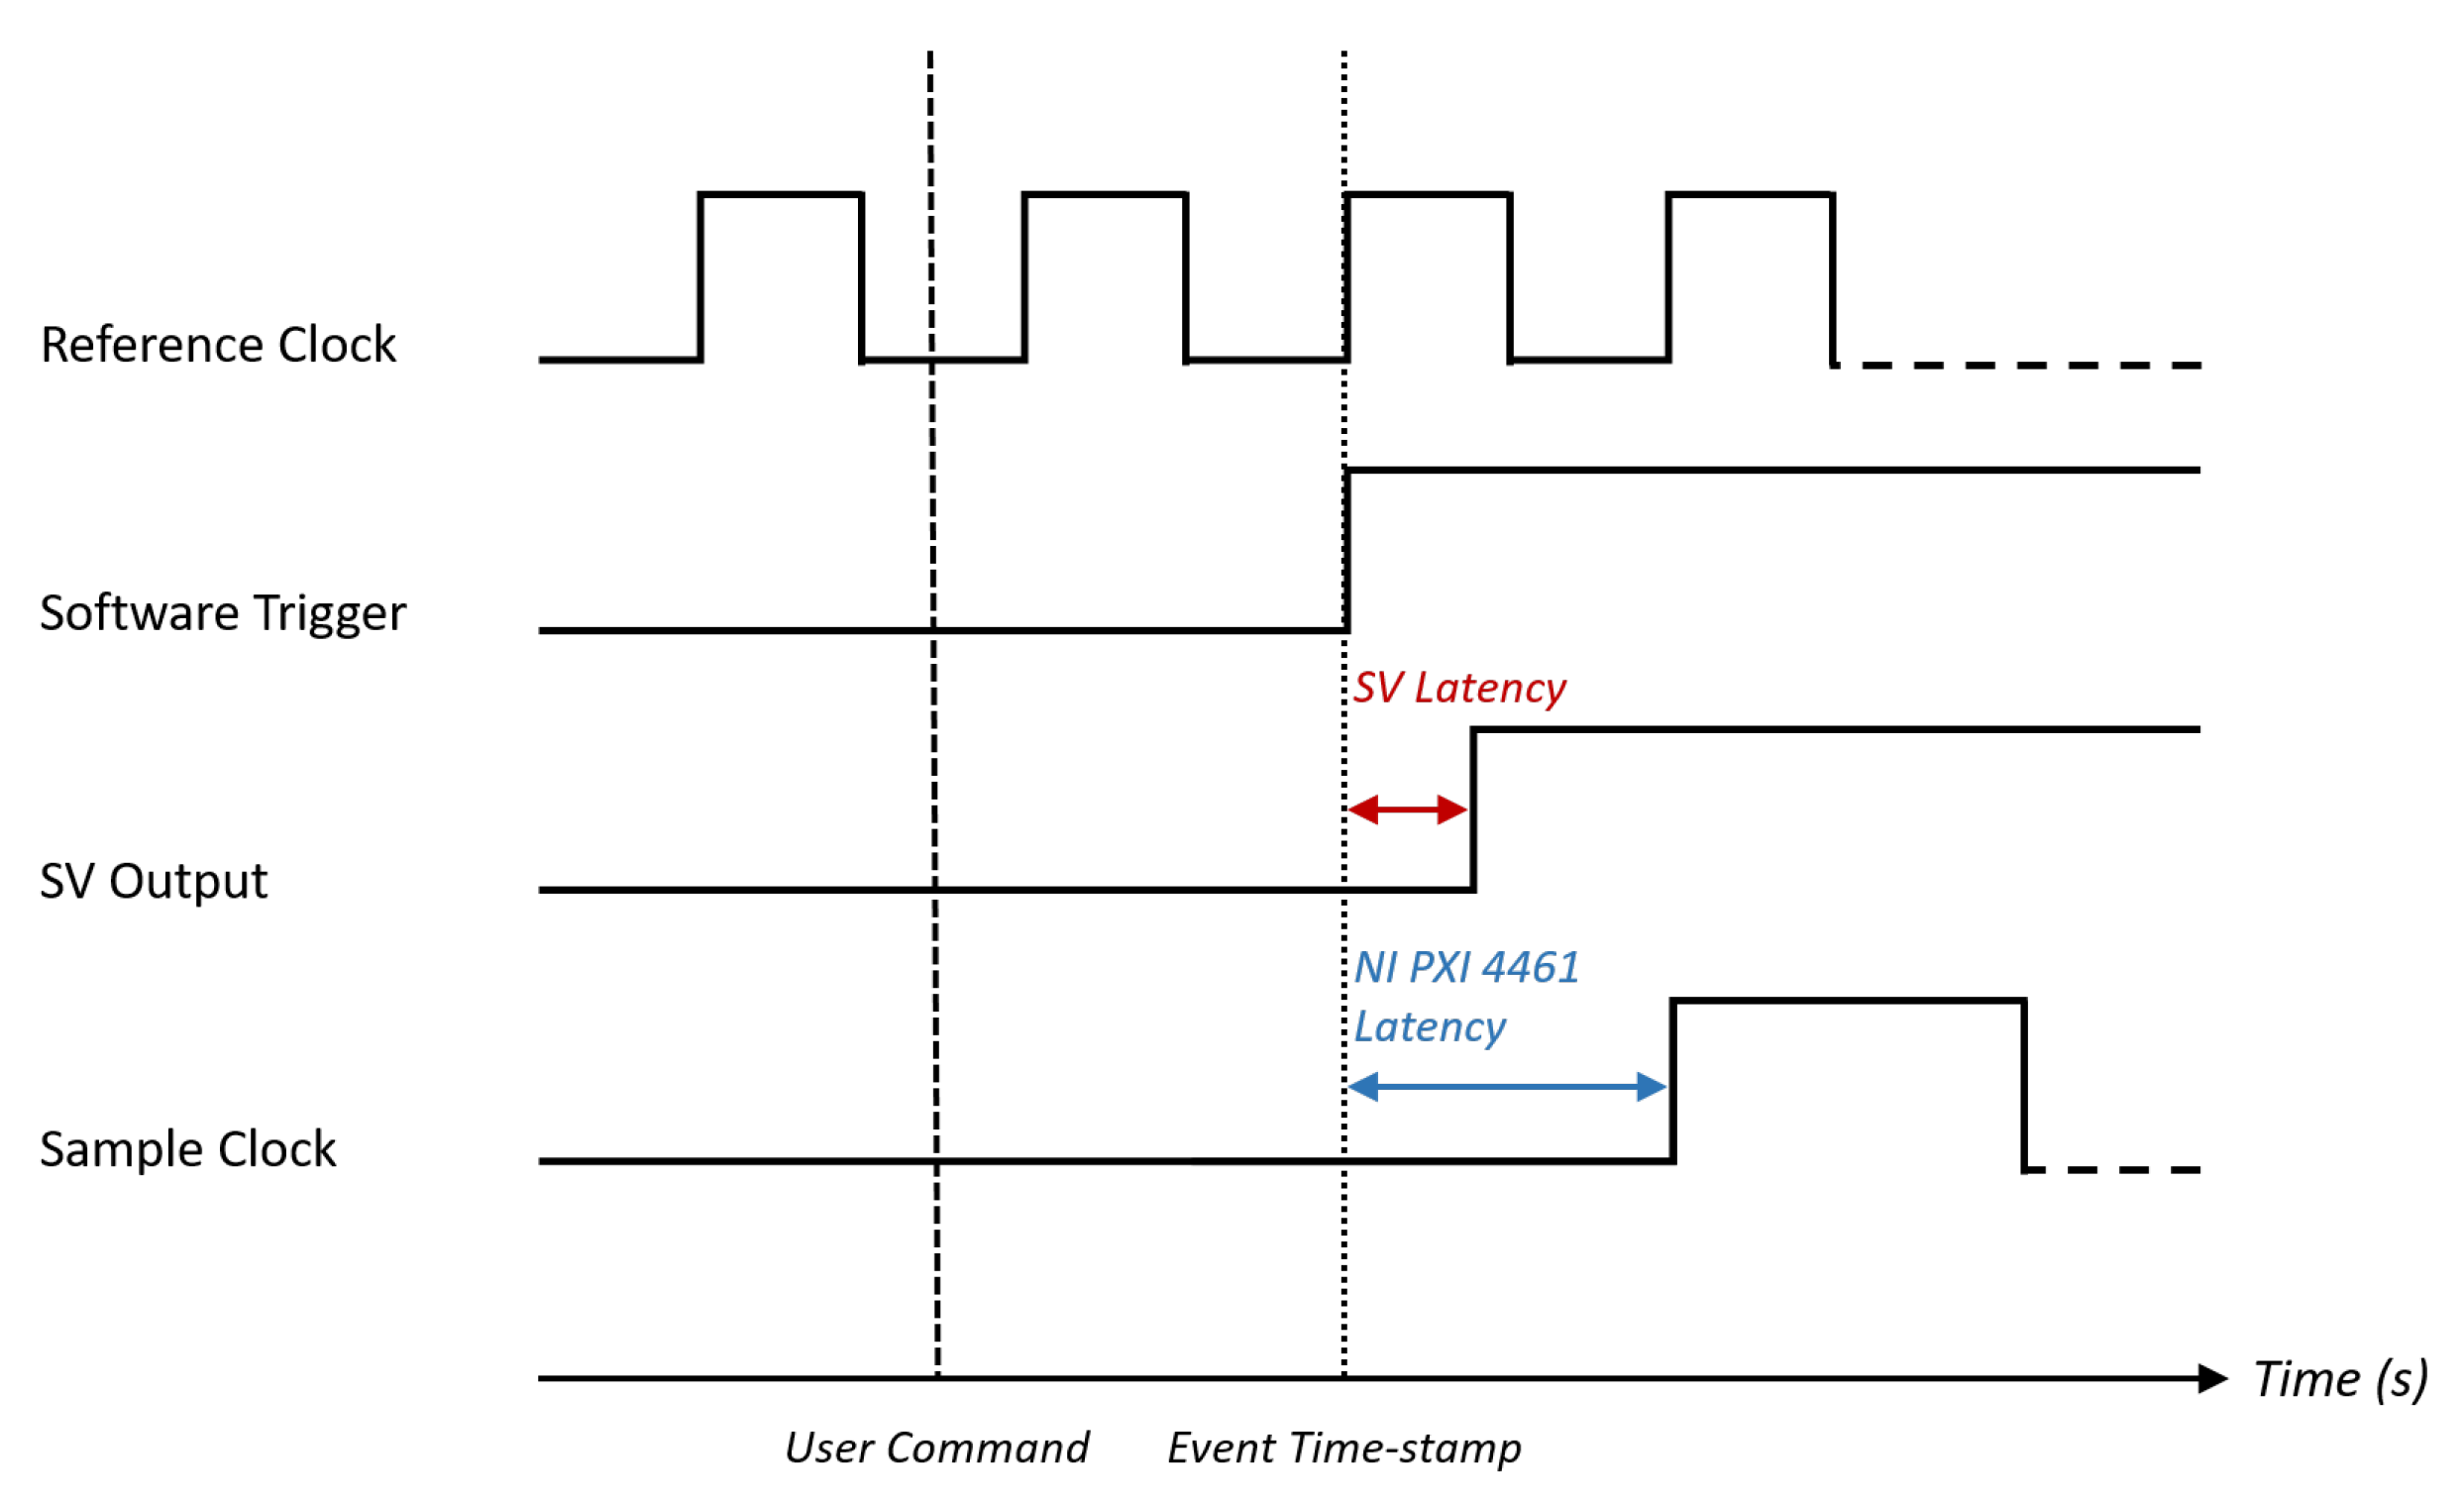
The need for synchronizing analog and digital outputs from different modules represents an implementation challenge, particularly on non-deterministic or real-time systems. In the present case, the synchronization module allows for distributing dedicated software triggers. In more detail, such triggers are programmed as future time events, as shown in Figure 2. At the occurrence of the user-defined time-stamp, a software trigger activates the SV transmission and the NI PXI 4461 board. Such trigger mechanism has different propagation delays within the calibrator infrastructure. In this paper, we focus mainly on the latency introduced in the SV transmission process, whereas the latency associated to the analog waveforms generation and acquisition has been thoroughly discussed in [17]. Nevertheless, it should be noticed that, by specifications, the latency due to the trigger propagation within different modules and boards shall not exceed 2 ns. Therefore, it is reasonable to expect that the major latency contribution is associated to the operating system and its management of the Ethernet adapter.
The capability of either transmitting or capturing SV data streams makes the proposed architecture a valuable option for calibrating Devices Under Test (DUTs) that either generate or receive digital signals. The first category includes the SAMUs and the non-conventional instrument transformers, whereas the second one encompasses phase comparators and measuring bridges. As shown in Figure 1, the DUT receives an analog signal from the IEC Std calibrator: in the first case, it converts it into the corresponding SV data stream (red dashed line), whereas, in the second one, it compares it with another digital input provided by the same IEC Std calibrator (blue dashed line).
3. Implementation of SV Transmission
In this Section, we discuss the implementation method for the generation of SV data streams, namely, encoding and transmission. Moreover, we present the measurement methods and the obtained results for the definition of the actual publishing rate as well as of the transmission latency. In this regard, the IEC Std defines a maximum tolerance of 3 ms for the transmission of the SV packets.
3.1. Encoding
The IEC Std calibrator aims at simulating an ideal SAMU, where digital and analog version of the input signal are nearly coincident. To this end, we used the open source platform introduced in [21] to develop a novel dll, specifically designed for the transmission and reception of SV data streams over an Ethernet network. In more detail, the code is tailored to a particular System Configuration Description (SCD) file [22] that contains the logical node structures of an Intelligent Electronic Device (IED), particularly a SAMU [23]. The attributes of these nodes consist of the instantaneous current and voltage values that are numerically generated by the IEC Std calibrator. Then, the entire node structure is encoded in a SV packet and subsequently sent over the network by making use of the functions present in the WinPcap library [24,25].
The content of the Ethernet frame conveying a SV packet is described in detail in [23]. Basically, the frame consists of three main parts. The first 12 bytes define the MAC address of the destination and source of the SV data stream. Then, 4 bytes are reserved for the priority tag and the V-LAN IDs, whereas the rest of the frame is mainly dedicated to the digital signal values stored in the Application Protocol Data Unit (APDU). The APDU is a structure containing a variable number of Application Service Data Unit (ASDU) fields. The exact number of ASDUs is constrained by the choice of the digital output sampling rate SmpRate applied on the signal. According to [23], SmpRate can assume a value of either 80 or , which determines a number of 1 or 8 ASDU, respectively. Each ASDU contains attributes such as the sample counter with respect to the PPS transition SmpCnt and the data set seqData. The value of the attribute SmpCnt is incremented from 0 (corresponding to the PPS rising edge transition) to the integer before the number of SV contained in . The data set is filled with current and voltage values of the correspondent analog waveform at that specific time-stamp. In order to expedite the transmission process, the sequence of frames, equivalent to of a periodic digital signal pattern, is buffered into a queue previously allocated in memory.
At this point, the SV packets are ready to be transmitted over the network. The most efficient way to accomplish this task has been found in using the WinPcap function pcap_sendqueue_transmit [26]. It should be noticed that this function transmits the content of the queue without emptying it. By repeating the transmission process iteratively, we are able to reproduce a nearly constant publishing rate. In this regard, it is worth noticing that the calibrator time-base is overridden by the 10 MHz of the master clock. This allows for improving the timeliness of the transmission repetition loop. Moreover, since this function buffers the packets in the kernel driver, where the number of context switches is lower, a more efficient output transmission can be achieved. Indeed, the kernel-mode clock allows for an accurate packet synchronization; therefore, it is realistic to expect a publishing period whose discrepancy with respect to the nominal one is within few microseconds.
It is worth noticing that such a precision cannot be achieved by transmitting one packet after the other with the function pcap_sendpacket. Indeed, in this case, the function execution time cannot be controlled. Moreover, given the non-deterministic nature of the operating system, the need of accessing the function at each new packet would result in additional delays. In this context, Section 3.2 characterizes the packet publishing rates for the two software variants using the WinPcap functions pcap_sendqueue_transmit and pcap_sendpacket, hereafter referred to as (QTP) and (STP), respectively.
3.2. Packet Publishing Rate
The publishing rate has been determined using the Wireshark network packet analyzer (release 3.4.9 from 6 October 2021). The Ethernet adapter defined as SV source has been connected through a RJ45 cable to another board of the same type mounted on another PC, where Wireshark is installed. For the sake of simplicity, the traffic between these two Ethernet adapters is limited to the SV data stream. A statistically significant amount of at least SV packets have been transmitted using all the rates as listed in the IEC Std. Once the packets reach the destination input queue of the driver kernel, Wireshark is expected to timestamp them with a resolution of 1 μs.
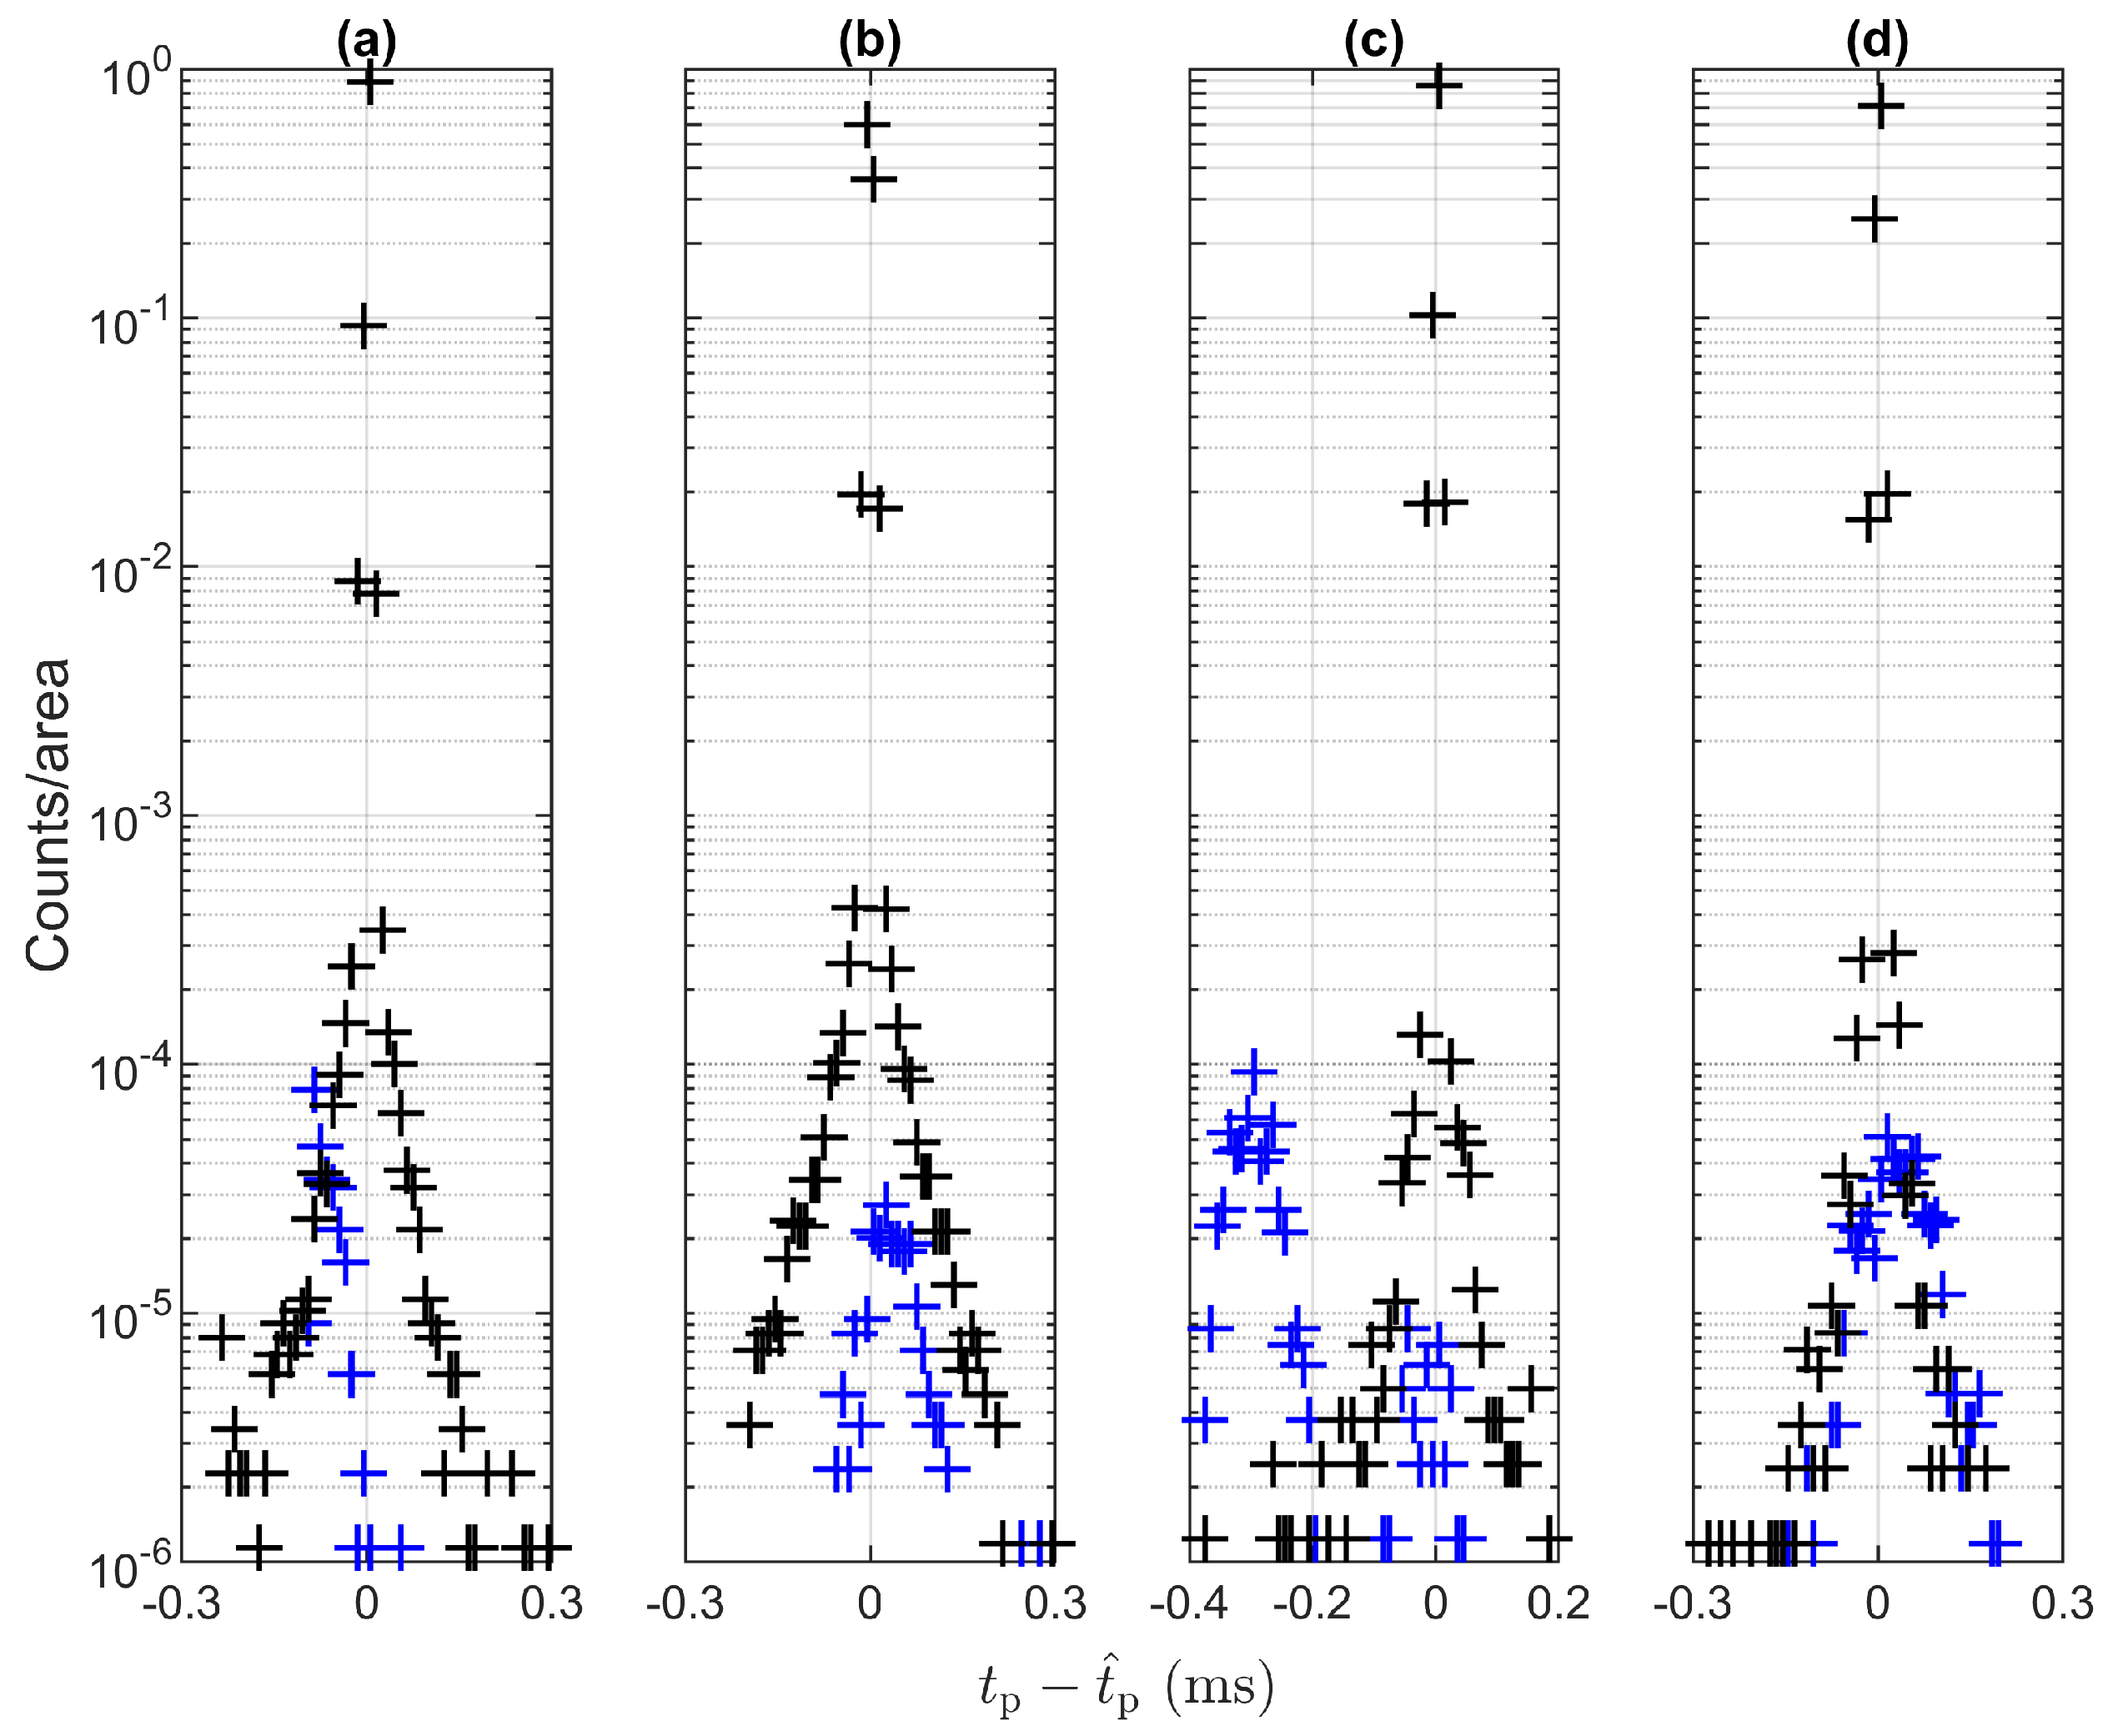
As shown in Figure 3, in the QTP implementation, the timestamp difference between two consecutive packets, also known as publishing period , is very close to the corresponding nominal value for the overwhelming majority of the captured packets. In this regard, it is important to notice that the publishing period is defined as the ratio between the number of ASDUs , and the product of the signal nominal frequency f and the sampling rate :
On the other hand, the timestamp differences between the first and the last packet before and after the rising edge transition of the PPS, , do not show the same values as the other packets. This is particularly noticeable for the data streams in Figure 3a,c.
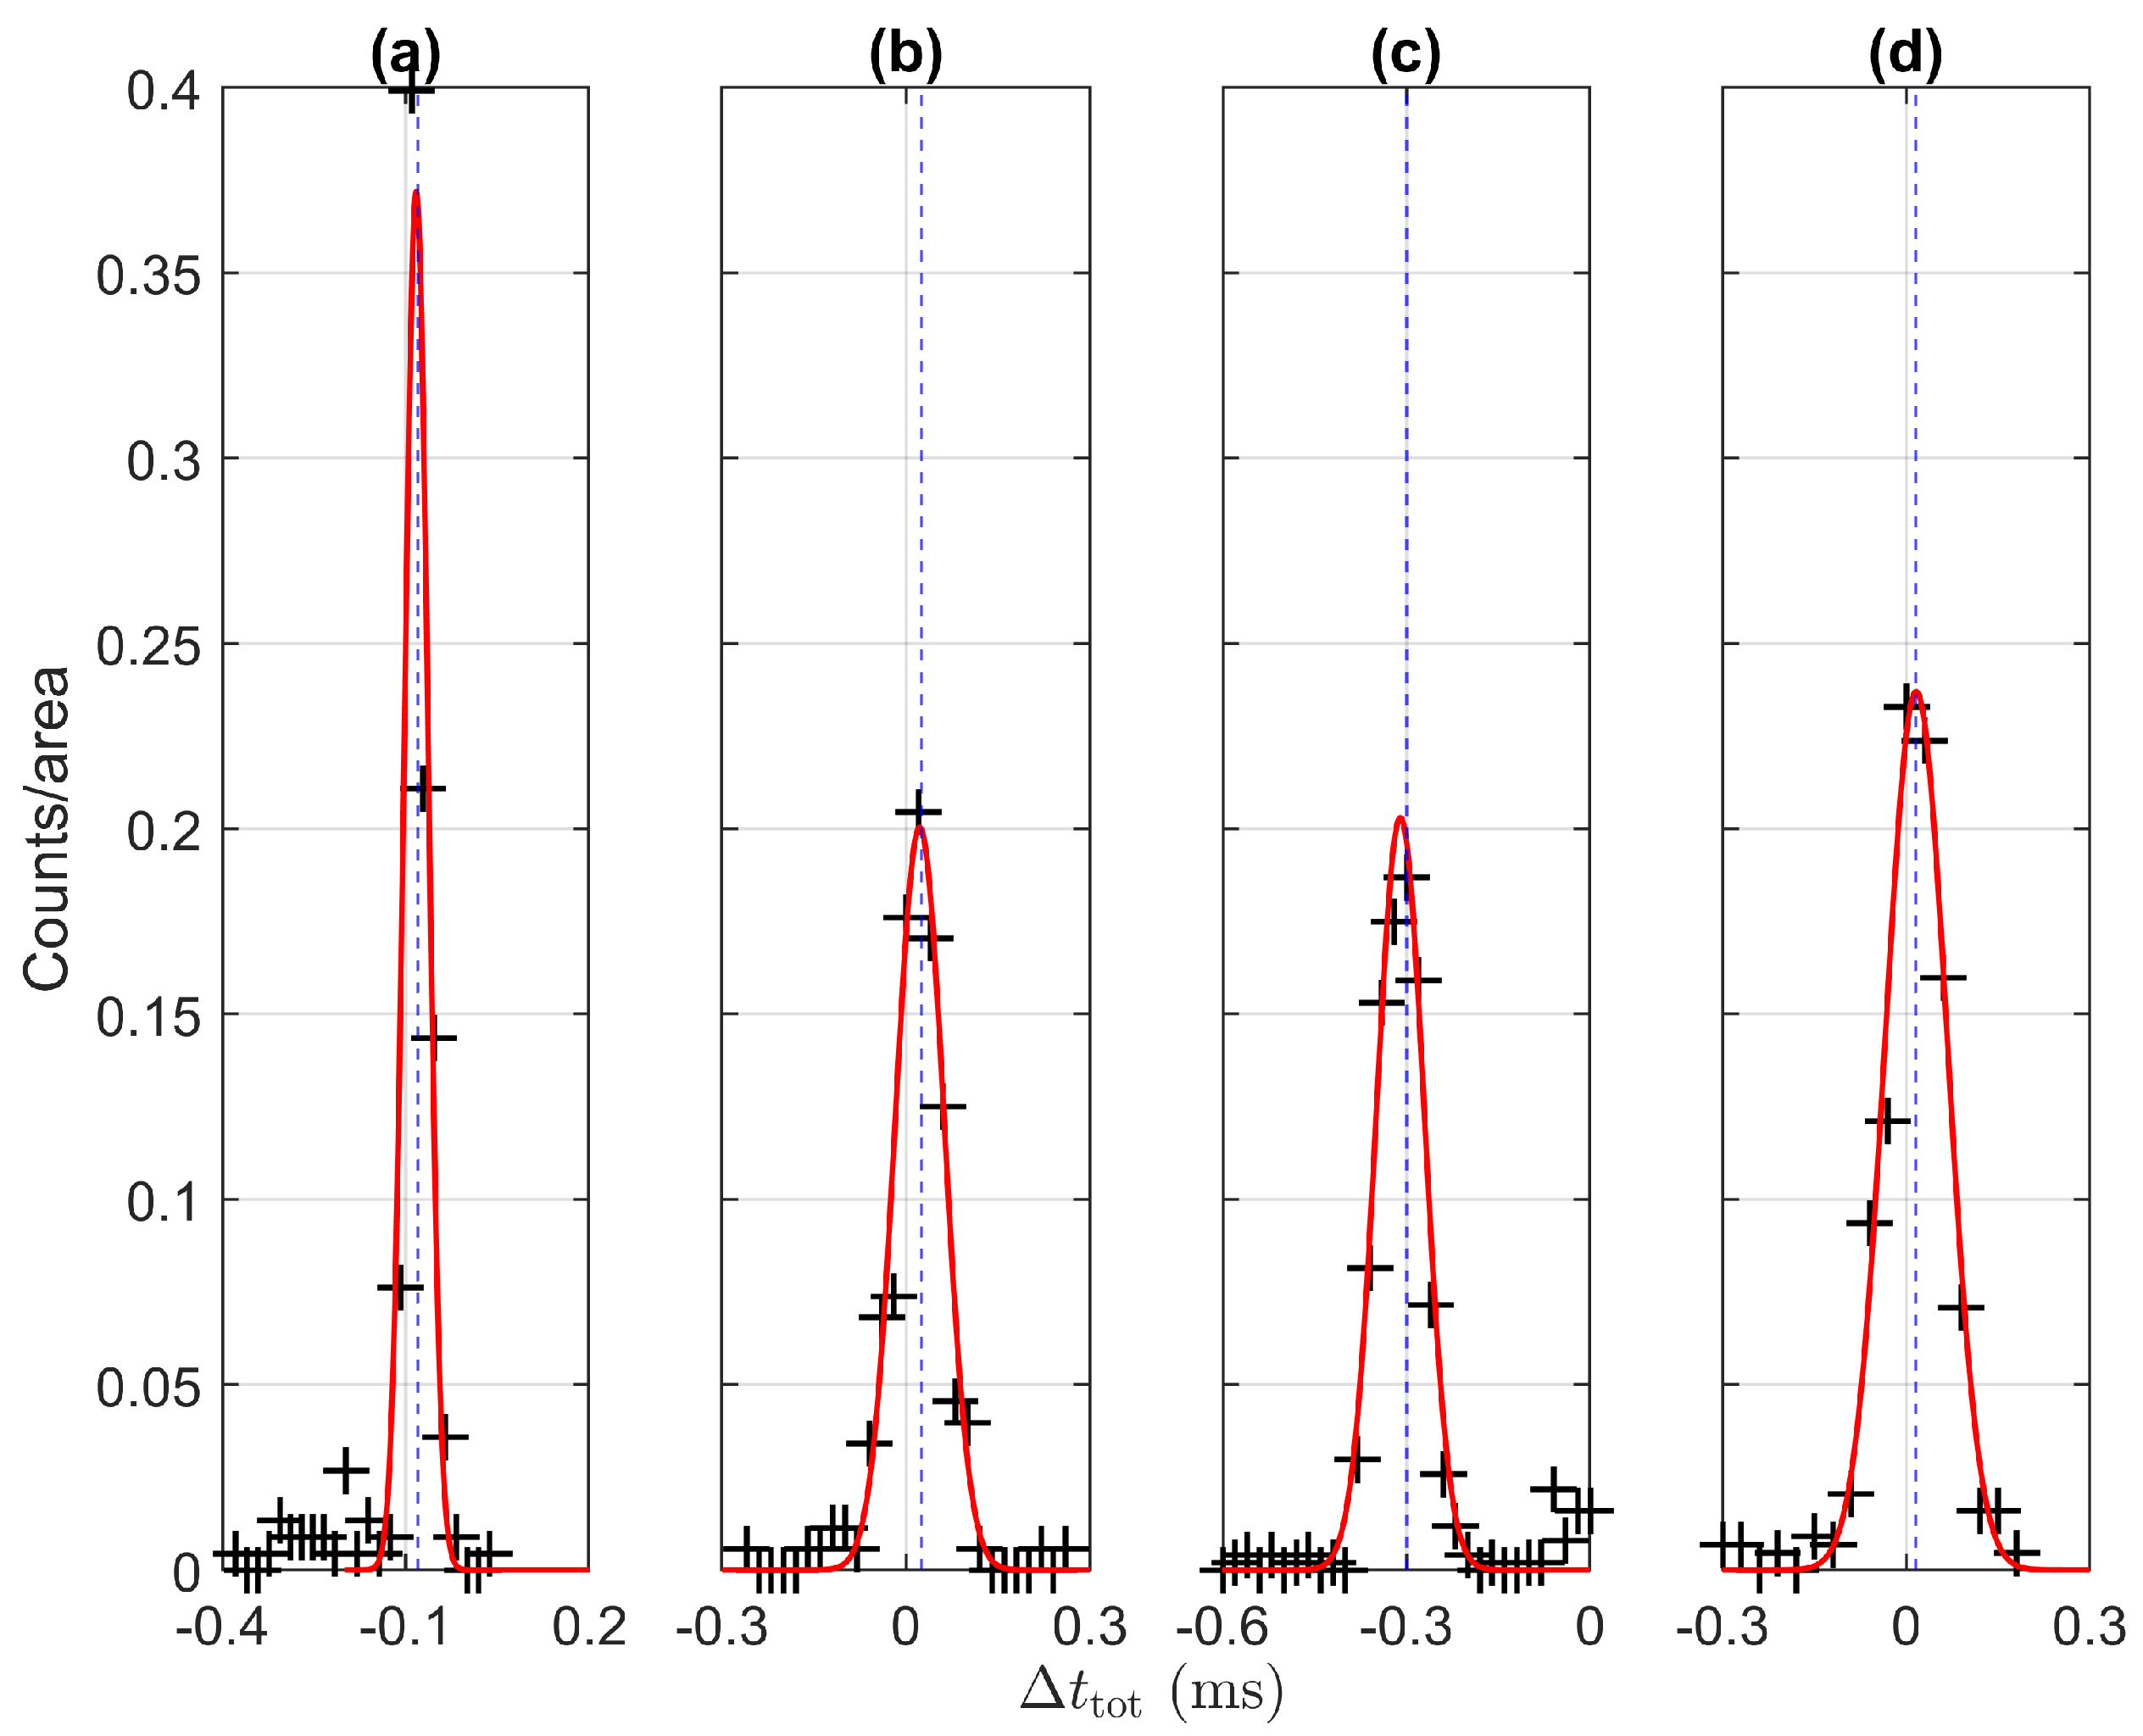
Such discrepancies can be traced back to the software routine of the QTP implementation. After each transmission, i.e., 1 s of sampled digital signal, it is necessary to re-access the memory allocation where the queue is stored and then re-start the transmission. In a non real-time operating system, this operation might take a certain amount of time, not scaled to the specific publishing period of the stream. In practice, this time is proven to depend on the overall memory occupation. It results as a delay or an anticipation depending on whether it exceeds the selected publishing period. To this end, we measured the overall time required to transmit the totality of packets contained between two PPS rising edge transitions. Ideally, this should correspond exactly to 1 s. Due to the re-transmission issue, though, a discrepancy is observed. In this regard, Figure 4 shows the distributions of counts for each considered publishing period. For the sake of readability, the counts are fitted with a normal distribution function, and it can be noticed that the expected values are very close to the mean of indicated with .
In Table 1, the fit results of and the deviation between the expected values and , named , are reported. It is worth noticing how is within 10 μs in all the considered configurations. Therefore, it is reasonable to say that the inconsistent publishing periods in correspondence of PPS transitions produce the significant discrepancies in . In principle, the knowledge of could allow for a fine-tuning of the publishing period. In this way, it is possible to guarantee that all packets are transmitted within . To this end, the modified publishing period shall be calculated as:
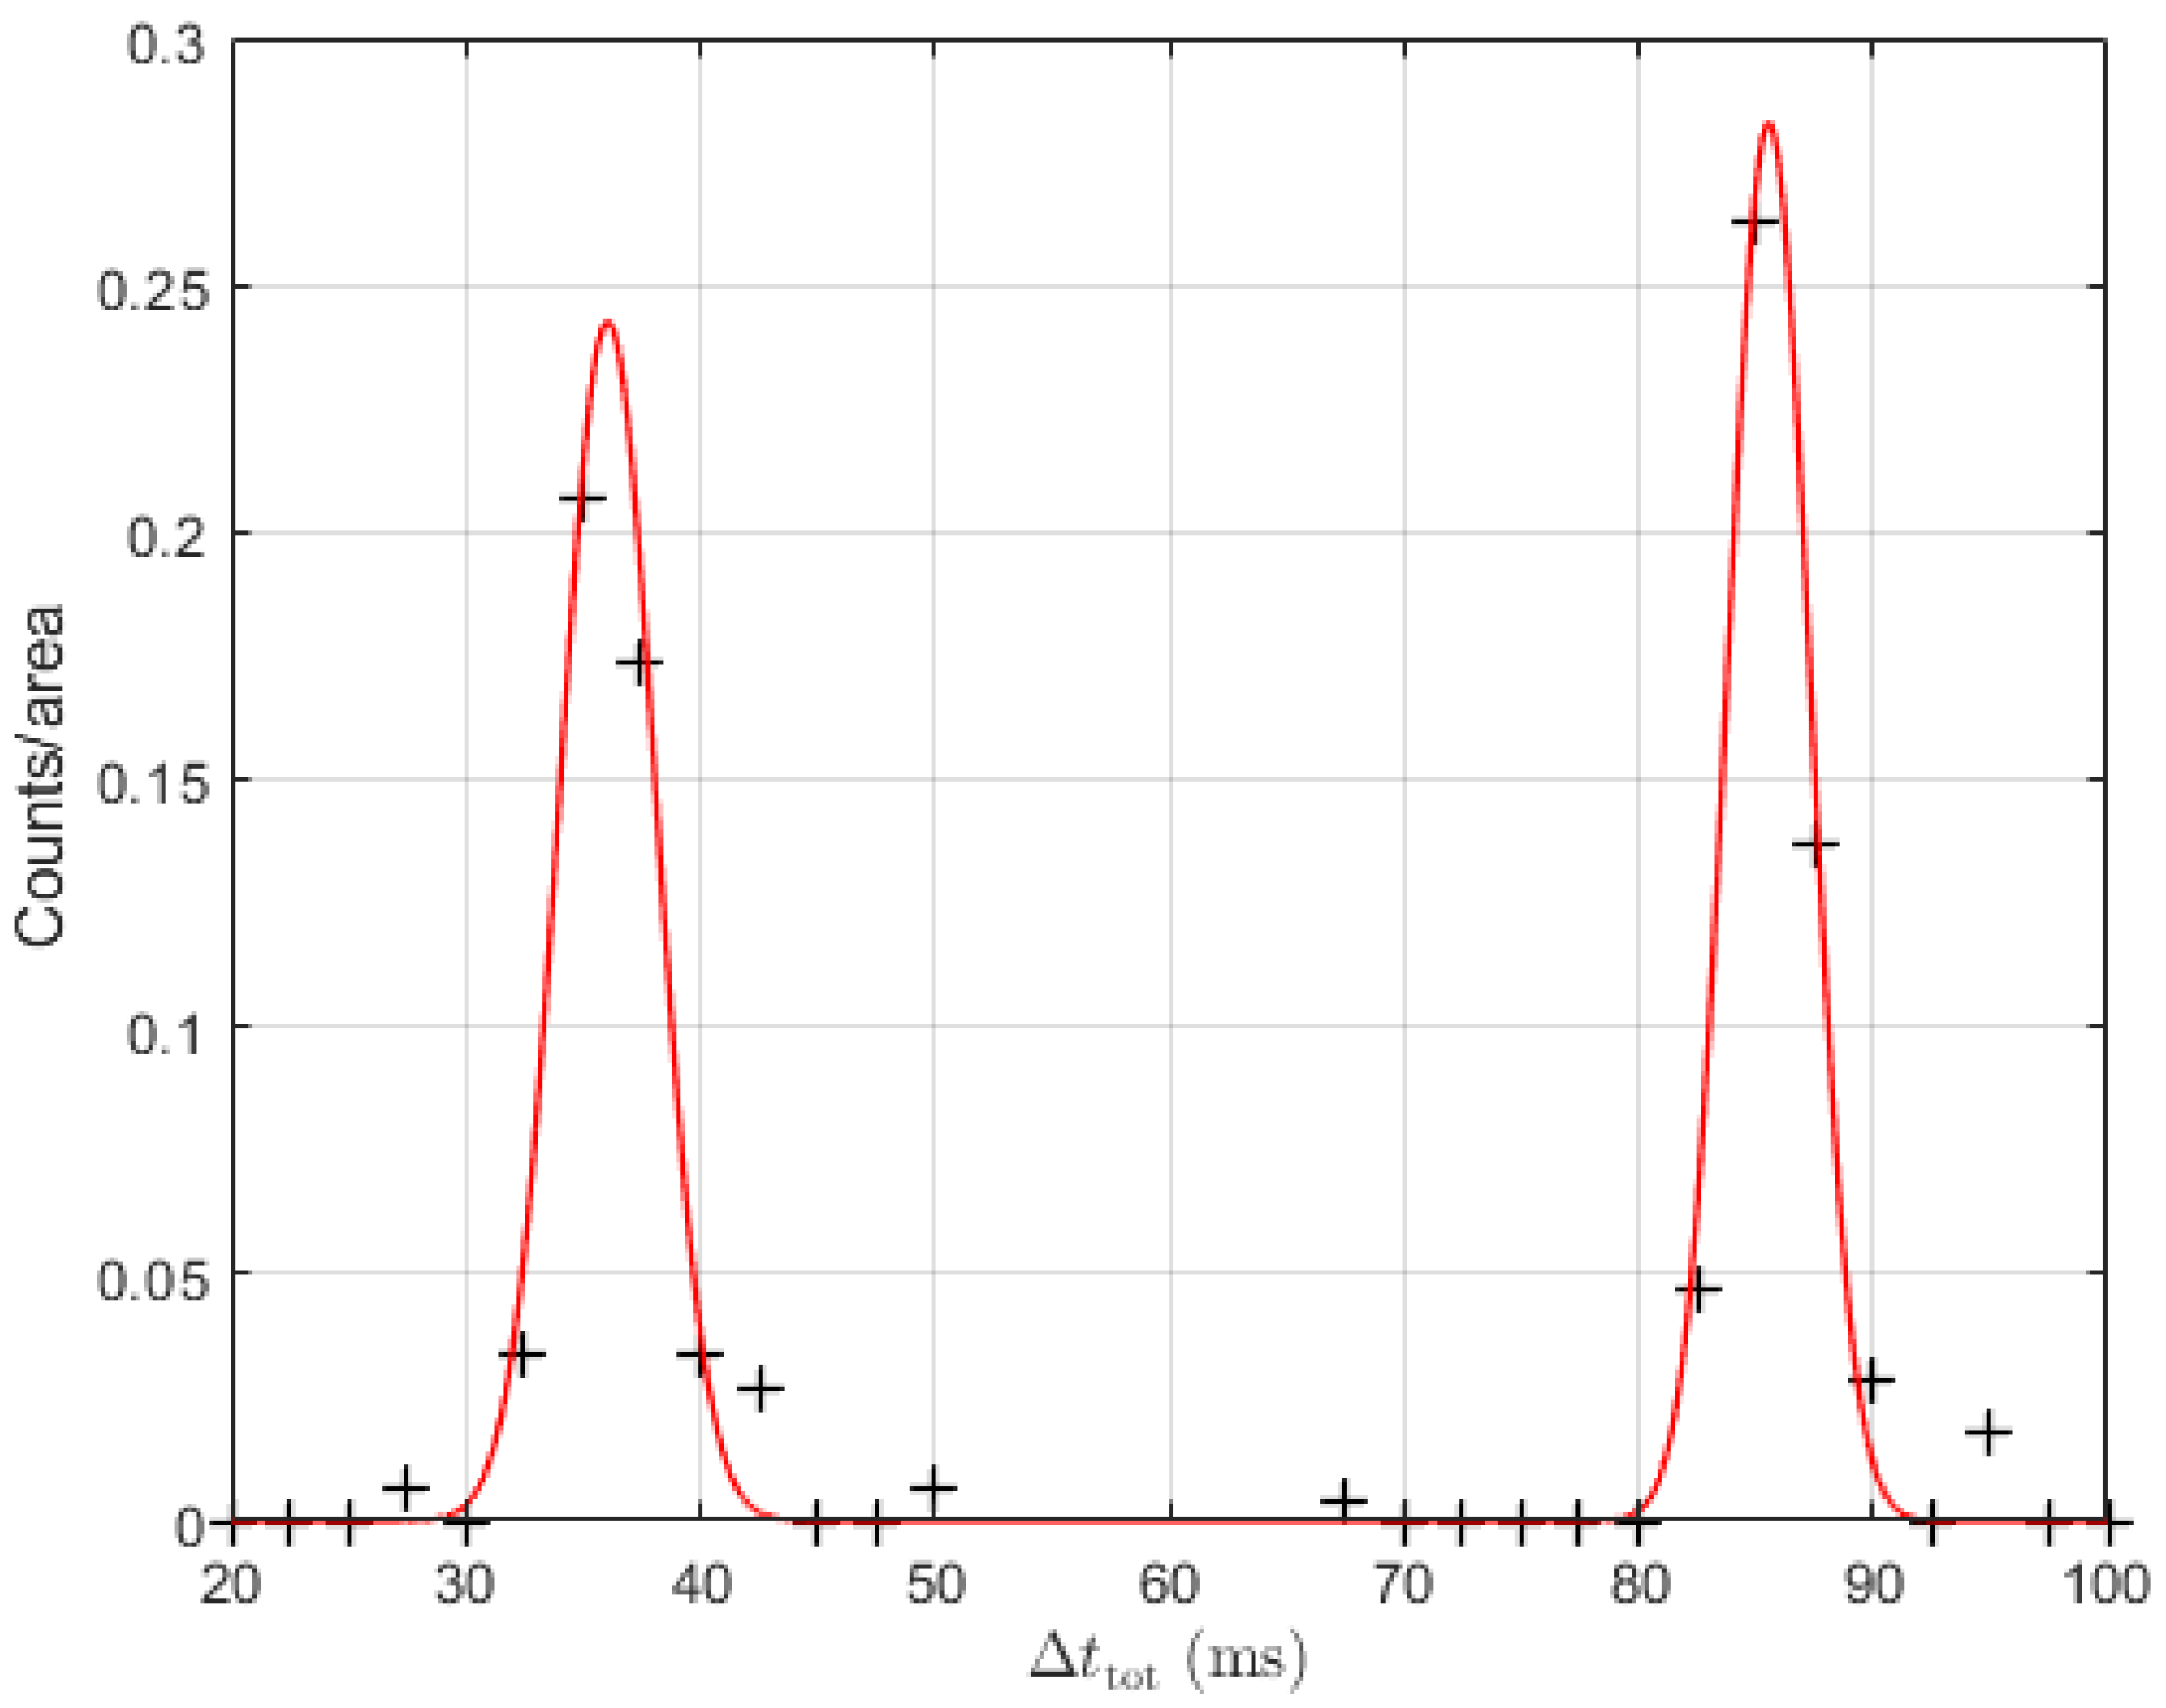
The same analysis has also been performed for the STP method. In this case, the packets are transmitted one-by-one by each time accessing the dll from the Labview software. As a consequence, each operation is not executed at a kernel level but at an application level and are thus affected by the additional delays due to the concurrent processes of the operating system. For this reason, it is impossible to effectively control the packet publishing period. For example, Figure 5 shows the distribution of for the captured packets transmitted with . It is interesting to observe how the distribution exhibits two modes centered around the two expected values, namely, 36 and . Such offsets may exceed the maximum allowed tolerance of many instruments with digital inputs, e.g., the digital measuring bridges (as proven in Section V.B). Based on these results, the STP method does not represent a viable solution for calibration applications.
3.3. Transmission Latency
Let us now describe the method for measuring the packet transmission latency with respect to the PPS rising edge transition. For this analysis, we need a more sophisticated method. Similarly to the previous Section, the packet arrival time at the receiver side has been determined by means of Wireshark. In this regard, it is worth pointing out that the IEC Std calibrator and the target PC were connected point-to-point and the delay contribution due to cabling is considered negligible with respect to computing and transmission times inherent the IEC Std protocol. In this case, though, we do not consider just the relative timestamp difference between consecutive packets, as we did for the definition of the publishing period. Conversely, we compare the packet arrival time with the PPS rising edge transition as given by the reference clock.
In more detail, given the proven precision and stability of the publishing rate, we consider the timestamp of the first sample only, i.e., the one tagged as . In order to obtained a statistically significant sample, we acquired at least 1000 SV data streams in both configurations, namely, equal to 80 and , respectively. For the sake of simplicity, the results here reported refer to a signal frequency of 50 Hz, but similar results can be obtained at 60 Hz. In order to evaluate the uncertainty introduced by the non real-time nature of the operating system, the measurement dataset consists of independent realizations of the packet computation and transmission process. Instead of considering a single acquisition of 1000 s, we repeat 1000 times the acquisition process: we re-initialize the software and we acquire 1 s of SV data stream. In this way, the initial conditions are not constant and provide a comprehensive description of the variability due to the non-deterministic behavior of the operating system.
The proposed measurement procedure exploits the fact that the PTP synchronization is also implemented through Ethernet packets in compliance with the IEEE Std 1588 [27]. In this context, we use two parallel Wireshark sessions in order to simultaneously capture the SV and the PTP packets on the dedicated adapters. In this way, it is possible to express the Windows-based time with respect to the PTP time and consequently trace back the measured latency to the time of the reference clock.
The PTP protocol involves the exchange of several messages across the Ethernet network in order to achieve an enhanced synchronization. Among these, two messages, the and the , contain the information that allows to determine the time-stamp referring to the synchronization source clock. More precisely, the messages contain the PTP-based timestamp, indicated with , and is captured by Wireshark at a time instant whose Windows-based timestamp is indicated as . Due to the technical limitations of the reference clock, the message is not output exactly at the time reported in its timestamp, but it is affected by a systematic delay . This delay is successively determined by the reference clock, and the previous transmitted time-stamp is corrected with . This value is then encapsulated in the message and subsequently transmitted over the network.
By associating the time-stamp values present in the messages to the Wireshark time-stamp captures of the messages , it is possible to fit the resulting linear trend and finally obtain the PTP time as a function of the Windows time :
All time values are to be considered relative to the first captured packet for both PTP and Windows timestamps. With respect to the PTP reference, the Windows time exhibits a drift of per second and an offset of . By analyzing the fit residuals, their standard deviation is equal to that can be interpreted as a sort of uncertainty on the measured transmission latency.
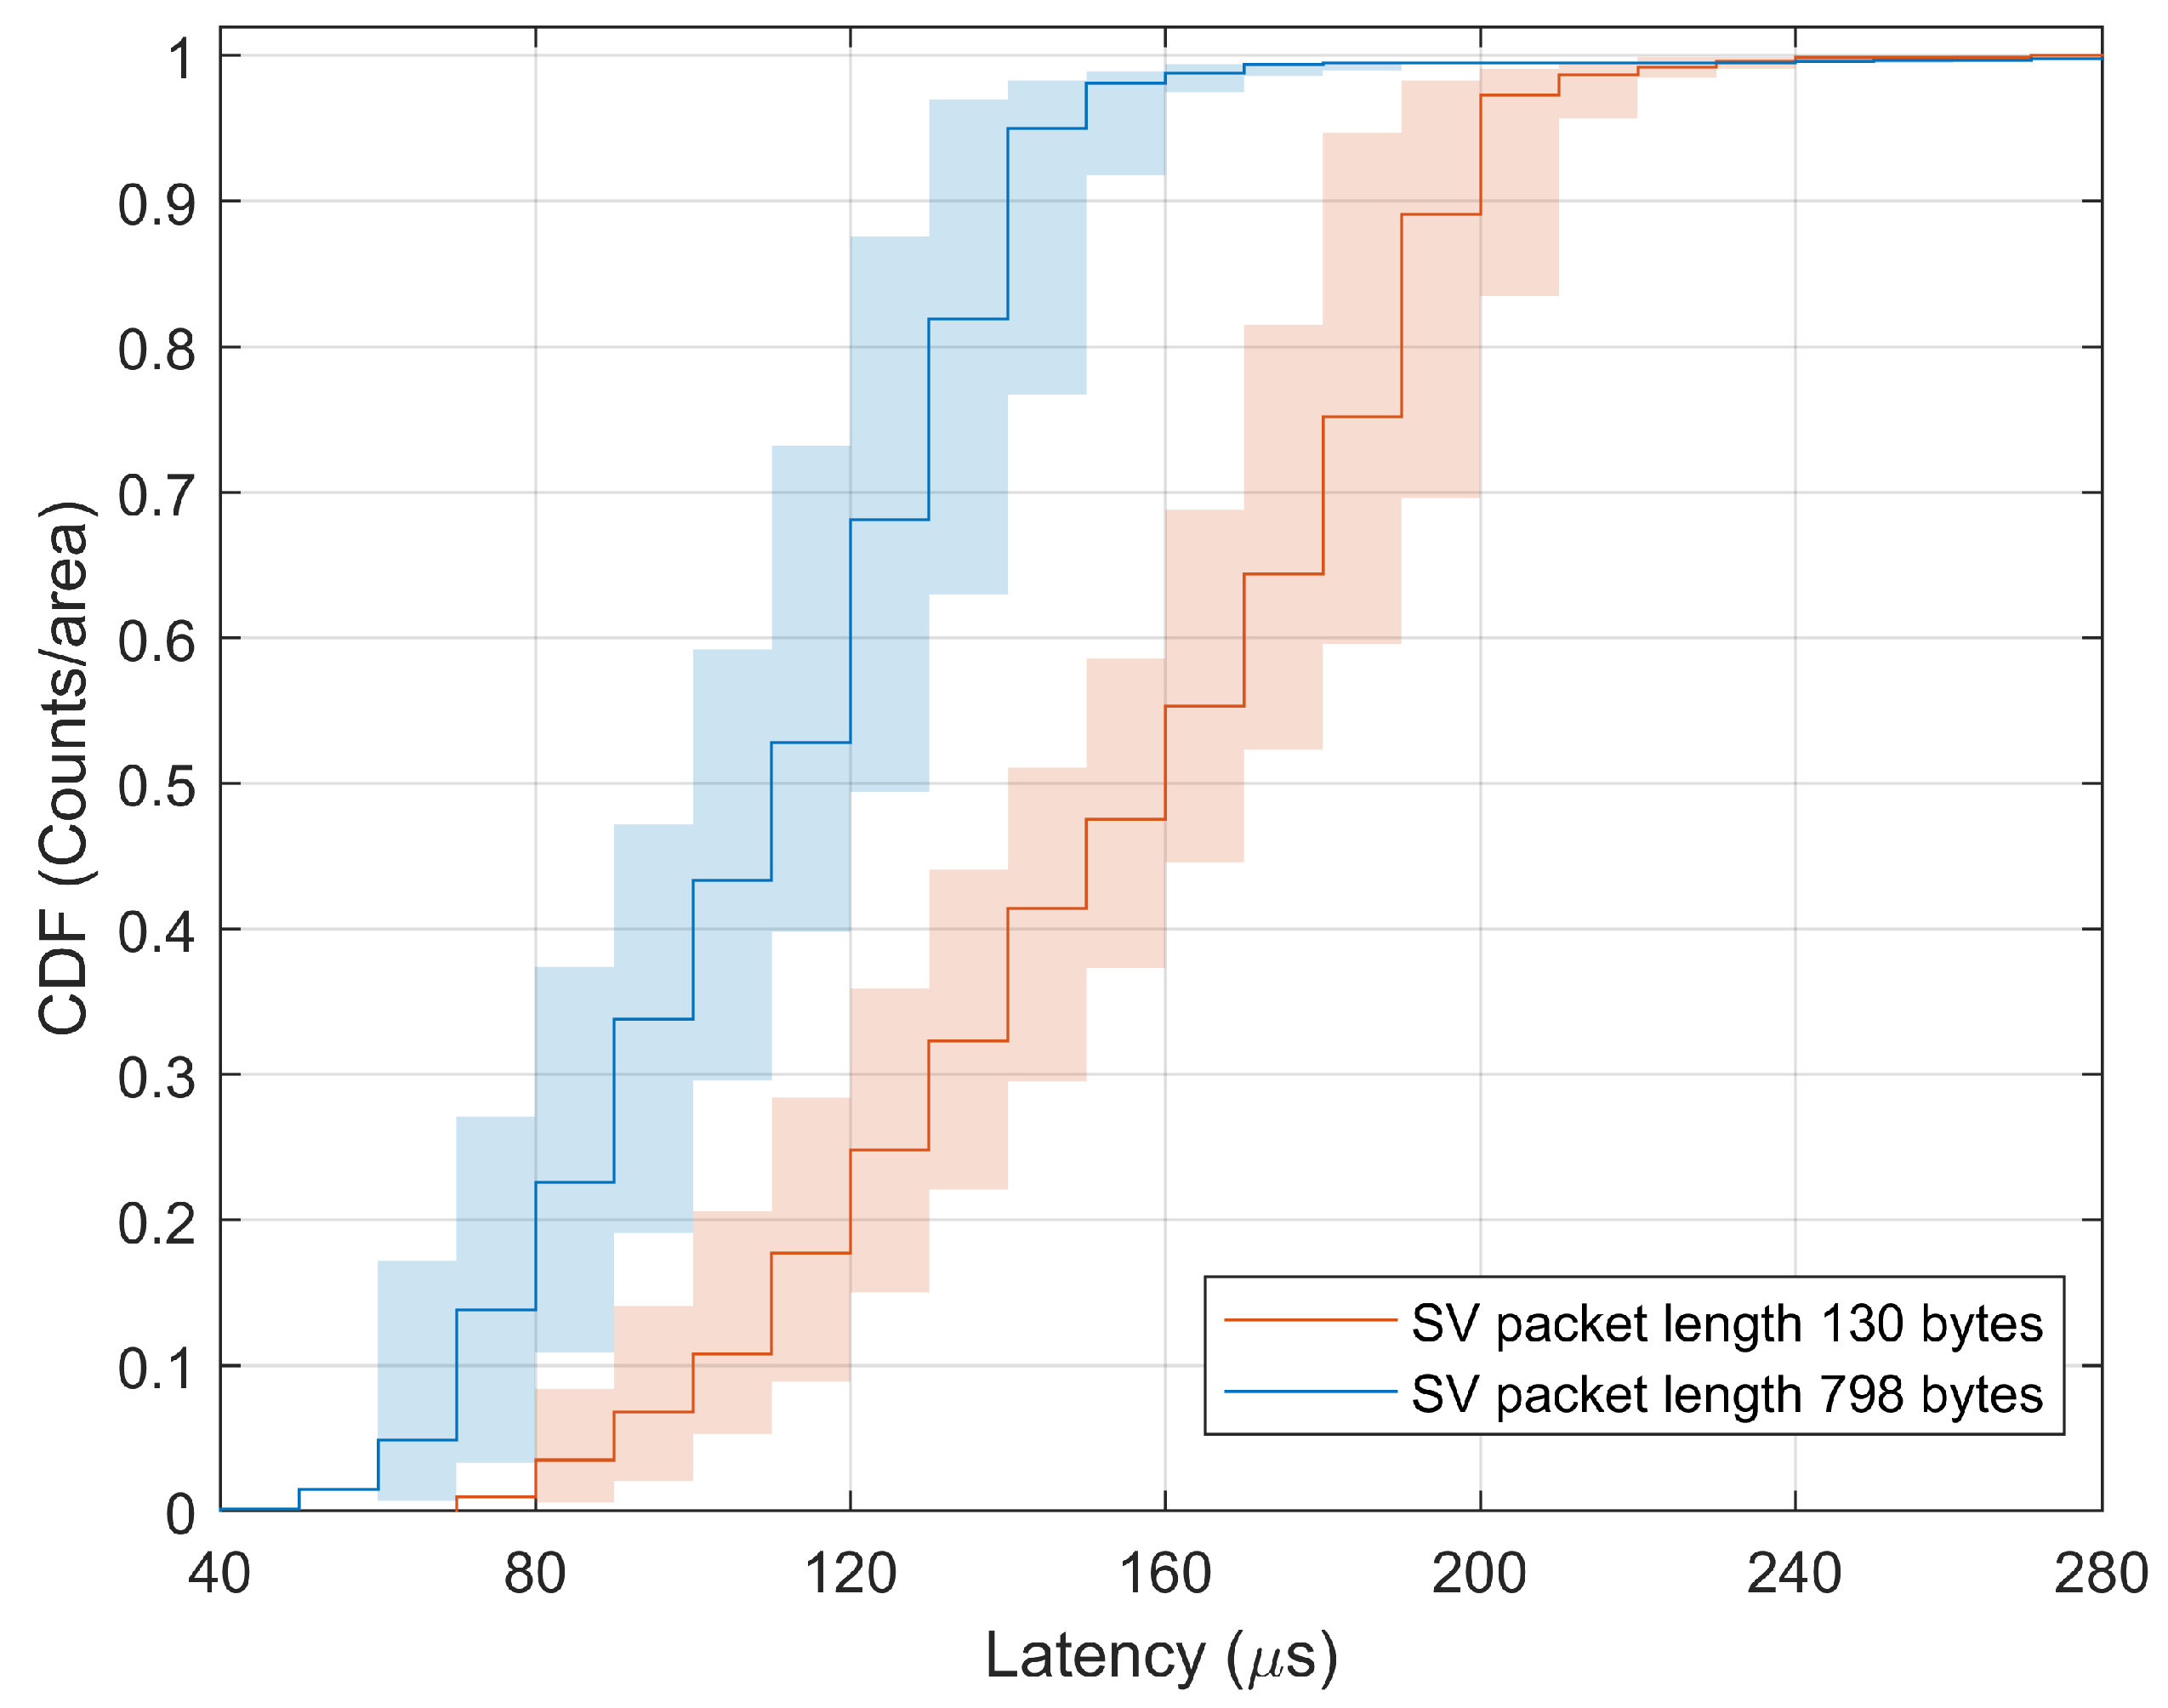
Figure 6 shows the cumulative distribution functions (CDFs) of the transmission latency with respect to the rising edge transition of the PPS in the PTP time reference. For this analysis, the latency measurements have been carried out by acquiring 2 SV data streams characterized by different packet size, namely, 798 and 130 bytes, respectively. In this way, we aim at investigating whether the size of the packet (and accordingly the allocated memory requirements) affects the transmission latency. Based on the obtained CDFs, are sufficient to guarantee that of the first samples from both SV data streams are transmitted. The comparison between the two configurations shows also that a higher packet size corresponds to a steeper rise in the CDF: the high majority of the first packets are transmitted within . Conversely, a lower packet size seems to produce a relaxation of the system repeatability, which corresponds to an extra for the CDF variation range. Nevertheless, it is reasonable to say that there exists no clear correlation between packet size and transmission latency: in all the considered configurations, the transmission latency is lower than a publishing period and compatible with the IEC Std requirement of overall latency not exceeding 3 ms by nearly one order of magnitude.
Unfortunately, differently from the publishing period correction in Section 3.2 for the QTP method, the measured transmission latency cannot be used for fine-tuning the IEC Std calibrator. In fact, the CDFs cover a quite large range and do not present a well-defined statistical distribution; therefore, it would be very difficult to compensate for such a contribution. An improper correction would risk to introduce time offsets between the PTP time reference and the SV counter and thus produce errors in the processing of the digital signal at the receiver side. Nevertheless, the remarkable stability and accuracy of the publishing rate combined with the limited contribution of the transmission latency reasonably ensure that the IEC Std constraints are fully met.
4. Reliability of Non-RT Measurements
In this Section, we discuss the reliability of the SV data stream output by the IEC Std calibrator. More specifically, we evaluate whether the publishing rate stability is dependent on external influence quantities, as the selected Ethernet board used to capture the packets or the internal clock of the PC where Wireshark is run.
For this analysis, we acquired the SV data stream between the IEC Std calibrator and an external Personal Computer (PC) with Windows 7 operating system. The signal frequency is set equal to 50 Hz and a sampling rate of 80 Sa/cycle is adopted. An Ethernet cable of 1 m guarantees a connection point-to-point between the publisher (i.e., the calibrator) and the receiver (i.e., the PC). On both sides, Wireshark captures the SV packets for an overall duration of nearly 4 min. The publishing period is computed as the time elapsed between the capture of two consecutive packets.
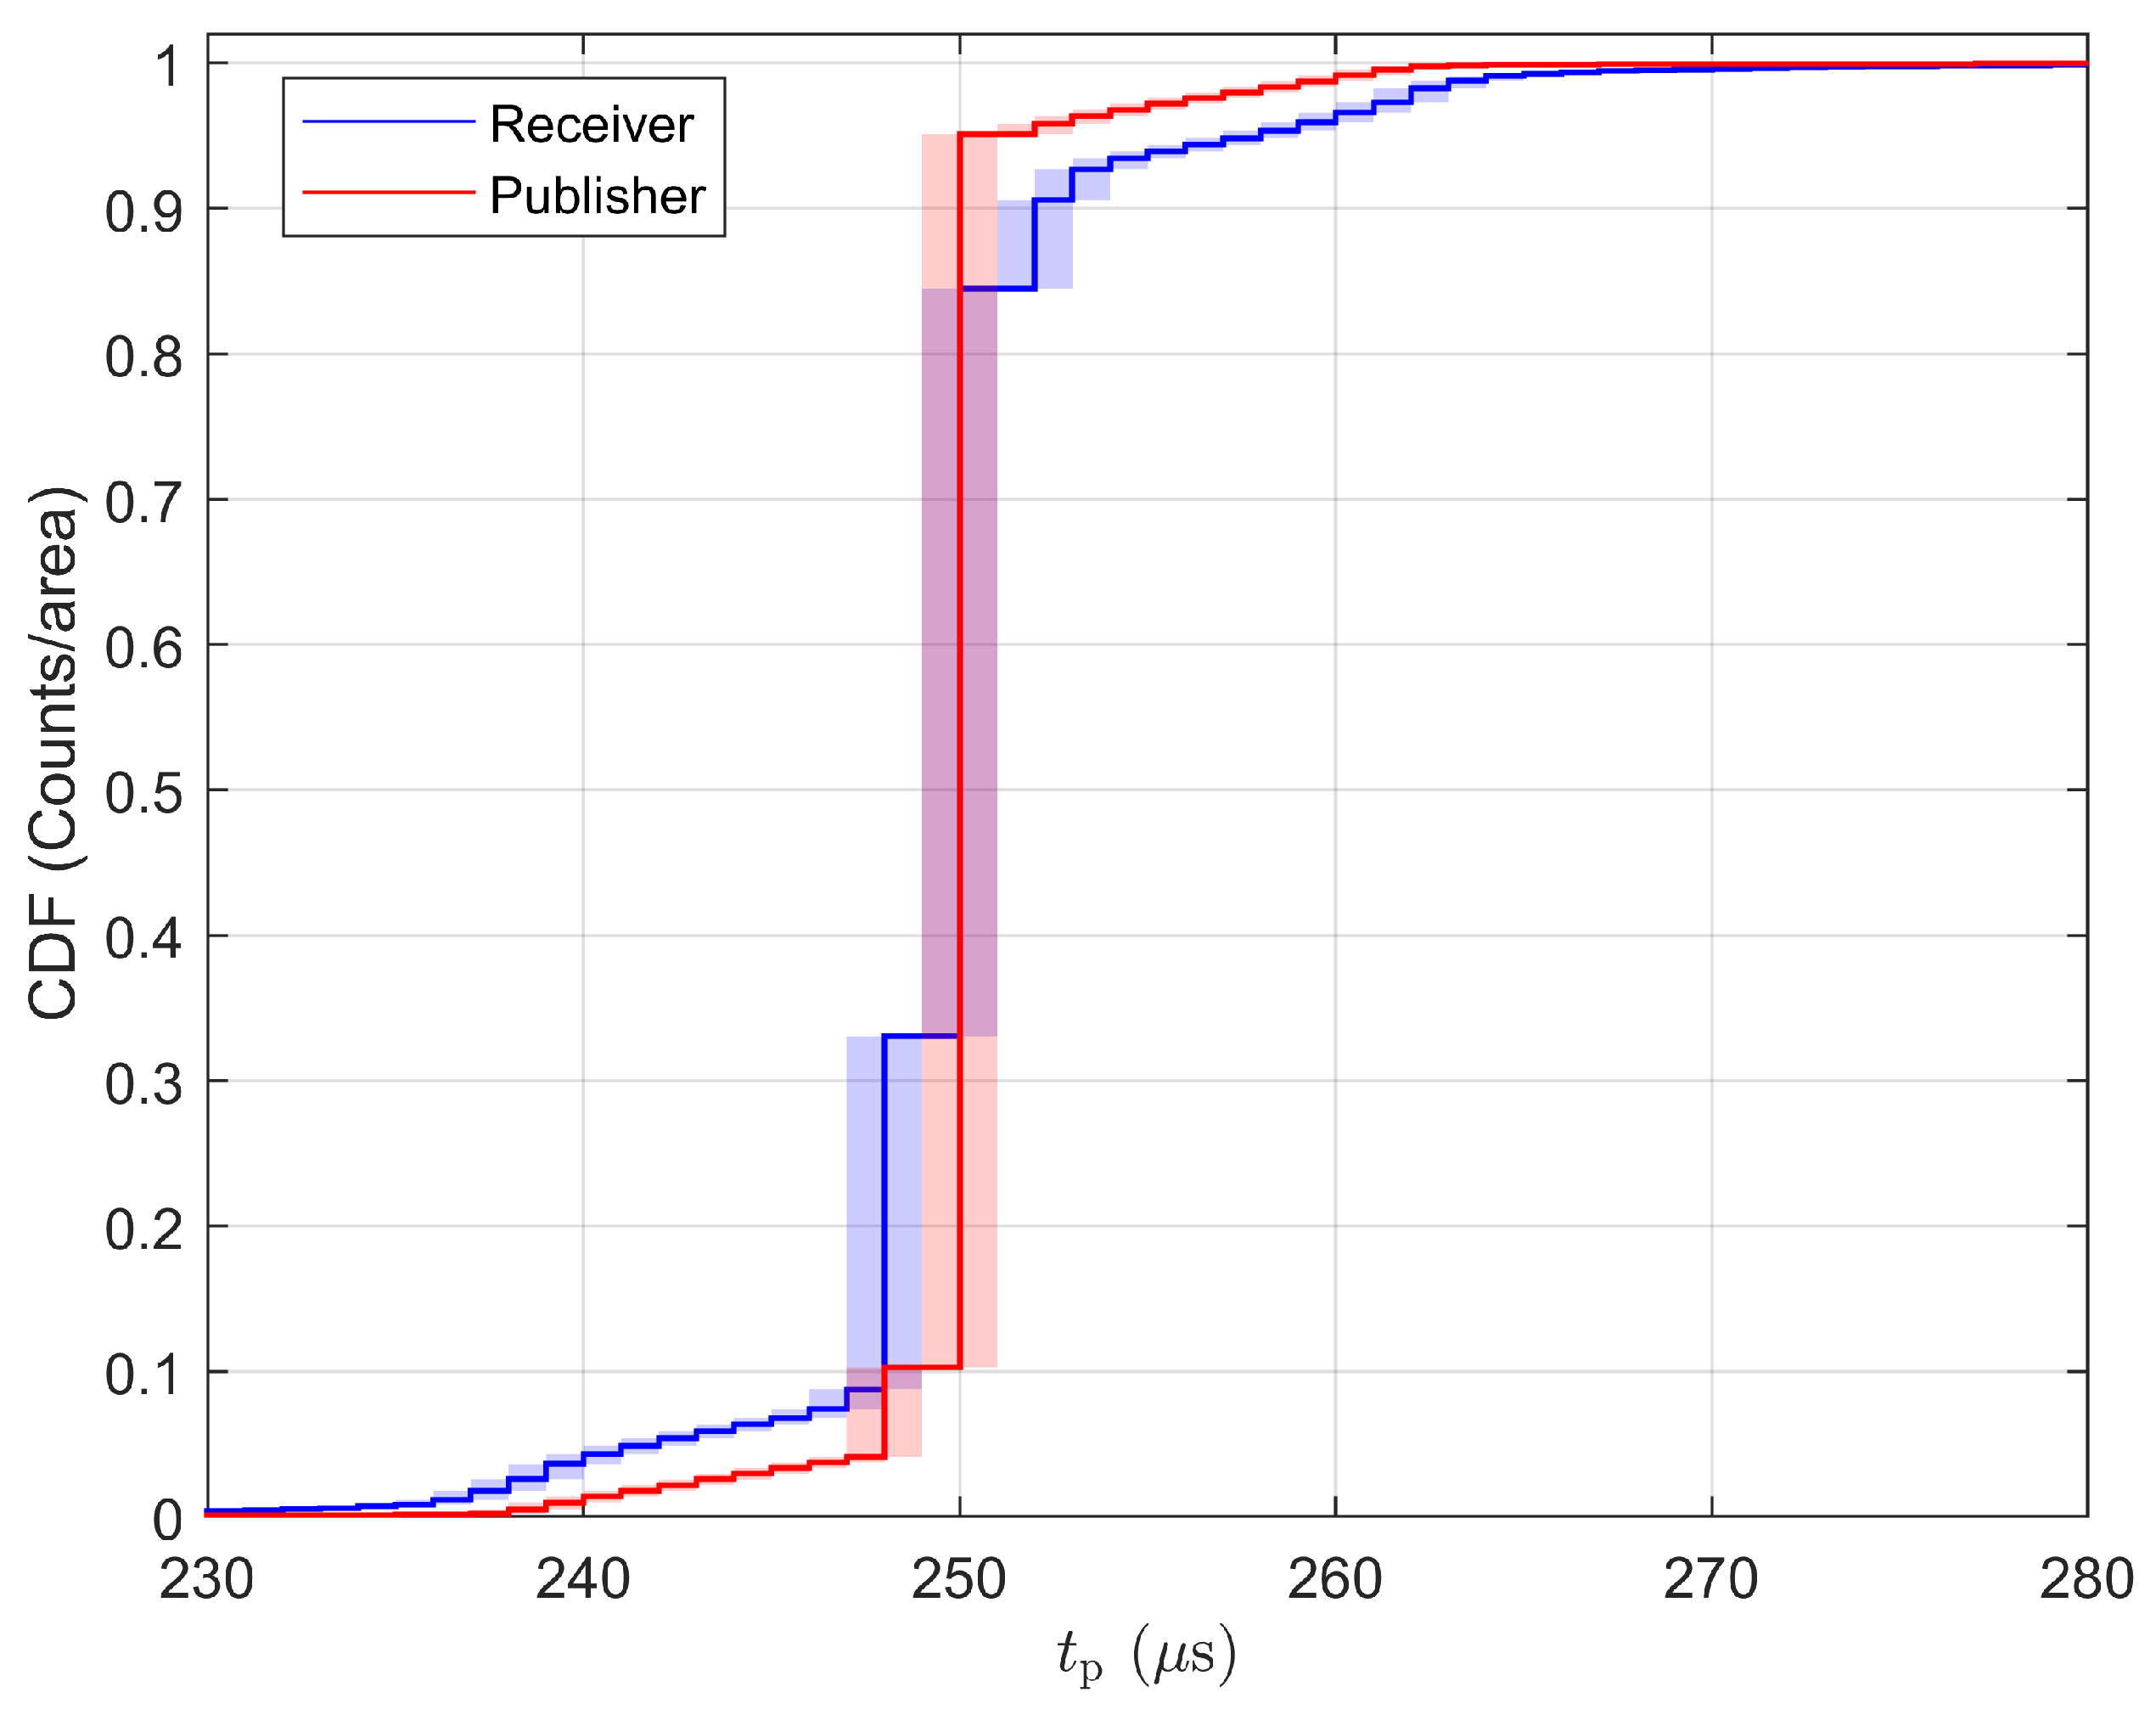
In this context, Figure 7 presents the CDF of the publishing period as measured at the publisher and receiver side in red and blue, respectively. In both cases, the distribution is centered around the nominal value, i.e., 250 μs. On the other hand, it is also worth noticing how the receiver presents a slightly higher variability due to the handling of other transmissions on the same Ethernet board. For the sake of completeness, the mean, standard deviation, and 95% percentile are reported in Table 2 for both publisher and receiver recordings.
5. Experimental Tests
In this Section, we provide an experimental validation of the IEC Std calibrator against two commercial devices, namely, a SAMU and a Digital Current Transformer Measuring Bridge (in the following briefly Bridge). Indeed, the first one is a typical example of SV publisher, whereas the second one is the most widely employed representative of SV receiver in metrology applications.
The first test enables us to highlight the stability of the publishing rate, whereas the second one shows how a deviation from the nominal publishing rate might affect the synchronization of a Bridge and thus produce a loss of SV packets.
5.1. Publishing Rate Stability
In the first test, the publishing rate of the IEC Std calibrator is compared against the one of a commercial SAMU coupled with a current transformer of class 0.5. For this analysis, the SV data stream is captured and timestamped by two different subscribers: a PC with non-real-time OS and an SV-based PMU running on a Linux RT OS [8].
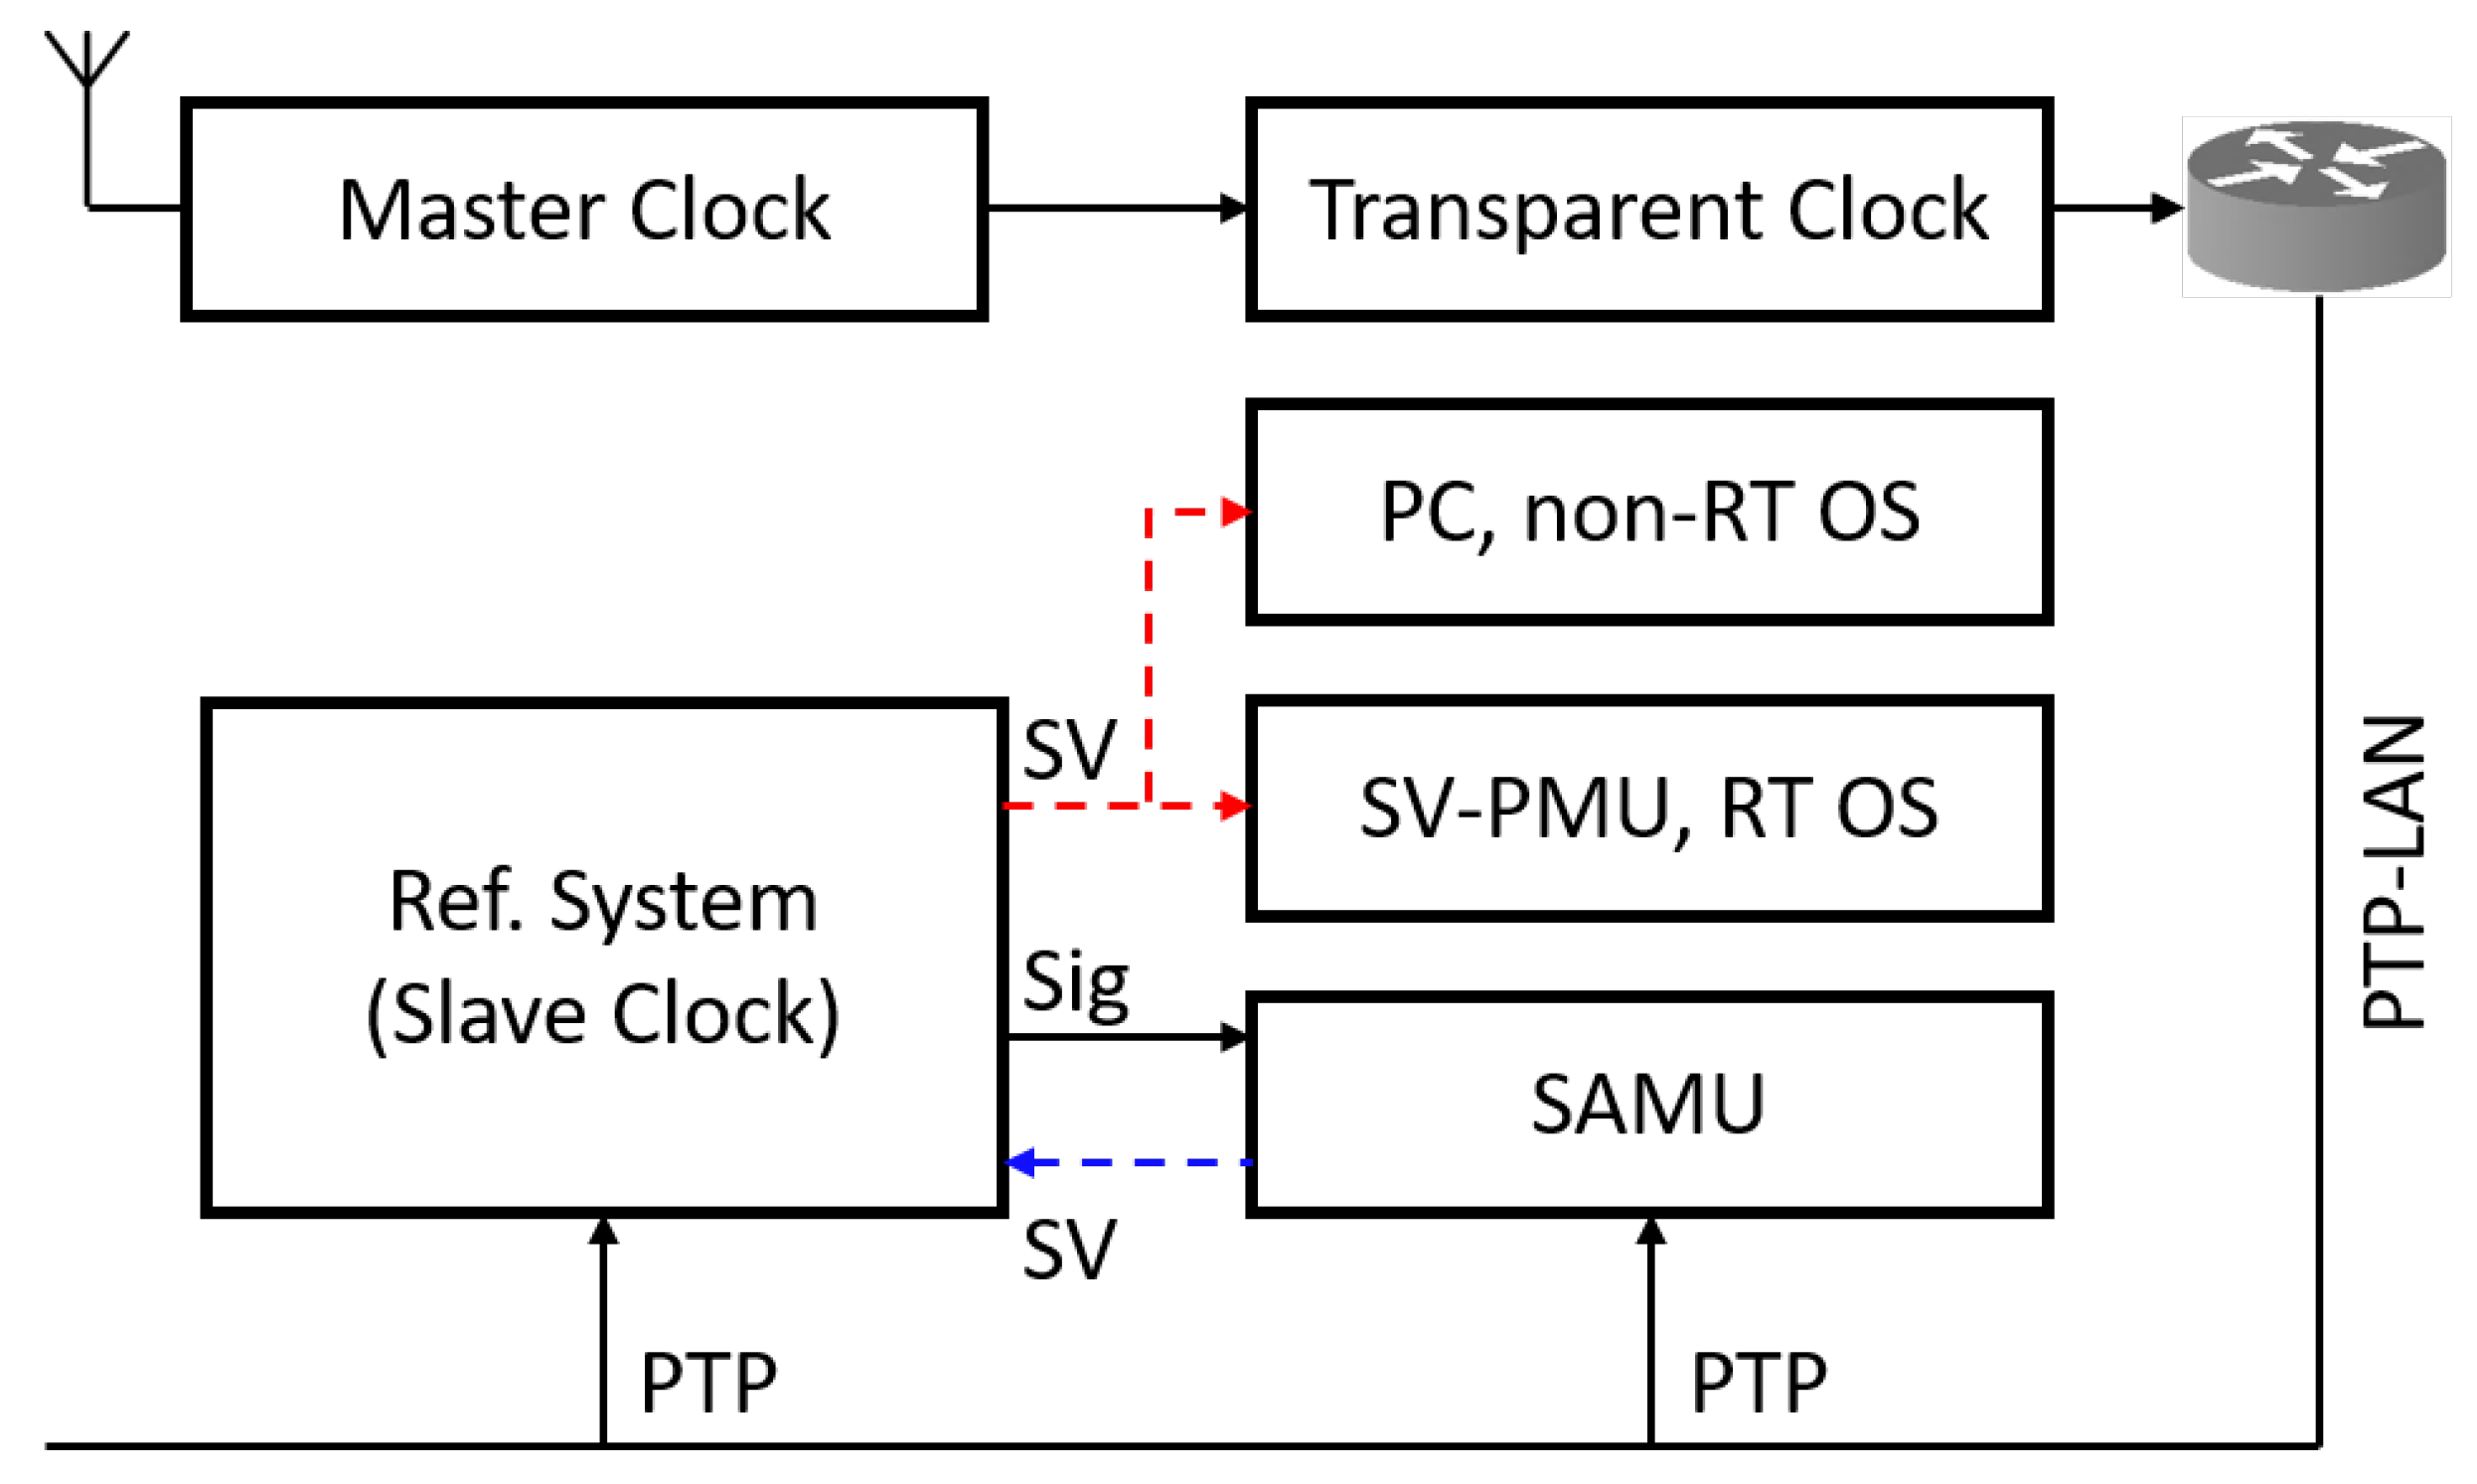
In this regard, Figure 8 presents the network topology of the measurement setup. The Meinberg LANTIME M600 Time Server constitutes the GPS-disciplined master clock. According to the PTP synchronization protocol, the time information is distributed via a MAR1040 Configurable Switch set as transparent clock (Belden, St. Louis, MO, USA) and is supplied to the IEC Std calibrator, to the SAMU, and to the PC used as the subscriber. The SV data streams, as output by the calibrator or the commercial device, are supplied in parallel to the PC and to the SV-PMU, whose time information descends from an independent GPS receiver.
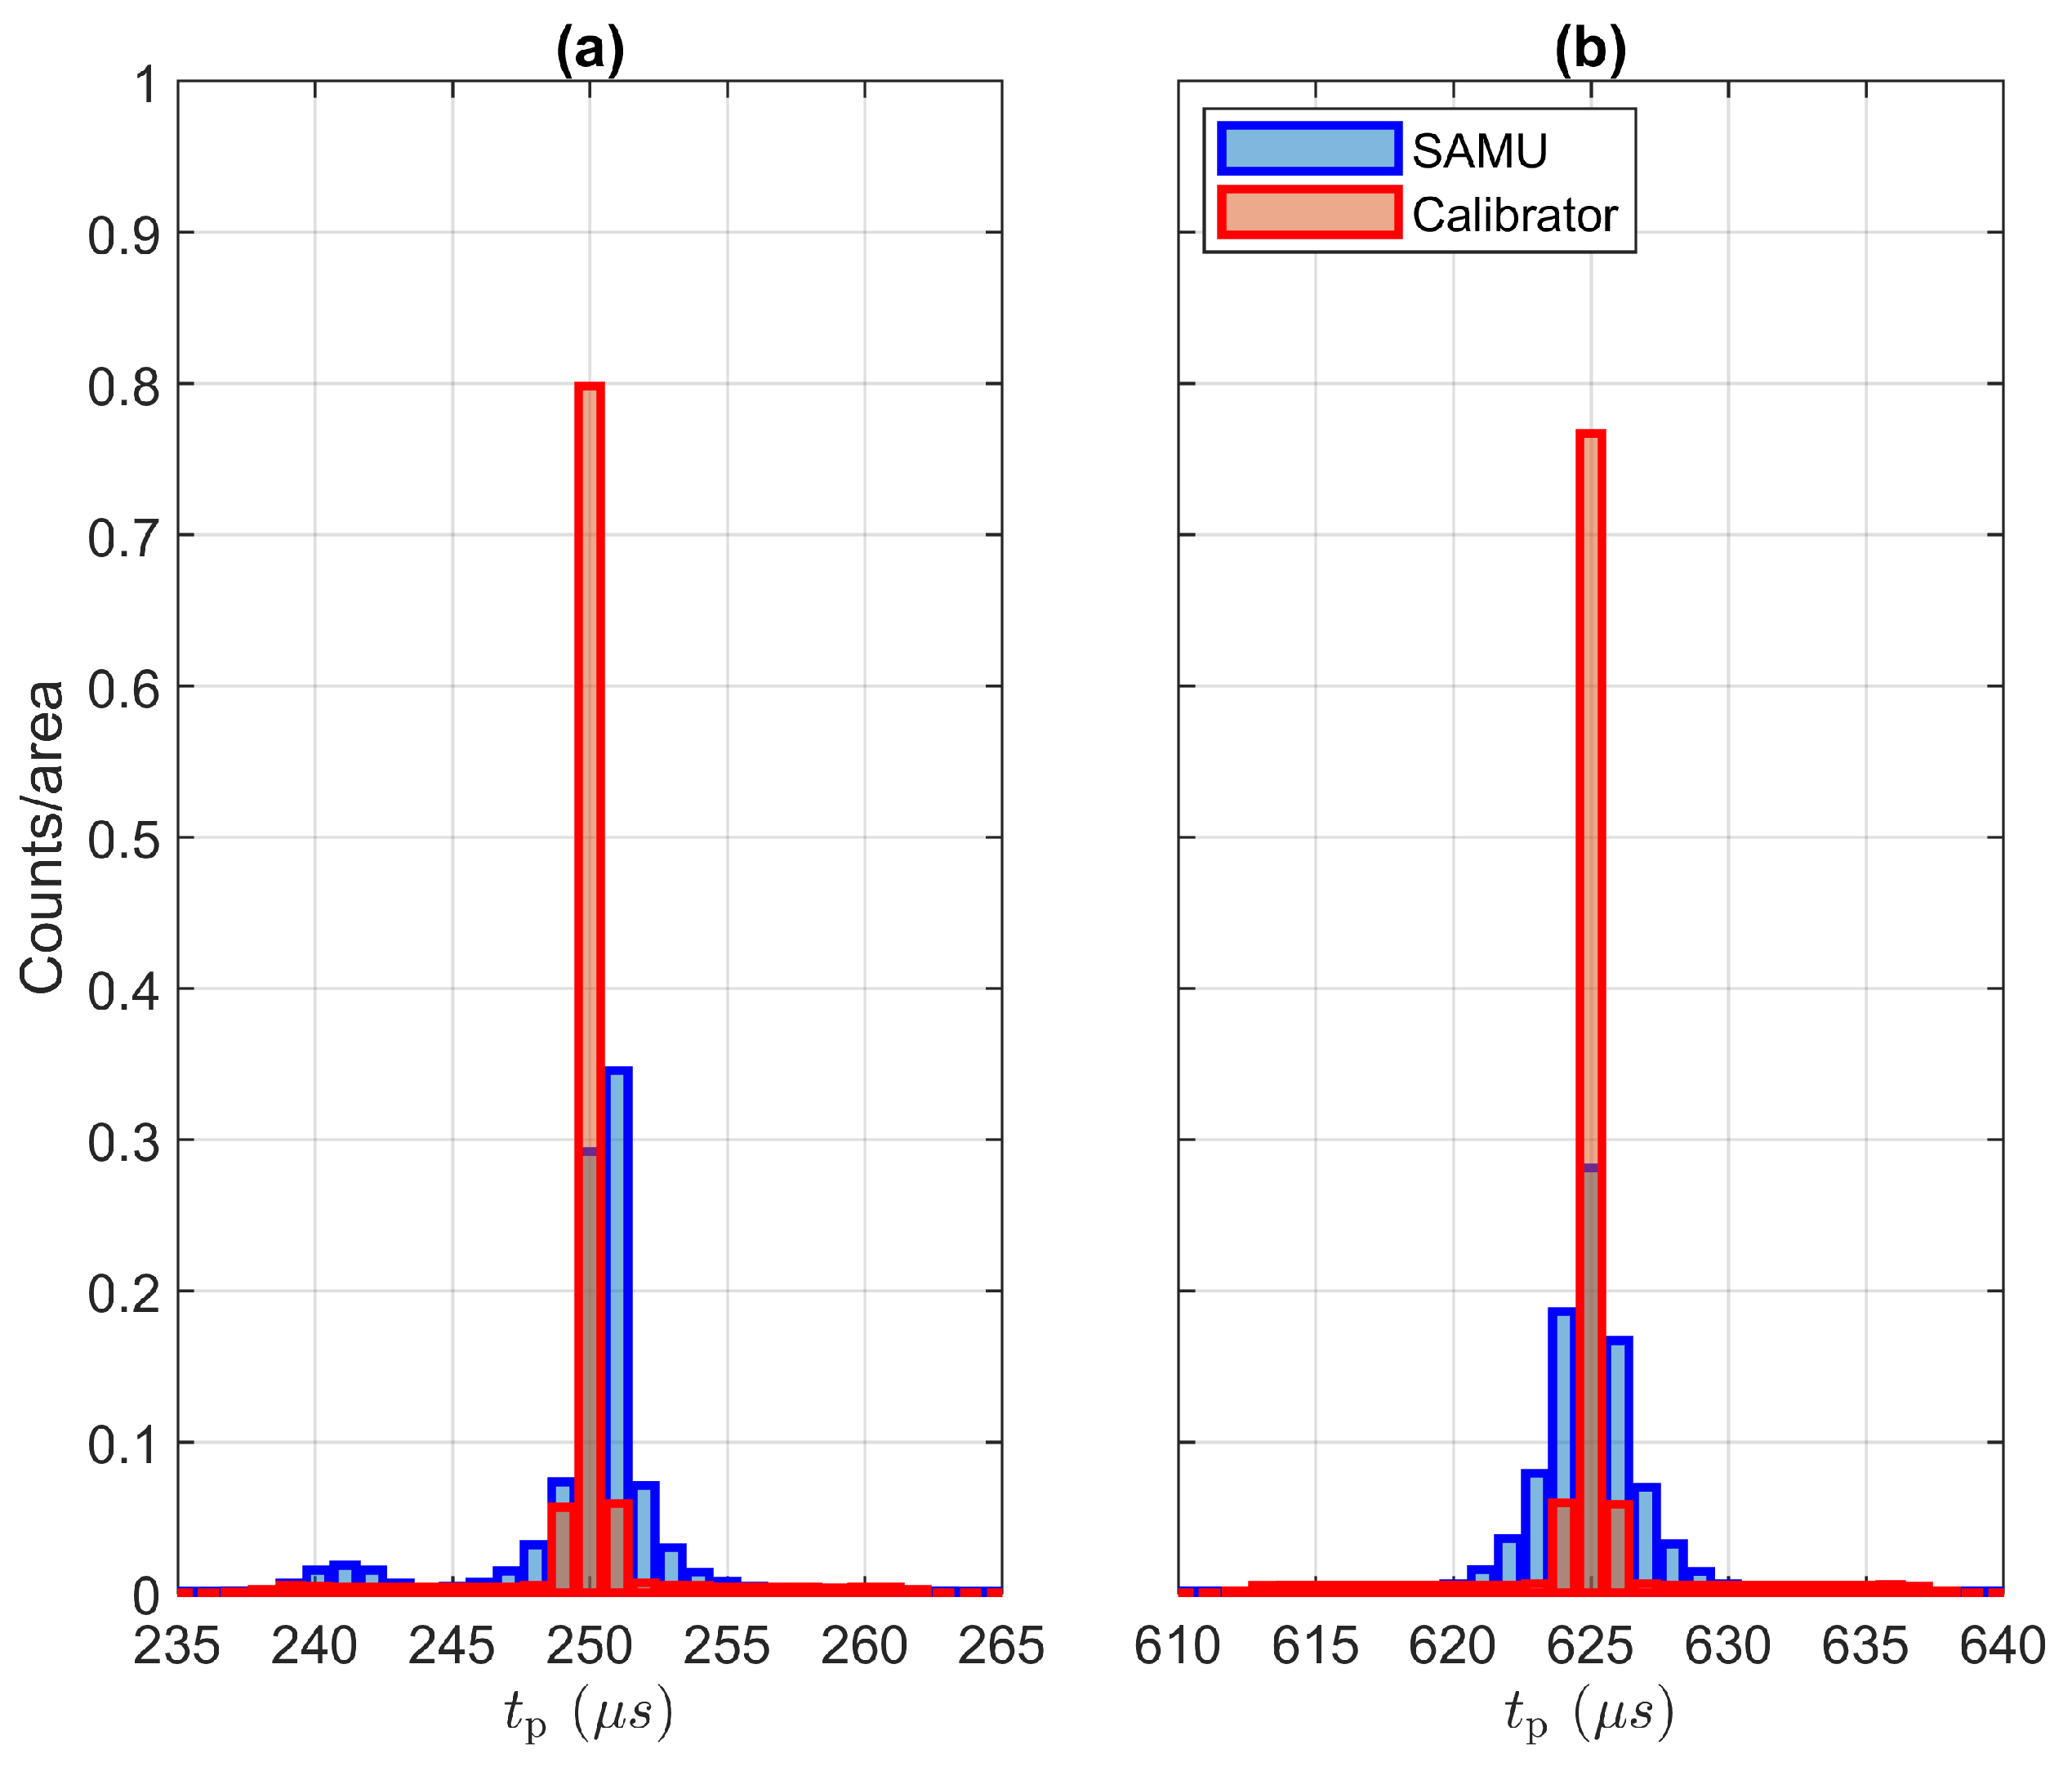
On the PC side, the SV data packets are captured and timestamped using Wireshark. In a similar way, the SV-PMU timestamps the SV data packets as soon as they are received by the Ethernet adapter. In this regard, it is interesting to observe that the present analysis allows for comparing two different timestamping procedures relying on two independent time sources. In particular, we consider the statistical distribution of the publishing period over two independent datasets, each one consisting of more than packets. Without loss of generality, we set the signal frequency to 50 Hz, and we varied the sampling rate from 80 to 256 Sa/cycle, as shown in Figure 9a,b, respectively.
In more detail, the two plots illustrate the probability distributions of through histograms with a bin width of , i.e., the resolution of Wireshark timestamp on Windows operating systems. In the IEC Std calibrator case, the counts are concentrated exactly at the nominal value for both the publishing periods unless minor deviations within and 1 μs. In the SAMU case instead, the histograms show a wider variation range and more irregular distribution.
In this context, Table 3 reports the mean and standard deviation of the distribution measured with the PC or the SV-PMU for both the SAMU and the IEC Std calibrator. It should be noticed how the two measurement procedures provide extremely consistent results in all the considered configurations. In particular, it is interesting to observe that the proposed reference system is characterized by slightly lower standard deviations.
These results prove the remarkable performance of the IEC Std calibrator and confirm the potential of the SV encoding approach proposed in Section 3.1. It is thus reasonable to say that the fact that the code runs on a non-real time operating system does not affect the publishing rate accuracy and stability even on long-lasting and independent experiments.
5.2. Publishing Rate Tolerance
The tolerance with respect to the deviation from the nominal SV publishing rate as a characteristic of instruments working with SV as input signal is an aspect that has not been properly studied yet. For this reason, it is worthwhile to carry out some tests that may highlight some interesting features of such instruments and, at the same time, will allow us to characterize our IEC Std calibrator in this operating scenario. To this end, a commercial Bridge has been deployed as DUT. The Bridge is synchronized with the same time reference (i.e., PTP) as the IEC Std calibrator and is equipped with an Ethernet board dedicated to the capturing of the the SV signal input. For these tests, this Ethernet board is connected point-to-point to the IEC Std calibrator, as shown by the blue dashed line in Figure 1. First, the SV packets are queued in a First-In-First-Out (FIFO) buffer. Then, based on the sample count, the time-stamp information is extracted and compared with the internal time of the Bridge (further details are provided in [16]).
According to (2), it is possible to adjust the publishing period employed by the IEC Std calibrator. In this way, while keeping the information contained within the SV intact (i.e., timestamp, current and voltage), the packet reaches its destination at an unusual time for what the DUT expects. Depending on the buffer size and on the tolerance set by the internal logic of the Bridge (Typically, the maximum allowed discrepancy between the arrival time of the SV packet with counter equal to 0 and the rising edge transition of the PPS.), this may result into a loss of synchronization and consequently into a discard of all invalid SV packets.
In order to reproduce such scenario, the DUT has been set to receive a SV data stream with a nominal publishing rate . This value has been increased and decreased, and the synchronization loss, in terms of the number of discarded packets within a given time window, has been observed 5 times each 60 s. In this context, the uncertainty has been assessed as the standard deviation of the discarded packet number as function of the adopted publishing rate.
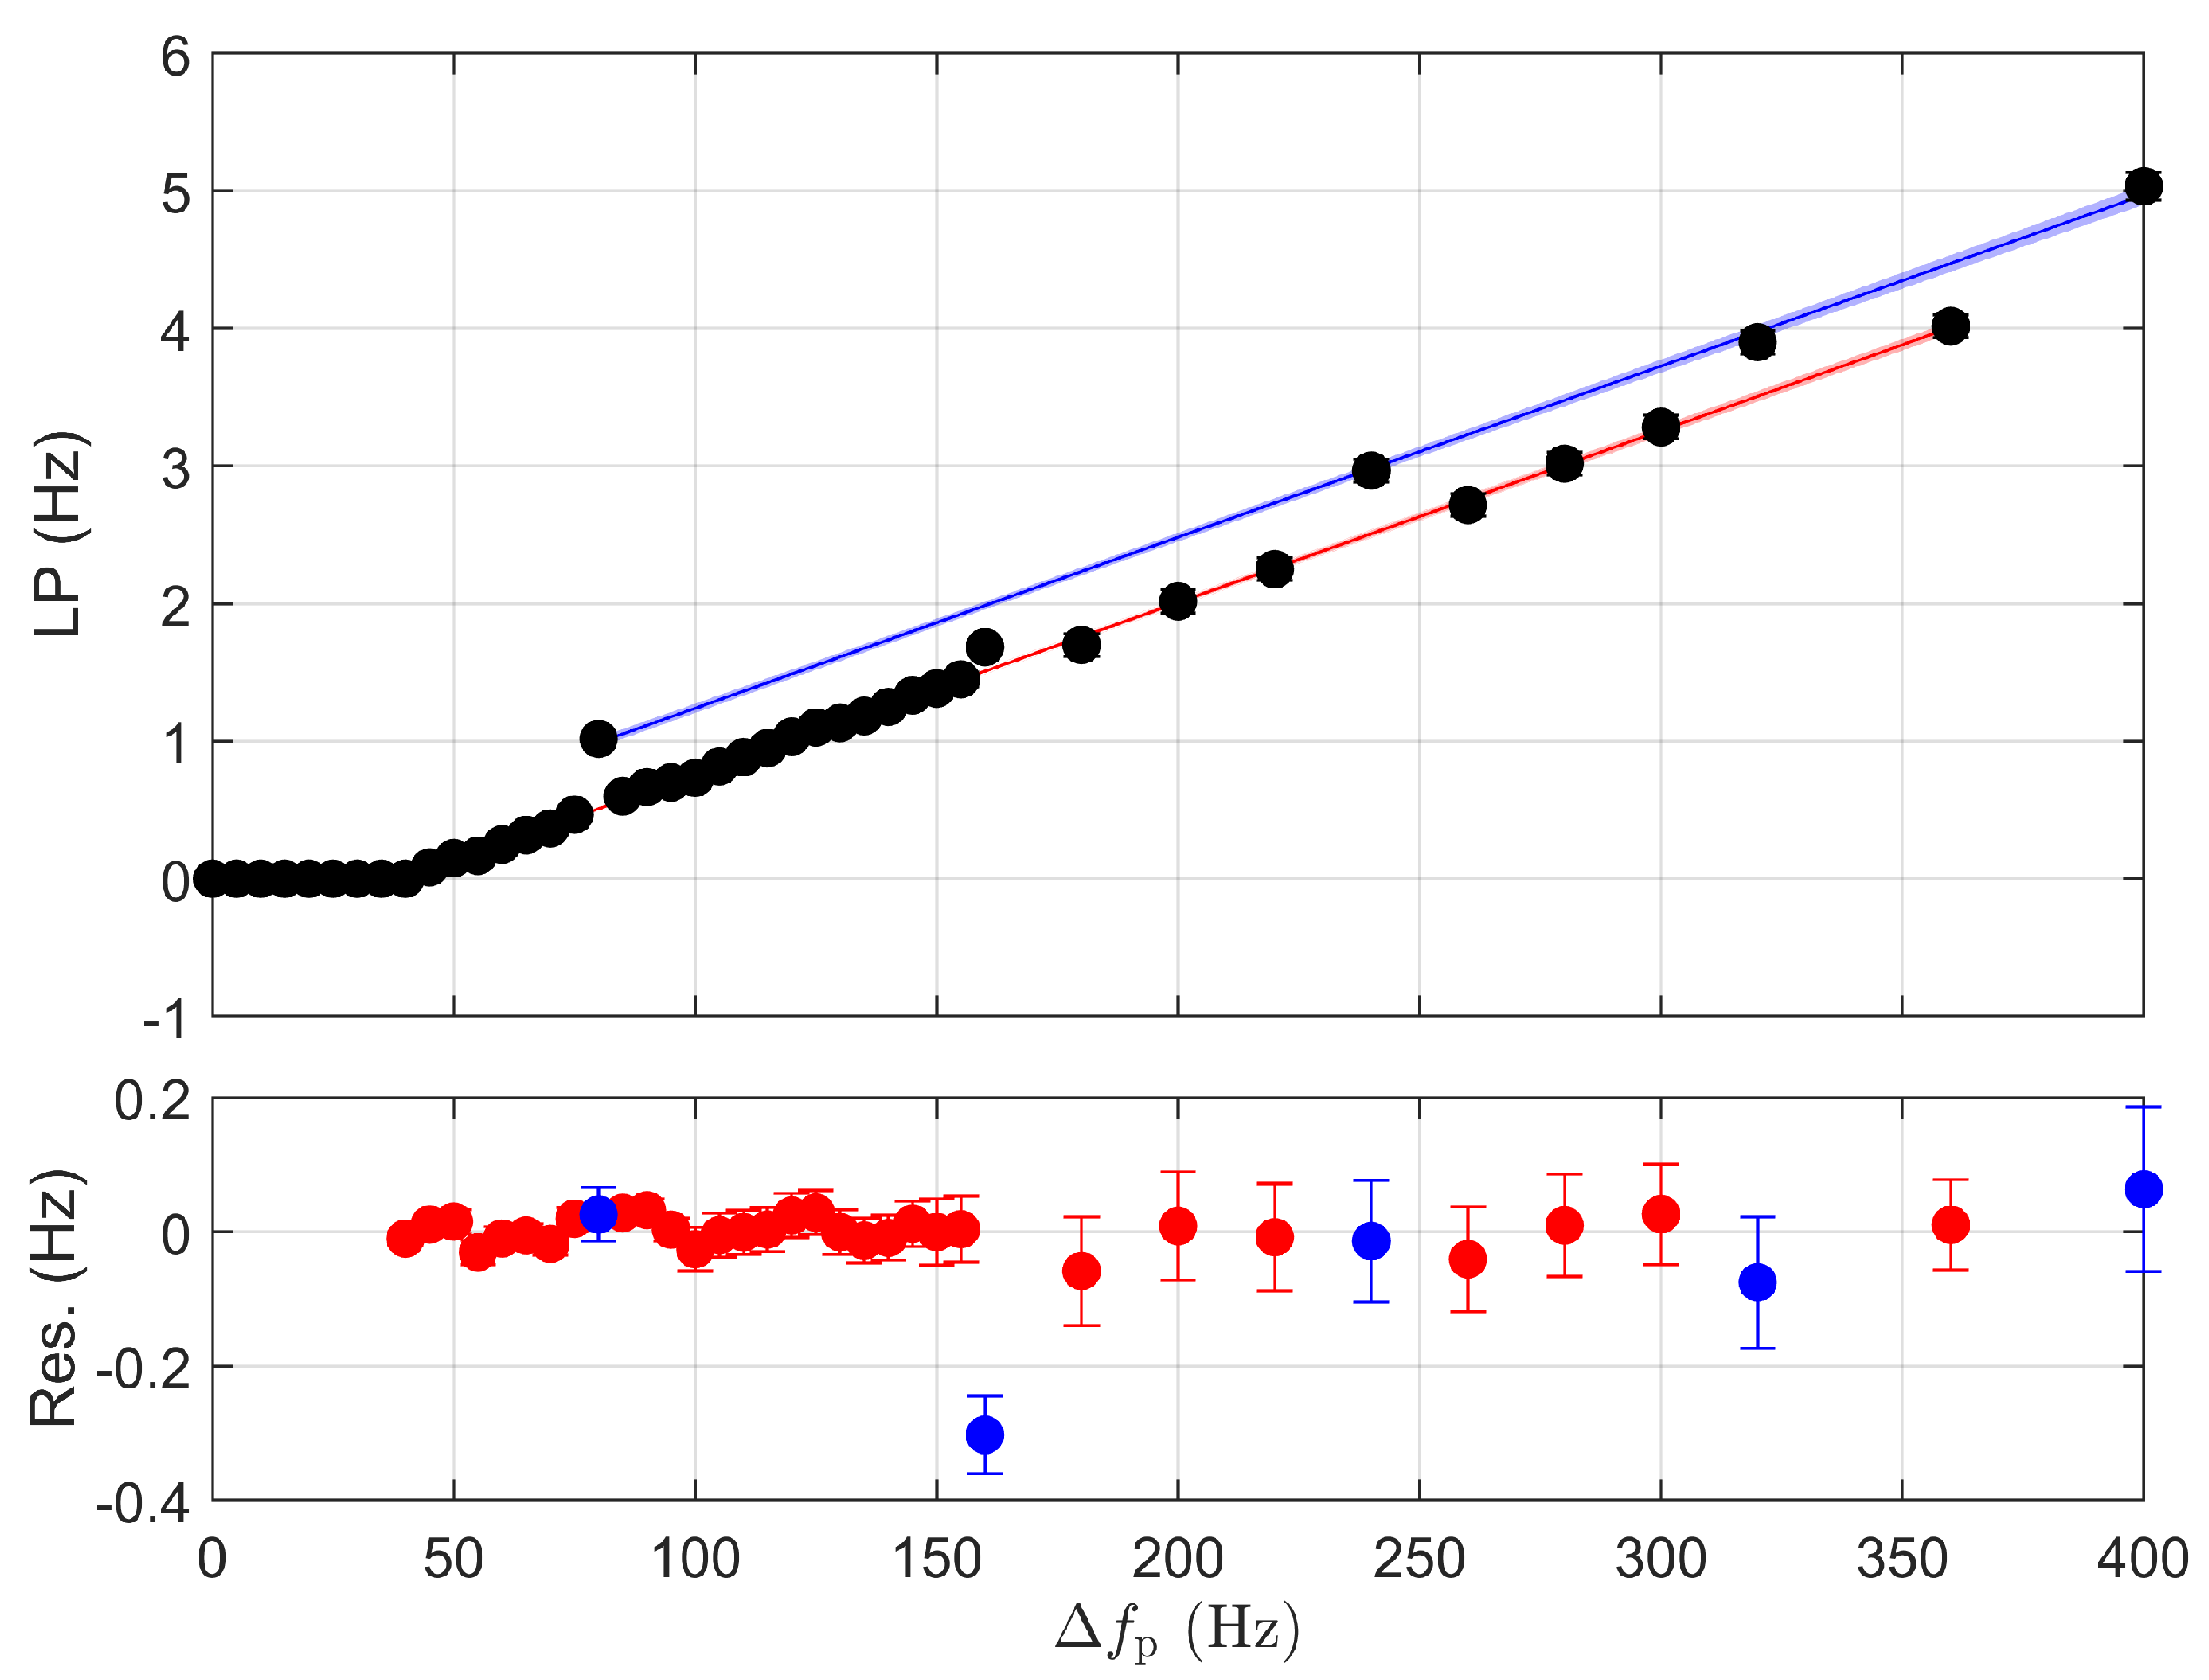
For , we do not observe any loss of packets. Instead, if , there is no loss up to ; then, the loss packet rate, named LP, increases linearly with two different trends by increasing the difference between nominal and modified publishing rate, named , as illustrated in Figure 10. It should be noticed that the two decreasing trends present the same slope fitted with an uncertainty lying within . The offset difference between the two linear trends occurs always for particular according this relation:
In order to minimize the effect of possible outliers, the fit is implemented through a weighted least squares procedures. For each considered value, we evaluated the rate of growth of the packet loss: the more consistent and stable is the packet loss, the higher the weight associated to the overall LP value is in the linear regression. In this way, we aim at neglecting packet losses that are due to intermittent or sporadic events and that are not strongly correlated with the inconsistency between nominal and actual publishing rate.
In summary, the residuals resemble a normal distribution with zero mean and reduced standard deviation. As a consequence, it is reasonable to say that there is a remarkable agreement between the measured LP values and the linear fit. This represents a useful feature of the IEC Std calibrator as it allows for assessing the DUT tolerance against non-nominal publishing rates.
6. Conclusions
The setup of a calibration system that synchronously produces analog signals and their corresponding digital version encapsulated in IEC 61850-9-2 Ethernet packets has been presented. In particular, the encoding of SVs, as well as their transmission functions, optimized for working on a non-real-time operating system, have been described in details. The performance of the IEC Std calibrator has been characterized in terms of publishing rate stability and transmission latency. These parameters represent two crucial aspects for many monitoring and control applications relying on SV data streams. As a consequence, the calibration infrastructure shall be optimized and characterized in terms of expected performance and relative statistical uncertainty. In this way, the calibration infrastructure will be able to assess the performance of the SV-based instrumentation not only in terms of accuracy of the transmitted values but also in terms of transmission latency and publishing rate stability.
Two experimental tests have proven that, first, the IEC Std calibrator guarantees a stable publishing rate independently of the non-deterministic timing of a non-real-time operating system; second, the effort made to implement the SV transmission functions at kernel level is proven useful to communicate with some IEC 61850-9-2 devices with SV input as, for instance, the measuring bridge for NCITs. The proposed IEC calibrator guarantees a publishing period within 0.3 μs from the nominal values with a worst-case standard deviation of 8.2 μs, thus proving its remarkable accuracy and stability.
Author Contributions
Conceptualization, M.A. and G.F.; methodology, G.F.; software, M.A.; validation, M.A. and G.F.; formal analysis, G.F.; writing—original draft preparation, G.F.; project administration, M.A. All authors have read and agreed to the published version of the manuscript.
Funding
This project 17IND06 FutureGrid II has received funding from the EMPIR program co-financed by the Participating States and from the European Union’s Horizon 2020 research and innovation program.
Informed Consent Statement
Not applicable.
Data Availability Statement
Not applicable.
Conflicts of Interest
The authors declare no conflict of interest. The funders had no role in the design of the study; in the collection, analyses, or interpretation of data; in the writing of the manuscript, or in the decision to publish the results.
Abbreviations
The following abbreviations are used in this manuscript:
| PMU | Phasor Measurement Unit |
| IED | Intelligent Electrical Device |
| SV | Sampled Value |
| SAMU | Stand Alone Merging Unit |
| NMI | National Metrology Institute |
| GPS | Global Positioning System |
| UTC | Coordinated Universal Time |
| dll | linked dynamic library |
| DUT | Device Under Test |
| SCD | System Configuration Description |
| APDU | Application Protocol Data Unit |
| ASDU | Application Service Data Unit |
| PPS | Pulse Per Second |
| PC | Personal Computer |
| PTP | Precision Time Protocol |
| CDF | Cumulative Distribution Function |
| RT | Real Time |
| OS | Operative System |
| NCIT | Non-Conventional Instrument Transformer |
References
- Liserre, M.; Sauter, T.; Hung, J.Y. Future Energy Systems: Integrating Renewable Energy Sources into the Smart Power Grid Through Industrial Electronics. IEEE Ind. Electron. Mag. 2010, 4, 18–37. [Google Scholar] [CrossRef]
- Borghetti, A.; Bosetti, M.; Grillo, S.; Massucco, S.; Nucci, C.A.; Paolone, M.; Silvestro, F. Short-Term Scheduling and Control of Active Distribution Systems with High Penetration of Renewable Resources. IEEE Syst. J. 2010, 4, 313–322. [Google Scholar] [CrossRef]
- Rietveld, G.; Braun, J.P.; Martin, R.; Wright, P.; Heins, W.; Ell, N.; Clarkson, P.; Zisky, N. Measurement Infrastructure to Support the Reliable Operation of Smart Electrical Grids. IEEE Trans. Instrum. Meas. 2015, 64, 1355–1363. [Google Scholar] [CrossRef]
- Frigo, G.; Derviškadić, A.; Zuo, Y.; Paolone, M. PMU-Based ROCOF Measurements: Uncertainty Limits and Metrological Significance in Power System Applications. IEEE Trans. Instrum. Meas. 2019, 68, 3810–3822. [Google Scholar] [CrossRef] [Green Version]
- Giustina, D.D.; Ferrari, P.; Flammini, A.; Rinaldi, S.; Sisinni, E. Automation of Distribution Grids with IEC 61850: A First Approach Using Broadband Power Line Communication. IEEE Trans. Instrum. Meas. 2013, 62, 2372–2383. [Google Scholar] [CrossRef]
- Castello, P.; Ferrari, P.; Flammini, A.; Muscas, C.; Pegoraro, P.A.; Rinaldi, S. A Distributed PMU for Electrical Substations with Wireless Redundant Process Bus. IEEE Trans. Instrum. Meas. 2015, 64, 1149–1157. [Google Scholar] [CrossRef]
- Cataliotti, A.; Cosentino, V.; Di Cara, D.; Guaiana, S.; Panzavecchia, N.; Tinè, G. A New Solution for Low-Voltage Distributed Generation Interface Protection System. IEEE Trans. Instrum. Meas. 2015, 64, 2086–2095. [Google Scholar] [CrossRef]
- Frigo, G.; Agustoni, M. Phasor Measurement Unit and Sampled Values: Measurement and Implementation Challenges. In Proceedings of the 2021 IEEE 11th International Workshop on Applied Measurements for Power Systems (AMPS), Cagliari, Italy, 29 September–1 October 2021; pp. 1–6. [Google Scholar] [CrossRef]
- IEC/IEEE 61850:2021 Edition 1.0 2021-06; IEC/IEEE International Standard-Communication Networks and Systems for Power Utility Automation—Part 1: Introduction and Overview. IEEE: Piscataway, NJ, USA, 2021; pp. 1–6707.
- IEEE Std 2030.100-2017; IEEE Recommended Practice for Implementing an IEC 61850-Based Substation Communications, Protection, Monitoring, and Control System. IEEE: Piscataway, NJ, USA, 2017; pp. 1–67. [CrossRef]
- IEC 61850-9-2:2011+AMD1:2020 CSV Edition 2.1 2020-02; IEC/IEEE International Standard-Communication Networks and Systems for Power Utility Automation-Part 9-2: Specific Communication Service Mapping (SCSM)-Sampled Values over ISO/IEC 8802-3. IEEE: Piscataway, NJ, USA, 2020; pp. 1–34.
- Higgins, N.; Vyatkin, V.; Nair, N.K.C.; Schwarz, K. Distributed Power System Automation with IEC 61850, IEC 61499, and Intelligent Control. IEEE Trans. Syst. Man Cybern. Part C Appl. Rev. 2011, 41, 81–92. [Google Scholar] [CrossRef]
- Agustoni, M.; Mortara, A. A Calibration Setup for IEC 61850-9-2 Devices. IEEE Trans. Instrum. Meas. 2017, 66, 1124–1130. [Google Scholar] [CrossRef]
- Lehtonen, T.; Hällström, J. A reference merging unit and calibration setup for sampled values over Ethernet. In Proceedings of the 2016 Conference on Precision Electromagnetic Measurements (CPEM 2016), Ottawa, ON, Canada, 10–15 July 2016; pp. 1–2. [Google Scholar] [CrossRef]
- Mohns, E.; Mortara, A.; Cayci, H.; Houtzager, E.; Fricke, S.; Agustoni, M.; Ayhan, B. Calibration of Commercial Test Sets for Non-Conventional Instrument Transformers. In Proceedings of the 2017 IEEE International Workshop on Applied Measurements for Power Systems (AMPS), Liverpool, UK, 20–22 September 2017; pp. 1–6. [Google Scholar] [CrossRef]
- Frigo, G.; Agustoni, M. Calibration of a Digital Current Transformer Measuring Bridge: Metrological Challenges and Uncertainty Contributions. Metrology 2021, 1, 93–106. [Google Scholar] [CrossRef]
- Agustoni, M.; Frigo, G. Characterization of DAC Phase Offset in IEC 61850-9-2 Calibration Systems. IEEE Trans. Instrum. Meas. 2021, 70, 1–10. [Google Scholar] [CrossRef]
- IEC/IEEE 60255-118-1 Edition 1.0 2018-12; IEC/IEEE International Standard-Measuring Relays and Protection Equipment—Part 118-1: Synchrophasor for Power Systems—Measurements. IEEE: Piscataway, NJ, USA, 2018; pp. 1–78.
- IEC 61869-9 Edition 1.0 2016-04; IEC International Standard-Instrument Transformers-Part 9: Digital Interface for Instrument Transformers. IEC: Geneva, Switzerland, 2016; pp. 1–132.
- Lombardi, M. The Use of GPS Disciplined Oscillators as Primary Frequency Standards for Calibration and Metrology Laboratories. NCSLI Meas. 2008, 3, 56–65. [Google Scholar] [CrossRef]
- Blair, S.M.; Coffele, F.; Booth, C.D.; Burt, G.M. An Open Platform for Rapid-Prototyping Protection and Control Schemes with IEC 61850. IEEE Trans. Power Deliv. 2013, 28, 1103–1110. [Google Scholar] [CrossRef] [Green Version]
- IEC 61850-6:2009+AMD1:2018 CSV Consolidated Version; IEC/IEEE International Standard-Communication Networks and Systems for Power Utility Automation-Part 6: Configuration Description Language for Communication in Power Utility Automation Systems Related to IEDs. IEC: Geneva, Switzerland, 2018; p. 269.
- UCA International User Group. Implementation Guideline for Digital Interface to Instrument Transformers Using IEC 61850-9-2; Technical Report; UCA International User Group: Raleigh, UC, USA, 2004. [Google Scholar]
- Risso, F.; Degioanni, L. An architecture for high performance network analysis. In Proceedings of the Sixth IEEE Symposium on Computers and Communications, Hammamet, Tunisia, 5 July 2001; pp. 686–693. [Google Scholar] [CrossRef] [Green Version]
- Jacobson, V.; Leres, C.; McCanne, S. libpcap Lawrence Berkeley Laboratory Berkeley CA. Initial Public Release. 1994. Available online: http://www.tcpdump.org/ (accessed on 10 June 2021).
- WinPcap User’s Manual. WinPcap Documentation. 2018. Available online: http://www.winpcap.org/docs/docs_412/html/group__wpcap.html (accessed on 10 June 2021).
- IEEE Std 1588-2019 (Revision ofIEEE Std 1588-2008); IEEE Standard for a Precision Clock Synchronization Protocol for Networked Measurement and Control Systems. IEEE: Piscataway, NJ, USA, 2020; pp. 1–499. [CrossRef]
Figure 1.
Measurement setup adopted for IEC 61850-9-2 devices’ calibration. The solid lines represent analog signals, the dotted lines represent synchronization logic signals, and the dashed lines represent the published and the received SV data streams in blue and red, respectively.
Figure 1.
Measurement setup adopted for IEC 61850-9-2 devices’ calibration. The solid lines represent analog signals, the dotted lines represent synchronization logic signals, and the dashed lines represent the published and the received SV data streams in blue and red, respectively.

Figure 2.
Time reference and trigger organization within the IEC calibrator. The dashed line represents the execution of the user command, whereas the dotted line indicates the occurrence of the future time event corresponding to the selected time-stamp.
Figure 2.
Time reference and trigger organization within the IEC calibrator. The dashed line represents the execution of the user command, whereas the dotted line indicates the occurrence of the future time event corresponding to the selected time-stamp.

Figure 3.
Probability distribution of the packet transmission periods measured according the QTP method reported (in log scale) with respect to their nominal values : (a) 250, (b) 208.3, (c) 625, and (d) . The blue crosses represent the transmission periods between the packets at the turn of the PPS , whereas the black crosses are the transmission periods between all other packets. The bin width is .

Figure 4.
Probability distribution of the all transmitted packets within with respect to the PPS (crosses) measured according the QTP method for the nominal transmission periods: (a) 250, (b) , (c) 625, and (d) . The data are fitted with a Gaussian function (red lines). The dashed blue lines represent . The bin widths are: (a) 18, (b) 20, (c) 20, and (d) .

Figure 5.
Probability distribution of the all transmitted packets within with respect to the PPS (crosses) measured according the STP method for the nominal transmission periods . The data are fitted with a Gaussian functions (red lines). The bin width is .
Figure 5.
Probability distribution of the all transmitted packets within with respect to the PPS (crosses) measured according the STP method for the nominal transmission periods . The data are fitted with a Gaussian functions (red lines). The bin width is .

Figure 6.
Cumulative distribution functions of the transmission latency of the first SV packet (with a size of 798 and 130 bytes in blue and red, respectively) with respect to the rising edge transition of the PTP time reference. Shaded areas represent the statistical uncertainty with coverage factor .

Figure 7.
Cumulative distribution function of the transmission period as measured at the publisher and receiver side in red and blue, respectively. Shaded areas represent the resolution of Wireshark timestamp captures.
Figure 7.
Cumulative distribution function of the transmission period as measured at the publisher and receiver side in red and blue, respectively. Shaded areas represent the resolution of Wireshark timestamp captures.

Figure 8.
Network topology of the measurement setup for the assessment of the publishing rate stability.
Figure 8.
Network topology of the measurement setup for the assessment of the publishing rate stability.

Figure 9.
Probability distributions of the SAMU (blue bars) and the IEC Std calibrator (red bars) publishing period for SV data streams with nominal values: (a) 250 and (b) . The bin width is 1 μs.
Figure 9.
Probability distributions of the SAMU (blue bars) and the IEC Std calibrator (red bars) publishing period for SV data streams with nominal values: (a) 250 and (b) . The bin width is 1 μs.

Figure 10.
(Top plot): loss packet rate LP by the DUT as a function of difference from nominal publishing rate of the input SV. The circles represent the measured data, whereas the solid lines with shaded areas are the fit with corresponding uncertainties. (Bottom plot): residuals between data and the corresponding fit mode highlighted with corresponding fit colors.


Table 1.
Gaussian Fit Results for the QTP Method.
| f (Hz) | (Sa/cyc.) | () | () | () | () |
|---|---|---|---|---|---|
| 50 | 80 | 250 | −83.2 | 19.3 | −3.2 |
| 60 | 80 | 208.3 | 22.1 | 39.8 | −2.9 |
| 50 | 256 | 625 | −309.8 | 39.3 | −9.8 |
| 60 | 256 | 520.8 | 16.2 | 50.5 | 1.2 |
Table 2.
Transmission Period Statistics.
| Mean (μs) | Std Dev (μs) | 95% Perc (μs) | |
|---|---|---|---|
| Publisher | 249.98 | 3.53 | 250.98 |
| Receiver | 249.97 | 5.57 | 256.50 |
Table 3.
Probability Distribution Functions-Statistical Parameters.
| Source | ) | Mean (μs) | Std Dev (μs) | OS |
|---|---|---|---|---|
| SAMU | 250 | 250.1 | 5.2 | Windows |
| 249.6 | 7.7 | Linux RT | ||
| 625 | 624.9 | 10.0 | Windows | |
| 625.2 | 10.3 | Linux RT | ||
| Calibrator | 250 | 249.9 | 3.4 | Windows |
| 249.4 | 5.5 | Linux RT | ||
| 625 | 624.9 | 7.9 | Windows | |
| 624.7 | 8.2 | Linux RT |
Publisher’s Note: MDPI stays neutral with regard to jurisdictional claims in published maps and institutional affiliations. |
© 2022 by the authors. Licensee MDPI, Basel, Switzerland. This article is an open access article distributed under the terms and conditions of the Creative Commons Attribution (CC BY) license (https://creativecommons.org/licenses/by/4.0/).
Share and Cite
MDPI and ACS Style
Agustoni, M.; Frigo, G. Characterization of Sampled Value Streams in Non Real-Time Calibration Systems. Energies 2022, 15, 3245. https://doi.org/10.3390/en15093245
AMA Style
Agustoni M, Frigo G. Characterization of Sampled Value Streams in Non Real-Time Calibration Systems. Energies. 2022; 15(9):3245. https://doi.org/10.3390/en15093245
Chicago/Turabian StyleAgustoni, Marco, and Guglielmo Frigo. 2022. "Characterization of Sampled Value Streams in Non Real-Time Calibration Systems" Energies 15, no. 9: 3245. https://doi.org/10.3390/en15093245
Note that from the first issue of 2016, this journal uses article numbers instead of page numbers. See further details here.