
Experimental Performance Analysis of Wi-SUN Channel Modelling Applied to Smart Grid Applications

The Sirindhorn International Thai-German Graduate School of Engineering (TGGS), King Mongkut’s University of Technology North Bangkok, 1518 Pracharat 1 Rd. Bangsue, Bangkok 10800, Thailand
*
Author to whom correspondence should be addressed.
Energies 2022, 15(7), 2417; https://doi.org/10.3390/en15072417
Submission received: 17 February 2022
/
Revised: 15 March 2022
/
Accepted: 23 March 2022
/
Published: 25 March 2022
(This article belongs to the Special Issue Advances in Smart Grids and Microgrids)
Abstract
:The grid operation and communication network are essential for smart grids (SG). Wi-SUN channel modelling is used to evaluate the performance of Wi-SUN smart grid networks, especially in the last-mile communication. In this article, the distribution approximation of the received signal strength for IEEE 802.15.4g Wi-SUN smart grid networks was investigated by using the Rician distribution curve fitting with the accuracy improvement by the biased approximation methodology. Specifically, the Rician distribution curve fitting was applied to the received signal strength indicator (RSSI) measurement data. With the biased approximation method, the Rician K-factor, a non-centrality parameter (rs), and a scale parameter (σ) are optimized such that the lower value of the root-mean squared error (RMSE) is acheived. The environments for data collection are selected for representing the location of the data concentrator unit (DCU) and the smart meter installation in the residential area. In summary, the experimental results with the channel model parameters are expanded to the whole range of Wi-SUN’s frequency bands and data rates, including 433.92, 443, 448, 923, and 2440 MHz, which are essential for the successful data communication in multiple frequency bands. The biased distribution approximation models have improved the accuracy of the conventional model, by which the root mean-squared error (RMSE) is reduced in the percentage range of 0.47–3.827%. The proposed channel models could be applied to the Wi-SUN channel simulation, smart meter installation, and planning in smart grid networks.
1. Introduction
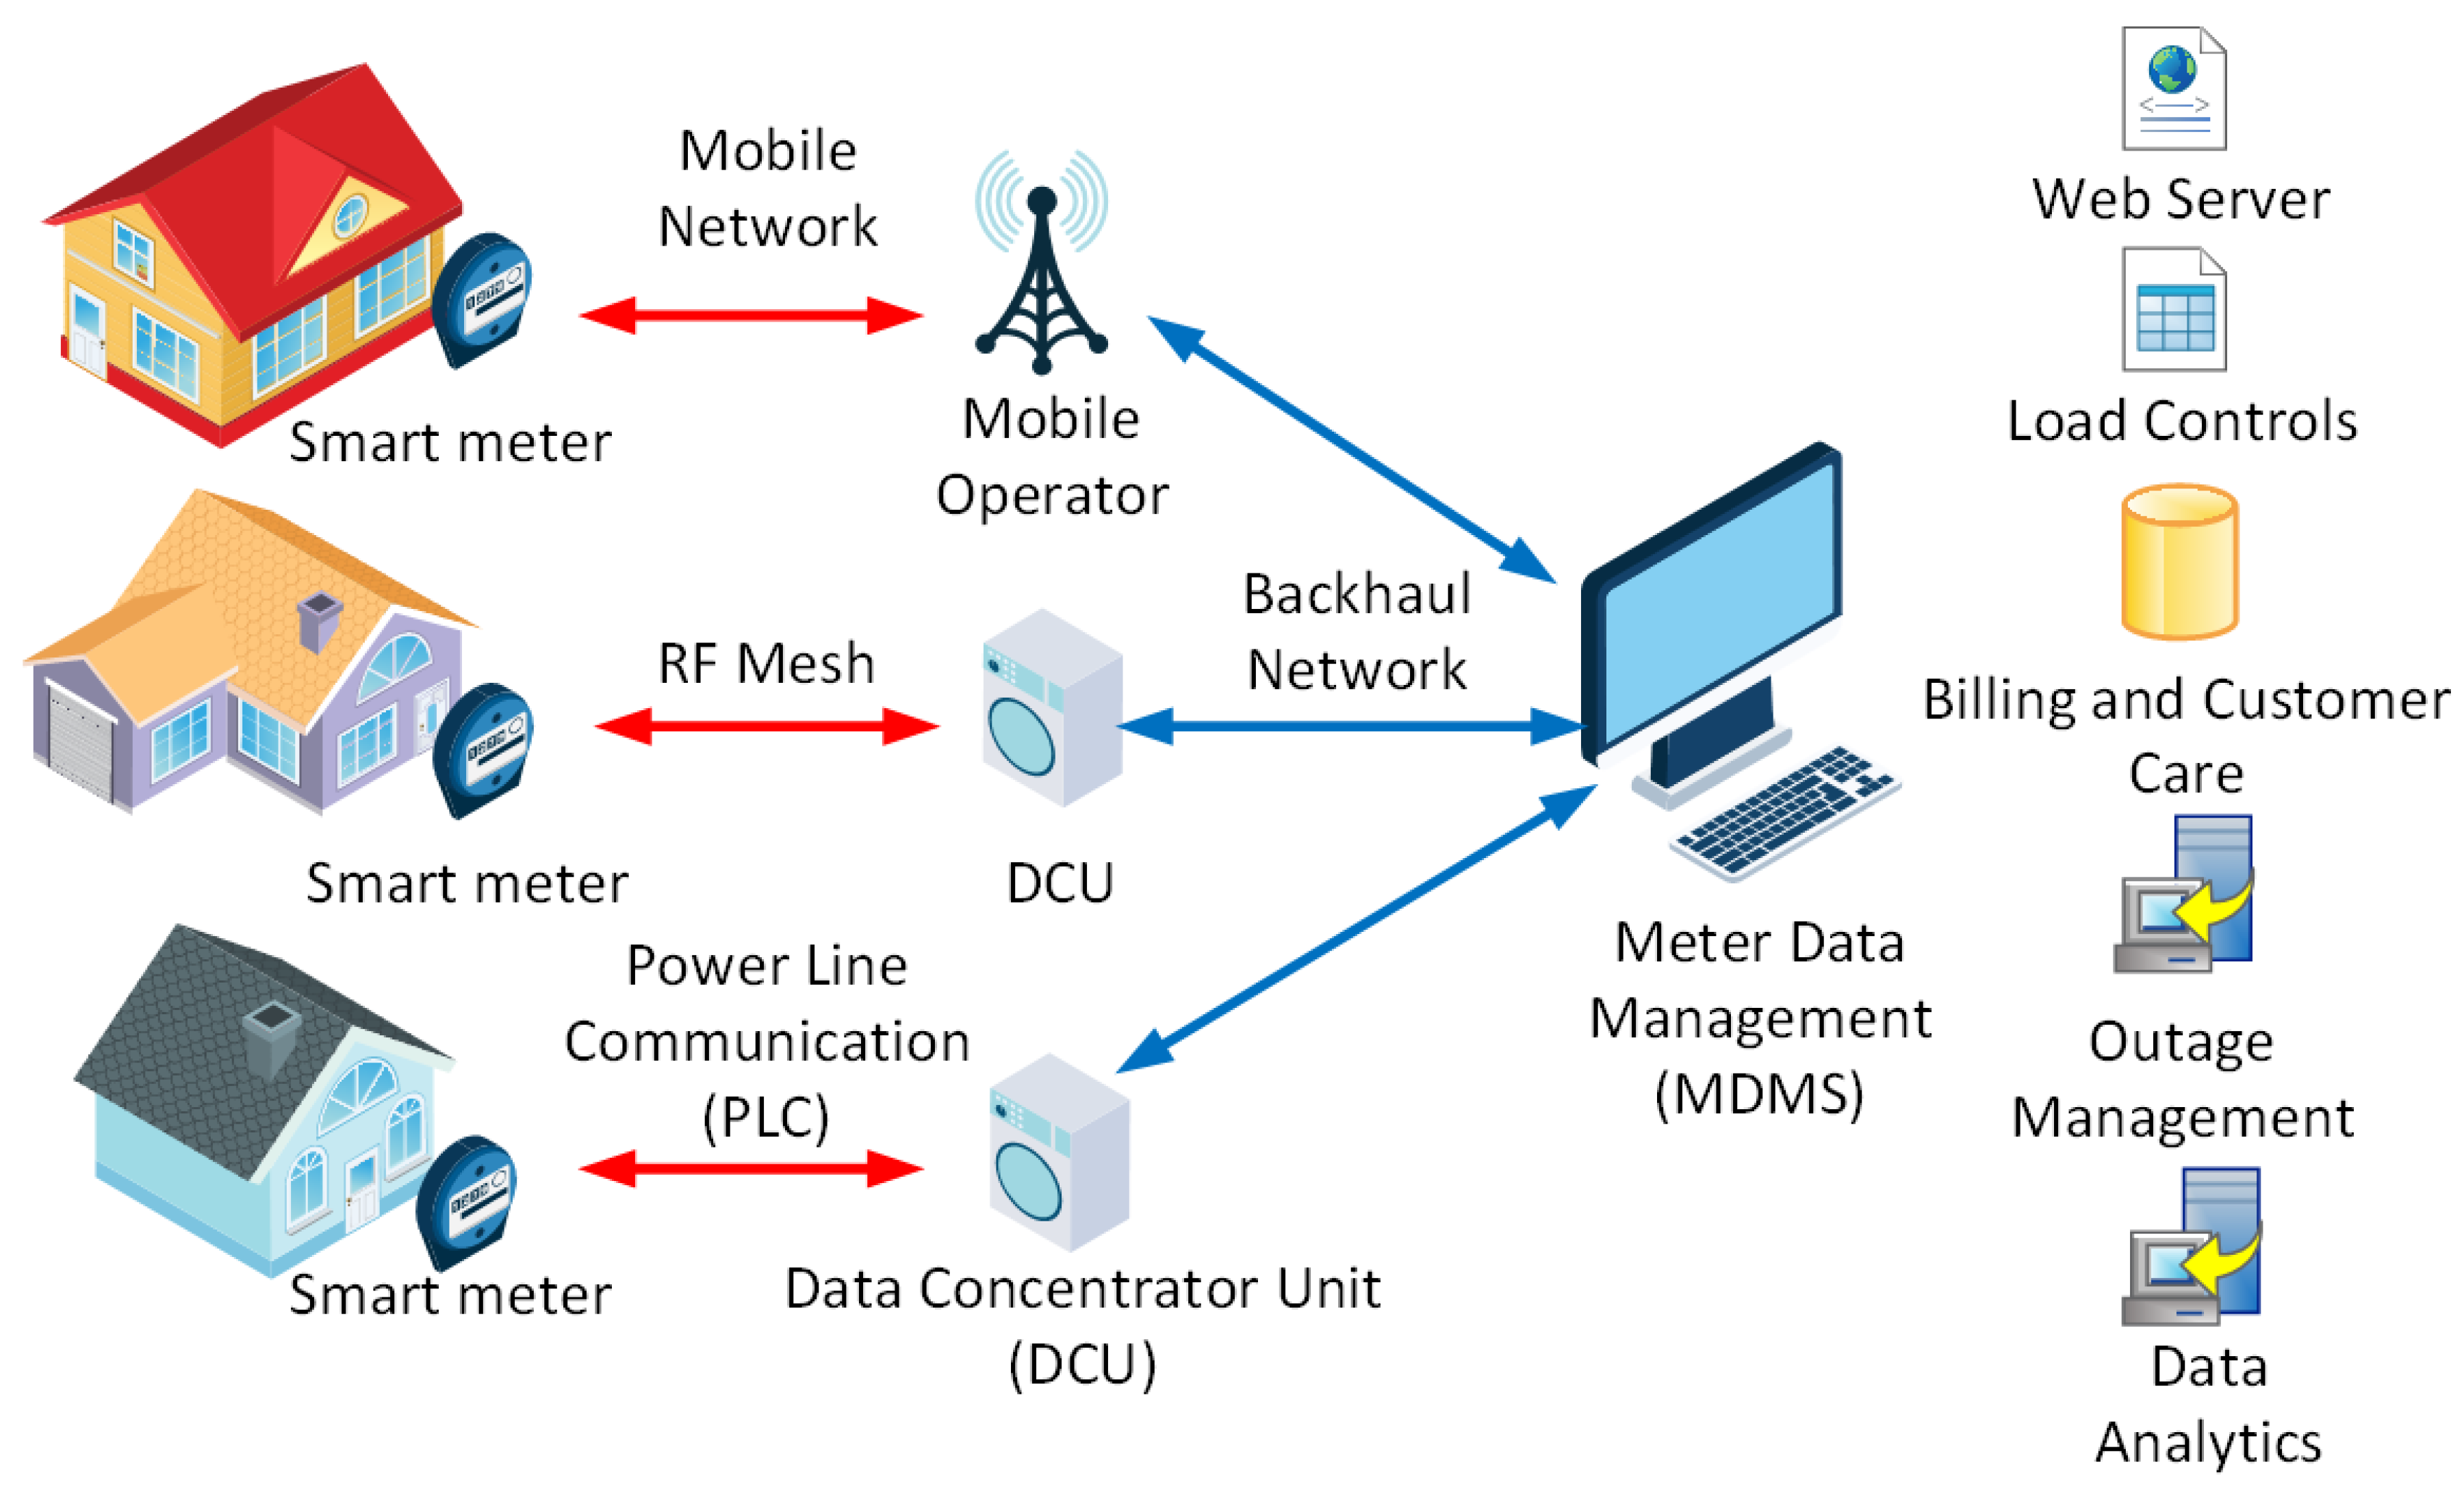
The smart grid (SG) as well as the Industrial Internet of Things (IIoT) are the heterogeneous networks of connected and remote-accessed smart devices which cooperate in the industrial energy sector [1]. SG has been improved from the traditional grids to solve the problem of scarce energy resources, which have been recently intensified worldwide over the past century. The problems have intensified since the outbreak of the COVID-19 worldwide pandemic at the beginning of the 2020. Many cities have been locked down resulting in people’s behavior changing and the energy demand changing from the previous era, such as working from home, online learning, etc. In 2020, during the lockdown period, the residential electricity demand was increased by around 7.43%, whereas the commercial electricity demand in Thailand was decreased by around 10.5% [2], according to the impact of COVID-19 on electricity report by the International Energy Agency (IEA) [3], which has reported services, the industrial electricity demand drop, and the residential demand increase in European countries, India, and the United States. The electricity power mix is a combination of coal, gas and oil, nuclear, and renewable energies. The share of renewable energies in the electricity generation mix has been increased following the lockdown period due to the electricity demand and low operating costs. However, renewable energy production is still unstable due to climate change and the limitation of geographical locations. Therefore, traditional electricity grids and load forecasting are not sufficient and flexible for the unpredictable situations that occur. Digital information and communication technologies are used to upgrade the grids to the SG, which has been increasingly focused on in order to manage, communicate and immediately respond to electricity demand and supply side in the grids. SG has also improved grids’ reliability and efficiency by means of real-time information monitoring, bi-directional communication technologies, energy demand optimization and energy management systems. The grid information is generated by the advanced systems and the smart devices which are combined and integrated with the traditional grids to scale the capacity and advanced functions, such as an advanced distribution management system (ADMS), a demand side management system (DMS), a distribution automation, an outage management system (OMS), a distribution generation system, a battery energy storage system, renewable energies, and an advanced metering infrastructure (AMI). AMI is a key element of the utility’s meter management and controls for energy demand in the grids. AMI exchanges the bidirectional energy information between the power generator and consumers [4]. AMI is developed after the automatic meter reading (AMR) system by changing from one-way to bi-directional data communication with a real-time data communication, interconnection large numbers of sensors and the ability to control or interact with the load or customer’s decisions or behaviors, such as dynamic pricing, load shedding and energy trading. Applying smart meters (SM), an AMI’s smart device, installed on the utility’s poles, especially for a residence house in Thailand that are monitored and report the real-time grid status to the utility, via communication networks, as shown in shown in Figure 1.
In Figure 1, the power line communication (PLC) network, mobile operation and radio frequency (RF)-mesh wireless networks are presented. Wireless technologies are more popular in outdoor AMI communication networks. AMI wireless networks are discussed in Section 2. Wireless communication systems are more sensitive than wired communication systems. Material absorbing, obstructions, interferences and multipath fading are effects occurring on a communication channel between the transmitter (TX) and the receiver (RX) which are also affected by the installation positions of the DCU. The DCU positions become the challenge for the AMI RF-mesh network, where location optimization and coverage area enhancement are of interest. Channel information and modeling are useful for investigating the wireless communication performance in the service areas.
The channel models are used in the network performance simulation and evaluation. The channel models are usually used in AMI wireless propagation channel [5,6,7] and vehicle-to-vehicle (V2V) wireless propagation channel [8], especially in urban and suburban areas where static or movable obstacles are presented in the realistic environment. In [5], the channel models of two Wi-SUN smart meters used in different modem brands are modeled by using the received signal strength indication (RSSI) measurement in Seoul, Korea. Smart meters are installed on the house’s exterior wall which is different from Thailand where smart meters are on a utility pole. In [6], the simulation of the Wi-SUN network in a laboratory is proposed, in which the Rayleigh fading path is used as the channel model. In [9], the channel model for a wireless M-Bus standard smart meter is modeled by the large number of RSSI which are collected by the driving data concentrator unit. In this article, the statistical RSSI at all allowed frequencies in Thailand, as described in Section 2 and Section 6, are used to model the channel fading and combine a bias function to reduce the measured RSSI distribution error to the residual at the tail of the distribution curve. The Rician fading model for the RSSI estimation in the Wi-SUN channel is studied by using the empirical model due to a low complexity property, given a tradeoff in a compromised accuracy in the model.
This article is organized as follows. Section 2 briefly discusses the components of AMI architecture and last-mile communication. The conventional channel modelling method and the biased method are presented in Section 3 and Section 4, respectively. In Section 5, the measurement setup is described. In Section 6, the experimental results and analysis are shown. The conclusion is stated in the last section.
2. AMI Architecture and Last-Mile Communication
The AMI system architecture is fairly flexible depending on the requirement of AMI functionality, communication technologies and smart meter interoperability. AMI basically consists of a smart meter (SM), communication networks, a head-end system (HES) and a meter data management system (MDMS), as shown in Figure 1. Furthermore, a data concentrator unit (DCU), which is used to collect data from a group of smart meters and send the collected data to the HES, is employed in some AMI system architectures, such as the RF-mesh-based and power line communication (PLC) AMI systems. MDMS is used to collect, manage and store the smart meter data; capture and filter the events and alarms; validate, estimate and edit (VEE) the 15-min load profile data; and conduct data analytics and advanced data processing, such as a virtual metering, load research and DMS. MDMS also provides the application programming interface (API) for the integration of multiple HESs or single HES connection. In some commercial solutions, HES and MDMS are bundled in the same system architecture. Last but not least, a smart meter is developed from the electronic meter with an enhancement by the essential AMI’s functions.; for example, dynamic tariff, clock synchronization, connect/disconnect load control, power quality monitoring, limiter, prepayment metering, push notifications, and remote firmware upgrade. The smart meter measures and collects customer’s data, grids’ statuses and the power quality data, and sends them to the DCU via wired or wireless communication networks, known as a field-area network (FAN). The cellular network and the optical fiber network are often used as the backhaul communication network between the DCU and HES.
There are several choices of FAN in both wired and wireless communication technologies. The typical wired communication in FAN is power line communication (PLC), which provides a connectivity over an AC power line, as a communication medium. G3 PLC and power line intelligent metering evolution (PRIME) are narrowband PLC technologies, which are mainly used in Europe [10,11]. High-speed PLC (HS PLC) or broadband PLC is a broadband PLC technology, which is mainly used in Korea [5]. On the other hand, the choice of wireless communications for FAN is comprised of a wireless local area network (Wi-Fi), a cellular network (3G, 4G and LTE), and a low-power wide-area network (LP-WAN). Although Wi-Fi, and the cellular network provide a high throughput, they also require high energy consumption and high bandwidth. Hence, the LP-WAN technology is mainly used in FAN due to the advantages of low power consumption, large coverage areas, and low bandwidth [12]. They also communicate with low data rate for small packets and provide a long battery life operation in the field. LP-WAN devices are constrained to use low bandwidth with limited frequency bands and duty-cycles. LP-WAN can support massive IoT devices by sharing network resources. The example of LP-WAN is LTE-M (Cat-M1), Narrowband IoT (NB-IoT), SIGFOX, LoRaWAN and RF-mesh networks, such as Zigbee and wireless smart utility network (Wi-SUN). In fact, each LP-WAN technology has strong and weak points in different aspects, such as a network topology, coverage, throughput, bandwidth, latency and scalability.
The LP-WAN network topology consists of (1) a star topology (Cat-M1, NB-IoT, SIGFOX, LoRaWAN, etc.) and (2) an RF-mesh topology (Zigbee, Wi-SUN, etc.). The star topology has a direct connection between the gateway and end-devices in the network. On the other hand, the gateway in the mesh topology can communicate with neighboring devices on their network, which serve as conduits. The mesh topology provides more redundant connections, and reduces the obstruction effects, especially in urban areas where constructions and temporary obstacles are normally presented. Wi-SUN is a seamless connectivity LP-WAN standard for smart utility networks, which amends Zigbee (IEEE 802.15.4) to IEEE 802.15.4g [13] for the physical layer (PHY), and IEEE 802.15.4e [14] for the MAC layer. Wi-SUN includes additional specifications of the MAC layer, adaptation, network and transport layer protocols standardized by IEEE and IETF to support several smart utility applications, e.g., smart municipality, city infrastructure monitoring and management and many more IoT applications [14]. Wi-SUN is an IPv6 wireless mesh network with frequency hopping, and multi-hop networking that improves robustness, reliability due to high redundancy and good scalability. Data rate is up to 300 kbps with low link latency. Therefore, the Wi-SUN mesh network has a self-healing network connection and is interference resistant, which is an interesting choice for studying in this article.
With the rising interest in dependable wireless communications for AMI applications, there are various studies [5,6,7,13,14,15,16] that have recently focused on IEEE 802.15.4g (Wi-SUN) in many regions and countries. China uses IEEE 802.15.4g with a Gaussian frequency shift keying (GFSK) at 470–510 MHz and 779–787 MHz. Europe uses IEEE 802.15.4g with GFSK at 863–870 MHz, and US and Japan use IEEE 802.15.4g with GFSK at 920–928 MHz [6]. Nevertheless, one of the most common challenges for the Wi-SUN mesh network is channel modelling, which is typically used in estimating the signal behavior, such as channel propagations (i.e., absorption, reflection, scattering and diffraction), interference (i.e., thermal noise and shared unlicensed bands) and dynamic environment (i.e., multi-path fading channel). The smart meter installation in Thailand is typically fixed on the utility pole situated along the side of the street. The optimal location of DCU installation could significantly enhance the reliability of AMI communication networks, especially the quality of service (QoS). Additionally, Thailand does not specify the frequency band or modulation types used for AMI application. However, the national broadcasting and telecommunications commission (NBTC) published the radio frequency utilization for the development of the smart grid in Thailand [17], which suggested using wireless networks on unlicensed bands (i.e., 433 MHz, 920–925 MHz and 2.4 GHz) or a licensed band (i.e., utility’s license) in the urban and suburban areas, and use the mobile network for rural areas. The 433 MHz and 2.4 GHz unlicensed bands are reserved internationally for industrial, scientific and medical (ISM) purposes [18]. The 920–925 MHz unlicensed bands are reserved for IoT applications in Thailand [19]. On the unlicensed bands, the AMI last-mile communication will share the communication’s resource with other IoT systems, which is a concern point for the IIoT. On the other hand, 443 and 448 MHz licensed bands for SG applications are individual; therefore, the level of interference is low. The frequency bands of the Wi-SUN network in Thailand by NBTC suggestion are presented in Table 1, which are used in this article experiment. Hence, the experimental performance analysis in multiple bands of Wi-SUN channel modelling is of interest in this article.
2.1. Wi-SUN (IEEE 802.15.4g)
IEEE 802.15.4g is the amendment of the IEEE 802.15.4-2012 (Zigbee) standard’s PHY layer, which is very sensitive to external interferences and multi-path fading [16]. The same range of frequencies (i.e., 2.4 GHz) in nearby wireless networks, such as IEEE 802.11 (WIFI) and IEEE 802.15.1 (Bluetooth), also generate interference to Zigbee. The multipath fading occurs when the signals are reflected off some obstacle in the environment resulting in multiple signals from different paths and time delays. Multi-path signals are combined at the receiver’s front end resulting in a reduction of the quality of communication due to the inter-symbol interference (ISI). Due to the interference and fading, the Zigbee communication range is limited to 100–200 m in outdoor environments; therefore, relay nodes are required for range expansion, which is a tradeoff between the extended network coverage and cost. In addition, IEEE 802.15.4g has adopted an alternate PHY layer to overcome the Zigbee’s limitation, by which the sub-GHz frequency bands and additional modulation schemes are introduced.
2.2. Multi-Rate, and Multi-Regional (MR-) FSK
MR-FSK is the commonly commercialized PHY layer [15] that provides low complex implementation, good power efficiency due to the constant envelop of the signal and multi-regional operation support. In addition, MR-FSK must be filtered to achieve regulation requirements of each region, such as GFSK. The forward error correction (FEC) encoder is optionally processed for a PHY service data unit (PSDU). It also provides various data rates between 5 and 400 kbps. In this article, a 2FSK PHY layer with various data rates is studied [6,15]. The data rates and frequency bands in different countries are shown in Table 2 [7].
2.3. MR-OFDM
MR-OFDM provides high data rates and long-range communication, which has been overcoming the ISI caused by the multi-path fading channel and the interference thanks to the concept that MR-OFDM spreads the information into multiple sub-carriers within a data frame. Furthermore, the multi-path fading channel has experienced an independently individual frequency response in each subcarrier; therefore, at the receiver, the received signals are retrieved in each subcarrier by using the orthogonality property of the OFDM signal and the estimated channel impulse response achieved by sending the pilot signals. FEC techniques and frequency repetition can also be used for performance enhancement. The achievable data rate varies between 50 and 800 kbps, which is higher than MR-FSK and MR-OQPSK; however, MR-OFDM requires more complex circuitry and high-power consumption.
2.4. MR-OQPSK
MR-OQPSK has some shared common characteristics with IEEE 802.15.4, except for a PHR (PHY header) format and a multiplexed direct sequence spread spectrum (MDSSS). MDSSS has just been added in IEEE 802.15.4g, which is specified in the 780 MHz, 915 MHz, 917 MHz and 2450 MHz frequency bands only. In addition, MR-OQPSK yields a low complexity in multimode implementation and is more cost-effective with the varying data rates between 6.25 and 500 kbps.
From the above description, the Wi-SUN mesh network is effective, interoperable and compatible for the AMI last-mile communication standard. MR-FSK has a low complexity implementation with multiple frequency bands and data rates supported, which allows multiple brands of smart meter vendor to cooperate with a Wi-SUN mesh HES.
3. Channel Modeling Methodology
A channel model is a simplified mathematical expression for a communication channel, which represents the channel characteristic and the performance of a specific communication technology operating in such a channel. It is used to simulate the channel emulation, evaluate the performance of communication technologies and be applied to network planning, especially in the wireless network design. Basically, the wireless network transmits and receives information through the air as a media. Hence, the wireless propagation under a realistic condition is modelled, which is extremely challenging. With the knowledge of boundary conditions, one can derive the channel model by solving Maxwell’s equations from all physical objects and the environment; however, it is considerably hard to obtain such information accurately, especially in the multi-path fading channels. Therefore, the channel model should be alternatively focused on the main propagation effects, such as the reflection, diffraction and scattering, and ignore the rest for the complexity reduction of the problem. The reflection occurs when the signal impinges on a surface whose dimensions are much larger than the wavelength of the incident wave. It depends on the angle of the incidence, wave polarization, material properties and the carrier frequency. The diffraction occurs when the signal passes through aperture or edges or sharp corners of obstacles, which reduce the field strength. The scattering occurs when the signal pass through small obstacles, which are much smaller than the wavelength. The signal is scattered in all directions from the obstacles. The multi-path propagation is caused by receiving signals in many directions, i.e., a direct path, a reflection, a diffraction and a scattering, are combined with a random amplitude, phase and delay. The fading in wireless communication can be classified into two groups, namely, large-scale fading and small-scale fading [20,21,22]. Large-scale fading represents the slow-changing signal, which is due to the effects of path loss and shadowing. On the other hand, small-scale fading represents the rapid-changing signal in a small scale based on the influence of three foundations, including a delay spread of the signal, a time variance of the channel and a transmission bandwidth of the channel. Therefore, the small-scale fading is of interest and challenging for channel simulation in realistic conditions.
The channel modeling approaches are classified into two categories, including a physical model and an analytical model. The physical model is the channel model estimated by the measurement of the transmitted and received signals. On the other hand, analytical models recreate the statistical properties of the channel modeling by mathematics or analysis, by which physical models are not considered [23]. The physical channel modeling can be classified into two types, as follows.
3.1. Statistical or Empirical Modeling
Statistical or empirical modeling is created from the statistical analysis of the large amounts of measurement data [24]. The Rayleigh fading model is typically used in an urban environment, where there is no dominant signal, i.e., a non-line-of-sight (nLOS). The uncorrelated Rayleigh fading could be modeled by a complex Gaussian distribution with equal variance and zero mean. In the Rician fading model, a dominant transmitted signal component is included, i.e., LOS path, in its model. In this article, the Rician fading model for the RSSI estimation in the Wi-SUN channel is studied by using the empirical model due to its low complexity property, given a tradeoff in compromised accuracy in the model.
3.2. Deterministic Modeling
The deterministic modeling is created from the ray tracing, the electrical properties of the propagation medium, the antenna pattern and the geometry in the environment. The deterministic model (i.e., method of moments (MoM), ray tracing (RT) and finite difference time domain (FDTD)) is of high accuracy, but it requires high computational complexity.
4. Received Signal Strength Distribution Approximation
4.1. Conventional Received Signal Strength Distribution Approximation
RSSI is the received signal strength measurement at the receiver, which is suitable for empirical channel modeling. The large number of measurements of RSSI is used in a statistical approach to analyze the channel propagation. Since Wi-SUN’s smart meters are installed on utility poles along the side of the street, a dominant transmitted signal component exists, i.e., LOS path, which is significant enough for channel modeling in the AMI network. Therefore, the Rician distribution approach is used as a curve fitting of the cumulative density function (CDF) of the RSSI measurement data. The Rician probability density function (PDF) [9] is presented as,
where K denotes the Rician K-factor, rs denotes the non-centrality parameter and I0 denotes the Bessel functions, in which
KdB denotes the ratio of dominant component power and multipath component power in dB unit, in which
where σ denotes the scale of a Rician distribution, with I0 being the zero-order modified Bessel function, and rs denotes LOS.
The maximum likelihood estimation (ML) method is used for the Rician distribution estimation that fairly fits the measured RSSI probability density function. The non-centrality parameter (rs), the scale parameter (σ) and the Rician K-factor of Rician distribution estimation fitting are determined in Equation (6). The likelihood function of the measured RSSI and the joint PDF of a sample of N independent observation {r} are presented as,
The ML estimator determines the maximum value of L, or equivalently, logL, in Equation (5) to arrive at,
The root mean-squared error (RMSE) is presented for the sample standard deviation and evaluates an error between the ML estimator and the PDF of the received signal strength, expressed as,
4.2. Biased Received Signal Strength Distribution Approximation
Even though the Rician RSSI distribution approximation described in the previous section may possibly fit the measured RSSI probability density, however, it would be assumed that is not an actual RSSI distribution. The measured RSSI distribution over a fading channel is more likely to experience the unobservable signal, which affects the overall RSSI distribution approximation, especially for RSSI fading near the level of receiver sensitivity. The statistics of measured RSSI data is the Rician RSSI distribution f(r). Hence, the measured RSSI data will be used to eliminate the unobservable signal by a cut-off or bias function w(r). The observable RSSI distribution fBiased(r) is the Rician RSSI distribution approximation f(r) multiplied by the bias function w(r) and divided by themselves. In addition, the offset (r0) is used to adjust the starting point of RSSI distribution to an origin, and allows integration to unity for a denominator normalization of the resulting density function. The observable RSSI distribution fBiased(r) is presented as,
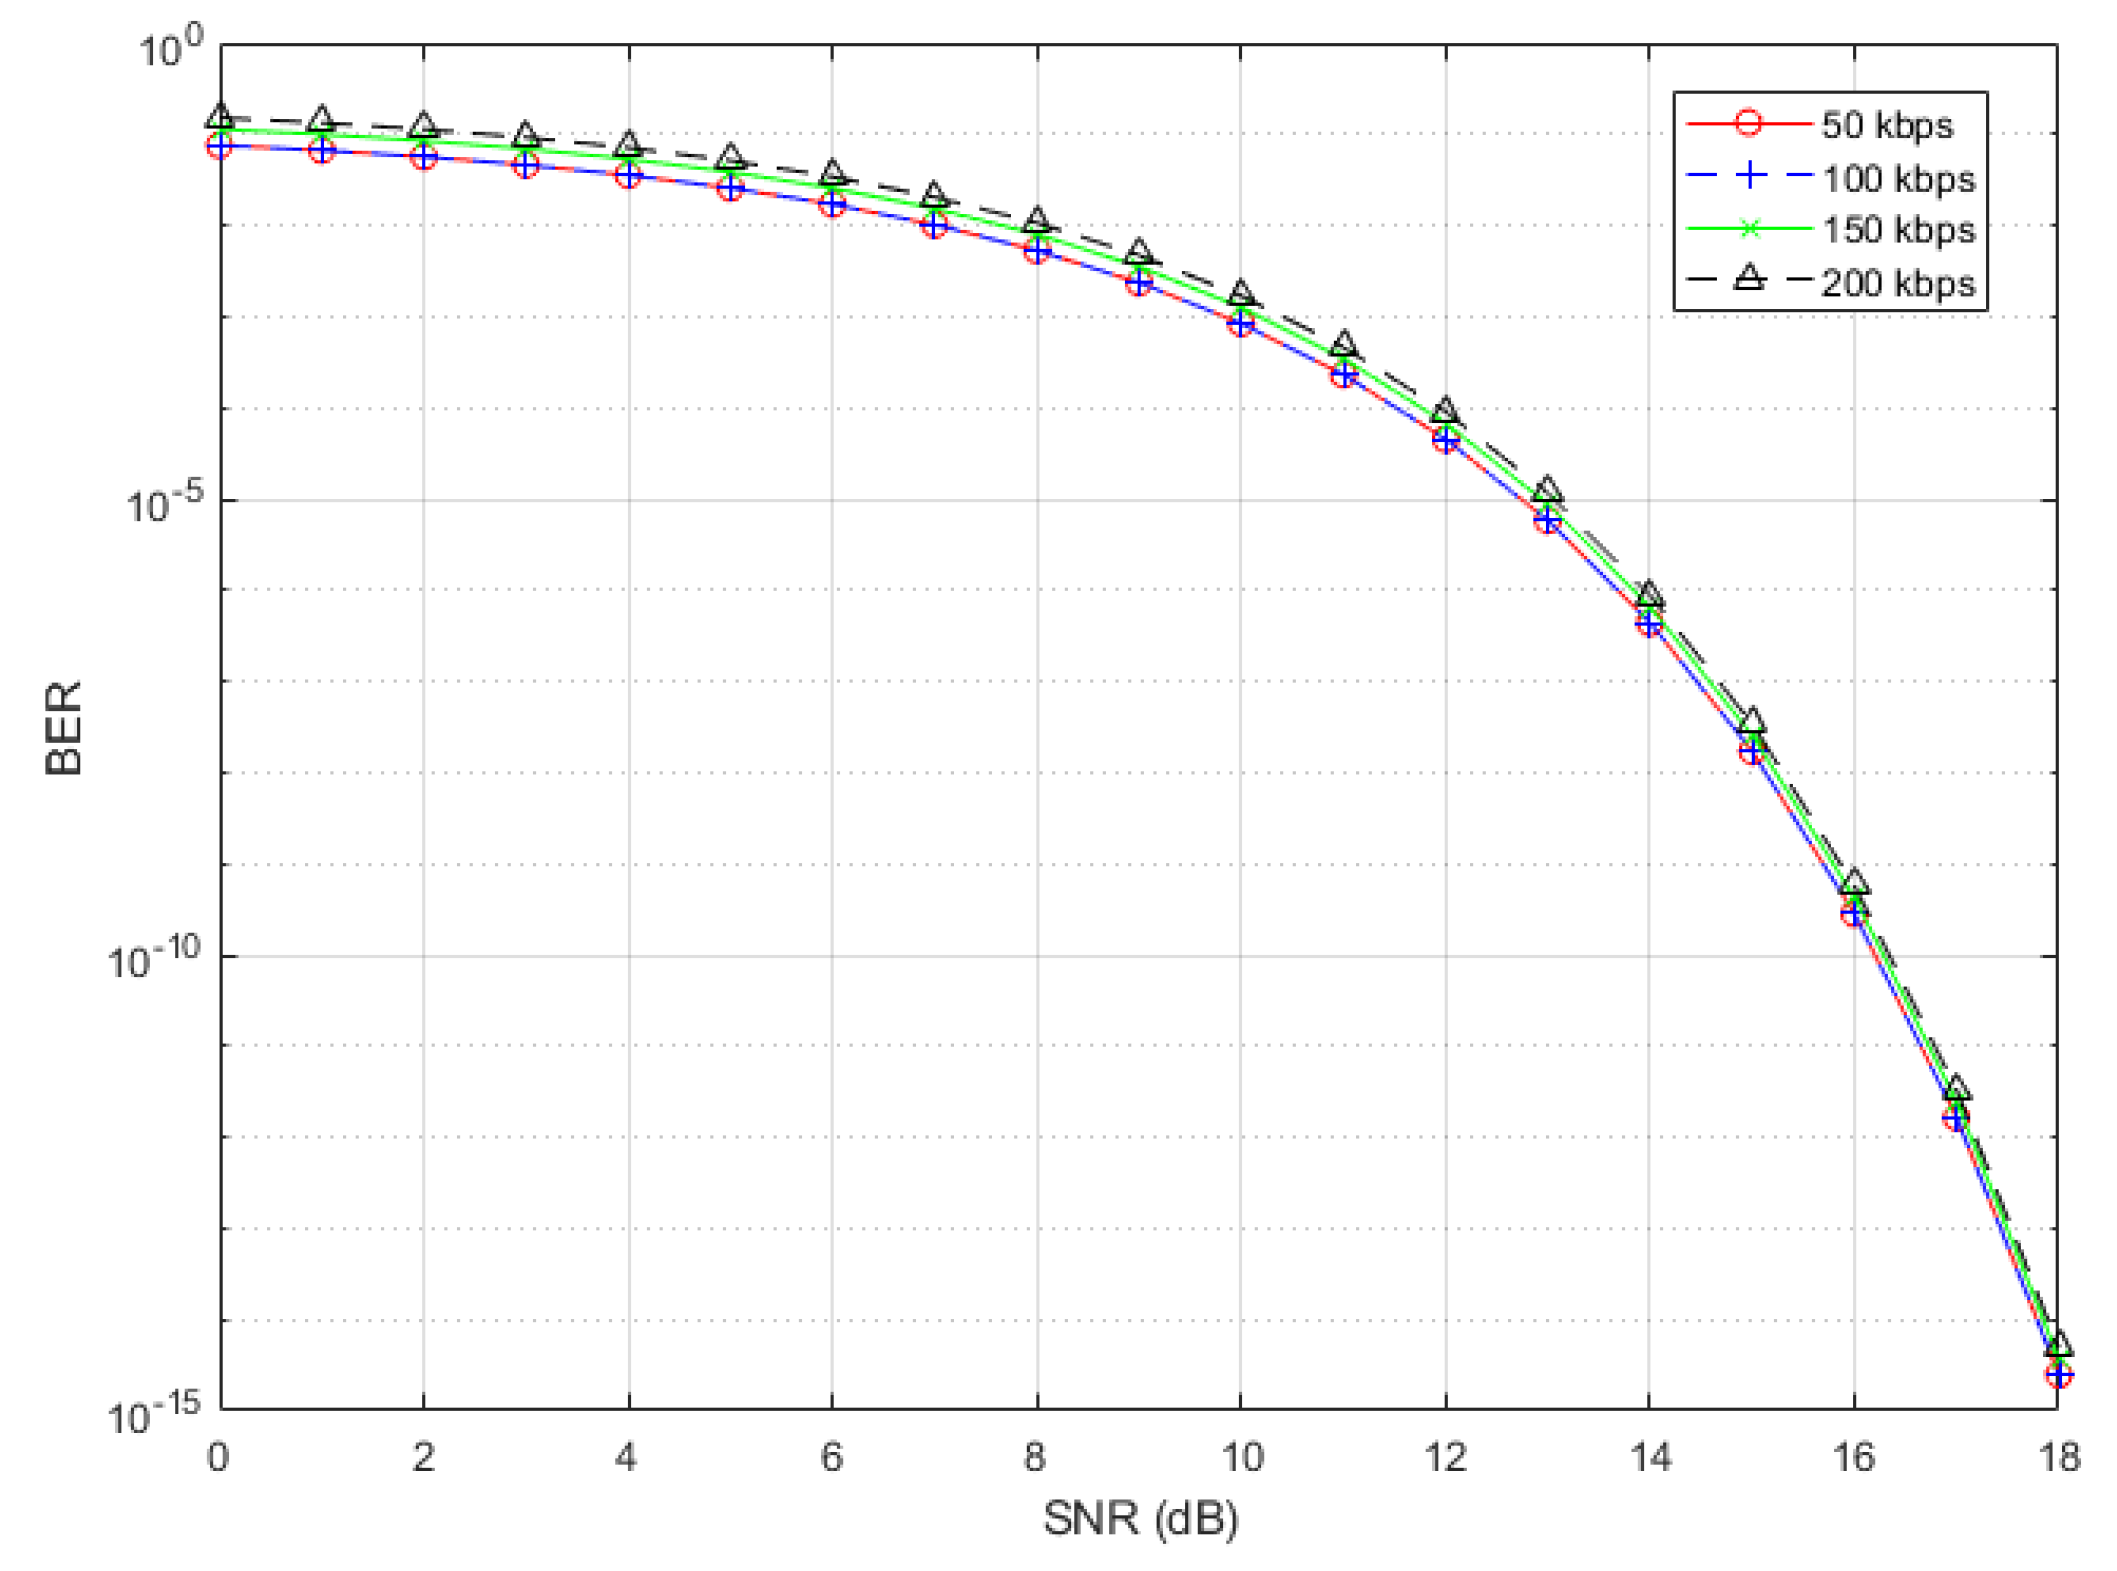
The bias function w(r) used to improve the empirical models is derived from the probability of a successful packet delivery, which denotes the inverse of frame error rate (FER) on Wi-SUN channel with 2FSK PHY layer, at a given signal-to-noise ratio (SNR), to arrive at,
where P2 FSK denotes the bit error rate (BER) and M denotes a value of bit per frame. The noise floor and noise figure of the receiver are measured in the experiment. P2 FSK of the Wi-SUN channel with various data rates is shown in Figure 2. P2 FSK with multi-data rates depends on the system data rate and the channel bandwidth, which are determined in Equation (10). Given the system data rate of R, and the channel bandwidth of B, one can derive that
5. Measurement Setup
In Thailand [19], frequency bands and PHY layers of the Wi-SUN network for the AMI smart grid application are not specified yet; however, NBTC has provided three unlicensed bands (i.e., 433 MHz, 920–925 MHz and 2.4 GHz) and two licensed bands to be jointly used for smart grid applications. As guided from Table 2 and [7], a table of data rates and frequency bands of the 2FSK PHY layer of the Wi-SUN network in Thailand is proposed in this article. Table 1 is used in the experiment to model the Wi-SUN channel correspondingly in many different data rates and frequency bands. The frequency bands and transmit power with antenna gain, expressed in Table 1, have followed the regulation set by NBTC [19].
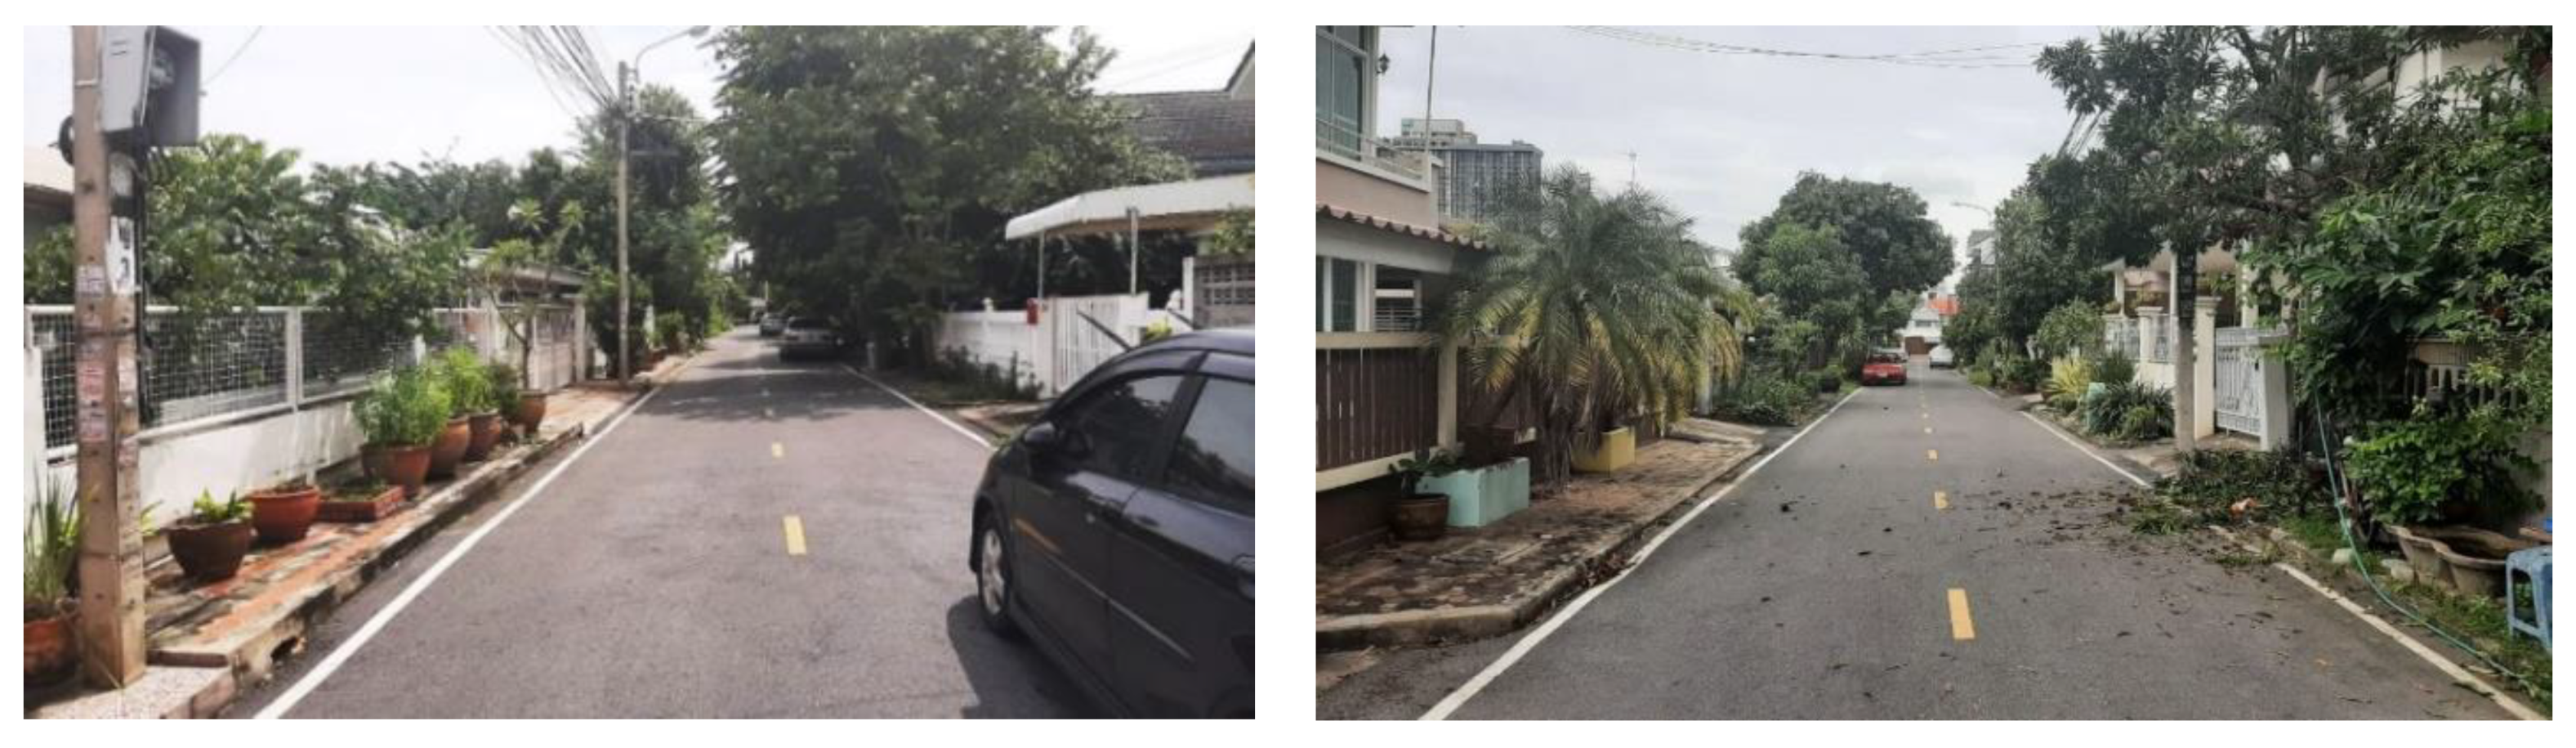
The IEEE 802.15.4g network was set up for the channel RSSI measurement in the residential area on the outskirts of Nonthaburi Province, Thailand. This area represents the tropical residential housing on developed real estate, in which each house has the same pattern and alignment across the main street. However, the big tree nearby the street was the obstacle for the transmitter and receiver installed on the utility’s low-voltage pole. The atmosphere of the experimental area is shown in Figure 3. This article will specifically focus on the residential customers of MEA and PEA, i.e., Thai electricity utility companies.
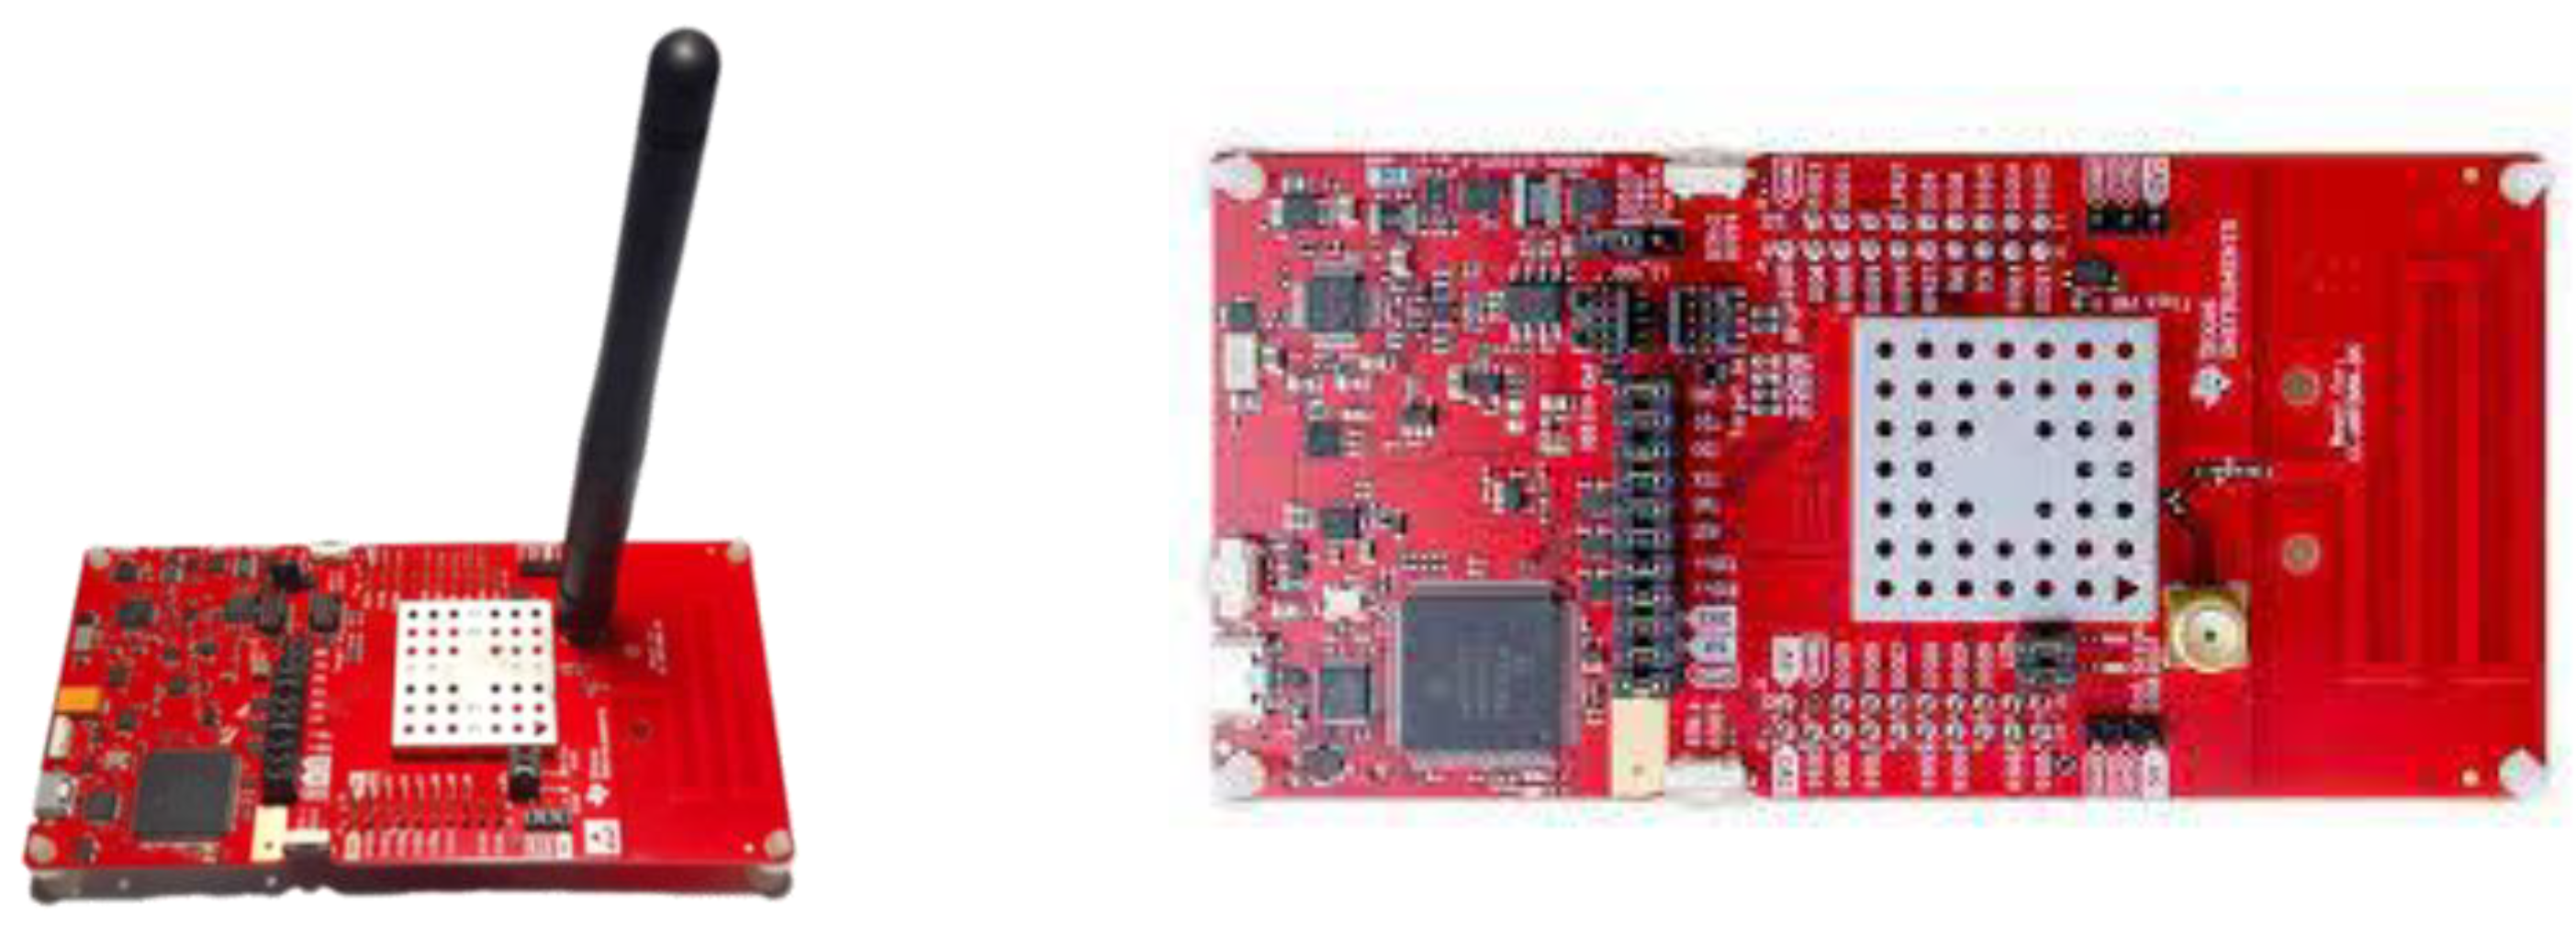
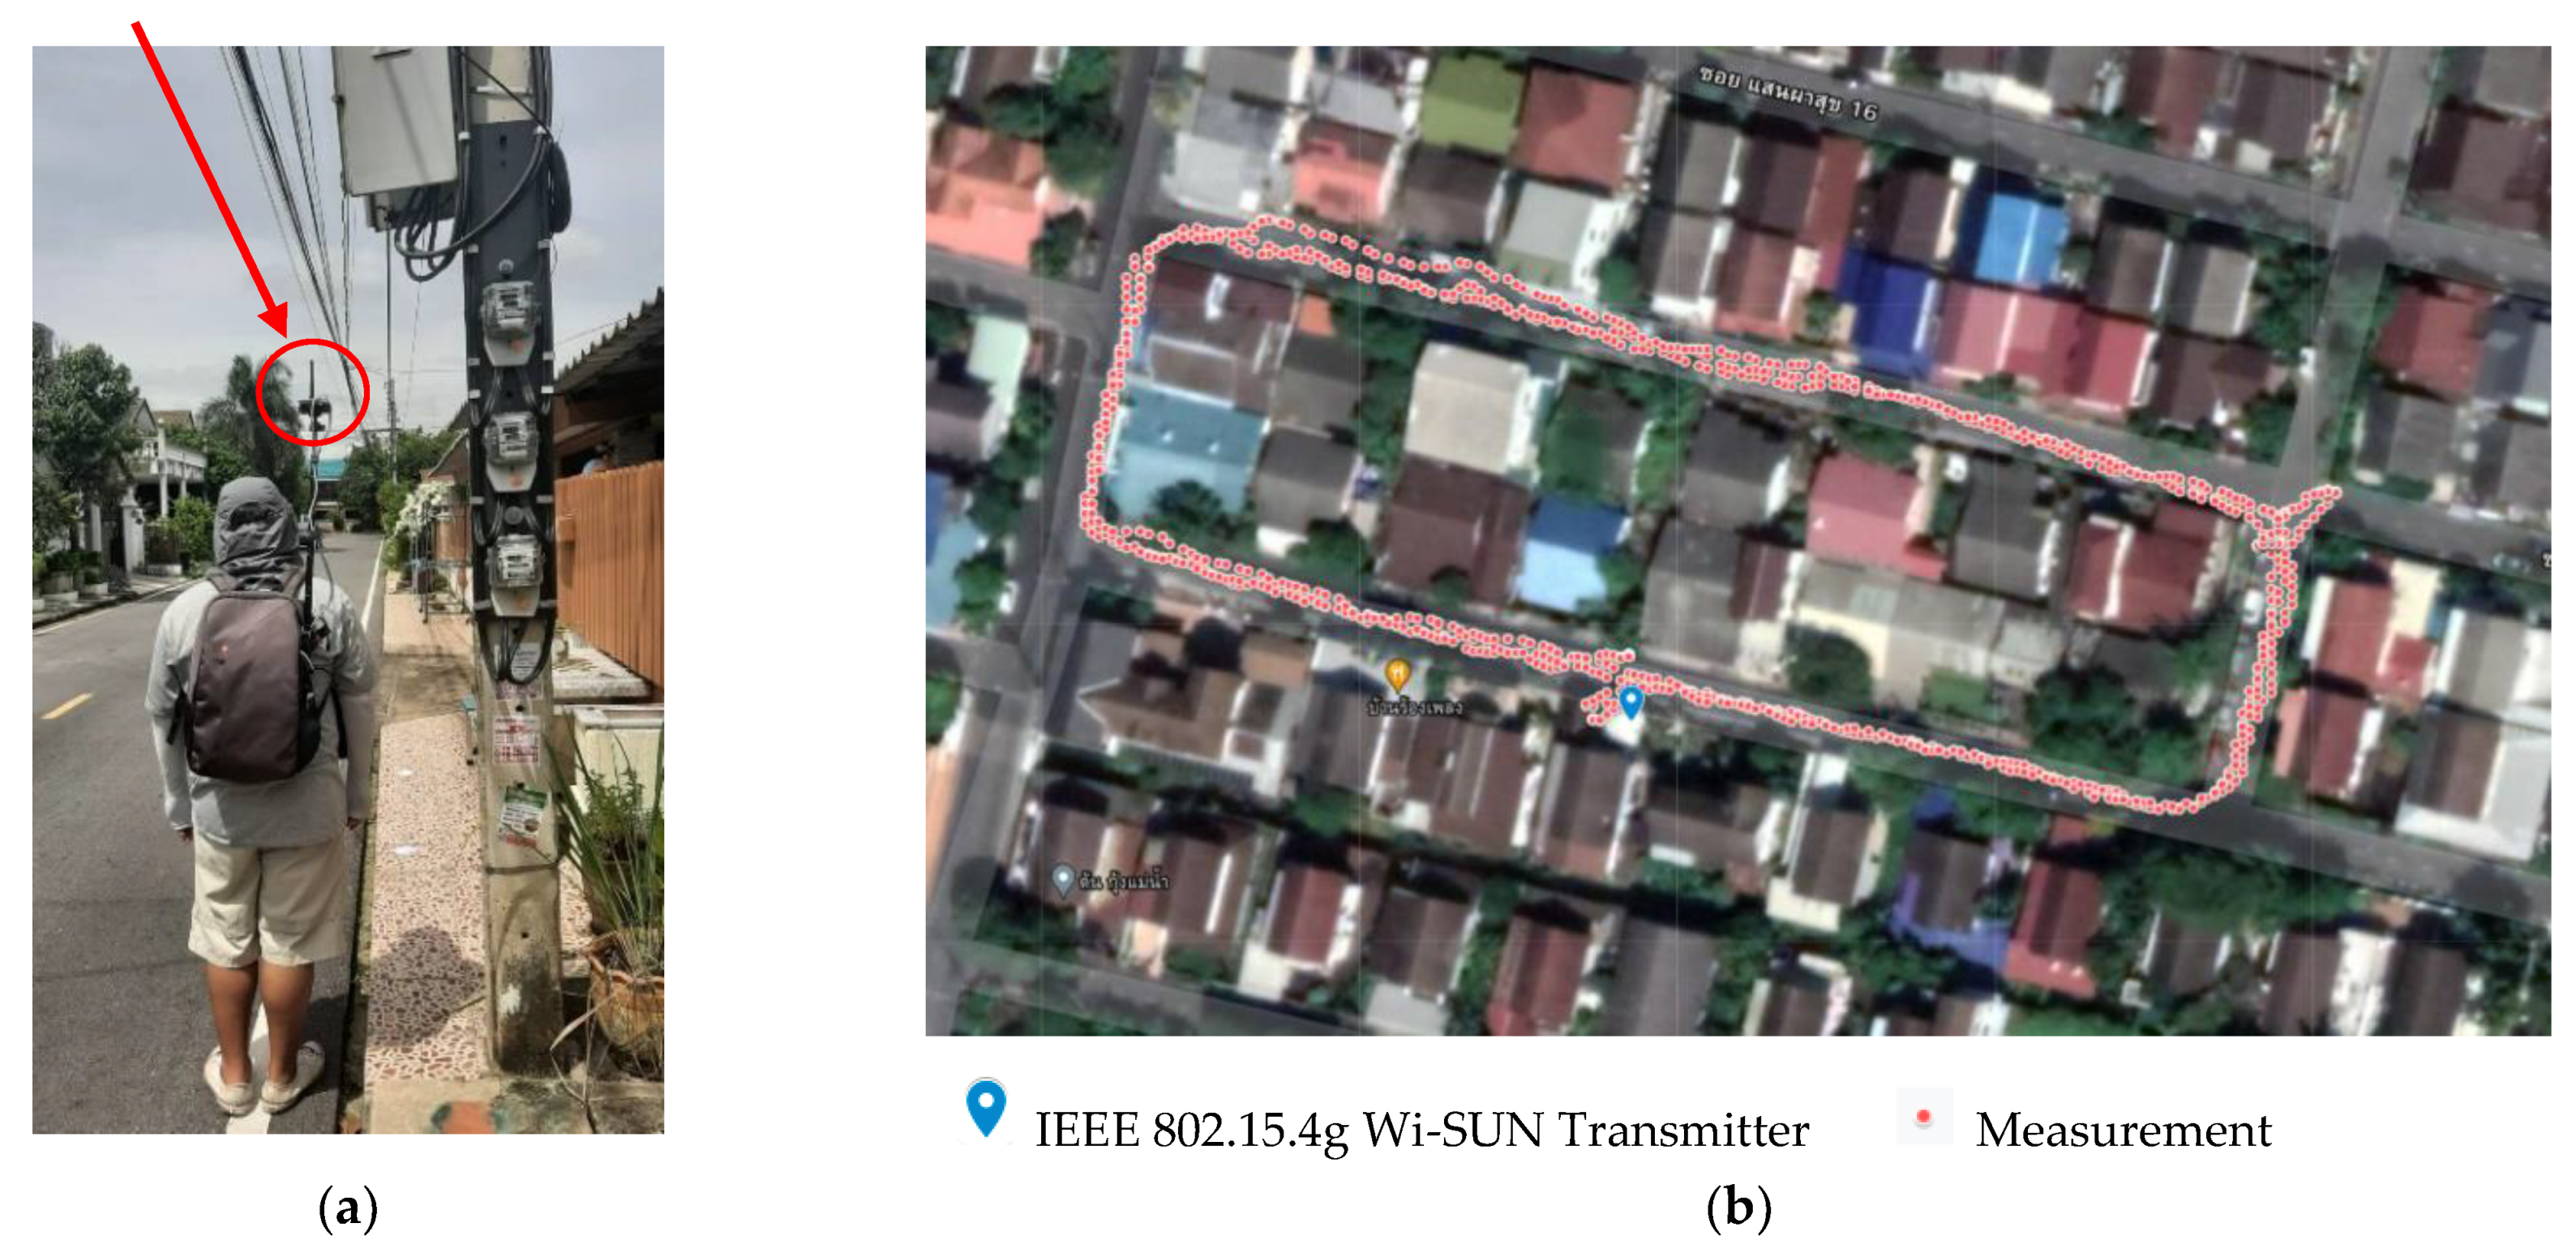
The Tx and Rx for realizing the Wi-SUN communication based on the IEEE 802.15.4g standard in this article are LAUNCHXL-CC1352P from Texas Instruments, which is a programmable development board supporting the IEEE 802.15.4g network for collecting measured values in computers, as shown in Figure 4. The experimenting IEEE 802.15.4g transmitter was installed four meters high on a tripod, which was used to simulate the DCU position on a utility’s low-voltage pole located along the side of the street. The transmitter packet was 255 bytes periodically sent every 500 ms in all aliases without FEC, as shown in Table 3. In addition, every package has a package counter number stamped in the transmit payload. The IEEE 802.15.4g receiver captures all received packages, which is comprised of the package counter number, random data and the measured RSSI value at the receiver, and stored in the mini-PC. The IEEE 802.15.4g receiver and mini-PC were carried on the backpack, as shown in Figure 5a, from which the measurement points were taken placed on two streets, as shown in Figure 5b. The receiver position was about two meters high above the ground, which is the same as the average height of the installed meter in the field.
6. Experimental Result and Performance Analysis
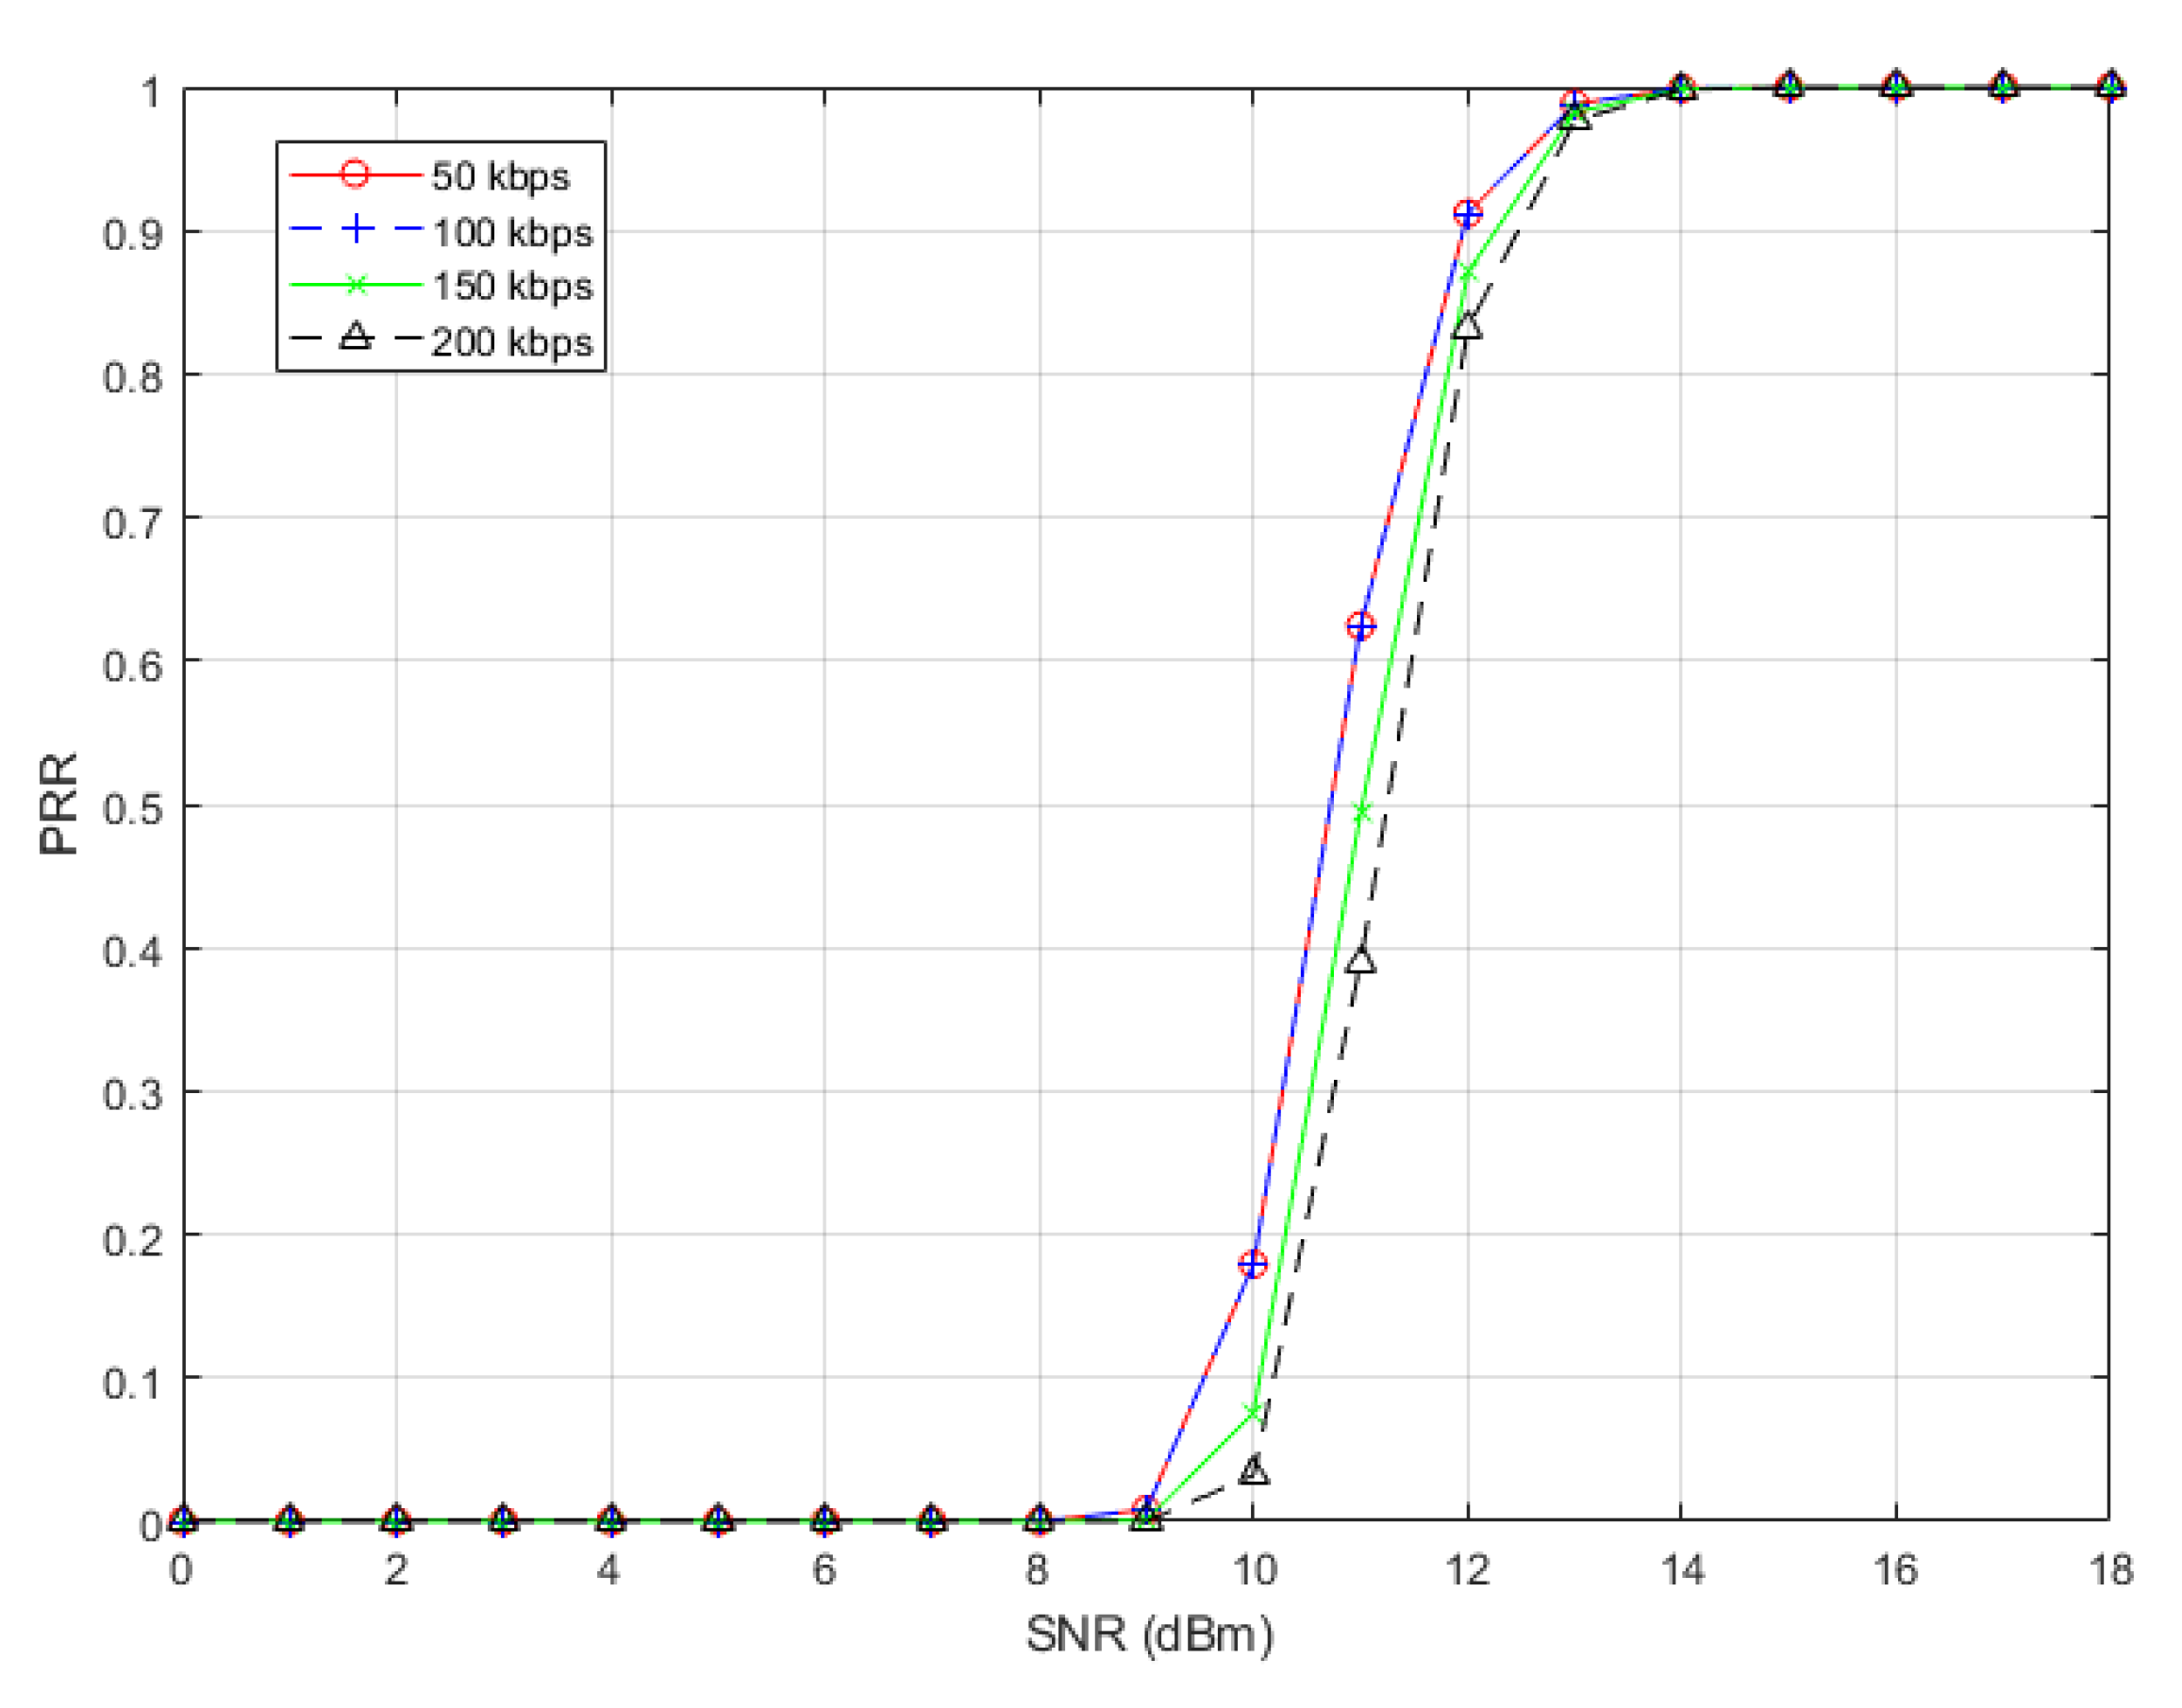
From the measurement setup section, the packet length was 255 bytes for every packet. The PRR of the IEEE 802.15.4g 2FSK PHY layer with various data rates is presented in Figure 6.
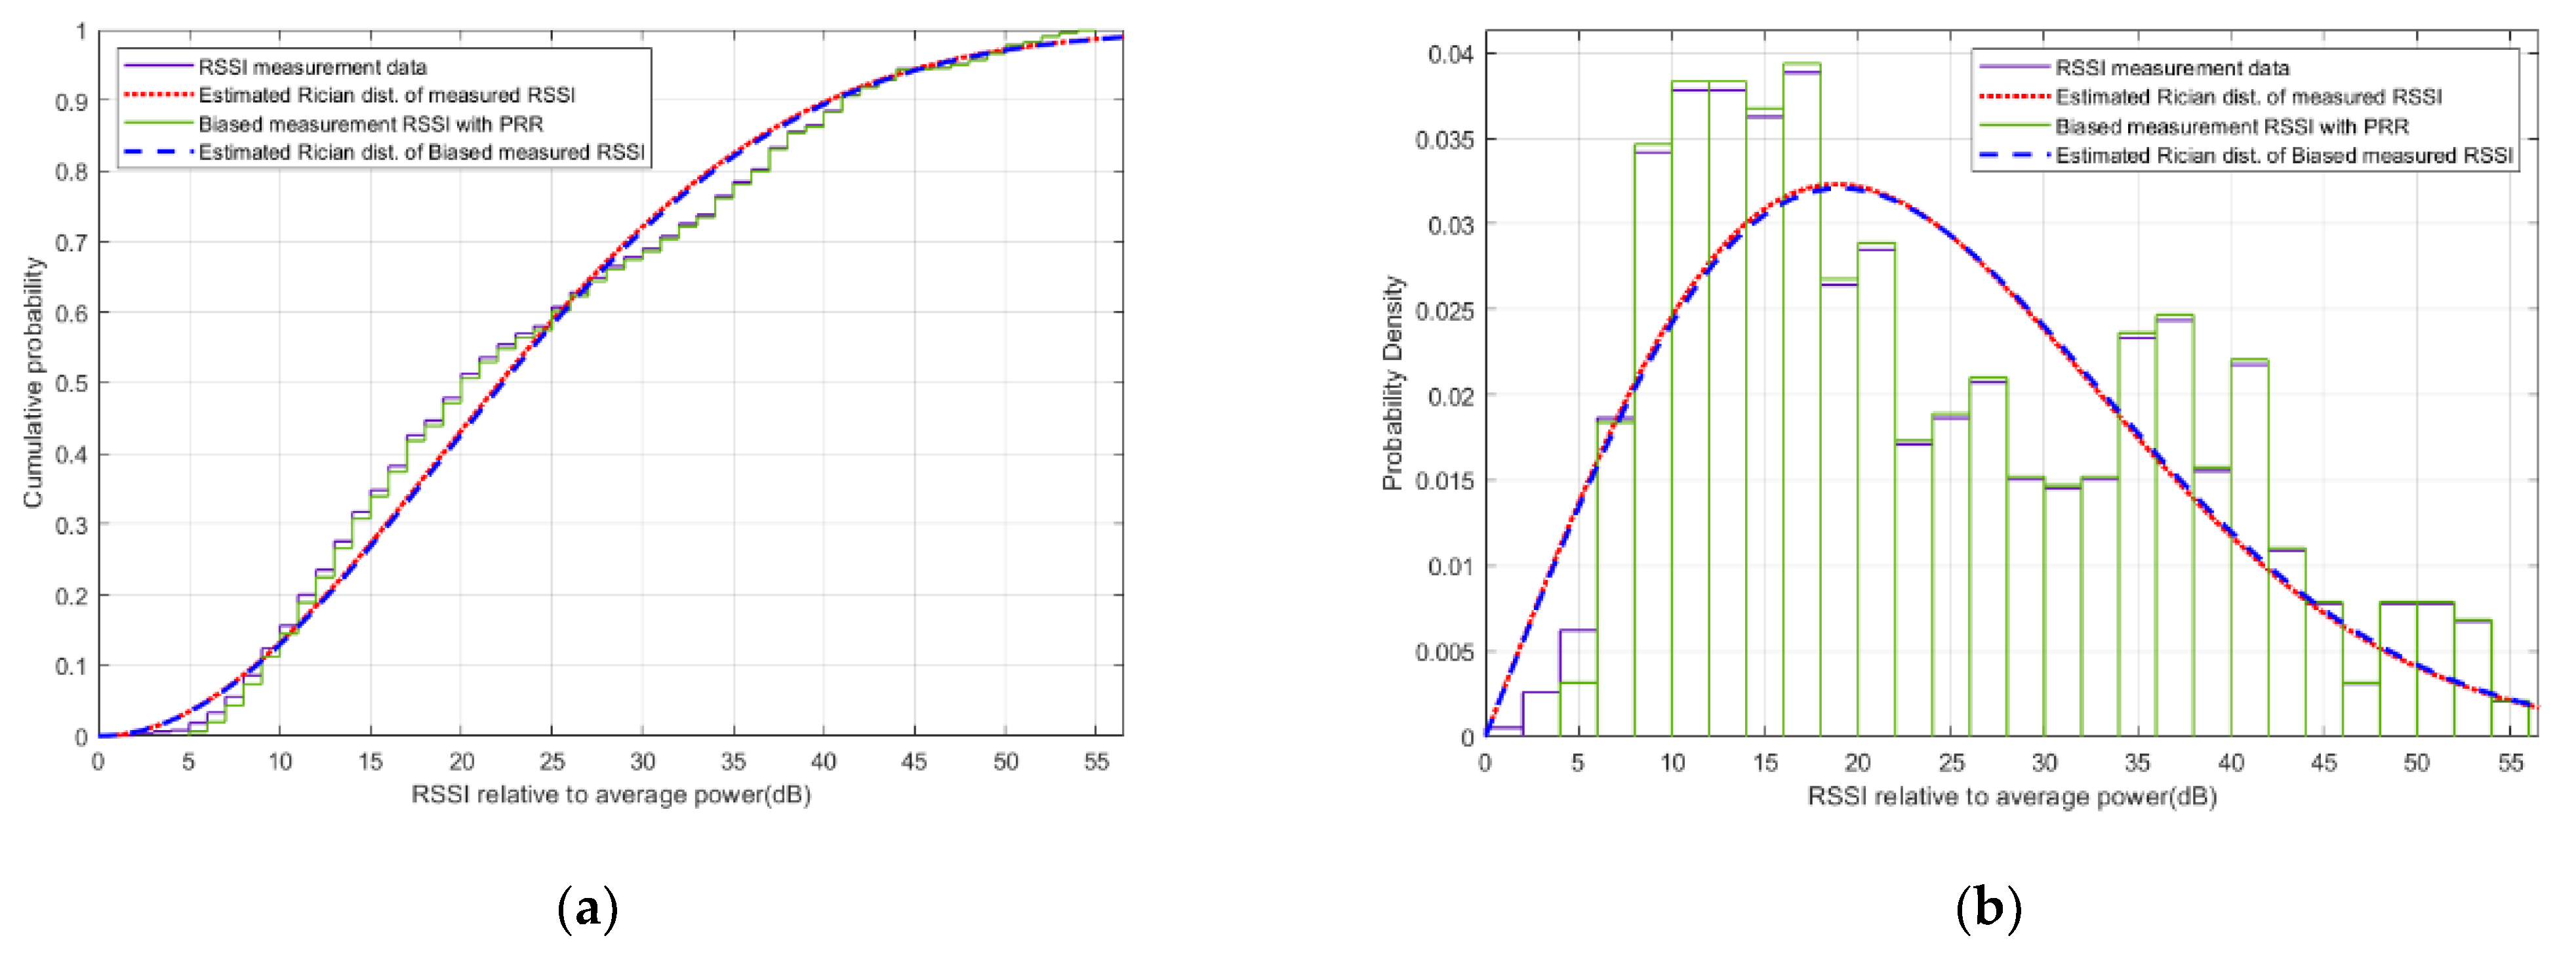
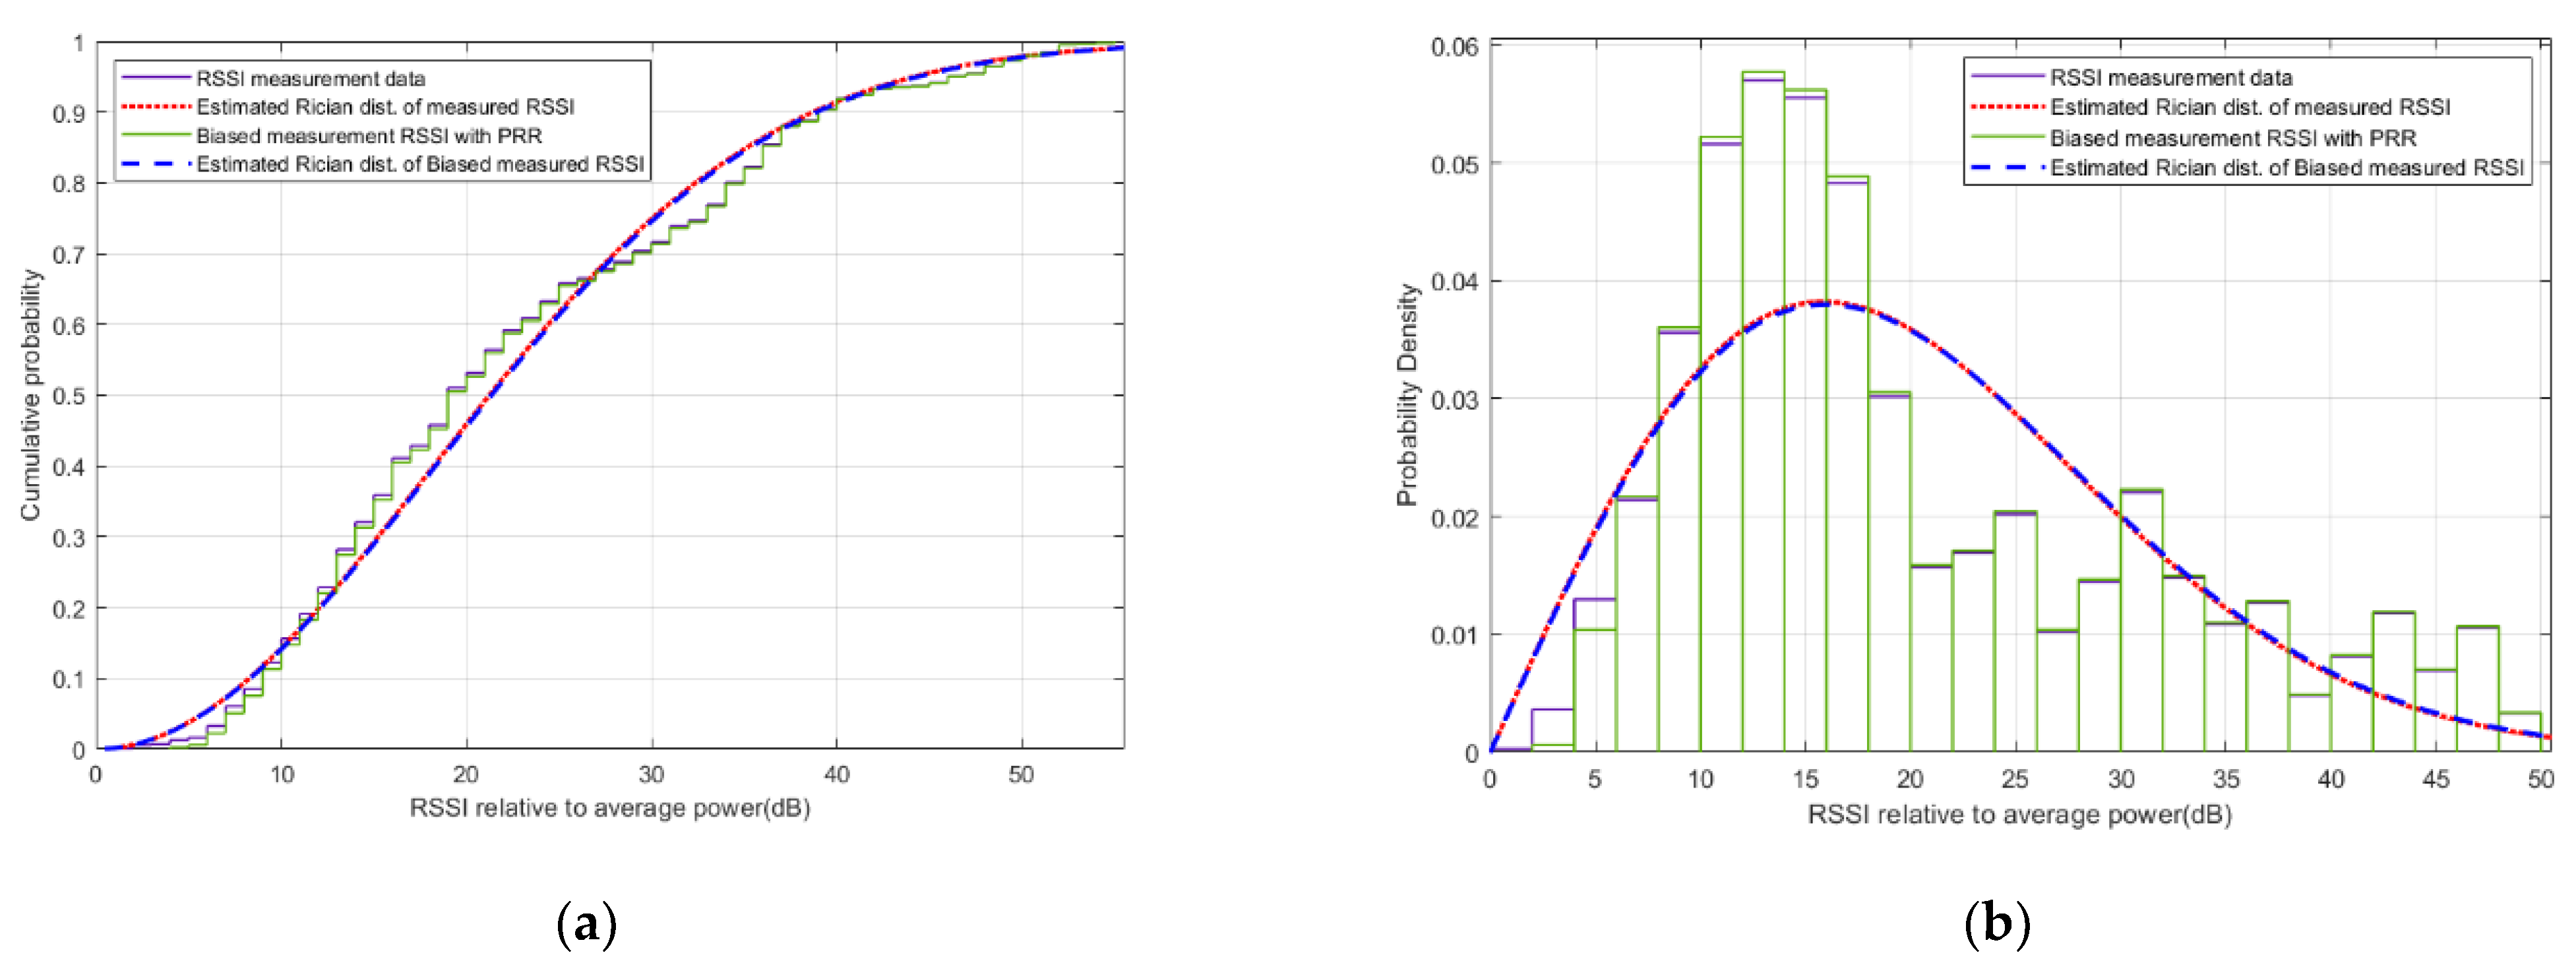
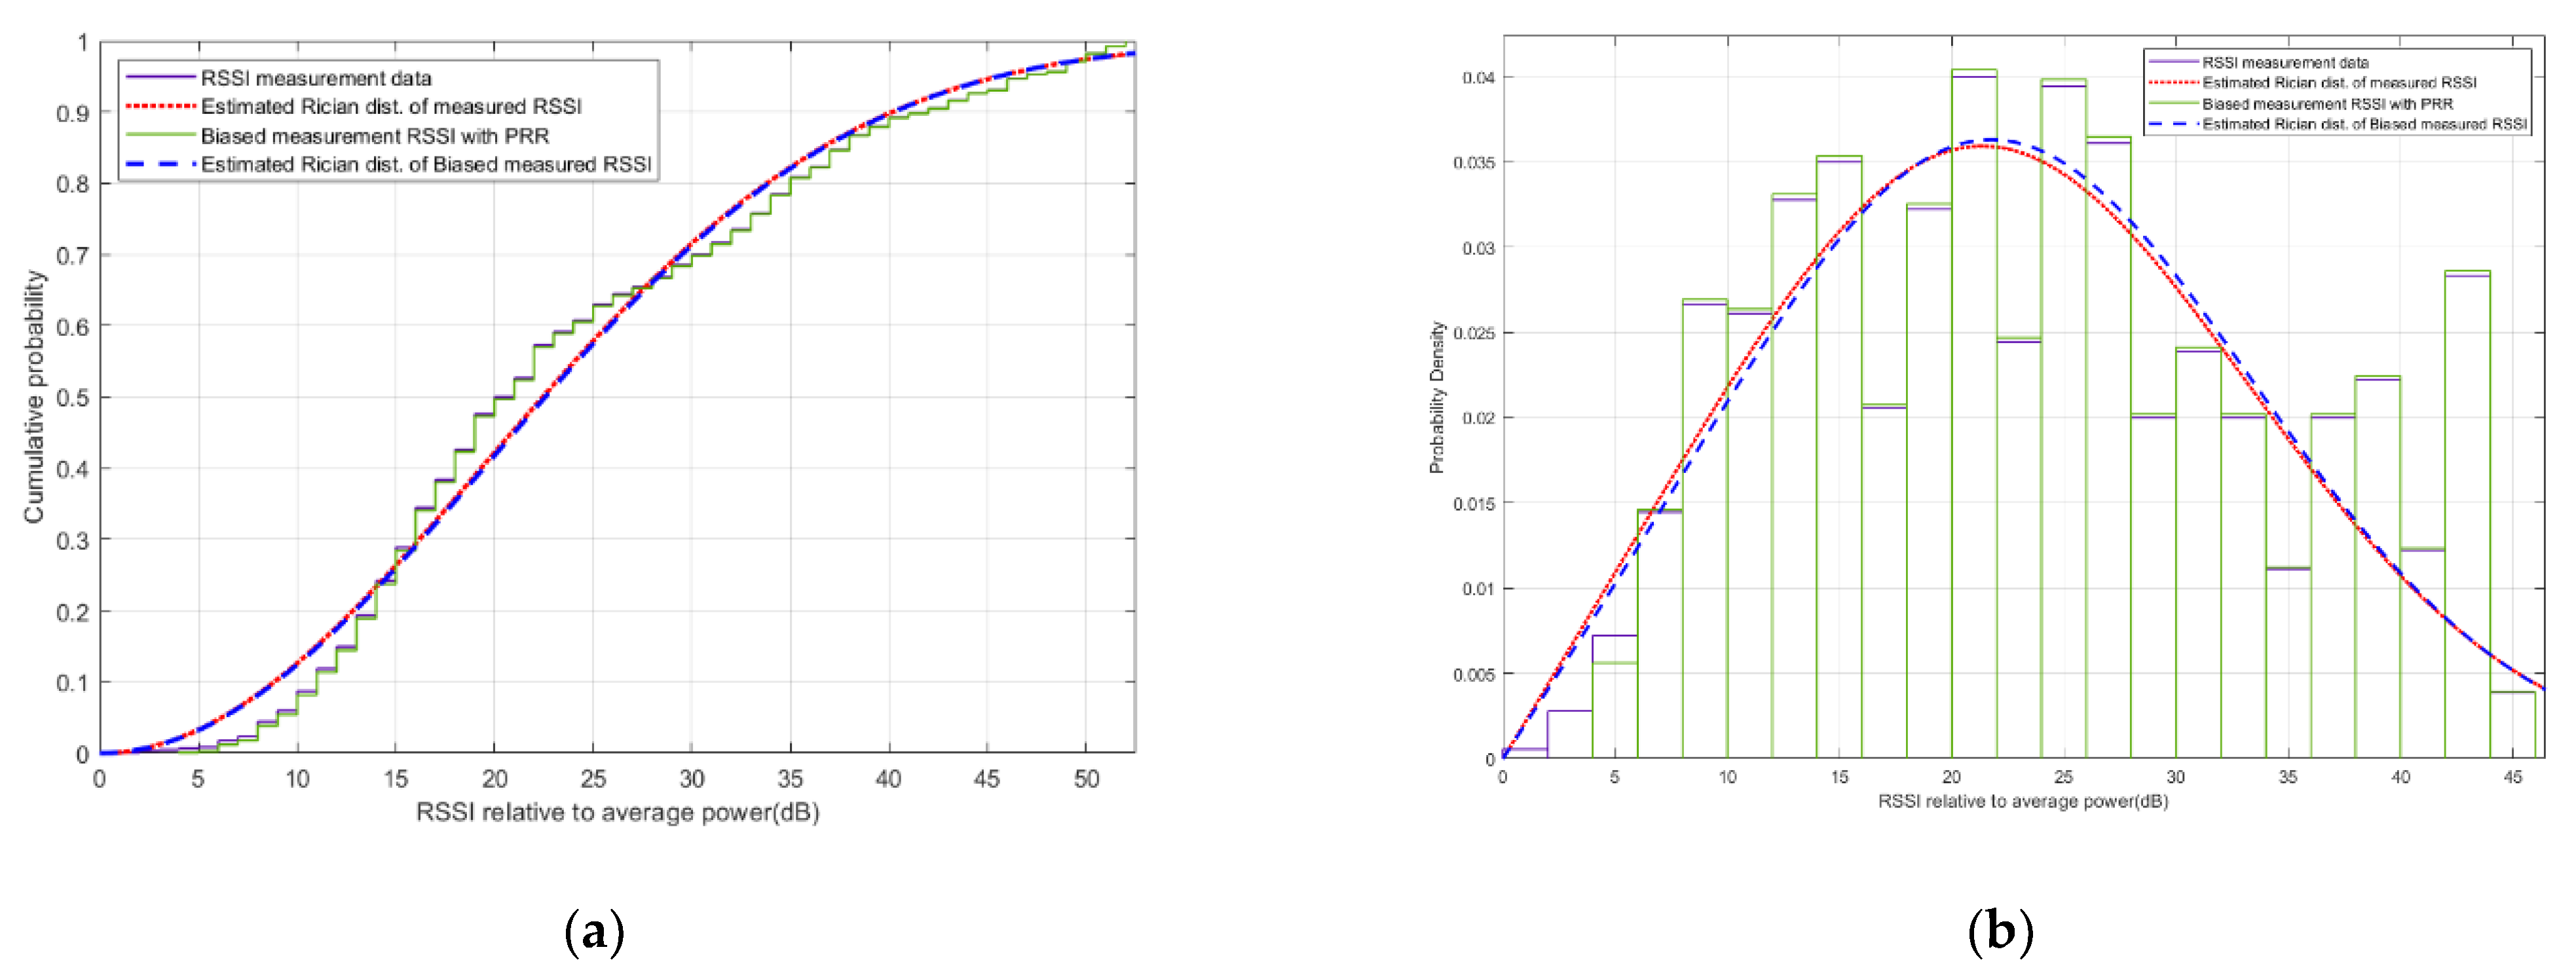
The received signal strength distribution was typically approximated by a Rician distribution curve fitting, which was a conventional Rician distribution approximation. For the improved accuracy of distribution approximation, the biased Rician distribution approximation was applied to the measured RSSI distribution, in which it was biased by a bias function w(r) in Equation (8) before being approximated by the Rician distribution. The rs and σ parameters are derived for both conventional and biased Rician distribution curve fittings. The K-factor was calculated by substituting rs and σ into Equations (2) and (3). Root mean-squared error (RMSE) was used to evaluate an error between the Rician distribution approximation and the measured RSSI distribution. The K-factor, rs, σ and RMSE parameters of conventional and biased Rician distribution curve fitting are shown in Table 4 and Table 5, respectively. CDF and PDF of conventional and biased Rician distribution curve fitting were applied to the RSSI measurement data taken from the experimental environment in all aliases (Table 1). For example, the conventional and biased Rician distribution curve fitting of 2FSK-433-50 alias was a PHY layer of the IEEE 802.15.4g channel, in which the 2FSK modulation 433.92 MHz multi-data rates (50 kbps, 100 kbps and 200 kbps) was fitted, as shown in Figure 7, Figure 8 and Figure 9, respectively.
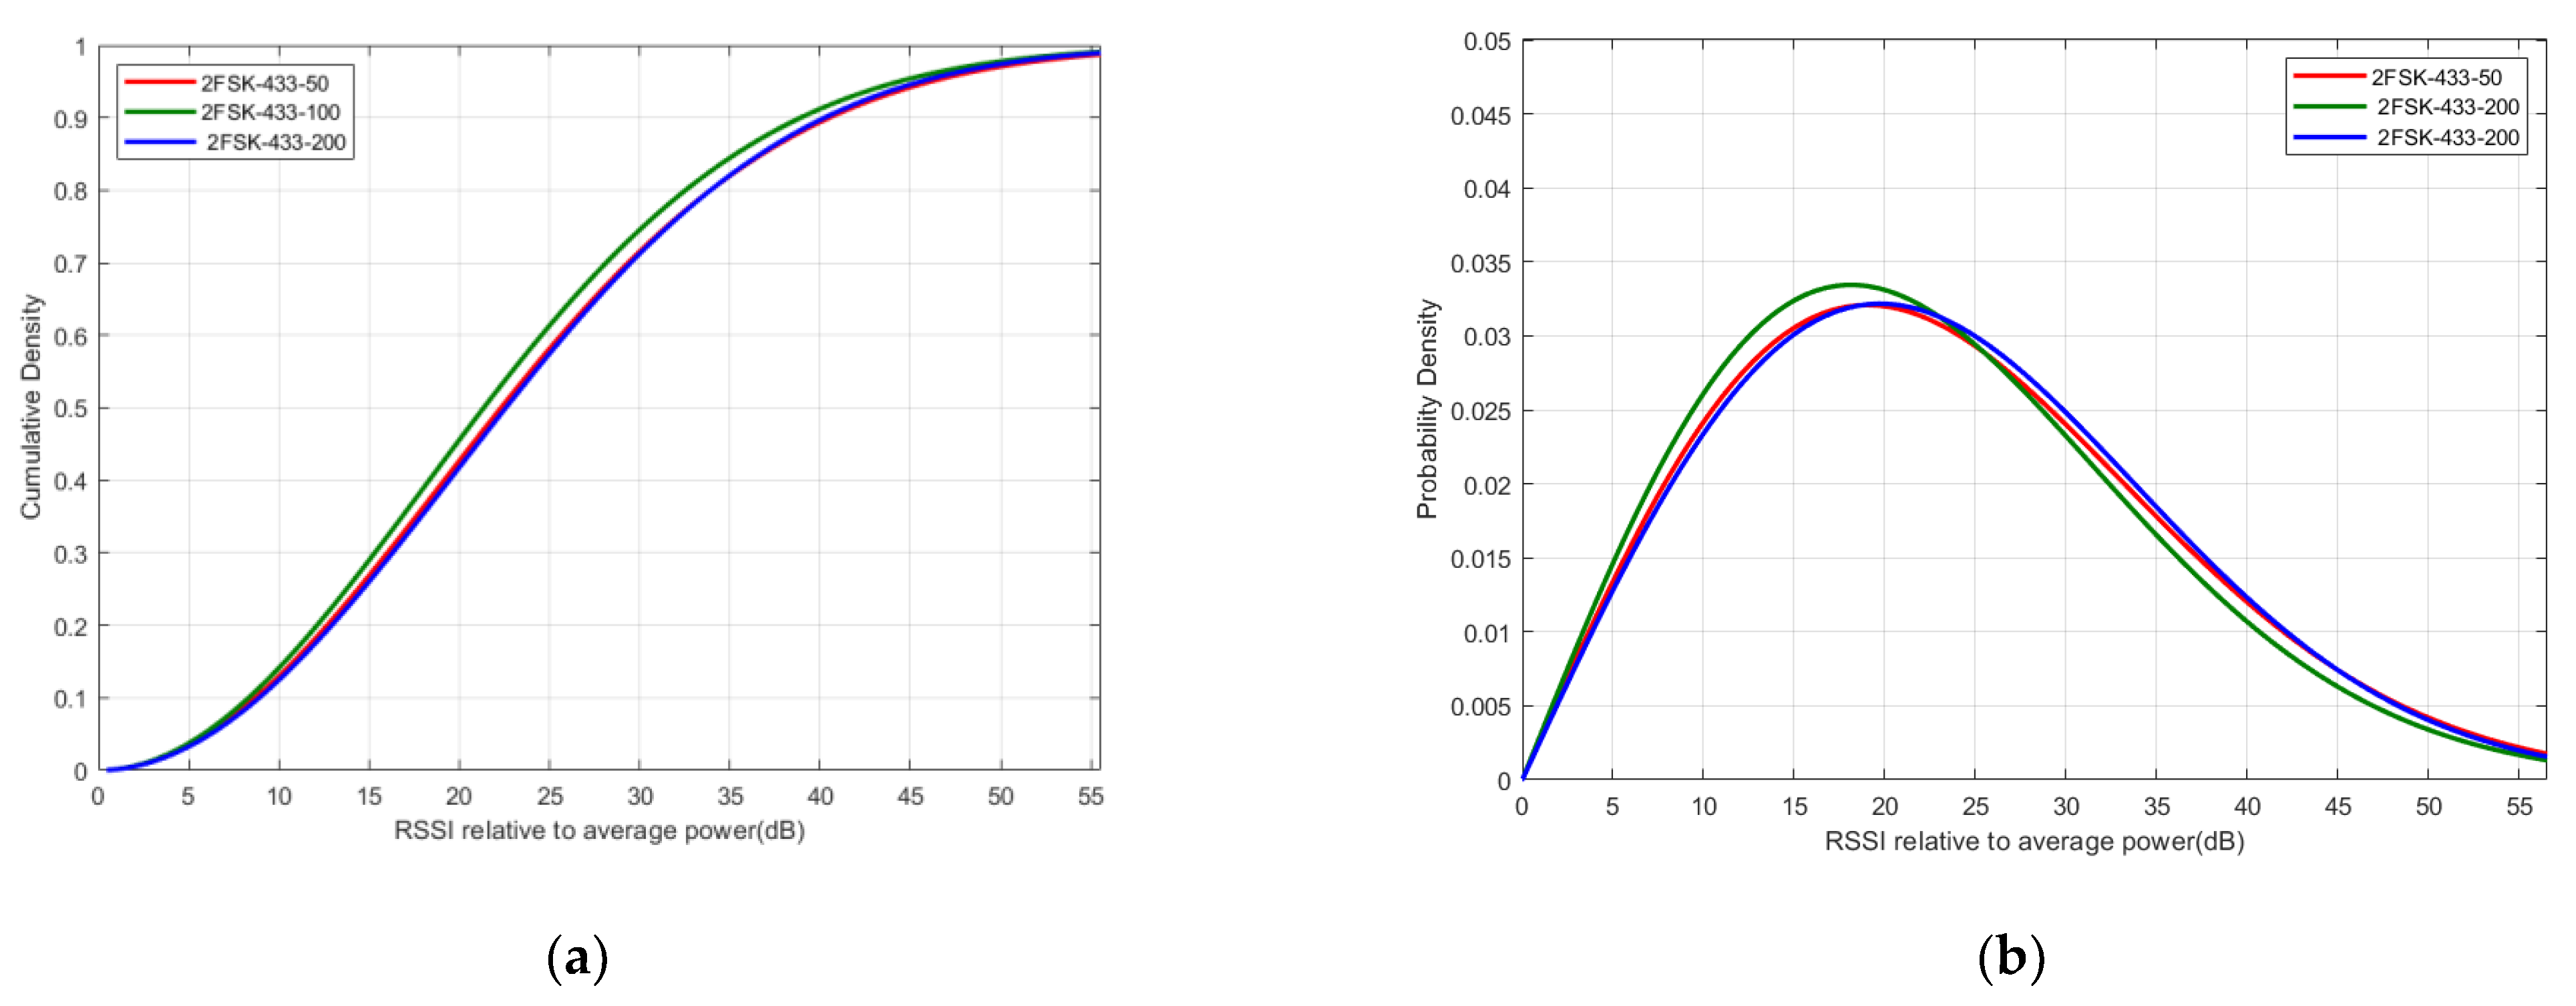
The Rician distribution estimation of RSSI for 2FSK 433.92 MHz Wi-SUN channel approximation with multi-data rates (50 kbps, 100 kbps and 200 kbps) is presented in Figure 10.
In Figure 10, it is shown that the characteristics of Wi-SUN channel approximation in the same modulation type and frequency (2FSK, 433.92 MHz) are different in each data rate, even though the experimental data was taken from the same experimental area.
In Table 4, the RMSE parameters in all aliases are very low, which fairly implies that the Rician distribution approximation is fit to the measured RSSI distribution. Therefore, K-factor, rs and σ derived from the conventional Rician distribution approximation could be fairly used to model the 2FSK Wi-SUN channel. However, in Table 5, it is shown that RMSE parameters are further decreased by applying the bias function in Equation (8), which are smaller than RMSE parameters shown in Table 4. For instance, on average, RMSE parameters were decreased for 0.557%, 2.695%, 0.47%, 0.666% and 3.827% in 433.92 MHz, 443 MHz, 448 MHz, 923 MHz and 2440 MHz, respectively. The K-factor (dB) of the biased approximation is also lower than the K-factor of the conventional approximation that has arisen from the fact that the rs and σ of the conventional Rician distribution approximation was reduced. Furthermore, the out-of-bound measurement of RSSI values are eliminated by the bias function in Equation (8); therefore, the RSSI approximations of 2FSK Wi-SUN channel become more accurate, which are closed to the RSSI measurement values.
7. Conclusions
In this article, the Wi-SUN channel approximations with multi-data rates were investigated for the residential area following the IEEE 802.15.4g Wi-SUN standard. The received signal strength distribution approximation for the IEEE 802.15.4g Wi-SUN smart grid networks was investigated by Rician distribution curve fitting, and then further improved the accuracy of approximation by the biased function. For all aliases, RMSE parameters of the biased approximation in Table 5 are reduced from the conventional approximation. For instance, on average, RMSE parameters were decreased by about 3.827% and 2.788% in 2440 and 443 MHz frequency bands, respectively. In addition, the K-factor (dB) in the Rician distribution, which represents the ratio of the power contribution by the line-of-sight (LOS) path to the remaining multipaths, in the biased approximation is decreased in all aliases; therefore, it sufficiently shows that the biased Wi-SUN channel model is more accurate than that of the conventional channel model. Hence, the experimental results and channel model could be applied to the Wi-SUN channel simulation for advanced metering infrastructure (AMI) last-mile network planning in smart grids. In future work, the authors will investigate the other biased functions for a better accuracy improvement, and also investigate the utilization of the investigated channel modelling in the smart meter network planning.
Author Contributions
Conceptualization, N.T. and C.P.; methodology, N.T. and C.P.; software, N.T. and C.P.; validation, N.T. and C.P.; formal analysis, N.T. and C.P.; investigation, N.T. and C.P.; resources, N.T. and C.P.; data curation, N.T. and C.P.; writing—original draft preparation, N.T.; writing—review and editing, C.P.; visualization, C.P.; supervision, C.P.; project administration, C.P.; funding acquisition, C.P. All authors have read and agreed to the published version of the manuscript.
Funding
This research was funded by King Mongkut’s University of Technology North Bangkok—contract no. KMUTNB-61-PHD-007.
Institutional Review Board Statement
Not applicable.
Informed Consent Statement
Not applicable.
Data Availability Statement
Publicly available datasets were analyzed in this study. This data can be found here: (https://github.com/deeppeed/datasets-Wi-SUNChannelModel-energies2022, 17 February 2022).
Conflicts of Interest
The authors declare no conflict of interest.
References
- Zikria, Y.B.; Kim, S.W.; Hahm, O.; Afzal, M.K.; Aalsalem, M.Y. Internet of Things (IoT) Operating Systems Management: Opportunities, Challenges, and Solution. Sensors 2019, 19, 1793. [Google Scholar] [CrossRef] [PubMed] [Green Version]
- Energy Policy, and Planning Office (EPPO), Thailand. The Situation of Oil, and Electricity Usage in Thailand during the First 5 Months of 2021. Available online: http://www.eppo.go.th/index.php/th/component/k2/item/download/21341_8cc2a1fd17cc537ad149ee1c90c8e81b (accessed on 20 September 2021).
- IEA. Covid-19 Impact on Electricity; IEA: Paris, France, 2021; Available online: https://www.iea.org/reports/covid-19-impact-on-electricity (accessed on 15 February 2022).
- Farmanbar, M.; Parham, K.; Arild, Ø.; Rong, C. A Widespread Review of Smart Grids Towards Smart Cities. Energies 2019, 12, 4484. [Google Scholar] [CrossRef] [Green Version]
- Kim, D.S.; Chung, B.J.; Chung, Y.M. Analysis of AMI Communication Methods in Various Field Environments. Energies 2020, 13, 5185. [Google Scholar] [CrossRef]
- Harada, H.; Mizutani, K.; Fujiwara, J.; Mochizuki, K.; Obata, K.; Okumura, R. IEEE 802.15.4g Based Wi-SUN Communication Systems. IEICE Trans. Commun. 2017, E100.B, 1032–1043. Available online: https://www.jstage.jst.go.jp/article/transcom/E100.B/7/E100.B_2016SCI0002/_article/-char/en (accessed on 15 February 2022). [CrossRef] [Green Version]
- Sum, C.S.; Zhou, M.T.; Kojima, F.; Harada, H. Experimental Performance Evaluation of Multihop IEEE 802.15.4/4g/4e Smart Utility Networks in Outdoor Environment. Wirel. Commun. Mob. Comput. 2017, 2017, 7137406. [Google Scholar] [CrossRef] [Green Version]
- Mahjoub, H.N.; Tahmasbi-Sarvestani, A.; Gani, S.M.O.; Fallah, Y.P. Composite α-μ Based DSRC Channel Model Using Large Data Set of RSSI Measurements. IEEE Trans. Intell. Transp. Syst. 2018, 20, 205–217. [Google Scholar] [CrossRef]
- Kielgast, M.R.; Rasmussen, A.C.; Laursen, M.H.; Nielsen, J.J.; Popovski, P.; Krigslund, R. Estimation of Received Signal Strength Distribution for Smart Meters with Biased Measurement Data Set. IEEE Wirel. Commun. Lett. 2017, 6, 2–5. [Google Scholar] [CrossRef] [Green Version]
- Uribe-Pérez, N.; Hernández, L.; Gómez, R.; Soria, S.; de la Vega, D.; Angulo, I.; Arzuaga, T.; Gutiérrez, L. Smart management of a distributed generation microgrid through PLC PRIME technology. In Proceedings of the 2015 International Symposium on Smart Electric Distribution Systems and Technologies (EDST), Vienna, Austria, 8–11 September 2015; pp. 374–379. [Google Scholar]
- Angulo, I.; Arrinda, A.; Fernández, I.; Uribe-Pérez, N.; Arechalde, I.; Hernández, L. A review on measurement techniques for non-intentional emissions above 2 kHz. In Proceedings of the 2016 IEEE International Energy Conference (ENERGYCON), Leuven, Belgium, 4–8 April 2016; pp. 1–5. [Google Scholar]
- Farrell, S. (Ed.) Low-Power Wide Area Network (LPWAN) Overview; Internet Engineering Task Force (IETF): Dublin, Ireland, May 2018; Available online: https://www.rfc-editor.org/rfc/pdfrfc/rfc8376.txt.pdf (accessed on 15 February 2022).
- Mochizuki, K.; Obata, K.; Mizutani, K.; Harada, H. Development and field experiment of wide area Wi-SUN system based on IEEE 802.15.4g. In Proceedings of the 2016 IEEE 3rd World Forum on Internet of Things (WF-IoT), Reston, VA, USA, 12–14 December 2016; pp. 76–81. [Google Scholar] [CrossRef]
- Chang, K.H.; Mason, B. The IEEE 802.15.4g standard for smart metering utility networks. In Proceedings of the 2012 IEEE Third International Conference on Smart Grid Communications (SmartGridComm), Tainan, Taiwan, 5–8 November 2012; pp. 476–480. [Google Scholar] [CrossRef]
- Muñoz, J.; Chang, T.; Vilajosana, X.; Watteyne, T. Evaluation of IEEE802.15.4g for Environmental Observations. Sensors 2018, 18, 3468. [Google Scholar] [CrossRef] [PubMed] [Green Version]
- Righetti, F.; Vallati, C.; Comola, D.; Anastasi, G. Performance Measurements of IEEE 802.15.4g Wireless Networks. In Proceedings of the 2019 IEEE 20th International Symposium on “A World of Wireless, Mobile and Multimedia Networks” (WoWMoM), Washington, DC, USA, 10–12 June 2019; pp. 1–6. [Google Scholar] [CrossRef]
- Benjapolakul, W. Radio Frequency Utilization for the Development of Smart Grids in Thailand. Available online: https://so04.tci-thaijo.org/index.php/NBTC_Journal/article/view/139500/115537 (accessed on 15 February 2022).
- ITU Radio Regulations. CHAPTER II—Frequencies, ARTICLE 5 Frequency Allocations, Section IV—Table of Frequency Allocations. Available online: https://www.sma.gov.jm/sites/default/files/publication_files/ITU-R_Radio_Regulations_2012_%202015_%20Article_5_Table%20of%20Frequencies.pdf (accessed on 15 February 2022).
- NBTC. Technical Standards of Telecommunication Equipment NTC TS 1033–2560 Radio Communication Radio Frequency Identification: The Frequency Range Is 920–925 MHz. Available online: http://www.ratchakitcha.soc.go.th/DATA/PDF/2560/E/289/51.PDF (accessed on 15 February 2022).
- Parsons, J.D. The Mobile Radio Propagation Channel; Wiley: Chichester, UK, 2001. [Google Scholar]
- Goldsmith, A. Wireless Communications; Cambridge University Press: Cambridge, UK, 2005. [Google Scholar]
- Yin, X.; Cheng, X. Propagation Channel Characterization, Parameter Estimation, and Modeling for Wireless Communications; Wiley: Singapore, 2016. [Google Scholar]
- Primak, S.; Kontorovich, V. Wireless Multi-Antenna Channels: Modeling and Simulation; John Wiley & Sons: West Sussex, UK, 2011; Volume 28. [Google Scholar]
- Zhu, S.; Ghazaany, T.S.; Jones, S.M.; Abd-Alhameed, R.A.; Noras, J.M.; Van Buren, T.; Wilson, J.; Suggett, T.; Marker, S. Probability Distribution of Rician K-Factor in Urban, Suburban and Rural Areas Using Real-World Captured Data. IEEE Trans. Antennas Propag. 2014, 62, 3835–3839. [Google Scholar] [CrossRef]
Figure 1.
The AMI architecture.

Figure 2.
BER of the 2FSK Wi-SUN channel with various data rates (50, 100, 150, 200 kbps).

Figure 3.
The experimental residential area.

Figure 4.
IEEE 802.15.4g Wi-SUN development board modelled LAUNCHXL-CC1352P.

Figure 5.
(a) IEEE 802.15.4g receiver on backpack, (b) the measurement points at the residential area.
Figure 5.
(a) IEEE 802.15.4g receiver on backpack, (b) the measurement points at the residential area.

Figure 6.
PRR of the 2FSK Wi-SUN channel with data rates of 50, 100, 150 and 200 kbps, respectively.
Figure 6.
PRR of the 2FSK Wi-SUN channel with data rates of 50, 100, 150 and 200 kbps, respectively.

Figure 7.
(a) CDF and (b) PDF of conventional and biased Wi-SUN channel approximation (2FSK-433-50 alias).
Figure 7.
(a) CDF and (b) PDF of conventional and biased Wi-SUN channel approximation (2FSK-433-50 alias).

Figure 8.
(a) CDF and (b) PDF of conventional and biased Wi-SUN channel approximation (2FSK-433-100 alias).
Figure 8.
(a) CDF and (b) PDF of conventional and biased Wi-SUN channel approximation (2FSK-433-100 alias).

Figure 9.
(a) CDF and (b) PDF of conventional and biased Wi-SUN channel approximation (2FSK-433-200 alias).
Figure 9.
(a) CDF and (b) PDF of conventional and biased Wi-SUN channel approximation (2FSK-433-200 alias).

Figure 10.
(a) CDF and (b) PDF of biased 2FSK 433.92 MHz multi-data rates Wi-SUN channel approximation (50, 100, 200 kbps).
Figure 10.
(a) CDF and (b) PDF of biased 2FSK 433.92 MHz multi-data rates Wi-SUN channel approximation (50, 100, 200 kbps).


Table 1.
The studied data rates and frequency bands of 2FSK PHY layer in Thailand.
| Frequency (MHz) | Data Rate (kbps) | Channel Spacing (kHz) | Alias | Transmit Power (dBm) |
|---|---|---|---|---|
| 433.92 | 50 | 200 | 2FSK-433-50 | 10 |
| 100 | 400 | 2FSK-433-100 | 10 | |
| 200 | 400 | 2FSK-433-200 | 10 | |
| 443 | 50 | 200 | 2FSK-443-50 | 10 |
| 100 | 400 | 2FSK-443-100 | 10 | |
| 200 | 400 | 2FSK-443-200 | 10 | |
| 448 | 50 | 200 | 2FSK-448-50 | 10 |
| 100 | 400 | 2FSK-448-100 | 10 | |
| 200 | 400 | 2FSK-448-200 | 10 | |
| 923 | 50 | 200 | 2FSK-923-50 | 20 |
| 100 | 400 | 2FSK-923-100 | 20 | |
| 150 | 400 | 2FSK-923-150 | 20 | |
| 200 | 400 | 2FSK-923-200 | 20 | |
| 2440 | 50 | 200 | 2FSK-2440-50 | 5 |
| 150 | 400 | 2FSK-2440-150 | 5 | |
| 200 | 400 | 2FSK-2440-200 | 5 |
Table 2.
Data rates and frequency bands of MR-FSK PHY layer in different countries.
| Regulatory Domain | Frequency Band (MHz) | Data Rates (kbps) |
|---|---|---|
| China | 470–510, 779–787 | 50, 100, 200 |
| Europe | 863–870 | 50, 100, 200 |
| US | 902–928 | 50, 150, 200 |
| Korea | 917–923.5 | 50, 150, 200 |
| Japan | 920–928, 950–958 | 50, 100, 200, 400 |
| Worldwide | 2400–2483.5 | 50, 150, 200 |
Table 3.
System specification in the experiment.
| Specification | Value | Unit |
|---|---|---|
| Standard | IEEE 802.15.4g-2012 (Wi-SUN) | - |
| Modulation, frequency, and data rate | All aliases in Table 1 | - |
| DCU installation height (Tx) | 4 | m |
| DCU installation height (Rx) | 2 | m |
| Payload size | 255 | bytes |
| Tx package interval | 500 | ms |
| Sampling point | ≥1000 | point |
Table 4.
Conventional fitted Rician parameter.
| Number | Alias |
K-factor (db) | RMSE | ||
|---|---|---|---|---|---|
| 1 | 2FSK-433-50 | 7.57963 | 17.9817 | −10.514 | 0.031926604 |
| 2 | 2FSK-433-100 | 3.61237 | 17.8572 | −16.8907 | 0.02828176 |
| 3 | 2FSK-433-200 | 13.503 | 16.2121 | −4.59848 | 0.03407693 |
| 4 | 2FSK-443-50 | 13.6994 | 13.6518 | −2.98007 | 0.03418891 |
| 5 | 2FSK-443-100 | 1.65492 | 15.8254 | −22.6219 | 0.704776627 |
| 6 | 2FSK-443-200 | 18.371 | 12.4326 | 0.381117 | 0.023459429 |
| 7 | 2FSK-448-50 | 14.5991 | 17.6363 | −4.65193 | 0.034126905 |
| 8 | 2FSK-448-100 | 7.72779 | 18.4444 | −10.5665 | 0.030325362 |
| 9 | 2FSK-448-200 | 9.55073 | 17.556 | −8.29808 | 0.030628617 |
| 10 | 2FSK-923-50 | 26.2517 | 16.7561 | 0.88939 | 0.023764168 |
| 11 | 2FSK-923-100 | 40.9284 | 14.4616 | 6.025868 | 0.030386638 |
| 12 | 2FSK-923-150 | 6.03959 | 17.8988 | −12.4466 | 0.037302199 |
| 13 | 2FSK-923-200 | 10.3359 | 17.8441 | −7.75323 | 0.038247233 |
| 14 | 2FSK-2440-50 | 17.329 | 16.2678 | −2.46141 | 0.030903469 |
| 15 | 2FSK-2440-150 | 21.5597 | 13.9068 | 0.79801 | 0.059350678 |
| 16 | 2FSK-2440-200 | 13.2688 | 14.2688 | −3.64142 | 0.026787834 |
Table 5.
The biased fitted Rician parameter.
| Number | Alias |
K-factor (dB) | RMSE | RMSE Changed (%) | ||
|---|---|---|---|---|---|---|
| 1 | 2FSK-433-50 | 9.66897 | 17.6084 | −8.21709 | 0.031739791 | −0.58513 |
| 2 | 2FSK-433-100 | 5.08686 | 17.7703 | −13.8752 | 0.028111935 | −0.60048 |
| 3 | 2FSK-433-200 | 14.207 | 15.9743 | −4.02869 | 0.033911397 | −0.48576 |
| 4 | 2FSK-443-50 | 14.5326 | 13.357 | −2.27761 | 0.032979213 | −3.53827 |
| 5 | 2FSK-443-100 | 1.37446 | 15.9317 | −24.2929 | 0.704715123 | −0.00873 |
| 6 | 2FSK-443-200 | 18.8941 | 12.167 | 0.812554 | 0.022394608 | −4.53899 |
| 7 | 2FSK-448-50 | 15.8887 | 17.2146 | −3.70647 | 0.034031097 | −0.28074 |
| 8 | 2FSK-448-100 | 11.2216 | 17.7849 | −7.01023 | 0.030280683 | −0.14733 |
| 9 | 2FSK-448-200 | 10.9664 | 17.2438 | −6.94168 | 0.030327182 | −0.98416 |
| 10 | 2FSK-923-50 | 26.9703 | 16.3685 | 1.327238 | 0.02369494 | −0.29131 |
| 11 | 2FSK-923-100 | 40.8299 | 14.5448 | 5.955111 | 0.030023154 | −1.1962 |
| 12 | 2FSK-923-150 | 7.68147 | 17.6876 | −10.2548 | 0.037048913 | −0.67901 |
| 13 | 2FSK-923-200 | 11.2209 | 17.659 | −6.94907 | 0.038055646 | −0.50092 |
| 14 | 2FSK-2440-50 | 18.0239 | 16.0046 | −1.97822 | 0.030583662 | −1.03486 |
| 15 | 2FSK-2440-150 | 21.9295 | 13.7122 | 1.068132 | 0.057093885 | −3.80247 |
| 16 | 2FSK-2440-200 | 14.857 | 13.7175 | −2.31718 | 0.025008052 | −6.64399 |
Publisher’s Note: MDPI stays neutral with regard to jurisdictional claims in published maps and institutional affiliations. |
© 2022 by the authors. Licensee MDPI, Basel, Switzerland. This article is an open access article distributed under the terms and conditions of the Creative Commons Attribution (CC BY) license (https://creativecommons.org/licenses/by/4.0/).
Share and Cite
MDPI and ACS Style
Tangsunantham, N.; Pirak, C. Experimental Performance Analysis of Wi-SUN Channel Modelling Applied to Smart Grid Applications. Energies 2022, 15, 2417. https://doi.org/10.3390/en15072417
AMA Style
Tangsunantham N, Pirak C. Experimental Performance Analysis of Wi-SUN Channel Modelling Applied to Smart Grid Applications. Energies. 2022; 15(7):2417. https://doi.org/10.3390/en15072417
Chicago/Turabian StyleTangsunantham, Natthanan, and Chaiyod Pirak. 2022. "Experimental Performance Analysis of Wi-SUN Channel Modelling Applied to Smart Grid Applications" Energies 15, no. 7: 2417. https://doi.org/10.3390/en15072417
Note that from the first issue of 2016, this journal uses article numbers instead of page numbers. See further details here.