

Cloud-Based Platform for Photovoltaic Assets Diagnosis and Maintenance
by
 , , ,
, , ,
Andreas Livera
1,*,
Georgios Tziolis
1,
Jose G. Franquelo
2,
Ruben Gonzalez Bernal
2 and
George E. Georghiou
1 1
PV Technology Laboratory, FOSS Research Centre for Sustainable Energy, Department of Electrical and Computer Engineering, University of Cyprus, Nicosia 1678, Cyprus
2
Isotrol SA, Isaac Newton 3, 41092 Seville, Spain
*
Author to whom correspondence should be addressed.
Energies 2022, 15(20), 7760; https://doi.org/10.3390/en15207760
Submission received: 19 September 2022
/
Revised: 12 October 2022
/
Accepted: 17 October 2022
/
Published: 20 October 2022
(This article belongs to the Special Issue Advances in Photovoltaic Solar Energy)
Abstract
:A cloud-based platform for reducing photovoltaic (PV) operation and maintenance (O&M) costs and improving lifetime performance is proposed in this paper. The platform incorporates a decision support system (DSS) engine and data-driven functionalities for data cleansing, PV system modeling, early fault diagnosis and provision of O&M recommendations. It can ensure optimum performance by monitoring in real time the operating state of PV assets, detecting faults at early stages and suggesting field mitigation actions based on energy loss analysis and incidents criticality evaluation. The developed platform was benchmarked using historical data from a test PV power plant installed in the Mediterranean region. The obtained results showed the effectiveness of the incorporated functionalities for data cleansing and system modeling as well as the platform’s capability for automated PV asset diagnosis and maintenance by providing recommendations for resolving the detected underperformance issues. Based on the DSS recommendations, approximately 7% of lost energy production could be recovered by performing field mitigation activities (e.g., corrective actions).
1. Introduction
A key factor for the future photovoltaic (PV) uptake and PV value chain is the reduction of the Levelized Cost of Electricity (LCOE). This can be achieved by increasing lifetime performance and reducing operating costs through health-state monitoring, offering quality control, safeguarding guarantees and cost-effective operation and maintenance (O&M). Since monitoring systems can assist in improving the reliability and service performance of PV [1], specific features for the automatic control of PV systems based on data analytics need to be included to assess PV system performance, identify instances of underperformance, and classify the root causes of faults. Such features include data quality and cleansing [2], system performance analytics, and fault and problem detection [3]. By integrating such functionalities within the monitoring system, optimal levels of PV performance are maintained through the quick identification and accurate quantification of the factors behind the various fault mechanisms. Therefore, downtime and power and hence economic losses due to operational problems are diminished [4].
Most of the existing PV installations around the world are monitored 24/7 by default, either via the inverter or through a monitoring system. Inverter-based monitoring systems (also referred as passive monitoring systems) perform basic PV performance and measurement checks. Such systems alert operators when an inverter is underperforming, and they can detect grid errors (e.g., inverter disconnection, damaged AC cable), errors at the AC side, unstable PV operation (reduced DC power production), sensor errors (e.g., communication faults with the meter unit), ground faults, and other incidents (such as DC overvoltage, DC overcurrent and inverter overtemperature). However, passive monitoring systems often trigger false alerts on cloudy days and do not detect faults that cause small amounts of power loss (e.g., degraded or soiled PV modules) nor PV array-related problems. On the contrary, the current state of the art within the PV industry is mainly concerned with so-called active PV monitoring systems used to quickly identify failures and assess the performance of PV systems in real time [1]. Active monitoring systems define different threshold levels (TLs), either static or dynamic, for determining whether the system is performing as expected or not, and to take into consideration the weather conditions. Such systems also offer constant alerting in case of malfunctions and system underperformance [5]. With the current advances in the field of artificial intelligence (AI) and the rapid developments in statistical analysis, more intelligent monitoring systems are continuously developed by integrating AI fault diagnostics and prognostics along with PV O&M strategies (i.e., preventive, predictive and corrective maintenance). The aforementioned analytics, diagnostics, and O&M strategies are necessary for providing recommendations of maintenance actions, intelligently resolving the power reduction issues and optimizing/scheduling field O&M activities, thus lowering operating expenses and increasing PV energy yield. To highlight the importance of these functionalities, a recent industry benchmark study indicated that the global PV industry could be losing $14.50 billion each year by 2024 if an O&M strategy is not executed [6]. The same study demonstrated that the average recoverable energy of a PV plant is 5.27% (equivalent to a potential recoverable income of 10,000 $/MW/year) when performing field O&M activities [6].
Bearing the above in mind, many performance monitoring and PV asset products have entered the market (from companies such as Isotrol, Alectris, Fronius International GmbH, Inaccess, QOS Energy, Raycatch, SMA Solar Technologies, SolarEdge, SunSniffer GmbH & Co KG, etc.) to reliable assess the PV performance and guarantee optimal output production [6,7,8,9,10]. Such monitoring products model PV system performance, given the prevailing meteorological conditions. They also perform comparisons between the system’s expected energy yield against the actual production to identify fault conditions and provide details about the operating state of the system, in addition to the attributes of PV underperformance [11,12,13]. Existing commercial solutions require either additional equipment (i.e., smart meters, specific hardware and software, inverters of specific manufacturer and sensors) or additional costs to make the service available to users [7]. Most of the commercial options are provided to users as Software as a Service (SaaS). Therefore, commercial solutions tend to be closed source, and not much information (e.g., the exact methodology followed for fault detection and energy losses calculations) is provided regarding the integrated functionalities.
Even though a lot of work has been performed in the area of fault detection [14,15,16,17,18], technical risk quantification [19,20,21], maintenance strategies [3,22,23], and commercialization of PV diagnostic tools [6,7,8,9,10], very few published articles [3,24,25] are concerned with the detailed description of platforms for PV O&M cost reduction and revenue optimization. The published articles describe the current state of the devised platforms, demonstrating results from the implementation of the integrated functionalities. The applicability of platforms for PV O&M and the complete process from data acquisition to prioritization of actions are commonly ignored. To address the aforementioned gaps, this paper expands on a previous study [25], describing in detail the developed cloud-based platform (and its functionalities) for PV asset diagnosis and maintenance. The proposed platform incorporates functionalities for data cleansing and PV system modeling, algorithms for early fault detection, an analytical method for energy loss breakdown and incidents criticality evaluation and a list of automatically generated recommendations for resolving underperformance incidents (i.e., performance losses and failures) and data issues. The platform was validated in a real environment that manages the complete process of acquisition and standardization of plant data on a cloud platform, validation, and cleaning of the received information, identification of failures, generation of recommendations for maintenance, and prioritization of actions and follow-up.
2. Materials and Methods
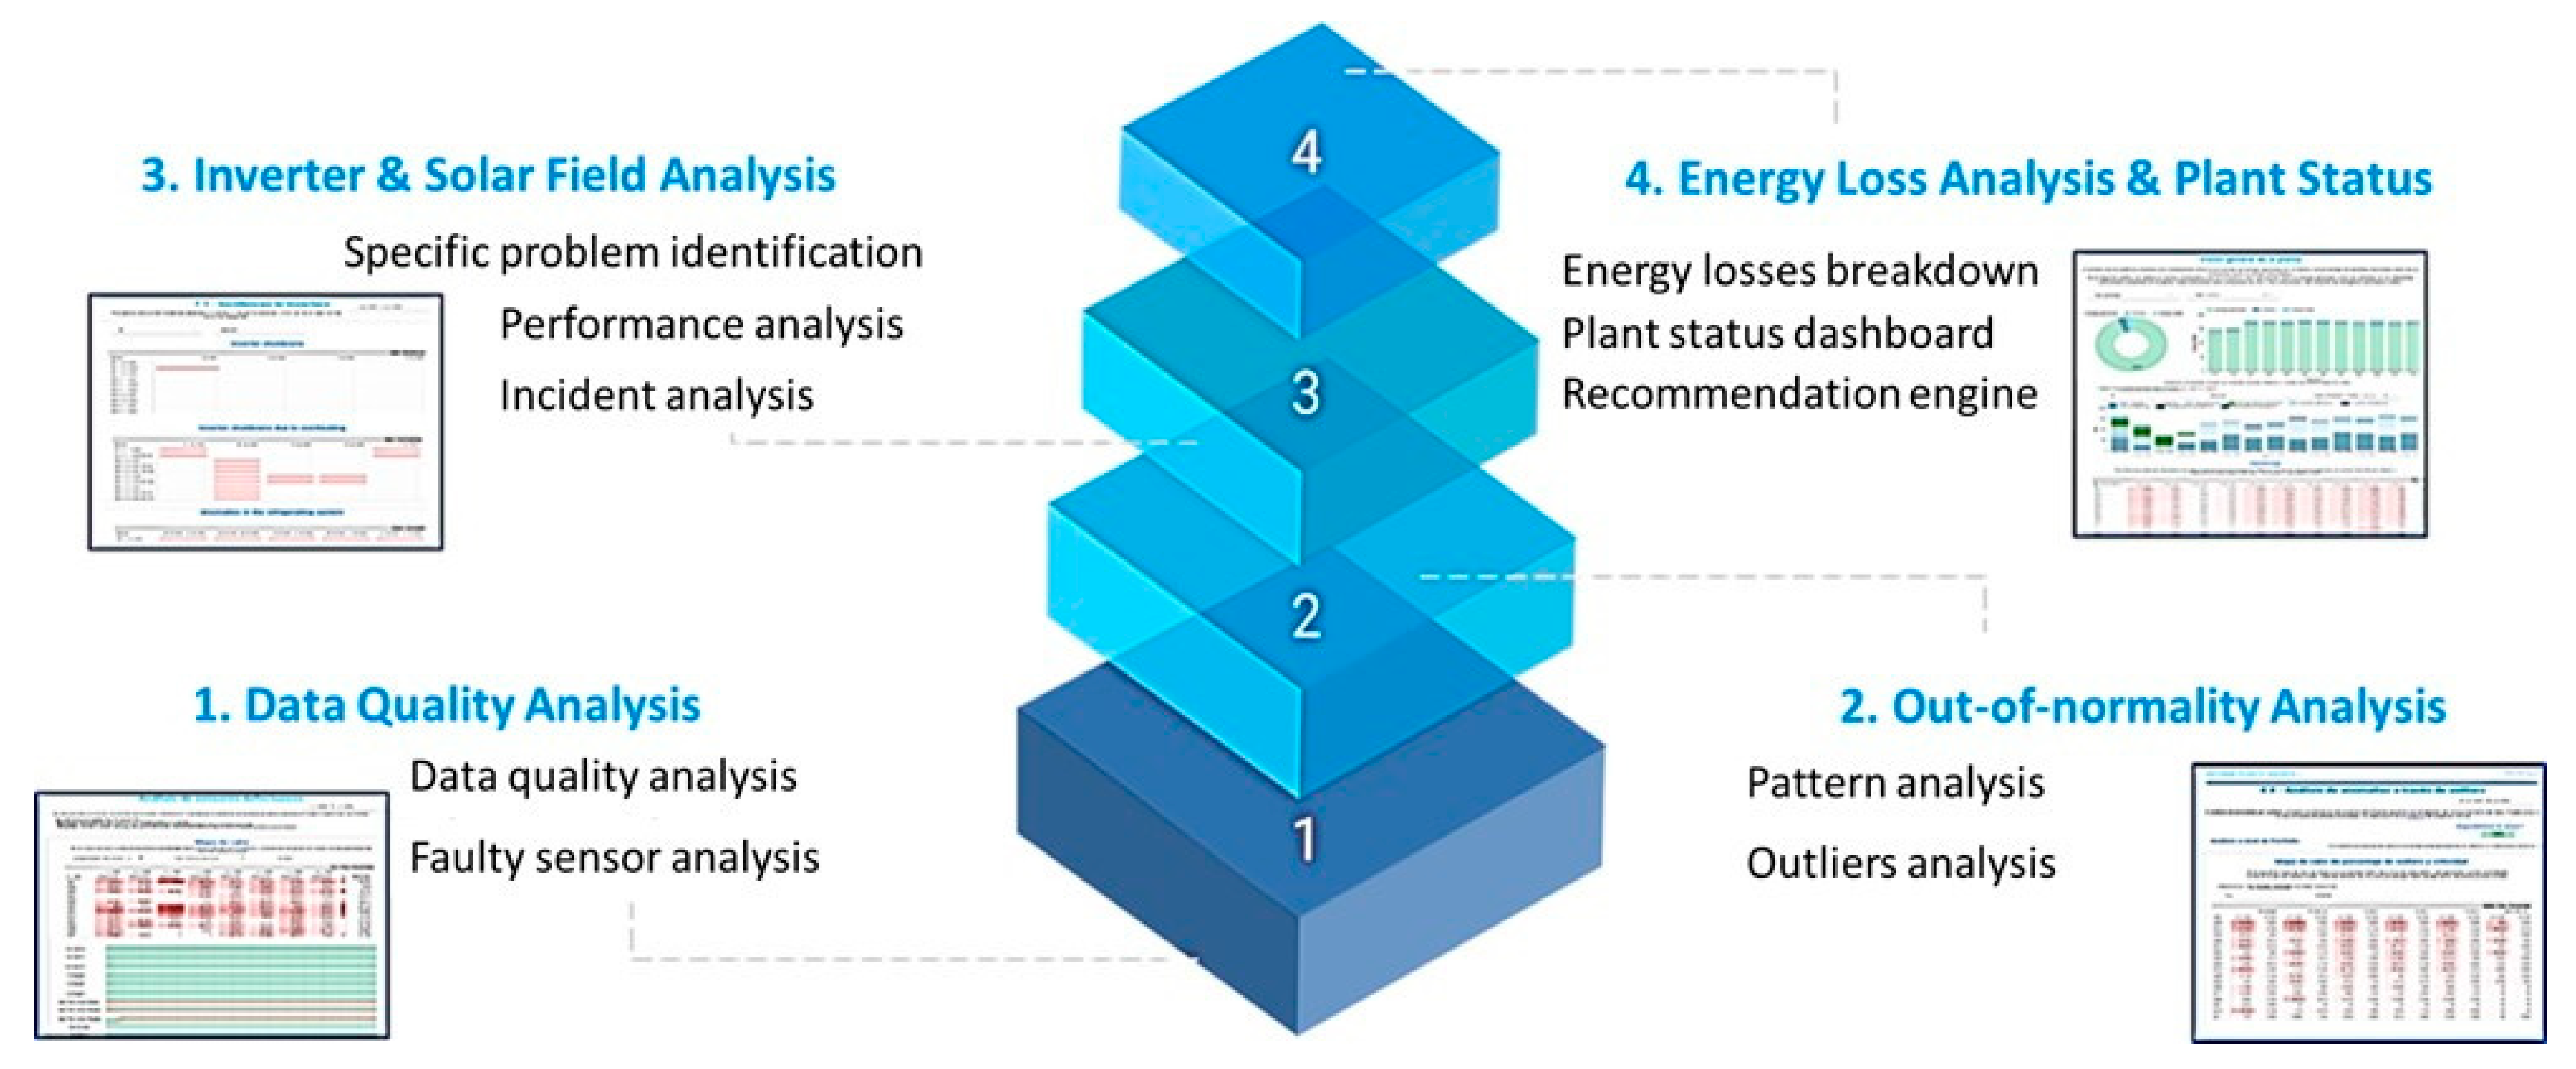
This section presents the methodology followed in this study to develop the cloud-based platform for asset diagnosis and maintenance in utility-scale PV systems. The proposed data-driven solution is based on a modularized architecture to decouple the whole system and allow modules to interoperate autonomously. The architecture, depicted in Figure 1, consists of four layers (modules):
- Data quality analysis;
- Out-of-normality analysis;
- Inverter and solar field analysis;
- Energy loss analysis and plant status.
Figure 1.
Layered description of the proposed cloud-based platform architecture for assets diagnosis and O&M in PV systems.
Figure 1.
Layered description of the proposed cloud-based platform architecture for assets diagnosis and O&M in PV systems.

Initially, the raw data are extracted and stored through an extract, transform and load (ETL) method. The automated daily ETL process is used to extract the data from supervisory control and data acquisition (SCADA) systems like Isotrol’s Bluence [26] and to upload/store them to an analytical scalable database (the Google Cloud platform, in this case). More details are given in Section 2.1.
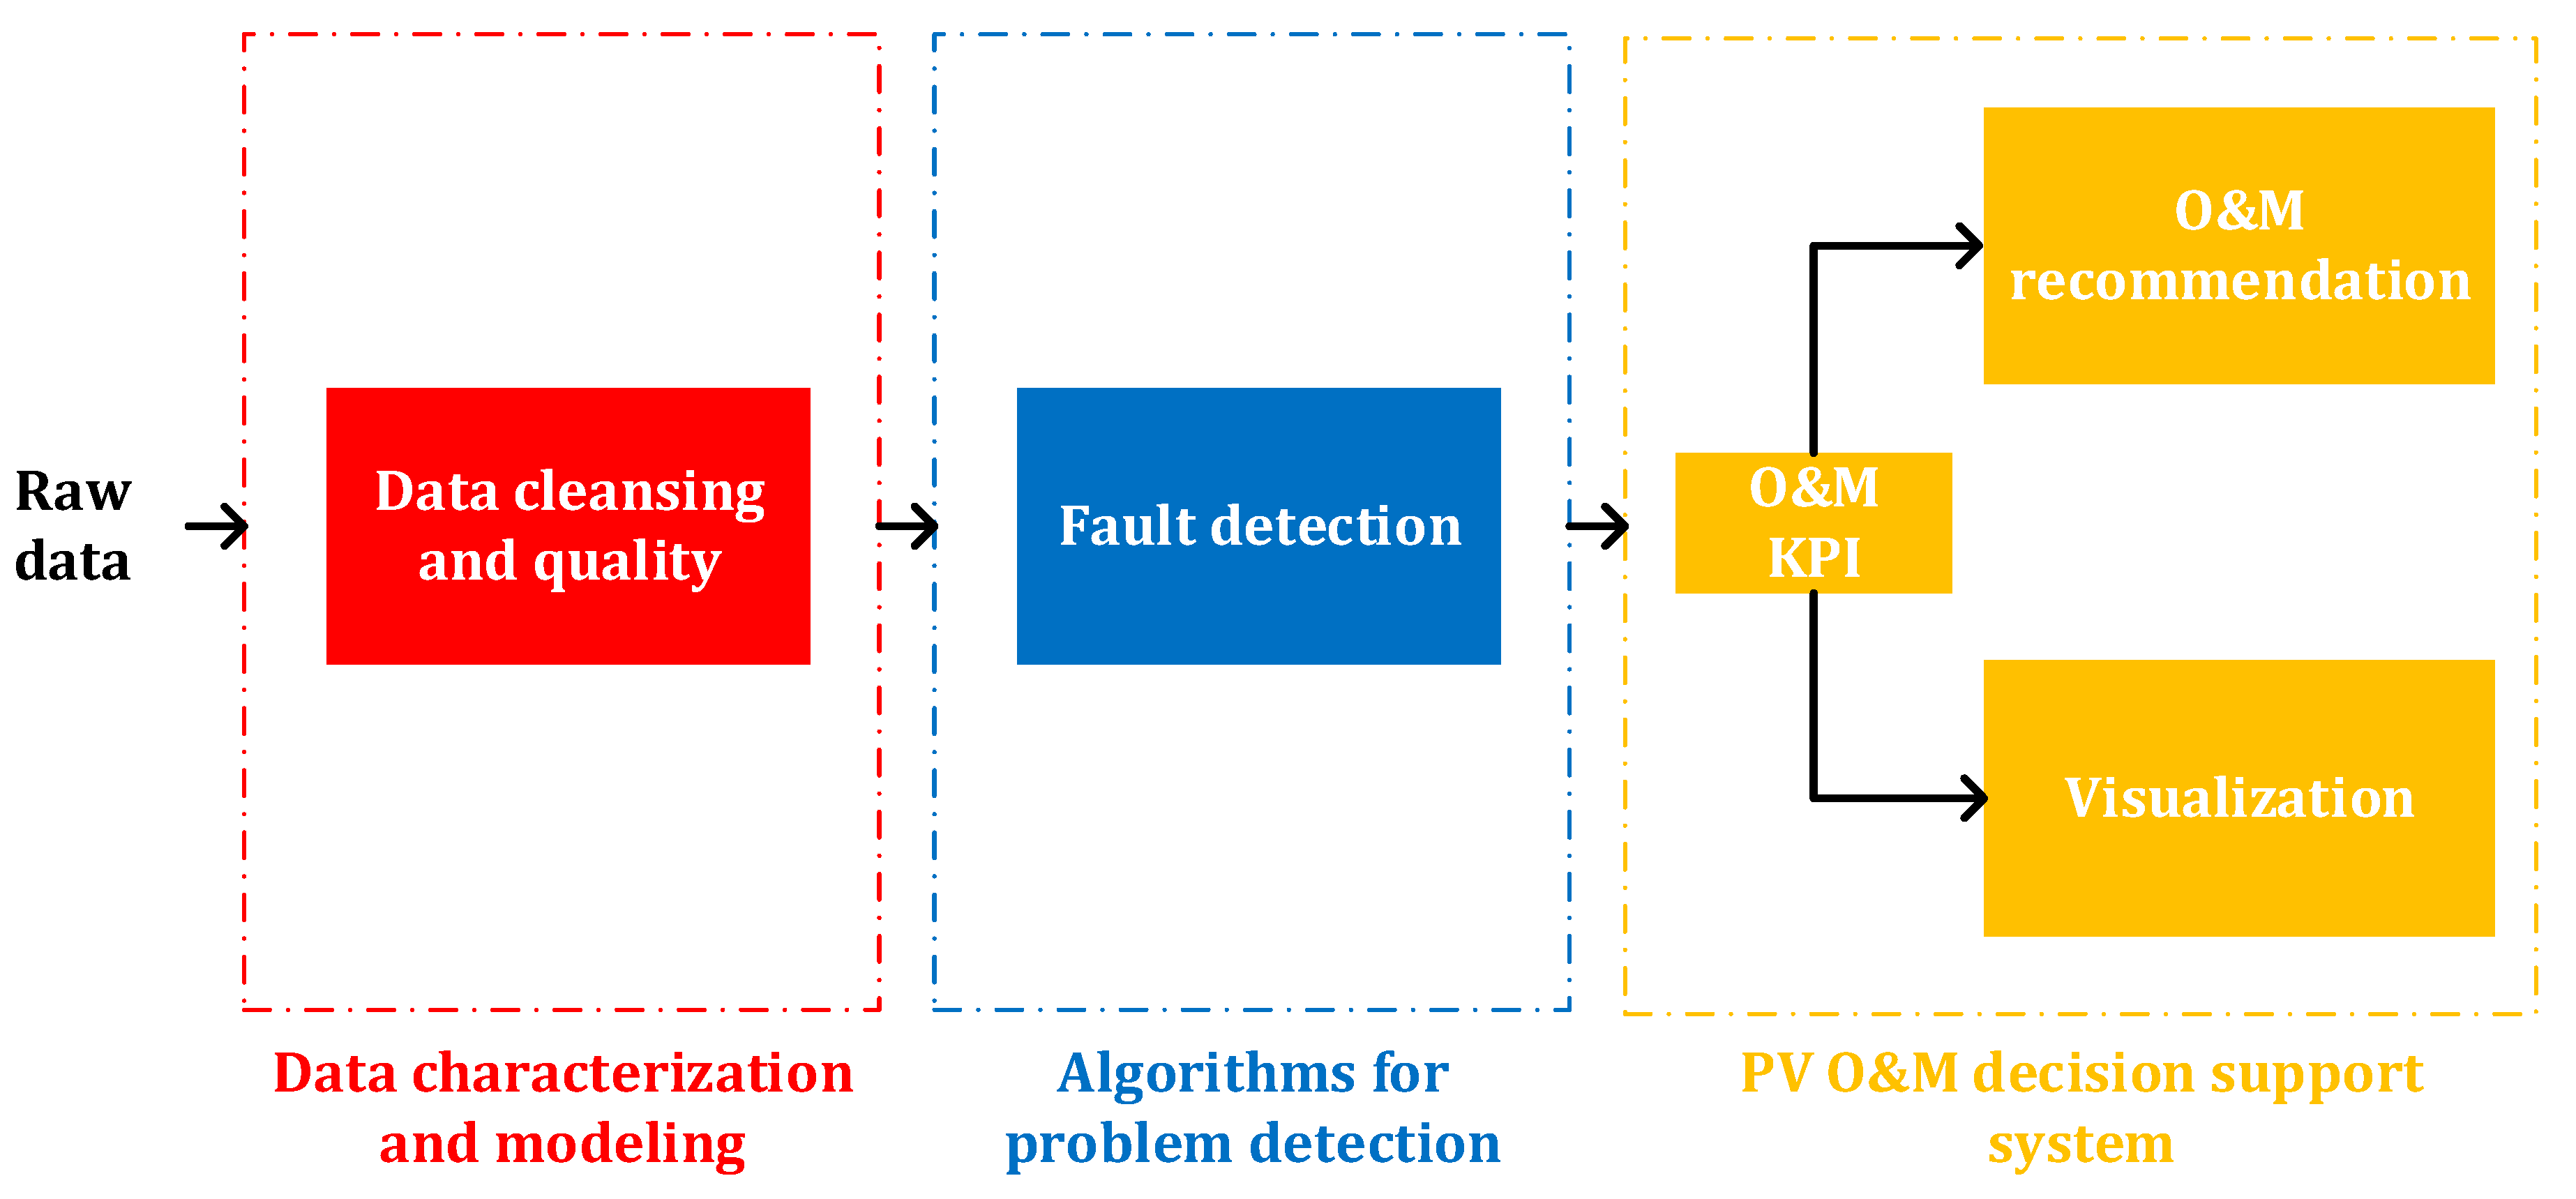
The data are then averaged and pre-processed to provide high-quality data for the execution of fault detection algorithms and generation of O&M recommendation actions (see Figure 2). Once the PV performance is modeled, the decision support system (DSS) extracts initial information on the health and performance status of the PV plant components by analyzing the available monitored data and comparing them with the results from models’ predictions. The cleansed data are then used as inputs in the problem detection step. In this step, underperformance incidents (e.g., failures and performance losses at the inverter and array/string level) causing power losses are detected. The results from the fault detection stage are then used along with O&M key performance indicators (KPI), which can quantify the impact that underperformance incidents could have on the PV O&M activities, for the generation of field O&M recommendations and the visualization of comprehensible results.
2.1. Data Extraction Process, Gathering, Storage and Sharing of Data
The data acquisition process is carried out by a SCADA, from which PV operational and meteorological data are extracted in raw format every few seconds and aggregated into average minute signals. Data, gathered at the SCADA level, are then collected by a script that allows the collection of the relevant data and its reception at the entry of the web-based platform. In this procedure, the communication protocols, which are specific to the SCADA provider that uses the assets of each PV plant, usually through an application programming interface (API), of the cloud service provider are used. When carrying out any communication between processes within the private cloud, authentication based on user permissions (roles, service accounts, etc.) is used for security purposes. The principle of least privilege is used; permissions are assigned so only the action required by the user can be carried out, and no other action is contemplated.
The extraction methodology can be either manual or automatic. For the manual extraction process, a manual intervention is required by an operator to: (a) extract the data directly from the SCADA, (b) download the data, and (c) store the necessary files/data into a computer. Data are extracted into comma-separated values (CSV) file over the course of the reporting period. On the other hand, for the automatic process, a software routine (e.g., creating a tool that funnels data from SCADA system or creating a web-scraping service that allows to automate the whole process when accessing the SCADA management platform of the test PV plant) is executed to obtain the data periodically. The data are then stored in a data warehouse for consultation. For this purpose, an entry point is made available so that the data can be obtained via an API. The data can be used by third parties, who have previously been granted access to them. Additionally, it must be possible to extract the data so that they can be sent to third parties when required.
In this work, the automatic process was followed using a web-scraping tool. This tool is configured to identify data in web environments and to upload it to a different environment based on Structured Query Language (SQL) for their storage and subsequent use. The tool can be easily configured using a set of parameters to define when the data are extracted and at what speed. Data of different granularities (e.g., hourly, daily, weekly, monthly, etc.) can be captured using this methodology. For early fault detection and performance assessment using outdoor field measurements, 10- or 15-min average data were sufficient to acquire high-quality predictions, while also ensuring a low computational load of the systems in charge of data management [27]. In addition, SCADA usually works by default in that frequency range.
Regarding data granularity, this depends on the data acquisition configuration of each monitored PV system. A minimum aggregation of 5 min is recommended when using the data for specific preventative and maintenance algorithms [27]. Existing literature suggests the usage of 1-s format data granularity [28]. However, this volume of data is not recommended, as it could overload the computer SCADA system.
The data can be structured or non-structured depending on the type of data obtained by the data acquisition process. If the data are of the structured type, a structured data warehouse or relational database is used for data storage. The ETL method extracts the data from the source, transforms them and finally stores them in a cloud storage system. On the other hand, non-structured data are stored in a non-relational database or wide-column warehouse. For this type of solution, the data will be immutable.
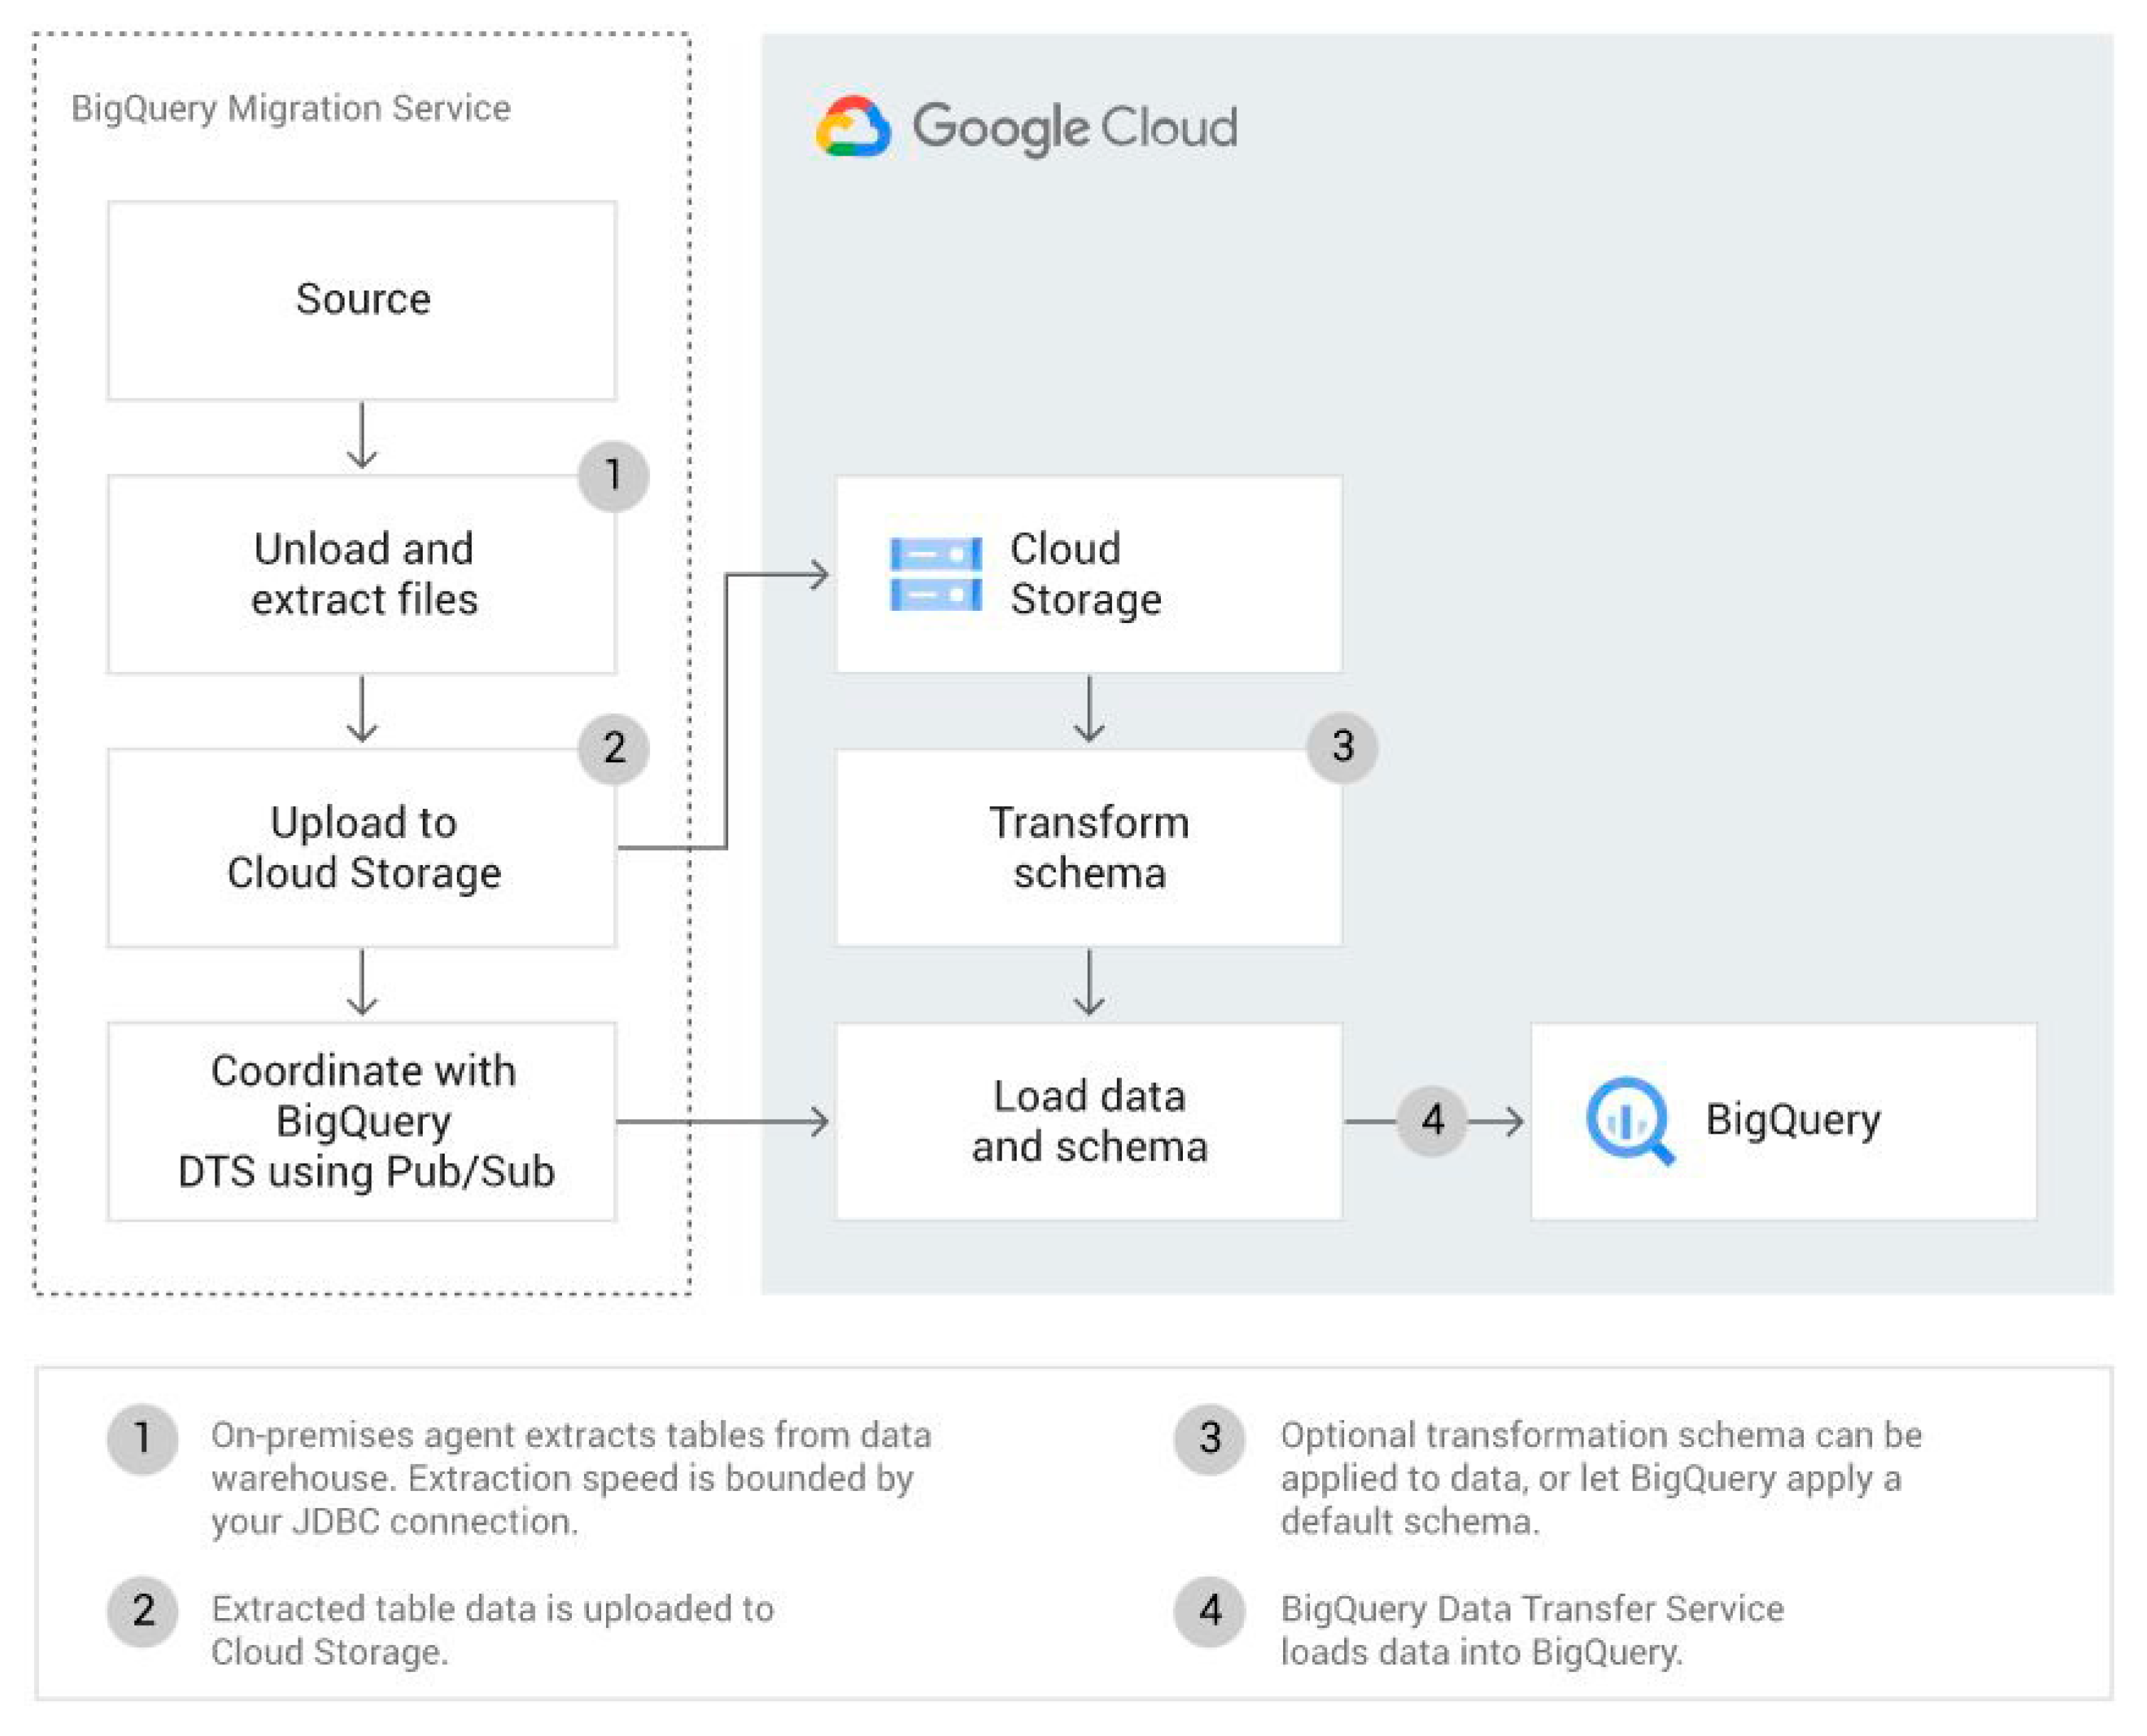
In this work, structured data are expected as inputs to the cloud-based platform. The data are transferred by automatic processes from the SCADA management system to the file storage service. Once the data are present in this service, it is necessary to process and store them in the data storage system (database or data warehouse). Storage of data is carried out using Google Cloud for the proposed platform. Figure 3 shows the Google Cloud data transfer service used to:
- Upload and extract amounts of data from source (e.g., data center, BigQuery data warehouse);
- Upload the data to Cloud Storage;
- Transform data if needed;
- Load data into BigQuery using the Data Transfer Service.
Figure 3.
Data flow between an on-premises data warehouse like Google BigQuery. This process is followed for storage of structured data.
Figure 3.
Data flow between an on-premises data warehouse like Google BigQuery. This process is followed for storage of structured data.

In the case of unstructured data, the data are loaded into a datastore service. This is a document database built for automatic scaling, high performance, and ease of application development. In this way, the developed platform can be adapted to store any type of data.
The volume of the data to be analyzed depends on the number of PV plants, number of variables/signals extracted from the SCADA, and the monitoring and evaluation period. Depending on the data acquisition process, the way the data are shared may be through a manual (e.g., the plant owner provides the data files by email or file transfer protocol) or an automatic procedure (e.g., through API). Finally, the data processing system must allow the analysis and processing of the available data (historical and real-time data) over the selected evaluation period and the algorithms should be executed periodically (e.g., in real time or on a daily/weekly basis).
In summary, the data acquisition is performed directly from the SCADA, obtaining the operational and meteorological data for field PV systems. The data extraction is performed automatically, periodically, and configured according to frequency, granularity, structure, etc. In the event of data extraction failure, the platform creates a warning (i.e., an alarm) that the data are not gathered properly. Once the data are extracted directly from SCADA, a cloud-based provider service is used for secure data storage, sharing and analysis.
2.2. Data Quality Analysis
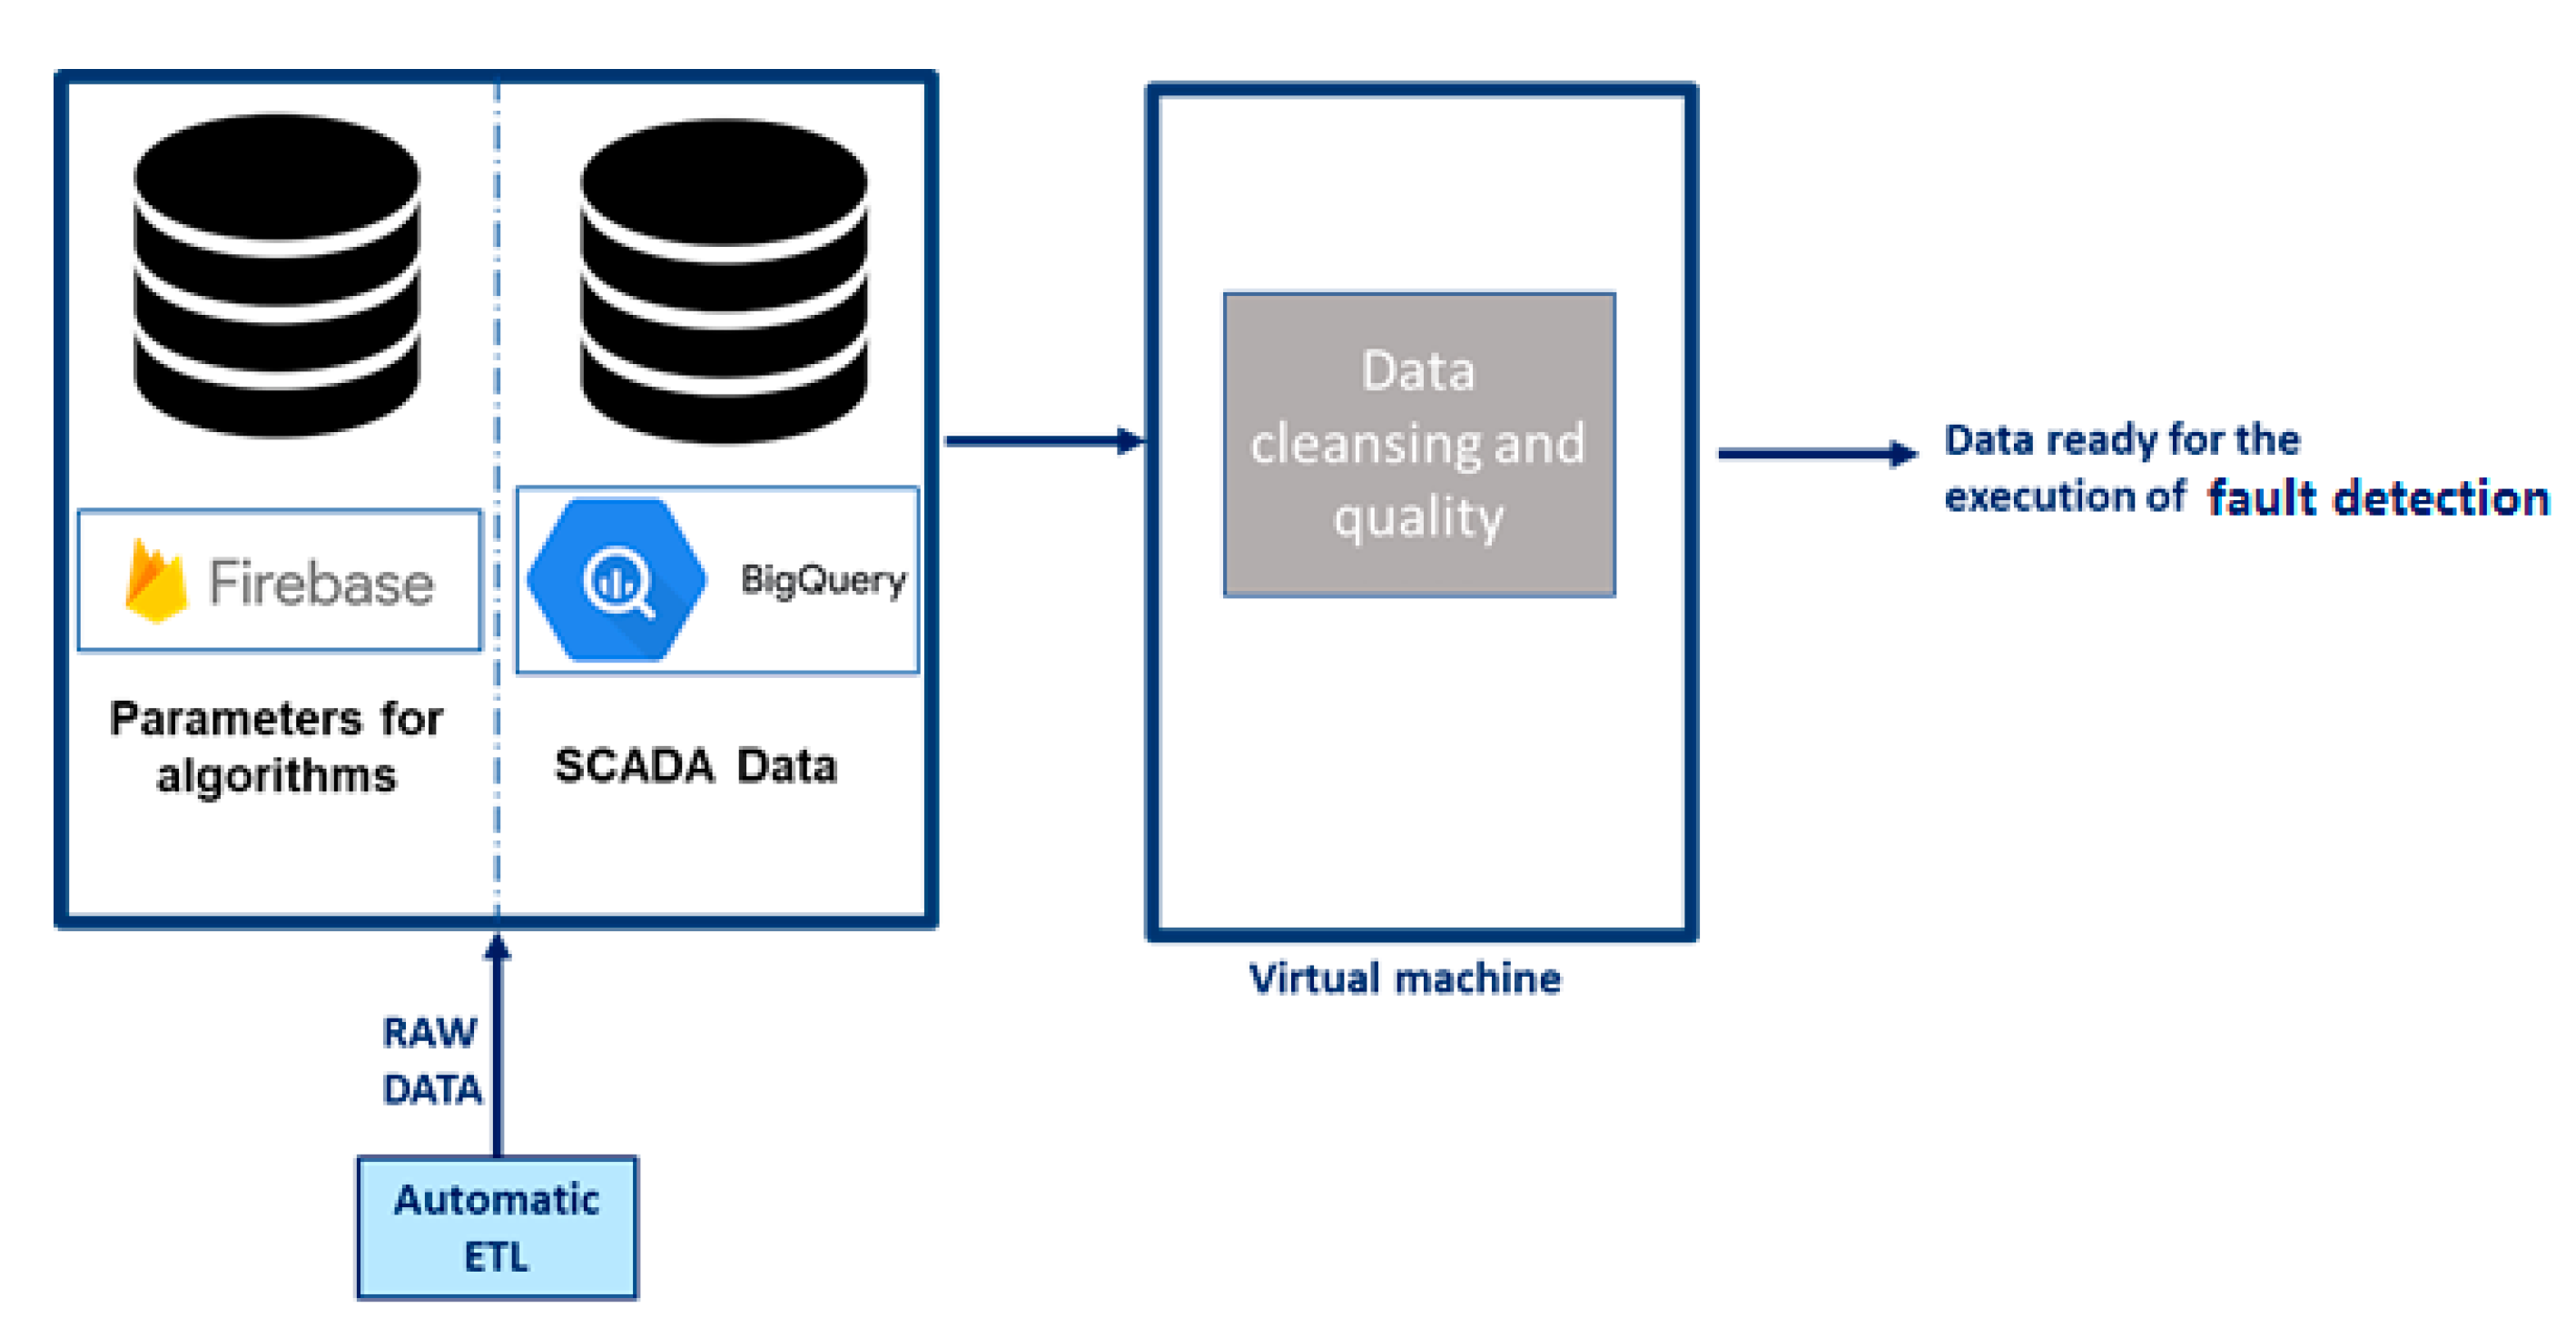
Once the data have been extracted automatically using an ETL method based on web scraping services, the data are then used as an input to a storage service hosted by Google Cloud. The data are stored in a database using the Google BigQuery warehouse, while the parameters for the execution of algorithms are stored on a Firebase powered storage (see Figure 4). Afterwards, data cleansing algorithms (e.g., data filters, imputation and correction techniques, etc.) are applied on the input SCADA data to reconstruct the given dataset and prepare the data for further analysis (e.g., for the execution of fault detection algorithms).
In this module, invalid data (fix data type errors, missing and erroneous values), outliers (data observations that are numerically distant from the rest of the data detected through the application of statistical techniques such as the Tukey test, sigma, and boxplot rule methods), sensors faulty operation (e.g., measurement problems) and failures as frozen data, synchronization, communication, consistency, and data issues (which are common and the most difficult to solve) are detected. The proposed methodology is based on a 5-step sequential approach (i.e., AC-DC cleansing, constant pattern and night-time anomaly detection, isolated outlier detection, and irradiance–power curve cleansing), followed by the aggregation of data and final data statistics (e.g., minimum and maximum values, mean and median values, etc.) and summary analysis [2].
Visualization of the results is provided in the form of time-related plots (e.g., time series by sensor at the inverter level, weather sensor time series and data quality over time) and heatmaps depicting daily/monthly percentage of communication errors and sensor problems.
This module also includes different predictive models to simulate the meteorological parameters (e.g., global horizontal and diffuse irradiance, module temperature, etc.) and electrical (e.g., DC current, voltage and power, AC output power) characteristics of the plant under study. The meteorological parameters are predicted using the meteorological functions described in [29], while the module temperature is simulated using a statistical technique (i.e., Ordinary Least Squares linear regression) [29]. On the other hand, the PV electrical characteristics are simulated using the eXtreme Gradient Boosting (XGBoost 1.6.1 in scikit-learn library in Python) machine learning (ML) technique [30]. The validation and benchmarking of the ML models is provided in [30]. The predictive models used in this study are applied on the cleansed data and visualized using time-related plots (x-t plots).
2.3. Out-of-Normality Analysis
Pattern and outlier analyses on the cleansed data is performed in this module to identify underperformance incidents and equipment malfunctions. The behavior analysis by patterns detects the changes in behavior of the PV system’s electrical and thermal characteristics. To determine the state of normality, the PV electrical and thermal characteristics are predicted using statistical and ML techniques and then compared with the real field measurements [31]. During the normality state, the differences between the measured and predicted parameters are within predefined limits (calculated by considering marginal operational limits, sensors’ and models’ uncertainties [32]).
Outliers in this module (different from the outlying data points detected by the data quality analysis) are detected by statistically comparing recorded measurements of similar elements (e.g., similar subarrays, strings, and inverters) and detecting noticeable discrepancies. Such outliers may indicate fault conditions, data issues and/or maintenance events.
Visualization of the results is provided in the form of heatmaps depicting the deviations of outliers from the mean or the health-state grade (i.e., state of normality, warning, and alert) for the significant measurements at the inverter level and time-related plots (x-t plots).
2.4. Inverter and Solar Field Analysis
Different algorithms are executed in this module to identify inverter failures and root causes (i.e., overheating, clipping, cooling fan failure, late awakening, shutdown and low efficiency) [33], solar field problems (e.g., soiling, bypass diode failures, string dropping, performance degradation and partial shading) [15,34] and PV plant faults (due to blocked trackers, string disconnection, and deficient thermic behavior). One of the main sources of information for determining the root-cause of inverter failures is the analysis of alarms generated by the inverter itself. However, there are cases in which faults or inefficiencies appear in which there is no associated alarm signal; in this case, data-driven algorithms (e.g., ML) are applied for the appropriate classification of the problems. In these situations, the faulty operation of the PV system is detected when the absolute error (AE), defined as the absolute difference between the measured and predicted DC (or AC) power, exceeds a predefined TL, which incorporates the predictive model and sensor uncertainties (defined as the combined uncertainty) [35]. The set TL was calculated by multiplying the power of the array under Standard Test Conditions (STC) with the combined yield uncertainty of the model, which was calculated by deriving the partial derivatives of the model’s inputs [32]. The energy loss for each fault type was also estimated in this step (by converting the power difference between the predicted and measured electrical signals into energy).
Inverter-related problems are mainly detected using a comparative algorithm that compares either the output of similar size rating inverters or the measured production against the predicted one [2]. Inverter shutdown or manual stop is detected when the power production of the inverter was near zero during hours above the generator’s minimum irradiance threshold [36]. It can also be detected by combining signal (measured or prediction) and alarm analysis at the inverter level. Inverter shutdown due to overheating is detected when an inverter shutdown failure is detected, and inverter disconnection is caused by high temperatures in the power electronics. Late awakening is detected in the case of inverter losses due to late start-up, while inverter clipping is detected when the output is limited by the capability of the inverter. Finally, inverter efficiency is calculated for each data record from the AC-to-DC power ratio.
For solar field problem detection, a detailed methodology for diagnosing faults and performance losses is described in [15,29,34,35]. More specifically, losses occurring in the DC side of the PV system are calculated using the capture loss analysis [37]. Such losses include short- and open-circuit faults, ground and line-to-line faults, shading losses, and blocking diode failures. Losses due to panel degradation (e.g., aging) can be estimated based on a regression of the DC power over the long term, after omitting those points previously classified as non-normal, compared to the manufacturer’s specification. In parallel, specific devices (such as Mars optical soiling sensor by Atonometrics, DustIQ by Kipp & Zonen, I-V curve tracer), soiling stations and/or two-sensor systems (at PV cell or module level), where one of the sensors is cleaned regularly (manually or automatically), are used to estimate the soiling losses [38]. In the case of the unavailability of dedicated soiling sensors/station, the soiling losses are estimated using the scalable method proposed by Deceglie et al. [39]. This method extracts soiling rates from PV production data, while also eliminating incidents and nominal losses, in periods of time without rainfall longer than 14 days. PV plant problems and specifically disconnected strings are identified by comparing outputs of similar strings and applying the Tukey test [35]. Statistical comparison of similar strings is performed to detect fault occurrences due to string disconnection [2], while other solar field problems (such as performance below best behavior) are detected from the deviation between the actual behavior of the devices with respect to the manufacturer’s specifications. To carry out the performance deviation analysis, the irradiance measurements are restricted from 600 to 1300 W/m2, while the power measurements are temperature corrected using the available ambient/module temperature data. This is done to resemble the field conditions to the STC established by the manufacturer. The solar field yield is thus calculated at the stringbox level for each field from the ratio of the produced DC power from SCADA data to the DC power production calculated using the manufacturer’s specification and measurements of irradiance and temperature.
Visualization of the results is in the form of time-related plots (x-t plots), scatter plots of two parameters (x-y plots), and heatmaps (e.g., inverter daily/monthly performance, solar field performance at the inverter level).
2.5. Energy Loss Analysis and Plant Status
An overview of the plant under study is provided in this module. It includes performance analysis, details regarding the plant status (i.e., a heatmap showing the overall status of the investigated PV plant), a breakdown of the losses, incident criticality evaluation based on the Failure Mode, Effects and Criticality Analysis (FMECA) method [21], alarms and recommendations generated for optimizing the O&M activities in PV systems. Visualization of the results is provided in the form of heatmaps (i.e., heatmap showing losses grouped by inverters), bar graphs, and circular diagrams showing the produced energy and losses breakdown, and time-related plots (e.g., PR time series plot), as well as list formats (i.e., table of sorted recommendations for the detected incidents).
The performance analysis is divided into inverter (power electronics) and solar field (PV modules and strings) incidents, and combines several parts, such as the study of behavior by patterns (ML models) and the study of outliers (deviation of the signals with respect to their peers), the statistical analysis of SCADA alarms, and the detection of specific incidents of the inverter and solar field.
For the energy loss analysis, irradiance data, predictive models and fault detection algorithms are required. The performed analysis focuses on analyzing how the PV energy production is affected by different problems and faults that can happen during the PV plant operation and quantifies how these problems reduce the output power production.
Once the data have been acquired, modifications of the results are performed. For the results obtained from the tracker blocking and string dropping (both occur at stringbox level), a column with the name of the inverter is created. The start and end time of the incidents are also provided, while the average radiation is then estimated. Low-irradiance conditions are detected by using a threshold of 250 W/m2 to assist the fault classification process.
The data obtained from the inverter incidents are then modified, placing a “1” or “0” for the occurrence or not of an incident. Afterwards, the current prediction data at the stringbox level are used to estimate the current prediction values at the inverter level. In this step, the data are grouped by inverter and date. The summation of the current values and its prediction is also derived.
After all of the modification, the final dataset is created, having all the necessary data and information for the loss calculation. To calculate soiling, inverter shutdown, clipping, temperature-caused shutdown, manual stop, late start, tracker blocking and string dropping losses, the difference between the predicted and measured DC power is calculated.
The inverter losses, calculated from the difference between the prediction and the real/measured signal, are then distinguished into two categories: inverter efficiency deviation and manufacturer losses. When no incident is detected and (1) is “True”, losses by inverter efficiency deviation (ninv_dev) are calculated on the basis of (2):
where ninv is the inverter efficiency of the manufacturer and active power of the inverter is determined by the value of the power provided by the PV system and the performance of the inverter.
DC power × inverter efficiency of the manufacturer > Active power × 1000,
ninv_dev = DC power × ninv − (Active power × 1000),
When there is no incident and (3) is “True”, inverter efficiency losses by the manufacturer (ninv,losses) are estimated by (4):
DC power > (Active power × 1000),
ninv_losses = DC power × (1 − ninv),
To calculate the power in MW (and hence the energy in MWh) for each of the use cases, the following procedure is performed: (a) group by day and element (inverter), (b) convert power to energy, and (c) use Equations (5)–(7). The produced energy (Eout) is first calculated from (5), followed by the estimation of lost energy for each fault type (i.e., inverter shutdown, temperature-caused shutdown, late awakening, temperature dropout, manual shutdown, manufacturer’s inverter efficiency/deviation, string dropout, tracker lockout, and soiling) using (6).
where ECF is the energy conversion factor, which depends on the recording interval of field data (e.g., the ECF is 12 for 5-min data) and W_KW_MW = 1,000,000.
Eout = Σ DC power/(ECF × W_KW_MW),
Loss classification = Σ Loss class/(ECF × W_KW_MW),
Other causes = Σ predicted DC power − Σ DC power − Σ Loss class/(ECF × W_KW_MW),
The percentage loss associated with each fault type by day and inverter is thus calculated. If the percentage loss is ≥25%, it is considered to be an “ALARM”, between 15% and 25% it triggers a “WARNING”, while for values < 15% it is considered to be “OK” (normal).
Finally, if the analyzed day have low irradiation, the dataset is unified with the one that defined earlier for low-irradiance conditions. During low-irradiance conditions, the classification of the percentage loss is set directly to “OK”.
Once the analysis of the time series is finished, the table that defines the boundary conditions is constructed (i.e., the average irradiance and the percentage of daily data). To do this, the initial data are used, grouped by day and observations (how many non-zero values exist), and divided by the number of data points that should exist.
The output of the missing energy algorithm returns four sets of data (i.e., bar graph of energy, energy temporal series, energy radiation data and general energy produced) for visualization purposes, depicting the produced energy, amount of lost energy per element and per type, and the ranking of elements according to their energy losses and causes.
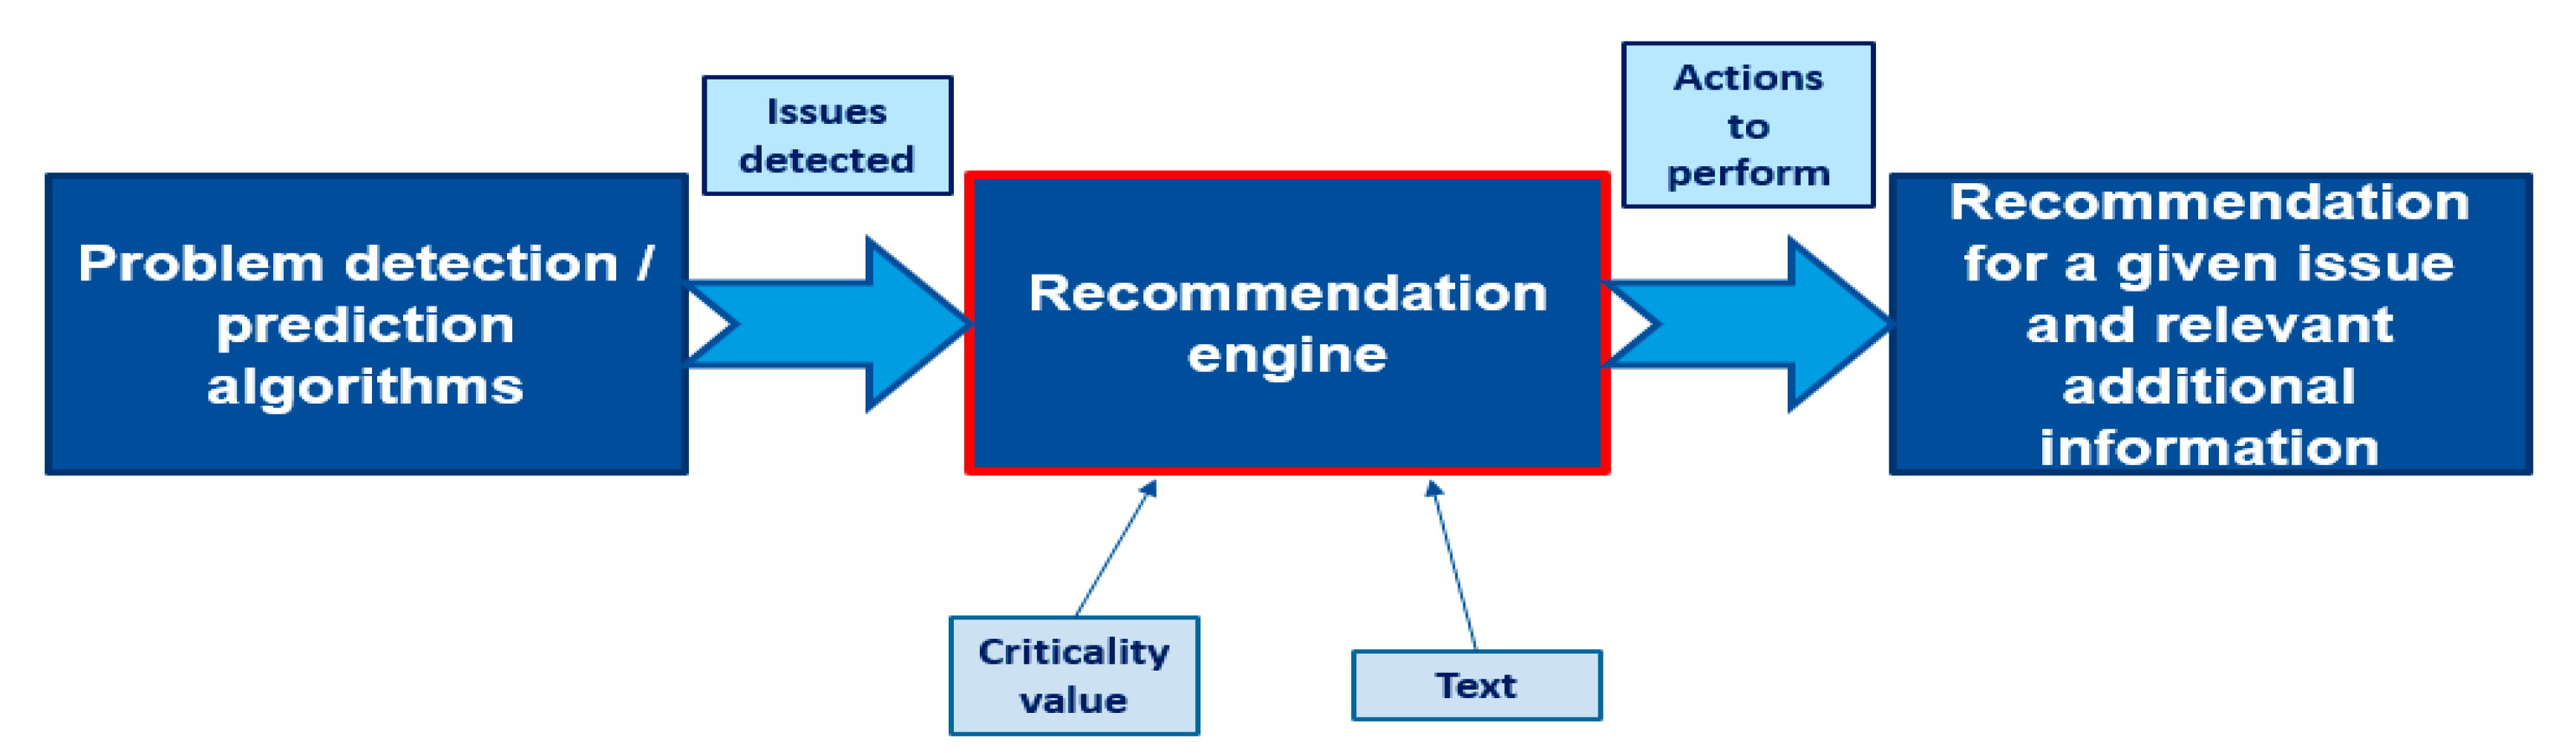
The results indicating inverter and solar field faults are then used as inputs to a recommendation engine responsible for transforming underperformance events into actions to be conducted by the O&M team (see Figure 5). A criticality value along with a text format are used as inputs to the engine for the generation of O&M recommendations. The list of text-based database of suggestions and actions allow the transformation of detected failures into readable actions or information provided to O&M personnel for the test PV plant.
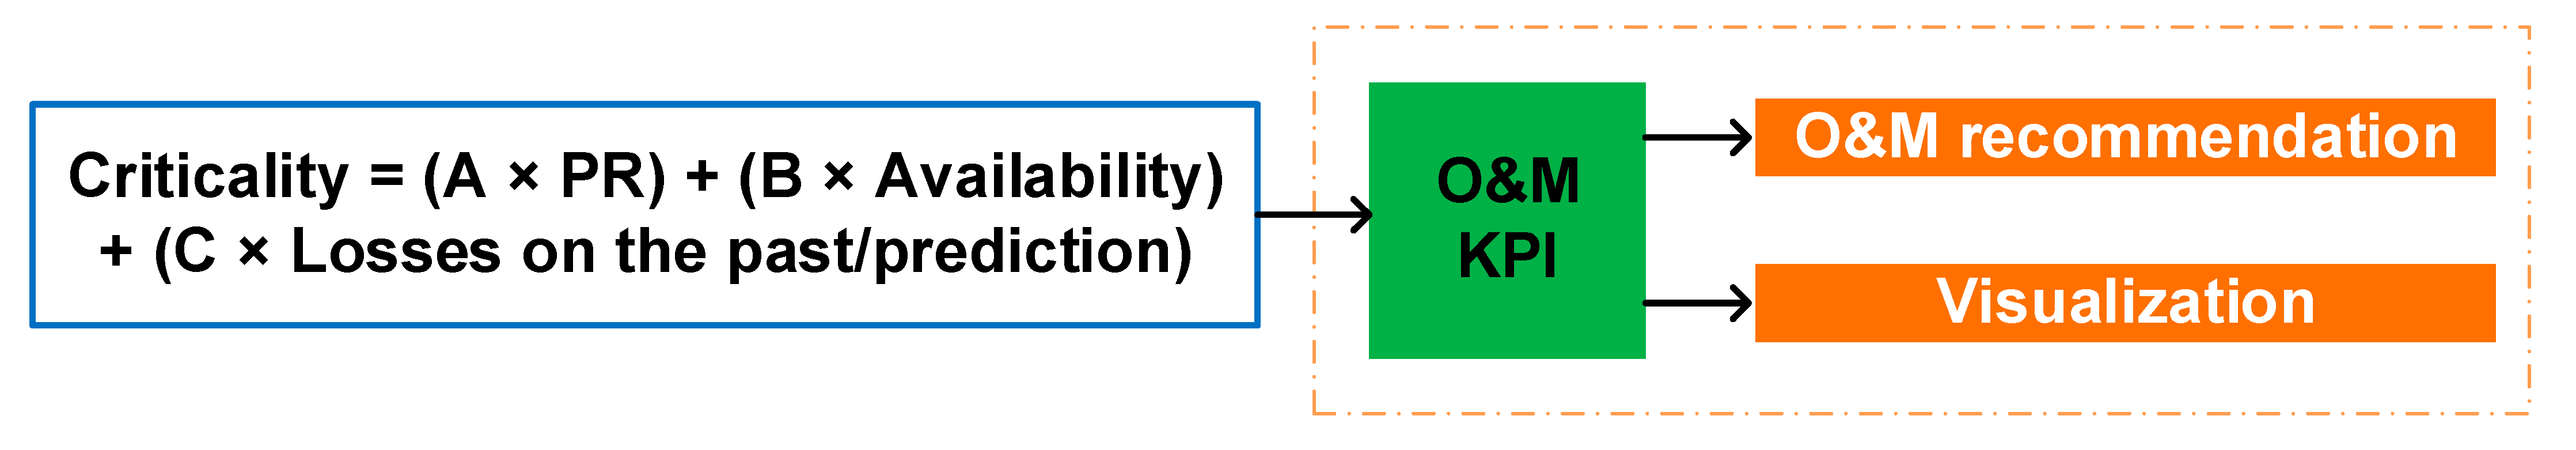
For proper scheduling of O&M activities and creation of a recommendation engine that will help operators to take the right mitigation actions at the right time, KPI are defined. The O&M KPI are defined according to the real requirements and necessities of the plant operators, allowing them to use information such as the past losses, availability and performance ratio (PR). The O&M recommendations are then sorted using criticality as the key element (see Figure 6). The criticality encompasses several other variables, such as the impact of failures on availability, detectability, severity, probability of occurrence, and financial metrics (e.g., repair cost and time), and finally generates a sorted list of corrective actions to be implemented.
The generation of recommendations is a deterministic process, in which a set of relations are defined for each signal along with the related attributes (such as the subsystem it refers to) and potential problems that could be assigned to indicate abnormality in the signal under study. An intermediate configuration file, in which problems and signal anomalies are matched, is used for this purpose. Using these relations, a dynamic criticality table is prepared and used for the calculation of values for this variable assigned for each fault use case. The final relation is translated into a table that uses the proposed key metrics and variables to consider for each of the problems, calculating a parametrized value for the final criticality according to the pondered value of each of the considered parameters. Each parameter will have an assigned value, ranging from 0 to 1, and all of them are considered for the calculation of the final criticality value.
To generate the list of recommendations, the engine is connected to the different modules in which the algorithms for fault detection and energy loss analysis are executed. The outputs of these algorithms are standardized to simplify the transformation of the analysis into text containing the best course of action for optimizing the solar farm operation while performing the required maintenance activities.
The recommendation module is the top layer that consolidates all the information generated in the different previous algorithms for fault detection, in addition to the algorithms responsible for the definition of the health-state status of the PV plant. The results of the different analyses are performed in virtual machines (VM), uploaded into a shared folder powered by BigQuery (v. 1.39.0), and then used for the generation of the recommendations.
In summary, the recommendation system provides a list of all the detected failures, prioritizes the actions, and recommends which fault incident should be solved first based on the assigned criticality value. The list of outputs accessible by end users (through the interface) include the:
- Inverter (indicating the inverter code);
- Subsystem, which states the component in which the fault or incidence is present, and depends on the monitoring system level;
- Detected incident (specifying the issue or problem that was detected);
- Start and end date (stating the date in which the problem was identified and date that the issue was resolved);
- Number of days after the start date in which the problem has not been solved; and
- Criticality (the value that was extracted from the table for criticality assignation using KPI).
In addition, three more fields are presented to end-users, (which are related to feedback management):
- “Recognized”; this flag indicates that operators are working on the detected issues suggested by the recommendation tool;
- “Solved”; this flag indicates that the fault was resolved; and
- “Additional info”; this section provides access to additional information regarding the problem and allows end users to provide feedback about the recommendations.
The recommendation visualization screen includes a feedback gathering and management tool for the proper interaction with asset managers and O&M personnel, to ensure the proper provision of recommendations and actions. In addition, bidirectional communication between the solution and O&M is established, allowing notification of issues that are being worked on, notes and files worth sharing with other O&M operators, and any other relevant information that could prove to be useful for the management of O&M services.
Once the field data have been processed by the performance, fault detection and energy loss algorithms, the results are stored in the data warehouse.
2.6. Cloud-Based Platform Development
The architecture proposed for the final solution was defined and implemented by ISOTROL (i.e., a Spanish company providing monitoring and control services to the energy sector) by setting up a Google Cloud environment. Different services were used to allow the execution of code in this environment, offering a robust, secure, cost-effective, user-friendly, and high-performance platform. Services such as Google Compute Engine (VM to process data using algorithms written in languages such as Python or R), Cloud Function (to execute code without the need for a server), and Google BigQuery (as a massive data storage or DataWarehouse), among others, were used to allow the proper implementation of the DSS.
A centralized platform was developed by selecting the Google Cloud platform (GCP) as the provider of the infrastructure as a service to support the tool. The platform is available through the Internet and credentials are required to access the user account. GCP offers a series of advantages including custom machines (e.g., it allows you to configure the optimal combination of virtual memory and central processing unit for your workload), better pricing, fast data restoration, user load management and increased speed [40].
The proposed architecture was integrated into the web-based platform in a report format. The system is presented in an organized structure, and it is divided into seven different categories (1. Energy loss and plant status, 2. Incidents in inverters, 3. Incidents in the solar field, 4. Out-of-normality and pattern analysis, 5. Outliers, 6. Alarm analysis, and 7. Sensors and data quality), simplifying the process of searching for a specific event and/or fault.
2.7. Validation
The developed platform was experimentally validated using a 1-year (January to December 2021) PV dataset that contained historical field measurements from a PV power plant of 10.09 MWp (currently monitored by Tegnatia) installed in the Mediterranean region (Köppen–Geiger photovoltaic climate classification DH; temperate climate with high irradiation) [41]. The PV plant comprises of 38,344 poly crystalline silicon PV modules (36,064 × 260 Wp JINKO + 2280 × 315 Wp TRINA), 10 inverters (9 × 1000 kW + 1 × 630 kW ABB) named “B”, “C”, “D”, “E”, “F”, “G”, “H”, “I”, “J” and “K”, and 68 stringboxes. The system is grid-connected, and it is installed in an open-field mounting arrangement at a fixed tilt angle of 25°.
The system is connected to a data-acquisition platform, which is used for the monitoring and storage of meteorological and PV operational data, according to the requirements set by the IEC 61724-1 [42]. The data are stored as 10-min averages on the GCP scalable database (Google BigQuery, Mountain View, CA, USA). The meteorological measurements include in-plane irradiance, wind speed and direction, relative humidity, module, ambient and insulated-gate bipolar transistor (IGBT) temperature. The PV system’s operational measurements include the string current, inverter DC current, AC and DC voltage, DC power, and active, reactive and apparent power. Due to unavailability of dedicated soiling sensors/station, the soiling losses of the test PV plant are estimated using the scalable method proposed by Deceglie et al. [39].
3. Results and Discussion
Results from the benchmarking procedure of the platform on an operating large-scale PV system of approximately 10 MWp are presented in this section over a 1-year period (1 January 2021–31 December 2021). The presented results were exported from the developed cloud-based platform (i.e., the Bluence Asset Performance Diagnosis developed by Isotrol). Discussion and comments about the results are also provided in this section, along with future research directions.
3.1. Data Quality Analysis
Initially, data cleansing (i.e., AC-DC cleansing, constant pattern detection, night-time anomaly detection, isolated outlier detection, and irradiance–power curve cleansing) algorithms were applied on the historic raw field measurements to detect sensor measurement problems and communication problems. In this context, the data issues analyzed were as follows:
- Communication errors: with the plant, inverter and/or a sensor;
- Saturation: when the sensor has a limit value within the operating range of the variable it measures;
- Frozen: when the sensor remains constant within the precision range with which the measurement is taken or stored;
- Inverter and stringbox coherence: the DC current and power are compared between the input of the inverter and the aggregation at the output of its solar field; and
- Tracker blocking in the cells of the meteorological station: the measured irradiance describes a daily curve analogous to a blockage of trackers in the solar field.
By post-processing the available data, communication errors and sensor problems were detected during the evaluation period. The average daily percentage of these issues was less than 0.05%, while the main detected problems were inverter and stringbox coherence failures and saturation of AC Voltage.
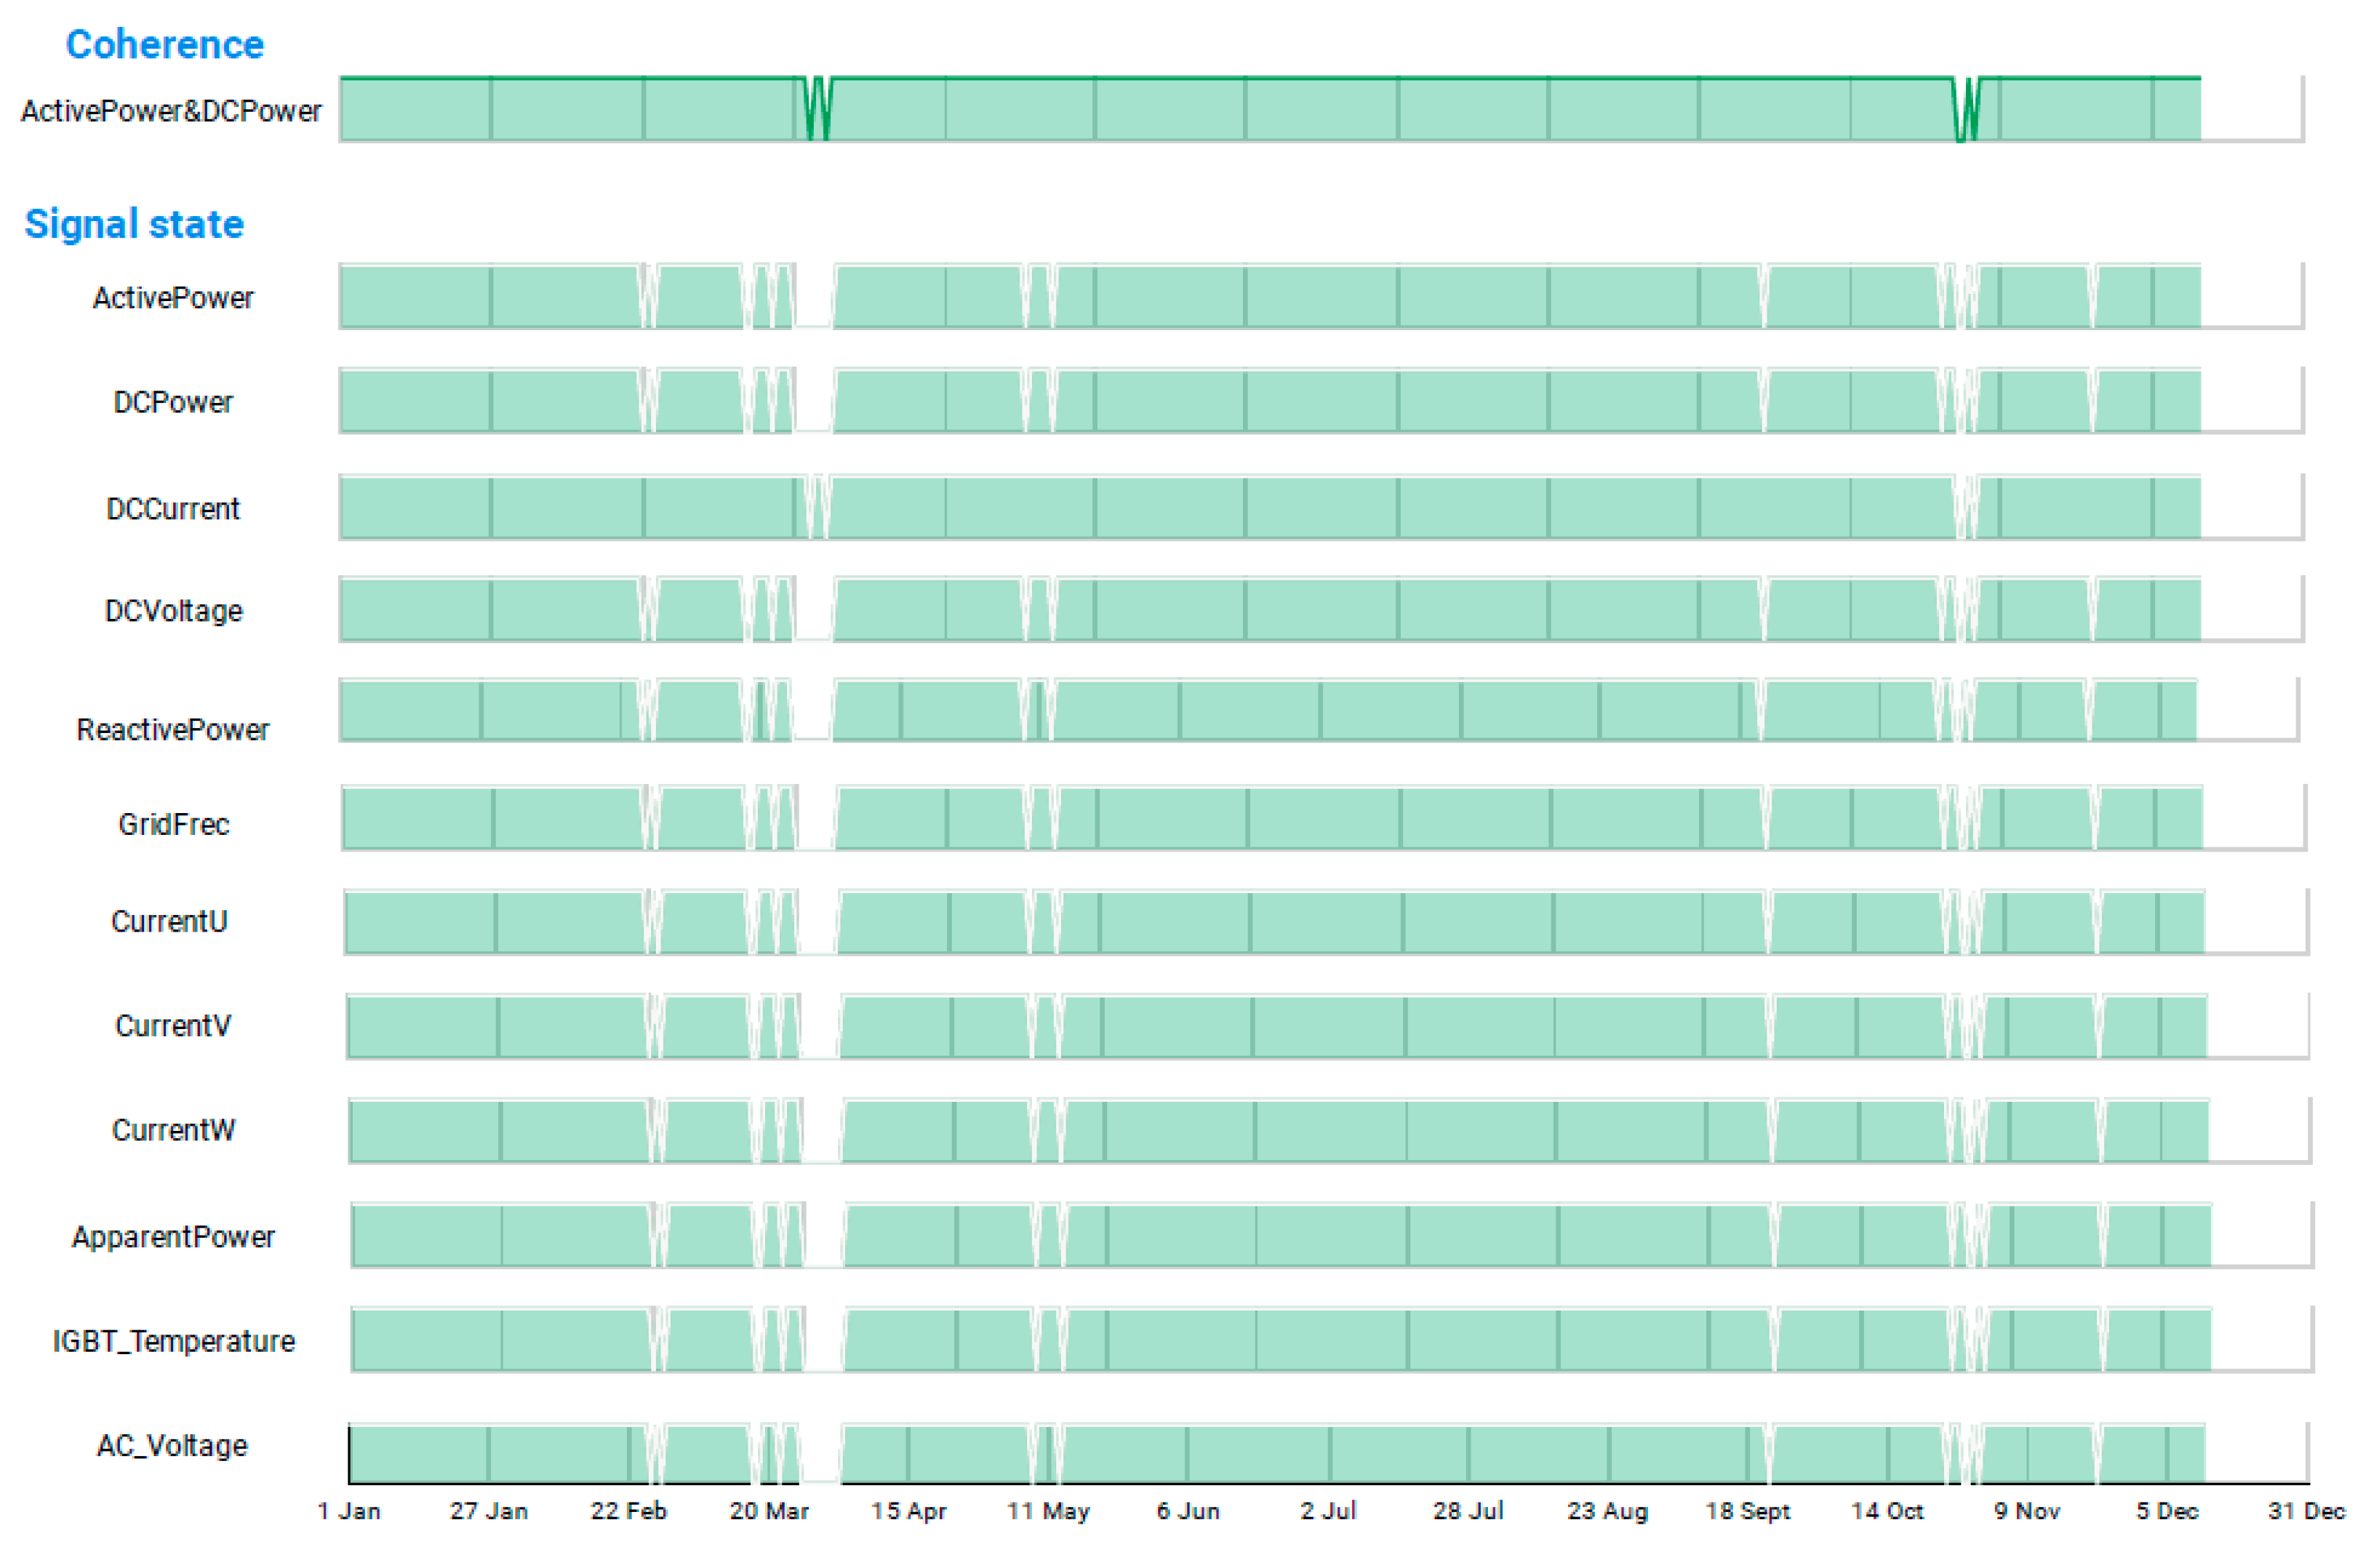
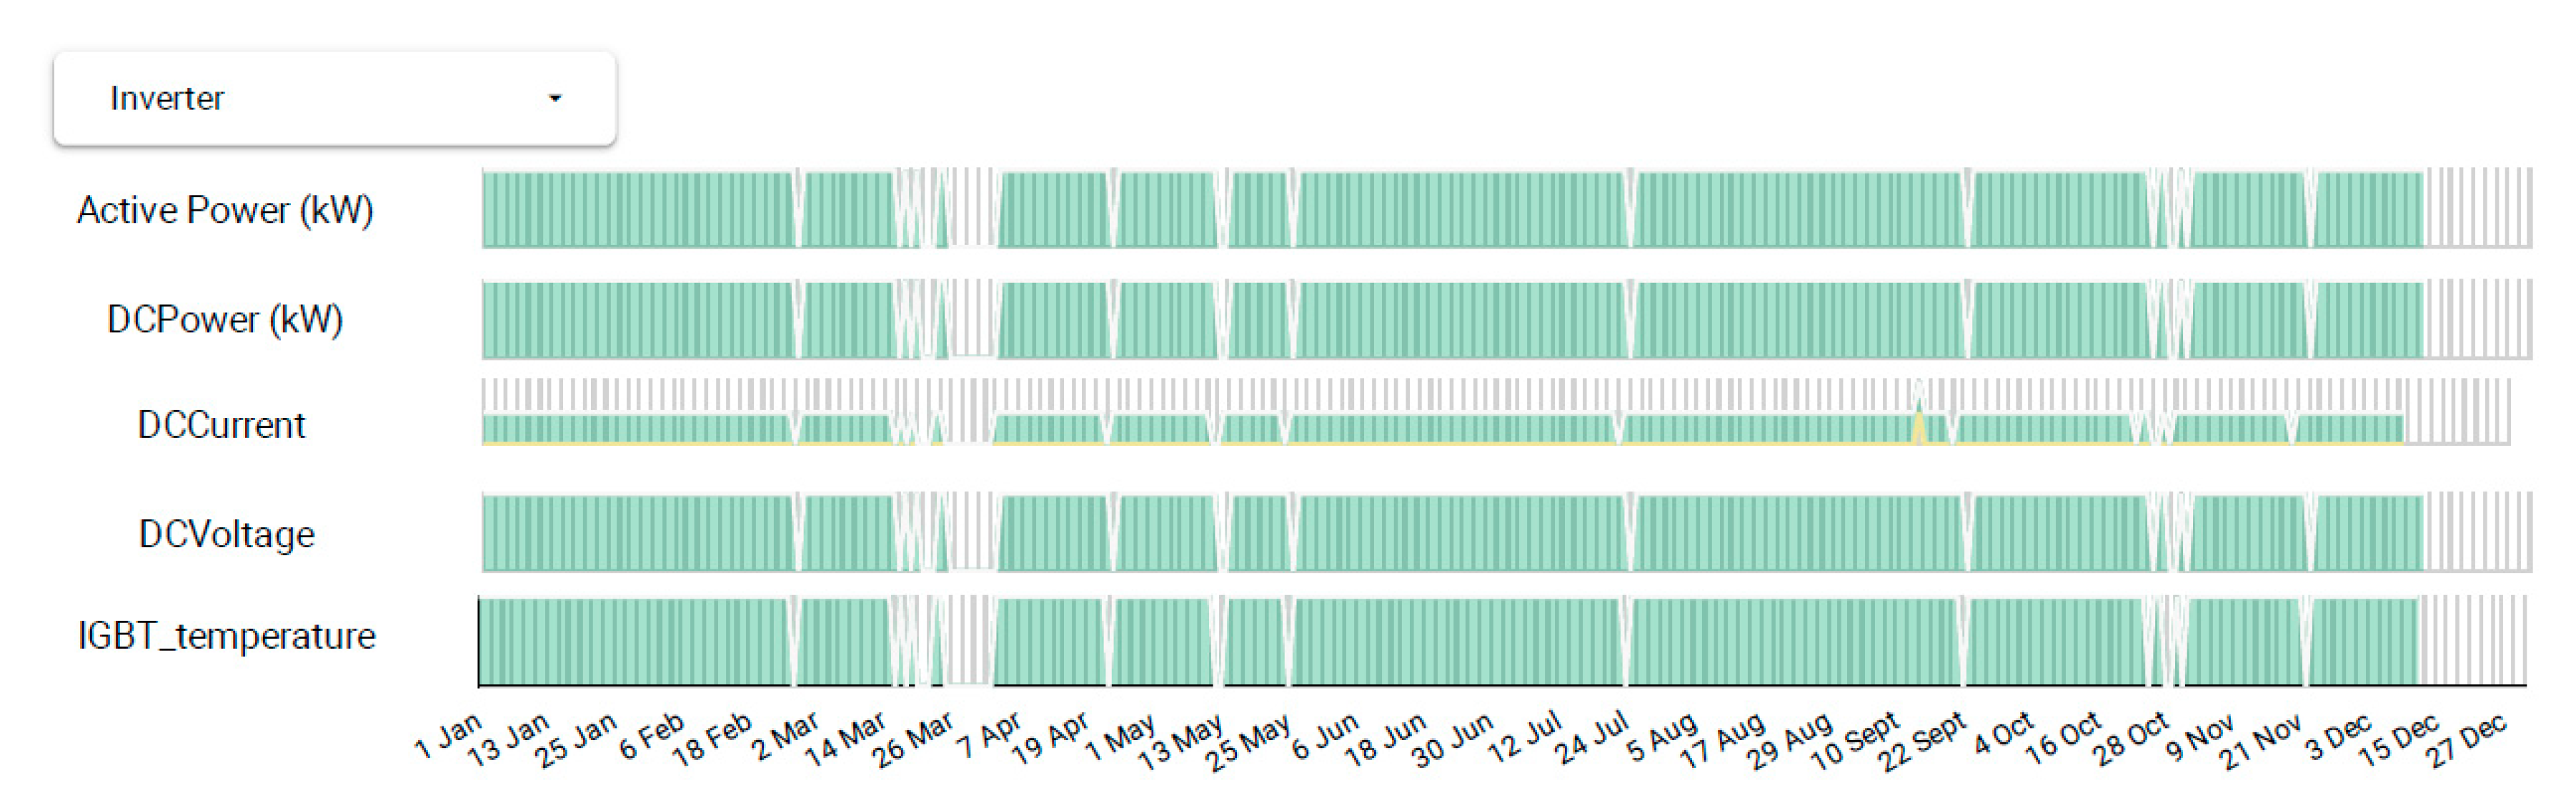
To examine at which signal problems occurred frequently, a time plot by sensor at the inverter level was used (see Figure 7), which shows the timeline of detected data issues along with the affected signals. The detected problems at the inverter level (null days colored in white in Figure 7) mainly occurred in February, March, May, and September–December, and all signals were affected.
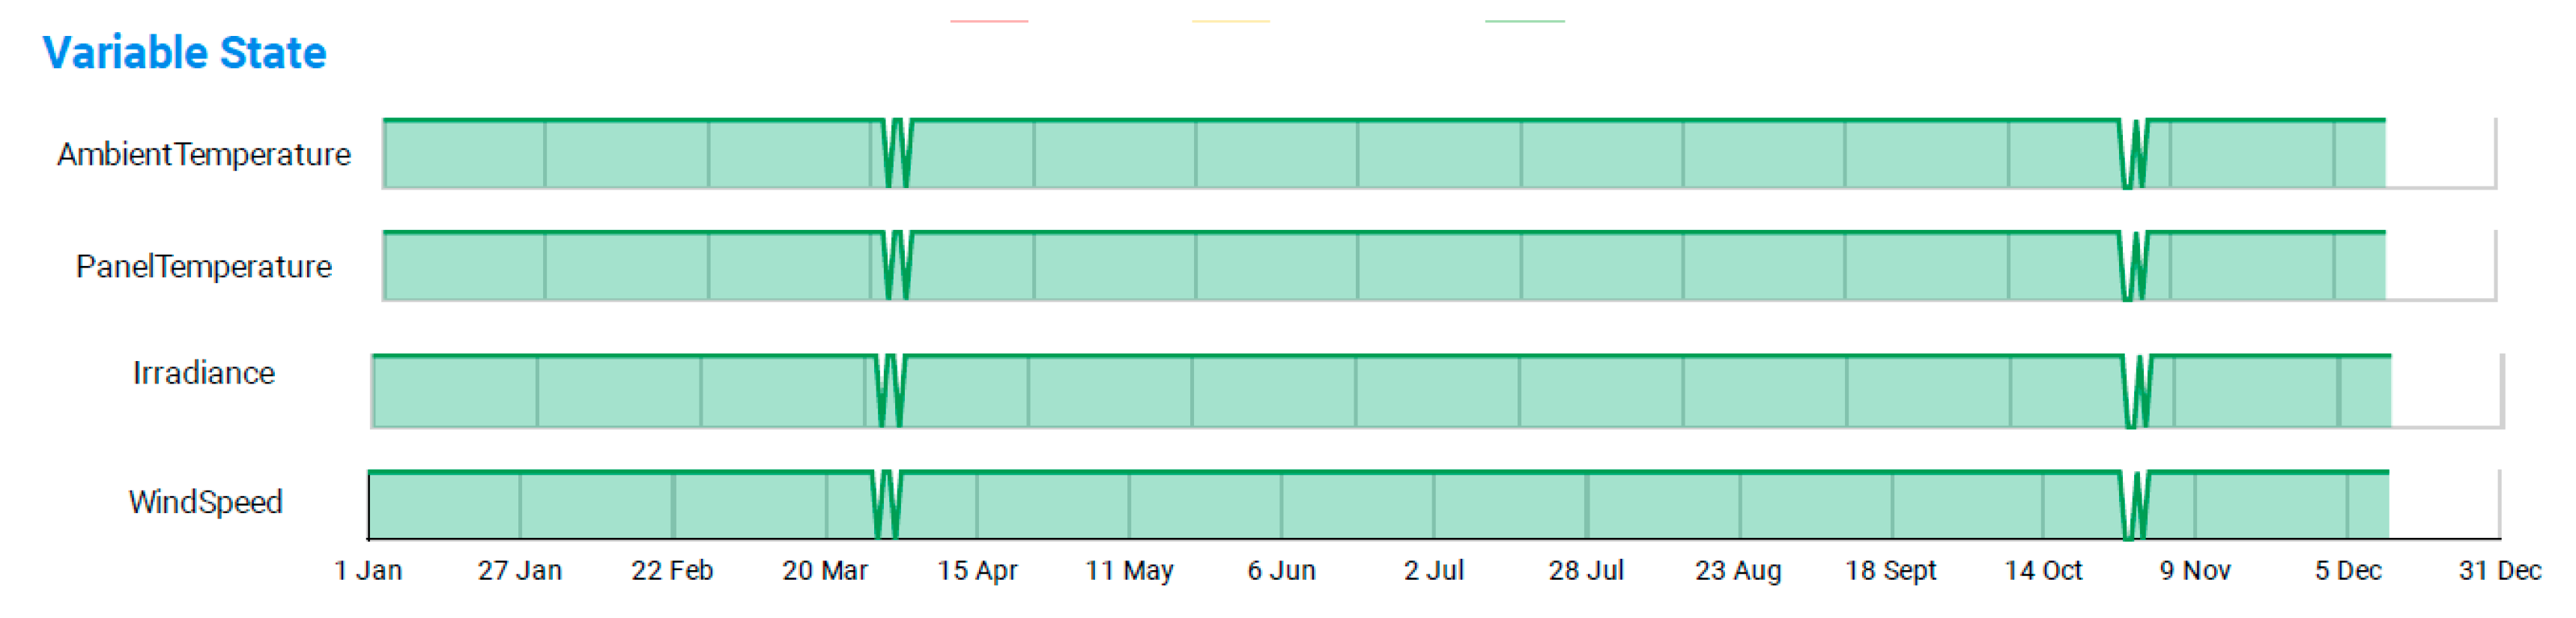
Weather signal analysis was also performed, and the results indicated that the weather sensors were working properly, except in March, November and December (see Figure 8).
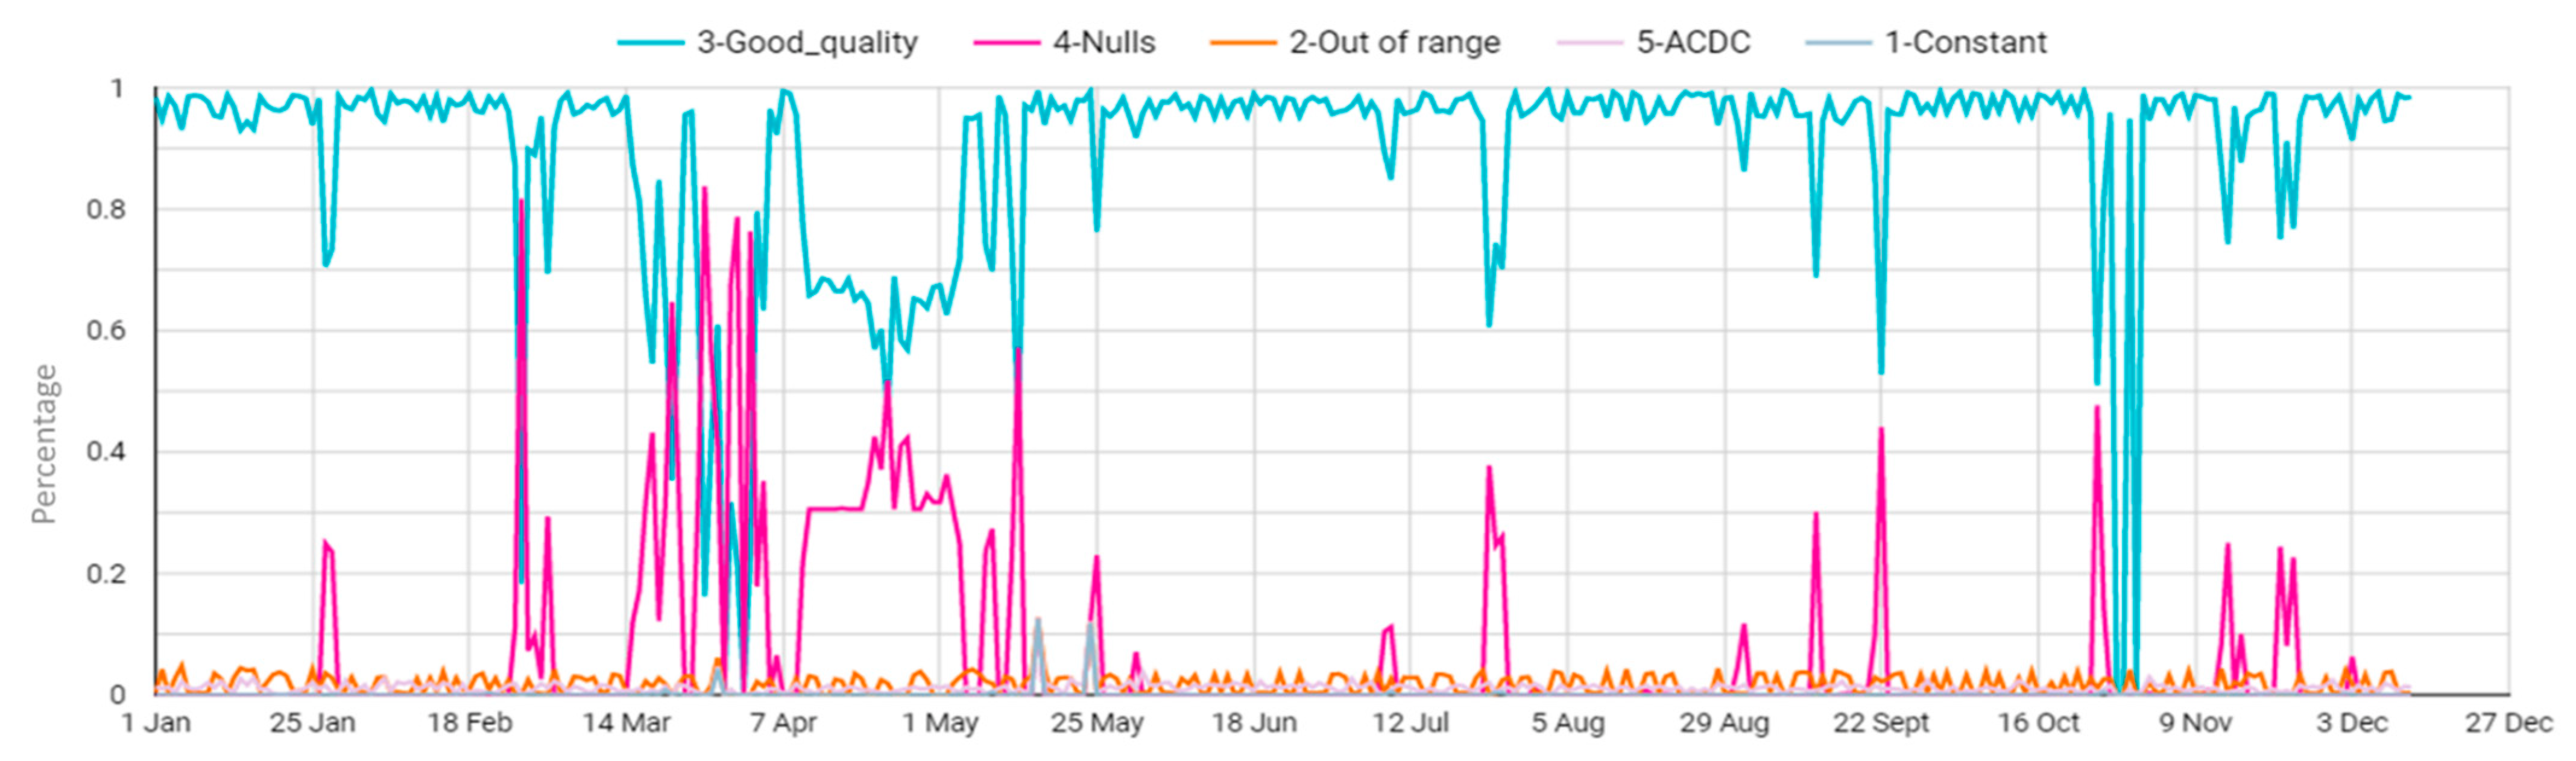
The behavior of the data was then plotted in a time series (see Figure 9). Data issues mainly took place in March–April. The data quality algorithms classified 93.08% of the given data points as being of good quality, 4.04% were null values, while the rest of the data points (2.88%) were constant or out of range values (i.e., outliers and anomalies) detected by AC-DC cleansing, as well as isolated outlier and constant pattern detection algorithms.
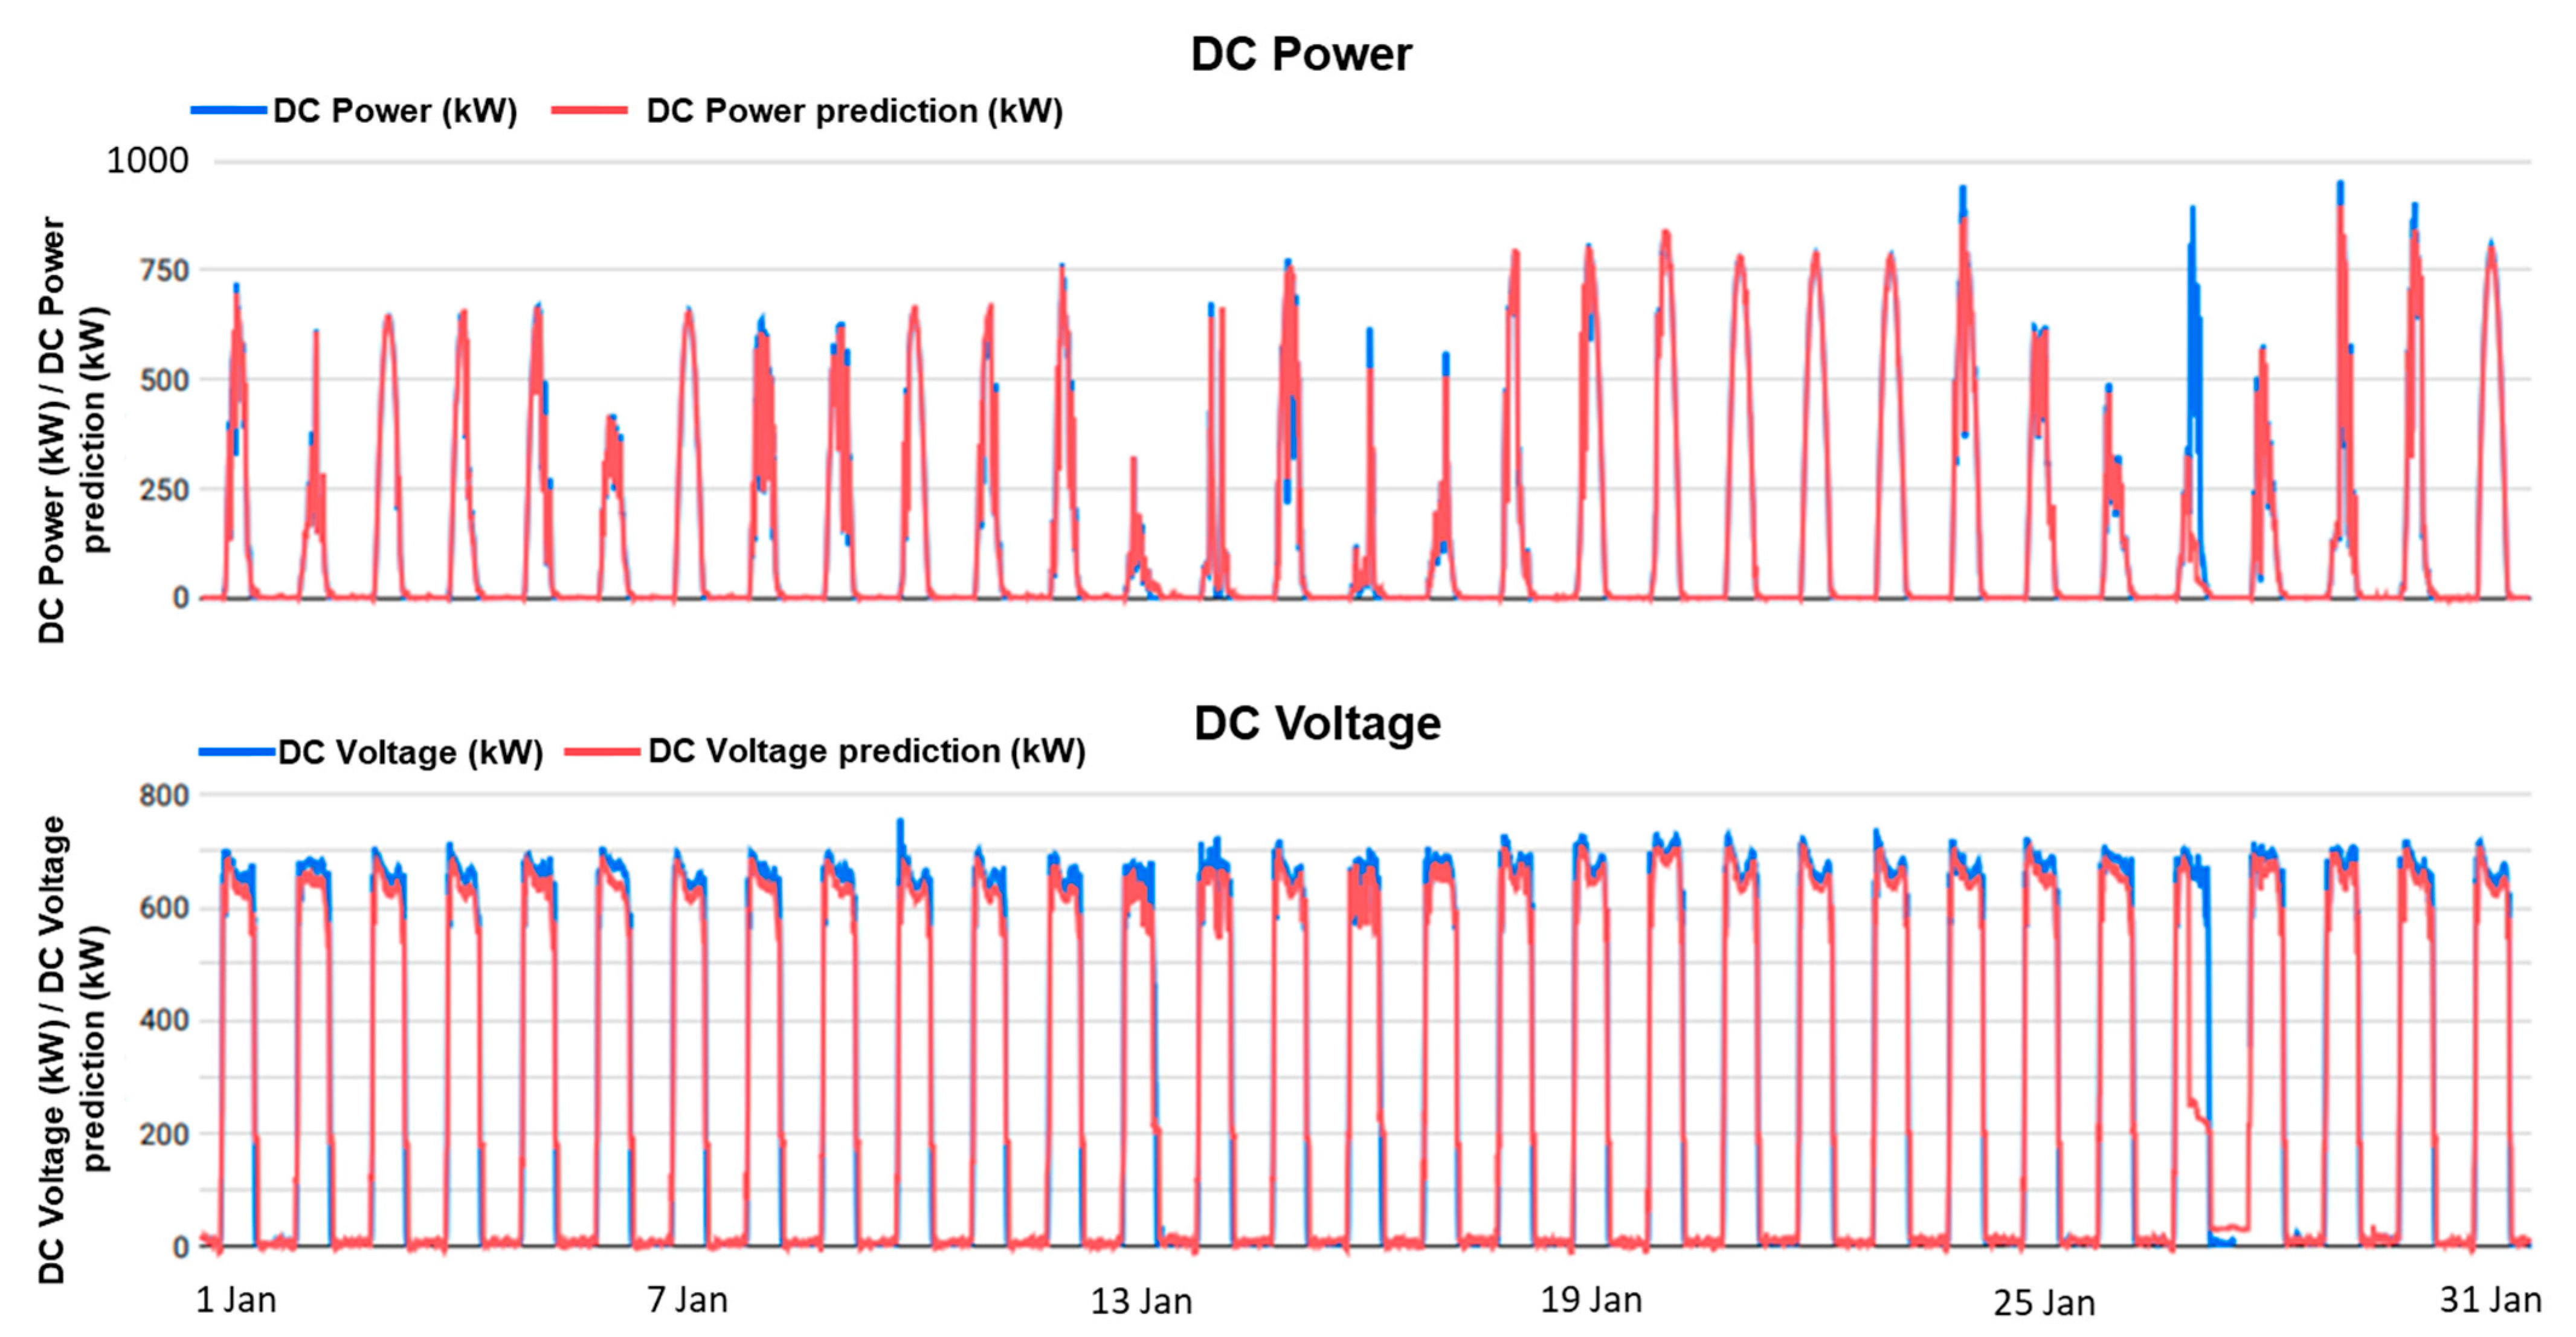
Once the data were cleansed, ML predictive models were used to simulate the PV system performance at the inverter level. The results of the models used to predict DC power and voltage of the test PV plant in January 2021 are depicted in Figure 10. The predictive models performed well for simulating the electrical characteristics of the PV system, and they were relatively accurate, exhibiting good agreement with the measured data. Indications of fault occurrences were evident when discrepancies between the PV system measured and predicted power were detected (e.g., 27th of January 2021).
3.2. Out-of-Normality Analysis
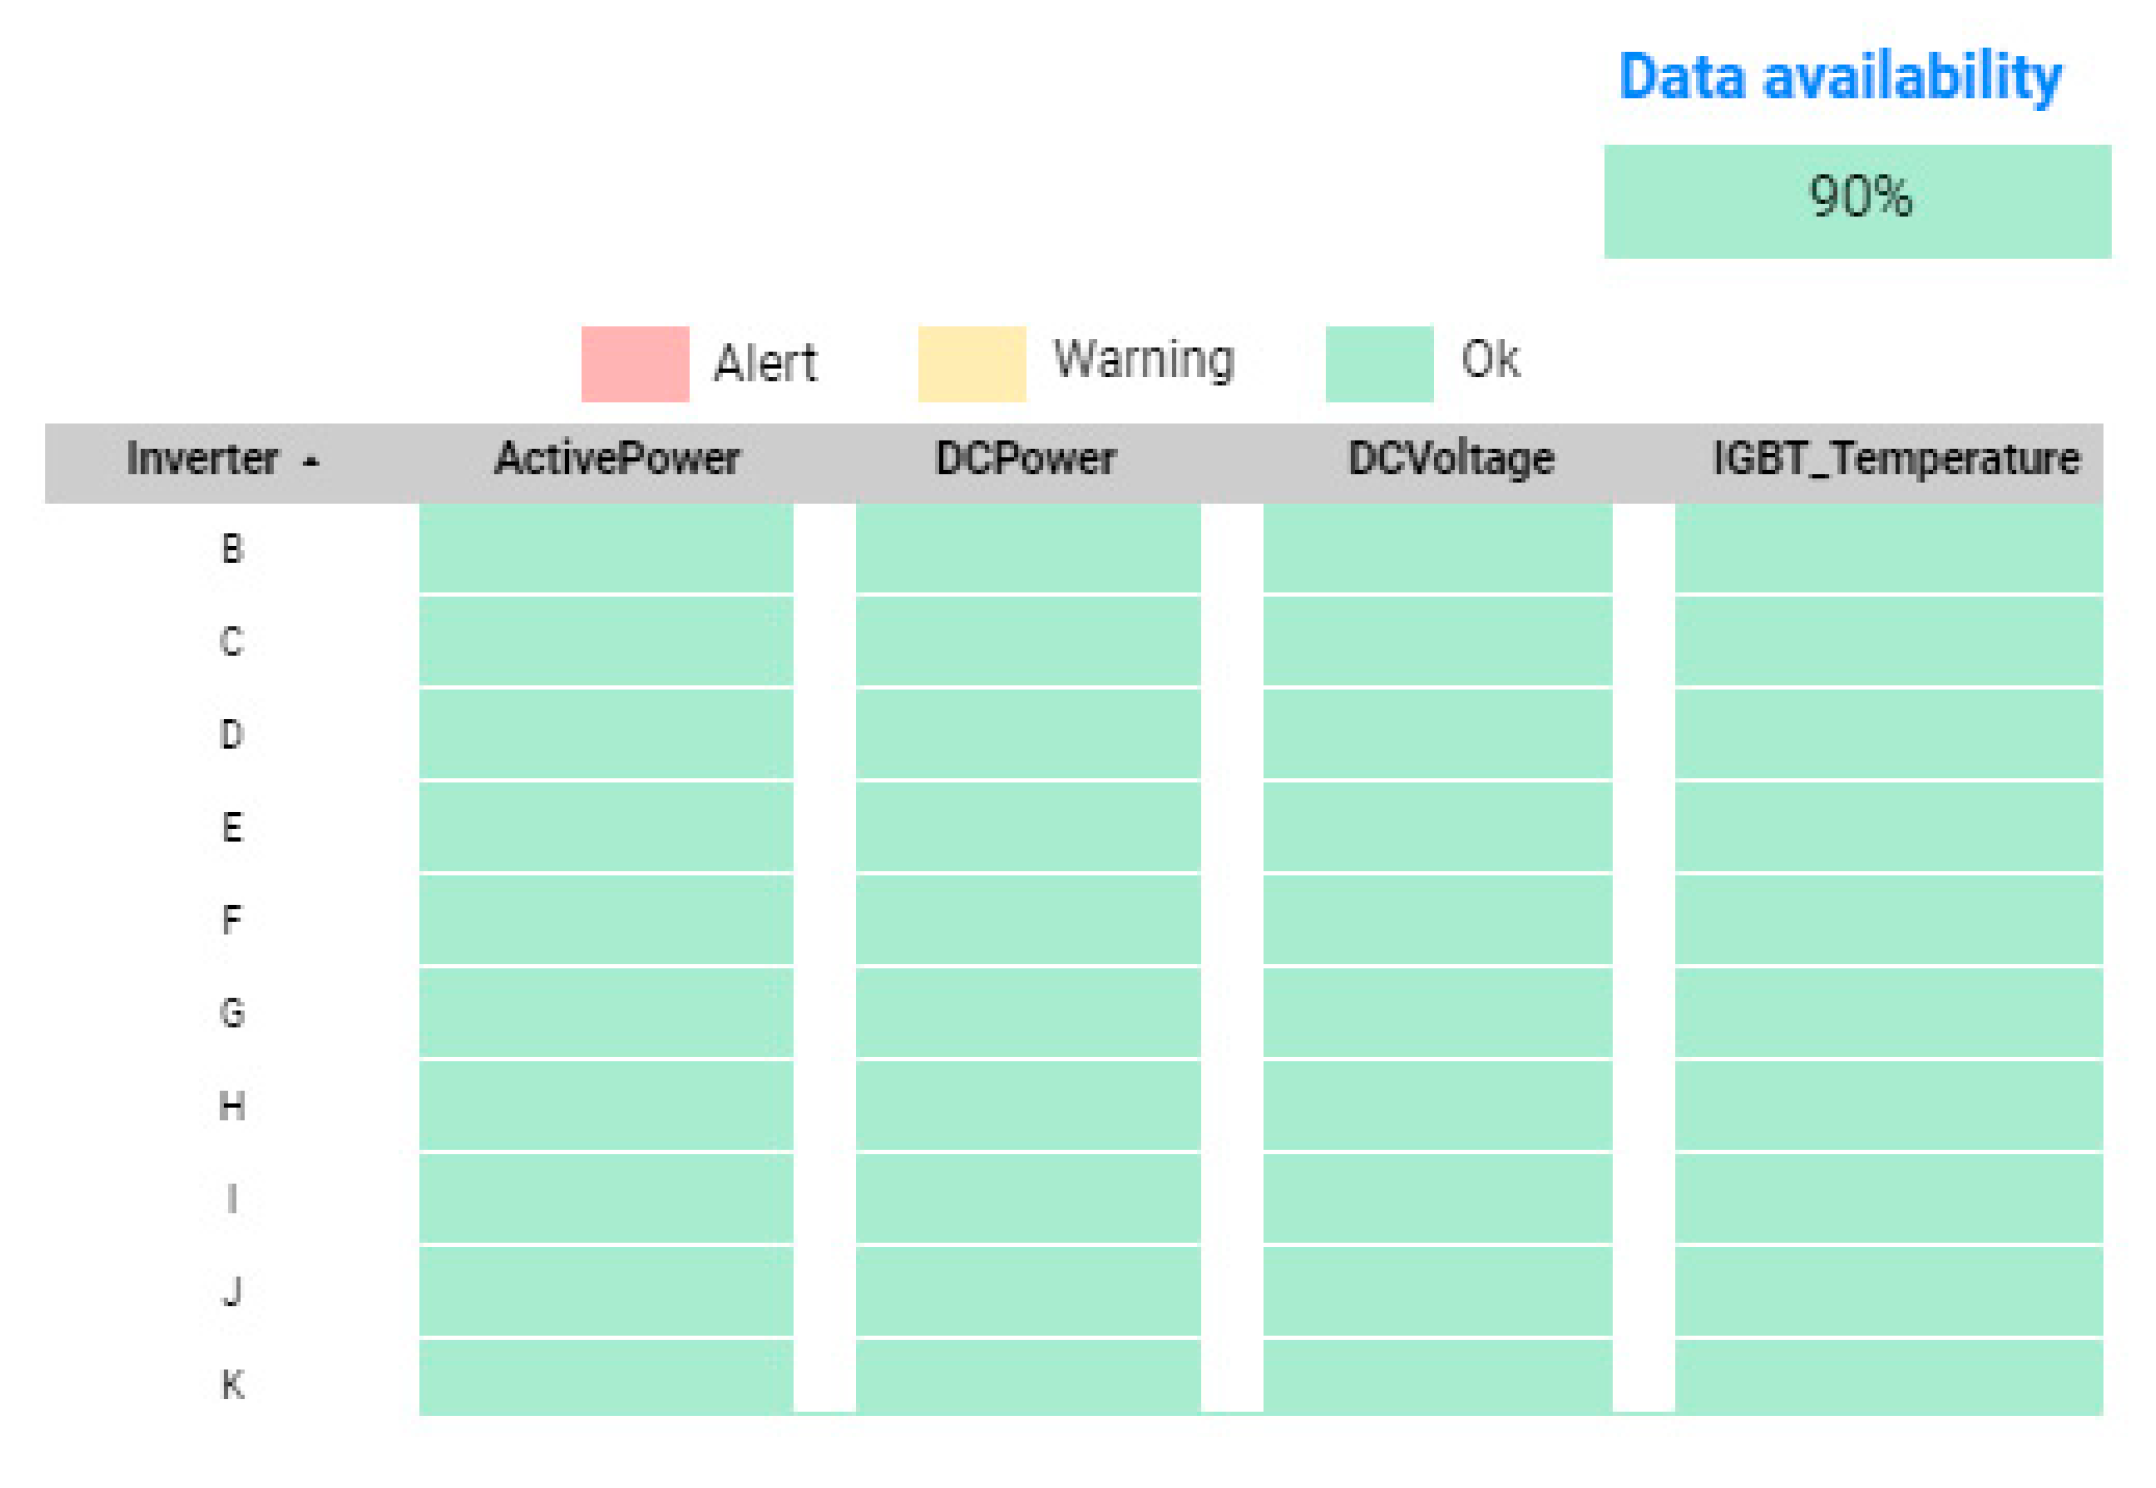
The pattern analysis revealed a data availability of 90%, and the generated inverter out-of-normality heatmap is presented in Figure 11. The heatmap shows the most significant variables (i.e., active and DC power, DC voltage and IGBT temperature) at the inverter level. For the selected period, an “Ok” (indicated by green color) was generated for the state of normality, a “WARNING” (indicated by yellow color) was generated when slight differences between the measured and predicted parameters were detected, while an “ALERT” (indicated by red color) was generated when the differences were significant. The results indicated the normality state for all the inverters (see Figure 11).
A time series plot was then used to demonstrate the behavior of signals. Signal errors/outliers are colored white in Figure 12 and correspond to communication errors or to days in which inconsistencies were detected between inverter sensors and their solar field. Such errors and inconsistencies mainly occurred in March, May, July, September, October and December (see Figure 12).
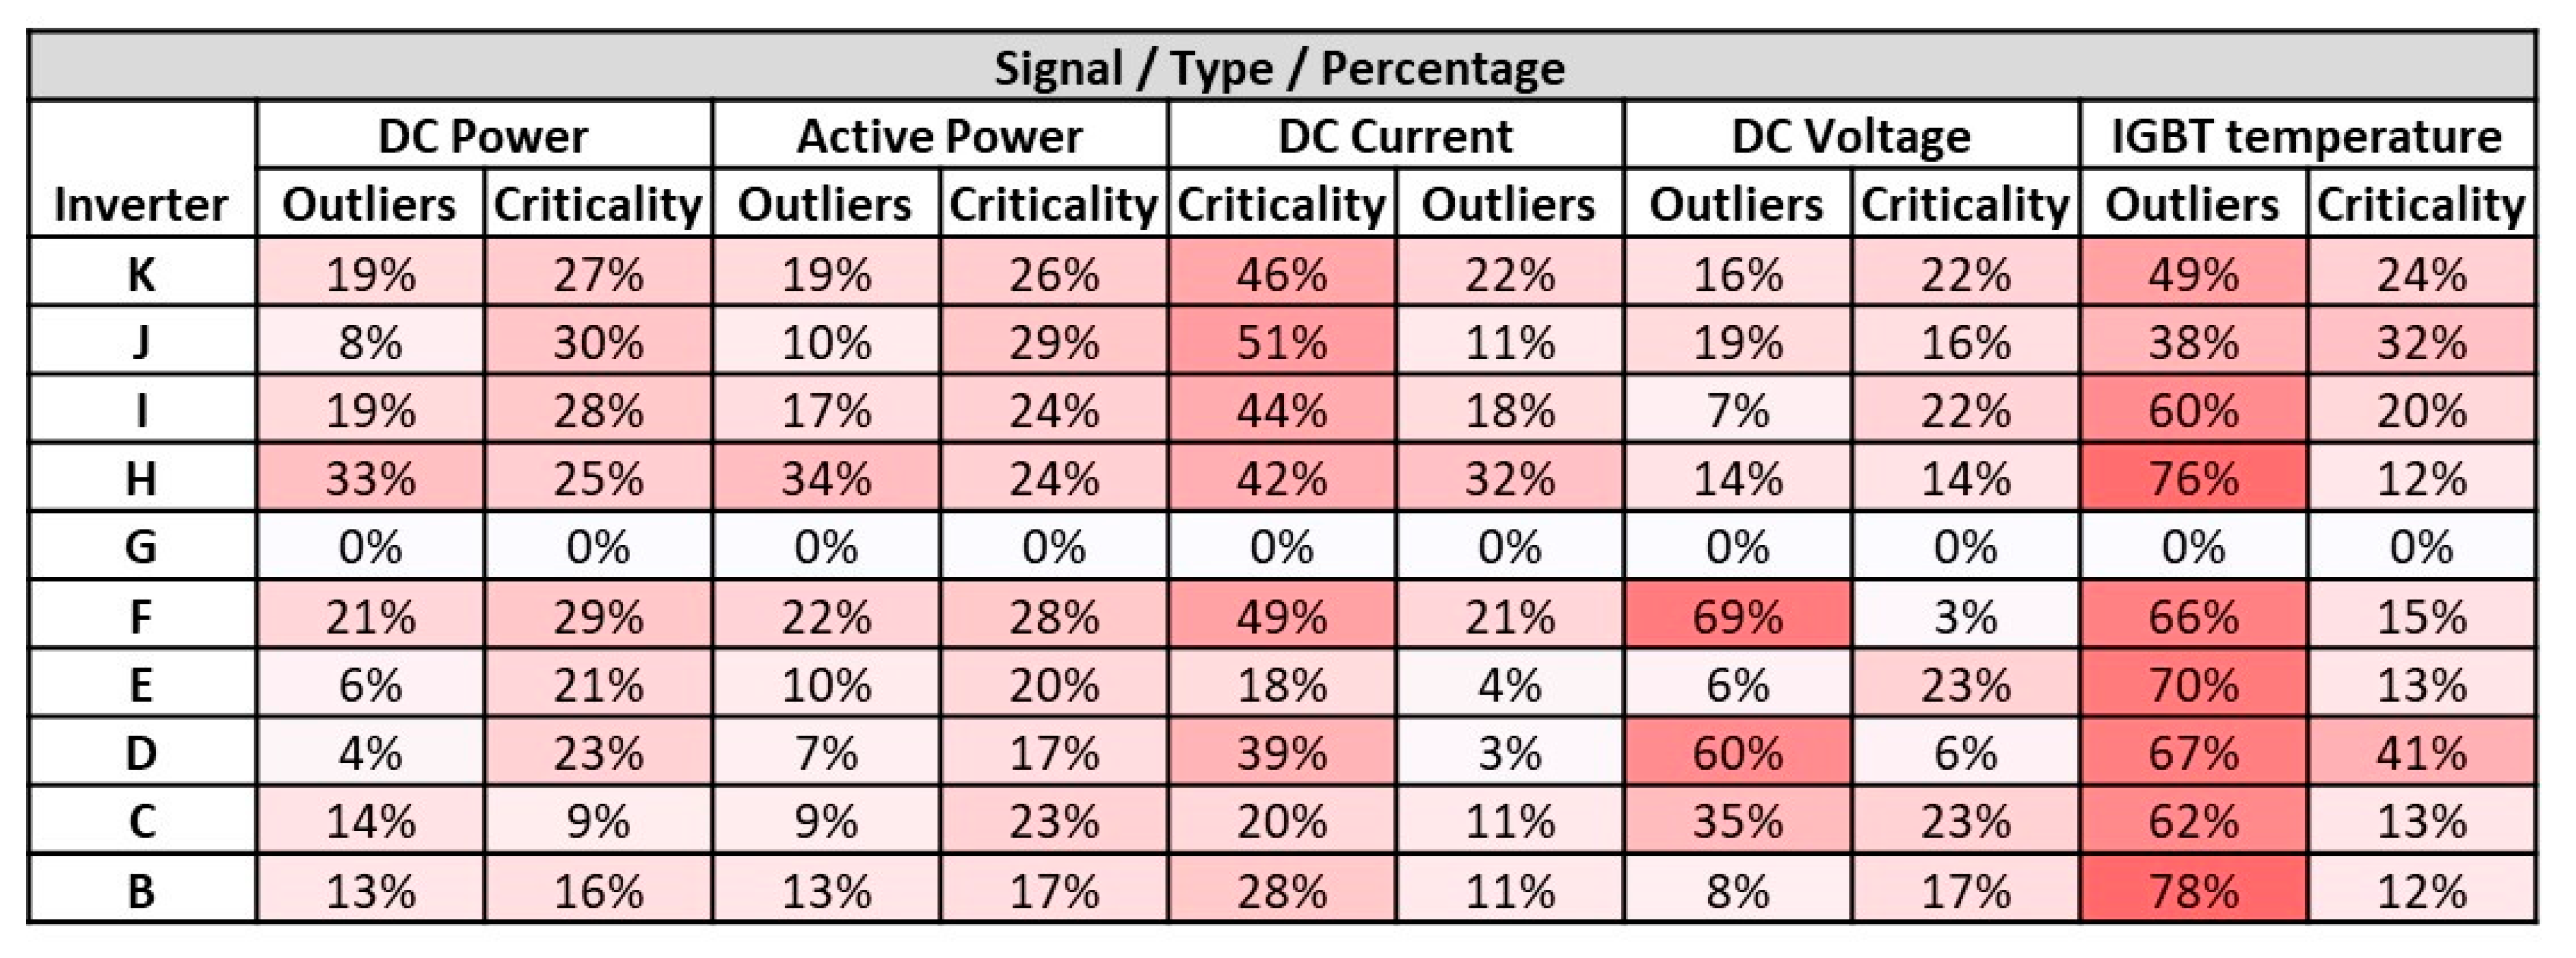
Statistical outlier analysis was then performed. The analysis of anomalies on the basis of outliers compares the signals of similar elements among themselves, detecting values that are far from the mean. An out-of-normality heatmap was constructed for the main electrical and weather measurements (see Figure 13), depicting the detected outliers (as a percentage of points) along with their criticality (i.e., percentage of points detected as outliers in the selected period). Outliers were detected for all signals and inverters (except inverter G), reaching up to 78% of points with a maximum criticality of 51%.
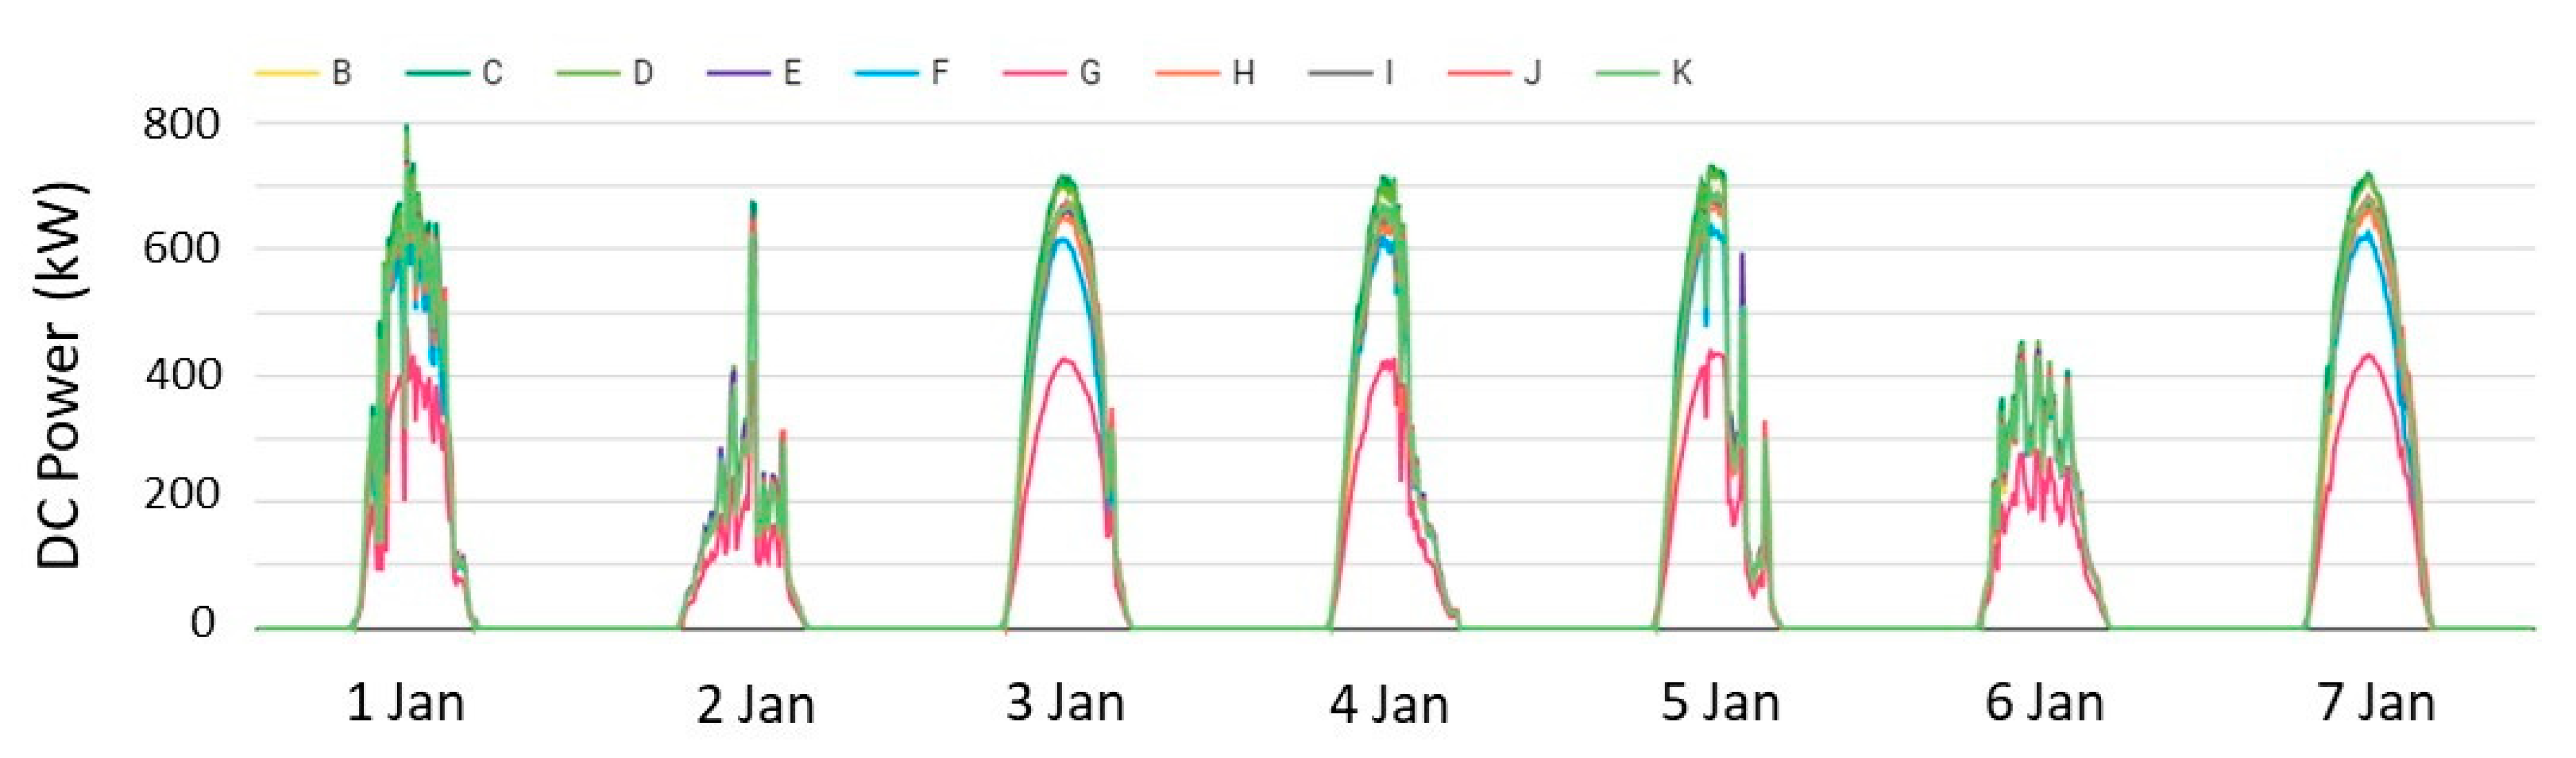
The statistical comparison of signals also led to the detection of fault occurrences due to string disconnection and low performance of inverters. An example from the signal comparison between different inverters is shown in Figure 14, demonstrating the fault operation of inverter G (which had significantly lower DC power production compared to the other inverters) over the first week of January 2021.
3.3. Inverter and Solar Field Analysis
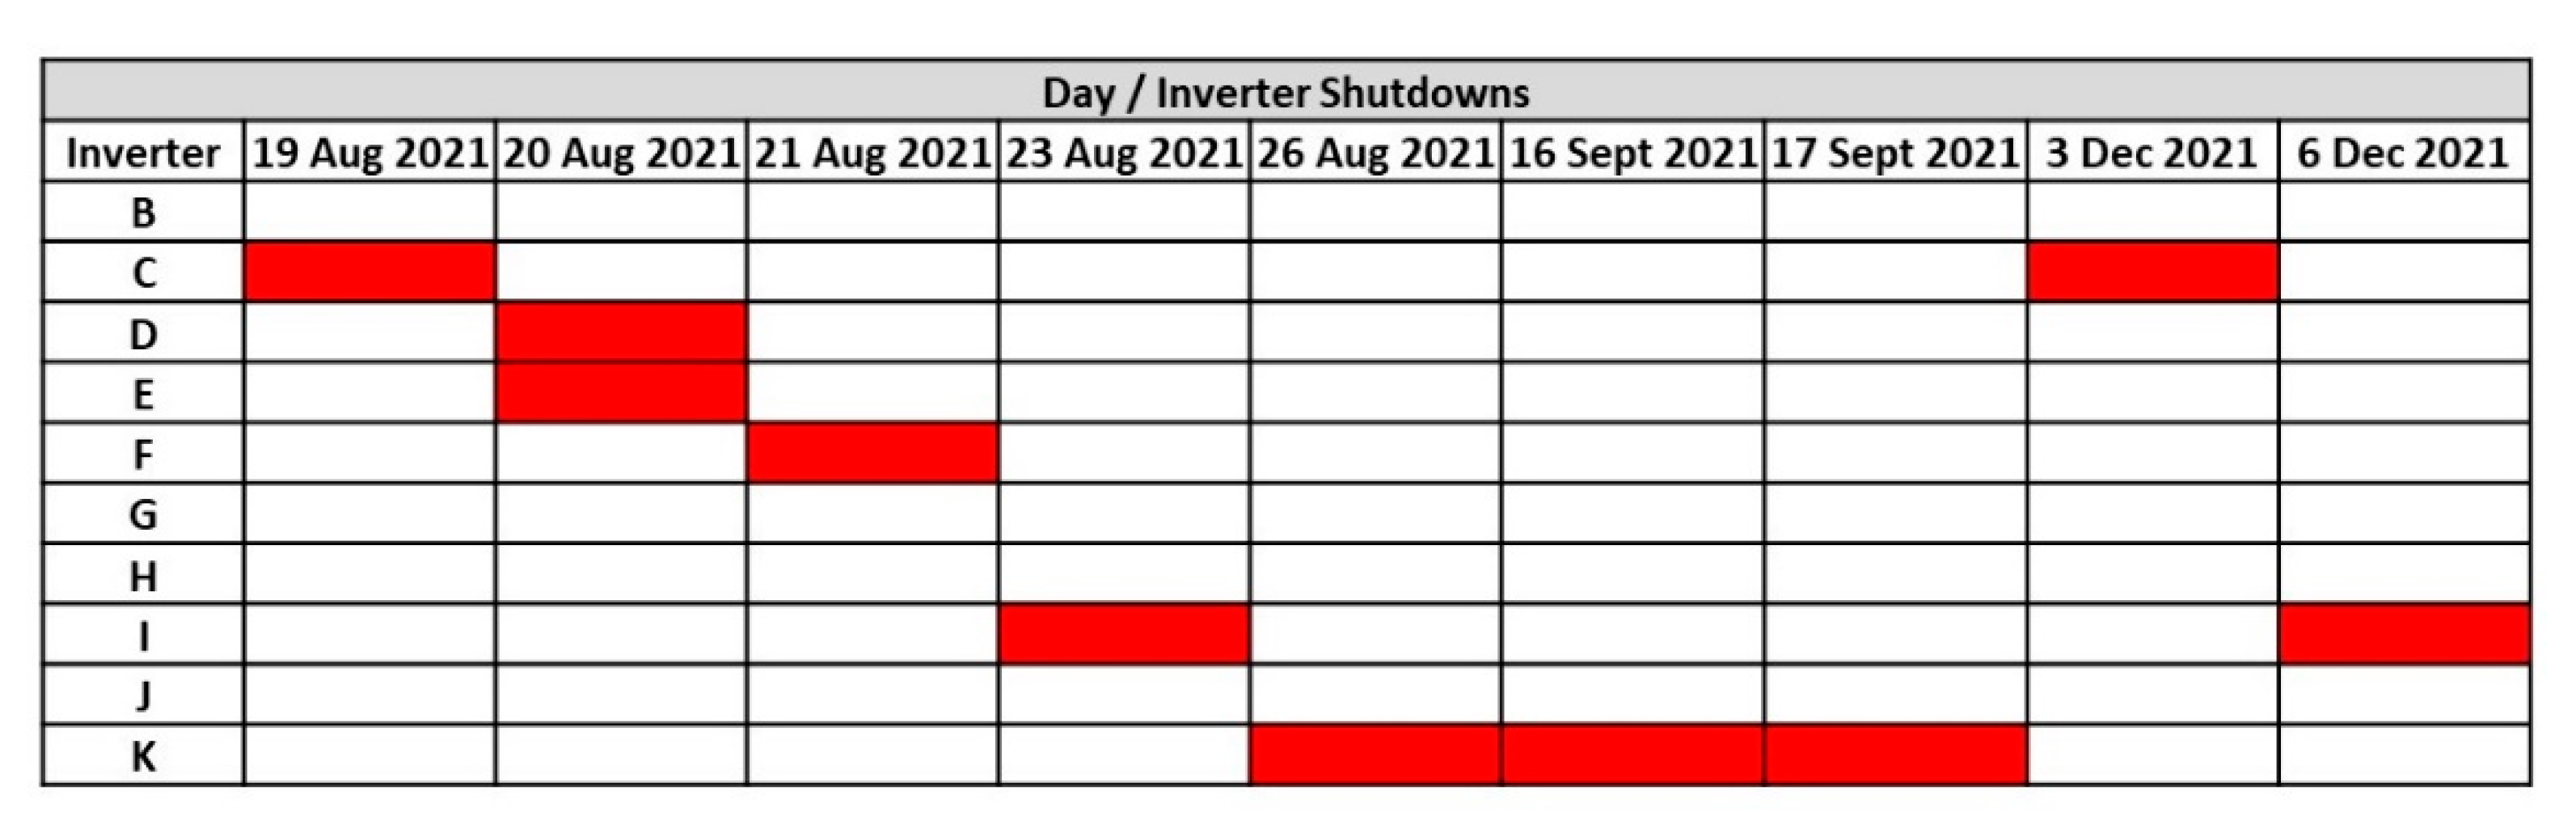
Different algorithms were executed to identify inverter failures due to overheating, clipping, cooling fan error, late awakening, shutdown, low efficiency, and solar field problems (e.g., soiling, bypass diode failures, performance degradation, disconnected strings, partial shading, etc.). An example of the detected inverter shutdown failures (at inverters C–F, I and K) over the period from August to December 2021 is depicted in Figure 15.
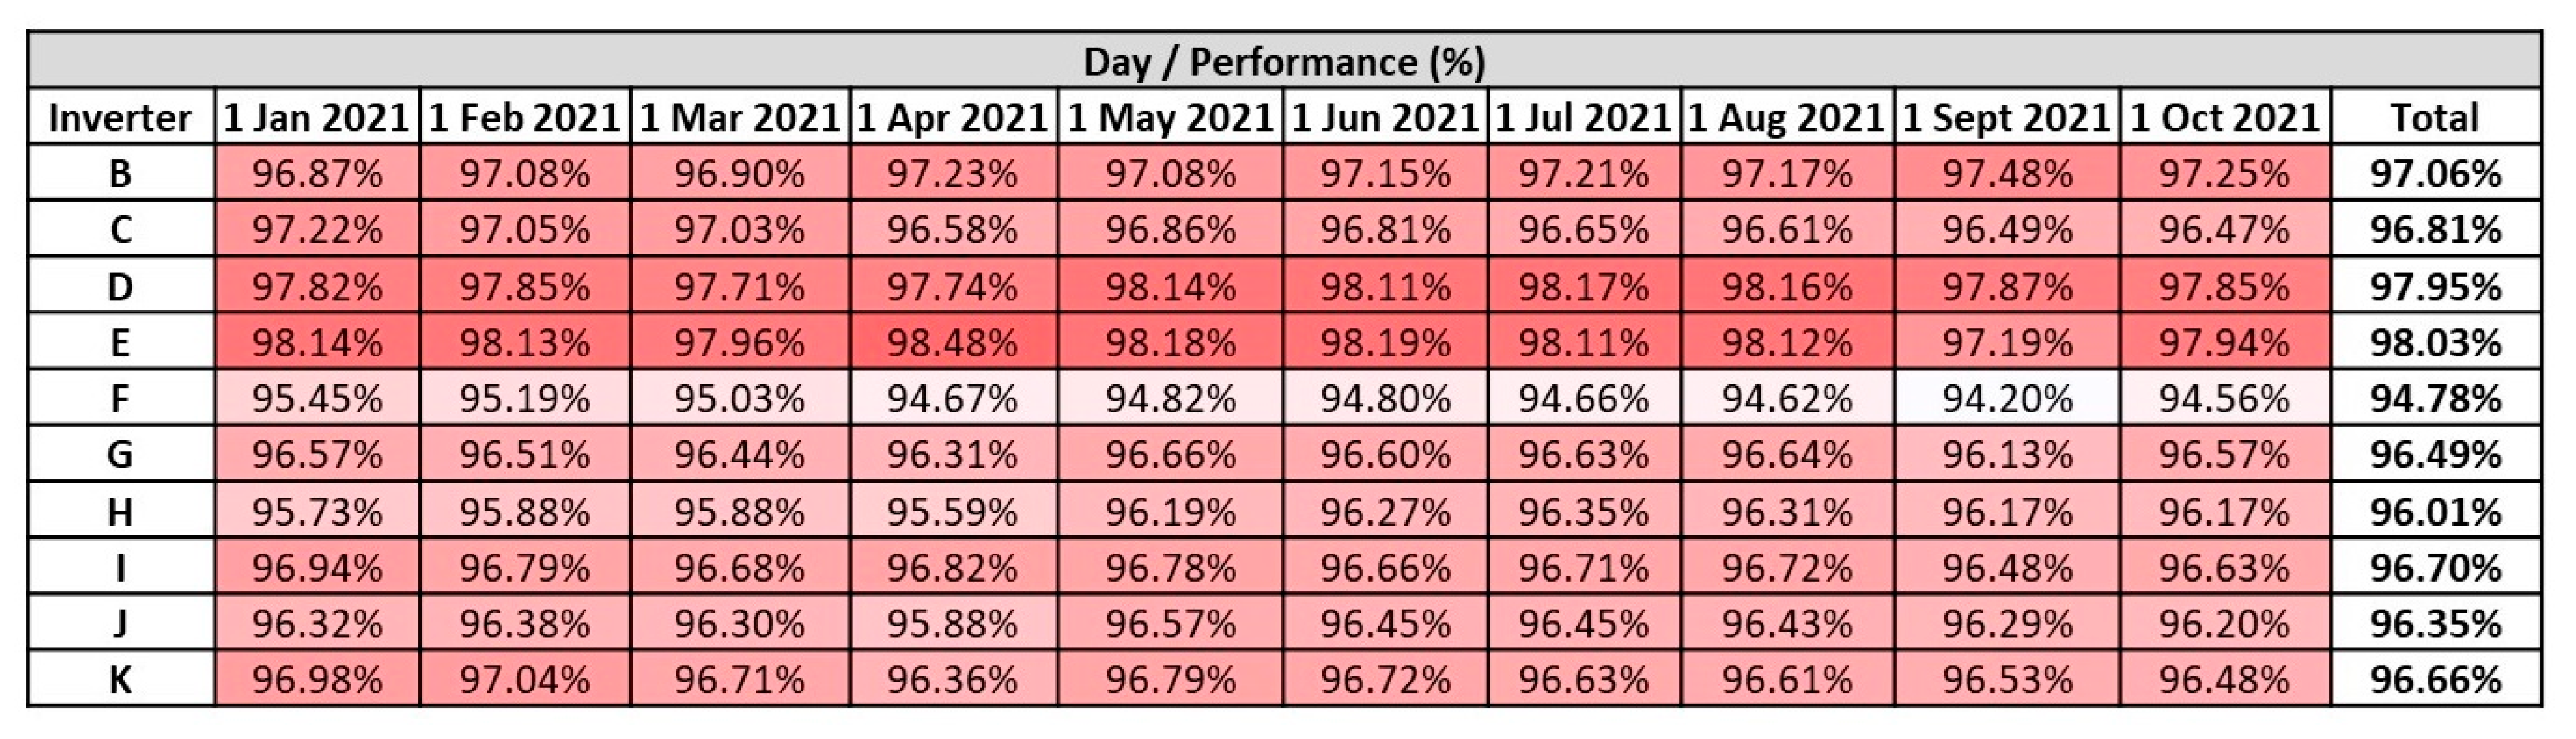
A heat map was also constructed depicting the efficiency of each inverter (see Figure 16) by relating the actual active power to the DC power and considering only datapoints similar to STC. Inverter F exhibited the lowest efficiency, at 94.78%, when comparing the obtained monthly values of the device with the efficiency value provided by the manufacturer (98.70%). The performance of the other inverters ranged from 96.01% to 98.03%.
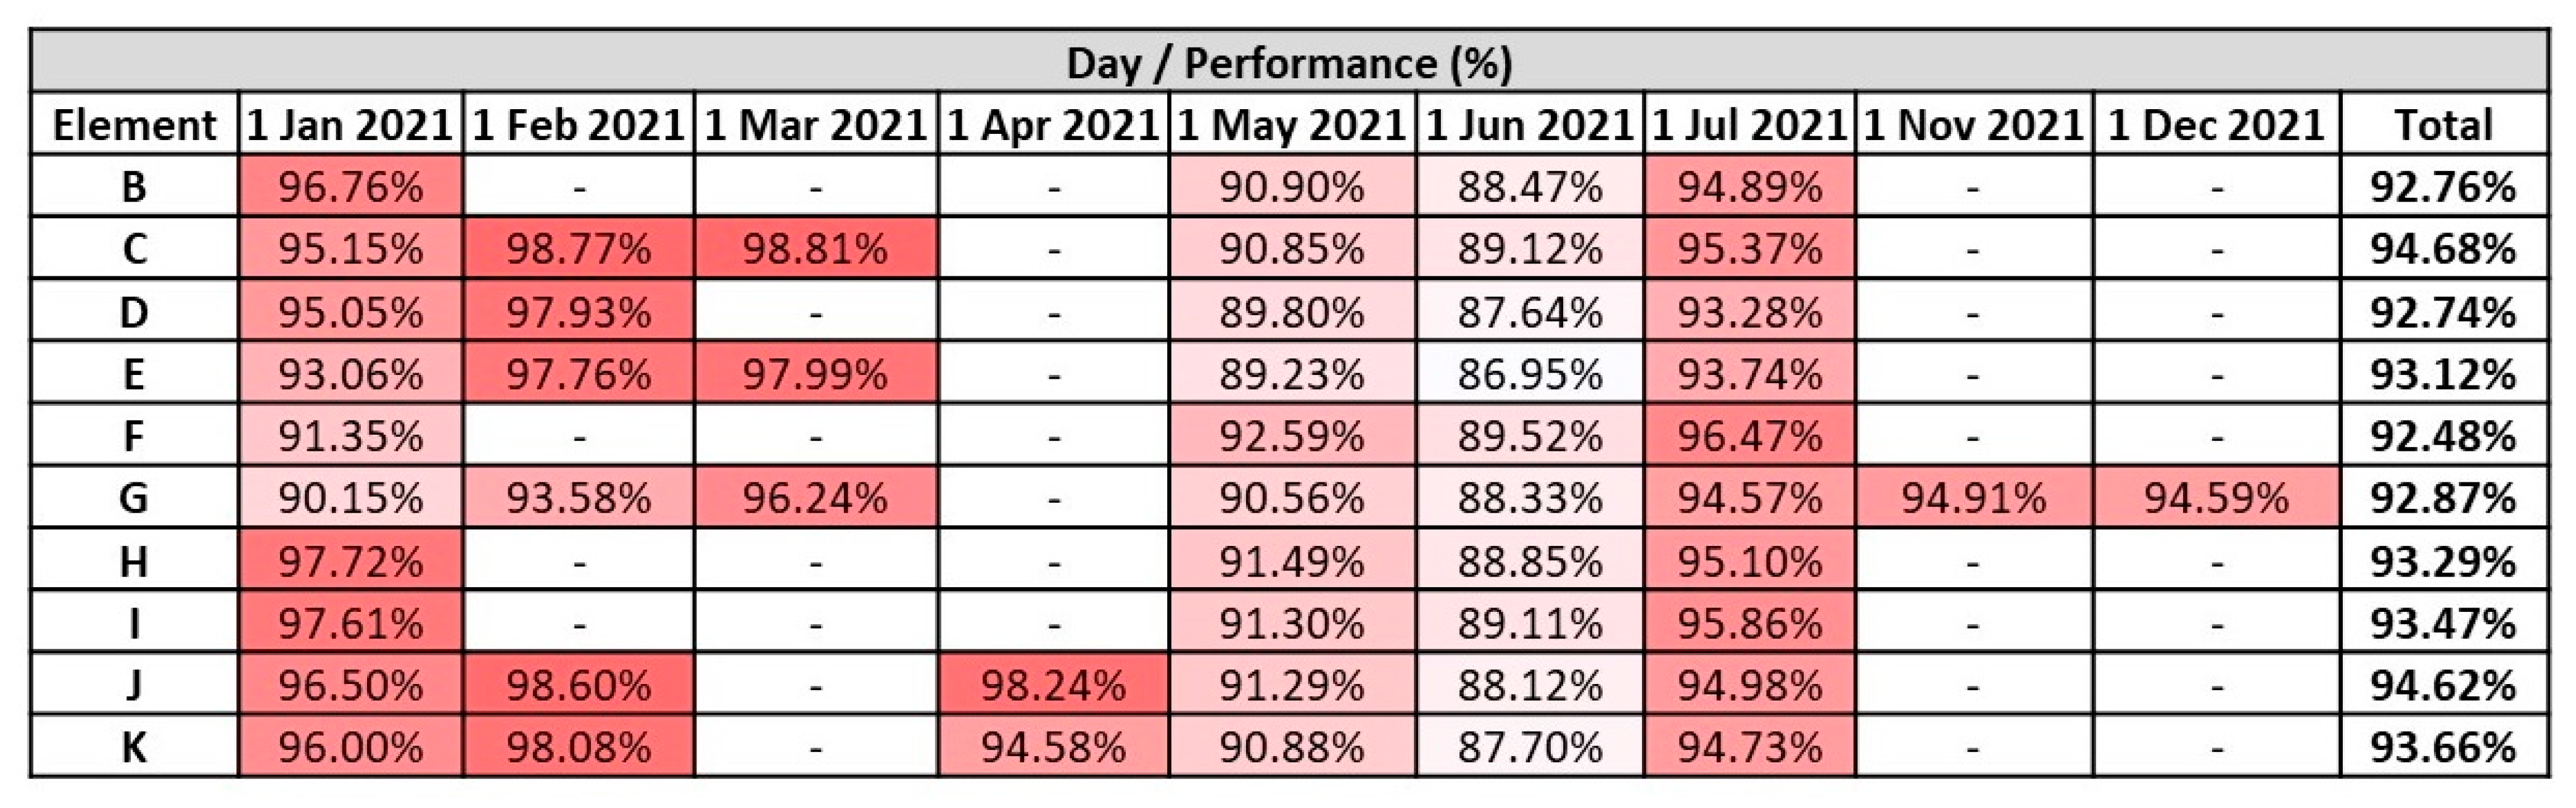
Likewise, a heat map for solar field performance was created (see Figure 17). It shows the performance of solar field (under optimal conditions) at the inverter level and the deviation between the actual behavior of the devices with respect to the manufacturer’s specifications (97%). Over the evaluation period, the performance of the solar field at the inverter level ranged from 92.48% (inverter F) to 94.68% (inverter C). It is worth noting here that the detected incidents in the solar field were mainly due to string disconnections.
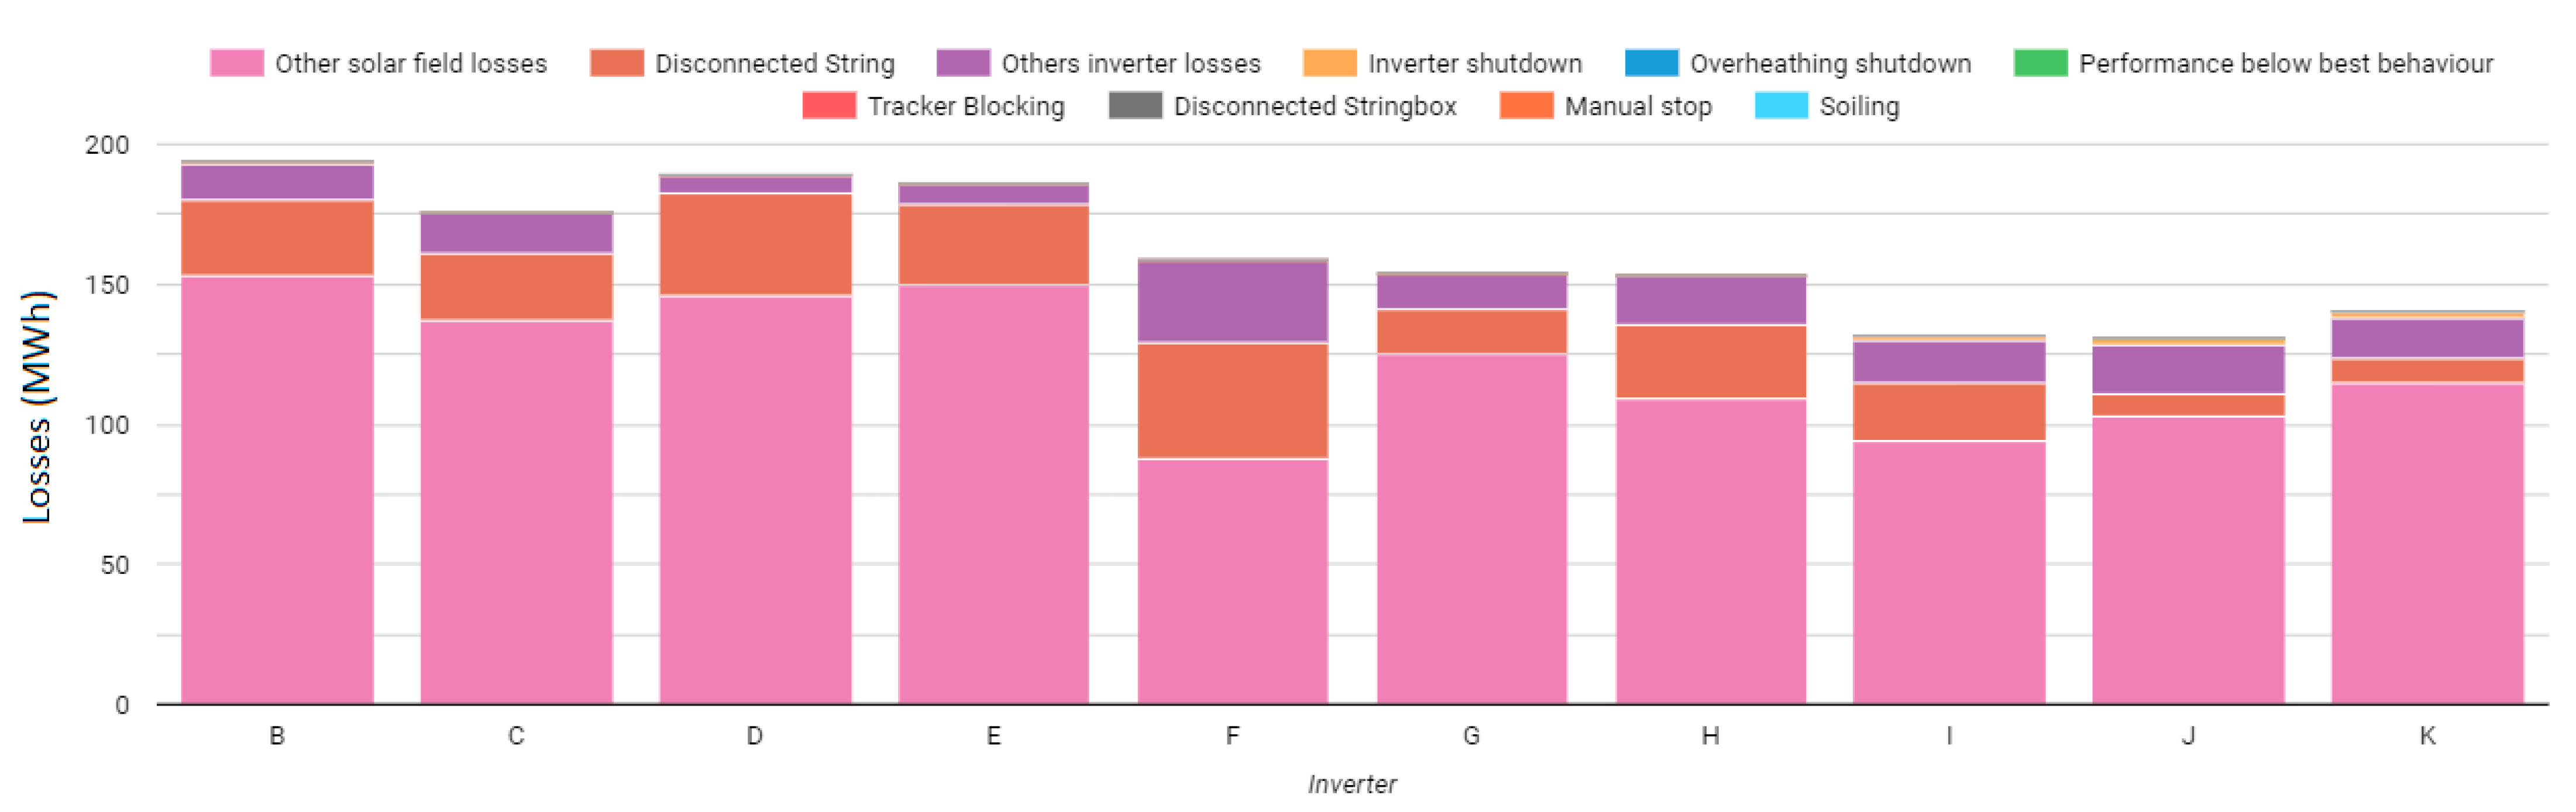
In general, different root causes of performance losses, including disconnected strings, inverter related failures, low performance, and other solar field problems were detected in this module. The detected incidents at each inverter are summarized in Figure 18, where the bar graph groups all the detected losses at the inverter level and shows the respective lost energy (in MWh) for each fault type over the test period. The main loss factors were the “other solar field losses” (i.e., losses located in the solar field determined by the difference between the theoretical solar field energy and the DC power energy of the inverter, eliminating the effects of panel degradation and losses due to inverter underperformance), disconnected strings, other inverter losses (i.e., losses at the inverter calculated from the difference between the DC and AC power) and inverter shutdown failures. Other solar field losses (referred to also as other performance solar field losses), including root causes such as PV module faults, mismatches, shadowing, and soiling, accounted for 1226 MWh (or 75.8% of the total losses), while disconnected strings accounted for 238 MWh (equivalent to 14.7%), other inverter losses accounted for 147 MWh (or 9.1%), and inverter shutdown failures resulted in 6.5 MWh of lost energy (equivalent to 0.4%). Over the evaluation period, most of the energy was lost at inverters B, D and E (193.4 MWh, 188.9 MWh and 185.8 MWh, respectively). At inverter B, the lost energy was mainly attributed to string shutdowns, while for inverters D and E, it was mainly attributed to string and inverter shutdowns.
3.4. Energy Loss Analysis and Plant Status
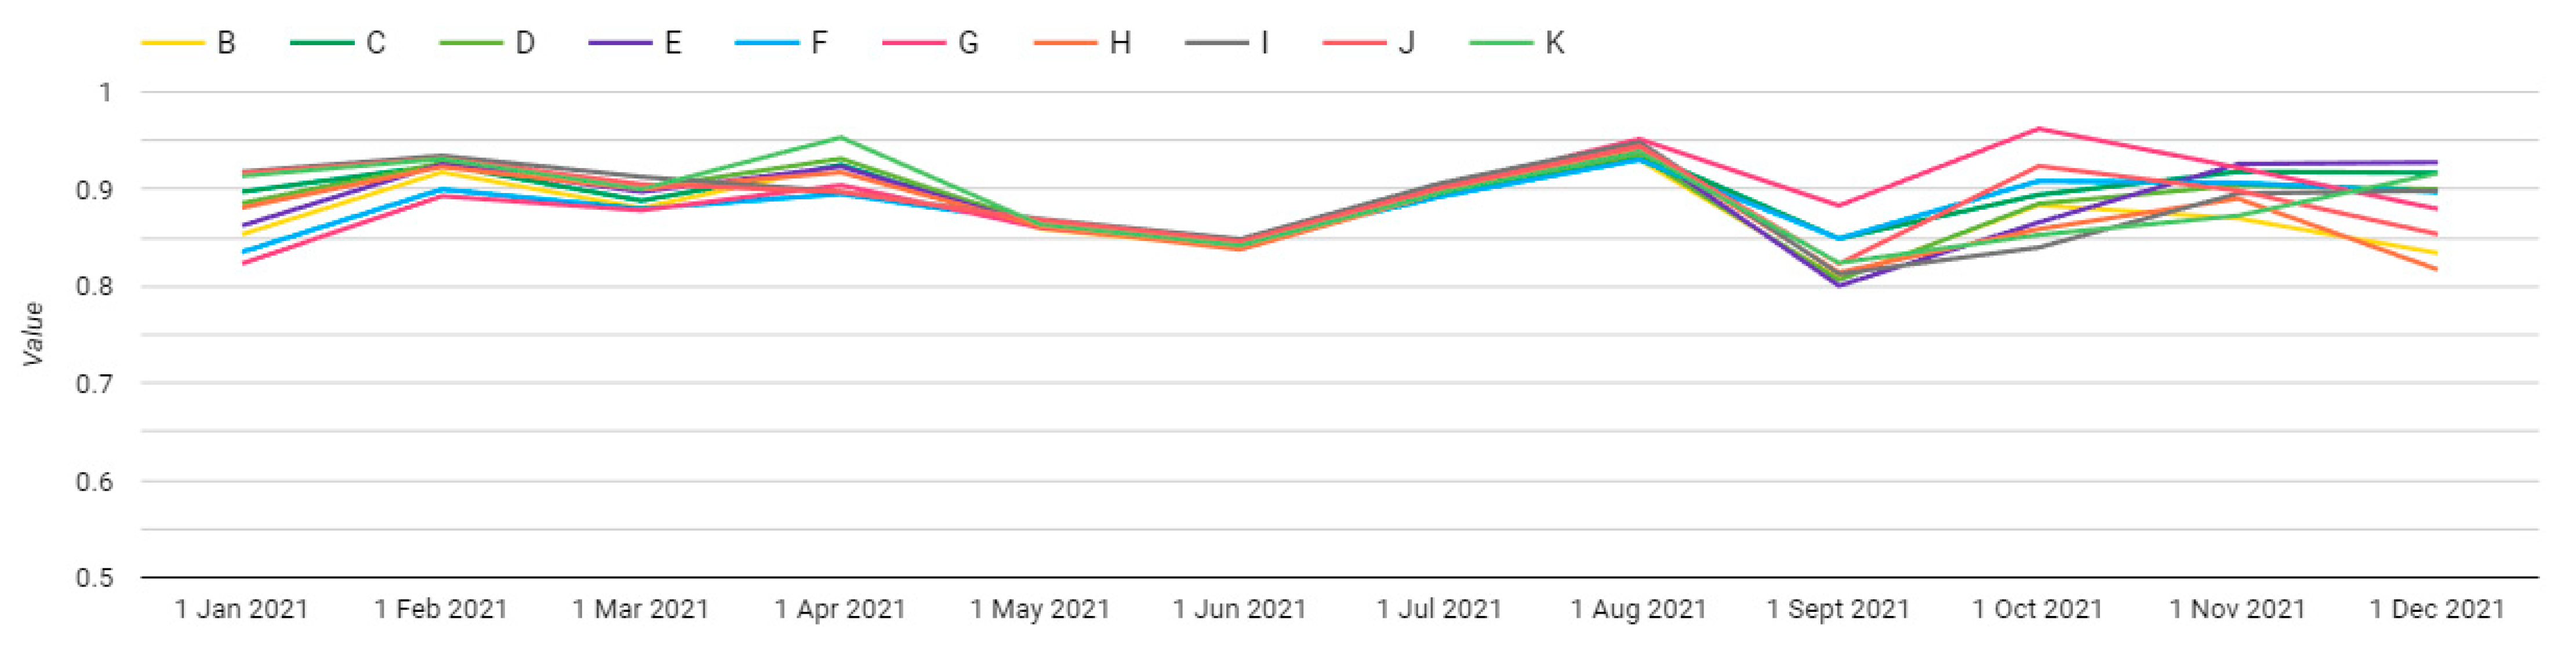
Initially, the PR was examined, as it is a normalized parameter and a KPI used for assessing overall plant performance and evaluating its efficiency. Over the 1-year evaluation period, the weather-corrected PR of the test inverters ranged from 0.80 to 0.96, with an average PR of 0.88 (see Figure 19), demonstrating its high performance.
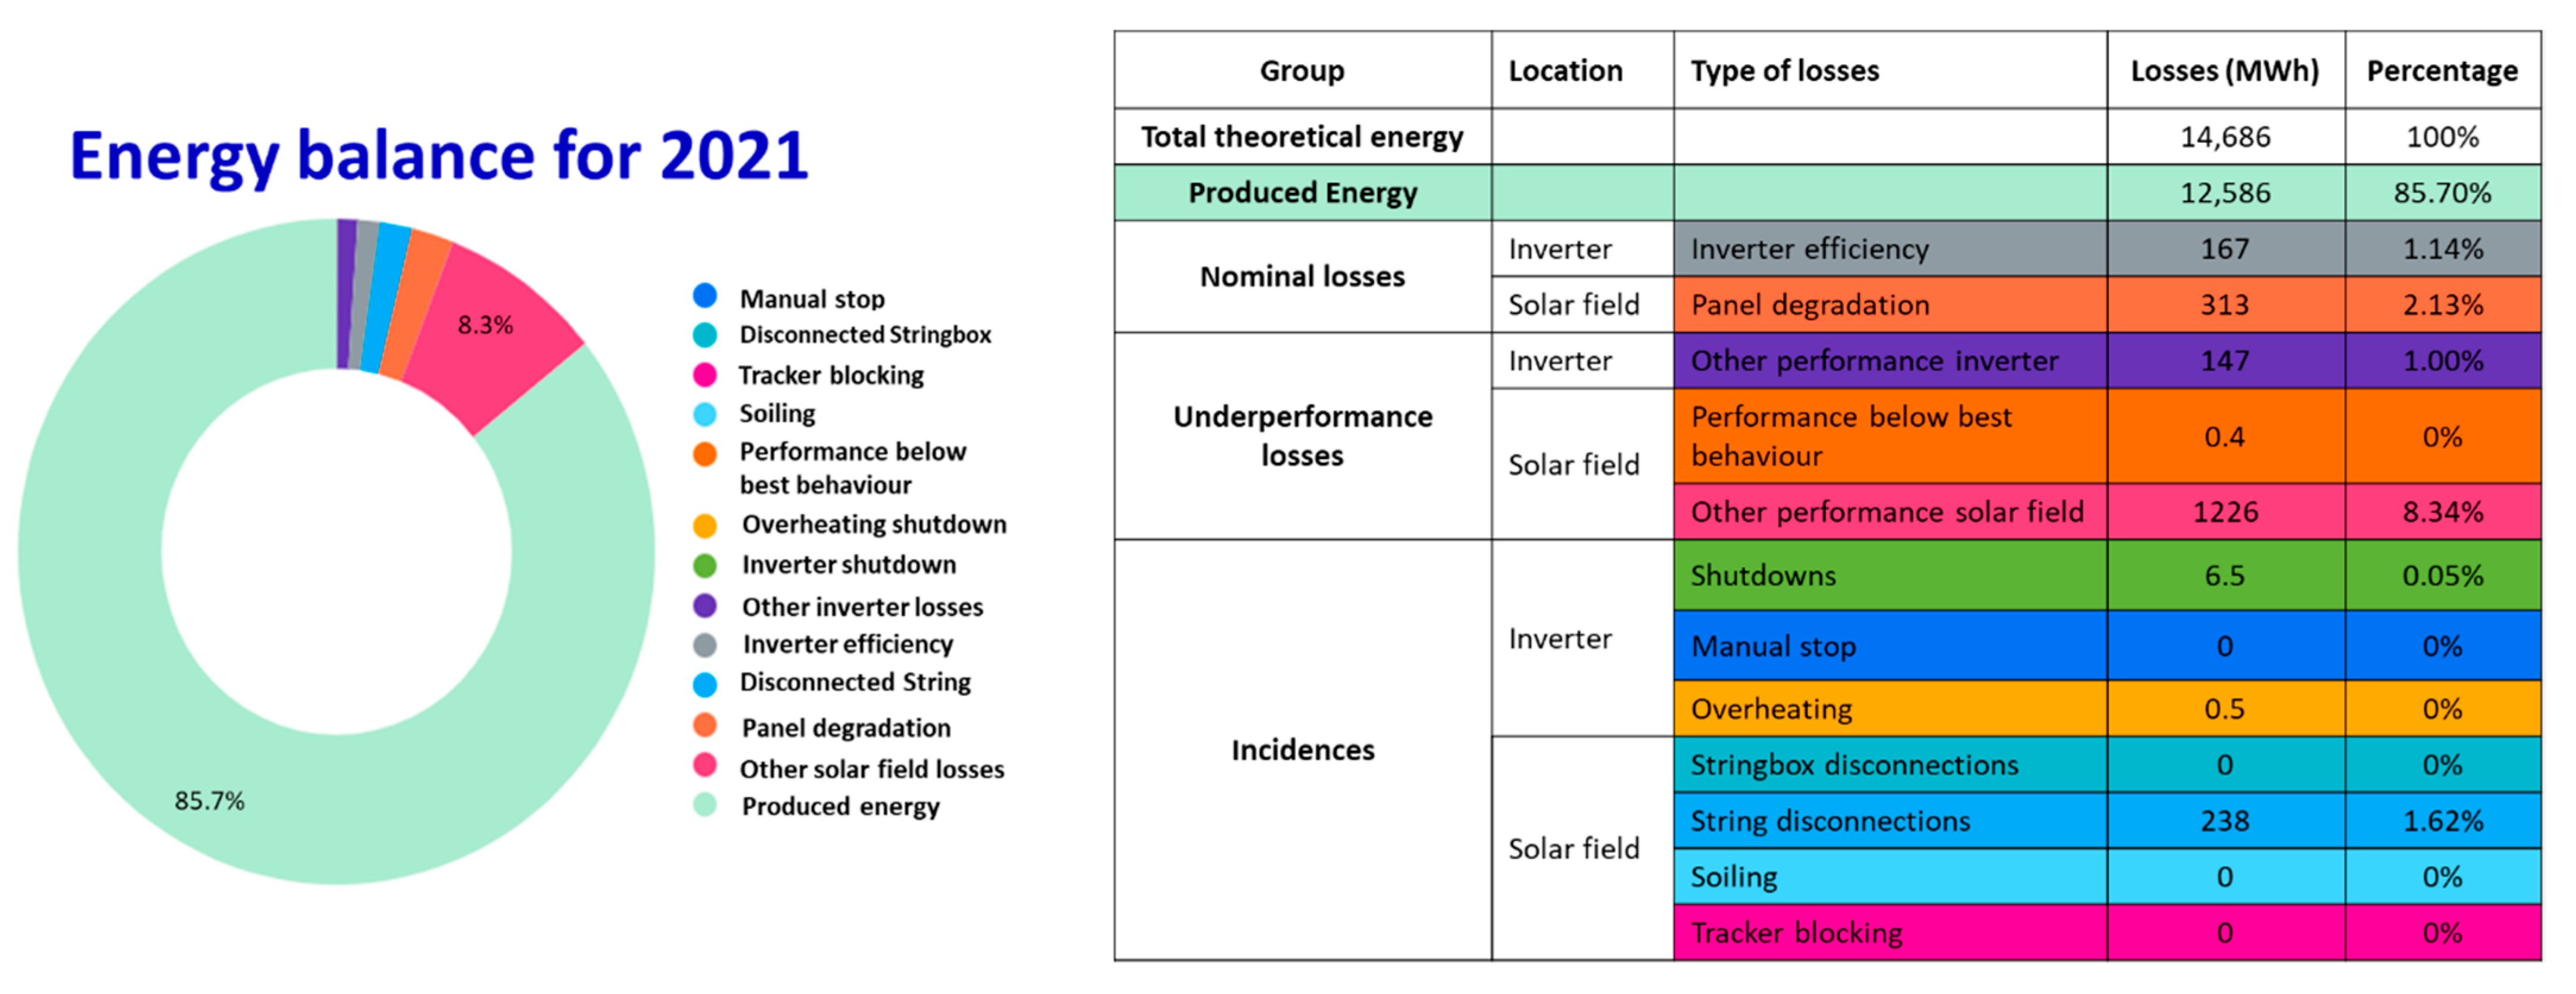
Then, the energy loss analysis was performed. Over the investigated period, the test PV plant produced 12,586 MWh (85.70%), while the detected incidents (i.e., inverter failures, PV module faults and string disconnections) accounted for 2100 MWh (14.30%) of lost energy (see Figure 20). More specifically, 35 inverter shutdown failures were detected (mainly occurring in July and September), accounting for 6.5 MWh (0.05%). Furthermore, 429 string disconnections were detected. The disconnected strings, accounting for 238 MWh (1.62%), were mainly detected during the period from January to February (47.70 MWh), May to June (78.90 MWh), and November to December (49.60 MWh). Other inverter-related problems (such as inverter efficiency and overheating problems) accounted for 314.5 MWh (2.14%), while solar field problems accounted for 1539 MWh (10.48%).
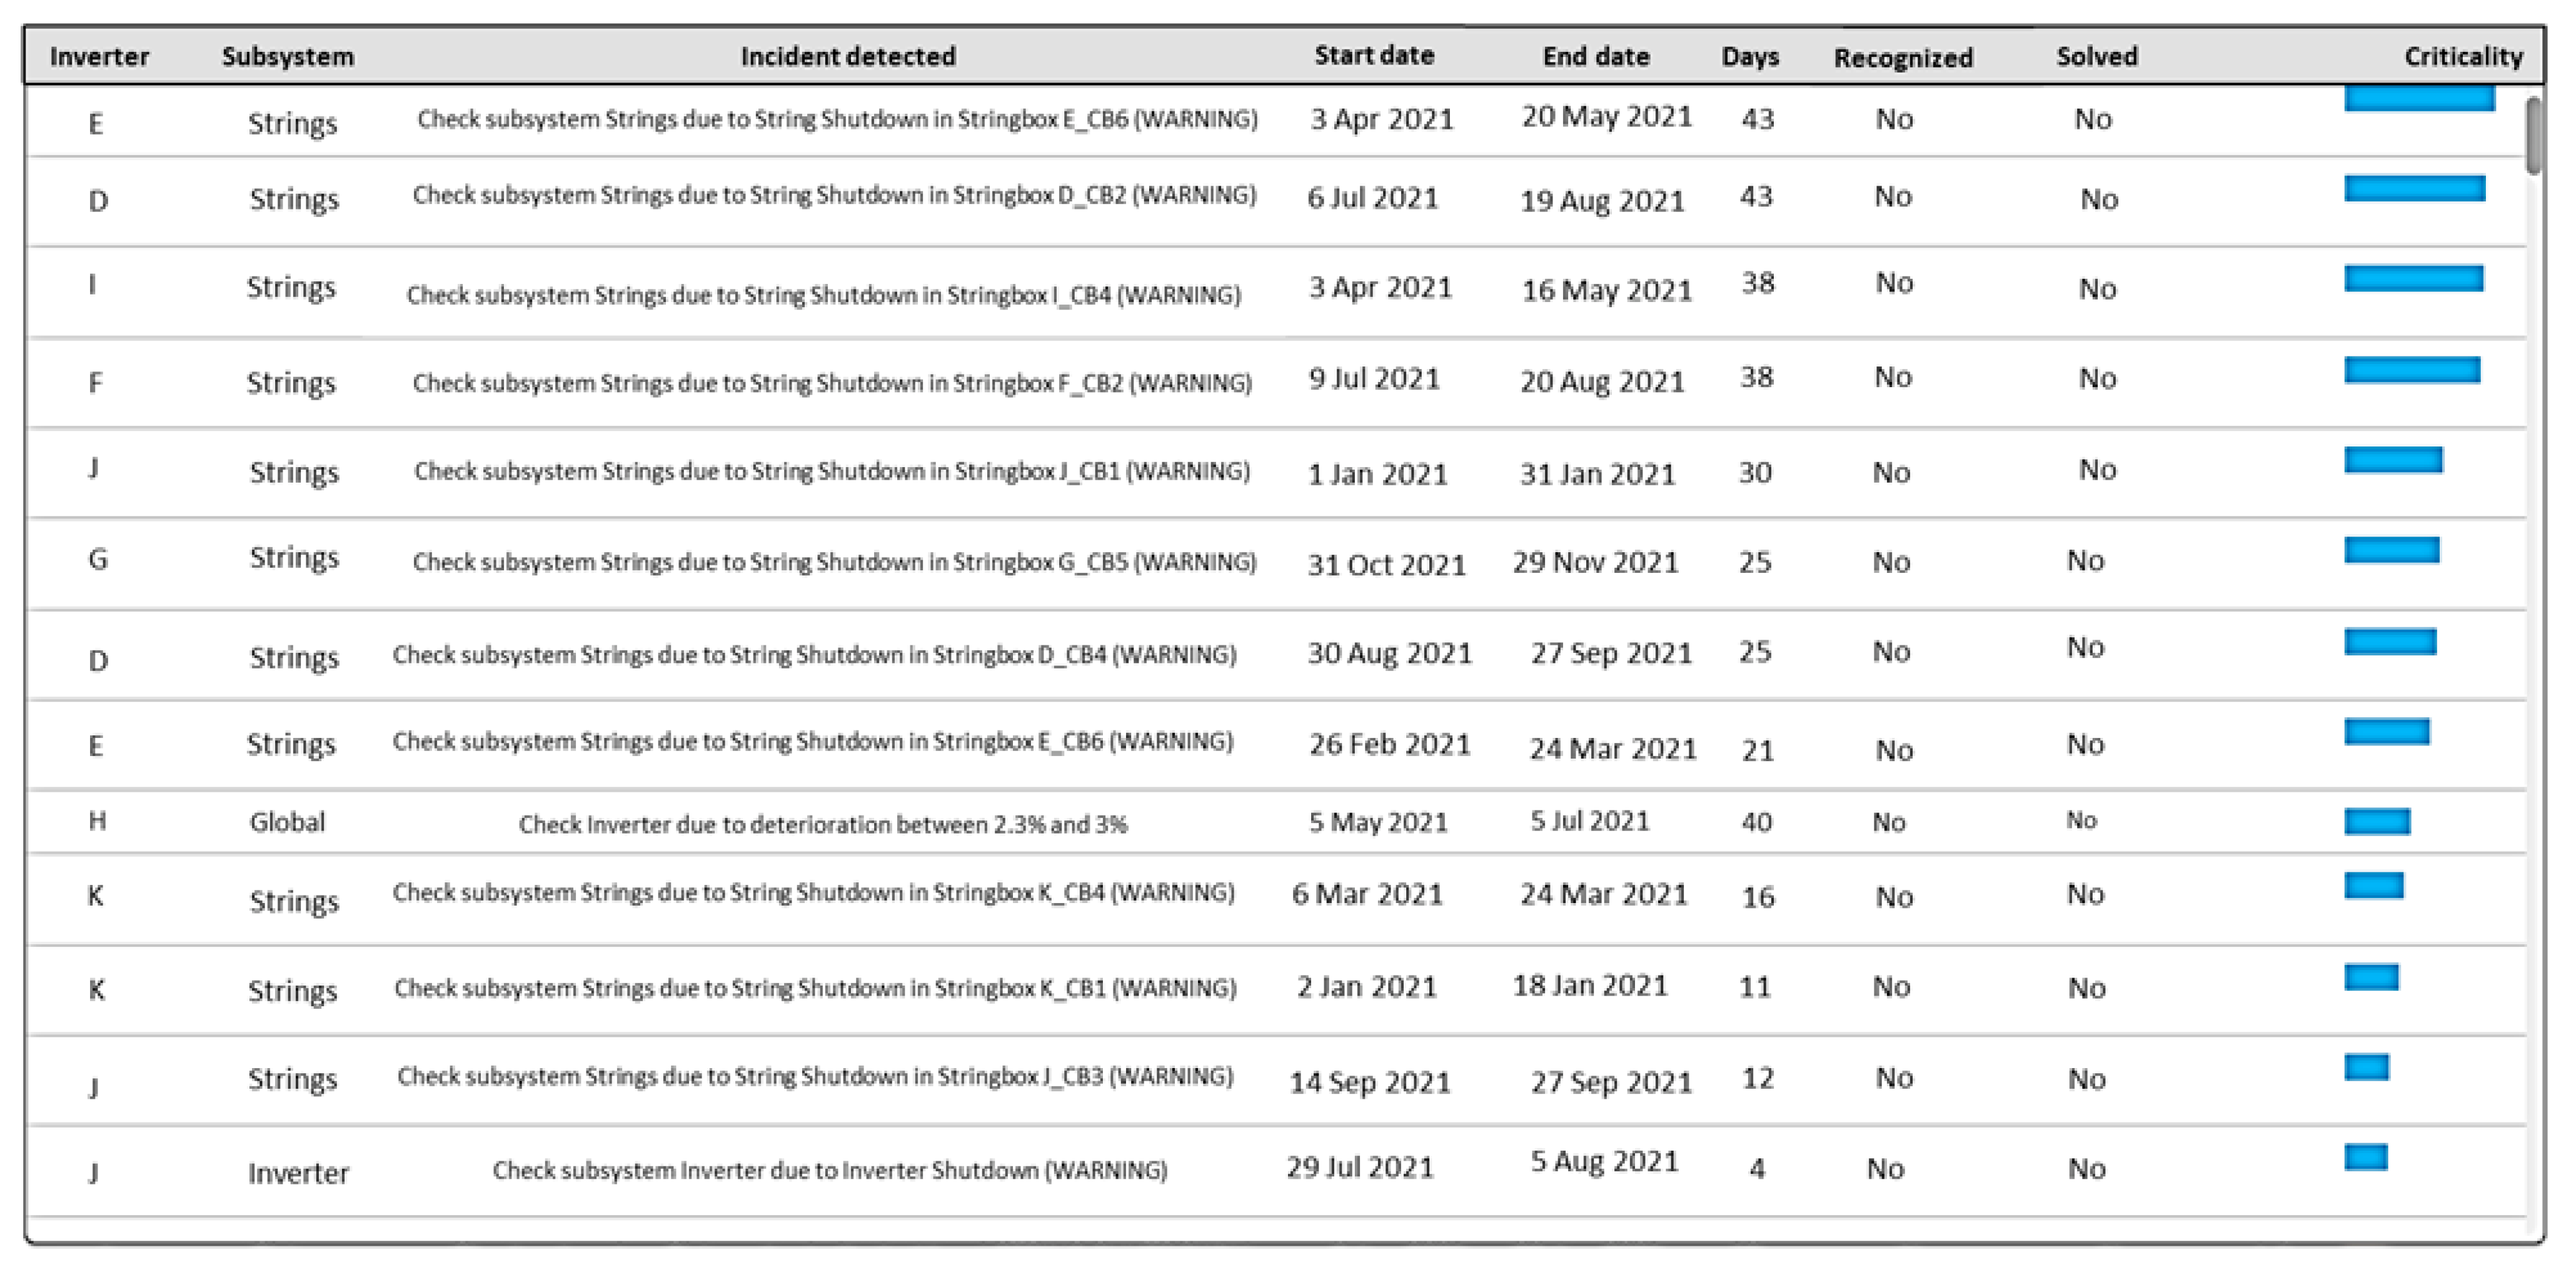
Using the FMECA analytical approach and the test PV plant’s O&M KPI, a criticality value was generated for each detected incident. A list of O&M recommendations was then generated by the DSS engine. A screenshot depicting the most important O&M recommendations (generated by the DSS engine) for optimizing the O&M activities and improving the performance of the test PV plant is shown in Figure 21.
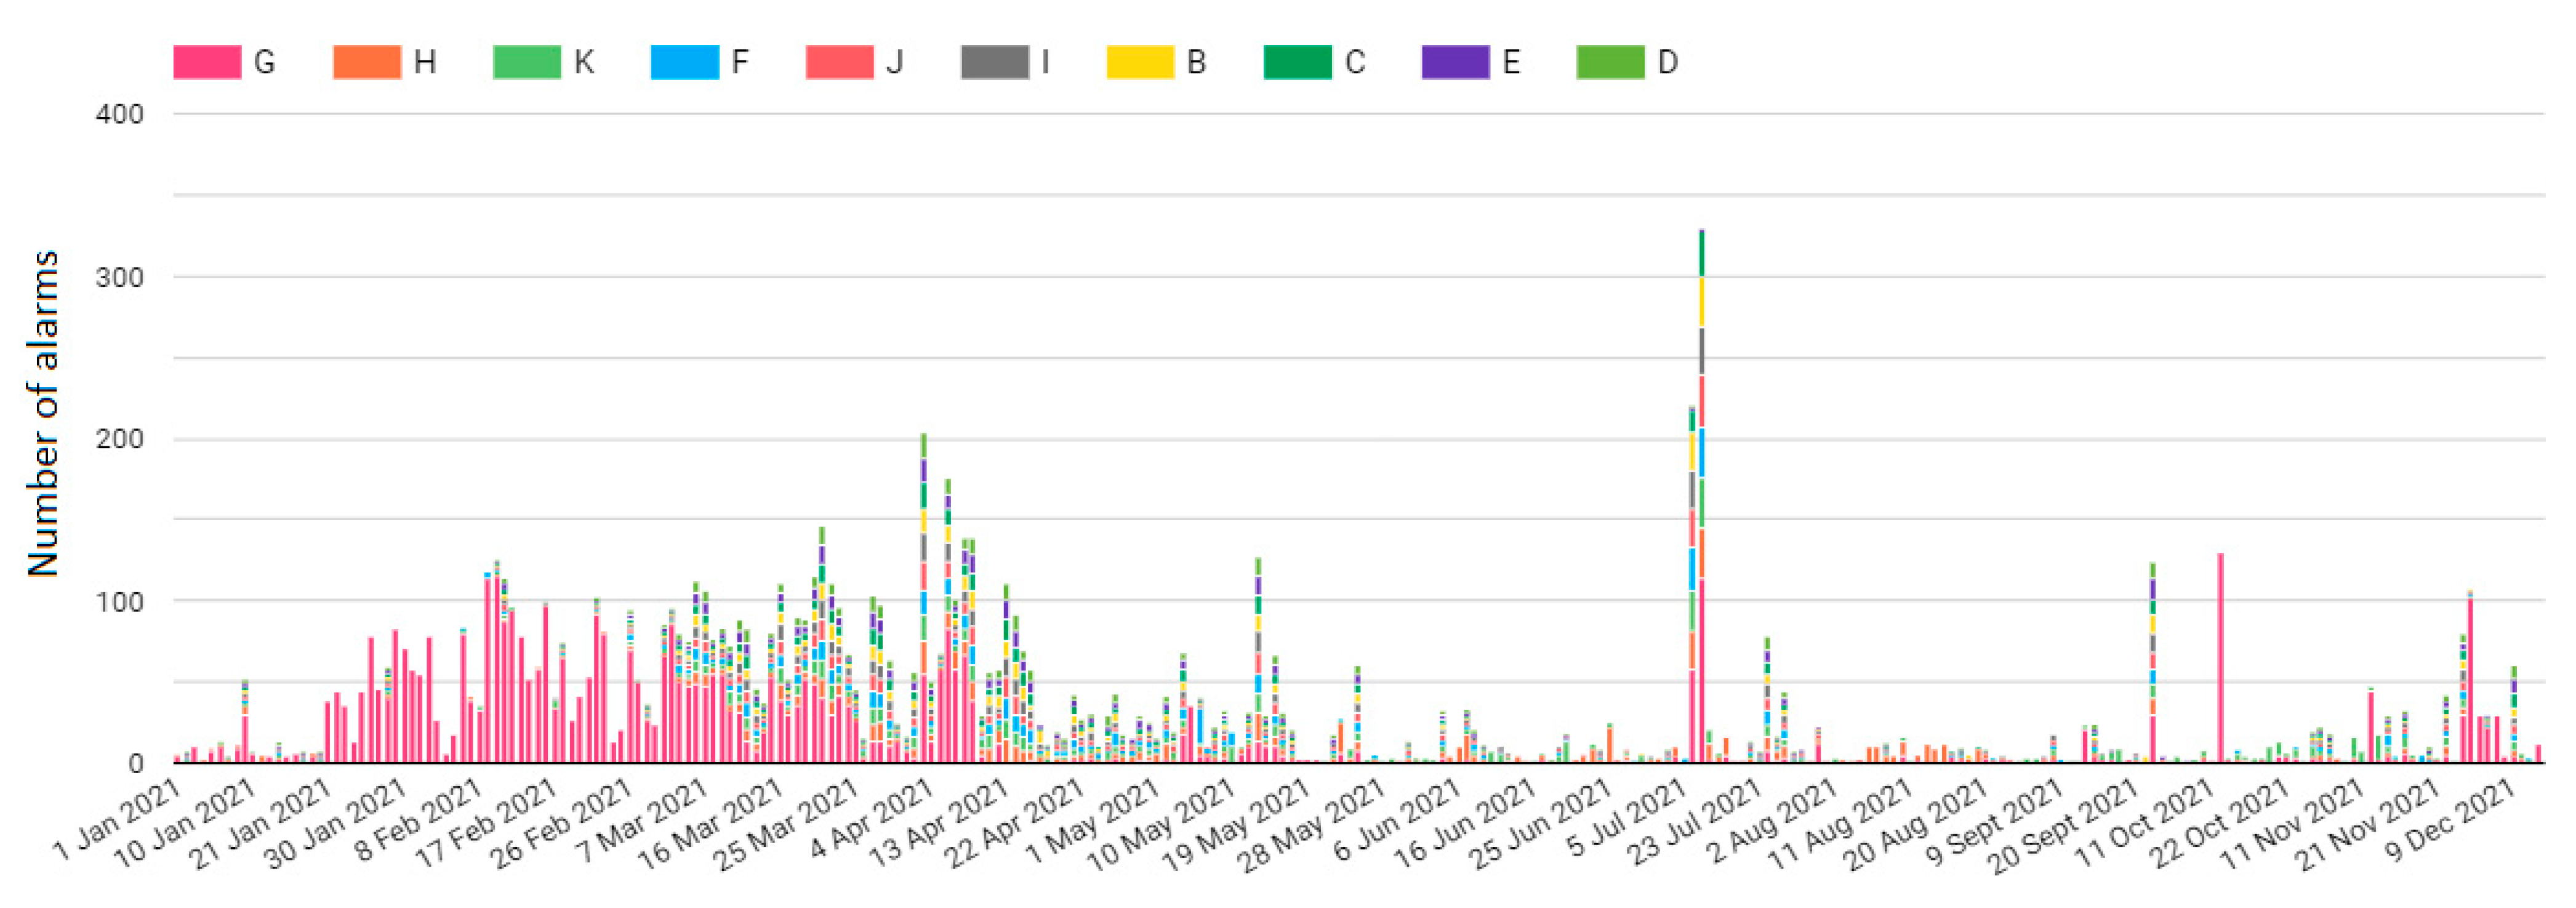
Finally, a statistical analysis of the alarms was performed. The alarm analysis includes the inverter alarms (failed and warnings) that appeared in SCADA and shows the total number (along with the type) of alarms per day and inverter. Over the evaluation period, most of the failed alarms occurred at inverter G (see Figure 22).
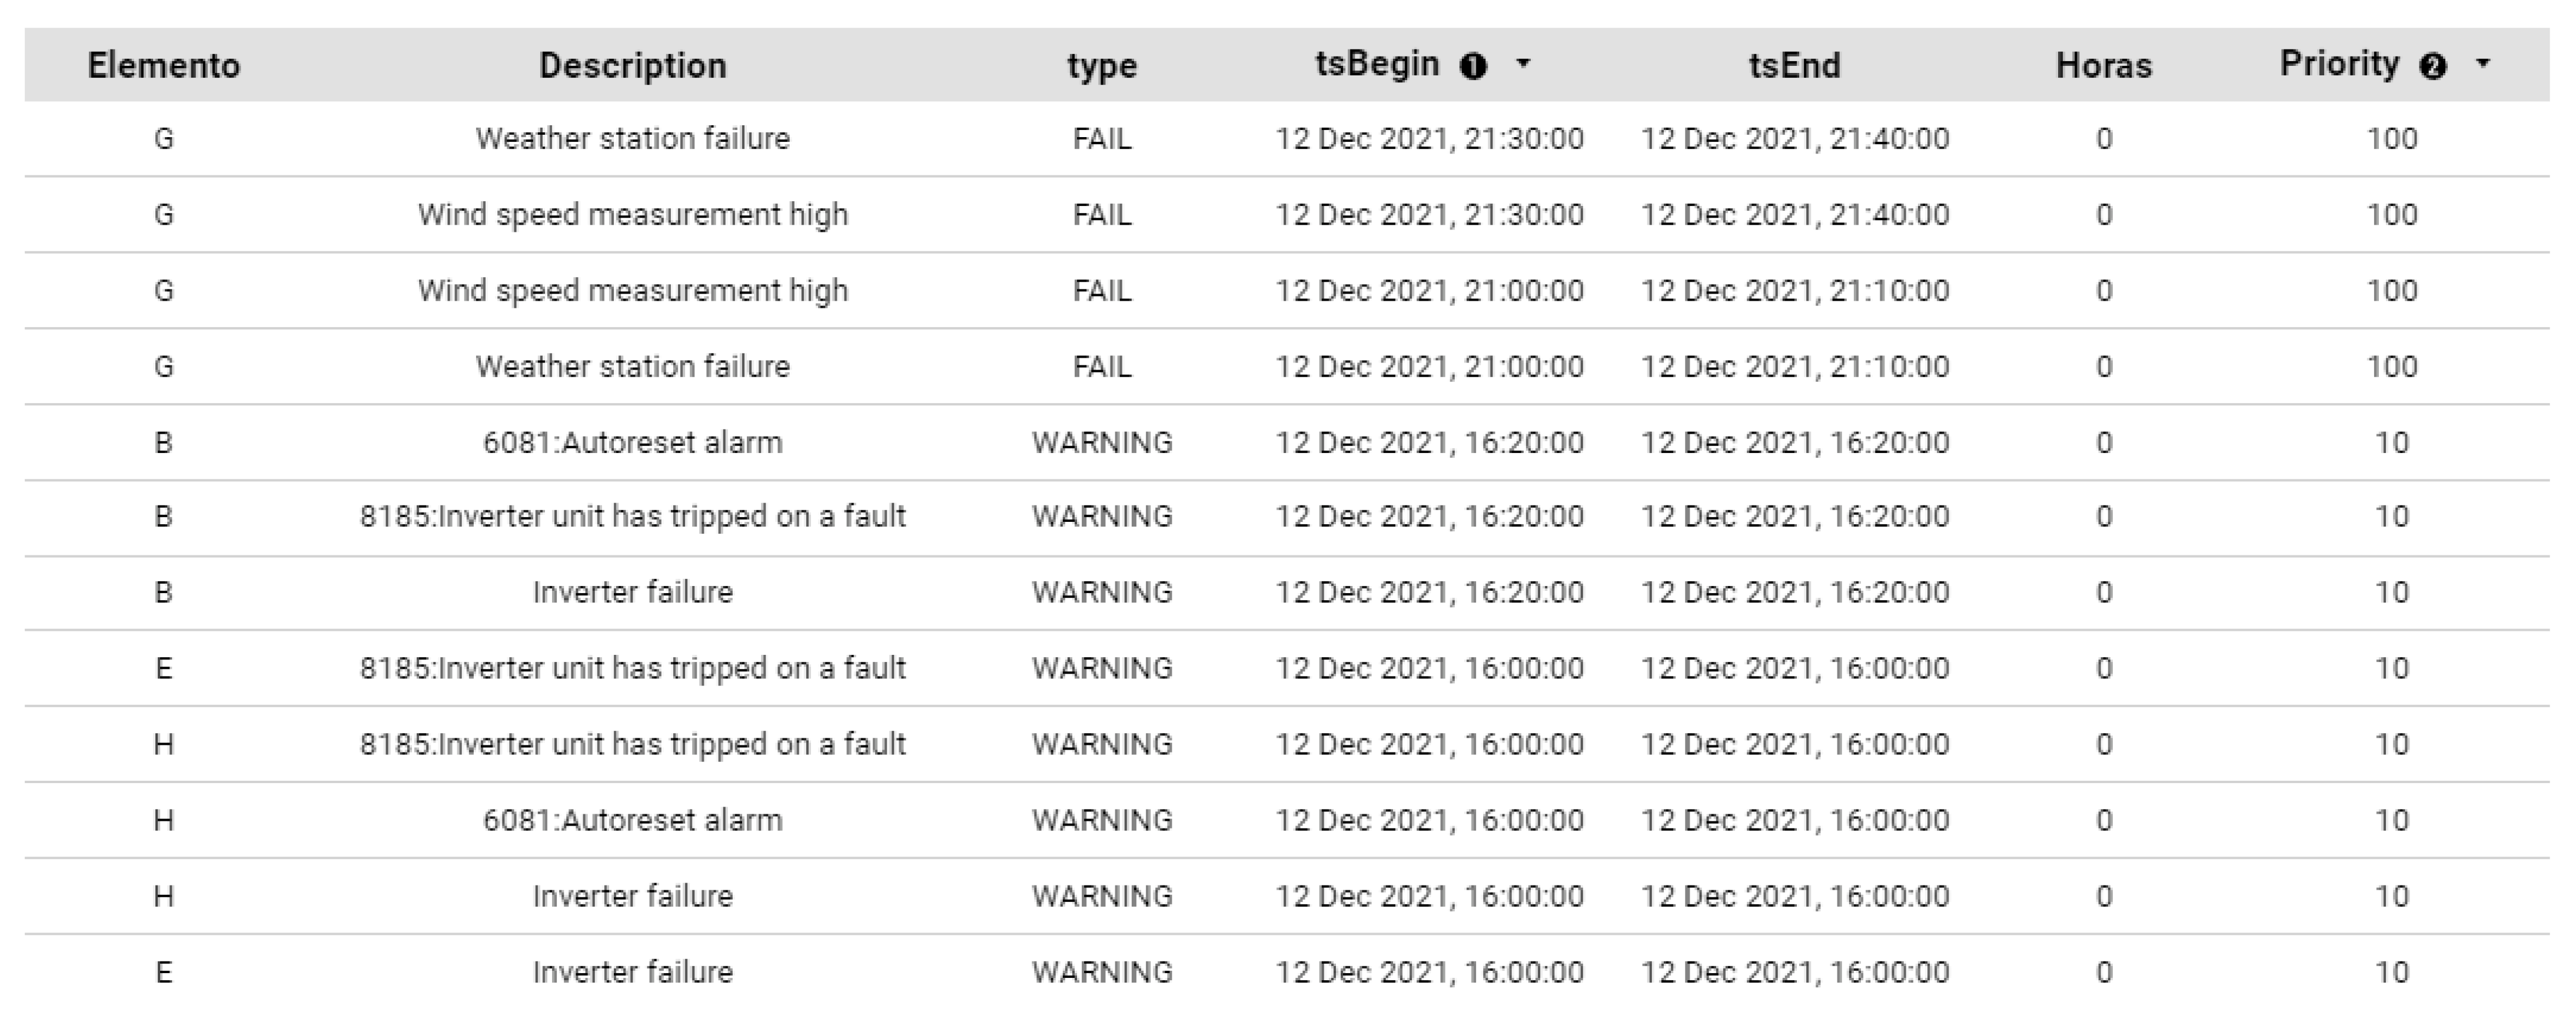
The reported alarms were mainly due to communication errors, link and weather station failures (i.e., missing wind speed and temperature measurements), inverter failures, and deviation of measured from estimated power. The most recent alarms for the test PV power plant are shown in Figure 23.
3.5. Test Scenario—Recoverable Energy
A test scenario was finally assumed in order to estimate the recoverable energy for the test PV power plant. In particular, the recoverable energy was calculated using the resolution times specified in [19], where the time required to fix each fault type is stated, while the response time was defined as stated in the contract between the PV plant owner and the O&M company [23]. For the test PV plant, we assumed that the O&M contractor was obliged to react on alarms indicating faulty PV operation within a certain period of time (e.g., within 4 daytime hours when the entire PV plant is off, up to 24 h for more than 30% power loss, and finally within 36 h for 0 to 30% power loss), 7 days a week [23].
By addressing the DSS recommendations for resolving the detected issues, approximately 7% of the lost energy production per year could be recovered by performing corrective actions.
3.6. Discussion and Future Research Directions
In this work, a cloud-based platform was proposed for providing recommendations of actionable decisions to resolve underperformance issues in PV systems. Within this framework, the performed research work led to a technological development (i.e., the platform) that revealed useful information on how to improve a plant’s performance and reduce its O&M costs, which are critical for asset managers in their question for the operational excellence and profitability of the plant. In the course of this study, the following findings were obtained:
- The data issues (which were common and the most difficult to solve) included communication errors with the plant/inverter and sensors (e.g., irradiance and temperature) faulty operation. The data quality issues mainly occurred in March–April 2021 and September–December 2021. Overall, the quality of the data was good (93.08% of the given data points were classified as good quality), with just two main periods with a severe lack of data (i.e., null values/cells), representing a total of 15 days approximately over the entire year (4.04% of the total number of data points). This indicates a high-quality data acquisition system [5]. During the abovementioned periods (March–April 2021 and September–December 2021), as the irradiance data were missing, no results of the energy balance could be derived. The faulty irradiance sensor results are also in line with the findings of [6], where the authors stated that 35% of the investigated plants (75 in total from random geographically diverse utility-scale solar plants with a total capacity of 1.2 GW) had faulty irradiance sensors. On average there are three faulty sensors in each plant (27% of the sensors) [6].
- Over the evaluation period, the performance of solar field at the inverter level ranged from 92.48% to 94.68%, while the efficiency of each inverter ranged from 94.78% to 98.03%. The obtained results were a bit lower with respect to the manufacturer’s specifications (97% and 98.70%, respectively).
- Different underperformance issues were detected in the test PV plant by applying outlier detection, ML, and comparative algorithms. The detected issues were attributed to different solar-field- and inverter-related problems.
- The main energy losses occurred in the solar field, accounting for 1464 MWh (or 90.5% of the total losses) of lost energy. Conversely, inverter-related losses accounted for 153.5 MWh (or equivalent to 9.5%). These findings are in line with reports and articles published in the literature [6,19] that state that most of the technical issues that affect PV plant power production are PV-module-related problems and failures.
- The main underperformance incidents detected in the test PV plant over the reporting period were string and inverter shutdowns, accounting for 244.5 MWh (or 1.67% of the total energy production) of lost energy. According to [6], 55% of the investigated plants had inverters operating below their specifications, and on average, there are 20 inverters below the Euro Efficiency spec (17% of the inverters) in a typical plant of 16.10 MWp. Furthermore, 65% of the investigated plants had disconnected strings, and on average, there are 11 disconnected strings in each plant (0.7% of the strings) [6].
- The inverters exhibited PR values higher than 0.80, with an average PR value of 0.88 during the test period. The extracted average PR value is within the expected limits and indicates the high-performance of the test PV plant [43]. PR values reported in the literature varied between 0.50 and 0.75 in the late 1980s, via 0.70 and 0.80 in the 1990s, to higher than 0.80 today. There is a clear upward trend towards a better PR for the newer PV installations (reaching PR values up to 0.95 [41]) compared to the early PV systems.
- The test PV plant produced 12,586 MWh (85.70%) over the 1-year evaluation period, while the detected incidents (i.e., inverter failures, PV module faults and string disconnections) accounted for 2100 MWh (14.30%) of lost energy. Similar results were obtained in [35], in which the stochastic simulations using the System Advisor Model’s (SAM’s) PV Reliability and Performance Model (PV-RPM) [44,45] resulted in a 0.13 fraction of energy lost.
- The test scenario revealed that approximately 7% of lost energy production could be recovered by performing corrective actions. This is in line with the results published in a recent industry benchmark study [6] that demonstrated that the average recoverable energy of a PV plant is 5.27%.
Overall, the developed platform was successfully validated in an operating PV power plant. The platform manages the complete process of acquisition and standardization of plant data on a cloud platform, validation and cleaning of the received information, identification of normal and abnormal behaviors, detection of failures and problems, generation of recommendations for maintenance, and prioritization of actions and follow-up. The platform uses statistical and comparative approaches and ML models to diagnose and capture accurately the behavior of PV systems for optimal plant maintenance.
The use of the developed platform (and/or its data-driven functionalities for detecting and resolving fault events) in operating PV plants could lead to production and revenue improvements, maximization of the return on investment (ROI) and minimization of power production (and hence financial) losses. Although promising results were obtained from the benchmarking procedure on a test PV power plant, the platform lacks extensive benchmarking in multiple locations/climates, which could be a focus of future work. To align with the current advances in the field of ML and the rapid developments of AI, the authors also intend to integrate additional AI preventive and predictive functionalities into the developed cloud-based solution for PV asset diagnosis and maintenance. The application of AI and ML for failure detection and prediction could further contribute to lowering the cost of O&M, and hence the LCOE.
4. Conclusions
Improving the plant performance and reducing PV O&M costs are critical for asset managers in their quest for the operational excellence and profitability of the plant. In this work, a cloud-based platform architecture was developed for improved PV performance. It was validated in a real environment that manages the complete process of acquisition and standardization of plant data on a cloud platform, validation, and cleaning of the received information, identification of failures, generation of recommendations for maintenance and prioritization of actions and follow-up.
The obtained results show the efficacy of the data-driven functionalities for raw data cleansing, as well as the system’s capabilities for automated failure diagnosis. Over the yearly evaluation period, the detected incidents accounted for 2100 MWh (or 14.30% of the total energy production) of lost energy. Based on the recommendations provided by the DSS engine, approximately 7% of the lost energy production could be recovered by performing corrective actions.
Finally, the results highlighted the importance of DSS engines capable of automatically generating specific O&M actions for O&M cost reduction, and revenue and energy production optimization. Insights are also provided to the community regarding the complete procedure of developing an O&M DSS engine for PV systems.
Author Contributions
Conceptualization, A.L., G.T., J.G.F. and R.G.B.; methodology, A.L. and R.G.B.; software, J.G.F. and R.G.B.; validation, J.G.F. and R.G.B.; formal analysis, A.L., G.T., J.G.F. and R.G.B.; investigation, A.L. and G.T.; writing—original draft preparation, A.L., G.T. and R.G.B.; writing—review and editing, A.L., J.G.F. and G.E.G.; visualization, J.G.F. and R.G.B.; supervision, J.G.F. and G.E.G.; project administration, J.G.F. and G.E.G.; funding acquisition, J.G.F. and G.E.G., All authors have read and agreed to the published version of the manuscript.
Funding
This research was funded by the 1C4PV SOLAR-ERA.NET project and the Research and Innovation Foundation (RIF) of Cyprus (RIF project number: P2P/SOLAR/0818/0010).
Data Availability Statement
Restrictions apply to the availability of the test PV plant data. The data were obtained from TEGNATIA ENERJI ÜRETIM SAN. VE TIC and are only available on request from the company. The data are not publicly available due to privacy reasons.
Acknowledgments
This work was funded by the 1C4PV project. Project 1C4PV is supported under the umbrella of SOLAR-ERA.NET Cofund 2 by the Centro para el Desarrollo Tecnológico Industrial (CDTI), the Scientific and Technological Research Council of Turkey and the Research and Innovation Foundation (RIF) of Cyprus. SOLAR-ERA.NET is supported by the European Commission within the EU Framework Programme for Research and Innovation HORIZON 2020 (Cofund 2 ERA-NET Action, No. 786483). TEGNATIA ENERJI ÜRETIM SAN. VE TIC. is kindly acknowledged for providing the field data of the test PV plant.
Conflicts of Interest
The authors declare no conflict of interest.
Abbreviations
The following abbreviations were used in this manuscript:
| AE | Absolute Error |
| API | Application Programming Interface |
| AI | Artificial Intelligence |
| CSV | Comma-Separated Values |
| DSS | Decision Support System |
| ETL | Extract, Transform and Load |
| FMECA | Failure Mode, Effects and Criticality Analysis |
| GCP | Google Cloud Platform |
| IGBT | Insulated-Gate Bipolar Transistor |
| KPI | Key Performance Indicators |
| LCOE | Levelized Cost of Electricity |
| ML | Machine Learning |
| O&M | Operation and Maintenance |
| PR | Performance Ratio |
| PV-RPM | Photovoltaic Reliability and Performance Model |
| PV | Photovoltaic |
| SaaS | Software as a Service |
| STC | Standard Test Conditions |
| SQL | Structured Query Language |
| SCADA | Supervisory Control and Data Acquisition |
| SAM’s | System Advisor Model’s |
| TL | Threshold Level |
| VM | Virtual Machines |
References
- Livera, A.; Theristis, M.; Makrides, G.; Georghiou, G.E. Georghiou, Recent advances in failure diagnosis techniques based on performance data analysis for grid-connected photovoltaic systems. Renew. Energy 2018, 133, 126–143. [Google Scholar] [CrossRef]
- Livera, A.; Theristis, M.; Koumpli, E.; Theocharides, S.; Makrides, G.; Sutterlueti, J.; Stein, J.S.; Georghiou, G.E. Data processing and quality verification for improved photovoltaic performance and reliability analytics. Prog. Photovolt. Res. Appl. 2020, 29, 143–158. [Google Scholar] [CrossRef]
- Livera, A.; Theristis, M.; Charalambous, A.; Stein, J.S.; Georghiou, G.E. Decision support system for corrective maintenance in large-scale photovoltaic systems. In Proceedings of the 48th IEEE Photovoltaic Specialists Conference, Fort Lauderdale, FL, USA, 20–25 June 2021; pp. 0306–0311. [Google Scholar] [CrossRef]
- Woyte, A.; Richter, M.; Moser, D.; Mau, S.; Reich, N.; Jahn, U. Monitoring of photovoltaic systems: Good practices and systematic analysis. In Proceedings of the 28th European Photovoltaic Solar Energy Conference, Paris, France, 30 September–4 October 2013; pp. 3686–3694. [Google Scholar] [CrossRef]
- Woyte, A.; Richter, M.; Moser, D.; Reich, N.; Green, M.; Mau, S. Analytical Monitoring of Grid-Connected Photovoltaic Systems: Good Practices for Monitoring and Performance Analysis; IEA-PVPS Task 13, Subtask 2; Tech. Rep. IEA-PVPS T13-03:2014; International Energy Agency: Paris, France, 2014. [Google Scholar] [CrossRef]
- Raycatch. White Paper: Solar Asset Optimization—Industry Benchmark Study; Technical Report; Raycatch: Tel Aviv, Israel, 2021. [Google Scholar]
- Manzano, S.; Peña, R.; Guevara, D.; Ríos, A. An Overview of Remote Monitoring PV Systems: Acquisition, Storages, Processing and Publication of Real-Time Data Based on Cloud Computing. In Proceedings of the 4th Solar Integration Workshop, Berlin, Germany, 10–11 November 2014. [Google Scholar]
- Kilper, T.; Kruse, I.; Feser, C.; Kirstein, U.; Peters, D.; Tapia, M.; Von Maydell, K.; Yilmaz, S.; Behrens, G. A New Generation of PV Monitoring System with High-Grade Remote Diagnostics Based on Module Level Monitoring and Integrated Yield Simulation. In Proceedings of the 30th European Photovoltaic Solar Energy Conference and Exhibition, Hamburg, Germany, 14–18 September 2015; pp. 1679–1682. [Google Scholar] [CrossRef]
- Monitoring State of the Art Monitoring and Alerting Capabilities. Available online: https://alectris.com/monitoring/ (accessed on 21 March 2019).
- Sunsniffer. Transforming PV O&M with Advanced Analytics—A SunSniffer White Paper; SunSniffer: Nürnberg, Germany, 2020. [Google Scholar]
- Kumar, S.S.; Selvakumar, A.I. Detection of the faults in the photovoltaic array under normal and partial shading conditions. In Proceedings of the 2017 Innovations in Power and Advanced Computing Technologies (i-PACT) 2017, Vellore, India, 21–22 April 2017; pp. 1–5. [Google Scholar] [CrossRef]
- Jones, C.B.; Stein, J.S.; Gonzalez, S.; King, B.H. Photovoltaic system fault detection and diagnostics using Laterally Primed Adaptive Resonance Theory neural network. In Proceedings of the 42nd IEEE Photovoltaic Specialists Conference, New Orleans, LA, USA, 14–19 June 2015. [Google Scholar] [CrossRef]
- Dhimish, M.; Holmes, V.; Mehrdadi, B.; Dales, M. Comparing Mamdani Sugeno fuzzy logic and RBF ANN network for PV fault detection. Renew. Energy 2018, 117, 257–274. [Google Scholar] [CrossRef] [Green Version]
- Mansouri, M.; Hajji, M.; Trabelsi, M.; Harkat, M.F.; Al-Khazraji, A.; Livera, A.; Nounou, H.; Nounou, M. An effective statistical fault detection technique for grid connected photovoltaic systems based on an improved generalized likelihood ratio test. Energy 2018, 159, 842–856. [Google Scholar] [CrossRef]
- Micheli, L.; Theristis, M.; Livera, A.; Stein, J.S.; Georghiou, G.E.; Muller, M.; Almonacid, F.; Fernandez, E.F. Improved PV Soiling Extraction through the Detection of Cleanings and Change Points. IEEE J. Photovolt. 2021, 11, 519–526. [Google Scholar] [CrossRef]
- Florides, M.; Livera, A.; Makrides, G.; Georghiou, G.E. Shunt Resistance Relation to Power Loss due to Potential Induced Degradation in Crystalline Photovoltaic Cells. In Proceedings of the 46th IEEE Photovoltaic Specialists Conference, Chicago, IL, USA, 16–21 June 2019; pp. 1950–1954. [Google Scholar] [CrossRef]
- Zuniga-Reyes, M.-A.; Robles-Ocampo, J.-B.; Sevilla-Camacho, P.-Y.; Rodriguez-Resendiz, J.; Lastres-Danguillecourt, O.; Conde-Diaz, J.-E. Photovoltaic Failure Detection Based on String-Inverter Voltage and Current Signals. IEEE Access 2021, 9, 39939–39954. [Google Scholar] [CrossRef]
- Akram, M.N.; Lotfifard, S. Modeling and Health Monitoring of DC Side of Photovoltaic Array. IEEE Trans. Sustain. Energy 2015, 6, 1245–1253. [Google Scholar] [CrossRef]
- Moser, D.; Del Buono, M.; Jahn, U.; Herz, M.; Richter, M.; De Brabandere, K. Identification of technical risks in the photovoltaic value chain and quantification of the economic impact. Prog. Photovolt. Res. Appl. 2017, 25, 592–604. [Google Scholar] [CrossRef]
- Colli, A. Failure mode and effect analysis for photovoltaic systems. Renew. Sustain. Energy Rev. 2015, 50, 804–809. [Google Scholar] [CrossRef]
- Sarr, O.N.; Barro, F.I.; Niasse, O.A.; Dia, F.; Mbengue, N.; Ba, B.; Sene, C. Analysis of Failure Modes Effect and Criticality Analysis (FMECA): A Stand-Alone Photovoltaic System. Sci. J. Energy Eng. 2017, 5, 40–47. [Google Scholar] [CrossRef] [Green Version]
- Di Lorenzo, G.; Araneo, R.; Mitolo, M.; Niccolai, A.; Grimaccia, F. Review of O&M Practices in PV Plants: Failures, Solutions, Remote Control, and Monitoring Tools. IEEE J. Photovolt. 2020, 10, 914–926. [Google Scholar] [CrossRef]
- SolarPower Europe [SPE]. Operation & Maintenance Best Practice Guidelines, version 5.0; SolarPower Europe: Brussels, Belgium, 2022. [Google Scholar]
- Louwen, A.; Koester, L.; Lindig, S.; Astigarraga, A.; Moser, D. V4.0: Combining Asset Management, PV Measurement Data and the Cost Priority Number Method in a Digital Infrastructure for PV Plant O&M. In Proceedings of the 37th European Photovoltaic Solar Energy Conference (EU PVSEC), Online, 7–11 September 2020; pp. 1378–1380. [Google Scholar] [CrossRef]
- Livera, A.; Franquelo, J.G.; Bernal, R.G.; Georghiou, G.E. Cloud-based decision support system for operation and maintenance in photovoltaic systems. In Proceedings of the 8th World Conference on Photovoltaic Energy Conversion, Milan, Italy, 26–30 September 2022. [Google Scholar]
- Isotrol, Bluence Asset Performance Diagnosis by Isotrol. 2018. Available online: https://bluence.isotrol.com/ (accessed on 10 August 2022).
- Copper, J.; Bruce, A.; Spooner, T.; Calais, M.; Pryor, T.; Watt, M. Australian Technical Guidelines for Monitoring and Analysing Photovoltaic Systems; Australian PV Institute (APVI): Sydney, Australia, 2013; pp. 1–44. [Google Scholar]
- IEC 61724-1:2021; Photovoltaic System Performance—Part 1: Monitoring. International Electrotechnical Commission (IEC): Geneva, Switzerland, 2021.
- Phinikarides, A.; Shimitra, C.; Bourgeon, R.; Koumparou, I.; Makrides, G.; Georghiou, G.E. Development of a novel web application for automatic photovoltaic system performance analysis and fault identification. In Proceedings of the 44th IEEE Photovoltaic Specialists Conference (PVSC), Washington, DC, USA, 25–30 June 2017; pp. 2298–2300. [Google Scholar] [CrossRef]
- Livera, A.; Paphitis, G.; Theristis, M.; Lopez-Lorente, J.; Makrides, G.; Georghiou, G.E. Photovoltaic system health-state architecture for data-driven failure detection. Solar 2022, 2, 81–98. [Google Scholar] [CrossRef]
- Livera, A.; Theristis, M.; Makrides, G.; Ransome, S.; Sutterlueti, J.; Georghiou, G.E. Optimal development of location and technology independent machine learning photovoltaic performance predictive models. In Proceedings of the 46th IEEE Photovoltaic Specialists Conference, Chicago, IL, USA, 16–21 June 2019; pp. 1270–1275. [Google Scholar] [CrossRef]
- Makrides, G.; Zinsser, B.; Schubert, M.; Georghiou, G.E. Energy yield prediction errors and uncertainties of different photovoltaic models. Prog. Photovolt. Res. Appl. 2011, 21, 500–516. [Google Scholar] [CrossRef]
- Livera, A.; Theristis, M.; Makrides, G.; Sutterlueti, J.; Georghiou, G.E. Advanced diagnostic approach of failures for grid-connected photovoltaic (PV) systems. In Proceedings of the 35th European Photovoltaic Solar Energy Conference (EU PVSEC), Brussels, Belgium, 24–28 September 2018; pp. 1548–1553. [Google Scholar] [CrossRef]
- Theristis, M.; Livera, A.; Jones, C.B.; Makrides, G.; Georghiou, G.E.; Stein, J.S. Nonlinear Photovoltaic Degradation Rates: Modeling and Comparison Against Conventional Methods. IEEE J. Photovolt. 2020, 10, 1112–1118. [Google Scholar] [CrossRef]
- Livera, A.; Theristis, M.; Micheli, L.; Fernandez, E.F.; Stein, J.S.; Georghiou, G.E. Operation and maintenance decision support system for photovoltaic systems. IEEE Access 2022, 10, 42481–42496. [Google Scholar] [CrossRef]
- Livera, A.; Florides, M.; Theristis, M.; Makrides, G.; Georghiou, G.E. Failure diagnosis of short- and open-circuit fault conditions in PV systems. In Proceedings of the 45th IEEE Photovoltaic Specialists Conference, Waikoloa, HI, USA, 10–15 June 2018; pp. 0739–0744. [Google Scholar] [CrossRef]
- Silvestre, S.; Chouder, A.; Karatepe, E. Automatic fault detection in grid connected PV systems. Sol. Energy 2013, 94, 119–127. [Google Scholar] [CrossRef]
- Ilse, K.; Micheli, L.; Figgis, B.W.; Lange, K.; Daßler, D.; Hanifi, H.; Wolfertstetter, F.; Naumann, V.; Hagendorf, C.; Gottschalg, R.; et al. Techno-Economic Assessment of Soiling Losses and Mitigation Strategies for Solar Power Generation. Joule 2019, 3, 2303–2321. [Google Scholar] [CrossRef] [Green Version]
- Deceglie, M.G.; Muller, M.; Defreitas, Z.; Kurtz, S. A scalable method for extracting soiling rates from PV production data. In Proceedings of the 43rd IEEE Photovoltaic Specialists Conference, Portland, OR, USA, 5–10 June 2016; pp. 2061–2065. [Google Scholar] [CrossRef]
- Girdharee Saran, Top 7 Advantages of Using Google Cloud Hosting. 2020. Available online: https://www.whizlabs.com/blog/google-cloud-hosting/ (accessed on 12 July 2022).
- Ascencio-Vásquez, J.; Brecl, K.; Topič, M. Methodology of Köppen-Geiger-Photovoltaic climate classification and implications to worldwide mapping of PV system performance. Sol. Energy 2019, 191, 672–685. [Google Scholar] [CrossRef]
- IEC 61724-1:2017; Photovoltaic System Performance—Part 1: Monitoring. International Electrotechnical Commission (IEC): Geneva, Switzerland, 2017.
- Khalid, A.M.; Mitra, I.; Warmuth, W.; Schacht, V. Performance ratio—Crucial parameter for grid connected PV plants. Renew. Sustain. Energy Rev. 2016, 65, 1139–1158. [Google Scholar] [CrossRef]
- Freeman, J.M.; Klise, G.T.; Walker, A.; Lavrova, O. Evaluating Energy Impacts and Costs from PV Component Failures. In Proceedings of the 2018 IEEE 7th World Conference on Photovoltaic Energy Conversion (WCPEC) (A Joint Conference of 45th IEEE PVSC, 28th PVSEC & 34th EU PVSEC), Waikoloa, HI, USA, 10–15 June 2018; pp. 1761–1765. [Google Scholar] [CrossRef]
- Miller, S.; Stein, J.S.; Granata, J. PV-RPM Demonstration Model User’s Guide, Sandia Report (SAND2011-8355P); Sandia National Laboratories: Albuquerque, NM, USA, 2011.
Figure 2.
Data process for the generation of O&M recommendations by the DSS engine.

Figure 4.
Data process for extracting/acquiring raw data using an ETL method and preparing them for the data quality analysis and execution of fault detection algorithms.
Figure 4.
Data process for extracting/acquiring raw data using an ETL method and preparing them for the data quality analysis and execution of fault detection algorithms.

Figure 5.
Process from problem detection to generation of recommendations.

Figure 6.
Definition of KPI for the generation of recommendations.

Figure 7.
Time series by sensor at the inverter level over the evaluation period (January–December 2021).
Figure 7.
Time series by sensor at the inverter level over the evaluation period (January–December 2021).

Figure 8.
Weather sensor time series over the evaluation period (January–December 2021).

Figure 9.
Data quality of the test PV plant over the evaluation period (January–December 2021).

Figure 10.
Measured (blue lines) and predicted (red lines) DC power and voltage in January 2021.

Figure 11.
Inverter out-of-normality heatmap (patterns). For the selected period, an “Ok” (depicted in green color) was generated indicating the normality state for all inverters.
Figure 11.
Inverter out-of-normality heatmap (patterns). For the selected period, an “Ok” (depicted in green color) was generated indicating the normality state for all inverters.

Figure 12.
Behavior of signals on the inverter timeline.

Figure 13.
Out-of-normality heatmap (outliers). The heat map shows the criticality (using red color conditional formatting) that describes how much a variable deviates from the mean and the percentage of points detected as outliers in the selected period.
Figure 13.
Out-of-normality heatmap (outliers). The heat map shows the criticality (using red color conditional formatting) that describes how much a variable deviates from the mean and the percentage of points detected as outliers in the selected period.

Figure 14.
Signal comparison between inverters B–K (depicted by different colors) during the first week of January 2021.
Figure 14.
Signal comparison between inverters B–K (depicted by different colors) during the first week of January 2021.

Figure 15.
Inverter shutdown failures (colored in red) detected over the period from August to December 2021.
Figure 15.
Inverter shutdown failures (colored in red) detected over the period from August to December 2021.

Figure 16.
Inverter performance heat map (using red color conditional formatting) at STC over the evaluation period.
Figure 16.
Inverter performance heat map (using red color conditional formatting) at STC over the evaluation period.

Figure 17.
Solar field performance heat map (using red color conditional formatting) under optimal conditions over the evaluation period.
Figure 17.
Solar field performance heat map (using red color conditional formatting) under optimal conditions over the evaluation period.

Figure 18.
Detected incidents, amount and type of energy loss (depicted by different colors) at the inverter level over the evaluation period.
Figure 18.
Detected incidents, amount and type of energy loss (depicted by different colors) at the inverter level over the evaluation period.

Figure 19.
Weather-corrected PR time series of each inverter over the evaluation period.

Figure 20.
Energy loss breakdown (given by different colors) for the test PV plant over the evaluation period (January to December 2021).
Figure 20.
Energy loss breakdown (given by different colors) for the test PV plant over the evaluation period (January to December 2021).

Figure 21.
Screenshot depicting some of the O&M recommendations generated by the DSS engine, along with the criticality value assignation for the detected incidents.
Figure 21.
Screenshot depicting some of the O&M recommendations generated by the DSS engine, along with the criticality value assignation for the detected incidents.

Figure 22.
Statistical analysis of the inverter failure alarms for the test PV plant over the course of the evaluation period.
Figure 22.
Statistical analysis of the inverter failure alarms for the test PV plant over the course of the evaluation period.

Figure 23.
Chronology of daily alarms by element for the test PV plant over the evaluation period.

Publisher’s Note: MDPI stays neutral with regard to jurisdictional claims in published maps and institutional affiliations. |
© 2022 by the authors. Licensee MDPI, Basel, Switzerland. This article is an open access article distributed under the terms and conditions of the Creative Commons Attribution (CC BY) license (https://creativecommons.org/licenses/by/4.0/).
Share and Cite
MDPI and ACS Style
Livera, A.; Tziolis, G.; Franquelo, J.G.; Bernal, R.G.; Georghiou, G.E. Cloud-Based Platform for Photovoltaic Assets Diagnosis and Maintenance. Energies 2022, 15, 7760. https://doi.org/10.3390/en15207760
AMA Style
Livera A, Tziolis G, Franquelo JG, Bernal RG, Georghiou GE. Cloud-Based Platform for Photovoltaic Assets Diagnosis and Maintenance. Energies. 2022; 15(20):7760. https://doi.org/10.3390/en15207760
Chicago/Turabian StyleLivera, Andreas, Georgios Tziolis, Jose G. Franquelo, Ruben Gonzalez Bernal, and George E. Georghiou. 2022. "Cloud-Based Platform for Photovoltaic Assets Diagnosis and Maintenance" Energies 15, no. 20: 7760. https://doi.org/10.3390/en15207760
Note that from the first issue of 2016, this journal uses article numbers instead of page numbers. See further details here.