
Integrated Bioinformatics Analysis Identified ASNS and DDIT3 as the Therapeutic Target in Castrate-Resistant Prostate Cancer
 ,
,  and
and
Abstract
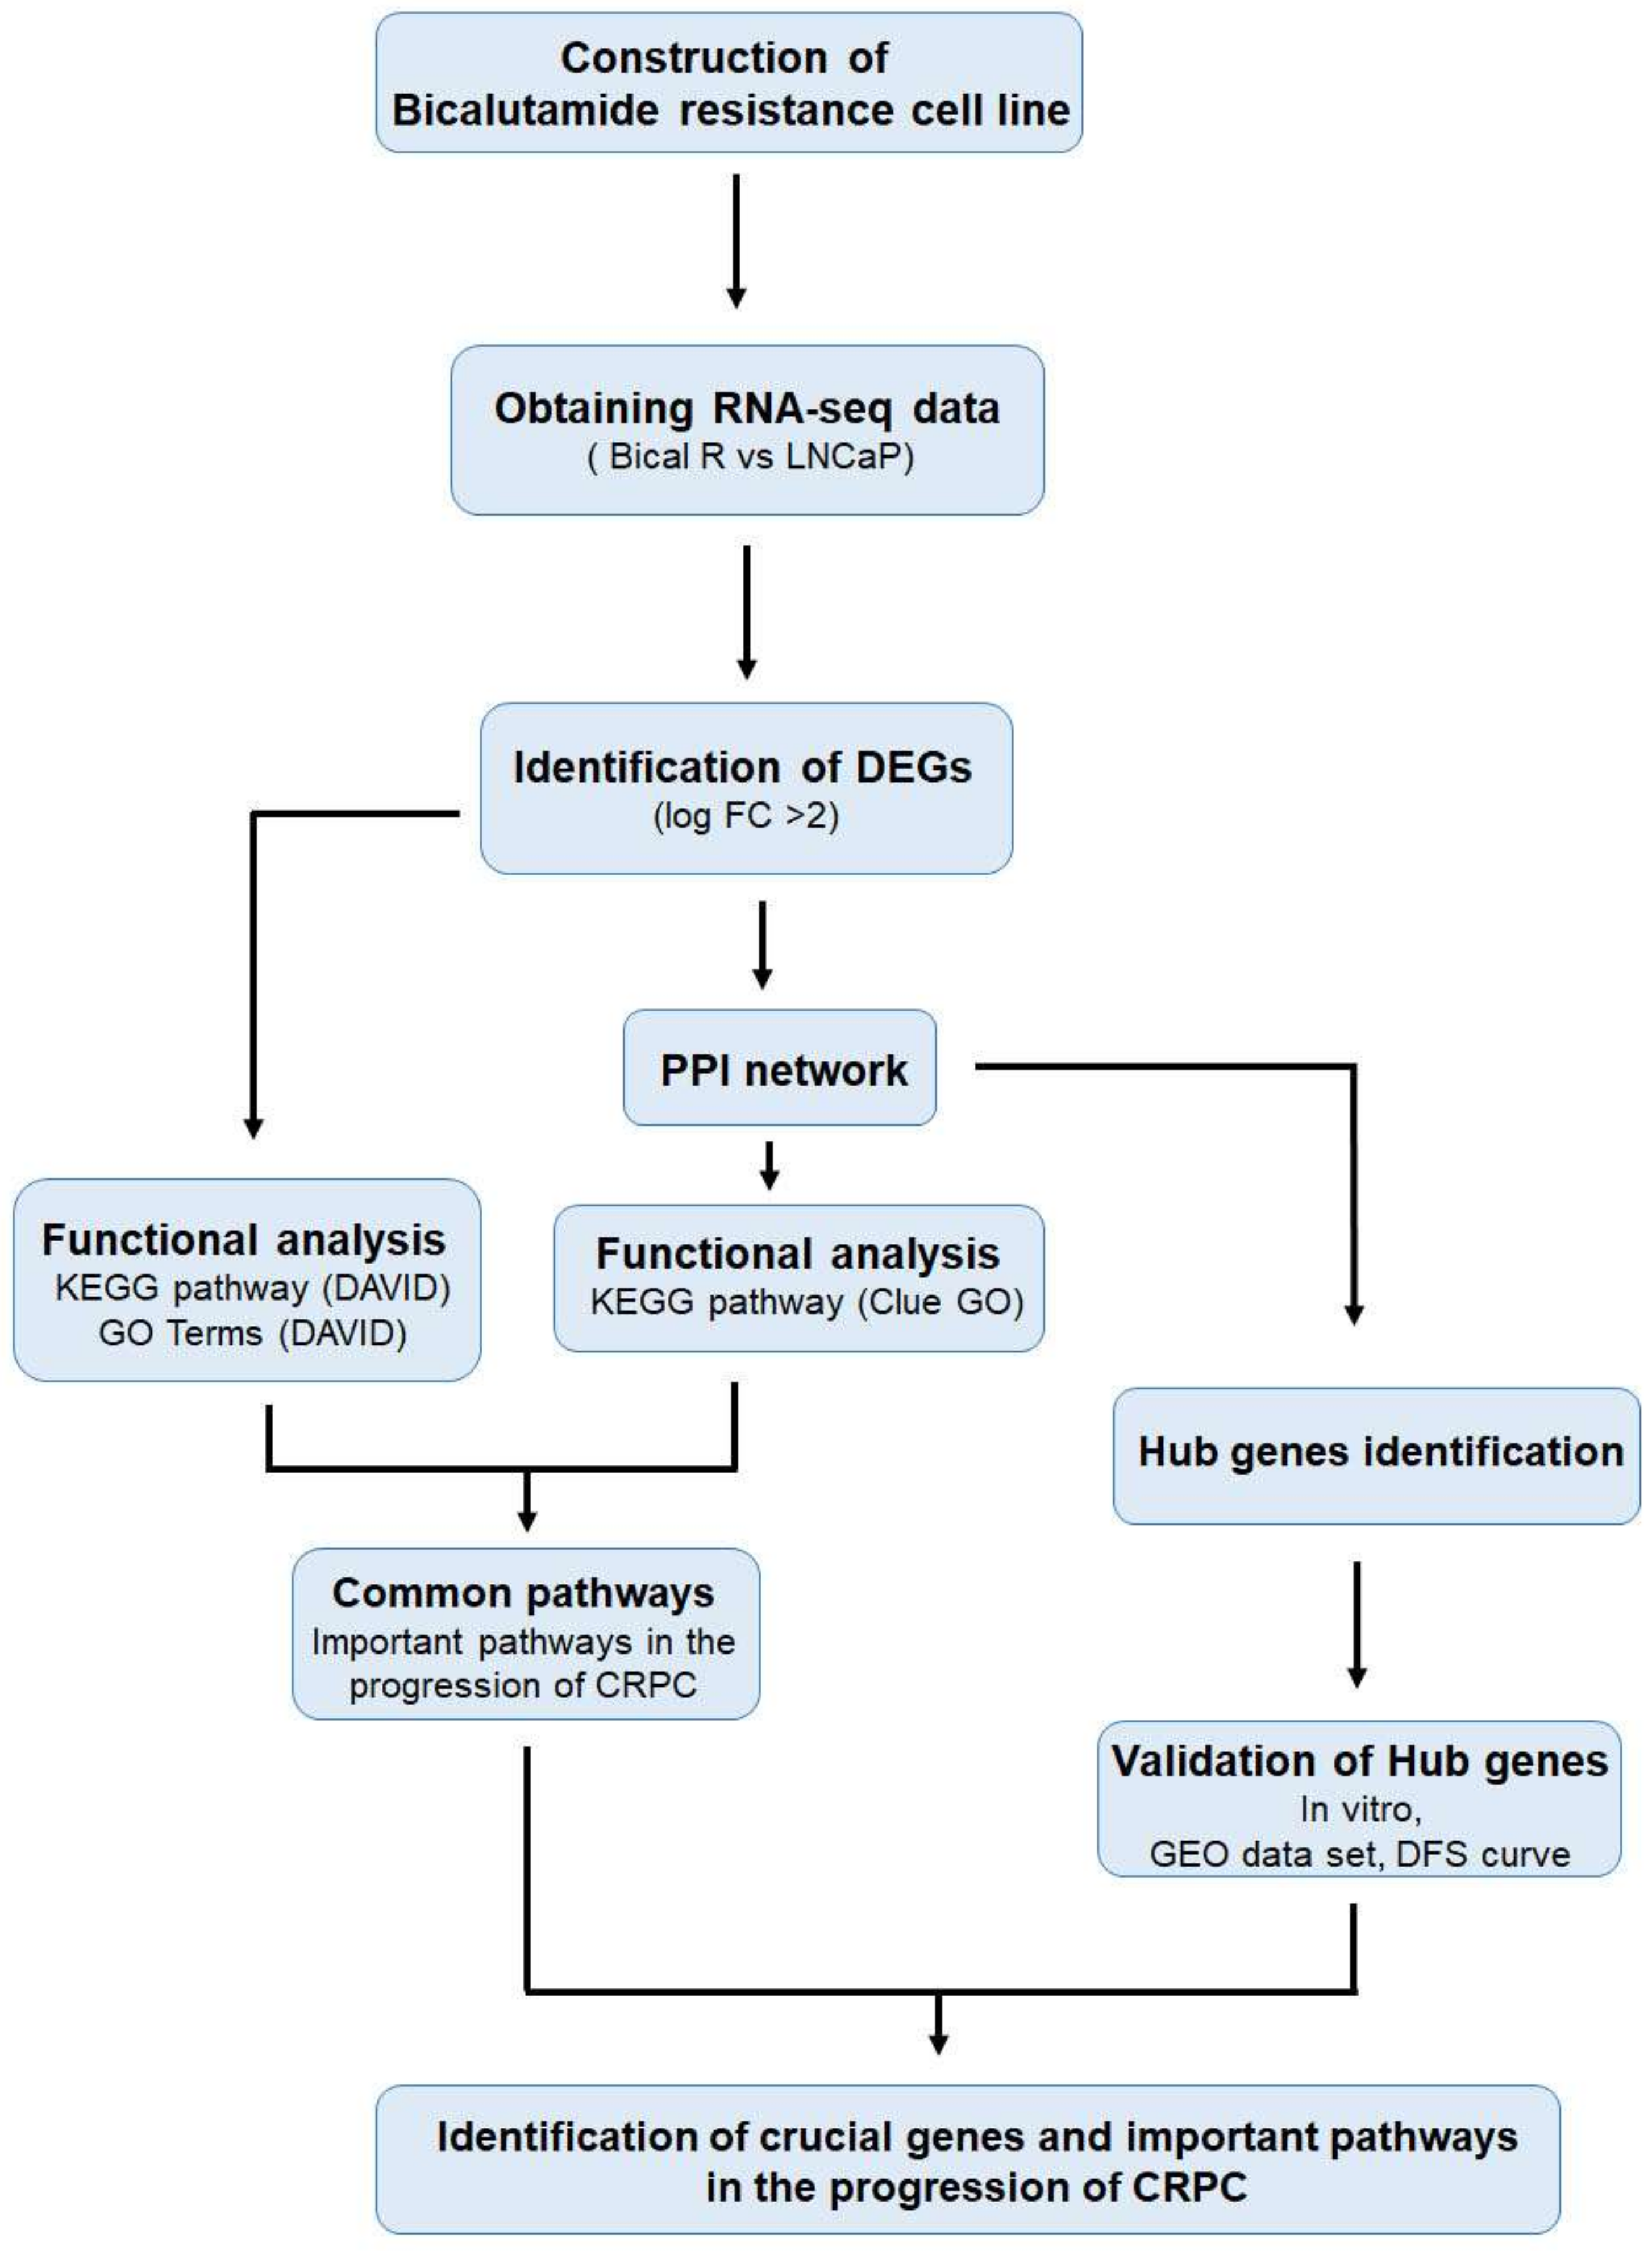
:1. Introduction
2. Results
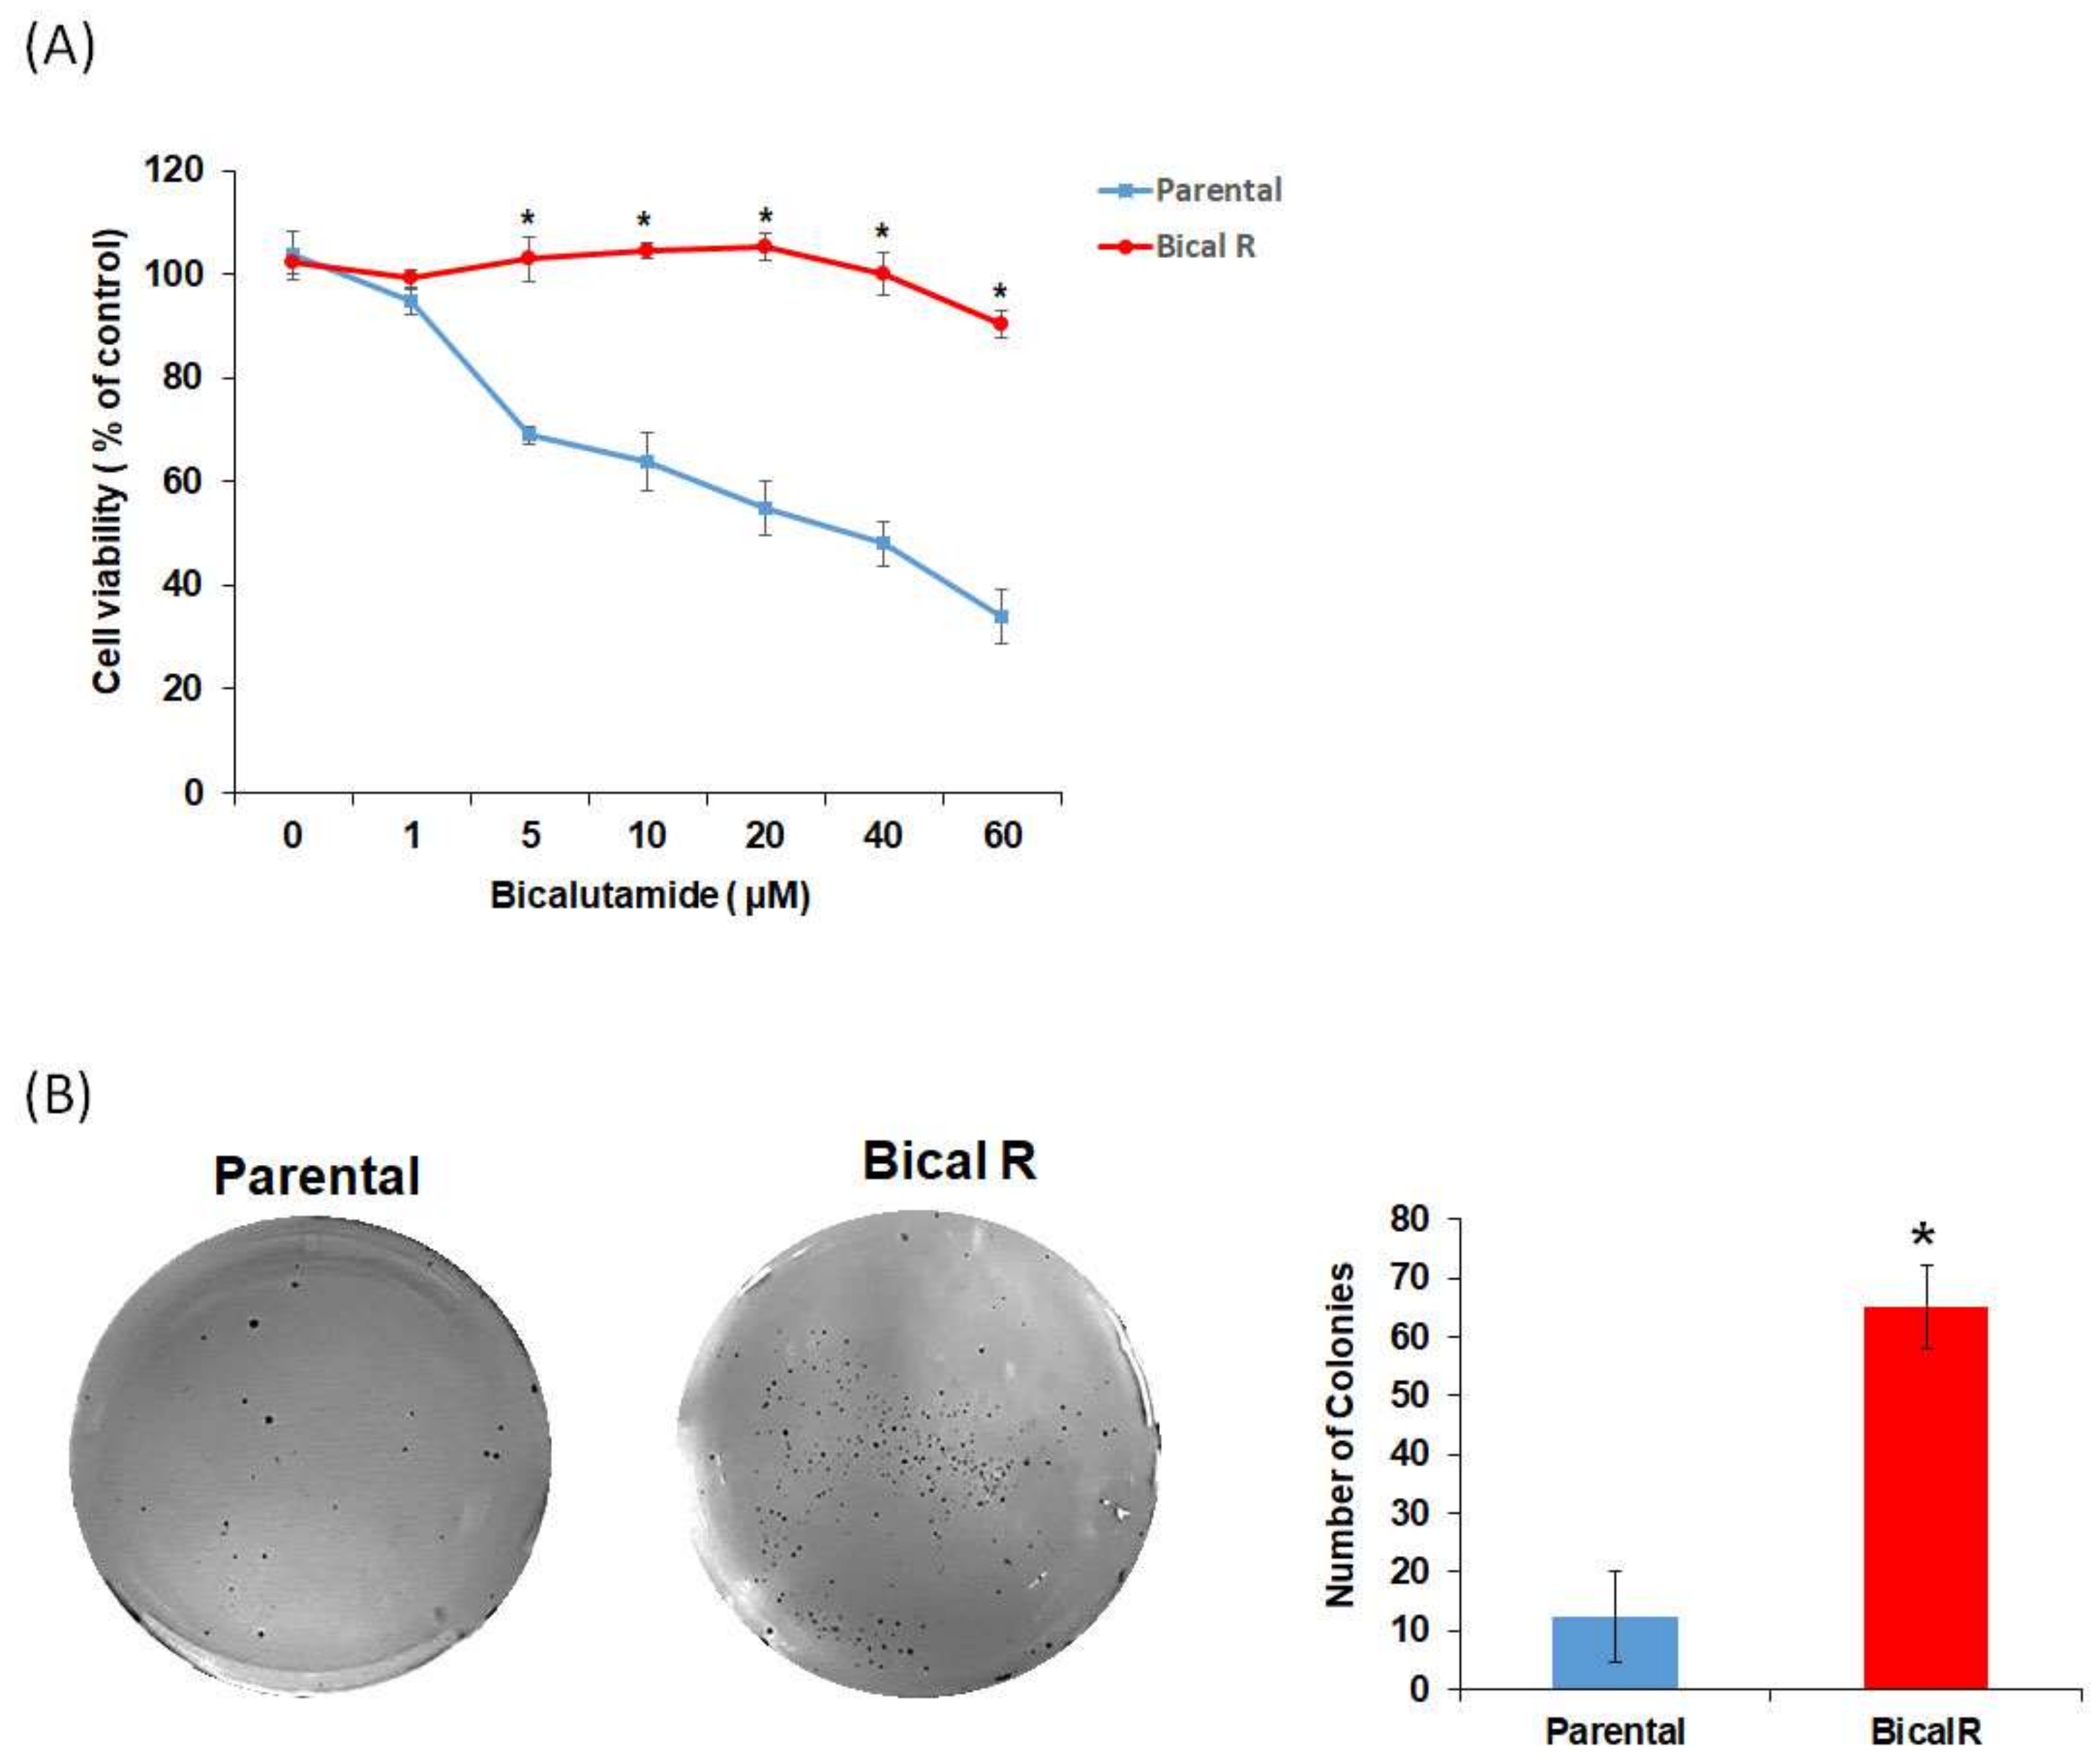
2.1. Construction of Bical R Cells
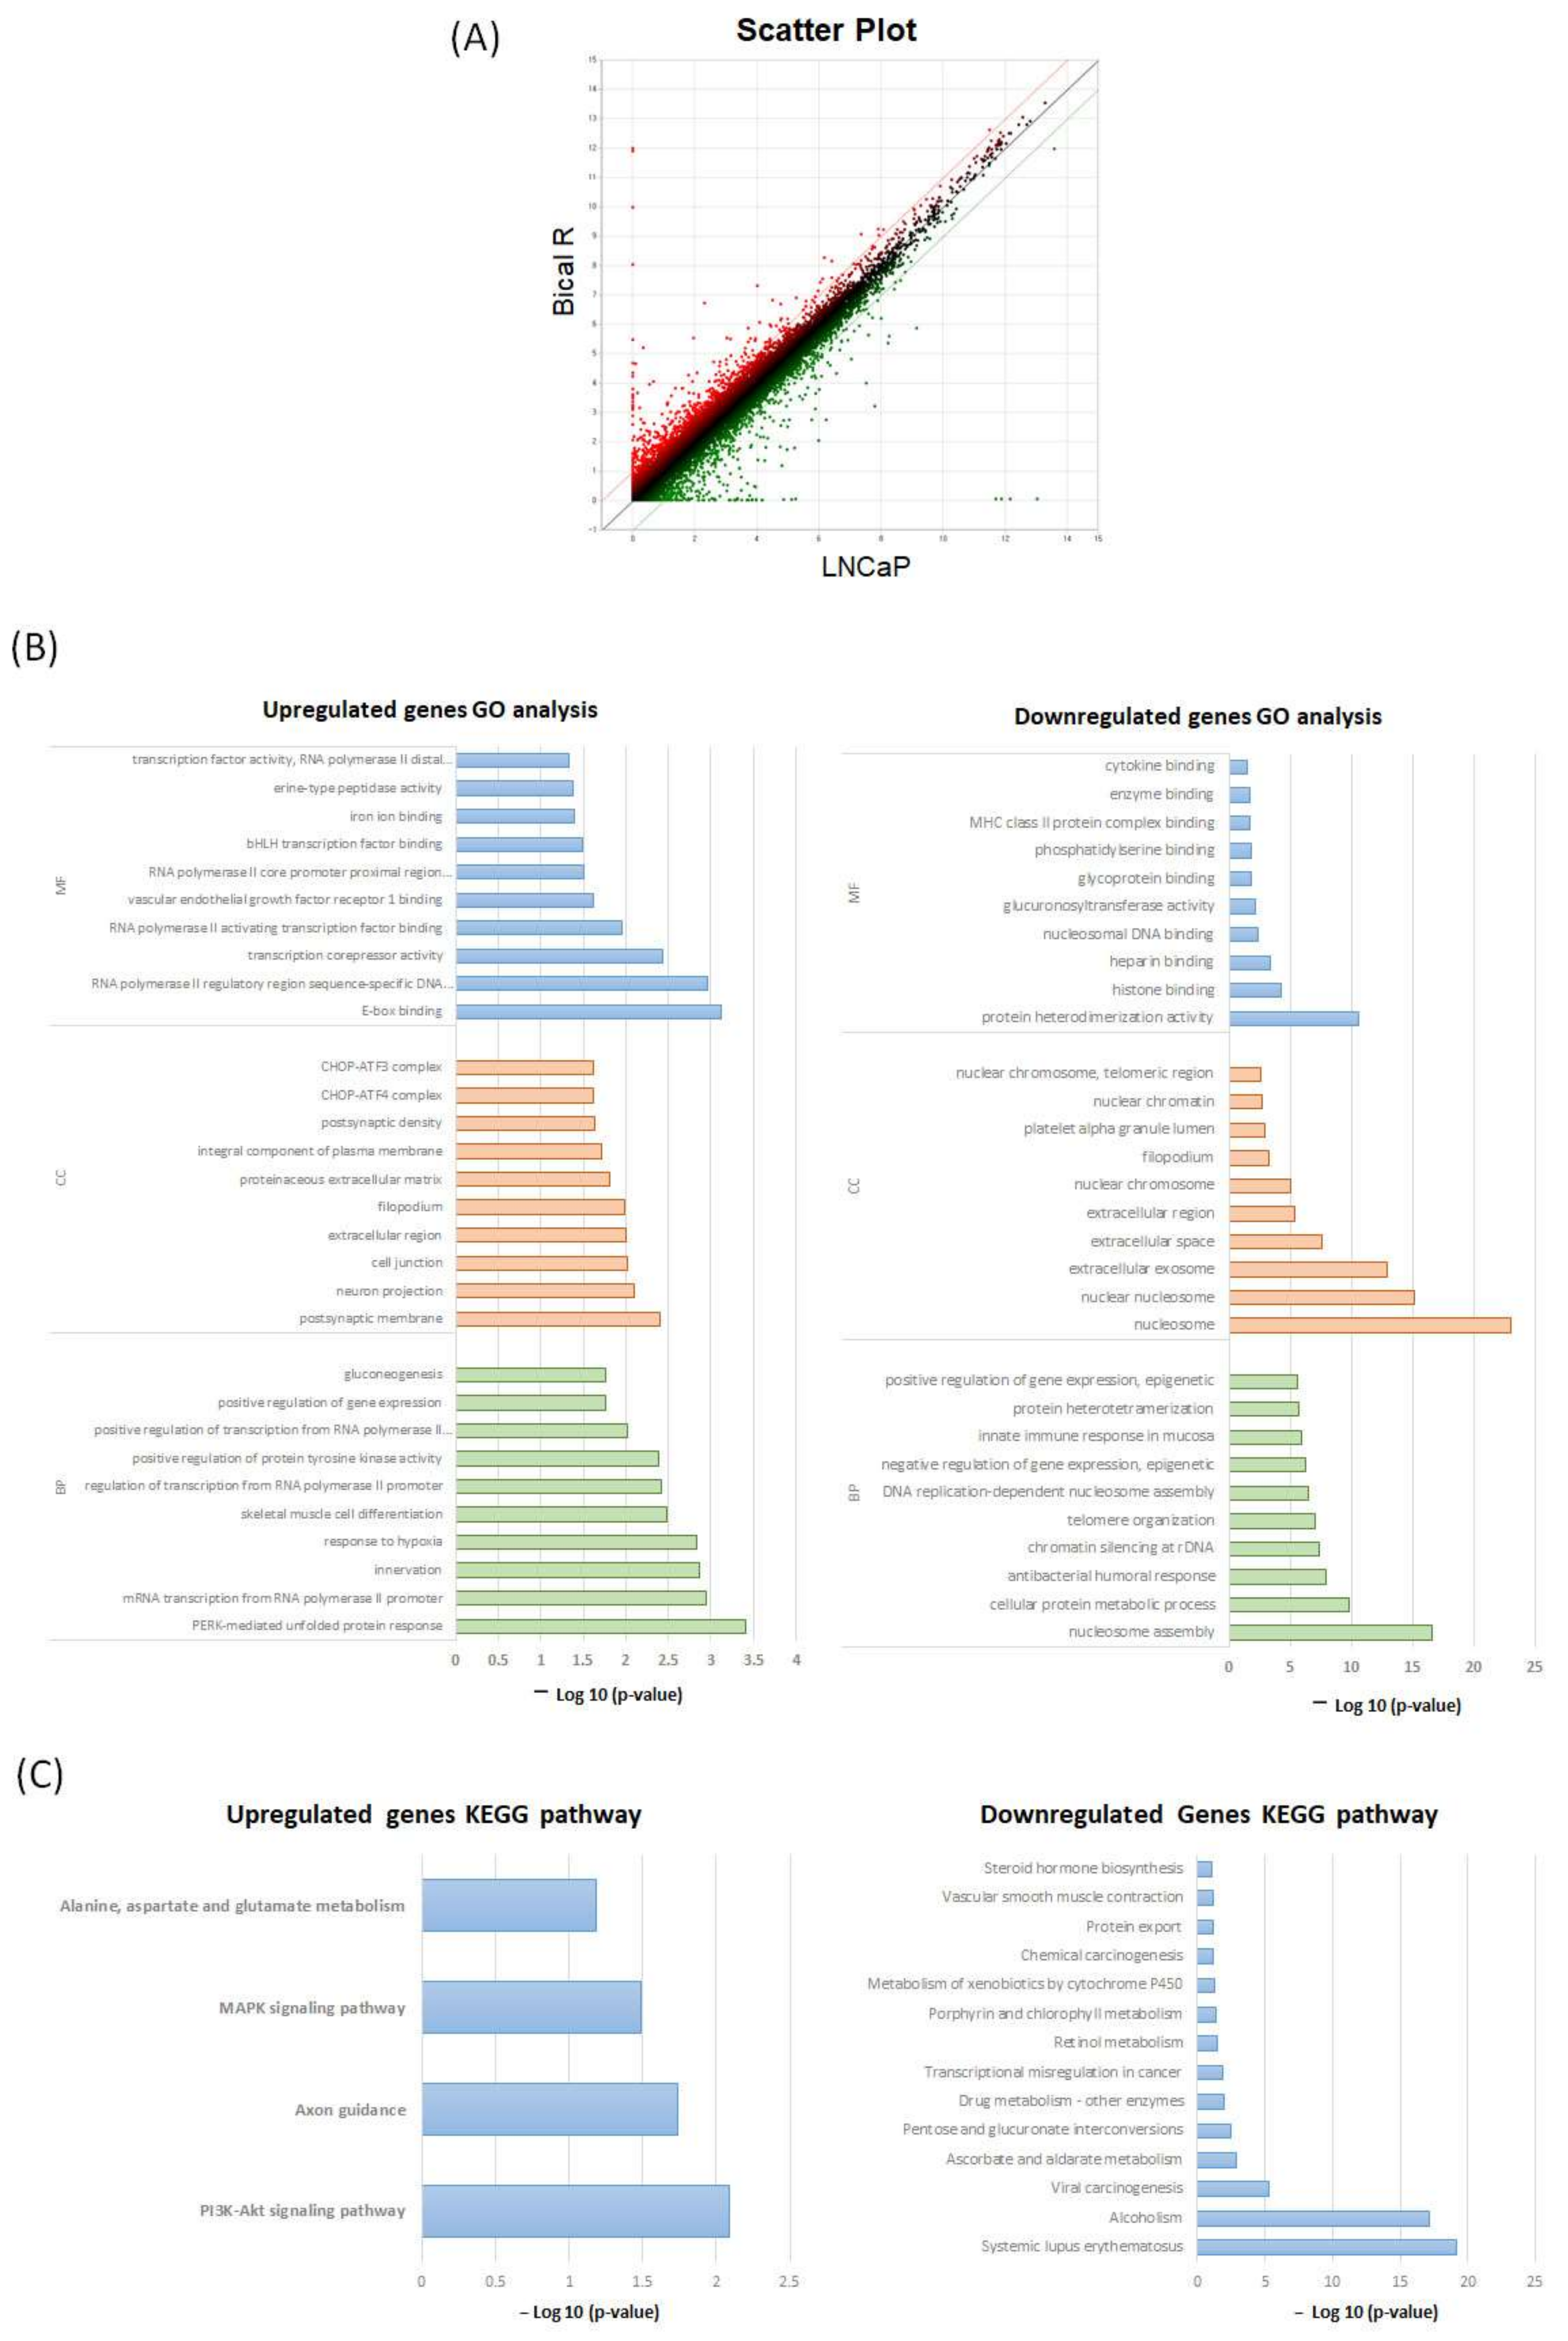
2.2. Functional Enrichment Analysis Based on DAVID
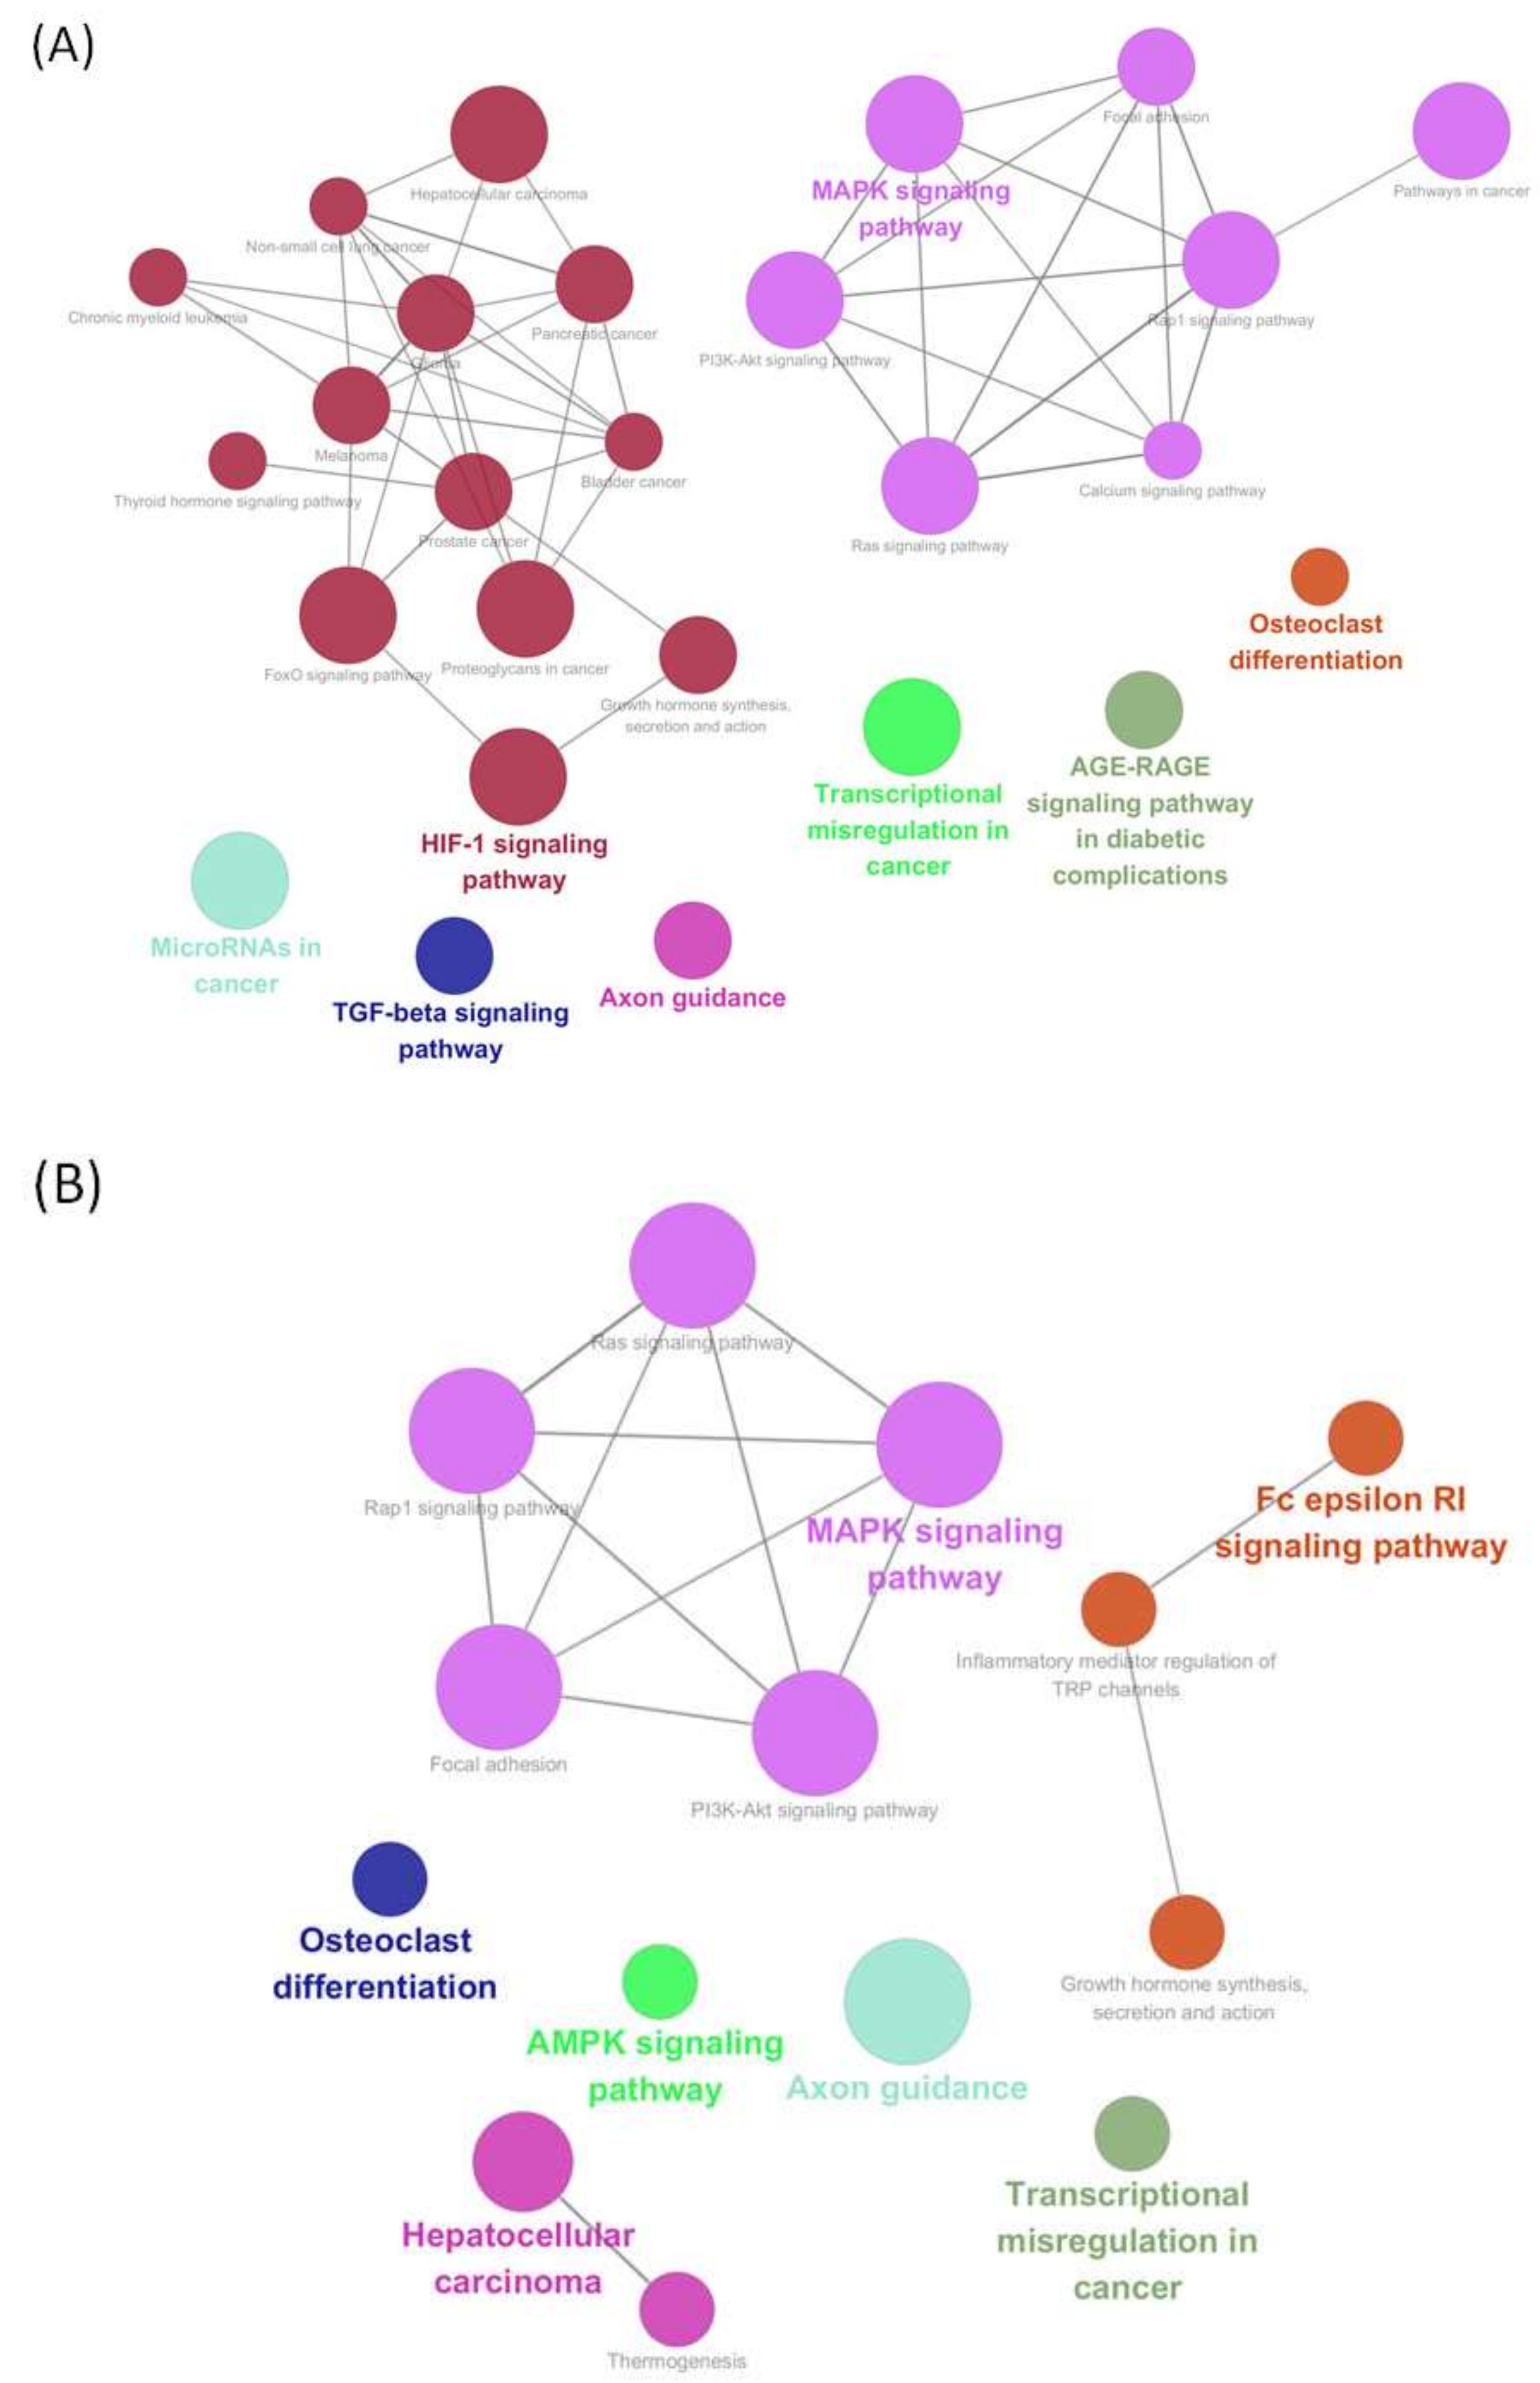
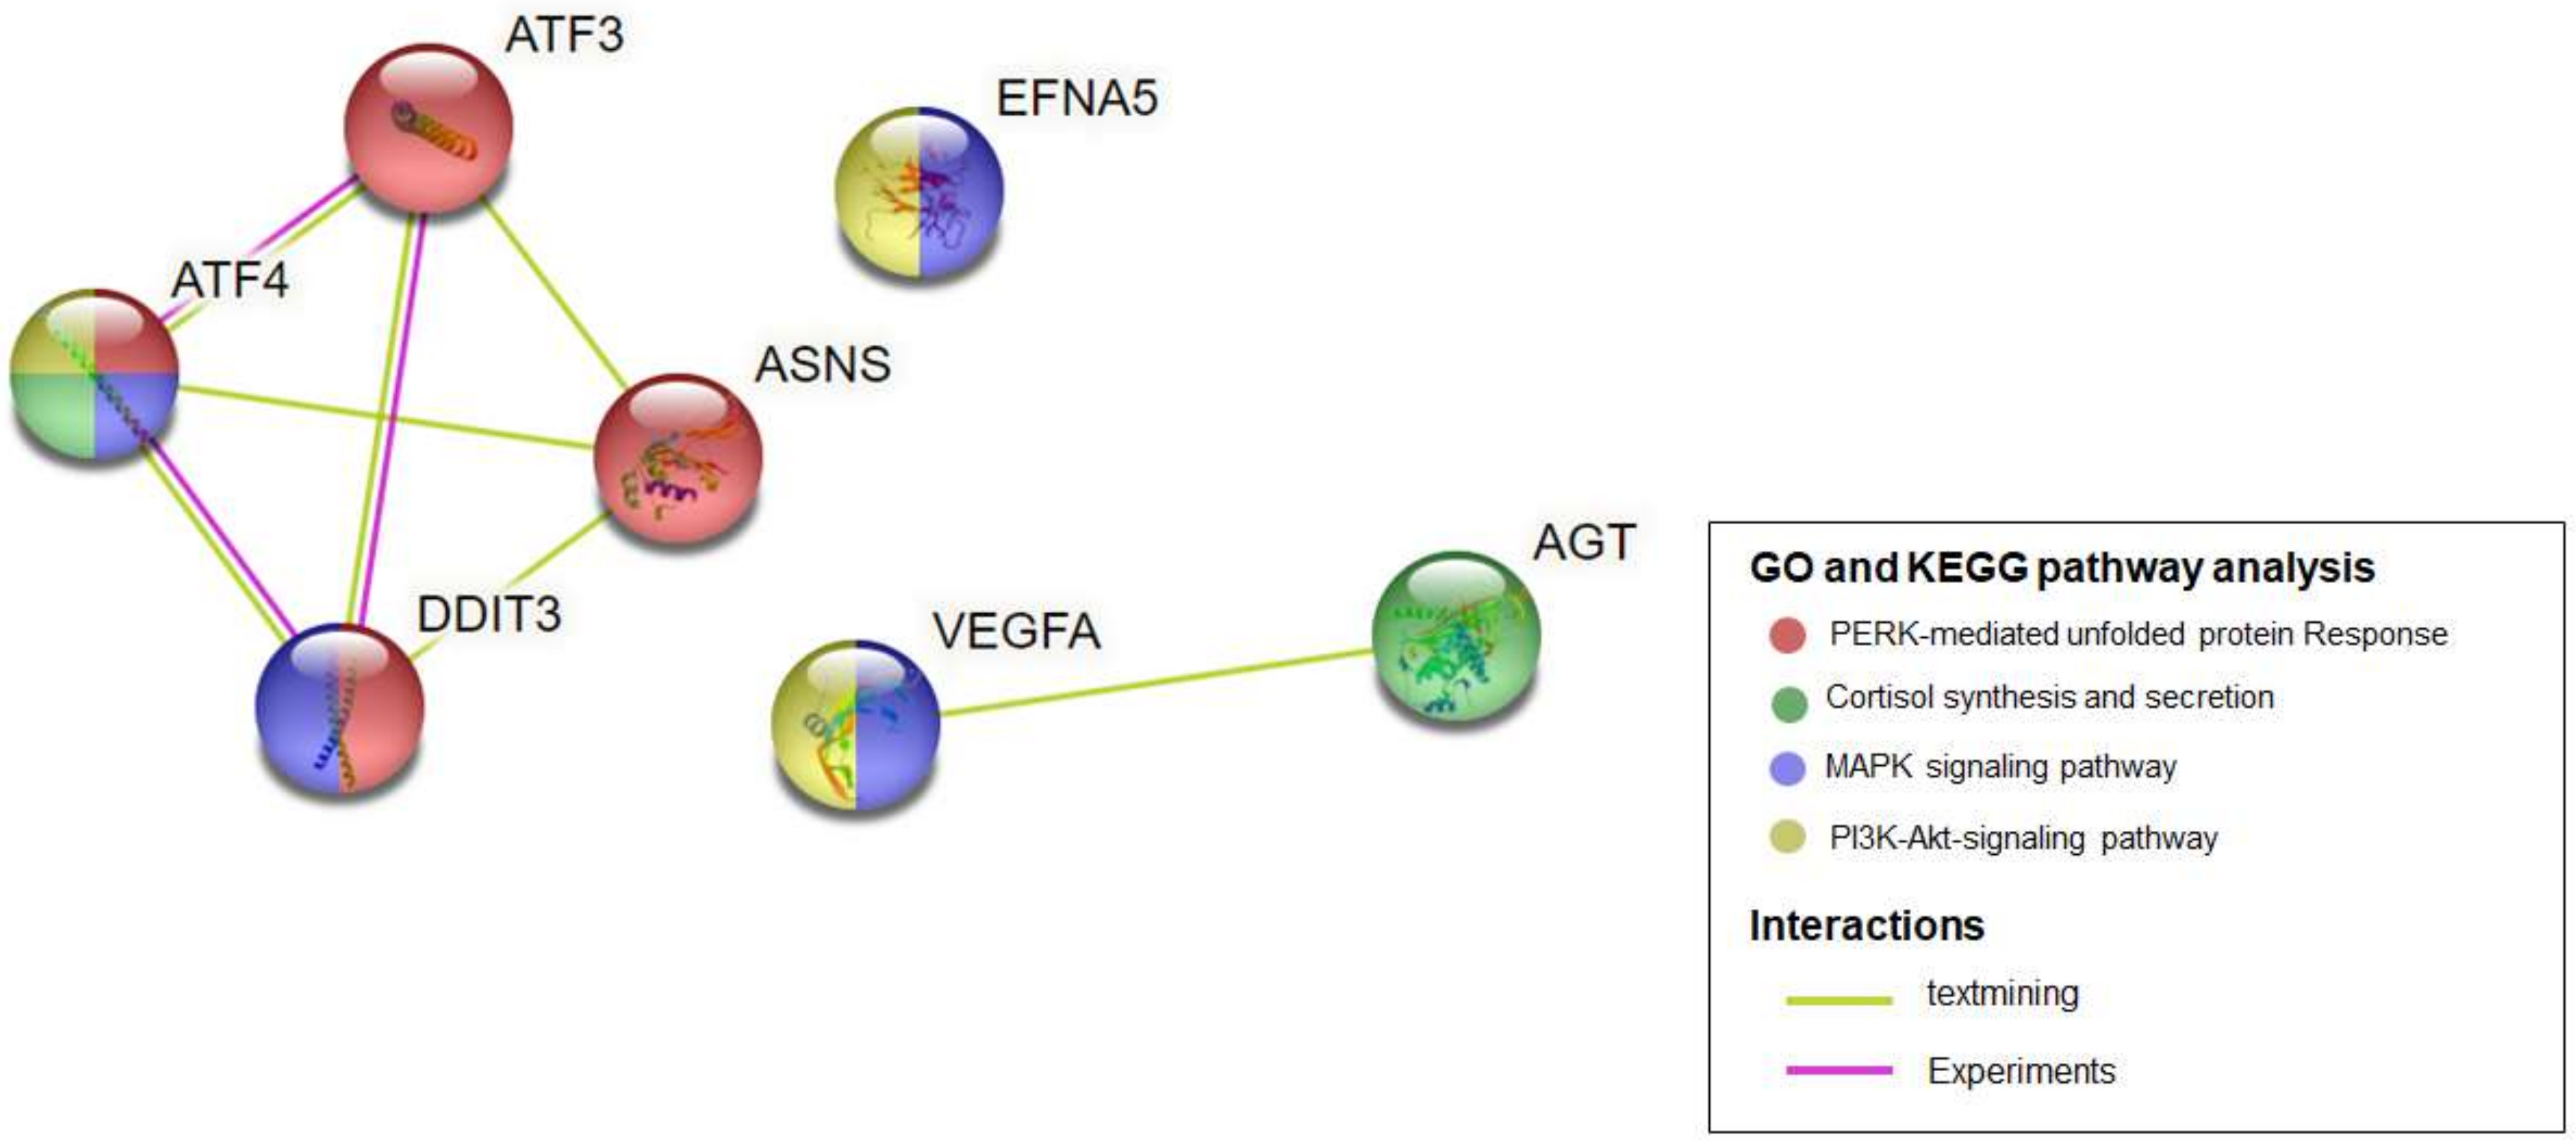
2.3. KEGG Pathways Analysis of the Modules Based on ClueGO
2.4. Identification of Hub Genes
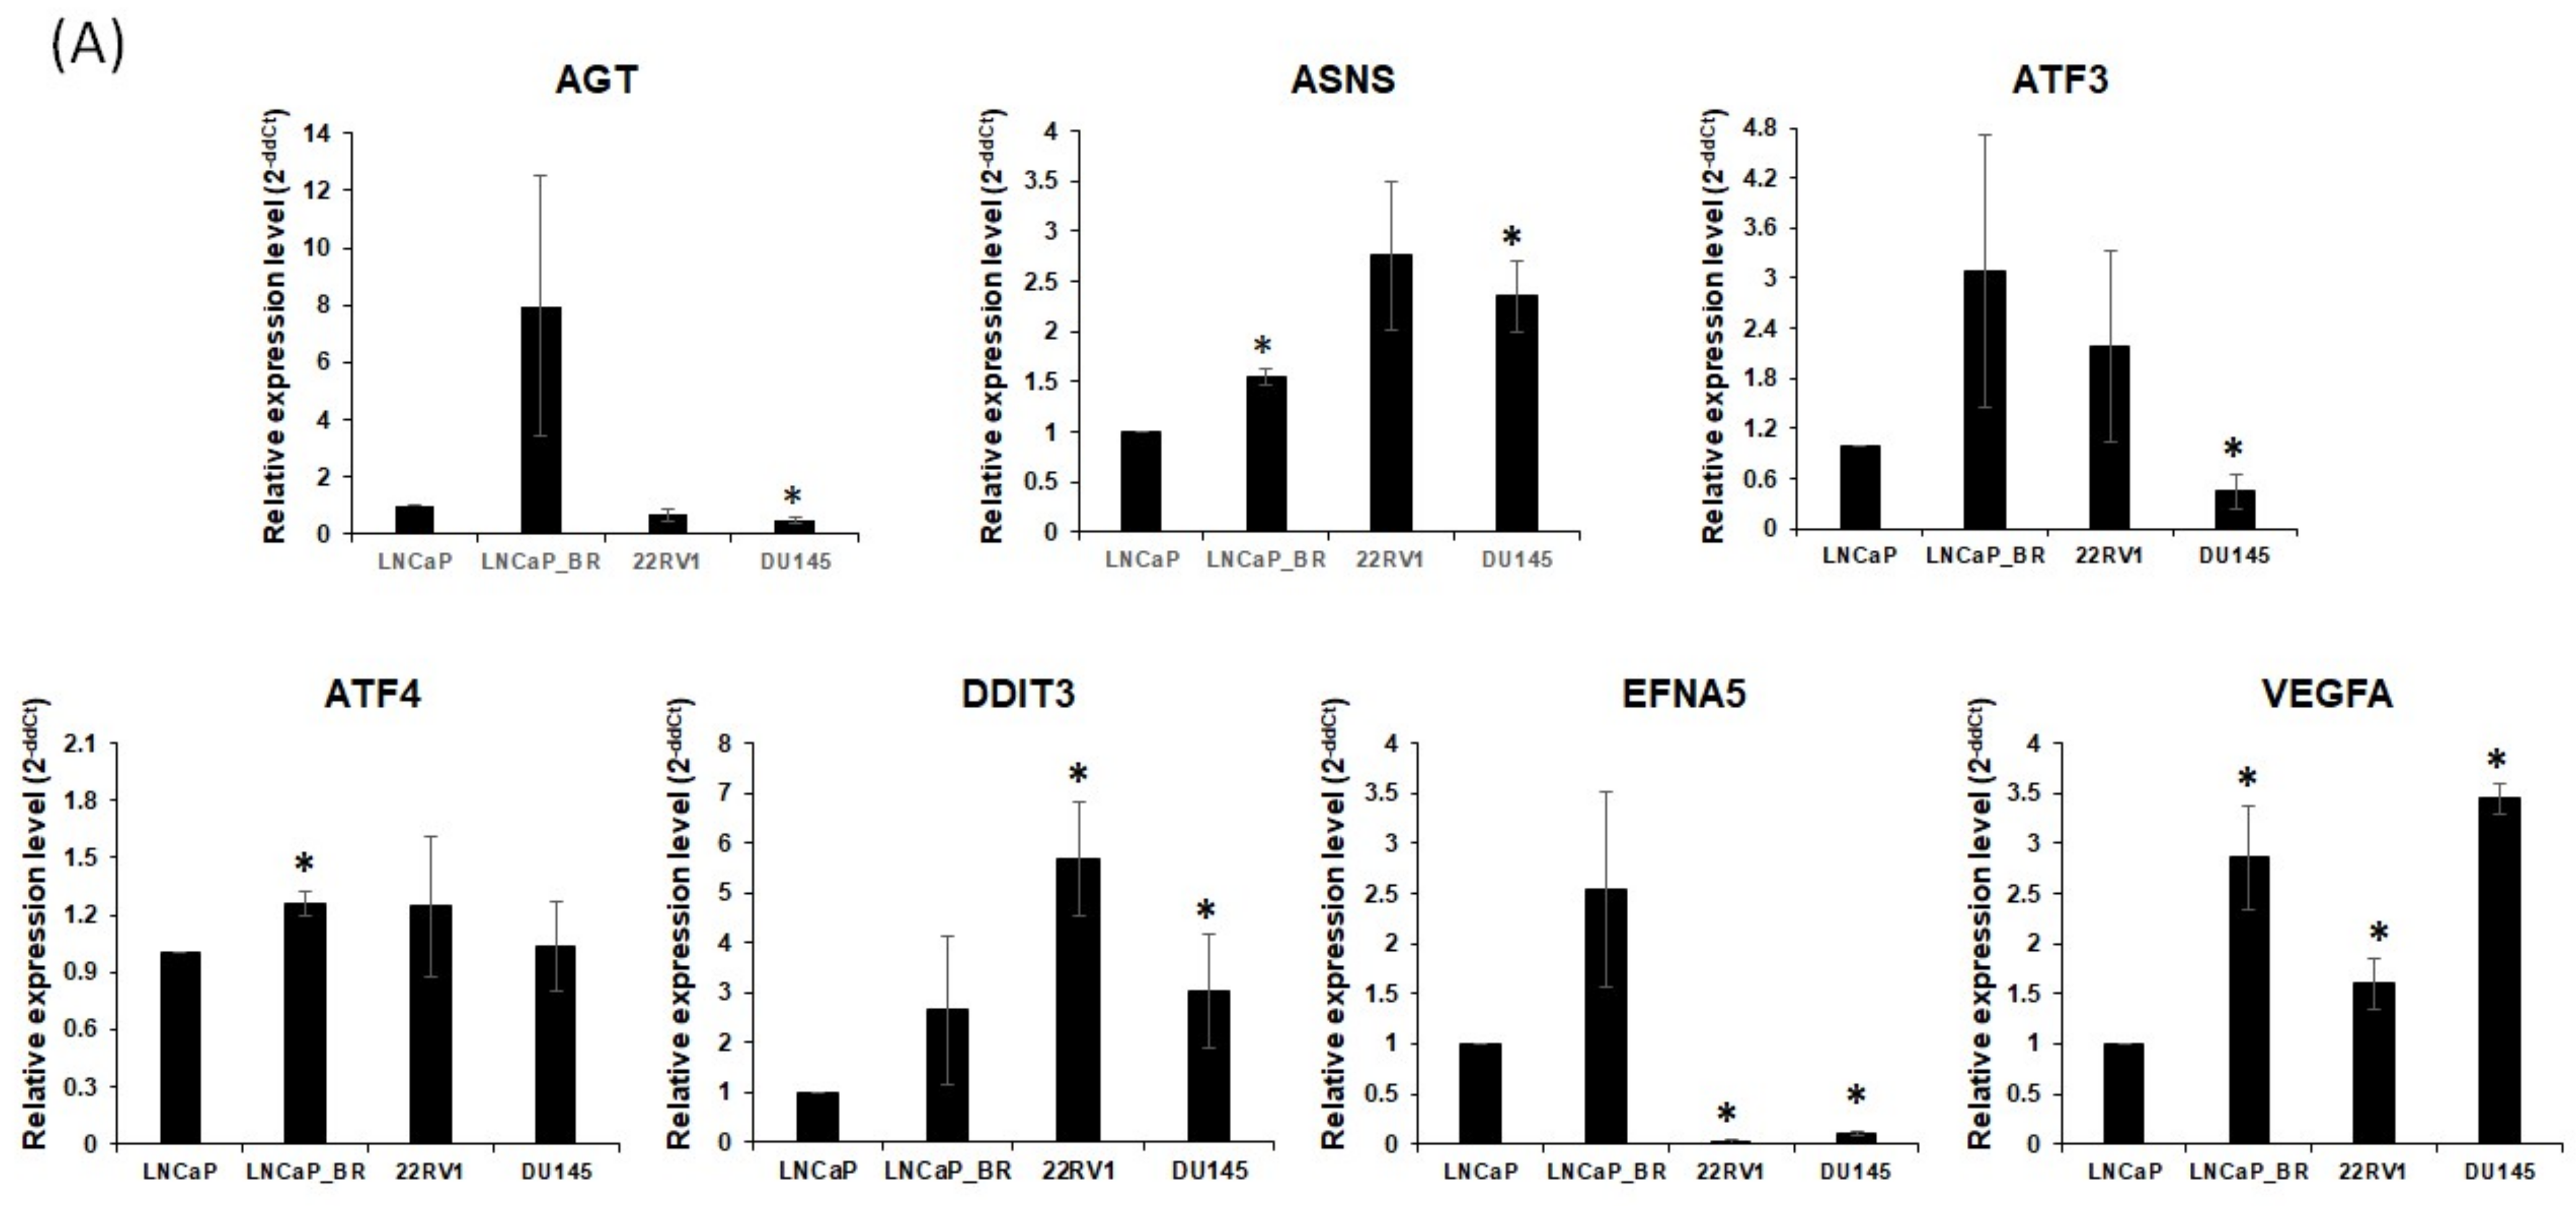
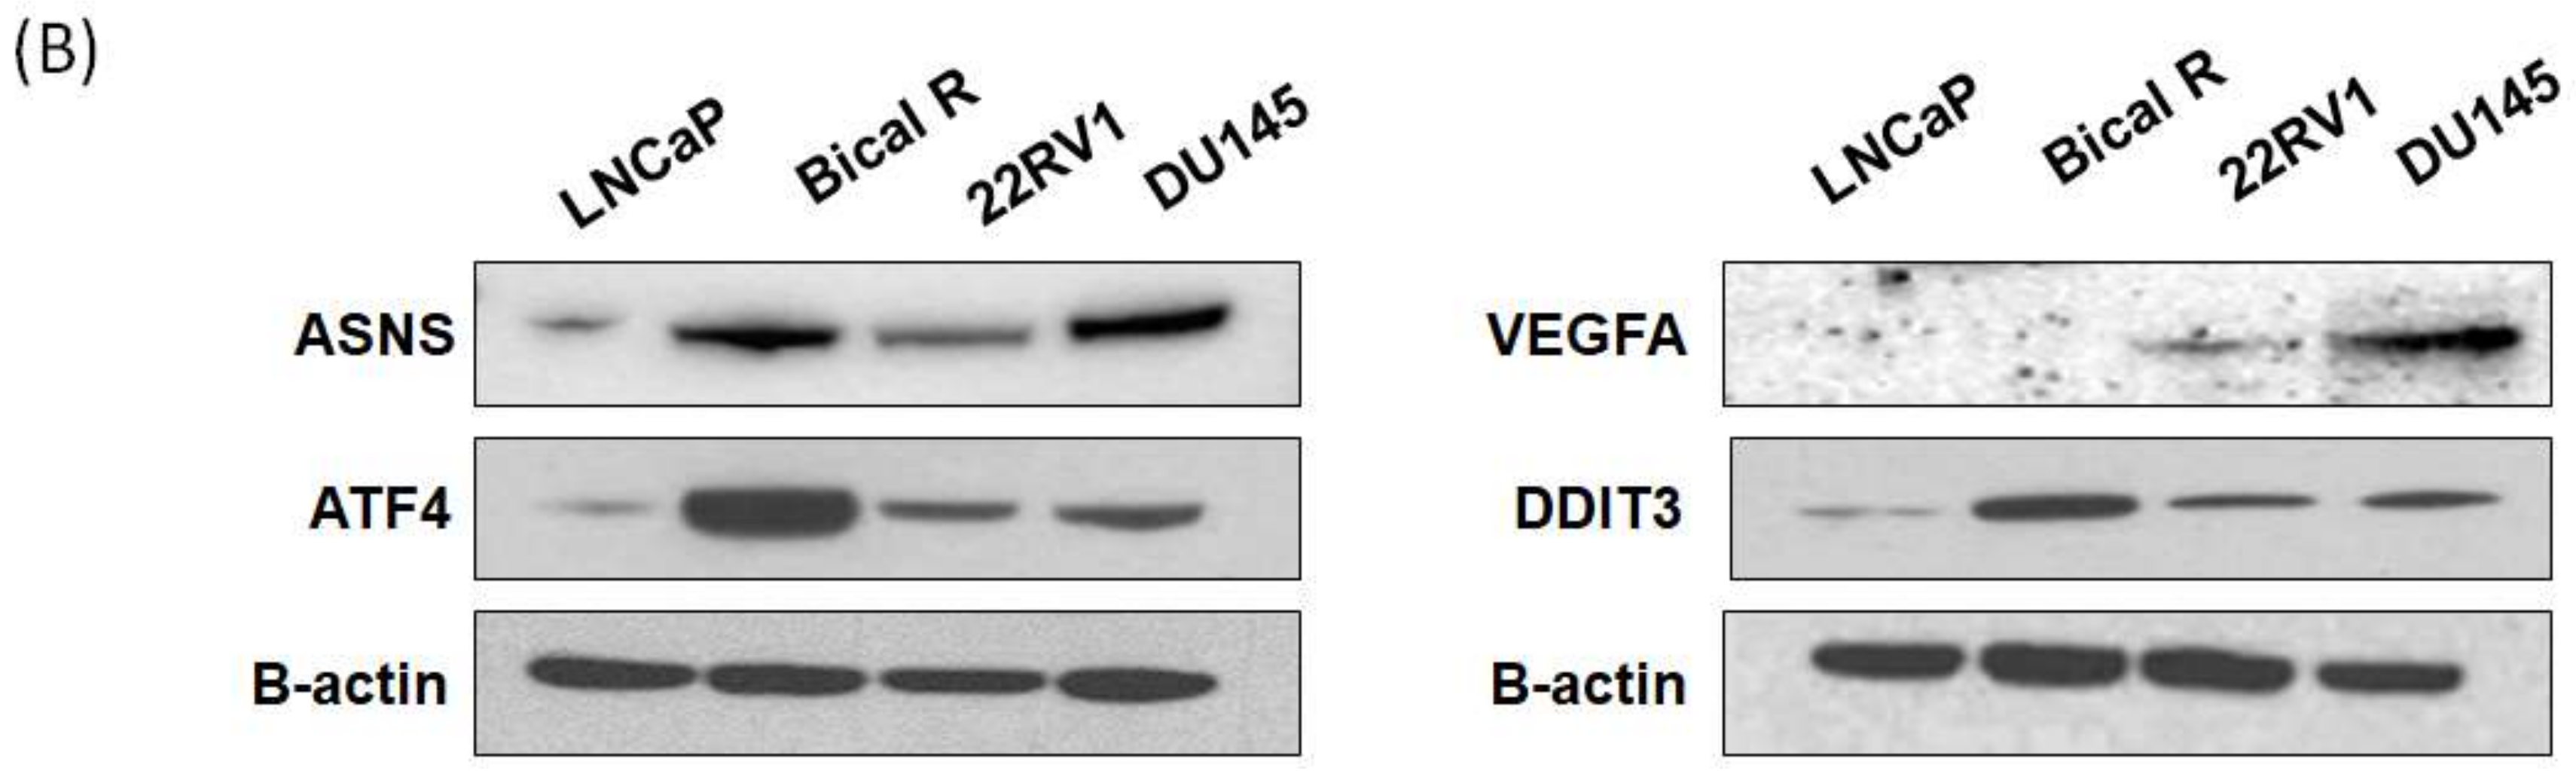
2.5. Validation of Hub Genes
3. Discussion
4. Materials and Methods
4.1. Cell Cultures
4.2. Drug Sensitivity Analysis by WST and Colony Formation Assays
4.3. mRNA Sequencing
4.4. Analysis of DEGs
4.5. GO and KEGG Pathway Analysis of DEGs
4.6. Protein–Protein Interaction Network Analysis
4.7. Screening of Module Genes and Kyoto Encyclopedia of Genes and Genomes Pathway Analysis of Upregulated DEGs
4.8. Identification of Hub Genes
4.9. Quantitative Real-Time PCR
4.10. Western Blot Analysis
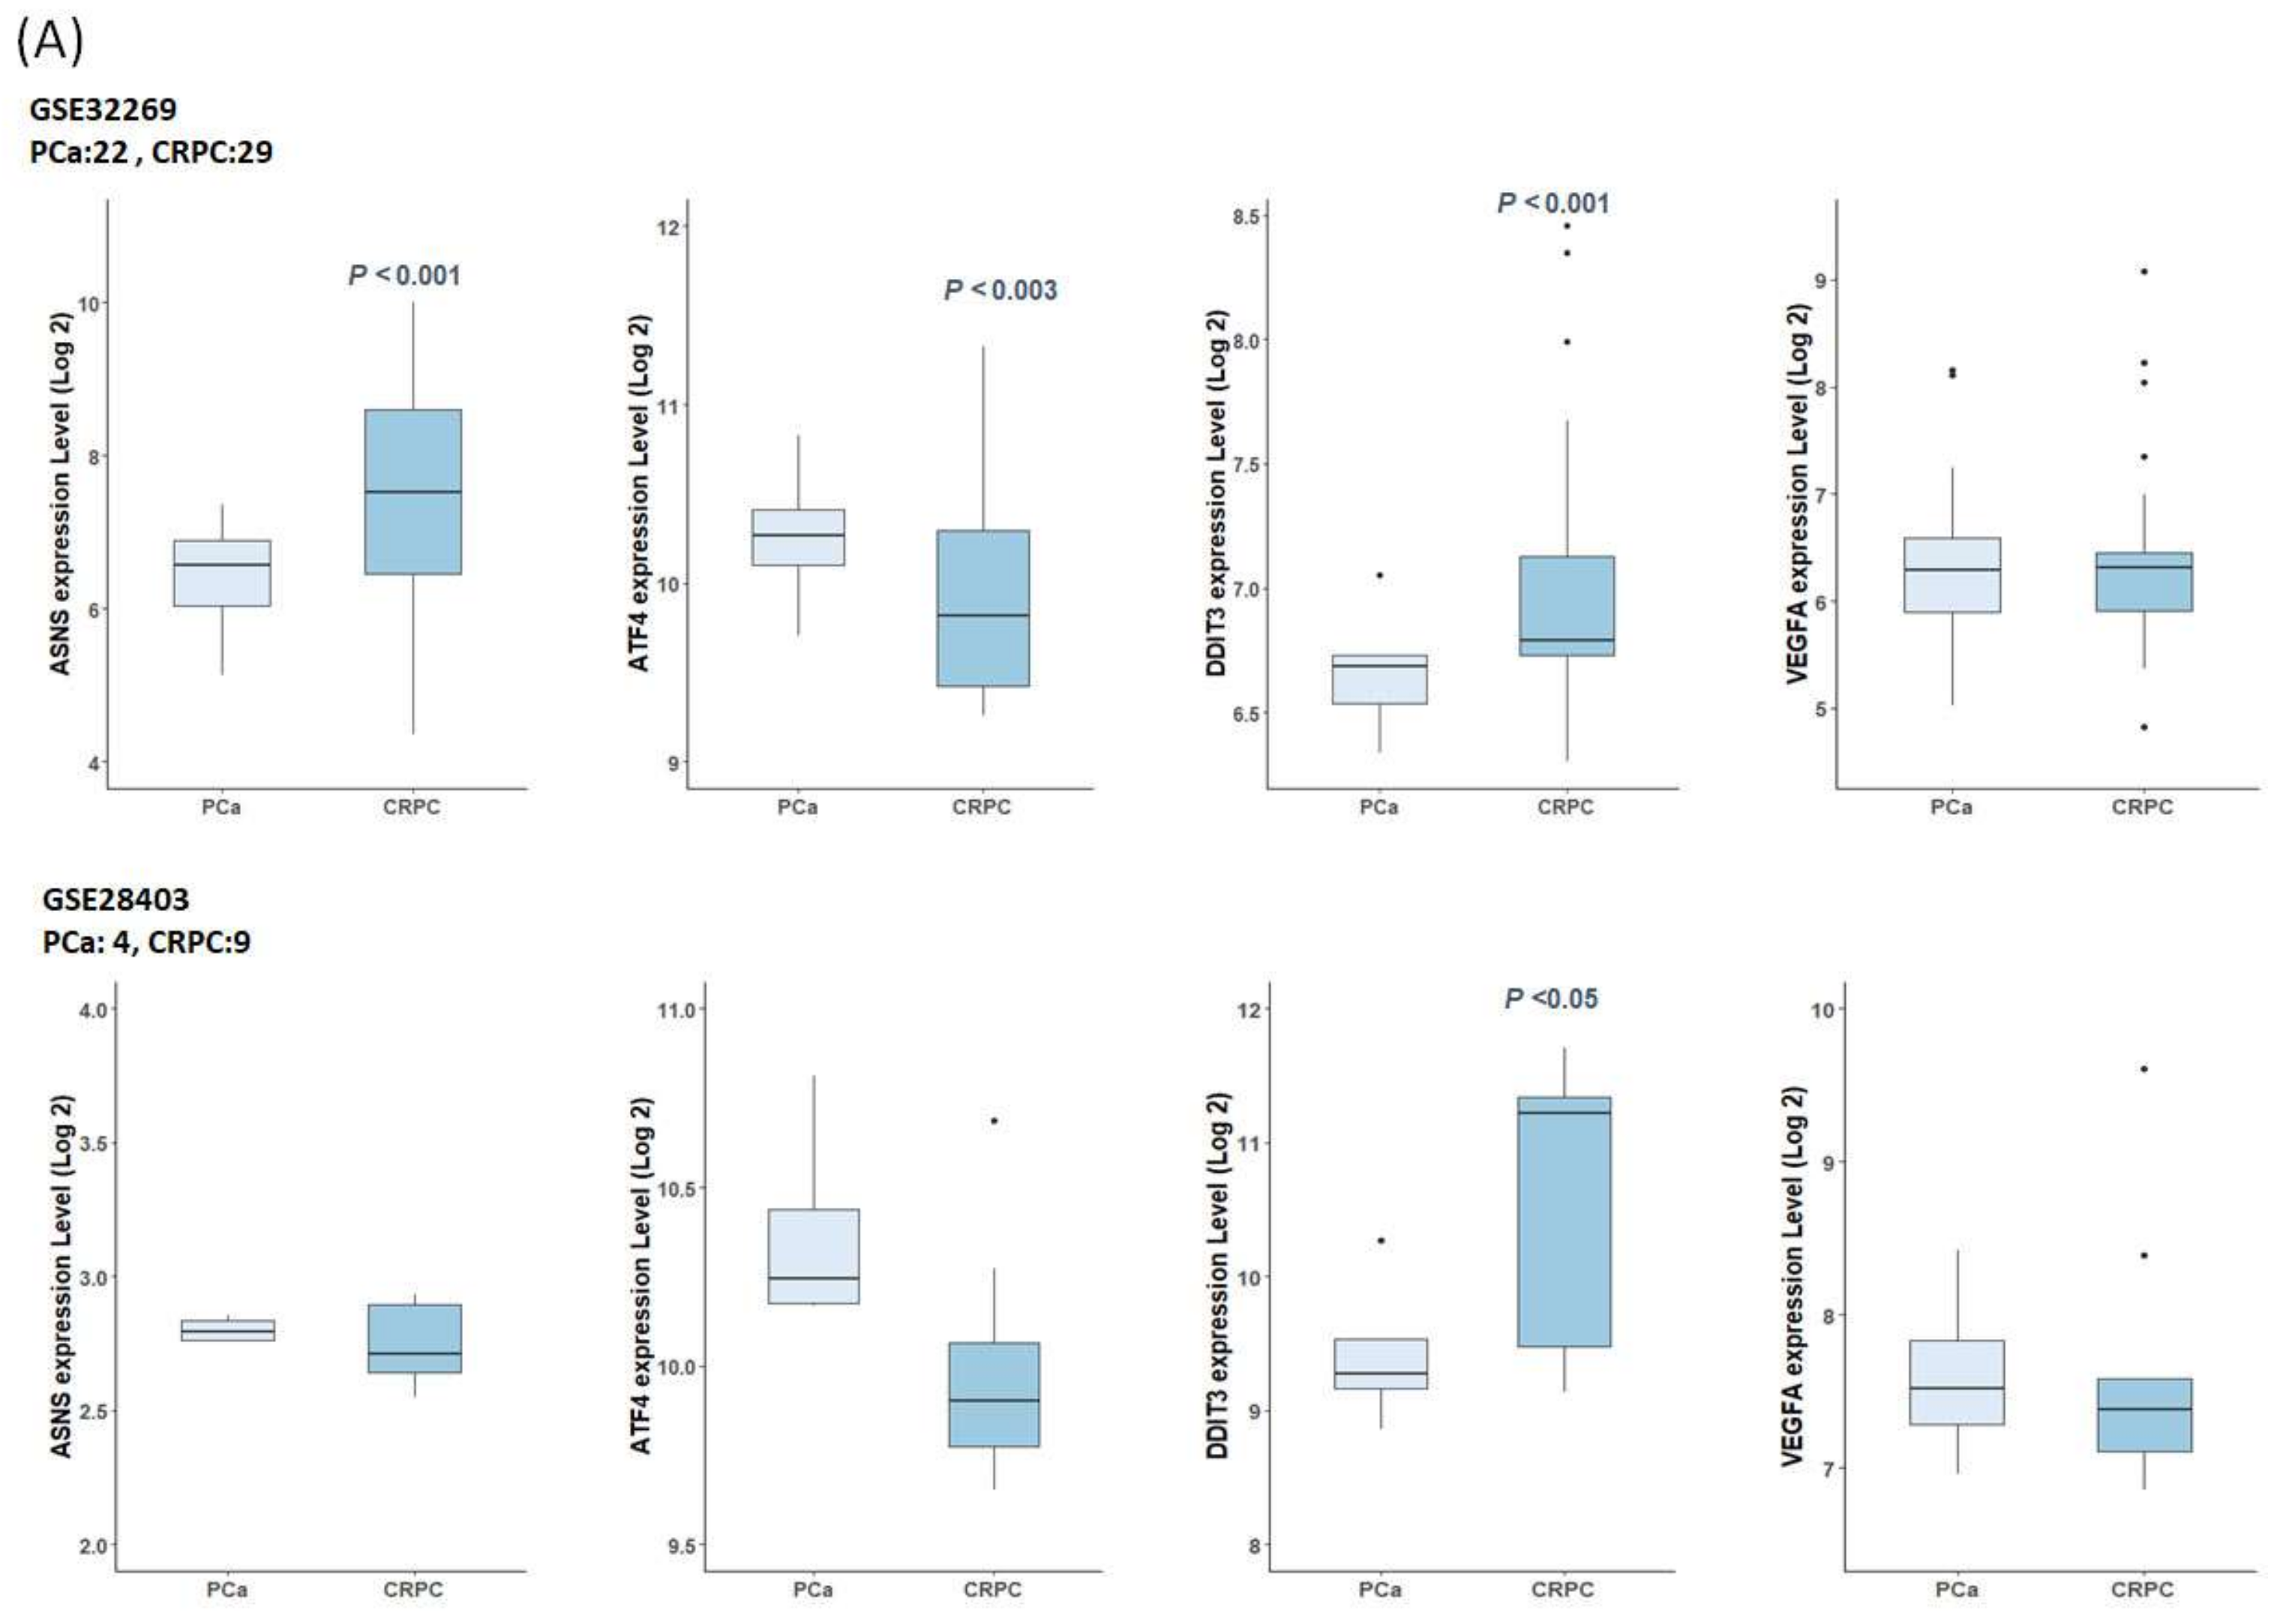
4.11. Gene Expression in Public Datasets
4.12. Survival Analyses of TCGA-PRAD Datasets
4.13. Statistical Analysis
Supplementary Materials
Author Contributions
Funding
Institutional Review Board Statement
Informed Consent Statement
Data Availability Statement
Conflicts of Interest
References
- Siegel, R.L.; Miller, K.D.; Wagle, N.S.; Jemal, A. Cancer statistics, 2023. CA Cancer J. Clin. 2023, 73, 17–48. [Google Scholar] [CrossRef]
- Zhang, J.S.; Cunningham, J.J.; Brown, J.S.; Gatenby, R.A. Integrating evolutionary dynamics into treatment of metastatic castrate-resistant prostate cancer. Nat. Commun. 2017, 8, 1816. [Google Scholar] [CrossRef] [PubMed]
- Higano, C.S.; Crawford, E.D. New and emerging agents for the treatment of castration-resistant prostate cancer. Urol. Oncol. 2011, 29, S1–S8. [Google Scholar] [CrossRef] [PubMed]
- de Bono, J.S.; Oudard, S.; Ozguroglu, M.; Hansen, S.; Machiels, J.P.; Kocak, I.; Gravis, G.; Bodrogi, I.; Mackenzie, M.J.; Shen, L.; et al. Prednisone plus cabazitaxel or mitoxantrone for metastatic castration-resistant prostate cancer progressing after docetaxel treatment: A randomised open-label trial. Lancet 2010, 376, 1147–1154. [Google Scholar] [CrossRef]
- Rice, M.A.; Malhotra, S.V.; Stoyanova, T. Second-Generation Antiandrogens: From Discovery to Standard of Care in Castration Resistant Prostate Cancer. Front. Oncol. 2019, 9, 801. [Google Scholar] [CrossRef] [PubMed]
- Verma, S.; Prajapati, K.S.; Kushwaha, P.P.; Shuaib, M.; Kumar Singh, A.; Kumar, S.; Gupta, S. Resistance to second generation antiandrogens in prostate cancer: Pathways and mechanisms. Cancer Drug Resist. 2020, 3, 742–761. [Google Scholar] [CrossRef] [PubMed]
- Huang, Y.; Jiang, X.; Liang, X.; Jiang, G. Molecular and cellular mechanisms of castration resistant prostate cancer. Oncol. Lett. 2018, 15, 6063–6076. [Google Scholar] [CrossRef]
- Watson, P.A.; Arora, V.K.; Sawyers, C.L. Emerging mechanisms of resistance to androgen receptor inhibitors in prostate cancer. Nat. Rev. Cancer 2015, 15, 701–711. [Google Scholar] [CrossRef]
- Kim, J.; Lee, J.N.; Ha, Y.-S.; Kwon, T.G.; Lee, S. Trends in the Development of Castration-resistant Prostate Cancer Treatment. Yakhak Hoeji 2020, 64, 243–249. [Google Scholar] [CrossRef]
- Heidenreich, A.; Bastian, P.J.; Bellmunt, J.; Bolla, M.; Joniau, S.; van der Kwast, T.; Mason, M.; Matveev, V.; Wiegel, T.; Zattoni, F.; et al. EAU guidelines on prostate cancer. Part II: Treatment of advanced, relapsing, and castration-resistant prostate cancer. Eur. Urol. 2014, 65, 467–479. [Google Scholar] [CrossRef]
- Nakazawa, M.; Paller, C.; Kyprianou, N. Mechanisms of Therapeutic Resistance in Prostate Cancer. Curr. Oncol. Rep. 2017, 19, 13. [Google Scholar] [CrossRef] [PubMed]
- Attard, G.; Parker, C.; Eeles, R.A.; Schroder, F.; Tomlins, S.A.; Tannock, I.; Drake, C.G.; de Bono, J.S. Prostate cancer. Lancet 2016, 387, 70–82. [Google Scholar] [CrossRef]
- Dowden, H.; Munro, J. Trends in clinical success rates and therapeutic focus. Nat. Rev. Drug Discov. 2019, 18, 495–496. [Google Scholar] [CrossRef] [PubMed]
- Satam, H.; Joshi, K.; Mangrolia, U.; Waghoo, S.; Zaidi, G.; Rawool, S.; Thakare, R.P.; Banday, S.; Mishra, A.K.; Das, G.; et al. Next-Generation Sequencing Technology: Current Trends and Advancements. Biology 2023, 12, 997. [Google Scholar] [CrossRef] [PubMed]
- Wooller, S.K.; Benstead-Hume, G.; Chen, X.R.; Ali, Y.; Pearl, F.M.G. Bioinformatics in translational drug discovery. Bioscience Rep. 2017, 37, BSR20160180. [Google Scholar] [CrossRef] [PubMed]
- Wang, R.; Mi, Y.Y.; Ni, J.; Wang, Y.; Ding, L.W.; Ran, X.B.; Sun, Q.Y.; Tan, S.Y.; Koeffler, H.P.; Feng, N.H.; et al. Identification of PRDX5 as A Target for The Treatment of Castration-Resistant Prostate Cancer. Adv. Sci. 2023, 2304939. [Google Scholar] [CrossRef] [PubMed]
- Yu, P.; Dai, Y.B.; Zhuang, T.T.; Yue, X.F.; Chen, Y.H.; Wang, X.C.; Duan, X.Z.; Ping, Y.; Xie, Y.Y.; Cao, Y.; et al. Identification and Validation of Three Hub Genes Involved in Cell Proliferation and Prognosis of Castration-Resistant Prostate Cancer. Oxid. Med. Cell Longev. 2022, 2022, 8761112. [Google Scholar] [CrossRef] [PubMed]
- Detchokul, S.; Elangovan, A.; Crampin, E.J.; Davis, M.J.; Frauman, A.G. Network analysis of an in vitro model of androgen-resistance in prostate cancer. BMC Cancer 2015, 15, 883. [Google Scholar] [CrossRef]
- Chin, C.H.; Chen, S.H.; Wu, H.H.; Ho, C.W.; Ko, M.T.; Lin, C.Y. cytoHubba: Identifying hub objects and sub-networks from complex interactome. BMC Syst. Biol. 2014, 8 (Suppl. S4), S11. [Google Scholar] [CrossRef]
- Carswell, C.I.; Figgitt, D.P. Bicalutamide: In early-stage prostate cancer. Drugs 2002, 62, 2471–2479, discussion 2480–2471. [Google Scholar] [CrossRef]
- Harris, W.P.; Mostaghel, E.A.; Nelson, P.S.; Montgomery, B. Androgen deprivation therapy: Progress in understanding mechanisms of resistance and optimizing androgen depletion. Nat. Clin. Pract. Urol. 2009, 6, 76–85. [Google Scholar] [CrossRef]
- Lomelino, C.L.; Andring, J.T.; McKenna, R.; Kilberg, M.S. Asparagine synthetase: Function, structure, and role in disease. J. Biol. Chem. 2017, 292, 19952–19958. [Google Scholar] [CrossRef]
- Noree, C.; Monfort, E.; Shotelersuk, V. Human asparagine synthetase associates with the mitotic spindle. Biol. Open 2018, 7, bio038307. [Google Scholar] [CrossRef]
- Fernandez-Garcia, J.; Franco, F.; Parik, S.; Altea-Manzano, P.; Pane, A.A.; Broekaert, D.; van Elsen, J.; Di Conza, G.; Vermeire, I.; Schalley, T.; et al. CD8(+) T cell metabolic rewiring defined by scRNA-seq identifies a critical role of ASNS expression dynamics in T cell differentiation. Cell Rep. 2022, 41, 111639. [Google Scholar] [CrossRef]
- Chiu, M.; Taurino, G.; Bianchi, M.G.; Kilberg, M.S.; Bussolati, O. Asparagine Synthetase in Cancer: Beyond Acute Lymphoblastic Leukemia. Front. Oncol. 2019, 9, 1480. [Google Scholar] [CrossRef]
- Jiang, J.; Batra, S.; Zhang, J. Asparagine: A Metabolite to Be Targeted in Cancers. Metabolites 2021, 11, 402. [Google Scholar] [CrossRef] [PubMed]
- Knott, S.R.V.; Wagenblast, E.; Khan, S.; Kim, S.Y.; Soto, M.; Wagner, M.; Turgeon, M.O.; Fish, L.; Erard, N.; Gable, A.L.; et al. Asparagine bioavailability governs metastasis in a model of breast cancer. Nature 2018, 554, 378–381. [Google Scholar] [CrossRef] [PubMed]
- Li, H.; Zhou, F.; Du, W.; Dou, J.; Xu, Y.; Gao, W.; Chen, G.; Zuo, X.; Sun, L.; Zhang, X.; et al. Knockdown of asparagine synthetase by RNAi suppresses cell growth in human melanoma cells and epidermoid carcinoma cells. Biotechnol. Appl. Biochem. 2016, 63, 328–333. [Google Scholar] [CrossRef] [PubMed]
- Xu, Y.; Lv, F.Z.; Zhu, X.X.; Wu, Y.; Shen, X.Y. Loss of asparagine synthetase suppresses the growth of human lung cancer cells by arresting cell cycle at G0/G1 phase. Cancer Gene Ther. 2016, 23, 287–294. [Google Scholar] [CrossRef] [PubMed]
- Pacher, M.; Seewald, M.J.; Mikula, M.; Oehler, S.; Mogg, M.; Vinatzer, U.; Eger, A.; Schweifer, N.; Varecka, R.; Sommergruber, W.; et al. Impact of constitutive IGF1/IGF2 stimulation on the transcriptional program of human breast cancer cells. Carcinogenesis 2007, 28, 49–59. [Google Scholar] [CrossRef] [PubMed]
- Krall, A.S.; Xu, S.L.; Graeber, T.G.; Braas, D.; Christofk, H.R. Asparagine promotes cancer cell proliferation through use as an amino acid exchange factor. Nat. Commun. 2016, 7, 11457. [Google Scholar] [CrossRef]
- Toda, K.; Kawada, K.; Iwamoto, M.; Inamoto, S.; Sasazuki, T.; Shirasawa, S.; Hasegawa, S.; Sakai, Y. Metabolic Alterations Caused by KRAS Mutations in Colorectal Cancer Contribute to Cell Adaptation to Glutamine Depletion by Upregulation of Asparagine Synthetase. Neoplasia 2016, 18, 654–665. [Google Scholar] [CrossRef]
- Sircar, K.; Huang, H.; Hu, L.; Cogdell, D.; Dhillon, J.; Tzelepi, V.; Efstathiou, E.; Koumakpayi, I.H.; Saad, F.; Luo, D.; et al. Integrative molecular profiling reveals asparagine synthetase is a target in castration-resistant prostate cancer. Am. J. Pathol. 2012, 180, 895–903. [Google Scholar] [CrossRef]
- Wang, H.; Chen, Y.; Zhao, W.; Liu, H.; Tu, H.; Xia, Z.; Wang, R.; Tang, J.; Zhu, C.; Li, R.; et al. A Five Glutamine-Associated Signature Predicts Prognosis of Prostate Cancer and Links Glutamine Metabolism with Tumor Microenvironment. J. Clin. Med. 2023, 12, 2243. [Google Scholar] [CrossRef]
- Li, Y.M.; Guo, Y.S.; Tang, J.; Jiang, J.L.; Chen, Z.N. New insights into the roles of CHOP-induced apoptosis in ER stress. Acta Biochim. Biophys. Sin. 2014, 46, 629–640, Erratum in Acta Biochim. Biophys. Sin. 2015, 47, 146–147. [Google Scholar] [CrossRef] [PubMed]
- Cao, Y.; Trillo-Tinoco, J.; Sierra, R.A.; Anadon, C.; Dai, W.J.; Mohamed, E.; Cen, L.; Costich, T.L.; Magliocco, A.; Marchion, D.; et al. ER stress-induced mediator C/EBP homologous protein thwarts effector T cell activity in tumors through T-bet repression. Nat. Commun. 2019, 10, 1280, Publisher Correction in Nat. Commun. 2019, 10, 3680. [Google Scholar] [CrossRef] [PubMed]
- Lin, H.; Liu, S.F.; Gao, W.D.; Liu, H.Y. DDIT3 modulates cancer stemness in gastric cancer by directly regulating CEBP beta. J. Pharm. Pharmacol. 2020, 72, 807–815. [Google Scholar] [CrossRef] [PubMed]
- Zhang, X.; Lu, Z.; Ren, X.; Chen, X.; Zhou, X.; Zhou, X.; Zhang, T.; Liu, Y.; Wang, S.; Qin, C. Genetic comprehension of organophosphate flame retardants, an emerging threat to prostate cancer. Ecotoxicol. Environ. Saf. 2021, 223, 112589. [Google Scholar] [CrossRef] [PubMed]
- Doultsinos, D.; Mills, I. The role of the androgen receptor as a driver and mitigator of cellular stress. J. Mol. Endocrinol. 2020, 65, R19–R33. [Google Scholar] [CrossRef] [PubMed]
- Mukherjee, R.; McGuinness, D.H.; McCall, P.; Underwood, M.A.; Seywright, M.; Orange, C.; Edwards, J. Upregulation of MAPK pathway is associated with survival in castrate-resistant prostate cancer. Br. J. Cancer 2011, 104, 1920–1928. [Google Scholar] [CrossRef] [PubMed]
- Li, S.Z.; Fong, K.W.; Gritsina, G.; Zhang, A.; Zhao, J.C.; Kim, J.; Sharp, A.; Yuan, W.; Aversa, C.; Yang, X.M.J.; et al. Activation of MAPK Signaling by CXCR7 Leads to Enzalutamide Resistance in Prostate Cancer. Cancer Res. 2019, 79, 2580–2592, Correction in Cancer Res. 2020, 80, 2072. [Google Scholar] [CrossRef]
- Gentleman, R.C.; Carey, V.J.; Bates, D.M.; Bolstad, B.; Dettling, M.; Dudoit, S.; Ellis, B.; Gautier, L.; Ge, Y.C.; Gentry, J.; et al. Bioconductor: Open software development for computational biology and bioinformatics. Genome Biol. 2004, 5, R80. [Google Scholar] [CrossRef]
- Dennis, G., Jr.; Sherman, B.T.; Hosack, D.A.; Yang, J.; Gao, W.; Lane, H.C.; Lempicki, R.A. DAVID: Database for Annotation, Visualization, and Integrated Discovery. Genome Biol. 2003, 4, P3. [Google Scholar] [CrossRef]
- Cai, C.; Wang, H.; He, H.H.; Chen, S.; He, L.; Ma, F.; Mucci, L.; Wang, Q.; Fiore, C.; Sowalsky, A.G.; et al. ERG induces androgen receptor-mediated regulation of SOX9 in prostate cancer. J. Clin. Investig. 2013, 123, 1109–1122. [Google Scholar] [CrossRef] [PubMed]
- Vainio, P.; Wolf, M.; Edgren, H.; He, T.; Kohonen, P.; Mpindi, J.P.; Smit, F.; Verhaegh, G.; Schalken, J.; Perala, M.; et al. Integrative genomic, transcriptomic, and RNAi analysis indicates a potential oncogenic role for FAM110B in castration-resistant prostate cancer. Prostate 2012, 72, 789–802. [Google Scholar] [CrossRef] [PubMed]
- Tang, Z.; Kang, B.; Li, C.; Chen, T.; Zhang, Z. GEPIA2: An enhanced web server for large-scale expression profiling and interactive analysis. Nucleic Acids Res. 2019, 47, W556–W560. [Google Scholar] [CrossRef]


| Method | |||||||||
|---|---|---|---|---|---|---|---|---|---|
| Degree | MNC | EPC | EcCentricity | MCC | |||||
| Rank | Gene | Rank | Gene | Rank | Gene | Rank | Gene | Rank | Gene |
| 1 | VEGFA | 1 | ATF4 | 1 | VEGFA | 1 | DDIT3 | 1 | GPC3 |
| 2 | ATF4 | 2 | GPC3 | 2 | ATF4 | 1 | ATF4 | 2 | LTBP1 |
| 3 | ATF3 | 3 | EFNA5 | 3 | DDIT3 | 1 | CTH | 2 | IGFBP5 |
| 3 | FYN | 3 | DDIT3 | 4 | ATF3 | 1 | ATF3 | 4 | STC2 |
| 3 | AGT | 3 | ATF3 | 5 | FYN | 1 | ASNS | 5 | FAM20C |
| 3 | SREBF1 | 3 | AGT | 6 | AGT | 1 | CYP2E1 | 5 | RCN1 |
| 7 | EFNA5 | 7 | FYN | 7 | ENO2 | 1 | ALDH2 | 5 | MXRA8 |
| 7 | DDIT3 | 7 | LTBP1 | 8 | MYOD1 | 1 | VEGFA | 8 | ATF4 |
| 7 | GPC3 | 7 | IGFBP5 | 9 | EFNA5 | 1 | ENO2 | 9 | ATF3 |
| 10 | LTBP1 | 10 | VEGFA | 10 | ASNS | 1 | PCK2 | 10 | DDIT3 |
| 10 | IGFBP5 | 10 | FAM20C | 11 | DDIT4 | 1 | GABBR1 | 11 | VEGFA |
| 10 | GAD1 | 10 | STC2 | 12 | GPC3 | 1 | AGT | 11 | AGT |
| 13 | ENO2 | 10 | RCN1 | 13 | GABBR1 | 1 | SMARCD3 | 13 | GABBR1 |
| 13 | GABBR1 | 10 | MXRA8 | 14 | GAD1 | 1 | MYOD1 | 14 | EFNA5 |
| 13 | MYOD1 | 15 | EPHA3 | 15 | IGFBP5 | 1 | CHAC1 | 14 | ASNS |
| 16 | ASNS | 15 | ASNS | 16 | LTBP1 | 1 | DDIT4 | 16 | ACKR3 |
| 16 | RELN | 15 | SRGN | 17 | SREBF1 | 17 | GABRA5 | 16 | LPAR3 |
| 16 | STC2 | 15 | ACKR3 | 18 | RELN | 17 | BEST1 | 18 | CHAC1 |
| 19 | CYP2E1 | 15 | LPAR3 | 19 | ACKR3 | 17 | EFNA5 | 18 | PCP2 |
| 19 | FAM20C | 15 | GAD1 | 20 | FAM20C | 17 | FSCN1 | 20 | EPHA3 |
Disclaimer/Publisher’s Note: The statements, opinions and data contained in all publications are solely those of the individual author(s) and contributor(s) and not of MDPI and/or the editor(s). MDPI and/or the editor(s) disclaim responsibility for any injury to people or property resulting from any ideas, methods, instructions or products referred to in the content. |
© 2024 by the authors. Licensee MDPI, Basel, Switzerland. This article is an open access article distributed under the terms and conditions of the Creative Commons Attribution (CC BY) license (https://creativecommons.org/licenses/by/4.0/).
Share and Cite
Jung, A.R.; Shin, S.; Kim, M.Y.; Ha, U.-S.; Hong, S.-H.; Lee, J.Y.; Kim, S.W.; Chung, Y.-J.; Park, Y.H. Integrated Bioinformatics Analysis Identified ASNS and DDIT3 as the Therapeutic Target in Castrate-Resistant Prostate Cancer. Int. J. Mol. Sci. 2024, 25, 2836. https://doi.org/10.3390/ijms25052836
Jung AR, Shin S, Kim MY, Ha U-S, Hong S-H, Lee JY, Kim SW, Chung Y-J, Park YH. Integrated Bioinformatics Analysis Identified ASNS and DDIT3 as the Therapeutic Target in Castrate-Resistant Prostate Cancer. International Journal of Molecular Sciences. 2024; 25(5):2836. https://doi.org/10.3390/ijms25052836
Chicago/Turabian StyleJung, Ae Ryang, Sun Shin, Mee Young Kim, U-Syn Ha, Sung-Hoo Hong, Ji Youl Lee, Sae Woong Kim, Yeun-Jun Chung, and Yong Hyun Park. 2024. "Integrated Bioinformatics Analysis Identified ASNS and DDIT3 as the Therapeutic Target in Castrate-Resistant Prostate Cancer" International Journal of Molecular Sciences 25, no. 5: 2836. https://doi.org/10.3390/ijms25052836