
Rapid and Robust Multi-Phenotypic Assay System for ALS Using Human iPS Cells with Mutations in Causative Genes
 , , and
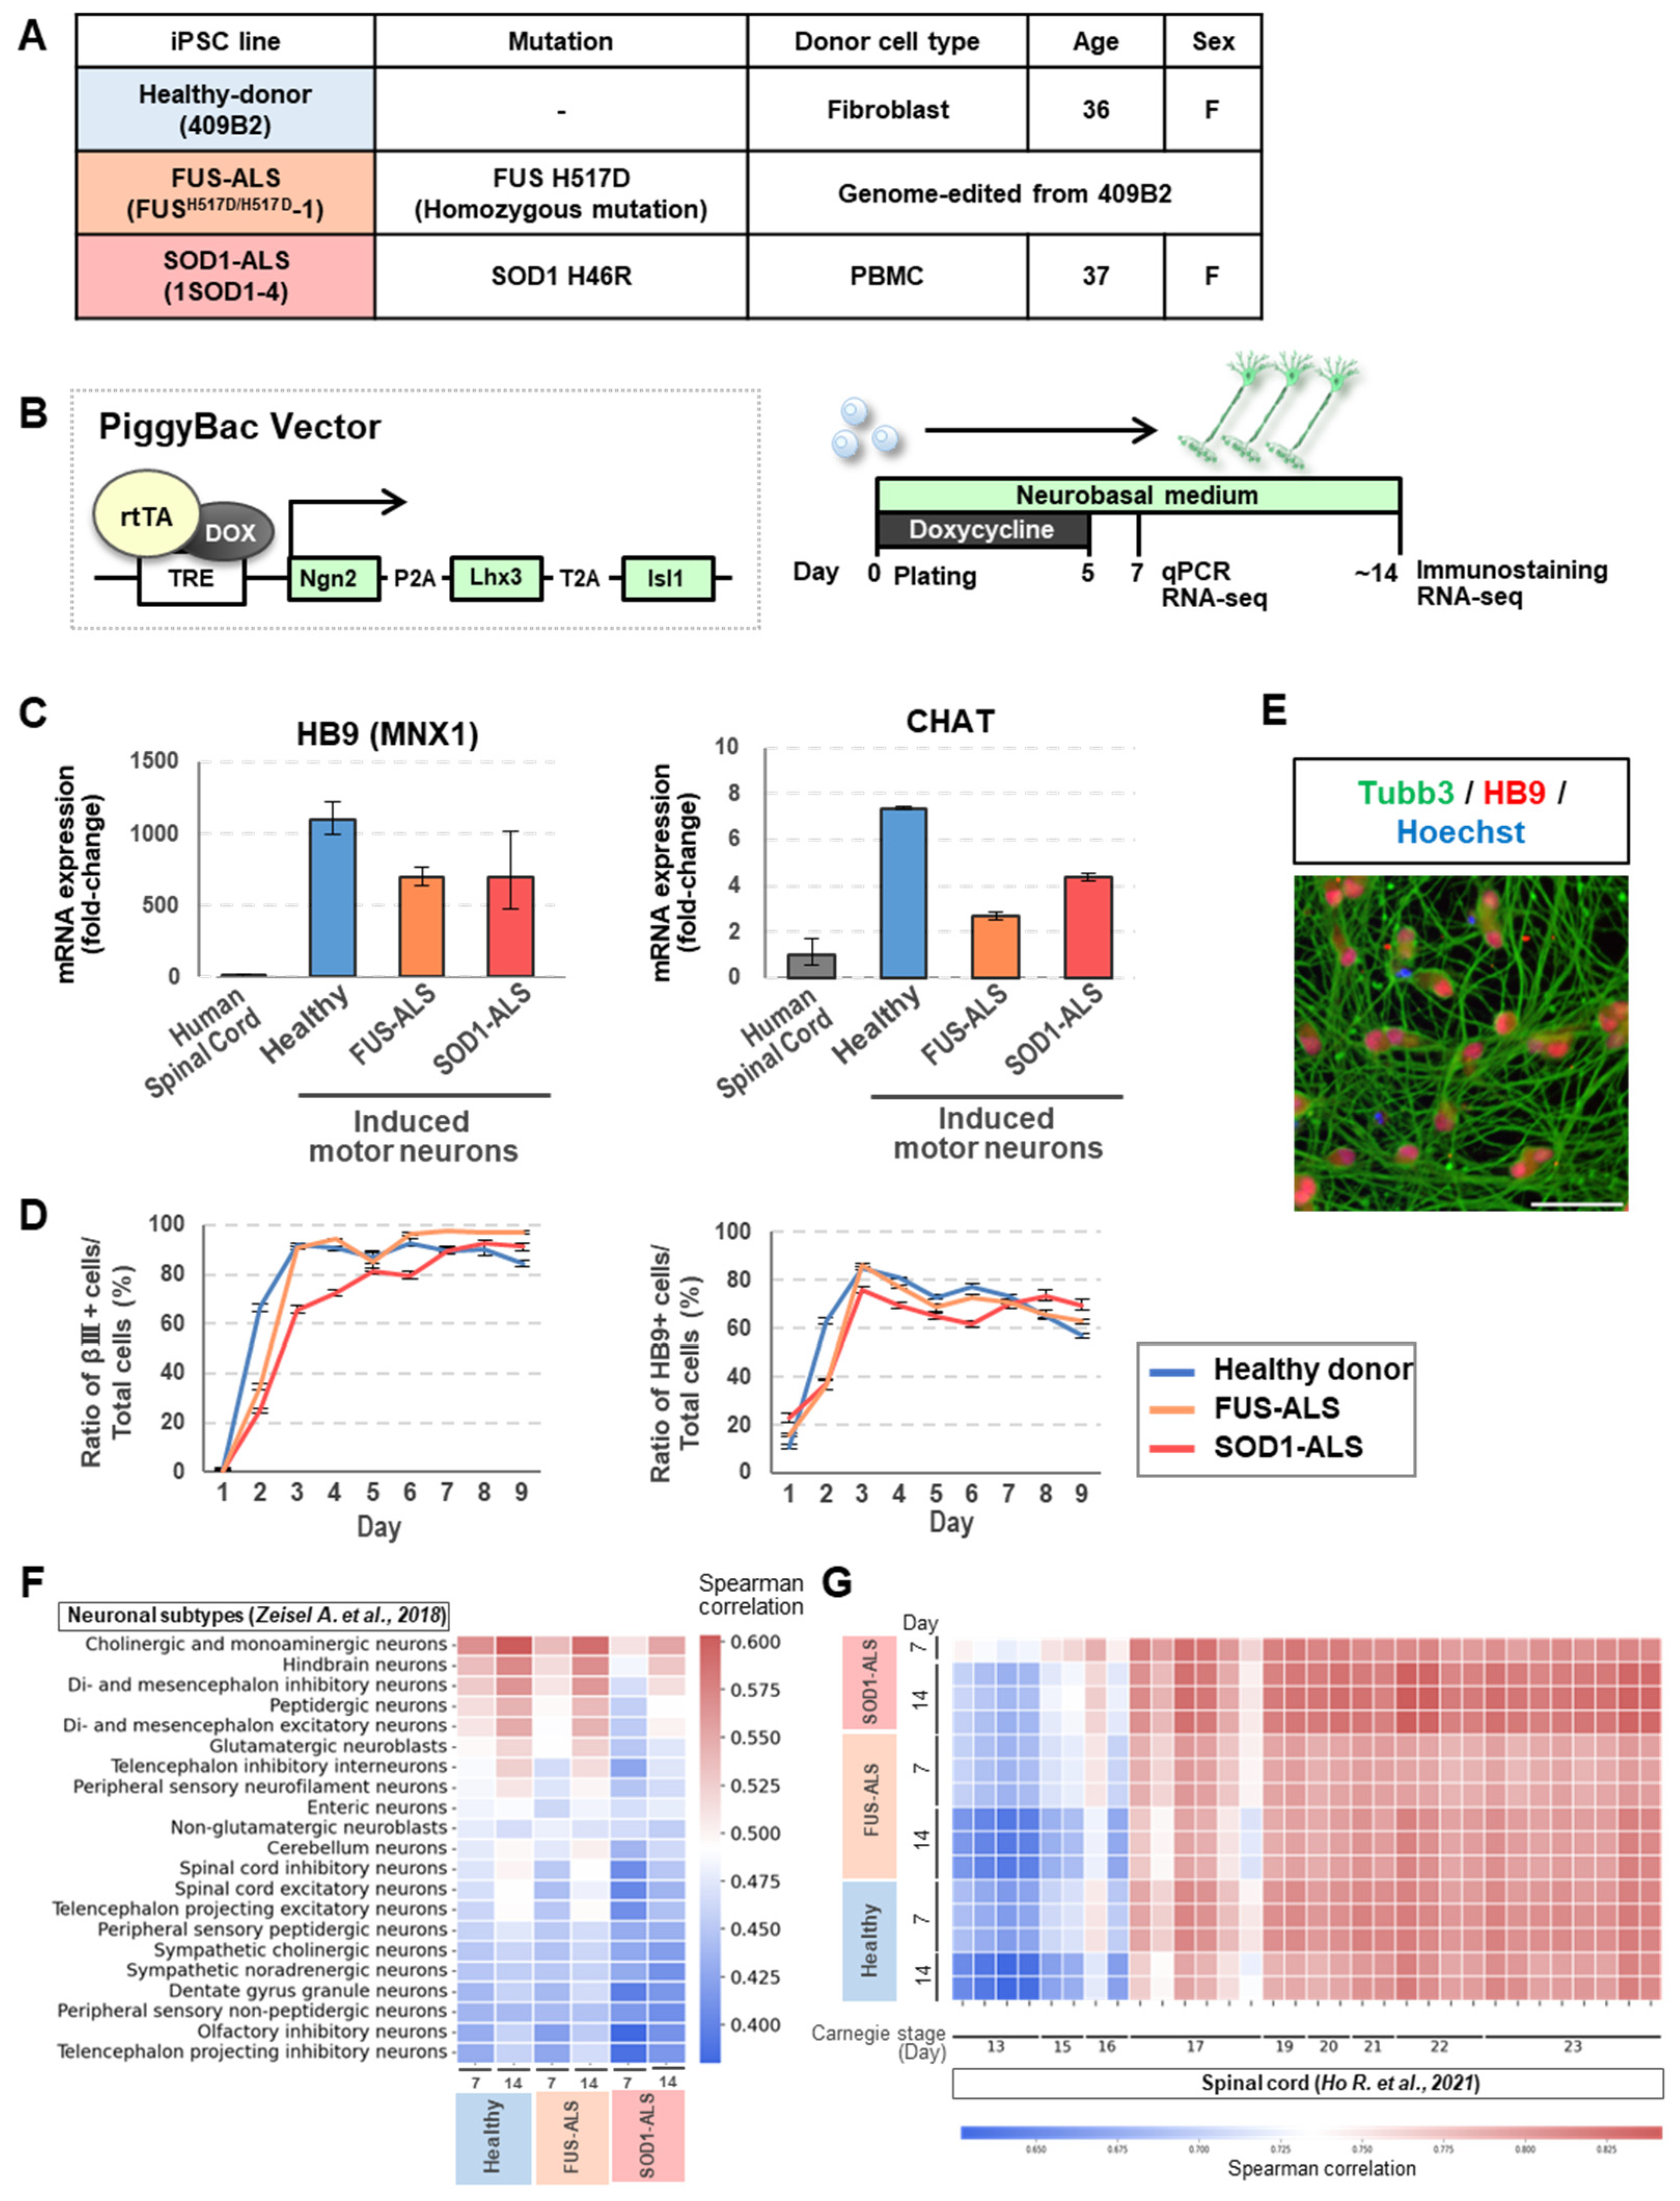
Abstract
:1. Introduction
2. Results
2.1. Motor Neurons Were Rapidly and Efficiently Generated from iPSCs
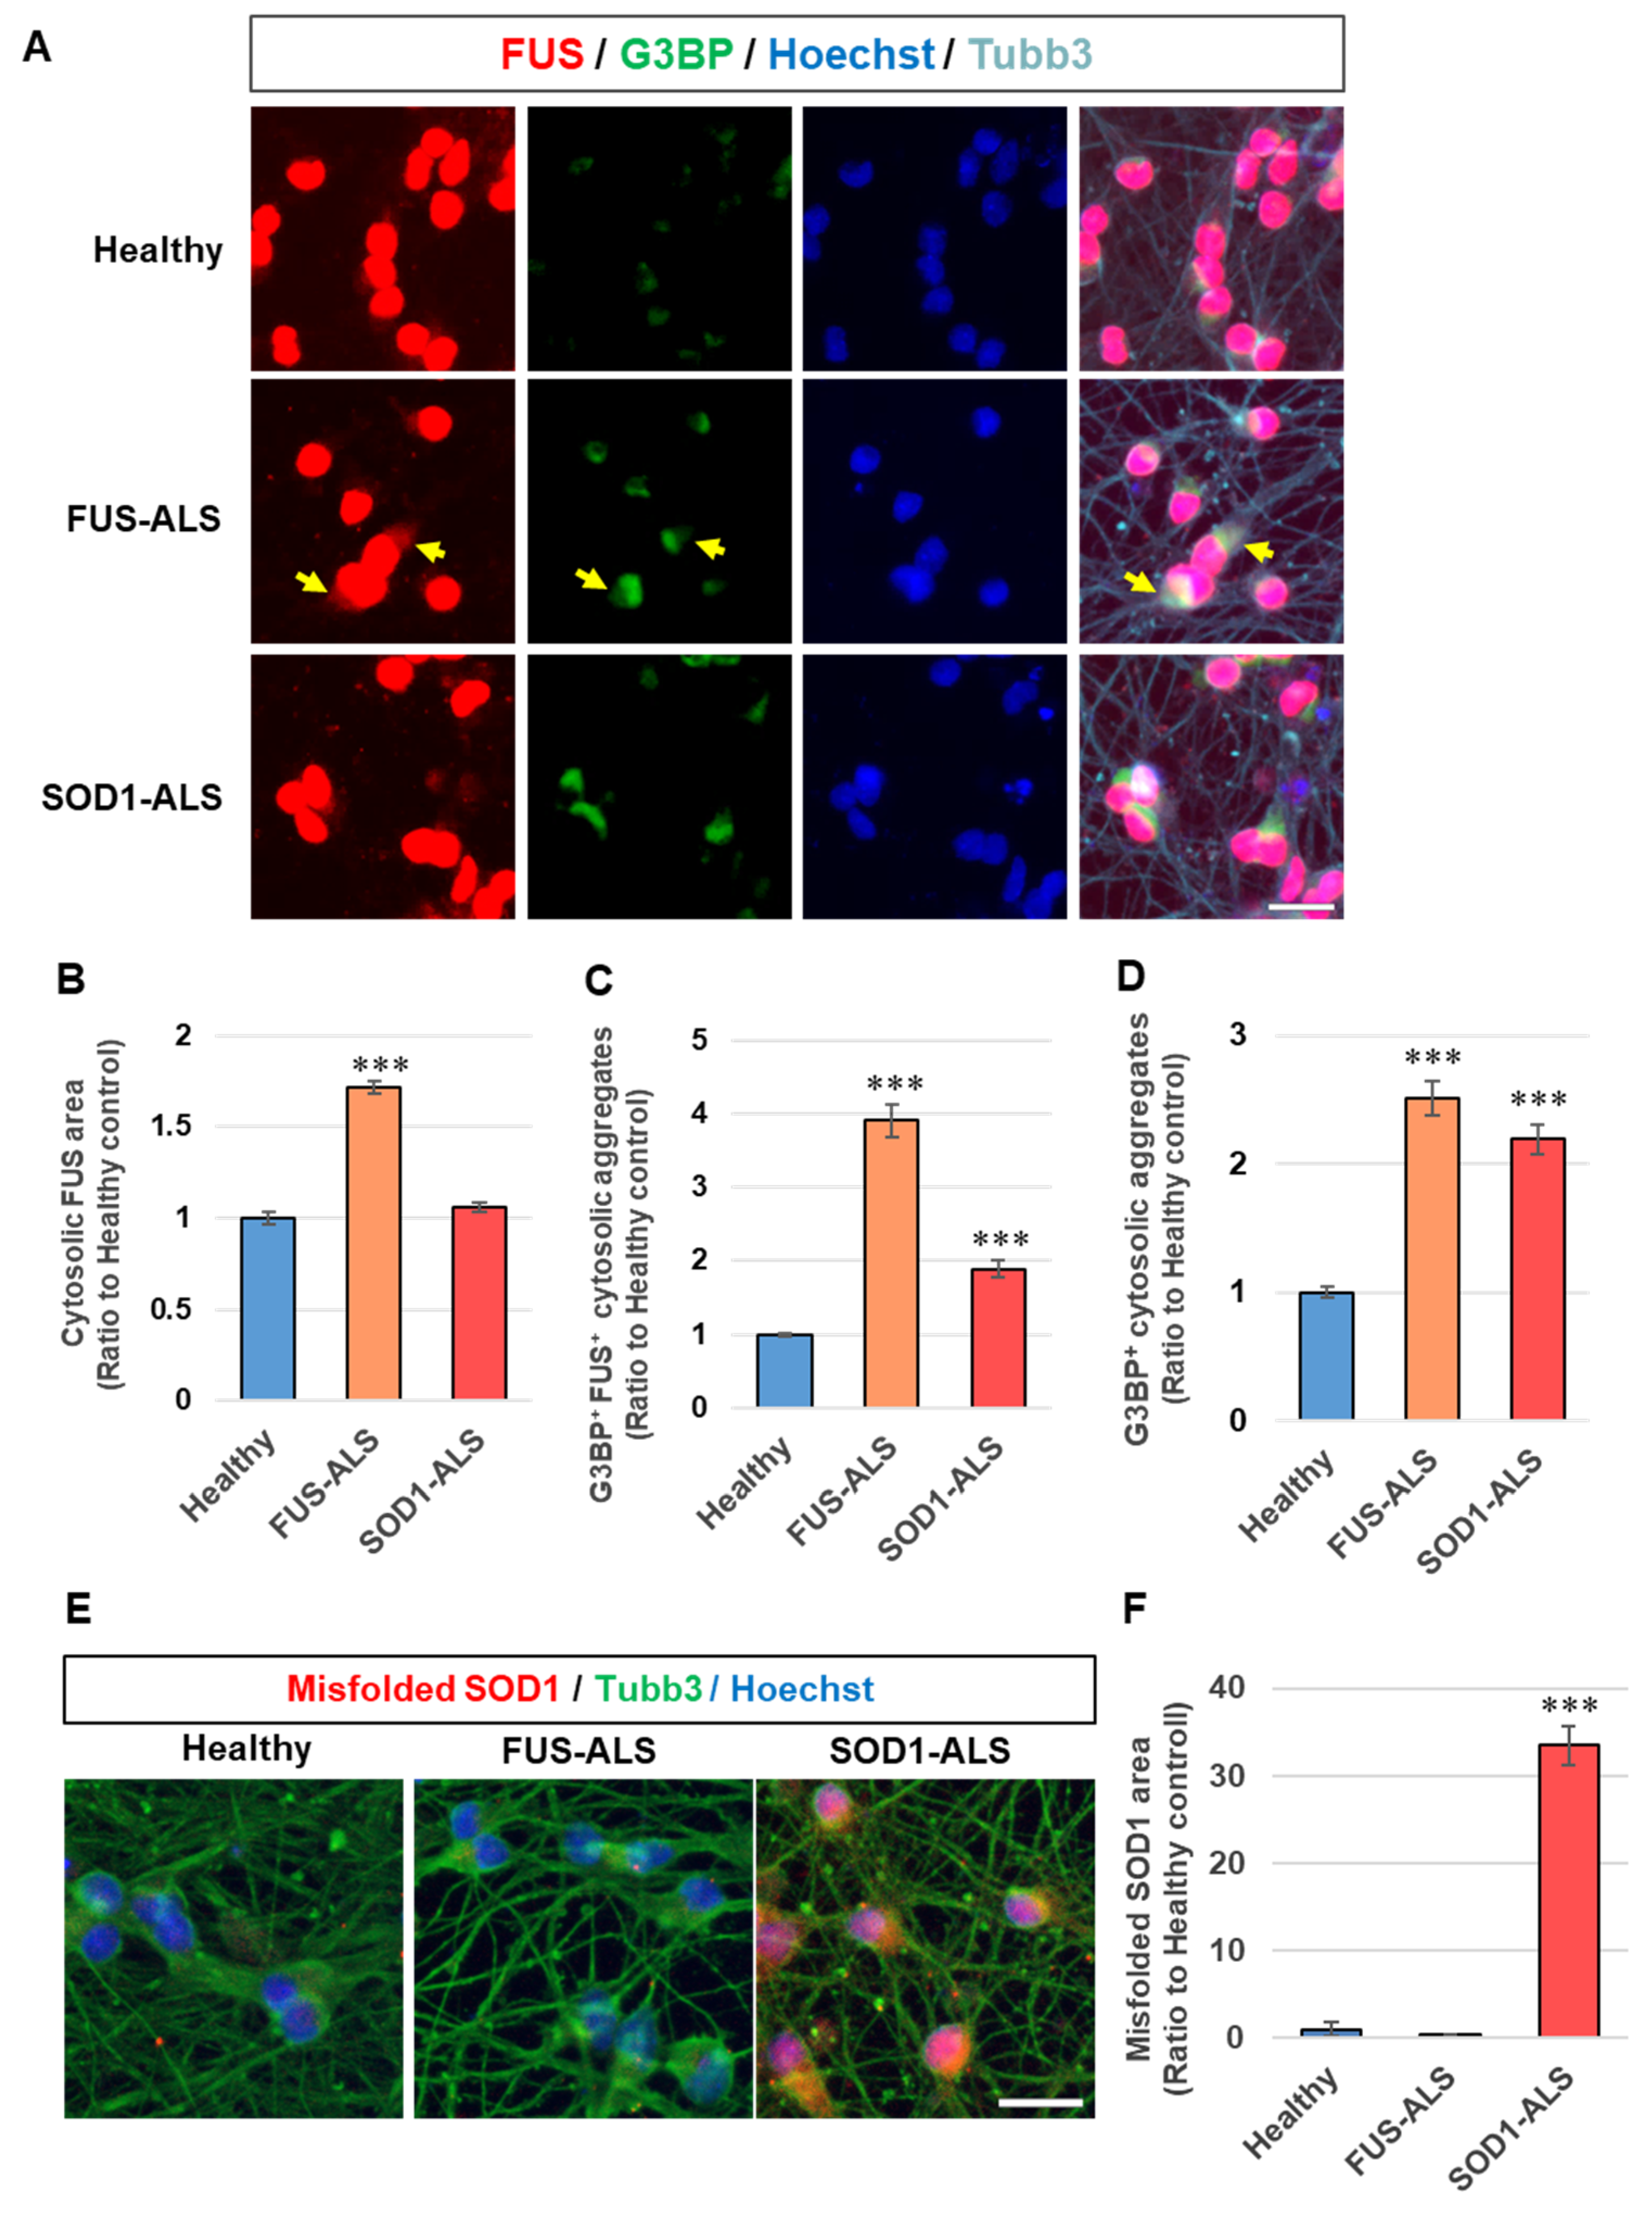
2.2. Protein Accumulation Corresponding to Gene Mutations Were Observed in iPSC-Derived Neurons
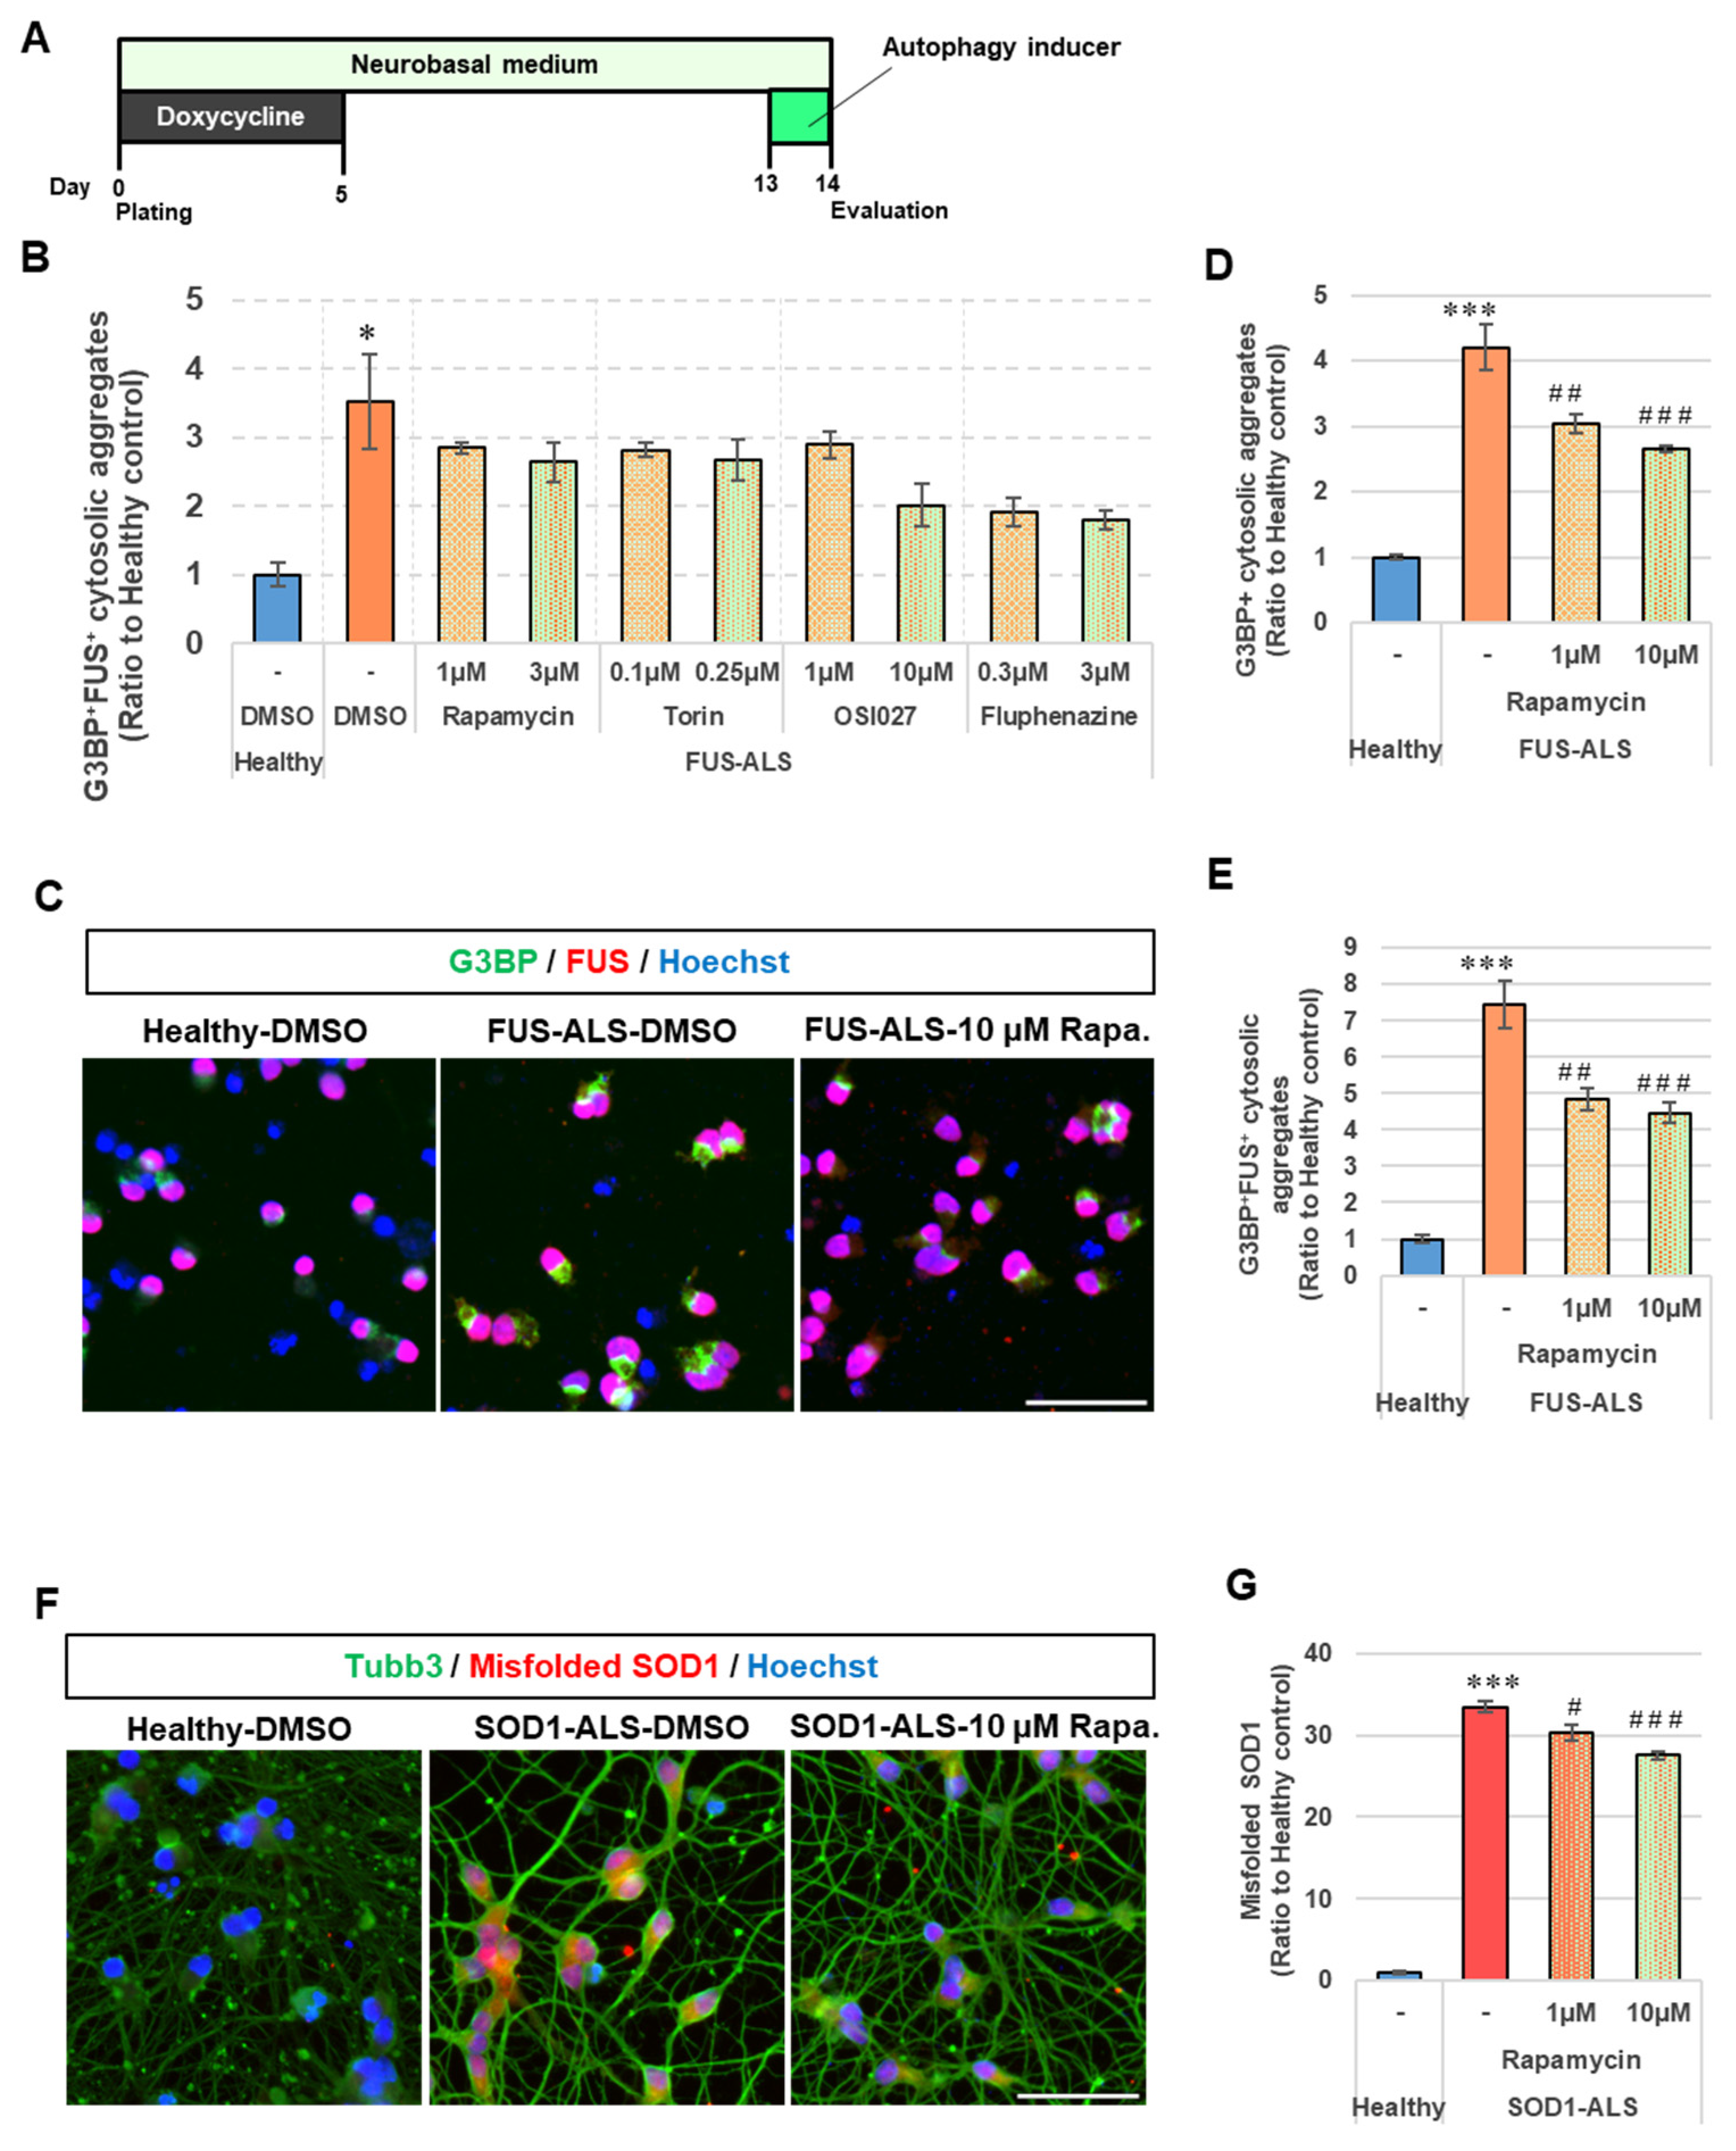
2.3. Protein Accumulation in Motor Neurons Was Suppressed by the Activation of Autophagy
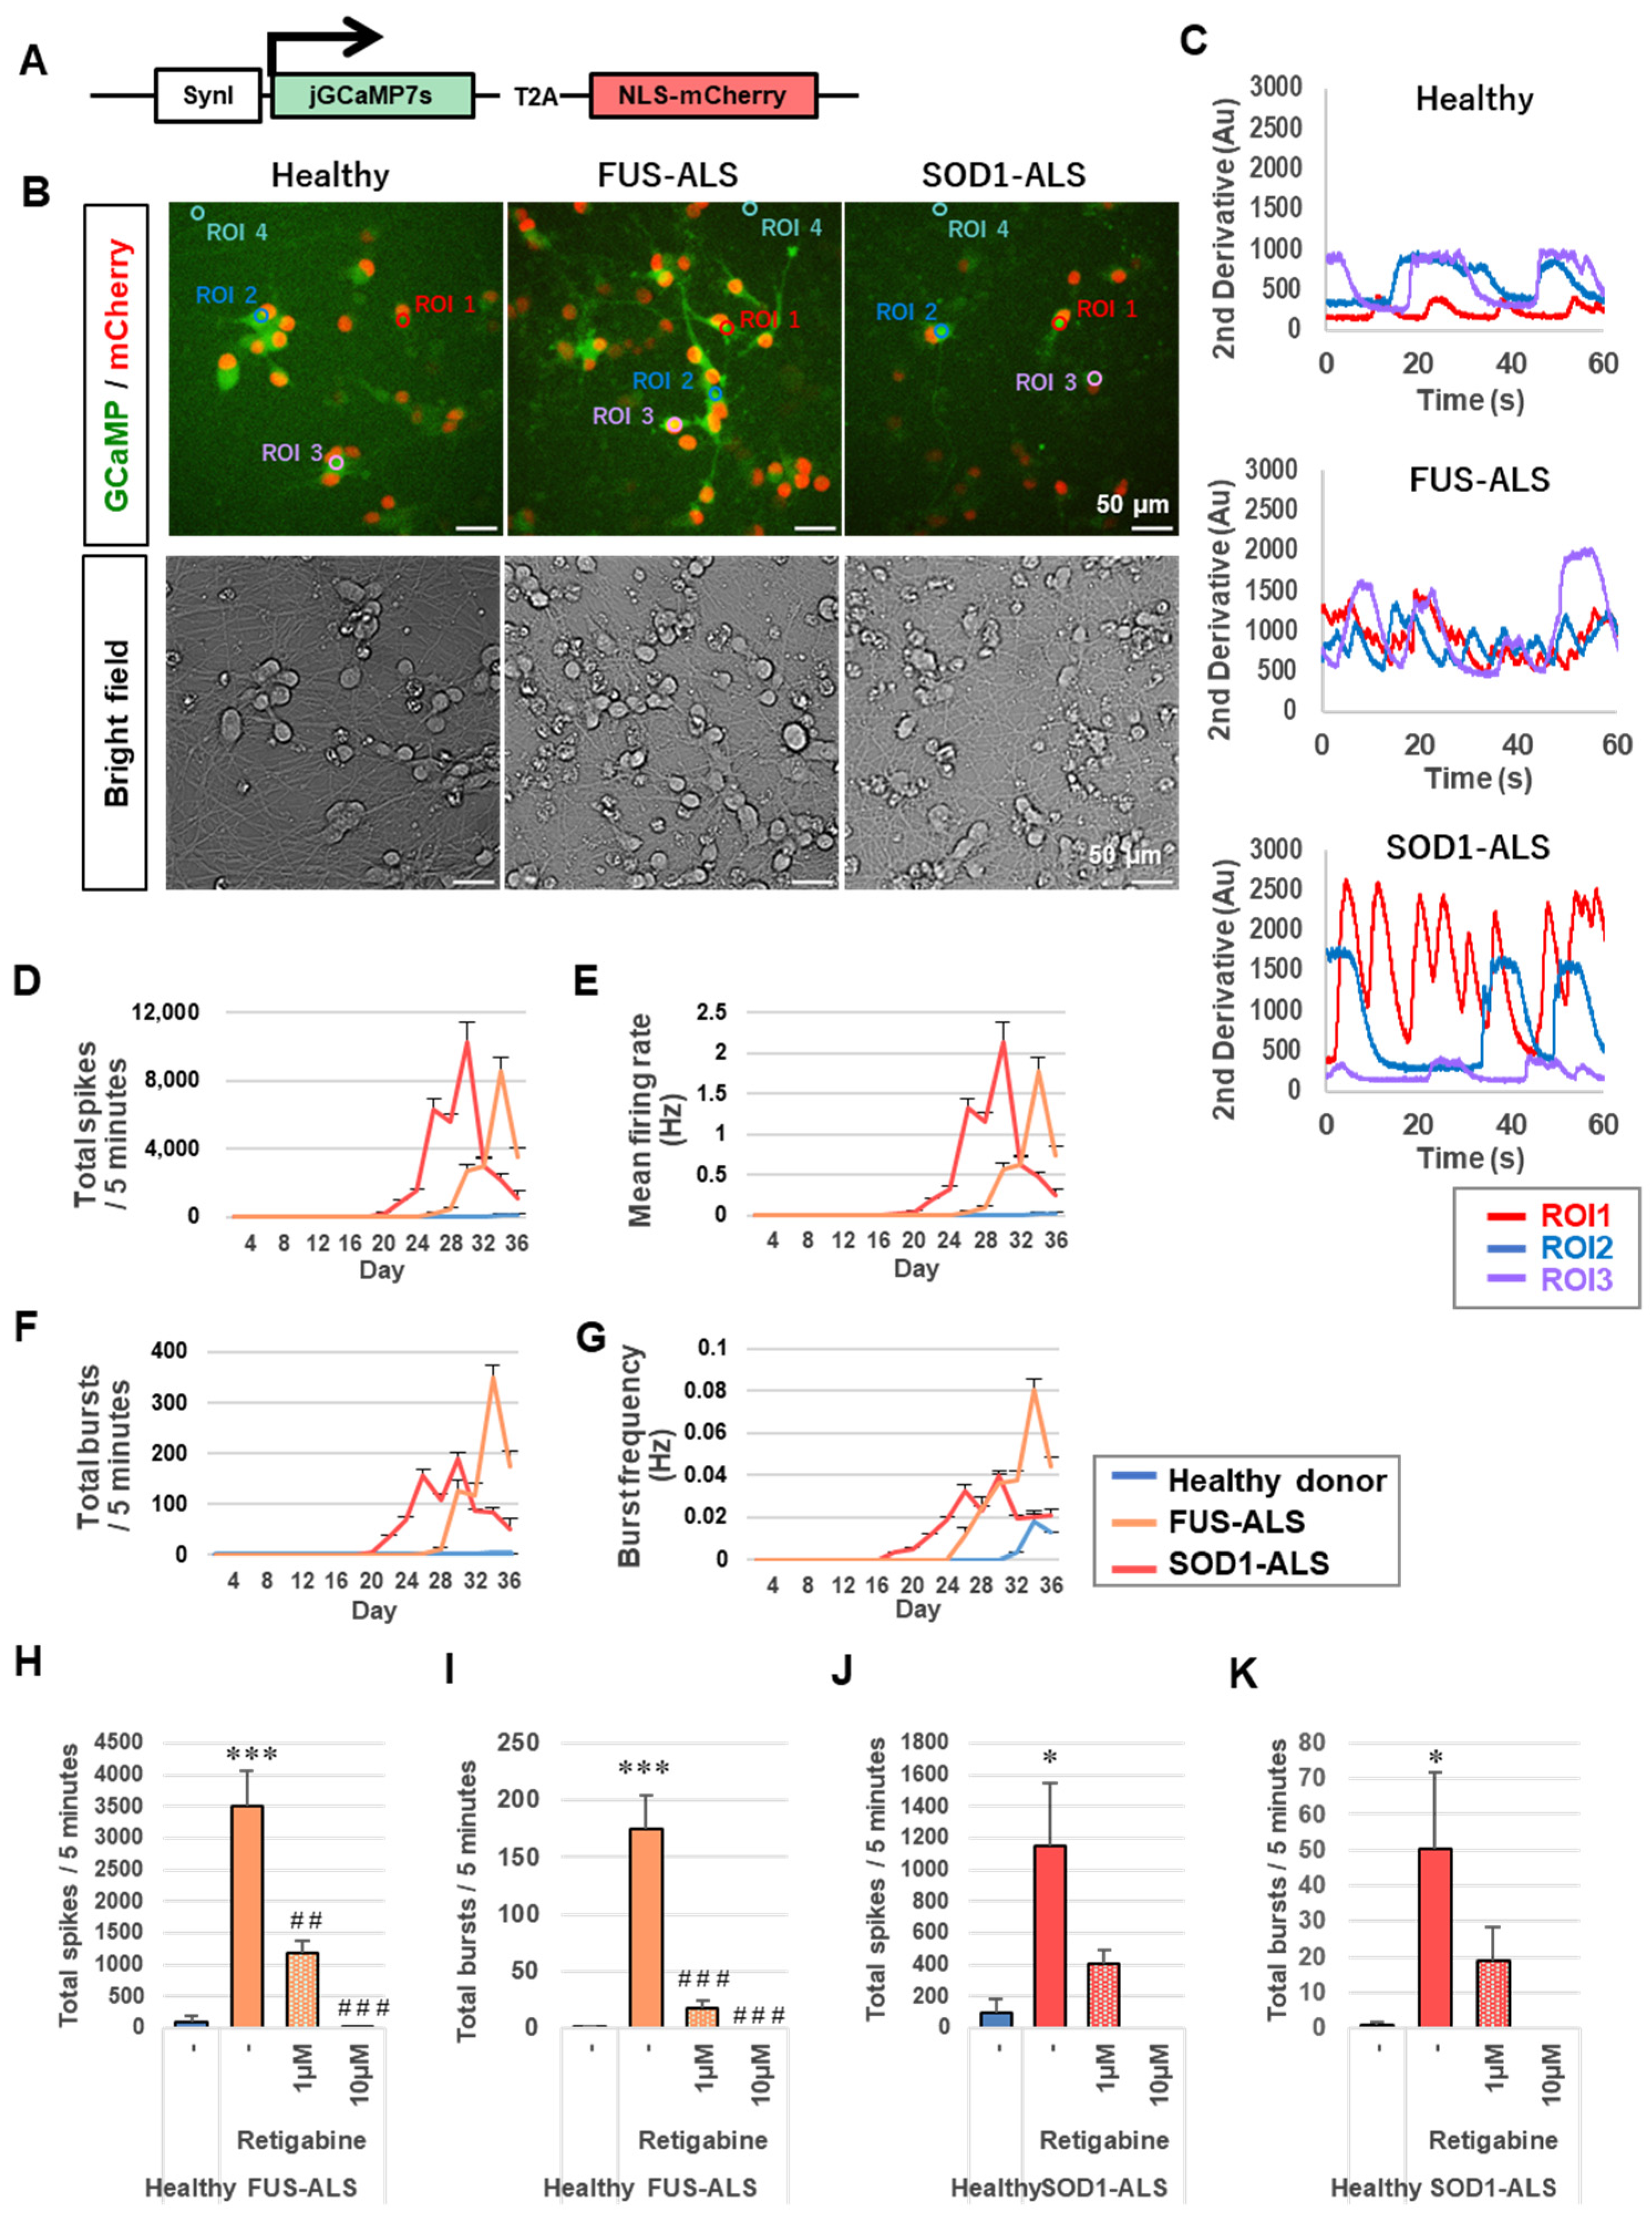
2.4. Induced Motor Neurons Have Electrophysiological Function and the ALS Motor Neurons Show Hyperexcitability
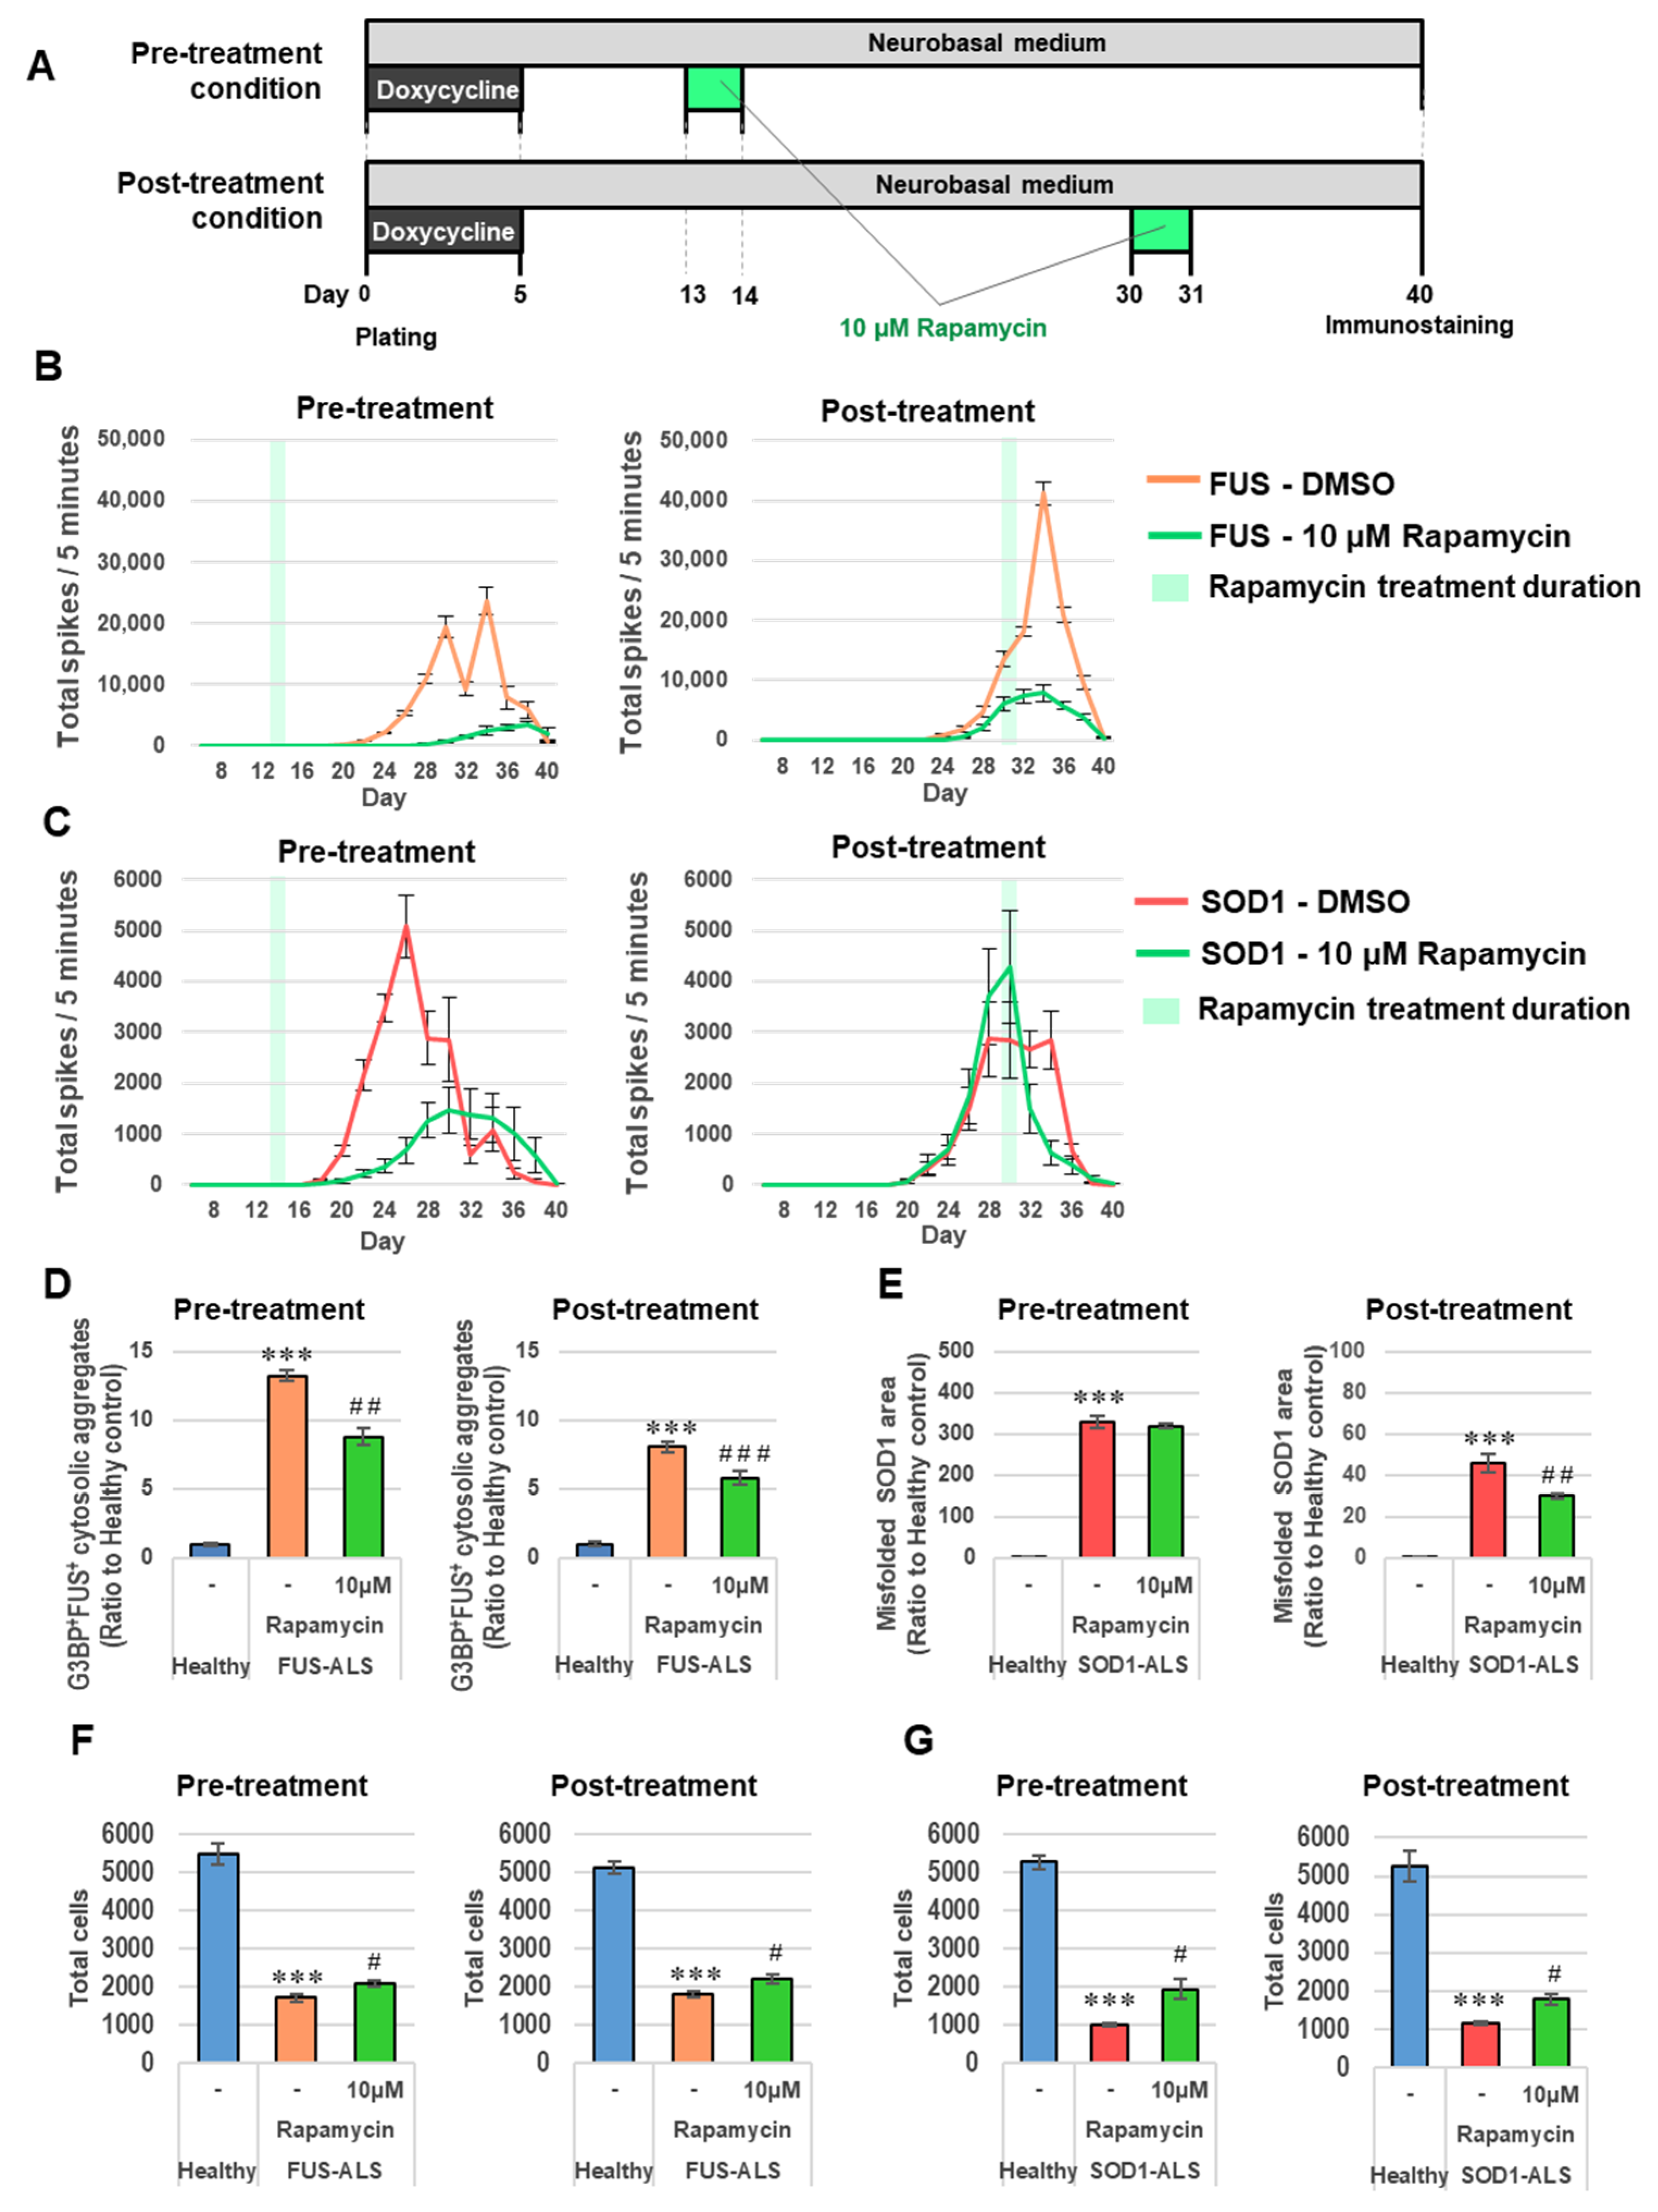
2.5. Hyperexcitability of ALS Motor Neurons Was Suppressed by Activation of Autophagy
3. Discussion
4. Materials and Methods
4.1. Human iPSC Culture
4.2. PiggyBac Vector Transfection
4.3. Neuronal Differentiation from iPSCs
4.4. Quantitative Reverse-Transcription PCR (qRT-PCR)
4.5. Transcriptome Analysis
4.6. Immunocytochemistry
4.7. High-Content Analysis
4.8. Calcium Imaging
4.9. Multiple Electrode Array (MEA)
4.10. Drug Treatment
Supplementary Materials
Author Contributions
Funding
Institutional Review Board Statement
Informed Consent Statement
Data Availability Statement
Acknowledgments
Conflicts of Interest
References
- Okano, H.; Morimoto, S. IPSC-Based Disease Modeling and Drug Discovery in Cardinal Neurodegenerative Disorders. Cell Stem Cell 2022, 29, 189–208. [Google Scholar] [CrossRef] [PubMed]
- Liguori, F.; Amadio, S.; Volonté, C. Where and Why Modeling Amyotrophic Lateral Sclerosis. Int. J. Mol. Sci. 2021, 22, 3977. [Google Scholar] [CrossRef]
- Du, H.; Huo, Z.; Chen, Y.; Zhao, Z.; Meng, F.; Wang, X.; Liu, S.; Zhang, H.; Zhou, F.; Liu, J.; et al. Induced Pluripotent Stem Cells and Their Applications in Amyotrophic Lateral Sclerosis. Cells 2023, 12, 971. [Google Scholar] [CrossRef]
- Ideno, H.; Imaizumi, K.; Shimada, H.; Sanosaka, T.; Nemoto, A.; Kohyama, J.; Okano, H. Human PSCs Determine the Competency of Cerebral Organoid Differentiation via FGF Signaling and Epigenetic Mechanisms. iScience 2022, 25, 105140. [Google Scholar] [CrossRef] [PubMed]
- Imaizumi, K.; Okano, H. Modeling Neurodevelopment in a Dish with Pluripotent Stem Cells. Dev. Growth Differ. 2021, 63, 18–25. [Google Scholar] [CrossRef]
- Jahromi, M.A.M.; Abdoli, A.; Rahmanian, M.; Bardania, H.; Bayandori, M.; Basri, S.M.M.; Kalbasi, A.; Aref, A.R.; Karimi, M.; Hamblin, M.R. Microfluidic Brain-on-a-Chip: Perspectives for Mimicking Neural System Disorders. Mol. Neurobiol. 2019, 56, 8489–8512. [Google Scholar] [CrossRef]
- Chambers, S.M.; Fasano, C.A.; Papapetrou, E.P.; Tomishima, M.; Sadelain, M.; Studer, L. Highly Efficient Neural Conversion of Human ES and IPS Cells by Dual Inhibition of SMAD Signaling. Nat. Biotechnol. 2009, 27, 275–280. [Google Scholar] [CrossRef] [PubMed] [Green Version]
- Kiecker, C.; Lumsden, A. The Role of Organizers in Patterning the Nervous System. Annu. Rev. Neurosci. 2012, 35, 347–367. [Google Scholar] [CrossRef] [Green Version]
- Kirkeby, A.; Grealish, S.; Wolf, D.A.; Nelander, J.; Wood, J.; Lundblad, M.; Lindvall, O.; Parmar, M. Generation of Regionally Specified Neural Progenitors and Functional Neurons from Human Embryonic Stem Cells under Defined Conditions. Cell Rep. 2012, 1, 703–714. [Google Scholar] [CrossRef] [Green Version]
- Moya, N.; Cutts, J.; Gaasterland, T.; Willert, K.; Brafman, D.A. Endogenous WNT Signaling Regulates HPSC-Derived Neural Progenitor Cell Heterogeneity and Specifies Their Regional Identity. Stem Cell Rep. 2014, 3, 1015–1028. [Google Scholar] [CrossRef]
- Imaizumi, K.; Sone, T.; Ibata, K.; Fujimori, K.; Yuzaki, M.; Akamatsu, W.; Okano, H. Controlling the Regional Identity of HPSC-Derived Neurons to Uncover Neuronal Subtype Specificity of Neurological Disease Phenotypes. Stem Cell Rep. 2015, 5, 1010–1022. [Google Scholar] [CrossRef] [PubMed] [Green Version]
- Ichiyanagi, N.; Fujimori, K.; Yano, M.; Ishihara-Fujisaki, C.; Sone, T.; Akiyama, T.; Okada, Y.; Akamatsu, W.; Matsumoto, T.; Ishikawa, M.; et al. Establishment of in Vitro FUS-Associated Familial Amyotrophic Lateral Sclerosis Model Using Human Induced Pluripotent Stem Cells. Stem Cell Rep. 2016, 6, 496–510. [Google Scholar] [CrossRef] [Green Version]
- Wainger, B.J.; Kiskinis, E.; Mellin, C.; Wiskow, O.; Han, S.S.W.; Sandoe, J.; Perez, N.P.; Williams, L.A.; Lee, S.; Boulting, G.; et al. Intrinsic Membrane Hyperexcitability of Amyotrophic Lateral Sclerosis Patient-Derived Motor Neurons. Cell Rep. 2014, 7, 1–11. [Google Scholar] [CrossRef] [PubMed] [Green Version]
- Kondo, T.; Imamura, K.; Funayama, M.; Tsukita, K.; Miyake, M.; Ohta, A.; Woltjen, K.; Nakagawa, M.; Asada, T.; Arai, T.; et al. IPSC-Based Compound Screening and In Vitro Trials Identify a Synergistic Anti-Amyloid β Combination for Alzheimer’s Disease. Cell Rep. 2017, 21, 2304–2312. [Google Scholar] [CrossRef] [Green Version]
- Yamaguchi, A.; Ishikawa, K.I.; Inoshita, T.; Shiba-Fukushima, K.; Saiki, S.; Hatano, T.; Mori, A.; Oji, Y.; Okuzumi, A.; Li, Y.; et al. Identifying Therapeutic Agents for Amelioration of Mitochondrial Clearance Disorder in Neurons of Familial Parkinson Disease. Stem Cell Rep. 2020, 14, 1060–1075. [Google Scholar] [CrossRef] [PubMed]
- Antoniou, N.; Prodromidou, K.; Kouroupi, G.; Boumpoureka, I.; Samiotaki, M.; Panayotou, G.; Xilouri, M.; Kloukina, I.; Stefanis, L.; Grailhe, R.; et al. High Content Screening and Proteomic Analysis Identify a Kinase Inhibitor That Rescues Pathological Phenotypes in a Patient-Derived Model of Parkinson’s Disease. NPJ Park. Dis. 2022, 8, 15. [Google Scholar] [CrossRef]
- Fujimori, K.; Ishikawa, M.; Otomo, A.; Atsuta, N.; Nakamura, R.; Akiyama, T.; Hadano, S.; Aoki, M.; Saya, H.; Sobue, G.; et al. Modeling Sporadic ALS in IPSC-Derived Motor Neurons Identifies a Potential Therapeutic Agent. Nat. Med. 2018, 24, 1579–1589. [Google Scholar] [CrossRef]
- Zhang, Y.; Pak, C.H.; Han, Y.; Ahlenius, H.; Zhang, Z.; Chanda, S.; Marro, S.; Patzke, C.; Acuna, C.; Covy, J.; et al. Rapid Single-Step Induction of Functional Neurons from Human Pluripotent Stem Cells. Neuron 2013, 78, 785–798. [Google Scholar] [CrossRef] [Green Version]
- Mazzoni, E.O.; Mahony, S.; Closser, M.; Morrison, C.A.; Nedelec, S.; Williams, D.J.; An, D.; Gifford, D.K.; Wichterle, H. Synergistic Binding of Transcription Factors to Cell-Specific Enhancers Programs Motor Neuron Identity. Nat. Neurosci. 2013, 16, 1219–1227. [Google Scholar] [CrossRef] [Green Version]
- Imamura, K.; Izumi, Y.; Watanabe, A.; Tsukita, K.; Woltjen, K.; Yamamoto, T.; Hotta, A.; Kondo, T.; Kitaoka, S.; Ohta, A.; et al. The Src/c-Abl Pathway Is a Potential Therapeutic Target in Amyotrophic Lateral Sclerosis. Sci. Transl. Med. 2017, 9, 391. [Google Scholar] [CrossRef] [Green Version]
- Shi, Y.; Lin, S.; Staats, K.A.; Li, Y.; Chang, W.H.; Hung, S.T.; Hendricks, E.; Linares, G.R.; Wang, Y.; Son, E.Y.; et al. Haploinsufficiency Leads to Neurodegeneration in C9ORF72 ALS/FTD Human Induced Motor Neurons. Nat. Med. 2018, 24, 313–325. [Google Scholar] [CrossRef]
- Jessell, T.M. Neuronal specification in the spinal cord: Inductive signals and transcriptional codes. Nat. Rev. Genet. 2000, 1, 20–29. [Google Scholar] [CrossRef]
- Okita, K.; Matsumura, Y.; Sato, Y.; Okada, A.; Morizane, A.; Okamoto, S.; Hong, H.; Nakagawa, M.; Tanabe, K.; Tezuka, K.I.; et al. A More Efficient Method to Generate Integration-Free Human IPS Cells. Nat. Methods 2011, 8, 409–412. [Google Scholar] [CrossRef] [PubMed] [Green Version]
- Ishikawa, M.; Aoyama, T.; Shibata, S.; Sone, T.; Miyoshi, H.; Watanabe, H.; Nakamura, M.; Morota, S.; Uchino, H.; Yoo, A.S.; et al. MiRNA-Based Rapid Differentiation of Purified Neurons from HPSCs Advancestowards Quick Screening for Neuronal Disease Phenotypes In Vitro. Cells 2020, 9, 532. [Google Scholar] [CrossRef] [Green Version]
- Zeisel, A.; Hochgerner, H.; Lönnerberg, P.; Johnsson, A.; Memic, F.; van der Zwan, J.; Häring, M.; Braun, E.; Borm, L.E.; La Manno, G.; et al. Molecular Architecture of the Mouse Nervous System. Cell 2018, 174, 999–1014.e22. [Google Scholar] [CrossRef] [PubMed] [Green Version]
- Ho, R.; Workman, M.J.; Mathkar, P.; Wu, K.; Kim, K.J.; O’Rourke, J.G.; Kellogg, M.; Montel, V.; Banuelos, M.G.; Arogundade, O.A.; et al. Cross-Comparison of Human IPSC Motor Neuron Models of Familial and Sporadic ALS Reveals Early and Convergent Transcriptomic Disease Signatures. Cell Syst. 2021, 12, 159–175.e9. [Google Scholar] [CrossRef]
- Gal, J.; Kuang, L.; Barnett, K.R.; Zhu, B.Z.; Shissler, S.C.; Korotkov, K.V.; Hayward, L.J.; Kasarskis, E.J.; Zhu, H. ALS Mutant SOD1 Interacts with G3BP1 and Affects Stress Granule Dynamics. Acta Neuropathol. 2016, 132, 563–576. [Google Scholar] [CrossRef] [Green Version]
- Marrone, L.; Poser, I.; Casci, I.; Japtok, J.; Reinhardt, P.; Janosch, A.; Andree, C.; Lee, H.O.; Moebius, C.; Koerner, E.; et al. Isogenic FUS-EGFP IPSC Reporter Lines Enable Quantification of FUS Stress Granule Pathology That Is Rescued by Drugs Inducing Autophagy. Stem Cell Rep. 2018, 10, 375–389. [Google Scholar] [CrossRef] [Green Version]
- Silva, M.C.; Nandi, G.A.; Tentarelli, S.; Gurrell, I.K.; Jamier, T.; Lucente, D.; Dickerson, B.C.; Brown, D.G.; Brandon, N.J.; Haggarty, S.J. Prolonged Tau Clearance and Stress Vulnerability Rescue by Pharmacological Activation of Autophagy in Tauopathy Neurons. Nat. Commun. 2020, 11, 3258. [Google Scholar] [CrossRef]
- Barmada, S.J.; Serio, A.; Arjun, A.; Bilican, B.; Daub, A.; Ando, D.M.; Tsvetkov, A.; Pleiss, M.; Li, X.; Peisach, D.; et al. Autophagy Induction Enhances TDP43 Turnover and Survival in Neuronal ALS Models. Nat. Chem. Biol. 2014, 10, 677–685. [Google Scholar] [CrossRef] [PubMed] [Green Version]
- Wainger, B.J.; Macklin, E.A.; Vucic, S.; McIlduff, C.E.; Paganoni, S.; Maragakis, N.J.; Bedlack, R.; Goyal, N.A.; Rutkove, S.B.; Lange, D.J.; et al. Effect of Ezogabine on Cortical and Spinal Motor Neuron Excitability in Amyotrophic Lateral Sclerosis: A Randomized Clinical Trial. JAMA Neurol. 2021, 78, 186–196. [Google Scholar] [CrossRef] [PubMed]
- Morimoto, S.; Takahashi, S.; Ito, D.; Okada, K.; Muh Chyi, C.; Nishiyama, A.; Fujimori, K.; Takao, M.; Hirai, M.; Kabe, Y.; et al. Ropinirole Hydrochloride for Amyotrophic Lateral Sclerosis: A Single-Center, Randomized 1 Feasibility, Double-Blind, Placebo-Controlled Trial. medRxiv 2021. [Google Scholar] [CrossRef]
- Hawrot, J.; Imhof, S.; Wainger, B.J. Modeling Cell-Autonomous Motor Neuron Phenotypes in ALS Using IPSCs. Neurobiol. Dis. 2020, 134, 104680. [Google Scholar] [CrossRef] [PubMed]
- Boehler, M.D.; Wheeler, B.C.; Brewer, G.J. Added Astroglia Promote Greater Synapse Density and Higher Activity in Neuronal Networks. Neuron Glia Biol. 2007, 3, 127–140. [Google Scholar] [CrossRef] [Green Version]
- Ishii, T.; Ishikawa, M.; Fujimori, K.; Maeda, T.; Kushima, I.; Arioka, Y.; Mori, D.; Nakatake, Y.; Yamagata, B.; Nio, S.; et al. In Vitro Modeling of the Bipolar Disorder and Schizophrenia Using Patient-Derived Induced Pluripotent Stem Cells with Copy Number Variations of PCDH15 and RELN. eNeuro 2019, 6, 403–418. [Google Scholar] [CrossRef] [Green Version]


Disclaimer/Publisher’s Note: The statements, opinions and data contained in all publications are solely those of the individual author(s) and contributor(s) and not of MDPI and/or the editor(s). MDPI and/or the editor(s) disclaim responsibility for any injury to people or property resulting from any ideas, methods, instructions or products referred to in the content. |
© 2023 by the authors. Licensee MDPI, Basel, Switzerland. This article is an open access article distributed under the terms and conditions of the Creative Commons Attribution (CC BY) license (https://creativecommons.org/licenses/by/4.0/).
Share and Cite
Kondo, T.; Ebinuma, I.; Tanaka, H.; Nishikawa, Y.; Komiya, T.; Ishikawa, M.; Okano, H. Rapid and Robust Multi-Phenotypic Assay System for ALS Using Human iPS Cells with Mutations in Causative Genes. Int. J. Mol. Sci. 2023, 24, 6987. https://doi.org/10.3390/ijms24086987
Kondo T, Ebinuma I, Tanaka H, Nishikawa Y, Komiya T, Ishikawa M, Okano H. Rapid and Robust Multi-Phenotypic Assay System for ALS Using Human iPS Cells with Mutations in Causative Genes. International Journal of Molecular Sciences. 2023; 24(8):6987. https://doi.org/10.3390/ijms24086987
Chicago/Turabian StyleKondo, Tosho, Ihori Ebinuma, Hirotaka Tanaka, Yukitoshi Nishikawa, Takaki Komiya, Mitsuru Ishikawa, and Hideyuki Okano. 2023. "Rapid and Robust Multi-Phenotypic Assay System for ALS Using Human iPS Cells with Mutations in Causative Genes" International Journal of Molecular Sciences 24, no. 8: 6987. https://doi.org/10.3390/ijms24086987