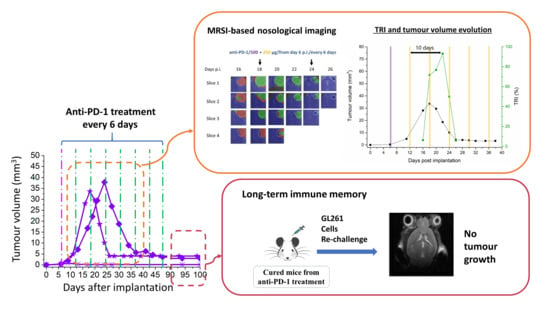
Anti-PD-1 Immunotherapy in Preclinical GL261 Glioblastoma: Influence of Therapeutic Parameters and Non-Invasive Response Biomarker Assessment with MRSI-Based Approaches


Abstract
:
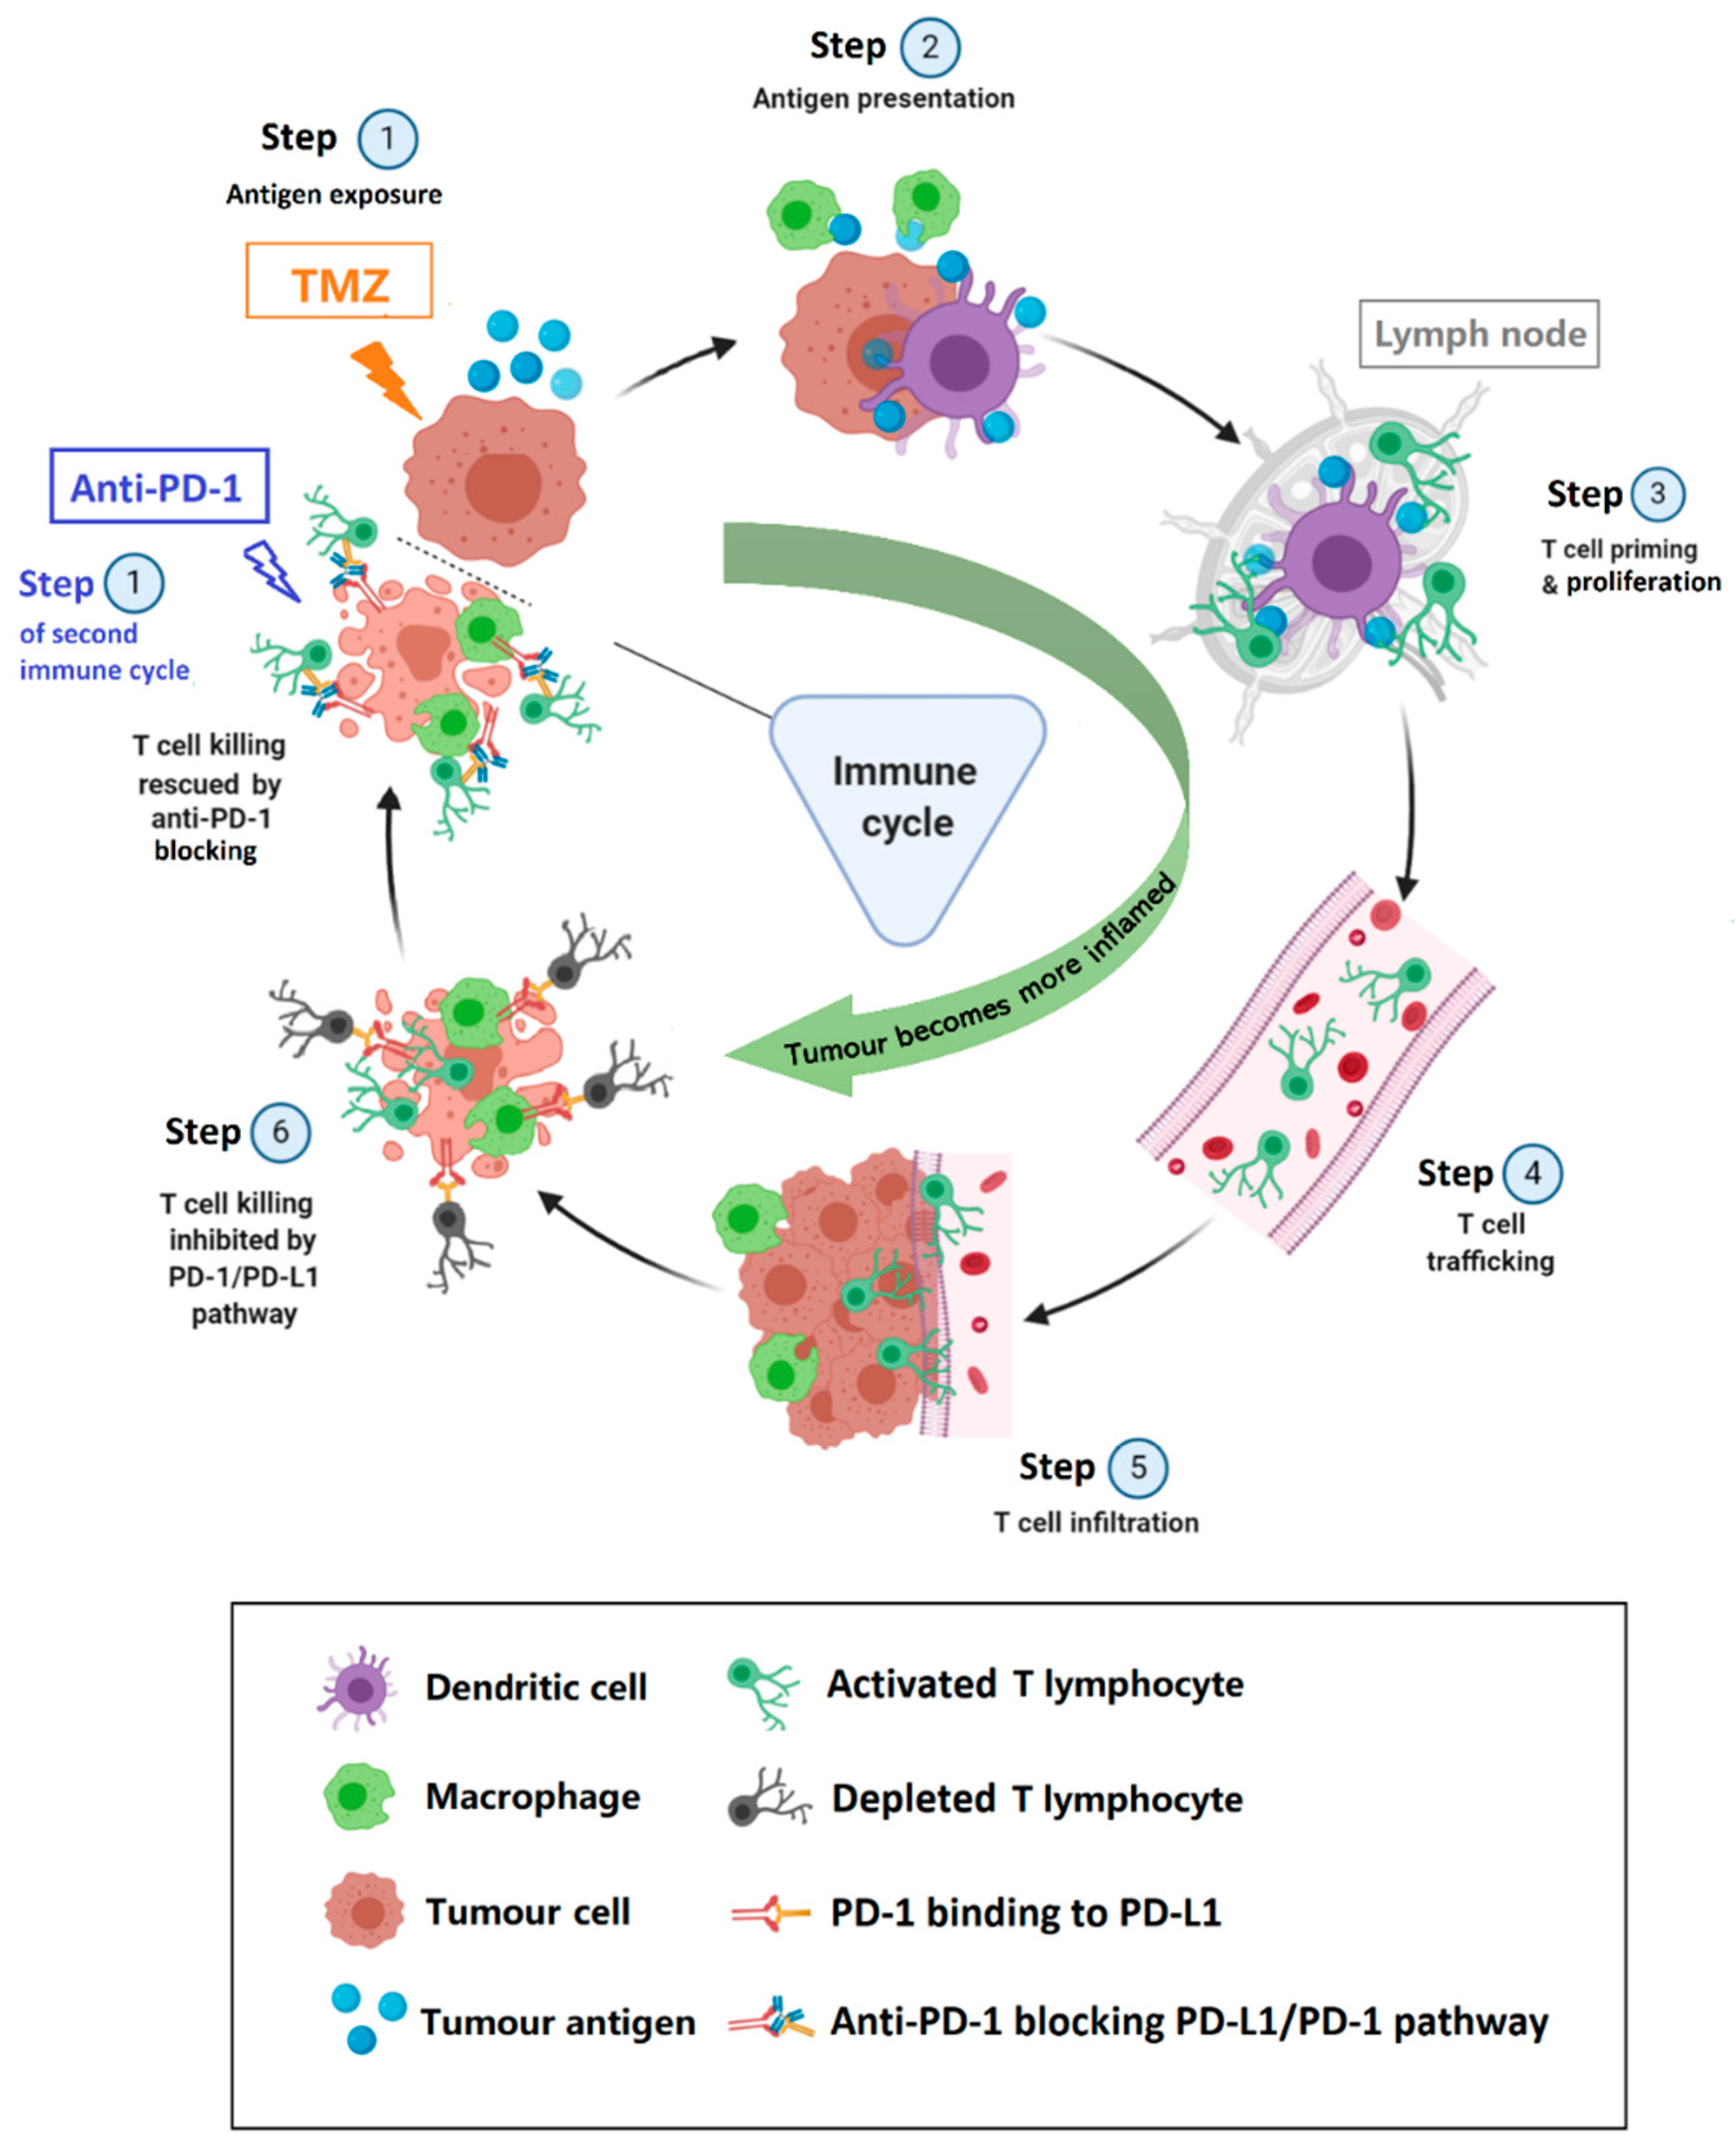
1. Introduction
2. Results
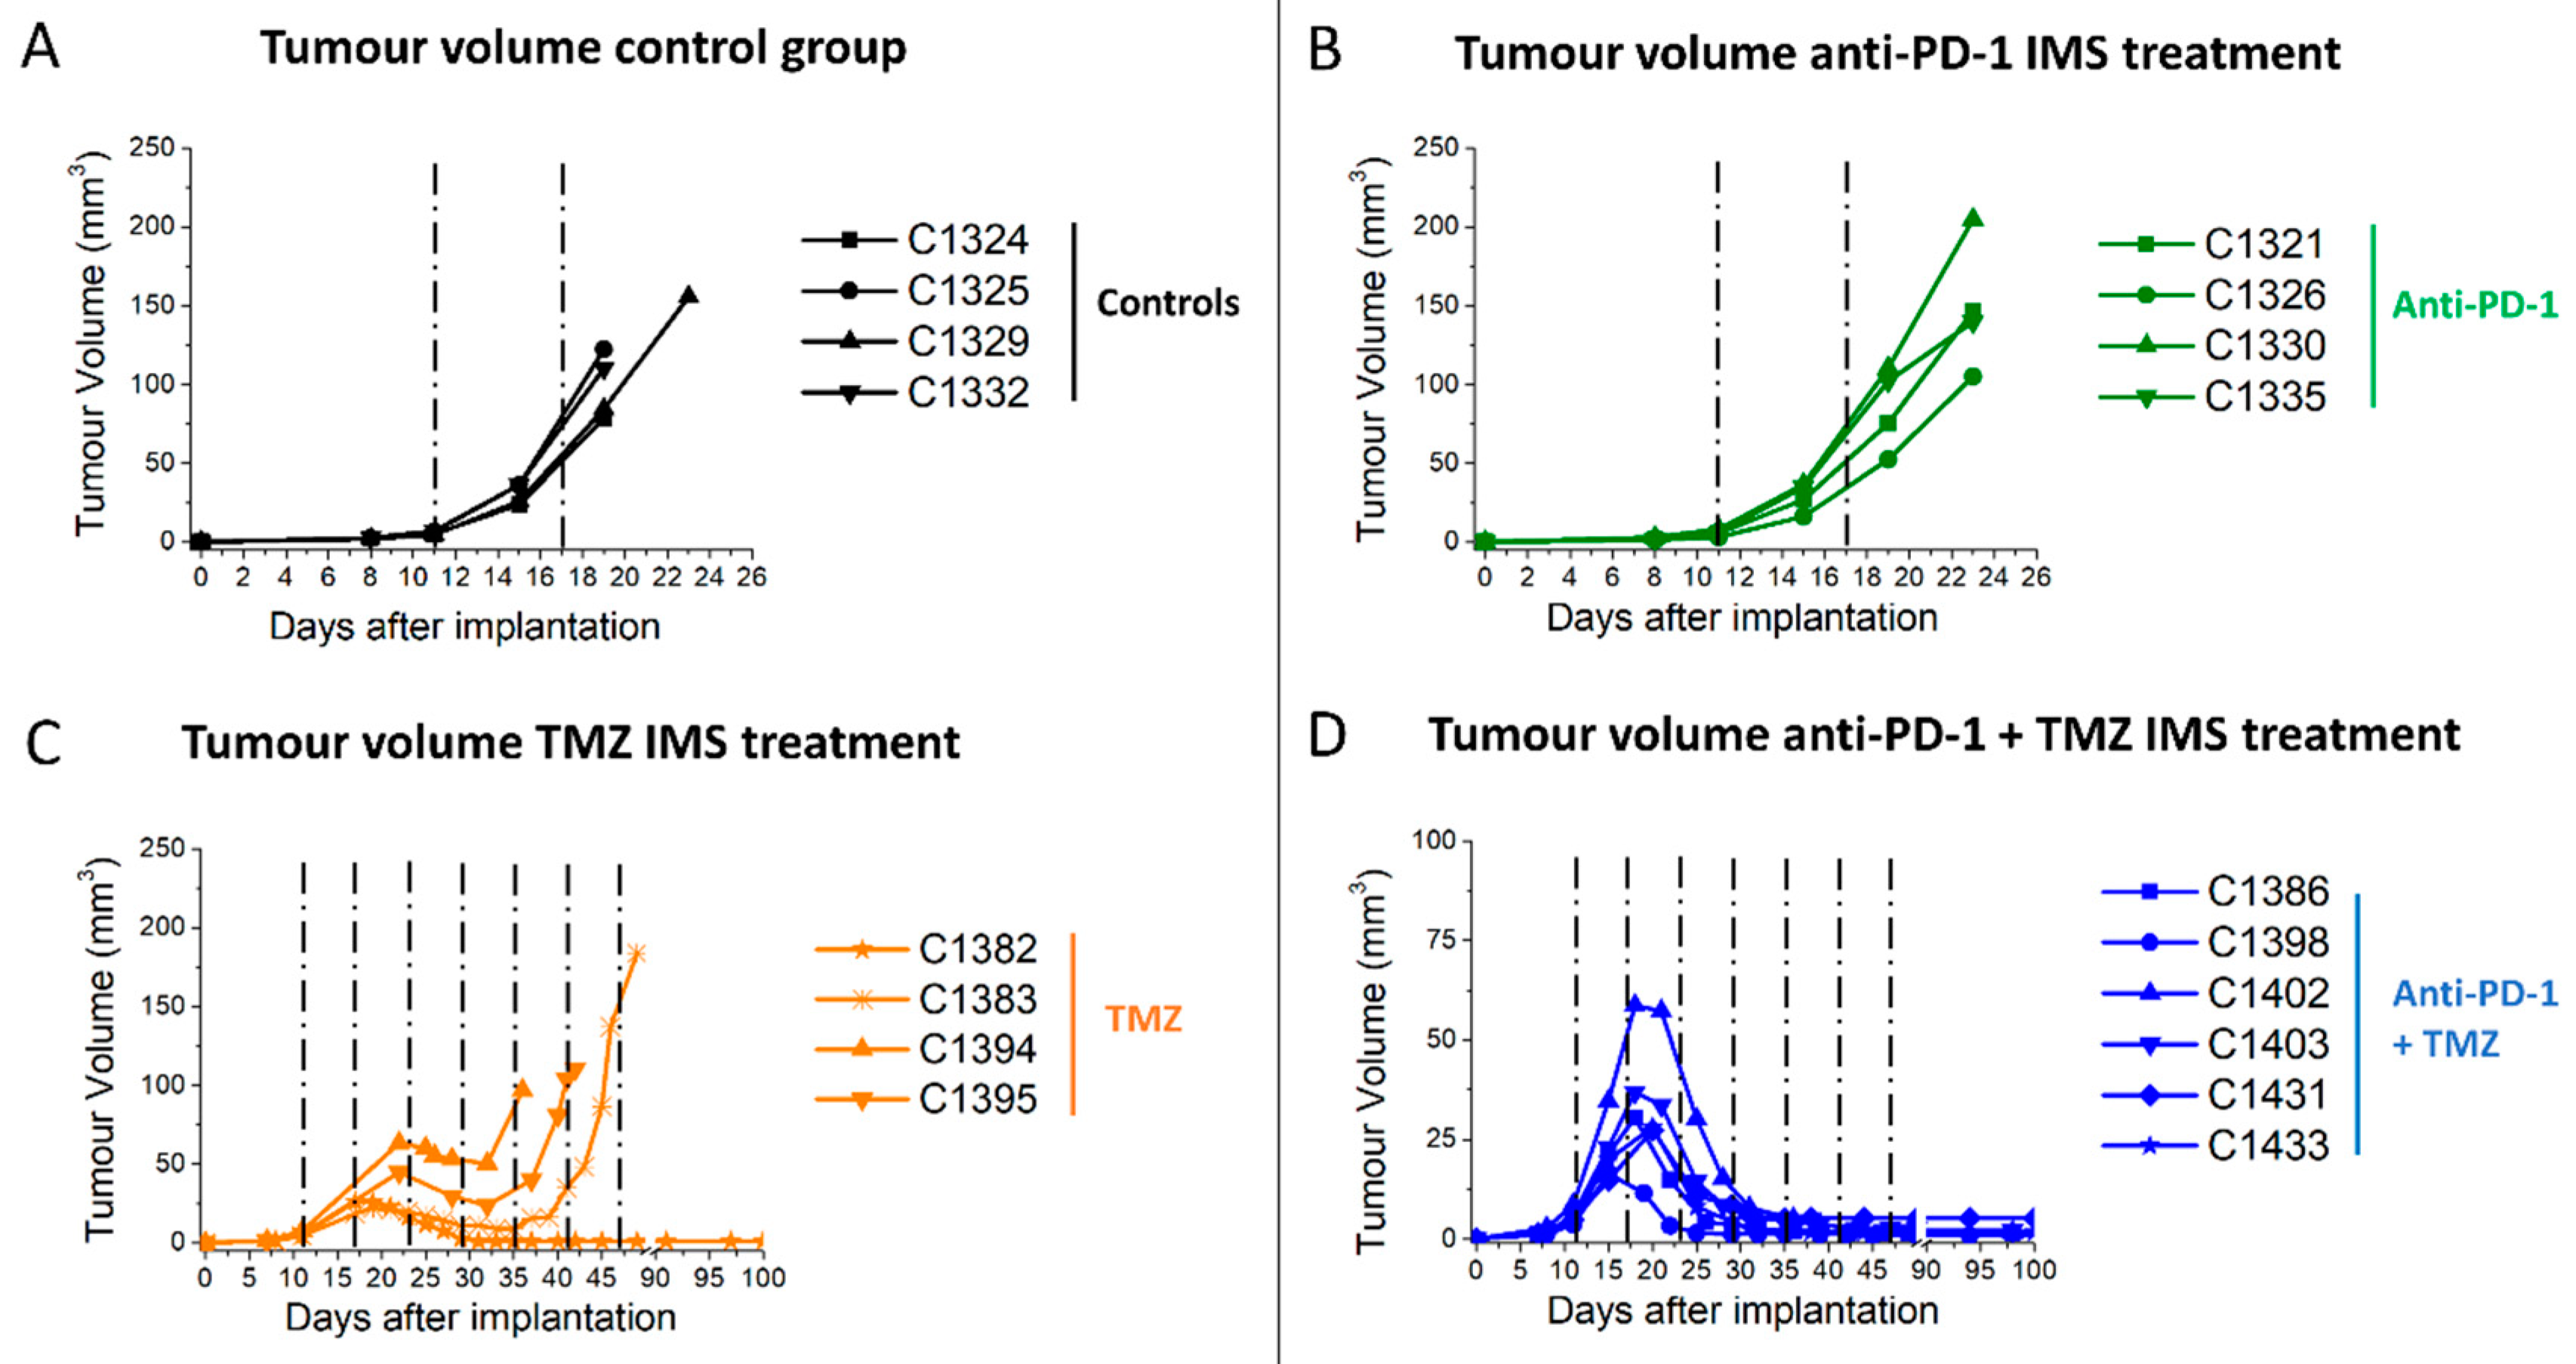
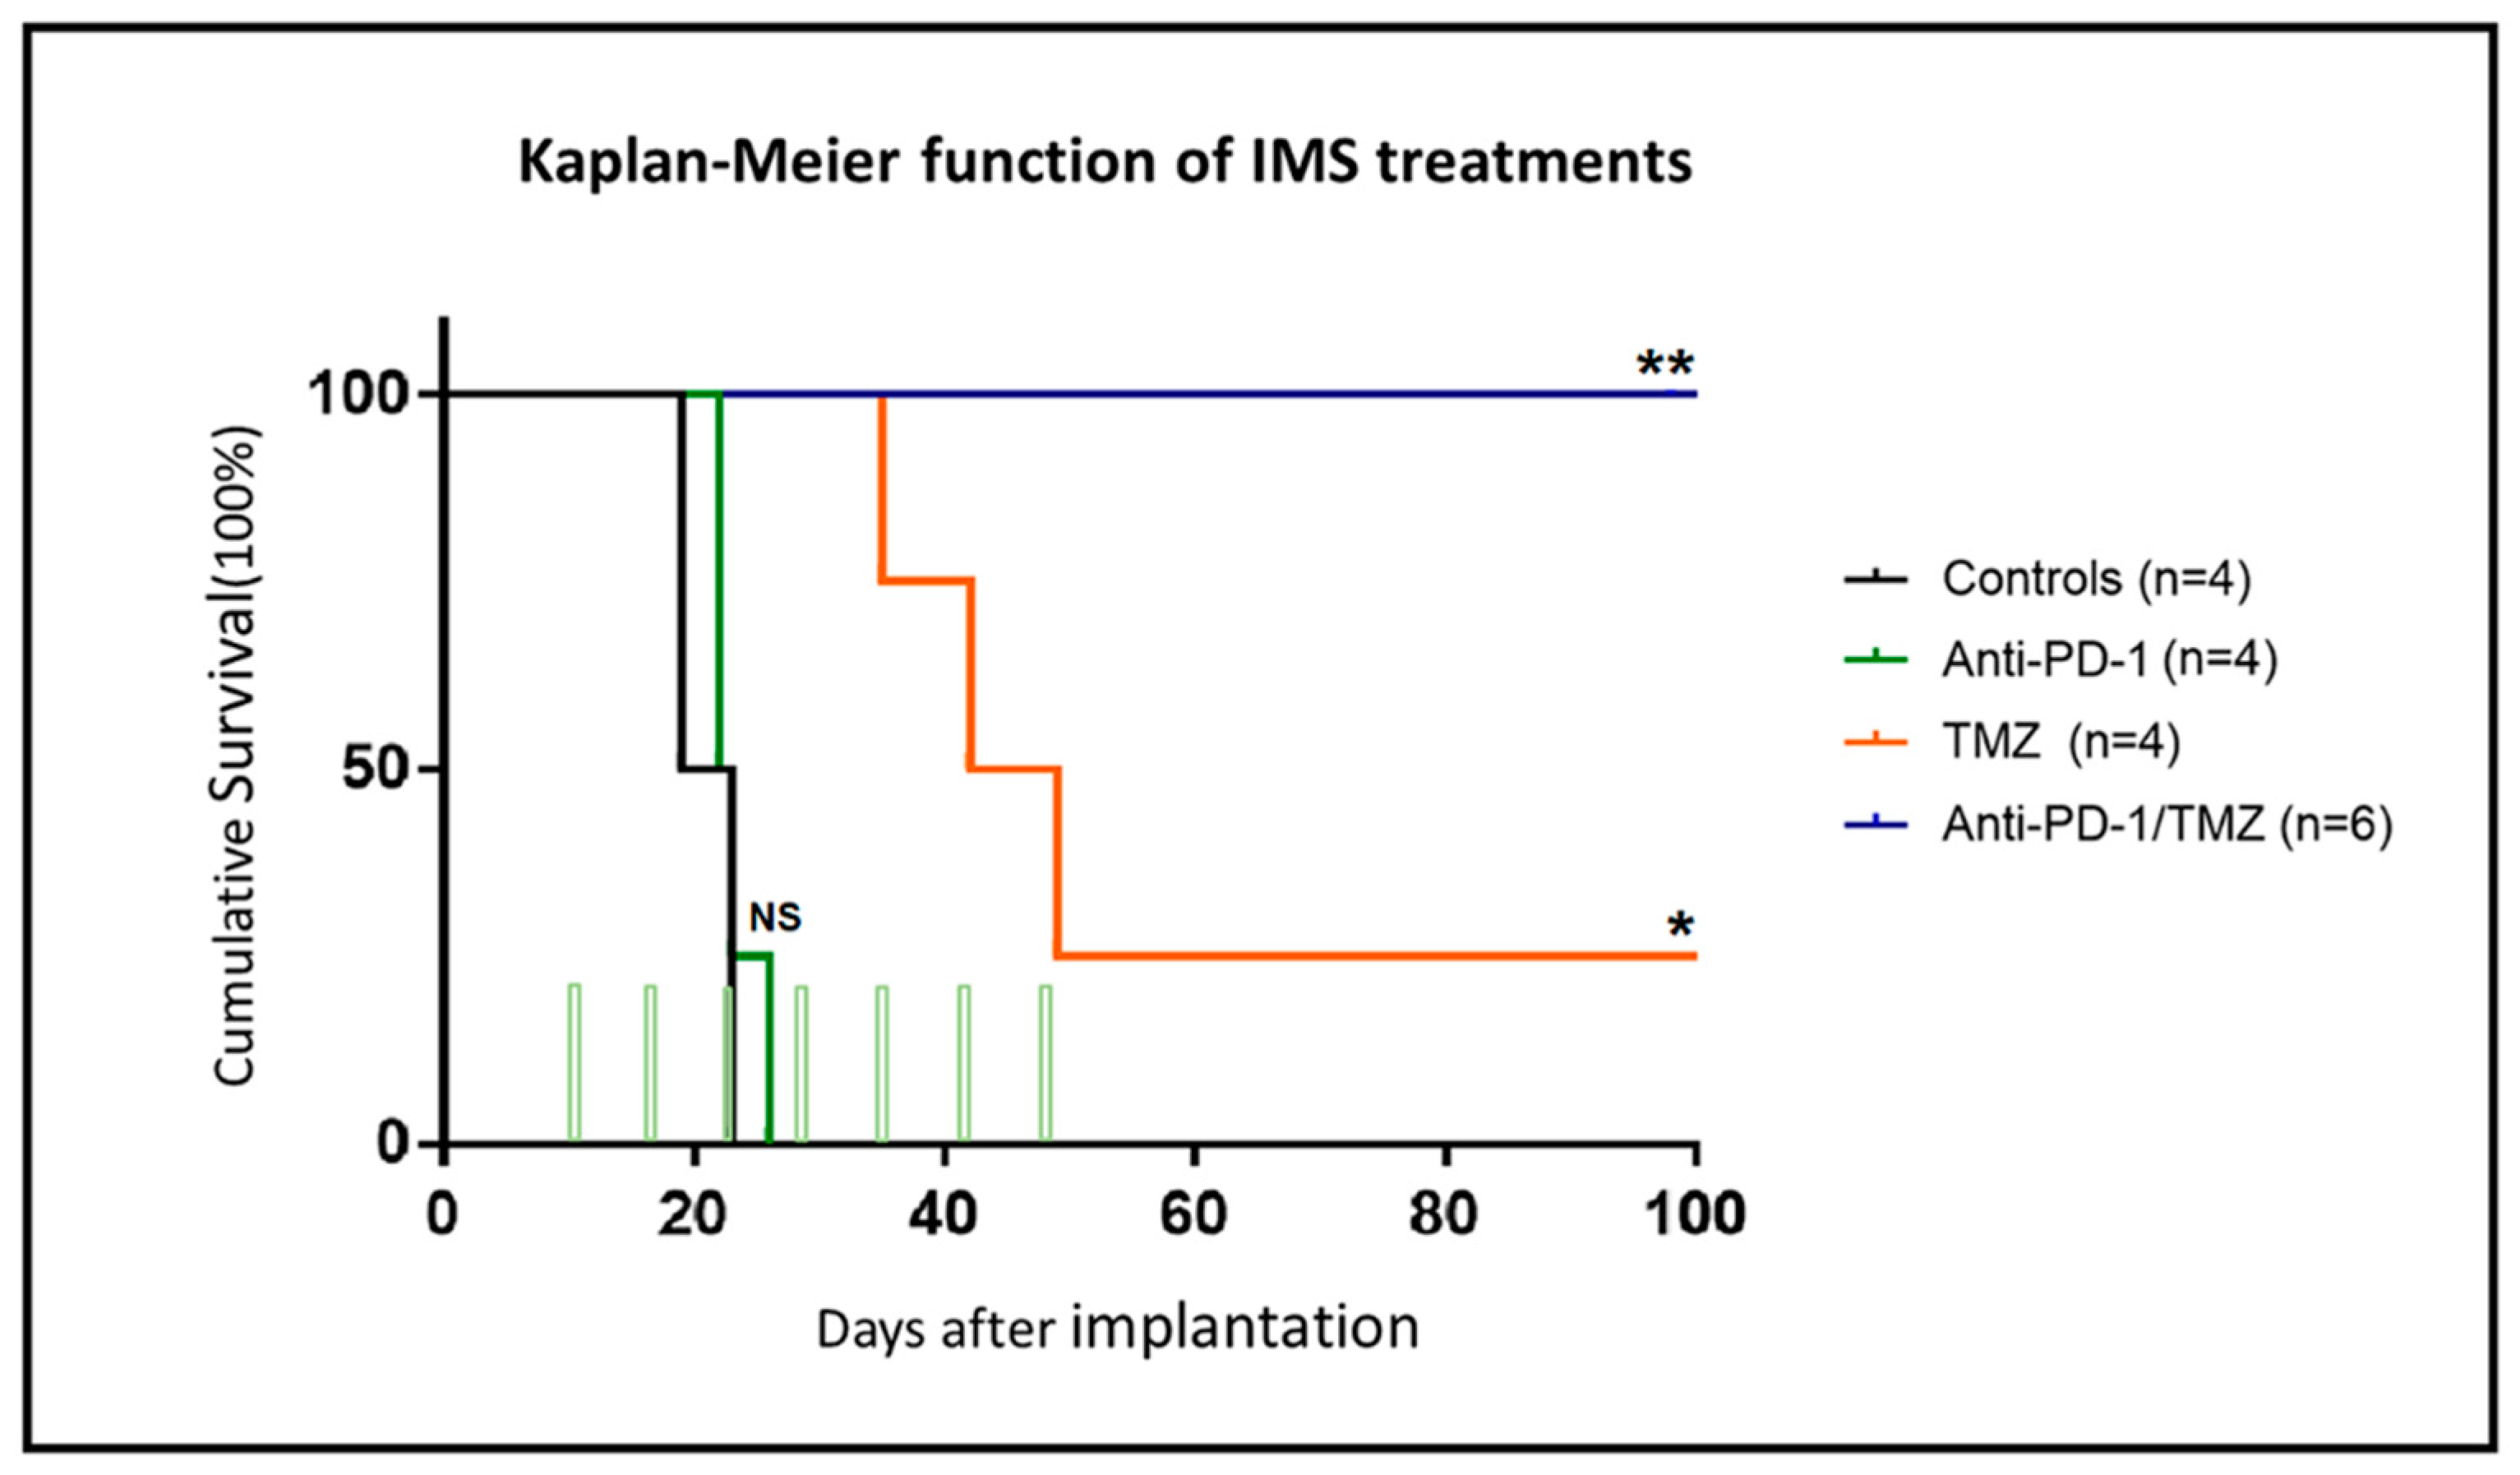
2.1. IMS-TMZ/anti-PD-1 Combined Therapy Is Superior to Monotherapy in Orthotopic GL261 Glioma Bearing Mice
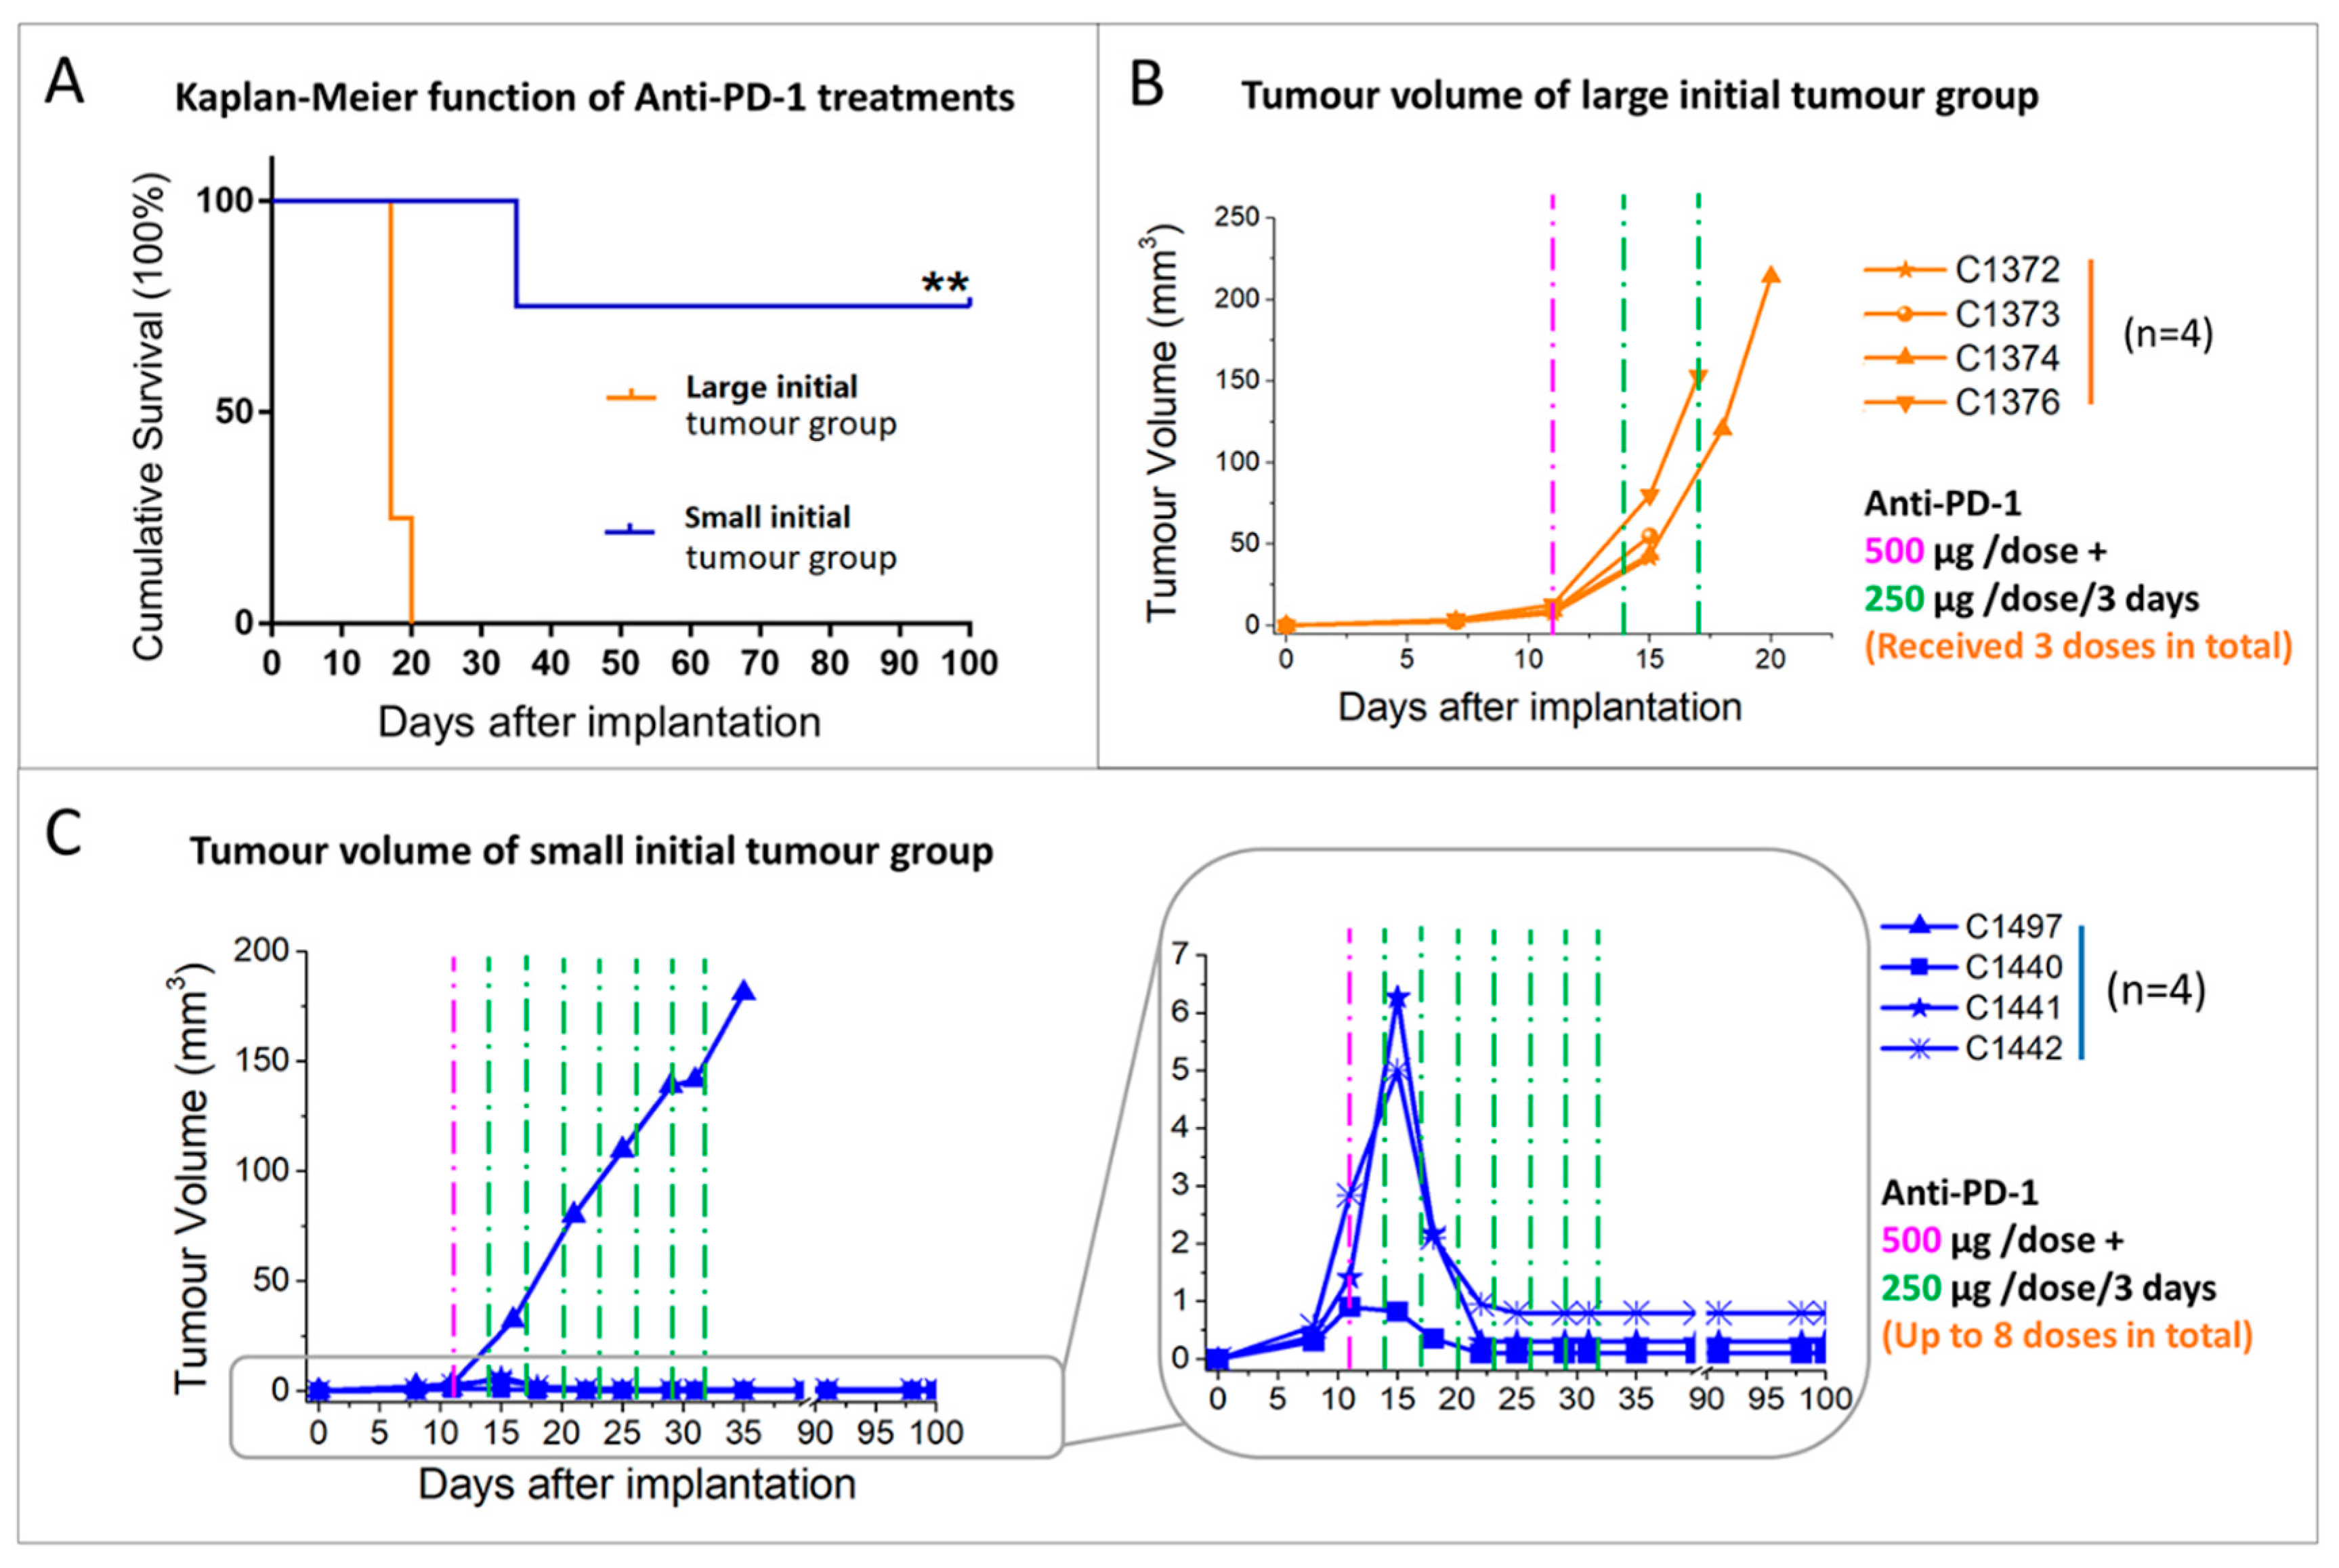
2.2. Initial Tumour Volume and Administration Schedule Are Critical for the Efficacy of Anti-PD-1 Monotherapy
2.2.1. Initial Tumour Volume Effect
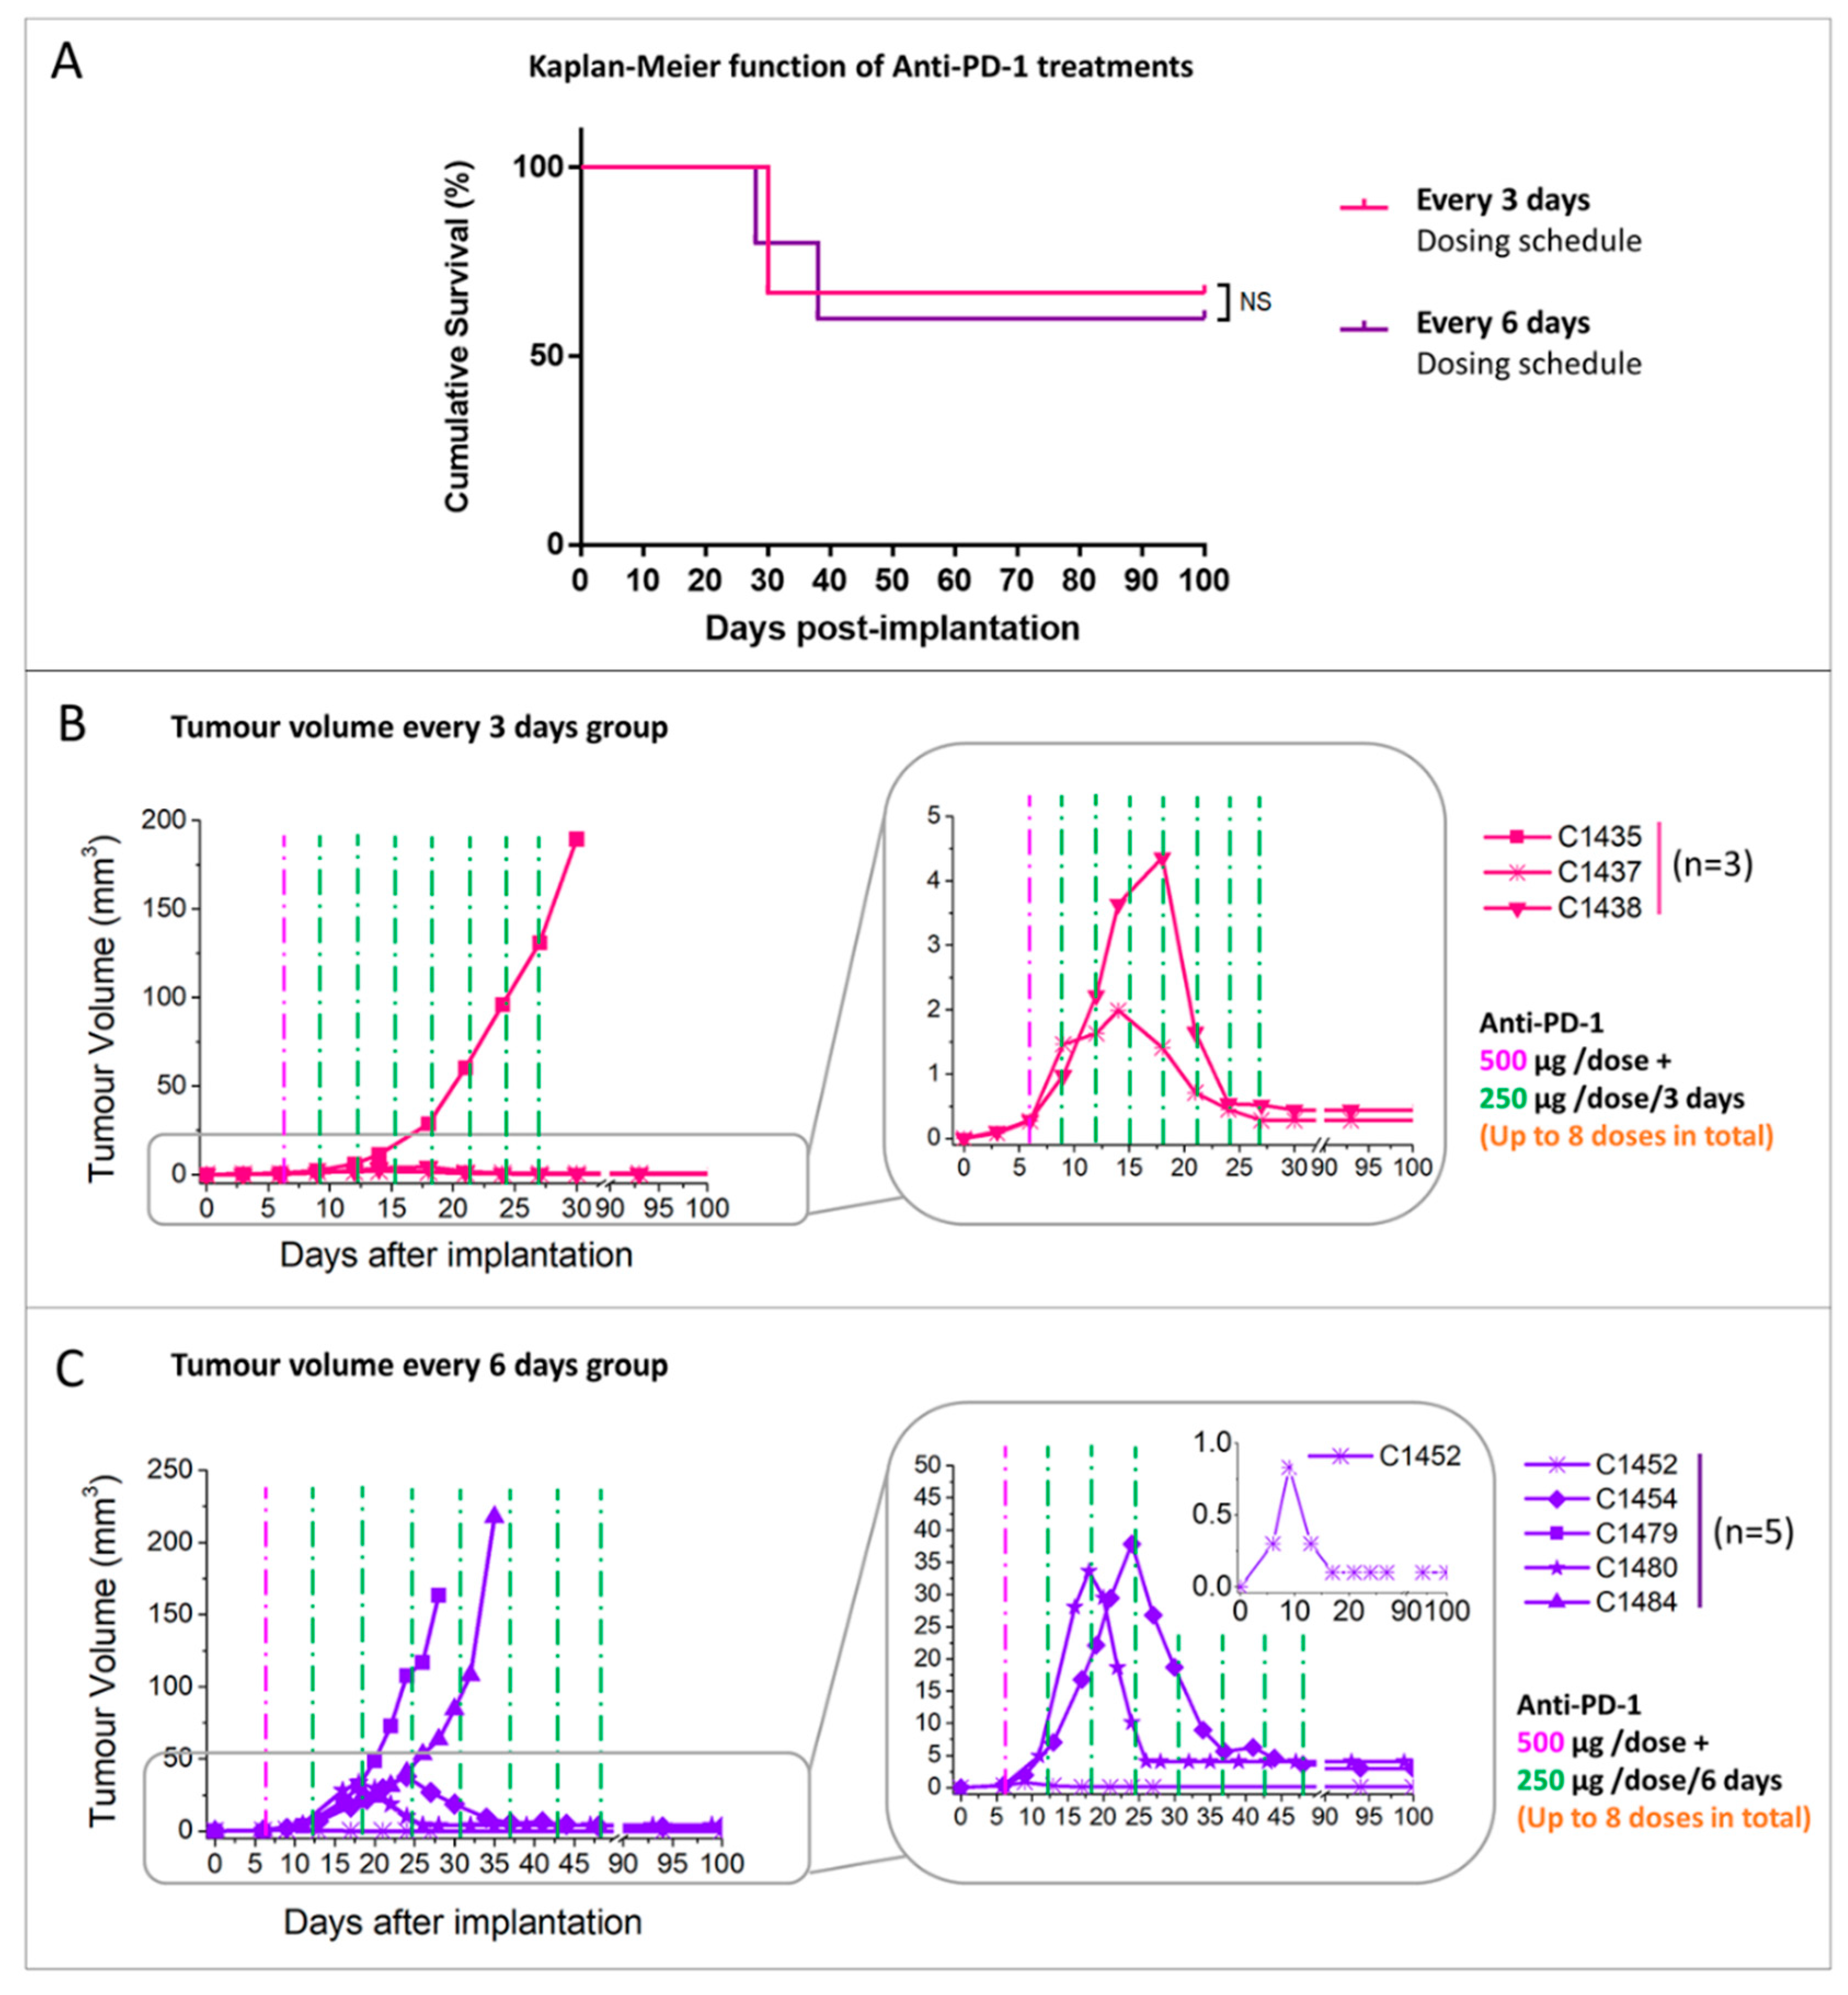
2.2.2. Administration Schedule Effect: Every 3 Days vs. 6 Days
2.3. Multi-Slice MRSI-Based Volumetric Analysis under IMS-Anti-PD-1/TMZ Combined Treatment or IMS-Anti-PD1 Monotherapy: Non-Invasive Biomarker of Therapy Response
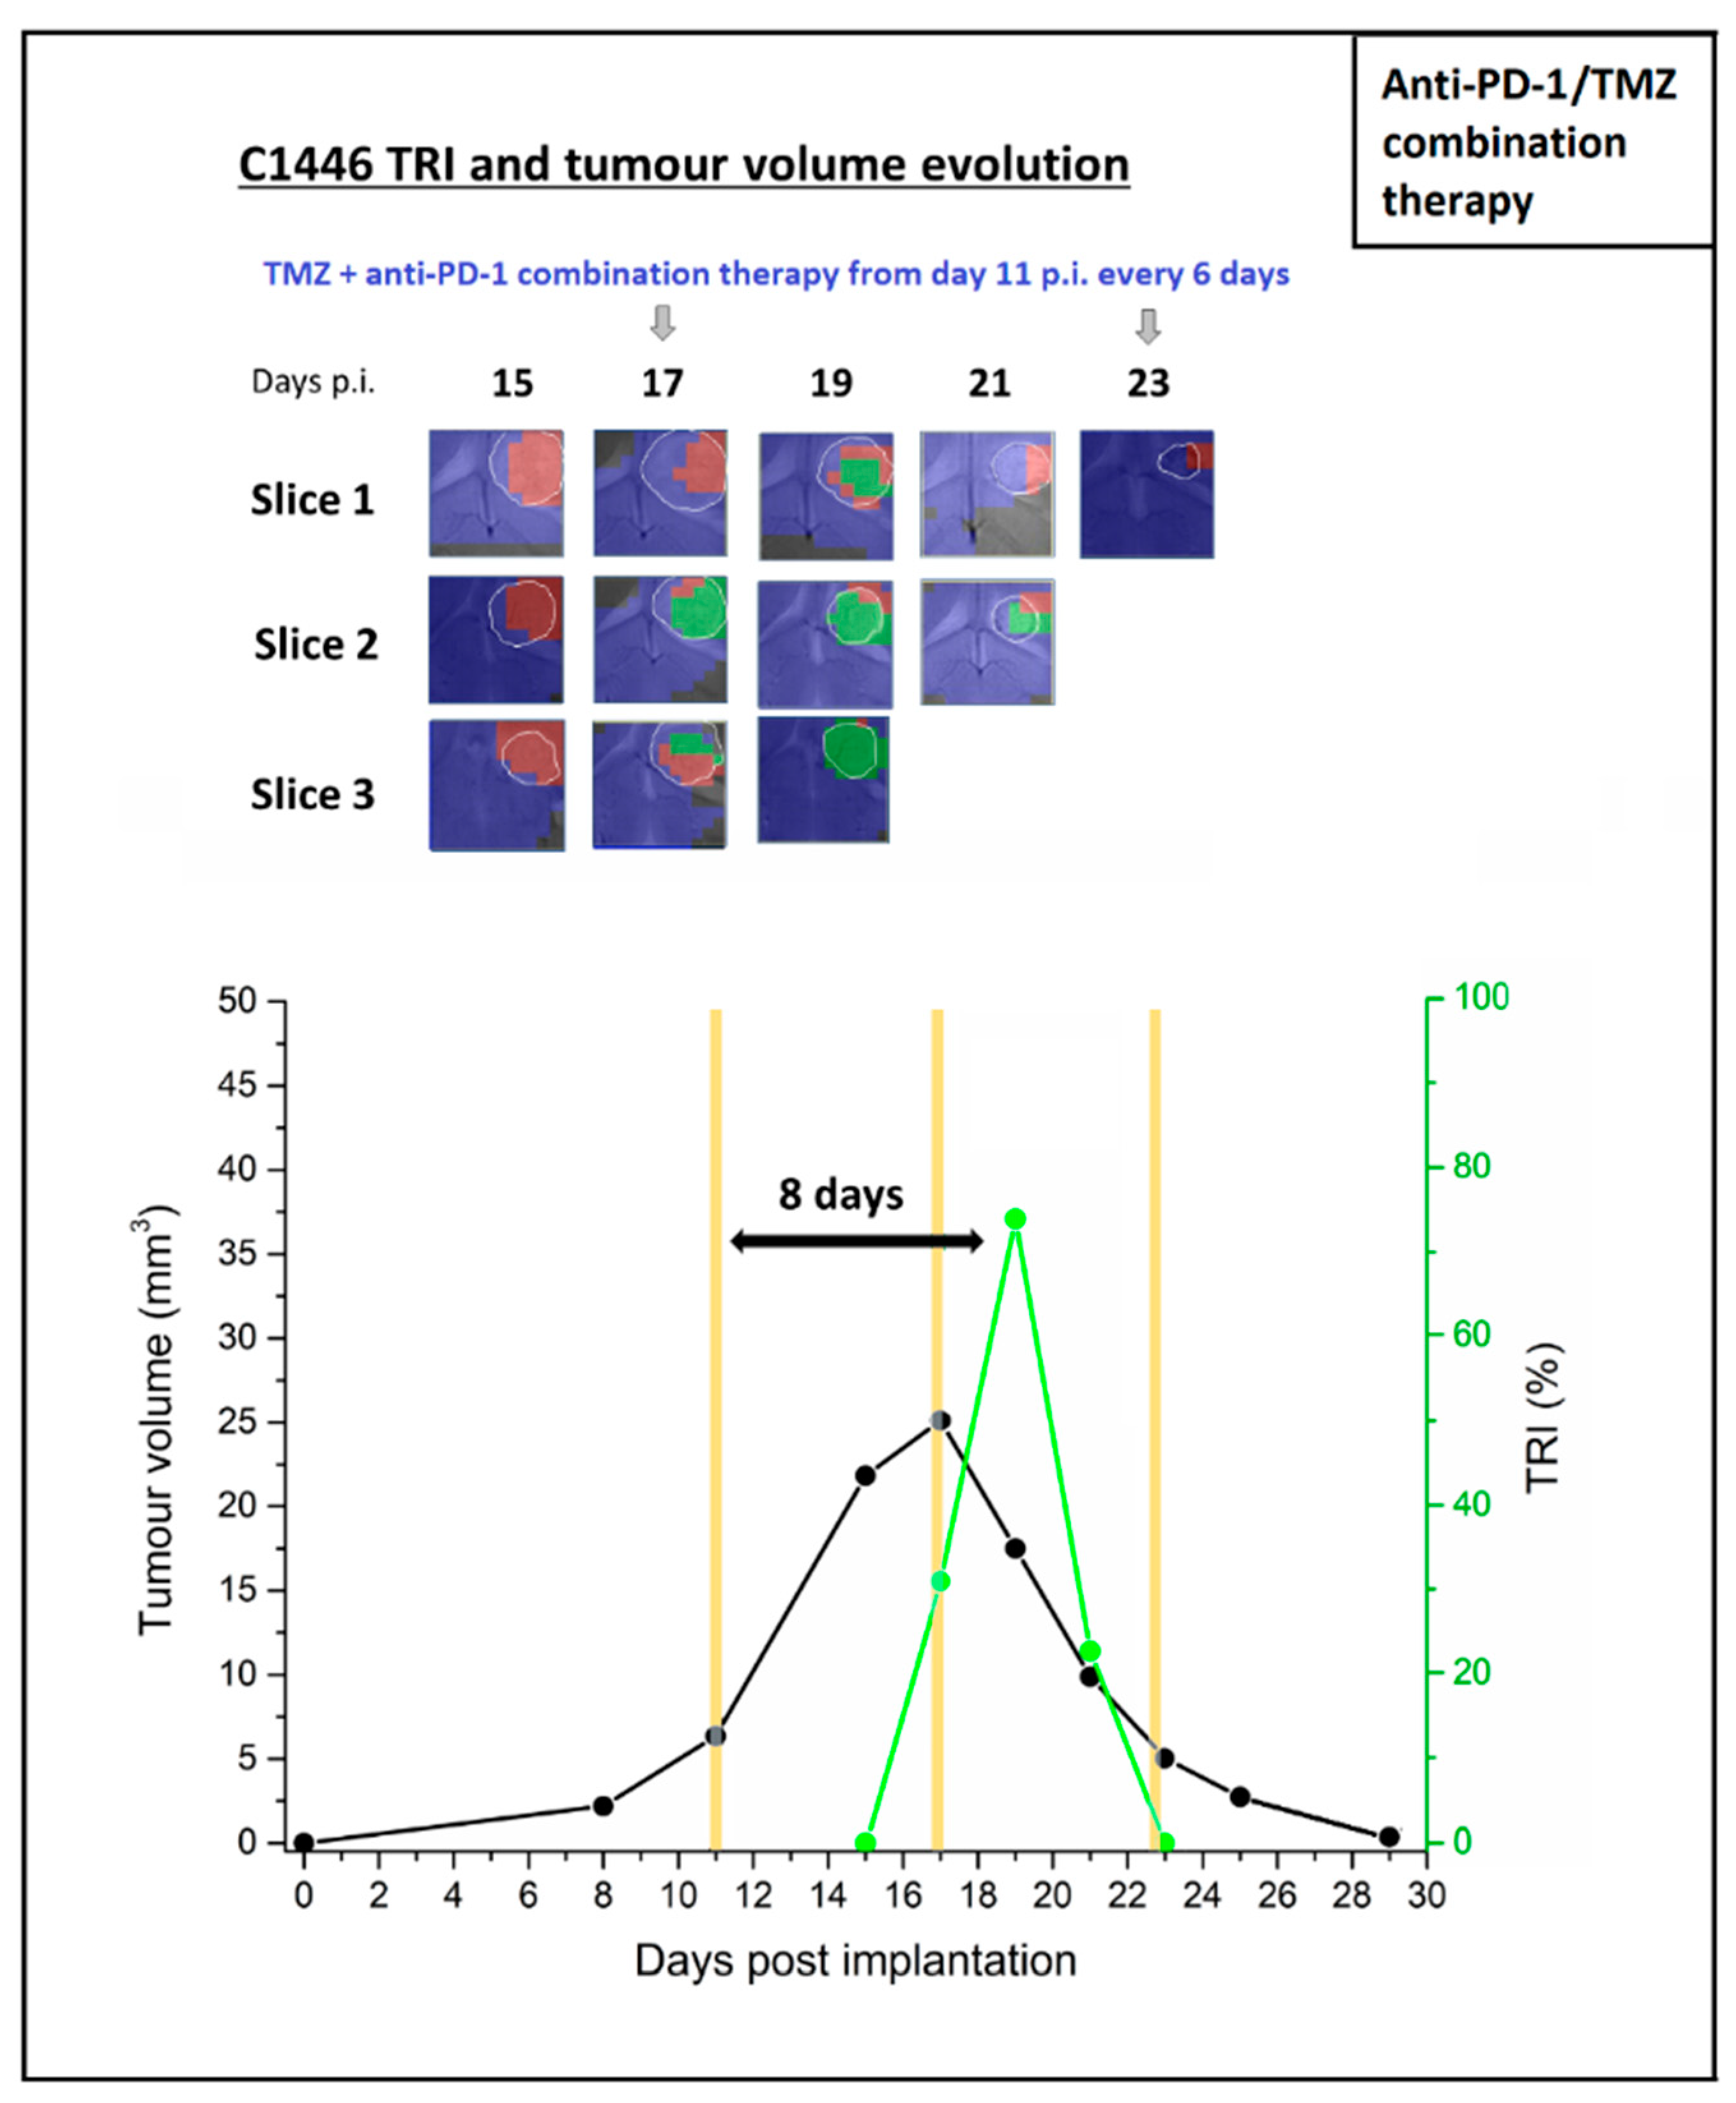
2.3.1. IMS-anti-PD-1/TMZ Treated Mouse
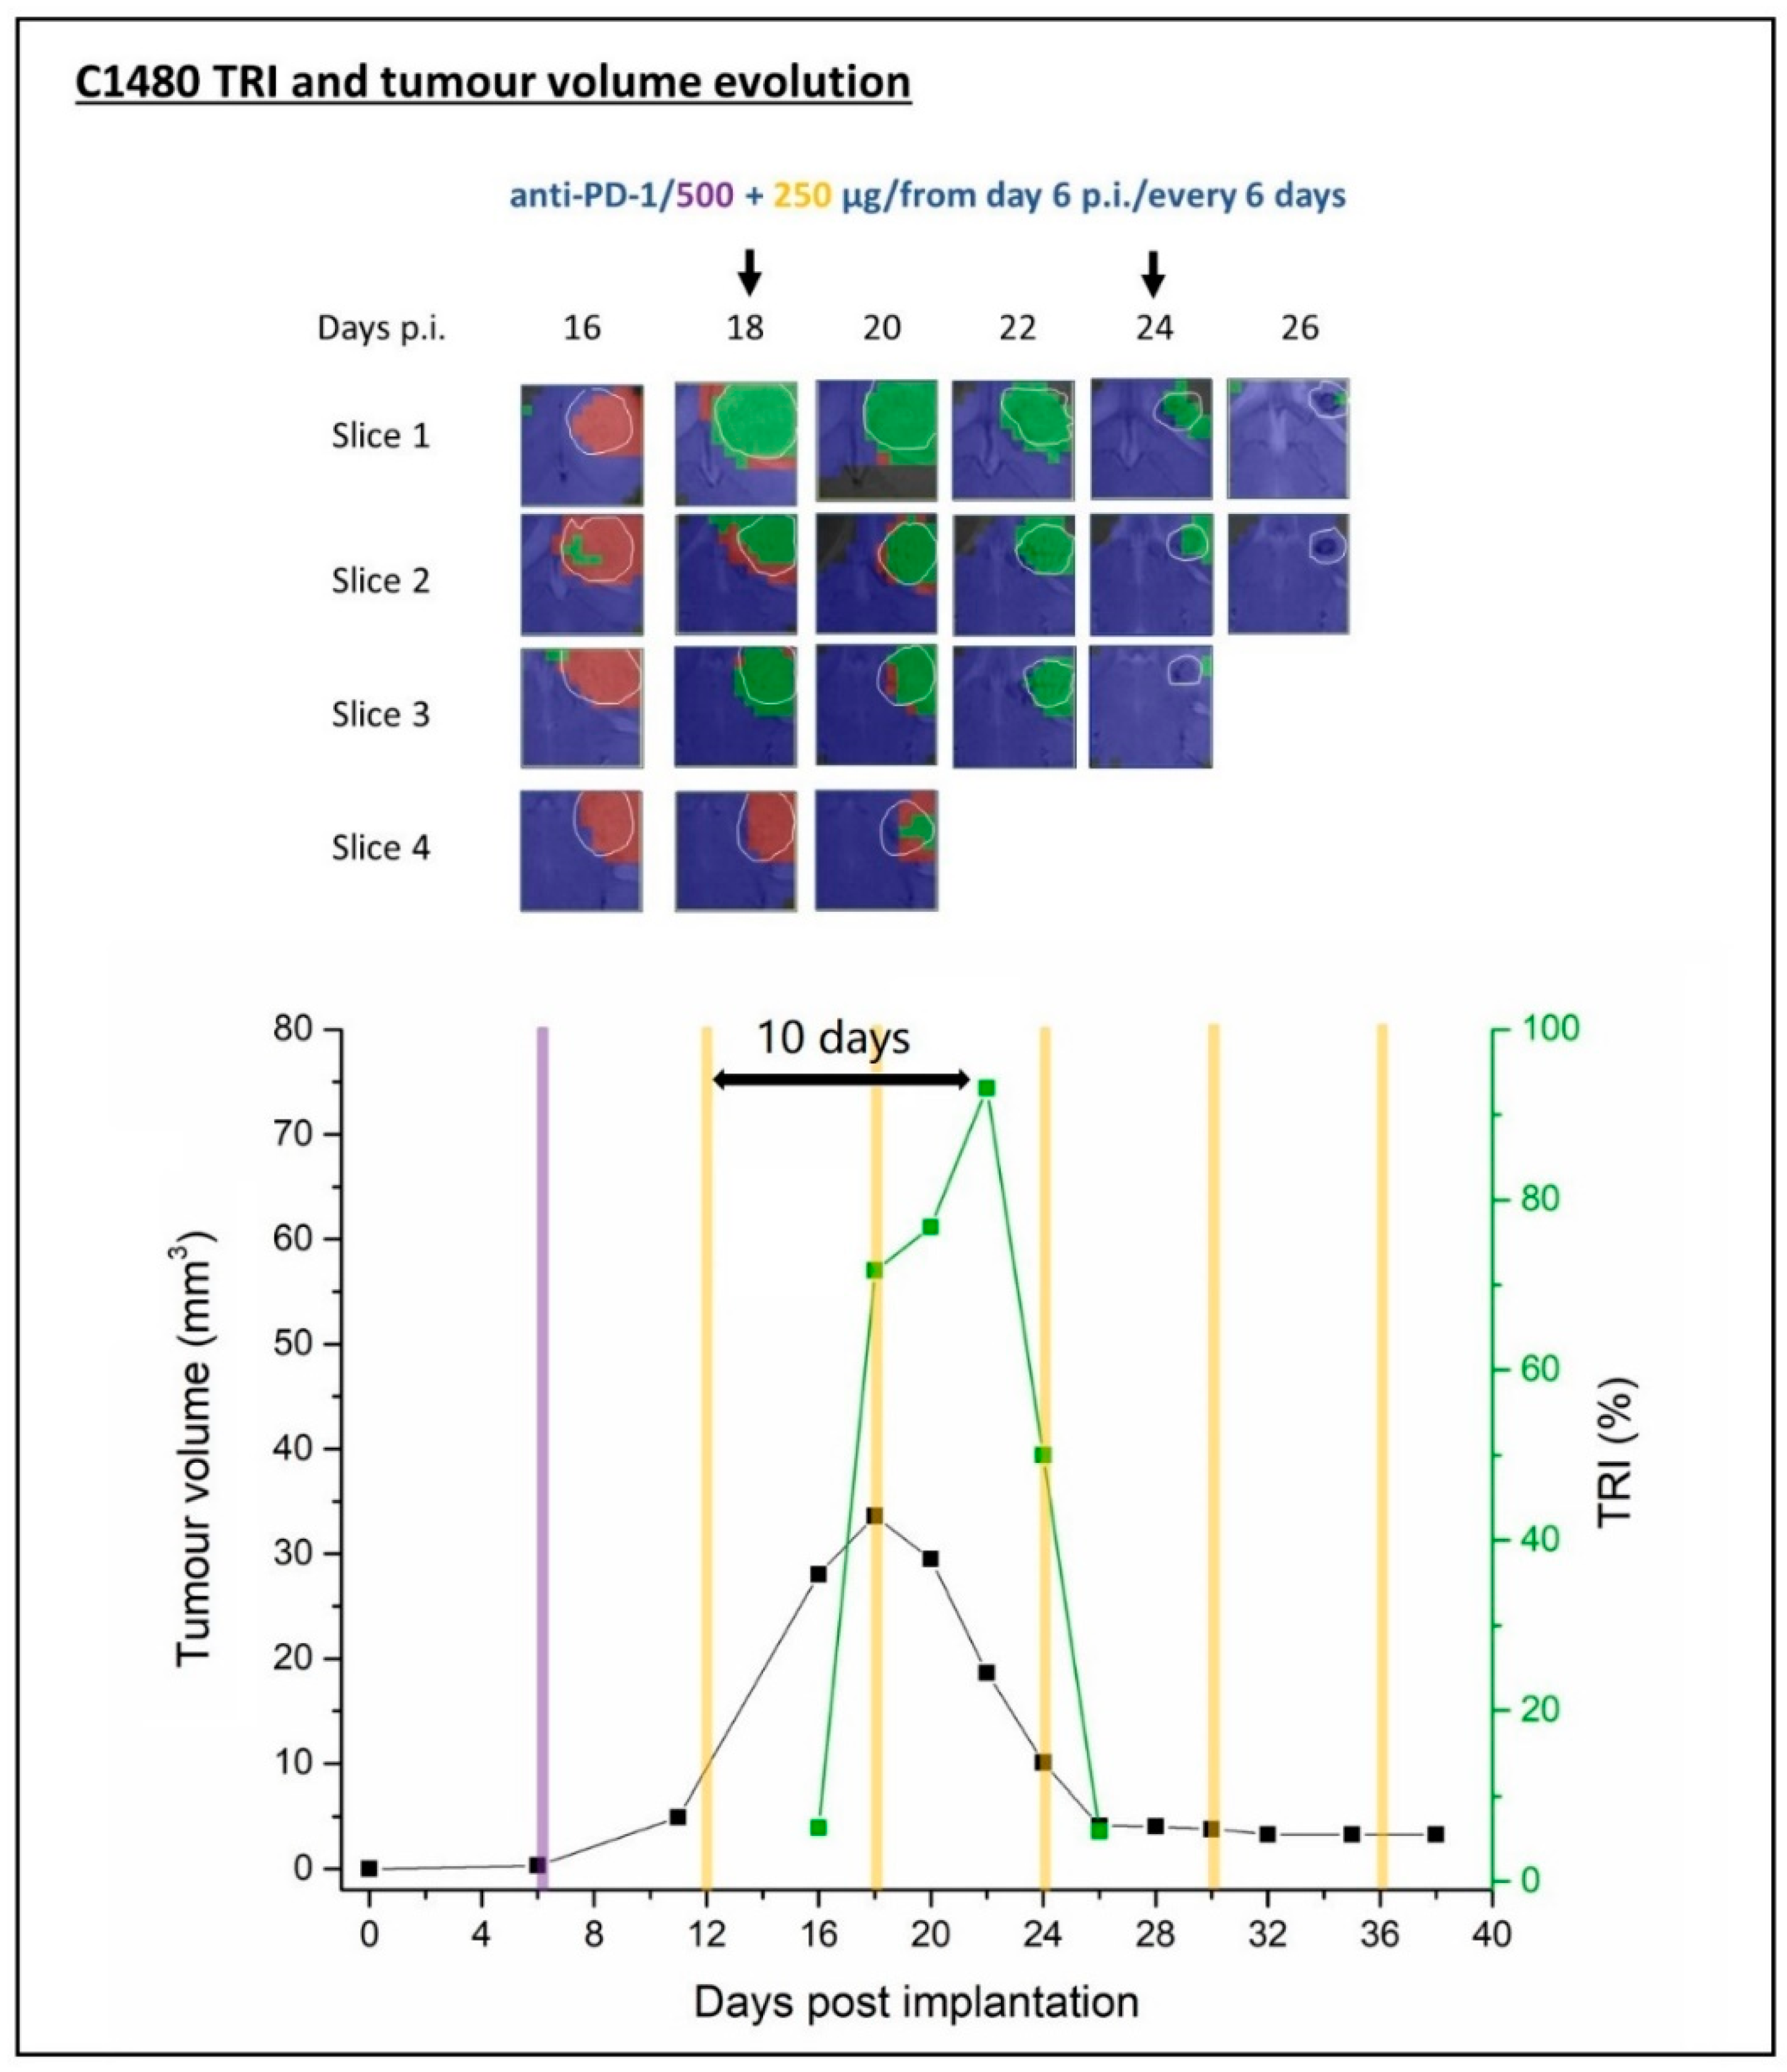
2.3.2. IMS-anti-PD-1 Monotherapy Treated Mice
C1480 Anti-PD-1 Monotherapy
TRI Oscillations Were Generally Coincident with Response
MRSI Spectral Quality
2.4. Anti-PD-1 Monotherapy Shown to Be More Effective in Establishing Anti-Tumour Immune Memory than Combined Therapy
2.4.1. Control Mice
2.4.2. IMS-Anti-PD-1/TMZ Cured Mice
2.4.3. Anti-PD-1 Monotherapy Cured Mice
3. Discussion
3.1. Harnessing the Immune System to Control GB Tumour Progression
3.2. Finding the Optimal Schedule for Non-Invasive Response Assessment: The Relevance of Tumour Volume at Therapy Starting Time and Dosing Schedule in Anti-PD-1 Monotherapy
3.3. The Oscillatory MRSI Metabolomic Pattern Changes Are Also Confirmed in GL261 GB Treated with Immunotherapy
3.4. IMS-Anti-PD-1/TMZ and Anti-PD-1 Monotherapy Established Varying Degrees of Long-Term Specific Anti-Tumour Immunity
3.5. Limitations of Our Study
4. Materials and Methods
4.1. GL261 Cells
4.2. Animal Model
4.3. Animal Treatment
4.4. In Vivo MRI and MRSI Studies
4.4.1. Data Acquisition
4.4.2. MRI Studies
Tumour Volume Calculation
4.4.3. MRSI Studies
4.4.4. MRSI Post-Processing and Pattern Recognition Strategies
4.4.5. Tumour Responding Index (TRI) Calculations
4.5. Rechallenge Experiments
4.6. Statistical Analysis
5. Conclusions
Supplementary Materials
Author Contributions
Funding
Conflicts of Interest
Abbreviations
| 3D | Three dimensional |
| AS | Surface area |
| ASCII | American Standard Code for Information Interchange |
| BTDP | Below threshold detection period |
| CKI | Check point inhibitors |
| CNS | Central nervous system |
| CPA | Cyclophosphamide |
| CRT | Calreticulin |
| DCs | Dendritic cells |
| E3D | Every 3 days dosing schedule |
| GABRMN | Grup d’Aplicacions Biomèdiques de la Ressonància Magnètica Nuclear |
| GB | Glioblastoma |
| IgG | Immunoglobulin G |
| IMS | Immune-Enhancing Metronomic Schedule |
| IT | Inter-slice thickness |
| MDSCs | Myeloid-derived suppressive cells |
| ML | Mobile Lipid |
| MRI | Magnetic resonance imaging |
| MRS | Magnetic Resonance Spectroscopy |
| MRSI | Magnetic resonance spectroscopic imaging |
| NMF | Non-negative matrix factorization |
| NMR | Nuclear Magnetic Resonance |
| OSs | Overall survival |
| PD | Progressive disease |
| PD-1 | Programmed cell death-1 |
| PD-L1 | Programmed cell death ligand-1 |
| PFS | Progression free survival |
| p.i. | Post-implantation |
| PRe | Partial response |
| PUFA | Polyunsaturated fatty acid |
| RARE | Rapid Acquisition with Relaxation Enhancement |
| RECIST | Response Evaluation Criteria in Solid Tumours |
| SDi | Stable disease |
| ST | Slice thickness |
| T2w | T2-weighted MRI |
| TEeff | Effective echo time |
| TMZ | Temozolomide |
| TR | Recycling time |
| TRI | Tumour Responding Index |
| TV | Tumour Volume |
| VOI | Volume of interest |
| wt | Wild type |
References
- Louis, D.N.; Perry, A.; Reifenberger, G.; von Deimling, A.; Figarella-Branger, D.; Cavenee, W.K.; Ohgaki, H.; Wiestler, O.D.; Kleihues, P.; Ellison, D.W. The 2016 World Health Organization Classification of Tumors of the Central Nervous System: A summary. Acta Neuropathol. 2016, 131, 803–820. [Google Scholar] [CrossRef] [PubMed] [Green Version]
- Thakkar, J.P.; Dolecek, T.A.; Horbinski, C.; Ostrom, Q.T.; Lightner, D.D.; Barnholtz-Sloan, J.S.; Villano, J.L. Epidemiologic and Molecular Prognostic Review of Glioblastoma. Cancer Epidemiol. Biomark. Prev. 2014, 23, 1985–1996. [Google Scholar] [CrossRef] [PubMed] [Green Version]
- Tejada, S.; Díez-Valle, R.; Aldave, G.; Marigil, M.; de Gallego, J.; Domínguez, P.D. Factors associated with a higher rate of distant failure after primary treatment for glioblastoma. J. Neurooncol. 2014, 116, 169–175. [Google Scholar] [CrossRef] [PubMed] [Green Version]
- Katsuya, Y.; Horinouchi, H.; Asao, T.; Kitahara, S.; Goto, Y.; Kanda, S.; Fujiwara, Y.; Nokihara, H.; Yamamoto, N.; Watanabe, S.; et al. Expression of programmed death 1 (PD-1) and its ligand (PD-L1) in thymic epithelial tumors: Impact on treatment efficacy and alteration in expression after chemotherapy. Lung Cancer 2016, 99, 4–10. [Google Scholar] [CrossRef] [Green Version]
- Hecht, M.; Büttner-Herold, M.; Erlenbach-Wünsch, K.; Haderlein, M.; Croner, R.; Grützmann, R.; Hartmann, A.; Fietkau, R.; Distel, L.V. PD-L1 is upregulated by radiochemotherapy in rectal adenocarcinoma patients and associated with a favourable prognosis. Eur. J. Cancer 2016, 65, 52–60. [Google Scholar] [CrossRef] [PubMed]
- Zhang, P.; Su, D.M.; Liang, M.; Fu, J. Chemopreventive agents induce programmed death-1-ligand 1 (PD-L1) surface expression in breast cancer cells and promote PD-L1-mediated T cell apoptosis. Mol. Immunol. 2008, 45, 1470–1476. [Google Scholar] [CrossRef]
- Laplagne, C.; Domagala, M.; Le Naour, A.; Quemerais, C.; Hamel, D.; Fournié, J.J.; Couderc, B.; Bousquet, C.; Ferrand, A.; Poupot, M. Latest Advances in Targeting the Tumor Microenvironment for Tumor Suppression. Int. J. Mol. Sci. 2019, 20, 4719. [Google Scholar] [CrossRef] [Green Version]
- Sharma, P.; Hu-Lieskovan, S.; Wargo, J.A.; Ribas, A. Primary, Adaptive, and Acquired Resistance to Cancer Immunotherapy. Cell 2017, 168, 707–723. [Google Scholar] [CrossRef] [Green Version]
- Ohaegbulam, K.C.; Assal, A.; Lazar-Molnar, E.; Yao, Y.; Zang, X. Human cancer immunotherapy with antibodies to the PD-1 and PD-L1 pathway. Trends Mol. Med. 2015, 21, 24–33. [Google Scholar] [CrossRef] [Green Version]
- Rizvi, N.A.; Mazières, J.; Planchard, D.; Stinchcombe, T.E.; Dy, G.K.; Antonia, S.J.; Horn, L.; Lena, H.; Minenza, E.; Mennecier, B.; et al. Activity and safety of nivolumab, an anti-PD-1 immune checkpoint inhibitor, for patients with advanced, refractory squamous non-small-cell lung cancer (CheckMate 063): A phase 2, single-arm trial. Lancet Oncol. 2015, 16, 257–265. [Google Scholar] [CrossRef] [Green Version]
- Cella, D.; Grünwald, V.; Nathan, P.; Doan, J.; Dastani, H.; Taylor, F.; Bennett, B.; DeRosa, M.; Berry, S.; Broglio, K.; et al. Quality of life in patients with advanced renal cell carcinoma given nivolumab versus everolimus in CheckMate 025: A randomised, open-label, phase 3 trial. Lancet Oncol. 2016, 17, 994–1003. [Google Scholar] [CrossRef] [Green Version]
- Ansell, S.M.; Lesokhin, A.M.; Borrello, I.; Halwani, A.; Scott, E.C.; Gutierrez, M.; Schuster, S.J.; Millenson, M.M.; Cattry, D.; Freeman, G.J.; et al. PD-1 Blockade with Nivolumab in Relapsed or Refractory Hodgkin’s Lymphoma. N. Engl. J. Med. 2015, 372, 311–319. [Google Scholar] [CrossRef] [PubMed] [Green Version]
- Schalper, K.A.; Rodriguez-Ruiz, M.E.; Diez-Valle, R.; López-Janeiro, A.; Porciuncula, A.; Idoate, M.A.; Inogés, S.; de Andrea, C.; López-Diaz de Cerio, A.; Tejada, S.; et al. Neoadjuvant nivolumab modifies the tumor immune microenvironment in resectable glioblastoma. Nat. Med. 2019, 25, 470–476. [Google Scholar] [CrossRef] [PubMed]
- Cloughesy, T.F.; Mochizuki, A.Y.; Orpilla, J.R.; Hugo, W.; Lee, A.H.; Davidson, T.B.; Wang, A.C.; Ellingson, B.M.; Rytlewski, J.A.; Sanders, C.M.; et al. Neoadjuvant anti-PD-1 immunotherapy promotes a survival benefit with intratumoral and systemic immune responses in recurrent glioblastoma. Nat. Med. 2019, 25, 477–486. [Google Scholar] [CrossRef] [PubMed]
- Bristol Myers Squibb. Bristol-Myers Squibb Provides Update on Phase 3 Opdivo (nivolumab) CheckMate -548 Trial in Patients with Newly Diagnosed MGMT-Methylated Glioblastoma Multiforme. Available online: https://news.bms.com/news/corporate-financial/2019/Bristol-Myers-Squibb-Provides-Update-on-Phase-3-Opdivo-nivolumab-CheckMate--548-Trial-in-Patients-with-Newly-Diagnosed-MGMT-Methylated-Glioblastoma-Multiforme/default.aspx (accessed on 15 November 2020).
- Reardon, D.A.; Gokhale, P.C.; Klein, S.R.; Ligon, K.L.; Rodig, S.J.; Ramkissoon, S.H.; Jones, K.L.; Conway, A.S.; Liao, X.; Zhou, J.; et al. Glioblastoma Eradication Following Immune Checkpoint Blockade in an Orthotopic, Immunocompetent Model. Cancer Immunol. Res. 2016, 4, 124–135. [Google Scholar] [CrossRef] [Green Version]
- Zeng, J.; See, A.P.; Phallen, J.; Jackson, C.M.; Belcaid, Z.; Ruzevick, J.; Durham, N.; Meyer, C.; Harris, T.J.; Albesiano, E.; et al. Anti-PD-1 blockade and stereotactic radiation produce long-term survival in mice with intracranial gliomas. Int. J. Radiat. Oncol. Biol. Phys. 2013, 86, 343–349. [Google Scholar] [CrossRef] [Green Version]
- Garg, A.D.; Vandenberk, L.; Van Woensel, M.; Belmans, J.; Schaaf, M.; Boon, L.; De Vleeschouwer, S.; Agostinis, P. Preclinical efficacy of immune-checkpoint monotherapy does not recapitulate corresponding biomarkers-based clinical predictions in glioblastoma. Oncoimmunology 2017, 6, e1295903. [Google Scholar] [CrossRef] [Green Version]
- Mathios, D.; Kim, J.E.; Mangraviti, A.; Phallen, J.; Park, C.K.; Jackson, C.M.; Garzon-Muvdi, T.; Kim, E.; Theodros, D.; Polanczyk, M.; et al. Anti-PD-1 antitumor immunity is enhanced by local and abrogated by systemic chemotherapy in GBM. Sci. Transl. Med. 2016, 8, 370ra180. [Google Scholar] [CrossRef] [Green Version]
- Wu, S.; Calero-Pérez, P.; Villamañan, L.; Arias-Ramos, N.; Pumarola, M.; Ortega-Martorell, S.; Julià-Sapé, M.; Arús, C.; Candiota, A.P. Anti-tumour immune response in GL261 glioblastoma generated by Temozolomide Immune-Enhancing Metronomic Schedule monitored with MRSI-based nosological images. NMR Biomed. 2020, 33, e4229. [Google Scholar] [CrossRef]
- Dhermain, F.G.; Hau, P.; Lanfermann, H.; Jacobs, A.H.; van den Bent, M.J. Advanced MRI and PET imaging for assessment of treatment response in patients with gliomas. Lancet Neurol. 2010, 9, 906–920. [Google Scholar] [CrossRef]
- Hattingen, E.; Jurcoane, A.; Bähr, O.; Rieger, J.; Magerkurth, J.; Anti, S.; Steinbach, J.P.; Pilatus, U. Bevacizumab impairs oxidative energy metabolism and shows antitumoral effects in recurrent glioblastomas: A 31P/ 1H MRSI and quantitative magnetic resonance imaging study. Neuro Oncol. 2011, 13, 1349–1363. [Google Scholar] [CrossRef] [PubMed] [Green Version]
- Nelson, S.J. Assessment of therapeutic response and treatment planning for brain tumors using metabolic and physiological MRI. NMR Biomed. 2011, 24, 734–749. [Google Scholar] [CrossRef] [Green Version]
- Julià-Sapé, M.; Candiota, A.P.; Arús, C. Cancer metabolism in a snapshot: MRS(I). NMR Biomed. 2019, 32, e4054. [Google Scholar] [CrossRef] [PubMed]
- Delgado-Goñi, T.; Ortega-Martorell, S.; Ciezka, M.; Olier, I.; Candiota, A.P.; Julià-Sapé, M.; Fernández, F.; Pumarola, M.; Lisboa, P.J.; Arús, C. MRSI-based molecular imaging of therapy response to temozolomide in preclinical glioblastoma using source analysis. NMR Biomed. 2016, 29, 732–743. [Google Scholar] [CrossRef] [PubMed] [Green Version]
- Arias-Ramos, N.; Ferrer-Font, L.; Lope-Piedrafita, S.; Mocioiu, V.; Julià-Sapé, M.; Pumarola, M.; Arús, C.; Candiota, A.P. Metabolomics of therapy response in preclinical glioblastoma: A multi-slice MRSI-based volumetric analysis for noninvasive assessment of temozolomide treatment. Metabolites 2017, 7, 1–29. [Google Scholar] [CrossRef] [PubMed] [Green Version]
- Ciezka, M.; Acosta, M.; Herranz, C.; Canals, J.M.; Pumarola, M.; Candiota, A.P.; Arús, C. Development of a transplantable glioma tumour model from genetically engineered mice: MRI/MRS/MRSI characterisation. J. Neurooncol. 2016, 129, 67–76. [Google Scholar] [CrossRef] [Green Version]
- Dunn-Pirio, A.M.; Vlahovic, G. Immunotherapy approaches in the treatment of malignant brain tumors. Cancer 2017, 123, 734–750. [Google Scholar] [CrossRef]
- Balermpas, P.; Michel, Y.; Wagenblast, J.; Seitz, O.; Weiss, C.; Rödel, F.; Rödel, C.; Fokas, E. Tumour-infiltrating lymphocytes predict response to definitive chemoradiotherapy in head and neck cancer. Br. J. Cancer 2014, 110, 501–509. [Google Scholar] [CrossRef]
- Park, J.; Kim, C.G.; Shim, J.K.; Kim, J.H.; Lee, H.; Lee, J.E.; Kim, M.H.; Haam, K.; Jung, I.; Park, S.H.; et al. Effect of combined anti-PD-1 and temozolomide therapy in glioblastoma. Oncoimmunology 2019, 8, 1–11. [Google Scholar] [CrossRef] [Green Version]
- Zhao, J.; Chen, A.X.; Gartrell, R.D.; Silverman, A.M.; Aparicio, L.; Chu, T.; Bordbar, D.; Shan, D.; Samanamud, J.; Mahajan, A.; et al. Immune and genomic correlates of response to anti-PD-1 immunotherapy in glioblastoma. Nat. Med. 2019, 25, 462–469. [Google Scholar] [CrossRef]
- Chen, D.S.; Mellman, I. Elements of cancer immunity and the cancer–immune set point. Nature 2017, 541, 321–330. [Google Scholar] [CrossRef] [PubMed]
- Hegde, P.S.; Karanikas, V.; Evers, S. The where, the when, and the how of immune monitoring for cancer immunotherapies in the era of checkpoint inhibition. Clin. Cancer Res. 2016, 22, 1865–1874. [Google Scholar] [CrossRef] [PubMed] [Green Version]
- Villamañán, L. Unraveling CK2 Inhibition and Temozolomide Contribution to Therapy Response in Preclinical GL261 Glioblastoma: Immune System Implications and Magnetic Resonance Based Nosological Imaging. Ph.D. Thesis, Universitat Autònoma de Barcelona, Barcelona, Spain, 2019. Available online: https://tdx.cat/handle/10803/666881 (accessed on 19 November 2020).
- Hanson, H.L.; Donermeyer, D.L.; Ikeda, H.; White, J.M.; Shankaran, V.; Old, L.J.; Shiku, H.; Schreiber, R.D.; Allen, P.M. Eradication of established tumors by CD8+ T cell adoptive immunotherapy. Immunity 2000, 13, 265–276. [Google Scholar] [CrossRef] [Green Version]
- Karman, J.; Ling, C.; Sandor, M.; Fabry, Z. Initiation of Immune Responses in Brain Is Promoted by Local Dendritic Cells. J. Immunol. 2004, 173, 2353–2361. [Google Scholar] [CrossRef] [PubMed] [Green Version]
- June, C.H.; Warshauer, J.T.; Bluestone, J.A. Is autoimmunity the Achilles’ heel of cancer immunotherapy? Nat. Med. 2017, 23, 540–547. [Google Scholar] [CrossRef] [Green Version]
- Ferrer-Font, L.; Arias-Ramos, N.; Lope-Piedrafita, S.; Julià-Sapé, M.; Pumarola, M.; Arús, C.; Candiota, A.P. Metronomic treatment in immunocompetent preclinical GL261 glioblastoma: Effects of cyclophosphamide and temozolomide. NMR Biomed. 2017, 30, e3748. [Google Scholar] [CrossRef] [PubMed]
- Montalbán del Barrio, I.; Penski, C.; Schlahsa, L.; Stein, R.G.; Diessner, J.; Wöckel, A.; Dietl, J.; Lutz, M.B.; Mittelbronn, M.; Wischhusen, J.; et al. Adenosine-generating ovarian cancer cells attract myeloid cells which differentiate into adenosine-generating tumor associated macrophages-a self-amplifying, CD39- and CD73-dependent mechanism for tumor immune escape. J. Immunother. Cancer 2016, 4, 49. [Google Scholar] [CrossRef] [PubMed] [Green Version]
- Lewis, C.; Murdoch, C. Macrophage responses to hypoxia: Implications for tumor progression and anti-cancer therapies. Am. J. Pathol. 2005, 167, 627–635. [Google Scholar] [CrossRef]
- Ribas, A.; Shin, D.S.; Zaretsky, J.; Frederiksen, J.; Cornish, A.; Avramis, E.; Seja, E.; Kivork, C.; Siebert, J.; Kaplan-Lefko, P.; et al. PD-1 blockade expands intratumoral memory T cells. Cancer Immunol. Res. 2016, 4, 194–203. [Google Scholar] [CrossRef] [Green Version]
- Szatmári, T.; Lumniczky, K.; Désaknai, S.; Trajcevski, S.; Hídvégi, E.J.; Hamada, H.; Sáfrány, G. Detailed characterization of the mouse glioma 261 tumor model for experimental glioblastoma therapy. Cancer Sci. 2006, 97, 546–553. [Google Scholar] [CrossRef]
- Galon, J.; Bruni, D. Approaches to treat immune hot, altered and cold tumours with combination immunotherapies. Nat. Rev. Drug Discov. 2019, 18, 197–218. [Google Scholar] [CrossRef] [PubMed]
- Liu, C.J.; Schaettler, M.; Blaha, D.T.; Bowman-Kirigin, J.A.; Kobayashi, D.K.; Livingstone, A.J.; Bender, D.; Miller, C.A.; Kranz, D.M.; Johanns, T.M.; et al. Treatment of an aggressive orthotopic murine glioblastoma model with combination checkpoint blockade and a multivalent neoantigen vaccine. Neuro Oncol. 2020, 22, 1276–1288. [Google Scholar] [CrossRef] [PubMed]
- Ene, C.I.; Kreuser, S.A.; Jung, M.; Zhang, H.; Arora, S.; White Moyes, K.; Szulzewsky, F.; Barber, J.; Cimino, P.J.; Wirsching, H.-G.; et al. Anti-PD-L1 antibody direct activation of macrophages contributes to a radiation-induced abscopal response in glioblastoma. Neuro Oncol. 2020, 22, 639–651. [Google Scholar] [CrossRef] [PubMed]
- Noorani, I. Genetically Engineered Mouse Models of Gliomas: Technological Developments for Translational Discoveries. Cancers (Basel) 2019, 11, 1335. [Google Scholar] [CrossRef] [Green Version]
- Noorani, I.; de la Rosa, J.; Choi, Y.H.; Strong, A.; Ponstingl, H.; Vijayabaskar, M.S.; Lee, J.; Lee, E.; Richard-Londt, A.; Friedrich, M.; et al. PiggyBac mutagenesis and exome sequencing identify genetic driver landscapes and potential therapeutic targets of EGFR-mutant gliomas. Genome Biol. 2020, 21, 181. [Google Scholar] [CrossRef]
- Simões, R.V.; Delgado-Goñi, T.; Lope-Piedrafita, S.; Arús, C. 1H-MRSI pattern perturbation in a mouse glioma: The effects of acute hyperglycemia and moderate hypothermia. NMR Biomed. 2010, 23, 23–33. [Google Scholar] [CrossRef]
- Simões, R.V.; García-Martín, M.L.; Cerdán, S.; Arús, C. Perturbation of mouse glioma MRS pattern by induced acute hyperglycemia. NMR Biomed. 2008, 21, 251–264. [Google Scholar] [CrossRef]
- Ortega-Martorell, S.; Lisboa, P.J.G.; Vellido, A.; Simões, R.V.; Pumarola, M.; Julià-Sapé, M.; Arús, C. Convex Non-Negative Matrix Factorization for Brain Tumor Delimitation from MRSI Data. PLoS ONE 2012, 7, e47824. [Google Scholar] [CrossRef] [Green Version]
- Ortega-Martorell, S.; Ruiz, H.; Vellido, A.; Olier, I.; Romero, E.; Julià-Sapé, M.; Martín, J.D.; Jarman, I.H.; Arús, C.; Lisboa, P.J.G. A Novel Semi-Supervised Methodology for Extracting Tumor Type-Specific MRS Sources in Human Brain Data. PLoS ONE 2013, 8, e83773. [Google Scholar] [CrossRef] [Green Version]
- Ding, C.H.Q.; Tao, L.; Jordan, M. I. Convex and Semi-Nonnegative Matrix Factorizations. IEEE Trans. Pattern Anal. Mach. Intell. 2010, 32, 45–55. [Google Scholar] [CrossRef] [Green Version]
- Ortega-Martorell, S.; Lisboa, P.J.G.; Vellido, A.; Julia-Sape, M.; Arus, C. Non-negative Matrix Factorisation methods for the spectral decomposition of MRS data from human brain tumours. BMC Bioinform. 2012, 13, 38. [Google Scholar] [CrossRef] [PubMed] [Green Version]
- Wu, J.; Waxman, D.J. Metronomic cyclophosphamide eradicates large implanted GL261 gliomas by activating antitumor Cd8 + T-cell responses and immune memory. Oncoimmunology 2015, 4, e1005521. [Google Scholar] [CrossRef] [PubMed] [Green Version]


| Treatment | IMS-Anti-PD-1/TMZ | IMS-Anti-PD-1 Monotherapy |
|---|---|---|
| Mice code | C1386 | C1440 |
| C1398 | C1441 | |
| C1402 | C1442 | |
| C1431 | C1437 | |
| C1433 | C1438 | |
| C1446 | C1454 | |
| C1480 | ||
| C1484 | ||
| Number of animals | 6 | 8 |
| Primary Tumour Implantation wt Control Mice | Tumour Re-Challenge IMS-Anti-PD-1/TMZ Cured Mice | Tumour Re-Challenge Anti-PD-1 Monotherapy Cured Mice | |
|---|---|---|---|
| Mice with growing tumour | 3 | 3 | 0 |
| Mice with upfront tumour rejection | 0 | 3 | 8 |
| Tumour rejection rate | 0% | 50% | 100% |
Publisher’s Note: MDPI stays neutral with regard to jurisdictional claims in published maps and institutional affiliations. |
© 2020 by the authors. Licensee MDPI, Basel, Switzerland. This article is an open access article distributed under the terms and conditions of the Creative Commons Attribution (CC BY) license (http://creativecommons.org/licenses/by/4.0/).
Share and Cite
Wu, S.; Calero-Pérez, P.; Arús, C.; Candiota, A.P. Anti-PD-1 Immunotherapy in Preclinical GL261 Glioblastoma: Influence of Therapeutic Parameters and Non-Invasive Response Biomarker Assessment with MRSI-Based Approaches. Int. J. Mol. Sci. 2020, 21, 8775. https://doi.org/10.3390/ijms21228775
Wu S, Calero-Pérez P, Arús C, Candiota AP. Anti-PD-1 Immunotherapy in Preclinical GL261 Glioblastoma: Influence of Therapeutic Parameters and Non-Invasive Response Biomarker Assessment with MRSI-Based Approaches. International Journal of Molecular Sciences. 2020; 21(22):8775. https://doi.org/10.3390/ijms21228775
Chicago/Turabian StyleWu, Shuang, Pilar Calero-Pérez, Carles Arús, and Ana Paula Candiota. 2020. "Anti-PD-1 Immunotherapy in Preclinical GL261 Glioblastoma: Influence of Therapeutic Parameters and Non-Invasive Response Biomarker Assessment with MRSI-Based Approaches" International Journal of Molecular Sciences 21, no. 22: 8775. https://doi.org/10.3390/ijms21228775