IMR Press / JIN / Volume 22 / Issue 6 / DOI: 10.31083/j.jin2206171
Open Access Original Research
Kv1.3 Blockade Alleviates White Matter Injury through Reshaping M1/M2 Phenotypes via the NF-κB Signaling Pathway after Intracerebral Hemorrhage
Show Less
1 Department of Neurosurgery and Key Laboratory of Neurotrauma, Southwest Hospital, Third Military Medical University (Army Medical University), 400038 Chongqing, China
2 Department of Neurology, Southwest Hospital, Third Military Medical University (Army Medical University), 400038 Chongqing, China
3 Department of Emergency, Affiliated Hospital of Zunyi Medical University, 563000 Zunyi, Guizhou, China
4 Department of Fundamental Medicine, Chengdu University of Traditional Chinese Medicine, 611137 Chengdu, Sichuan, China
5 Institute of Pathology and Southwest Cancer Center, Southwest Hospital, Third Military Medical University (Army Medical University), 400038 Chongqing, China
*Correspondence: fenghua8888@vip.163.com (Hua Feng); neuroyin@163.com (Yi Yin); hongfei0723@163.com (Hongfei Ge)
J. Integr. Neurosci. 2023, 22(6), 171; https://doi.org/10.31083/j.jin2206171
Submitted: 25 March 2023 | Revised: 18 April 2023 | Accepted: 25 April 2023 | Published: 5 December 2023
Copyright: © 2023 The Author(s). Published by IMR Press.
This is an open access article under the CC BY 4.0 license.
Abstract

Background: White matter injury (WMI) in basal ganglia usually induces long-term disability post intracerebral hemorrhage (ICH). Kv1.3 is an ion channel expressed in microglia and induces neuroinflammation after ICH. Here, we investigated the functions and roles of Kv1.3 activation-induced inflammatory response in WMI and the Kv1.3 blockade effect on microglia polarization after ICH. Methods: Mice ICH model was constructed by autologous blood injection. The expression of Kv1.3 was measured using immunoblot, real-time quantitative polymerase chain reaction (RT-qPCR), and immunostaining assays. Then, the effect of administration of 5-(4-Phenoxybutoxy) psoralen (PAP-1), a selectively pharmacological Kv1.3 blocker, was investigated using open field test (OFT) and basso mouse score (BMS). RT-qPCR, immunoblot, and enzyme-linked immunosorbent assay (ELISA) were taken to elucidate the expression of pro-inflammatory or anti-inflammatory factors around hematoma. PAP-1’s function in regulating microglia polarization was investigated using immunoblot, RT-qPCR, and immunostaining assays. The downstream PAP-1 signaling pathway was determined by RT-qPCR and immunoblot. Results: Kv1.3 expression was increased in microglia around the hematoma significantly after ICH. PAP-1 markedly improved neurological outcomes and the WMI by reducing pro-inflammatory cytokine accumulation and upregulating anti-inflammatory factors. Mechanistically, PAP-1 reduces NF-κB p65 and p50 activation, thus facilitating microglia polarization into M2-like microglia, which exerts this beneficial effect. Conclusions: PAP-1 reduced pro-inflammatory cytokines accumulation and increased anti-inflammatory factors by facilitating M2-like microglia polarization via the NF-κB signaling pathway. Thus, the current study shows that the Kv1.3 blockade is capable of ameliorating WMI by facilitating M2-like phenotype microglia polarization after ICH.

Keywords
intracerebral hemorrhage
Kv1.3
microglia
PAP-1
neuroinflammation
1. Introduction

Intracerebral hemorrhage (ICH) is a kind of life-threatening disease with high morbidity, and nearly every ICH survivor undergoes long-term disabilities [1, 2]. Researchers have suggested that long-term disabilities possibly originate from white matter injury (WMI) in the basal ganglia [3, 4]. Previous studies have shown that white matter integrity is a promotor for locomotion functional recovery [5, 6, 7]. Various strategies, such as the inhibition of ferroptosis with the administration of Dexpramipexole (DPX) [8], upregulation of brain-derived neurotrophic factor (BDNF) by lithium [9], and inactivation of microglia into M1 phenotype using Ambroxol [10], have been identified to accelerate functional recovery through mitigating WMI after ICH. Hence, reducing WMI is a potential strategy to improve post-ICH neurological impairments.

Microglia are the first-line innate immune cells in the central nervous system (CNS) that respond to exogenous stimuli [11, 12]. Once activated, the microglia served as both a blessing and a curse cause microglia’s activity is determined by the composition ratio of two phenotypes, comprising M1-like (microglia that promote inflammation) and M2-like (microglia that inhibit inflammation) phenotypes [13]. After ICH, M1 microglia were activated through classical activation from primary microglia and exaggerating the immune and inflammation response. M2 microglia were formed through alternative activation of primary microglia, attenuating inflammation reaction and boosting tissue repair after injury [11, 13]. The M1-like microglia aim to enhance neuroinflammation and induce neurocyte death [11, 13]. Cytokines like tumor necrosis factor-α (TNF-α), interleukin-1β (IL-1β), and interleukin-6 (IL-6) that promote inflammation are secreted by M1-like microglia. Meanwhile, interleukin-4 (IL-4) and interleukin-10 (IL-10) are produced by M2-like microglia to attenuate neuroinflammation. [11, 13]. A well-toned M1/M2 composition and M1-M2 paradigm are crucial for tissue injury and recovery, which is vital to disease rehabilitation. Increasing microglial M2 phenotype is of vital importance. Recently, several studies have confirmed that boosting M1-like microglia transformation into M2-like microglia can alleviate WMI and improve neurological outcomes [11, 14]. Hence, exploring neuro-immunomodulatory treatments focusing on the polarization of microglia from M1-like to M2-like is a promising strategy for treating ICH.

Kv1.3 is a voltage-gated potassium channel that is highly expressed in the CNS and immune systems [15, 16, 17]. Previous studies have indicated that in neurodegenerative diseases such as Alzheimer’s disease (AD) and Parkinson’s disease (PD), Kv1.3 is upregulated [15, 16]. With the overexpression of Kv1.3, microglia are shifted into the M1 phenotype resulting in an increase in pro-inflammatory factors, including TNF-α, IL-1β, and IL-6 [15, 16, 18]. Concurrently, the administration of 5-(4-Phenoxybutoxy) psoralen (PAP-1), a selectively pharmacological Kv1.3 inhibitor, remarkably decreases the pro-inflammatory cytokines deposition by inhibiting M1-like microglia activation in PD [16]. Furthermore, PAP-1 reduces secondary inflammation through attenuating M1-like microglia activation after ischemic stroke [19, 20]. In addition, blocking Kv1.3 enhances microglia shift into M2 phenotype following cerebral ischemia/reperfusion injury [20], indicating Kv1.3 is a negative regulator that reshapes M1/M2 phenotypes. Previous studies also illustrated that the detailed mechanisms of Kv1.3 activity were related to NF-κB activation [21, 22], which upregulates the inflammatory genes [23, 24, 25]. Furthermore, Kv1.3 inhibitor PAP-1 probably functions via inhibiting the NF-κB signaling pathway [22]. However, whether Kv1.3 make an effect in polarizing microglia following ICH has not been fully elucidated. Moreover, whether blocking Kv1.3 using PAP-1 intensifies neurological outcomes through mitigating WMI remains unclear.

Herein, we hypothesized that Kv1.3 blockade alleviated WMI by reducing microglia M1 phenotype and enhancing microglia M2 phenotype polarization via inhibiting the NF-κB signaling pathway. The current study aims to clarify Kv1.3’s function of mediating microglia polarization and provide a brand new therapeutic strategy to tackle WMI following ICH.

2. Materials and Methods
2.1 Experimental Animals

The National Institutes of Health Guide for the Care and Use of Laboratory Animals was followed for all experiments and treatments on animals. And all animal experiments were sanctified and supervised by the Ethics Committee of the Chongqing Southwest Hospital (approval no. AMUWEC20224059). A total of 118 adult C57BL/6J mice (male, 23–26 g, aged between 8–11 weeks, 112 were enrolled in experiments and 6 died) were acquired from the Southwest Hospital experiments animal center. Throughout the experiment, food and water were freely available to the mice. The feeding room has a constant temperature of 22–25 °C and humidity of 55–60%, and 12 hours dark/12 hours light circle.

2.2 ICH Model and Group Designation

The mice were stabilized on the stereotactic instrument (No.68001, RWD Life Science Corporation, Shenzhen, Guangdong, China) after proper anesthetization by a mixed 2% isoflurane/air (2–3 L/min). The mice ICH model was constructed according to the previous description [26]. Briefly, after performing a scalp incision and drilling a cranial hole, 16 µL autologous blood from the tail vein was harvested after tail shearing and pumped into the basal ganglia (from bregma: 2.1 mm lateral, 0.9 mm anterior, and 3.0 mm ventral) by a sterilized syringe (No.7000, Hamilton, Bonaduz, Glaubenden, Switzerland) at 2 µL/min. After injecting the blood, the syringe needle was fixed for five min to prevent blood back-flow. An animal surgery temperature control device (No.78600 Zhongshi Corporation, Beijing, China) was used to control mice’s body temperatures during surgery. Then, the weight of each mouse was measured. Mice experiment groups were randomly divided by a mice breeder who is blind to this study by means of a serious of random number. Needle insertion was the only procedure performed on the Sham mice. In the ICH group, 16 µL autologous blood from the tail vein was injected as mentioned. In the ICH + PAP-1 group, mice were further randomly divided by the dosage of PAP-1 (No.HY-10015, MedChemExpress, Monmouth Junction, NJ, USA) (20, 40, and 60 mg/kg/d). The PAP-1 was administrated via intraperitoneal injections immediately after ICH. PAP-1 was dissolved in dimethyl sulfoxide (DMSO) and corn oil with 0.05:0.95 before injection. Each mouse received a 2 mL mixture in one shot daily, and the injections continued for 3 or 7 days according to the experimental design. The ICH group only received the same volume of 2 mL mixed dimethyl sulfoxide and corn oil intraperitoneal injections.

2.3 Open Field Test

Open field test (OFT) was used for mice behavioral changes evaluation, as described before [27]. Briefly, a field box was evenly divided into four sections adjacent to each other but isolated by a board. Each section was 50 cm square and 50 cm high. Each mouse was placed in one of the chambers for five min allowing free movement. Their activities were video recorded. Then, the chamber was cleaned with purified water and ready for the next test. The resultant videos were then analyzed by a software (VideoTrack, ViewPoint Behaviour Technology, Lyon, Rhone, France). The mean velocity of the movement was then calculated from the software by two examiners blinded to the group’s design.

2.4 Basso Mouse Score

Basso mouse score (BMS) is a scoring system used to evaluate mice’s joint movement and coordination [28, 29]. Each mouse was placed on a broad experimental table one by one for free movement under the observation of two investigators. After one min of observation, the score from each observer blind to group design was recorded. The scoring scale ranges from 0 to 9, and the significance of each point is described previously [28, 29].

2.5 Transmission Electron Microscopy

Transmission electron microscopy (TEM) was performed to detect the integrity of the white matter bundle as described [30]. Briefly, after perfusion, samples (1 mm3) were incubated overnight in 1.25% glutaraldehyde and then post-fixed for three days at 4 °C in 1.25% glutaraldehyde. Then, the samples were rinsed thrice and fixed by 1% osmium tetroxide (OsO4) for 2 h. After re-dyeing with uranyl acetate, dehydration was conducted using gradient acetone, followed by infiltration with propylene oxide. Thereafter, the samples were embedded in epoxy resin, sliced by an ultra-microtome (EM UC7, Leica, Wetzlar, Hessian, Germany), and exposed to TEM (HT7700, Hitachi, Tokyo, Japan). G-ratio was measured by ImageJ (V.1.8, NIH, Bethesda, Rockville, MD, USA) for evaluating demyelination per field that was randomly selected. At least 25 white matter bundles in each sample were taken into statistics. Three independent samples per group were taken into the experiment.

2.6 Enzyme-Linked Immune-Sorbent Assay

Briefly, a double antibody sandwich method was used in this study. The following enzyme-linked immune-sorbent assay (ELISA) kits were used: Murine TNF-α (No.BGK06804, Biogems, Los Angeles, CA, USA); Murine IL-1β (No.BGK10749, Biogems, Los Angeles, CA, USA); Murine IL-4 (No.BGK07750, Biogems, Los Angeles, CA, USA); Murine IL-10 (No.BGK18893, Biogems, Los Angeles, CA, USA). After isolating ipsilateral brain tissue, the homogenate was centrifuged (4 °C, 12000 rpm, 30 min) and the concentration of the total protein was detected by a Bicinchoninic Acid kit (No.P0010, Beyotime, Shanghai, China). 100 µL supernate or standard was incubated with a monoclonal antibody pre-coated ELISA kit for 120 min at room temperature (RT). Then, after washing with PBS thrice, the biotinylated antibody was added for 90 min incubation at RT, followed by washing. Afterwards, 100 µL prepared 1× Avidin-Biotin-Peroxidase complex was added to each well for 40 min incubation at RT. Next, 90 µL color-developing reagent was added and incubated for 30 min in the dark at RT. 100 µL stop solution was added, followed by a 30 min reaction. Finally, the optical density (OD) value was measured at 450 nm by a spectrophotometer (Varioskan Flash, Thermo Scientific, Waltham, MA, USA). The concentration of inflammatory factors was calculated by comparing the OD value with the standard curve and recorded as pg/mg total protein after standardization. Each sample consisted of at least two repeat wells, and each group comprised at least three independent samples.

2.7 Immunostaining

Brain sections were obtained from the aforementioned freezing microtome and then perforated with 0.3% Triton-X 100 (No.P0090, Beyotime, Shanghai, China)for 30 min. Then, the 5% bovine serum album (BSA) was added for 2 h blocking at RT. Thereafter, the following primary antibodies were incubated at 4 °C overnight: Mouse anti-Iba-1 (1:200, No.ab283319, Abcam, Cambridge, Cambridgeshire, UK); Rabbit anti-CD16 (1:100, No.16559-1-AP, Proteintech, Philadelphia, PA, USA); Rabbit anti-CD206 (1:100, No.18704-1-AP, Proteintech, Philadelphia, PA, USA); Rabbit anti-iNOS (1:100, No.22226-1-AP, Proteintech, Philadelphia, PA, USA); Rabbit anti-Arg-1 (1:100, No.16001-1-AP, Proteintech, Philadelphia, PA, USA); Rabbit anti-Kv1.3 (1:200, No.14079-1-AP, Proteintech, Philadelphia, PA, USA); Mouse anti-MBP (1:200, No.sc-365701, Santa Cruz, Dallas, TX, USA); Rabbit anti-NFH (1:200, No.BM0100, Boster, Wuhan, Hubei, China). After incubation, the sections were washed thrice with PBS; each sample was washed for at least 5 min. Then, the following secondary antibodies were incubated for 2 h at RT: Goat anti-Mouse 488; Goat anti-Mouse 555; Goat anti-Rabbit 488; Goat anti-Rabbit 555. Then, brain sections were washed with PBS and DAPI (4’,6-diamidino-2-phenylindole) was used for nuclear staining for 5 min at RT. Afterwards, the neutral resin was administrated for mounting. A fluorescent microscope (Axioskop2, Carl ZEISS, Weimar, German) was then taken to record the images of the resultant samples. At least 3 independent samples were studied in each group. At least 3 sections were prepared for the evaluation of each sample. The images were investigated by Image J (V.1.8, NIH, Bethesda, MA, USA). At least 3 images of the peri-hematoma area were taken from each section for statistics.

2.8 Immunoblot

Mouse brain peri-hematoma tissue was extracted from homogenate and centrifuged at 4 °C, 12000 rpm 30 min after sacrifice. The protein concentration was also detected by the Bicinchoninic Acid kit above. Then, the protein samples were mixed with 5× loading buffer (No.P0015, Beyotime, Shanghai, China) and denaturation for 5 min at 95 °C. After calculation, a total of 50 µg protein was separated by gel electrophoresis using 10 or 12.5% SDS- polyacrylamide gel electrophoresis (SDS-PAGE) at a constant 80 V and electro-blotted to polyvinylidene difluoride (PVDF, Roche, Indianapolis, IN, USA) membranes under a constant current passage of 200 mA. Thereafter, the membranes were blocked by 5% BSA for 2 h at RT. Then the sample was incubated separately with the following primary antibodies overnight at 4 °C: Rabbit anti-Kv1.3 (1:1000, No.14079-1-AP, Proteintech, Philadelphia, PA, USA); Rabbit anti-MBP (1:1000, No.BA0094, Boster, Wuhan, Hubei, China); Rabbit anti-CD16 (1:1000, No.16559-1-AP, Proteintech, Philadelphia, PA, USA); Rabbit anti-CD206 (1:1000, No.18704-1-AP Proteintech, Philadelphia, PA, USA); Rabbit anti-iNOS (1:1000, No.22226-1-AP, Proteintech, Philadelphia, PA, USA); Rabbit anti-Arg-1 (1:1000, No.16001-1-AP, Proteintech, Philadelphia, PA, USA); Mouse anti-TNF-α (1:1000, No.sc-52746, Santa Cruz, Dallas, TX, USA); Mouse anti-IL-1β (1:1000, No.sc-32294, Santa Cruz, Dallas, TX, USA); Rabbit anti-IL-4 (1:1000, No.66142-1-Ig, Proteintech, Philadelphia, PA, USA); Rabbit anti-IL-10 (1:1000, No.60269-1-Ig, Proteintech, Philadelphia, PA, USA); Mouse anti-NF-κB p65 (1:200, No.sc-8008, Santa Cruz, Dallas, TX, USA); Mouse anti-NF-κB p50 (1:200, No.sc-8414, Santa Cruz, Dallas, TX, USA); Mouse anti-p-NF-κB p65 (1:200, No.sc-136548, Santa Cruz, Dallas, TX, USA); Mouse anti-p-NF-κB p50 (1:200, No.sc-271908, Santa Cruz, Dallas, TX, USA); Mouse anti-β-Tubulin (1:5000, No.T200608, Zen-bio, Chengdu, Sichuan, China); Mouse anti-GAPDH (1:5000, No.250133, Zen-bio, Chengdu, Sichuan, China); Mouse anti-β-Actin (1:5000, No.700068, Zen-bio, Chengdu, Sichuan, China). After washing thrice with Tris-HCl buffer solution + Tween (TBST) post-incubation, the membranes were incubated with the secondary antibodies Goat anti-Rabbit or Goat anti-Mouse for 2 h at RT. The resultant band OD of membranes was detected by an imaging system (Evolution-Capt Edge, Vilber, Paris, Evelyn, France) with a western blotting chemiluminescence kit (No.WP20005, Thermo Fisher Scientific, Waltham, MA, USA). Images were analyzed by the aforementioned system (Evolution-Capt Edge, Vilber, France). At least 3 samples were there in each group and at least 3 times exposure was made in each sample.

2.9 Real-Time Fluorescence Quantitative Polymerase Chain Reaction

After liquid nitrogen milling, the total RNA of mice hematoma ipsilateral brain was extracted by Trizol reagent (No.DP451, Tiangen, Beijing, China). Then, an extraction procedure was performed, followed by an extraction kit manual (No.DP451, Tiangen, Beijing, China). After RNA concentration measurement and dilution, RNA reverse-transcription was made by a reverse-transcription kit (No.RR047A, Takara Bio Inc., Shiga, Japan) on a PCR system (V.1.5, Bio-Rad CFX manager, Hercules, CA, USA). Thereafter, real-time fluorescence quantitative polymerase chain reaction (RT-qPCR) was conducted using SYBR-green Premix Ex Taq™ (No.RR820A, Takara Bio Inc., Shiga, Japan) on the system. In brief, a total of 25 µL reaction system was added to the 96-well plates followed by the manual (No.RR820A, Takara Bio Inc., Shiga, Japan) and then cycled for 41 rounds under conditions prescribed in the manual. Each sample was studied in triplicate. The threshold cycle (CT) values were collected, and the mRNA level was calculated by 2-ΔΔCT. Glyceraldehyde 3-phosphate dehydrogenase (GAPDH) was set as an internal control. Relative gene expression was normalized to the Sham group and the primers used in the present study are listed in Table 1.

Table 1.Primer used in RT-qPCR.
Target genes Forward sequence (5′–3′) Reverse sequence (5′–3′)
Kv1.3 GGGGCATTGCCATTGTGTC AGGCGGGATAGTCTTTCTCATC
Kca3.1 GCTCAACCAAGTCCGCTTC GTGATCGGAATCAGCCACAGT
Kv1.1 GTGATGTCGGGGGAGAATGTT CCGGAGATGTTGATTACTACGC
Kv1.5 TCCGACGGCTGGACTCAATAA CAGATGGCCTTCTAGGCTGTG
Tnf-α CCCTCACACTCAGATCATCTTCT GCTACGACGTGGGCTACAG
Il-6 TAGTCCTTCCTACCCCAATTTC TTGGTCCTTAGCCACTCCTTC
Il-1β GCAACTGTTCCTGAACTCAACT ATCTTTTGGGGTCCGTCAACT
Il-10 GCTCTTACTGACTGGCATGAG CGCAGCTCTAGGAGCATGTG
Bdnf TCATACTTCGGTTGCATGAAGG AGACCTCTCGAACCTGCCC
Ncf CCAGTGAAATTAGGCTCCCTG CCTTGGCAAAACCTTTATTGGG
Cd16 CAGAATGCACACTCTGGAAGC GGGTCCCTTCGCACATCAG
Cd32 AGGGCCTCCATCTGGACTG GTGGTTCTGGTAATCATGCTCTG
Inos GTTCTCAGCCCAACAATACAAGA GTGGACGGGTCGATGTCAC
Cd206 CTCTGTTCAGCTATTGGACGC CGGAATTTCTGGGATTCAGCTTC
Arg1 CTCCAAGCCAAAGTCCTTAGAG AGGAGCTGTCATTAGGGACAT
Tgf-β CTCCCGTGGCTTCTAGTGC GCCTTAGTTTGGACAGGATCTG
P65 CTTCTGGGCCTTATGTGGAGATC GGTCCTGTGTAGCCATTGATCTT
P50 GATGGGACTACACCTCTGCATAT AGGCTCATACGGTTTCCCATTTA
Actb ACTGTCGAGTCGCGTCC CTGACCCATTCCCACCATCA
Gapdh CCTGGAGAAACCTGCCAAGTA TCATACCAGGAAATGAGCTTGAC

RT-qPCR, real-time quantitative polymerase chain reaction.

2.10 Statistical Analysis

All data in this study were presented as mean ± SEM. SPSS 18.0 software (SPSS, Inc., Chicago, IL, USA) was used for the statistic. For the data obtained from the RT-qPCR of the ion channel, multiple t-tests were performed. For comparison of Kv1.3 immunoblot and immunostaining, the Student’s t-test was deployed. Behavioral data collected were analyzed by a two-way analysis of variance (ANOVA), followed by Turkey’s post-hoc test. One-way ANOVA was used for other data analyses. Furthermore, multiple comparisons were performed using Turkey’s post-hoc test only if the data lived up to the normal distribution checked by Shapiro-Wilk normality test. In this study, p < 0.05 was considered to be statistically significant.

3. Results
3.1 Kv1.3 was Significantly Upregulated from Day 1 to 7 Post-ICH.

To determine which subunit of voltage-gated potassium channel plays the dominant role in enhancing neuroinflammation around the post-ICH hemorrhage, the mRNA expression of several subunits belonging to voltage-gated potassium channel was investigated using RT-qPCR (Fig. 1). Results demonstrated an increased expression of Kv1.3 mRNA from day 1 to day 7, especially on day 3, while the Kv1.3 mRNA expression exhibited no notable difference on day 14 between the Sham group and the ICH group (Fig. 2A). Moreover, the expression of other potassium channels exhibited no significant difference, such as Kv1.1, Kv1.5, and Kca3.1, between the two groups (Fig. 2A). Subsequently, the immunoblot bands indicated that in the ICH group, Kv1.3 protein expression was higher than that in the Sham group on day 3 (Fig. 2B,C). Next, the immunostaining images revealed higher optical densities of Kv1.3 in the ICH group than that in the Sham group around hematoma (Fig. 2D,E). Collectively, these results demonstrated that Kv1.3’s expression was markedly enhanced around the hematoma following ICH. The highest expression of Kv1.3 is on day 3 of ICH among the checkpoints of days 1, 3, 7, and 14.

Fig. 1.

Schematic illustration showing the experimental design and timeline in the current study. ICH, intracerebral hemorrhage; PAP-1, 5-(4- Phenoxybutoxy) psoralen.
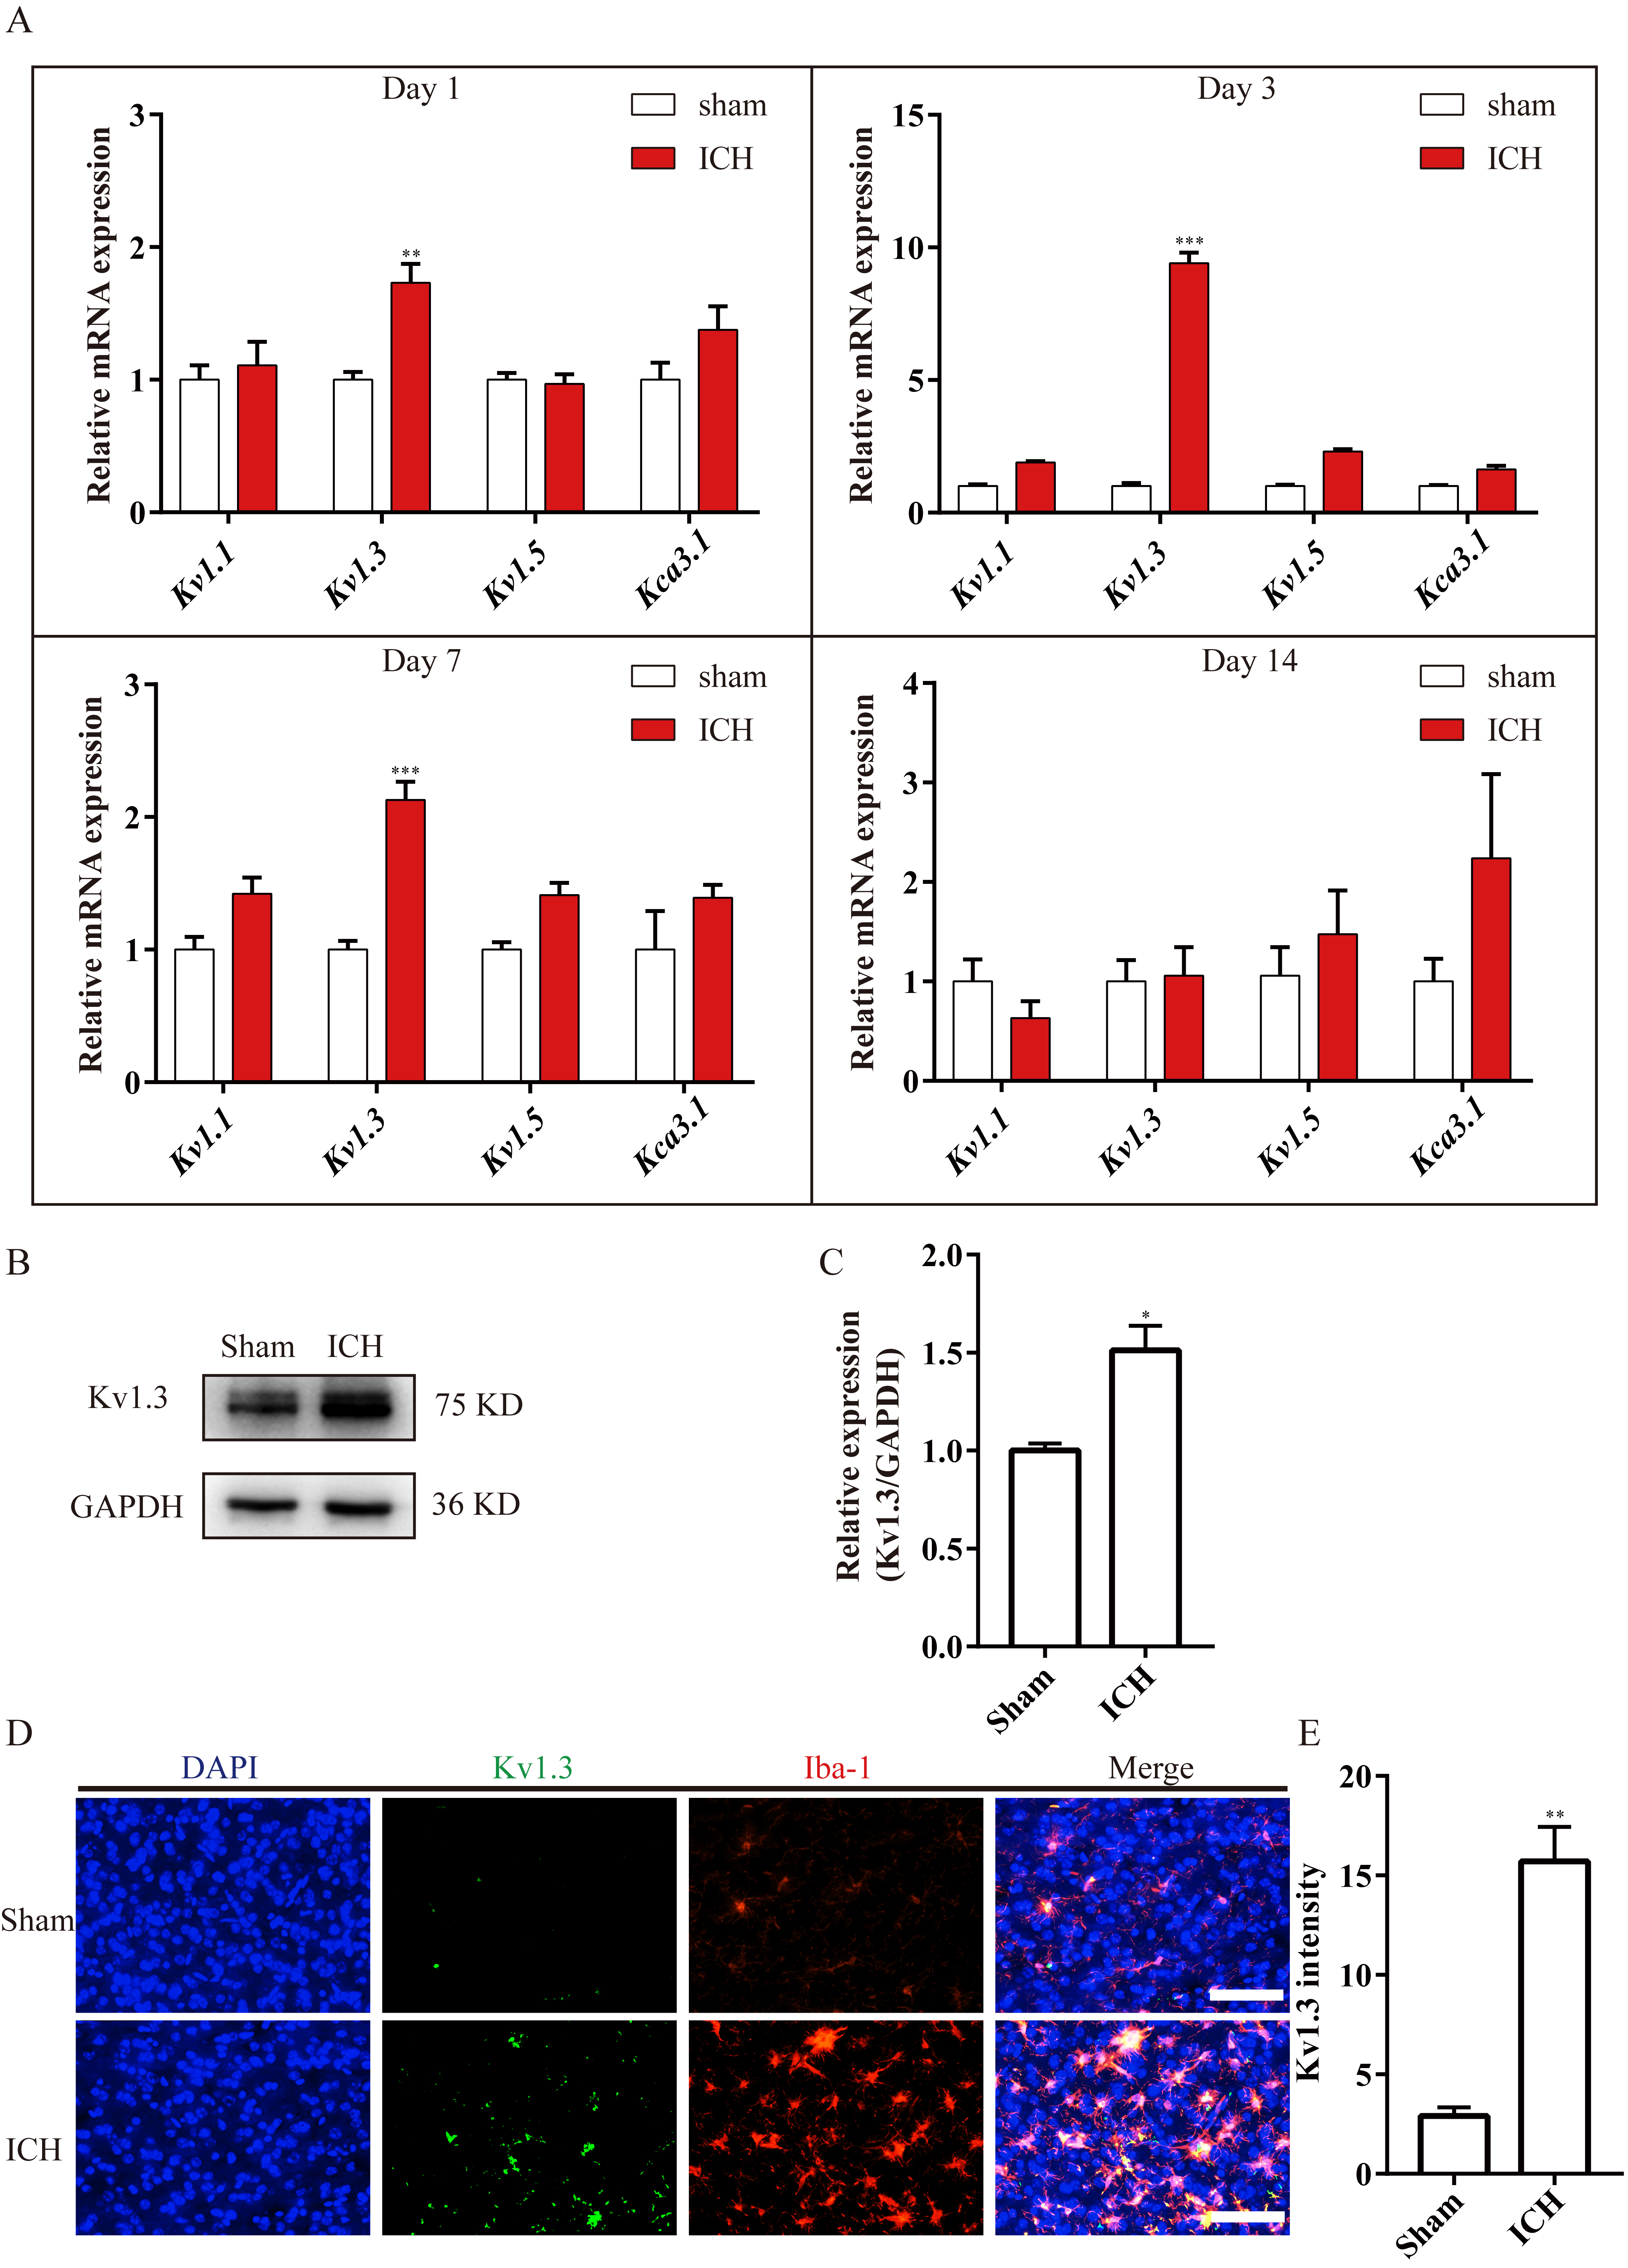
Fig. 2.

Kv1.3 expression was significantly increased after ICH. (A) Bar charts illustrating the Kv1.1, Kv1.3, Kv1.5, and Kca3.1 mRNA expressions in Sham and ICH groups at different time points. n = 3 each group, **p < 0.01, ***p < 0.001; multiple t-tests. (B) Immunoblot bands showing the Kv1.3 protein expression in Sham and ICH groups on day 3 after ICH. (C) Summarized bar graph depicting Kv1.3 expression from (B). n = 3 each group, *p < 0.05; Student’s t-test. (D) Immunostaining of Iba-1 (red) and Kv1.3 (green) in Sham and ICH groups on day 3 after ICH. Scale bars: 50 µm. (E) Summarized bar graph depicting the optical density of Kv1.3 from (D). n = 3 each group, **p < 0.01; Student’s t-test. ICH, intracerebral hemorrhage; GAPDH, glyceraldehyde 3-phosphate dehydrogenase; DAPI, 4’,6-diamidino-2-phenylindole.

3.2 Administration of PAP-1 Blocking Kv1.3 Facilitated Weight Gain and Neurological Recovery after ICH in Mice.

The aforementioned results revealed that Kv1.3 expression was enhanced in microglia in ICH mice. Considering that Kv1.3 blockage using PAP-1 exerts a neuroprotective effect in neurodegenerative diseases and ischemic stroke [15, 16, 19], the different dosages (20, 40, and 60 mg/kg) of PAP-1 were used to test the neuroprotective effect of Kv1.3 blockage on ICH mice. The weight measurement and behavioral tests were conducted to validate the time-point and dosage for further research on days 1, 3, 7, and 14 (Fig. 1). Then the various examinations were performed on day 3 in the current study (Fig. 1).

First, the mice in the ICH + PAP-1 group weighed more than those in the ICH group, and the dosages of 40 and 60 mg/kg showed a better weight gain effect than the dosage of 20 mg/kg from day 3 to 14 (Fig. 3A). Next, the curves collected from BMS indicated that mice that received PAP-1 treatment exhibited higher scores than that in the ICH group, and the scores in ICH + PAP-1 40 mg/kg and ICH + PAP-1 60 mg/kg groups were higher than that in ICH + PAP-1 20 mg/kg group from day 3 to 14 (Fig. 3B). Subsequently, the results obtained from OFT revealed that the mean velocity of mice in OFT in the ICH group decreased significantly after ICH, whereas the same was considerably increased with the application of PAP-1 (Fig. 3C,D). Meanwhile, mice in ICH + PAP-1 40 mg/kg and ICH + PAP-1 60 mg/kg groups showed increased mean velocity than that in ICH + PAP-1 20 mg/kg group (Fig. 3C,D). Collectively, these results indicated that PAP-1 administration improved neurological deficits after ICH. The dosage was 40 mg/kg, and the checkpoint was day 3 for future experiments in the present experiments.
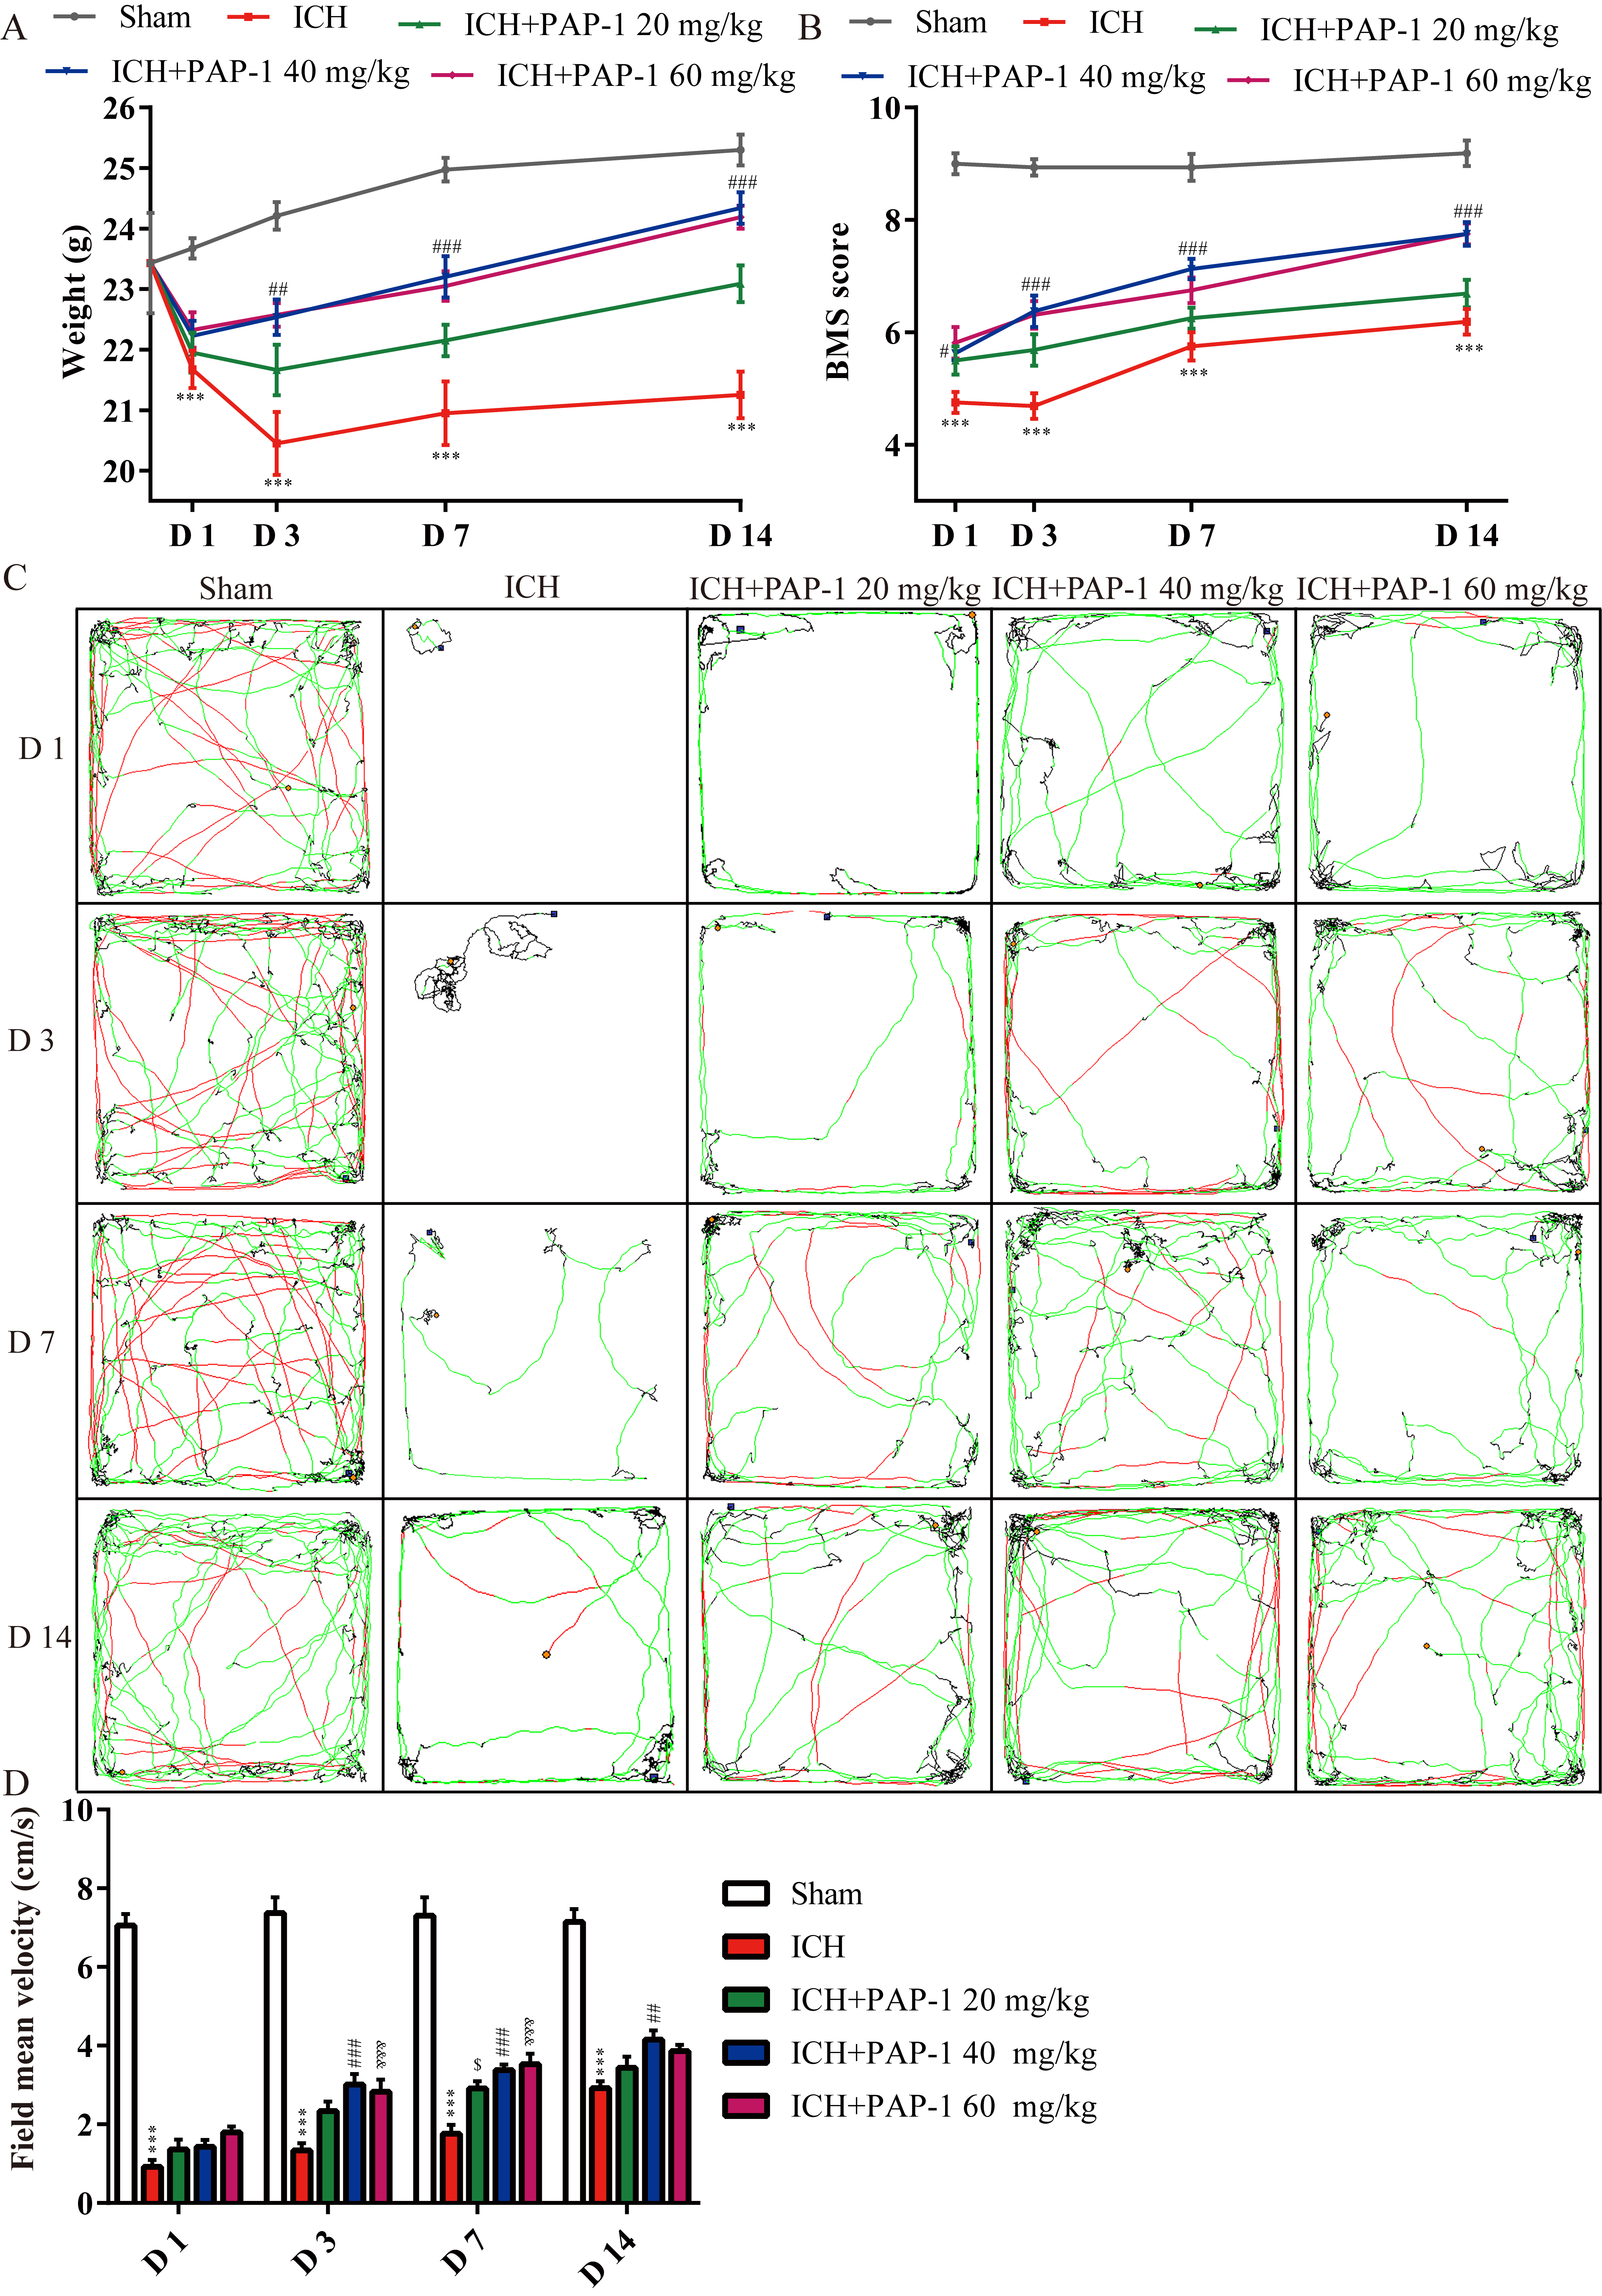
Fig. 3.

Application of PAP-1 facilitated neurological outcomes after ICH. (A) Weight variation curves of mice in each group. n = 8 each group, ***p < 0.001 vs. Sham group; ##p < 0.01, ###p < 0.001 vs. ICH group. (B) Basso mouse score in each group. n = 8 each group, ***p < 0.001 vs. Sham group; #p < 0.05, ###p < 0.001 vs. ICH group. (C) Representative mice locomotion trajectory in the open field test. Blue square: the starting point; Yellow circle: the ending point; Red trajectory: velocity >25 cm/s; Green trajectory: velocity >7 but <25 cm/s; Black trajectory: velocity <7 cm/s. (D) Open field test showing each group’s mean velocity of mice. n = 8 each group, ***p < 0.001 ICH vs. Sham group; ##p < 0.01, ###p < 0.001 ICH + PAP-1 (40 mg/kg) vs. ICH group; $p < 0.05 ICH + PAP-1 (20 mg/kg) vs. ICH group; &&&p < 0.001 ICH + PAP-1 (60 mg/kg) vs. ICH group.

3.3 Application of PAP-1 Reduced WMI Peri-Hematoma in Mice after ICH.

The integrity of white matter bundles contributes greatly to neurological outcomes after ICH. Results indicated that the effect of PAP-1 administration on WMI was elucidated on day 3 following ICH. The immunostaining results of MBP and NF200 depicted that the optical density of MBP and NF200 decreased around hematoma on day 3 after ICH, while the treatment of PAP-1 partially ameliorated this phenomenon (Fig. 4A–C). Next, the immunoblot results elucidated a downregulated myelin basic protein (MBP) expression in the ICH group, whereas the application of PAP-1 abrogated this effect (Fig. 4D,E). Furthermore, the integrity of the white matter bundle was determined by TEM. As a result, the ICH group had a much greater G-ratio for the myelin sheath. In contrast, PAP-1 treatment markedly decreased this phenomenon (Fig. 4F,G). Combinedly, these results implied that ICH caused WMI, and the application of PAP-1 alleviated ICH-induced WMI in mice.

Fig. 4.

Administration of PAP-1 reduced ICH-induced white matter injury. (A) Immunostaining of MBP (red) and NF200 (green) in each group on day 3 after ICH. Scale bars: 50 µm. (B) Summarized bar graph depicting MBP expression from (A). n = 3 each group, ***p < 0.001 vs. Sham group; #p < 0.05 vs. ICH group. (C) Summarized bar graph depicting NF-200 expression from (A). n = 3 each group, **p < 0.01 vs. Sham group; #p < 0.05 vs. ICH group. (D) Immunoblot bands illustrating MBP expression in each group on day 3 after ICH. (E) Summarized bar graph depicting MBP expression from (D). n = 3 each group, **p < 0.01 vs. Sham group; ##p < 0.01 vs. ICH group. (F) TEM images showing white matter bundles in each group. Orange arrows indicate demyelination. Scale bars: 2 µm. (G) Summarized bar graph depicting the white matter bundles’ G-ratio in each group. At least 70 white matter bundles in each group were considered in statistics, ***p < 0.001 vs. Sham group; ##p < 0.01 vs. ICH group. MBP, Myelin Basic Protein; NF, Neurofilament Protein; TEM, Transmission electron microscopy.

3.4 The Application of PAP-1 Mitigated WMI by Decreasing Pro-inflammatory Factors and Increasing Anti-inflammatory Cytokines.

To decipher why PAP-1 administration reduced WMI, a further investigation of anti-inflammatory and pro-inflammatory mediator levels was conducted. Initially, the results obtained using RT-qPCR assays on day 3 after ICH corroborated that Tnf-α, Il-1β, and Il-6 mRNA expressions were significantly increased, whereas the elevated mRNA expression above was prominently decreased with the treatment of PAP-1 (Fig. 5A). Next, the immunoblot bands indicated that TNF-α and IL-1β protein expressions were prominently increased, while this effect was abrogated with the application of PAP-1 on day 3 after ICH (Fig. 5B–D). Subsequently, the ELISA results showed that the concentration of TNF-α and IL-1β were considerably increased, but this phenomenon was markedly compromised with the application of PAP-1 (Fig. 5E,F). Collectively, these results indicated that PAP-1 reduced the accumulation of pro-inflammatory factors on day 3 after ICH.

Fig. 5.

Administration of PAP-1 decreased the pro-inflammatory factors around hematoma after ICH. (A) Bar charts illustrating Tnf-α, Il-1β, and Il-6 mRNA expression in each group on day 3 after ICH. n = 3 each group, ***p < 0.001 vs. Sham group; ###p < 0.001 vs. ICH group. (B) Immunoblot bands demonstrating TNF-α and IL-1β expression in each group. (C) Summarized bar graph depicting TNF-α expression from (B). n = 3 each group, ***p < 0.001 vs. Sham group; ###p < 0.001 vs. ICH group. (D) Summarized bar graph depicting IL-1β expression from (B). n = 3 each group, ***p < 0.001 vs. Sham group; ##p < 0.01 vs. ICH group. (E) ELISA results representing the concentration of TNF-α in each group on day 3 after ICH. n = 3 each group, ***p < 0.001 vs. Sham group; #p < 0.05 vs. ICH group. (F) ELISA results representing the concentration of IL-1β in each group on day 3 after ICH. n = 3 each group, ***p < 0.001 vs. Sham group; #p < 0.05 vs. ICH group. TNF-α, tumor necrosis factor-α; IL-1β, interleukin-1β; ELISA, enzyme-linked immunosorbent assay .

Subsequently, the bar charts showed that the mRNA expressions of anti-inflammatory cytokines, including nerve growth factor (Ngf), Il-10, and brain-derived neurotrophic factor (Bdnf), were increased after ICH, and their expressions were notably enhanced with PAP-1 administration (Fig. 6A). Furthermore, immunoblot shows elevated IL-4 and IL-10 protein expressions, and this effect was markedly enhanced with the PAP-1 application on day 3 after ICH (Fig. 6B–D). Thereafter, the ELISA findings demonstrated that the content of IL-4 and IL-10 were prominently increased, and this effect was reinforced with the administration of PAP-1 (Fig. 6E,F). Taken together, these results verified that PAP-1 improved the neuro-inflammatory microenvironment by decreasing the accumulation of pro-inflammatory factors and enhancing the deposition of anti-inflammatory factors on day 3 after ICH.
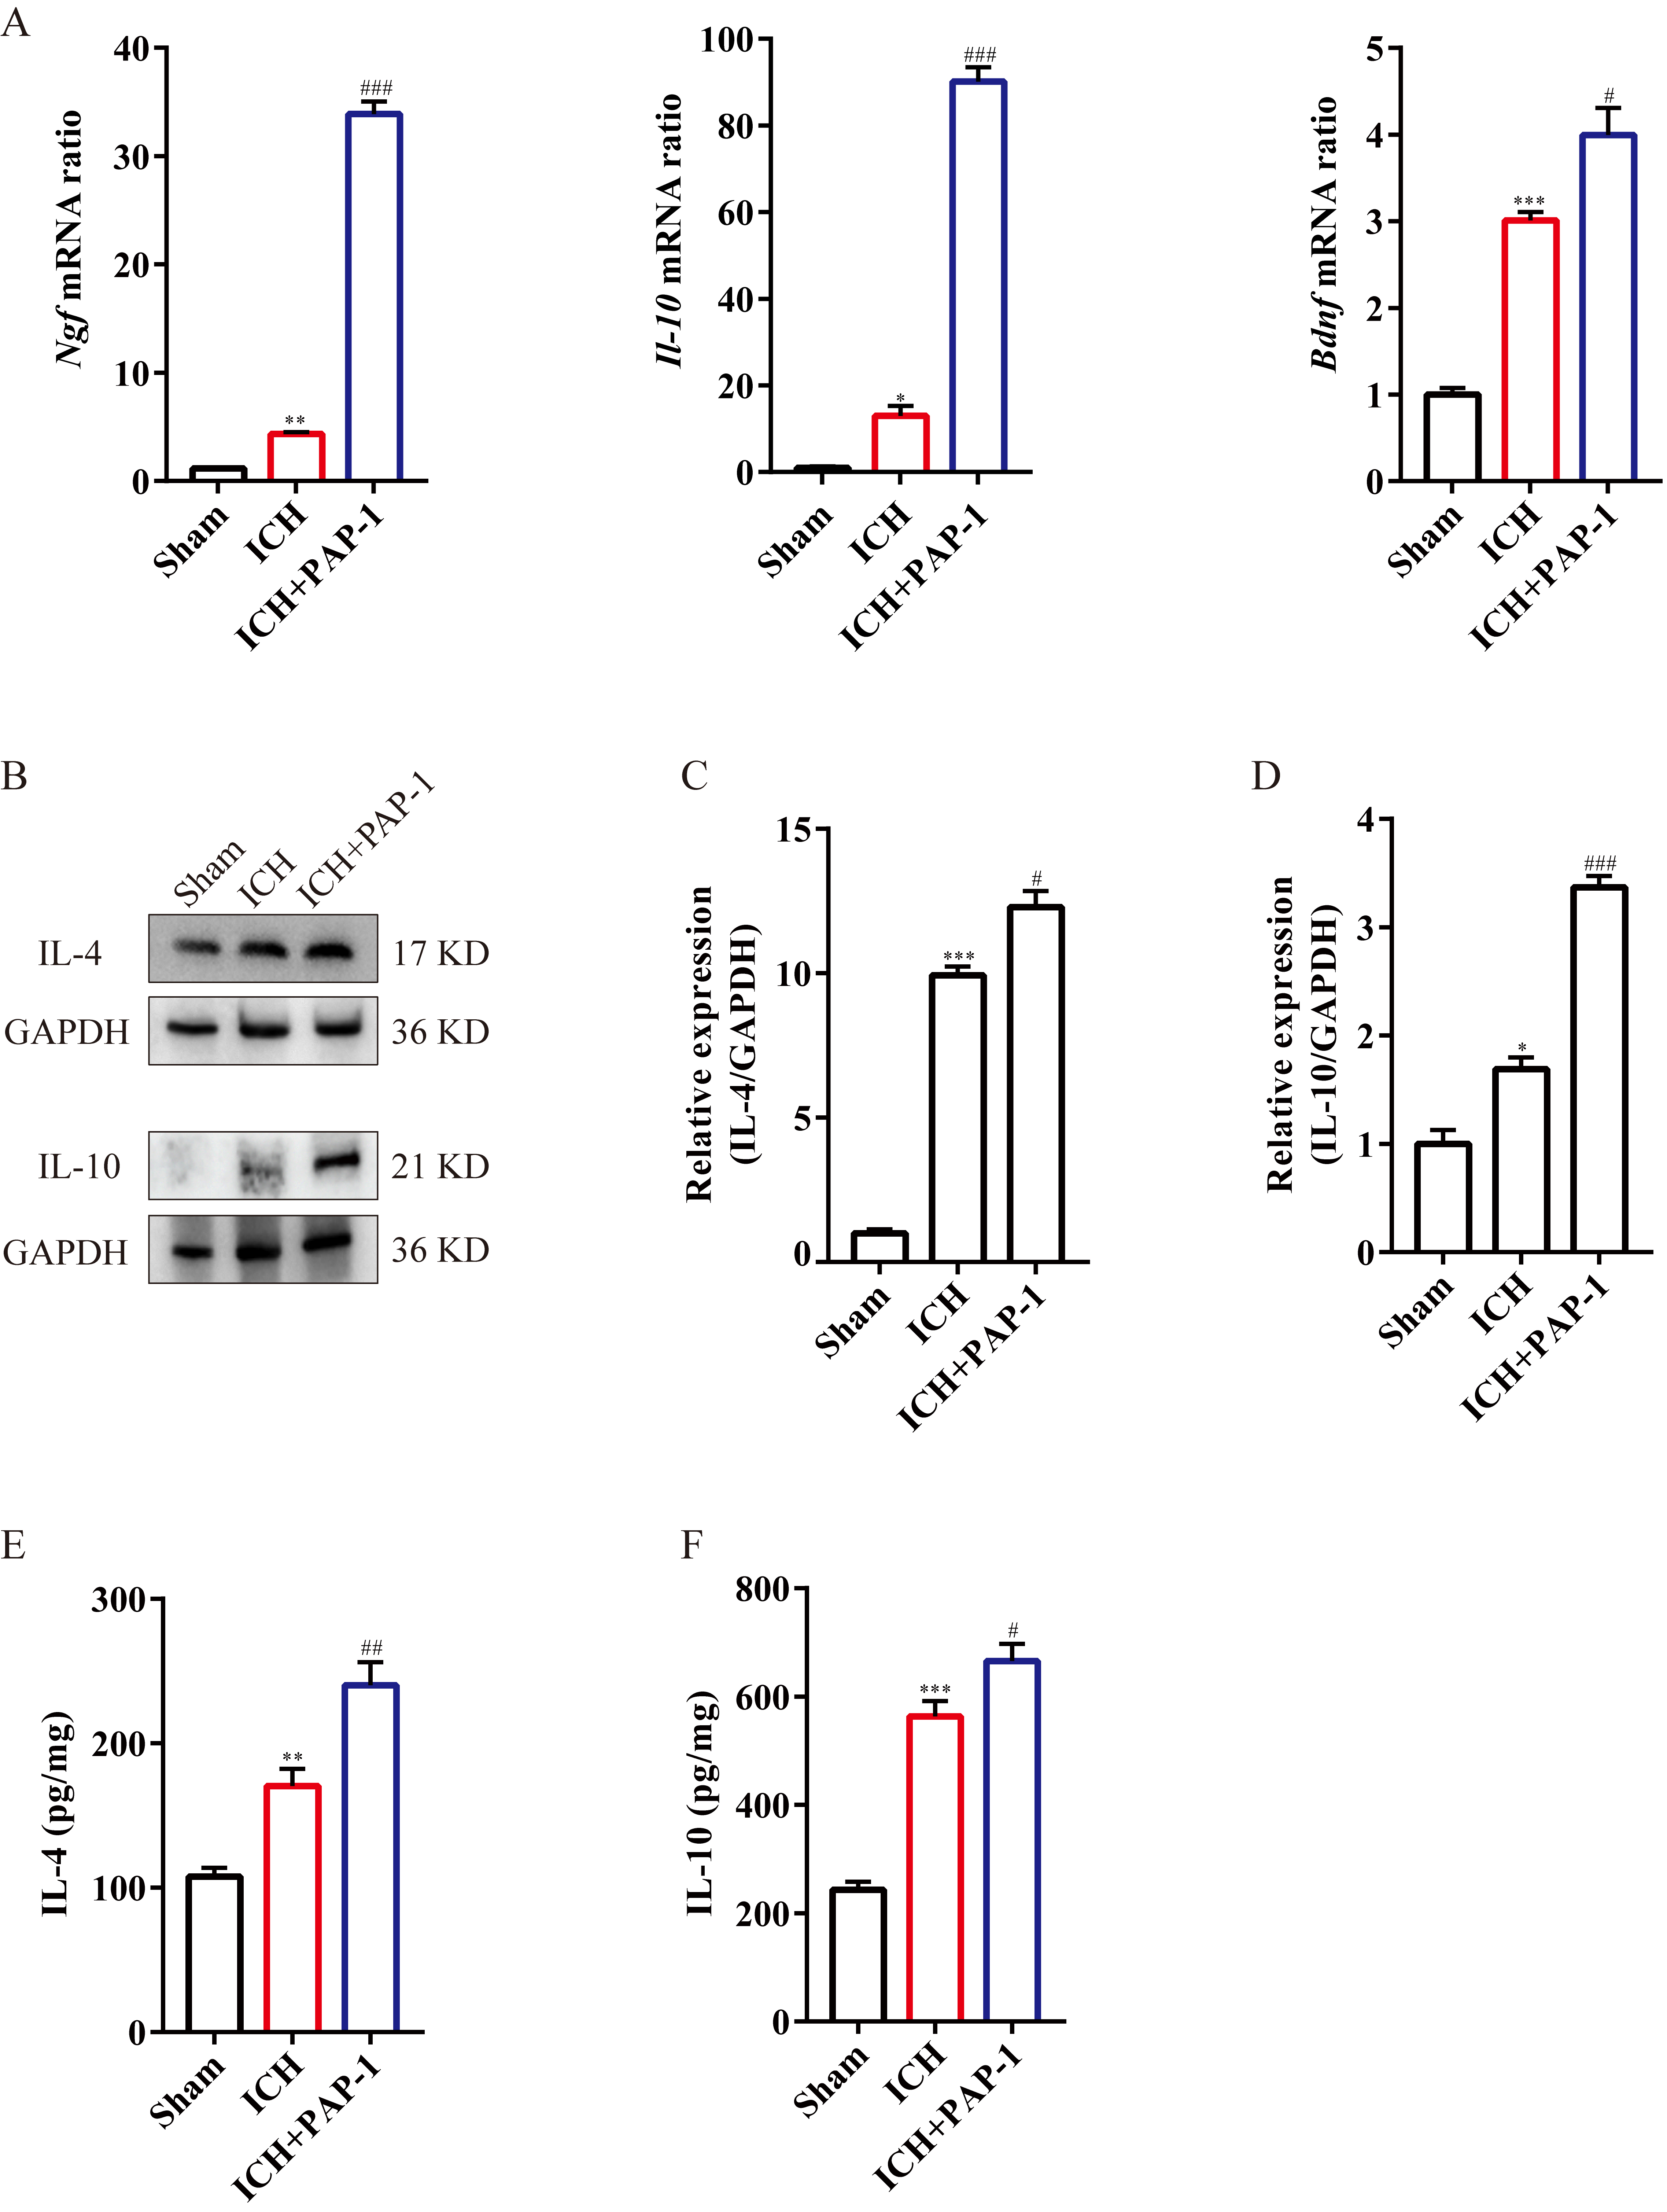
Fig. 6.

The application of PAP-1 increased the anti-inflammatory cytokines around hematoma after ICH. (A) Bar charts illustrating Ngf, Il-10, and Bdnf mRNA expression in each group on day 3 after ICH. n = 3 each group, *p < 0.05, **p < 0.01, ***p < 0.001 vs. Sham group; #p < 0.05, ###p < 0.001 vs. ICH group. (B) Immunoblot bands illustrating IL-4 and IL-10 expression in each group on day 3 after ICH. (C) Summarized bar graph depicting IL-4 expression from (B). n = 3 each group, ***p< 0.001 vs. Sham group; #p < 0.05 vs. ICH group. (D) Summarized bar graph depicting IL-10 expression from (B). n = 3 each group, *p < 0.05 vs. Sham group; ###p < 0.001 vs. ICH group. (E) ELISA results representing the concentration of IL-4 in each group on day 3 after ICH. n = 3 each group, **p < 0.01 vs. Sham group; ##p < 0.01 vs. ICH group. (F) ELISA results representing the concentration of IL-10 in each group on day 3 after ICH. n = 3 each group, ***p < 0.001 vs. Sham group; #p < 0.05 vs. ICH group. IL-4, interleukin-4; IL-10, interleukin-10.

3.5 Administration of PAP-1 Ameliorated Neuro-inflammatory Microenvironment through Facilitating M1/M2 Polarization after ICH.

The above findings confirmed that the application of PAP-1 improved the post-ICH neuro-inflammatory niche. Because the microglia transformation of M1/M2 phenotypes exerted the aforementioned effect, the polarization of microglia was investigated. First, the results indicated that the M1-microglia markers Cd16, Cd32, and Inos mRNA expression were substantially upregulated after ICH, and PAP-1 abrogated this effect on day 3 (Fig. 7A). Then, the immunoblot implied that CD16 and iNOS protein expression exhibited the same tendency as the mRNA expression level (Fig. 7B–D). Afterwards, the immunostaining images indicated that the Iba1
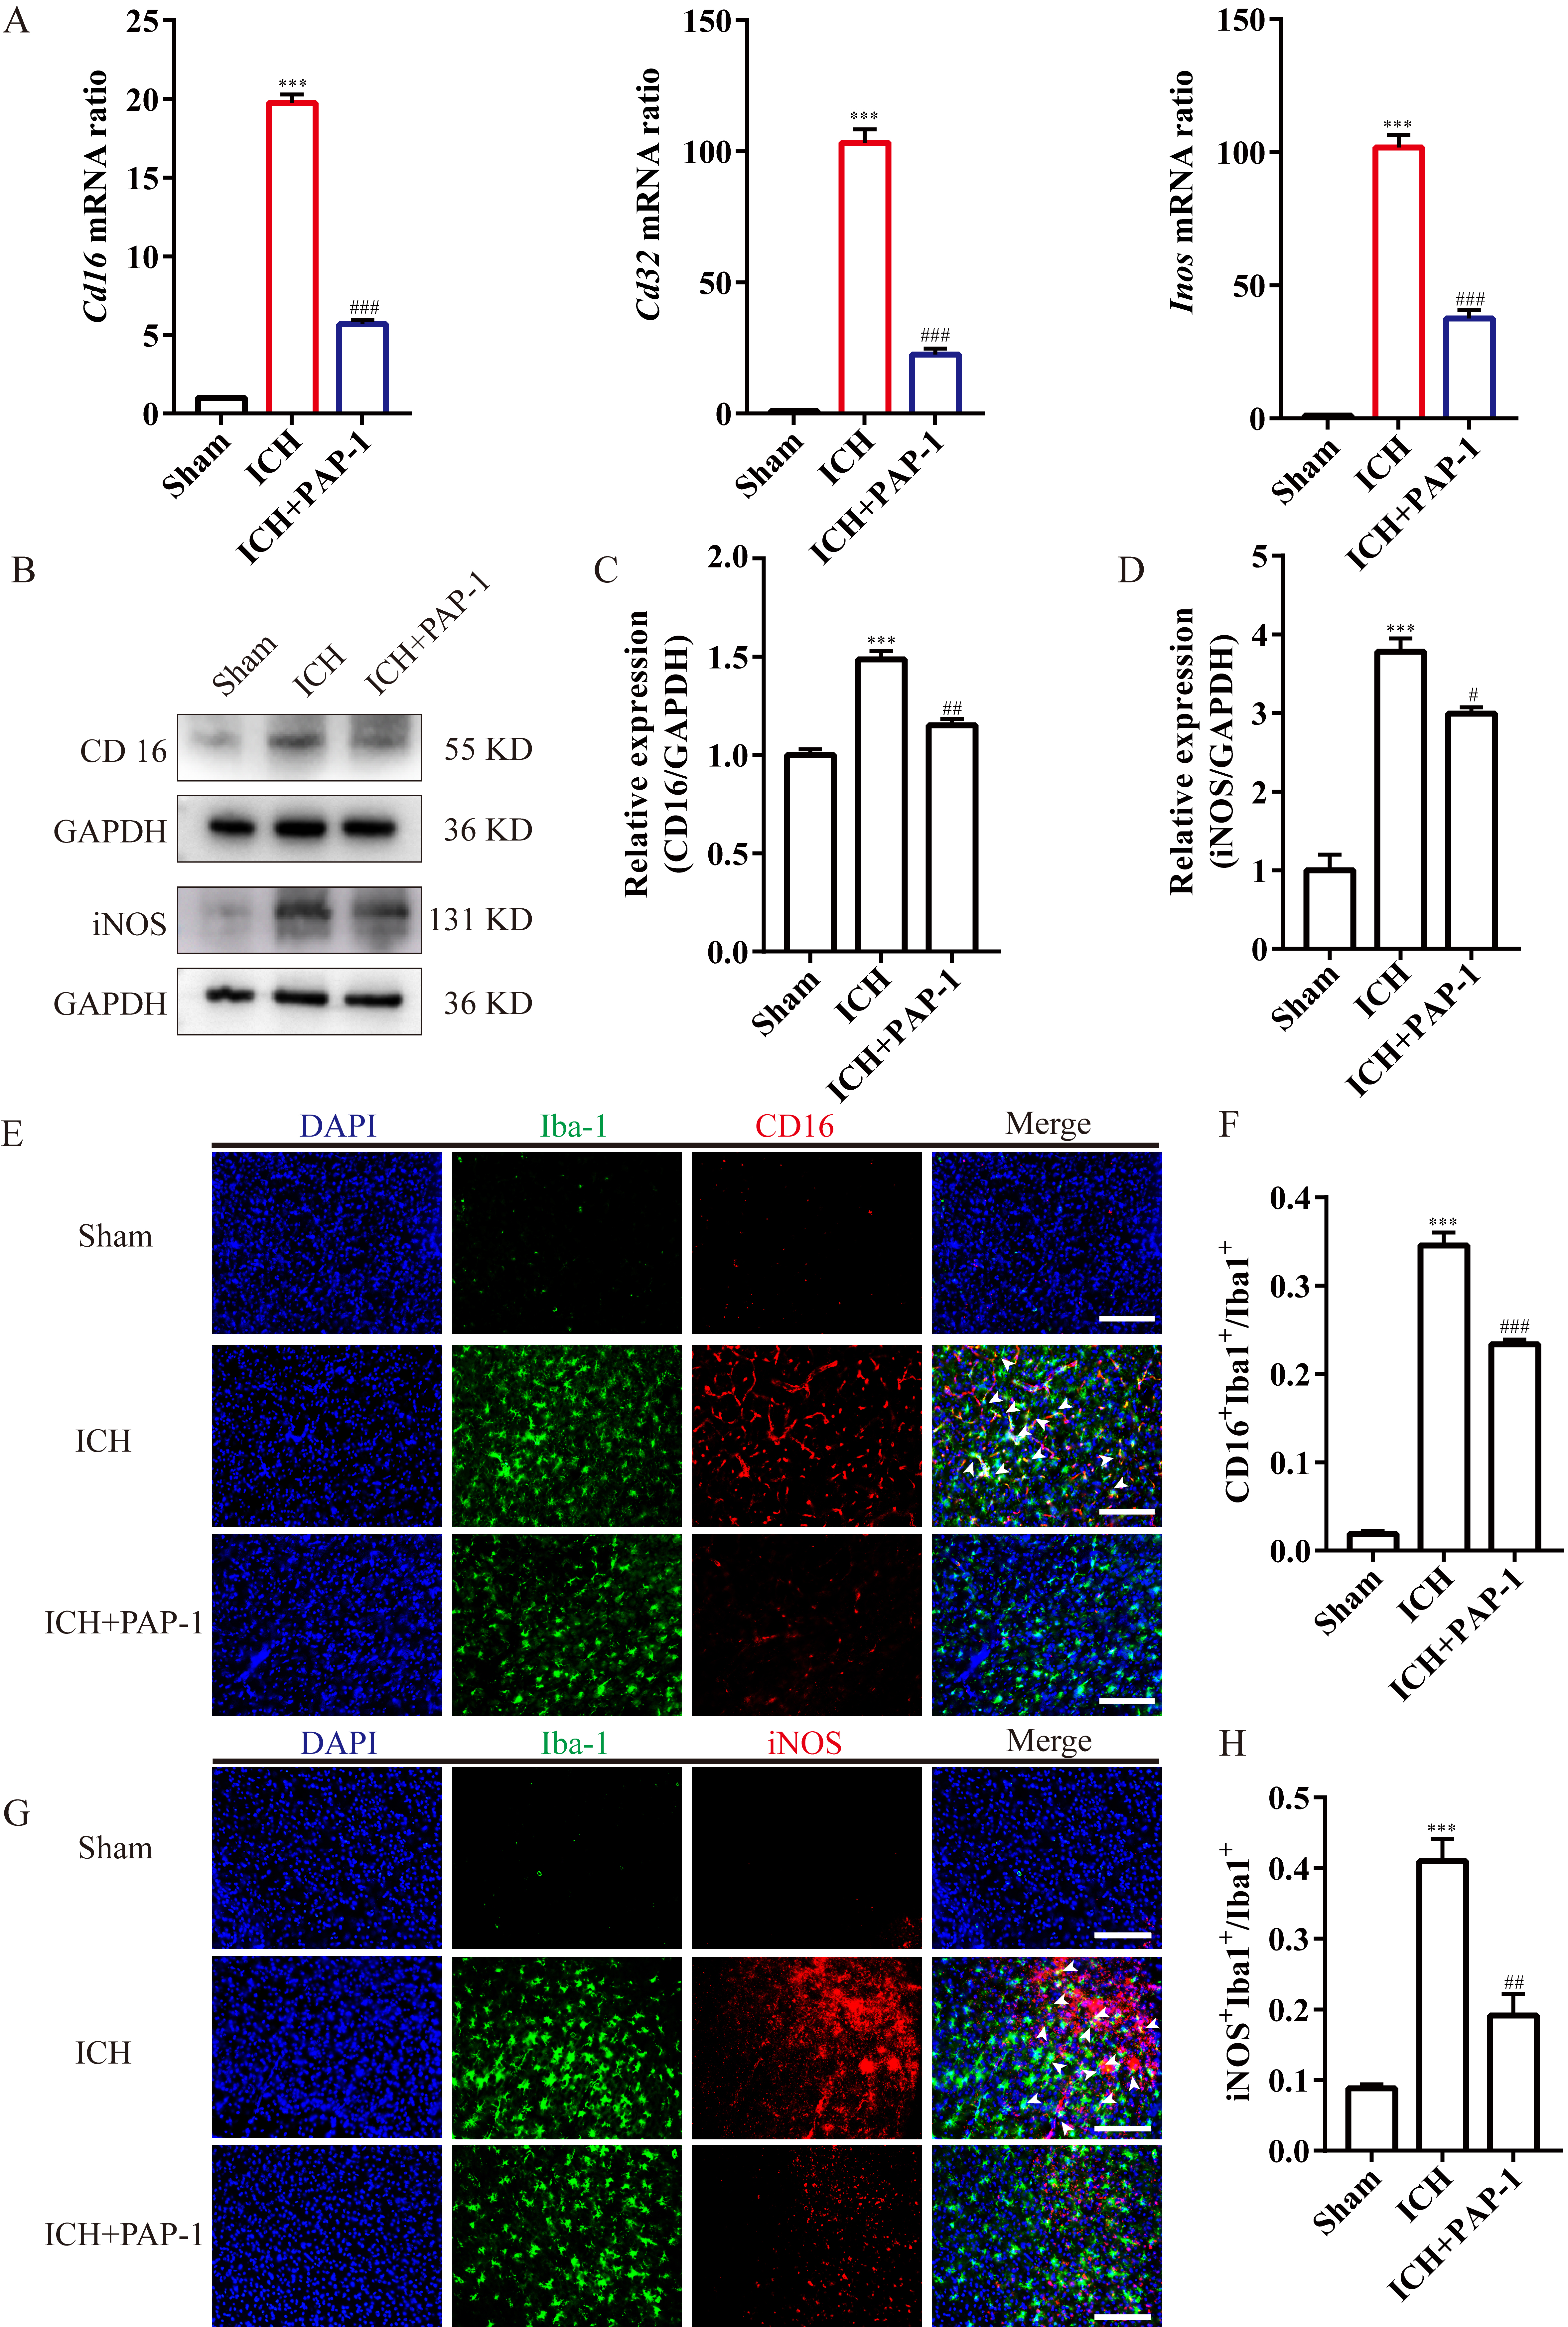
+CD16+ cells’ percentage was significantly increased after ICH, while this effect was partly abrogated by the application of PAP-1 on day 3 after ICH (Fig. 7E,F). Concurrently, the proportion of Iba1+iNOS+ cells showed the same trend as Iba1+CD16+ cells (Fig. 7G,H).

Fig. 7.

Application of PAP-1 reduced the M1-like microglia around the hematoma after ICH. (A) Bar charts illustrating Cd16, Cd32, and Inos mRNA expression in each group on day 3 after ICH. n = 3 each group, ***p < 0.001 vs. Sham group; ###p < 0.001 vs. ICH group. (B) Immunoblot bands illustrating CD16 and iNOS expression in each group on day 3 after ICH. (C) Summarized bar graph depicting CD16 expression from (B). n = 3 each group, ***p < 0.001 vs. Sham group; ##p < 0.01 vs. ICH group. (D) Summarized bar graph depicting iNOS expression from (B). n = 3 each group, ***p < 0.001 vs. Sham group; #p < 0.05 vs. ICH group. (E) Immunostaining of CD16 (red) and Iba-1 (green) in each group on day 3 after ICH. Scale bars: 50 µm. (F) Summarized bar graph depicting Iba1+CD16+ cells percentage from (E). n = 3 each group, ***p < 0.001 vs. Sham group; ###p < 0.001 vs. ICH group. (G) Immunostaining of iNOS (red) and Iba-1 (green) in each group on day 3 after ICH. Scale bars: 50 µm. (H) Summarized bar graph depicting Iba1+iNOS+ cells percentage from (G). n = 3 each group, ***p < 0.001 vs. Sham group; ##p < 0.01 vs. ICH group. iNOS, inducible nitric oxide synthase.

Next, the bar graphs implied that the M2-like microglia markers’ mRNA expression levels, including Cd206, Arg-1, and Tgf
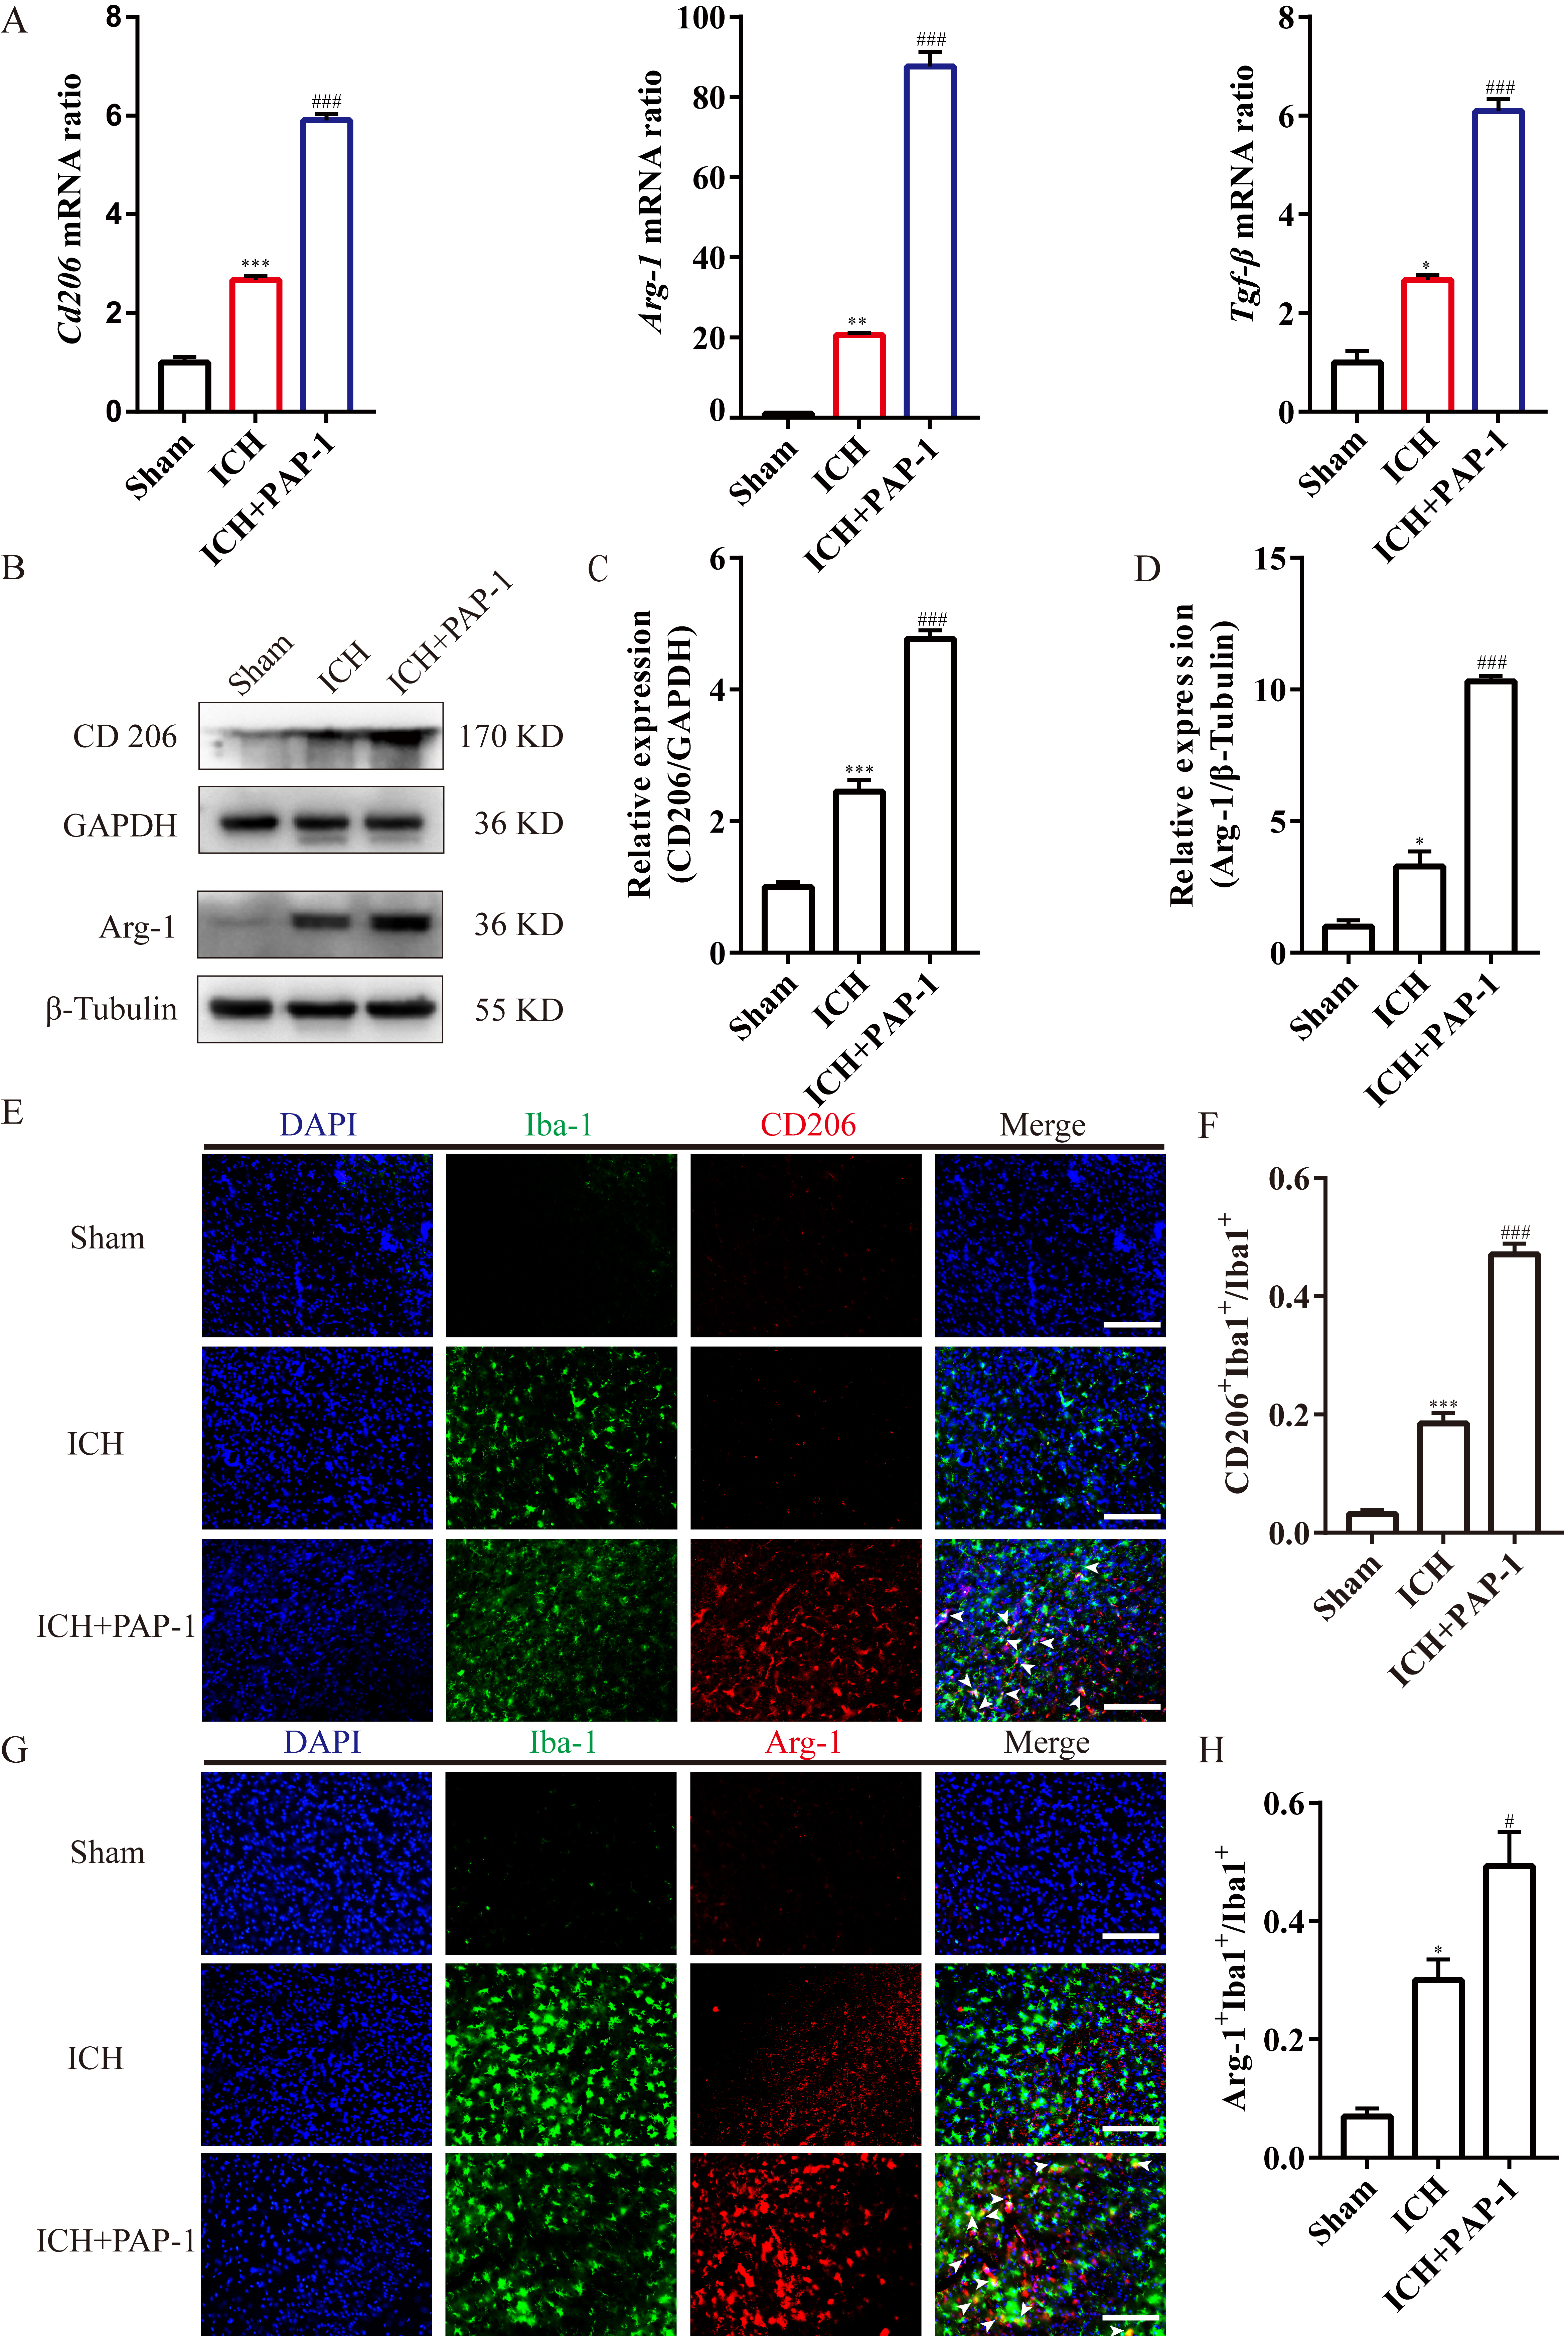
-β were elevated after ICH, and the administration of PAP-1 significantly enhanced this effect on day 3 after ICH (Fig. 8A). Thereafter, the immunoblot bands confirmed that the CD206 and Arg-1 protein expression was increased after ICH, and this phenomenon was intensified with the PAP-1 treatment on day 3 (Fig. 8B–D). Subsequently, the immunostaining images reported that the proportion of Iba1+CD206+ cells increased after ICH, and this effect was prominently expedited by PAP-1 application on day 3 after ICH (Fig. 8E,F). Meanwhile, the percentage of Iba1+Arg-1+ cells revealed the same tendency as Iba1+CD206+ cells on day 3 after ICH (Fig. 8G,H). Collectively, these results indicated that the usage of PAP-1 facilitated M1-like microglia shift into M2-like microglia, therefore improving the neuroinflammatory microenvironment through declining the accumulation of pro-inflammatory factors and enhancing the deposition of anti-inflammatory factors after ICH.

Fig. 8.

Application of PAP-1 increased the M2-like microglia around the hematoma after ICH. (A) Bar charts showcasing Cd206, Arg-1, and Tgf-β mRNA expression in each group on day 3 after ICH. n = 3 each group, *p < 0.05, **p < 0.01, ***p < 0.001 vs. Sham group; ###p < 0.001 vs. ICH group. (B) Immunoblot bands illustrating CD206 and Arg-1 expression in each group on day 3 after ICH. (C) Summarized bar graph depicting CD206 expression from (B). n = 3 each group, ***p < 0.001 vs. Sham group; ###p < 0.001 vs. ICH group. (D) Summarized bar graph depicting Arg-1 expression from (B). n = 3 each group, *p < 0.05 vs. Sham group; ###p < 0.001 vs. ICH group. (E) Immunostaining of CD206 (red) and Iba-1 (green) in each group on day 3 after ICH. Scale bars: 50 µm. (F) Summarized bar graph depicting Iba1+CD206+ cells percentage from (E). n = 3 each group, ***p < 0.001 vs. Sham group; ###p < 0.001 vs. ICH group. (G) Immunostaining of Arg-1 (red) and Iba-1 (green) in each group on day 3 after ICH. Scale bars: 50 µm. (H) Summarized bar graph depicting Iba1+Arg-1+ cells percentage from (G). n = 3 each group, *p < 0.05 vs. Sham group; #p < 0.05 vs. ICH group.

3.6 PAP-1 Regulates M1/M2 Polarization via NF-κB Signaling Pathway Inhibition after ICH.

In previous studies, the NF
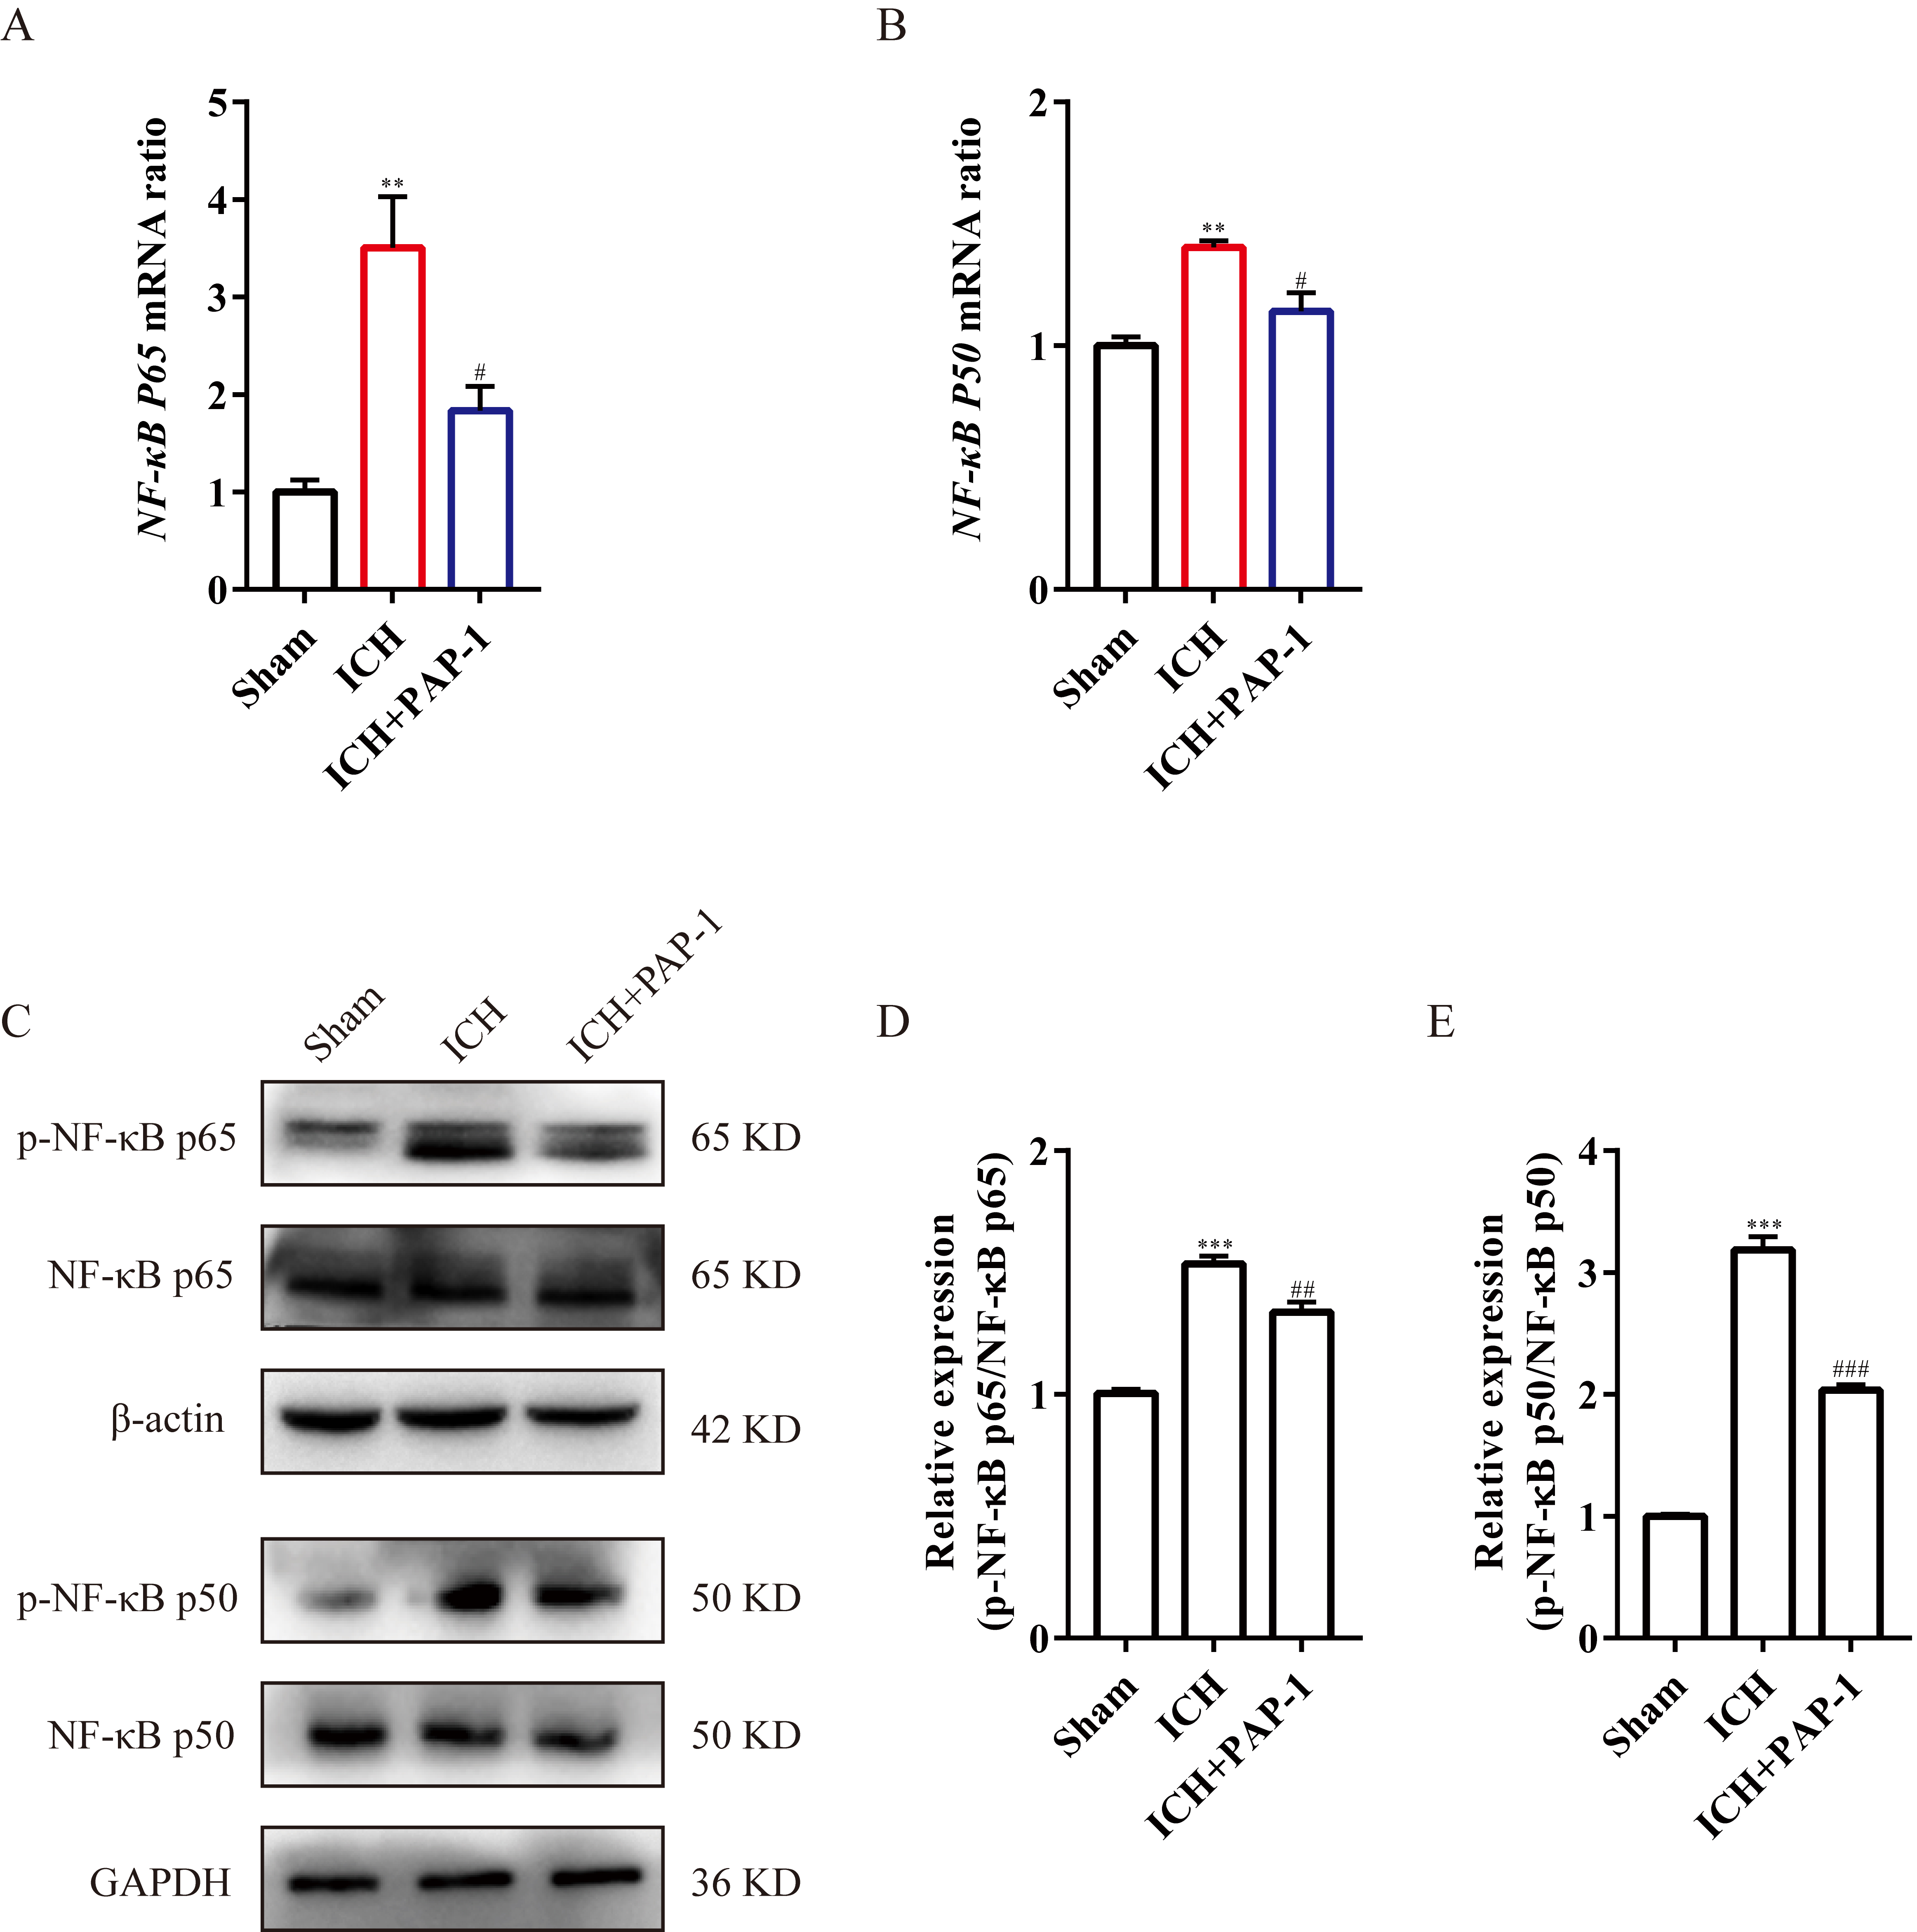
-κB signaling pathway activation was primarily detected by the quantity and function of p65 and p50, subunits of NF-κB [31, 32, 33]. First, RT-qPCR was used to evaluate the P65 and P50 mRNA levels. Results indicated that the P65 and P50 mRNA expression significantly increased after ICH, while PAP-1 administration abrogated this phenomenon (Fig. 9A, B). Immunoblot results showed that the phosphorylated-p65 expression level, indicating the functional form of p65, was increased after ICH. While compared with those in the ICH group, PAP-1 decreased the phosphorylated-p65 expression (Fig. 9C). NF-κB subunit p50 showed the same trends as that in p65 (Fig. 9C). Compared with the Sham group, the ICH group has increased ratios of both phosphorylated-p65/p65 and phosphorylated-p50/p50 (Fig. 9D,E). In comparison with the ICH group, the aforementioned ratios were significantly decreased in the ICH + PAP-1 group (Fig. 9D,E). Collectively, these results indicated that NF-κB was activated after ICH in mice, which was counterbalanced by PAP-1 administration.

Fig. 9.

Application of PAP-1 inhibiting NF-κB activation after ICH. (A) Bar charts showing NF-κB P65 mRNA expression in each group on day 3 after ICH. n = 3 each group, **p < 0.01 vs. Sham group; #p < 0.05 vs. ICH group. (B) Bar charts showing NF-κB P50 mRNA expression in each group on day 3 after ICH. n = 3 each group **p < 0.01 vs. Sham group; #p < 0.05 vs. ICH group. (C) Immunoblot bands illustrating phosphorylated-NF-κB p65, NF-κB p65, phosphorylated-NF-κB p50, and NF-κB p50 expression in each group on day 3 after ICH. (D) Summarized bar graph depicting phosphorylated-NF-κB p65 expression from (C). n = 3 each group, ***p < 0.001 vs. Sham group; ##p < 0.01 vs. ICH group. (E) Summarized bar graph depicting phosphorylated-NF-κB p50 expression from (C). n = 3 each group, ***p < 0.001 vs. Sham group; ###p < 0.001 vs. ICH group. NF-κB, Nuclear factor kappa B.

4. Discussion

ICH usually causes long-term disability due to WMI in the basal ganglia [34, 35]. Facilitating microglia polarization to M2 phenotype around hematoma is an underlying and feasible therapeutic strategy for alleviating WMI owing to a reduced accumulation of pro-inflammatory factors and increased deposition of anti-inflammatory cytokines [36, 37]. The results in this study illustrated that Kv1.3 expression increased around hematoma after mice ICH (Fig. 10). Furthermore, the administration of PAP-1, a pharmacological inhibitor of Kv1.3, markedly reduced the accumulation of TNF
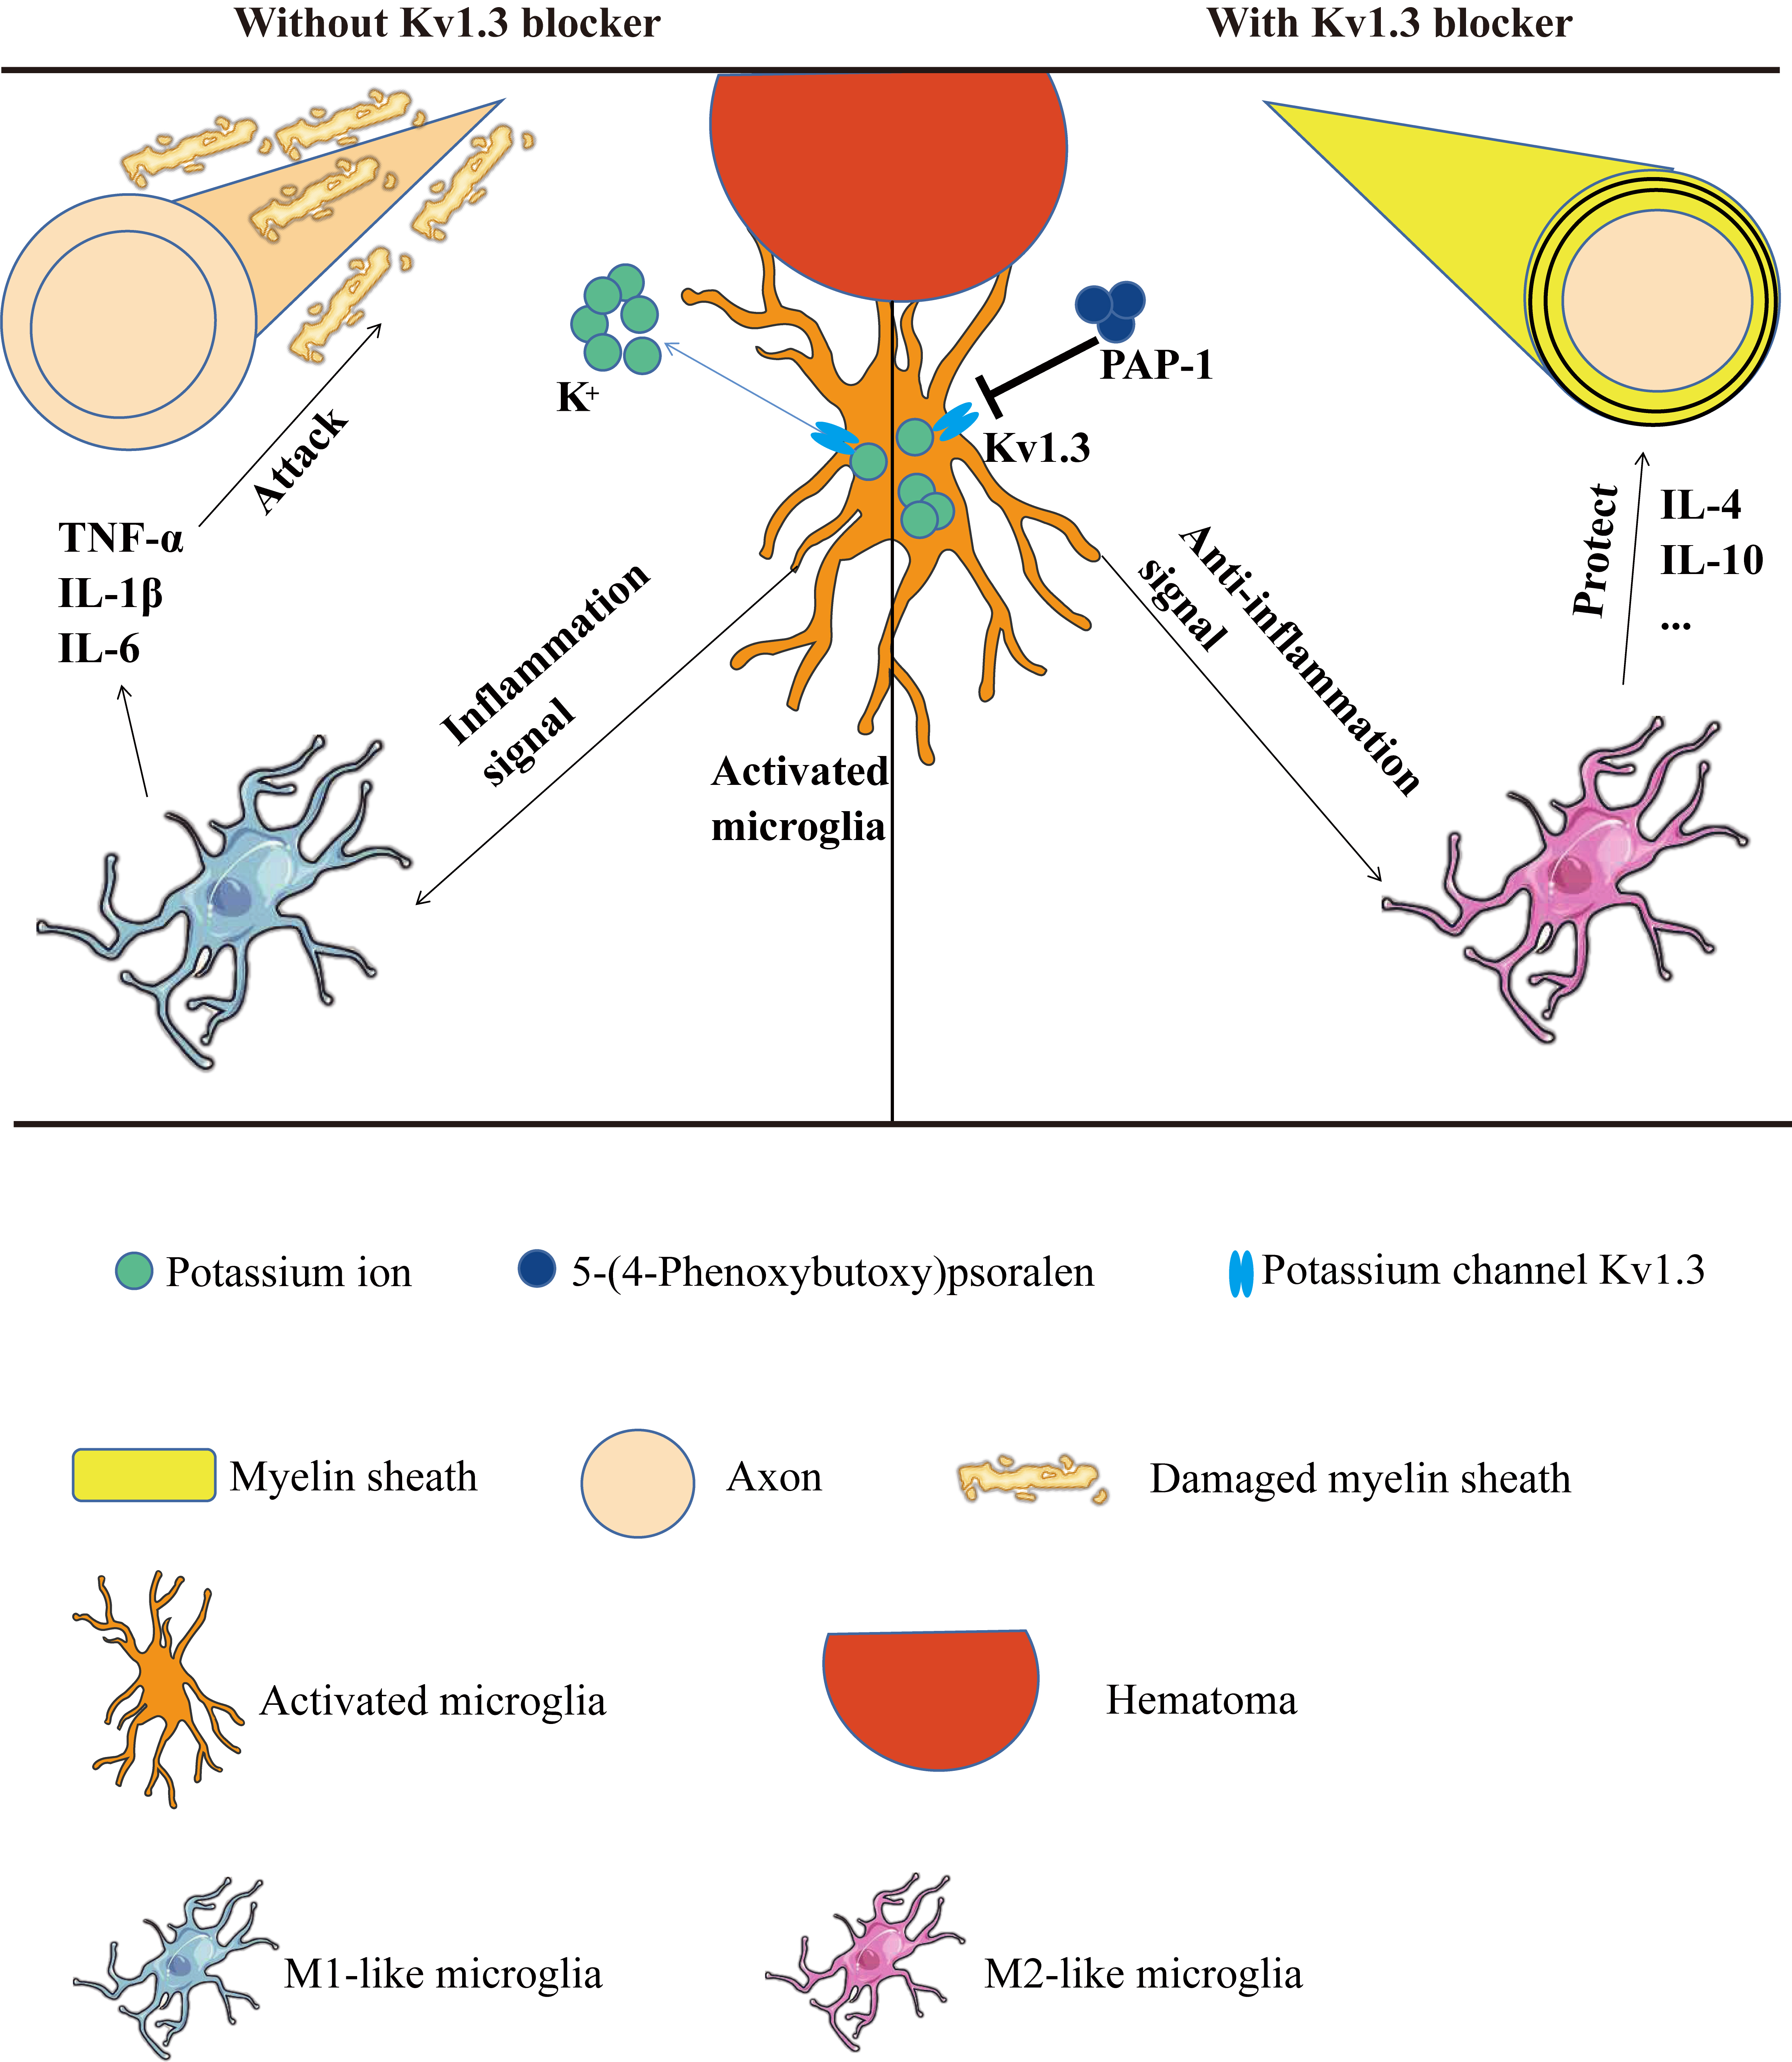
-α, IL-1β, and IL-6 and increased the deposition of IL-4 and IL-10, which exert an anti-inflammation effect through switching M1-like microglia into M2-like microglia around hematoma after ICH. Thus, the current study suggests a suitable molecule facilitating the microglia polarization into an M2-like phenotype and offers a rationale for administrating PAP-1 to improve neuroinflammation in the treatment of ICH.

Fig. 10.

ICH-induced WMI could be inhibited by PAP-1 by reshaping M1/M2 microglia phenotype. WMI, White matter injury; TNF-α, tumor necrosis factor-α; IL-1β, interleukin-1β; IL-6, interleukin-6; IL-4, interleukin-4; IL-10, interleukin-10.

After ICH, neuroinflammation begins immediately following hematoma formation, exerting an active defense to respond to secondary brain injury [38, 39, 40]. It is to be noted that microglia are the main immune cells responsible for neuroinflammation [41, 42]. Microglia are activated into an M1-like phenotype after brain injury and produce pro-inflammatory factors, such as TNF-α, IL-1β, IL-6, free radicals, chemokines, and other chemicals that toxic to cells, resulting in blood-brain barrier (BBB) disruption, brain edema, and neuronal apoptosis ultimately [38, 43, 44]. Alternatively, microglia are switched into M2-like phenotype secreting anti-inflammatory and neurotrophic cytokines, which enhance cell debris and hematoma phagocytosis and misfolded proteins clearance, promote tissue repair and reconstruction, and boost neuron survival [45, 46]. The activation of M1-like microglia produces significant amounts of pro-inflammatory factors causing neuroinflammation in the early stages of ischemic stroke [19, 47], which is in line with the characteristics of microglia around hematoma after ICH. Although microglia switch to M2-like microglia producing neurotrophic cytokines and anti-inflammatory factors (TGF-β, IL-10, NGF, and BDNF) and ameliorating brain injury a few days later post-ischemic stroke [17, 48, 49], our results indicate that the M2-like microglia are also activated to release anti-inflammatory and neurotrophic cytokines on day 3 of mice ICH model. This phenomenon might be due to the negative feedback of self-healing response to brain injury after ICH. Our results confirm that exploiting the neuro-immunomodulatory regimen focusing on M1-like microglia polarizing to M2-like phenotypes is a promising and potential strategy in ICH treatment, and Kv1.3 is a negative mediator regulating microglia transformation after ICH. Previously, the NF-κB signaling pathway was considered as the mediator of M1/M2 phenotype changes [50, 51, 52], but our results indicate that Kv1.3-induced M1/M2 phenotype changes may be due to NF-κB signaling inhibition.

Kv1.3 is a subtype of voltage-gated potassium channel responsible for activating immune cells by regulating membrane potential [16, 17]. Kv1.3 is mainly located on microglia, astrocytes, and macrophages, playing an evident role in responding to inflammatory stimuli in several diseases like Type 1 diabetes, multiple sclerosis (MS), asthma, and rheumatoid arthritis [17, 53, 54, 55]. Furthermore, studies have shown that Kv1.3 activation is related to the propagation of neuroinflammation by increasing the secretion of pro-inflammatory cytokines (IL-1β, IL-2, IL-4, IL-6, IFN-γ, and TNF-α) derived from M1-like microglia to enhance the progression of neurodegenerative diseases including AD and PD [16, 17, 53, 56]. This is consistent with the results in this study that the pro-inflammatory factor TNF-α, IL-1β, and IL-6 levels were prominently increased after ICH in mice. In addition, PAP-1 administration decreases the aforementioned pro-inflammatory factors and enhances the deposition of anti-inflammatory and neurotrophic cytokines resulting from promoting microglia shift into M2 phenotype after ICH [16, 18, 20].

Targeting Kv1.3 is a potential strategy to maintain the integrity of white matter bundles in mice ICH models. The reasons for the WMI ameliorated by PAP-1 might be due to several beneficial effects, except for the suppression of neuroinflammation after ICH. First, Kv1.3 blockade suppresses the NF-κB activation, which is responsible for the pro-inflammation cytokine transcription and immune regulation [21, 57]. To the best of our knowledge, this article first illustrated that Kv1.3 reshapes M1/M2 phenotype through NF-κB inhibition in mice models. Second, Kv1.3 blockade promotes the regenerative ability resulting from neural progenitor cells (NPC), as a study has indicated that an inhibitor of Kv1.3 promotes NPC proliferation post-brain injury previously [15]. Furthermore, the administration promotes the proliferation of oligodendrocyte progenitor cell (OPC) and PAP-1 exert an effect on OPC’s differentiation into oligodendrocytes, which is responsible for myelination in the CNS [8], through enhanced AKT activation [58]. Third, PAP-1 increased the neurotrophic factors (including NGF and BDNF) around hematoma, which support neuron survival [59].

5. Conclusions

The results of the current study illustrate that the Kv1.3 expression is enhanced in microglia around hematoma after ICH. In addition, Kv1.3 blockade using PAP-1 evidently reduces the accumulation of pro-inflammatory factors and upregulates the deposition of anti-inflammatory and neurotrophic factors by facilitating microglia polarization into M2-like microglia. The present study provides a feasible target for facilitating microglia transformation into an M2-like phenotype and offers evidence that PAP-1 administration bears the potential to ameliorate WMI by suppressing neuroinflammation in ICH treatment.

Abbreviations

ICH, intracerebral hemorrhage; WMI, white matter injury; RT-qPCR, real-time quantitative polymerase chain reaction; PAP-1, 5-(4-Phenoxybutoxy) psoralen; OFT, open field test; BMS, basso mouse score; ELISA, enzyme-linked immunosorbent assay; DPX, dexpramipexole; BDNF, brain-derived neurotrophic factor; CNS, the central nervous system; TNF-α, tumor necrosis factor-α; IL-1β, interleukin-1β; IL-6, interleukin-6; IL-4, interleukin-4; IL-10, interleukin-10; PD, Parkinson’s disease; AD, Alzheimer’s disease; TEM, transmission electron microscopy; PBS, phosphate-buffered solution; ELISA, enzyme-linked immunosorbent assay; PVDF, polyvinylidene difluoride; GAPDH, glyceraldehyde 3-phosphate dehydrogenase; NGF, nerve growth factor; MS, multiple sclerosis; OPC, oligodendrocyte progenitor cell; NPC, neural progenitor cell.

Availability of Data and Materials

All raw data in this research are available upon reasonable request.

Author Contributions

HFG, YY, and HF conceived and designed the study. BW, JC, SHW, and LC performed the ICH model and RT-qPCR. BW, SHW, and YLZ performed the immunoblot blots and immunostaining. BW, XYZ, and TYZ prepared the figures. JZ and CZ analyzed data. YJH conducted TEM. BW and YY prepared the manuscript draft. BW and HFG wrote the paper. HF revised the manuscript. All authors contributed to editorial changes in the manuscript. All authors read and approved the final manuscript. All authors have participated sufficiently in the work and agreed to be accountable for all aspects of the work.

Ethics Approval and Consent to Participate

This study was approved by the Ethics Committee of the Southwest Hospital, Third Military Medical University, and Conformed to the guidelines of the National Institutes of Health Guide for the Care and Use of Laboratory Animals (approval no. AMUWEC20224059).

Acknowledgment

Not applicable.

Funding

This work was supported by the National Natural Science Foundation of China (Nos. 82271424, 81802509, and 82001321) and the Natural Science Foundation of Chongqing (2022NSCQ-MSX4518).

Conflict of Interest

The authors declare no conflict of interest.

References
[1]
Magid-Bernstein J, Girard R, Polster S, Srinath A, Romanos S, Awad IA, et al. Cerebral Hemorrhage: Pathophysiology, Treatment, and Future Directions. Circulation Research. 2022; 130: 1204–1229.
[2]
Montaño A, Hanley DF, Hemphill JC 3rd. Hemorrhagic stroke. Handbook of Clinical Neurology. 2021; 176: 229–248.
[3]
Jiang YB, Wei KY, Zhang XY, Feng H, Hu R. White matter repair and treatment strategy after intracerebral hemorrhage. CNS Neuroscience and Therapeutics. 2019; 25: 1113–1125.
[4]
Kwon YH, Jang SH. Changes in subcortical white matter in the unaffected hemisphere following unilateral spontaneous intracerebral hemorrhage: a tract-based spatial statistics study. Journal of Integrative Neuroscience. 2022; 21: 63.
[5]
Zhang C, Ge H, Zhang S, Liu D, Jiang Z, Lan C, et al. Hematoma Evacuation via Image-Guided Para-Corticospinal Tract Approach in Patients with Spontaneous Intracerebral Hemorrhage. Neurology and Therapy. 2021; 10: 1001–1013.
[6]
Chen W, Guo C, Jia Z, Wang J, Xia M, Li C, et al. Inhibition of Mitochondrial ROS by MitoQ Alleviates White Matter Injury and Improves Outcomes after Intracerebral Haemorrhage in Mice. Oxidative Medicine and Cellular Longevity. 2020; 2020: 8285065.
[7]
Chen W, Xia M, Guo C, Jia Z, Wang J, Li C, et al. Modified behavioural tests to detect white matter injury-induced motor deficits after intracerebral haemorrhage in mice. Scientific Reports. 2019; 9: 16958.
[8]
Wang B, Zhang X, Zhong J, Wang S, Zhang C, Li M, et al. Dexpramipexole Attenuates White Matter Injury to Facilitate Locomotion and Motor Coordination Recovery via Reducing Ferroptosis after Intracerebral Hemorrhage. Oxidative Medicine and Cellular Longevity. 2022; 2022: 6160701.
[9]
Li M, Xia M, Chen W, Wang J, Yin Y, Guo C, et al. Lithium treatment mitigates white matter injury after intracerebral hemorrhage through brain-derived neurotrophic factor signaling in mice. Translational Research. 2020; 217: 61–74.
[10]
Jiang X, Zhang J, Kou B, Zhang C, Zhong J, Fang X, et al. Ambroxol Improves Neuronal Survival and Reduces White Matter Damage through Suppressing Endoplasmic Reticulum Stress in Microglia after Intracerebral Hemorrhage. BioMed Research International. 2020; 2020: 8131286.
[11]
Fu X, Zhou G, Wu X, Xu C, Zhou H, Zhuang J, et al. Inhibition of P2X4R attenuates white matter injury in mice after intracerebral hemorrhage by regulating microglial phenotypes. Journal of Neuroinflammation. 2021; 18: 184.
[12]
Loane DJ, Kumar A. Microglia in the TBI brain: the good, the bad, and the dysregulated. Experimental Neurology. 2016; 275 Pt 3: 316–327.
[13]
Liu J, Liu L, Wang X, Jiang R, Bai Q, Wang G. Microglia: A Double-Edged Sword in Intracerebral Hemorrhage From Basic Mechanisms to Clinical Research. Frontiers in Immunology. 2021; 12: 675660.
[14]
Wang G, Shi Y, Jiang X, Leak RK, Hu X, Wu Y, et al. HDAC inhibition prevents white matter injury by modulating microglia/macrophage polarization through the GSK3β/PTEN/Akt axis. Proceedings of the National Academy of Sciences of the United States of America. 2015; 112: 2853–2858.
[15]
Revuelta M, Urrutia J, Villarroel A, Casis O. Microglia-Mediated Inflammation and Neural Stem Cell Differentiation in Alzheimer’s Disease: Possible Therapeutic Role of Kv1.3 Channel Blockade. Frontiers in Cellular Neuroscience. 2022; 16: 868842.
[16]
Sarkar S, Nguyen HM, Malovic E, Luo J, Langley M, Palanisamy BN, et al. Kv1.3 modulates neuroinflammation and neurodegeneration in Parkinson’s disease. Journal of Clinical Investigation. 2020; 130: 4195–4212.
[17]
Wang X, Li G, Guo J, Zhang Z, Zhang S, Zhu Y, et al. Kv1.3 Channel as a Key Therapeutic Target for Neuroinflammatory Diseases: State of the Art and Beyond. Frontiers in Neuroscience. 2020; 13: 1393.
[18]
Nguyen HM, Grössinger EM, Horiuchi M, Davis KW, Jin L, Maezawa I, et al. Differential Kv1.3, KCa3.1, and Kir2.1 expression in “classically” and “alternatively” activated microglia. Glia. 2017; 65: 106–121.
[19]
Chen Y, Nguyen HM, Maezawa I, Jin L, Wulff H. Inhibition of the potassium channel Kv1.3 reduces infarction and inflammation in ischemic stroke. Annals of Clinical and Translational Neurology. 2017; 5: 147–161.
[20]
Ma D, Zhang N, Zhang Y, Chen H. Kv1.3 channel blockade alleviates cerebral ischemia/reperfusion injury by reshaping M1/M2 phenotypes and compromising the activation of NLRP3 inflammasome in microglia. Experimental Neurology. 2020; 332: 113399.
[21]
Zhang Q, Liu L, Hu Y, Shen L, Li L, Wang Y. Kv1.3 Channel is Involved in Ox-LDL-induced Macrophage Inflammation via ERK/NF-κB signaling pathway. Archives of Biochemistry and Biophysics. 2022; 730: 109394.
[22]
Zhou Q, Wang T, Li M, Shang Y. Alleviating airway inflammation by inhibiting ERK-NF-κB signaling pathway by blocking Kv1.3 channels. International Immunopharmacology. 2018; 63: 110–118.
[23]
DiDonato JA, Mercurio F, Karin M. NF-κB and the link between inflammation and cancer. Immunological Reviews. 2012; 246: 379–400.
[24]
Hayden MS, Ghosh S. Signaling to NF-κB. Genes and Development. 2004; 18: 2195–2224.
[25]
Yang Y, Cui J, Gao F, Li B, Liu C, Zhang P, et al. Whole Body Irradiation Induces Cutaneous Dendritic Cells Depletion via NF-κB Activation. Cellular Physiology and Biochemistry. 2013; 32: 200–209.
[26]
Krafft PR, Rolland WB, Duris K, Lekic T, Campbell A, Tang J, et al. Modeling intracerebral hemorrhage in mice: injection of autologous blood or bacterial collagenase. Journal of Visualized Experiments. 2012: e4289.
[27]
Kraeuter A, Guest PC, Sarnyai Z. The Open Field Test for Measuring Locomotor Activity and Anxiety-Like Behavior. Methods in Molecular Biology. 2019; 1916: 99–103.
[28]
Basso DM, Fisher LC, Anderson AJ, Jakeman LB, Mctigue DM, Popovich PG. Basso Mouse Scale for Locomotion Detects Differences in Recovery after Spinal Cord Injury in Five Common Mouse Strains. Journal of Neurotrauma. 2006; 23: 635–659.
[29]
Ge M, Tian H, Mao L, Li D, Lin J, Hu H, et al. Zinc attenuates ferroptosis and promotes functional recovery in contusion spinal cord injury by activating Nrf2/GPX4 defense pathway. CNS Neuroscience and Therapeutics. 2021; 27: 1023–1040.
[30]
Mierzwa AJ, Marion CM, Sullivan GM, McDaniel DP, Armstrong RC. Components of Myelin Damage and Repair in the Progression of White Matter Pathology after Mild Traumatic Brain Injury. Journal of Neuropathology and Experimental Neurology. 2015; 74: 218–232.
[31]
Liu T, Han Q, Pan Y, Li J, Song H. Carbon Monoxide-Releasing Molecule-3 Regulates the Polarization of Lipopolysaccharide-Induced Macrophages. Inflammation. 2021; 44: 1737–1749.
[32]
Chen H, Hong YH, Woo BY, Hong YD, Manilack P, Souladeth P, et al. Cocculus hirsutus ameliorates gastric and lung injuries by suppressing Src/Syk. Phytomedicine. 2021; 93: 153778.
[33]
Luo X, Zhu X, Li Y, Wang X, Yin W, Ge Y, et al. MicroRNA-150 restores endothelial cell function and attenuates vascular remodeling by targeting PTX3 through the NF-κB signaling pathway in mice with acute coronary syndrome. Cell Biology International. 2018; 42: 1170–1181.
[34]
Fu X, Zhou G, Zhuang J, Xu C, Zhou H, Peng Y, et al. White Matter Injury After Intracerebral Hemorrhage. Frontiers in Neurology. 2021; 12: 562090.
[35]
Zuo S, Pan P, Li Q, Chen Y, Feng H. White Matter Injury and Recovery after Hypertensive Intracerebral Hemorrhage. BioMed Research International. 2017; 2017: 6138424.
[36]
Xi Z, Xu C, Chen X, Wang B, Zhong Z, Sun Q, et al. Protocatechuic Acid Suppresses Microglia Activation and Facilitates M1 to M2 Phenotype Switching in Intracerebral Hemorrhage Mice. Journal of Stroke and Cerebrovascular Diseases. 2021; 30: 105765.
[37]
Zhou L, Wang D, Qiu X, Zhang W, Gong Z, Wang Y, et al. DHZCP Modulates Microglial M1/M2 Polarization via the p38 and TLR4/NF-κB Signaling Pathways in LPS-Stimulated Microglial Cells. Frontiers in Pharmacology. 2020; 11: 1126.
[38]
Chen S, Peng J, Sherchan P, Ma Y, Xiang S, Yan F, et al. TREM2 activation attenuates neuroinflammation and neuronal apoptosis via PI3K/Akt pathway after intracerebral hemorrhage in mice. Journal of Neuroinflammation. 2020; 17: 168.
[39]
Xue M, Yong VW. Neuroinflammation in intracerebral haemorrhage: immunotherapies with potential for translation. The Lancet Neurology. 2020; 19: 1023–1032.
[40]
Zhao H, Pan P, Yang Y, Ge H, Chen W, Qu J, et al. Endogenous hydrogen sulphide attenuates NLRP3 inflammasome-mediated neuroinflammation by suppressing the P2X7 receptor after intracerebral haemorrhage in rats. Journal of Neuroinflammation. 2017; 14: 163.
[41]
Woodburn SC, Bollinger JL, Wohleb ES. The semantics of microglia activation: neuroinflammation, homeostasis, and stress. Journal of Neuroinflammation. 2021; 18: 258.
[42]
Leng F, Edison P. Neuroinflammation and microglial activation in Alzheimer disease: where do we go from here? Nature Reviews Neurology. 2021; 17: 157–172.
[43]
Wu C, Shyue S, Hung T, Wen S, Lin C, Chang C, et al. Genetic deletion or pharmacological inhibition of soluble epoxide hydrolase reduces brain damage and attenuates neuroinflammation after intracerebral hemorrhage. Journal of Neuroinflammation. 2017; 14: 230.
[44]
Ge H, Xue X, Xian J, Yuan L, Wang L, Zou Y, et al. Ferrostatin-1 Alleviates White Matter Injury via Decreasing Ferroptosis Following Spinal Cord Injury. Molecular Neurobiology. 2022; 59: 161–176.
[45]
Liu H, Tang R, Qi R. Interleukin-4 affects microglial autophagic flux. Neural Regeneration Research. 2019; 14: 1594–1602.
[46]
Xiong X, Liu L, Yang Q. Functions and mechanisms of microglia/macrophages in neuroinflammation and neurogenesis after stroke. Progress in Neurobiology. 2016; 142: 23–44.
[47]
Man SM, Karki R, Kanneganti T. Molecular mechanisms and functions of pyroptosis, inflammatory caspases and inflammasomes in infectious diseases. Immunological Reviews. 2017; 277: 61–75.
[48]
Wu H, Zheng J, Xu S, Fang Y, Wu Y, Zeng J, et al. Mer regulates microglial/macrophage M1/M2 polarization and alleviates neuroinflammation following traumatic brain injury. Journal of Neuroinflammation. 2021; 18: 2.
[49]
Liu X, Wen S, Yan F, Liu K, Liu L, Wang L, et al. Salidroside provides neuroprotection by modulating microglial polarization after cerebral ischemia. Journal of Neuroinflammation. 2018; 15: 39.
[50]
Gaojian T, Dingfei Q, Linwei L, Xiaowei W, Zheng Z, Wei L, et al. Parthenolide promotes the repair of spinal cord injury by modulating M1/M2 polarization via the NF-κB and STAT 1/3 signaling pathway. Cell Death Discovery. 2020; 6: 97.
[51]
Ma Y, Fan P, Zhao R, Zhang Y, Wang X, Cui W. Neuregulin-1 regulates the conversion of M1/M2 microglia phenotype via ErbB4-dependent inhibition of the NF-κB pathway. Molecular Biology Reports. 2022; 49: 3975–3986.
[52]
Xue K, Qi M, She T, Jiang Z, Zhang Y, Wang X, et al. Argon mitigates post-stroke neuroinflammation by regulating M1/M2 polarization and inhibiting NF-κB/NLRP3 inflammasome signaling. Journal of Cell Biology. 2022. (Online ahead of print)
[53]
Rangaraju S, Gearing M, Jin L, Levey A. Potassium Channel Kv1.3 is Highly Expressed by Microglia in Human Alzheimer’s Disease. Journal of Alzheimer’S Disease. 2015; 44: 797–808.
[54]
Serrano-Albarrás A, Cirera-Rocosa S, Sastre D, Estadella I, Felipe A. Fighting rheumatoid arthritis: Kv1.3 as a therapeutic target. Biochemical Pharmacology. 2019; 165: 214–220.
[55]
Toldi G, Vásárhelyi B, Kaposi A, Mészáros G, Pánczél P, Hosszufalusi N, et al. Lymphocyte activation in type 1 diabetes mellitus: the increased significance of Kv1.3 potassium channels. Immunology Letters. 2010; 133: 35–41.
[56]
Maezawa I, Nguyen HM, Di Lucente J, Jenkins DP, Singh V, Hilt S, et al. Kv1.3 inhibition as a potential microglia-targeted therapy for Alzheimer’s disease: preclinical proof of concept. Brain. 2018; 141: 596–612.
[57]
Hayden MS, Ghosh S. Shared principles in NF-κB signaling. Cell. 2008; 132: 344–362.
[58]
Liu H, Yang X, Yang J, Yuan Y, Wang Y, Zhang R, et al. IL-17 Inhibits Oligodendrocyte Progenitor Cell Proliferation and Differentiation by Increasing K+ Channel Kv1.3. Frontiers in Cellular Neuroscience. 2021; 15: 679413.
[59]
Guo S, Wang H, Yin Y. Microglia Polarization From M1 to M2 in Neurodegenerative Diseases. Frontiers in Aging Neuroscience. 2022; 14: 815347.

Publisher’s Note: IMR Press stays neutral with regard to jurisdictional claims in published maps and institutional affiliations.

Share
Back to top